SCHEDULE 14C INFORMATION
INFORMATION STATEMENT PURSUANT TO SECTION 14(C) OF THE
SECURITIES EXCHANGE ACT OF 1934
(AMENDMENT NO.)
Check the appropriate box:
|
| |
| [_] | Preliminary Information Statement |
| | |
| [_] | Confidential, for Use of the Commission Only (as permitted by Rule 14c-5(d)(2)) |
| | |
| [X] | Definitive Information Statement |
Wisconsin Electric Power Company
(NAME OF REGISTRANT AS SPECIFIED IN ITS CHARTER)
Payment of Filing Fee (Check the appropriate box)
|
| |
| [X] | No fee required. |
| | |
| [_] | Fee computed on table below per Exchange Act Rules 14c-5(g) and 0-11. |
| | |
| 1) | Title of each class of securities to which transaction applies: |
| |
|
| |
| 2) | Aggregate number of securities to which transaction applies: |
| |
|
| |
| 3) | Per unit price or other underlying value of transaction computed pursuant to Exchange Act Rule 0-11 (Set forth the amount on which the filing fee is calculated and state how it was determined): |
| |
|
| |
| 4) | Proposed maximum aggregate value of transaction: |
| |
|
| |
| [_] | Fee paid previously with preliminary materials. |
| | |
| [_] | Check box if any part of the fee is offset as provided by Exchange Act Rule 0-11(a)(2) and identify the filing for which the offsetting fee was paid previously. Identify the previous filing by registration statement number, or the Form or Schedule and the date of its filing. |
| |
|
| |
| 1) | Amount Previously Paid: ________________________________________________________________ |
| | |
| 2) | Form, Schedule or Registration Statement No.:______________________________________________ |
| | |
| 3) | Filing Party:__________________________________________________________________________ |
| | |
| 4) | Date Filed:___________________________________________________________________________ |
|
| |
| Gale E. Klappa Chairman and Chief Executive Officer 231 W. Michigan Street Milwaukee, WI 53203 |
March 29, 2018
Dear Preferred Stockholder:
Wisconsin Electric Power Company, which does business under the trade name of We Energies, will hold its Annual Meeting of Stockholders on Thursday, April 26, 2018, at 10:00 a.m., Central time, in the Resource Center on the first floor of the Public Service Building, 231 W. Michigan Street, Milwaukee, Wisconsin 53203.
We are not soliciting proxies for this meeting, as more than 99% of the voting stock is owned, and will be voted, by Wisconsin Electric’s parent, WEC Energy Group, Inc. If you wish, you may vote your shares of preferred stock in person at the meeting; however, the business session will be very brief.
As an alternative, you might consider attending WEC Energy Group’s Annual Meeting of Stockholders to be held Thursday, May 3, 2018, at 10:00 a.m., Central time, at Concordia University Wisconsin in the R. John Buuck Field House located at 12800 North Lake Shore Drive, Mequon, Wisconsin 53097.
By attending this meeting, you would have the opportunity to meet many of the Wisconsin Electric officers and directors. Although you cannot vote your shares of Wisconsin Electric preferred stock at the WEC Energy Group meeting, you may find the activities worthwhile.
You must pre-register and present photo identification at the door to attend WEC Energy Group’s Annual Meeting. To pre-register for the meeting, please contact WEC Energy Group’s Stockholder Services, 231 W. Michigan Street, Milwaukee, Wisconsin 53203; call 800-881-5882; or email WEC.Stockholder-Services.Contact@wisconsinenergy.com and provide proof of your ownership of preferred stock, including, if applicable, a bank or brokerage firm account statement or a letter from the broker, trustee, bank, or nominee holding your shares.
The annual report of Wisconsin Electric is attached as Appendix B to this information statement. If you have any questions or would like a copy of the WEC Energy Group annual report, please call our toll-free stockholder hotline at 800-881-5882.
Thank you for your support.
Sincerely,
NOTICE OF ANNUAL MEETING OF STOCKHOLDERS
March 29, 2018
To the Stockholders of Wisconsin Electric Power Company:
The 2018 Annual Meeting of Stockholders of Wisconsin Electric Power Company will be held on Thursday, April 26, 2018, at 10:00 a.m., Central time, in the Resource Center on the first floor of the Public Service Building, 231 W. Michigan Street, Milwaukee, Wisconsin 53203, for the following purposes:
| |
| 1. | To elect the five members of the Board of Directors to hold office until the 2019 Annual Meeting of Stockholders; and |
| |
| 2. | To consider any other matters that may properly come before the meeting. |
Stockholders of record at the close of business on February 22, 2018, are entitled to vote. The following pages provide additional details about the meeting as well as other useful information.
Important Notice Regarding the Availability of Materials Related to the Stockholder Meeting to Be Held on April 26, 2018 – The Information Statement and 2017 Annual Report to Stockholders are available at:
www.wisconsinelectric.com
By Order of the Board of Directors,
Margaret C. Kelsey
Executive Vice President, General Counsel and Corporate Secretary
|
| |
| We Energies 231 W. Michigan Street Milwaukee, WI 53203 |
INFORMATION STATEMENT
This information statement is being furnished to stockholders beginning on or about March 29, 2018, in connection with the annual meeting of stockholders of Wisconsin Electric Power Company (“WE” or the “Company”), which does business under the trade name of We Energies, and all adjournments or postponements of the annual meeting, for the purposes listed in the preceding Notice of Annual Meeting of Stockholders. The annual meeting of stockholders will be held on Thursday, April 26, 2018 (the “Meeting”), at 10:00 a.m., Central time, in the Resource Center on the first floor of the Public Service Building, 231 W. Michigan Street, Milwaukee, Wisconsin 53203. The WE annual report to stockholders is attached as Appendix B to this information statement.
We are not asking you for a proxy and you are requested not to send us a proxy. However, you may vote your shares of preferred stock at the Meeting. If you would like to attend the Meeting, please contact Stockholder Services by email at wec.stockholder-services.contact@wecenergygroup.com or by telephone at 800-881-5882.
VOTING SECURITIES
As of February 22, 2018, WE had outstanding 44,498 shares of $100 par value Six Per Cent. Preferred Stock; 260,000 shares of $100 par value 3.60% Serial Preferred Stock; and 33,289,327 shares of common stock. Each outstanding share of each class is entitled to one vote. Stockholders of record at the close of business on February 22, 2018 will be entitled to vote at the Meeting. In order to conduct the Meeting, a majority of the outstanding shares entitled to vote must be represented at the Meeting. This is known as a “quorum.” All of WE’s outstanding common stock, representing more than 99% of its voting securities, is owned by its parent company, WEC Energy Group, Inc. (“WEC Energy Group”), and will be represented at the Meeting. The principal business address of WEC Energy Group is 231 W. Michigan Street, Milwaukee, Wisconsin 53203. A list of stockholders of record entitled to vote at the Meeting will be available for inspection by stockholders at WE’s principal business office at 231 W. Michigan Street, Milwaukee, Wisconsin 53203, prior to and at the Meeting.
INTERNET AVAILABILITY OF INFORMATION
The following documents can be found at wisconsinelectric.com:
| |
| • | Notice of Annual Meeting; |
| |
| • | Information Statement; and |
| |
| • | 2017 Annual Report to Stockholders. |
ELECTION OF DIRECTORS
At the Meeting, there will be an election of five directors. Based upon the recommendation of the Corporate Governance Committee of WEC Energy Group’s Board of Directors (the "Corporate Governance Committee"), the individuals named below have been nominated by the WE Board of Directors (the “Board”) to serve a one-year term expiring at the 2019 Annual Meeting of Stockholders and until they are re-elected or until their respective successors are duly elected and qualified.
Directors will be elected by a plurality of the votes cast by the shares entitled to vote, as long as a quorum is present. “Plurality” means that the individuals who receive the largest number of votes are elected as directors up to the maximum number of directors to be chosen. Therefore, shares not voted, whether by withheld authority or otherwise, have no effect in the election of directors.
Each nominee has consented to being nominated and to serve if elected. In the unlikely event that any nominee becomes unable to serve for any reason, the Board will select a substitute nominee based upon the recommendation of the Corporate Governance Committee.
|
| | |
| Wisconsin Electric Power Company | 1 | 2018 Annual Meeting Information Statement |
Director Nominees
The Company does not have a nominating committee. The Corporate Governance Committee provides oversight for the nominating process on behalf of the Board.
Director nominees for the Board are evaluated as a whole with the goal of recommending nominees with diverse backgrounds and experience that, together, can best perpetuate the success of WE’s business and represent stockholder interests. In addition to the specific experiences and skills of the individual director nominees identified below, the Corporate Governance Committee believes that director nominees should generally possess certain characteristics and skills including: proven integrity; mature and independent judgment; vision and imagination; ability to objectively appraise problems; ability to evaluate strategic options and risks; sound business experience and acumen; relevant technological, political, economic, or social/cultural expertise; social consciousness; achievement of prominence in career; and familiarity with national and international issues affecting the Company’s business. After considering the recommendations of the Corporate Governance Committee, the Board selected the nominees listed below.
Board Diversity
The Corporate Governance Committee does not have a specific policy with regards to the consideration of diversity in identifying director nominees. However, the Corporate Governance Committee strives to recommend candidates who each bring a unique perspective to the Board in order to contribute to the collective diversity of the Board. As part of its process, in connection with the nomination of new directors to the Board, the Corporate Governance Committee considers several factors to ensure the entire Board collectively embraces a wide variety of characteristics, including professional background, experience, skills, and knowledge, as well as the criteria listed above. Each candidate will generally exhibit different and varying degrees of these characteristics.
Nominees for Election to the Board of Directors
Biographical information regarding each nominee is shown below. Ages are as of December 31, 2017. All nominees are officers of the Company and are not independent.
J. Kevin Fletcher. Age 59.
| |
| • | Wisconsin Electric Power Company – President since May 2016; Executive Vice President-Customer Service and Operations from June 2015 to April 2016; Senior Vice President-Customer Operations from October 2011 through June 2015. |
| |
| • | Director of Wisconsin Electric Power Company since June 2015. |
| |
| • | Mr. Fletcher also serves as an officer and/or director of several other major subsidiaries of WEC Energy Group. |
Based primarily upon Mr. Fletcher’s executive management experience in customer service and operations at WEC Energy Group and its utility affiliates, as well as his experience in community and economic development while at Georgia Power Company, where he held the title of Vice President-Community and Economic Development, the Board concluded that Mr. Fletcher should serve as a director of the Company.
Margaret C. Kelsey. Age 52.
| |
| • | WEC Energy Group, Inc. – Executive Vice President since September 2017; General Counsel and Corporate Secretary since January 2018. |
| |
| • | Wisconsin Electric Power Company – Executive Vice President, General Counsel, and Corporate Secretary since January 2018. |
| |
| • | Modine Manufacturing Company - Vice President-Corporate Communications from 2014 to August 2017; Vice President, General Counsel and Corporate Secretary from 2008 to August 2017; Vice President-Corporate Development from 2008 to 2014. |
| |
| • | Director of Wisconsin Electric Power Company since January 2018. |
| |
| • | Ms. Kelsey also serves as an officer and/or director of several other major subsidiaries of WEC Energy Group. |
WE's Board elected Ms. Kelsey as a director effective January 1, 2018 after giving consideration to Ms. Kelsey's position and qualifications as Executive Vice President, General Counsel, and Corporate Secretary of WEC Energy Group and its utility subsidiaries. Based upon her extensive experience in legal, governance, compliance, and regulatory matters as General Counsel and Corporate Secretary of Modine Manufacturing as well as in managing corporate communications,
|
| | |
| Wisconsin Electric Power Company | 2 | 2018 Annual Meeting Information Statement |
strategic initiatives, business/corporate development, and treasury/risk management functions at Modine, the Board concluded that Ms. Kelsey should serve as a director of the Company.
Gale E. Klappa. Age 67.
| |
| • | WEC Energy Group, Inc. – Chairman of the Board and Chief Executive Officer (“CEO”) from 2004 to May 2016 and October 2017 to present; Non-Executive Chairman of the Board from May 2016 to October 2017; President from 2003 to August 2013. |
| |
| • | Wisconsin Electric Power Company – Chairman of the Board from 2004 to May 2016 and January 2018 to present; CEO from 2003 to May 2016 and January 2018 to present; President from 2003 to June 2015. |
| |
| • | Director of WEC Energy Group since 2003; Director of Wisconsin Electric Power Company from 2003 to May 2016 and January 2018 to present. |
| |
| • | Mr. Klappa also serves as an executive officer and/or director of several other major subsidiaries of WEC Energy Group. |
Mr. Klappa has more than 40 years of experience working in the public utility industry, including 25 at a senior executive level. He retired as CEO of WEC Energy Group and Wisconsin Electric in May 2016, at which time he assumed the role of Non-Executive Chairman of WEC Energy Group's Board of Directors. In October 2017, the Company's and WEC Energy Group's then-CEO, Allen Leverett, suffered a stroke. In response, WEC Energy Group's Board of Directors activated its succession plan and appointed Mr. Klappa to serve in the role of Chairman of the Board and CEO of WEC Energy Group. WE's Board of Directors appointed Mr. Klappa Chairman of the Board and CEO of the Company effective January 1, 2018. Mr. Klappa's deep knowledge of the Company's industry, operations, customers, stockholders, and management team has allowed for continuity during Mr. Leverett's recovery.
Based upon Mr. Klappa’s extensive executive management, financial, and strategic experience as a senior executive in the utility industry, the Board concluded that Mr. Klappa should serve as director of the Company.
Scott J. Lauber. Age 52.
| |
| • | WEC Energy Group, Inc. – Executive Vice President and Chief Financial Officer (“CFO”) since April 2016; Vice President and Treasurer from February 2013 to March 2016; Assistant Treasurer from March 2011 to January 2013. |
| |
| • | Wisconsin Electric Power Company – Executive Vice President and CFO since April 2016; Vice President and Treasurer from February 2013 to March 2016; Assistant Treasurer from March 2011 to January 2013. |
| |
| • | Director of Wisconsin Electric Power Company since April 2016. |
| |
| • | Mr. Lauber also serves as an officer and/or director of several other major subsidiaries of WEC Energy Group. |
Based primarily upon Mr. Lauber’s more than 27 years of service at WEC Energy Group, including executive and financial management responsibility of its utility affiliates, with a focus on long-range financial planning and oversight of the treasury function, as well as his experience in risk and insurance matters and knowledge of the financial community, the Board concluded that Mr. Lauber should serve as director of the Company.
Tom Metcalfe. Age 50.
| |
| • | Wisconsin Electric Power Company – Executive Vice President-Generation since April 2016; Senior Vice President-Power Generation from January 2014 to March 2016; Vice President-Oak Creek Campus from February 2011 to December 2013. |
| |
| • | Director of Wisconsin Electric Power Company since January 2018. |
| |
| • | Mr. Metcalfe also serves as an officer and director of Wisconsin Public Service Corporation, another utility subsidiary of WEC Energy Group. |
WE's Board elected Mr. Metcalfe as a director effective January 15, 2018. Based primarily upon Mr. Metcalfe’s strong executive experience, considerable knowledge of the Company's industry, customers and strategic initiatives, and executive responsibility for the Company's and Wisconsin Public Service Corporation's generation operations, the Board concluded that Mr. Metcalfe should serve as a director of the Company.
|
| | |
| Wisconsin Electric Power Company | 3 | 2018 Annual Meeting Information Statement |
COMMITTEES OF THE WEC ENERGY GROUP BOARD OF DIRECTORS
WE is a wholly-owned subsidiary of WEC Energy Group, and the WE Board does not have any committees. The WEC Energy Group Board maintains the following committees, which oversee WE operations on behalf of the WEC Energy Group Board: Audit and Oversight, Compensation, Corporate Governance, and Finance. All committees operate under a charter approved by WEC Energy Group’s Board of Directors. A copy of each committee charter is posted in the “Governance” section of WEC Energy Group’s Website at wecenergygroup.com and is available in print to any stockholder who requests it in writing from the Corporate Secretary. Members and principal responsibilities of the WEC Energy Group Board committees are provided below.
|
| | |
| Members | | Principal Responsibilities; Meetings |
| | | |
Audit and Oversight Thomas J. Fischer, Chair John F. Bergstrom Barbara L. Bowles Patricia W. Chadwick Danny L. Cunningham Henry W. Knueppel | | • Oversee the integrity of the financial statements. • Oversee management compliance with legal and regulatory requirements. • Review the Company's environmental and compliance programs. • Review, approve, and evaluate the independent auditors’ services. • Oversee the performance of the internal audit function and independent auditors. • Discuss risk management and major risk exposures and steps taken to monitor and control such exposures. • Prepare the report required by the Securities and Exchange Commission (“SEC”) for inclusion in the proxy and information statements. • Establish procedures for the submission of complaints and concerns regarding WEC Energy Group’s and its subsidiaries’ accounting or auditing matters. • The Audit and Oversight Committee conducted six meetings in 2017. |
| | | |
Compensation John F. Bergstrom, Chair Thomas J. Fischer Ulice Payne, Jr. | | • Identify through succession planning potential executive officers. • Provide competitive, performance-based executive and director compensation programs. • Set performance goals for the CEO, annually evaluate the CEO’s performance against such goals, and determine compensation adjustments based on whether these goals have been achieved. • Prepare the report required by the SEC for inclusion in the proxy and information statements. • The Compensation Committee conducted six meetings in 2017 and executed two written unanimous consents. |
| | | |
Corporate Governance Barbara L. Bowles, Chair Albert J. Budney, Jr. Curt S. Culver Henry W. Knueppel | | • Establish and annually review the Corporate Governance Guidelines to verify that the WEC Energy Group Board of Directors and the Company's Board are effectively performing their fiduciary responsibilities to stockholders. • Establish and annually review director candidate selection criteria. • Identify and recommend candidates to be named as nominees of WEC Energy Group’s Board of Directors and the Company’s Board for election as directors. • Lead the WEC Energy Group Board in its performance annual review. • The Corporate Governance Committee conducted four meetings in 2017 and executed one written unanimous consent. |
| | | |
Finance Curt S. Culver, Chair William J. Brodsky Patricia W. Chadwick William M. Farrow III Ulice Payne, Jr. Mary Ellen Stanek | | • Review and monitor WEC Energy Group’s and its subsidiaries’ current and long-range financial policies and strategies, including each company’s capital structure and dividend policy. • Authorize the issuance of corporate debt within limits set by WEC Energy Group’s Board. • Discuss policies with respect to risk assessment and risk management. • Approve WEC Energy Group’s consolidated financial plan, including the capital budget. • The Finance Committee conducted five meetings in 2017 and executed one written unanimous consent. |
The WE Board met seven times during calendar year 2017 and executed nine written unanimous consents.
With the exception of Mr. Leverett, all WE Board members attended 100% of the total number of WE Board meetings during 2017. Leading up to October when Mr. Leverett suffered a stroke and took a leave of absence to recover, his attendance rate was 100%; at year-end it was 42.9%. Including Mr. Leverett, all WE Board members attended 85.7% of the total number of WE Board of Director meetings during 2017. Ms. Kelsey and Mr. Metcalfe were not directors of the Company at any time during 2017.
|
| | |
| Wisconsin Electric Power Company | 4 | 2018 Annual Meeting Information Statement |
DIRECTOR COMPENSATION
J. Kevin Fletcher, Susan H. Martin, Scott J. Lauber, and Allen L. Leverett served as directors of the Company for all of 2017. Each of these individuals is a named executive officer of WE for 2017 and were not separately compensated as directors. Any compensation received by these individuals for service as named executive officers may be found in the “Summary Compensation Table” on page 27 of this information statement.
OTHER MATTERS
The WE Board of Directors is not aware of any other matters that may properly come before the Meeting. The WE bylaws set forth the requirements that must be followed should a stockholder wish to propose any floor nominations for director or floor proposals at annual or special meetings of stockholders. In the case of annual meetings, the bylaws state, among other things, that notice and certain other documentation must be provided to WE at least 70 days and not more than 100 days before the scheduled date of the annual meeting. No such notices have been received by WE.
CORPORATE GOVERNANCE – FREQUENTLY ASKED QUESTIONS
Does WE have Corporate Governance Guidelines?
The Board follows WEC Energy Group’s Corporate Governance Guidelines that WEC Energy Group has maintained since 1996. WEC Energy Group was one of the earliest adopters of a formal set of Corporate Governance Guidelines. These Guidelines provide a framework under which the WEC Energy Group and WE Boards conduct their business.
To maintain effective Corporate Governance Guidelines, WEC Energy Group’s Corporate Governance Committee annually reviews WEC Energy Group’s and the Company’s governance practices, taking into consideration discussions with WEC Energy Group stockholders as part of the investor outreach and engagement program, industry surveys, and benchmarking studies, as well as governance guidelines published by proxy advisors.
The Guidelines are available in the “Governance” section of WEC Energy Group’s Website at wecenergygroup.com and are available in print to any stockholder who requests them in writing from the Corporate Secretary.
How are directors determined to be independent?
No director qualifies as independent unless the Board affirmatively determines that the director has no material relationship with the Company.
What are the WEC Energy Group Board’s standards of independence?
The guidelines the WEC Energy Group and WE Boards of Directors use in determining director independence are located in Appendix A of the WEC Energy Group Corporate Governance Guidelines. The Guidelines are available in the “Governance” section of WEC Energy Group’s Website at wecenergygroup.com. These standards of independence include a provision that a director will not be considered independent if he or she has been an employee of the Company for the last five years.
Who are the independent directors?
All of WE’s current Board members, as well as all directors who served on WE's Board during 2017, are or were employees of the Company and/or WEC Energy Group at the time of service and are not (or were not) independent.
Are the WEC Energy Group Audit and Oversight and Compensation Committees comprised solely of independent directors?
Yes. These committees are comprised solely of independent directors, as determined by the WEC Energy Group Board.
In addition, the WEC Energy Group Audit and Oversight Committee is a separately designated committee established in accordance with Section 3(a)(58)(A) of the Securities Exchange Act of 1934, as amended.
Is the office of CEO combined with the office of Chairman of the Board?
Yes. The office of CEO is combined with the office of Chairman of the Board at WE. Consistent with WE’s bylaws and WEC Energy Group’s Corporate Governance Guidelines, the Board retains the right to exercise its discretion in combining or separating the offices of CEO and Chairman of the Board.
|
| | |
| Wisconsin Electric Power Company | 5 | 2018 Annual Meeting Information Statement |
What is the Board’s role in risk oversight?
The Board oversees the Company’s risk environment. In addition, the WEC Energy Group Audit and Oversight Committee and the WEC Energy Group Finance Committee provide risk oversight with respect to WEC Energy Group and its subsidiaries, including the Company, on behalf of the WEC Energy Group Board as described in each committee’s charter. The Board receives regular briefings from management on specific areas of risk as well as emerging risks to the enterprise.
Over the course of the year, the WEC Energy Group Audit and Oversight Committee hears reports from management on the Company’s major risk exposures in such areas as regulatory compliance, environmental, legal/litigation, technology security (cybersecurity), and ethical conduct, as well as steps taken to monitor and control such exposures. The WEC Energy Group Finance Committee discusses the Company’s financial risk assessment and risk management policies; it also provides oversight of insurance matters to support the proper function of the risk management program. Both committees have direct access to, and meet as needed with, Company representatives without other management present to discuss matters related to risk management.
The CEO, who is ultimately responsible for managing risk, regularly reports to the Board on risk-related matters. As part of this process, the business unit leaders identify existing, new, or emerging issues or changes within their business areas that could have enterprise implications and report them to senior management. Management is tasked with ensuring that these risks and opportunities are appropriately addressed.
In addition, WEC Energy Group has established an Enterprise Risk Steering Committee, comprised of senior level management employees, whose purpose is to foster an enterprise-wide approach to managing risk and compliance. The Committee regularly reviews key risk areas and provides input to the development and implementation of effective compliance and risk management practices, including external audits. The results of each of these risk-management efforts are reported to the CEO, to the Board, and to the WEC Energy Group Board or its appropriate committee.
The Board believes that its leadership structure and WEC Energy Group’s enterprise risk management program support the risk oversight function of the Board.
How can interested parties contact the members of the Board?
Correspondence may be sent to the directors in care of the Corporate Secretary, Margaret C. Kelsey, at the Company’s principal business office, 231 W. Michigan Street, P.O. Box 2046, Milwaukee, Wisconsin 53201.
All communications received as set forth above will be opened by the Corporate Secretary for the sole purpose of confirming the contents represent a message to the Company’s directors. All communication, other than advertising, promotion of a product or service, or patently offensive material, will be forwarded promptly to the addressee.
Does the Company have a written code of ethics?
Yes. All WE and WEC Energy Group directors, executive officers, and employees, including the principal executive, financial, and accounting officers, have a responsibility to comply with WEC Energy Group’s Code of Business Conduct, to seek advice in doubtful situations, and to report suspected violations.
WEC Energy Group’s Code of Business Conduct addresses, among other things: conflicts of interest; confidentiality; fair dealing; protection and proper use of Company assets; and compliance with laws, rules, and regulations (including insider trading laws). WEC Energy Group, including the Company, has not provided any waiver to the Code for any director, executive officer, or other employee.
The Code of Business Conduct is posted in the “Governance” section of WEC Energy Group’s Website at wecenergygroup.com. It is also available in print to any stockholder upon request in writing to the Corporate Secretary.
The Company has several ways employees can raise questions concerning WEC Energy Group’s Code of Business Conduct and other Company policies. As one reporting mechanism, the Company receives independent services under a contract for employees to confidentially and anonymously report suspected violations of the Code of Business Conduct or other concerns, including those regarding accounting, internal accounting controls, or auditing matters.
Does the Company have policies and procedures in place to review and approve related party transactions?
Yes. All employees of WE and WEC Energy Group, including executive officers and members of the Board, are required to comply with WEC Energy Group’s Code of Business Conduct. The Code of Business Conduct addresses, among other things, what actions are required when potential conflicts of interest may arise, including those from related party transactions. Specifically, executive officers and members of the Board are required to obtain approval of WEC Energy Group’s Audit and
|
| | |
| Wisconsin Electric Power Company | 6 | 2018 Annual Meeting Information Statement |
Oversight Committee Chair before (1) obtaining any financial interest in or participating in any business relationship with any company, individual, or concern doing business with WEC Energy Group or any of its subsidiaries, including WE; (2) participating in any joint venture, partnership, or other business relationship with WEC Energy Group or any of its subsidiaries, including WE; and (3) serving as an officer or member of the board of any substantial outside for-profit organization. Furthermore, before serving as an officer or member of the board of any substantial outside for-profit organization, the CEO must obtain the approval of WEC Energy Group’s full Board of Directors. In addition, executive officers must obtain the prior approval of the CEO before accepting a position with a substantial non-profit organization.
WEC Energy Group’s Code of Business Conduct also requires employees and directors to notify the Compliance Officer of situations where family members are a supplier or significant customer of WEC Energy Group or the Company or employed by one. To the extent the Compliance Officer deems it appropriate, the officer will consult with WEC Energy Group’s Audit and Oversight Committee Chair in situations involving executive officers and members of the Board.
Are all the members of the WEC Energy Group Audit Committee financially literate and does the committee have an “audit committee financial expert”?
Yes. The WEC Energy Group Board of Directors has determined that all of the members of WEC Energy Group’s Audit and Oversight Committee are financially literate as required by New York Stock Exchange rules and qualify as audit committee financial experts within the meaning of SEC rules.
How does WEC Energy Group’s Compensation Committee administer the executive and director compensation programs?
One of the principal responsibilities of WEC Energy Group’s Compensation Committee (the "Compensation Committee") is to provide competitive, performance-based executive and director compensation programs.
With respect to the executive compensation program, the Compensation Committee’s responsibilities include:
| |
| • | determining and annually reviewing the Compensation Committee’s compensation philosophy; |
| |
| • | reviewing and determining the compensation paid to executive officers (including base salaries, incentive compensation, and benefits); |
| |
| • | overseeing the compensation and benefits to be paid to other officers and key employees; |
| |
| • | establishing and administering the Chief Executive Officer compensation package; and |
| |
| • | reviewing the results of the most recent WEC Energy Group stockholder advisory vote on compensation of the named executive officers (“NEOs”). |
The Compensation Committee is also charged with administering the compensation package of WEC Energy Group’s non-management directors. The Compensation Committee meets with the WEC Energy Group Corporate Governance Committee annually to review the compensation package of WEC Energy Group’s non-management directors and to determine the appropriate amount of such compensation. All of the Company’s current Board members are executive officers of WE and are not separately compensated as directors.
The Compensation Committee, which has authority to retain advisers, including compensation consultants, at WEC Energy Group’s expense, retained Frederic W. Cook & Co., Inc. (“FW Cook” or the “Consultant”) to analyze and help develop the executive compensation program, and to assess whether the compensation program is competitive and supports the Committee’s objectives. FW Cook also assesses and provides recommendations on non-management director compensation.
FW Cook is engaged solely by the Compensation Committee to provide executive compensation consulting services, and does not provide any additional services to WEC Energy Group or the Company. In connection with its retention of FW Cook, the Compensation Committee reviewed FW Cook’s independence including: (1) the amount of fees received by FW Cook from WEC Energy Group as a percentage of FW Cook’s total revenue; (2) FW Cook’s policies and procedures designed to prevent conflicts of interest; and (3) the existence of any business or personal relationships that could impact independence. After reviewing these and other factors, the Compensation Committee determined that FW Cook is independent and the engagement did not present any conflicts of interest. FW Cook also determined that it was independent from WEC Energy Group’s and its subsidiaries’ management, which was confirmed in a written statement delivered to the Compensation Committee.
For more information regarding the executive compensation processes and procedures, please refer to the “Compensation Discussion and Analysis” later in this information statement.
|
| | |
| Wisconsin Electric Power Company | 7 | 2018 Annual Meeting Information Statement |
Does the Board have a nominating committee?
No. Instead, as discussed under “Director Nominees” above, WE relies upon WEC Energy Group’s Corporate Governance Committee for, among other things, identifying and evaluating director nominees.
What is the process used to identify director nominees and how do I recommend a nominee to WEC Energy Group’s Corporate Governance Committee?
Please refer to the discussion under the heading “Director Nominees” earlier in this information statement.
WEC Energy Group owns all of the Company’s common stock and, as a result, WEC Energy Group’s affirmative vote is sufficient to elect director nominees. Consequently, the Board does not accept proposals from preferred stockholders regarding potential candidates for director nominees.
What is WE’s policy regarding director attendance at annual meetings?
Directors are not expected to attend the Company’s annual meetings of stockholders, as they are only short business meetings.
INDEPENDENT AUDITORS’ FEES AND SERVICES
Deloitte & Touche LLP served as the independent auditors for the Company for the last 16 fiscal years beginning with the fiscal year ended December 31, 2002. They have been selected by WEC Energy Group’s Audit and Oversight Committee (the “Audit and Oversight Committee”) as independent auditors for WEC Energy Group and its subsidiaries, including the Company, for the fiscal year ending December 31, 2018, subject to ratification by the stockholders of WEC Energy Group at WEC Energy Group’s Annual Meeting of Stockholders on May 3, 2018.
Representatives of Deloitte & Touche LLP are not expected to be present at the Company’s Annual Meeting, but are expected to attend WEC Energy Group’s Annual Meeting of Stockholders on May 3, 2018. They will have an opportunity to make a statement at WEC Energy Group’s Annual Meeting, if they so desire, and are expected to respond to appropriate questions that may be directed to them.
Pre-Approval Policy. The Audit and Oversight Committee has a formal policy delineating its responsibilities for reviewing and approving, in advance, all audit, audit-related, tax, and other services of the independent auditors. As such, the Audit and Oversight Committee is responsible for the audit fee negotiations associated with WEC Energy Group's and the Company’s retention of independent auditors.
The Audit and Oversight Committee is committed to ensuring the independence of the auditors, both in appearance as well as in fact. In order to assure continuing auditor independence, the Audit and Oversight Committee periodically considers whether there should be a regular rotation of the independent external audit firm. In addition, the Audit and Oversight Committee is directly involved in the selection of Deloitte & Touche LLP’s lead engagement partner.
Under the pre-approval policy, before engagement of the independent auditors for the next year’s audit, the independent auditors will submit: (1) a description of all services anticipated to be rendered, as well as an estimate of the fees for each of the services, for the Audit and Oversight Committee to approve, and (2) written confirmation that the performance of any non-audit services is permissible and will not impact the firm’s independence. Annual pre-approval will be deemed effective for a period of twelve months from the date of pre-approval, unless the Audit and Oversight Committee specifically provides for a different period. A fee level will be established for all permissible, pre-approved non-audit services. Any additional audit service, audit-related service, tax service, and other service must also be pre-approved.
The Audit and Oversight Committee delegated pre-approval authority to the Committee’s Chair. The Audit and Oversight Committee Chair is required to report any pre-approval decisions at the next scheduled Audit and Oversight Committee meeting. Under the pre-approval policy, the Audit and Oversight Committee may not delegate to management its responsibilities to pre-approve services performed by the independent auditors.
Under the pre-approval policy, prohibited non-audit services are services prohibited by the Securities and Exchange Commission or by the Public Company Accounting Oversight Board (United States) to be performed by the Company’s independent auditors. These services include: bookkeeping or other services related to the accounting records or financial statements of the Company; financial information systems design and implementation; appraisal or valuation services, fairness opinions or contribution-in-kind reports; actuarial services; internal audit outsourcing services; management functions or human resources; broker-dealer, investment advisor or investment banking services; legal services and expert services unrelated to the audit; services provided for a contingent fee or commission; and services related to planning, marketing or opining in favor of the tax treatment of a confidential transaction or an aggressive tax position transaction that was initially recommended, directly or
|
| | |
| Wisconsin Electric Power Company | 8 | 2018 Annual Meeting Information Statement |
indirectly, by the independent auditors. In addition, the Audit and Oversight Committee has determined that the independent auditors may not provide any services, including personal financial counseling and tax services, to any officer or other employee of the Company who serves in a financial reporting oversight role or to the Chair of the Audit and Oversight Committee or to an immediate family member of these individuals, including spouses, spousal equivalents, and dependents.
Fee Table. The following table shows the fees, all of which were pre-approved by the Audit and Oversight Committee, for professional audit services provided by Deloitte & Touche LLP for the audit of the annual financial statements of the Company for fiscal years 2017 and 2016 and fees for other services rendered during those periods. No fees were paid to Deloitte & Touche LLP pursuant to the “de minimus” exception to the pre-approval policy permitted under the Securities Exchange Act of 1934, as amended.
|
| | | | | | | | |
| | | 2017 | | 2016 |
Audit Fees (1) | | $ | 2,206,306 |
| | $ | 2,108,351 |
|
Audit-Related Fees (2) | | — |
| | — |
|
Tax Fees (3) | | 8,902 |
| | — |
|
All Other Fees (4) | | 2,319 |
| | 3,502 |
|
| Total | | $ | 2,217,527 |
| | $ | 2,111,853 |
|
| |
| (1) | Audit Fees consist of fees for professional services rendered in connection with the audits of the annual financial statements of the Company and its subsidiary, and other non-recurring audit work. This category also includes reviews of financial statements included in Form 10-Q filings of the Company, and services normally provided in connection with statutory and regulatory filings or engagements. |
| |
| (2) | Audit-Related Fees consist of fees for professional services that are reasonably related to the performance of the audit or review of the Company’s financial statements and are not reported under “Audit Fees.” |
| |
| (3) | Tax Fees consist of fees for professional services rendered with respect to federal and state tax compliance and tax advice. This can include preparation of tax returns, claims for refunds, payment planning, and tax law interpretation. No such services were received from Deloitte & Touche in 2016. |
| |
| (4) | All Other Fees consist of costs for certain employees to attend accounting/tax seminars hosted by Deloitte & Touche LLP plus the subscription cost for the use of a Deloitte & Touche LLP accounting research tool. |
AUDIT AND OVERSIGHT COMMITTEE REPORT
The Audit and Oversight Committee, which is comprised solely of independent directors, oversees the integrity of the financial reporting process on behalf of the Company’s Board of Directors. In addition, the Audit and Oversight Committee oversees compliance with the Company’s legal and regulatory requirements. The Audit and Oversight Committee operates under a written charter approved by the Board of Directors of WEC Energy Group, which can be found in the “Governance” section of WEC Energy Group’s Website at wecenergygroup.com.
The Audit and Oversight Committee is also directly responsible for the appointment, compensation, retention, and oversight of the Company’s independent auditors, as well as the oversight of the Company’s internal audit function.
In order to assure continuing auditor independence, the Audit and Oversight Committee periodically considers whether there should be a regular rotation of the independent external audit firm. For 2018, the Audit and Oversight Committee has appointed Deloitte & Touche LLP to remain as the Company’s independent auditors, subject to ratification by WEC Energy Group’s stockholders. The members of the Audit and Oversight Committee and other members of WEC Energy Group’s Board believe that the continued retention of Deloitte & Touche LLP to serve as the Company’s independent external auditor is in the best interests of the Company and its stockholders.
The Audit and Oversight Committee is directly involved in the selection of Deloitte & Touche LLP’s lead engagement partner in conjunction with a mandated rotation policy and is also responsible for audit fee negotiations with Deloitte & Touche LLP.
Management is responsible for the Company’s financial reporting process, the preparation of consolidated financial statements in accordance with generally accepted accounting principles, and the system of internal controls and procedures designed to provide reasonable assurance regarding compliance with accounting standards and applicable laws and regulations. The Company’s independent auditors are responsible for performing an independent audit of the Company’s consolidated financial statements in accordance with the standards of the Public Company Accounting Oversight Board (United States) (the “PCAOB”) and issuing a report thereon.
The Audit and Oversight Committee held six meetings during 2017. Meetings are designed to facilitate and encourage open communication among the members of the Audit and Oversight Committee, management, the internal auditors, and the
|
| | |
| Wisconsin Electric Power Company | 9 | 2018 Annual Meeting Information Statement |
Company’s independent auditors, Deloitte & Touche LLP. During these meetings, we reviewed and discussed with management, among other items, the Company’s unaudited quarterly and audited annual financial statements and the system of internal controls designed to provide reasonable assurance regarding compliance with accounting standards and applicable laws.
We have reviewed and discussed with management and the Company’s independent auditors the Company’s audited consolidated financial statements and related footnotes for the fiscal year ended December 31, 2017, and the independent auditor’s report on those financial statements. Management represented to us that the Company’s financial statements were prepared in accordance with generally accepted accounting principles. Deloitte & Touche LLP presented the matters required to be discussed with the Audit and Oversight Committee by PCAOB Auditing Standard No. 1301, Communications with Audit Committees. This review included a discussion with management and the independent auditors about the quality of the Company’s accounting principles, the reasonableness of significant estimates and judgments, and the disclosures in the Company’s financial statements, as well as the disclosures relating to critical accounting policies.
In addition, we received the written disclosures and the letter relative to the auditors’ independence from Deloitte & Touche LLP, as required by applicable requirements of the PCAOB regarding Deloitte & Touche LLP’s communications with the Audit and Oversight Committee concerning independence. The Audit and Oversight Committee discussed with Deloitte & Touche LLP its independence and also considered the compatibility of non-audit services provided by Deloitte & Touche LLP with maintaining its independence.
Based on these reviews and discussions, the Audit and Oversight Committee recommended to the Company’s Board that the audited financial statements be included in Wisconsin Electric Power Company’s Annual Report on Form 10-K for the fiscal year ended December 31, 2017 and filed with the Securities and Exchange Commission.
Respectfully submitted to Wisconsin Electric Power Company’s stockholders by the Audit and Oversight Committee,
|
| |
| | The Audit and Oversight Committee |
| | of WEC Energy Group, Inc. |
| | |
| | Thomas J. Fischer, Committee Chair John F. Bergstrom Barbara L. Bowles Patricia W. Chadwick Danny L Cunningham Henry W. Knueppel |
|
| | |
| Wisconsin Electric Power Company | 10 | 2018 Annual Meeting Information Statement |
COMPENSATION DISCUSSION AND ANALYSIS
The following discussion provides an overview and analysis of our executive compensation program, including the role of WEC Energy Group’s Compensation Committee (the “Compensation Committee"), the elements of our executive compensation program, the purposes and objectives of these elements, and the manner in which we established the compensation of the Company’s named executive officers (“NEOs”) for fiscal year 2017.
References to “we,” “us,” “our,” and the "Company," in this discussion and analysis mean Wisconsin Electric Power Company and its management, as applicable, and references to “WEC Energy Group” mean WEC Energy Group, Inc.
The Compensation Committee oversees the compensation program of WEC Energy Group and its subsidiaries, including the Company, on behalf of WEC Energy Group’s Board of Directors. Therefore, the Compensation Committee has responsibility for making compensation decisions regarding the NEOs of the Company. There is significant overlap between the NEOs of the Company and the NEOs of WEC Energy Group.
EXECUTIVE SUMMARY
Overview
The primary objective of our executive compensation program is to provide a competitive, performance-based plan that enables WEC Energy Group and the Company to attract and retain key individuals and to reward them for achieving both WEC Energy Group's and the Company’s short-term and long-term goals without creating an incentive for our NEOs to take excessive risks. Our program has been designed to provide a level of compensation that is strongly dependent upon the achievement of short-term and long-term goals that are aligned with the interests of WEC Energy Group's and the Company's stockholders and our customers. To that end, a substantial portion of pay is at risk, and generally, the value will only be realized upon strong corporate performance.
2017 Business Highlights
WEC Energy Group completed its second full year of combined utility operations in 2017 following the acquisition of Integrys Energy Group in June 2015. During 2017, WEC Energy Group made excellent progress in its continued efforts to integrate employees, merge and improve business processes, and consolidate its IT infrastructure. At the same time, WEC Energy Group and its utilities achieved solid results and continued to create long-term value for stockholders and customers by focusing on the following:
|
| | | |
| | • World-class reliability | • Operating efficiency | • Employee safety |
| | | | |
| | • Financial discipline | • Exceptional customer care | |
Commitment to Stockholder Value Creation. Financially, WEC Energy Group and the Company again delivered solid earnings growth, generated strong cash flow, and WEC Energy Group increased its dividend for the 14th consecutive year. In January 2017, the WEC Energy Group Board raised the quarterly dividend 5.1% to $0.5200 per share, equivalent to an annual rate of $2.08 per share. In January 2018, the WEC Energy Group Board increased the quarterly dividend to $0.5525 per share, which is equivalent to an annual rate of $2.21 per share, in line with the plan to maintain a dividend payout ratio of 65% to 70% of earnings. WEC Energy Group and the Company also turned in above target performances in customer satisfaction and network reliability during 2017.
|
| | |
| Wisconsin Electric Power Company | 11 | 2018 Annual Meeting Information Statement |
Specific achievements during 2017 of WEC Energy Group and the Company include:
|
| | |
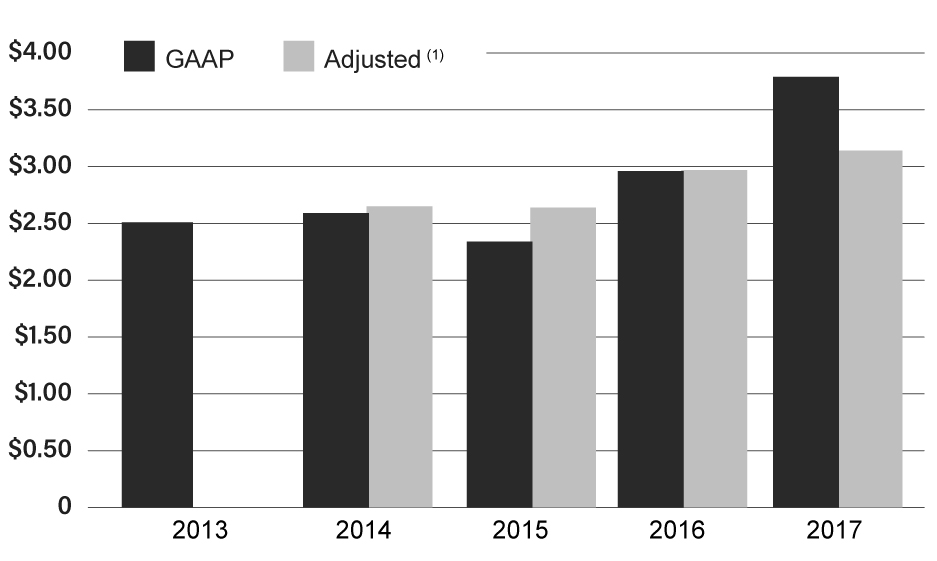
| 2017 Financial Highlights | | WEC Energy Group Diluted Earnings Per Share |
• WEC Energy Group delivered solid earnings growth again, generated strong cash flow, and increased the dividend for the 14th consecutive year.
• WEC Energy Group achieved fully diluted earnings per share and adjusted earnings per share of $3.79 and $3.14, respectively. (2)
• Each of WEC Energy Group's regulated utility subsidiaries, including the Company, earned its allowed rate of return.
• Returned approximately $656.5 million to WEC Energy Group stockholders through dividends.
• WEC Energy Group's common stock traded at an all-time high of $70.09 on November 15, 2017.
• In January 2018, the WEC Energy Group Board raised the quarterly dividend to $0.5525 per share, which is equivalent to an annual dividend rate of $2.21 per share.
| | (1) For 2017, excludes a one-time $0.65 per share gain related to a revaluation of WEC Energy Group deferred taxes as a result of the Tax Cuts and Jobs Act of 2017. For 2016, 2015, and 2014, excludes costs of $0.01, $0.30, and $0.06 per share, respectively, related to WEC Energy Group's acquisition of Integrys. See Appendix A on page A-1 for a full GAAP reconciliation and an explanation of why WEC Energy Group believes the presentation of adjusted earnings per share is relevant and useful to investors.
|
2017 Performance Highlights
| |
| • | WEC Energy Group was recognized in 2017 by Corporate Responsibility Magazine as one of the 50 best corporate citizens in America. |
| |
| • | PA Consulting Group named We Energies (the trade name of WE and Wisconsin Gas LLC) the most reliable utility in the United States in 2017, and in the Midwest for the seventh year in a row. |
| |
| • | WEC Energy Group’s utilities, including the Company, continued to balance the delivery of safe, reliable, and affordable energy with a commitment to protecting the environment. |
| |
| • | At our request, the Public Service Commission of Wisconsin approved a base rate freeze, keeping base rates flat through 2019 for our Wisconsin customers. |
| |
| • | Wisconsin Public Service Corporation, another utility subsidiary of WEC Energy Group, was named as the best midsize utility in the Midwest for business customer satisfaction.(2) |
| |
| • | All major utility subsidiaries of WEC Energy Group, including the Company, either met or exceeded their overall customer satisfaction targets.(2) |
| |
| • | Minnesota Energy Resources Corporation, another utility subsidiary of WEC Energy Group, received the Governor’s Safety Award, which recognizes companies with incident rates that are 51% to 90% better than the industry average.(2) |
| |
| • | We announced an advanced metering infrastructure program, which consists of an integrated system of smart meters, communication networks, and data management systems that enable two-way communication between utilities and customers.(2) |
| |
| • | WEC Energy Group announced a corporate strategy to reshape its generation fleet to provide a clean, reliable future. The plan includes retiring approximately 1,800 MWs of coal generation by 2020 and adding additional natural gas-fired generating units and renewable generation, including utility-scale solar projects. |
| |
| • | WEC Energy Group completed the acquisition of Bluewater Natural Gas Holding, LLC, which owns underground natural gas storage facilities in Michigan. |
| |
| • | Upper Michigan Energy Resources, another utility subsidiary of WEC Energy Group, received approval from the Michigan Public Service Commission to construct and operate approximately 180 MWs of natural gas-fired generation located in the Upper Peninsula of Michigan. |
| |
| • | WEC Energy Group announced that Wisconsin Public Service Corporation, along with two other unaffiliated utilities, agreed to purchase the Forward Wind Energy Center, which consists of 86 wind turbines located in Wisconsin with a total capacity of 129 MWs. The aggregate purchase price is $174 million, of which Wisconsin Public Service's proportionate share is 44.6%, or approximately $78 million. |
(2) This measure is a component of our short-term incentive compensation program.
|
| | |
| Wisconsin Electric Power Company | 12 | 2018 Annual Meeting Information Statement |
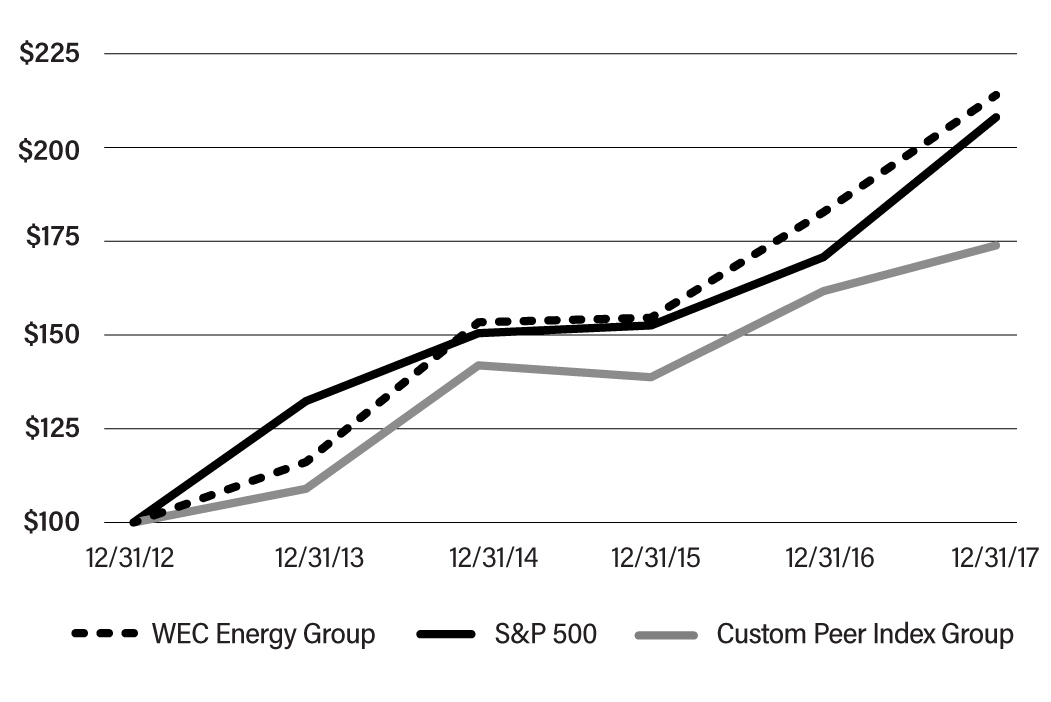
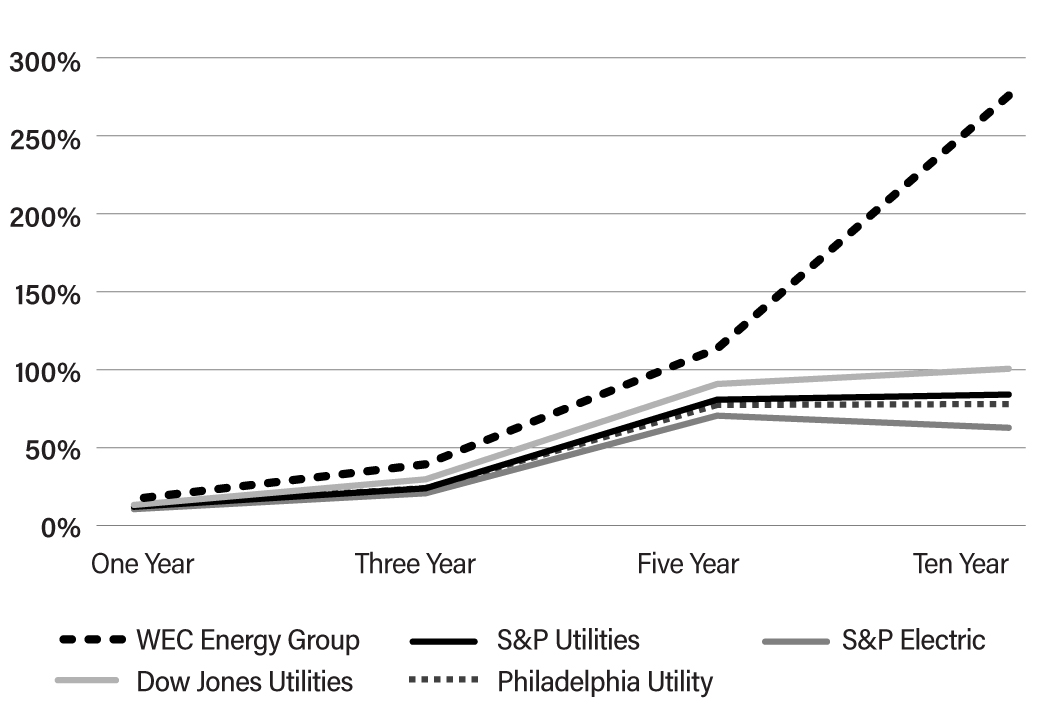
Long-Term Stockholder Returns
Over the past decade, WEC Energy Group has consistently delivered among the best total returns in the industry and did so again in 2017.
|
| |
WEC Energy Group Five-Year Cumulative Return | WEC Energy Group Industry Leading Total Shareholder Returns |
| |
(1) The Five-Year Cumulative Return Chart shows a comparison of WEC Energy Group's cumulative total return, assuming reinvestment of dividends, over the last five years had $100 been invested at the close of business on December 31, 2012. For information about the Custom Peer Index Group, see page 22 of this information statement. | Source: Bloomberg; assumes all dividends are reinvested and returns are compounded daily. |
Key Compensation Program Changes
We continually look for ways to refine our executive compensation program to more effectively align executive pay with performance and reflect best compensation practices. For 2017, based upon feedback received from WEC Energy Group stockholders during investor outreach efforts, the Compensation Committee amended and restated the WEC Energy Group Performance Unit Plan to provide for an Additional Performance Measure in addition to the performance measure of total stockholder return. Performance units will continue to vest in an amount between 0% and 175% of the target award based upon WEC Energy Group’s comparative total stockholder return over a three-year performance period. However, the vesting percentage may be adjusted based upon WEC Energy Group’s performance against the Additional Performance Measure(s). The Compensation Committee selected performance against the weighted average authorized return on equity of all WEC Energy Group’s utility subsidiaries, including the Company, as the Additional Performance Measure for the 2017 performance unit awards. In order for WEC Energy Group to achieve its financial goals, it is important that WEC Energy Group’s utilities, including the Company, earn at or close to their authorized return on equity.
For additional information about the performance units and Additional Performance Measures, see “Long-Term Incentive Compensation” on page 20 of this information statement.
Consideration of 2017 WEC Energy Group Stockholder Advisory Vote and Stockholder Outreach
At the 2017 WEC Energy Group Annual Meeting of Stockholders, stockholders approved the compensation of the 2016 named executive officers with almost 95% of the votes cast. The Compensation Committee considered this outcome as well as the feedback received during meetings WEC Energy Group held with a number of its institutional stockholders. During 2017, WEC Energy Group talked with 30 stockholders representing approximately 45% of WEC Energy Group’s outstanding common stock about its governance and compensation practices. In light of the significant stockholder support for the executive compensation program received in 2017, the payout levels under the performance-based program for 2017, and the changes previously made to the program in 2016, the Compensation Committee continues to believe that the compensation program is competitive, aligned with WEC Energy Group’s and our financial and operational performance, and in the best interests of WEC Energy Group and the Company, stockholders, and customers.
|
| | |
| Wisconsin Electric Power Company | 13 | 2018 Annual Meeting Information Statement |
COMPONENTS OF OUR EXECUTIVE COMPENSATION PROGRAM
We have three primary elements of total direct compensation: (1) base salary; (2) annual incentive awards; and (3) long-term incentive awards consisting of a mix of WEC Energy Group performance units, stock options, and restricted stock. The Compensation Committee retained Frederic W. Cook & Co., Inc. ("FW Cook") as its independent compensation consultant to advise the Compensation Committee with respect to our executive compensation program. The Compensation Committee generally relied on the recommendations of FW Cook as it developed the 2017 program.
As WEC Energy Group first reported in a Current Report on Form 8-K filed on October 12, 2017, Allen Leverett, then Chairman of the Board and CEO of the Company, suffered a stroke. Pursuant to our Bylaws, on October 31, 2017, the Company’s Board of Directors ordered that the duties of Chief Executive Officer would be exercised by the Company’s President, Kevin Fletcher, on an interim basis. Mr. Fletcher exercised these duties through December 31, 2017. Effective January 1, 2018, the Company’s Board appointed Gale E. Klappa to serve as Chairman of the Board and CEO while Mr. Leverett continues to recover from the stroke and until such time as he is able to re-assume those responsibilities. Mr. Fletcher did not receive any additional compensation for his service in this role.
For the remainder of 2017, we continued to compensate Mr. Leverett pursuant to the standard medical leave policy.
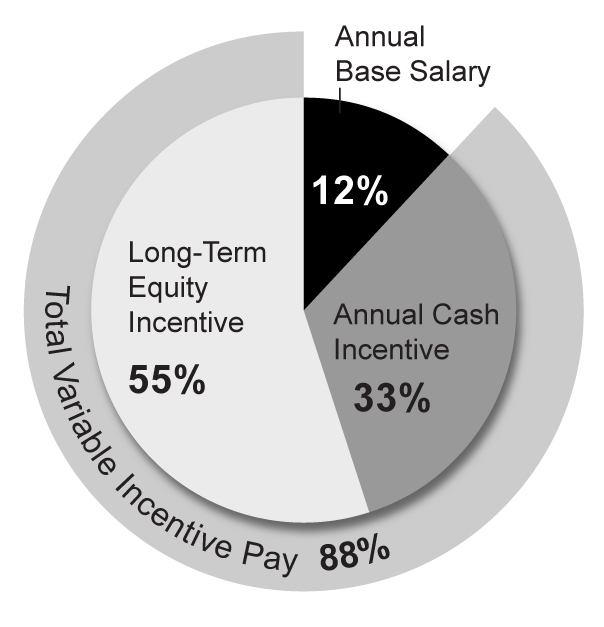
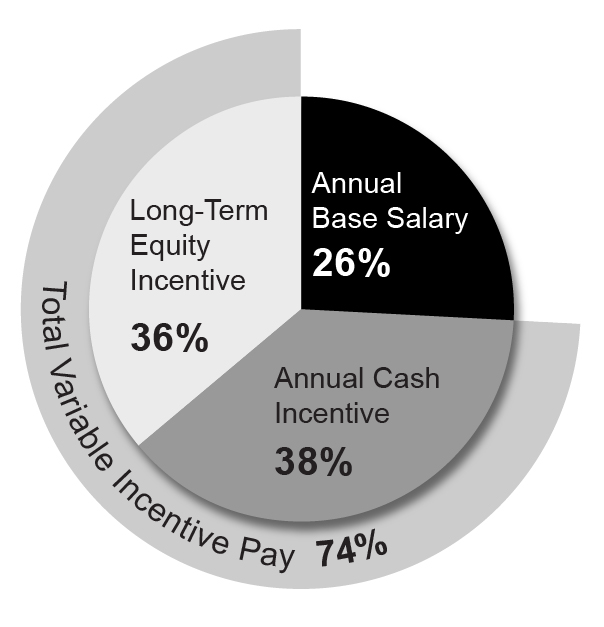
As shown in the charts below, 88% of Mr. Leverett’s 2017 total direct compensation and an average of 74% of the other NEO’s 2017 total direct compensation is tied to WEC Energy Group performance and is not guaranteed.
|
| | |
| CEO 2017 TOTAL DIRECT COMPENSATION MIX | | OTHER NEOs 2017 TOTAL DIRECT COMPENSATION MIX |
| | |
To the extent feasible, WEC Energy Group believes it is important that the compensation program not dilute the interests of current stockholders. Therefore, WEC Energy Group currently uses open market purchases to satisfy benefit plan obligations, including the exercise of stock options and vesting of restricted stock.
In addition to the components of total direct compensation identified above, retirement programs are another important component of our compensation program.
This Compensation Discussion and Analysis contains a more detailed discussion of each of the above components for 2017, including FW Cook's recommendations with respect to each component.
|
| | |
| Wisconsin Electric Power Company | 14 | 2018 Annual Meeting Information Statement |
Compensation Governance and Practices
The Compensation Committee annually reviews and considers the Company’s compensation policies and practices to ensure our executive compensation program aligns with our compensation philosophy. Highlighted below is an overview of our current compensation practices.
|
| | |
| What We Do |
| |
• Our compensation program focuses on key Company results (financial, safety, customer satisfaction, diversity) that are aligned with WEC Energy Group’s and our strategic goals.
• A substantial portion of compensation is at risk and tied to WEC Energy Group and Company performance.
• The compensation program has a long-term orientation aligned with WEC Energy Group stockholder interests.
• The Compensation Committee retains an independent compensation consultant to help design the compensation program and determine competitive levels of pay.
• The Compensation Committee's independent compensation consultant reviews competitive employment market data from two general industry surveys and a comparison group of companies similar to WEC Energy Group.
• We have implemented a clawback policy that provides for the recoupment of incentive-based compensation. (page 24) • Annual incentive-based compensation contains multiple, pre-established performance metrics aligned with WEC Energy Group’s and the Company’s stockholder and customer interests. (page 17)
| | • The WEC Energy Group Performance Unit Plan award payouts (including dividend equivalents) are based on WEC Energy Group stockholder return as compared to an appropriate peer group and Additional Performance Measure(s), selected by the Compensation Committee. (page 20)
• The WEC Energy Group Performance Unit Plan requires a separation from service following a change in control for award vesting to occur. (page 23)
• Equity award and other benefit plan obligations are satisfied through open market purchases of WEC Energy Group common stock.
• Meaningful WEC Energy Group stock ownership levels are required for senior executives. (page 24)
• Ongoing engagement with investors takes place to ensure that compensation practices are responsive to WEC Energy Group stockholder interests.
• We prohibit hedging and pledging of WEC Energy Group common stock. (page 24)
• We prohibit entry into any new arrangements that obligate WEC Energy Group or the Company to pay directly or reimburse individual tax liability for benefits provided. (page 25)
• We prohibit repricing of WEC Energy Group stock options without WEC Energy Group stockholder approval.
|
Competitive Benchmarking
As a general matter, we believe the labor market for WEC Energy Group executive officers is consistent with that of general industry. Although we recognize our business is focused on the energy services industry, our goal is to have an executive compensation program that will allow us to be competitive in recruiting the most qualified candidates to serve as executive officers of WEC Energy Group and the Company, including individuals who may be employed outside of the energy services industry. Further, in order to retain top performing executive officers, we believe our compensation practices must be competitive with those of general industry.
To confirm that our annual executive compensation is competitive with the market, FW Cook reviewed the compensation data obtained from Willis Towers Watson's 2017 Executive Compensation Data Bank as well as similar data from Aon Hewitt. FW Cook also analyzed the compensation data from a peer group of 18 companies similar to WEC Energy Group in size and business model. The methodology used by FW Cook to determine the peer group of companies is described below.
FW Cook started with U.S. companies in the Standard & Poor’s database, and then limited those companies to the same line of business as WEC Energy Group as indicated by the Global Industry Classification Standards. This list of companies was then further limited to companies with revenues between $2.45 billion and $22 billion (approximately one- third to three times the size of WEC Energy Group’s revenues), and that were within a reasonable size range in various other measures such as operating income, total assets, total employees, and market capitalization. From this list, FW Cook selected companies similar in overall size to WEC Energy Group with consideration given to companies that met one or more of the following criteria:
| |
| • | Diversified, technically sophisticated utility operations (e.g., multiple utilities, electric utilities); |
|
| | |
| Wisconsin Electric Power Company | 15 | 2018 Annual Meeting Information Statement |
| |
| • | Minimal non-regulated business; and/or |
| |
| • | Operates in the Midwest. |
These criteria resulted in a comparison group of 18 companies with median revenues and market capitalization of approximately $8.7 billion and $15.2 billion, respectively.
The comparison group utilized for purposes of 2017 compensation includes the same companies as the previous year’s comparison group, except that Dominion Resources was removed based on FW Cook’s recommendation that it no longer meets the applicable criteria. The comparison group consisted of the 18 companies listed below.
|
| | | |
• Alliant Energy Corporation • Ameren Corporation • American Electric Power Company • CMS Energy Corporation • CenterPoint Energy | • Consolidated Edison, Inc. • DTE Energy Co. • Edison International • Entergy Inc. • Eversource Energy
| • FirstEnergy Corp. • NiSource Inc. • PG&E Corporation • PPL Corp. • Pinnacle West Capital Corp.
| • SCANA Corporation • The Southern Company • Xcel Energy Inc. |
The Compensation Committee approved this revised comparison group.
DETERMINATION OF MARKET MEDIAN
In order to determine the “market median” for our NEOs, FW Cook recommended that the survey data from Willis Towers Watson and Aon Hewitt receive a 75% weighting and the comparison group of 18 companies receive a 25% weighting. The Compensation Committee agreed with this recommendation. The survey data received a higher weighting because we consider the labor market for our executives to be consistent with that of general industry. Using this methodology, FW Cook recommended, and the Compensation Committee approved, the appropriate market median for each of our NEOs.
The comparison of each component of compensation with the appropriate market median when setting the compensation levels of our NEOs drives the allocation of cash versus non-cash compensation and short-term versus long-term incentive compensation.
ANNUAL BASE SALARY
The annual base salary component of our executive compensation program provides each executive officer with a fixed level of annual cash compensation. We believe that providing annual cash compensation through a base salary is an established market practice and is a necessary component of a competitive compensation program.
Based upon the market data analyzed by FW Cook, we generally target base salaries to be within (plus or minus) 15% of the market median for each NEO. However, the Compensation Committee may, in its discretion, adjust base salaries outside of this 15% band when the Compensation Committee deems it appropriate.
Actual salary determinations are made taking into consideration factors such as the relative levels of individual experience, performance, responsibility, and contribution to the results of WEC Energy Group’s and the Company’s operations. At the beginning of each year, the WEC Energy Group CEO develops a list of goals for WEC Energy Group and its utility subsidiaries, including the Company, and their employees to achieve during the upcoming year. At the end of the year, the CEO measures the performance of WEC Energy Group and the Company against each stated goal and reports the results to the WEC Energy Group Board. The Compensation Committee then takes WEC Energy Group’s and the Company’s performance into consideration when establishing the compensation of WEC Energy Group’s CEO. The CEO undertakes a similar process with the NEOs, who develop individual goals related to the achievement of WEC Energy Group’s and the Company’s goals developed by the CEO. At the end of the year, each officer’s performance is measured against these goals. Compensation recommendations and determinations for the upcoming year for each executive officer also take into consideration the level of such performance.
The Compensation Committee increased Mr. Leverett’s annual base salary to $1,161,000 for 2017, which was within our targeted range of the market median.
With respect to each other NEO, in December 2016, Mr. Leverett recommended an annual base salary to the Compensation Committee based upon a review of the market compensation data provided by FW Cook and the factors described above. The Compensation Committee approved the recommendations, which represented an average increase in annual base salary of approximately 3% for Messrs. Fletcher and Garvin, and Mmes. Martin and Shafer, and an increase in annual base salary of approximately 16% for Mr. Lauber.
|
| | |
| Wisconsin Electric Power Company | 16 | 2018 Annual Meeting Information Statement |
Upon his appointment as Executive Vice President and Chief Financial Officer, Mr. Lauber’s base salary was previously increased effective April 1, 2016, but was set below the target range because of how significant such an increase would have been in order to bring his salary within the range. As we previously reported, the Compensation Committee’s intent was to continue increasing Mr. Lauber’s salary in multiple steps to move it within the target range. As a result, effective July 1, 2017, the Compensation Committee increased Mr. Lauber’s annual base salary by an additional 16% to provide an aggregate base salary of $496,165 in 2017. The annual base salary of each NEO was within our targeted range of the market median as discussed above.
ANNUAL CASH INCENTIVE COMPENSATION
We provide annual cash incentive compensation through WEC Energy Group’s Short-Term Performance Plan (“STPP”). The STPP provides for annual cash awards to NEOs based upon the achievement of pre-established stockholder-, customer-, and employee- focused objectives. All payments under the STPP are at risk. Payments are made only if performance goals are achieved, and awards may be less or greater than targeted amounts based upon actual performance. Payments under the STPP are intended to reward achievement of short-term goals that contribute to WEC Energy Group stockholder and customer (including our customers) value, as well as individual contributions to successful operations.
2017 Target Awards. Each year, the Compensation Committee approves a target level of compensation under the STPP for each of our NEOs. This target level of compensation is expressed as a percentage of base salary.
The year-end 2017 target awards for each NEO are set forth in the chart below.
|
| |
| Executive Officer | Target STPP Award as a Percentage of Base Salary |
| Mr. Leverett | 125% |
| Mr. Fletcher | 70% |
| Mr. Lauber | 80% |
| Ms. Martin | 70% |
| Mr. Garvin | 65% |
| Ms. Shafer | 65% |
The target award levels of each officer named in this table reflect median incentive compensation practices as indicated by the market data. The Compensation Committee increased Mr. Leverett's and Mr. Lauber’s targets to move them into the median target range for their positions
For 2017, the possible payout for any NEO ranged from 0% of the target award to 210% of the target award, based upon performance.
2017 Financial Goals under the STPP. The Compensation Committee adopted the 2017 STPP with a continued principal focus on financial results. In December 2016, the Compensation Committee approved WEC Energy Group’s earnings per share (75% weight) and cash flow (25% weight) as the primary performance measures to be used in 2017. For those officers whose positions primarily relate to utility operations in Wisconsin, the Compensation Committee approved WEC Energy Group’s earnings per share (25% weight) and cash flow (25% weight), as well as aggregate net income of WEC Energy Group’s Wisconsin utility operations (50% weight), as the primary performance measures to be used in 2017. We believe earnings per share and cash flow are key indicators of financial strength and performance and are recognized as such by the investment community. Utility net income is an important financial measure as it is an indicator of the return on equity earned by WEC Energy Group’s utilities, including us, and in order to meet WEC Energy Group’s earnings per share targets it is important that the utilities earn at or close to their allowed rates of return.
In January 2017, the Compensation Committee approved the performance goals under the STPP for WEC Energy Group’s earnings per share as set forth in the chart below.
|
| | |
| Earnings Per Share Performance Goal | Earnings Per Share CAGR | Payout Level |
| $2.96 | 4.3% | 25% |
| $2.98 | 4.7% | 50% |
| $3.00 | 5.0% | 100% |
| $3.06 | 6.1% | 135% |
| $3.12 | 7.1% | 200% |
If WEC Energy Group performance falls between these levels, the payout level with respect to earnings per share is determined by interpolating on a straight line basis the appropriate payout level.
|
| | |
| Wisconsin Electric Power Company | 17 | 2018 Annual Meeting Information Statement |
WEC Energy Group’s growth plan, which has been communicated to the public, calls for a long-term compound annual growth rate (“CAGR”) in earnings per share of 5.0% to 7.0% off of a 2015 base of $2.72 per share. At the time the Compensation Committee was establishing targets for 2017, we believed that this CAGR, plus WEC Energy Group’s continued growth in dividends would support a premium valuation as compared to WEC Energy Group’s peers. Therefore, the Compensation Committee tied the target (100%) payout level to achievement of the low end of the target CAGR range (5.0%), and the above target payout level to the mid-point of the target range (6.1%). The Compensation Committee tied the maximum payout level (200%) to achievement of a 7.1% CAGR. The Compensation Committee determined that WEC Energy Group’s CAGR should exceed the high end of the target range to achieve the maximum payout level.
In January 2017, the Compensation Committee approved the performance goals under the STPP for WEC Energy Group’s cash flow below ($ in millions).
|
| |
| Cash Flow | Payout Level |
| $1,750 | 25% |
| $1,800 | 50% |
| $1,850 | 100% |
| $1,900 | 135% |
| $2,000 | 200% |
If WEC Energy Group performance falls between these levels, the payout level with respect to cash flow is determined by interpolating on a straight line basis the appropriate payout level.
The Compensation Committee used a different process to establish the cash flow targets for 2017, basing the performance level goals on WEC Energy Group’s funds from operations (“FFO”). FFO is calculated by taking “cash provided by operating activities” and eliminating certain accruals and other items related to capital spending. Generally accepted accounting principles (GAAP) require these items to be recorded as part of cash from operations, but management views them as related to WEC Energy Group’s capital expenditure program. The Compensation Committee believes that basing the cash flow performance goals on FFO provides a more accurate measurement of the cash generated by WEC Energy Group’s operations that is available for capital investment, which is WEC Energy Group’s and the Company’s primary driver for earnings growth. FFO is not a measure of financial performance under GAAP and our calculation may differ from similarly titled measures used by other companies or securities rating agencies.
In January 2017, the Compensation Committee approved the performance goals under the STPP for the Wisconsin utilities’ net income (based upon WEC Energy Group's earnings per share performance goals) below ($ in millions).
|
| | |
| Net Income | Weighted Return on Equity | Payout Level |
| $550 | 9.81% | 25% |
| $556 | 9.91% | 50% |
| $562 | 10.01% | 100% |
| $570 | 10.15% | 135% |
| $580 | 10.32% | 200% |
2017 Financial Performance under the STPP. In January 2018, the Compensation Committee reviewed actual performance for 2017 against the financial and operational performance goals established under the STPP, subject to final audit.
WEC Energy Group’s 2017 financial performance satisfied the maximum payout level established for earnings per share, cash flow, and net income for the Wisconsin utilities. WEC Energy Group’s GAAP earnings per share and adjusted earnings per share were $3.79 and $3.14, respectively, for 2017. The adjusted earnings exclude a one-time $0.65 per share gain related to a revaluation of WEC Energy Group's deferred taxes as a result of the Tax Cuts and Jobs Act of 2017. WEC Energy Group’s cash flow, based on FFO, was $2,113.0 million, and the Wisconsin utilities’ net income was $582.6 million for 2017. Net income is measured against the net income from WEC Energy Group’s Wisconsin segment excluding contributions to the Wisconsin utilities’ charitable foundations and net costs related to the coal plant closings WEC Energy Group announced in 2017. WEC Energy Group’s adjusted earnings per share, cash flow, and net income are not measures of financial performance under GAAP.
By satisfying the maximum payout level with respect to these financial measures, the NEOs earned 200% of the target award from the financial goal component of the STPP.
2017 WEC Energy Group Operational Goals and Performance under the STPP. Similar to prior years, in December 2016 and January 2017, the Compensation Committee also approved operational performance measures and targets under the STPP. Annual incentive awards could be increased or decreased by up to 10% of the actual award based upon WEC Energy
|
| | |
| Wisconsin Electric Power Company | 18 | 2018 Annual Meeting Information Statement |
Group’s performance in the operational areas of customer satisfaction (5% weight), safety (2.5% weight), and supplier and workforce diversity (2.5% weight). The Compensation Committee recognizes the importance of strong operational results to the success of WEC Energy Group and the Company and has identified these three operational areas in particular as being critical to that success.
For 2017, Near Miss/Unsafe Condition ("NMUC") Reports have been added to the measures used to determine WEC Energy Group's and the Company's safety performance. NMUC reporting is designed to proactively identify and take action on potential safety risks before an incident occurs (unsafe conditions); and to learn from near-miss incidents that have occurred, but did not result in an injury or damage.
The operational performance measures are based upon recommendations from management and take into consideration both current year performance and our longer-term objective of achieving top quartile performance. The Compensation Committee reviews management's recommendations and may make adjustments to the performance measures if it feels changes are necessary. The following table provides the operational goals approved by the Compensation Committee for 2017, as well as WEC Energy Group’s performance (which includes the Company’s performance) against these goals:
|
| | | | |
| Operational Measure | Below Goal | Goal | Above Goal | Final Result |
| Customer Satisfaction Percentage of "Highly Satisfied": | -5.00% | 0.00% | +5.00% | |
| Company | <68.6% | 68.6% - 74.7% | >74.7% | 78.0% |
| Transaction | <76.0% | 76.0% - 81.4% | >81.4% | 80.7% |
| Safety: | -2.50% | 0.00% | +2.50% | |
| Lost Time Injury - Incidents | >67 | 39 - 67 | <39 | 63 |
| OSHA Recordable Incidents | >206 | 135 - 206 | <135 | 225 |
| Near Miss / Unsafe Condition Reports | <14,590 | 14,590 - 18,910 | >18,910 | 22,927 |
| Diversity: | -2.50% | 0.00% | +2.50% | |
| Supplier ($ in Millions) | <155.4 | 155.4 - 180.2 | >180.2 | 248.9 |
| Workforce - Assessment | Not Met | Met | Exceeded | Met |
WEC Energy Group’s performance with respect to operational goals generated a 3.75% increase to the compensation awarded under the STPP for 2017. The Compensation Committee measured customer satisfaction levels based upon the results of surveys that an independent third party conducted of customers who had direct contact with WEC Energy Group’s utilities during the year, which measured (1) customers’ satisfaction with the respective utility overall, and (2) customers’ satisfaction with respect to the particular transactions with the applicable utility. Overall, WEC Energy Group’s utilities (including the Company) exceeded target-level performance with respect to the first customer satisfaction measure; and WEC Energy Group exceeded the supplier diversity goal.
2017 Wisconsin Utilities Operational Goals and Performance under the STPP. For those officers whose positions primarily relate to utility operations in Wisconsin, STPP awards could be increased or decreased by up to 10% based upon performance in the operational areas of customer satisfaction (5% weight), safety (2.5% weight), and supplier diversity (1.25% weight) for WEC Energy Group’s Wisconsin utility operations (including the Company), as well as WEC Energy Group’s performance in the operational area of workforce diversity (1.25% weight). The following table provides the operational goals approved by the Compensation Committee for 2017 for WEC Energy Group’s Wisconsin utility operations, as well as the performance against these goals:
|
| | | | |
| Operational Measure | Below Goal | Goal | Above Goal | Final Result |
| Customer Satisfaction Percentage of "Highly Satisfied": | -5.00% | 0.00% | +5.00% | |
| Company | <72.0% | 72.0% - 78.0% | >78.0% | 80.8% |
| Transaction | <79.1% | 79.1% - 85.1% | >85.1% | 82.9% |
| Safety: | -2.50% | 0.00% | +2.50% | |
| Lost Time Injury - Incidents | >25 | 13 - 25 | <13 | 23 |
| OSHA Recordable Incidents | >105 | 65 - 105 | <65 | 118 |
| Near Miss / Unsafe Condition Reports | <13,100 | 13,100 - 15,750 | >15,750 | 22,927 |
| Diversity: | -2.50% | 0.00% | +2.50% | |
| Supplier ($ in Millions) | <90.0 | 90.0 - 104.0 | >104.0 | 132.8 |
| Workforce - Assessment | Not Met | Met | Exceeded | Met |
The Wisconsin utilities' performance with respect to operational goals generated a 3.75% increase to the compensation awarded under the STPP for 2017. The Compensation Committee measured customer satisfaction levels based upon the results of
|
| | |
| Wisconsin Electric Power Company | 19 | 2018 Annual Meeting Information Statement |
surveys that an independent third party conducted of customers who had direct contact with WEC Energy Group’s Wisconsin utilities, including the Company, during the year, which measured (1) customers’ satisfaction with the specific Wisconsin utility overall, and (2) customers’ satisfaction with respect to their particular transactions with their specific utility. WEC Energy Group’s Wisconsin utilities, including the Company, exceeded target-level performance with respect to the first customer satisfaction measure; those utilities also exceeded target-level performance with respect to supplier diversity.
The Compensation Committee retains the right to exercise discretion in adjusting awards under the STPP when it deems appropriate, but did not factor individual contributions into determining the amount of the awards for the NEOs for 2017. Because WEC Energy Group’s performance (which includes the Company’s performance) against the financial and operational goals resulted in significant STPP awards in 2017, the Compensation Committee determined that no further adjustments based upon individual contributions or otherwise were appropriate.
Based upon performance against the financial and operational goals established by the Compensation Committee, Mr. Leverett received annual incentive cash compensation under the STPP of $2,956,922 for 2017. This represented 255% of his annual base salary. Messrs. Fletcher, Lauber, and Garvin, and Mmes. Martin and Shafer, received annual cash incentive compensation for 2017 under the STPP equal to 143%, 163%, 132%, 143%, and 132% of their respective annual base salaries, representing 203.75% of the target award for each officer.
LONG-TERM INCENTIVE COMPENSATION
The Compensation Committee administers WEC Energy Group’s 1993 Omnibus Stock Incentive Plan, amended and restated effective January 1, 2016, which is a WEC Energy Group stockholder-approved, long-term incentive plan designed to link the interests of our executives and other key employees of WEC Energy Group and the Company to creating long-term stockholder value. It allows for various types of awards tied to the performance of WEC Energy Group’s common stock, including WEC Energy Group stock options, stock appreciation rights, and restricted stock. The Compensation Committee also administers the WEC Energy Group Performance Unit Plan, under which the Compensation Committee may award performance units. The Compensation Committee primarily uses WEC Energy Group (1) performance units, including dividend-equivalents, (2) stock options, and (3) restricted stock to deliver long-term incentive opportunities.
Performance Units. Each year, the Compensation Committee makes annual grants of WEC Energy Group performance units under the Performance Unit Plan. The performance units are designed to provide a form of long-term incentive compensation that aligns the interests of management with those of a typical utility stockholder who is focused not only on stock price appreciation but also on dividends. Payouts are based upon WEC Energy Group’s level of “total stockholder return” (stock price appreciation plus reinvested dividends) in comparison to a peer group of companies over a three-year performance period, and beginning with the 2017 grants may be adjusted based upon WEC Energy Group’s performance against an Additional Performance Measure(s). The performance units are settled in cash.
Selection of Additional Performance Measure(s). “Additional Performance Measure” is defined as the performance criterion or criteria (if any) that the Compensation Committee selects, in its sole discretion, based upon the attainment of specific levels of performance by WEC Energy Group. Performance units will continue to vest in an amount between 0% and 175% of the target award based upon WEC Energy Group’s comparative total stockholder return over a three-year performance period. However, the vesting percentage may be adjusted based upon WEC Energy Group’s performance against the Additional Performance Measure(s). The Additional Performance Measure(s), if any, must be selected by the Compensation Committee at the beginning of the three-year performance period. For each year during the performance period, the Compensation Committee will select the target(s) for the Additional Performance Measure(s) and the potential adjustment to the vesting percentage for that year based upon achievement of the Additional Performance Measure(s) relative to the selected target(s). The actual adjustment, if any, to the vesting percentage based upon the Additional Performance Measure(s) will be determined annually. In no event will any adjustment cause the vesting percentage over the three-year performance period to be less than zero.
Short-Term Dividend Equivalents. We increase the number of unvested performance units as of any date that WEC Energy Group declares a cash dividend on its common stock by the amount of short-term dividend equivalents a participant is entitled to receive. Short-term dividend equivalents are calculated by multiplying (a) the number of unvested performance units held by a plan participant as of the related dividend record date by (b) the amount of cash dividend payable by WEC Energy Group on a share of common stock; and (c) dividing the result by the closing price for a share of WEC Energy Group common stock on the dividend payment date. In effect, short-term dividend equivalents are credited and accumulated as reinvested dividends on each performance unit so that the performance units and accumulated dividends will be paid out at the end of the three-year performance period, rather than paying out the dividend equivalents annually on unearned performance units.
Short-term dividend equivalents are treated as additional unvested performance units and are subject to the same vesting, forfeiture, payment, termination, and other terms and conditions as the original performance units to which they relate. In
|
| | |
| Wisconsin Electric Power Company | 20 | 2018 Annual Meeting Information Statement |
addition, outstanding short-term dividend equivalents are treated as unvested performance units for purposes of calculating future short-term dividend equivalents.
Stock Options. Each year, the Compensation Committee also makes annual WEC Energy Group stock option grants as part of the long-term incentive program. These stock options have an exercise price equal to the fair market value of WEC Energy Group common stock on the date of grant and expire on the 10th anniversary of the grant date. Since management benefits from a stock option award only to the extent WEC Energy Group’s stock price appreciates above the exercise price of the stock option, stock options align the interests of management with those of WEC Energy Group stockholders in attaining long-term stock price appreciation.
Restricted Stock. The Compensation Committee also awards WEC Energy Group restricted stock as part of the long-term incentive plan, consistent with market practice. Similar to performance units, restricted stock aligns the interests of management with a typical utility stockholder who is focused on stock price appreciation and dividends.
Aggregate 2017 Long-Term Incentive Awards. In establishing the target value of long-term incentive awards and the appropriate mix of WEC Energy Group performance units, stock options, and restricted stock for each NEO in 2017, the Compensation Committee reviewed the market compensation data and analysis provided by FW Cook. Based upon FW Cook’s analysis, the Compensation Committee determined that the long-term incentive awards for our NEOs would be weighted 65% performance units, 20% stock options, and 15% restricted stock. These target values were presented to and approved by the Compensation Committee in December 2016.
Based upon the market data provided by FW Cook, we target the long-term incentive award to be within (plus or minus) 20% of the market median value of long-term incentive compensation. All of the NEO’s long-term incentive awards were within this target range for 2017.
2017 Stock Option Grants. In December 2016, the Compensation Committee approved the grant of WEC Energy Group stock options to each of our NEOs and established an overall pool of options that were granted to approximately 200 other employees. The option grants to the NEOs were made effective January 3, 2017, the first trading day of 2017. The options were granted with an exercise price equal to the average of the high and low prices reported on the NYSE for shares of WEC Energy Group common stock on the grant date. The options were granted in accordance with WEC Energy Group's standard practice of making annual stock option grants effective on the first trading day of each year, and the timing of the grants was not tied to the timing of any release of material information.
These stock options have a term of 10 years and vest 100% on the third anniversary of the date of grant. The vesting of the stock options may be accelerated in connection with a change in control of WEC Energy Group or an executive officer’s termination of employment under certain circumstances. Subject to the limitations of WEC Energy Group’s 1993 Omnibus Stock Incentive Plan, the Compensation Committee has the power to amend the terms of any option (with the participant’s consent). However, the Committee may not reduce the exercise price of existing options or cancel outstanding options and grant replacement options having a lower exercise price without WEC Energy Group stockholder approval. See “Potential Payments upon Termination or Change in Control” beginning on page 37 for additional information.
For purposes of determining the appropriate number of options to grant to a particular NEO, the value of an option was determined based upon the Black-Scholes option pricing model. We use the Black-Scholes option pricing model for purposes of the compensation valuation. The following table provides the number of options granted to each NEO in 2017:
|
| |
| Executive Officer | Options Granted |
| Mr. Leverett | 130,640 |
| Mr. Fletcher | 17,345 |
| Mr. Lauber | 17,320 |
| Ms. Martin | 21,065 |
| Mr. Garvin | 14,185 |
| Ms. Shafer | 12,565 |
For financial reporting purposes, the stock options granted on January 3, 2017 had a grant date fair value of $7.91 per option for Messrs. Leverett, Fletcher, Lauber and Garvin, and a grant date fair value of $6.40 for Mmes. Martin and Shafer. Mmes. Martin and Shafer are considered to be “retirement eligible.” Therefore, their options are presumed to have a shorter expected life, which results in a lower option value.
|
| | |
| Wisconsin Electric Power Company | 21 | 2018 Annual Meeting Information Statement |
2017 Restricted Stock Awards. In December 2016, the Compensation Committee also approved the grant of WEC Energy Group restricted stock to each of our NEOs and established an overall pool of restricted stock that was granted to approximately 200 other employees. The grants to the NEOs were also made effective January 3, 2017. The restricted stock vests in three equal annual installments beginning on January 3, 2018.
The vesting of the restricted stock may be accelerated in connection with a termination of employment due to a change in control, death or disability, or by action of the Compensation Committee. See “Potential Payments upon Termination or Change in Control” beginning on page 37 for additional information. Tax withholding obligations related to vesting may be satisfied, at the option of the executive officer, by withholding shares otherwise deliverable upon vesting or by cash. The NEOs have the right to vote the restricted stock and to receive cash dividends when WEC Energy Group pays a dividend to its stockholders.
For purposes of determining the appropriate number of shares of restricted stock to grant to a particular NEO, the Compensation Committee used a value of $57.043 per share. This value was based upon the volume weighted price of WEC Energy Group’s common stock for the ten trading days beginning on December 5, 2016, and ending on December 16, 2016. The Compensation Committee uses the volume-weighted price in order to minimize the impact of day-to-day volatility in the stock market.
The measurement period is customarily early- to mid-December for annual awards to shorten the timeframe between the calculation of the awards and the actual grant date. The following table provides the number of shares of restricted stock granted to each NEO in January 2017:
|
| |
| Executive Officer | Restricted Stock Granted |
| Mr. Leverett | 12,975 |
| Mr. Fletcher | 1,722 |
| Mr. Lauber | 1,719 |
| Ms. Martin | 2,091 |
| Mr. Garvin | 1,407 |
| Ms. Shafer | 1,248 |
2017 Performance Units. In 2017, the Compensation Committee granted WEC Energy Group performance units to each of our NEOs and approved a pool of performance units that were granted to approximately 200 other employees. With respect to the 2017 performance units, the amount of the benefit that ultimately vests will be dependent upon WEC Energy Group’s total stockholder return over a three-year period ending December 31, 2019, as compared to the total stockholder return of the custom peer group described below. Total stockholder return is the calculation of total return (stock price appreciation plus reinvestment of dividends) based upon an initial investment of $100 and subsequent $100 investments at the end of each quarter during the three-year performance period. However, the vesting percentage may be adjusted based upon WEC Energy Group’s performance against the Additional Performance Measure. For the 2017 performance unit awards, the Compensation Committee selected performance against the weighted average authorized return on equity of all WEC Energy Group’s utility subsidiaries, including the Company.
Upon vesting, the performance units will be settled in cash in an amount determined by multiplying the number of performance units that have vested by the closing price of WEC Energy Group’s common stock on the last trading day of the performance period.
The 2017 performance unit peer group against which WEC Energy Group's performance will be measured includes:
|
| | | |
| • Alliant Energy Corporation | • DTE Energy Co. | • Great Plains Energy, Inc. | • SCANA Corporation |
| • Ameren Corporation | • Duke Energy Corp. | • NiSource Inc. | • The Southern Company |
| • American Electric Power Company | • Edison International | • OGE Energy Corp. | • Xcel Energy Inc. |
| • CMS Energy Corporation | • Eversource Energy | • PG&E Corporation | |
| • Consolidated Edison, Inc. | • FirstEnergy Corp. | • Pinnacle West Capital Corp. | |
The peer group is chosen by the Compensation Committee, based upon management’s recommendation and with the concurrence of FW Cook. This peer group was chosen because we believe these companies are similar to WEC Energy Group in terms of business model and long-term strategies, with a focus on regulated utility operations rather than a non-regulated business model. There is significant overlap between the performance unit peer group and the comparison group developed by FW Cook for purposes of benchmarking compensation levels. However, there are several companies that are different among the two groups because FW Cook places significant weight on the financial metrics of the companies included in its comparison group, whereas we focus more on operational measures for the performance unit peer group.
|
| | |
| Wisconsin Electric Power Company | 22 | 2018 Annual Meeting Information Statement |
The required percentile ranking for total stockholder return and the applicable vesting percentage are set forth in the chart below.
|
| |
| Performance Percentile Rank | Vesting Percent |
| < 25th Percentile | 0% |
| 25th Percentile | 25% |
| Target (50th Percentile) | 100% |
| 75th Percentile | 125% |
| 90th Percentile | 175% |
If WEC Energy Group’s rank is between the benchmarks identified above, the vesting percentage will be determined by interpolating on a straight line basis the appropriate vesting percentage. Unvested performance units generally are immediately forfeited upon a NEO’s cessation of employment with WEC Energy Group prior to completion of the three-year performance period. However, the performance units will vest immediately at the target 100% rate upon the termination of the NEO’s employment (1) by reason of disability or death or (2) after a change in control of WEC Energy Group. In addition, a prorated number of performance units (based upon the target 100% rate) will vest upon the termination of employment of the NEO by reason of retirement prior to the end of the three-year performance period.
For the 2017 performance unit awards, the Additional Performance Measure is the weighted average authorized return on equity (“ROE”) of all WEC Energy Group’s utility subsidiaries, including the Company. Performance against this measure may increase or decrease the vesting percentage of the performance units up to 10% over the three year performance period. For 2017, the ROE targets and potential adjustments were set as follows:
|
| | |
| If Actual Annual Authorized ROE is | The Annual Adjustment is | ROE Ranges |
| ≤ 20 bp below the Authorized ROE | + 3.33% | ≥ 9.76% |
| 21 - 30 bp below the Authorized ROE | 0% | 9.66% - 9.75% |
| > 30 bp below the Authorized ROE | (3.33)% | < 9.66% |
WEC Energy Group’s utility subsidiaries achieved a weighted average authorized ROE of 10.25% for 2017. This resulted in a 3.33% increase in the vesting percentage of the performance units awarded in January 2017. For purposes of determining the appropriate number of performance units to grant to a particular NEO, the Compensation Committee used a value of $57.043 per unit, the same value used for the restricted stock granted in January 2017.
The following table provides the number of performance units granted to each NEO effective January 3, 2017, at the 100% target level:
|
| |
| Executive Officer | Performance Units Granted |
| Mr. Leverett | 56,225 |
| Mr. Fletcher | 7,465 |
| Mr. Lauber | 7,455 |
| Ms. Martin | 9,065 |
| Mr. Garvin | 6,105 |
| Ms. Shafer | 5,405 |
2017 Payouts under Previously Granted Long-Term Incentive Awards. In 2015, the Compensation Committee granted WEC Energy Group performance unit awards to participants in the Performance Unit Plan, including the NEOs. The terms of the performance units granted in 2015 were substantially similar to those of the performance units granted in 2017 described above, except that the 2015 performance units did not have an Additional Performance Measure. The required percentile ranks for total stockholder return and related vesting schedule were identical to that of the 2017 performance units.
Payouts under the 2015 performance units were based upon WEC Energy Group’s total stockholder return for the three-year performance period ended December 31, 2017 against the same group of peer companies used for the 2017 performance unit awards, except that the 2015 peer group included Avista, but did not include Edison International. However, in December 2017, the Compensation Committee determined that Avista Corporation should be removed from the custom peer group for the 2015 performance unit award. On July 19, 2017, Hydro One Limited and Avista announced that they had entered into an agreement whereby Hydro One will purchase Avista. Upon this announcement, there was a significant increase in Avista’s stock price, which we believe was not the result of ongoing operating performance. This action is consistent with the Compensation Committee’s past decisions to adjust the peer group to account for the impact of mergers and acquisitions.
Accounting for this change, WEC Energy Group’s total stockholder return was at the 56th percentile of the peer group for the three-year performance period ended December 31, 2017, resulting in the performance units vesting at a level of 105.6%. The
|
| | |
| Wisconsin Electric Power Company | 23 | 2018 Annual Meeting Information Statement |
actual payouts were determined by multiplying the number of vested performance units by the closing price of WEC Energy Group common stock ($66.43) on December 29, 2017, the last trading day of the performance period. The actual payout to each NEO is reflected in the “Option Exercises and Stock Vested for Fiscal Year 2017” table.
COMPENSATION RECOUPMENT POLICY
Accountability is a fundamental value of WEC Energy Group and the Company. To reinforce this value through the executive compensation program, the Compensation Committee has adopted a clawback policy that provides for the recoupment of incentive-based compensation in the event WEC Energy Group is required to prepare an accounting restatement due to material noncompliance with any financial reporting requirement under the securities laws (other than restatements permitted as a result of changes in accounting principles or interpretation). Pursuant to the policy, the Compensation Committee will recover from any current or former executive officer who has received incentive-based compensation during the three-year period preceding the date on which WEC Energy Group is required to prepare the accounting restatement, any portion of the incentive-based compensation paid in excess of what would have been paid to the executive officer under the restated financial results. WEC Energy Group may also recover incentive-based compensation if an executive officer’s employment is terminated for cause, or the executive officer violates a noncompetition or other restrictive covenant.
STOCK OWNERSHIP GUIDELINES
The Compensation Committee believes that an important adjunct to the long-term incentive program is significant stock ownership by officers who participate in the program, including the NEOs. Accordingly, the Compensation Committee has implemented WEC Energy Group stock ownership guidelines requiring officers who participate in the long-term incentive program to hold an amount of WEC Energy Group common stock and other equity-related WEC Energy Group securities that varies depending upon such officer's level.
In addition to shares owned outright, holdings of each of the following are included in determining compliance with the stock ownership guidelines: restricted stock; WEC Energy Group phantom stock units held in the Executive Deferred Compensation Plan; WEC Energy Group stock held in WEC Energy Group’s 401(k) plans; performance units at target; and shares held in a brokerage account, jointly with an immediate family member or in a trust.
Effective January 1, 2017, the guidelines require each executive officer, including the NEOs, to acquire (generally within five years of appointment as an executive officer) and hold WEC Energy Group common stock and other equity-related securities of WEC Energy Group having a minimum fair market value ranging from 250% to 600% of base salary. The Compensation Committee believes these stock ownership guidelines discourage unreasonable risk taking by officers.
The Compensation Committee annually reviews whether executive officers are in compliance with these guidelines. The last review was completed in October 2017. The Compensation Committee determined that all of the NEOs are in compliance with the ownership guidelines.
PROHIBITION ON HEDGING AND PLEDGING
WEC Energy Group's Corporate Securities Trading Policy prohibits the use of any strategies or products, including derivatives and short-selling techniques, to hedge against potential changes in the value of WEC Energy Group’s common stock. The policy also prohibits the holding of WEC Energy Group securities in a margin account, as well as the pledging of WEC Energy Group securities as collateral for a loan.
LIMITED TRADING WINDOWS
Officers, including the NEOs, other key employees, and WEC Energy Group directors may only transact in WEC Energy Group securities during approved trading windows after satisfying mandatory pre-clearance requirements.
RETIREMENT PROGRAMS
WEC Energy Group also maintains retirement plans in which our NEOs participate: a defined benefit pension plan of the cash balance type, a supplemental executive retirement plan, and individual letter agreements with some of the NEOs. We believe our retirement plans are a valuable benefit in the attraction and retention of our employees, including the NEOs. We believe that providing a foundation for long-term financial security for our employees, beyond their employment with the Company, is a valuable component of our overall compensation program which will inspire increased loyalty and improved performance. For more information about our retirement plans, see "Pension Benefits at Fiscal Year-End 2017" and "Retirement Plans."
|
| | |
| Wisconsin Electric Power Company | 24 | 2018 Annual Meeting Information Statement |
OTHER BENEFITS, INCLUDING PERQUISITES
We provide our executive officers, including the NEOs, with employee benefits and a limited number of perquisites. Except as specifically noted elsewhere in this information statement, the employee benefits programs in which executive officers participate (which provide benefits such as medical coverage, retirement benefits, and annual contributions to a qualified savings plan) are generally the same programs offered to substantially all of the Company’s salaried employees.
The perquisites made available to executive officers include financial planning, membership in a service that provides health care and safety management when traveling outside the United States, reimbursement for expenses related to annual physical exam costs not covered by insurance, and limited spousal travel for business purposes. The Company also pays periodic dues and fees for club memberships for certain of the NEOs and other designated officers.
We customarily review market data regarding executive perquisite practices on an annual basis. Following WEC Energy Group’s acquisition of Integrys Energy Group, the Compensation Committee undertook a thorough review of WEC Energy Group’s perquisite practices with FW Cook. At that time, FW Cook recommended to the Compensation Committee that the current package of perquisites be retained. For 2017, the Compensation Committee again reviewed the package of perquisites with FW Cook and decided not to make any changes. WEC Energy Group and the Company have a legacy group of executives who are still eligible for gross-ups. We reimburse those executives for taxes paid on income attributable to the financial planning benefits provided to the executives only if the executive uses the Company’s identified preferred provider, AYCO. We believe the use of the preferred financial adviser provides administrative benefits and eases communication between Company personnel and the financial adviser.
We pay periodic dues and fees for certain club memberships as we have found that the use of these facilities helps foster better customer and community relationships. Officers, including the NEOs, are expected to use clubs for which the Company pays dues primarily for business purposes. We do not pay any additional expenses incurred for personal use of these facilities, and officers are required to reimburse the Company to the extent that it pays for any such personal use. The total annual club dues are included in the "Summary Compensation Table." We do not permit personal use of the airplane utilized by WEC Energy Group. We do allow spousal travel if an executive’s spouse is accompanying the executive on business travel and the airplane is not fully utilized by WEC Energy Group personnel. There is no incremental cost to WEC Energy Group or the Company for this travel, other than the reimbursement for taxes paid on imputed income attributable to the executives for this perquisite, as the airplane cost is the same regardless of whether an executive’s spouse travels. Any tax reimbursement is subject to the Company's Tax Gross-Up Policy discussed below.
In addition, each of our executive officers is eligible to participate in an officer life insurance benefit. If an executive officer chooses to participate, upon such officer’s death while employed by WEC Energy Group and/or the Company, a benefit is paid to his or her designated beneficiary in an amount equal to the value of three times the officer’s base salary at the time of death.
TAX GROSS-UP POLICY
The Compensation Committee adopted a formal policy that prohibits entry into any contract, agreement, or arrangement with any officer of WEC Energy Group or its subsidiaries, including the Company, that obligates the Company to pay directly or reimburse the officer for any portion of the officer’s individual tax liability for benefits provided by the Company. Excluded from this policy are (1) agreements or arrangements entered into prior to December 2014 when the policy was adopted, (2) agreements or arrangements entered into prior to, and assumed by WEC Energy Group or the Company in connection with, any merger or acquisition, or (3) plans or policies applicable to Company employees generally.
This policy formalizes the Compensation Committee’s policy since July 2011 to eliminate tax gross-ups on perquisites provided by WEC Energy Group and the Company to their officers (except to officers who were already receiving gross-ups as of July 2011). Other than Mr. Fletcher, the NEOs were receiving gross-ups from WEC Energy Group and/or the Company prior to July 2011.
SEVERANCE BENEFITS AND CHANGE IN CONTROL
Several years ago, the Compensation Committee determined that it would no longer offer severance and change in control benefits in employment agreements. Therefore, Messrs. Lauber and Garvin, and Mmes. Martin and Shafer, have not entered into an employment agreement that provides for these benefits. However, they are eligible to participate in the Company’s Severance Pay Plan. Prior to that time, each of Messrs. Leverett and Fletcher entered into an employment agreement with WEC Energy Group, which includes severance and change in control provisions. For a discussion of the severance and change in control benefits available under these agreements, and to our executive officers generally, see “Potential Payments upon Termination or Change in Control.”
|
| | |
| Wisconsin Electric Power Company | 25 | 2018 Annual Meeting Information Statement |
In addition, WEC Energy Group’s supplemental pension plan provides that in the event of a change in control of WEC Energy Group, each NEO will be entitled to a lump sum payment of amounts due under the plan if employment is terminated within 18 months of the change in control.
IMPACT OF PRIOR COMPENSATION
The Compensation Committee does not believe it is appropriate to consider the amounts realized or realizable from prior incentive compensation awards when establishing future levels of short-term and long-term incentive compensation.
SECTION 162(m) OF THE INTERNAL REVENUE CODE
Section 162(m) of the Internal Revenue Code limits the deductibility of certain executives’ compensation that exceeds $1 million per year. For tax years prior to 2018, compensation over $1 million per year could be deducted if such compensation was performance-based under Section 162(m) and issued through a plan that had been approved by stockholders. Although the Compensation Committee historically took into consideration the provisions of Section 162(m), it believes that maintaining tax deductibility is only one consideration among many in the design of an effective executive compensation program. With respect to 2017 compensation for the NEOs, the stock option grants under the WEC Energy Group 1993 Omnibus Stock Incentive Plan have been structured to qualify as performance-based compensation under Section 162(m). The remaining components of the 2017 compensation program do not qualify for tax deductibility under Section 162(m).
The recently enacted tax reform legislation has raised some questions as to whether performance-based compensation granted in 2018 and thereafter may continue to be deducted. The Compensation Committee does not anticipate that the tax law changes, if applicable, will have a significant impact on the executive compensation program as the Committee continues to believe that a significant portion of the executives’ compensation should be at risk and based upon performance against WEC Energy Group and Company goals.
COMPENSATION COMMITTEE REPORT
The Compensation Committee has reviewed and discussed the Compensation Discussion and Analysis required by Item 402(b) of Regulation S-K with management and, based on such review and discussions, the Compensation Committee recommended to the Board that the Compensation Discussion and Analysis be included in this information statement.
|
| |
| | The Compensation Committee |
| | of WEC Energy Group, Inc. |
| | |
| | John F. Bergstrom, Committee Chair Thomas J. Fischer Ulice Payne, Jr. |
|
| | |
| Wisconsin Electric Power Company | 26 | 2018 Annual Meeting Information Statement |
EXECUTIVE COMPENSATION
The following table summarizes total compensation awarded to, earned by, or paid to WEC Energy Group’s Chief Executive Officer ("CEO"), Chief Financial Officer ("CFO"), and each of the other individuals identified in the table below (the “NEOs”). The amounts shown in this and all subsequent tables in this information statement are WEC Energy Group consolidated compensation data.
SUMMARY COMPENSATION TABLE
|
| | | | | | | | | | | | | | | | | | |
| | | | | (5) | (6) | (7) | (8) | (9)(10) | | |
Name and Principal Position | Year | Salary | Bonus | Stock Awards | Option Awards | Non-Equity Incentive Plan Compensation | Change in Pension Value and Nonqualified Deferred Compensation Earnings | All Other Compensation | Total | Total Without Change in Pension Value |
| | | ($) | ($) | ($) | ($) | ($) | ($) | ($) | ($) | ($) |
Allen L. Leverett(1) Chairman and Chief Executive Officer
| 2017 | 1,161,000 |
| — | 4,034,706 |
| 1,033,362 |
| 3,018,251 |
| 4,224,896 |
| 170,022 |
| 13,642,237 |
| 9,437,265 |
|
| 2016 | 941,667 |
| — | 2,939,251 |
| 769,144 |
| 2,162,593 |
| 4,549,812 |
| 140,512 |
| 11,502,979 |
| 6,963,294 |
|
| 2015 | 799,155 |
| — | 2,762,955 |
| 481,762 |
| 1,680,500 |
| 925,639 |
| 132,014 |
| 6,782,025 |
| 5,858,590 |
|
J. Kevin Fletcher(1)(2) President | 2017 | 436,800 |
| — | 535,648 |
| 137,199 |
| 633,095 |
| 1,198,310 |
| 44,062 |
| 2,985,114 |
| 1,800,225 |
|
| 2016 | 411,345 |
| — | 336,818 |
| 81,425 |
| 606,866 |
| 671,274 |
| 39,869 |
| 2,147,597 |
| 1,482,133 |
|
Scott J. Lauber(2) Executive Vice President and Chief Financial Officer | 2017 | 467,321 |
| — | 534,890 |
| 137,001 |
| 764,441 |
| 93,343 |
| 66,124 |
| 2,063,120 |
| 1,977,525 |
|
| 2016 | 351,784 |
| — | 158,886 |
| 38,371 |
| 513,010 |
| 65,818 |
| 38,116 |
| 1,165,985 |
| 1,103,685 |
|
Susan H. Martin(3) Executive Vice President | 2017 | 530,450 |
| — | 650,451 |
| 134,816 |
| 771,436 |
| 108,918 |
| 64,827 |
| 2,260,898 |
| 2,156,824 |
|
| 2016 | 515,000 |
| — | 587,165 |
| 106,358 |
| 779,035 |
| 102,117 |
| 113,108 |
| 2,202,783 |
| 2,103,032 |
|
| 2015 | 475,000 |
| — | 824,278 |
| 87,032 |
| 741,831 |
| 86,748 |
| 58,343 |
| 2,273,232 |
| 2,186,678 |
|
Robert M. Garvin Executive Vice President - External Affairs | 2017 | 428,604 |
| — | 437,987 |
| 112,203 |
| 578,855 |
| 80,450 |
| 66,394 |
| 1,704,493 |
| 1,624,043 |
|
| 2016 | 416,120 |
| — | 406,738 |
| 98,269 |
| 541,443 |
| 75,596 |
| 65,541 |
| 1,603,707 |
| 1,528,639 |
|
| 2015 | 404,000 |
| — | 709,707 |
| 88,189 |
| 539,575 |
| 60,584 |
| 62,499 |
| 1,864,554 |
| 1,804,019 |
|
Joan M. Shafer(4) Executive Vice President - Human Resources & Org Effectiveness | 2017 | 379,600 |
| — | 387,904 |
| 80,416 |
| 505,936 |
| 60,113 |
| 78,140 |
| 1,492,109 |
| 1,432,059 |
|
Note: In order to show the effect that the year-over-year change in pension value had on total compensation, as determined under applicable SEC rules, we have included an additional column to show total compensation minus the change in pension value. The amounts reported in the Total Without Change in Pension Value column may differ substantially from the amounts reported in the Total column required under SEC rules and are not a substitute for total compensation. Total Without Change in Pension Value represents total compensation, as determined under applicable SEC rules, minus the change in pension value reported in the Change in Pension Value and Nonqualified Deferred Compensation Earnings column. The change in pension value is subject to many external variables, such as interest rates, that are not related WEC Energy Group or Company performance. Therefore, we do not believe a year-over-year change in pension value is helpful in evaluating compensation for comparative purposes.
| |
| (1) | As WEC Energy Group first reported in a Current Report on Form 8-K filed on October 12, 2017, Allen Leverett, then Chairman of the Board and CEO of the Company, suffered a stroke. Pursuant to our Bylaws, on October 31, 2017, the Company’s Board of Directors ordered that the duties of Chief Executive Officer would be exercised by the Company’s President, Kevin Fletcher, on an interim basis. Mr. Fletcher exercised these duties through December 31, 2017. Effective January 1, 2018, the Company’s Board appointed Gale E. Klappa to serve as Chairman of the Board and CEO while Mr. Leverett continues to recover from the stroke and until such time as he is able to re-assume those responsibilities. |
| |
| (2) | Mr. Lauber, who was named Executive Vice President and CFO effective April 1, 2016, and Mr. Fletcher, who was named President of the Wisconsin utilities effective May 1, 2016, became named executive officers in 2016. Therefore, no information has been provided for 2015 for either officer. |
| |
| (3) | Ms. Martin held the title of Executive Vice President, General Counsel and Corporate Secretary through December 31, 2017. As we previously reported, Ms. Martin intends to retire in early 2018. As part of this transition, effective January 1, 2018, Ms. Martin holds the title of Executive Vice President. |
| |
| (4) | Ms. Shafer became a named executive officer in 2017. Therefore, no information has been provided for 2015 and 2016 for Ms. Shafer. |
| |
| (5) | The amounts reported reflect the aggregate grant date fair value, as computed in accordance with FASB ASC Topic 718 excluding estimated forfeitures, of performance units and/or restricted stock awarded to each NEO in the respective year for which such amounts are reported. The amounts reported for the performance units are based upon the probable outcome as of the grant date of associated performance and market conditions, and are consistent with our estimate, as of the grant date, of aggregate compensation cost to be recognized over the three-year performance period. The actual value received by the executives from these awards may range from $0 to greater than the reported amounts, depending upon WEC Energy Group’s performance and the executive’s number of additional years of service with the Company. |
|
| | |
| Wisconsin Electric Power Company | 27 | 2018 Annual Meeting Information Statement |
The value of the performance unit awards as of the grant date, assuming achievement of the highest level of performance and excluding any performance units resulting from short-term dividend equivalents and the Additional Performance Measure, for each of Messrs. Leverett, Fletcher, Lauber, and Garvin, and Mmes. Martin and Shafer, is $5,736,862, $761,697, $760,647, $622,931, $924,951, and $551,507, respectively, for the 2017 awards. The value of the performance unit awards as of the grant date, assuming achievement of the highest level of performance and excluding any performance units resulting from short-term dividend equivalents, for each of Messrs. Leverett, Fletcher, Lauber, and Garvin, and Ms. Martin, is $4,179,276, $427,001, $225,903, $578,406, and $835,068, respectively, for the 2016 awards. See “Option Exercises and Stock Vested For Fiscal Year 2017” for the amount of the actual payout with respect to the 2015 award of performance units. Not included are the performance unit awards resulting from short-term dividend equivalents and/or the Additional Performance Measure that may increase or, in the case of the Additional Performance Measure, decrease these amounts.
| |
| (6) | The amounts reported reflect the aggregate grant date fair value, as computed in accordance with FASB ASC Topic 718 excluding estimated forfeitures, of options awarded to each NEO in the respective year for which such amounts are reported. The actual value received by the executives from these awards may range from $0 to greater than the reported amounts, depending upon WEC Energy Group performance. In accordance with FASB ASC Topic 718, we made certain assumptions in our calculation of the grant date fair value of the stock options. See “Stock Options” in Note 1(k) Stock-Based Compensation, in the Notes to Consolidated Financial Statements in our 2017 Annual Report on Form 10-K for a description of these assumptions. For 2017, the assumptions made in connection with the valuation of the stock options are the same as described in Note 1(k), except that the expected life of the options is 7.6 years for Messrs. Leverett, Fletcher, Lauber, and Garvin, and 4.9 years for Mmes. Martin and Shafer. The change in the expected life of the options as set forth in Note 1(k) resulted from the fact that Mmes. Martin and Shafer are “retirement eligible” as of the grant date, and Messrs. Leverett, Fletcher, Lauber, and Garvin were not, whereas the assumption described in Note 1(k) is a weighted average of all option holders |
| |
| (7) | Consists of the annual incentive compensation and short-term dividend equivalents earned under WEC Energy Group’s STPP. The amounts earned for each award for 2017 are shown below. |
|
| | | |
| Name | Annual Incentive Award ($) | Short-Term Dividend Equivalents ($) | Total ($) |
| Allen L. Leverett | 2,956,922 | 61,329 | 3,018,251 |
| J. Kevin Fletcher | 622,986 | 10,109 | 633,095 |
| Scott J. Lauber | 760,250 | 4,191 | 764,441 |
| Susan H. Martin | 756,554 | 14,882 | 771,436 |
| Robert M. Garvin | 567,633 | 11,222 | 578,855 |
| Joan M. Shafer | 502,733 | 3,203 | 505,936 |
In conjunction with WEC Energy Group performance units granted prior to January 1, 2016, certain officers, including the NEOs, and employees were eligible to receive dividend equivalents under the STPP in an amount equal to the number of performance units at the target 100% rate held by each such officer or employee on the dividend declaration date multiplied by the amount of cash dividends paid by WEC Energy Group on a share of common stock on such date. The short-term dividend equivalents vested at the end of each year only if WEC Energy Group achieved the performance target or targets for that year established by the Compensation Committee in the same manner as the performance targets are established under the STPP for the annual incentive awards.
In 2015, the Compensation Committee determined that short-term dividend equivalents should no longer vest annually on unearned performance units and, therefore, would no longer be issued under the STPP. Therefore, the Compensation Committee amended and restated the WEC Energy Groups Performance Unit Plan effective January 1, 2016, to provide for short-term dividend equivalents. For a more detailed discussion of how Short-Term Dividend Equivalents are earned under the WEC Energy Group Performance Unit Plan, see “Short-Term Dividend Equivalents” in the Compensation Discussion and Analysis.
| |
| (8) | The amounts reported for 2017, 2016, and 2015 reflect the aggregate change in the actuarial present value of each applicable NEO’s accumulated benefit under all defined benefit plans from December 31, 2016 to December 31, 2017, December 31, 2015 to December 31, 2016, and December 31, 2014 to December 31, 2015, respectively. For 2017, 2016, and 2015, the amounts reported also include above-market earnings on compensation that is deferred by the NEOs into the Prime Rate Fund under WEC Energy Group’s Executive Deferred Compensation Plan. Above-market earnings represent the difference between the interest rate used to calculate earnings under the Plan and 120% of the applicable federal long-term rate prescribed by the Internal Revenue Code. The amounts earned for 2017 are shown below. |
|
| | | | | | |
| Name | Change in Pension Value ($) | Non-Qualified Deferred Compensation Earnings ($) | Total ($) |
|
| Allen L. Leverett | 4,204,972 |
| 19,924 |
| 4,224,896 |
|
| J. Kevin Fletcher | 1,184,889 |
| 13,421 |
| 1,198,310 |
|
| Scott J. Lauber | 85,595 |
| 7,748 |
| 93,343 |
|
| Susan H. Martin | 104,074 |
| 4,844 |
| 108,918 |
|
| Robert M. Garvin | 80,450 |
| — |
| 80,450 |
|
| Joan M. Shafer | 60,050 |
| 63 |
| 60,113 |
|
For 2017, 2016, and 2015, the applicable discount rate used to value pension plan liabilities moved from 4.15% to 3.65%, 4.45% to 4.15%, and 4.15% to 4.45%, respectively. As the discount rate decreases, the Company’s pension funding obligation increases, and vice versa. The changes in the actuarial present values of the NEOs’ pension benefits do not constitute cash payments to the NEOs.
The pension values reported represent only WEC Energy Group’s obligation of the aggregate change in the actuarial present value of each NEO’s accumulated benefit under all defined benefit plans. Messrs. Leverett and Fletcher are entitled to receive pension benefits from prior employers. To the extent such prior employers are unable to pay their pension obligations, WEC Energy Group may be obligated to pay the total amount.
| |
| (9) | During 2017, each NEO received financial planning services and the cost of an annual physical exam; Mr. Leverett and Ms. Shafer received reimbursement for club dues; Messrs. Leverett and Lauber were provided with membership in a service that provides healthcare and safety management when traveling outside the United States. |
|
| | |
| Wisconsin Electric Power Company | 28 | 2018 Annual Meeting Information Statement |
| |
| (10) | All Other Compensation for Messrs. Leverett, Fletcher, Lauber, and Garvin, and Mmes. Martin and Shafer, for 2017 also consists of: |
| |
| • | Employer matching of contributions into the WEC Energy Group 401(k) plan in the amount of $10,350 for Messrs. Leverett and Garvin; $10,800 for Mr. Lauber; $7,841 for Mr. Fletcher; $6,112 for Ms. Martin; and $7,791 for Ms. Shafer; |
| |
| • | “Make-whole” payments under the Executive Deferred Compensation Plan that provides a match at the same level as the WEC Energy Group 401(k) plan (4% for up to 7% of wages) for all deferred salary and bonus not otherwise eligible for a match in the amounts of $115,273 for Mr. Leverett, $29,471 for Mr. Fletcher, $27,293 for Mr. Lauber, $39,528 for Ms. Martin, $26,411 for Mr. Garvin, and $23,495 for Ms. Shafer; and |
| |
| • | Tax reimbursements or “gross-ups” for all applicable perquisites in the amounts of $21,452, $11,397, and $14,698 for Messrs. Leverett, Lauber, and Garvin, respectively. |
|
| | |
| Wisconsin Electric Power Company | 29 | 2018 Annual Meeting Information Statement |
GRANTS OF PLAN-BASED AWARDS FOR FISCAL YEAR 2017
The following table shows additional data regarding incentive plan awards to the NEOs in 2017.
|
| | | | | | | | | | | | | | | |
| Name | Grant Date |
Action Date (1) | Estimated Future Payouts Under Non-Equity Incentive Plan Awards (2) | Estimated Future Payouts Under Equity Incentive Plan Awards (3) | All Other Stock Awards: Number of Shares of Stock or Units (4) (#) |
All Other Option Awards (5) |
Grant Date Fair Value of Stock and Option Awards ($) |
Threshold ($) | Target ($) | Maximum ($) | Threshold (#) | Target (#) | Maximum (#) | Number of Securities Underlying Options (#) | Exercise or Base Price (6) ($/Sh) | Closing Market Price ($/Sh) |
| Allen L. Leverett | 1/19/17 | — | 362,813 | 1,451,250 |
| 3,047,625 | — | — | — | — | — | — | — | — |
| 1/19/17 | — | — | 61,329 |
| — | — | — | — | — | — | — | — | — |
| 1/3/17 | 12/1/16 | — | — | — | 14,056 | 56,225 | 98,394 | — | — | — | — | 3,278,199 |
|
| 1/3/17 | 12/1/16 | — | — | — | — | — | — | 12,975 | — | — | — | 756,507 |
|
| 1/3/17 | 12/1/16 | — | — | — | — | — | — | — | 130,640 | 58.305 | 58.49 | 1,033,362 |
|
| J. Kevin Fletcher | 1/19/17 | — | 76,440 | 305,760 |
| 642,096 | — | — | — | — | — | — | — | — |
|
| 1/19/17 | — | — | 10,109 |
| — | — | — | — | — | — | — | — | — |
|
| 1/3/17 | 12/1/16 | — | — | — | 1,866 | 7,465 | 13,064 | — | — | — | — | 435,247 |
|
| 1/3/17 | 12/1/16 | — | — | — | — | — | — | 1,722 | — | — | — | 100,401 |
|
| 1/3/17 | 12/1/16 | — | — | — | — | — | — | — | 17,345 | 58.305 | 58.49 | 137,199 |
|
| Scott J. Lauber | 1/19/17 | — | 93,282 | 373,129 |
| 783,571 | — | — | — | — | — | — | — | — |
|
| 1/19/17 | — | — | 4,191 |
| — | �� | — | — | — | — | — | — | — |
|
| 1/3/17 | 12/1/16 | — | — | — | 1,864 | 7,455 | 13,046 | — | — | — | — | 434,664 |
|
| 1/3/17 | 12/1/16 | — | — | — | — | — | — | 1,719 | — | — | — | 100,226 |
|
| 1/3/17 | 12/1/16 | — | — | — | — | — | — | — | 17,320 | 58.305 | 58.49 | 137,001 |
|
| Susan H. Martin | 1/19/17 | — | 92,829 | 371,315 |
| 779,762 | — | — | — | — | — | — | — | — |
|
| 1/19/17 | — | — | 14,882 |
| — | — | — | — | — | — | — | — | — |
|
| 1/3/17 | 12/1/16 | — | — | — | 2,266 | 9,065 | 15,864 | — | — | — | — | 528,535 |
|
| 1/3/17 | 12/1/16 | — | — | — | — | — | — | 2,091 | — | — | — | 121,916 |
|
| 1/3/17 | 12/1/16 | — | — | | — | — | — | — | 21,065 | 58.305 | 58.49 | 134,816 |
|
| Robert M. Garvin | 1/19/17 | — | 69,648 | 278,593 |
| 585,045 | — | — | — | — | — | — | — | — |
|
| 1/19/17 | — | — | 11,222 |
| — | — | — | — | — | — | — | — | — |
|
| 1/3/17 | 12/1/16 | — | — | — | 1,526 | 6,105 | 10,684 | — | — | — | — | 355,952 |
|
| 1/3/17 | 12/1/16 | — | — | — | — | — | — | 1,407 | — | — | — | 82,035 |
|
| 1/3/17 | 12/1/16 | — | — | — | — | — | — | — | 14,185 | 58.305 | 58.49 | 112,203 |
|
| Joan M. Shafer | 1/19/17 | — | 61,685 | 246,740 |
| 518,154 | — | — | — | — | — | — | — | — |
|
| 1/19/17 | — | — | 3,203 |
| — | — | — | — | — | — | — | — | — |
|
| 1/3/17 | 12/1/16 | — | — | — | 1,351 | 5,405 | 9,459 | — | — | — | — | 315,139 |
|
| 1/3/17 | 12/1/16 | — | — | — | — | — | — | 1,248 | — | — | — | 72,765 |
|
| 1/3/17 | 12/1/16 | — | — | — | — | — | — | — | 12,565 | 58.305 | 58.49 | 80,416 |
|
| |
| (1) | On December 1, 2016, the Compensation Committee awarded the 2017 option, restricted stock, and performance unit grants effective the first trading day of 2017 (January 3, 2017). |
| |
| (2) | Non-equity incentive plan awards consist of annual incentive awards under WEC Energy Group’s STPP (reported on the first line) and short- term dividend equivalents payable under the STPP in connection with the 2015 award of performance units (reported on the second line). The short-term dividend equivalents only vest upon achievement of the established performance target; otherwise, no dividend equivalents vest. For a more detailed description of the STPP, see the Compensation Discussion and Analysis. |
| |
| (3) | Consists of performance units awarded under the WEC Energy Group Performance Unit Plan. Effective with performance units awarded on or after January 1, 2016, WEC Energy Group's Performance Unit Plan provides for short-term dividend equivalents. The number of performance units awarded will be increased as of any date that WEC Energy Group declares a cash dividend on its common stock by the amount of short-term dividend equivalents awarded. In effect, short-term dividend equivalents will be credited and accumulated as reinvested dividends on each performance unit so that the performance units and accumulated dividends will be paid out at the end of the performance units’ three-year performance period, contingent upon WEC Energy Group’s performance. Therefore, the number of performance units reported at each of the threshold, target, and maximum levels in this table will increase by the number of short-term dividend equivalents earned. For a more detailed description of the performance units and short-term dividend equivalents and how such dividend equivalents are calculated, see the Compensation Discussion and Analysis. |
| |
| (4) | Consists of restricted stock awarded under WEC Energy Group’s 1993 Omnibus Stock Incentive Plan. For a more detailed description of the terms of the restricted stock, see the Compensation Discussion and Analysis. |
| |
| (5) | Consists of non-qualified stock options to purchase shares of WEC Energy Group common stock pursuant to WEC Energy Group’s 1993 Omnibus Stock Incentive Plan. For a more detailed description of the terms of the options, see the Compensation Discussion and Analysis. |
| |
| (6) | The exercise price of the option awards is equal to the fair market value of WEC Energy Group’s common stock on the date of grant. Fair market value is the average of the high and low prices of WEC Energy Group common stock, which is listed on the New York Stock Exchange, reported by Bloomberg, LLP on the grant date. |
|
| | |
| Wisconsin Electric Power Company | 30 | 2018 Annual Meeting Information Statement |
OUTSTANDING EQUITY AWARDS AT FISCAL YEAR-END 2017
The following table reflects the number and value of exercisable and unexercisable options as well as the number and value of other equity awards held by the NEOs at fiscal year-end 2017.
|
| | | | | | | | | |
| Name | Option Awards | Stock Awards |
Number of Securities Underlying Unexercised Options: Exercisable (#) | Number of Securities Underlying Unexercised Options: Unexercisable (1) (#) | Equity Incentive Plan Awards: Number of Securities Underlying Unexercised Unearned Options (#) | Option Exercise Price ($) | Option Expiration Date | Number of Shares or Units of Stock that Have Not Vested (2) (#) | Market Value of Shares or Units of Stock that Have Not Vested ($) | Equity Incentive Plan Awards: Number of Unearned Shares, Units or Other Rights that Have Not Vested (#) | Equity Incentive Plan Awards: Market or Payout Value of Unearned Shares, Units or Other Rights that Have Not Vested (3) ($) |
| Allen L. Leverett | 112,250 | — | — | 34.875 | 1/3/22 | — | — | — | — |
| 197,360 | — | — | 37.46 | 1/2/23 | — | — | — | — |
| 134,055 | — | — | 41.025 | 1/2/24 | — | — | — | — |
| — | 77,955 | — | 52.895 | 1/2/25 | — | — | — | — |
| — | 82,455 | — | 50.925 | 1/4/26 | — | — | — | — |
| — | 42,679 | — | 58.325 | 5/2/26 | — | — | — | — |
| — | 130,640 | — | 58.305 | 1/3/27 | 27,866 | 1,851,138 | — | — |
| — | — | — | — | — | — | — | 83,720 | 5,561,520 |
| — | — | — | — | — | — | — | 103,556 | 6,879,225 |
| J. Kevin Fletcher | 18,260 | — | — | 34.875 | 1/3/22 | — | — | — | — |
| 33,670 | — | — | 37.46 | 1/2/23 | — | — | — | — |
| 20,525 | — | — | 41.025 | 1/2/24 | — | — | — | — |
| — | 12,845 | — | 52.895 | 1/2/25 | — | — | — | — |
| — | 14,260 | — | 50.925 | 1/4/26 | — | — | — | — |
| — | 17,345 | — | 58.305 | 1/3/27 | 3,993 | 265,255 | — | — |
| — | — | — | — | — | — | — | 10,052 | 667,754 |
| — | — | — | — | — | — | — | 13,749 | 913,346 |
| Scott J. Lauber | 3,650 | — | — | 34.875 | 1/3/22 | — | — | — | — |
| 6,360 | — | — | 37.46 | 1/2/23 | — | — | — | — |
| 9,560 | — | — | 41.025 | 1/2/24 | — | — | — | — |
| — | 5,330 | — | 52.895 | 1/2/25 | — | — | — | — |
| — | 6,720 | — | 50.925 | 1/4/26 | — | — | — | — |
| — | 17,320 | — | 58.305 | 1/3/27 | 3,515 | 233,501 | — | — |
| — | — | — | — | — | — | — | 4,741 | 314,945 |
| — | — | — | — | — | — | — | 13,678 | 908,630 |
| Susan H. Martin | — | 18,920 | — | 52.895 | 1/2/25 | — | — | — | — |
| — | 24,850 | — | 50.925 | 1/4/26 | — | — | — | — |
| — | 21,065 | — | 58.305 | 1/3/27 | 6,511 | 432,526 | — | — |
| — | — | — | — | — | — | — | 17,523 | 1,164,053 |
| — | — | — | — | — | — | — | 16,695 | 1,109,049 |
| Robert M. Garvin | 33,910 | — | — | 37.46 | 1/2/23 | — | — | — | — |
| 24,665 | — | — | 41.025 | 1/2/24 | — | — | — | — |
| — | 14,270 | — | 52.895 | 1/2/25 | — | — | — | — |
| — | 17,210 | — | 50.925 | 1/4/26 | — | — | — | — |
| — | 14,185 | — | 58.305 | 1/3/27 | 5,250 | 348,758 | — | — |
| — | — | — | — | — | — | — | 12,136 | 806,194 |
| — | — | — | — | — | — | — | 11,244 | 746,939 |
| Joan M. Shafer | 3,230 | — | — | 24.92 | 1/4/20 | — | — | — | — |
| 2,630 | — | — | 29.3475 | 1/3/21 | — | — | — | — |
| 5,935 | — | — | 34.875 | 1/3/22 | — | — | — | — |
| 10,975 | — | — | 37.46 | 1/2/23 | — | — | — | — |
| 6,405 | — | — | 41.025 | 1/2/24 | — | — | — | — |
| — | 4,070 | — | 52.895 | 1/2/25 | — | — | — | — |
| — | 13,840 | — | 50.925 | 1/4/26 | — | — | — | — |
| — | 12,565 | — | 58.305 | 1/3/27 | 3,240 | 215,233 | — | — |
| — | — | — | — | — | — | — | 9,753 | 647,892 |
| — | — | — | — | — | — | — | 9,954 | 661,244 |
|
| | |
| Wisconsin Electric Power Company | 31 | 2018 Annual Meeting Information Statement |
| |
| (1) | All options reported in this column were granted ten years prior to their respective expiration date and vest 100% on the third anniversary of the grant date. |
| |
| (2) | Effective January 2, 2015, Messrs. Leverett, Fletcher, Lauber, and Garvin, and Mmes. Martin and Shafer, were granted restricted stock awards of 6,804, 1,119, 465, 1,245, 1,650, and 354 shares, respectively, which began vesting in three equal annual installments on January 2, 2016. On July 31, 2015, Messrs. Leverett, Fletcher, Lauber, and Garvin, and Mmes. Martin and Shafer, were granted restricted stock awards of 17,145, 3,215, 3,751, 7,287, 7,287, and 3,215 shares, respectively, for the key role each played in closing WEC Energy Group’s acquisition of Integrys Energy Group. These shares vest in three equal installments on January 29, 2016, January 31, 2017, and July 31, 2018. Effective January 4, 2016, Messrs. Leverett, Fletcher, Lauber, and Garvin, and Mmes. Martin and Shafer, were granted restricted stock awards of 7,173, 1,239, 585, 1,497, 2,160, and 1,203 shares, respectively, which began vesting in three equal annual installments on January 4, 2017. Effective May 2, 2016, Mr. Leverett was granted a restricted stock award of 3,186 shares, which began vesting in three equal annual installments on May 2, 2017. Effective January 3, 2017, Messrs. Leverett, Fletcher, Lauber, and Garvin, and Mmes. Martin and Shafer, were granted restricted stock awards of 12,975, 1,722, 1,719, 1,407, 2,091, and 1,248 shares, respectively, which began vesting in three equal annual installments on January 3, 2018. The vesting of the restricted stock may be accelerated in connection with a termination of employment due to a change in control, death or disability, or by action of the Compensation Committee. |
| |
| (3) | The number of performance units reported were awarded in 2016 (first line) and 2017 (second line) and vest at the end of the three-year performance period ending December 31, 2018 and December 31, 2019, respectively. The number of performance units reported and their corresponding value are based upon a payout at the maximum amount for both 2016 and 2017. The number and value of the 2016 performance units includes performance units resulting from the grant of short-term dividend equivalents in 2016 and 2017. The number and value of the 2017 performance units includes performance units resulting from the grant of short-term dividend equivalents and achievement of the Additional Performance Measure in 2017. |
OPTION EXERCISES AND STOCK VESTED FOR FISCAL YEAR 2017
This table shows the number and value of (1) stock options that were exercised by the NEOs, (2) restricted stock awards that vested, and (3) performance units that vested in 2017.
|
| | | | |
| Name | Option Awards | Stock Awards |
Number of Shares Acquired on Exercise (#) | Value Realized on Exercise (1) ($) | Number of Shares Acquired on Vesting (2) (#) | Value Realized on Vesting (3)(4) ($) |
| Allen L. Leverett | 29,715 | 860,951 | 14,115 | 830,790 |
| — | — | 31,136 | 2,068,375 |
| J. Kevin Fletcher | — | — | 2,268 | 133,124 |
| — | — | 5,132 | 340,929 |
| Scott J. Lauber | 9,390 | 379,139 | 1,791 | 105,056 |
| — | — | 2,128 | 141,352 |
| Susan H. Martin | 48,175 | 1,257,291 | 4,353 | 255,443 |
| — | — | 7,556 | 501,924 |
| Robert M. Garvin | — | — | 3,836 | 225,053 |
| — | — | 5,697 | 378,460 |
| Joan M. Shafer | — | — | 1,719 | 100,859 |
| — | — | 1,626 | 108,031 |
| |
| (1) | Value realized upon the exercise of options is determined by multiplying the number of shares received upon exercise by the difference between the market price of WEC Energy Group common stock at the time of exercise and the exercise price. |
| |
| (2) | Reflects the number of shares of restricted stock that vested in 2017 (first line) and, the number of performance units that vested as of December 31, 2017, the end of the applicable three-year performance period (second line). The performance units were settled in cash. |
| |
| (3) | Restricted stock value realized is determined by multiplying the number of shares of restricted stock that vested by the fair market value of WEC Energy Group common stock on the date of vesting. We compute fair market value as the average of the high and low prices of WEC Energy Group common stock reported by Bloomberg, LLP on the vesting date. |
| |
| (4) | Performance units value realized is determined by multiplying the number of performance units that vested by the closing market price of WEC Energy Group common stock on December 29, 2017, the last trading day of the year. |
|
| | |
| Wisconsin Electric Power Company | 32 | 2018 Annual Meeting Information Statement |
PENSION BENEFITS AT FISCAL YEAR-END 2017
The following table sets forth information for each NEO regarding their pension benefits at fiscal year-end 2017 under WEC Energy Group’s three different retirement plans discussed below.
|
| | | | |
| Name | Plan Name | Number of Years Credited Service (1) (#) | Present Value of Accumulated Benefit (2)(3) ($) | Payments During Last Fiscal Year ($) |
| Allen L. Leverett | WEC Energy Group Plan | 14.5 | 325,820 | — |
| SERP | 14.5 | 2,106,717 | — |
| Individual Letter Agreement | 29 | 12,231,485 | — |
| J. Kevin Fletcher | WEC Energy Group Plan | 6.17 | 121,168 | — |
| SERP | 6.17 | 232,155 | — |
| Individual Letter Agreement | 40.75 | 4,727,616 | — |
| Scott J. Lauber | WEC Energy Group Plan | 27.5 | 548,682 | — |
| SERP | 27.5 | 178,153 | — |
| Individual Letter Agreement | — | — | — |
| Susan H. Martin | WEC Energy Group Plan | 17.75 | 295,686 | — |
| SERP | 17.75 | 414,467 | — |
| Individual Letter Agreement | — | — | — |
| Robert M. Garvin | WEC Energy Group Plan | 6.67 | 134,629 | — |
| SERP | 6.67 | 252,192 | — |
| Individual Letter Agreement | 6.67 | 73,680 | — |
| Joan M. Shafer | WEC Energy Group Plan | 39.08 | 1,807,140 | — |
| SERP | 39.08 | 599,883 | — |
| Individual Letter Agreement | — | — | — |
| |
| (1) | Years of service are computed as of December 31, 2017, the pension plan measurement date used for financial statement reporting purposes. Messrs. Leverett and Fletcher have been credited with 14.5 and 34.58 years of service, respectively, pursuant to the terms of their Individual Letter Agreements ("ILAs"). The increase in the aggregate amount of each of Messrs. Leverett's and Fletcher's accumulated benefit under all of WEC Energy Group’s retirement plans resulting from the additional years of credited service is $8,974,190 and $4,009,791, respectively. |
| |
| (2) | The key assumptions used in calculating the actuarial present values reflected in this column are: |
| |
| • | First projected unreduced retirement age based on current service: |
| |
| ◦ | For Mr. Leverett, age 60. |
| |
| ◦ | For Mr. Fletcher, age 65. |
| |
| ◦ | For Ms. Martin, age 65.67. |
| |
| ◦ | For Mr. Garvin, age 54.75. |
| |
| ◦ | For Ms. Shafer, age 64.33. |
| |
| • | Cash balance interest crediting rate of 5.00%. |
| |
| ◦ | Messrs. Leverett and Fletcher: WEC Energy Group Plan and SERP - Lump sum; ILA - Life annuity. |
| |
| ◦ | Mr. Lauber: WEC Energy Group Plan and SERP - Life annuity. |
| |
| ◦ | Mr. Garvin and Ms. Martin: WEC Energy Group Plan and SERP - Lump sum. |
| |
| ◦ | Mr. Garvin: ILA - Lump sum. |
| |
| ◦ | Ms. Shafer: WEC Energy Group Plan and SERP - Five annual installments. |
| |
| • | Mortality Table, for Messrs. Leverett’s, Fletcher's, and Lauber's life annuity – RP2014/Male/White Collar with modified MP2014 projection. |
| |
| • | Mortality Table, for Ms. Shafer's installments - RP2014/Female/White Collar with modified MP2014 projection. |
| |
| (3) | WEC Energy Group’s pension benefit obligations to Messrs. Leverett and Fletcher will be partially offset by pension benefits Messrs. Leverett and Fletcher are entitled to receive from their former employers. The amounts reported for Messrs. Leverett and Fletcher represent only WEC Energy Group’s obligation of the aggregate actuarial present value of each of their accumulated benefit under all of the plans. The total aggregate actuarial present value of each of Messrs. Leverett's and Fletcher's accumulated benefit under all of the plans is $15,361,203 and $7,484,805, respectively, $697,181 and $2,403,866 of which we estimate the prior employer is obligated to pay. If Messrs. Leverett or Fletcher's former employer becomes unable to pay its portion of his respective accumulated pension benefit, WEC Energy Group may be obligated to pay the total amount. |
|
| | |
| Wisconsin Electric Power Company | 33 | 2018 Annual Meeting Information Statement |
RETIREMENT PLANS
WEC Energy Group maintains three different plans providing for retirement payments and benefits for the NEOs: a defined benefit pension plan of the cash balance type (“WEC Energy Group Plan”); a supplemental executive retirement plan (“SERP”); and ILAs. The compensation currently considered for purposes of the retirement plans (other than the WEC Energy Group Plan and SERP) for Messrs. Leverett and Fletcher is $2,610,356 and $924,226, respectively. These amounts represent the average compensation (consisting of base salary and annual incentive compensation) for the 36 highest consecutive months. For Messrs. Lauber and Garvin, and Mmes. Martin and Shafer, the compensation considered for purposes of the retirement plans (other than the WEC Energy Group Plan) is $952,339, $930,275, $1,258,194, and $857,371, respectively. These amounts represent their 2017 base salary, plus their 2016 STPP award paid in 2017. As of December 31, 2017, Messrs. Leverett, Fletcher, Lauber, and Garvin, and Mmes. Martin and Shafer, currently have or are considered to have 29, 40.75, 27.50, 6.67, 17.75, and 39.08 credited years of service, respectively, under the various plans described below. Messrs. Lauber and Garvin, and Mmes. Martin and Shafer, were not granted additional years of credited service.
The WEC Energy Group Plan
Most regular full-time and part-time employees, including the NEOs, participate in the WEC Energy Group Plan. The WEC Energy Group Plan bases a participant’s defined benefit pension on the value of a hypothetical account balance. For individuals participating in the WEC Energy Group Plan as of December 31, 1995, a starting account balance was created equal to the present value of the benefit accrued as of December 31, 1994, under the plan benefit formula prior to the change to a cash balance approach. That formula provided a retirement income based on years of credited service and average compensation (consisting of base salary and annual incentive compensation) for the 36 highest consecutive months, with an adjustment to reflect the Social Security integrated benefit. In addition, individuals participating in the WEC Energy Group Plan as of December 31, 1995, received a special one-time transition credit amount equal to a specified percentage varying with age multiplied by credited service and 1994 base pay.
The present value of the accrued benefit as of December 31, 1994, plus the transition credit, was also credited with interest at a stated rate. For 1996 through 2007, a participant received annual credits to the account equal to 5% of base pay (including WEC Energy Group 401(k) plan pre-tax deferrals and other items), plus an interest credit on all prior accruals equal to 4% plus 75% of the annual time-weighted trust investment return for the year in excess of 4%. From 2008 through 2013, the interest credit percentage was set at either the long-term corporate bond third segment rate, published by the Internal Revenue Service, or 4%, whichever was greater.
Effective January 1, 2014, participants receive an annual credit to the account equal to 6% of base pay (including WEC Energy Group 401(k) plan pre-tax deferrals and other items), plus an interest credit on all prior accruals equal to a 5% fixed rate. For participants in the WEC Energy Group Plan on December 31, 2007 and December 31, 2013, their WEC Energy Group Plan benefit will never be less than the benefit accrued as of December 31, 2007 and December 31, 2013, respectively. The WEC Energy Group Plan benefit will be calculated under all three formulas to provide participants with the greater benefit; however, in calculating a participant’s benefit accrued as of December 31, 2007 and December 31, 2013, interest credits as defined under each of the prior WEC Energy Group Plan formulas will be taken into account but not any additional pay credits.
Participants who were “grandfathered” as of December 31, 1995, as discussed below, will still receive the greater of the grandfathered benefit or the cash balance benefit.
The life annuity payable under the WEC Energy Group Plan is determined by converting the hypothetical account balance credits into annuity form.
Individuals who were participants in the WEC Energy Group Plan on December 31, 1995 were “grandfathered” so that they will not receive any lower retirement benefit than would have been provided under the formula in effect through December 31, 1995, had it continued. This amount continued to increase until December 31, 2010, at which time it was frozen. Upon retirement, participants will receive the greater of this frozen amount or the accumulated cash balance.
For Messrs. Leverett and Lauber, and Ms. Shafer, estimated benefits under the grandfathered formula are higher than under the cash balance plan formula. Messrs. Fletcher and Garvin, and Ms. Martin, do not participate in the grandfathered formula. Although all of the NEOs participate in the cash balance plan formula, pursuant to the agreement discussed below, Mr. Leverett’s total retirement benefits would be determined by the prior plan benefit formula if he were to retire at or after age 60. Mr. Leverett's agreement also provides that the prior plan benefit formula will continue to be applied until retirement, with no amounts frozen as of December 31, 2010. Mr. Leverett would receive the cash balance in his account if he was to terminate employment prior to attaining the age of 60.
Under the WEC Energy Group Plan, participants receive unreduced pension benefits upon reaching one of the following three thresholds: (1) age 65; (2) age 62 with 30 years of service; or (3) age 60 with 35 years of service.
|
| | |
| Wisconsin Electric Power Company | 34 | 2018 Annual Meeting Information Statement |
Pursuant to the Internal Revenue Code, only $270,000 of pension eligible earnings (base pay and annual incentive compensation) may be considered for purposes of the WEC Energy Group Plan.
Supplemental Executive Retirement Plans and Individual Letter Agreements
Designated officers of WEC Energy Group and the Company, including all of the NEOs, participate in the SERP, which is part of the Supplemental Pension Plan (the “SPP”) adopted to comply with Section 409A of the Internal Revenue Code. The SERP provides monthly supplemental pension benefits to participants, which will be paid out of unsecured corporate assets, or the grantor trust described below, in an amount equal to the difference between the actual pension benefit payable under the WEC Energy Group Plan and what such pension benefit would be if calculated without regard to any limitation imposed by the Internal Revenue Code on pension benefits or covered compensation, including amounts deferred to the WEC Energy Group Executive Deferred Compensation Plan. Except for a “change in control” of WEC Energy Group, as defined in the SPP, and pursuant to the terms of the ILAs discussed below, no payments are made until after the participant’s retirement at or after age 60 or death. If a participant in the SERP dies prior to age 60, his or her beneficiary is entitled to receive retirement benefits under the SERP.
WEC Energy Group entered into an agreement with Mr. Leverett to provide him with supplemental retirement benefits upon retirement at or after age 60. The supplemental retirement payments are intended to make the total retirement benefits payable to Mr. Leverett comparable to that which would have been received under the WEC Energy Group Plan as in effect on December 31, 1995, had the defined benefit formula then in effect continued until his retirement, calculated without regard to Internal Revenue Code limits, and as if Mr. Leverett had started participation in the WEC Energy Group Plan on January 1, 1989. The retirement benefits payable to Mr. Leverett will be offset by the value of any qualified or non-qualified defined benefit pension plans of prior employers.
Mr. Leverett's agreement also provides for a pre-retirement spousal benefit to be paid to his spouse in the event of his death while employed by WEC Energy Group or its subsidiaries, including the Company. The benefit payable is equal to the amount which would have been received by Mr. Leverett’s spouse under the WEC Energy Group Plan as in effect on December 31, 1995, had the benefit formula then in effect continued until Mr. Leverett’s death, calculated without regard to Internal Revenue Code limits, and as if Mr. Leverett had started at the age indicated above. The spousal benefit payable would be offset by one-half of the value of any qualified or non-qualified deferred benefit pension plans of Mr. Leverett's prior employer.
WEC Energy Group entered into an agreement with Mr. Fletcher to provide him with supplemental retirement benefits upon his retirement, provided he completed one year of service. The supplemental retirement payments are intended to make the total retirement benefits payable to Mr. Fletcher comparable to that which would have been received under his prior employer’s defined benefit pension plan, calculated without regard to Internal Revenue Code limits, and as if Mr. Fletcher’s employment continued with the prior employer and the defined benefit formula then in effect under the prior employer’s plan continued to his retirement. The retirement benefits payable as a result of this agreement will be offset by the value of any qualified and non-qualified defined benefit pension plan of the prior employer.
WEC Energy Group entered into an agreement with Mr. Garvin when he was hired in April 2011 that provides for a supplemental pension benefit account, which was credited with $50,000. This account is credited with interest annually at the same rate as the WEC Energy Group Plan. The account balance will vest at the earliest to occur of Mr. Garvin attaining age 60 or completion of 10 years of service.
The purpose of these agreements was to ensure that Messrs. Leverett, Fletcher, and Garvin did not lose pension earnings by joining the executive management team at WEC Energy Group they otherwise would have received from their former employers. Without providing a means to retain these pension benefits, it would have been difficult for WEC Energy Group to attract these officers.
The SPP provides for a mandatory lump sum payment upon a change in control if the executive’s employment is terminated within 18 months after the change in control. The Wisconsin Energy Corporation 2014 Rabbi Trust, a grantor trust, funds certain non-qualified benefits, including the SPP and the ILAs, as well as the Executive Deferred Compensation Plan. See “Potential Payments upon Termination or Change in Control” later in this information statement for additional information.
|
| | |
| Wisconsin Electric Power Company | 35 | 2018 Annual Meeting Information Statement |
WEC Energy Group Retirement Savings Plan
Effective January 1, 2015, all newly hired management employees, including executive officers, will receive an annual contribution equal to 6% of pension eligible wages from the Company into WEC Energy Group’s 401(k) plan rather than participate in the WEC Energy Group Plan. Pension eligible wages consist of annual base salary and STPP payouts. In connection with this plan, the Compensation Committee adopted the WEC Energy Group Non-Qualified Retirement Savings Plan which provides “make-whole” benefits to address Internal Revenue Code limits on the amount of money that can be contributed to a 401(k) plan. The NEOs do not participate in these plans as they are grandfathered under the WEC Energy Group Plan.
NONQUALIFIED DEFERRED COMPENSATION FOR FISCAL YEAR 2017
The following table reflects activity by the NEOs during 2017 in WEC Energy Group’s Executive Deferred Compensation Plan discussed below.
|
| | | | | | | | | | |
| Name | Executive Contributions in Last Fiscal Year (1) | Registrant Contributions in Last Fiscal Year (1) | Aggregate Earnings In Last Fiscal Year | Aggregate Withdrawals / Distributions | Aggregate Balance at Last Fiscal Year-End (2) |
| ($) | ($) | ($) | ($) | ($) |
| Allen L. Leverett | 363,270 |
| 115,272 |
| 607,067 |
| — |
| 5,655,363 |
|
| J. Kevin Fletcher | 335,349 |
| 29,471 |
| 79,688 |
| — |
| 2,112,425 |
|
| Scott J. Lauber | 94,498 |
| 27,293 |
| 82,980 |
| — |
| 1,402,853 |
|
| Susan H. Martin | 514,088 |
| 39,528 |
| 331,605 |
| — |
| 2,869,597 |
|
| Robert M. Garvin | 65,119 |
| 26,411 |
| 69,932 |
| — |
| 581,853 |
|
| Joan M. Shafer | 60,016 |
| 23,495 |
| 67,267 |
| — |
| 566,220 |
|
| |
| (1) | All of the amounts are reported as compensation in the “Summary Compensation Table” of this information statement. |
| |
| (2) | $3,078,418, $328,425, $105,478, $380,074, and $1,067,251 of the reported amounts were reported as compensation in the Summary Compensation Tables in prior information statements for Messrs. Leverett, Fletcher, Lauber, and Garvin, and Ms. Martin, respectively. Ms. Shafer became a named executive officer in 2017. |
Executive Deferred Compensation Plan
WEC Energy Group maintains two executive deferred compensation plans in which the NEOs participate: the Legacy WEC Energy Group Executive Deferred Compensation Plan (the “Legacy EDCP”), and the WEC Energy Group Executive Deferred Compensation Plan (the “EDCP”) adopted effective January 1, 2005 to comply with Section 409A of the Internal Revenue Code. The Legacy EDCP provides that (1) amounts earned, deferred, vested, credited, and/or accrued as of December 31, 2004 are preserved and frozen so that these amounts are exempt from Section 409A and (2) no new employees may participate in the Legacy EDCP as of January 1, 2005. Since January 1, 2005, all deferrals have been made to the EDCP. The provisions of the EDCP as in effect on December 31, 2017 are described below, as are the payout provisions of the Legacy EDCP.
The EDCP. Under the plan, a participant may defer up to 50% of his or her base salary, annual incentive compensation and vested awards of performance units. Stock option gains, vested restricted stock, and short-term dividend equivalents may not be deferred into the EDCP. Generally, deferral elections are made annually by each participant for the upcoming plan year. WEC Energy Group maintains detailed records tracking each participant’s “account balance.” In addition to deferrals made by the participants, WEC Energy Group may also credit each participant’s account balance by matching a certain portion of each participant’s deferral. Such deferral matching is determined by a formula taking into account the matching rate applicable under WEC Energy Group’s 401(k) plan, the percentage of compensation subject to such matching rate, the participant’s gross compensation eligible for matching, and the amount of eligible compensation actually deferred. Also, in our discretion, WEC Energy Group may credit any other amounts, as appropriate, to each participant’s account.
Participants may elect to participate in WEC Energy Group’s stock measurement fund and/or the Prime Rate Fund. WEC Energy Group tracks each participant’s account balance as though the balance was actually invested in these funds. Fund elections are not actual investments, but are elections chosen only for purposes of calculating market gain or loss on deferred amounts for the duration of the deferral period. Each participant may select the amount of deferred compensation to be allocated among the two measurement funds. Contributions and deductions may be made to each participant’s account based on the performance of the measurement fund(s) elected.
|
| | |
| Wisconsin Electric Power Company | 36 | 2018 Annual Meeting Information Statement |
The annual rate of return for the calendar year ended December 31, 2017 for the WEC Energy Group Common Stock Fund and the Prime Rate Fund was 13.3% and 4.19%, respectively.
Each participant’s account balance is debited or credited periodically based on the performance of the measurement fund(s) elected by the participant. Subject to certain restrictions, participants may make changes to their measurement fund elections by notice to the committee administering the plan.
At the time of his or her deferral election, each participant may designate a prospective payout election for any or the entire amount deferred, plus any amounts debited or credited to the deferred amount as of the designated payout. Amounts deferred into the EDCP may not be withdrawn at the discretion of the participant and a change to the designated payout delays the initial payment five years beyond the originally designated payout date. In addition, WEC Energy Group may not limit payout amounts in order to deduct such amounts under Section 162(m) of the Internal Revenue Code.
The balance of a participant’s account is payable on his or her retirement in either a lump sum payout or in annual installments, at the election of the participant. Upon the death of a participant after retirement, payouts are made to the deceased participant’s beneficiary in the same manner as though such payout would have been made to the participant had the participant survived. In the event of a participant’s termination of employment prior to retirement, the participant may elect to receive a payout beginning the year after termination in the amount of his or her account balance as of the termination date either in a lump sum or in annual installments over a period of five years. Disability is not itself a payment event until the participant terminates employment with WEC Energy Group or its subsidiaries, including the Company. A participant’s account balance will be paid out in a lump sum if the participant separates from service with WEC Energy Group or its subsidiaries within 18 months after a change in control of WEC Energy Group, as defined in the plan. The deferred amounts will be paid out of the general corporate assets or the assets of the Wisconsin Energy Corporation 2014 Rabbi Trust.
The Legacy EDCP. At the time of his or her deferral election, each participant designated a prospective payout election for any or the entire amount deferred, plus any amounts debited or credited to the deferred amount as of the designated payout. A participant may elect, at any time, to withdraw part (a minimum of $25,000) or all of his or her account balance, subject to a withdrawal penalty of 10%. Payout amounts may be limited to the extent to which they are deductible by WEC Energy Group under Section 162(m) of the Internal Revenue Code.
The balance of a participant’s account is payable on his or her retirement in either a lump sum payout or in annual installments, at the election of the participant. Upon the death of a participant after retirement, payouts are made to the deceased participant’s beneficiary in the same manner as though such payout would have been made to the participant had the participant survived. In the event of a participant’s termination of employment prior to retirement, the participant may elect to receive a payout beginning the year after termination in the amount of his or her account balance as of the termination date either in a lump sum or in annual installments over a period of five years. Any participant who suffers from a continued disability will be entitled to the benefits of plan participation unless and until the committee administering the plan determines that the participant has been terminated for purposes of continued participation in the plan. Upon any such determination, the disabled participant is paid out as though the participant had retired. Except in certain limited circumstances, participants’ account balances will be paid out in a lump sum (1) upon the occurrence of a change in control, as defined in the plan, or (2) upon any downgrade of WEC Energy Group’s senior debt obligations to less than “investment grade.” The deferred amounts will be paid out of the general corporate assets or the assets of the Wisconsin Energy Corporation 2014 Rabbi Trust.
POTENTIAL PAYMENTS UPON TERMINATION OR CHANGE IN CONTROL
The tables below reflect the amount of compensation payable to each of our NEOs in the event of termination of each executive’s employment. These amounts are in addition to each NEO’s aggregate balance in the EDCP at fiscal year-end 2017, as reported in the "Aggregate Balance at Last Fiscal Year-End" column under “Nonqualified Deferred Compensation for Fiscal Year 2017.” The amount of compensation payable to each NEO upon voluntary termination, normal retirement, for-cause termination, involuntary termination (by WEC Energy Group or the Company for any reason other than cause, death or disability or by the executive for “good reason”), termination following a “change in control,” disability, and death are set forth below. The amounts shown assume that such termination was effective as of December 31, 2017 and include amounts earned through that date, and are estimates of the amounts which would be paid out to the NEOs upon termination. The amounts shown under “Normal Retirement” assume the NEOs were retirement eligible with no reduction of retirement benefits. The amounts shown under “Termination Upon a Change in Control” assume the NEOs terminated employment as of December 31, 2017, which was within 18 months of a change in control of WEC Energy Group. The amounts reported in the row titled “Retirement Plans” in each table below are not in addition to the amounts reflected under “Pension Benefits at Fiscal Year-End 2017.” The actual amounts to be paid out can only be determined at the time of an officer’s termination of employment.
|
| | |
| Wisconsin Electric Power Company | 37 | 2018 Annual Meeting Information Statement |
Payments Made Upon Voluntary Termination or Termination for Cause, Death or Disability
In the event a NEO voluntarily terminates employment or is terminated for cause, death, or disability, the officer will receive:
| |
| • | accrued but unpaid base salary and, for termination by death or disability, prorated annual incentive compensation; |
| |
| • | WEC Energy Group 401(k) plan and EDCP account balances; |
| |
| • | the WEC Energy Group Plan cash balance; |
| |
| • | in the case of death or disability, full vesting in all outstanding stock options, restricted stock, and performance units (otherwise, the ability to exercise already vested options within three months of termination) as well as vesting in the SERP and ILAs; and |
| |
| • | if voluntary termination occurs after age 60, such termination is treated as a normal retirement. |
NEOs are also entitled to the value of unused vacation days, if any, and for termination by death, benefits payable under the officer life insurance benefit if the NEO participates in such benefit.
Payments Made Upon Normal Retirement
In the event of the retirement of a NEO, the officer will receive:
•accrued but unpaid base salary and prorated annual incentive compensation;
•full vesting in all outstanding stock options and a prorated amount of performance units;
•full vesting in all retirement plans, including the WEC Energy Group Plan, SERP, and ILAs; and
•WEC Energy Group 401(k) plan and EDCP account balances.
NEOs are also entitled to the value of unused vacation days, if any.
Payments Made Under Employment Agreements Upon a Change in Control of WEC Energy Group, Involuntary Termination, or Termination for Good Reason
WEC Energy Group has entered into a written employment agreement with Mr. Leverett, which provides for certain severance benefits as described below. The Compensation Committee did not amend or otherwise modify Mr. Leverett's employment agreement, dated as of December 28, 2008, in any way in connection with his service as CEO.
Under the agreement with Mr. Leverett, severance benefits are provided if his employment is terminated:
| |
| • | in anticipation of or following a change in control by WEC Energy Group for any reason, other than cause, death, or disability; |
| |
| • | by Mr. Leverett for good reason in anticipation of or following a change in control; |
| |
| • | by Mr. Leverett within six months after completing one year of service following a change in control; or |
| |
| • | in the absence of a change in control, by WEC Energy Group for any reason other than cause, death, or disability or by Mr. Leverett for good reason. |
Upon termination of his employment in connection with a change in control of WEC Energy Group, Mr. Leverett’s agreement provides for:
| |
| • | a lump sum severance payment equal to three times the sum of Mr. Leverett's highest annual base salary in effect for the three years preceding his termination and highest bonus amount; |
| |
| • | three years continuation of health and certain other welfare benefit coverage and eligibility for retiree health coverage thereafter; |
| |
| • | a payment equal to the value of three additional years of participation in the applicable qualified and non-qualified retirement plans based upon the higher of (1) the annual base salary in effect at the time of termination, and (2) any salary in effect during the 180 day period preceding termination, plus the highest bonus amount; |
| |
| • | a payment equal to the value of three additional years of WEC Energy Group match in the 401(k) plan and EDCP; |
| |
| • | full vesting in all outstanding stock options, restricted stock, and other equity awards; |
| |
| • | WEC Energy Group 401(k) and EDCP account balances; |
| |
| • | certain financial planning services and other benefits; and |
| |
| • | a "gross up" payment should any payments under the agreement trigger federal excise taxes under the "parachute payment" provisions of the tax law. |
If Mr. Leverett's employment is terminated by WEC Energy Group for any reason other than cause, death, or disability, or by him for good reason in the absence of a change in control of WEC Energy Group, payments and other benefits tied to a three year multiple will instead be tied to a two year multiple. In addition, Mr. Leverett would not be entitled to receive any gross-up.
|
| | |
| Wisconsin Electric Power Company | 38 | 2018 Annual Meeting Information Statement |
The highest bonus amount would be calculated as the larger of (1) the current target bonus for the fiscal year in which employment termination occurs, or (2) the highest bonus paid in any of the last three fiscal years prior to termination or the change in control of WEC Energy Group. The agreement contains a one-year non-compete provision applicable on termination of employment.
Pursuant to the terms of the agreement with Mr. Fletcher, severance benefits are provided if his employment is terminated (1) by WEC Energy Group for any reason other than cause, death, or disability, or (2) by Mr. Fletcher for good reason. Upon termination, Mr. Fletcher's agreement provides for (1) a lump sum payment equal to 2.99 times his annual base salary for the fiscal year in which termination occurs, and (2) health, life and other welfare benefits (excluding disability benefits) for a period of three years following termination.
Pursuant to the terms of the SPP and ILAs, retirement benefits are paid to the NEOs upon termination of employment within 18 months of a change in control. Participants in the SPP, including the NEOs, are also eligible to receive a supplemental disability benefit in an amount equal to the difference between the actual amount of the benefit payable under the long-term disability plan applicable to all employees and what such disability benefit would have been if calculated without regard to any limitation imposed by the broad-based plan on annual compensation recognized thereunder.
Generally, pursuant to Mr. Leverett’s agreement, a change in control of WEC Energy Group is deemed to occur:
| |
| (1) | if any person or group acquires WEC Energy Group common stock that constitutes more than 50% of the total fair market value or total voting power of WEC Energy Group; |
| |
| (2) | if any person or group acquires (or has acquired during the 12-month period ending on the date of the most recent acquisition by such person or group) WEC Energy Group common stock that constitutes 30% or more of the total voting power of WEC Energy Group; |
| |
| (3) | if a majority of the members of WEC Energy Group’s Board is replaced during any 12-month period by directors whose appointment or election is not endorsed by a majority of WEC Energy Group’s Board before the date of appointment or election; or |
| |
| (4) | if any person or group acquires (or has acquired during the 12-month period ending on the date of the most recent acquisition by such person or group) assets from WEC Energy Group that have a total gross fair market value equal to or more than 40% of the total gross value of all the assets of WEC Energy Group immediately before such acquisition or acquisitions, unless the assets are transferred to: |
| |
| • | an entity that is controlled by the stockholders of the transferring corporation; |
| |
| • | a stockholder of WEC Energy Group in exchange for or with respect to its stock; |
| |
| • | an entity of which WEC Energy Group owns, directly or indirectly, 50% or more of its total value or voting power; or |
| |
| • | a person or group (or an entity of which such person or group owns, directly or indirectly, 50% or more of WEC Energy Group total value or voting power) that owns, directly or indirectly, 50% or more of the total value or voting power of WEC Energy Group. |
Generally, pursuant to Mr. Leverett’s and Mr. Fletcher's ILAs, good reason means:
| |
| (1) | a material reduction in the executive’s base compensation; |
| |
| (2) | a material change in the geographic location at which the executive must perform services; |
| |
| (3) | a material breach of the agreement by WEC Energy Group; or |
| |
| (4) | with respect to Mr. Leverett's ILA only and solely in the context of a change in control of WEC Energy Group, a material reduction of the executive's duties and responsibilities. |
Payments under the Severance Pay Plan
Messrs. Lauber and Garvin, and Mmes. Martin and Shafer, have not entered into any agreement that provides for severance benefits upon a change in control or otherwise. All four officers are eligible to participate in the Company’s Severance Pay Plan, in which all management employees are eligible to participate. In the event a participant is involuntarily terminated, other than for cause, death, disability, retirement, or resignation, the participant is entitled to receive severance pay in an amount equal to the sum of: (1) 4% of the participant’s annual base salary and target bonus, plus (2) 4% of the participant’s annual base salary and target bonus multiplied by his or her completed years of service with the Company. The maximum amount of severance pay that can be received under the plan is twelve months of a participant’s annual base salary and target bonus.
|
| | |
| Wisconsin Electric Power Company | 39 | 2018 Annual Meeting Information Statement |
Potential Payments to Named Executive Officers Upon Termination or Change in Control of WEC Energy Group
The following tables show the potential payments upon termination or a change in control of WEC Energy Group.
|
| | | | | | | | | | | | | | |
Executive Benefits and Payments Upon Separation | Voluntary Termination ($) | Normal Retirement ($) | For Cause Termination ($) | Involuntary Termination ($) | Termination Upon Change in Control ($) | Disability ($) | Death ($) |
| Allen L. Leverett |
| Compensation: | | | | | | | |
| Cash Severance | — | — | — | 6,392,458 |
| 9,588,687 |
| — | — |
| Additional Pension Credited Service | — | — | — | 4,090,055 |
| 4,440,982 |
| — | — |
| Additional 401(k) and EDCP Match | — | — | — | 255,698 |
| 383,547 |
| — | — |
| Long-Term Incentive Compensation: | | | | | | | |
| Performance Units | — | 3,404,538 |
| — | 7,035,601 |
| 7,035,601 |
| 7,035,601 |
| 7,035,601 |
|
| Restricted Stock | — | — | — | 1,851,138 |
| 1,851,138 |
| 1,851,138 |
| 1,851,138 |
|
| Options | — | 3,740,949 |
| — | 3,740,949 |
| 3,740,949 |
| 3,740,949 |
| 3,740,949 |
|
| Benefits & Perquisites: | | | | | | | |
| Retirement Plans | 325,820 |
| 14,664,022 |
| 325,820 |
| 9,531,327 |
| 9,556,472 |
| 14,664,022 |
| 5,482,505 |
|
| Health and Welfare Benefits | — | — | — | 34,489 |
| 63,995 |
| — | — |
| Excise Tax Gross-Up | — | — | — | — | — | — | — |
| Financial Planning | — | — | — | 54,000 |
| 54,000 |
| — | — |
| Outplacement | — | — | — | 30,000 |
| 30,000 |
| — | — |
| Death Benefit | — | — | — | — | — | — | — |
| Total | 325,820 |
| 21,809,509 |
| 325,820 |
| 33,015,715 |
| 36,745,371 |
| 27,291,710 |
| 18,110,193 |
|
| |
| J. Kevin Fletcher |
| Compensation: | | | | | | | |
| Cash Severance | — | — | — | 1,306,032 |
| 1,306,032 |
| — | — |
| Additional Pension Credited Service | — | — | — | — | — | — | — |
| Additional 401(k) and EDCP Match | — | — | — | — | — | — | — |
| Long-Term Incentive Compensation: | | | | | | | |
| Performance Units | — | 425,086 |
| — | — | 893,749 |
| 893,749 |
| 893,749 |
|
| Restricted Stock | — | — | — | — | 265,255 |
| 265,255 |
| 265,255 |
|
| Options | — | 535,887 |
| — | — | 535,887 |
| 535,887 |
| 535,887 |
|
| Benefits & Perquisites: | | | | | | | |
| Retirement Plans | 5,080,939 |
| 5,080,939 |
| 5,080,939 |
| 5,080,939 |
| 5,080,939 |
| 5,080,939 |
| 3,047,015 |
|
| Health and Welfare Benefits | — | — | — | 51,733 |
| 51,733 |
| — | — |
| Excise Tax Gross-Up | — | — | — | — | — | — | — |
| Financial Planning | — | — | — | — | — | — | — |
| Outplacement | — | — | — | — | — | — | — |
| Death Benefit | — | — | — | — | — | — | 1,310,400 |
|
| Total | 5,080,939 |
| 6,041,912 |
| 5,080,939 |
| 6,438,704 |
| 8,133,595 |
| 6,775,830 |
| 6,052,306 |
|
| |
| Scott J. Lauber |
| Compensation: | | | | | | | |
| Cash Severance | — | — | — | 869,294 |
| 869,294 |
| — | — |
| Additional Pension Credited Service | — | — | — | — | — | — | — |
| Additional 401(k) and EDCP Match | — | — | — | — | — | — | — |
| Long-Term Incentive Compensation: | | | | | | | |
| Performance Units | — | 289,834 |
| — | — | 689,477 |
| 689,477 |
| 689,477 |
|
| Restricted Stock | — | — | — | — | 233,501 |
| 233,501 |
| 233,501 |
|
| Options | — | 317,060 |
| — | — | 317,060 |
| 317,060 |
| 317,060 |
|
| Benefits & Perquisites: | | | | | | | |
| Retirement Plans | 726,835 |
| 726,835 |
| 726,835 |
| 726,835 |
| 726,835 |
| 726,835 |
| 522,152 |
|
| Health and Welfare Benefits | — | — | — | 8,622 |
| 8,622 |
| — | — |
| Excise Tax Gross-Up | — | — | — | — | — | — | — |
| Financial Planning | — | — | — | — | — | — | — |
| Outplacement | — | — | — | — | — | — | — |
| Death Benefit | — | — | — | — | — | — | — |
| Total | 726,835 |
| 1,333,729 |
| 726,835 |
| 1,604,751 |
| 2,844,789 |
| 1,966,873 |
| 1,762,190 |
|
|
| | |
| Wisconsin Electric Power Company | 40 | 2018 Annual Meeting Information Statement |
|
| | | | | | | | | | | | | | |
Executive Benefits and Payments Upon Separation | Voluntary Termination ($) | Normal Retirement ($) | For Cause Termination ($) | Involuntary Termination ($) | Termination Upon Change in Control ($) | Disability ($) | Death ($) |
| Susan H. Martin |
| Compensation: | | | | | | | |
| Cash Severance | — | — | — | 649,271 |
| 649,271 |
| — | — |
| Additional Pension Credited Service | — | — | — | — | — | — | — |
| Additional 401(k) and EDCP Match | — | — | — | — | — | — | — |
| Long-Term Incentive Compensation: | | | | | | | |
| Performance Units | 650,748 |
| 650,748 |
| — | 650,748 |
| 1,287,081 |
| 1,287,081 |
| 1,287,081 |
|
| Restricted Stock | — | — | — | — | 432,526 |
| 432,526 |
| 432,526 |
|
| Options | 812,535 |
| 812,535 |
| — | 812,535 |
| 812,535 |
| 812,535 |
| 812,535 |
|
| Benefits & Perquisites: | | | | | | | |
| Retirement Plans | 710,153 |
| 710,153 |
| 710,153 |
| 710,153 |
| 710,153 |
| 710,153 |
| 710,153 |
|
| Health and Welfare Benefits | — | — | — | 8,622 |
| 8,622 |
| — | — |
| Excise Tax Gross-Up | — | — | — | — | — | — | — |
| Financial Planning | — | — | — | — | — | — | — |
| Outplacement | — | — | — | — | — | — | — |
| Death Benefit | — | — | — | — | — | — | 1,591,350 |
|
| Total | 2,173,436 |
| 2,173,436 |
| 710,153 |
| 2,831,329 |
| 3,900,188 |
| 3,242,295 |
| 4,833,645 |
|
| |
| Robert M. Garvin |
| Compensation: | | | | | | | |
| Cash Severance | — | — | — | 198,015 |
| 198,015 |
| — | — |
| Additional Pension Credited Service | — | — | — | — | — | — | — |
| Additional 401(k) and EDCP Match | — | — | — | — | — | — | — |
| Long-Term Incentive Compensation: | | | | | | | |
| Performance Units | — | 446,742 |
| — | — | 879,533 |
| 879,533 |
| 879,533 |
|
| Restricted Stock | — | — | — | — | 348,758 |
| 348,758 |
| 348,758 |
|
| Options | — | 575,239 |
| — | — | 575,239 |
| 575,239 |
| 575,239 |
|
| Benefits & Perquisites: | | | | | | | |
| Retirement Plans | 134,629 |
| 460,501 |
| 134,629 |
| 460,501 |
| 460,501 |
| 460,501 |
| 441,059 |
|
| Health and Welfare Benefits | — | — | — | 8,622 |
| 8,622 |
| — | — |
| Excise Tax Gross-Up | — | — | — | — | — | — | — |
| Financial Planning | — | — | — | — | — | — | — |
| Outplacement | — | — | — | — | — | — | — |
| Death Benefit | — | — | — | — | — | — | 1,285,812 |
|
| Total | 134,629 |
| 1,482,482 |
| 134,629 |
| 667,138 |
| 2,470,668 |
| 2,264,031 |
| 3,530,401 |
|
|
| | | | | | | | | | | | | | |
| Joan M. Shafer |
| Compensation: | | | | | | | |
| Cash Severance | — | — | — | 1,002,144 |
| 1,002,144 |
| — | — |
| Additional Pension Credited Service | — | — | — | — | — | — | — |
| Additional 401(k) and EDCP Match | — | — | — | — | — | — | — |
| Long-Term Incentive Compensation: | | | | | | | |
| Performance Units | 370,414 |
| 370,414 |
| — | 370,414 |
| 741,027 |
| 741,027 |
| 741,027 |
|
| Restricted Stock | — | — | — | — | 215,233 |
| 215,233 |
| 215,233 |
|
| Options | 371,767 |
| 371,767 |
| — | 371,767 |
| 371,767 |
| 371,767 |
| 371,767 |
|
| Benefits & Perquisites: | | | | | | | |
| Retirement Plans | 2,407,023 |
| 2,407,023 |
| 2,407,023 |
| 2,407,023 |
| 2,407,023 |
| 2,407,023 |
| 929,001 |
|
| Health and Welfare Benefits | — | — | — | 8,622 |
| 8,622 |
| — | — |
| Excise Tax Gross-Up | — | — | — | — | — | — | — |
| Financial Planning | — | — | — | — | — | — | — |
| Outplacement | — | — | — | — | — | — | — |
| Death Benefit | — | — | — | — | — | — | — |
| Total | 3,149,204 |
| 3,149,204 |
| 2,407,023 |
| 4,159,970 |
| 4,745,816 |
| 3,735,050 |
| 2,257,028 |
|
|
| | |
| Wisconsin Electric Power Company | 41 | 2018 Annual Meeting Information Statement |
PAY RATIO DISCLOSURE
The primary objective of our executive compensation program is to provide a competitive, performance-based plan that enables WEC Energy Group and the Company to attract and retain key individuals and to reward them for achieving both WEC Energy Group’s and the Company’s short-term and long-term goals without creating an incentive for our NEOs to take excessive risks. For 2017, the annual total compensation of Mr. Leverett, our principal executive officer serving in that position on October 7, 2017 (the date we selected to identify the median employee), of $13,642,237, as shown in the Summary Compensation Table above (“CEO Compensation”), was approximately 113 times the annual total compensation of a median employee of WEC Energy Group of $120,223.
We identified the median employee as of October 7, 2017, using total wages and earnings paid during the rolling 12-month period ended October 7, 2017, as reflected in WEC Energy Group’s internal payroll records (including, without limitation, base salary, wages plus overtime, and annual cash incentive payments, as applicable), for all individuals, excluding Mr. Leverett, who were employed by WEC Energy Group or any of its consolidated subsidiaries, including the Company, on October 7, 2017 (whether employed on a full-time, part-time, seasonal or temporary basis and including union and non-union employees). After identifying the median employee, we calculated annual total compensation for such employee using the same methodology we use for our CEO Compensation, which includes salary, bonus, changes in pension value and 401(k) matching by the WEC Energy Group.
We are providing the pay ratio of Mr. Leverett to a median employee based upon his aggregate WEC Energy Group compensation because we believe doing otherwise would not be representative of the manner in which Mr. Leverett's compensation is determined. A significant number of employees of a WEC Energy Group owned centralized service company who provide a substantial amount of administrative and support services to the Company would otherwise be excluded from the pay ratio calculation if it were calculated on a basis other than the consolidated WEC Energy Group level. There are also employees of several of WEC Energy Group’s other utility subsidiaries who provide services to the Company and would otherwise be excluded from the calculation.
In addition to WEC Energy Group and the Company, Mr. Leverett was also the Chairman and CEO of several other major subsidiaries of WEC Energy Group during 2017. The Compensation Committee determines Mr. Leverett’s annual compensation based upon his service to WEC Energy Group and its subsidiaries, taken as a whole, as opposed to allocating compensation based upon Mr. Leverett’s service to each individual company.
RISK ANALYSIS OF COMPENSATION POLICIES AND PRACTICES
As part of its process to determine the 2017 compensation of the NEOs, the Compensation Committee analyzed whether the compensation program of WEC Energy Group and its subsidiaries taken as a whole creates risks that are reasonably likely to have a material adverse effect on WEC Energy Group and its subsidiaries, including the Company. The Compensation Committee concluded it does not. This analysis applies generally to the compensation program for WEC Energy Group’s and the Company’s employees since all management employees (both officers and non-officers) above a certain level are provided with substantially the same mix of compensation as the NEOs. The compensation package provided to employees below this level is not applicable to this analysis as such compensation package does not provide sufficient incentive to take risks that could materially affect WEC Energy Group or the Company.
There is no objective way to measure risk resulting from a corporation’s compensation program; therefore, this analysis is subjective in nature. We believe that the only elements of the compensation program that could incentivize risk-taking by the employees of WEC Energy Group or the Company, and therefore have a reasonable likelihood of materially adversely affecting WEC Energy Group or the Company, are the annual cash incentive compensation and the long-term incentive compensation, the payout of which is dependent on the achievement of certain performance levels by WEC Energy Group and its subsidiaries, including the Company. Based upon the value of each of these elements to the overall compensation mix and the relative value each has to the other, we believe the compensation program is appropriately balanced. We believe that the mix of short- and long-term awards minimizes risks that may be taken, as any risks taken for short-term gains could ultimately jeopardize WEC Energy Group’s or the Company’s ability to meet the long-term performance objectives. Given the current balance of compensation elements, we do not believe the compensation program incentivizes unreasonable risk-taking by management.
The Compensation Committee’s stock ownership guidelines require officers who participate in the long-term incentive compensation program to hold an amount of WEC Energy Group common stock and other equity-related WEC Energy Group securities that varies depending upon such officers’ level. The guidelines require executive officers to hold common stock and other equity-related securities of WEC Energy Group having a minimum fair market value ranging from 250% to 600% of base salary. The Compensation Committee believes these stock ownership guidelines further discourage unreasonable risk taking by the officers of WEC Energy Group or the Company.
|
| | |
| Wisconsin Electric Power Company | 42 | 2018 Annual Meeting Information Statement |
As part of this analysis, we also considered the nature of WEC Energy Group’s business as a public utility holding company and the fact that substantially all of its earnings and other financial results are generated by, or relate to, regulated public utilities, including the Company. The highly regulated nature of WEC Energy Group’s business, including limits on the amount of profit WEC Energy Group’s public utility subsidiaries (and therefore, WEC Energy Group) may earn, significantly reduces any incentive to engage in conduct that would be reasonably likely to have a material adverse effect on WEC Energy Group or the Company.
STOCK OWNERSHIP OF DIRECTORS, NOMINEES AND EXECUTIVE OFFICERS
None of the Company’s directors, nominees, or executive officers own any WE stock but do beneficially own shares of its parent company, WEC Energy Group, Inc.
The following table lists the beneficial ownership of WEC Energy Group common stock of each WE director, nominee, NEO, and of all of the directors and executive officers as a group as of January 31, 2018. In general, “beneficial ownership” includes those shares for which the indicated persons have voting power or investment power and WEC Energy Group stock options that are exercisable currently or within 60 days of January 31, 2018. Included are shares owned by each individual’s spouse, minor children, or any other relative sharing the same residence, as well as shares held in a fiduciary capacity or held in WEC Energy Group’s Stock Plus Investment Plan and WEC Energy Group’s 401(k) plans. The shares beneficially owned by all directors, nominees and executive officers as a group consist of less than 1% of WEC Energy Group’s outstanding common stock.
|
| | | | | | | | |
| Name | Shares Beneficially Owned (1) |
Shares Owned (2) (3) (4) | Option Shares Exercisable Within 60 Days | Total |
| J. Kevin Fletcher | 9,384 |
| | 85,300 |
| 94,684 |
| |
| Robert M. Garvin | 9,268 |
| | 72,845 |
| 82,113 |
| |
| Margaret C. Kelsey | 1,815 |
| | — |
| 1,815 |
| |
| Gale E. Klappa | 213,866 |
| | 1,096,303 |
| 1,310,169 |
| |
| Scott J. Lauber | 17,433 |
| | 24,900 |
| 42,333 |
| |
| Allen L. Leverett | 89,023 |
| | 521,620 |
| 610,643 |
| |
| Susan H. Martin | 21,026 |
| | 18,920 |
| 39,946 |
| |
| Tom Metcalfe | 9,041 |
| | 22,510 |
| 31,551 |
| |
| Joan M. Shafer | 11,394 |
| | 33,245 |
| 44,639 |
| |
All directors and executive officers as a group (11 persons) | 407,211 |
| (5) | 1,894,468 |
| 2,301,679 |
| |
| |
| (1) | Information on beneficially owned shares is based on data furnished by the specified persons and is determined in accordance with Rule 13d-3 under the Securities Exchange Act of 1934, as amended, as required for purposes of this information statement. It is not necessarily to be construed as an admission of beneficial ownership for other purposes. |
| |
| (2) | Certain directors, nominees, NEOs, and other executive officers also hold share units in the WEC Energy Group phantom common stock account under WEC Energy Group’s EDCP as indicated: Mr. Garvin (6,859), Ms. Kelsey (2,308), Mr. Lauber (1,183), Mr. Leverett (10,328), Ms. Martin (846), Mr. Metcalfe (22,425), Ms. Shafer (5,972) and all directors and executive officers as a group (50,081). Share units are intended to reflect the performance of WEC Energy Group common stock and are payable in cash. While these units do not represent a right to acquire WEC Energy Group common stock, have no voting rights, and are not included in the number of shares reflected in the “Shares Owned” column in the table above, the Company listed them in this footnote because they represent an additional economic interest of the directors, nominees, NEOs, and other executive officers that is tied to the performance of WEC Energy Group common stock. |
| |
| (3) | Each individual has sole voting and investment power as to all shares listed for such individual, except the following individuals have shared voting and/or investment power (included in the table above) as indicated: Mr. Klappa (5,000), Mr. Leverett (55,923), Ms. Martin (4,996), and all directors and executive officers as a group (65,919). |
| |
| (4) | The directors, nominees, NEOs, and other executive officers hold shares of restricted stock (included in the table above) over which the holders have sole voting but no investment power: Mr. Fletcher (4,112), Mr. Garvin (5,223), Ms. Kelsey (1,695), Mr. Klappa (60,035), Mr. Lauber (5,031), Mr. Leverett (30,027), Ms. Martin (6,341), Mr. Metcalfe (1,612), Ms. Shafer (3,376), and all directors and executive officers as a group (120,920). |
| |
| (5) | None of the shares beneficially owned by the directors, nominees, NEOs, or all directors and executive officers as a group are pledged as security. |
|
| | |
| Wisconsin Electric Power Company | 43 | 2018 Annual Meeting Information Statement |
SECTION 16(a) BENEFICIAL OWNERSHIP REPORTING COMPLIANCE
Section 16(a) of the Securities Exchange Act of 1934, as amended, requires the Company’s executive officers, directors, and persons owning more than 10% of a registered class of the Company’s equity securities to file reports of ownership and changes in ownership of equity and derivative securities of WE with the SEC. Specific due dates for those reports have been established by the SEC, and the Company is required to disclose in this information statement any failure to file by those dates during the 2017 fiscal year. To the Company’s knowledge, based on information provided by the reporting persons, all applicable reporting requirements for fiscal year 2017 were complied with in a timely manner.
CERTAIN RELATIONSHIPS AND RELATED TRANSACTIONS
The Company provides to and receives from WEC Energy Group and its other subsidiaries, including WEC Business Services LLC (“WBS”), a centralized service company, services, property and other items of value.
An affiliated interest agreement (the "AIA"), that became effective January 1, 2017, governs the provision and receipt of services by WEC Energy Group and its subsidiaries, including the Company. Services under the AIA are subject to various pricing methodologies. All services provided by any regulated subsidiary to another regulated subsidiary are priced at cost. All services provided by any regulated subsidiary to any nonregulated subsidiary are priced at the greater of cost or fair market value. All services provided by any nonregulated subsidiary to any regulated subsidiary are priced at the lesser of cost or fair market value. All services provided by any regulated or nonregulated subsidiary to WBS are priced at cost. WBS renders its services at cost.
Compensation Committee Interlocks and Insider Participation. None of the persons who served as members of the WEC Energy Group Compensation Committee during 2017 was an officer or employee of WEC Energy Group or the Company during 2017 or at any time in the past nor had reportable transactions with WEC Energy Group or the Company.
During 2017, none of our executive officers served as a member of the compensation committee or as a director of another entity, one of whose executive officers served on the Compensation Committee or as a director of WEC Energy Group or the Company.
AVAILABILITY OF FORM 10-K
A copy (without exhibits) of Wisconsin Electric Power Company’s Annual Report on Form 10-K for the fiscal year ended December 31, 2017, as filed with the SEC, is available without charge to any stockholder of record or beneficial owner of Wisconsin Electric preferred stock by writing to the Corporate Secretary, Margaret C. Kelsey, at the Company’s principal business office, 231 W. Michigan Street, PO Box 2046, Milwaukee, Wisconsin 53201. The Wisconsin Electric consolidated financial statements and certain other information found in the Form 10-K are included in the Wisconsin Electric Power Company 2017 Annual Financial Statements and Review of Operations, attached hereto as Appendix B.
|
| | |
| Wisconsin Electric Power Company | 44 | 2018 Annual Meeting Information Statement |
APPENDIX A – EARNINGS PER SHARE GAAP RECONCILIATION
|
| | | | | | | | | | | | | | | | |
| Diluted Earnings Per Share | | 2017 | | 2016 | | 2015 | | 2014 |
| WEC Energy Group GAAP EPS | | $ | 3.79 |
| | $ | 2.96 |
| | $ | 2.34 |
| | $ | 2.59 |
|
| Tax benefit related to Tax Cuts and Jobs Act of 2017 | | (0.65 | ) | | — |
| | — |
| | — |
|
| Acquisition costs | | — |
| | 0.01 |
| | 0.30 |
| | 0.06 |
|
| WEC Energy Group adjusted EPS | | $ | 3.14 |
| | $ | 2.97 |
| | $ | 2.64 |
| | $ | 2.65 |
|
WEC Energy Group provided adjusted earnings per share (non-GAAP earnings) as a complement to, and not as an alternative to, reported earnings per share presented in accordance with GAAP. Adjusted earnings per share exclude a one-time reduction in income tax expense related to a revaluation of WEC Energy Group's deferred tax assets as a result of the Tax Cuts and Jobs Act of 2017 as well as costs related to WEC Energy Group's acquisition of Integrys, neither of which is indicative of WEC Energy Group's ongoing operating performance. Therefore, WEC Energy Group believes that the presentation of adjusted earnings per share is relevant and useful to investors to understand WEC Energy Group's operating performance. WEC Energy Group management uses such measures internally to evaluate WEC Energy Group’s performance and manage its operations.
|
| | |
| Wisconsin Electric Power Company | A-1 | 2018 Annual Meeting Information Statement |
APPENDIX B
|
| | |
| | WISCONSIN ELECTRIC POWER COMPANY | |
| | | |
| | 2017 ANNUAL REPORT TO STOCKHOLDERS | |
| | | |
| | | |
| | | |
| | | |
| | 2017 ANNUAL FINANCIAL STATEMENTS | |
| | | |
| | AND | |
| | | |
| | REVIEW OF OPERATIONS | |
|
| | |
| Wisconsin Electric Power Company | B-1 | 2017 Annual Financial Statements
|
GLOSSARY OF TERMS AND ABBREVIATIONS
The abbreviations and terms set forth below are used throughout this report and have the meanings assigned to them below:
|
| | |
| Subsidiaries and Affiliates | | |
| ATC | | American Transmission Company LLC |
| Bluewater | | Bluewater Natural Gas Holding, LLC |
| Bostco | | Bostco LLC |
| Integrys | | Integrys Holding, Inc. (previously known as Integrys Energy Group, Inc.) |
| UMERC | | Upper Michigan Energy Resources Corporation |
| WBS | | WEC Business Services LLC |
| WE | | Wisconsin Electric Power Company |
| We Power | | W.E. Power, LLC |
| WEC Energy Group | | WEC Energy Group, Inc. (previously known as Wisconsin Energy Corporation) |
| WG | | Wisconsin Gas LLC |
| Wispark | | Wispark LLC |
| WPS | | Wisconsin Public Service Corporation |
| | | |
| Federal and State Regulatory Agencies |
| EPA | | United States Environmental Protection Agency |
| FERC | | Federal Energy Regulatory Commission |
| IRS | | United States Internal Revenue Service |
| MDEQ | | Michigan Department of Environmental Quality |
| MPSC | | Michigan Public Service Commission |
| PSCW | | Public Service Commission of Wisconsin |
| SEC | | Securities and Exchange Commission |
| WDNR | | Wisconsin Department of Natural Resources |
| | | |
| Accounting Terms |
| AFUDC | | Allowance for Funds Used During Construction |
| ARO | | Asset Retirement Obligation |
| ASC | | Accounting Standards Codification |
| ASU | | Accounting Standards Update |
| CWIP | | Construction Work in Progress |
| FASB | | Financial Accounting Standards Board |
| GAAP | | Generally Accepted Accounting Principles |
| OPEB | | Other Postretirement Employee Benefits |
| | | |
| Environmental Terms |
| Act 141 | | 2005 Wisconsin Act 141 |
CO2 | | Carbon Dioxide |
| CPP | | Clean Power Plan |
| CSAPR | | Cross-State Air Pollution Rule |
| GHG | | Greenhouse Gas |
| NAAQS | | National Ambient Air Quality Standards |
| NOx | | Nitrogen Oxide |
SO2 | | Sulfur Dioxide |
| | | |
| Measurements | | |
| Dth | | Dekatherm |
| MW | | Megawatt |
| MWh | | Megawatt-hour |
| | | |
|
| | |
| Wisconsin Electric Power Company | B-2 | 2017 Annual Financial Statements
|
|
| | |
| Other Terms and Abbreviations |
| AIA | | Affiliated Interest Agreement |
| ARRs | | Auction Revenue Rights |
| Compensation Committee | | Compensation Committee of the Board of Directors of WEC Energy Group, Inc. |
| D.C. Circuit Court of Appeals | | United States Court of Appeals for the District of Columbia Circuit |
| ERGS | | Elm Road Generating Station |
| ER 1 | | Elm Road Generating Station Unit 1 |
| ER 2 | | Elm Road Generating Station Unit 2 |
| Exchange Act | | Securities Exchange Act of 1934, as amended |
| FTRs | | Financial Transmission Rights |
| GCRM | | Gas Cost Recovery Mechanism |
| LMP | | Locational Marginal Price |
| MCPP | | Milwaukee County Power Plant |
| MISO | | Midcontinent Independent System Operator, Inc. |
| MISO Energy Markets | | MISO Energy and Operating Reserves Market |
| NYMEX | | New York Mercantile Exchange |
| OCPP | | Oak Creek Power Plant |
| OC 5 | | Oak Creek Power Plant Unit 5 |
| OC 6 | | Oak Creek Power Plant Unit 6 |
| OC 7 | | Oak Creek Power Plant Unit 7 |
| OC 8 | | Oak Creek Power Plant Unit 8 |
| Omnibus Stock Incentive Plan | | WEC Energy Group 1993 Omnibus Stock Incentive Plan, Amended and Restated Effective as of January 1, 2016 |
| PIPP | | Presque Isle Power Plant |
| Point Beach | | Point Beach Nuclear Power Plant |
| PWGS | | Port Washington Generating Station |
| PWGS 1 | | Port Washington Generating Station Unit 1 |
| PWGS 2 | | Port Washington Generating Station Unit 2 |
| ROE | | Return on Equity |
| RTO | | Regional Transmission Organization |
| SSR | | System Support Resource |
| Supreme Court | | United States Supreme Court |
| Tax Legislation | | Tax Cuts and Jobs Act of 2017 |
| Tilden | | Tilden Mining Company |
| Treasury Grant | | Section 1603 Renewable Energy Treasury Grant |
| VAPP | | Valley Power Plant |
|
| | |
| Wisconsin Electric Power Company | B-3 | 2017 Annual Financial Statements
|
CAUTIONARY STATEMENT REGARDING FORWARD-LOOKING INFORMATION
In this report, we make statements concerning our expectations, beliefs, plans, objectives, goals, strategies, and future events or performance. These statements are "forward-looking statements" within the meaning of Section 27A of the Securities Act of 1933, as amended, and Section 21E of the Exchange Act. Readers are cautioned not to place undue reliance on these forward-looking statements. Forward-looking statements may be identified by reference to a future period or periods or by the use of terms such as "anticipates," "believes," "could," "estimates," "expects," "forecasts," "goals," "guidance," "intends," "may," "objectives," "plans," "possible," "potential," "projects," "seeks," "should," "targets," "will," or variations of these terms.
Forward-looking statements include, among other things, statements concerning management's expectations and projections regarding earnings, completion of capital projects, sales and customer growth, rate actions and related filings with regulatory authorities, environmental and other regulations and associated compliance costs, legal proceedings, effective tax rate, pension and OPEB plans, fuel costs, sources of electric energy supply, coal and natural gas deliveries, remediation costs, liquidity and capital resources, and other matters.
Forward-looking statements are subject to a number of risks and uncertainties that could cause our actual results to differ materially from those expressed or implied in the statements. These risks and uncertainties include those described below:
| |
| • | Factors affecting utility operations such as catastrophic weather-related damage, environmental incidents, unplanned facility outages and repairs and maintenance, and electric transmission or natural gas pipeline system constraints; |
| |
| • | Factors affecting the demand for electricity and natural gas, including political developments, unusual weather, changes in economic conditions, customer growth and declines, commodity prices, energy conservation efforts, and continued adoption of distributed generation by customers; |
| |
| • | The timing, resolution, and impact of rate cases and negotiations, including recovery of deferred and current costs and the ability to earn a reasonable return on investment, and other regulatory decisions impacting our regulated operations; |
| |
| • | The ability to obtain and retain customers, including wholesale customers, due to increased competition in our electric and natural gas markets from retail choice and alternative electric suppliers, and continued industry consolidation; |
| |
| • | The timely completion of capital projects within budgets, as well as the recovery of the related costs through rates; |
| |
| • | The impact of federal, state, and local legislative and regulatory changes, including changes in rate-setting policies or procedures, deregulation and restructuring of the electric and/or natural gas utility industries, transmission or distribution system operation, the approval process for new construction, reliability standards, pipeline integrity and safety standards, allocation of energy assistance, and energy efficiency mandates; |
| |
| • | The uncertainty surrounding the recently enacted Tax Legislation, including implementing regulations and IRS interpretations, the amount to be returned to our ratepayers, and its impact, if any, on our credit ratings; |
| |
| • | Federal and state legislative and regulatory changes relating to the environment, including climate change and other environmental regulations impacting generation facilities and renewable energy standards, the enforcement of these laws and regulations, changes in the interpretation of permit conditions by regulatory agencies, and the recovery of associated remediation and compliance costs; |
| |
| • | Factors affecting the implementation of WEC Energy Group's generation reshaping plan, including related regulatory decisions, the cost of materials, supplies, and labor, and the feasibility of competing projects; |
| |
| • | Increased pressure on us by investors and other stakeholder groups to take more aggressive action to reduce future GHG emissions in order to limit future global temperature increases; |
| |
| • | The risks associated with changing commodity prices, particularly natural gas and electricity, and the availability of sources of fossil fuel, natural gas, purchased power, materials needed to operate environmental controls at our electric generating facilities, or water supply due to high demand, shortages, transportation problems, nonperformance by electric energy or natural gas suppliers under existing power purchase or natural gas supply contracts, or other developments; |
| |
| • | Changes in credit ratings, interest rates, and our ability to access the capital markets, caused by volatility in the global credit markets, our capitalization structure, and market perceptions of the utility industry or us; |
| |
| • | Costs and effects of litigation, administrative proceedings, investigations, settlements, claims, and inquiries; |
| |
| • | The risk of financial loss, including increases in bad debt expense, associated with the inability of our customers, counterparties, and affiliates to meet their obligations; |
| |
| • | Changes in the creditworthiness of the counterparties with whom we have contractual arrangements, including participants in the energy trading markets and fuel suppliers and transporters; |
|
| | |
| Wisconsin Electric Power Company | B-4 | 2017 Annual Financial Statements
|
| |
| • | The direct or indirect effect on our business resulting from terrorist attacks and cyber security intrusions, as well as the threat of such incidents, including the failure to maintain the security of personally identifiable information, the associated costs to protect our utility assets, technology systems, and personal information, and the costs to notify affected persons to mitigate their information security concerns; |
| |
| • | The investment performance of our employee benefit plan assets, as well as unanticipated changes in related actuarial assumptions, which could impact future funding requirements; |
| |
| • | Factors affecting the employee workforce, including loss of key personnel, internal restructuring, work stoppages, and collective bargaining agreements and negotiations with union employees; |
| |
| • | Advances in technology that result in competitive disadvantages and create the potential for impairment of existing assets; |
| |
| • | The timing, costs, and anticipated benefits associated with the remaining integration efforts relating to WEC Energy Group's acquisition of Integrys; |
| |
| • | Potential business strategies to acquire and dispose of assets or businesses, which cannot be assured to be completed timely or within budgets; |
| |
| • | The timing and outcome of any audits, disputes, and other proceedings related to taxes; |
| |
| • | The ability to maintain effective internal controls in accordance with Section 404 of the Sarbanes-Oxley Act, while both integrating and continuing to consolidate WEC Energy Group's enterprise systems with those of its other utilities; |
| |
| • | The effect of accounting pronouncements issued periodically by standard-setting bodies; and |
| |
| • | Other considerations disclosed elsewhere herein and in other reports we file with the SEC or in other publicly disseminated written documents. |
We expressly disclaim any obligation to publicly update or revise any forward-looking statements, whether as a result of new information, future events, or otherwise.
|
| | |
| Wisconsin Electric Power Company | B-5 | 2017 Annual Financial Statements
|
BUSINESS OF THE COMPANY
In this report, when we refer to "us," "we," "our," or "ours," we are referring to Wisconsin Electric Power Company and our subsidiary, Bostco. References to "Notes" are to the Notes to the Consolidated Financial Statements included in this report.
We are a subsidiary of WEC Energy Group and were incorporated in the state of Wisconsin in 1896. We maintain our principal executive offices in Milwaukee, Wisconsin and serve customers in Wisconsin and served customers in the Upper Peninsula of Michigan through December 31, 2016. Effective January 1, 2017, we transferred our electric customers and distribution assets located in the Upper Peninsula of Michigan to UMERC, a stand-alone utility owned by WEC Energy Group. UMERC became operational effective January 1, 2017. We will continue to provide service to one iron ore mine located in the Upper Peninsula of Michigan pursuant to a contract between the mine’s owner and us until UMERC’s new generation units begin commercial operation, which is expected in 2019. See Note 4, Related Parties, and Note 21, Regulatory Environment, for more information.
At December 31, 2017, we conducted our operations in the two reportable segments discussed below.
UTILITY SEGMENT
We are the largest electric utility in the state of Wisconsin. We generate and distribute electric energy to approximately 1,126,800 customers located in southeastern Wisconsin (including the metropolitan Milwaukee area), east central Wisconsin, and northern Wisconsin. We also continue, on an interim basis, to serve the iron ore mine in the Upper Peninsula of Michigan.
We are authorized to provide retail natural gas distribution service in designated territories in the state of Wisconsin, as established by indeterminate permits and boundary agreements with other utilities. We also transport customer-owned natural gas. We serve approximately 486,300 customers in three distinct service areas in Wisconsin, including areas west and south of the City of Milwaukee, the Appleton area, and areas within Iron and Vilas Counties.
We have a steam utility that generates, distributes, and sells steam supplied by VAPP to customers in metropolitan Milwaukee, Wisconsin. Steam is used by approximately 400 customers for processing, space heating, domestic hot water, and humidification. Annual sales of steam fluctuate from year to year based on system growth and variations in weather conditions. In April 2016, we sold our MCPP steam generation and distribution assets, located in Wauwatosa, Wisconsin. MCPP primarily provided steam to the Milwaukee Regional Medical Center hospitals and other campus buildings. See Note 3, Dispositions, for more information.
OTHER SEGMENT
At December 31, 2017, our other segment included Bostco, our non-utility subsidiary that was originally formed to develop and invest in real estate. In March 2017, we sold the remaining real estate holdings of Bostco located in downtown Milwaukee, Wisconsin, which included retail, office, and residential space. Bostco no longer has significant operations.
Prior to January 1, 2017, our other segment also included our approximate 23% ownership interest in ATC, a for-profit, electric transmission company regulated by the FERC and certain state regulatory commissions. Effective January 1, 2017, we transferred our investment in ATC to another subsidiary of WEC Energy Group. See Note 16, Investment in American Transmission Company, for more information.
For additional financial information about our business segments, see Results of Operations in Management's Discussion and Analysis of Financial Condition and Results of Operations and Note 17, Segment Information.
|
| | |
| Wisconsin Electric Power Company | B-6 | 2017 Annual Financial Statements
|
MANAGEMENT'S DISCUSSION AND ANALYSIS OF
FINANCIAL CONDITION AND RESULTS OF OPERATIONS
CORPORATE DEVELOPMENTS
INTRODUCTION
We are a wholly owned subsidiary of WEC Energy Group, and derive revenues primarily from the distribution and sale of electricity and natural gas to retail customers in Wisconsin. We have combined common functions with WG and operate under the trade name of "We Energies." We conduct our business primarily through our utility reportable segment. See Note 17, Segment Information, for more information on our reportable business segments.
Effective January 1, 2017, our customers (other than Tilden) and electric distribution assets located in the Upper Peninsula of Michigan were transferred to UMERC, a new stand-alone utility. See Note 4, Related Parties, and Note 21, Regulatory Environment, for more information.
Effective January 1, 2017, we transferred our investment in ATC to another subsidiary of WEC Energy Group. See Note 16, Investment in American Transmission Company, for more information. In March 2017, we sold the remaining real estate holdings of Bostco located in downtown Milwaukee, Wisconsin, which included retail, office, and residential space. See Note 3, Dispositions, for more information.
CORPORATE STRATEGY
Our goal is to continue to build and sustain long-term value for customers and shareholders by focusing on the fundamentals of our business: reliability; operating efficiency; financial discipline; customer care; and safety.
Reshaping Our Generation Fleet
WEC Energy Group has developed and is executing a plan to reshape its generation portfolio. This plan will balance reliability and customer cost with environmental stewardship. Taken as a whole, this plan should reduce costs to customers, preserve fuel diversity, and lower carbon emissions. Generation reshaping includes retiring older fossil fuel generation units, building state-of-the-art natural gas generation, and investing in cost-effective zero-carbon generation with a goal of reducing CO2 emissions by approximately 40% below 2005 levels by 2030. WEC Energy Group expects to retire approximately 1,800 MW of coal generation by 2020 across its electric utilities, and add additional natural gas-fired generating units and renewable generation, including utility-scale solar projects. See Note 6, Property, Plant, and Equipment, for information related to the planned retirements of our Pleasant Prairie power plant and PIPP as part of WEC Energy Group's plan.
Reliability
We have made significant reliability-related investments in recent years, and plan to continue strengthening and modernizing our generation fleet and distribution networks to further improve reliability. Our investments, coupled with our commitment to operating efficiency and customer care, resulted in We Energies being recognized by PA Consulting Group, an independent consulting firm, as the most reliable utility in the United States in 2017 and, for the seventh year in a row, as the most reliable utility in the Midwest.
Operating Efficiency
We continually look for ways to optimize the operating efficiency of our company. For example, we received approval from the PSCW to make changes at the Elm Road Generating Station to enable the facility to burn coal from the Powder River Basin located in the western United States. The plant was originally designed to burn coal mined from the eastern United States. This project is creating flexibility and has enabled the plant to operate at lower costs, placing it in a better position to be called upon in the MISO Energy Markets, resulting in lower fuel costs for our customers.
We also made progress on our Advanced Metering Infrastructure program, replacing aging meter-reading equipment on both our network and customer property. An integrated system of smart meters, communication networks, and data management programs enables two-way communication between us and our customers. This program reduces the manual effort for disconnects and reconnects and enhances outage management capabilities.
|
| | |
| Wisconsin Electric Power Company | B-7 | 2017 Annual Financial Statements
|
WEC Energy Group continues to focus on integrating and improving business processes and consolidating its IT infrastructure across all of its companies. We expect these efforts to continue to drive operational efficiency and to put us in position to effectively support plans for future growth.
Financial Discipline
A strong adherence to financial discipline is essential to earning our authorized ROE and maintaining a strong balance sheet, stable cash flows, and quality credit ratings.
We follow an asset management strategy that focuses on investing in and acquiring assets consistent with our strategic plans, as well as disposing of assets, including property, plants, and equipment, that are no longer performing as intended, or have an unacceptable risk profile. See Note 3, Dispositions, for information on the sale of the MCPP and Bostco's remaining real estate holdings.
Exceptional Customer Care
Our approach is driven by an intense focus on delivering exceptional customer care every day. We strive to provide the best value for our customers by embracing constructive change, demonstrating personal responsibility for results, leveraging our capabilities and expertise, and using creative solutions to meet or exceed our customers’ expectations.
One example of how we obtain feedback from our customers is through our "We Care" calls, where our employees contact customers after a completed service call. Customer satisfaction is a priority, and making "We Care" calls is one of the main methods we use to gauge our performance to improve customer satisfaction.
Safety
We have a long-standing commitment to both workplace and public safety, and under our "Target Zero" mission, we have an ultimate goal of zero incidents, accidents, and injuries. We also set goals around injury-prevention activities that raise awareness and facilitate conversations about employee safety. WEC Energy Group's corporate safety program provides a forum for addressing employee concerns, training employees and contractors on current safety standards, and recognizing those who demonstrate a safety focus.
RESULTS OF OPERATIONS
CONSOLIDATED EARNINGS
Our consolidated earnings for the years ended December 31, 2017, 2016, and 2015 were $335.6 million, $364.3 million, and $375.7 million, respectively. See below for information on the year-over year changes in consolidated earnings.
Non-GAAP Financial Measures
The discussion below addresses the operating income contribution of our utility segment and includes financial information prepared in accordance with GAAP, as well as electric margins and natural gas margins, which are not measures of financial performance under GAAP. Electric margin (electric revenues less fuel and purchased power costs) and natural gas margin (natural gas revenues less cost of natural gas sold) are non-GAAP financial measures because they exclude other operation and maintenance expense, depreciation and amortization, and property and revenue taxes.
We believe that electric and natural gas margins provide a more meaningful basis for evaluating utility operations than operating revenues since the majority of prudently incurred fuel and purchased power costs, as well as prudently incurred natural gas costs, are passed through to customers in current rates. As a result, management uses electric and natural gas margins internally when assessing the operating performance of our utility segment as these measures exclude the majority of revenue fluctuations caused by changes in these expenses. Similarly, the presentation of electric and natural gas margins herein is intended to provide supplemental information for investors regarding our operating performance.
Our electric margins and natural gas margins may not be comparable to similar measures presented by other companies. Furthermore, these measures are not intended to replace operating income as determined in accordance with GAAP as an indicator of our utility segment operating performance. Our utility segment operating income for the years ended December 31, 2017, 2016, and 2015 was $625.6 million, $629.5 million, and $648.9 million, respectively. The operating income discussion below includes a table that provides the calculation of electric margins and natural gas margins, along with a reconciliation to utility segment operating income.
|
| | |
| Wisconsin Electric Power Company | B-8 | 2017 Annual Financial Statements
|
UTILITY SEGMENT CONTRIBUTION TO OPERATING INCOME
Effective January 1, 2017, we transferred our electric customers (other than Tilden) located in the Upper Peninsula of Michigan to UMERC. See Note 4, Related Parties, for more information.
|
| | | | | | | | | | | | |
| | | Year Ended December 31 |
| (in millions) | | 2017 | | 2016 | | 2015 |
| Electric revenues | | $ | 3,336.2 |
| | $ | 3,440.6 |
| | $ | 3,454.4 |
|
| Fuel and purchased power | | 1,064.3 |
| | 1,091.8 |
| | 1,154.4 |
|
| Total electric margins | | 2,271.9 |
| | 2,348.8 |
| | 2,300.0 |
|
| | | | | | | |
| Natural gas revenues | | 375.5 |
| | 352.2 |
| | 399.7 |
|
| Cost of natural gas sold | | 222.1 |
| | 200.3 |
| | 244.6 |
|
| Total natural gas margins | | 153.4 |
| | 151.9 |
| | 155.1 |
|
| | | | | | | |
| Total electric and natural gas margins | | 2,425.3 |
| | 2,500.7 |
| | 2,455.1 |
|
| | | | | | | |
| Other operation and maintenance | | 1,358.5 |
| | 1,430.2 |
| | 1,384.9 |
|
| Depreciation and amortization | | 331.6 |
| | 325.4 |
| | 304.0 |
|
| Property and revenue taxes | | 109.6 |
| | 115.6 |
| | 117.3 |
|
| Operating income | | $ | 625.6 |
| | $ | 629.5 |
| | $ | 648.9 |
|
The following table shows a breakdown of other operation and maintenance:
|
| | | | | | | | | | | | |
| | | Year Ended December 31 |
| (in millions) | | 2017 | | 2016 | | 2015 |
| Operation and maintenance not included in lines items below | | $ | 488.3 |
| | $ | 500.2 |
| | $ | 502.9 |
|
We Power (1) | | 513.0 |
| | 513.2 |
| | 510.7 |
|
Transmission (2) | | 251.9 |
| | 273.8 |
| | 272.3 |
|
Regulatory amortizations and other pass through expenses (3) | | 96.7 |
| | 96.6 |
| | 99.0 |
|
| Earnings sharing mechanism | | 0.1 |
| | 21.1 |
| | — |
|
| Other | | 8.5 |
| | 25.3 |
| | — |
|
| Total other operation and maintenance | | $ | 1,358.5 |
| | $ | 1,430.2 |
| | $ | 1,384.9 |
|
| |
(1) | Represents costs associated with the We Power generation units, including operating and maintenance, as well as the lease payments that are billed from We Power to us and then recovered in our rates. During 2017, 2016, and 2015, $535.1 million, $528.4 million, and $483.4 million, respectively, of both lease and operating and maintenance costs were billed to us, with the difference in costs billed or incurred and expenses recognized, either deferred or deducted from the regulatory asset. |
| |
(2) | The PSCW has approved escrow accounting for our ATC and MISO network transmission expenses. As a result, we defer as a regulatory asset or liability the differences between actual transmission costs and those included in rates until recovery or refund is authorized in a future rate proceeding. During 2017, 2016, and 2015, $303.8 million, $335.3 million, and $319.3 million, respectively, of costs were billed to us by transmission providers. |
| |
(3) | Regulatory amortizations and other pass through expenses are substantially offset in margins and therefore do not have a significant impact on operating income. |
The following tables provide information on delivered volumes by customer class and weather statistics:
|
| | | | | | | | | |
| | | Year Ended December 31 |
| | | MWh (in thousands) |
| Electric Sales Volumes | | 2017 | | 2016 | | 2015 |
| Customer class | | | | | | |
| Residential | | 7,648.5 |
| | 8,136.6 |
| | 7,789.3 |
|
| Small commercial and industrial | | 8,768.4 |
| | 9,061.1 |
| | 8,835.9 |
|
| Large commercial and industrial | | 8,340.3 |
| | 9,217.6 |
| | 9,492.0 |
|
| Other | | 144.9 |
| | 143.4 |
| | 147.7 |
|
| Total retail | | 24,902.1 |
| | 26,558.7 |
| | 26,264.9 |
|
| Wholesale | | 1,600.2 |
| | 1,134.2 |
| | 1,234.0 |
|
| Resale | | 8,144.5 |
| | 8,282.1 |
| | 8,577.6 |
|
| Total sales in MWh | | 34,646.8 |
| | 35,975.0 |
| | 36,076.5 |
|
|
| | |
| Wisconsin Electric Power Company | B-9 | 2017 Annual Financial Statements
|
|
| | | | | | | | | |
| | | Year Ended December 31 |
| | | Therms (in millions) |
| Natural Gas Sales Volumes | | 2017 | | 2016 | | 2015 |
| Customer class | | | | | | |
| Residential | | 344.3 |
| | 341.7 |
| | 341.2 |
|
| Commercial and industrial | | 193.4 |
| | 186.3 |
| | 194.5 |
|
| Total retail | | 537.7 |
| | 528.0 |
| | 535.7 |
|
| Transport | | 314.2 |
| | 323.8 |
| | 306.9 |
|
| Total sales in therms | | 851.9 |
| | 851.8 |
| | 842.6 |
|
|
| | | | | | | | | |
| | | Year Ended December 31 |
| | | Degree Days |
| Weather * | | 2017 | | 2016 | | 2015 |
| Heating (6,574 normal) | | 5,908 |
| | 6,068 |
| | 6,468 |
|
| Cooling (714 normal) | | 772 |
| | 991 |
| | 622 |
|
| |
| * | Normal degree days are based on a 20-year moving average of monthly temperatures from Mitchell International Airport in Milwaukee, Wisconsin. |
2017 Compared with 2016
Electric Utility Margins
Electric utility margins decreased $76.9 million during 2017, compared with 2016. The significant factors impacting the lower electric utility margins were:
| |
| • | A $74.1 million decrease related to lower sales volumes during 2017, primarily driven by unfavorable weather, lower overall retail use per customer, and the transfer of customers and their related sales to UMERC. Cooler summer and warmer winter weather in 2017, as well as an additional day of sales during 2016 due to leap year, contributed to the decrease. As measured by cooling degree days, 2017 was 22.1% cooler than 2016. As measured by heating degree days, 2017 was 2.6% warmer than 2016. |
| |
| • | A $25.9 million decrease related to SSR payments we refunded to MISO as directed by a FERC order received in October 2017. The FERC order reduced the costs eligible for reimbursement to us for the operation and maintenance of our PIPP units under an SSR agreement we have with MISO. A portion of these payments was returned to us through the MISO allocation process and reduced transmission expense as discussed below. See Note 21, Regulatory Environment, for more information. |
| |
| • | A $4.3 million decrease in margins related to the iron ore mines located in the Upper Peninsula of Michigan. In November 2016, one of the iron ore mines closed. With the return of the mines as retail customers in 2015, we continue to defer the majority of the margin from those sales and intend to apply these amounts for the benefit of Wisconsin retail electric customers in a future rate proceeding. |
| |
| • | A $3.5 million decrease in steam margins driven by the sale of the MCPP in April 2016. See Note 3, Dispositions, for more information. |
These decreases in margins were partially offset by $36.5 million of lower capacity payments to a counterparty during 2017, related to improved contract terms.
Natural Gas Utility Margins
Natural gas utility margins increased $1.5 million during 2017, compared with 2016. The most significant factor impacting the higher natural gas utility margins was higher retail sales volumes, primarily driven by higher overall retail use per customer and customer growth. The higher margins were partially offset by an additional day of sales during 2016 due to leap year.
Operating Income
Operating income at the utility segment decreased $3.9 million during 2017, compared with 2016. This decrease was driven by the $75.4 million net decrease in margins discussed above, partially offset by $71.5 million of lower operating expenses (which include other operation and maintenance, depreciation and amortization, and property and revenues taxes).
|
| | |
| Wisconsin Electric Power Company | B-10 | 2017 Annual Financial Statements
|
We experienced lower overall operating expenses related to synergy savings resulting from WEC Energy Group's acquisition of Integrys. The significant factors impacting the decrease in operating expenses during 2017, compared with 2016, were:
| |
| • | A $21.9 million decrease in transmission expenses, driven by a FERC order to reduce SSR costs related to PIPP, as discussed under electric utility margins. |
| |
| • | A $21.0 million decrease in expenses related to our earnings sharing mechanism in place. See the PSCW conditions of approval related to the Integrys acquisition in Note 2, Acquisitions, for more information. |
| |
| • | A $19.1 million decrease in electric and natural gas distribution expenses, primarily related to the transfer of electric customers and their related sales to UMERC, lower metering costs, and other cost savings. |
| |
| • | A $16.8 million decrease in expenses related to charitable projects supporting our customers and the communities within our service territories. |
These decreases in operating expenses were partially offset by a $10.9 million gain recorded in April 2016 related to the sale of the MCPP. See Note 3, Dispositions, for more information on the sale of the MCPP.
2016 Compared with 2015
Electric Utility Margins
Electric utility margins increased $48.8 million during 2016, compared with 2015. The significant factors impacting the higher electric utility margins were:
| |
| • | A $38.9 million increase related to higher retail sales volumes during 2016, primarily driven by warmer summer weather. As measured by cooling degree days, 2016 was 59.3% warmer than 2015. |
| |
| • | The expiration of $12.5 million of bill credits refunded to customers in 2015 related to the Treasury Grant we received in connection with our biomass facility. |
Natural Gas Utility Margins
Natural gas utility margins decreased $3.2 million during 2016, compared with 2015. The most significant factor impacting the lower natural gas utility margins was a decrease in sales volumes during 2016, primarily driven by warmer winter weather. As measured by heating degree days, 2016 was 6.2% warmer than 2015.
Operating Income
Operating income at the utility segment decreased $19.4 million during 2016, compared with 2015. The decrease was driven by the $65.0 million of higher operating expenses, partially offset by the $45.6 million net increase in margins discussed above.
The significant factors impacting the increase in operating expenses during 2016, compared with 2015, were:
| |
| • | A $25.3 million increase in expenses related to charitable projects supporting our customers and the communities within our service territories. |
| |
| • | A $21.4 million increase in depreciation and amortization, driven by an overall increase in utility plant in service. In November 2015, we completed the conversion of the fuel source for VAPP from coal to natural gas. |
| |
| • | A $21.1 million expense related to our earnings sharing mechanism in place, effective January 1, 2016. |
| |
| • | An $11.1 million increase in expenses related to various regulatory matters. |
These increases in operating expenses were partially offset by a $16.4 million positive impact from the sale of the MCPP in April 2016, including a gain on sale and lower operating costs in 2016.
EQUITY IN EARNINGS OF TRANSMISSION AFFILIATE
|
| | | | | | | | | | | | |
| | | Year Ended December 31 |
| (in millions) | | 2017 | | 2016 | | 2015 |
| Equity in earnings of transmission affiliate | | $ | — |
| | $ | 55.5 |
| | $ | 47.8 |
|
|
| | |
| Wisconsin Electric Power Company | B-11 | 2017 Annual Financial Statements
|
2017 Compared with 2016
At December 31, 2016, we owned approximately 23% of ATC. Effective January 1, 2017, we transferred our investment in ATC to another subsidiary of WEC Energy Group. See Note 16, Investment in American Transmission Company, for more information.
2016 Compared with 2015
Earnings from our ownership interest in ATC increased $7.7 million during 2016, compared with 2015. This increase was primarily due to the negative impact on our 2015 earnings from a decision issued by an administrative law judge in December 2015 regarding complaints related to ATC's ROE.
CONSOLIDATED OTHER INCOME, NET
|
| | | | | | | | | | | | |
| | | Year Ended December 31 |
| (in millions) | | 2017 | | 2016 | | 2015 |
| AFUDC – Equity | | $ | 3.1 |
| | $ | 4.2 |
| | $ | 5.7 |
|
| Interest income | | 2.3 |
| | 2.2 |
| | 2.2 |
|
| Other, net | | 14.3 |
| | 2.7 |
| | 3.3 |
|
| Other income, net | | $ | 19.7 |
| | $ | 9.1 |
| | $ | 11.2 |
|
2017 Compared with 2016
Other income, net increased $10.6 million during 2017, compared with 2016. The increase was driven by higher gains on property sales during 2017, compared to 2016, and the expenses we incurred in 2016 related to the disposition of certain non-utility real estate assets. These increases were partially offset by lower AFUDC during 2017.
CONSOLIDATED INTEREST EXPENSE
|
| | | | | | | | | | | | |
| | | Year Ended December 31 |
| (in millions) | | 2017 |
| 2016 |
| 2015 |
| Interest expense | | $ | 117.3 |
| | $ | 117.6 |
| | $ | 119.0 |
|
INCOME TAX EXPENSE
|
| | | | | | | | | |
| | | Year Ended December 31 |
| | | 2017 |
| 2016 |
| 2015 |
| Effective tax rate | | 36.2 | % | | 36.6 | % | | 36.0 | % |
2017 Compared with 2016
Our effective tax rate was 36.2% in 2017 compared to 36.6% in 2016. This decrease in our effective tax rate was primarily due to increased renewable energy credits related to wind projects and favorable compensation expense. Preliminarily, we expect our 2018 annual effective tax rate to be between -5% and -4%, which includes an estimated 27% effective tax rate benefit due to the flow through of tax repairs in connection with the Wisconsin settlement. See Note 21, Regulatory Environment, for more information on the Wisconsin settlement. Excluding the impact of the tax repairs, the 2018 range would be between 22% and 23%. See Note 12, Income Taxes, for more information.
2016 Compared with 2015
Our effective tax rate was 36.6% in 2016 compared with 36.0% in 2015. This increase in our effective tax rate was primarily due to Treasury Grant activity in 2015.
|
| | |
| Wisconsin Electric Power Company | B-12 | 2017 Annual Financial Statements
|
LIQUIDITY AND CAPITAL RESOURCES
CASH FLOWS
The following table summarizes our cash flows for the years ended December 31:
|
| | | | | | | | | | | | | | | | | | | | |
| (in millions) | | 2017 | | 2016 | | 2015 | | Change in 2017 Over 2016 | | Change in 2016 Over 2015 |
| Cash provided by (used in): | | | | | | | | | | |
| Operating activities | | $ | 698.0 |
| | $ | 848.4 |
| | $ | 674.4 |
| | $ | (150.4 | ) | | $ | 174.0 |
|
| Investing activities | | (568.2 | ) | | (436.8 | ) | | (520.2 | ) | | (131.4 | ) | | 83.4 |
|
| Financing activities | | (132.9 | ) | | (423.3 | ) | | (151.1 | ) | | 290.4 |
| | (272.2 | ) |
Operating Activities
2017 Compared with 2016
Net cash provided by operating activities decreased $150.4 million during 2017, compared with 2016, driven by:
| |
| • | A $171.9 million net decrease in cash related to $71.7 million of cash paid for income taxes during 2017, compared with $100.2 million of cash received during 2016. This decrease in cash was primarily due to the extension of bonus depreciation in December 2015, which resulted in the receipt of an income tax refund during 2016. |
| |
| • | A $149.8 million decrease in cash related to lower overall collections from customers during 2017, compared with 2016. Collections from customers decreased primarily because of unfavorable weather and the loss of sales from the transfer of customers to UMERC in 2017. |
| |
| • | Cash distributions provided by ATC of $38.4 million during 2016. Effective January 1, 2017, we transferred our investment in ATC to another subsidiary of WEC Energy Group. See Note 16, Investment in American Transmission Company, for more information. |
These decreases in net cash provided by operating activities were partially offset by:
| |
| • | Cash payments of $116.0 million for transfers of certain benefit-related liabilities to WBS during 2016. |
| |
| • | A $56.9 million increase in cash from lower payments for operating and maintenance costs. During 2017, our payments related to transmission, electric and natural gas distribution, and charitable projects decreased. |
| |
| • | A $32.5 million net increase in cash resulting from lower payments for fuel and purchased power due to the transfer of electric customers to UMERC. This increase in cash was partially offset by higher payments for natural gas, primarily due to higher commodity prices. The average per-unit cost of natural gas sold increased 8.9% during 2017, compared with 2016. |
2016 Compared with 2015
Net cash provided by operating activities increased $174.0 million during 2016, driven by:
| |
| • | A $158.7 million net increase in cash related to $100.2 million of cash received for income taxes during 2016, compared with $58.5 million of cash paid for income taxes during 2015. The increase in cash received was due to a federal income tax refund received in 2016, primarily the result of the extension of bonus depreciation in December 2015. |
| |
| • | A $144.2 million increase in cash resulting from lower payments for natural gas and fuel and purchased power, due to lower commodity prices and warmer weather during the 2016 heating season. The average per-unit cost of natural gas sold decreased 17.4% in 2016. |
| |
| • | A $99.6 million decrease in contributions and payments to our pension and OPEB plans during 2016, compared with 2015. |
| |
| • | A $29.1 million increase in cash due to lower collateral requirements during 2016, compared with 2015, driven by an increase in the fair value of our derivative instruments. See Note 14, Derivative Instruments, for more information. |
These increases in net cash provided by operating activities were partially offset by:
| |
| • | Cash payments of $116.0 million for transfers of certain benefit-related liabilities to WBS during 2016. |
| |
| • | A $91.6 million decrease in cash related to lower overall collections from customers. Collections from customers decreased primarily because of lower commodity prices and warmer weather during the 2016 heating season. |
| |
| • | A $55.8 million decrease in cash driven by higher payments for operating and maintenance costs during 2016. |
|
| | |
| Wisconsin Electric Power Company | B-13 | 2017 Annual Financial Statements
|
Investing Activities
2017 Compared with 2016
Net cash used in investing activities increased $131.4 million during 2017, compared with 2016, driven by:
| |
| • | A $126.6 million increase in cash paid for capital expenditures during 2017, compared with 2016, which is discussed in more detail below. |
| |
| • | Cash of $13.1 million received during 2016 related to transfers of certain software to WBS. There were no similar transfers in 2017. |
| |
| • | An $8.8 million decrease in the proceeds received from the sale of assets during 2017, compared with 2016. See Note 3, Dispositions, for more information. |
These increases in net cash used in investing activities were partially offset by $16.1 million of capital contributions paid to ATC during 2016. Effective January 1, 2017, we transferred our investment in ATC to another subsidiary of WEC Energy Group.
2016 Compared with 2015
Net cash used in investing activities decreased $83.4 million during 2016, compared with 2015, driven by:
| |
| • | A $49.7 million decrease in cash paid for capital expenditures during 2016, compared with 2015, which is discussed in more detail below. |
| |
| • | Proceeds of $31.7 million received from the sale of MCPP in April 2016. See Note 3, Dispositions, for more information. |
| |
| • | Cash received of $13.1 million during 2016 related to transfers of certain software to WBS. |
These decreases in net cash used in investing activities were partially offset by an $11.5 million increase in capital contributions to ATC during 2016, compared with 2015, driven by the continued investment in equipment and facilities by ATC to improve reliability.
Capital Expenditures
Capital expenditures for the years ended December 31 were as follows:
|
| | | | | | | | | | | | | | | | | | | | |
| (in millions) | | 2017 | | 2016 | | 2015 | | Change in 2017 Over 2016 | | Change in 2016 Over 2015 |
| Capital expenditures | | $ | 596.1 |
| | $ | 469.5 |
| | $ | 519.2 |
| | $ | 126.6 |
| | $ | (49.7 | ) |
2017 Compared with 2016
The increase in cash paid for capital expenditures during 2017, compared with 2016, was driven by upgrades to our electric and natural gas distribution systems, including main replacement projects and an advanced metering infrastructure program, as well as various projects at the OCPP.
See Capital Resources and Requirements – Capital Requirements – Capital Expenditures and Significant Capital Projects below for more information.
2016 Compared with 2015
The decrease in cash paid for capital expenditures during 2016 was partially related to the completion in November 2015 of the coal to natural gas conversion project at VAPP. Also contributing to the decrease were lower payments during 2016 for environmental compliance projects and electric distribution upgrades.
Financing Activities
2017 Compared with 2016
Net cash used in financing activities decreased $290.4 million during 2017, compared with 2016, driven by:
| |
| • | A $215.0 million decrease in dividends paid to our parent during 2017, compared with 2016. During 2016, we paid special dividends to our parent to balance our capital structure. |
| |
| • | A $75.0 million equity contribution received from our parent to balance our capital structure in 2017. |
| |
| • | A $36.9 million increase in net borrowings of commercial paper during 2017, compared with 2016. |
|
| | |
| Wisconsin Electric Power Company | B-14 | 2017 Annual Financial Statements
|
These decreases in net cash used in financing activities were partially offset by a $17.4 million increase in repayments provided to our parent during 2017 related to our subsidiary's note payable, compared with 2016.
2016 Compared with 2015
Net cash used in financing activities increased $272.2 million during 2016, compared with 2015, driven by:
| |
| • | A $250.0 million net decrease in cash due to the issuance of $500.0 million of long-term debt during 2015, partially offset by the repayment of $250.0 million of long-term debt during 2015. A portion of this issuance was also used to repay short-term debt during 2015. We did not issue or repay any long-term debt in 2016. |
| |
| • | A $215.0 million increase in dividends paid to our parent during 2016, compared with 2015. During 2016, we paid special dividends to our parent to balance our capital structure. |
These increases in net cash used for financing activities were partially offset by a $177.8 million net increase in cash due to $15.0 million of net borrowings of commercial paper during 2016, compared with $162.8 million of net repayments of commercial paper during 2015.
Significant Financing Activities
For more information on our financing activities, see Note 10, Short-Term Debt and Lines of Credit, and Note 11, Long-Term Debt and Capital Lease Obligations.
CAPITAL RESOURCES AND REQUIREMENTS
Capital Resources
Liquidity
We anticipate meeting our capital requirements for our existing operations through internally generated funds and short-term borrowings, supplemented by the issuance of intermediate or long-term debt securities, depending on market conditions and other factors, and equity contributions from our parent.
We currently have access to the capital markets and have been able to generate funds internally and externally to meet our capital requirements. Our ability to attract the necessary financial capital at reasonable terms is critical to our overall strategic plan. We currently believe that we have adequate capacity to fund our operations for the foreseeable future through our existing borrowing arrangements, access to capital markets, and internally generated cash.
We maintain a bank back-up credit facility, which provides liquidity support for our obligations with respect to commercial paper and for general corporate purposes. We review our bank back-up credit facility needs on an ongoing basis and expect to be able to maintain adequate credit facilities to support our operations. See Note 10, Short-Term Debt and Lines of Credit, for more information on our credit facility.
At December 31, 2017, we were in compliance with all covenants related to outstanding short-term and long-term debt. We expect to be in compliance with all such debt covenants for the foreseeable future. See Note 11, Long-Term Debt and Capital Lease Obligations, for more information on our long-term debt.
Working Capital
As of December 31, 2017, our current liabilities exceeded our current assets by $148.0 million. We do not expect this to have any impact on our liquidity since we believe we have adequate back-up lines of credit in place for our ongoing operations. We also believe that we can access the capital markets to finance our construction programs and to refinance current maturities of long-term debt, if necessary.
Credit Rating Risk
We do not have any credit agreements that would require material changes in payment schedules or terminations as a result of a credit rating downgrade. However, we have certain agreements in the form of commodity contracts and employee benefit plans that could require collateral or a termination payment in the event of a credit rating change to below BBB- at S&P Global Ratings and/or Baa3 at Moody's Investors Service. We also have other commodity contracts that, in the event of a credit rating downgrade, could result in a reduction of our unsecured credit granted by counterparties.
In addition, access to capital markets at a reasonable cost is determined in large part by credit quality. Any credit ratings downgrade could impact our ability to access capital markets.
|
| | |
| Wisconsin Electric Power Company | B-15 | 2017 Annual Financial Statements
|
In July 2017, Moody's downgraded our senior unsecured rating to A2 from A1 and affirmed our P-1 commercial paper rating. We do not believe the change in rating will have a material impact on our ability to access capital markets.
Subject to other factors affecting the credit markets as a whole, we believe our current ratings should provide a significant degree of flexibility in obtaining funds on competitive terms. However, these security ratings reflect the views of the rating agency only. An explanation of the significance of these ratings may be obtained from the rating agency. Such ratings are not a recommendation to buy, sell, or hold securities. Any rating can be revised upward or downward or withdrawn at any time by a rating agency.
If we are unable to successfully take actions to manage any adverse impacts of the Tax Legislation, or if additional interpretations, regulations, amendments or technical corrections exacerbate the adverse impacts of the Tax Legislation, the legislation could result in credit rating agencies placing our credit ratings on negative outlook or downgrading our credit ratings. Any such actions by credit rating agencies may make it more difficult and costly for us to issue future debt securities and certain other types of financing and could increase borrowing costs under our credit facility.
Capital Requirements
Contractual Obligations
We have the following contractual obligations and other commercial commitments as of December 31, 2017:
|
| | | | | | | | | | | | | | | | | | | | |
| | | Payments Due by Period (1) |
| (in millions) | | Total | | Less than 1 year | | 1-3 years | | 3-5 years | | More than 5 years |
Long-term debt obligations (2) | | $ | 4,873.3 |
| | $ | 362.8 |
| | $ | 460.8 |
| | $ | 491.3 |
| | $ | 3,558.4 |
|
Capital lease obligations (3) | | 7,878.1 |
| | 398.7 |
| | 799.9 |
| | 792.7 |
| | 5,886.8 |
|
Operating lease obligations (4) | | 34.7 |
| | 3.5 |
| | 5.3 |
| | 2.9 |
| | 23.0 |
|
Energy and transportation purchase obligations (5) | | 9,954.9 |
| | 647.0 |
| | 1,132.0 |
| | 1,105.1 |
| | 7,070.8 |
|
Purchase orders (6) | | 248.9 |
| | 42.8 |
| | 62.1 |
| | 46.7 |
| | 97.3 |
|
Pension and OPEB funding obligations (7) | | 11.9 |
| | 4.0 |
| | 7.9 |
| | — |
| | — |
|
| Total contractual obligations | | $ | 23,001.8 |
| | $ | 1,458.8 |
| | $ | 2,468.0 |
| | $ | 2,438.7 |
| | $ | 16,636.3 |
|
| |
(1) | The amounts included in the table are calculated using current market prices, forward curves, and other estimates. |
| |
(2) | Principal and interest payments on long-term debt (excluding capital lease obligations). |
| |
(3) | Capital lease obligations for power purchase commitments and the leases with We Power. |
| |
(4) | Operating lease obligations for power purchase commitments and rail car leases. |
| |
(5) | Energy and transportation purchase obligations under various contracts for the procurement of fuel, power, gas supply, and associated transportation related to utility operations. |
| |
(6) | Purchase obligations related to normal business operations, information technology, and other services. |
| |
(7) | Obligations for pension and OPEB plans cannot reasonably be estimated beyond 2020. |
The table above does not reflect estimated future payments related to the manufactured gas plant remediation liability of $18.5 million at December 31, 2017, as the amount and timing of payments are uncertain. We expect to incur costs annually to remediate these sites. See Note 19, Commitments and Contingencies, for more information about environmental liabilities.
AROs in the amount of $68.3 million are not included in the above table. Settlement of these liabilities cannot be determined with certainty, but we believe the majority of these liabilities will be settled in more than five years.
Obligations for utility operations have historically been included as part of the rate-making process and therefore are generally recoverable from customers.
|
| | |
| Wisconsin Electric Power Company | B-16 | 2017 Annual Financial Statements
|
Capital Expenditures and Significant Capital Projects
We have several capital projects that will require significant capital expenditures over the next three years and beyond. All projected capital requirements are subject to periodic review and may vary significantly from estimates, depending on a number of factors. These factors include environmental requirements, regulatory restraints and requirements, impacts from the Tax Legislation, acquisition and development opportunities, market volatility, and economic trends. Our estimated capital expenditures for the next three years are as follows:
|
| | | | |
| (in millions) | | |
| 2018 | | $ | 598.5 |
|
| 2019 | | 552.5 |
|
| 2020 | | 807.5 |
|
| Total | | $ | 1,958.5 |
|
The majority of spending consists of upgrading our electric and natural gas distribution systems to enhance reliability. These upgrades include the advanced metering infrastructure (AMI) program. AMI is an integrated system of smart meters, communication networks and data management systems that enable two-way communication between utilities and customers.
Additionally, as part of our commitment to invest in zero-carbon generation, we plan to invest in utility scale solar of up to 150 MW. Solar generation technology has greatly improved, has become more cost-effective, and it complements our summer demand curve.
Common Stock Matters
For information related to our common stock matters, see Note 8, Common Equity.
Investments in Outside Trusts
We use outside trusts to fund our pension and certain OPEB obligations. These trusts had investments of approximately $1.4 billion as of December 31, 2017. These trusts hold investments that are subject to the volatility of the stock market and interest rates. We contributed $8.3 million, $8.0 million, and $107.6 million to our pension and OPEB plans in 2017, 2016, and 2015, respectively. Future contributions to the plans will be dependent upon many factors, including the performance of existing plan assets and long-term discount rates. For additional information, see Note 15, Employee Benefits.
Off-Balance Sheet Arrangements
We are a party to various financial instruments with off-balance sheet risk as a part of our normal course of business, including letters of credit that primarily support our commodity contracts. We believe that these agreements do not have, and are not reasonably likely to have, a current or future material effect on our financial condition, changes in financial condition, revenues or expenses, results of operations, liquidity, capital expenditures, or capital resources. For additional information, see Note 10, Short-Term Debt and Lines of Credit, and Note 18, Variable Interest Entities.
FACTORS AFFECTING RESULTS, LIQUIDITY, AND CAPITAL RESOURCES
MARKET RISKS AND OTHER SIGNIFICANT RISKS
We are exposed to market and other significant risks as a result of the nature of our businesses and the environments in which those businesses operate. These risks, described in further detail below, include but are not limited to:
Regulatory Recovery
We account for our regulated operations in accordance with accounting guidance under the Regulated Operations Topic of the FASB ASC. Our rates are determined by various regulatory commissions. Our primary regulator is the PSCW. See Note 21, Regulatory Environment, for additional information regarding recent rate proceedings and orders.
Regulated entities are allowed to defer certain costs that would otherwise be charged to expense if the regulated entity believes the recovery of the costs is probable. We record regulatory assets pursuant to specific orders or by a generic order issued by our regulators. Recovery of the deferred costs in future rates is subject to the review and approval by our regulators. We assume the risks and benefits of ultimate recovery of these items in future rates. If the recovery of the deferred costs is not approved by our regulators, the costs would be charged to income in the current period. In general, our regulatory assets are recovered over a period of between one to six years. Regulators can impose liabilities on a prospective basis for amounts previously collected
|
| | |
| Wisconsin Electric Power Company | B-17 | 2017 Annual Financial Statements
|
from customers and for amounts that are expected to be refunded to customers. We record these items as regulatory liabilities. As of December 31, 2017, our regulatory assets were $1,984.9 million, and our regulatory liabilities were $1,721.1 million.
Due to the Tax Legislation signed into law in December 2017, we remeasured our deferred taxes and recorded an estimated tax benefit of $1,065 million. This tax benefit will be returned to ratepayers through future refunds, bill credits, or reductions to other regulatory assets. See Note 12, Income Taxes, and Note 21, Regulatory Environment, for more information.
Commodity Costs
In the normal course of providing energy, we are subject to market fluctuations in the costs of coal, natural gas, purchased power, and fuel oil used in the delivery of coal. We manage our fuel and natural gas supply costs through a portfolio of short and long-term procurement contracts with various suppliers for the purchase of coal, natural gas, and fuel oil. In addition, we manage the risk of price volatility through natural gas and electric hedging programs.
Embedded within our rates are amounts to recover fuel, natural gas, and purchased power costs. We have recovery mechanisms in place that allow us to recover or refund all or a portion of the changes in prudently incurred fuel, natural gas, and purchased power costs from rate case-approved amounts.
Higher commodity costs can increase our working capital requirements, result in higher gross receipts taxes, and lead to increased energy efficiency investments by our customers to reduce utility usage and/or fuel substitution. Higher commodity costs combined with slower economic conditions also expose us to greater risks of accounts receivable write-offs as more customers are unable to pay their bills. See Note 1(d), Revenues and Customer Receivables, for more information on our mechanism that allows for cost recovery or refund of uncollectible expense.
Weather
Our utility rates are based upon estimated normal temperatures. Our electric utility margins are unfavorably sensitive to below normal temperatures during the summer cooling season and, to some extent, to above normal temperatures during the winter heating season. Our natural gas utility margins are unfavorably sensitive to above normal temperatures during the winter heating season. A summary of actual weather information in our service territory during 2017, 2016 and 2015, as measured by degree days, may be found in Results of Operations.
Interest Rates
We are exposed to interest rate risk resulting from our short-term borrowings and projected near-term debt financing needs. We manage exposure to interest rate risk by limiting the amount of our variable rate obligations and continually monitoring the effects of market changes on interest rates. When it is advantageous to do so, we enter into long-term fixed rate debt.
Based on our variable rate debt outstanding at December 31, 2017, and December 31, 2016, a hypothetical increase in market interest rates of one percentage point would have increased annual interest expense by $2.1 million and $1.6 million in 2017 and 2016, respectively. This sensitivity analysis was performed assuming a constant level of variable rate debt during the period and an immediate increase in interest rates, with no other changes for the remainder of the period.
Marketable Securities Return
We use various trusts to fund our pension and OPEB obligations. These trusts invest in debt and equity securities. Changes in the market prices of these assets can affect future pension and OPEB expenses. Additionally, future contributions can also be affected by the investment returns on trust fund assets. We believe that the financial risks associated with investment returns would be partially mitigated through future rate actions by the PSCW.
The fair value of our trust fund assets and expected long-term returns were approximately:
|
| | | | | | | |
| (in millions) | | As of December 31, 2017 | | Expected Return on Assets in 2018 |
| Pension trust funds | | $ | 1,134.1 |
| | 7.00 | % |
| OPEB trust funds | | $ | 220.1 |
| | 7.25 | % |
Fiduciary oversight of the pension and OPEB trust fund investments is the responsibility of an Investment Trust Policy Committee. The Committee works with external actuaries and investment consultants on an ongoing basis to establish and monitor investment strategies and target asset allocations. Forecasted cash flows for plan liabilities are regularly updated based on annual valuation results. Target asset allocations are determined utilizing projected benefit payment cash flows and risk analyses of appropriate investments. The targeted asset allocations are intended to reduce risk, provide long-term financial stability for the plans, and maintain funded levels which meet long-term plan obligations while preserving sufficient liquidity for
|
| | |
| Wisconsin Electric Power Company | B-18 | 2017 Annual Financial Statements
|
near-term benefit payments. Investment strategies utilize a wide diversification of asset types and qualified external investment managers.
WEC Energy Group consults with its investment advisors on an annual basis to help it forecast expected long-term returns on plan assets by reviewing actual historical returns and calculating expected total trust returns using the weighted-average of long-term market returns for each of the major target asset categories utilized in the funds.
Economic Conditions
Our service territories are primarily within the state of Wisconsin. As such, we are exposed to market risks in the regional Midwest economy. In addition, any economic downturn or disruption of national or international markets could adversely affect the financial condition of our customers and demand for their products, which could affect their demand for our products.
Inflation
We continue to monitor the impact of inflation, especially with respect to the costs of medical plans, fuel, transmission access, construction costs, and regulatory and environmental compliance in order to minimize its effects in future years through pricing strategies, productivity improvements, and cost reductions. We do not believe the impact of general inflation will have a material impact on our future results of operations.
For additional information concerning risk factors, including market risks, see the Cautionary Statement Regarding Forward-Looking Information at the beginning of this report.
INDUSTRY RESTRUCTURING
Electric Utility Industry
The regulated energy industry continues to experience significant changes. The FERC continues to support large RTOs, which affects the structure of the wholesale market. To this end, MISO implemented the MISO Energy Markets, including the use of LMP to value electric transmission congestion and losses. Increased competition in the retail and wholesale markets, which may result from restructuring efforts, could have a significant and adverse financial impact on us.
Electric utility revenues in Wisconsin are regulated by the PSCW. The PSCW continues to maintain the position that the question of whether to implement electric retail competition in Wisconsin should ultimately be decided by the Wisconsin legislature. No such legislation has been introduced in Wisconsin to date, and it is uncertain when, if at all, retail choice might be implemented in Wisconsin.
Natural Gas Utility Industry
The PSCW previously instituted generic proceedings to consider how its regulation of natural gas distribution utilities should change to reflect a competitive environment in the natural gas industry. To date, the PSCW has made a policy decision to provide customer classes with competitive market choices the option to choose an alternative retail natural gas supplier. The PSCW has also adopted standards for transactions between a utility and its natural gas marketing affiliates. All of our Wisconsin customer classes have competitive market choices and, therefore, can purchase natural gas directly from either an alternative retail natural gas supplier or their local natural gas utility.
We offer natural gas transportation services to our customers that elect to purchase natural gas from an alternative retail natural gas supplier. Since these transportation customers continue to use our distribution systems to transport natural gas to their facilities, we earn distribution revenues from them. As such, there is little impact on our net income from customers purchasing natural gas from an alternative retail natural gas supplier as natural gas costs are passed through to customers in rates on a one-for-one basis. Currently, we are unable to predict the impact of potential future industry restructuring on our results of operations or financial position.
ENVIRONMENTAL MATTERS
See Note 19, Commitments and Contingencies, for a discussion of certain environmental matters affecting us, including rules and regulations relating to air quality, water quality, land quality, and climate change.
|
| | |
| Wisconsin Electric Power Company | B-19 | 2017 Annual Financial Statements
|
OTHER MATTERS
Tax Cuts and Jobs Act of 2017
On December 22, 2017, the Tax Legislation was signed into law. See Note 12, Income Taxes, and Note 21, Regulatory Environment, for more information regarding its impact on us.
Bonus Depreciation Provisions
Bonus depreciation is an additional amount of first-year tax deductible depreciation that is awarded above what would normally be available. Based on the Protecting Americans from Tax Hikes Act of 2015, a 50% bonus depreciation deduction was available for assets placed in service during 2017. The increase in our federal tax depreciation from this deduction significantly reduced our 2017 federal income tax payment.
On December 22, 2017, the Tax Legislation was signed into law. This legislation modified the bonus depreciation deduction available for public utility property subject to rate-making by a government entity or public utility commission. See Note 12, Income Taxes, for more information.
CRITICAL ACCOUNTING POLICIES AND ESTIMATES
Preparation of financial statements and related disclosures in compliance with GAAP requires the application of appropriate technical accounting rules and guidance, as well as the use of estimates. The application of these policies necessarily involves judgments regarding future events, including the likelihood of success of particular projects, legal and regulatory challenges and anticipated recovery of costs. These judgments, in and of themselves, could materially impact the financial statements and disclosures based on varying assumptions. In addition, the financial and operating environment may also have a significant effect, not only on the operation of our business, but on our results reported through the application of accounting measures used in preparing the financial statements and related disclosures, even if the nature of the accounting policies applied have not changed.
The following is a list of accounting policies that are most significant to the portrayal of our financial condition and results of operations and that require management's most difficult, subjective or complex judgments:
Long-Lived Assets
We periodically assess the recoverability of certain long-lived assets when factors indicate the carrying value of such assets may be impaired or such assets are planned to be sold. These assessments require significant assumptions and judgments by management. The long-lived assets assessed for impairment generally include certain assets within regulated operations that may not be fully recovered from our customers as a result of regulatory decisions that will be made in the future.
We have evaluated future plans for our older fossil fuel generating units and have announced our plans for the retirement of certain older and less-efficient generating units. When it becomes probable that a generating unit will be retired before the end of its useful life, we assess whether the generating unit meets the criteria for abandonment accounting. Generating units that are considered probable of abandonment are expected to cease operations in the near term, significantly before the end of their original estimated useful lives. As a result, the remaining net book value of these assets can be significant. If a generating unit meets applicable criteria to be considered probable of abandonment, we assess the likelihood of recovery of the remaining carrying value of that generating unit at the end of each reporting period. If it becomes probable that regulators will not allow full recovery as well as a return on the remaining net book value of the abandoned generating unit, an impairment charge may be required. An impairment charge would be recorded if the remaining carrying value of the abandoned generating unit is greater than the present value of the amount expected to be recovered from ratepayers.
We concluded that Pleasant Prairie power plant and PIPP met the criteria to be considered probable of abandonment as of December 31, 2017. We plan to ask for full cost recovery of and a full return on the remaining book value of the generating units and have concluded that no impairment was required related to these assets as of December 31, 2017.
See Note 6, Property, Plant, and Equipment, for more information on the units to be retired.
Pension and Other Postretirement Employee Benefits
The costs of providing non-contributory defined pension benefits and OPEB, described in Note 15, Employee Benefits, are dependent upon numerous factors resulting from actual plan experience and assumptions of future experience.
Pension and OPEB costs are impacted by actual employee demographics (including age, compensation levels, and employment periods), the level of contributions made to the plans, and earnings on plan assets. Pension and OPEB costs may also be
|
| | |
| Wisconsin Electric Power Company | B-20 | 2017 Annual Financial Statements
|
significantly affected by changes in key actuarial assumptions, including anticipated rates of return on plan assets, mortality and discount rates, and expected health care cost trends. Changes made to the plan provisions may also impact current and future pension and OPEB costs.
Pension and OPEB plan assets are primarily made up of equity and fixed income investments. Fluctuations in actual equity and fixed income market returns, as well as changes in general interest rates, may result in increased or decreased benefit costs in future periods. We believe that such changes in costs would be recovered or refunded through the ratemaking process.
The following table shows how a given change in certain actuarial assumptions would impact the projected benefit obligation and the reported net periodic pension cost. Each factor below reflects an evaluation of the change based on a change in that assumption only.
|
| | | | | | | | | | |
Actuarial Assumption (in millions, except percentages) | | Percentage-Point Change in Assumption | | Impact on Projected Benefit Obligation | | Impact on 2017 Pension Cost |
| Discount rate | | (0.5) | | $ | 68.9 |
| | $ | 5.0 |
|
| Discount rate | | 0.5 | | (60.2 | ) | | (4.2 | ) |
| Rate of return on plan assets | | (0.5) | | N/A |
| | 5.5 |
|
| Rate of return on plan assets | | 0.5 | | N/A |
| | (5.5 | ) |
The following table shows how a given change in certain actuarial assumptions would impact the accumulated OPEB obligation and the reported net periodic OPEB cost. Each factor below reflects an evaluation of the change based on a change in that assumption only.
|
| | | | | | | | | | |
Actuarial Assumption (in millions, except percentages) | | Percentage-Point Change in Assumption | | Impact on Postretirement Benefit Obligation | | Impact on 2017 Postretirement Benefit Cost |
| Discount rate | | (0.5) | | $ | 22.6 |
| | $ | 0.6 |
|
| Discount rate | | 0.5 | | (19.9 | ) | | (0.1 | ) |
| Health care cost trend rate | | (0.5) | | (12.4 | ) | | (1.2 | ) |
| Health care cost trend rate | | 0.5 | | 14.3 |
| | 1.4 |
|
| Rate of return on plan assets | | (0.5) | | N/A |
| | 1.0 |
|
| Rate of return on plan assets | | 0.5 | | N/A |
| | (1.0 | ) |
The discount rates are selected based on hypothetical bond portfolios consisting of noncallable (or callable with make-whole provisions), noncollateralized, high-quality corporate bonds across the full maturity spectrum. The bonds are generally rated "Aa" with a minimum amount outstanding of $50.0 million. From the hypothetical bond portfolios, a single rate is determined that equates the market value of the bonds purchased to the discounted value of the plans' expected future benefit payments.
We establish our expected return on asset assumption based on consideration of historical and projected asset class returns, as well as the target allocations of the benefit trust portfolios. The assumed long-term rate of return on pension plan assets was 7.00% in 2017, 2016, and 2015. The actual rate of return on pension plan assets, net of fees, was 11.48%, 6.91%, and (0.6)%, in 2017, 2016, and 2015, respectively.
In selecting assumed health care cost trend rates, past performance and forecasts of health care costs are considered. For more information on health care cost trend rates and a table showing future payments that we expect to make for our pension and OPEB, see Note 15, Employee Benefits.
Regulatory Accounting
Our utility operations follow the guidance under the Regulated Operations Topic of the FASB ASC. Our financial statements reflect the effects of the ratemaking principles followed by the jurisdictions regulating us. Certain items that would otherwise be immediately recognized as revenues and expenses are deferred as regulatory assets and regulatory liabilities for future recovery or refund to customers, as authorized by our regulators.
Future recovery of regulatory assets is not assured and is generally subject to review by regulators in rate proceedings for matters such as prudence and reasonableness. Once approved, the regulatory assets and liabilities are amortized into earnings over the rate recovery period. If recovery or refund of costs is not approved or is no longer considered probable, these regulatory assets or liabilities are recognized in current period earnings. Management regularly assesses whether these regulatory assets and liabilities are probable of future recovery or refund by considering factors such as changes in the regulatory environment, earnings from our electric and natural gas utility operations, and the status of any pending or potential deregulation legislation.
|
| | |
| Wisconsin Electric Power Company | B-21 | 2017 Annual Financial Statements
|
The application of the Regulated Operations Topic of the FASB ASC would be discontinued if all or a separable portion of our utility operations no longer met the criteria for application. Our regulatory assets and liabilities would be written off to income as an unusual or infrequently occurring item in the period in which discontinuation occurred. As of December 31, 2017, we had $1,984.9 million in regulatory assets and $1,721.1 million in regulatory liabilities. See Note 5, Regulatory Assets and Liabilities, for more information.
Unbilled Revenues
We record utility operating revenues when energy is delivered to our customers. However, the determination of energy sales to individual customers is based upon the reading of their meters, which occurs on a systematic basis throughout the month. At the end of each month, amounts of energy delivered to customers since the date of their last meter reading are estimated and corresponding unbilled revenues are calculated. This unbilled revenue is estimated each month based upon actual generation and throughput volumes, recorded sales, estimated customer usage by class, weather factors, estimated line losses, and applicable customer rates. Significant fluctuations in energy demand for the unbilled period or changes in the composition of customer classes could impact the accuracy of the unbilled revenue estimate. Total utility operating revenues during 2017 of approximately $3.7 billion included accrued utility revenues of $217.5 million as of December 31, 2017.
Income Tax Expense
We are required to estimate income taxes for each of the jurisdictions in which we operate as part of the process of preparing consolidated financial statements. This process involves estimating current income tax liabilities together with assessing temporary differences resulting from differing treatment of items, such as depreciation, for income tax and accounting purposes. These differences result in deferred income tax assets and liabilities, which are included within our balance sheets. We also assess the likelihood that our deferred income tax assets will be recovered through future taxable income. To the extent we believe that realization is not likely, we establish a valuation allowance, which is offset by an adjustment to the provision for income taxes in our income statements.
Uncertainty associated with the application of tax statutes and regulations and the outcomes of tax audits and appeals requires that judgments and estimates be made in the accrual process and in the calculation of effective tax rates. Only income tax benefits that meet the "more likely than not" recognition threshold may be recognized or continue to be recognized. Unrecognized tax benefits are re-evaluated quarterly and changes are recorded based on new information, including the issuance of relevant guidance by the courts or tax authorities and developments occurring in the examinations of our tax returns.
Significant management judgment is required in determining our provision for income taxes, deferred income tax assets and liabilities, the liability for unrecognized tax benefits, and any valuation allowance recorded against deferred income tax assets. The assumptions involved are supported by historical data, reasonable projections, and interpretations of applicable tax laws and regulations across multiple taxing jurisdictions. Significant changes in these assumptions could have a material impact on our financial condition and results of operations. See Note 1(l), Income Taxes, and Note 12, Income Taxes, for a discussion of accounting for income taxes.
QUANTITATIVE AND QUALITATIVE DISCLOSURES ABOUT MARKET RISK
See Management's Discussion and Analysis of Financial Condition and Results of Operations – Factors Affecting Results, Liquidity, and Capital Resources – Market Risks and Other Significant Risks, as well as Note 1(m), Fair Value Measurements, and Note 1(n), Derivative Instruments, for information concerning potential market risks to which we are exposed.
|
| | |
| Wisconsin Electric Power Company | B-22 | 2017 Annual Financial Statements
|
WISCONSIN ELECTRIC POWER COMPANY
CONSOLIDATED INCOME STATEMENTS
|
| | | | | | | | | | | | |
| Year Ended December 31 | | | | | | |
| (in millions) | | 2017 | | 2016 | | 2015 |
| Operating revenues | | $ | 3,711.7 |
| | $ | 3,792.8 |
| | $ | 3,854.1 |
|
| | | | | | | |
| Operating expenses | | | | | | |
| Cost of sales | | 1,286.4 |
| | 1,292.1 |
| | 1,399.0 |
|
| Other operation and maintenance | | 1,358.5 |
| | 1,430.2 |
| | 1,384.9 |
|
| Depreciation and amortization | | 331.6 |
| | 325.4 |
| | 304.0 |
|
| Property and revenue taxes | | 109.6 |
| | 115.6 |
| | 117.3 |
|
| Total operating expenses | | 3,086.1 |
| | 3,163.3 |
| | 3,205.2 |
|
| | | | | | | |
| Operating income | | 625.6 |
| | 629.5 |
| | 648.9 |
|
| | | | | | | |
| Equity in earnings of transmission affiliate | | — |
| | 55.5 |
| | 47.8 |
|
| Other income, net | | 19.7 |
| | 9.1 |
| | 11.2 |
|
| Interest expense | | 117.3 |
| | 117.6 |
| | 119.0 |
|
| Other expense | | (97.6 | ) | | (53.0 | ) | | (60.0 | ) |
| | | | | | | |
| Income before income taxes | | 528.0 |
| | 576.5 |
| | 588.9 |
|
| Income tax expense | | 191.2 |
| | 211.0 |
| | 212.0 |
|
| Net income | | 336.8 |
| | 365.5 |
| | 376.9 |
|
| | | | | | | |
| Preferred stock dividend requirements | | 1.2 |
| | 1.2 |
| | 1.2 |
|
| Net income attributed to common shareholder | | $ | 335.6 |
| | $ | 364.3 |
| | $ | 375.7 |
|
The accompanying Notes to Consolidated Financial Statements are an integral part of these financial statements.
|
| | |
| Wisconsin Electric Power Company | B-23 | 2017 Annual Financial Statements
|
WISCONSIN ELECTRIC POWER COMPANY
CONSOLIDATED BALANCE SHEETS
|
| | | | | | | | |
| At December 31 | | | | |
| (in millions, except share and per share amounts) | | 2017 | | 2016 |
| Assets | | | | |
| Current assets | | | | |
| Cash and cash equivalents | | $ | 12.3 |
| | $ | 15.4 |
|
| Accounts receivable and unbilled revenues, net of reserves of $39.5 and $40.9, respectively | | 513.8 |
| | 503.2 |
|
| Accounts receivable from related parties | | 109.1 |
| | 58.2 |
|
| Materials, supplies, and inventories | | 250.7 |
| | 271.0 |
|
| Prepayments | | 144.3 |
| | 138.0 |
|
| Other | | 9.4 |
| | 24.6 |
|
| Current assets | | 1,039.6 |
| | 1,010.4 |
|
| | | | | |
| Long-term assets | | | | |
| Property, plant, and equipment, net of accumulated depreciation of $3,741.8 and $3,619.6, respectively | | 10,007.7 |
| | 9,832.3 |
|
| Regulatory assets | | 1,984.9 |
| | 2,036.6 |
|
| Equity investment in transmission affiliate | | — |
| | 402.0 |
|
| Other | | 89.4 |
| | 90.2 |
|
| Long-term assets | | 12,082.0 |
| | 12,361.1 |
|
| Total assets | | $ | 13,121.6 |
| | $ | 13,371.5 |
|
| | | | | |
| Liabilities and Equity | | | | |
| Current liabilities | | | | |
| Short-term debt | | $ | 210.9 |
| | $ | 159.0 |
|
| Current portion of long-term debt | | 250.0 |
| | — |
|
| Current portion of capital lease obligations | | 42.5 |
| | 28.5 |
|
| Subsidiary note payable to WEC Energy Group | | — |
| | 18.5 |
|
| Accounts payable | | 329.3 |
| | 297.9 |
|
| Accounts payable to related parties | | 131.5 |
| | 112.9 |
|
| Accrued payroll and benefits | | 53.4 |
| | 51.8 |
|
| Accrued taxes | | 58.2 |
| | 46.0 |
|
| Other | | 111.8 |
| | 100.1 |
|
| Current liabilities | | 1,187.6 |
| | 814.7 |
|
| | | | | |
| Long-term liabilities | | | | |
| Long-term debt | | 2,412.3 |
| | 2,661.1 |
|
| Capital lease obligations | | 2,823.8 |
| | 2,756.5 |
|
| Deferred income taxes | | 1,155.5 |
| | 2,333.3 |
|
| Regulatory liabilities | | 1,708.0 |
| | 853.9 |
|
| Pension and OPEB obligations | | 143.2 |
| | 167.6 |
|
| Other | | 276.9 |
| | 260.2 |
|
| Long-term liabilities | | 8,519.7 |
| | 9,032.6 |
|
| | | | | |
| Commitments and contingencies (Note 19) | |
| |
|
| | | | | |
| Common shareholder's equity | | | | |
| Common stock - $10 par value; 65,000,000 shares authorized; 33,289,327 shares outstanding | | 332.9 |
| | 332.9 |
|
| Additional paid in capital | | 802.7 |
| | 1,020.1 |
|
| Retained earnings | | 2,248.3 |
| | 2,140.8 |
|
| Common shareholder's equity | | 3,383.9 |
| | 3,493.8 |
|
| | | | | |
| Preferred stock | | 30.4 |
| | 30.4 |
|
| Total liabilities and equity | | $ | 13,121.6 |
| | $ | 13,371.5 |
|
The accompanying Notes to Consolidated Financial Statements are an integral part of these financial statements.
|
| | |
| Wisconsin Electric Power Company | B-24 | 2017 Annual Financial Statements
|
WISCONSIN ELECTRIC POWER COMPANY
CONSOLIDATED STATEMENTS OF CASH FLOWS
|
| | | | | | | | | | | | |
| Year Ended December 31 | | | | | | |
| (in millions) | | 2017 | | 2016 | | 2015 |
| Operating activities | | | | | | |
| Net income | | $ | 336.8 |
| | $ | 365.5 |
| | $ | 376.9 |
|
| Reconciliation to cash provided by operating activities | | | | | | |
| Depreciation and amortization | | 331.6 |
| | 325.4 |
| | 323.7 |
|
| Deferred income taxes and investment tax credits, net | | 109.7 |
| | 206.2 |
| | 178.9 |
|
| Contributions and payments related to pension and OPEB plans | | (8.3 | ) | | (8.0 | ) | | (107.6 | ) |
| Equity income in transmission affiliate, net of distributions | | — |
| | (17.2 | ) | | (4.9 | ) |
| Payments for liabilities transferred to WBS | | (0.3 | ) | | (116.0 | ) | | — |
|
| Change in – | | | | | | |
| Accounts receivable and unbilled revenues | | (64.9 | ) | | (59.0 | ) | | (2.9 | ) |
| Materials, supplies, and inventories | | 20.3 |
| | 30.6 |
| | 18.8 |
|
| Prepaid taxes | | 0.5 |
| | 39.4 |
| | (2.8 | ) |
| Other current assets | | (11.8 | ) | | 9.3 |
| | 0.3 |
|
| Accounts payable | | 45.8 |
| | 31.3 |
| | (5.9 | ) |
| Accrued taxes | | 12.8 |
| | 30.4 |
| | (42.1 | ) |
| Other current liabilities | | 12.2 |
| | 10.7 |
| | (1.2 | ) |
| Other, net | | (86.4 | ) | | (0.2 | ) | | (56.8 | ) |
| Net cash provided by operating activities | | 698.0 |
| | 848.4 |
| | 674.4 |
|
| | | | | | | |
| Investing activities | | | | | | |
| Capital expenditures | | (596.1 | ) | | (469.5 | ) | | (519.2 | ) |
| Capital contributions to transmission affiliate | | — |
| | (16.1 | ) | | (4.6 | ) |
| Proceeds from the sale of assets | | 22.9 |
| | 31.7 |
| | 0.2 |
|
| Proceeds from assets transferred to WBS | | — |
| | 13.1 |
| | — |
|
| Other, net | | 5.0 |
| | 4.0 |
| | 3.4 |
|
| Net cash used in investing activities | | (568.2 | ) | | (436.8 | ) | | (520.2 | ) |
| | | | | | | |
| Financing activities | | | | | | |
| Change in short-term debt | | 51.9 |
| | 15.0 |
| | (162.8 | ) |
| Repayment of subsidiary note to parent | | (18.5 | ) | | (1.1 | ) | | (2.9 | ) |
| Issuance of long-term debt | | — |
| | — |
| | 500.0 |
|
| Retirement of long-term debt | | — |
| | — |
| | (250.0 | ) |
| Equity contribution from parent | | 75.0 |
| | — |
| | — |
|
| Payment of dividends to parent | | (240.0 | ) | | (455.0 | ) | | (240.0 | ) |
| Payment of preferred stock dividends | | (1.2 | ) | | (1.2 | ) | | (1.2 | ) |
| Other, net | | (0.1 | ) | | 19.0 |
| | 5.8 |
|
| Net cash used in financing activities | | (132.9 | ) | | (423.3 | ) | | (151.1 | ) |
| | | | | | | |
| Net change in cash and cash equivalents | | (3.1 | ) | | (11.7 | ) | | 3.1 |
|
| Cash and cash equivalents at beginning of year | | 15.4 |
| | 27.1 |
| | 24.0 |
|
| Cash and cash equivalents at end of year | | $ | 12.3 |
| | $ | 15.4 |
| | $ | 27.1 |
|
The accompanying Notes to Consolidated Financial Statements are an integral part of these financial statements.
|
| | |
| Wisconsin Electric Power Company | B-25 | 2017 Annual Financial Statements
|
WISCONSIN ELECTRIC POWER COMPANY
CONSOLIDATED STATEMENTS OF EQUITY
|
| | | | | | | | | | | | | | | | | | | | | | | | |
| | | Wisconsin Electric Power Company Common Shareholder's Equity | | | | |
| | | Common Stock | | Additional Paid-In Capital | | Retained Earnings | | Total Common Shareholder's Equity | | Preferred Stock | | Total Equity |
| (in millions) | | | | | | |
| Balance at December 31, 2014 | | $ | 332.9 |
| | $ | 984.4 |
| | $ | 2,095.5 |
| | $ | 3,412.8 |
| | $ | 30.4 |
| | $ | 3,443.2 |
|
| Net income | | — |
| | — |
| | 376.9 |
| | 376.9 |
| | — |
| | 376.9 |
|
| Dividends | | | | | | | | | | | | |
| Common stock | | — |
| | — |
| | (240.0 | ) | | (240.0 | ) | | — |
| | (240.0 | ) |
| Preferred stock | | — |
| | — |
| | (1.2 | ) | | (1.2 | ) | | — |
| | (1.2 | ) |
| Tax benefit of exercised stock options allocated from parent | | — |
| | 12.1 |
| | — |
| | 12.1 |
| | — |
| | 12.1 |
|
| Stock-based compensation and other | | — |
| | 3.2 |
| | 0.2 |
| | 3.4 |
| | — |
| | 3.4 |
|
| Balance at December 31, 2015 | | $ | 332.9 |
| | $ | 999.7 |
| | $ | 2,231.4 |
| | $ | 3,564.0 |
| | $ | 30.4 |
| | $ | 3,594.4 |
|
| Net income | | — |
| | — |
| | 365.5 |
| | 365.5 |
| | — |
| | 365.5 |
|
| Dividends | | | | | | | | | | | | |
| Common stock | | — |
| | — |
| | (455.0 | ) | | (455.0 | ) | | — |
| | (455.0 | ) |
| Preferred stock | | — |
| | — |
| | (1.2 | ) | | (1.2 | ) | | — |
| | (1.2 | ) |
| Tax benefit of exercised stock options allocated from parent | | — |
| | 19.3 |
| | — |
| | 19.3 |
| | — |
| | 19.3 |
|
| Stock-based compensation and other | | — |
| | 1.1 |
| | 0.1 |
| | 1.2 |
| | — |
| | 1.2 |
|
| Balance at December 31, 2016 | | $ | 332.9 |
| | $ | 1,020.1 |
| | $ | 2,140.8 |
| | $ | 3,493.8 |
| | $ | 30.4 |
| | $ | 3,524.2 |
|
| Net income | | — |
| | — |
| | 336.8 |
| | 336.8 |
| | — |
| | 336.8 |
|
| Dividends | | | | | | | | | | | | |
| Common stock | | — |
| | — |
| | (240.0 | ) | | (240.0 | ) | | — |
| | (240.0 | ) |
| Preferred stock | | — |
| | — |
| | (1.2 | ) | | (1.2 | ) | | — |
| | (1.2 | ) |
| Cumulative effect adjustment from adoption of ASU 2016-09 | | — |
| | — |
| | 11.9 |
| | 11.9 |
| | — |
| | 11.9 |
|
| Equity contribution from parent | | — |
| | 75.0 |
| | — |
| | 75.0 |
| | — |
| | 75.0 |
|
| Transfer of net assets to UMERC | | — |
| | (61.1 | ) | | — |
| | (61.1 | ) | | — |
| | (61.1 | ) |
| Transfer of ATC ownership interest and related taxes | | — |
| | (228.6 | ) | | — |
| | (228.6 | ) | | — |
| | (228.6 | ) |
| Settlement of a short-term note receivable between Bostco and our parent company | | — |
| | (4.8 | ) | | — |
| | (4.8 | ) | | — |
| | (4.8 | ) |
| Stock-based compensation and other | | — |
| | 2.1 |
| | — |
| | 2.1 |
| | — |
| | 2.1 |
|
| Balance at December 31, 2017 | | $ | 332.9 |
| | $ | 802.7 |
| | $ | 2,248.3 |
| | $ | 3,383.9 |
| | $ | 30.4 |
| | $ | 3,414.3 |
|
The accompanying Notes to Consolidated Financial Statements are an integral part of these financial statements.
|
| | |
| Wisconsin Electric Power Company | B-26 | 2017 Annual Financial Statements
|
WISCONSIN ELECTRIC POWER COMPANY
CONSOLIDATED STATEMENTS OF CAPITALIZATION
|
| | | | | | | | | | | | |
At December 31 (in millions) | | | | | | 2017 | | 2016 |
| Common shareholder's equity (see accompanying statement) | | 3,383.9 |
| | 3,493.8 |
|
| Preferred stock (Note 9) | | 30.4 |
| | 30.4 |
|
| Long-term debt | | Interest Rate | | Year Due | | | | |
| Debentures (unsecured) | | 1.70% | | 2018 | | 250.0 |
| | 250.0 |
|
| | | 4.25% | | 2019 | | 250.0 |
| | 250.0 |
|
| | | 2.95% | | 2021 | | 300.0 |
| | 300.0 |
|
| | | 3.10% | | 2025 | | 250.0 |
| | 250.0 |
|
| | | 6.50% | | 2028 | | 150.0 |
| | 150.0 |
|
| | | 5.625% | | 2033 | | 335.0 |
| | 335.0 |
|
| | | 5.70% | | 2036 | | 300.0 |
| | 300.0 |
|
| | | 3.65% | | 2042 | | 250.0 |
| | 250.0 |
|
| | | 4.25% | | 2044 | | 250.0 |
| | 250.0 |
|
| | | 4.30% | | 2045 | | 250.0 |
| | 250.0 |
|
| | | 6.875% | | 2095 | | 100.0 |
| | 100.0 |
|
| Note (secured, nonrecourse) | | 4.81% | | 2030 | | — |
| | 2.0 |
|
| Obligations under capital leases | | | | | | 2,866.3 |
| | 2,785.0 |
|
| Total | | | | | | 5,551.3 |
| | 5,472.0 |
|
| Unamortized debt issuance costs | | | | | | (3.2 | ) | | (3.6 | ) |
| Unamortized discount, net | | | | | | (19.5 | ) | | (22.3 | ) |
| Total long-term debt and capital lease obligations, including current portion | | | | | | 5,528.6 |
| | 5,446.1 |
|
| Current portion of long-term debt and capital lease obligations | | | | | | (292.5 | ) | | (28.5 | ) |
| Total long-term debt and capital lease obligations | | | | | | 5,236.1 |
| | 5,417.6 |
|
| Total long-term capitalization | | | | | | $ | 8,650.4 |
| | $ | 8,941.8 |
|
The accompanying Notes to Consolidated Financial Statements are an integral part of these financial statements.
|
| | |
| Wisconsin Electric Power Company | B-27 | 2017 Annual Financial Statements
|
WISCONSIN ELECTRIC POWER COMPANY
NOTES TO CONSOLIDATED FINANCIAL STATEMENTS
NOTE 1—SUMMARY OF SIGNIFICANT ACCOUNTING POLICIES
(a) Nature of Operations—On June 29, 2015, our parent company, Wisconsin Energy Corporation, acquired Integrys and changed its name to WEC Energy Group, Inc. See Note 2, Acquisitions, for more information on this acquisition.
We are an electric, natural gas, and steam utility company that serves electric customers in Wisconsin and an iron ore mine owned by Tilden in the Upper Peninsula of Michigan, natural gas customers in Wisconsin, and steam customers in metropolitan Milwaukee, Wisconsin.
In December 2016, both the MPSC and the PSCW approved the operation of UMERC as a stand-alone utility in the Upper Peninsula of Michigan, and it became operational effective January 1, 2017. This utility holds the electric assets previously held by us and the electric and natural gas distribution assets previously held by WPS, located in the Upper Peninsula of Michigan. The existing contract between us and Tilden will remain in place until a new power generation solution for the region is commercially operational, which is expected to occur in 2019.
As used in these notes, the term "financial statements" refers to the consolidated financial statements. This includes the income statements, balance sheets, statements of cash flows, statements of equity, and statements of capitalization, unless otherwise noted.
Through December 31, 2017, we had one wholly owned subsidiary, Bostco. At December 31, 2016, Bostco had total assets of $24.4 million. In March 2017, we sold substantially all of the remaining assets of Bostco. See Note 3, Dispositions, for more information. The financial statements include our accounts and the accounts of our wholly owned subsidiary. The cost method of accounting is used for investments when we do not have significant influence over the operating and financial policies of the investee. Investments in companies not controlled by us, but over which we have significant influence regarding the operating and financial policies of the investee, are accounted for using the equity method.
(b) Basis of Presentation—We prepare our financial statements in conformity with GAAP. We make estimates and assumptions that affect the reported amounts of assets and liabilities, the disclosure of contingent assets and liabilities at the date of the financial statements, and the reported amounts of revenues and expenses during the reporting period. Actual results may differ from these estimates.
(c) Cash and Cash Equivalents—Cash and cash equivalents include marketable debt securities with an original maturity of three months or less.
(d) Revenues and Customer Receivables—We recognize revenues related to the sale of energy on the accrual basis and include estimated amounts for services provided but not yet billed to customers.
We present revenues net of pass-through taxes on the income statements.
Below is a summary of the significant mechanisms we had in place that allowed us to recover or refund changes in prudently incurred costs from rate case-approved amounts:
| |
| • | Fuel and purchased power costs were recovered from customers on a one-for-one basis by our Wisconsin wholesale electric operations and our Michigan retail electric operations. |
| |
| • | Our retail electric rates in Wisconsin are established by the PSCW and include base amounts for fuel and purchased power costs. The electric fuel rules set by the PSCW allow us to defer, for subsequent rate recovery or refund, under- or over-collections of actual fuel and purchased power costs that exceed a 2% price variance from the costs included in the rates charged to customers. We monitor the deferral of under-collected costs to ensure that it does not cause us to earn a greater ROE than authorized by the PSCW. |
| |
| • | We received payments from MISO under an SSR agreement for our PIPP units through February 1, 2015. We recorded revenue for these payments to recover costs for operating and maintaining these units. See Note 21, Regulatory Environment, for more information. |
| |
| • | Our natural gas utility rates included a one-for-one recovery mechanism for natural gas commodity costs. We defer any difference between actual natural gas costs incurred and costs recovered through rates as a current asset or liability. The deferred balance is returned to or recovered from customers at intervals throughout the year. |
|
| | |
| Wisconsin Electric Power Company | B-28 | 2017 Annual Financial Statements
|
| |
| • | Our residential rates included a mechanism for cost recovery or refund of uncollectible expense based on the difference between actual uncollectible write-offs and the amounts recovered in rates. |
Revenues are also impacted by other accounting policies related to our participation in the MISO Energy Markets. We sell and purchase power in the MISO Energy Markets, which operate under both day-ahead and real-time markets. We record energy transactions in the MISO Energy Markets on a net basis for each hour. If we were a net seller in a particular hour, the net amount was reported as operating revenues. If we were a net purchaser in a particular hour, the net amount was recorded as cost of sales on our income statements.
We provide regulated electric, natural gas, and steam service to customers in Wisconsin and to Tilden located in the Upper Peninsula of Michigan, and provided electric service to other customers in the Upper Peninsula of Michigan through December 31, 2016. See Note 4, Related Parties, and Note 21, Regulatory Environment, for information regarding the transfer of our customers located in the Upper Peninsula of Michigan to UMERC as of January 1, 2017. The geographic concentration of our customers did not contribute significantly to our overall exposure to credit risk. We periodically review customers' credit ratings, financial statements, and historical payment performance and require them to provide collateral or other security as needed. Our credit risk exposure is mitigated by our recovery mechanism for uncollectible expense discussed above. As a result, we did not have any significant concentrations of credit risk at December 31, 2017. In addition, there were no customers that accounted for more than 10% of our revenues for the year ended December 31, 2017.
(e) Materials, Supplies, and Inventories—Our inventory as of December 31 consisted of:
|
| | | | | | | | |
| (in millions) | | 2017 | | 2016 |
| Materials and supplies | | $ | 140.7 |
| | $ | 148.1 |
|
| Fossil fuel | | 74.8 |
| | 91.1 |
|
| Natural gas in storage | | 35.2 |
| | 31.8 |
|
| Total | | $ | 250.7 |
| | $ | 271.0 |
|
Substantially all materials and supplies, fossil fuel, and natural gas in storage inventories are recorded using the weighted-average cost method of accounting.
(f) Regulatory Assets and Liabilities—The economic effects of regulation can result in regulated companies recording costs and revenues that have been or are expected to be allowed in the rate-making process in a period different from the period in which the costs or revenues would be recognized by a nonregulated company. When this occurs, regulatory assets and regulatory liabilities are recorded on the balance sheet. Regulatory assets represent probable future revenues associated with certain costs or liabilities that have been deferred and are expected to be recovered through rates charged to customers. Regulatory liabilities represent amounts that are expected to be refunded to customers in future rates or amounts that are collected in rates for future costs.
Recovery or refund of regulatory assets and liabilities is based on specific periods determined by the regulators or occurs over the normal operating period of the assets and liabilities to which they relate. If at any reporting date a previously recorded regulatory asset is no longer probable of recovery, the regulatory asset is reduced to the amount considered probable of recovery with the reduction charged to expense in the reporting period the determination is made. See Note 5, Regulatory Assets and Liabilities, for more information.
(g) Property, Plant, and Equipment—We record property, plant, and equipment at cost. Cost includes material, labor, overhead, and both debt and equity components of AFUDC. Additions to and significant replacements of property are charged to property, plant, and equipment at cost; minor items are charged to other operation and maintenance expense. The cost of depreciable utility property less salvage value is charged to accumulated depreciation when property is retired.
We record straight-line depreciation expense over the estimated useful life of utility property using depreciation rates approved by the PSCW and MPSC that include estimates for salvage value and removal costs. Depreciation as a percent of average depreciable utility plant was 2.95%, 3.00%, and 3.01% in 2017, 2016, and 2015, respectively.
We capitalize certain costs related to software developed or obtained for internal use and record these costs to amortization expense over the estimated useful life of the related software, which ranges from 5 to 15 years. If software is retired prior to being fully amortized, the difference is recorded as a loss on the income statement.
For assets other than our regulated assets and leased equipment, we accrue depreciation expense at straight-line rates over the estimated useful lives of the assets, or over the non-cancellable lease term for leased equipment.
|
| | |
| Wisconsin Electric Power Company | B-29 | 2017 Annual Financial Statements
|
Third parties reimburse us for all or a portion of expenditures for certain capital projects. Such contributions in aid of construction costs are recorded as a reduction to property, plant, and equipment.
See Note 6, Property, Plant, and Equipment, for more information.
(h) Allowance for Funds Used During Construction—AFUDC is included in utility plant accounts and represents the cost of borrowed funds (AFUDC – Debt) used during plant construction, and a return on shareholders' capital (AFUDC – Equity) used for construction purposes. AFUDC – Debt is recorded as a reduction of interest expense, and AFUDC – Equity is recorded in other income, net.
Approximately 50% of our retail jurisdictional CWIP expenditures are subject to the AFUDC calculation. Our average AFUDC retail rates were 8.45% for 2017, 2016, and 2015. Our average AFUDC wholesale rates were 5.94%, 2.73%, and 1.72% for 2017, 2016, and 2015, respectively.
We recorded the following AFUDC for the years ended December 31:
|
| | | | | | | | | | | | |
| (in millions) | | 2017 | | 2016 | | 2015 |
| AFUDC – Debt | | $ | 1.2 |
| | $ | 1.7 |
| | $ | 2.2 |
|
| AFUDC – Equity | | $ | 3.1 |
| | $ | 4.2 |
| | $ | 5.7 |
|
(i) Asset Retirement Obligations—We recognize, at fair value, legal obligations associated with the retirement of long-lived assets that result from the acquisition, construction, development, and normal operation of the assets. An ARO liability is recorded, when incurred, for these obligations as long as the fair value can be reasonably estimated, even if the timing or method of settling the obligation is unknown. The associated retirement costs are capitalized as part of the related long-lived asset and are depreciated over the useful life of the asset. The ARO liabilities are accreted each period using the credit-adjusted risk-free interest rates associated with the expected settlement dates of the AROs. These rates are determined when the obligations are incurred. Subsequent changes resulting from revisions to the timing or the amount of the original estimate of undiscounted cash flows are recognized as an increase or a decrease to the carrying amount of the liability and the associated retirement costs. We recognize regulatory assets or liabilities for the timing differences between when we recover an ARO in rates and when we recognize the associated retirement costs. See Note 7, Asset Retirement Obligations, for more information.
(j) Asset Impairment—We periodically assess the recoverability of certain long-lived assets when factors indicate the carrying value of such assets may be impaired or such assets are planned to be sold. These assessments require significant assumptions and judgments by management. The long-lived assets assessed for impairment generally include certain assets within regulated operations that may not be fully recovered from our customers as a result of regulatory decisions that will be made in the future.
When it becomes probable that a generating unit will be retired before the end of its useful life, we assess whether the generating unit meets the criteria for abandonment accounting. Generating units that are considered probable of abandonment are expected to cease operations in the near term, significantly before the end of their original estimated useful lives. If a generating unit meets applicable criteria to be considered probable of abandonment, we assess the likelihood of recovery of the remaining carrying value of that generating unit at the end of each reporting period. If it becomes probable that regulators will not allow full recovery as well as a return on the remaining net book value of the abandoned generating unit, an impairment charge may be required. An impairment charge would be recorded if the remaining carrying value of the abandoned generating unit is greater than the present value of the amount expected to be recovered from ratepayers. See Note 6, Property, Plant, and Equipment, for more information.
(k) Stock-Based Compensation—Our employees participate in the WEC Energy Group stock-based compensation plans. In accordance with the WEC Energy Group shareholder approved Omnibus Stock Incentive Plan, WEC Energy Group provides long-term incentives through its equity interests to its non-employee directors, selected officers, and other key employees. The plan provides for the granting of stock options, restricted stock, performance shares, and other stock-based awards. Awards may be paid in WEC Energy Group common stock, cash, or a combination thereof. The number of shares of WEC Energy Group common stock authorized for issuance under the plan is 34.3 million.
Stock-based compensation expense is allocated to us based on the outstanding awards held by our employees and our allocation of labor costs. Awards classified as equity awards are measured based on their grant-date fair value. Awards classified as liability awards are recorded at fair value each reporting period.
In March 2016, the FASB issued ASU 2016-09, Improvements to Employee Share-Based Payment Accounting, which modifies certain aspects of the accounting for stock-based compensation awards. This ASU became effective for us on January 1, 2017. Under the new guidance, all excess tax benefits and tax deficiencies are recognized as income tax expense or benefit in the
|
| | |
| Wisconsin Electric Power Company | B-30 | 2017 Annual Financial Statements
|
income statement on a prospective basis. Prior to January 1, 2017, these amounts were recorded in additional paid in capital on the balance sheet, and excess tax benefits could only be recognized to the extent they reduced taxes payable. In the first quarter of 2017, we recorded an $11.9 million cumulative-effect adjustment to increase retained earnings for excess tax benefits that had not been recognized in prior years as they did not reduce taxes payable.
ASU 2016-09 also requires excess tax benefits to be classified as an operating activity on the statement of cash flows. As we have elected to apply this provision on a prospective basis, the prior year amounts will continue to be reflected as a financing activity. As allowed under this ASU, we have also elected to account for forfeitures as they occur, rather than estimating potential future forfeitures and recording them over the vesting period.
As we did not record any excess tax benefits in 2017, adoption of ASU 2016-09 had no impact on our financial statements other than the cumulative-effect adjustment discussed above.
Stock Options
Our employees are granted WEC Energy Group non-qualified stock options that generally vest on a cliff-basis after a three-year period. The exercise price of a stock option under the plan cannot be less than 100% of the fair market value of WEC Energy Group common stock on the grant date. Historically, all stock options have been granted with an exercise price equal to the fair market value of WEC Energy Group common stock on the date of the grant. Options may not be exercised within six months of the grant date except in the event of a change in control. Options expire no later than 10 years from the date of grant.
WEC Energy Group stock options are classified as equity awards. The fair value of each stock option was calculated using a binomial option-pricing model. The following table shows the estimated weighted-average fair value per stock option granted to our employees along with the weighted-average assumptions used in the valuation models:
|
| | | | | | | | | | | | |
| | | 2017 |
| 2016 |
| 2015 |
| Stock options granted * | | 80,770 |
| | 92,880 |
| | 495,550 |
|
| | | | | | | |
| Estimated weighted-average fair value per stock option | | $ | 7.12 |
| | $ | 4.92 |
| | $ | 5.29 |
|
| | | | | | | |
| Assumptions used to value the options: | | | | | | |
| Risk-free interest rate | | 0.7% – 2.5% |
| | 0.5% – 2.2% |
| | 0.1% – 2.1% |
|
| Dividend yield | | 3.5 | % | | 4.0 | % | | 3.7 | % |
| Expected volatility | | 19.0 | % | | 18.0 | % | | 18.0 | % |
| Expected life (years) | | 6.2 |
| | 5.8 |
| | 5.8 |
|
| |
| * | Effective January 1, 2016, certain employees were transferred into WBS. See Note 4, Related Parties, for more information. |
The risk-free interest rate was based on the United States Treasury interest rate with a term consistent with the expected life of the stock options. The dividend yield was based on WEC Energy Group's dividend rate at the time of the grant and historical stock prices. Expected volatility and expected life assumptions were based on WEC Energy Group's historical experience.
Restricted Shares
WEC Energy Group restricted shares granted to our employees have a three-year vesting period with one-third of the award vesting on each anniversary of the grant date. The restricted shares are classified as equity awards.
Performance Units
Officers and other key employees are granted performance units under the WEC Energy Group Performance Unit Plan. Under the plan, the ultimate number of units that will be awarded is dependent on WEC Energy Group's total shareholder return (stock price appreciation plus dividends) as compared to the total shareholder return of a peer group of companies over a three-year period, and beginning in 2017, other performance metrics as determined by the Compensation Committee. Participants may earn between 0% and 175% of the base performance unit award, as adjusted pursuant to the terms of the plan. Performance units granted on or after January 1, 2016 also accrue forfeitable dividend equivalents in the form of additional performance units.
All grants of performance units are settled in cash and are accounted for as liability awards accordingly. The fair value of the performance units reflects our estimate of the final expected value of the awards, which is based on WEC Energy Group's stock price and performance achievement under the terms of the award. Stock-based compensation costs are recorded over the three-year performance period.
See Note 8, Common Equity, for more information on WEC Energy Group's stock-based compensation plans.
|
| | |
| Wisconsin Electric Power Company | B-31 | 2017 Annual Financial Statements
|
(l) Income Taxes—We follow the liability method in accounting for income taxes. Accounting guidance for income taxes requires the recording of deferred assets and liabilities to recognize the expected future tax consequences of events that have been reflected in our financial statements or tax returns and the adjustment of deferred tax balances to reflect tax rate changes. We are required to assess the likelihood that our deferred tax assets would expire before being realized. If we conclude that certain deferred tax assets are likely to expire before being realized, a valuation allowance would be established against those assets. GAAP requires that, if we conclude in a future period that it is more likely than not that some or all of the deferred tax assets would be realized before expiration, we reverse the related valuation allowance in that period. Any change to the allowance, as a result of a change in judgment about the realization of deferred tax assets, is reported in income tax expense.
Investment tax credits associated with regulated operations are deferred and amortized over the life of the assets. We are included in WEC Energy Group's consolidated Federal and state income tax returns. In accordance with our tax allocation agreement with WEC Energy Group, we are allocated income tax payments and refunds based upon our separate tax computation. See Note 12, Income Taxes, for more information.
We recognize interest and penalties accrued related to unrecognized tax benefits in income tax expense in our income statements.
(m) Fair Value Measurements—Fair value is the price that would be received to sell an asset or paid to transfer a liability in an orderly transaction between market participants at the measurement date (exit price).
Fair value accounting rules provide a fair value hierarchy that prioritizes the inputs used to measure fair value. The hierarchy gives the highest priority to unadjusted quoted prices in active markets for identical assets or liabilities (Level 1 measurement) and the lowest priority to unobservable inputs (Level 3 measurement). The three levels of the fair value hierarchy are defined as follows:
Level 1 – Quoted prices are available in active markets for identical assets or liabilities as of the reporting date. Active markets are those in which transactions for the asset or liability occur in sufficient frequency and volume to provide pricing information on an ongoing basis.
Level 2 – Pricing inputs are observable, either directly or indirectly, but are not quoted prices included within Level 1. Level 2 includes those financial instruments that are valued using external inputs within models or other valuation methods.
Level 3 – Pricing inputs include significant inputs that are generally less observable from objective sources. These inputs may be used with internally developed methods that result in management's best estimate of fair value. Level 3 instruments include those that may be more structured or otherwise tailored to customers' needs.
Assets and liabilities are classified in their entirety based on the lowest level of input that is significant to the fair value measurement. We use a mid-market pricing convention (the mid-point price between bid and ask prices) as a practical measure for valuing certain derivative assets and liabilities. We primarily use a market approach for recurring fair value measurements and attempt to use valuation techniques that maximize the use of observable inputs and minimize the use of unobservable inputs.
When possible, we base the valuations of our derivative assets and liabilities on quoted prices for identical assets and liabilities in active markets. These valuations are classified in Level 1. The valuations of certain contracts not classified as Level 1 may be based on quoted market prices received from counterparties and/or observable inputs for similar instruments. Transactions valued using these inputs are classified in Level 2. Certain derivatives are categorized in Level 3 due to the significance of unobservable or internally-developed inputs.
We recognize transfers between levels of the fair value hierarchy at their value as of the end of the reporting period.
Due to the short-term nature of cash and cash equivalents, net accounts receivable and unbilled revenues, accounts payable, and short-term debt, the carrying amount of each such item approximates fair value. The fair value of our preferred stock is estimated based on the quoted market value for the same issue, or by using a dividend discount model. The fair value of our long-term debt is estimated based upon the quoted market value for the same or similar issues. The fair values of long-term debt and preferred stock are categorized within Level 2 of the fair value hierarchy.
See Note 13, Fair Value Measurements, for more information.
(n) Derivative Instruments—We use derivatives as part of our risk management program to manage the risks associated with the price volatility of purchased power, generation, and natural gas costs for the benefit of our customers. Our approach is non-speculative and designed to mitigate risk. Our regulated hedging programs are approved by the PSCW.
|
| | |
| Wisconsin Electric Power Company | B-32 | 2017 Annual Financial Statements
|
We record derivative instruments on our balance sheets as assets or liabilities measured at fair value, unless they qualify for the normal purchases and sales exception, and are so designated. We continually assess our contracts designated as normal and will discontinue the treatment of these contracts as normal if the required criteria are no longer met. Changes in the derivative's fair value are recognized currently in earnings unless specific hedge accounting criteria are met or we receive regulatory treatment for the derivative. For most energy related physical and financial contracts in our regulated operations that qualify as derivatives, the PSCW allows the effects of fair value accounting to be offset to regulatory assets and liabilities.
We classify derivative assets and liabilities as current or long-term on our balance sheets based on the maturities of the underlying contracts. Realized gains and losses on derivative instruments are primarily recorded in cost of sales on our income statements. Cash flows from derivative activities are presented in the same category as the item being hedged within operating activities on our statements of cash flows.
Derivative accounting rules provide the option to present certain asset and liability derivative positions net on the balance sheets and to net the related cash collateral against these net derivative positions. We elected not to net these items. On our balance sheets, cash collateral provided to others is reflected in other current assets, and cash collateral received is reflected in other current liabilities. See Note 14, Derivative Instruments, for more information.
(o) Employee Benefits—The costs of pension and OPEB plans are expensed over the periods during which employees render service. These costs are distributed among WEC Energy Group's subsidiaries based on current employment status and actuarial calculations, as applicable. Our regulators allow recovery in rates for our net periodic benefit cost calculated under GAAP. See Note 15, Employee Benefits, for more information.
(p) Customer Deposits and Credit Balances—When utility customers apply for new service, they may be required to provide a deposit for the service. Customer deposits are recorded within other current liabilities on our balance sheets.
Utility customers can elect to be on a budget plan. Under this type of plan, a monthly installment amount is calculated based on estimated annual usage. During the year, the monthly installment amount is reviewed by comparing it to actual usage. If necessary, an adjustment is made to the monthly amount. Annually, the budget plan is reconciled to actual annual usage. Payments in excess of actual customer usage are recorded within other current liabilities on our balance sheets.
(q) Environmental Remediation Costs—We are subject to federal and state environmental laws and regulations that in the future may require us to pay for environmental remediation at sites where we have been, or may be, identified as a potentially responsible party. Loss contingencies may exist for the remediation of hazardous substances at various potential sites, including coal combustion product landfill sites and manufactured gas plant sites. See Note 7, Asset Retirement Obligations, for more information regarding coal combustion product landfill sites and Note 19, Commitments and Contingencies, for more information regarding manufactured gas plant sites.
We record environmental remediation liabilities when site assessments indicate remediation is probable and we can reasonably estimate the loss or a range of losses. The estimate includes both our share of the liability and any additional amounts that will not be paid by other potentially responsible parties or the government. When possible, we estimate costs using site-specific information but also consider historical experience for costs incurred at similar sites. Remediation efforts for a particular site generally extend over a period of several years. During this period, the laws governing the remediation process may change, as well as site conditions, potentially affecting the cost of remediation.
We have received approval to defer certain environmental remediation costs, as well as estimated future costs, through a regulatory asset. The recovery of deferred costs is subject to the PSCW's approval.
We review our estimated costs of remediation annually for our manufactured gas plant sites and coal combustion product landfill sites. We adjust the liabilities and related regulatory assets, as appropriate, to reflect the new cost estimates. Any material changes in cost estimates are adjusted throughout the year.
NOTE 2—ACQUISITIONS
Parent Company's Acquisition of Natural Gas Storage Facilities in Michigan
On June 30, 2017, our parent company completed the acquisition of Bluewater for $226.0 million. Bluewater owns natural gas storage facilities in Michigan that will provide a portion of the current storage needs for our natural gas utility operations. In September 2017, we entered into a long-term service agreement with a wholly owned subsidiary of Bluewater to take the allocated storage, which was then approved by the PSCW in November 2017. See Note 21, Regulatory Environment, for more information.
|
| | |
| Wisconsin Electric Power Company | B-33 | 2017 Annual Financial Statements
|
Parent Company's Acquisition of Integrys
On June 29, 2015, our parent company acquired 100% of the outstanding common shares of Integrys and changed its name to WEC Energy Group, Inc. Integrys is a provider of regulated natural gas and electricity, as well as nonregulated renewable energy.
The acquisition was subject to the approvals of various government agencies, including the PSCW. Approvals were obtained from all agencies subject to several conditions. The PSCW order includes the following conditions:
| |
| • | We are subject to an earnings sharing mechanism for three years beginning January 1, 2016. Under the earnings sharing mechanism, if we earn over our authorized rate of return, 50% of the first 50 basis points of additional utility earnings will be shared with customers and will reduce our transmission escrow. All utility earnings above the first 50 basis points will be solely used to reduce the transmission escrow. For the years ended December 31, 2017 and 2016, we recorded $0.1 million and $21.1 million of expense related to this earnings sharing mechanism, respectively. |
| |
| • | Any future electric generation projects affecting Wisconsin ratepayers submitted by WEC Energy Group or its subsidiaries will first consider the extent to which existing intercompany resources can meet energy and capacity needs. In September 2015, we and WPS filed a joint integrated resource plan with the PSCW for our combined loads, which indicated that no new generation was needed at the time. |
In 2015, we recorded $6.6 million of severance expense that resulted from employee reductions related to the post-acquisition integration. The severance expense was recorded in our utility segment and is included in the other operation and maintenance line item on the income statements. Severance expense incurred after 2015 was not significant. Severance payments made during 2017 were not significant. Severance payments of $4.6 million and $1.2 million were made during 2016 and 2015, respectively. The severance accrual on our balance sheets at December 31, 2017 and 2016 related to the acquisition of Integrys was not significant.
NOTE 3—DISPOSITIONS
Utility Segment
Sale of Milwaukee County Power Plant
In April 2016, we sold the MCPP steam generation and distribution assets, located in Wauwatosa, Wisconsin. MCPP primarily provided steam to the Milwaukee Regional Medical Center hospitals and other campus buildings. During the second quarter of 2016, we recorded a pre-tax gain on the sale of $10.9 million ($6.5 million after tax), which was included in other operation and maintenance on our income statements. The assets included in the sale were not material and, therefore, were not presented as held for sale. The results of operations of this plant remained in continuing operations through the sale date as the sale did not represent a shift in our corporate strategy and did not have a major effect on our operations and financial results.
Other Segment
Sale of Bostco Real Estate Holdings
In March 2017, we sold the remaining real estate holdings of Bostco located in downtown Milwaukee, Wisconsin, which included retail, office, and residential space. During the first quarter of 2017, we recorded an insignificant gain on the sale, which was included in other income, net on our income statements. The assets included in the sale were not material and, therefore, were not presented as held for sale. The results of operations associated with these assets remained in continuing operations through the sale date as the sale did not represent a shift in our corporate strategy and did not have a major effect on our operations and financial results.
NOTE 4—RELATED PARTIES
We routinely enter into transactions with related parties, including WEC Energy Group, its other subsidiaries, ATC, and other affiliated entities.
We provide and receive services, property, and other items of value to and from our parent, WEC Energy Group, and other subsidiaries of WEC Energy Group.
Following the acquisition of Integrys by Wisconsin Energy Corporation on June 29, 2015, an AIA (Non-WBS AIA) went into effect. The Non-WBS AIA governed the provision and receipt of services by WEC Energy Group's subsidiaries, except that WBS continued to provide services to Integrys and its subsidiaries only under the existing WBS AIAs. WBS provided services to WEC
|
| | |
| Wisconsin Electric Power Company | B-34 | 2017 Annual Financial Statements
|
Energy Group and the former Wisconsin Energy Corporation subsidiaries, including us, under interim WBS AIAs. The PSCW and all other relevant state commissions approved the Non-WBS AIA or granted appropriate waivers related to the Non-WBS AIA.
Services under the Non-WBS AIA were subject to various pricing methodologies. All services provided by any regulated subsidiary to another regulated subsidiary were priced at cost. All services provided by any regulated subsidiary to any nonregulated subsidiary were priced at the greater of cost or fair market value. All services provided by any nonregulated subsidiary to any regulated subsidiary were priced at the lesser of cost or fair market value. All services provided by any regulated or nonregulated subsidiary to WBS were priced at cost.
WBS provided several categories of services (including financial, human resource, and administrative services) to us pursuant to the interim WBS AIAs, which were approved, or from which we were granted appropriate waivers, by the appropriate regulators, including the PSCW. As required by FERC regulations for centralized service companies, WBS renders services at cost. The PSCW must be notified prior to making changes to the services offered under and the allocation methods specified in the interim WBS AIAs. Other modifications or amendments to the interim WBS AIAs would require PSCW approval. Recovery of allocated costs is addressed in our rate cases.
A new AIA took effect January 1, 2017. The new agreement replaced the previous agreements. The pricing methodology and services under this new agreement are substantially identical to those under the agreements that were replaced. All of the applicable state commissions approved modifications to the new AIA to incorporate WEC Energy Group's acquisition of Bluewater. See Note 2, Acquisitions, for more information on the acquisition.
Effective January 1, 2016, 485 of our employees were transferred into WBS. In connection with this transfer of employees, certain benefit-related liabilities were also transferred to WBS. In addition, we transferred certain software assets to WBS in 2016.
Bostco, our consolidated subsidiary, had a note payable to our parent company, WEC Energy Group. The balance of this note payable was $18.5 million at December 31, 2016, which was paid off in the first half of 2017.
In connection with the sale of Bostco’s remaining real estate holdings, Wispark, a subsidiary of WEC Energy Group, provided $7.0 million of financing to the buyer and established a corresponding note receivable. Bostco had a $7.0 million related party receivable from Wispark that was paid in April 2017. See Note 3, Dispositions, for more information on the real estate sale.
Effective January 1, 2017, based upon input we received from the PSCW, we transferred our $415.4 million investment in ATC, and the related receivable for distributions approved and recorded in December 2016, to another subsidiary of WEC Energy Group. In addition, we transferred $186.8 million of related deferred income tax liabilities. These transactions were non-cash equity transfers recorded to additional paid in capital between entities under common control, and therefore, did not result in the recognition of a gain or loss.
We pay ATC for transmission and other related services it provides. In addition, we provide a variety of operational, maintenance, and project management work for ATC, which is reimbursed by ATC. Services are billed to and from ATC under agreements approved by the PSCW, at each of our fully allocated costs.
Our balance sheets included the following receivables and payables related to transactions entered into with ATC:
|
| | | | | | | | |
| (in millions) | | 2017 | | 2016 |
| Accounts receivable | | | | |
| Services provided to ATC | | $ | 0.8 |
| | $ | 1.1 |
|
| Accounts payable | | | | |
| Services received from ATC | | 22.2 |
| | 20.0 |
|
|
| | |
| Wisconsin Electric Power Company | B-35 | 2017 Annual Financial Statements
|
The following table shows activity associated with our related party transactions for the years ended December 31:
|
| | | | | | | | | | | | |
| (in millions) | | 2017 | | 2016 | | 2015 |
| Lease agreements | | |
| | |
| | |
|
Lease payments to We Power (1) | | $ | 420.5 |
| | $ | 412.2 |
| | $ | 410.5 |
|
| CWIP billed to We Power | | 57.3 |
| | 37.9 |
| | 58.8 |
|
Transactions with WBS (2) | | | | | | |
Billings to WBS (3) | | 255.7 |
| | 213.8 |
| | 11.1 |
|
Billings from WBS (4) | | 215.4 |
| | 310.6 |
| | 1.3 |
|
Transactions with WPS (2) | | | | | | |
|
| Natural gas purchases from WPS | | 1.6 |
| | 1.9 |
| | 0.4 |
|
| Billings to WPS | | 28.2 |
| | 9.0 |
| | 13.4 |
|
| Billings from WPS | | 4.5 |
| | 4.2 |
| | 4.9 |
|
| Transactions with WG | | | | | | |
|
| Natural gas purchases from WG | | 5.3 |
| | 5.3 |
| | 5.3 |
|
| Billings to WG | | 64.0 |
| | 60.6 |
| | 79.4 |
|
| Billings from WG | | 23.1 |
| | 21.5 |
| | 23.5 |
|
Transactions with UMERC (5) | | | | | | |
| Electric sales to UMERC | | 30.8 |
| | — |
| | — |
|
Billings to UMERC (2) | | 125.5 |
| | — |
| | — |
|
Transactions with Bluewater (6) | | | | | | |
| Storage service fees | | 2.7 |
| | — |
| | — |
|
| Transactions with ATC | | | | | | |
| Charges to ATC for services and construction | | 10.9 |
| | 10.0 |
| | 9.7 |
|
| Charges from ATC for network transmission services | | 241.4 |
| | 247.8 |
| | 238.5 |
|
| Refund from ATC per FERC ROE order | | (19.4 | ) | | — |
| | — |
|
| |
(1) | We make lease payments to We Power, another subsidiary of WEC Energy Group, for PWGS Units 1 and 2 and ERGS Units 1 and 2. |
| |
(2) | Includes amounts billed for services, pass through costs, and other items in accordance with the approved AIAs. |
| |
(3) | Includes $1.2 million, for the transfer of certain benefit-related liabilities from WBS for the year ended December 31, 2017. For the year ended December 31, 2016, includes $13.1 million for the transfer of certain software assets to WBS. There were no transfers of assets to WBS during the year ended December 31, 2017, and there were no transfers of liabilities from WBS for the year ended December 31, 2016. |
| |
(4) | For the year ended December 31, 2017 and 2016, includes $1.5 million and $116.0 million, respectively, for the transfer of certain benefit-related liabilities to WBS. |
| |
(5) | UMERC became operational effective January 1, 2017. See below for more information. |
| |
(6) | The acquisition of Bluewater was completed on June 30, 2017. See below for more information. |
Upper Michigan Energy Resources Corporation
In December 2016, both the MPSC and the PSCW approved the operation of UMERC as a stand-alone utility in the Upper Peninsula of Michigan. UMERC, a subsidiary of WEC Energy Group, became operational effective January 1, 2017, and we transferred customers and property, plant, and equipment as of that date. See Note 21, Regulatory Environment, for more information. We transferred approximately 27,500 retail electric customers and 50 electric distribution-only customers to UMERC, along with approximately 2,500 miles of electric distribution lines. We also transferred related electric distribution substations in the Upper Peninsula of Michigan and all property rights for the distribution assets to UMERC. The book value of net assets, including the related deferred income tax liabilities, transferred to UMERC from us as of January 1, 2017, was $61.1 million. This transaction was a non-cash equity transfer recorded to additional paid in capital between entities under common control, and therefore, did not result in the recognition of a gain or loss. UMERC currently meets its market obligations through power purchase agreements with us and WPS.
NOTE 5—REGULATORY ASSETS AND LIABILITIES
We recorded a $1,065 million change in our deferred taxes due to the enactment of the Tax Legislation, which resulted in both an increase to income tax related regulatory liabilities as well as a decrease to certain existing income tax related regulatory assets represented in Income tax related items in the table below. The $1,065 million change in our deferred taxes represents our estimate of the tax benefit that will be returned to ratepayers through future refunds, bill credits, or reductions in other regulatory assets. See Note 12, Income Taxes, for more information on the Tax Legislation.
|
| | |
| Wisconsin Electric Power Company | B-36 | 2017 Annual Financial Statements
|
The following regulatory assets were reflected on our balance sheets as of December 31:
|
| | | | | | | | | | |
| (in millions) | | 2017 | | 2016 | | See Note |
Regulatory assets (1) (2) | | | | | | |
| Plant related – capital leases | | $ | 801.3 |
| | $ | 724.8 |
| | 11 |
Unrecognized pension and OPEB costs (3) | | 484.4 |
| | 520.3 |
| | 15 |
| SSR | | 298.9 |
| | 188.1 |
| | 21 |
| Electric transmission costs | | 220.7 |
| | 231.9 |
| | 21 |
We Power generation (4) | | 71.3 |
| | 54.1 |
| | |
| AROs | | 41.4 |
| | 39.7 |
| | 7 |
Environmental remediation costs (5) | | 30.4 |
| | 29.9 |
| | 19 |
Energy efficiency programs (6) | | 28.2 |
| | 38.5 |
| | |
| Income tax related items | | — |
| | 200.8 |
| | 12 |
| Other, net | | 8.3 |
| | 8.5 |
| | |
| Total regulatory assets | | $ | 1,984.9 |
| | $ | 2,036.6 |
| | |
| |
(1) | Based on prior and current rate treatment, we believe it is probable that we will continue to recover from customers the regulatory assets in the table. |
| |
(2) | As of December 31, 2017, we had $11.4 million of regulatory assets not earning a return and $254.0 million of regulatory assets earning a return based on short-term interest rates. The regulatory assets not earning a return relate to certain environmental remediation costs, the recovery of which depends on the timing of the actual expenditures. The other regulatory assets in the table either earn a return or the cash has not yet been expended, in which case the regulatory assets are offset by liabilities. |
| |
(3) | Represents the unrecognized future pension and OPEB costs resulting from actuarial gains and losses on defined benefit and OPEB plans. We are authorized recovery of this regulatory asset over the average remaining service life of each plan. |
| |
(4) | Represents amounts recoverable from customers related to our costs of the generating units leased from We Power, including subsequent capital additions. See Note 11, Long-Term Debt and Capital Lease Obligations, for more information on the Tax Legislation impacts on the lease payments. |
| |
(5) | As of December 31, 2017, we had not yet made cash expenditures for $18.5 million of these environmental remediation costs. |
| |
(6) | Represents amounts recoverable from customers related to programs designed to meet energy efficiency standards. |
The following regulatory liabilities were reflected on our balance sheets as of December 31:
|
| | | | | | | | | | |
| (in millions) | | 2017 | | 2016 | | See Note |
| Regulatory liabilities | | | | | | |
| 2017 Tax Legislation impact and income tax related | | $ | 849.1 |
| | $ | — |
| | 12 |
Removal costs (1) | | 730.0 |
| | 722.9 |
| | |
Mines deferral (2) | | 95.1 |
| | 70.2 |
| | |
| Other, net | | 46.9 |
| | 71.0 |
| | |
| Total regulatory liabilities | | $ | 1,721.1 |
| | $ | 864.1 |
| | |
| | | | | | | |
| Balance Sheet Presentation | | | | | | |
| Current liabilities | | $ | 13.1 |
| | $ | 10.2 |
| | |
| Regulatory liabilities | | 1,708.0 |
| | 853.9 |
| | |
| Total regulatory liabilities | | $ | 1,721.1 |
| | $ | 864.1 |
| | |
| |
(1) | Represents amounts collected from customers to cover the cost of future removal of property, plant, and equipment. |
| |
(2) | Represents the deferral of revenues less the associated cost of sales related to the mines, which were not included in the 2015 rate order. We intend to request that this deferral be applied for the benefit of Wisconsin retail electric customers in a future rate proceeding. |
|
| | |
| Wisconsin Electric Power Company | B-37 | 2017 Annual Financial Statements
|
NOTE 6—PROPERTY, PLANT, AND EQUIPMENT
Property, plant, and equipment consisted of the following utility and non-utility and other assets at December 31:
|
| | | | | | | | |
| (in millions) | | 2017 | | 2016 |
Utility property, plant, and equipment (1) | | $ | 9,870.7 |
| | $ | 11,232.9 |
|
| Less: Accumulated depreciation | | 2,970.3 |
| | 3,606.9 |
|
| Net | | 6,900.4 |
| | 7,626.0 |
|
| CWIP | | 159.5 |
| | 111.5 |
|
| Plant to be retired, net | | 872.7 |
| | — |
|
| Net utility property, plant, and equipment | | 7,932.6 |
| | 7,737.5 |
|
| | | | | |
| Property under capital leases | | 3,009.1 |
| | 2,898.0 |
|
| Less: Accumulated amortization | | 945.9 |
| | 837.8 |
|
| Net leased facilities | | 2,063.2 |
| | 2,060.2 |
|
| | | | | |
| Non-utility and other property, plant, and equipment | | 11.9 |
| | 46.4 |
|
| Less: Accumulated depreciation | | — |
| | 12.7 |
|
Net (2) | | 11.9 |
| | 33.7 |
|
| CWIP | | — |
| | 0.9 |
|
| Net non-utility and other property, plant, and equipment | | 11.9 |
| | 34.6 |
|
| | | | | |
| Total property, plant, and equipment | | $ | 10,007.7 |
| | $ | 9,832.3 |
|
| |
(1) | Effective January 1, 2017, we transferred 2,500 miles of electric distribution lines and related electric distribution substations in the Upper Peninsula of Michigan to UMERC. The net book value of the property, plant, and equipment we transferred to UMERC was $61.1 million. See Note 4, Related Parties, for more information. |
| |
(2) | In March 2017, we sold the remaining real estate holdings of Bostco located in downtown Milwaukee, Wisconsin, which included retail, office, and residential space. |
Utility Segment Plant to be Retired
We have evaluated future plans for our older and less efficient fossil fuel generating units and have announced our plans for the retirement of the plants identified below. The net book value of these plants was classified as plant to be retired within property, plant, and equipment on our balance sheet at December 31, 2017. In addition, severance expense in the amount of $25.8 million was recorded within the utility segment in 2017 related to these announced plant retirements.
Pleasant Prairie Power Plant
As a result of a MISO ruling in December 2017, Pleasant Prairie must be shut down no later than April 10, 2018. Because we had an obligation at December 31, 2017 to shut down the Pleasant Prairie plant in April 2018, retirement of the plant was probable at December 31, 2017. The net book value of this generating unit was $681.3 million at December 31, 2017. This amount was classified as plant to be retired within property, plant, and equipment on our balance sheet. This unit is included in rate base, and we continue to depreciate it on a straight-line basis using the composite depreciation rates approved by the PSCW. The physical dismantlement of the plant will not occur immediately. It may take several years to finalize long-term plans for the site. See Note 19, Commitments and Contingencies, for more information.
Presque Isle Power Plant
In October 2017, the MPSC approved UMERC’s application to construct and operate approximately 180 MW of natural gas-fired generation in the Upper Peninsula of Michigan. Upon receiving this approval, retirement of the PIPP generating units became probable. The new units are expected to begin commercial operation in 2019 and should allow for the retirement of PIPP no later than 2020. The net book value of these units was $191.4 million at December 31, 2017. These units are included in rate base, and we continue to depreciate them on a straight-line basis using the composite depreciation rates approved by the PSCW. The net book value of these assets was transferred from plant in service to plant to be retired. See Note 19, Commitments and Contingencies, for more information.
|
| | |
| Wisconsin Electric Power Company | B-38 | 2017 Annual Financial Statements
|
NOTE 7—ASSET RETIREMENT OBLIGATIONS
We have recorded AROs primarily for asbestos abatement at certain generation and substation facilities, the removal and dismantlement of generation facilities, and the closure of fly-ash landfills at our generation facilities. We establish regulatory assets and liabilities to record the differences between ongoing expense recognition under the ARO accounting rules and the rate-making practices for retirement costs authorized by the applicable regulators. On our balance sheets, AROs are recorded within other long-term liabilities.
The following table shows changes to our AROs during the years ended December 31:
|
| | | | | | | | | | | | | |
| (in millions) | | 2017 | | 2016 | | 2015 | |
| Balance as of January 1 | | $ | 61.5 |
| | $ | 58.7 |
| | $ | 40.5 |
| |
| Accretion | | 3.2 |
| | 3.0 |
| | 2.3 |
| |
| Additions | | 5.5 |
| (1) | — |
| | 15.9 |
| (2) |
| Liabilities settled | | (1.9 | ) | | (0.2 | ) | | — |
| |
| Balance as of December 31 | | $ | 68.3 |
| | $ | 61.5 |
| | $ | 58.7 |
| |
| |
(1) | During 2017, an ARO was recorded related to the removal and dismantlement of the Rothschild Biomass Plant. |
| |
(2) | During 2015, an ARO was recorded for the fly-ash landfills located at our generation facilities. |
NOTE 8—COMMON EQUITY
Stock-Based Compensation Plans
The following table summarizes our pre-tax stock-based compensation expense and the related tax benefit recognized in income for the years ended December 31:
|
| | | | | | | | | | | | |
| (in millions) | | 2017 | | 2016 | | 2015 |
| Stock options | | $ | 1.3 |
| | $ | 1.8 |
| | $ | 3.2 |
|
| Restricted stock | | 0.8 |
| | 1.8 |
| | 2.1 |
|
| Performance units | | 9.9 |
| | 3.9 |
| | 7.5 |
|
| Stock-based compensation expense | | $ | 12.0 |
| | $ | 7.5 |
| | $ | 12.8 |
|
| Related tax benefit | | $ | 4.8 |
| | $ | 3.0 |
| | $ | 5.1 |
|
Stock-based compensation costs capitalized during 2017, 2016, and 2015 were not significant.
Stock Options
The following is a summary of our employees' WEC Energy Group stock option activity during 2017:
|
| | | | | | | | | | | | | |
| Stock Options | | Number of Options | | Weighted-Average Exercise Price | | Weighted-Average Remaining Contractual Life (in years) | | Aggregate Intrinsic Value (in millions) |
| Outstanding as of January 1, 2017 | | 1,285,806 |
| | $ | 33.41 |
| | | | |
| Granted | | 80,770 |
| | $ | 58.31 |
| | | | |
| Exercised | | (300,064 | ) | | $ | 25.54 |
| | | | |
| Transferred | | 129,635 |
| | $ | 35.48 |
| | | | |
| Outstanding as of December 31, 2017 | | 1,196,147 |
| | $ | 37.29 |
| | 4.6 | | $ | 34.9 |
|
| Exercisable as of December 31, 2017 | | 971,547 |
| | $ | 33.43 |
| | 3.8 | | $ | 32.1 |
|
The aggregate intrinsic value of outstanding and exercisable options in the above table represents the total pre-tax intrinsic value that would have been received by the option holders had they exercised all of their options on December 31, 2017. This is calculated as the difference between WEC Energy Group's closing stock price on December 31, 2017, and the option exercise price, multiplied by the number of in-the-money stock options. The intrinsic value of options exercised during the years ended December 31, 2017, 2016, and 2015 was $11.2 million, $14.1 million, and $34.6 million, respectively. Cash received by WEC Energy Group from exercises of its options by our employees was $7.7 million, $12.1 million, and $29.2 million during the years ended December 31, 2017, 2016, and 2015, respectively. The actual tax benefit from option exercises for the same periods was approximately $4.5 million, $5.6 million, and $14.0 million, respectively.
As of December 31, 2017, we expected to recognize approximately $0.9 million of unrecognized compensation cost related to unvested and outstanding WEC Energy Group stock options over the next 1.7 years on a weighted-average basis.
|
| | |
| Wisconsin Electric Power Company | B-39 | 2017 Annual Financial Statements
|
During the first quarter of 2018, the Compensation Committee awarded 81,730 non-qualified WEC Energy Group stock options with an exercise price of $66.02 and a weighted-average grant date fair value of $7.26 per option to certain of our officers and other key employees under its normal schedule of awarding long-term incentive compensation.
Restricted Shares
The following is a summary of our employees' WEC Energy Group restricted stock activity during 2017:
|
| | | | | | | |
| Restricted Shares | | Number of Shares | | Weighted-Average Grant Date Fair Value |
| Outstanding as of January 1, 2017 | | 16,261 |
| | $ | 50.39 |
|
| Granted | | 8,001 |
| | $ | 58.10 |
|
| Released | | (8,018 | ) | | $ | 48.78 |
|
| Transferred | | (379 | ) | | $ | 57.77 |
|
| Forfeited | | (582 | ) | | $ | 53.83 |
|
| Outstanding as of December 31, 2017 | | 15,283 |
| | $ | 54.96 |
|
The intrinsic value of WEC Energy Group restricted stock held by our employees that was released was $0.5 million, $0.4 million, and $2.7 million for the years ended December 31, 2017, 2016, and 2015, respectively. The actual tax benefit from released restricted shares for the same years was $0.2 million, $0.2 million, and $1.1 million, respectively.
As of December 31, 2017, we expected to recognize approximately $1.2 million of unrecognized compensation cost related to WEC Energy Group restricted stock over the next 1.7 years on a weighted-average basis.
During the first quarter of 2018, the Compensation Committee awarded 7,518 WEC Energy Group restricted shares to our officers and other key employees under its normal schedule of awarding long-term incentive compensation. The grant date fair value of these awards was $64.99 per share.
Performance Units
During 2017, 2016, and 2015, the Compensation Committee awarded 34,765; 35,700; and 187,450 WEC Energy Group performance units, respectively, to our officers and other key employees under the WEC Energy Group Performance Unit Plan.
In 2016, we transferred 573,499 performance units to WBS in connection with the transfer of certain employees. See Note 4, Related Parties, for more information.
Performance units with an intrinsic value of $1.4 million, $3.4 million, and $11.6 million were settled during 2017, 2016, and 2015, respectively. The actual tax benefit from the distribution of performance units for the same years was approximately $0.4 million, $0.5 million, and $4.2 million, respectively.
At December 31, 2017, we had 96,577 performance units outstanding, including dividend equivalents. A liability of $4.9 million was recorded on our balance sheet at December 31, 2017 related to these outstanding units. As of December 31, 2017, we expected to recognize approximately $3.6 million of unrecognized compensation cost related to unvested and outstanding WEC Energy Group performance units over the next 1.4 years on a weighted-average basis.
During the first quarter of 2018, performance units held by our employees with an intrinsic value of $1.8 million were settled. The actual tax benefit from the distribution of these awards was $0.4 million. In January 2018, the Compensation Committee also awarded 32,650 WEC Energy Group performance units to our officers and other key employees under its normal schedule of awarding long-term incentive compensation.
Restrictions
Various financing arrangements and regulatory requirements impose certain restrictions on our ability to transfer funds to WEC Energy Group in the form of cash dividends, loans, or advances. In addition, Wisconsin law prohibits us from making loans to or guaranteeing obligations of WEC Energy Group or its subsidiaries.
In accordance with our most recent rate order, we may not pay common dividends above the test year forecasted amount reflected in our rate case, if it would cause our average common equity ratio, on a financial basis, to fall below our authorized level of 51%. A return of capital in excess of the test year amount can be paid by us at the end of the year provided that our average common equity ratio does not fall below the authorized level.
|
| | |
| Wisconsin Electric Power Company | B-40 | 2017 Annual Financial Statements
|
We may not pay common dividends to WEC Energy Group under our Restated Articles of Incorporation if any dividends on our outstanding preferred stock have not been paid. In addition, pursuant to the terms of our 3.60% Serial Preferred Stock, our ability to declare common dividends would be limited to 75% or 50% of net income during a twelve month period if our common stock equity to total capitalization, as defined in the preferred stock designation, is less than 25% and 20%, respectively.
See Note 10, Short-Term Debt and Lines of Credit, for discussion of certain financial covenants related to short-term debt obligations.
As of December 31, 2017, our restricted retained earnings totaled $2.2 billion.
Except for the restrictions described above and subject to applicable law, we do not have any other significant dividend restrictions.
NOTE 9—PREFERRED STOCK
The following table shows preferred stock authorized and outstanding at December 31, 2017 and 2016:
|
| | | | | | | | | | | | | | |
| (in millions, except share and per share amounts) | | Shares Authorized | | Shares Outstanding | | Redemption Price Per Share | | Total |
| $100 par value, Six Per Cent. Preferred Stock | | 45,000 |
| | 44,498 |
| | — |
| | $ | 4.4 |
|
| $100 par value, Serial Preferred Stock | | 2,286,500 |
| | | | | | |
| 3.60% Series | | | | 260,000 |
| | $ | 101 |
| | 26.0 |
|
| $25 par value, Serial Preferred Stock | | 5,000,000 |
| | — |
| | — |
| | — |
|
| Total | | | | | | | | $ | 30.4 |
|
NOTE 10—SHORT-TERM DEBT AND LINES OF CREDIT
The following table shows our short-term borrowings and their corresponding weighted-average interest rates as of December 31:
|
| | | | | | | | |
| (in millions, except percentages) | | 2017 | | 2016 |
| Commercial paper | | | | |
| Amount outstanding at December 31 | | $ | 210.9 |
| | $ | 159.0 |
|
| Average interest rate on amounts outstanding at December 31 | | 1.81 | % | | 0.87 | % |
Our average amount of commercial paper borrowings based on daily outstanding balances during 2017 was $53.3 million, with a weighted-average interest rate during the period of 1.38%.
We have entered into a bank back-up credit facility to maintain short-term credit liquidity which, among other terms, requires us to maintain, subject to certain exclusions, a minimum total funded debt to capitalization ratio of less than 65%.
As of December 31, 2017, we had approximately $287.9 million of available capacity under our bank back-up credit facility and $210.9 million of commercial paper outstanding that was supported by the credit facility.
In April 2017, our consolidated subsidiary, Bostco, paid off a note payable to our parent, WEC Energy Group.
The information in the table below relates to our revolving credit facility used to support our commercial paper borrowing program, including remaining available capacity under this facility as of December 31:
|
| | | | | | |
| (in millions) | | Maturity | | 2017 |
| Revolving credit facility | | October 2022 | | $ | 500.0 |
|
| | | | | |
| Less: | | | | |
|
| Letters of credit issued inside credit facility | | | | $ | 1.2 |
|
| Commercial paper outstanding | | | | 210.9 |
|
| | | | | |
| Available capacity under existing agreement | | | | $ | 287.9 |
|
This facility has a renewal provision for two one-year extensions, subject to lender approval.
|
| | |
| Wisconsin Electric Power Company | B-41 | 2017 Annual Financial Statements
|
Our bank back-up credit facility contains customary covenants, including certain limitations on our ability to sell assets. The credit facility also contains customary events of default, including payment defaults, material inaccuracy of representations and warranties, covenant defaults, bankruptcy proceedings, certain judgments, Employee Retirement Income Security Act of 1974 defaults and change of control.
NOTE 11—LONG-TERM DEBT AND CAPITAL LEASE OBLIGATIONS
See our statements of capitalization for details on our long-term debt.
Debentures and Notes
The following table shows the future maturities of our long-term debt outstanding (excluding obligations under capital leases) as of December 31, 2017:
|
| | | | |
| (in millions) | | |
| 2018 | | $ | 250.0 |
|
| 2019 | | 250.0 |
|
| 2020 | | — |
|
| 2021 | | 300.0 |
|
| 2022 | | — |
|
| Thereafter | | 1,885.0 |
|
| Total | | $ | 2,685.0 |
|
We amortize debt premiums, discounts, and debt issuance costs over the life of the debt and we include the costs in interest expense.
We are the obligor under a series of tax-exempt pollution control refunding bonds with an outstanding principal amount of $80.0 million. In August 2009, we terminated a letter of credit that provided credit and liquidity support for the bonds, which resulted in a mandatory tender of the bonds. We purchased the bonds at par plus accrued interest to the date of purchase. As of December 31, 2017, the repurchased bonds were still outstanding, but are not reported in our long-term debt or included in our capitalization statements since they are held by us. Depending on market conditions and other factors, we may change the method used to determine the interest rate on this bond series and have it remarketed to third parties. A related bond series that had an outstanding principal amount of $67.0 million matured on August 1, 2016.
Obligations Under Capital Leases
We are the obligor under a power purchase contract with an unaffiliated third party and we lease power plants from We Power. Under capital lease accounting, we have recorded the leased plants and corresponding obligations under the capital leases on our balance sheets. We treat these agreements as operating leases for rate-making purposes. We record our minimum lease payments under the power purchase contract as purchased power expense on our income statements. We record the lease payments under our leases with We Power as rent expense in other operation and maintenance in our income statements. We record the difference between the minimum lease payments and the sum of imputed interest and amortization costs calculated under capital lease accounting as a deferred regulatory asset on our balance sheets. See Note 5, Regulatory Assets and Liabilities, for more information on our plant related capital leases.
Power Purchase Commitment
In 1997, we entered into a 25-year power purchase contract with an unaffiliated independent power producer. The contract, for 236 MW of firm capacity from a natural gas-fired cogeneration facility, includes zero minimum energy requirements. When the contract expires in 2022, we may, at our option and with proper notice, renew for another ten years or purchase the generating facility at fair value or allow the contract to expire. We account for this contract as a capital lease and recorded the leased facility and corresponding obligation under the capital lease at the estimated fair value of the plant's electric generating facilities. We are amortizing the leased facility on a straight-line basis over the original 25-year term of the contract.
We treat the long-term power purchase contract as an operating lease for rate-making purposes and we record our minimum lease payments as cost of sales on our income statements. We record the difference between the minimum lease payments and the sum of imputed interest and amortization costs calculated under capital lease accounting as a deferred regulatory asset on our balance sheets. Due to the timing and the amounts of the minimum lease payments, the regulatory asset increased to approximately $78.5 million during 2009, at which time the regulatory asset began to be reduced to zero over the remaining life of the contract. The total obligation under the capital lease was $27.0 million as of December 31, 2017, and will decrease to zero over the remaining life of the contract.
|
| | |
| Wisconsin Electric Power Company | B-42 | 2017 Annual Financial Statements
|
Port Washington Generating Station
We are leasing PWGS 1 and PWGS 2, two 545 MW natural gas-fired generation units which were placed in service in July 2005 and May 2008, respectively, from We Power under PSCW approved leases. The leased units and corresponding obligations for the units have been recorded at the estimated fair value of $727.4 million. We are amortizing the leased units on a straight-line basis over the original 25-year term of the leases. The lease payments are expected to be recovered through our rates, as supported by the 2001 leased generation law. Due to the timing and the amounts of the minimum lease payments, we expect the regulatory asset to increase to approximately $129.1 million in the year 2021 for PWGS 1 and to approximately $124.4 million in the year 2023 for PWGS 2, at which time the regulatory assets will be reduced to zero over the remaining lives of the contracts. The total obligation under the capital leases for the units was $644.7 million as of December 31, 2017, and will decrease to zero over the remaining lives of the contracts.
Elm Road Generating Station
We are leasing ER 1, ER 2, and the common facilities, which are also utilized by our OC 5 through OC 8, from We Power under PSCW approved leases. We are amortizing the leased units on a straight-line basis over the 30-year term of the leases. ER 1 and ER 2 were placed in service in February 2010 and January 2011, respectively. The leased units and corresponding capital lease obligations have been recorded at the estimated fair value of $2,141.4 million. The lease payments are expected to be recovered through our rates, as supported by the 2001 leased generation law. Due to the timing and the amounts of the minimum lease payments, we expect the regulatory asset to increase to approximately $517.9 million in the year 2028 for ER 1 and to approximately $425.0 million in the year 2029 for ER 2, at which time the regulatory assets will be reduced to zero over the remaining lives of the contracts. The total obligation under the capital leases was $2,194.6 million as of December 31, 2017, and will decrease to zero over the remaining lives of the contracts.
We paid the following lease payments during 2017, 2016, and 2015:
|
| | | | | | | | | | | | |
| (in millions) | | 2017 | | 2016 | | 2015 |
| Long-term power purchase commitment | | $ | 7.2 |
| | $ | 37.6 |
| | $ | 36.2 |
|
| PWGS | | 85.0 |
| | 82.4 |
| | 103.8 |
|
| ERGS | | 335.5 |
| | 329.8 |
| | 306.7 |
|
| Total | | $ | 427.7 |
| | $ | 449.8 |
| | $ | 446.7 |
|
As a result of the Tax Legislation, future PWGS and ERGS lease payments were recalculated and are expected to decrease by approximately $50.0 million annually beginning in 2018. The reduction in lease payments is not expected to impact earnings as it will be recorded as a reduction to regulatory assets until our next rate case. See Note 5, Regulatory Assets and Liabilities, and Note 12, Income Taxes, for more information on the Tax Legislation.
The following table summarizes our capitalized leased facilities as of December 31:
|
| | | | | | | | |
| (in millions) | | 2017 | | 2016 |
| Long-term power purchase commitment | | | | |
| Under capital lease | | $ | 140.3 |
| | $ | 140.3 |
|
| Accumulated amortization | | (115.2 | ) | | (109.5 | ) |
| Total long-term power purchase commitment | | $ | 25.1 |
| | $ | 30.8 |
|
| | | | | |
| PWGS | | | | |
| Under capital lease | | $ | 727.4 |
| | $ | 704.2 |
|
| Accumulated amortization | | (305.1 | ) | | (274.7 | ) |
| Total PWGS | | $ | 422.3 |
| | $ | 429.5 |
|
| | | | | |
| ERGS | | | | |
| Under capital lease | | $ | 2,141.4 |
| | $ | 2,053.5 |
|
| Accumulated amortization | | (525.6 | ) | | (453.6 | ) |
| Total ERGS | | $ | 1,615.8 |
| | $ | 1,599.9 |
|
| | | | | |
| Total leased facilities | | $ | 2,063.2 |
| | $ | 2,060.2 |
|
|
| | |
| Wisconsin Electric Power Company | B-43 | 2017 Annual Financial Statements
|
Future minimum lease payments under our capital leases and the present value of our net minimum lease payments as of December 31, 2017 are as follows:
|
| | | | | | | | | | | | | | | | |
| (in millions) | | Power Purchase Commitment | | PWGS | | ERGS | | Total |
| 2018 | | $ | 14.7 |
| | $ | 96.3 |
| | $ | 287.7 |
| | $ | 398.7 |
|
| 2019 | | 15.5 |
| | 96.3 |
| | 287.7 |
| | 399.5 |
|
| 2020 | | 16.4 |
| | 96.3 |
| | 287.7 |
| | 400.4 |
|
| 2021 | | 17.2 |
| | 96.3 |
| | 287.7 |
| | 401.2 |
|
| 2022 | | 7.6 |
| | 96.3 |
| | 287.6 |
| | 391.5 |
|
| Thereafter | | — |
| | 857.3 |
| | 5,029.5 |
| | 5,886.8 |
|
| Total minimum lease payments | | 71.4 |
| | 1,338.8 |
| | 6,467.9 |
| | 7,878.1 |
|
| Less: Estimated executory costs | | (33.1 | ) | | — |
| | — |
| | (33.1 | ) |
| Net minimum lease payments | | 38.3 |
| | 1,338.8 |
| | 6,467.9 |
| | 7,845.0 |
|
| Less: Interest | | (11.3 | ) | | (694.1 | ) | | (4,273.3 | ) | | (4,978.7 | ) |
| Present value of minimum lease payments | | 27.0 |
| | 644.7 |
| | 2,194.6 |
| | 2,866.3 |
|
| Less: Due currently | | (3.7 | ) | | (19.4 | ) | | (19.4 | ) | | (42.5 | ) |
| Long-term obligations under capital lease | | $ | 23.3 |
| | $ | 625.3 |
| | $ | 2,175.2 |
| | $ | 2,823.8 |
|
NOTE 12—INCOME TAXES
Income Tax Expense
The following table is a summary of income tax expense for each of the years ended December 31:
|
| | | | | | | | | | | | |
| (in millions) | | 2017 | | 2016 | | 2015 |
| Current tax expense | | $ | 81.5 |
| | $ | 4.8 |
| | $ | 33.1 |
|
| Deferred income taxes, net | | 110.6 |
| | 207.3 |
| | 180.0 |
|
| Investment tax credit, net | | (0.9 | ) | | (1.1 | ) | | (1.1 | ) |
| Total income tax expense | | $ | 191.2 |
| | $ | 211.0 |
| | $ | 212.0 |
|
Statutory Rate Reconciliation
The provision for income taxes for each of the years ended December 31 differs from the amount of income tax determined by applying the applicable United States statutory federal income tax rate to income before income taxes and preferred dividend as a result of the following:
|
| | | | | | | | | | | | | | | | | | | | | |
| | | 2017 | | 2016 | | 2015 |
| (in millions) | | Amount | | Effective Tax Rate | | Amount | | Effective Tax Rate | | Amount | | Effective Tax Rate |
| Expected tax at statutory federal tax rates | | $ | 184.4 |
| | 35.0 | % | | $ | 201.4 |
| | 35.0 | % | | $ | 205.7 |
| | 35.0 | % |
| State income taxes net of federal tax benefit | | 27.9 |
| | 5.3 | % | | 31.8 |
| | 5.5 | % | | 31.0 |
| | 5.3 | % |
| Production tax credits | | (17.6 | ) | | (3.3 | )% | | (16.5 | ) | | (2.8 | )% | | (17.8 | ) | | (3.0 | )% |
| Domestic production activities deduction | | (7.8 | ) | | (1.5 | )% | | (7.8 | ) | | (1.4 | )% | | (7.8 | ) | | (1.3 | )% |
| AFUDC – Equity | | (1.1 | ) | | (0.2 | )% | | (1.5 | ) | | (0.3 | )% | | (2.0 | ) | | (0.3 | )% |
| Investment tax credit restored | | (0.9 | ) | | (0.2 | )% | | (1.1 | ) | | (0.2 | )% | | (1.1 | ) | | (0.2 | )% |
| Other, net | | 6.3 |
| | 1.1 | % | | 4.7 |
| | 0.8 | % | | 4.0 |
| | 0.5 | % |
| Total income tax expense | | $ | 191.2 |
| | 36.2 | % | | $ | 211.0 |
| | 36.6 | % | | $ | 212.0 |
| | 36.0 | % |
Deferred Income Tax Assets and Liabilities
On December 22, 2017, the Tax Legislation was signed into law. For businesses, the Tax Legislation reduces the corporate federal tax rate from a maximum of 35% to a 21% rate effective January 1, 2018. We estimated a preliminary tax benefit related to the re-measurement of our deferred taxes in the amount of approximately $1,065 million. Accordingly, this amount has been recorded as both an increase to regulatory liabilities as well as a decrease to certain existing regulatory assets as of December 31, 2017. Our revaluation of our deferred tax assets and liabilities is subject to further clarification of the new law that cannot be estimated at this time. The impact of the Tax Legislation could materially differ from this estimate due to, among other things, changes in interpretations and assumptions we have made.
On December 22, 2017, the SEC staff issued guidance in Staff Accounting Bulletin 118 (SAB 118), Income Tax Accounting Implications of the Tax Cuts and Jobs Act, which provides for a measurement period of up to one year from the enactment date
|
| | |
| Wisconsin Electric Power Company | B-44 | 2017 Annual Financial Statements
|
to complete accounting under GAAP for the tax effects of the legislation. Due to the complex and comprehensive nature of the enacted tax law changes, and their application under GAAP, certain amounts related to bonus depreciation and future tax benefit utilization recorded in the financial statements as a result of the Tax Legislation are to be considered "provisional" as discussed in SAB 118 and subject to revision. We are awaiting additional guidance from industry and income tax authorities in order to finalize our accounting.
The components of deferred income taxes as of December 31 were as follows:
|
| | | | | | | | |
| (in millions) | | 2017 | | 2016 |
| Deferred tax assets | | | | |
| Tax gross up – regulatory items | | $ | 240.1 |
| | $ | — |
|
| Future tax benefits | | 133.1 |
| | 143.7 |
|
| Deferred revenues | | 128.8 |
| | 207.2 |
|
| Employee benefits and compensation | | 50.2 |
| | 77.6 |
|
| Construction advances | | 15.0 |
| | 20.0 |
|
| Uncollectible account expense | | 12.5 |
| | 16.1 |
|
| Emission allowances | | 0.1 |
| | 0.2 |
|
| Other | | 54.8 |
| | 70.9 |
|
| Total deferred tax assets | | 634.6 |
| | 535.7 |
|
| | | | | |
| Deferred tax liabilities | | | | |
| Property-related | | 1,487.0 |
| | 2,257.3 |
|
| Employee benefits and compensation | | 117.4 |
| | 179.3 |
|
| Deferred transmission costs | | 60.1 |
| | 93.1 |
|
| Prepaid tax, insurance, and other | | 33.8 |
| | 50.2 |
|
| Investment in transmission affiliate | | — |
| | 195.1 |
|
| Other | | 91.8 |
| | 94.0 |
|
| Total deferred tax liabilities | | 1,790.1 |
| | 2,869.0 |
|
| Deferred tax liability, net | | $ | 1,155.5 |
| | $ | 2,333.3 |
|
Consistent with rate-making treatment, deferred taxes in the table above are offset for temporary differences that have related regulatory assets and liabilities.
As of December 31, 2017, we had $4.0 million and $125.6 million of federal charitable contribution and tax credit carryforwards resulting in deferred tax assets of $0.8 million and $125.6 million, respectively. These federal charitable contribution carryforwards begin to expire in 2020 and tax credit carryforwards begin to expire in 2031. We expect to have future taxable income sufficient to utilize these deferred tax assets. As of December 31, 2016, we had approximately $82.8 million and $107.2 million of federal net operating loss and tax credit carryforwards resulting in deferred tax assets of $29.0 million and $107.2 million, respectively. As of December 31, 2017 we had $74.7 million and $31.9 million of state net operating loss and state charitable contribution carryforwards resulting in deferred tax assets of $4.7 million and $2.0 million, respectively. These state net operating loss carryforwards begin to expire in 2035 and state charitable contribution carryforwards begin to expire in 2017. We expect to have future taxable income sufficient to utilize these deferred tax assets. As of December 31, 2016 we had $149.9 million state net operating loss carryforwards resulting in deferred tax assets of $7.5 million.
Unrecognized Tax Benefits
We previously adopted accounting guidance related to uncertainty in income taxes. A reconciliation of the beginning and ending amount of unrecognized tax benefits is as follows:
|
| | | | | | | | |
| (in millions) | | 2017 | | 2016 |
| Balance as of January 1 | | $ | 5.1 |
| | $ | 6.1 |
|
| Reductions for tax positions of prior years | | (5.1 | ) | | (1.0 | ) |
| Balance as of December 31 | | $ | — |
| | $ | 5.1 |
|
The amount of unrecognized tax benefits as of December 31, 2017 and 2016 excludes deferred tax assets related to uncertainty in income taxes of zero and $5.1 million, respectively. As of December 31, 2017 and 2016, there were no unrecognized tax benefits that, if recognized, would impact the effective tax rate for continuing operations.
We recognize interest and penalties accrued related to unrecognized tax benefits as a component of income tax expense. For the years ended December 31, 2017, 2016, and 2015, we recognized $0.7 million of interest income, $0.2 million of interest expense, and $0.1 million of interest income, respectively, in our income statements. For the years ended December 31, 2017,
|
| | |
| Wisconsin Electric Power Company | B-45 | 2017 Annual Financial Statements
|
2016, and 2015, we recognized no penalties in our income statements. As of December 31, 2017, we had no interest accrued and no penalties accrued on our balance sheets. As of December 31, 2016, we had $0.7 million of accrued interest and no penalties accrued on our balance sheets.
We do not anticipate any significant increases or decreases in the total amounts of unrecognized tax benefits within the next 12 months.
Our primary tax jurisdictions include Federal and the state of Wisconsin. With a few exceptions, we are no longer subject to federal income tax examination by the IRS for years prior to 2014. As of December 31, 2017, we were subject to examination by the Wisconsin taxing authority for tax years 2013 through 2017.
NOTE 13—FAIR VALUE MEASUREMENTS
The following tables summarize our financial assets and liabilities that were accounted for at fair value on a recurring basis, categorized by level within the fair value hierarchy:
|
| | | | | | | | | | | | | | | | |
| | | December 31, 2017 |
| (in millions) | | Level 1 | | Level 2 | | Level 3 | | Total |
| Derivative assets | | | | | | | | |
| Natural gas contracts | | $ | 0.5 |
| | $ | 0.1 |
| | $ | — |
| | $ | 0.6 |
|
| Petroleum products contracts | | 0.9 |
| | — |
| | — |
| | 0.9 |
|
| FTRs | | — |
| | — |
| | 2.4 |
| | 2.4 |
|
| Coal contracts | | — |
| | 0.7 |
| | — |
| | 0.7 |
|
| Total derivative assets | | $ | 1.4 |
| | $ | 0.8 |
| | $ | 2.4 |
| | $ | 4.6 |
|
| | | | | | | | | |
| Derivative liabilities | | | | | | | | |
| Natural gas contracts | | $ | 2.0 |
| | $ | 0.1 |
| | $ | — |
| | $ | 2.1 |
|
| Coal contracts | | — |
| | 0.3 |
| | — |
| | 0.3 |
|
| Total derivative liabilities | | $ | 2.0 |
| | $ | 0.4 |
| | $ | — |
| | $ | 2.4 |
|
|
| | | | | | | | | | | | | | | | |
| | | December 31, 2016 |
| (in millions) | | Level 1 | | Level 2 | | Level 3 | | Total |
| Derivative assets | | | | | | | | |
| Natural gas contracts | | $ | 6.0 |
| | $ | 0.8 |
| | $ | — |
| | $ | 6.8 |
|
| Petroleum products contracts | | 0.2 |
| | — |
| | — |
| | 0.2 |
|
| FTRs | | — |
| | — |
| | 3.1 |
| | 3.1 |
|
| Coal contracts | | — |
| | 1.9 |
| | — |
| | 1.9 |
|
| Total derivative assets | | $ | 6.2 |
| | $ | 2.7 |
| | $ | 3.1 |
| | $ | 12.0 |
|
| | | | | | | | | |
| Derivative liabilities | | | | | | | | |
| Natural gas contracts | | $ | 0.1 |
| | $ | — |
| | $ | — |
| | $ | 0.1 |
|
| Petroleum products contracts | | 0.1 |
| | — |
| | — |
| | 0.1 |
|
| Coal contracts | | — |
| | 0.5 |
| | — |
| | 0.5 |
|
| Total derivative liabilities | | $ | 0.2 |
| | $ | 0.5 |
| | $ | — |
| | $ | 0.7 |
|
The derivative assets and liabilities listed in the tables above include options, futures, physical commodity contracts, and other instruments used to manage market risks related to changes in commodity prices. They also include FTRs, which are used to manage electric transmission congestion costs in the MISO Energy Markets. See Note 14, Derivative Instruments, for more information.
The following table summarizes the changes to derivatives classified as Level 3 in the fair value hierarchy:
|
| | | | | | | | | | | | |
| (in millions) | | 2017 | | 2016 | | 2015 |
| Balance at the beginning of the period | | $ | 3.1 |
| | $ | 1.6 |
| | $ | 7.0 |
|
| Purchases | | 6.9 |
| | 8.1 |
| | 3.9 |
|
| Settlements | | (7.6 | ) | | (6.6 | ) | | (9.3 | ) |
| Balance at the end of the period | | $ | 2.4 |
| | $ | 3.1 |
| | $ | 1.6 |
|
|
| | |
| Wisconsin Electric Power Company | B-46 | 2017 Annual Financial Statements
|
Fair Value of Financial Instruments
The following table shows the financial instruments included on our balance sheets that are not recorded at fair value:
|
| | | | | | | | | | | | | | | | |
| | | December 31, 2017 | | December 31, 2016 |
| (in millions) | | Carrying Amount | | Fair Value | | Carrying Amount | | Fair Value |
| Preferred stock | | $ | 30.4 |
| | $ | 30.5 |
| | $ | 30.4 |
| | $ | 28.8 |
|
| Long-term debt, including current portion | | 2,662.3 |
| | 2,976.3 |
| | 2,661.1 |
| | 2,923.4 |
|
NOTE 14—DERIVATIVE INSTRUMENTS
The following table shows our derivative assets and derivative liabilities:
|
| | | | | | | | | | | | | | | | |
| | | December 31, 2017 | | December 31, 2016 |
| (in millions) | | Derivative Assets | | Derivative Liabilities | | Derivative Assets | | Derivative Liabilities |
| Other current | | | | | | | | |
| Natural gas contracts | | $ | 0.6 |
| | $ | 1.9 |
| | $ | 6.3 |
| | $ | 0.1 |
|
| Petroleum products contracts | | 0.9 |
| | — |
| | 0.2 |
| | 0.1 |
|
| FTRs | | 2.4 |
| | — |
| | 3.1 |
| | — |
|
| Coal contracts | | 0.6 |
| | 0.1 |
| | 1.5 |
| | 0.5 |
|
| Total other current | | $ | 4.5 |
| | $ | 2.0 |
| | $ | 11.1 |
| | $ | 0.7 |
|
| | | | | | | | | |
| Other long-term | | | | | | | | |
| Natural gas contracts | | $ | — |
| | $ | 0.2 |
| | $ | 0.5 |
| | $ | — |
|
| Coal contracts | | 0.1 |
| | 0.2 |
| | 0.4 |
| | — |
|
| Total other long-term | | $ | 0.1 |
| | $ | 0.4 |
| | $ | 0.9 |
| | $ | — |
|
| Total | | $ | 4.6 |
| | $ | 2.4 |
| | $ | 12.0 |
| | $ | 0.7 |
|
Our estimated notional sales volumes and realized gains (losses) were as follows:
|
| | | | | | | | | | | | | | | | | | |
| | | December 31, 2017 | | December 31, 2016 | | December 31, 2015 |
| (in millions) | | Volume | | Gains (Losses) | | Volume | | Gains (Losses) | | Volume | | Gains (Losses) |
| Natural gas contracts | | 26.9 Dth | | $ | (1.0 | ) | | 35.3 Dth | | $ | (12.3 | ) | | 24.0 Dth | | $ | (12.6 | ) |
| Petroleum products contracts | | 16.7 gallons | | (1.4 | ) | | 10.3 gallons | | (2.6 | ) | | 4.0 gallons | | (0.2 | ) |
| FTRs | | 27.1 MWh | | 7.6 |
| | 25.3 MWh | | 7.3 |
| | 22.8 MWh | | 3.2 |
|
| Total | | | | $ | 5.2 |
| | | | $ | (7.6 | ) | | | | $ | (9.6 | ) |
At December 31, 2017, we had posted cash collateral of $4.9 million in our margin accounts, and at December 31, 2016, we had received cash collateral of $3.4 million in our margin accounts.
The following table shows derivative assets and derivative liabilities if derivative instruments by counterparty were presented net on our balance sheets: |
| | | | | | | | | | | | | | | | |
| | | December 31, 2017 | | December 31, 2016 |
| (in millions) | | Derivative Assets | | Derivative Liabilities | | Derivative Assets | | Derivative Liabilities |
| Gross amount recognized on the balance sheet | | $ | 4.6 |
| | $ | 2.4 |
| | $ | 12.0 |
| | $ | 0.7 |
|
| Gross amount not offset on the balance sheet | | (1.3 | ) | | (2.0 | ) | (1) | (3.6 | ) | (2) | (0.2 | ) |
| Net amount | | $ | 3.3 |
| | $ | 0.4 |
| | $ | 8.4 |
| | $ | 0.5 |
|
| |
(1) | Includes cash collateral posted of $0.7 million at December 31, 2017. |
| |
(2) | Includes cash collateral received of $3.4 million at December 31, 2016. |
|
| | |
| Wisconsin Electric Power Company | B-47 | 2017 Annual Financial Statements
|
NOTE 15—EMPLOYEE BENEFITS
Pension and Other Postretirement Employee Benefits
We participate in WEC Energy Group's defined benefit pension plans and OPEB plans that cover substantially all of our employees. We are responsible for our share of the plan assets and obligations. The benefits for a portion of these plans are funded through irrevocable trusts, as allowed for income tax purposes. Our balance sheets reflect only the liabilities associated with our past and current employees and our share of the plan assets and obligations. We also offer medical, dental, and life insurance benefits to active employees and their dependents. We expense the costs of these benefits as incurred.
Generally, employees who started with us after 1995 receive a benefit based on a percentage of their annual salary plus an interest credit, while employees who started before 1996 receive a benefit based upon years of service and final average salary. New management employees hired after December 31, 2014 receive a 6% annual company contribution to their 401(k) savings plan instead of being enrolled in the defined benefit plans.
We use a year-end measurement date to measure the funded status of all of the pension and OPEB plans. Due to the regulated nature of our business, we have concluded that substantially all of the unrecognized costs resulting from the recognition of the funded status of the pension and OPEB plans qualify as a regulatory asset.
The following tables provide a reconciliation of the changes in our plans' benefit obligations and fair value of assets:
|
| | | | | | | | | | | | | | | | | |
| | | Pension Costs | | OPEB Costs | |
| (in millions) | | 2017 | | 2016 | | 2017 | | 2016 | |
| Change in benefit obligation | | | | | | | | | |
| Obligation at January 1 | | $ | 1,177.0 |
| | $ | 1,290.6 |
| | $ | 298.5 |
| | $ | 313.8 |
| |
| Service cost | | 12.2 |
| | 10.5 |
| | 7.0 |
| | 7.3 |
| |
| Interest cost | | 47.0 |
| | 49.7 |
| | 12.1 |
| | 13.2 |
| |
| Participant contributions | | — |
| | — |
| | 5.7 |
| | 8.8 |
| |
| Plan amendments | | — |
| | (2.6 | ) | | (6.8 | ) | | — |
| |
| Net transfer to/from affiliates | | (13.4 | ) | (1) | (121.1 | ) | (2) | (3.3 | ) | (1) | (17.0 | ) | (2) |
| Actuarial loss (gain) | | 53.1 |
| | 25.3 |
| | 5.1 |
| | (9.7 | ) | |
| Benefit payments | | (82.0 | ) | | (75.4 | ) | | (16.5 | ) | | (19.0 | ) | |
| Federal subsidy on benefits paid | | N/A |
| | N/A |
| | 1.7 |
| | 1.1 |
| |
| Obligation at December 31 | | $ | 1,193.9 |
| | $ | 1,177.0 |
| | $ | 303.5 |
| | $ | 298.5 |
| |
| | | | | | | | | | |
| Change in fair value of plan assets | | | | | | | | | |
| Fair value at January 1 | | $ | 1,102.8 |
| | $ | 1,179.3 |
| | $ | 205.1 |
| | $ | 216.1 |
| |
| Actual return on plan assets | | 121.9 |
| | 73.0 |
| | 25.9 |
| | 13.5 |
| |
| Employer contributions | | 5.1 |
| | 5.3 |
| | 3.2 |
| | 2.7 |
| |
| Participant contributions | | — |
| | — |
| | 5.7 |
| | 8.8 |
| |
| Net transfer to/from affiliates | | (13.7 | ) | (1) | (79.4 | ) | (2) | (3.3 | ) | (1) | (17.0 | ) | (2) |
| Benefit payments | | (82.0 | ) | | (75.4 | ) | | (16.5 | ) | | (19.0 | ) | |
| Fair value at December 31 | | $ | 1,134.1 |
| | $ | 1,102.8 |
| | $ | 220.1 |
| | $ | 205.1 |
| |
| Funded status at December 31 | | $ | (59.8 | ) | | $ | (74.2 | ) | | $ | (83.4 | ) | | $ | (93.4 | ) | |
| |
(1) | Benefit obligations and plan assets were moved along with our employees who were transferred to/from affiliated entities, primarily a result of our customer service employees being transferred to WBS. |
| |
(2) | Benefit obligations and plan assets were moved along with our employees who were transferred to/from affiliated entities. See Note 4, Related Parties, for more information. |
The amounts recognized on our balance sheets at December 31 related to the funded status of the benefit plans were as follows:
|
| | | | | | | | | | | | | | | | |
| | | Pension Costs | | OPEB Costs |
| (in millions) | | 2017 | | 2016 | | 2017 | | 2016 |
| Pension and OPEB obligations | | $ | (59.8 | ) | | $ | (74.2 | ) | | $ | (83.4 | ) | | $ | (93.4 | ) |
The accumulated benefit obligation for all defined benefit pension plans was $1,192.4 million and $1,175.8 million as of December 31, 2017 and 2016, respectively.
|
| | |
| Wisconsin Electric Power Company | B-48 | 2017 Annual Financial Statements
|
The following table shows information for the pension plans for which we have an accumulated benefit obligation in excess of plan assets. Amounts presented are as of December 31:
|
| | | | | | | | |
| (in millions) | | 2017 | | 2016 |
| Projected benefit obligation | | $ | 1,193.9 |
| | $ | 1,177.0 |
|
| Accumulated benefit obligation | | 1,192.4 |
| | 1,175.8 |
|
| Fair value of plan assets | | 1,134.1 |
| | 1,102.8 |
|
The following table shows the amounts that have not yet been recognized in our net periodic benefit cost as of December 31:
|
| | | | | | | | | | | | | | | | |
| | | Pension Costs | | OPEB Costs |
| (in millions) | | 2017 | | 2016 | | 2017 | | 2016 |
| Net regulatory assets | | | | | | | | |
| Net actuarial loss (gain) | | $ | 485.4 |
| | $ | 518.5 |
| | $ | (1.6 | ) | | $ | 4.6 |
|
| Prior service costs (credits) | | (1.0 | ) | | 0.2 |
| | (8.4 | ) | | (3.0 | ) |
| Total | | $ | 484.4 |
| | $ | 518.7 |
| | $ | (10.0 | ) | | $ | 1.6 |
|
The following table shows the estimated amounts that will be amortized into net periodic benefit cost during 2018:
|
| | | | | | | | |
| (in millions) | | Pension Costs | | OPEB Costs |
| Net actuarial loss | | $ | 37.5 |
| | $ | — |
|
| Prior service costs (credits) | | 0.9 |
| | (2.3 | ) |
| Total 2018 – estimated amortization | | $ | 38.4 |
| | $ | (2.3 | ) |
The components of net periodic benefit cost (including amounts capitalized to our balance sheets) for the years ended December 31 were as follows:
|
| | | | | | | | | | | | | | | | | | | | | | | | |
| | | Pension Costs | | OPEB Costs |
| (in millions) | | 2017 | | 2016 | | 2015 | | 2017 | | 2016 | | 2015 |
| Service cost | | $ | 12.2 |
| | $ | 10.5 |
| | $ | 14.7 |
| | $ | 7.0 |
| | $ | 7.3 |
| | $ | 9.0 |
|
| Interest cost | | 47.0 |
| | 49.7 |
| | 52.9 |
| | 12.1 |
| | 13.2 |
| | 13.4 |
|
| Expected return on plan assets | | (76.6 | ) | | (77.7 | ) | | (83.6 | ) | | (14.7 | ) | | (14.0 | ) | | (16.0 | ) |
| Plan settlement | | 4.1 |
| | — |
| | — |
| | — |
| | — |
| | — |
|
| Amortization of prior service cost (credit) | | 1.1 |
| | 1.6 |
| | 2.0 |
| | (1.4 | ) | | (1.1 | ) | | (1.1 | ) |
| Amortization of net actuarial loss | | 35.4 |
| | 32.4 |
| | 35.6 |
| | — |
| | 1.0 |
| | 1.0 |
|
| Net periodic benefit cost | | $ | 23.2 |
| | $ | 16.5 |
| | $ | 21.6 |
| | $ | 3.0 |
| | $ | 6.4 |
| | $ | 6.3 |
|
The weighted-average assumptions used to determine the benefit obligations for the plans were as follows for the years ended December 31:
|
| | | | | | | | |
| | | Pension | | OPEB |
| | | 2017 | | 2016 | | 2017 | | 2016 |
| Discount rate | | 3.65% | | 4.15% | | 3.65% | | 4.20% |
| Rate of compensation increase | | 3.20% | | 3.20% | | N/A | | N/A |
| Assumed medical cost trend rate (pre 65) | | N/A | | N/A | | 6.50% | | 7.00% |
| Ultimate trend rate | | N/A | | N/A | | 5.00% | | 5.00% |
| Year ultimate trend rate is reached | | N/A | | N/A | | 2024 | | 2021 |
| Assumed medical cost trend rate (post 65) | | N/A | | N/A | | 6.18% | | 7.00% |
| Ultimate trend rate | | N/A | | N/A | | 5.00% | | 5.00% |
| Year ultimate trend rate is reached | | N/A | | N/A | | 2028 | | 2021 |
The weighted-average assumptions used to determine the net periodic benefit cost for the plans were as follows for the years ended December 31:
|
| | | | | | |
| | | Pension Costs |
| | | 2017 | | 2016 | | 2015 |
| Discount rate | | 4.12% | | 4.45% | | 4.15% |
| Expected return on plan assets | | 7.00% | | 7.00% | | 7.00% |
| Rate of compensation increase | | 3.20% | | 3.50% | | 4.00% |
|
| | |
| Wisconsin Electric Power Company | B-49 | 2017 Annual Financial Statements
|
|
| | | | | | |
| | | OPEB Costs |
| | | 2017 | | 2016 | | 2015 |
| Discount rate | | 4.10% | | 4.45% | | 4.20% |
| Expected return on plan assets | | 7.25% | | 7.25% | | 7.25% |
| Assumed medical cost trend rate (Pre 65/Post 65) | | 7.00% | | 7.50% | | 7.50% |
| Ultimate trend rate | | 5.00% | | 5.00% | | 5.00% |
| Year ultimate trend rate is reached | | 2021 | | 2021 | | 2021 |
WEC Energy Group consults with its investment advisors on an annual basis to help forecast expected long-term returns on plan assets by reviewing historical returns as well as calculating expected total trust returns using the weighted-average of long-term market returns for each of the major target asset categories utilized in the fund. For 2018, the expected return on assets assumption is 7.00% for the pension plan and 7.25% for the OPEB plan.
Assumed health care cost trend rates have a significant effect on the amounts reported by us for the health care plans. For the year ended December 31, 2017, a one-percentage-point change in assumed health care cost trend rates would have had the following effects:
|
| | | | | | | | |
| (in millions) | | 1% Increase | | 1% Decrease |
| Effect on total of service and interest cost components of net periodic postretirement health care benefit cost | | $ | 2.9 |
| | $ | (2.3 | ) |
| Effect on the health care component of the accumulated postretirement benefit obligation | | 29.3 |
| | (24.2 | ) |
Plan Assets
Current pension trust assets and amounts which are expected to be contributed to the trusts in the future are expected to be adequate to meet pension payment obligations to current and future retirees.
The Investment Trust Policy Committee oversees investment matters related to all of our funded benefit plans. The Committee works with external actuaries and investment consultants on an on-going basis to establish and monitor investment strategies and target asset allocations. Forecasted cash flows for plan liabilities are regularly updated based on annual valuation results. Target allocations are determined utilizing projected benefit payment cash flows and risk analyses of appropriate investments. They are intended to reduce risk, provide long-term financial stability for the plans and maintain funded levels which meet long-term plan obligations while preserving sufficient liquidity for near-term benefit payments.
Our pension trust target asset allocation is 35% equity investments, 55% fixed income investments, and 10% private equity and real estate investments. The OPEB trusts' target asset allocations are 60% equity investments and 40% fixed income investments. Equity securities include investments in large-cap, mid-cap, and small-cap companies primarily located in the United States. Fixed income securities include corporate bonds of companies from diversified industries, mortgage and other asset backed securities, commercial paper, and United States Treasuries.
Pension and OPEB plan investments are recorded at fair value. See Note 1(m), Fair Value Measurements, for more information regarding the fair value hierarchy and the classification of fair value measurements based on the types of inputs used.
|
| | |
| Wisconsin Electric Power Company | B-50 | 2017 Annual Financial Statements
|
The following tables summarize the fair values of our investments by asset class:
|
| | | | | | | | | | | | | | | | | | | | | | | | | | | | | | | | |
| | | December 31, 2017 |
| | | Pension Plan Assets | | OPEB Assets |
| (in millions) | | Level 1 | | Level 2 | | Level 3 | | Total | | Level 1 | | Level 2 | | Level 3 | | Total |
| Asset Class | | | | | | | | | | | | | | | | |
| Cash and cash equivalents | | $ | — |
| | $ | 6.6 |
| | $ | — |
| | $ | 6.6 |
| | $ | 2.1 |
| | $ | 0.5 |
| | $ | — |
| | $ | 2.6 |
|
| Equity securities: | | | | | | | | | | | | | | | | |
| Unites States Equity | | 109.4 |
| | 0.1 |
| | — |
| | 109.5 |
| | 29.0 |
| | — |
| | — |
| | 29.0 |
|
| International Equity | | 114.4 |
| | — |
| | — |
| | 114.4 |
| | 32.2 |
| | — |
| | — |
| | 32.2 |
|
| Fixed income securities: * | | | | | | | | | | | | | | | | |
| United States Bonds | | 75.9 |
| | 467.8 |
| | — |
| | 543.7 |
| | 24.4 |
| | 46.3 |
| | — |
| | 70.7 |
|
| International Bonds | | 9.7 |
| | 32.8 |
| | — |
| | 42.5 |
| | 1.7 |
| | 2.9 |
| | — |
| | 4.6 |
|
| Private Equity and Real Estate | | — |
| | 20.6 |
| | 55.3 |
| | 75.9 |
| | — |
| | 1.4 |
| | 3.8 |
| | 5.2 |
|
| | | $ | 309.4 |
| | $ | 527.9 |
| | $ | 55.3 |
| | $ | 892.6 |
| | $ | 89.4 |
| | $ | 51.1 |
| | $ | 3.8 |
| | $ | 144.3 |
|
| Investments measured at net asset value | | | | | | | | $ | 241.5 |
| | | | | | | | $ | 75.8 |
|
| Total | | $ | 309.4 |
| | $ | 527.9 |
| | $ | 55.3 |
| | $ | 1,134.1 |
| | $ | 89.4 |
| | $ | 51.1 |
| | $ | 3.8 |
| | $ | 220.1 |
|
| |
| * | This category represents investment grade bonds of United States and foreign issuers denominated in United States dollars from diverse industries. |
|
| | | | | | | | | | | | | | | | | | | | | | | | | | | | | | | | |
| | | December 31, 2016 |
| | | Pension Plan Assets | | OPEB Assets |
| (in millions) | | Level 1 | | Level 2 | | Level 3 | | Total | | Level 1 | | Level 2 | | Level 3 | | Total |
| Asset Class | | | | | | | | | | | | | | | | |
| Cash and cash equivalents | | $ | 1.1 |
| | $ | 19.2 |
| | $ | — |
| | $ | 20.3 |
| | $ | 6.5 |
| | $ | 1.3 |
| | $ | — |
| | $ | 7.8 |
|
| Equity securities: | | | | | | | | | | | | | | | | |
| United States equity | | 85.5 |
| | 0.1 |
| | — |
| | 85.6 |
| | 10.5 |
| | — |
| | — |
| | 10.5 |
|
| International equity | | 17.7 |
| | — |
| | — |
| | 17.7 |
| | 1.3 |
| | — |
| | — |
| | 1.3 |
|
| Fixed income securities: * | | | | | | | | | | | | | | | | |
| United States bonds | | — |
| | 455.3 |
| | — |
| | 455.3 |
| | — |
| | 44.0 |
| | — |
| | 44.0 |
|
| International bonds | | — |
| | 31.6 |
| | — |
| | 31.6 |
| | — |
| | 2.8 |
| | — |
| | 2.8 |
|
| Private Equity and Real Estate | | — |
| | — |
| | 11.0 |
| | 11.0 |
| | — |
| | — |
| | 0.7 |
| | 0.7 |
|
| | | $ | 104.3 |
| | $ | 506.2 |
| | $ | 11.0 |
| | $ | 621.5 |
| | $ | 18.3 |
| | $ | 48.1 |
| | $ | 0.7 |
| | $ | 67.1 |
|
| Investments measured at net asset value | | | | | | | | $ | 481.3 |
| | | | | | | | $ | 138.0 |
|
| Total | | $ | 104.3 |
| | $ | 506.2 |
| | $ | 11.0 |
| | $ | 1,102.8 |
| | $ | 18.3 |
| | $ | 48.1 |
| | $ | 0.7 |
| | $ | 205.1 |
|
| |
| * | This category represents investment grade bonds of United States and foreign issuers denominated in United States dollars from diverse industries. |
The following tables set forth a reconciliation of changes in the fair value of pension and OPEB plan assets categorized as Level 3 in the fair value hierarchy:
|
| | | | | | | | |
| | | Private Equity and Real Estate |
| (in millions) | | Pension | | OPEB |
| Beginning balance at January 1, 2017 | | $ | 11.0 |
| | $ | 0.7 |
|
| Realized and unrealized gains | | 1.9 |
| | 0.2 |
|
| Purchases | | 22.3 |
| | 1.5 |
|
| Transfers into level 3 | | 20.1 |
| | 1.4 |
|
| Ending balance at December 31, 2017 | | $ | 55.3 |
| | $ | 3.8 |
|
|
| | | | | | | | |
| | | Private Equity and Real Estate |
| (in millions) | | Pension | | OPEB |
| Beginning balance at January 1, 2016 | | $ | 4.5 |
| | $ | 0.3 |
|
| Purchases | | 6.5 |
| | 0.4 |
|
| Ending balance at December 31, 2016 | | $ | 11.0 |
| | $ | 0.7 |
|
|
| | |
| Wisconsin Electric Power Company | B-51 | 2017 Annual Financial Statements
|
Cash Flows
We expect to contribute $3.9 million to the pension plans and $0.1 million to the OPEB plans in 2018, dependent upon various factors affecting us, including our liquidity position and the effects of the new Tax Legislation.
The following table shows the payments, reflecting expected future service, that we expect to make for pension and OPEB:
|
| | | | | | | | |
| (in millions) | | Pension Costs | | OPEB Costs |
| 2018 | | $ | 92.4 |
| | $ | 13.5 |
|
| 2019 | | 90.1 |
| | 14.2 |
|
| 2020 | | 89.2 |
| | 14.9 |
|
| 2021 | | 86.0 |
| | 15.7 |
|
| 2022 | | 82.3 |
| | 16.2 |
|
| 2023-2027 | | 368.2 |
| | 85.5 |
|
Savings Plans
We sponsor 401(k) savings plans which allow employees to contribute a portion of their pre-tax and/or after-tax income in accordance with plan-specified guidelines. A percentage of employee contributions are matched by us through a contribution into the employee's savings plan account, up to certain limits. Total costs incurred under all of these plans were $11.7 million in 2017, $10.4 million in 2016, and $13.0 million in 2015.
NOTE 16—INVESTMENT IN AMERICAN TRANSMISSION COMPANY
At December 31, 2016, we owned approximately 23% of ATC, a for-profit, transmission-only company regulated by the FERC for cost of service and certain state regulatory commissions for routing and siting of transmission projects. Effective January 1, 2017, based upon input we received from the PSCW, we transferred our investment in ATC to another subsidiary of WEC Energy Group. This transaction was a non-cash equity transfer between entities under common control, and therefore, did not result in the recognition of a gain or loss. The following table provides a reconciliation of our investment in ATC during the years ended December 31:
|
| | | | | | | | | | | | |
| (in millions) | | 2017 | | 2016 | | 2015 |
| Balance at January 1 | | $ | 402.0 |
| | $ | 382.2 |
| | $ | 372.9 |
|
| Less: Transfer of ownership interest | | 402.0 |
| | — |
| | — |
|
| Add: Earnings from equity method investment | | — |
| | 55.5 |
| | 47.8 |
|
| Add: Capital contributions | | — |
| | 16.1 |
| | 4.6 |
|
| Less: Distributions | | — |
| | 51.7 |
| * | 42.9 |
|
| Less: Other | | — |
| | 0.1 |
| | 0.2 |
|
| Balance at December 31 | | $ | — |
| | $ | 402.0 |
| | $ | 382.2 |
|
| |
| * | Of this amount, $13.4 million was recorded as a receivable from ATC at December 31, 2016. |
See Note 4, Related Parties, for more information on transactions with ATC.
NOTE 17—SEGMENT INFORMATION
We use operating income to measure segment profitability and to allocate resources to our businesses. At December 31, 2017, we reported two segments, which are described below.
Our utility segment includes our electric and natural gas utility operations. Our electric utility operations are engaged in the generation, distribution, and sale of electricity in southeastern Wisconsin (including metropolitan Milwaukee), east central Wisconsin, northern Wisconsin, and the Upper Peninsula of Michigan. Effective January 1, 2017, we transferred all of our electric distribution assets and customers located in the Upper Peninsula of Michigan to UMERC, with the exception of Tilden. See Note 4, Related Parties, and Note 21, Regulatory Environment, for additional information. Our electric utility operations also include our steam operations, which produce, distribute, and sell steam to customers in metropolitan Milwaukee, Wisconsin. Our natural gas utility operations are engaged in the purchase, distribution, and sale of natural gas to retail customers and the transportation of customer-owned natural gas in our three service areas within southeastern, east central, and northern Wisconsin.
Our other segment includes Bostco, our non-utility subsidiary that was originally formed to develop and invest in real estate. In March 2017, we sold substantially all of the remaining assets of Bostco. See Note 3, Dispositions, for more information. Prior to
|
| | |
| Wisconsin Electric Power Company | B-52 | 2017 Annual Financial Statements
|
January 1, 2017, our other segment also included our approximate 23% ownership interest in ATC, a for-profit, electric transmission company regulated by the FERC and certain state regulatory commissions. Effective January 1, 2017, we transferred our investment in ATC to another subsidiary of WEC Energy Group. See Note 16, Investment in American Transmission Company, for more information.
All of our operations and assets are located within the United States. The following tables show summarized financial information related to our reportable segments for the years ended December 31, 2017, 2016, and 2015.
|
| | | | | | | | | | | | |
2017 (in millions) | | Utility | | Other | | Wisconsin Electric Power Company Consolidated |
| Operating revenues | | $ | 3,711.7 |
| | $ | — |
| | $ | 3,711.7 |
|
| Other operation and maintenance | | 1,358.5 |
| | — |
| | 1,358.5 |
|
| Depreciation and amortization | | 331.6 |
| | — |
| | 331.6 |
|
| Operating income | | 625.6 |
| | — |
| | 625.6 |
|
| Interest expense | | 117.0 |
| | 0.3 |
| | 117.3 |
|
| Capital expenditures | | 596.1 |
| | — |
| | 596.1 |
|
| Total assets | | 13,121.6 |
| | — |
| | 13,121.6 |
|
|
| | | | | | | | | | | | |
2016 (in millions) | | Utility | | Other | | Wisconsin Electric Power Company Consolidated |
| Operating revenues | | $ | 3,792.8 |
| | $ | — |
| | $ | 3,792.8 |
|
| Other operation and maintenance | | 1,430.2 |
| | — |
| | 1,430.2 |
|
| Depreciation and amortization | | 325.4 |
| | — |
| | 325.4 |
|
| Operating income | | 629.5 |
| | — |
| | 629.5 |
|
| Equity in earnings of transmission affiliate | | — |
| | 55.5 |
| | 55.5 |
|
| Interest expense | | 116.6 |
| | 1.0 |
| | 117.6 |
|
| Capital expenditures | | 468.9 |
| | 0.6 |
| | 469.5 |
|
| Total assets | | 12,945.1 |
| | 426.4 |
| | 13,371.5 |
|
|
| | | | | | | | | | | | |
2015 (in millions) | | Utility | | Other | | Wisconsin Electric Power Company Consolidated |
| Operating revenues | | $ | 3,854.1 |
| | $ | — |
| | $ | 3,854.1 |
|
| Other operation and maintenance | | 1,384.9 |
| | — |
| | 1,384.9 |
|
| Depreciation and amortization | | 304.0 |
| | — |
| | 304.0 |
|
| Operating income | | 648.9 |
| | — |
| | 648.9 |
|
| Equity in earnings of transmission affiliate | | — |
| | 47.8 |
| | 47.8 |
|
| Interest expense | | 117.7 |
| | 1.3 |
| | 119.0 |
|
| Capital expenditures | | 518.8 |
| | 0.4 |
| | 519.2 |
|
| Total assets | | 12,727.6 |
| | 412.0 |
| | 13,139.6 |
|
NOTE 18—VARIABLE INTEREST ENTITIES
The primary beneficiary of a variable interest entity must consolidate the entity's assets and liabilities. In addition, certain disclosures are required for significant interest holders in variable interest entities.
We assess our relationships with potential variable interest entities, such as our coal suppliers, natural gas suppliers, coal transporters, natural gas transporters, and other counterparties related to power purchase agreements, investments, and joint ventures. In making this assessment, we consider, along with other factors, the potential that our contracts or other arrangements provide subordinated financial support, the obligation to absorb the entity's losses, the right to receive residual returns of the entity, and the power to direct the activities that most significantly impact the entity's economic performance.
American Transmission Company
As of December 31, 2016, we owned approximately 23% of ATC, a for-profit, electric transmission company regulated by the FERC and certain state regulatory commissions. However, effective January 1, 2017, we transferred our investment in ATC to another subsidiary of WEC Energy Group. ATC was a variable interest entity, but consolidation was not required since we were
|
| | |
| Wisconsin Electric Power Company | B-53 | 2017 Annual Financial Statements
|
not ATC's primary beneficiary. We did not have the power to direct the activities that most significantly impacted ATC's economic performance. At December 31, 2016, we accounted for ATC as an equity method investment. See Note 16, Investment in American Transmission Company, for more information.
Purchased Power Agreement
We have a purchased power agreement that represents a variable interest. This agreement is for 236 MW of firm capacity from a natural gas-fired cogeneration facility, and we account for it as a capital lease. The agreement includes no minimum energy requirements over the remaining term of approximately four years. We have examined the risks of the entity, including operations, maintenance, dispatch, financing, fuel costs, and other factors, and have determined that we are not the primary beneficiary of the entity. We do not hold an equity or debt interest in the entity, and there is no residual guarantee associated with the purchased power agreement.
We have approximately $71.4 million of required payments over the remaining term of this agreement. We believe that the required lease payments under this contract will continue to be recoverable in rates. Total capacity and lease payments under this contract for the years ended December 31, 2017, 2016, and 2015 were $18.0 million, $54.2 million, and $53.6 million, respectively. Our maximum exposure to loss is limited to the capacity payments under the contract.
NOTE 19—COMMITMENTS AND CONTINGENCIES
We have significant commitments and contingencies arising from our operations, including those related to unconditional purchase obligations, operating leases, environmental matters, and enforcement and litigation matters.
Unconditional Purchase Obligations
We have obligations to distribute and sell electricity and natural gas to our customers and expect to recover costs related to these obligations in future customer rates. In order to meet these obligations, we routinely enter into long-term purchase and sale commitments for various quantities and lengths of time.
The following table shows our minimum future commitments related to these purchase obligations as of December 31, 2017.
|
| | | | | | | | | | | | | | | | | | | | | | | | | | | | | | |
| | | | | | | Payments Due By Period |
| (in millions) | | Date Contracts Extend Through | | Total Amounts Committed | | 2018 | | 2019 | | 2020 | | 2021 | | 2022 | | Later Years |
| Electric utility: | | | | | | | | | | | | | | | | |
| Nuclear | | 2033 | | $ | 9,184.5 |
| | $ | 420.1 |
| | $ | 445.4 |
| | $ | 475.1 |
| | $ | 501.1 |
| | $ | 531.2 |
| | $ | 6,811.6 |
|
| Coal supply and transportation | | 2020 | | 215.0 |
| | 132.2 |
| | 53.9 |
| | 28.9 |
| | — |
| | — |
| | — |
|
| Purchased power | | 2031 | | 93.1 |
| | 29.1 |
| | 16.6 |
| | 13.7 |
| | 10.9 |
| | 9.0 |
| | 13.8 |
|
| Natural gas utility supply and transportation | | 2048 | | 462.3 |
| | 65.6 |
| | 54.8 |
| | 43.6 |
| | 30.3 |
| | 22.6 |
| | 245.4 |
|
| Total | | | | $ | 9,954.9 |
| | $ | 647.0 |
| | $ | 570.7 |
| | $ | 561.3 |
| | $ | 542.3 |
| | $ | 562.8 |
| | $ | 7,070.8 |
|
Operating Leases
We lease property, plant, and equipment under various terms. The operating leases generally require us to pay property taxes, insurance premiums, and maintenance costs associated with the leased property. Many of our leases contain one of the following options upon the end of the lease term: (a) purchase the property at the current fair market value, or (b) exercise a renewal option, as set forth in the lease agreement.
Rental expense attributable to operating leases was $4.0 million, $5.0 million, and $6.7 million in 2017, 2016, and 2015, respectively.
|
| | |
| Wisconsin Electric Power Company | B-54 | 2017 Annual Financial Statements
|
Future minimum payments under noncancelable operating leases are payable as follows:
|
| | | | |
Year Ending December 31 | | Payments (in millions) |
| 2018 | | $ | 3.5 |
|
| 2019 | | 3.4 |
|
| 2020 | | 1.9 |
|
| 2021 | | 1.4 |
|
| 2022 | | 1.5 |
|
| Later years | | 23.0 |
|
| Total | | $ | 34.7 |
|
Environmental Matters
Consistent with other companies in the energy industry, we face significant ongoing environmental compliance and remediation obligations related to current and past operations. Specific environmental issues affecting us include, but are not limited to, current and future regulation of air emissions such as SO2, NOx, fine particulates, mercury, and GHGs; water intake and discharges; disposal of coal combustion products such as fly ash; and remediation of impacted properties, including former manufactured gas plant sites.
We have continued to pursue a proactive strategy to manage our environmental compliance obligations, including:
| |
| • | the development of additional sources of renewable electric energy supply; |
| |
| • | the addition of improvements for water quality matters such as treatment technologies to meet regulatory discharge limits and improvements to our cooling water intake systems; |
| |
| • | the addition of emission control equipment to existing facilities to comply with ambient air quality standards and federal clean air rules; |
| |
| • | the protection of wetlands and waterways, threatened and endangered species, and cultural resources associated with utility construction projects; |
| |
| • | the retirement of old coal-fired power plants and conversion to modern, efficient, natural gas generation, super-critical pulverized coal generation, and/or replacement with renewable generation; |
| |
| • | the beneficial use of ash and other products from coal-fired and biomass generating units; and |
| |
| • | the remediation of former manufactured gas plant sites. |
Air Quality
8-Hour Ozone National Ambient Air Quality Standards – After completing its review of the 2008 ozone standard, the EPA released a final rule in October 2015, which lowered the limit for ground-level ozone, creating a more stringent standard than the 2008 NAAQS. In December 2017, the EPA designated all the counties along Wisconsin's Lake Michigan shoreline, except Brown, Kewaunee, Marinette, and Oconto Counties, as either partial or full nonattainment. Waukesha and Washington counties were also included due to the counties being in the Milwaukee combined statistical area. For nonattainment areas, the state of Wisconsin will have to develop a state implementation plan to bring the areas back into attainment. We will be required to comply with this state implementation plan no earlier than 2020. Although we will not know the potential impacts for complying with the 2015 ozone NAAQS until the designations are final, which is expected from the EPA in April 2018, and until the state prepares a draft attainment plan, we believe we are well positioned to meet the requirements associated with the ozone standard and do not expect to incur significant costs to comply.
Climate Change – In 2015, the EPA issued a final rule regulating GHG emissions from existing generating units, referred to as the CPP, a proposed federal plan and model trading rules as alternatives or guides to state compliance plans, and final performance standards for modified and reconstructed generating units and new fossil-fueled power plants. In October 2015, following publication of the CPP, numerous states (including Wisconsin and Michigan) and other parties, filed lawsuits challenging the final rule, including a request to stay the implementation of the final rule pending the outcome of these legal challenges. The D.C. Circuit Court of Appeals denied the stay request, but in February 2016, the Supreme Court stayed the effectiveness of the CPP until disposition of the litigation in the D.C. Circuit Court of Appeals and to the extent that further appellate review is sought, at the Supreme Court. The D.C. Circuit Court of Appeals heard one case in September 2016, and the other case is still pending. In April 2017, pursuant to motions made by the EPA, the D.C. Circuit Court of Appeals ordered the cases to be held in abeyance. Supplemental briefs were provided addressing whether the cases should be remanded to the EPA rather than held in abeyance. The EPA argued that the cases should continue to be held in abeyance pending the conclusion of the EPA's review of the CPP and any resulting rulemaking.
|
| | |
| Wisconsin Electric Power Company | B-55 | 2017 Annual Financial Statements
|
The CPP seeks to achieve state-specific GHG emission reduction goals by 2030, and would have required states to submit plans by September 2016. The goal of the final rule is to reduce nationwide GHG emissions by 32% from 2005 levels. The rule is seeking GHG emission reductions in Wisconsin and Michigan of 41% and 39%, respectively, below 2012 levels by 2030. Interim goals starting in 2022 would require states to achieve about two-thirds of the 2030 required reduction.
In March 2017, President Trump issued an executive order that, among other things, specifically directs the EPA to review, and if appropriate, initiate proceedings to suspend, revise, or rescind the CPP and related GHG regulations for new, reconstructed, or modified fossil-fueled power plants. As a result of this order and related EPA review, as well as the ongoing legal proceedings, the timelines for the GHG emission reduction goals and all other aspects of the CPP are uncertain. In April 2017, the EPA withdrew the proposed rule for a federal plan and model trading rules that were published in October 2015 for use in developing state plans to implement the CPP or for use in states where a plan is not submitted or approved. In October 2017, the EPA issued a proposed rulemaking to repeal the CPP. In December 2017, the EPA issued an advanced notice of proposed rulemaking to solicit input on whether it is appropriate to replace the CPP. In addition, the Governor of Wisconsin issued an executive order in February 2016, which prohibits state agencies, departments, boards, commissions, or other state entities from developing or promoting the development of a state plan to implement the CPP.
Notwithstanding the uncertain future of the CPP, and given current fuel and technology markets, we continue to evaluate opportunities and actions that preserve fuel diversity, lower costs for our customers, and contribute towards long-term GHG reductions. Our plan is to work with our industry partners, environmental groups, and the State of Wisconsin, with a goal of reducing CO2 emissions by approximately 40% below 2005 levels by 2030. We have implemented and continue to evaluate numerous options in order to meet our CO2 reduction goal, such as increased use of existing natural gas combined cycle units, co-firing or switching to natural gas in existing coal-fired units, reduced operation or retirement of existing coal-fired units, addition of new renewable energy resources (wind, solar), and consideration of supply and demand-side energy efficiency and distributed generation. As a result of WEC Energy Group's generation reshaping plan, we expect to retire approximately 1,547 MW of coal generation by 2020, including Pleasant Prairie power plant and PIPP. See Note 6, Property, Plant, and Equipment, for more information. In addition, we are evaluating our goal, and possible subsequent actions, with respect to national and international efforts to reduce future GHG emissions in order to limit future global temperature increases to less than two degrees Celsius.
We are required to report our CO2 equivalent emissions from our electric generating facilities under the EPA Greenhouse Gases Reporting Program. For 2016, we reported aggregated CO2 equivalent emissions of approximately 23.9 million metric tonnes to the EPA. Based upon our preliminary analysis of the data, we estimate that we will report CO2 equivalent emissions of approximately 23.5 million metric tonnes to the EPA for 2017. The level of CO2 and other GHG emissions varies from year to year and is dependent on the level of electric generation and mix of fuel sources, which is determined primarily by demand, the availability of the generating units, the unit cost of fuel consumed, and how our units are dispatched by MISO.
We are also required to report CO2 equivalent amounts related to the natural gas that our natural gas operations distribute and sell. For 2016, we reported aggregated CO2 equivalent emissions of approximately 3.7 million metric tonnes to the EPA. Based upon our preliminary analysis of the data, we estimate that we will report CO2 equivalent emissions of approximately 3.8 million metric tonnes to the EPA for 2017.
Water Quality
Clean Water Act Cooling Water Intake Structure Rule – In August 2014, the EPA issued a final regulation under Section 316(b) of the Clean Water Act, which requires that the location, design, construction, and capacity of cooling water intake structures at existing power plants reflect the Best Technology Available (BTA) for minimizing adverse environmental impacts from both impingement (entrapping organisms on water intake screens) and entrainment (drawing organisms into water intake). The rule became effective in October 2014, and applies to all of our existing generating facilities with cooling water intake structures, except for the ERGS units, which were permitted under the rules governing new facilities.
Facility owners must select from seven compliance options available to meet the impingement mortality (IM) reduction standard. The rule requires state permitting agencies to make BTA determinations, subject to EPA oversight, for IM reduction over the next several years as facility permits are reissued. Based on our assessment, we believe that existing technologies at our generating facilities satisfy the IM BTA requirements.
BTA determinations must also be made by the WDNR and MDEQ to address entrainment mortality (EM) reduction on a site-specific basis taking into consideration several factors. We have received an EM BTA determination by the WDNR, with EPA concurrence, for our intake modification at VAPP. Due to our plans to retire PIPP and Pleasant Prairie power plant, we do not believe that BTA determinations for EM will be necessary for these facilities. Although we currently believe that existing technologies at PWGS and OC 5 through OC 8 satisfy the EM BTA requirements, BTA determinations to address EM reduction requirements will not be made until discharge permits are renewed for these facilities. Until that time, we cannot yet determine
|
| | |
| Wisconsin Electric Power Company | B-56 | 2017 Annual Financial Statements
|
what, if any, intake structure or operational modifications will be required to meet the new EM BTA requirements at these other facilities. During 2018, we will continue to evaluate options to address the EM BTA requirements at these plants.
We have also provided information to the WDNR and the MDEQ about planned unit retirements. Based on discussions with the MDEQ, if we submit a signed certification stating that PIPP will be retired no later than the end of the next permit cycle (assumed to be October 1, 2023), the EM BTA requirements will be waived. We expect to submit the letter identifying the last operating date for PIPP to the MDEQ during 2018, ahead of when the agency begins processing our pending application for the National Pollutant Discharge Elimination System permit reissuance.
We believe our fleet overall is well positioned to meet the new regulation and do not expect to incur significant costs to comply with this regulation.
Steam Electric Effluent Limitation Guidelines – The EPA's final steam electric effluent limitation guidelines (ELG) rule took effect in January 2016. Various petitions challenging the rule were consolidated and are pending in the United States Fifth Circuit Court of Appeals. In April 2017, the EPA issued an administrative stay of certain compliance deadlines while further reviewing the rule. In September 2017, the EPA issued a final rule to postpone the earliest compliance dates for the bottom ash transport water and wet flue gas desulfurization wastewater requirements. This rule applies to wastewater discharges from our power plant processes in Wisconsin and Michigan. While the ELG compliance deadlines are postponed, the WDNR and the MDEQ have indicated that they will refrain from incorporating certain new requirements into any reissued discharge permits between 2018 and 2023.
After a final rule is back in effect, the WDNR and MDEQ have indicated that they will modify the state rules as necessary and incorporate the new requirements into our facility permits, which are renewed every five years. Our power plant facilities already have advanced wastewater treatment technologies installed that meet many of the discharge limits established by this rule. However, as currently constructed, the ELG rule will require additional wastewater treatment retrofits as well as installation of other equipment to minimize process water use.
The final rule would phase in new or more stringent requirements related to limits of arsenic, mercury, selenium, and nitrogen in wastewater discharged from wet scrubber systems. New requirements for wet scrubber wastewater treatment would require additional zero liquid discharge or other advanced treatment capital improvements for the OCPP and ERGS. The rule also would require dry fly ash handling, which is already in place at all of our power plants. Dry bottom ash transport systems are required by the new rule, and modifications would be required at OC 7 and OC 8. We are beginning preliminary engineering for compliance with the rule and estimate approximately $50 million will be required to design and install these advanced treatment and bottom ash transport systems. This estimate reflects the planned retirements of certain of our generation plants as a result of WEC Energy Group's generation reshaping plan discussed in Climate Change above.
Land Quality
Manufactured Gas Plant Remediation – We have identified sites at which we or a predecessor company owned or operated a manufactured gas plant or stored manufactured gas. We have also identified other sites that may have been impacted by historical manufactured gas plant activities. We are responsible for the environmental remediation of these sites. We are also working with various state jurisdictions in our investigation and remediation planning. These sites are at various stages of investigation, monitoring, remediation, and closure.
The future costs for detailed site investigation, future remediation, and monitoring are dependent upon several variables including, among other things, the extent of remediation, changes in technology, and changes in regulation. Historically, our regulators have allowed us to recover incurred costs, net of insurance recoveries and recoveries from potentially responsible parties, associated with the remediation of manufactured gas plant sites. Accordingly, we have established regulatory assets for costs associated with these sites.
We have established the following regulatory assets and reserves related to manufactured gas plant sites as of December 31:
|
| | | | | | | | |
| (in millions) | | 2017 | | 2016 |
| Regulatory assets | | $ | 30.4 |
| | $ | 29.9 |
|
| Reserves for future remediation | | 18.5 |
| | 19.0 |
|
|
| | |
| Wisconsin Electric Power Company | B-57 | 2017 Annual Financial Statements
|
Renewables, Efficiency, and Conservation
Wisconsin Legislation – In 2005, Wisconsin enacted Act 141, which established a goal that 10% of all electricity consumed in Wisconsin be generated by renewable resources by December 31, 2015. We have achieved a renewable energy percentage of 8.27% and met our compliance requirements by constructing various wind parks, a biomass facility, and by also relying on renewable energy purchases. We continue to review our renewable energy portfolio and acquire cost-effective renewables as needed to meet our requirements on an ongoing basis. The PSCW administers the renewable program related to Act 141, and we fund the program, along with other utilities, based on 1.2% of our annual operating revenues.
Michigan Legislation – In 2008, Michigan enacted Act 295, which required 10% of the state's electric energy to come from renewables by 2015 and energy optimization (efficiency) targets up to 1% annually by 2015. In December 2016, Michigan revised this legislation with Act 342, which requires additional renewable energy requirements beyond 2015. The new legislation retains the 10% renewable energy portfolio requirement for years 2017 through 2018, increases the requirement to 12.5% for years 2019 through 2020, and increases the requirement to 15.0% for 2021. We were in compliance with these requirements as of December 31, 2017. The revised legislation continues to allow recovery of costs incurred to meet the standards and provides for ongoing review and revision to assure the measures taken are cost-effective.
Enforcement and Litigation Matters
We are involved in legal and administrative proceedings before various courts and agencies with respect to matters arising in the ordinary course of business. Although we are unable to predict the outcome of these matters, management believes that appropriate reserves have been established and that final settlement of these actions will not have a material effect on our financial condition or results of operations.
NOTE 20—SUPPLEMENTAL CASH FLOW INFORMATION
|
| | | | | | | | | | | | |
| (in millions) | | 2017 | | 2016 | | 2015 |
| Cash (paid) for interest, net of amount capitalized | | $ | (115.1 | ) | | $ | (116.2 | ) | | $ | (116.2 | ) |
| Cash (paid) received for income taxes, net | | (71.7 | ) | | 100.2 |
| | (58.5 | ) |
| Significant non-cash transactions: | | | | | | |
| Accounts payable related to construction costs | | 13.2 |
| | 9.1 |
| | 11.7 |
|
Transfer of investment in ATC to another subsidiary of WEC Energy Group (1) (2) | | 415.4 |
| | — |
| | — |
|
Transfer of net assets to UMERC (1) | | 61.1 |
| | — |
| | — |
|
| Equity settlement of a short-term note receivable between Bostco and our parent company | | 4.8 |
| | — |
| | — |
|
| |
(1) | See Note 4, Related Parties, for more information on these transactions. |
| |
(2) | The amount transferred includes a $13.4 million receivable for distributions approved and recorded in December 2016. |
NOTE 21—REGULATORY ENVIRONMENT
Tax Cuts and Jobs Act of 2017
As ordered by the PSCW, we deferred for return to ratepayers, through future refunds, bill credits, or reductions in other regulatory assets, the estimated tax benefit of $1,065 million related to the Tax Legislation that was signed into law in December 2017. This tax benefit resulted from the revaluation of deferred taxes. See Note 12, Income Taxes, for more information.
2018 and 2019 Rates
During April 2017, we, along with WG and WPS, filed an application with the PSCW for approval of a settlement agreement we made with several of our commercial and industrial customers regarding 2018 and 2019 base rates. In September 2017, the PSCW issued an order that approved the settlement agreement, which freezes base rates through 2019 for our electric and natural gas customers. Based on the PSCW order, our authorized ROE remains at 10.2%, and our current capital cost structure will remain unchanged through 2019. Various intervenors had filed requests for rehearing, all of which have been denied.
In addition to freezing base rates, the settlement agreement extends and expands the electric real-time market pricing program options for large commercial and industrial customers and mitigates the continued growth of certain escrowed costs during the base rate freeze period by accelerating the recognition of certain tax benefits.
Pursuant to the settlement agreement, we also agreed to keep our earnings sharing mechanism in place through 2019. Under this earnings sharing mechanism, if we earn above our authorized ROE, 50% of the first 50 basis points of additional utility earnings must be shared with customers. All utility earnings above the first 50 basis points must also be shared with customers.
|
| | |
| Wisconsin Electric Power Company | B-58 | 2017 Annual Financial Statements
|
Natural Gas Storage Facilities in Michigan
In January 2017, WEC Energy Group signed an agreement for the acquisition of Bluewater. Bluewater owns natural gas storage facilities in Michigan that would provide a portion of the current storage needs for our natural gas utility operations. As a result of this agreement, we, along with WG and WPS, filed a request with the PSCW in February 2017 for a declaratory ruling on various items associated with the storage facilities. In the filing, we requested that the PSCW review and confirm the reasonableness and prudency of our potential long-term storage service agreement and interstate natural gas transportation contracts related to the storage facilities. We also requested approval to amend WEC Energy Group's AIA to ensure WBS and WEC Energy Group's other subsidiaries could provide services to the storage facilities. During June 2017, the PSCW granted, subject to various conditions, these declarations and approvals, and WEC Energy Group acquired Bluewater on June 30, 2017. In September 2017, we entered into the long-term service agreement for the natural gas storage, which was then approved by the PSCW in November 2017.
Formation of Upper Michigan Energy Resources Corporation
In December 2016, both the MPSC and the PSCW approved the operation of UMERC, a subsidiary of WEC Energy Group, as a stand-alone utility in the Upper Peninsula of Michigan, and UMERC became operational effective January 1, 2017. This utility holds the electric and natural gas distribution assets, previously held by WPS and us, located in the Upper Peninsula of Michigan.
In August 2016, WEC Energy Group entered into an agreement with Tilden, under which Tilden will purchase electric power from UMERC for its iron ore mine for 20 years, contingent upon UMERC's construction of approximately 180 MW of natural gas-fired generation in the Upper Peninsula of Michigan.
In October 2017, the MPSC approved both the agreement with Tilden and UMERC's application for a certificate of necessity to begin construction of the proposed generation. The new units are expected to begin commercial operation in 2019 and should allow for the retirement of PIPP no later than 2020. Tilden will remain our customer until this new generation begins commercial operation.
2015 Wisconsin Rate Order
In May 2014, we applied to the PSCW for a biennial review of costs and rates. In December 2014, the PSCW approved the following rate adjustments, effective January 1, 2015:
| |
| • | A net bill increase related to non-fuel costs for our retail electric customers of approximately $2.7 million (0.1%) in 2015. This amount reflected the receipt of SSR payments from MISO that were higher than we anticipated when we filed our rate request in May 2014, as well as an offset of $26.6 million related to a refund of prior fuel costs and the remainder of the proceeds from a Treasury Grant that we received in connection with our biomass facility. The majority of this $26.6 million was returned to customers in the form of bill credits in 2015. |
| |
| • | A rate increase for our retail electric customers of $26.6 million (0.9%) in 2016, related to the expiration of the bill credits provided to customers in 2015. |
| |
| • | A rate decrease of $13.9 million (-0.5%) in 2015 related to a forecasted decrease in fuel costs. |
| |
| • | A rate decrease of $10.7 million (-2.4%) for our natural gas customers in 2015, with no rate adjustment in 2016. |
| |
| • | A rate increase of approximately $0.5 million (2.0%) for our Downtown Milwaukee (Valley) steam utility customers in 2015, with no rate adjustment in 2016. |
| |
| • | A rate increase of approximately $1.2 million (7.3%) for our Milwaukee County steam utility customers in 2015, with no rate adjustment in 2016. As a result of the sale of the MCPP, we no longer have any Milwaukee County steam utility customers. See Note 3, Dispositions, for more information about the sale of the MCPP. |
Our authorized ROE was set at 10.2%, and our common equity component remained at an average of 51%. The PSCW order reaffirmed the deferral of our transmission costs, and it verified that 2015 and 2016 fuel costs should continue to be monitored using a 2% tolerance window. The PSCW order also authorized escrow accounting for SSR revenues because of the uncertainty of the actual revenues we will receive under the PIPP SSR agreements. Under escrow accounting, we record SSR revenues of $90.7 million a year. If actual SSR payments from MISO exceed $90.7 million a year, the difference is deferred and returned to customers, with interest, in a future rate case. If actual SSR payments from MISO are less than $90.7 million a year, the difference is deferred and is expected to be recovered from customers with interest, in a future rate case.
|
| | |
| Wisconsin Electric Power Company | B-59 | 2017 Annual Financial Statements
|
Earnings Sharing Agreement
In May 2015, the PSCW approved the acquisition of Integrys subject to the condition of an earnings sharing mechanism for us. See Note 2, Acquisitions, for more information on this earnings sharing mechanism.
NOTE 22—QUARTERLY FINANCIAL INFORMATION (Unaudited)
|
| | | | | | | | | | | | | | | | | | | | |
| (in millions) | | First Quarter | | Second Quarter | | Third Quarter | | Fourth Quarter | | Total |
| 2017 | | | | | | | | | | |
| Operating revenues | | $ | 972.0 |
| | $ | 855.4 |
| | $ | 943.8 |
| | $ | 940.5 |
| | $ | 3,711.7 |
|
| Operating income | | 185.1 |
| | 142.8 |
| | 163.4 |
| | 134.3 |
| | 625.6 |
|
| Net income attributed to common shareholder | | 101.8 |
| | 75.3 |
| | 89.4 |
| | 69.1 |
| | 335.6 |
|
| | | | | | | | | | | |
| 2016 | | | | | | | | | | |
| Operating revenues | | $ | 975.5 |
| | $ | 877.2 |
| | $ | 1,023.8 |
| | $ | 916.3 |
| | $ | 3,792.8 |
|
| Operating income | | 181.5 |
| | 146.9 |
| | 196.4 |
| | 104.7 |
| | 629.5 |
|
| Net income attributed to common shareholder | | 107.3 |
| | 82.6 |
| | 115.2 |
| | 59.2 |
| | 364.3 |
|
Due to various factors, the quarterly results of operations are not necessarily comparable.
NOTE 23—NEW ACCOUNTING PRONOUNCEMENTS
Revenue Recognition
In May 2014, the FASB and the International Accounting Standards Board issued their joint revenue recognition standard, ASU 2014-09, Revenue from Contracts with Customers. Several amendments were issued subsequent to the standard to clarify the guidance. The core principle of the guidance is to recognize revenue in an amount that an entity is entitled to receive in exchange for goods and services. The guidance also requires additional disclosures about the nature, amount, timing, and uncertainty of revenues and the related cash flows arising from contracts with customers.
We have completed the review of our contracts with customers and are finalizing the related financial disclosures to evaluate the impact of the amended guidance on our existing revenue recognition policies and procedures. We have evaluated the nature of our operating revenues and do not expect that there will be a significant shift in the timing or pattern of revenue recognition. Most of our revenues are from regulated tariff sales, which are in the scope of the new standard, excluding the revenue component related to alternative revenue programs. The revenues from these contracts are recorded at the amount of the electricity or natural gas delivered to the customer during the period.
We adopted this standard for interim and annual periods beginning January 1, 2018, as required, and used the modified retrospective method of adoption. The most significant impact to the financial statements is expected to be in the form of additional disclosures. However, we do not expect to have a cumulative-effect adjustment to record on the balance sheet as of the beginning of 2018; and therefore, do not expect to include a reconciliation of results under the new revenue recognition guidance compared with what would have been reported in 2018 under the old revenue recognition guidance. We will include disaggregated revenue disclosures by segment, major products (electric and natural gas), and customer class in the combined notes to the financial statements, starting in the first quarter of 2018.
Recognition and Measurement of Financial Instruments
In January 2016, the FASB issued ASU 2016-01, Recognition and Measurement of Financial Assets and Liabilities. This guidance requires equity investments, including other ownership interests such as partnerships, unincorporated joint ventures, and limited liability companies, to be measured at fair value with changes in fair value recognized in net income. It also simplifies the impairment assessment of equity investments without readily determinable fair values and amends certain disclosure requirements associated with the fair value of financial instruments. This ASU does not apply to investments accounted for under the equity method of accounting. As required, we adopted this ASU for interim and annual periods beginning January 1, 2018. We do not believe the adoption of this guidance will have a significant impact on our financial statements.
|
| | |
| Wisconsin Electric Power Company | B-60 | 2017 Annual Financial Statements
|
Leases
In February 2016, the FASB issued ASU 2016-02, Leases. This guidance is effective for fiscal years, and interim periods within those fiscal years, beginning after December 15, 2018, and will be applied using a modified retrospective approach. The main provision of this ASU is that lessees will be required to recognize lease assets and lease liabilities for most leases, including those classified as operating leases under GAAP. We are currently assessing the effects this guidance may have on our financial statements.
Financial Instruments Credit Losses
In June 2016, the FASB issued ASU 2016-13, Measurement of Credit Losses on Financial Instruments. This guidance is effective for fiscal years, and interim periods within those fiscal years, beginning after December 15, 2019. This ASU introduces a new impairment model known as the current expected credit loss model. The ASU requires a financial asset measured at amortized cost to be presented at the net amount expected to be collected. Previously, recognition of the full amount of credit losses was generally delayed until the loss was probable of occurring. We are currently assessing the effects this guidance may have on our financial statements.
Classification of Certain Cash Receipts and Cash Payments
In August 2016, the FASB issued ASU 2016-15, Classification of Certain Cash Receipts and Cash Payments. There are eight main provisions of this ASU for which current GAAP either is unclear or does not include specific guidance. As required, we adopted this ASU for interim and annual periods beginning January 1, 2018 and used a retrospective transition method. We do not believe the adoption of this guidance will have a significant impact on our financial statements.
Improving the Presentation of Net Periodic Pension Cost and Net Periodic Postretirement Benefit Cost
In March 2017, the FASB issued ASU 2017-07, Improving the Presentation of Net Periodic Pension Cost and Net Periodic Postretirement Benefit Cost. Under this ASU, an employer is required to disaggregate the service cost component from the other components of the net benefit cost. The amendments provide explicit guidance on how to present the service cost component and the other components of the net benefit cost in the income statement and allow only the service cost component of the net benefit cost to be eligible for capitalization. As required, we adopted this ASU for interim and annual periods beginning January 1, 2018. The amendments will be applied retrospectively for the presentation of the service cost component and the other components of the net benefit cost in the income statement, and prospectively for the capitalization of the service cost component in assets. As a result of the application of accounting principles for rate regulated entities, a similar amount of net benefit cost (including non-service components) will be recognized in our financial statements consistent with the current rate-making treatment. The impacts of adoption will be limited to changes in classification of non-service costs in the income statements.
|
| | |
| Wisconsin Electric Power Company | B-61 | 2017 Annual Financial Statements
|
|
| | |
| Wisconsin Electric Power Company | B-62 | 2017 Annual Financial Statements
|
WISCONSIN ELECTRIC POWER COMPANY
COMPARATIVE SELECTED FINANCIAL DATA AND OTHER STATISTICS
|
| | | | | | | | | | | | | | | | | | | | |
| As of or for Year Ended December 31 | | | | | | | | | | |
| (in millions) | | 2017 (1) | | 2016 | | 2015 | | 2014 | | 2013 |
| Operating revenues | | $ | 3,711.7 |
| | $ | 3,792.8 |
| | $ | 3,854.1 |
| | $ | 4,059.4 |
| | $ | 3,800.2 |
|
| Net income attributed to common shareholder | | 335.6 |
| | 364.3 |
| | 375.7 |
| | 376.7 |
| | 360.0 |
|
| Total assets | | 13,121.6 |
| | 13,371.5 |
| | 13,139.6 |
| | 12,597.2 |
| | 12,207.2 |
|
| Long-term debt and capital lease obligations (excluding current portion) | | 5,236.1 |
| | 5,417.6 |
| | 5,351.3 |
| | 4,875.2 |
| | 4,876.7 |
|
| |
(1) | Includes the impact of the transfer of our investment in ATC to another subsidiary of WEC Energy Group and the impact of the transfer of net assets to UMERC. See Note 4, Related Parties, for more information on these transactions. |
|
| | |
| Wisconsin Electric Power Company | B-63 | 2017 Annual Financial Statements
|
MARKET FOR OUR COMMON EQUITY AND RELATED STOCKHOLDER MATTERS
DIVIDENDS
Dividends declared on our common stock during the two most recent fiscal years are set forth below. Dividends were paid entirely in cash to our sole common shareholder, WEC Energy Group. There is no established public trading market for our common stock.
|
| | | | | | | | |
| Quarter | | | | |
| (in millions) | | 2017 | | 2016 |
| First | | $ | 60.0 |
| | $ | 160.0 |
|
| Second | | 60.0 |
| | 60.0 |
|
| Third | | 60.0 |
| | 100.0 |
|
| Fourth | | 60.0 |
| | 135.0 |
|
| Total | | $ | 240.0 |
| | $ | 455.0 |
|
Subject to any regulatory restriction or other limitations on the payment of dividends, future dividends will be at the discretion of the Board of Directors and will depend upon, among other factors, our earnings, financial condition, and other requirements.
Various financing arrangements and regulatory requirements impose certain restrictions on our ability to transfer funds to WEC Energy Group in the form of cash dividends, loans or advances. Under Wisconsin law, we are prohibited from loaning funds, either directly or indirectly, to WEC Energy Group. See Note 8, Common Equity, for more information regarding restrictions on our ability to pay dividends.
|
| | |
| Wisconsin Electric Power Company | B-64 | 2017 Annual Financial Statements
|
DIRECTORS AND EXECUTIVE OFFICERS
DIRECTORS
The information under "Nominees for Election to the Board of Directors" in Wisconsin Electric Power Company's definitive Information Statement dated March 29, 2018, attached hereto, is incorporated herein by reference.
EXECUTIVE OFFICERS
The names and positions as of December 31, 2017 of Wisconsin Electric's executive officers are listed below.
Allen L. Leverett (1) - Chairman of the Board and Chief Executive Officer.
J. Kevin Fletcher - President.
Robert M. Garvin - Executive Vice President-External Affairs.
Scott J. Lauber - Executive Vice President and Chief Financial Officer.
Susan H. Martin (2) - Executive Vice President, General Counsel and Corporate Secretary.
Tom Metcalfe - Executive Vice President-Generation.
Joan M. Shafer (3) - Executive Vice President-Human Resources and Organizational Effectiveness.
William J. Guc - Vice President and Controller.
James A. Schubilske - Vice President and Treasurer.
| |
(1) | In October 2017, WEC Energy Group filed a Form 8-K to disclose that Allen L. Leverett had suffered a stroke. In response, the Board of Directors of WEC Energy Group appointed Gale E. Klappa as Chairman of the Board and Chief Executive Officer of WEC Energy Group until such time as Mr. Leverett is able to resume those responsibilities. In addition, Wisconsin Electric’s Board of Directors appointed Mr. Klappa as Chairman of the Board and Chief Executive Officer of the Company effective January 1, 2018. |
| |
(2) | In July 2017, the Company announced Ms. Martin’s intent to retire in early 2018. As part of that transition, effective January 1, 2018, Margaret C. Kelsey was appointed Executive Vice President, General Counsel, and Corporate Secretary of the Company, and Ms. Martin was appointed Executive Vice President of the Company. |
| |
(3) | Ms. Shafer announced that she will be retiring effective May 1, 2018. |
|
| | |
| Wisconsin Electric Power Company | B-65 | 2017 Annual Financial Statements
|