Wisconsin Electric Power Company PFD 6% (WELPM)
Filed: 2 Apr 15, 12:00am
UNITED STATES
SECURITIES AND EXCHANGE COMMISSION
Washington, D.C. 20549
SCHEDULE 14C
Information Statement Pursuant to Section 14(c)
of the Securities Exchange Act of 1934 (Amendment No. )
Check the appropriate box: | ||||
| ¨ | Preliminary Information Statement | |||
| ¨ | Confidential, for Use of the Commission Only (as permitted by Rule 14c-5(d)(2)) | |||
| x | Definitive Information Statement | |||
| Wisconsin Electric Power Company | ||||
| (Name of Registrant As Specified In Charter) | ||||
Payment of Filing Fee (Check the appropriate box): | ||||
| x | No fee required | |||
| ¨ | Fee computed on table below per Exchange Act Rules 14c-5(g) and 0-11. | |||
| (1) | Title of each class of securities to which transaction applies: | |||
| ||||
| (2) | Aggregate number of securities to which transaction applies: | |||
| ||||
| (3) | Per unit price or other underlying value of transaction computed pursuant to Exchange Act Rule 0-11 (Set forth the amount on which the filing fee is calculated and state how it was determined): | |||
| ||||
| (4) | Proposed maximum aggregate value of transaction: | |||
| ||||
| (5) | Total fee paid: | |||
| ||||
| ¨ | Fee paid previously with preliminary materials. | |||
| ¨ | Check box if any part of the fee is offset as provided by Exchange Act Rule 0-11(a)(2) and identify the filing for which the offsetting fee was paid previously. Identify the previous filing by registration statement number, or the Form or Schedule and the date of its filing | |||
| (1) | Amount Previously Paid: | |||
| ||||
| (2) | Form, Schedule or Registration Statement No.: | |||
| ||||
| (3) | Filing Party: | |||
| ||||
| (4) | Date Filed: | |||
| ||||
Gale E. Klappa | ||
| Chairman, President and | ||
| Chief Executive Officer | ||
| 231 W Michigan Street | ||
| Milwaukee, WI 53203 |
April 2, 2015
Dear Preferred Stockholder:
Wisconsin Electric Power Company, which does business under the trade name of We Energies, will hold its Annual Meeting of Stockholders on Thursday, April 30, 2015, at 10:00 a.m., in the Resource Center on the first floor of the Public Service Building, 231 West Michigan Street, Milwaukee, Wisconsin 53203.
We are not soliciting proxies for this meeting, as more than 99% of the voting stock is owned, and will be voted, by Wisconsin Electric Power Company’s parent, Wisconsin Energy Corporation. If you wish, you may vote your shares of preferred stock in person at the meeting; however, the business session will be very brief.
As an alternative, you might consider attending Wisconsin Energy Corporation’s Annual Meeting of Stockholders to be held Thursday, May 7, 2015, at 10:00 a.m., Central time, at Concordia University Wisconsin in the R. John Buuck Field House located at 12800 North Lake Shore Drive, Mequon, Wisconsin 53097.
By attending this meeting, you would have the opportunity to meet many of the Wisconsin Electric Power Company officers and directors. Although you cannot vote your shares of Wisconsin Electric Power Company preferred stock at the Wisconsin Energy Corporation meeting, you may find the activities worthwhile.
You must pre-register and present photo identification at the door to attend Wisconsin Energy Corporation’s Annual Meeting. To pre-register for the meeting, please contact Wisconsin Energy Corporation’s Stockholder Services, 231 West Michigan Street, P.O. Box 1331, Milwaukee, Wisconsin 53201, or simply call 800-881-5882 or emailWEC.Stockholder-Services.Contact@wisconsinenergy.com and provide proof of your ownership of preferred stock, including a bank or brokerage firm account statement or a letter from the broker, trustee, bank or nominee holding your shares.
The annual report of Wisconsin Electric is attached as Appendix A to this information statement. If you have any questions or would like a copy of the Wisconsin Energy Corporation annual report, please call our toll-free stockholder hotline at 800-881-5882.
Thank you for your support.
Sincerely,

NOTICE OF ANNUAL MEETING OF STOCKHOLDERS
April 2, 2015
To the Stockholders of Wisconsin Electric Power Company:
The 2015 Annual Meeting of Stockholders of Wisconsin Electric Power Company will be held on Thursday, April 30, 2015, at 10:00 a.m., Central time, in the Resource Center on the first floor of the Public Service Building, 231 West Michigan Street, Milwaukee, Wisconsin 53203, for the following purposes:
| 1. | To elect the nine members of the Board of Directors to hold office until the 2016 Annual Meeting of Stockholders; and |
| 2. | To consider any other matters that may properly come before the meeting. |
Stockholders of record at the close of business on February 26, 2015, are entitled to vote. The following pages provide additional details about the meeting as well as other useful information.
Important Notice Regarding the Availability of Materials Related to the Stockholder Meeting to Be Held on April 30, 2015 – The Information Statement and 2014 Annual Report to Stockholders are available at:
www.wisconsinelectric.com
By Order of the Board of Directors,
Susan H. Martin
Executive Vice President, General Counsel and Corporate Secretary
 |
We Energies | |||||||
| 231 West Michigan Street | ||||||||
| Milwaukee, Wisconsin 53203 |
INFORMATION STATEMENT
This information statement is being furnished to stockholders beginning on or about April 2, 2015, in connection with the annual meeting of stockholders of Wisconsin Electric Power Company (“WE” or the “Company”) to be held on Thursday, April 30, 2015 (the “Meeting”), at 10:00 a.m., Central time, in the Resource Center on the first floor of the Public Service Building, 231 West Michigan Street, Milwaukee, Wisconsin 53203, and all adjournments or postponements of the Meeting, for the purposes listed in the preceding Notice of Annual Meeting of Stockholders. If you need directions to the Meeting, please call our toll-free stockholder hotline at 800-881-5882. The WE annual report to stockholders is attached as Appendix A to this information statement.
We are not asking you for a proxy and you are requested not to send us a proxy.However, you may vote your shares of preferred stock at the Meeting.
VOTING SECURITIES
As of February 26, 2015, WE had outstanding 44,498 shares of $100 par value Six Per Cent. Preferred Stock; 260,000 shares of $100 par value 3.60% Serial Preferred Stock; and 33,289,327 shares of common stock. Each outstanding share of each class is entitled to one vote. Stockholders of record at the close of business on February 26, 2015 will be entitled to vote at the Meeting. In order to conduct the Meeting, a majority of the outstanding shares entitled to vote must be represented at the Meeting. This is known as a “quorum.” All of WE’s outstanding common stock, representing more than 99% of its voting securities, is owned by its parent company, Wisconsin Energy Corporation (“WEC”), and will be represented at the Meeting. The principal business address of WEC is 231 West Michigan Street, Milwaukee, Wisconsin 53203. A list of stockholders of record entitled to vote at the Meeting will be available for inspection by stockholders at WE’s principal business office at 231 West Michigan Street, Milwaukee, Wisconsin 53203, prior to and at the Meeting.
INTERNET AVAILABILITY OF INFORMATION
The following documents can be found atwww.wisconsinelectric.com:
| • | Notice of Annual Meeting; |
| • | Information Statement; and |
| • | 2014 Annual Report to Stockholders. |
ELECTION OF DIRECTORS
At the Meeting, there will be an election of nine directors. Based upon the recommendation of the Corporate Governance Committee of WEC’s Board of Directors, the individuals named below have been nominated by the WE Board of Directors (the “Board”) to serve a one-year term expiring at the 2016 Annual Meeting of Stockholders and until they are re-elected or until their respective successors are duly elected and qualified. Currently, directors of WEC also serve as the directors of WE.
Directors will be elected by a plurality of the votes cast by the shares entitled to vote, as long as a quorum is present. “Plurality” means that the individuals who receive the largest number of votes are elected as directors up to the maximum number of directors to be chosen. Therefore, shares not voted, whether by withheld authority or otherwise, have no effect in the election of directors.
Each nominee has consented to being nominated and to serve if elected. In the unlikely event that any nominee becomes unable to serve for any reason, the WE Board will select a substitute nominee based upon the recommendation of the Corporate Governance Committee of WEC’s Board of Directors.
| Wisconsin Electric Power Company | 1 | 2015 Annual Meeting Information Statement |
Director Nominees
WEC’s Corporate Governance Committee evaluates each individual director nominee in the context of the WEC and WE Boards as a whole with the goal of recommending nominees with diverse backgrounds and experience that, together, can best perpetuate the success of WEC’s and WE’s businesses and represent stockholder interests. In addition to the specific experiences and skills of each individual director nominee as identified below, the WEC Corporate Governance Committee believes that all director nominees should generally possess certain characteristics and skills.
Director Candidate Criteria. WE Relies on WEC’s Corporate Governance Committee to identify and evaluate director nominees. WEC’s Corporate Governance Committee has established criteria for evaluating all director candidates, which are reviewed annually. As set forth in WEC’s Corporate Governance Guidelines, these include: proven integrity; mature and independent judgment; vision and imagination; ability to objectively appraise problems; ability to evaluate strategic options and risks; sound business experience and acumen; relevant technological, political, economic, or social/cultural expertise; social consciousness; achievement of prominence in career; familiarity with national and international issues affecting WEC’s and the Company’s businesses; contribution to the Board’s desired diversity and balance; and, in the case of new directors, availability to serve for five years before reaching the directors’ retirement age of 72.
Board Diversity. WEC’s Corporate Governance Committee does not have a specific policy with regards to the consideration of diversity in identifying director nominees. However, WEC’s Corporate Governance Committee strives to recommend candidates who each bring a unique perspective to the Board in order to contribute to the collective diversity of the Board. As part of its process in connection with the nomination of new directors to the Board, the WEC Corporate Governance Committee considers several factors to ensure the entire Board collectively embraces a wide variety of characteristics, including professional background, experience, skills, and knowledge, as well as the criteria listed above. Each candidate will generally exhibit different and varying degrees of these characteristics.
Director Independence. Prior to nomination, both new and returning directors are evaluated to ensure compliance with the Board’s standards of independence. Additionally, WEC’s Corporate Governance Committee reviews potential conflicts of interest, including interlocking directorships and substantial business, civic, and/or social relationships with other members of the Board, that could impair the prospective Board member’s ability to act independently from the other Board members and management.
Director Nominee Evaluation Process. Once a person has been identified by WEC’s Corporate Governance Committee as a potential candidate, WEC’s Corporate Governance Committee may collect and review publicly available information regarding the person to assess whether that person should be considered further. If WEC’s Corporate Governance Committee determines that the candidate warrants further consideration, the chair or another member of the Board of Directors contacts the person. Generally, if the person expresses a willingness to be considered and to serve on the Board, WEC’s Corporate Governance Committee requests additional information from the candidate, reviews the person’s accomplishments and qualifications, and conducts one or more interviews with the candidate. In certain instances, WEC’s Corporate Governance Committee members may contact one or more references provided by the candidate or may contact other members of the business community or other persons who may have greater firsthand knowledge of the candidate’s accomplishments.
WEC’s Corporate Governance Committee evaluates all candidates, including those proposed by stockholders, using the criteria and process described above. The process is designed to provide the Board with a diversity of experience and stability to allow it to effectively meet the many challenges WE and WEC face in today’s challenging economic environment.
| Wisconsin Electric Power Company | 2 | 2015 Annual Meeting Information Statement |
Nominees for Election to the Board of Directors. Biographical information regarding each nominee is shown below. WE and Wisconsin Gas LLC (WG) do business as We Energies and are subsidiaries of WEC. Ages and biographical information are as of March 1, 2015
John F. Bergstrom. Age 68.
| • | Bergstrom Corporation – Chairman and Chief Executive Officer since 1982. Bergstrom Corporation owns and operates numerous automobile sales and leasing companies. |
| • | Director of Advance Auto Parts Inc. since 2008; Director of Associated Banc-Corp since 2010; and Director of Kimberly-Clark Corporation since 1987. |
| • | Director of Wisconsin Energy Corporation since 1987, Wisconsin Electric Power Company since 1985, and Wisconsin Gas LLC since 2000. |
Mr. Bergstrom has over 30 years of experience as CEO of Bergstrom Corporation, one of the top 50 automotive dealership groups in America, with dealerships across eastern Wisconsin, including several in We Energies’ utility service territories. Therefore, Mr. Bergstrom provides the Board experience and insight with respect to understanding the needs of the Company’s retail customers, as well as Wisconsin’s business environment. As the CEO of a large, diverse retailer, Mr. Bergstrom has a deep understanding of executive compensation issues and challenges and is well qualified to provide perspective on customer focus and satisfaction which continues to be a primary focus of the Company. Mr. Bergstrom also provides the Board with insight gained from his over 29 years of service as a director on WEC’s and its affiliates’ Boards, over 50 years of combined experience as a director on the boards of several other publicly traded U.S. corporations, and past or present directorships on the boards of several regional non-profit entities, including the Green Bay Packers, Inc.
Barbara L. Bowles. Age 67.
| • | Profit Investment Management – Retired Vice Chair. Served as Vice Chair from January 2006 until retirement in December 2007. Profit Investment Management is an investment advisory firm. |
| • | The Kenwood Group, Inc. – Retired Chairman. Served as Chairman from 2000 until 2006 when The Kenwood Group, Inc. merged into Profit Investment Management. Chief Executive Officer from 1989 to 2005. |
| • | Director of Hospira, Inc. since 2008. |
| • | Director of Black & Decker Corporation from 1993 to 2010. |
| • | Director of Wisconsin Energy Corporation and Wisconsin Electric Power Company since 1998, and Wisconsin Gas LLC since 2000. |
As founder, president and CEO of The Kenwood Group, Inc., a Chicago-based investment advisory firm that managed pension funds for corporations, public institutions and endowments, Ms. Bowles has over 19 years of investment advisory experience. Before founding The Kenwood Group, Ms. Bowles, who is a Chartered Financial Analyst, was a chief investor relations officer for two Fortune 50 companies. Prior to that, she served as a portfolio manager and utility analyst for more than 10 years. With this combined experience, Ms. Bowles is well qualified to provide perspective to the Board as to what issues are important to large investors, particularly what is important to analysts covering the Company’s industry. Ms. Bowles also served as chief compliance officer for the mid-cap portfolios following The Kenwood Group’s merger with Profit Investment Management, through which she gained a deep understanding of corporate governance issues and concerns. This experience is invaluable for Ms. Bowles’ positions as chair of the WEC Corporate Governance Committee and presiding independent director. Ms. Bowles’ past and present service as a director of other public companies, including service on several audit and finance committees, provides a resource to the Board in discussions of issues facing the Company.
Patricia W. Chadwick. Age 66.
| • | Ravengate Partners, LLC – President since 1999. Ravengate Partners, LLC provides businesses and not-for-profit institutions with advice about the financial markets, business management and global economics. |
| • | Director of AMICA Mutual Insurance Company since 1992; Director of VOYA Mutual Funds (previously ING Mutual Funds) since 2006; and Director of The Royce Funds since 2009. |
| • | Director of Wisconsin Energy Corporation, Wisconsin Electric Power Company, and Wisconsin Gas LLC since 2006. |
Ms. Chadwick, who is a Chartered Financial Analyst, was an investment professional/portfolio manager or principal for 30 years, and served as a director of research for four of those years. Since 1999, Ms. Chadwick has been president of Ravengate Partners, LLC, a firm that provides businesses and not-for-profit institutions with advice about the economy and the financial markets. As indicated above, Ms. Chadwick currently serves as a director on the boards of two registered investment companies. She has served as the Chair of multiple committees at AMICA Mutual Insurance Company, including the Audit Committee and the Nominating and Governance Committee. She is also the Chair of the IBF – International Bond Fund Committee at VOYA Mutual Funds and serves on the Audit Committee for The Royce
| Wisconsin Electric Power Company | 3 | 2015 Annual Meeting Information Statement |
Funds, and Finance Committee for AMICA. Ms. Chadwick’s career and experience allow her to provide needed advice and insight to the Board on the capital markets. This perspective is valuable to WEC and its affiliates, which operate in a capital-intensive industry and must consistently access the capital markets. In addition, Ms. Chadwick’s service on the Board of AMICA, including presently serving as lead director, has provided her with experience in dealing with insurance risk management issues.
Curt S. Culver. Age 62.
| • | MGIC Investment Corporation – Non-Executive Chairman of the Board effective March 1, 2015. Served as Chairman from 2005 to February 2015, Chief Executive Officer from 2000 to February 2015, and President from 1999 to 2006. MGIC Investment Corporation is the parent of Mortgage Guaranty Insurance Corporation. |
| • | Mortgage Guaranty Insurance Corporation – Non-Executive Chairman of the Board effective March 1, 2015. Served as Chairman from 2005 to February 2015, Chief Executive Officer from 1999 to February 2015, and President from 1996 to 2006. Mortgage Guaranty Insurance Corporation is a private mortgage insurance company. |
| • | Director of MGIC Investment Corporation since 1999. |
| • | Director of Wisconsin Energy Corporation, Wisconsin Electric Power Company, and Wisconsin Gas LLC since 2004. |
Mr. Culver’s experience as Chairman and CEO of MGIC, which is headquartered in Milwaukee, Wisconsin, not only provides the Board with expertise in the financial markets and risk assessment and management, but also knowledge of the challenges and issues facing a public company headquartered in the same city as the Company. In addition, with his experience in the insurance industry, Mr. Culver is in a position to advise the Finance Committee on the Company’s insurance program and its effect on overall risk management. Mr. Culver also has past and present experience serving on the boards of numerous Milwaukee-area non-profit and two private, regional for-profit entities.
Thomas J. Fischer. Age 67.
| • | Fischer Financial Consulting LLC – Principal since 2002. Fischer Financial Consulting LLC provides consulting on corporate financial, accounting and governance matters. |
| • | Director of Actuant Corporation since 2003; Director of Badger Meter, Inc. since 2003; and Director of Regal-Beloit Corporation since 2004. |
| • | Director of Wisconsin Energy Corporation, Wisconsin Electric Power Company, and Wisconsin Gas LLC since 2005. |
As Principal of Fischer Financial Consulting LLC, Mr. Fischer has provided consulting services to companies in the areas of corporate financial, accounting and governance matters since 2002. Prior to this, Mr. Fischer, who is a Certified Public Accountant, worked for Arthur Andersen, which was a large, international independent public accounting firm, for 33 years, the last 22 as a partner responsible for services provided to large, complex public and private companies and several public utility audits. Combined with Mr. Fischer’s service as a director and member of the audit committee of three other Wisconsin-based public companies, Mr. Fischer provides the Board with a deep understanding of corporate governance issues, accounting and auditing matters, including financial reporting and regulatory compliance, and risk assessment and management. In light of this extensive experience, he is chair of the Audit and Oversight Committee for each of WEC and the Company.
Gale E. Klappa. Age 64.
| • | Wisconsin Energy Corporation – Chairman of the Board and Chief Executive Officer since 2004, and President from 2003 to 2013. |
| • | Wisconsin Electric Power Company – Chairman of the Board since 2004. President and Chief Executive Officer since 2003. |
| • | Wisconsin Gas LLC – Chairman of the Board since 2004. President and Chief Executive Officer since 2003. |
| • | Director of Badger Meter, Inc. since 2010; and Director of Joy Global Inc. since 2006. |
| • | Director of Wisconsin Energy Corporation, Wisconsin Electric Power Company, and Wisconsin Gas LLC since 2003. |
As Chief Executive Officer of WEC, WE and WG, Mr. Klappa represents and communicates management’s perspective to the Board. Mr. Klappa provides the Board with an understanding of the day-to-day operations of the Company, and, in turn, communicates the Board’s vision and direction for the Company to the other officers and management. Mr. Klappa has more than 40 years of experience working in the public utility industry, the last 22 at a senior executive level. Immediately prior to joining WEC in 2003, Mr. Klappa served as Executive Vice President and Chief Financial Officer of The Southern Company, a public utility holding company serving the southeastern United States. Mr. Klappa also served in various other leadership positions during his tenure at Southern, including Chief Strategic Officer and Chief Executive of the company’s subsidiary in the United Kingdom. Mr. Klappa currently serves on the boards of Edison Electric Institute, an association of U.S. shareholder-owned electric companies, and Electric Power Research Institute, an independent, non-profit research company performing research, development and demonstration in the electricity sector.
| Wisconsin Electric Power Company | 4 | 2015 Annual Meeting Information Statement |
Henry W. Knueppel. Age 66.
| • | Regal Beloit Corporation – Retired Chairman of the Board and Chief Executive Officer. Served as Chief Executive Officer from 2005 to 2011 and as Chairman from 2006 to 2011. Regal Beloit Corporation is a leading manufacturer of electric motors, mechanical and electrical motion controls, and power generation products. |
| • | Harsco Corporation – Independent, Non-Executive Chairman of the Board from September 2012 until September 2014. Served as Interim Chairman and Chief Executive Officer from February 2012 to September 2012. Harsco Corporation is a diversified, worldwide industrial services company. |
| • | Director of Regal Beloit Corporation since 1985; Director of Harsco Corporation since 2008; and Director of Snap-on Incorporated since 2011. |
| • | Director of Wisconsin Energy Corporation, Wisconsin Electric Power Company, and Wisconsin Gas LLC since 2013. |
Prior to serving as Chief Executive Officer and Chairman of the Board, Mr. Knueppel held several leadership positions at Regal Beloit Corporation and has more than 30 years of senior management experience at the company. Mr. Knueppel’s years of service with Regal Beloit Corporation, a Wisconsin-based manufacturer of electrical motors, mechanical and electrical motion controls, and power generation products, provides him with knowledge of equipment used in the Company’s business. Mr. Knueppel continues to serve on Regal Beloit Corporation’s Board of Directors, as well as on the Boards of Directors of Harsco Corporation and Snap-On Incorporated, both large publicly-traded industrial companies. With his combined experience, Mr. Knueppel is well qualified to provide perspective on the issues facing the Company’s large commercial and industrial customers.
Ulice Payne, Jr. Age 59.
| • | Addison-Clifton, LLC – Managing Member since 2004. Addison-Clifton, LLC provides global trade compliance advisory services. |
| • | Director of Manpower Group. since 2007; and Trustee of The Northwestern Mutual Life Insurance Company since 2005. |
| • | Director of Badger Meter, Inc. from 2000 to 2010. |
| • | Director of Wisconsin Energy Corporation, Wisconsin Electric Power Company, and Wisconsin Gas LLC since 2003. |
Mr. Payne has extensive leadership experience within the local community and the state of Wisconsin, previously serving as president and CEO of the Milwaukee Brewers Baseball Club, Inc., as managing partner of the Milwaukee office of Foley & Lardner, a Milwaukee-based law firm, and as Securities Commissioner for the state of Wisconsin. In addition, Mr. Payne is and has been involved in numerous Milwaukee-area non-profit entities, including serving as past chair of the Bradley Center Sports and Entertainment Corporation. Therefore, Mr. Payne is well positioned to provide the Board with perspective on the issues and challenges affecting the Milwaukee region as well as a broad spectrum of the Company’s customers. Mr. Payne presently advises on global trade compliance as Managing Member of Addison-Clifton, LLC, where Mr. Payne consistently deals with public policy and compliance matters, experience he brings to the Board. In addition, Mr. Payne’s past and present directorship experience on the boards of several public corporations includes service as a member of either the audit or finance committee at each of these companies, which is beneficial to the Board.
Mary Ellen Stanek. Age 58.
| • | Baird Financial Group – Managing Director and Director of Asset Management since 2000; Baird Advisors – Chief Investment Officer since 2000; Baird Funds, Inc. – President since 2000. Baird Financial Group provides wealth management, capital markets, private equity and asset management services to clients worldwide. Baird Advisors is an institutional fixed income investment advisor. Baird Funds, Inc. is a publicly registered investment company. |
| • | Director of Journal Communications Inc. since 2002; and Trustee of The Northwestern Mutual Life Insurance Company since 2009. |
| • | Director of Wisconsin Energy Corporation, Wisconsin Electric Power Company, and Wisconsin Gas LLC since 2012. |
Ms. Stanek, who is a Chartered Financial Analyst, has over 35 years of investment management experience and is currently responsible for the development and portfolio management of all fixed income proprietary asset management services for Baird Financial Group. Ms. Stanek also co-manages several fixed income mutual funds as well as a number of taxable and tax-exempt portfolios. In addition to her positions set forth above, Ms. Stanek is also a director of Baird Financial Group. Because of her career and experience, Ms. Stanek brings significant knowledge and financial expertise about the financial markets to the Board and Finance Committee. In particular, Ms. Stanek’s focus on fixed income investments is valuable as the Company customarily issues debt securities as a means of raising capital. In addition, Ms. Stanek brings experience in dealing with insurance risk management issues through her service as a director of West Bend Mutual Insurance Company from1999 until 2014. Ms. Stanek’s past and present experience serving on the boards of numerous Milwaukee-area non-profit institutions provides her with a good understanding of the issues and challenges that impact the Milwaukee region.
| Wisconsin Electric Power Company | 5 | 2015 Annual Meeting Information Statement |
COMMITTEES OF THE BOARD OF DIRECTORS
Members | Principal Responsibilities; Meetings | |||
Audit and Oversight Thomas J. Fischer, Chair John F. Bergstrom Barbara L. Bowles Patricia W. Chadwick Henry W. Knueppel | • | Oversee the integrity of the financial statements. | ||
| • | Oversee management compliance with legal and regulatory requirements. | |||
| • | Review, approve and evaluate the independent auditors’ services. | |||
| • | Oversee the performance of the internal audit function and independent auditors. | |||
• | Discuss risk management and major risk exposures and steps taken to monitor and control such exposures. | |||
| • | Prepare the report required by the SEC for inclusion in the information statement. | |||
| • | Establish procedures for the submission of complaints and concerns regarding WE’s accounting or auditing matters. | |||
| • | The Audit and Oversight Committee conducted six meetings in 2014. | |||
Compensation John F. Bergstrom, Chair Thomas J. Fischer Ulice Payne, Jr. | • | Identify through succession planning potential executive officers. | ||
| • | Provide a competitive, performance-based executive and director compensation program. | |||
| • | Set goals for the CEO, annually evaluate the CEO’s performance against such goals and determine compensation adjustments based on whether these goals have been achieved. | |||
| • | Prepare the report required by the SEC for inclusion in the information statement. | |||
| • | The Compensation Committee conducted six meetings in 2014, including one joint meeting with WEC’s Corporate Governance Committee. | |||
Finance Curt S. Culver, Chair Patricia W. Chadwick Ulice Payne, Jr. Mary Ellen Stanek | • | Review and monitor the Company’s current and long-range financial policies and strategies, including its capital structure and dividend policy. | ||
| • | Authorize the issuance of corporate debt within limits set by the Board. | |||
| • | Discuss policies with respect to risk assessment and risk management. | |||
| • | Approve the Company’s financial plan, including the capital budget. | |||
| • | The Finance Committee conducted three meetings in 2014. | |||
Wisconsin Electric relies on WEC’s Corporate Governance Committee for identifying and evaluating director nominees. WEC’s Corporate Governance Committee is also responsible for establishing and reviewing the WEC Corporate Governance Guidelines which are followed by the Board. The members of WEC’s Corporate Governance Committee are Barbara L. Bowles (Chair), Curt S. Culver and Henry W. Knueppel. WEC’s Corporate Governance Committee conducted three meetings in 2014, including one joint meeting with the Company’s Compensation Committee.
The Board also has an Executive Committee which may exercise all powers vested in the Board except action regarding dividends or other distributions to stockholders, filling Board vacancies and other powers which by law may not be delegated to a committee or actions reserved for a committee comprised of independent directors. The members of the Executive Committee are Gale E. Klappa (Chair), John F. Bergstrom, Barbara L. Bowles, Thomas J. Fischer and Ulice Payne, Jr. The Executive Committee did not meet in 2014.
In addition to the number of committee meetings listed in the preceding table, the Board met six times in 2014 and executed two signed, written unanimous consents. The average meeting attendance during the year was 96.5%. No director attended fewer than 88.9% of the total number of meetings of the Board and Board committees on which he or she served.
| Wisconsin Electric Power Company | 6 | 2015 Annual Meeting Information Statement |
DIRECTOR COMPENSATION
The following table summarizes total compensation awarded to, earned by, or paid to each of the Company’s non-employee directors during 2014. The amounts in the table are WEC consolidated compensation data.
(a) | (b) | (c) | (d) | (e) | (f) | (g) | (h) | |||||||||||||||||||||
| Fees Earned or Paid In Cash | Stock Awards (1)(2) | Option Awards | Non-Equity Incentive Plan Compensation | Change in Pension Value and Nonqualified Deferred Compensation Earnings | All Other Compensation (3) | Total | ||||||||||||||||||||||
Name | ($) | ($) | ($) | ($) | ($) | ($) | ($) | |||||||||||||||||||||
John F. Bergstrom | 87,000 | 90,000 | — | — | — | 25,285 | 202,285 | |||||||||||||||||||||
Barbara L. Bowles | 85,000 | 90,000 | — | — | — | 23,313 | 198,313 | |||||||||||||||||||||
Patricia W. Chadwick | 75,000 | 90,000 | — | — | — | 25,796 | 190,796 | |||||||||||||||||||||
Curt S. Culver | 85,000 | 90,000 | — | — | — | 18,122 | 193,122 | |||||||||||||||||||||
Thomas J. Fischer | 90,000 | 90,000 | — | — | — | 29,469 | 209,469 | |||||||||||||||||||||
Henry W. Knueppel | 75,000 | 90,000 | — | — | — | — | 165,000 | |||||||||||||||||||||
Ulice Payne, Jr. | 75,000 | 90,000 | — | — | — | 13,128 | 178,128 | |||||||||||||||||||||
Mary Ellen Stanek | 75,000 | 90,000 | — | — | — | — | 165,000 | |||||||||||||||||||||
| (1) | The amounts reported reflect the aggregate grant date fair value, as computed in accordance with Financial Accounting Standards Board Accounting Standards Codification (“FASB ASC”) Topic 718, of WEC restricted stock awards made to the directors in 2014. Each restricted stock award vests in full on the third anniversary of the grant date. |
| (2) | Other than Mr. Knueppel (4,530 shares) and Ms. Stanek (7,159 shares), each current director held 7,096 shares of WEC restricted stock as of December 31, 2014. |
| (3) | All amounts represent costs for the WEC Directors’ Charitable Awards Program. See “Compensation of the Board of Directors” below for additional information regarding this program. |
Compensation of the Board of Directors
2014 Compensation. During 2014, each non-employee director received an annual retainer fee of $75,000. Non-employee chairs of the Finance Committee and the WEC Corporate Governance Committee received a quarterly retainer of $2,500, the chair of the Compensation Committee received a quarterly retainer of $3,000, and the chair of the Audit and Oversight Committee received a quarterly retainer of $3,750. The Company reimbursed non-employee directors for all out-of-pocket travel expenses (which reimbursed amounts are not reflected in the table above). On January 2, 2014, each non-employee director also received the 2014 annual stock compensation award in the form of WEC restricted stock equal to a value of $90,000, with all shares vesting three years from the grant date. Employee directors do not receive these fees. Insurance is also provided for director liability coverage, fiduciary and employee benefit liability coverage, and travel accident coverage for director travel on Company business. The premiums paid for this insurance are not included in the amounts reported in the table above.
Although Wisconsin Electric directors also serve on the Wisconsin Energy and Wisconsin Gas boards and their committees, a single annual retainer fee and quarterly committee chair retainer were paid. Fees were allocated among Wisconsin Energy, Wisconsin Electric and Wisconsin Gas based on services rendered.
Deferred Compensation Plan. Non-employee directors may defer all or a portion of director fees pursuant to the WEC Directors’ Deferred Compensation Plan. Deferred amounts can be credited to any of ten measurement funds, including a WEC phantom stock account. The value of these accounts will appreciate or depreciate based on market performance, as well as through the accumulation of reinvested dividends. Deferral amounts are credited to accounts in the name of each participating director on the books of WEC, are unsecured, and are payable only in cash following termination of the director’s service to WEC and its subsidiaries, including the Company. The deferred amounts will be paid out of general
| Wisconsin Electric Power Company | 7 | 2015 Annual Meeting Information Statement |
corporate assets or the assets of the Wisconsin Energy Corporation 2014 Rabbi Trust discussed later in this information statement.
Charitable Awards Program. WEC has a Directors’ Charitable Awards Program under which it intends to contribute up to $100,000 per year for 10 years to one or more charitable organizations chosen by each director, including employee directors, following the director’s death. Directors are provided with one charitable award benefit for serving on the boards of WEC and its subsidiaries, including the Company. Charitable donations under the program will be paid out of general corporate assets. Directors derive no financial benefit from the program, and all income tax deductions accrue solely to WEC. The tax deductibility of these charitable donations mitigates the net cost to WEC. The Directors’ Charitable Awards Program has been eliminated for any new directors elected after January 1, 2007. Directors already participating as of that date, which includes all of the current directors except Mr. Knueppel and Ms. Stanek, were grandfathered.
2015 Compensation. In December 2014, the Compensation Committee conducted its annual review of non-employee director compensation and determined that the total directors’ compensation package was slightly below the market median. In order to continue to place more emphasis on the stock component of the directors’ pay package than the cash retainer, the Compensation Committee determined that it was appropriate to increase the annual WEC restricted stock award by $10,000. As a result, effective January 1, 2015, upon the recommendation of the Compensation Committee, the Board of Directors increased the annual WEC restricted stock award from $90,000 to $100,000.
OTHER MATTERS
The Board of Directors is not aware of any other matters that may properly come before the Meeting. The WE Bylaws set forth the requirements that must be followed should a stockholder wish to propose any floor nominations for director or floor proposals at annual or special meetings of stockholders. In the case of annual meetings, the Bylaws state, among other things, that notice and certain other documentation must be provided to WE at least 70 days and not more than 100 days before the scheduled date of the annual meeting. No such notices have been received by WE.
| Wisconsin Electric Power Company | 8 | 2015 Annual Meeting Information Statement |
CORPORATE GOVERNANCE – FREQUENTLY ASKED QUESTIONS
| Does WE have Corporate Governance Guidelines? | The WE Board of Directors follows WEC’s Corporate Governance Guidelines that WEC has maintained since 1996. WEC was one of the earliest adopters of a formal set of Corporate Governance Guidelines. These Guidelines provide a framework under which the Board conducts its business addressing matters including director selection and election, determination of independence, board leadership, board committee structure and evaluation, chief executive officer performance evaluation, and management succession. To maintain effective Corporate Governance Guidelines, WEC’s Corporate Governance Committee annually reviews WEC’s and the Company’s governance practices, taking into consideration industry surveys and benchmarking studies, as well as governance guidelines published by proxy advisers.
The Guidelines are available in the “Governance” section of WEC’s Website atwww.wisconsinenergy.com and are available in print to any stockholder who requests them in writing from the Corporate Secretary. | |||||
| How are directors determined to be independent? | No director qualifies as independent unless the Board affirmatively determines that the director has no material relationship with the Company. WEC’s Corporate Governance Guidelines provide that the WEC Board should consist of at least a two-thirds majority of independent directors and currently, the directors of WEC also serve as the directors of WE. | |||||
| What are the Board’s standards of independence? | The guidelines the Board uses in determining director independence are located in Appendix A of WEC’s Corporate Governance Guidelines. These standards of independence, which are summarized below, include those established by the New York Stock Exchange as well as a series of standards that are more comprehensive than New York Stock Exchange requirements. A director will be considered independent by the Board if the director: | |||||
| • | has not been an employee of the Company for the last five years; | |||||
| • | has not received, in the past three years, more than $120,000 per year in direct compensation from the Company, other than director fees or deferred compensation for prior service; | |||||
| • | is not a current partner or employee of a firm that is the Company’s internal or external auditor, was not within the last three years a partner or employee of such a firm and personally worked on the Company’s audit within that time, has no immediate family member who is a current partner of such a firm, or has no immediate family member who is a current employee of such a firm and personally works on the Company’s audit; | |||||
| • | has not been an executive officer, in the past three years, of another company where any of the Company’s present executives at the same time serves or served on that other company’s compensation committee; | |||||
| • | in the past three years, has not been an employee of a company that makes payments to, or receives payments from, the Company for property or services in an amount which in any single fiscal year is the greater of $1 million or 2% of such other company’s consolidated gross revenues; | |||||
| • | has not received, during the current calendar year or the immediately preceding calendar year, remuneration, other thande minimus remuneration, as a result of services as, or being affiliated with an entity that serves as, an advisor, consultant, or legal counsel to the Company or to a member of the Company’s senior management, or a significant supplier of the Company; | |||||
| • | has no personal service contract(s) with the Company or any member of the Company’s senior management; | |||||
| • | is not an employee or officer with a not-for profit entity that receives 5% or more of its total annual charitable awards from the Company; | |||||
| • | is not employed by a public company at which an executive officer of the Company serves as a director; and | |||||
| • | does not have any beneficial ownership interest of 5% or more in an entity that has received remuneration, other thande minimus remuneration, from the Company, its subsidiaries or affiliates. | |||||
| Wisconsin Electric Power Company | 9 | 2015 Annual Meeting Information Statement |
| The Board also considers whether a director’s immediate family members meet the above criteria, as well as whether a director has any relationships with the Company’s affiliates for certain of the above criteria, when determining the director’s independence. For purposes of the above discussion, “Company” refers to WEC and its subsidiaries, including WE. | ||||||
| Who are the independent directors? | The Board has affirmatively determined that Directors Bergstrom, Bowles, Chadwick, Culver, Fischer, Knueppel, Payne, and Stanek have no relationships described in the Board’s standards of independence noted above and otherwise have no material relationships with WE or WEC and are independent. This represents 89% of the current Board. Director Klappa is not independent due to his present employment with WEC and its affiliates.
Since 2005, WEC has engaged Baird Financial Group primarily to provide consulting services for investments held in its various benefit plan trusts. The Board reviewed the terms of this engagement, including the approximately $402,571 in fees paid to Baird in 2014 (which are less than one-tenth of 1% of Baird’s total revenue), and Ms. Stanek’s position at Baird, and concluded that such engagement is not material and did not impact Ms. Stanek’s independence. | |||||
| What are the committees of the Board? | The Board of Directors of WE has the following committees: Audit and Oversight, Compensation, Finance, and Executive.
All committees, except the Executive Committee, operate under a charter approved by the Board. A copy of each committee charter is posted in the “Governance” section of WEC’s Website atwww.wisconsinenergy.com and is available in print to any stockholder who requests it in writing from the Corporate Secretary. | |||||
| Are the Audit and Oversight and Compensation Committees comprised solely of independent directors? | Yes, these committees are comprised solely of independent directors, as determined under New York Stock Exchange rules and WEC’s Corporate Governance Guidelines.
In addition, the Board has determined that each member of the Audit and Oversight Committee and the Compensation Committee is independent under the rules of the New York Stock Exchange applicable to audit committee and compensation committee members, respectively. The Audit and Oversight Committee is a separately designated committee established in accordance with Section 3(a)(58)(A) of the Securities Exchange Act of 1934, as amended. | |||||
| Is the office of CEO combined with the office of Chairman of the Board? | Yes, the office of CEO is combined with the office of Chairman of the Board. Consistent with WE’s Bylaws and WEC’s Corporate Governance Guidelines, the Board retains the right to exercise its discretion in combining or separating the offices of Chief Executive Officer and Chairman of the Board. Given the complexity of the Company’s industry, operations and regulatory environment, the Board believes that having a combined CEO and Chairman is the appropriate structure for the Company at this time. | |||||
| Does the Board have an independent lead or presiding director? | Director Bowles, an independent director and Chair of WEC’s Corporate Governance Committee, currently serves as presiding director. In that role, Director Bowles:
| |||||
| • | Presides at all meetings of the Board at which the Chairman is not present, including executive sessions of the independent directors; | |||||
| • | Serves as liaison between the CEO and the independent directors under most circumstances, although each individual director has full access to the CEO; | |||||
| • | Has authority to call meetings of the independent directors; | |||||
| • | Reviews meeting agendas for the Board and its Committees; | |||||
| • | Reviews meeting schedules to assure there is sufficient time for discussion of all agenda items; | |||||
| • | Reviews all proposed changes to committee charters; and | |||||
| • | Leads the annual Board evaluation. | |||||
| Wisconsin Electric Power Company | 10 | 2015 Annual Meeting Information Statement |
| Do the non-management directors meet separately from management? | Yes, at every regularly scheduled Board meeting non-management (non-employee) directors meet in executive session without any management present. All non-management directors are independent. As discussed above, Director Bowles presides at these sessions. | |||||
| Are directors subject to term limits? | The Board does not believe it is appropriate or necessary to limit the number of terms a director may serve. The Board values the participation and insight of directors who have developed an increased understanding of the governance of the Company and the specific issues it faces doing business in a complex industry, as well as fresh and varied perspectives. Therefore, the Board is comprised of members with diverse backgrounds and tenure.
The WEC Corporate Governance Committee annually evaluates each director nominee to confirm that he or she has the skills, education, experience, and qualifications required to help further the success of the Company’s business and represent WEC stockholder interests. | |||||
| What is the Board’s role in risk oversight? | The Board oversees our risk environment and has delegated specific risk monitoring responsibilities to the Audit and Oversight Committee and the Finance Committee as described in each committee’s charter. Both of these committees routinely report back to the Board. The Board and its committees also periodically receive briefings from management on specific areas of risk as well as emerging risks to the enterprise. The Board’s role in risk oversight had no effect on the Board’s decision to keep the roles of Chairman and CEO combined.
Over the course of the year, the Audit and Oversight Committee hears reports from management on the Company’s major risk exposures in such areas as compliance, environmental, legal/litigation and ethical conduct and steps taken to monitor and control such exposures. The Finance Committee discusses the Company’s risk assessment and risk management policies; it also provides oversight of insurance matters to ensure that its risk management program is functioning properly. Both committees have direct access to, and meet as needed with, Company representatives without other management present to discuss matters related to risk management.
The CEO, who is ultimately responsible for managing risk, routinely reports to the Board on risk-related matters. As part of this process, the business unit leaders identify existing, new, or emerging issues or changes within their business area that could have enterprise implications and report them to senior management. Management is tasked with ensuring that these risks and opportunities are appropriately addressed. In addition, the Company, along with WEC, has established a Compliance Risk Steering Committee, comprised of senior level management employees, whose purpose is to foster an enterprise-wide approach to managing compliance. The results of each of these risk-management efforts are reported to the CEO and to the Board or its appropriate committee. | |||||
| How can interested parties contact the members of the Board? | Correspondence may be sent to the directors, including the non-management directors, in care of the Corporate Secretary, Susan H. Martin, at the Company’s principal business office, 231 West Michigan Street, P.O. Box 2046, Milwaukee, Wisconsin 53201.
All communication received as set forth above will be opened by the Corporate Secretary for the sole purpose of confirming the contents represent a message to the Company’s directors. Pursuant to instructions from the Board of Directors, all communication, other than advertising, promotion of a product or service, or patently offensive material, will be forwarded promptly to the addressee. | |||||
| Does the Company have a written code of ethics? | Yes, all WE and WEC directors, executive officers and employees, including the principal executive, financial and accounting officers, have a responsibility to comply with WEC’s Code of Business Conduct, to seek advice in doubtful situations and to report suspected violations.
WEC’s Code of Business Conduct addresses, among other things: conflicts of interest; confidentiality; fair dealing; protection and proper use of Company assets; and compliance | |||||
| Wisconsin Electric Power Company | 11 | 2015 Annual Meeting Information Statement |
with laws, rules and regulations (including insider trading laws). The Company has not provided any waiver to the Code for any director, executive officer or other employee.
The Code of Business Conduct is posted in the “Governance” section of WEC’s Website atwww.wisconsinenergy.com. It is also available in print to any stockholder upon request in writing to the Corporate Secretary.
The Company has several ways employees can raise questions concerning WEC’s Code of Business Conduct and other Company policies. As one reporting mechanism, the Company has contracted with an independent service for employees to confidentially and anonymously report suspected violations of WEC’s Code of Business Conduct or other concerns, including those regarding accounting, internal accounting controls or auditing matters. | ||||||
| Does the Company have policies and procedures in place to review and approve related party transactions? | All employees of the Company, including executive officers, and members of the Board are required to comply with WEC’s Code of Business Conduct. The Code of Business Conduct addresses, among other things, what actions are required when potential conflicts of interest may arise, including those from related party transactions. Specifically, executive officers and members of the Board are required to obtain approval of the Audit and Oversight Committee chair (1) before obtaining any financial interest in or participating in any business relationship with any company, individual or concern doing business with WEC or any of its subsidiaries, including WE; (2) before participating in any joint venture, partnership or other business relationship with WEC or any of its subsidiaries, including WE; and (3) before serving as an officer or member of the board of any substantial outside for-profit organization (except the Chief Executive Officer must obtain the approval of the full Board before doing so and members of the Board of Directors must obtain the prior approval of WEC’s Corporate Governance Committee). Executive officers must obtain the prior approval of the Chief Executive Officer before accepting a position with a substantial non-profit organization; members of the Board must notify the Compliance Officer when joining the board of a substantial non-profit organization, but do not need to obtain prior approval. | |||||
| In addition, WEC’s Code of Business Conduct requires employees and directors to notify the Compliance Officer of situations where family members are a supplier or significant customer of WEC or the Company or employed by one. To the extent the Compliance Officer deems it appropriate, she will consult with the Audit and Oversight Committee chair in situations involving executive officers and members of the Board. | ||||||
| Does the Board evaluate CEO performance? | Yes, the Compensation Committee, on behalf of the Board, annually evaluates the performance of the CEO and reports the results to the Board. As part of this practice, the Compensation Committee obtains from each non-employee director his or her input on the CEO’s performance.
The CEO is evaluated in a number of areas including leadership, vision, financial stewardship, strategy development, management development, effective communication with constituencies, demonstrated integrity and effective representation of the Company in community and industry affairs. The chair of the Compensation Committee shares the evaluation results with the CEO. The process is also used by the Compensation Committee to determine appropriate compensation for the CEO. This procedure allows the Board to evaluate the CEO and to communicate the Board’s expectations. | |||||
| Does the Board evaluate its own performance? | Yes, the Board annually evaluates its own collective performance. Each director is asked to consider the performance of the Board on such things as: the establishment of appropriate corporate governance practices; providing appropriate oversight for key affairs of the Company (including its strategic plans, long-range goals, financial and operating performance, risks to the enterprise, and customer satisfaction initiatives); communicating the Board’s expectations and concerns to the CEO; overseeing opportunities critical to the Company; and operating in a manner that ensures open communication, candid and constructive dialogue, as well as critical questioning. WEC’s Corporate Governance Committee uses the results of this process as part of its annual review of the Corporate Governance Guidelines and to foster continuous improvement of the Board’s activities. | |||||
| Wisconsin Electric Power Company | 12 | 2015 Annual Meeting Information Statement |
| Is Board committee performance evaluated? | Yes, each committee, except the Executive Committee, conducts an annual performance evaluation of its own activities and reports the results to the Board. The evaluation compares the performance of each committee with the requirements of its charter. The results of the annual evaluations are used by each committee to identify both its strengths and areas where its governance practices can be improved. Each committee may adjust its charter, with Board approval, based on the evaluation results. | |||||
| Are all the members of the Audit Committee financially literate and does the committee have an “audit committee financial expert”? | Yes, the Board has determined that all of the members of the Audit and Oversight Committee are financially literate as required by New York Stock Exchange rules and qualify as audit committee financial experts within the meaning of Securities and Exchange Commission rules.
Director Fischer serves on the audit committee of three other public companies. The Board determined that his service on these other audit committees will not impair Director Fischer’s ability to effectively serve on the Audit and Oversight Committee. In fact, the Board considers this additional service to be an asset because of the additional knowledge and insight Mr. Fischer brings to his role on the Board. No other member of the Audit and Oversight Committee serves as an audit committee member of more than three public companies. For this purpose, the Company considers service on the audit committees of Wisconsin Electric Power Company and Wisconsin Energy Corporation to be service on the audit committee of one public company because of the commonality of the issues considered by those committees. | |||||
| How does the Compensation Committee administer the executive and director compensation programs? | One of the principal responsibilities of the Compensation Committee is to provide competitive, performance-based executive and director compensation programs.
With respect to the executive compensation program, the Compensation Committee’s responsibilities include:
| |||||
| • | determining and annually reviewing the Compensation Committee’s compensation philosophy; | |||||
| • | determining and reviewing the compensation paid to executive officers (including base salaries, incentive compensation, and benefits); | |||||
| • | overseeing the compensation and benefits to be paid to other officers and key employees; | |||||
| • | establishing and administering the Chief Executive Officer compensation package; and | |||||
| • | reviewing the results of the most recent WEC stockholder advisory vote on compensation of the named executive officers. | |||||
The Compensation Committee is also charged with administering the compensation package of the non-employee directors. The Compensation Committee meets with WEC’s Corporate Governance Committee annually to review the compensation package of the non-employee directors and to determine the appropriate amount of such compensation.
In January 2015, the Compensation Committee retained Frederic W. Cook & Co. to provide consultation on executive and director compensation practices and programs. In connection with this engagement, the Compensation Committee determined that Frederic W. Cook & Co. was independent under the standards established by the New York Stock Exchange.
For more information regarding our executive compensation processes and procedures, please refer to the “Compensation Discussion and Analysis” later in this information statement. | ||||||
| Does the Board have a nominating committee? | WE does not have a nominating committee. WE relies on WEC’s Corporate Governance Committee for, among other things, identifying and evaluating director nominees. The chair of the WEC Corporate Governance Committee coordinates this effort. The WEC Board has determined that all members of the WEC Corporate Governance Committee are independent under New York Stock Exchange rules applicable to nominating committee members. | |||||
| Wisconsin Electric Power Company | 13 | 2015 Annual Meeting Information Statement |
| The WEC Corporate Governance Committee operates under a charter approved by the WEC Board, a copy of which is posted in the “Governance” section of WEC’s Website atwww.wisconsinenergy.com. It is also available in print to any stockholder upon request in writing to the Corporate Secretary. | ||||||
| What is the process used to identify director nominees and how do I recommend a nominee to WEC’s Corporate Governance Committee? | Candidates for director nomination may be proposed by stockholders, WEC’s Corporate Governance Committee, and other members of the Board. The Committee may pay a third party to identify qualified candidates; however, no such firm was engaged with respect to the nominees listed in this information statement. No formal stockholder nominations or recommendations for director candidates were received from holders of either series of the Company’s preferred stock.
Stockholders wishing to propose director candidates for consideration and recommendation by WEC’s Corporate Governance Committee for election at the Company’s 2016 Annual Meeting of Stockholders must submit the candidates’ names and qualifications to WEC’s Corporate Governance Committee no later than November 1, 2015, via the Corporate Secretary, Susan H. Martin, at WEC’s principal business office, 231 West Michigan Street, P.O. Box 1331, Milwaukee, Wisconsin 53201. | |||||
| What is WE’s policy regarding director attendance at annual meetings? | Directors are not expected to attend the Company’s annual meetings of stockholders, as they are only short business meetings. Generally, all directors are expected to attend WEC’s annual meetings of stockholders. All directors attended WEC’s 2014 Annual Meeting, except for Mr. Culver. | |||||
| Wisconsin Electric Power Company | 14 | 2015 Annual Meeting Information Statement |
INDEPENDENT AUDITORS’ FEES AND SERVICES
Deloitte & Touche LLP served as the independent auditors for the Company for the last thirteen fiscal years beginning with the fiscal year ended December 31, 2002. They have been selected by the Audit and Oversight Committee as independent auditors for the Company for the fiscal year ending December 31, 2015, subject to ratification by the stockholders of WEC at WEC’s Annual Meeting of Stockholders on May 7, 2015.
Representatives of Deloitte & Touche LLP are not expected to be present at the Company’s Annual Meeting, but are expected to attend WEC’s Annual Meeting of Stockholders on May 7, 2015. They will have an opportunity to make a statement at WEC’s Annual Meeting, if they so desire, and are expected to respond to appropriate questions that may be directed to them.
Pre-Approval Policy. The Audit and Oversight Committee has a formal policy delineating its responsibilities for reviewing and approving, in advance, all audit, audit-related, tax, and other services of the independent auditors. The Audit and Oversight Committee is committed to ensuring the independence of the auditors, both in appearance as well as in fact.
Under the pre-approval policy, before engagement of the independent auditors for the next year’s audit, the independent auditors will submit (i) a description of all services anticipated to be rendered, as well as an estimate of the fees for each of the services, for the Audit and Oversight Committee to approve, and (ii) written confirmation that the performance of any non-audit services is permissible and will not impact the firm’s independence. Annual pre-approval will be deemed effective for a period of twelve months from the date of pre-approval, unless the Audit and Oversight Committee specifically provides for a different period. A fee level will be established for all permissible, pre-approved non-audit services. Any additional audit service, audit-related service, tax service, and other service must also be pre-approved.
The Audit and Oversight Committee delegated pre-approval authority to the Committee’s Chair. The Audit and Oversight Committee Chair is required to report any pre-approval decisions at the next scheduled Audit and Oversight Committee meeting. Under the pre-approval policy, the Audit and Oversight Committee may not delegate to management its responsibilities to pre-approve services performed by the independent auditors.
Under the pre-approval policy, prohibited non-audit services are services prohibited by the Securities and Exchange Commission or by the Public Company Accounting Oversight Board (United States) (“PCAOB”) to be performed by the Company’s independent auditors. These services include: bookkeeping or other services related to the accounting records or financial statements of the Company; financial information systems design and implementation; appraisal or valuation services; fairness opinions or contribution-in-kind reports; actuarial services; internal audit outsourcing services; management functions, or human resources, broker-dealer, investment advisor or investment banking services; legal services and expert services unrelated to the audit; services provided for a contingent fee or commission; and services related to planning, marketing or opining in favor of the tax treatment of a confidential transaction or an aggressive tax position transaction that was initially recommended, directly or indirectly, by the independent auditors. In addition, the Audit and Oversight Committee has determined that the independent auditors may not provide any services, including personal financial counseling and tax services, to any officer or other employee of the Company who serves in a financial reporting oversight role or to the chair of the Audit and Oversight Committee or to an immediate family member of these individuals, including spouses, spousal equivalents, and dependents.
| Wisconsin Electric Power Company | 15 | 2015 Annual Meeting Information Statement |
Fee Table. The following table shows the fees, all of which were pre-approved by the Audit and Oversight Committee, for professional audit services provided by Deloitte & Touche LLP for the audit of the Company’s annual financial statements for fiscal years 2014 and 2013 and fees for other services rendered during those periods. No fees were paid to Deloitte & Touche LLP pursuant to the “de minimus” exception to the pre-approval policy permitted under the Securities Exchange Act of 1934, as amended.
| 2014 | 2013 | |||||||
Audit Fees(1) | $ | 1,503,800 | $ | 1,464,740 | ||||
Audit-Related Fees | — | — | ||||||
Tax Fees | — | — | ||||||
All Other Fees(2) | 2,970 | 4,950 | ||||||
|
|
|
| |||||
Total | $ | 1,506,770 | $ | 1,469,690 | ||||
|
|
|
| |||||
| (1) | Audit Fees consist of fees for professional services rendered in connection with the audits of the Company’s annual financial statements, reviews of financial statements included in Form 10-Q filings of WE, and services normally provided in connection with statutory and regulatory filings or engagements. |
| (2) | All Other Fees consist of costs for certain employees to attend accounting/tax seminars hosted by Deloitte & Touche LLP. |
| Wisconsin Electric Power Company | 16 | 2015 Annual Meeting Information Statement |
AUDIT AND OVERSIGHT COMMITTEE REPORT
The Audit and Oversight Committee, which is comprised solely of independent directors, oversees the integrity of the financial reporting process on behalf of the Board of the Company. In addition, the Audit and Oversight Committee oversees compliance with legal and regulatory requirements. The Audit and Oversight Committee operates under a written charter approved by the Board, which can be found in the “Governance” section of Wisconsin Energy Corporation’s Website atwww.wisconsinenergy.com.
The Audit and Oversight Committee is also responsible for the appointment, compensation, retention, and oversight of the Company’s independent auditors, as well as the oversight of the Company’s internal audit function. The Audit and Oversight Committee selected Deloitte & Touche LLP to remain as the Company’s independent auditors for 2015, subject to ratification by Wisconsin Energy Corporation stockholders.
Management is responsible for the Company’s financial reporting process, the preparation of consolidated financial statements in accordance with generally accepted accounting principles, and the system of internal controls and procedures designed to provide reasonable assurance regarding compliance with accounting standards and applicable laws and regulations. The Company’s independent auditors are responsible for performing an independent audit of the Company’s consolidated financial statements in accordance with the standards of the PCAOB and issuing a report thereon.
The Audit and Oversight Committee held six meetings during 2014. Meetings are designed to facilitate and encourage open communication among the members of the Audit and Oversight Committee, management, the internal auditors, and the Company’s independent auditors, Deloitte & Touche LLP. During these meetings, we reviewed and discussed with management, among other items, the Company’s unaudited quarterly and audited annual financial statements and the system of internal controls designed to provide reasonable assurance regarding compliance with accounting standards and applicable laws.
We have reviewed and discussed with management and the Company’s independent auditors the Company’s audited consolidated financial statements and related footnotes for the fiscal year ended December 31, 2014, and the independent auditor’s report on those financial statements. Management represented to us that the Company’s financial statements were prepared in accordance with generally accepted accounting principles. Deloitte & Touche LLP presented the matters required to be discussed with the Audit and Oversight Committee by PCAOB Auditing Standard No. 16,Communications with Audit Committees. This review included a discussion with management and the independent auditors about the quality of the Company’s accounting principles, the reasonableness of significant estimates and judgments, and the disclosures in the Company’s financial statements, as well as the disclosures relating to critical accounting policies.
In addition, we received the written disclosures and the letter relative to the auditors’ independence from Deloitte & Touche LLP, as required by applicable requirements of the PCAOB regarding Deloitte & Touche LLP’s communications with the Audit and Oversight Committee concerning independence. The Audit and Oversight Committee discussed with Deloitte & Touche LLP its independence and also considered the compatibility of non-audit services provided by Deloitte & Touche LLP with maintaining its independence.
Based on these reviews and discussions, the Audit and Oversight Committee recommended to the Board that the audited financial statements be included in Wisconsin Electric Power Company’s Annual Report on Form 10-K for the fiscal year ended December 31, 2014 and filed with the Securities and Exchange Commission.
Respectfully submitted to Wisconsin Electric Power Company’s stockholders by the Audit and Oversight Committee of the Board of Directors.
| Thomas J. Fischer, Committee Chair |
| John F. Bergstrom |
| Barbara L. Bowles |
| Patricia W. Chadwick |
| Henry W. Knueppel |
| Wisconsin Electric Power Company | 17 | 2015 Annual Meeting Information Statement |
COMPENSATION DISCUSSION AND ANALYSIS
The following discussion provides an overview and analysis of our executive compensation program, including the role of the Compensation Committee, the elements of our executive compensation program, the purposes and objectives of these elements, and the manner in which we established the compensation of our named executive officers (“NEOs”) for fiscal year 2014.
References to “we”, “us”, “our” and the “Company” in this discussion and analysis mean Wisconsin Electric Power Company and its management, as applicable, and references to “WEC” mean Wisconsin Energy Corporation.
The Compensation Committee of the Company is comprised of the same individuals who are members of the Compensation Committee of the Board of Directors of Wisconsin Energy Corporation (the “WEC Compensation Committee” and, together with the Company’s Compensation Committee, the “Compensation Committee”). The NEOs of the Company are the same as the NEOs of WEC, and the WEC Compensation Committee and the Company’s Compensation Committee each have responsibility for making compensation decisions regarding these executive officers.
EXECUTIVE SUMMARY
Overview
The primary objective of our executive compensation program is to provide a competitive, performance-based plan that enables the Company to attract and retain key individuals and to reward them for achieving both the Company’s short-term and long-term goals. Our program has been designed to provide a level of compensation that is strongly dependent upon the achievement of short-term and long-term goals that are aligned with the interests of WEC’s stockholders and our customers. To that end, a substantial portion of pay is at risk, and generally, the value will only be realized upon strong corporate performance.
2014 Highlights
The Company achieved strong financial results which contributed to WEC again delivering solid earnings growth, generating strong cash flow, and increasing the WEC dividend for the 11th consecutive year. In January 2014, WEC’s Board of Directors increased WEC’s quarterly dividend to $0.39 per share, raising the annual dividend to $1.56 per share. And, in January 2015, the WEC Board again raised the quarterly dividend 8.3 percent to $0.4225 per share, which is equivalent to an annual rate of $1.69 per share. The Company also achieved milestones in employee safety, customer satisfaction, and diversity during 2014, all of which are components of our short-term incentive compensation program. More specifically, WEC’s and the Company’s achievements included:
| ||||
• | WEC entered into an agreement and plan of merger to acquire all of the outstanding shares of Integrys Energy Group (“TEG”), which WEC believes will create the leading electric and natural gas utility in the Midwest.
| |||
| • | WEC returned more than $370 million to its stockholders during 2014 through dividends and share repurchases. | |||
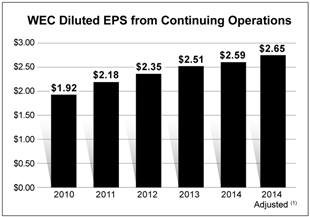
| • | WEC fully diluted adjusted earnings per share of $2.65, highest in its history. (1) | |||
| • | WEC common stock reached a then all-time high of $55.39 per share on December 29, 2014. |
• |
The Company was named the most reliable utility in the Midwest for the fourth year in a row and the ninth time in the past 12 years. | |||
| (1) | Excludes costs of $0.06 per share related to WEC’s acquisition of Integrys. Adjusted earnings (non-GAAP earnings), which generally exclude nonoperational items that are not associated with WEC’s ongoing operations, are provided as a complement to, and should not be considered as an alternative to, reported earnings presented in accordance with GAAP. The excluded items are not indicative of operating performance. Therefore, we believe that the presentation of adjusted earnings is relevant and useful to investors to understand operating performance. Management uses such measures internally to evaluate performance and manage operations. |
| Wisconsin Electric Power Company | 18 | 2015 Annual Meeting Information Statement |
| • | Continued improvements in customer satisfaction based on customer surveys. Data indicated that the Company and WG achieved their highest single month rating in history for customer satisfaction with respect to the particular transaction with the Company and WG during December 2014. |
| • | Achieved best overall employee safety results in Company history. |
| • | Exceeded workforce and supplier diversity targets for 2014. |
| • | WEC was named one of the 100 best corporate citizens in the United States by Corporate Responsibility magazine for the seventh consecutive year. |
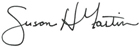
Industry-Leading Stockholder Returns
As the following charts indicate, WEC again delivered industry-leading total stockholder returns for 2014.(2)
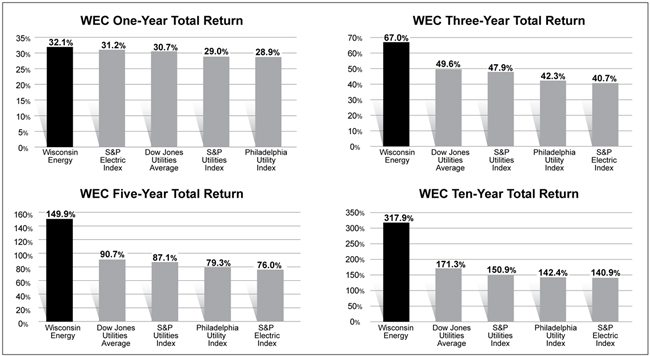
Source: Bloomberg; assumes all dividends are reinvested and returns are compounded daily.
| These charts illustrate management’s delivery of long-term results for WEC’s stockholders. In the context of an acquisition, the acquiring company will often see a decline in its stock performance during the pendency of the approval process for the transaction. In fact, WEC’s common stock closed at $46.89 per share on June 20, 2014, the last trading day prior to the announcement of WEC’s acquisition of TEG, and fell to a low of $45.21 on June 23, 2014, the day WEC announced the transaction. This is a drop of approximately 3.6%. Despite its initial drop, WEC’s stock price rebounded and, as indicated in the one-year total return chart above, outperformed the |  |
| (2) | The WEC Five-Year Cumulative Return Chart shows a comparison of the cumulative total return, assuming reinvestment of dividends, over the last five years had $100 been invested at the close of business on December 31, 2009. In addition to WEC, the Custom Peer Index Group consists of those 22 companies listed under “Competitive Benchmarking” in this Compensation Discussion and Analysis. The Recomprised Custom Peer Index Group consists of the same companies except that it excludes Integrys and Pepco Holdings and includes TECO Energy. |
| Wisconsin Electric Power Company | 19 | 2015 Annual Meeting Information Statement |
broader indices in 2014. We believe this indicates investors’ confidence in WEC’s and the Company’s management as well as the merits of the transaction.
In addition, at the beginning of 2015 WEC’s price to earnings valuation on expected earnings for 2015 was the highest of any company in the regulated utility sector.
Consideration of 2014 WEC Stockholder Advisory Vote
After WEC’s 2014 Annual Meeting of Stockholders, at which WEC’s stockholders approved the compensation of the NEOs with almost 80% of the votes cast, the Compensation Committee considered the outcome and sought additional input from stockholders and other stakeholders as part of WEC’s ongoing stockholder outreach and engagement program.
In 2014, WEC spoke with 15 of its largest stockholders representing approximately 35% of shares outstanding and also met with proxy advisors. The Compensation Committee values this feedback, and has adopted several changes to the Company’s executive compensation program. We believe these changes are responsive to the input WEC received, and are in the best interests of WEC, the Company, and their stockholders. The chart below summarizes the key points we heard, what action the Compensation Committee has taken, and when the changes were effective.
What We Heard | What We Did | When Effective | ||
| Add an additional performance measure to the STPP | Cash flow added as an additional performance measure, in addition to WEC earnings per share from continuing operations. | Awards for 2015 | ||
| Adopt a formal clawback policy | The Board adopted a policy that (i) applies to current and former executive officers, (ii) requires recoupment of excess incentive compensation earned due to an accounting restatement resulting from material noncompliance with financial reporting requirements and (iii) incorporates a three-year look-back. | Applies to incentive compensation awarded after December 4, 2014, the date of adoption | ||
| Consider a formal policy for tax gross-ups | A policy was adopted. Neither WEC nor the Company had entered into agreements providing excise tax gross-ups for several years. Any gross-ups on executive benefits had been limited to a legacy group of plan participants. A formal policy was put in place prohibiting any new arrangements that would provide tax gross-ups going forward. | December 4, 2014, the date of adoption | ||
| Incorporate a double trigger for vesting upon a change in control for the WEC Performance Unit Plan | The WEC Performance Unit Plan was amended to provide for a double trigger. The plan now requires a separation from service following a change in control for vesting to occur. | January 1, 2015 | ||
| Clarify that you have an anti-hedging and anti-pledging policy | Explained that the Corporate Securities Trading Policy already prohibited these activities; committed to enhancing disclosure. | See “Prohibition on Hedging and Pledging” in this Compensation Discussion and Analysis | ||
In addition to these changes, the Compensation Committee retained Frederic W. Cook & Co. as a compensation consultant in 2015 to evaluate and make recommendations with respect to the compensation program.
Components of Our Executive Compensation Program
We have three primary elements of total direct compensation: (1) base salary; (2) annual incentive awards; and (3) long-term incentive awards consisting of a mix of WEC performance units, WEC stock options, and WEC restricted stock. We analyze market data obtained from Towers Watson, a compensation consulting firm utilized by management, to help determine the appropriate level of compensation for each NEO. As shown in the charts below, 87 percent of Mr. Klappa’s
| Wisconsin Electric Power Company | 20 | 2015 Annual Meeting Information Statement |
total direct compensation as CEO and an average of 79 percent of the other NEOs’ total direct compensation is tied to WEC performance and is not guaranteed. The percentages shown are based on WEC consolidated compensation data.
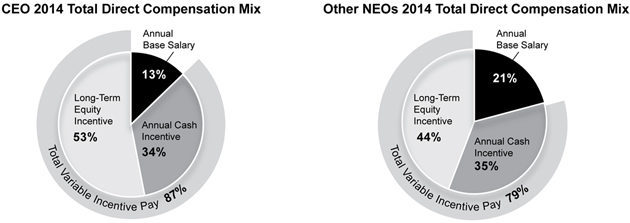
In addition to the components of total direct compensation identified above, WEC’s retirement programs are another important component of the compensation program.
To the extent feasible, we believe it is important that the compensation program not dilute the interests of WEC’s current stockholders. Therefore, WEC currently uses open market purchases to satisfy its benefit plan obligations, including the exercise of WEC stock options and vesting of WEC restricted stock. In fact, WEC ended 2014 with fewer shares outstanding than at the end of 2013.
This Compensation Discussion and Analysis contains a more detailed discussion of each of the above components and the extent to which we analyzed market data in establishing each individual component in 2014.
Compensation Governance and Practices
The Compensation Committee annually reviews and considers the Company’s compensation policies and practices to ensure our executive compensation program aligns with our compensation philosophy. Highlighted below is an overview of our current compensation practices.
What We Do
| • | Our compensation program focuses on key Company results (financial, safety, customer satisfaction, diversity) that are aligned with WEC’s and our strategic goals. |
| • | A substantial portion of compensation is at risk and tied to WEC and Company performance. |
| • | The compensation program has a long-term orientation aligned with WEC stockholder interests. |
| • | The Compensation Committee reviews competitive employment market data from a wide range of businesses throughout general industry when making compensation decisions. |
| • | We have implemented a clawback policy that provides for the recoupment of incentive-based compensation. |
| • | Annual incentive-based compensation contains multiple, pre-established performance metrics aligned with WEC stockholder and Company customer interests. |
| • | The WEC Performance Unit Plan award payouts are based on WEC stockholder return as compared to an appropriate peer group. |
| • | The WEC Performance Unit Plan requires a separation from service following a change in control for award vesting to occur. |
| • | Equity award and other benefit plan obligations are satisfied through open market purchases of WEC common stock. |
| Wisconsin Electric Power Company | 21 | 2015 Annual Meeting Information Statement |
What We Do
| • | Meaningful WEC stock ownership requirements for senior executives. |
| • | Engagement with WEC investors to ensure that compensation practices are responsive to stockholder interests. |
| • | We prohibit hedging and pledging of WEC common stock. |
| • | We adopted a formal policy that prohibits entry into any new arrangements that obligate WEC or the Company to pay directly or reimburse individual tax liability for benefits provided. |
| • | We prohibit repricing of WEC stock options without WEC stockholder approval. |
Competitive Benchmarking
As a general matter, we believe the labor market for WEC executive officers is consistent with that of general industry. Although we recognize WEC’s business is focused on the energy services industry, our goal is to have an executive compensation program that will allow us to be competitive in recruiting the most qualified candidates to serve as executive officers of WEC and the Company, including individuals who may be employed outside of the energy services industry. Further, in order to retain top performing executive officers, we believe our compensation practices must be competitive with those of general industry.
To confirm that our annual executive compensation is competitive with the market, we consider the market data obtained from Towers Watson. For 2014, Towers Watson provided us with compensation data from its 2014 Executive Compensation Data Bank, which contains information obtained from 446 companies of varying sizes in a wide range of businesses throughout general industry.
Instead of the broad group of companies used for general compensation comparisons, for purposes of measuring WEC’s total stockholder return with respect to awards under the WEC Performance Unit Plan, WEC compares itself with the peer group of companies described below. In addition to Wisconsin Energy Corporation, the 2014 peer group originally included:
• Alliant Energy Corporation | • DTE Energy Co. | • NiSource Inc. | • Portland General Electric | |||
• Ameren Corporation | • Duke Energy Corp. | • OGE Energy Corp. | • SCANA Corporation | |||
• American Electric Power | • Eversource Energy | • Pepco Holdings, Inc. | • The Southern Company | |||
Company, Inc. | (f/k/a Northeast Utilities) |
• Westar Energy, Inc. | ||||
• Avista Corporation | • FirstEnergy Corp. | • PG&E Corporation |
• Xcel Energy Inc. | |||
• CMS Energy Corporation | • Great Plains Energy, Inc. | • Pinnacle West Capital Corporation | ||||
• Consolidated Edison, Inc. | • Integrys Energy Group, Inc. | |||||
This peer group was chosen because we believe these companies are similar to WEC in terms of business model and long-term strategies, with a focus on regulated utility operations rather than a non-regulated business model. Certain utilities that had a strong regulated business in the past have diversified into master limited partnerships for their natural gas pipeline business and real estate investment trusts to hold their renewable investments. Because this is a different business model than WEC’s, these companies have been excluded from the peer group.
In addition, in December 2014, the Compensation Committee determined that Pepco Holdings and Integrys Energy Group should be removed from the custom peer group for the 2014, 2013 and 2012 awards of WEC performance units. In April 2014 and June 2014, Exelon Corp. announced its acquisition of Pepco Holdings and WEC announced its acquisition of TEG, respectively. Upon each respective announcement, there was a significant increase in Pepco’s and TEG’s stock price which we believe was not the result of ongoing operating performance. Pepco’s and TEG’s stock prices continued to reflect these extraordinary events through 2014. This action is consistent with the Compensation Committee’s past decisions to adjust the peer group to account for the impact of mergers and acquisitions.
Effective with the 2015 performance unit awards, the Compensation Committee added TECO Energy, Inc. to the peer group.
DETERMINATION OF MARKET MEDIAN
We use the Towers Watson survey data to establish the “market median” for each NEO. For purposes of determining the 2014 compensation of Messrs. Klappa and Keyes, and Ms. Martin, the term “market median” means the median level for
| Wisconsin Electric Power Company | 22 | 2015 Annual Meeting Information Statement |
an executive officer serving in a comparable position in a comparably sized company to WEC in general industry based on our analysis of the Towers Watson survey data.
With respect to Mr. Garvin, given the scope of his responsibilities as Senior Vice President – External Affairs of WEC and the Company, we considered the average of (1) the median level for an individual serving as the top governmental relations officer of a company comparable in size to WEC and (2) the median level for a “sector head” of a company comparable in size to WEC in the energy services industry. We define a “sector head” as an individual in charge of an area of a company that is a significant source of revenue for that company. We determined that Mr. Garvin’s compensation should reflect the complexity of the energy services industry and the significant impact the state and federal regulatory process has on the financial condition of WEC and the Company.
There is not a well-defined market median for Mr. Leverett because of his unique role as both the principal executive officer of our electric generation operations and President of WEC.
Our comparison of each component of compensation with the appropriate market data when setting the compensation levels of our NEOs drives the allocation of cash versus non-cash compensation and short-term versus long-term incentive compensation.
ANNUAL BASE SALARY
The annual base salary component of our executive compensation program provides each executive officer with a fixed level of annual cash compensation. We believe that providing annual cash compensation through a base salary is an established market practice and is a necessary component of a competitive compensation program.
In determining the annual base salaries to be paid to our NEOs, we generally target base salaries to be within 10% of the market median for each NEO. However, the Compensation Committee may, in its discretion, adjust base salaries outside of this 10% band when the Compensation Committee deems it appropriate. The extent to which the Compensation Committee exercised discretion in establishing 2014 base salaries is set forth below.
Actual salary determinations are made taking into consideration factors such as the relative levels of individual experience, performance, responsibility, and contribution to the results of WEC’s and the Company’s operations. At the beginning of each year, Mr. Klappa develops a list of goals for WEC and its subsidiaries, including the Company, and their employees to achieve during the upcoming year. At the end of the year, Mr. Klappa measures the performance of WEC and the Company against each stated goal and reports the results to the Board. The Compensation Committee then takes WEC’s performance into consideration when establishing Mr. Klappa’s compensation for the upcoming year. Mr. Klappa undertakes a similar process with the NEOs of WEC and its subsidiaries, who develop individual goals related to the achievement of WEC’s goals developed by Mr. Klappa. At the end of the year, each officer’s performance is measured against these goals. Compensation recommendations and determinations for the upcoming year for each executive officer take into consideration the level of such performance.
The Compensation Committee also believes that Mr. Klappa’s compensation should reflect the fact that his tenure of 11 years as CEO is longer than many of those in the traditional market median. As a complement to the Towers Watson data, we conducted an analysis of compensation data from the twenty most valuable electric utility companies by market capitalization (3) in order to calibrate the effect on base salaries of longer service in the CEO position. The Compensation Committee discussed the results of this analysis and determined that the data indicated a distinction in the median salary for those CEOs who had served as a CEO for more than five years. Based upon all of the factors described above and the results of the Board’s annual CEO evaluation, the Compensation Committee determined it was appropriate to revise the market median for Mr. Klappa and to set his 2014 annual base salary at $1,283,040, approximately 3% outside this target range. This represents a 3.1% increase over Mr. Klappa’s 2013 base salary.
Based upon Mr. Leverett’s significant contributions to the success of WEC and the Company, the Compensation Committee increased Mr. Leverett’s base salary approximately 3.2% over his 2013 base salary that became effective upon being named President of WEC in August 2013.
| (3) | The 20 most valuable electric utility companies by market capitalization, as determined by publicly available data, were AES Corp.; American Electric Power Co.; CenterPoint Energy; Consolidated Edison; Dominion Resources; DTE Energy Co.; Duke Energy Corp.; Edison International; Entergy Corp.; Eversource Energy (f/k/a Northeast Utilities); Exelon Corp.; FirstEnergy Corp.; NextEra Energy; PG&E Corp.; PPL Corp.; Public Service Enterprise Group; Sempra Energy; The Southern Company; Wisconsin Energy Corporation; and Xcel Energy. |
| Wisconsin Electric Power Company | 23 | 2015 Annual Meeting Information Statement |
With respect to each other NEO, Mr. Klappa recommended an annual base salary to the Compensation Committee based upon a review of the market compensation data provided by Towers Watson and the factors described above. The Compensation Committee approved Mr. Klappa’s recommendations, which represented an average increase in annual base salary of just over 3% for Messrs. Keyes and Garvin, and Ms. Martin. The annual base salaries of Messrs. Keyes and Garvin, and Ms. Martin, were within 10% of the appropriate market median discussed above.
ANNUAL CASH INCENTIVE COMPENSATION
We provide annual cash incentive compensation through WEC’s Short-Term Performance Plan (“STPP”). The STPP provides for annual cash awards to NEOs based upon the achievement of pre-established stockholder, customer, and employee focused objectives. All payments under the STPP are at risk. Payments are made only if performance goals are achieved, and awards may be less or greater than targeted amounts based on actual performance. Payments under the STPP are intended to reward achievement of short-term goals that contribute to WEC stockholder and customer (including our customers) value, as well as individual contributions to successful operations.
2014 Target Awards. Each year, the Compensation Committee approves a target level of compensation under the STPP for each of the NEOs. This target level of compensation is expressed as a percentage of base salary. Each of Messrs. Klappa, Leverett, and Garvin has an employment agreement with WEC that specifies a target level of compensation under the STPP based on a percentage of such executive officer’s annual base salary. The terms of Messrs. Klappa’s and Leverett’s employment agreements provide that the target award may not be adjusted below these levels unless the WEC Board or the Compensation Committee takes action resulting in the lowering of target awards for the entire senior executive group. The target levels contained in the employment agreements were negotiated and, we believe, consistent with market practice at the time the agreements were entered into. The market data we reviewed in connection with determining 2014 compensation indicated that Mr. Klappa’s then current target level was below the median for similar officers in companies similar in size to WEC in general industry. As a result, the Compensation Committee approved an increase in Mr. Klappa’s target award level to 110% from 105% of annual base salary.
The target award levels of Messrs. Keyes and Garvin, and Ms. Martin, reflect median incentive compensation practices as indicated by the market data. We believe Mr. Leverett’s target award level reflects market competitive practices given his unique position at WEC and demonstrated leadership.
The 2014 target awards for each NEO were as follows:
Executive Officer | Target STPP Award as a Percentage of Base Salary | |||
Mr. Klappa | 110 | % | ||
Mr. Keyes | 75 | % | ||
Mr. Leverett | 90 | % | ||
Ms. Martin | 70 | % | ||
Mr. Garvin | 60 | % | ||
For 2014, the possible payout for any NEO ranged from 0% of the target award to 210% of the target award, based on WEC’s performance.
2014 Performance Goals. The Compensation Committee adopted the 2014 STPP with a continued principal focus on financial results. In December 2013, the Compensation Committee approved WEC earnings per share from continuing operations as the primary performance measure to be used in 2014. We continue to believe WEC’s earnings per share from continuing operations is a key indicator of financial strength and performance and is recognized as such by the investment community. In January 2014, the Compensation Committee approved the performance goals under the STPP for WEC’s earnings per share from continuing operations as follows:
| Earnings Per Share Performance Goal | Earnings Per Share CAGR | Payout Level | ||||||||
| $ | 2.48 | 4.4 | % | 25 | % | |||||
| $ | 2.50 | 4.7 | % | 50 | % | |||||
| Wisconsin Electric Power Company | 24 | 2015 Annual Meeting Information Statement |
| Earnings Per Share Performance Goal | Earnings Per Share CAGR | Payout Level | ||||||||
| $ | 2.52 | 5.0 | % | 100 | % | |||||
| $ | 2.54 | 5.3 | % | 125 | % | |||||
| $ | 2.57 | 5.6 | % | 200 | % | |||||
If WEC’s performance falls between these levels, the payout level is determined by interpolating on a straight line basis the appropriate payout level.
WEC’s growth plan, which has been communicated to the public, calls for a compound annual growth rate (“CAGR”) in earnings per share from continuing operations of 4.0% to 6.0% starting with WEC’s 2011 earnings per share from continuing operations of $2.18. At the time the Compensation Committee was establishing targets for 2014, we believed that this CAGR plus the continued industry-leading growth in WEC’s dividend would support a premium valuation as compared to WEC’s peers. Rather than provide for a payout at a 4.0% CAGR, the Compensation Committee determined that WEC would need to achieve a CAGR of 4.4%, which would result in 2014 earnings per share of $2.48, to reach the minimum payout level. The Compensation Committee then tied achievement of the remaining payout levels (below target, target, above target and maximum) to WEC earnings per share corresponding to incremental increases of 0.03% in the CAGR. While achievement of the other payout levels required increases of two cents per share, the Compensation Committee determined that achievement of the maximum payout level should require more of an increase. Therefore, an incremental increase of three cents per share would be required to achieve the maximum payout level.
Similar to prior years, in December 2013 and January 2014, the Compensation Committee also approved operational performance measures and targets under the annual incentive plan. Annual incentive awards could be increased or decreased by up to 10% of the target award based upon WEC’s performance in the operational areas of customer satisfaction (5% weight), supplier and workforce diversity (2.5%), and safety (2.5%). The Compensation Committee recognizes the importance of strong operational results to the success of WEC and the Company and has identified these three operational areas in particular as being critical to that success.
In addition to applying these financial and operational factors, the Compensation Committee retains the right to exercise discretion in adjusting awards under the STPP when it deems appropriate.
2014 Performance Under the STPP. In January 2015, the Compensation Committee reviewed WEC’s actual performance for 2014 against the financial and operational performance goals established under the STPP, subject to final audit. In 2014, WEC’s financial performance satisfied the maximum payout level established for WEC earnings per share from continuing operations. WEC’s earnings per share from continuing operations were $2.65 for 2014, highest in WEC’s history. This earnings level equates to a CAGR of 6.7% from WEC’s 2011 earnings per share. To compute earnings per share from continuing operations, we excluded from earnings per share of $2.59 costs related to WEC’s acquisition of TEG in the amount of $0.06 per share. WEC’s earnings per share from continuing operations is not a measure of financial performance under generally accepted accounting principles.
By satisfying the maximum payout level with respect to WEC earnings per share from continuing operations, the NEOs earned 200% of the target award from the financial goal component of the STPP.
With respect to operational goals in 2014, the performance at WEC and its subsidiaries, including the Company, generated a 5% increase to the compensation awarded under the STPP, as detailed below. WEC and its subsidiaries, including the Company, achieved the best overall safety performance in their history in 2014, exceeding the target levels for both Occupational Safety and Health Administration (OSHA) recordable injuries and lost-time injuries leading to a 2.5% increase in the STPP award. WEC and its subsidiaries exceeded target level performance with respect to both supplier and workforce diversity, resulting in an increase in the STPP award of 2.5% for 2014. The Compensation Committee measured customer satisfaction levels based on the results of surveys that an independent third party conducted of customers who had direct contact with the Company and WG during the year, which measured (1) customers’ satisfaction with the Company and WG overall and (2) customers’ satisfaction with respect to their particular transactions with the Company and WG. In 2014, the Company and WG exceeded the target level related to satisfaction with the particular interaction, but fell slightly short of the target level related to overall satisfaction with the Company and WG. Therefore, performance in customer satisfaction did not have any impact on the award.
The Compensation Committee did not factor individual contributions into determining the amount of the awards for the NEOs. Because performance measured against the financial and operational goals resulted in significant STPP awards in
| Wisconsin Electric Power Company | 25 | 2015 Annual Meeting Information Statement |
2014, the Compensation Committee determined that no further adjustments based upon individual contributions or otherwise were appropriate.
Based on performance measured against the financial and operational goals established by the Compensation Committee, Mr. Klappa received annual incentive cash compensation under the STPP of $2,893,255 for 2014. This represented 225% of his annual base salary. Messrs. Keyes, Leverett and Garvin, and Ms. Martin, received annual cash incentive compensation for 2014 under the STPP equal to 154%, 185%, 123% and 143% of their respective annual base salaries, representing 205% of the target award for each officer.
Changes to STPP for 2015 – Financial Performance Measures. For 2015, the Compensation Committee adopted a second financial performance measure with respect to the vesting of the annual incentive award under the STPP. In general, the 2015 annual incentive will be dependent upon financial achievement determined by WEC’s performance against targets for both earnings from continuing operations (75% weight) and cash flow (25% weight).
Short-Term Dividend Equivalents. Under the STPP, certain officers, including the NEOs, and employees are eligible to receive dividend equivalents in an amount equal to the number of WEC performance units at the target 100% rate held by each such officer and employee on the dividend declaration date multiplied by the amount of cash dividends paid by WEC on a share of its common stock on such date. The short-term dividend equivalents vest at the end of each year only if WEC achieves the performance target or targets for that year established by the Compensation Committee in the same manner as the performance targets are established under the STPP for the annual incentive awards. For 2014, the Compensation Committee determined that the short-term dividend equivalents would be dependent upon WEC’s performance against a target for earnings from continuing operations. The Compensation Committee established $2.52 per share, which was the earnings per share from continuing operations necessary to achieve a 5.0% CAGR, as the target, and WEC achieved $2.65 per share.
LONG-TERM INCENTIVE COMPENSATION
The Compensation Committee administers WEC’s 1993 Omnibus Stock Incentive Plan, amended and restated effective May 5, 2011, which is a WEC stockholder-approved, long-term incentive plan designed to link the interests of executives and other key employees of WEC and its subsidiaries, including the Company, to creating long-term stockholder value. It allows for various types of awards tied to the performance of WEC common stock, including stock options, stock appreciation rights, and restricted stock. The Compensation Committee also administers the WEC Performance Unit Plan, under which the Compensation Committee may award WEC performance units. The Compensation Committee primarily uses (1) WEC performance units, (2) WEC stock options, and (3) WEC restricted stock to deliver long-term incentive opportunities.
Performance Units. Each year, the Compensation Committee makes annual grants of WEC performance units under the Performance Unit Plan. WEC performance units are designed to provide a form of long-term incentive compensation that aligns the interests of management with those of a typical utility stockholder who is focused not only on stock price appreciation but also on dividends. Under the terms of the performance units, payouts are based on WEC’s level of “total stockholder return” (stock price appreciation plus reinvested dividends) in comparison to a peer group of companies over a three-year performance period. The performance units are settled in cash.
Stock Options. Each year, the Compensation Committee also makes annual WEC stock option grants as part of the long-term incentive program. These stock options have an exercise price equal to the fair market value of WEC common stock on the date of grant and expire on the 10th anniversary of the grant date. Since management benefits from a stock option award only to the extent WEC’s stock price appreciates above the exercise price of the stock option, stock options align the interests of management with those of WEC’s stockholders in attaining long-term stock price appreciation.
Restricted Stock. The Compensation Committee also awards WEC restricted stock as part of the long-term incentive plan, consistent with market practice. Similar to performance units, restricted stock aligns the interests of management with a typical utility stockholder who is focused on stock price appreciation and dividends.
Aggregate 2014 Long-Term Incentive Awards. In establishing the target value of long-term incentive awards for each NEO in 2014, we analyzed the market compensation data included in the Towers Watson survey. For Messrs. Klappa, Keyes and Garvin, and Ms. Martin, we determined the ratio of (1) the market median value of long-term incentive compensation to (2) the market median level of annual base salary, and multiplied each annual base salary by the applicable market ratio to determine the value of long-term incentive awards to be granted. These target values were presented to and approved by the Compensation Committee. We also calculated a target value of long-term incentive
| Wisconsin Electric Power Company | 26 | 2015 Annual Meeting Information Statement |
awards for Mr. Leverett using this method. However, because of Mr. Leverett’s role in WEC’s succession plan, we recommended, and the Compensation Committee approved, a higher target value.
For 2014, the Compensation Committee approved a long-term incentive award consisting of WEC performance units, WEC stock options, and WEC restricted stock. Performance units are the largest component of the long-term incentive award. The Compensation Committee continues to believe that the long-term award must be tied to WEC performance and stockholder value and that WEC performance units are an effective tool to achieve this goal.
2014 Stock Option Grants. In December 2013, the Compensation Committee approved the grant of WEC stock options to each of the NEOs and established an overall pool of WEC stock options that were granted to approximately 100 other employees. These option grants were made effective January 2, 2014, the first trading day of 2014. The options were granted with an exercise price equal to the average of the high and low prices reported on the New York Stock Exchange for shares of WEC common stock on the grant date. The WEC stock options were granted in accordance with our standard practice of making annual WEC stock option grants effective on the first trading day of each year, and the timing of the grants was not tied to the timing of any release of material information. These stock options have a term of 10 years and vest 100% on the third anniversary of the date of grant. The vesting of WEC stock options may be accelerated in connection with a change in control of WEC or an executive officer’s termination of employment. See “Potential Payments upon Termination or Change in Control” under “Executive Compensation” for additional information.
For purposes of determining the appropriate number of options to grant to a particular NEO, the value of an option was determined based on the Black-Scholes option pricing model. We use the Black-Scholes option pricing model for purposes of the compensation valuation. This valuation approach is consistent with the market information we review from Towers Watson. The following table provides the number of WEC stock options granted to each NEO in 2014.
Executive Officer | Options Granted | |||
Mr. Klappa | 302,535 | |||
Mr. Keyes | 57,335 | |||
Mr. Leverett | 134,055 | |||
Ms. Martin | 32,705 | |||
Mr. Garvin | 24,665 | |||
For financial reporting purposes, the WEC stock options granted in 2014 had a grant date fair value of $3.51 per option for Mr. Klappa and Ms. Martin, and a grant date fair value of $5.01 for Messrs. Keyes, Leverett and Garvin. Mr. Klappa and Ms. Martin are considered to be “retirement eligible.” Therefore, their options are presumed to have a shorter expected life, which results in a lower option value.
2014 Restricted Stock Awards. In December 2013, the Compensation Committee also approved the grant of WEC restricted stock to each of the NEOs and established an overall pool of WEC restricted stock that was granted to approximately 100 other employees. These grants were also made effective January 2, 2014. The restricted stock vests in three equal annual installments beginning on January 2, 2015. The vesting of the restricted stock may be accelerated in connection with a termination of employment due to a change in control of WEC, death or disability or by action of the Compensation Committee. See “Potential Payments upon Termination or Change in Control” under “Executive Compensation” for additional information. Tax withholding obligations related to vesting may be satisfied, at the option of the executive officer, by withholding shares otherwise deliverable upon vesting or by cash. The NEOs have the right to vote the restricted stock and to receive cash dividends when WEC pays a dividend to its stockholders.
For purposes of determining the appropriate number of shares of WEC restricted stock to grant to a particular NEO, the Compensation Committee used a value of $41.16 per share. This value was based on the volume weighted price of WEC’s common stock for the ten trading days beginning on December 2, 2013 and ending on December 13, 2013. The Compensation Committee uses the volume weighted price in order to minimize the impact of day to day volatility in the stock market. The measurement period is customarily early to mid- December to shorten the timeframe between the calculation of the awards and the actual grant date. The following table provides the number of shares of WEC restricted stock granted to each NEO in 2014.
| Wisconsin Electric Power Company | 27 | 2015 Annual Meeting Information Statement |
Executive Officer | Restricted Stock Granted | |||
Mr. Klappa | 18,144 | |||
Mr. Keyes | 3,438 | |||
Mr. Leverett | 8,040 | |||
Ms. Martin | 1,962 | |||
Mr. Garvin | 1,479 | |||
2014 Performance Units. In 2014, the Compensation Committee granted WEC performance units to each of the NEOs and approved a pool of WEC performance units that were granted to approximately 100 other employees. With respect to the 2014 performance units, the amount of the benefit that ultimately vests will be dependent upon WEC’s total stockholder return over a three-year period ending December 31, 2016, as compared to the total stockholder return of the custom peer group previously described under “Competitive Benchmarking,” again excluding TEG and Pepco Holdings. Total stockholder return is the calculation of total return (stock price appreciation plus reinvestment of dividends) based upon an initial investment of $100 and subsequent $100 investments at the end of each quarter during the three-year performance period.
Upon vesting, the performance units will be settled in cash in an amount determined by multiplying the number of performance units that have vested by the closing price of WEC’s common stock on the last trading day of the performance period.
The required percentile ranking for total stockholder return and the applicable vesting percentage are set forth in the chart below.
Performance Percentile Rank | Vesting Percent | |||
< 25th Percentile | 0 | % | ||
25th Percentile | 25 | % | ||
Target (50th Percentile) | 100 | % | ||
75th Percentile | 125 | % | ||
90th Percentile | 175 | % | ||
If WEC’s rank is between the benchmarks identified above, the vesting percentage will be determined by interpolating on a straight line basis the appropriate vesting percentage. Unvested performance units generally are immediately forfeited upon a NEO’s cessation of employment with WEC prior to completion of the three-year performance period. However, the performance units will vest immediately at the target 100% rate upon (1) the termination of the NEO’s employment by reason of disability or death or (2) a change in control of WEC while the NEO is employed by WEC or its subsidiaries, including the Company. In addition, a prorated number of performance units (based upon the target 100% rate) will vest upon the termination of employment of the NEO by reason of retirement prior to the end of the three-year performance period.
For purposes of determining the appropriate number of WEC performance units to grant to a particular NEO, the Compensation Committee used a value of $41.16 per unit, the same value used for the restricted stock. The following table provides the number of WEC performance units granted to each NEO at the 100% target level.
Executive Officer | Performance Units Granted | |||
Mr. Klappa | 78,620 | |||
Mr. Keyes | 14,900 | |||
Mr. Leverett | 34,840 | |||
Ms. Martin | 8,500 | |||
Mr. Garvin | 6,410 | |||
| Wisconsin Electric Power Company | 28 | 2015 Annual Meeting Information Statement |
Amendment of Performance Unit Plan – Vesting Double Trigger. The Compensation Committee amended and restated the WEC Performance Unit Plan effective January 1, 2015, to incorporate a double trigger for the vesting of performance units awarded under the plan upon a change in control of WEC. For awards granted on or after January 1, 2015, the plan now requires a separation from service after a change in control of WEC for vesting of the awards to occur.
2014 Payouts Under Previously Granted Long-Term Incentive Awards. In 2012, the Compensation Committee granted WEC performance unit awards to participants in the plan, including the NEOs. The terms of the performance units granted in 2012 were substantially similar to those of the performance units granted in 2014 described above, and the required performance percentile ranks and related vesting schedule were identical to that of the 2014 units.
Payouts under the 2012 WEC performance units were based on WEC’s total stockholder return for the three-year performance period ended December 31, 2014 against the same group of peer companies used for the 2014 WEC performance unit awards, except that the 2012 peer group of companies included Sempra Energy. Sempra was removed from the peer group for subsequent performance unit awards because its long-term business model no longer compared to WEC’s. The percentage of Sempra’s earnings from U.S. utility operations is expected to drop as more growth is expected from its international operations.
For the three-year performance period ended December 31, 2014, WEC’s total stockholder return was at the 52nd percentile of the peer group, resulting in the performance units vesting at a level of 102.4%. The actual payouts were determined by multiplying the number of vested performance units by the closing price of WEC’s common stock ($52.74) on December 31, 2014, the last trading day of the performance period. The actual payout to each NEO is reflected in the “Option Exercises and Stock Vested for Fiscal Year 2014” table.
COMPENSATION RECOUPMENT POLICY
Accountability is a fundamental value of WEC and the Company. To reinforce this value through the executive compensation program, in December 2014, the Compensation Committee adopted a clawback policy that provides for the recoupment of incentive-based compensation in the event WEC is required to prepare an accounting restatement due to material noncompliance with any financial reporting requirement under the securities laws (other than restatements permitted as a result of changes in accounting principles or interpretation). Pursuant to the policy, the Compensation Committee will recover from any current or former executive officer who has received incentive-based compensation during the three year period preceding the date on which WEC is required to prepare the accounting restatement, any portion of the incentive-based compensation paid in excess of what would have been paid to the executive officer under the restated financial results. The Company may also recover incentive-based compensation if an executive officer’s employment is terminated for cause, or the executive officer violates a noncompetition or other restrictive covenant.
STOCK OWNERSHIP GUIDELINES
The Compensation Committee believes that an important adjunct to the long-term incentive program is significant stock ownership by officers who participate in the program, including the NEOs. Accordingly, the Compensation Committee has implemented WEC stock ownership guidelines for officers of WEC and the Company. These guidelines provide that each executive officer, including the NEOs, should, over time (generally within five years of appointment as an executive officer), acquire and hold WEC common stock having a minimum fair market value ranging from 250% to 500% of base salary. In addition to shares owned outright, holdings of each of the following are included in determining compliance with the stock ownership guidelines: WEC restricted stock; WEC phantom stock units held in the Executive Deferred Compensation Plan; WEC stock held in the 401(k) plan; WEC performance units at target; and WEC shares held by a brokerage account, jointly with an immediate family member or in a trust.
The Compensation Committee annually reviews whether executive officers are in compliance with these guidelines. The last review was completed in July 2014. The Compensation Committee determined that all of the NEOs satisfied, or were making appropriate progress to satisfy, these guidelines.
PROHIBITION ON HEDGING AND PLEDGING
Wisconsin Energy’s Corporate Securities Trading Policy prohibits the use of any strategies or products, including derivatives and short-selling techniques, to hedge against potential changes in the value of WEC’s common stock. The policy also prohibits the holding of WEC securities in a margin account, as well as the pledging of WEC securities as collateral for a loan.
| Wisconsin Electric Power Company | 29 | 2015 Annual Meeting Information Statement |
LIMITED TRADING WINDOWS
Officers, including the NEOs, other key employees, and the Company’s directors may only transact in WEC securities during approved trading windows after satisfying mandatory pre-clearance requirements.
RETIREMENT PROGRAMS
WEC also maintains retirement plans in which the NEOs participate: a defined benefit pension plan of the cash balance type, a supplemental executive retirement plan, and individual letter agreements with some of the NEOs. We believe WEC’s retirement plans are a valuable benefit in the attraction and retention of our employees, including the NEOs. We believe that providing a foundation for long-term financial security for our employees, beyond their employment with the Company, is a valuable component of our overall compensation program which will inspire increased loyalty and improved performance. For more information about our retirement plans, see “Pension Benefits at Fiscal Year-End 2014” and “Retirement Plans”.
OTHER BENEFITS, INCLUDING PERQUISITES
The Company provides its executive officers, including the NEOs, with employee benefits and a limited number of perquisites. Except as specifically noted elsewhere in this information statement, the employee benefits programs in which executive officers participate (which provide benefits such as medical coverage, retirement benefits, and annual contributions to a qualified savings plan) are generally the same programs offered to substantially all of the Company’s salaried employees.
The perquisites made available to executive officers include financial planning, membership in a service that provides health care and safety management when traveling outside the United States, payment of the cost of a mandatory physical exam that the Board requires annually, limited spousal travel for business purposes, and monitoring costs related to a residential security system. The Company also pays periodic dues and fees for club memberships for certain of the NEOs and other designated officers.
We periodically review market data regarding executive perquisite practices. In 2013, we reviewed a survey of 335 companies throughout general industry conducted by The Ayco Company, L.P., a financial services firm (“AYCO”). We reviewed 2013 data because this survey is conducted every two years. Based upon this review, we believe that the perquisites we provide to the executive officers are generally market competitive and reflect the practices of other similarly-sized companies. Effective January 1, 2014, the Compensation Committee increased the annual financial planning allowance for executive officers to $18,000 from $15,000. The last modification to the allowance occurred in 2004, and general inflation over the nine-year period had caused the fees charged by our preferred provider to overtake the financial planning allowance. The Company has a legacy group of executives who are still eligible for gross-ups. We reimburse those executives who are still eligible for gross-ups for taxes paid on income attributable to the financial planning benefits provided to the executives only if the executive uses the Company’s identified preferred provider, AYCO. We believe the use of the preferred financial adviser provides administrative benefits and eases communication between Company personnel and the financial adviser.
We pay periodic dues and fees for certain club memberships as we have found that the use of these facilities helps foster better customer relationships. Officers, including the NEOs, are expected to use clubs for which the Company pays dues primarily for business purposes. We do not pay any additional expenses incurred for personal use of these facilities, and officers are required to reimburse the Company to the extent that it pays for any such personal use. The total annual club dues are included in the Summary Compensation Table. We do not permit personal use of the airplane utilized by WEC. We do allow spousal travel if an executive’s spouse is accompanying the executive on business travel and the airplane is not fully utilized by WEC personnel. There is no incremental cost to WEC or the Company for this travel, other than the reimbursement for taxes paid on imputed income attributable to the executives for this perquisite, as the airplane cost is the same regardless of whether an executive’s spouse travels.
In addition, each of our executive officers participates in WEC’s death benefit only plan. Under the terms of the plan, upon an executive officer’s death while employed by WEC or its subsidiaries, including the Company, a benefit is paid to his or her designated beneficiary in an amount equal to the after-tax value of three times the officer’s base salary at the time of death.
| Wisconsin Electric Power Company | 30 | 2015 Annual Meeting Information Statement |
TAX GROSS-UP POLICY
In December 2014, the Compensation Committee adopted a formal policy that prohibits entry into any contract, agreement, or arrangement with any officer of WEC or its subsidiaries, including the Company, that obligates the Company to pay directly or reimburse the officer for any portion of the officer’s individual tax liability for benefits provided by the Company. Excluded from this policy are (i) agreements or arrangements entered into prior to December 2014, (ii) agreements or arrangements entered into prior to, and assumed by the Company in connection with, any merger or acquisition, or (iii) plans or policies applicable to Company employees generally.
This policy formalizes WEC’s and the Company’s practice since the beginning of 2006 to not include any provisions requiring a gross-up for excise tax in any new executive employment agreement, as well as the Compensation Committee’s policy since July 2011 to eliminate tax gross-ups on perquisites provided by WEC or the Company to their officers (except to officers who were already receiving gross-ups as of July 2011). Of the NEOs, Messrs. Klappa, Leverett and Garvin, and Ms. Martin, were receiving gross-ups from WEC prior to July 2011.
SEVERANCE BENEFITS AND CHANGE IN CONTROL
Several years ago, the Compensation Committee determined that it would no longer offer severance and change in control benefits in employment agreements. Therefore, Messrs. Keyes and Garvin, and Ms. Martin, have not entered into an employment agreement that provides for these benefits. However, they are eligible to participate in the Company’s Severance Pay Plan. Prior to that time, each of Messrs. Klappa and Leverett entered into an employment agreement with WEC which includes severance and change in control provisions. For a discussion of the severance and change in control benefits available under these agreements, and to the executive officers generally, see “Potential Payments upon Termination or Change in Control”.
In addition, WEC’s supplemental pension plan provides that in the event of a change in control of WEC, each NEO will be entitled to a lump sum payment of amounts due under the plan if employment is terminated within 18 months of the change in control.
IMPACT OF PRIOR COMPENSATION
The Compensation Committee does not believe it is appropriate to consider the amounts realized or realizable from prior incentive compensation awards when establishing future levels of short-term and long-term incentive compensation.
SECTION 162(M) OF THE INTERNAL REVENUE CODE
Section 162(m) of the Internal Revenue Code limits the deductibility of certain executives’ compensation that exceeds $1 million per year, unless the compensation is performance-based under Section 162(m) and is issued through a plan that has been approved by stockholders. Although the Compensation Committee takes into consideration the provisions of Section 162(m), it believes that maintaining tax deductibility is only one consideration among many in the design of an effective executive compensation program.
With respect to 2014 compensation for the NEOs, the stock option grants under WEC’s 1993 Omnibus Stock Incentive Plan have been structured to qualify as performance-based compensation under Section 162(m). The remaining components of the 2014 compensation program do not qualify for tax deductibility under Section 162(m).
COMPENSATION COMMITTEE REPORT
The Compensation Committee has reviewed and discussed the Compensation Discussion and Analysis required by Item 402(b) of Regulation S-K with management and, based on such review and discussions, the Compensation Committee recommended to the Board of Directors that the Compensation Discussion and Analysis be included in this information statement.
| The Compensation Committee |
| John F. Bergstrom, Committee Chair |
Thomas J. Fischer Ulice Payne, Jr. |
| Wisconsin Electric Power Company | 31 | 2015 Annual Meeting Information Statement |
EXECUTIVE COMPENSATION
The following table summarizes total compensation awarded to, earned by or paid to the Company’s Chief Executive Officer, Chief Financial Officer and each of the Company’s other three most highly compensated executive officers as of December 31, 2014 (the “NEOs”). The amounts shown in this and all subsequent tables in this information statement are WEC consolidated compensation data.
Summary Compensation Table
(a) | (b) | (c) | (d) | (e) | (f) | (g) | (h) | (i) | (j) | |||||||||||||||||||||||||||
Name and Principal Position | Year | Salary | Bonus | Stock Awards (3) | Option Awards (4) | Non-Equity Incentive Plan Compensation (5) | Change in Pension Value and Nonqualified Deferred Compensation Earnings (6) | All Other Compensation (7) (8) | Total | |||||||||||||||||||||||||||
| ($) | ($) | ($) | ($) | ($) | ($) | ($) | ($) | |||||||||||||||||||||||||||||
Gale E. Klappa | ||||||||||||||||||||||||||||||||||||
Chairman of the Board and Chief Executive Officer of WEC, WE and WG; President of WE and WG |
| 2014 2013 2012 |
|
| 1,283,040 1,243,256 1,209,393 |
|
| — — — |
|
| 3,969,744 3,727,719 3,991,025 |
|
| 1,061,898 1,443,747 763,287 |
|
| 3,289,058 3,097,587 2,951,811 |
|
| 2,647,425 29,170 3,938,995 |
|
| 246,641 229,347 223,467 |
|
| 12,497,806 9,770,826 13,077,978 |
| |||||||||
J. Patrick Keyes | ||||||||||||||||||||||||||||||||||||
Executive Vice President and Chief Financial Officer of WEC, WE and WG |
| 2014 2013 2012 |
|
| 515,536 500,520 345,400 |
|
| — — — |
|
| 752,317 740,397 163,495 |
|
| 287,248 380,107 41,422 |
|
| 846,957 798,334 413,593 |
|
| 105,365 55,712 39,508 |
|
| 70,153 48,771 40,691 |
|
| 2,577,576 2,523,841 1,044,109 |
| |||||||||
Allen L. Leverett | ||||||||||||||||||||||||||||||||||||
President of WEC; Executive Vice President of WE and WG |
| 2014 2013 2012 |
|
| 774,000 705,139 652,856 |
|
| — — — |
|
| 1,759,152 1,533,874 1,754,910 |
|
| 671,616 787,466 444,510 |
|
| 1,598,927 1,446,375 1,293,839 |
|
| 1,578,300 11,124 1,115,374 |
|
| 125,250 103,074 104,251 |
|
| 6,507,245 4,587,052 5,365,740 |
| |||||||||
Susan H. Martin(1) | ||||||||||||||||||||||||||||||||||||
Executive Vice President, General Counsel and Corporate Secretary of WEC, WE and WG |
| 2014 2013 |
|
| 430,499 417,960 |
|
| — — |
|
| 429,204 431,052 |
|
| 114,795 166,965 |
|
| 649,371 621,419 |
|
| 79,808 72,942 |
|
| 110,671 87,549 |
|
| 1,814,348 1,797,887 |
| |||||||||
Robert M. Garvin | ||||||||||||||||||||||||||||||||||||
Senior Vice President of WEC, WE and WG |
| 2014 2013 2012 |
|
| 386,548 374,562 363,300 |
|
| 30,000 20,000 — | (2) (2)
|
| 323,646 263,531 300,483 |
|
| 123,572 135,301 76,131 |
|
| 505,437 479,221 466,272 |
|
| 72,709 50,059 49,299 |
|
| 61,126 62,456 51,070 |
|
| 1,503,038 1,385,130 1,306,555 |
| |||||||||
| (1) | Ms. Martin became a named executive officer in 2013. Therefore, no information has been provided for 2012. |
| (2) | Constitutes discretionary bonuses paid to Mr. Garvin for exceptional work on legislative and regulatory matters during 2014 and 2013. |
| (3) | The amounts reported reflect the aggregate grant date fair value, as computed in accordance with FASB ASC Topic 718 excluding estimated forfeitures, of WEC performance units and WEC restricted stock awarded to each NEO in the respective year for which such amounts are reported. The amounts reported for the performance units are based upon the probable outcome as of the grant date of associated performance and market conditions, and are consistent with our estimate, as of the grant date, of aggregate compensation cost to be recognized over the three-year performance period. The actual value received by the executives from these awards may range from $0 to greater than the reported amounts, depending upon WEC’s performance and the executive’s number of additional years of service with the Company. |
The value of the WEC performance unit awards as of the grant date, assuming achievement of the highest level of performance, for each of Messrs. Klappa, Keyes, Leverett and Garvin, and Ms. Martin, is $7,256,233, $1,375,196, $3,215,558, $591,637 and $784,508, respectively, for the 2014 awards. The value of the WEC performance unit awards as of the grant date, assuming achievement of the highest level of performance, for each of Messrs. Klappa,
| Wisconsin Electric Power Company | 32 | 2015 Annual Meeting Information Statement |
Keyes, Leverett and Garvin, and Ms. Martin is $7,462,499, $1,482,258, $3,070,681, $527,453 and $862,985, respectively, for the 2013 awards.
| (4) | The amounts reported reflect the aggregate grant date fair value, as computed in accordance with FASB ASC Topic 718 excluding estimated forfeitures, of WEC stock options awarded to each NEO in the respective year for which such amounts are reported. The actual value received by the executives from these awards may range from $0 to greater than the reported amounts, depending upon WEC performance. In accordance with FASB ASC Topic 718, we made certain assumptions in our calculation of the grant date fair value of WEC stock options. See “Stock Options” in Note A — Summary of Significant Accounting Policies in the Notes to Consolidated Financial Statements in our 2014 Annual Report on Form 10-K for a description of these assumptions. For 2014, the assumptions made in connection with the valuation of WEC stock options are the same as described in Note A, except that the expected life of the options is 4.2 years for Mr. Klappa and Ms. Martin, and 7.8 years for Messrs. Keyes, Leverett and Garvin, and the expected forfeiture rate is 0%. The change in the expected life of the options as set forth in Note A resulted from the fact that Mr. Klappa and Ms. Martin were “retirement eligible” as of December 31, 2014, and Messrs. Keyes, Leverett and Garvin were not, whereas the assumption described in Note A is a weighted average of all option holders. The change in the expected forfeiture rate to 0% from 2.0%, as set forth in Note A, is due to the assumption that the NEOs will not forfeit any of their stock options. |
| (5) | Consists of the annual incentive compensation and short-term dividend equivalents earned under WEC’s STPP. The amounts earned for each award for 2014 are shown below. |
Name | Annual Incentive Award ($) | Short-Term Dividend Equivalents ($) | Total ($) | |||||||||
Gale E. Klappa | 2,893,255 | 395,803 | 3,289,058 | |||||||||
J. Patrick Keyes | 792,637 | 54,320 | 846,957 | |||||||||
Allen L. Leverett | 1,428,030 | 170,897 | 1,598,927 | |||||||||
Susan H. Martin | 617,765 | 31,606 | 649,371 | |||||||||
Robert M. Garvin | 475,454 | 29,983 | 505,437 | |||||||||
| (6) | The amounts reported for 2014, 2013 and 2012 reflect the aggregate change in the actuarial present value of each applicable NEO’s accumulated benefit under all defined benefit plans from December 31, 2013 to December 31, 2014, December 31, 2012 to December 31, 2013 and December 31, 2011 to December 31, 2012, respectively. For 2013 and 2012, the amounts reported also include above-market earnings on compensation that is deferred by the NEOs into the Prime Rate Fund under WEC’s Executive Deferred Compensation Plan. Above-market earnings represent the difference between the interest rate used to calculate earnings under the Plan and 120% of the applicable federal long-term rate prescribed by the Internal Revenue Code. |
The Company’s employees, including the NEOs, are eligible to participate in WEC’s defined benefit plans. For 2014, 2013 and 2012, the applicable discount rate used to value pension plan liabilities moved from 5.00% to 4.15%, 4.10% to 5.00% and 5.05% to 4.10%, respectively. As the discount rate decreases, the Company’s pension funding obligation increases, and vice versa. The changes in the actuarial present values of the NEOs’ pension benefits do not constitute cash payments to the NEOs.
The pension values reported represent only WEC’s obligation of the aggregate change in the actuarial present value of each NEO’s accumulated benefit under all defined benefit plans. Messrs. Klappa and Leverett are entitled to receive pension benefits from prior employers. To the extent such prior employers are unable to pay their pension obligations, WEC may be obligated to pay the total amount.
| (7) | During 2014, each NEO received financial planning services and the cost of an annual physical exam; Messrs. Klappa, Leverett and Garvin, and Ms. Martin, received reimbursement for club dues; Messrs. Klappa, Keyes and Leverett were provided with membership in a service that provides healthcare and safety management when traveling outside the United States; and Mr. Klappa received reimbursement for monitoring costs related to a home security system. In addition, the NEOs were eligible to receive reimbursement for taxes paid on imputed income attributable to certain perquisites including spousal travel and related costs for industry events where it is customary and expected that officers attend with their spouses. During 2014, Mr. Klappa utilized the benefit of spousal travel for business purposes with the associated tax reimbursement. These tax reimbursements are reflected in the Summary Compensation Table (see the third bullet point in Note 8 below). Other than the tax reimbursement, there is no incremental cost to the Company related to this spousal travel. |
| Wisconsin Electric Power Company | 33 | 2015 Annual Meeting Information Statement |
| (8) | For Mr. Klappa, the amount reported in All Other Compensation for 2014 includes $19,654 attributable to WEC’s Directors’ Charitable Awards Program in connection with Mr. Klappa’s service on the Company’s Board. See “Director Compensation” for a description of the Directors’ Charitable Awards Program. |
All Other Compensation for Messrs. Klappa, Keyes, Leverett and Garvin, and Ms. Martin, for 2014 also consists of:
| • | Employer matching of contributions into WEC’s 401(k) plan in the amount of $10,400 for Mr. Klappa, $10,013 for Mr. Keyes, and $10,050 for Messrs. Leverett and Garvin, and Ms. Martin; |
| • | “Make-whole” payments under WEC’s Executive Deferred Compensation Plan that provides a match at the same level as the 401(k) plan (4% for up to 7% of wages) for all deferred salary and bonus not otherwise eligible for a match in the amounts of $148,366, $41,403, $71,389, $23,846, and $31,211, respectively; and |
| • | Tax reimbursements or “gross-ups” for all applicable perquisites in the amounts of $35,274, $21,223, $9,090, and $24,422 for Messrs. Klappa, Leverett and Garvin, and Ms. Martin, respectively. |
Percentages of Total Compensation. In 2014, for Messrs. Klappa, Keyes, Leverett and Garvin, and Ms. Martin, (1) salary (as reflected in column (c) above) represented approximately 10%, 20%, 12%, 26% and 24%, respectively, of total compensation (as shown in column (j) above), (2) annual incentive compensation and short-term dividend equivalents (as reflected in column (g) above) represented approximately 26%, 33%, 25%, 34% and 36%, respectively, of total compensation, and (3) salary and annual incentive compensation and short-term dividend equivalents together represented approximately 37%, 53%, 36%, 59% and 60%, respectively, of total compensation.
In 2013, for Messrs. Klappa, Keyes, Leverett and Garvin, and Ms. Martin, (1) salary (as reflected in column (c) above) represented approximately 13%, 20%, 15%, 27% and 23%, respectively, of total compensation (as shown in column (j) above), (2) annual incentive compensation and short-term dividend equivalents (as reflected in column (g) above) represented approximately 32%, 32%, 32%, 35% and 35%, respectively, of total compensation, and (3) salary and annual incentive compensation and short-term dividend equivalents together represented approximately 44%, 51%, 47%, 63% and 58%, respectively, of total compensation.
In 2012, for Messrs. Klappa, Keyes, Leverett and Garvin, (1) salary represented approximately 9%, 33%, 12% and 28%, respectively, of total compensation, (2) annual incentive compensation and short-term dividend equivalents represented approximately 23%, 40%, 24% and 36%, respectively, of total compensation, and (3) salary and annual incentive compensation and short-term dividend equivalents together represented approximately 32%, 73%, 36% and 63%, respectively, of total compensation.
| Wisconsin Electric Power Company | 34 | 2015 Annual Meeting Information Statement |
Grants of Plan-Based Awards for Fiscal Year 2014
The following table shows additional data regarding incentive plan awards to the NEOs in 2014.
(a) | (b) | (c) | (d) | (e) | (f) | (g) | (h) | (i) | (j) | (k) | (l) | |||||||||||||||||||||||||||||||||||||||||
| Estimated Possible Payouts Under Non-Equity Incentive Plan Awards (2) | Estimated Future Payouts Under Equity Incentive Plan Awards (3) | All Other Stock Awards: Number of Shares of Stock or Units(4) | All Other Option Awards (5) | Grant Date Fair Value of Stock and Option Awards | ||||||||||||||||||||||||||||||||||||||||||||||||
Name | Grant Date | Action Date (1) | Threshold | Target | Maximum | Threshold | Target | Maximum | Number of Securities Underlying Options | Exercise or Base Price (6) | Closing Market Price | |||||||||||||||||||||||||||||||||||||||||
| ($) | ($) | ($) | (#) | (#) | (#) | (#) | (#) | ($/Sh) | ($/Sh) | ($) | ||||||||||||||||||||||||||||||||||||||||||
Gale E. Klappa | 1/16/14 | — | 352,836 | 1,411,344 | 2,963,822 | — | — | — | — | — | — | — | — | |||||||||||||||||||||||||||||||||||||||
| 1/16/14 | — | — | 395,803 | — | — | — | — | — | — | — | — | — | ||||||||||||||||||||||||||||||||||||||||
| 1/02/14 | 12/5/13 | — | — | — | 19,655 | 78,620 | 137,585 | — | — | — | — | 3,225,386 | ||||||||||||||||||||||||||||||||||||||||
| 1/02/14 | 12/5/13 | — | — | — | — | — | — | 18,144 | — | — | — | 744,358 | ||||||||||||||||||||||||||||||||||||||||
| 1/02/14 | 12/5/13 | — | — | — | — | — | — | — | 302,535 | 41.025 | 40.73 | 1,061,898 | ||||||||||||||||||||||||||||||||||||||||
J. Patrick Keyes | 1/16/14 | — | 96,663 | 386,652 | 811,969 | — | — | — | — | — | — | — | — | |||||||||||||||||||||||||||||||||||||||
| 1/16/14 | — | — | 54,320 | — | — | — | — | — | — | — | — | — | ||||||||||||||||||||||||||||||||||||||||
| 1/02/14 | 12/5/13 | — | — | — | 3,725 | 14,900 | 26,075 | — | — | — | — | 611,273 | ||||||||||||||||||||||||||||||||||||||||
| 1/02/14 | 12/5/13 | — | — | — | — | — | — | 3,438 | — | — | — | 141,044 | ||||||||||||||||||||||||||||||||||||||||
| 1/02/14 | 12/5/13 | — | — | — | — | — | — | — | 57,335 | 41.025 | 40.73 | 287,248 | ||||||||||||||||||||||||||||||||||||||||
Allen L. Leverett | 1/16/14 | — | 174,150 | 696,600 | 1,462,860 | — | — | — | — | — | — | — | — | |||||||||||||||||||||||||||||||||||||||
| 1/16/14 | — | — | 170,897 | — | — | — | — | — | �� | — | — | — | — | |||||||||||||||||||||||||||||||||||||||
| 1/02/14 | 12/5/13 | — | — | — | 8,710 | 34,840 | 60,970 | — | — | — | — | 1,429,311 | ||||||||||||||||||||||||||||||||||||||||
| 1/02/14 | 12/5/13 | — | — | — | — | — | — | 8,040 | — | — | — | 329,841 | ||||||||||||||||||||||||||||||||||||||||
| 1/02/14 | 12/5/13 | — | — | — | — | — | — | — | 134,055 | 41.025 | 40.73 | 671,616 | ||||||||||||||||||||||||||||||||||||||||
Susan H. Martin | 1/16/14 | — | 75,337 | 301,349 | 632,833 | — | — | — | — | — | — | — | — | |||||||||||||||||||||||||||||||||||||||
| 1/16/14 | — | — | 31,606 | — | — | — | — | — | — | — | — | — | ||||||||||||||||||||||||||||||||||||||||
| 1/02/14 | 12/5/13 | — | — | — | 2,125 | 8,500 | 14,875 | — | — | — | — | 348,713 | ||||||||||||||||||||||||||||||||||||||||
| 1/02/14 | 12/5/13 | — | — | — | — | — | — | 1,962 | — | — | — | 80,491 | ||||||||||||||||||||||||||||||||||||||||
| 1/02/14 | 12/5/13 | — | — | — | — | — | — | — | 32,705 | 41.025 | 40.73 | 114,795 | ||||||||||||||||||||||||||||||||||||||||
Robert M. Garvin | 1/16/14 | — | 57,982 | 231,929 | 487,051 | — | — | — | — | — | — | — | — | |||||||||||||||||||||||||||||||||||||||
| 1/16/14 | — | — | 29,983 | — | — | — | — | — | — | — | — | — | ||||||||||||||||||||||||||||||||||||||||
| 1/02/14 | 12/5/13 | — | — | — | 1,603 | 6,410 | 11,218 | — | — | — | — | 262,970 | ||||||||||||||||||||||||||||||||||||||||
| 1/02/14 | 12/5/13 | — | — | — | — | — | — | 1,479 | — | — | — | 60,676 | ||||||||||||||||||||||||||||||||||||||||
| 1/02/14 | 12/5/13 | — | — | — | — | — | — | — | 24,665 | 41.025 | 40.73 | 123,572 | ||||||||||||||||||||||||||||||||||||||||
| (1) | On December 5, 2013, the Compensation Committee awarded the 2014 WEC option, restricted stock and performance unit grants effective the first trading day of 2014 (January 2, 2014). |
| (2) | Non-equity incentive plan awards consist of annual incentive awards under WEC’s STPP (reported on the first line) and short-term dividend equivalents (reported on the second line). The short-term dividend equivalents only vest upon WEC’s achievement of the established performance target; otherwise, no dividend equivalents vest. For a more detailed description of the STPP and short-term dividend equivalents, see the Compensation Discussion and Analysis. |
| (3) | Consists of WEC performance units awarded under the WEC Performance Unit Plan. For a more detailed description of the terms of the performance units, see the Compensation Discussion and Analysis. |
| (4) | Consists of WEC restricted stock awarded under WEC’s 1993 Omnibus Stock Incentive Plan. For a more detailed description of the terms of the restricted stock, see the Compensation Discussion and Analysis. |
| (5) | Consists of non-qualified stock options to purchase shares of WEC common stock pursuant to WEC’s 1993 Omnibus Stock Incentive Plan. These options were granted for a term of ten years, subject to earlier termination in certain events related to termination of employment. The options fully vest and become exercisable three years from the date of grant. Notwithstanding the preceding sentence, the options become immediately exercisable upon the occurrence of a change in control of WEC or termination of employment by reason of retirement, disability or death. The exercise price may be paid by delivery of already-owned shares. Tax withholding obligations related to exercise may be satisfied by withholding shares otherwise deliverable upon exercise, subject to certain conditions. Subject to the |
| Wisconsin Electric Power Company | 35 | 2015 Annual Meeting Information Statement |
| limitations of WEC’s 1993 Omnibus Stock Incentive Plan, the Compensation Committee has the power to amend the terms of any option (with the participant’s consent). |
| (6) | The exercise price of the option awards is equal to the fair market value of WEC’s common stock on the date of grant, January 2, 2014. Fair market value is the average of the high and low prices of WEC common stock reported in the New York Stock Exchange Composite Transaction Report on the grant date. |
Outstanding Equity Awards at Fiscal Year-End 2014
The following table reflects the number and value of exercisable and unexercisable WEC stock options as well as the number and value of other WEC equity awards held by the NEOs at fiscal year-end 2014.
(a) | (b) | (c) | (d) | (e) | (f) | (g) | (h) | (i) | (j) | |||||||||||||||||||||||||||
| Option Awards | Stock Awards | |||||||||||||||||||||||||||||||||||
Name | Number of Securities Underlying Unexercised Options: Exercisable | Number of Securities Underlying Unexercised Options: Unexercisable (1) | Equity Incentive Plan Awards: Number of Securities Underlying Unexercised Unearned Options | Option Exercise Price | Option Expiration Date | Number of Shares or Units of Stock that Have Not Vested (2) | Market Value of Shares or Units of Stock that Have Not Vested | Equity Incentive Plan Awards: Number of Unearned Shares, Units or Other Rights that Have Not Vested(3) | Equity Incentive Plan Awards: Market or Payout Value of Unearned Shares, Units or Other Rights that Have Not Vested (3) | |||||||||||||||||||||||||||
| (#) | (#) | (#) | ($) | (#) | ($) | (#) | ($) | |||||||||||||||||||||||||||||
Gale E. Klappa | 471,790 | — | — | 24.0175 | 1/02/18 | — | — | — | — | |||||||||||||||||||||||||||
| 551,960 | — | — | 21.1075 | 1/02/19 | — | — | — | — | ||||||||||||||||||||||||||||
| 131,060 | — | — | 24.92 | 1/04/20 | — | — | — | — | ||||||||||||||||||||||||||||
| 122,610 | — | — | 29.3475 | 1/03/21 | — | — | — | — | ||||||||||||||||||||||||||||
| — | 255,280 | — | 34.875 | 1/03/22 | — | — | — | — | ||||||||||||||||||||||||||||
| — | 479,650 | — | 37.46 | 1/02/23 | — | — | — | — | ||||||||||||||||||||||||||||
| — | 302,535 | — | 41.025 | 1/02/24 | — | — | — | — | ||||||||||||||||||||||||||||
| — | — | — | — | — | 37,313 | 1,967,888 | — | — | ||||||||||||||||||||||||||||
| — | — | — | — | — | — | — | 141,496 | 7,462,499 | ||||||||||||||||||||||||||||
| — | — | — | — | — | — | — | 137,585 | 7,256,233 | ||||||||||||||||||||||||||||
J. Patrick Keyes | — | 10,460 | — | 34.875 | 1/03/22 | — | — | — | — | |||||||||||||||||||||||||||
| — | 95,265 | — | 37.46 | 1/02/23 | — | — | — | — | ||||||||||||||||||||||||||||
| — | 57,335 | — | 41.025 | 1/02/24 | — | — | — | — | ||||||||||||||||||||||||||||
| — | — | — | — | — | 6,184 | 326,144 | — | — | ||||||||||||||||||||||||||||
| — | — | — | — | — | — | — | 28,105 | 1,482,258 | ||||||||||||||||||||||||||||
| — | — | — | — | — | — | — | 26,075 | 1,375,196 | ||||||||||||||||||||||||||||
Allen L. Leverett | 193,683 | — | — | 24.0175 | 1/02/18 | — | — | — | — | |||||||||||||||||||||||||||
| 292,000 | — | — | 21.1075 | 1/02/19 | — | — | — | — | ||||||||||||||||||||||||||||
| 68,210 | — | — | 24.92 | 1/04/20 | — | — | — | — | ||||||||||||||||||||||||||||
| 56,540 | — | — | 29.3475 | 1/03/21 | — | — | — | — | ||||||||||||||||||||||||||||
| — | 112,250 | — | 34.875 | 1/03/22 | — | — | — | — | ||||||||||||||||||||||||||||
| — | 197,360 | — | 37.46 | 1/02/23 | — | — | — | — | ||||||||||||||||||||||||||||
| — | 134,055 | — | 41.025 | 1/02/24 | — | — | — | — | ||||||||||||||||||||||||||||
| — | — | — | — | — | 16,118 | 850,063 | — | — | ||||||||||||||||||||||||||||
| — | — | — | — | — | — | — | 58,223 | 3,070,681 | ||||||||||||||||||||||||||||
| — | — | — | — | — | — | — | 60,970 | 3,215,558 | ||||||||||||||||||||||||||||
Susan H. Martin | 6,530 | — | — | 21.1075 | 1/02/19 | — | — | — | — | |||||||||||||||||||||||||||
| 3,690 | — | — | 24.92 | 1/04/20 | — | — | — | — | ||||||||||||||||||||||||||||
| 3,390 | — | — | 29.3475 | 1/03/21 | — | — | — | — | ||||||||||||||||||||||||||||
| — | 6,530 | — | 34.875 | 1/03/22 | — | — | — | — | ||||||||||||||||||||||||||||
| — | 55,470 | — | 37.46 | 1/02/23 | — | — | — | — | ||||||||||||||||||||||||||||
| — | 32,705 | — | 41.025 | 1/02/24 | — | — | — | — | ||||||||||||||||||||||||||||
| — | — | — | — | — | 3,572 | 188,387 | — | — | ||||||||||||||||||||||||||||
| — | — | — | — | — | — | — | 16,363 | 862,985 | ||||||||||||||||||||||||||||
| — | — | — | — | — | — | — | 14,875 | 784,508 | ||||||||||||||||||||||||||||
| Wisconsin Electric Power Company | 36 | 2015 Annual Meeting Information Statement |
(a) | (b) | (c) | (d) | (e) | (f) | (g) | (h) | (i) | (j) | |||||||||||||||||||||||||||
| Option Awards | Stock Awards | |||||||||||||||||||||||||||||||||||
Name | Number of Securities Underlying Unexercised Options: Exercisable | Number of Securities Underlying Unexercised Options: Unexercisable (1) | Equity Incentive Plan Awards: Number of Securities Underlying Unexercised Unearned Options | Option Exercise Price | Option Expiration Date | Number of Shares or Units of Stock that Have Not Vested (2) | Market Value of Shares or Units of Stock that Have Not Vested | Equity Incentive Plan Awards: Number of Unearned Shares, Units or Other Rights that Have Not Vested(3) | Equity Incentive Plan Awards: Market or Payout Value of Unearned Shares, Units or Other Rights that Have Not Vested (3) | |||||||||||||||||||||||||||
| (#) | (#) | (#) | ($) | (#) | ($) | (#) | ($) | |||||||||||||||||||||||||||||
Robert M. Garvin | — | 19,225 | — | 34.875 | 1/03/22 | — | — | — | — | |||||||||||||||||||||||||||
| — | 33,910 | — | 37.46 | 1/02/23 | — | — | — | — | ||||||||||||||||||||||||||||
| — | 24,665 | — | 41.025 | 1/02/24 | — | — | — | — | ||||||||||||||||||||||||||||
| — | — | — | — | — | 2,866 | 151,153 | — | — | ||||||||||||||||||||||||||||
| — | — | — | — | — | — | — | 10,001 | 527,453 | ||||||||||||||||||||||||||||
| — | — | — | — | — | — | — | 11,218 | 591,637 | ||||||||||||||||||||||||||||
| (1) | All options reported in this column were granted ten years prior to their respective expiration date and vest 100% on the third anniversary of the grant date. |
| (2) | Effective January 3, 2012, Messrs. Klappa, Keyes, Leverett and Garvin, and Ms. Martin, were granted WEC restricted stock awards of 20,193, 828, 8,880, 1,521 and 516 shares, respectively, which began vesting in three equal annual installments on January 3, 2013. Effective January 2, 2013, Messrs. Klappa, Keyes, Leverett and Garvin, and Ms. Martin, were granted WEC restricted stock awards of 18,657, 3,705, 7,677, 1,320 and 2,157 shares, respectively, which began vesting in three equal annual installments on January 2, 2014. Effective January 2, 2014, Messrs. Klappa, Keyes, Leverett and Garvin, and Ms. Martin, were granted WEC restricted stock awards of 18,144, 3,438, 8,040, 1,479 and 1,962 shares, respectively, which began vesting in three equal annual installments on January 2, 2015. The vesting of the WEC restricted stock may be accelerated in connection with a termination of employment due to a change in control of WEC, death or disability or by action of the Compensation Committee. |
| (3) | The number of WEC performance units reported were awarded in 2013 (first line) and 2014 (second line) and vest at the end of the three-year performance period ending December 31, 2015 and December 31, 2016, respectively. The number of performance units reported and their corresponding value are based upon a payout at the maximum amount for 2013 and for 2014. |
| Wisconsin Electric Power Company | 37 | 2015 Annual Meeting Information Statement |
Option Exercises and Stock Vested for Fiscal Year 2014
This table shows the number and value of (1) WEC stock options that were exercised by the NEOs, (2) WEC restricted stock awards that vested and (3) WEC performance units that vested in 2014.
(a) | (b) | (c) | (d) | (e) | ||||||||||||
| Option Awards | Stock Awards | |||||||||||||||
Name | Number of Shares Acquired on Exercise | Value Realized on Exercise (1) | Number of Shares Acquired on Vesting (2) | Value Realized on Vesting (3)(4) | ||||||||||||
| (#) | ($) | (#) | ($) | |||||||||||||
Gale E. Klappa | 689,210 | 15,316,042 | 17,808 | 726,401 | ||||||||||||
| — | — | 96,506 | 5,089,773 | |||||||||||||
J. Patrick Keyes | — | — | 1,511 | 61,889 | ||||||||||||
| — | — | 3,952 | 208,462 | |||||||||||||
Allen L. Leverett | 482,817 | 10,957,483 | 7,759 | 316,441 | ||||||||||||
| — | — | 42,434 | 2,237,999 | |||||||||||||
Susan H. Martin | 20,520 | 490,626 | 1,025 | 41,940 | ||||||||||||
| — | — | 2,467 | 130,154 | |||||||||||||
Robert M. Garvin | — | — | 947 | 38,668 | ||||||||||||
| — | — | 7,265 | 383,171 | |||||||||||||
| (1) | Value realized upon the exercise of WEC stock options is determined by multiplying the number of shares received upon exercise by the difference between the market price of WEC common stock at the time of exercise and the exercise price. |
| (2) | Reflects the number of shares of WEC restricted stock that vested in 2014 (first line) and the number of WEC performance units that vested as of December 31, 2014, the end of the applicable three-year performance period (second line). The performance units were settled in cash. |
| (3) | Restricted stock value realized is determined by multiplying the number of shares of WEC restricted stock that vested by the fair market value of WEC common stock on the date of vesting. We compute fair market value as the average of the high and low prices of WEC common stock reported in the New York Stock Exchange Composite Transaction Report on the vesting date. |
| (4) | Performance units value realized is determined by multiplying the number of WEC performance units that vested by the closing market price of WEC common stock on December 31, 2014. |
| Wisconsin Electric Power Company | 38 | 2015 Annual Meeting Information Statement |
Pension Benefits at Fiscal Year-End 2014
The following table sets forth information for each NEO regarding their pension benefits at fiscal year-end 2014 under WEC’s three different retirement plans discussed below.
(a) | (b) | (c) | (d) | (e) | ||||||||||
Name | Plan Name | Number of Years Credited Service (1) | Present Value of Accumulated Benefit (2)(3) | Payments During Last Fiscal Year | ||||||||||
| (#) | ($) | ($) | ||||||||||||
Gale E. Klappa | WEC Plan | 11.67 | 237,056 | — | ||||||||||
SERP | 11.67 | 2,768,154 | — | |||||||||||
Individual Letter Agreement | 37.33 | 22,077,330 | — | |||||||||||
J. Patrick Keyes | WEC Plan | 3.67 | 66,387 | — | ||||||||||
SERP | 3.67 | 130,492 | — | |||||||||||
Individual Letter Agreement | 3.67 | 128,357 | — | |||||||||||
Allen L. Leverett | WEC Plan | 11.50 | 238,069 | — | ||||||||||
SERP | 11.50 | 1,426,037 | — | |||||||||||
Individual Letter Agreement | 26.00 | 3,331,824 | — | |||||||||||
Susan H. Martin | WEC Plan | 14.75 | 211,866 | — | ||||||||||
SERP | 14.75 | 207,908 | — | |||||||||||
Individual Letter Agreement | — | — | — | |||||||||||
Robert M. Garvin | WEC Plan | 3.67 | 71,412 | — | ||||||||||
SERP | 3.67 | 108,856 | — | |||||||||||
Individual Letter Agreement | 3.67 | 64,180 | — | |||||||||||
| (1) | Years of service are computed as of December 31, 2014, the pension plan measurement date used for financial statement reporting purposes. Messrs. Klappa and Leverett have been credited with 25.66 and 14.5 years of service, respectively, pursuant to the terms of their Individual Letter Agreements (“ILAs”). The increase in the aggregate amount of each of Messrs. Klappa’s and Leverett’s accumulated benefit under all of WEC’s retirement plans resulting from the additional years of credited service is $15,292,790 and $2,549,247, respectively. |
| (2) | The key assumptions used in calculating the actuarial present values reflected in this column are: |
| • | First projected unreduced retirement age based on current service: |
| • | For Mr. Klappa, age 64.33. |
| • | For Mr. Keyes, age 55.58. |
| • | For Mr. Leverett, age 65. |
| • | For Ms. Martin, age 62.67. |
| • | For Mr. Garvin, age 54.75. |
| • | Discount rate of 4.15%. |
| • | Cash balance interest crediting rate of 5.0%. |
| • | Form of payment: |
| • | Messrs. Klappa and Leverett: WEC Plan and SERP – Lump sum; ILA – Life annuity. |
| • | Messrs. Keyes and Garvin, and Ms. Martin: WEC Plan, SERP and ILA – Lump sum. |
| • | Mortality Table, for Messrs. Klappa’s and Leverett’s life annuity – IRS Prescribed Mortality. |
| (3) | WEC’s pension benefit obligations to Messrs. Klappa and Leverett will be partially offset by pension benefits Messrs. Klappa and Leverett are entitled to receive from their former employers. The amounts reported for Messrs. Klappa and Leverett represent only WEC’s obligation of the aggregate actuarial present value of each of their accumulated benefit under all of the plans. The total aggregate actuarial present value of each of Messrs. Klappa’s and Leverett’s accumulated benefit under all of the plans is $29,842,995 and $5,468,922 respectively, $4,760,455 and $472,993 of which we estimate the prior employer is obligated to pay. If Mr. Klappa’s or Mr. Leverett’s former employer becomes unable to pay its portion of his respective accumulated pension benefit, WEC may be obligated to pay the total amount. |
| Wisconsin Electric Power Company | 39 | 2015 Annual Meeting Information Statement |
Retirement Plans
WEC maintains three different plans providing for retirement payments and benefits for the NEOs: a defined benefit pension plan of the cash balance type (“WEC Plan”); a supplemental executive retirement plan (“SERP”); and ILAs. The compensation currently considered for purposes of the retirement plans (other than the WEC Plan) for Messrs. Klappa and Leverett is $3,805,759 and $1,850,430, respectively. These amounts represent the average compensation (consisting of base salary and annual incentive compensation) for the 36 highest consecutive months. For Messrs. Keyes and Garvin, and Ms. Martin, the compensation considered for purposes of the retirement plans (other than the WEC Plan) is $1,285,086, $847,259 and $1,030,272, respectively. These amounts represent their 2014 base salary, plus their 2013 STPP award paid in 2014. As of December 31, 2014, Messrs. Klappa, Keyes, Leverett and Garvin, and Ms. Martin, currently have or are considered to have 37.33, 3.67, 26.00, 3.67 and 14.75 credited years of service, respectively, under the various supplemental plans described below. Messrs. Keyes and Garvin, and Ms. Martin, were not granted additional years of credited service.
The WEC Plan. Most regular full-time and part-time employees, including the NEOs, participate in the WEC Plan. The WEC Plan bases a participant’s defined benefit pension on the value of a hypothetical account balance. For individuals participating in the WEC Plan as of December 31, 1995, a starting account balance was created equal to the present value of the benefit accrued as of December 31, 1994, under the plan benefit formula prior to the change to a cash balance approach. That formula provided a retirement income based on years of credited service and average compensation (consisting of base salary and annual incentive compensation) for the 36 highest consecutive months, with an adjustment to reflect the Social Security integrated benefit. In addition, individuals participating in the WEC Plan as of December 31, 1995, received a special one-time transition credit amount equal to a specified percentage varying with age multiplied by credited service and 1994 base pay.
The present value of the accrued benefit as of December 31, 1994, plus the transition credit, was also credited with interest at a stated rate. For 1996 through 2007, a participant received annual credits to the account equal to 5% of base pay (including 401(k) plan pre-tax deferrals and other items), plus an interest credit on all prior accruals equal to 4% plus 75% of the annual time-weighted trust investment return for the year in excess of 4%. From 2008 through 2013, the interest credit percentage was set at either the long-term corporate bond third segment rate, published by the Internal Revenue Service, or 4%, whichever was greater.
Effective January 1, 2014, participants receive an annual credit to the account equal to 6% of base pay (including 401(k) plan pre-tax deferrals and other items), plus an interest credit on all prior accruals equal to a 5% fixed rate. For participants in the WEC Plan on December 31, 2007 and December 31, 2013, their WEC Plan benefit will never be less than the benefit accrued as of December 31, 2007 and December 31, 2013, respectively. The WEC Plan benefit will be calculated under all three formulas to provide participants with the greater benefit; however, in calculating a participant’s benefit accrued as of December 31, 2007 and December 31, 2013, interest credits as defined under each of the prior WEC Plan formulas will be taken into account but not any additional pay credits. Effective January 1, 2014, the WEC Plan eliminated its performance-based benefit credit of up to an additional 2% of base pay based upon achievement of WEC earnings targets.
Participants who were “grandfathered” as of December 31, 1995, as discussed below, will still receive the greater of the grandfathered benefit or the cash balance benefit.
The life annuity payable under the WEC Plan is determined by converting the hypothetical account balance credits into annuity form.
Individuals who were participants in the WEC Plan on December 31, 1995 were “grandfathered” so that they will not receive any lower retirement benefit than would have been provided under the formula in effect through December 31, 1995, had it continued. This amount continued to increase until December 31, 2010, at which time it was frozen. Upon retirement, participants will receive the greater of this frozen amount or the accumulated cash balance.
For Messrs. Klappa and Leverett, estimated benefits under the grandfathered formula are higher than under the cash balance plan formula. Messrs. Keyes and Garvin, and Ms. Martin, do not participate in the grandfathered formula. Although all of the NEOs participate in the cash balance plan formula, pursuant to the agreements discussed below, Messrs. Klappa’s and Leverett’s total retirement benefits would be determined by the prior plan benefit formula if they were to retire at or after age 60. Mr. Klappa turned 64 in 2014. These benefits are payable under the ILAs, not the WEC Plan. These agreements also provide that the prior plan benefit formula will continue to be applied until retirement, with no amounts frozen as of December 31, 2010. Mr. Leverett would receive the cash balance in his account if he was to terminate employment prior to attaining the age of 60.
| Wisconsin Electric Power Company | 40 | 2015 Annual Meeting Information Statement |
Under the WEC Plan, participants receive unreduced pension benefits upon reaching one of the following three thresholds: (1) age 65; (2) age 62 with 30 years of service; or (3) age 60 with 35 years of service.
Pursuant to the Internal Revenue Code, only $260,000 of pension eligible earnings (base pay and annual incentive compensation) may be considered for purposes of the WEC Plan.
Supplemental Executive Retirement Plans and Individual Letter Agreements. Designated officers of WEC and the Company, including all of the NEOs, participate in the SERP, which is part of the Supplemental Pension Plan (the “SPP”) adopted to comply with Section 409A of the Internal Revenue Code. The SERP provides monthly supplemental pension benefits to participants, which will be paid out of unsecured corporate assets, or the grantor trust described below, in an amount equal to the difference between the actual pension benefit payable under the WEC Plan and what such pension benefit would be if calculated without regard to any limitation imposed by the Internal Revenue Code on pension benefits or covered compensation, including amounts deferred to the WEC Executive Deferred Compensation Plan. Except for a “change in control” of WEC, as defined in the SPP, and pursuant to the terms of the ILAs discussed below, no payments are made until after the participant’s retirement at or after age 60 or death. If a participant in the SERP dies prior to age 60, his or her beneficiary is entitled to receive retirement benefits under the SERP.
WEC entered into agreements with Messrs. Klappa and Leverett to provide them with supplemental retirement benefits upon retirement at or after age 60. The supplemental retirement payments are intended to make the total retirement benefits payable to the executive comparable to that which would have been received under the WEC Plan as in effect on December 31, 1995, had the defined benefit formula then in effect continued until the executive’s retirement, calculated without regard to Internal Revenue Code limits, and as if the executive had started participation in the WEC Plan at age 27 for Mr. Klappa and on January 1, 1989 for Mr. Leverett. The retirement benefits payable to Messrs. Klappa and Leverett will be offset by the value of any qualified or non-qualified defined benefit pension plans of prior employers.
Messrs. Klappa’s and Leverett’s agreements also provide for a pre-retirement spousal benefit to be paid to their spouses in the event of the executive’s death while employed by WEC or its subsidiaries. The benefit payable is equal to the amount which would have been received by the executive’s spouse under the WEC Plan as in effect on December 31, 1995, had the benefit formula then in effect continued until the executive’s death, calculated without regard to Internal Revenue Code limits, and as if the executive had started at the ages or dates indicated above for each executive. The spousal benefit payable would be offset by one-half of the value of any qualified or non-qualified deferred benefit pension plans of Messrs. Klappa’s and Leverett’s prior employers.
WEC entered into an agreement with Mr. Keyes when he was hired as Vice President and Treasurer that provides for a supplemental pension benefit account, which was credited with $100,000. This account will be credited with interest annually at the same rate as the WEC Plan. The account balance will vest at the earliest to occur of Mr. Keyes attaining age 60 or completion of 10 years of service.
Mr. Garvin’s agreement also provides for a supplemental pension benefit account, which was credited with $50,000. This account will be credited with interest annually at the same rate as the WEC Plan. The account balance will vest at the earliest to occur of Mr. Garvin attaining the age of 60 or completion of 10 years of service.
The purpose of these agreements was to ensure that Messrs. Klappa, Keyes, Leverett and Garvin did not lose pension earnings by joining the executive management team at WEC and the Company they otherwise would have received from their former employers. Without providing a means to retain these pension benefits, it would have been difficult to attract these officers.
The SPP provides for a mandatory lump sum payment upon a change in control of WEC if the executive’s employment is terminated within 18 months after the change in control. The Wisconsin Energy Corporation 2014 Rabbi Trust, a grantor trust, funds certain non-qualified benefits, including the SPP and the ILAs, as well as the WEC Executive Deferred Compensation Plan and the WEC Directors’ Deferred Compensation Plan. See “Potential Payments upon Termination or Change in Control” later in this information statement for additional information.
Effective January 1, 2015, all newly hired management employees, including executive officers, will receive a 6% contribution annually from the Company into WEC’s 401(k) plan rather than participate in the WEC Plan. In connection with this new plan, the Compensation Committee adopted the Wisconsin Energy Corporation Non-Qualified Retirement Savings Plan which provides “make-whole” benefits to address Internal Revenue Code limits on the amount of money that can be contributed to a 401(k) plan. The NEOs do not participate in these plans as they are grandfathered under the WEC Plan.
| Wisconsin Electric Power Company | 41 | 2015 Annual Meeting Information Statement |
Nonqualified Deferred Compensation for Fiscal Year 2014
The following table reflects activity by the NEOs during 2014 in WEC’s Executive Deferred Compensation Plan discussed below.
(a) | (b) | (c) | (d) | (e) | (f) | |||||||||||||||
Name | Executive Contributions in Last Fiscal Year (1) | Registrant Contributions in Last Fiscal Year (1) | Aggregate Earnings In Last Fiscal Year | Aggregate Withdrawals / Distributions | Aggregate Balance at Last Fiscal Year-End (2) | |||||||||||||||
| ($) | ($) | ($) | ($) | ($) | ||||||||||||||||
Gale E. Klappa | 587,328 | 148,366 | 205,139 | — | 6,836,128 | |||||||||||||||
J. Patrick Keyes | 628,717 | 41,403 | 57,475 | — | 937,667 | |||||||||||||||
Allen L. Leverett | 142,432 | 71,389 | 133,125 | — | 3,630,685 | |||||||||||||||
Susan H. Martin | 103,027 | 31,211 | 53,159 | — | 1,073,348 | |||||||||||||||
Robert M. Garvin | 59,308 | 23,846 | 14,209 | — | 231,441 | |||||||||||||||
| (1) | All of the amounts are reported as compensation in the Summary Compensation Table of this information statement. |
| (2) | $4,930,915, $155,931, $2,205,095, $119,298 and $106,586 of the reported amounts were reported as compensation in the Summary Compensation Tables in prior information statements for Messrs. Klappa, Keyes, Leverett and Garvin, and Ms. Martin, respectively. |
Executive Deferred Compensation Plan
WEC maintains two executive deferred compensation plans, the Legacy Wisconsin Energy Corporation Executive Deferred Compensation Plan (the “Legacy EDCP”) and the Wisconsin Energy Corporation Executive Deferred Compensation Plan (the “EDCP”), adopted effective January 1, 2005 to comply with Section 409A of the Internal Revenue Code. Executive officers and certain other highly compensated employees are eligible to participate in both plans. The Legacy EDCP provides that (i) amounts earned, deferred, vested, credited and/or accrued as of December 31, 2004 are preserved and frozen so that these amounts are exempt from Section 409A and (ii) no new employees may participate in the Legacy EDCP as of January 1, 2005. Since January 1, 2005, all deferrals have been made to the EDCP. The provisions of the EDCP as in effect on December 31, 2014, are described below, as are the payout provisions of the Legacy EDCP.
The EDCP. Under the plan, a participant may defer up to 75% of his or her base salary and annual incentive compensation and up to 100% of his or her vested awards of WEC performance units. WEC stock option gains, vested WEC restricted stock and short-term dividend equivalents may not be deferred into the EDCP.
Generally, deferral elections are made annually by each participant for the upcoming plan year. WEC maintains detailed records tracking each participant’s “account balance.” In addition to deferrals made by the participants, WEC may also credit each participant’s account balance by matching a certain portion of each participant’s deferral. Such deferral matching is determined by a formula taking into account the matching rate applicable under WEC’s 401(k) plan, the percentage of compensation subject to such matching rate, the participant’s gross compensation eligible for matching and the amount of eligible compensation actually deferred. Also, WEC, in its discretion, may credit any other amounts, as appropriate, to each participant’s account.
WEC tracks each participant’s account balance as though the balance was actually invested in one or more of several measurement funds. Measurement fund elections are not actual investments, but are elections chosen only for purposes of calculating market gain or loss on deferred amounts for the duration of the deferral period. Each participant may select the amount of deferred compensation to be allocated among any one or more of the available measurement funds. Participants may elect from among eight measurement funds that correspond to investment options in WEC’s 401(k) plan in addition to the Prime Rate Fund and WEC’s stock measurement fund. Contributions and deductions may be made to each participant’s account based on the performance of the measurement funds elected.
The table below shows the funds available under the EDCP and their annual rate of return for the calendar year ended December 31, 2014:
| Wisconsin Electric Power Company | 42 | 2015 Annual Meeting Information Statement |
Name of Fund | Rate of Return | Name of Fund | Rate of Return | |||||||
Fidelity Balanced Fund | 10.37 | % | Prime Rate | 3.25 | % | |||||
Fidelity Diversified International Fund | -3.20 | % | S&P 500 Fund | 13.69 | % | |||||
Fidelity Growth Company Fund | 14.44 | % | Vanguard Intermediate Bond Index | 6.96 | % | |||||
Fidelity Low-Priced Stock Fund | 7.65 | % | Vanguard Mid-Cap Index | 13.60 | % | |||||
MFS Value R4 | 10.57 | % | WEC Common Stock Fund | 32.10 | % | |||||
Each participant’s account balance is debited or credited periodically based on the performance of the measurement fund(s) elected by the participant. Subject to certain restrictions, participants may make changes to their measurement fund elections by notice to the committee administering the plan.
At the time of his or her deferral election, each participant may designate a prospective payout date for any or the entire amount deferred, plus any amounts debited or credited to the deferred amount as of the designated payout date. Amounts deferred into the EDCP may not be withdrawn at the discretion of the participant and a change to the designated payout date delays the initial payment five years beyond the originally designated payout date. In addition, payout amounts may not be limited in order to deduct such amounts under Section 162(m) of the Internal Revenue Code.
The balance of a participant’s account is payable on his or her retirement in either a lump sum payout or in annual installments, at the election of the participant. Upon the death of a participant after retirement, payouts are made to the deceased participant’s beneficiary in the same manner as though such payout would have been made to the participant had the participant survived. In the event of a participant’s termination of employment prior to retirement, the participant may elect to receive a payout beginning the year after termination in the amount of his or her account balance as of the termination date either in a lump sum or in annual installments over a period of five years. Disability is not itself a payment event until the participant terminates employment with WEC or its subsidiaries. A participant’s account balance will be paid out in a lump sum if the participant separates from service with WEC or its subsidiaries within 18 months after a change in control of WEC, as defined in the plan. The deferred amounts will be paid out of the general corporate assets or the assets of the Wisconsin Energy Corporation 2014 Rabbi Trust.
The Legacy EDCP. At the time of his or her deferral election, each participant designated a prospective payout date for any or the entire amount deferred, plus any amounts debited or credited to the deferred amount as of the designated payout date. A participant may elect, at any time, to withdraw part (a minimum of $25,000) or all of his or her account balance, subject to a withdrawal penalty of 10%. Payout amounts may be limited to the extent to which they are deductible under Section 162(m) of the Internal Revenue Code.
The balance of a participant’s account is payable on his or her retirement in either a lump sum payout or in annual installments, at the election of the participant. Upon the death of a participant after retirement, payouts are made to the deceased participant’s beneficiary in the same manner as though such payout would have been made to the participant had the participant survived. In the event of a participant’s termination of employment prior to retirement, the participant may elect to receive a payout beginning the year after termination in the amount of his or her account balance as of the termination date either in a lump sum or in annual installments over a period of five years. Any participant who suffers from a continued disability will be entitled to the benefits of plan participation unless and until the committee administering the plan determines that the participant has been terminated for purposes of continued participation in the plan. Upon any such determination, the disabled participant is paid out as though the participant had retired. Except in certain limited circumstances, participants’ account balances will be paid out in a lump sum (1) upon the occurrence of a change in control of WEC, as defined in the plan, or (2) upon any downgrade of WEC’s senior debt obligations to less than “investment grade.” The deferred amounts will be paid out of the general corporate assets or the assets of the Wisconsin Energy Corporation 2014 Rabbi Trust.
Amendment of EDCP and Legacy EDCP. Effective January 1, 2015, we amended the EDCP to provide that a plan participant may defer up to 50% of his or her base salary, annual incentive and his or her vested awards of WEC performance units. In addition, we amended the EDCP and the Legacy EDCP to eliminate all of the investment fund choices other than the WEC Common Stock Fund and the Prime Rate Fund.
| Wisconsin Electric Power Company | 43 | 2015 Annual Meeting Information Statement |
Potential Payments upon Termination or Change in Control
The tables below reflect the amount of compensation payable to each of our NEOs in the event of termination of each executive’s employment. These amounts are in addition to each NEO’s aggregate balance in the EDCP at fiscal year-end 2014, as reported in column (f) under “Nonqualified Deferred Compensation for Fiscal Year 2014.” The amount of compensation payable to each NEO upon voluntary termination, normal retirement, for-cause termination, involuntary termination (by WEC for any reason other than cause, death or disability or by the executive for “good reason”), termination following a “change in control” of WEC, disability and death are set forth below. The amounts shown assume that such termination was effective as of December 31, 2014 and include amounts earned through that date, and are estimates of the amounts which would be paid out to the NEOs upon termination. The amounts shown under “Normal Retirement” assume the NEOs were retirement eligible with no reduction of retirement benefits. The amounts shown under “Termination Upon a Change in Control” assume the NEOs terminated employment as of December 31, 2014, which was within 18 months of a change in control of WEC. The amounts reported in the row titled “Retirement Plans” in each table below are not in addition to the amounts reflected under “Pension Benefits at Fiscal Year-End 2014.” The actual amounts to be paid out can only be determined at the time of an officer’s termination of employment.
Payments Made Upon Voluntary Termination or Termination for Cause, Death or Disability. In the event a NEO voluntarily terminates employment or is terminated for cause, death or disability, the officer will receive:
| • | accrued but unpaid base salary and, for termination by death or disability, prorated annual incentive compensation; |
| • | 401(k) plan and EDCP account balances; |
| • | the WEC Plan cash balance; |
| • | in the case of death or disability, full vesting in all outstanding WEC stock options, WEC restricted stock and WEC performance units (otherwise, the ability to exercise already vested options within three months of termination) as well as vesting in the SERP and ILAs; and |
| • | if voluntary termination occurs after age 60, such termination is treated as a normal retirement. |
NEOs are also entitled to the value of unused vacation days, if any, and for termination by death, benefits payable under the death benefit only plan.
Payments Made Upon Normal Retirement. In the event of the retirement of a NEO, the officer will receive:
| • | accrued but unpaid base salary and prorated annual incentive compensation; |
| • | full vesting in all outstanding WEC stock options and a prorated amount of WEC performance units; |
| • | full vesting in all retirement plans, including the WEC Plan, SERP, and ILAs; and |
| • | 401(k) plan and EDCP account balances. |
NEOs are also entitled to the value of unused vacation days, if any.
Payments Made Under Employment Agreements Upon a Change in Control or Involuntary Termination.WEC has entered into written employment agreements with Messrs. Klappa and Leverett, which provide for certain severance benefits as described below.
Under the agreement with Mr. Klappa, severance benefits are provided if his employment is terminated:
| • | in anticipation of or following a change in control by WEC for any reason, other than cause, death or disability; |
| • | by Mr. Klappa for good reason in anticipation of or following a change in control of WEC; |
| • | by Mr. Klappa within six months after completing one year of service following a change in control of WEC; or |
| • | in the absence of a change in control of WEC, by WEC for any reason other than cause, death or disability or by Mr. Klappa for good reason. |
Upon the occurrence of one of these events, Mr. Klappa’s agreement provides for:
| • | a lump sum severance payment equal to three times the sum of Mr. Klappa’s highest annual base salary in effect in the last three years and highest bonus amount; |
| • | three years continuation of health and certain other welfare benefit coverage and eligibility for retiree health coverage thereafter; |
| Wisconsin Electric Power Company | 44 | 2015 Annual Meeting Information Statement |
| • | a payment equal to the value of three additional years of participation in the applicable qualified and non-qualified retirement plans based upon the higher of (1) the annual base salary in effect at the time of termination and (2) any salary in effect during the 180 day period preceding termination, plus the highest bonus amount; |
| • | a payment equal to the value of three additional years of WEC match in the 401(k) plan and the EDCP; |
| • | full vesting in all outstanding WEC stock options, WEC restricted stock and other equity awards; |
| • | 401(k) plan and EDCP account balances; |
| • | certain financial planning services and other benefits; and |
| • | in the event of a change in control of WEC, a “gross-up” payment should any payments or benefits under the agreements trigger federal excise taxes under the “parachute payment” provisions of the tax law. |
The highest bonus amount would be calculated as the largest of (1) the current target bonus for the fiscal year in which employment termination occurs, or (2) the highest bonus paid in any of the last three fiscal years prior to termination or the change in control of WEC. The agreement contains a one-year non-compete provision applicable on termination of employment.
Mr. Leverett’s agreement is substantially similar to Mr. Klappa’s, except that if his employment is terminated by WEC for any reason other than cause, death or disability or by him for good reason in the absence of a change in control of WEC:
| • | the special lump sum severance benefit is two times the sum of his highest annual base salary in effect for the three years preceding his termination and highest bonus amount; |
| • | health and certain other welfare benefits are provided for a two-year period; |
| • | the special retirement plan lump sum is calculated as if his employment continued for a two-year period following termination of employment; and |
| • | the payment for 401(k) plan and EDCP match is equal to two years of WEC match. |
Mr. Leverett’s agreement contains a one-year non-compete provision applicable on termination of employment.
Pursuant to the terms of the SPP and ILAs, retirement benefits are paid to the NEOs upon termination of employment within 18 months of a change in control of WEC. Participants in the SERP, including the NEOs, are also eligible to receive a supplemental disability benefit in an amount equal to the difference between the actual amount of the benefit payable under the long-term disability plan applicable to all employees and what such disability benefit would have been if calculated without regard to any limitation imposed by the broad-based plan on annual compensation recognized thereunder.
Generally, pursuant to Messrs. Klappa’s and Leverett’s agreements, a change in control of WEC is deemed to occur:
| (1) | if any person or group acquires WEC common stock that constitutes more than 50% of the total fair market value or total voting power of WEC; |
| (2) | if any person or group acquires (or has acquired during the 12-month period ending on the date of the most recent acquisition by such person or group) WEC common stock that constitutes 30% or more of the total voting power of WEC; |
| (3) | if a majority of the members of WEC’s Board is replaced during any 12-month period by directors whose appointment or election is not endorsed by a majority of WEC’s Board before the date of appointment or election; or |
| (4) | if any person or group acquires (or has acquired during the 12-month period ending on the date of the most recent acquisition by such person or group) assets from WEC that have a total gross fair market value equal to or more than 40% of the total gross value of all the assets of WEC immediately before such acquisition or acquisitions, unless the assets are transferred to: |
| • | an entity that is controlled by the stockholders of the transferring corporation; |
| • | a stockholder of WEC in exchange for or with respect to its stock; |
| • | an entity of which WEC owns, directly or indirectly, 50% or more of its total value or voting power; or |
| • | a person or group (or an entity of which such person or group owns, directly or indirectly, 50% or more of its total value or voting power) that owns, directly or indirectly, 50% or more of the total value or voting power of WEC. |
Generally, pursuant to Messrs. Klappa’s and Leverett’s ILAs, good reason means:
| (1) | solely in the context of a change in control of WEC, a material reduction of the executive’s duties and responsibilities; |
| Wisconsin Electric Power Company | 45 | 2015 Annual Meeting Information Statement |
| (2) | a material reduction in the executive’s base compensation; |
| (3) | a material change in the geographic location at which the executive must perform services; or |
| (4) | a material breach of the agreement by WEC. |
Payments under the Severance Pay Plan. Messrs. Keyes and Garvin, and Ms. Martin, have not entered into any agreement that provides for severance benefits upon a change in control of WEC or otherwise. All three officers are eligible to participate in the Company’s Severance Pay Plan, in which all management employees are eligible to participate. In the event a participant is involuntarily terminated, other than for cause, death, disability, retirement or resignation, the participant is entitled to receive severance pay in an amount equal to the sum of (i) 4% of the participant’s annual base salary and target bonus, plus (ii) 4% of the participant’s annual base salary and target bonus multiplied by his or her completed years of service with the Company. The maximum amount of severance pay that can be received under the plan is twelve months of a participant’s annual base salary and target bonus.
Potential Payments to Named Executive Officers Upon Termination or Change in Control of WEC
The following tables show the potential payments upon termination or a change in control of WEC for:
Gale E. Klappa.
Executive Benefits and Payments Upon Separation | Voluntary Termination | Normal Retirement | For Cause Termination | Involuntary Termination | Termination Upon a Change in Control | Disability | Death | |||||||||||||||||||||
| ($) | ($) | ($) | ($) | ($) | ($) | ($) | ||||||||||||||||||||||
Compensation: | ||||||||||||||||||||||||||||
Cash Severance | — | — | — | 11,877,447 | 11,877,447 | — | — | |||||||||||||||||||||
Additional Pension Credited Service | — | — | — | 3,003,769 | 3,003,769 | — | — | |||||||||||||||||||||
Additional 401(k) and EDCP Match | — | — | — | 475,098 | 475,098 | — | — | |||||||||||||||||||||
Long-Term Incentive Compensation: | ||||||||||||||||||||||||||||
Performance Units | 4,225,001 | 4,225,001 | — | 8,410,712 | 8,410,712 | 8,410,712 | 8,410,712 | |||||||||||||||||||||
Restricted Stock | — | — | — | 1,967,888 | 1,967,888 | 1,967,888 | 1,967,888 | |||||||||||||||||||||
Options | 15,431,038 | 15,431,038 | — | 15,431,038 | 15,431,038 | 15,431,038 | 15,431,038 | |||||||||||||||||||||
Benefits & Perquisites: | ||||||||||||||||||||||||||||
Retirement Plans | 25,082,540 | 25,082,540 | 25,082,540 | 20,338,588 | 20,338,588 | 25,082,540 | 11,862,313 | |||||||||||||||||||||
Health and Welfare Benefits | — | — | — | 60,179 | 60,179 | — | — | |||||||||||||||||||||
Excise Tax Gross-Up | — | — | — | — | — | — | — | |||||||||||||||||||||
Financial Planning | — | — | — | 54,000 | 54,000 | — | — | |||||||||||||||||||||
Outplacement | — | — | — | 30,000 | 30,000 | — | — | |||||||||||||||||||||
Death Benefit Only Plan | — | — | — | — | — | — | 3,849,120 | |||||||||||||||||||||
|
|
|
|
|
|
|
|
|
|
|
|
|
| |||||||||||||||
Total | 44,738,579 | 44,738,579 | 25,082,540 | 61,648,719 | 61,648,719 | 50,892,178 | 41,521,071 | |||||||||||||||||||||
|
|
|
|
|
|
|
|
|
|
|
|
|
| |||||||||||||||
| Wisconsin Electric Power Company | 46 | 2015 Annual Meeting Information Statement |
J. Patrick Keyes.
Executive Benefits and Payments Upon Separation | Voluntary Termination | Normal Retirement | For Cause Termination | Involuntary Termination | Termination Upon a Change in Control | Disability | Death | |||||||||||||||||||||
| ($) | ($) | ($) | ($) | ($) | ($) | ($) | ||||||||||||||||||||||
Compensation: | ||||||||||||||||||||||||||||
Cash Severance | — | — | — | 142,548 | 142,548 | — | — | |||||||||||||||||||||
Additional Pension Credited Service | — | — | — | — | — | — | — | |||||||||||||||||||||
Additional 401(k) and EDCP Match | — | — | — | — | — | — | — | |||||||||||||||||||||
Long-Term Incentive Compensation: | ||||||||||||||||||||||||||||
Performance Units | — | 826,647 | — | — | 1,632,830 | 1,632,830 | 1,632,830 | |||||||||||||||||||||
Restricted Stock | — | — | — | — | 326,144 | 326,144 | 326,144 | |||||||||||||||||||||
Options | — | 2,313,858 | — | — | 2,313,858 | 2,313,858 | 2,313,858 | |||||||||||||||||||||
Benefits & Perquisites: | ||||||||||||||||||||||||||||
Retirement Plans | 66,387 | 325,235 | 66,387 | 325,235 | 325,235 | 325,235 | 308,925 | |||||||||||||||||||||
Health and Welfare Benefits | — | — | — | 10,030 | 10,030 | — | — | |||||||||||||||||||||
Excise Tax Gross-Up | — | — | — | — | — | — | — | |||||||||||||||||||||
Financial Planning | — | — | — | — | — | — | — | |||||||||||||||||||||
Outplacement | — | — | — | — | — | — | — | |||||||||||||||||||||
Death Benefit Only Plan | — | — | — | — | — | — | 1,546,608 | |||||||||||||||||||||
|
|
|
|
|
|
|
|
|
|
|
|
|
| |||||||||||||||
Total | 66,387 | 3,465,740 | 66,387 | 477,813 | 4,750,645 | 4,598,067 | 6,128,365 | |||||||||||||||||||||
|
|
|
|
|
|
|
|
|
|
|
|
|
| |||||||||||||||
Allen L. Leverett.
Executive Benefits and Payments Upon Separation | Voluntary Termination | Normal Retirement | For Cause Termination | Involuntary Termination | Termination Upon a Change in Control | Disability | Death | |||||||||||||||||||||
| ($) | ($) | ($) | ($) | ($) | ($) | ($) | ||||||||||||||||||||||
Compensation: | ||||||||||||||||||||||||||||
Cash Severance | — | — | — | 4,069,472 | 6,104,208 | — | — | |||||||||||||||||||||
Additional Pension Credited Service | — | — | — | 1,732,318 | 2,127,108 | — | — | |||||||||||||||||||||
Additional 401(k) and EDCP Match | — | — | — | 162,779 | 244,168 | — | — | |||||||||||||||||||||
Long-Term Incentive Compensation: | ||||||||||||||||||||||||||||
Performance Units | — | 1,782,243 | — | 3,592,121 | 3,592,121 | 3,592,121 | 3,592,121 | |||||||||||||||||||||
Restricted Stock | — | — | — | 850,063 | 850,063 | 850,063 | 850,063 | |||||||||||||||||||||
Options | — | 6,590,230 | — | 6,590,230 | 6,590,230 | 6,590,230 | 6,590,230 | |||||||||||||||||||||
Benefits & Perquisites: | ||||||||||||||||||||||||||||
Retirement Plans | 238,069 | 4,995,929 | 238,069 | 4,587,385 | 4,597,708 | 4,995,929 | 2,810,206 | |||||||||||||||||||||
Health and Welfare Benefits | — | — | — | 40,119 | 60,179 | — | — | |||||||||||||||||||||
Excise Tax Gross-Up | — | — | — | — | — | — | — | |||||||||||||||||||||
Financial Planning | — | — | — | 54,000 | 54,000 | — | — | |||||||||||||||||||||
Outplacement | — | — | — | 30,000 | 30,000 | — | — | |||||||||||||||||||||
Death Benefit Only Plan | — | — | — | — | — | — | 2,322,000 | |||||||||||||||||||||
|
|
|
|
|
|
|
|
|
|
|
|
|
| |||||||||||||||
Total | 238,069 | 13,368,402 | 238,069 | 21,708,487 | 24,249,785 | 16,028,343 | 16,164,620 | |||||||||||||||||||||
|
|
|
|
|
|
|
|
|
|
|
|
|
| |||||||||||||||
| Wisconsin Electric Power Company | 47 | 2015 Annual Meeting Information Statement |
Susan H. Martin.
Executive Benefits and Payments Upon Separation | Voluntary Termination | Normal Retirement | For Cause Termination | Involuntary Termination | Termination Upon a Change in Control | Disability | Death | |||||||||||||||||||||
| ($) | ($) | ($) | ($) | ($) | ($) | ($) | ||||||||||||||||||||||
Compensation: | ||||||||||||||||||||||||||||
Cash Severance | — | — | — | 433,843 | 433,843 | — | — | |||||||||||||||||||||
Additional Pension Credited Service | — | — | — | — | — | — | — | |||||||||||||||||||||
Additional 401(k) and EDCP Match | — | — | — | — | — | — | — | |||||||||||||||||||||
Long-Term Incentive Compensation: | ||||||||||||||||||||||||||||
Performance Units | 478,141 | 478,141 | — | 478,141 | 941,409 | 941,409 | 941,409 | |||||||||||||||||||||
Restricted Stock | — | — | — | — | 188,387 | 188,387 | 188,387 | |||||||||||||||||||||
Options | 1,347,183 | 1,347,183 | — | 1,347,183 | 1,347,183 | 1,347,183 | 1,347,183 | |||||||||||||||||||||
Benefits & Perquisites: | ||||||||||||||||||||||||||||
Retirement Plans | 419,774 | 419,774 | 419,774 | 419,774 | 419,774 | 419,774 | 419,774 | |||||||||||||||||||||
Health and Welfare Benefits | — | — | — | 10,030 | 10,030 | — | — | |||||||||||||||||||||
Excise Tax Gross-Up | — | — | — | — | — | — | — | |||||||||||||||||||||
Financial Planning | — | — | — | — | — | — | — | |||||||||||||||||||||
Outplacement | — | — | — | — | — | — | — | |||||||||||||||||||||
Death Benefit Only Plan | — | — | — | — | — | — | 1,291,497 | |||||||||||||||||||||
|
|
|
|
|
|
|
|
|
|
|
|
|
| |||||||||||||||
Total | 2,245,098 | 2,245,098 | 419,774 | 2,688,971 | 3,340,626 | 2,896,753 | 4,188,250 | |||||||||||||||||||||
|
|
|
|
|
|
|
|
|
|
|
|
|
| |||||||||||||||
Robert M. Garvin.
Executive Benefits and Payments Upon Separation | Voluntary Termination | Normal Retirement | For Cause Termination | Involuntary Termination | Termination Upon a Change in Control | Disability | Death | |||||||||||||||||||||
| ($) | ($) | ($) | ($) | ($) | ($) | ($) | ||||||||||||||||||||||
Compensation: | ||||||||||||||||||||||||||||
Cash Severance | — | — | — | 97,806 | 97,806 | — | — | |||||||||||||||||||||
Additional Pension Credited Service | — | — | — | — | — | — | — | |||||||||||||||||||||
Additional 401(k) and EDCP Match | — | — | — | — | — | — | — | |||||||||||||||||||||
Long-Term Incentive Compensation: | ||||||||||||||||||||||||||||
Performance Units | — | 313,644 | — | — | 639,473 | 639,473 | 639,473 | |||||||||||||||||||||
Restricted Stock | — | — | — | — | 151,153 | 151,153 | 151,153 | |||||||||||||||||||||
Options | — | 1,150,330 | — | — | 1,150,330 | 1,150,330 | 1,150,330 | |||||||||||||||||||||
Benefits & Perquisites: | ||||||||||||||||||||||||||||
Retirement Plans | 71,412 | 244,448 | 71,412 | 244,448 | 244,448 | 244,448 | 232,183 | |||||||||||||||||||||
Health and Welfare Benefits | — | — | — | 10,030 | 10,030 | — | — | |||||||||||||||||||||
Excise Tax Gross-Up | — | — | — | — | — | — | — | |||||||||||||||||||||
Financial Planning | — | — | — | — | — | — | — | |||||||||||||||||||||
Outplacement | — | — | — | — | — | — | — | |||||||||||||||||||||
Death Benefit Only Plan | — | — | — | — | — | — | 1,159,644 | |||||||||||||||||||||
|
|
|
|
|
|
|
|
|
|
|
|
|
| |||||||||||||||
Total | 71,412 | 1,708,422 | 71,412 | 352,284 | 2,293,240 | 2,185,404 | 3,332,783 | |||||||||||||||||||||
|
|
|
|
|
|
|
|
|
|
|
|
|
| |||||||||||||||
RISK ANALYSIS OF COMPENSATION POLICIES AND PRACTICES
As part of its process to determine the 2014 compensation of the NEOs, the Compensation Committee analyzed whether the compensation program of WEC and its subsidiaries, including the Company, taken as a whole creates risks that are reasonably likely to have a material adverse effect on WEC and its subsidiaries. The Compensation Committee concluded it does not. This analysis applies generally to the compensation program for WEC’s and the Company’s employees since all management employees (both officers and non-officers) above a certain level are provided with substantially the same mix of compensation as the NEOs. The compensation package provided to employees below this level is not applicable to this analysis as such compensation package does not provide sufficient incentive to take risks that could materially affect WEC or the Company.
| Wisconsin Electric Power Company | 48 | 2015 Annual Meeting Information Statement |
There is no objective way to measure risk resulting from a corporation’s compensation program; therefore, this analysis is subjective in nature. We believe that the only elements of the compensation program that could incentivize risk-taking by WEC’s or the Company’s employees, and therefore have a reasonable likelihood of materially adversely affecting WEC or the Company, are the annual cash incentive compensation and the long-term incentive compensation, the payout of which is dependent on the achievement of certain performance levels by WEC and its subsidiaries, including the Company. Based upon the value of each of these elements to the overall compensation mix and the relative value each has to the other, we believe the compensation program is appropriately balanced. We believe that the mix of short- and long-term awards minimizes risks that may be taken, as any risks taken for short-term gains could ultimately jeopardize WEC’s or the Company’s ability to meet the long-term performance objectives. Given the current balance of compensation elements, we do not believe the compensation program incentivizes unreasonable risk-taking by management.
The Compensation Committee’s stock ownership guidelines require officers who participate in the long-term incentive compensation program to hold an amount of WEC common stock and other equity-related WEC securities that varies depending upon such officers’ level. The guidelines require executive officers to hold common stock and other equity-related securities of WEC having a minimum fair market value ranging from 250% to 500% of base salary. The Compensation Committee believes these stock ownership guidelines further discourage unreasonable risk taking by WEC or Company officers.
As part of this analysis, we also considered the nature of WEC’s business as a public utility holding company and the fact that substantially all of its earnings and other financial results are generated by, or relate to, regulated public utilities, including the Company. The highly regulated nature of WEC’s business, including limits on the amount of profit the Company (and therefore, WEC) may earn, significantly reduces any incentive to engage in conduct that would be reasonably likely to have a material adverse effect on WEC or the Company.
STOCK OWNERSHIP OF DIRECTORS, NOMINEES AND EXECUTIVE OFFICERS
None of the Company’s directors, nominees or executive officers own any WE stock, but do beneficially own shares of its parent company, Wisconsin Energy Corporation. The following table lists the beneficial ownership of WEC common stock of each Wisconsin Electric director, nominee, named executive officer and of all of its directors and executive officers as a group as of March 2, 2015. In general, “beneficial ownership” includes those shares as to which the indicated persons have voting power or investment power and WEC stock options that are exercisable currently or within 60 days of March 2, 2015. Included are shares owned by each individual’s spouse, minor children or any other relative sharing the same residence, as well as shares held in a fiduciary capacity or held in WEC’s Stock Plus Investment Plan and 401(k) plan. None of these persons beneficially owns more than 1% of WEC’s outstanding common stock.
| Shares Beneficially Owned(1) | ||||||||||||
Name | Shares Owned(2) (3) (4) | Option Shares Exercisable Within 60 Days | Total | |||||||||
John F. Bergstrom | 18,021 | — | 18,021 | |||||||||
Barbara L. Bowles | 22,492 | — | 22,492 | |||||||||
Patricia W. Chadwick | 25,220 | — | 25,220 | |||||||||
Curt S. Culver | 6,503 | — | 6,503 | |||||||||
Thomas J. Fischer | 34,472 | — | 34,472 | |||||||||
Robert M. Garvin | 4,401 | 19,225 | 23,626 | |||||||||
J. Patrick Keyes | 11,745 | 10,460 | 22,205 | |||||||||
Gale E. Klappa | 144,206 | 1,532,700 | 1,676,906 | |||||||||
Henry W. Knueppel | 8,975 | — | 8,975 | |||||||||
Allen L. Leverett | 52,291 | 561,658 | 613,949 | |||||||||
Susan H. Martin | 11,215 | 20,140 | 31,355 | |||||||||
Ulice Payne, Jr. | 31,308 | — | 31,308 | |||||||||
Mary Ellen Stanek | 9,104 | — | 9,104 | |||||||||
|
|
|
|
|
| |||||||
All directors and executive officers as a group (15 persons) | 454,016 | (5) | 2,162,443 | 2,616,459 | (6) | |||||||
|
|
|
|
|
| |||||||
| (1) | Information on beneficially owned shares is based on data furnished by the specified persons and is determined in accordance with Rule 13d-3 under the Securities Exchange Act of 1934, as amended, as required for purposes of this information statement. It is not necessarily to be construed as an admission of beneficial ownership for other purposes. |
| Wisconsin Electric Power Company | 49 | 2015 Annual Meeting Information Statement |
| (2) | Certain directors, NEOs, and other executive officers also hold share units in the WEC phantom common stock account under WEC’s deferred compensation plans as indicated: Mr. Bergstrom (51,089), Ms. Bowles (726), Mr. Culver (70,834), Mr. Fischer (2,559), Mr. Garvin (34), Mr. Keyes (1,011), Ms. Martin (771), Ms. Stanek (5,521) and all directors and executive officers as a group (132,893). Share units are intended to reflect the performance of WEC common stock and are payable in cash. While these units do not represent a right to acquire WEC common stock, have no voting rights, and are not included in the number of shares reflected in the “Shares Owned” column in the table above, the Company listed them in this footnote because they represent an additional economic interest of the directors, NEOs, and other executive officers that is tied to the performance of WEC common stock. |
| (3) | Each individual has sole voting and investment power as to all shares listed for such individual, except the following individuals have shared voting and/or investment power (included in the table above) as indicated: Mr. Bergstrom (6,000), Mr. Fischer (25,969), Mr. Klappa (5,000), Mr. Knueppel (2,500), Mr. Leverett (34,759), Ms. Martin (454), Ms. Stanek (2,601) and all directors and executive officers as a group (77,283). |
| (4) | The directors and executive officers hold shares of WEC restricted stock (included in the table above) over which the holders have sole voting but no investment power: Mr. Bergstrom (6,503), Ms. Bowles (6,503), Ms. Chadwick (6,503), Mr. Culver (6,503), Mr. Fischer (6,503), Mr. Garvin (2,671), Mr. Keyes (6,380), Mr. Klappa (33,678), Mr. Knueppel (6,475), Mr. Leverett (14,723), Ms. Martin (3,677) Mr. Payne (6,503), Ms. Stanek (6,503), and all directors and executive officers as a group (116,730). |
| (5) | None of the shares of WEC common stock beneficially owned by the directors, NEOs, or all directors and executive officers as a group are pledged as security. |
| (6) | Represents approximately 1.2% of total WEC common stock outstanding on March 2, 2015. |
SECTION 16(a) BENEFICIAL OWNERSHIP REPORTING COMPLIANCE
Section 16(a) of the Securities Exchange Act of 1934, as amended, requires the Company’s executive officers, directors and persons owning more than ten percent of a registered class of the Company’s equity securities to file reports of ownership and changes in ownership of equity and derivative securities of Wisconsin Electric with the Securities and Exchange Commission. Specific due dates for those reports have been established by the Securities and Exchange Commission, and the Company is required to disclose in this information statement any failure to file by those dates during the 2014 fiscal year. To the Company’s knowledge, based on information provided by the reporting persons, all applicable reporting requirements for fiscal year 2014 were complied with in a timely manner.
CERTAIN RELATIONSHIPS AND RELATED TRANSACTIONS
The Company provides to and receives from WEC, and other subsidiaries of WEC, services, property and other things of value (the “Items”). These transactions are made pursuant to either a master affiliated interest agreement or a service agreement, both of which have been approved by the Public Service Commission of Wisconsin. The master affiliated interest agreement provides that the Company receive payment equal to the higher of its cost or fair market value for the Items provided to WEC or its nonutility subsidiaries, and that the Company make payment equal to the lower of the provider’s cost or fair market value for the Items which WEC or its nonutility subsidiaries provided to the Company. The service agreement provides that Items provided by the Company or Wisconsin Gas to each other shall be provided at cost. Modification or amendment to the master affiliated interest agreement or the service agreement requires the approval of the Public Service Commission of Wisconsin.
Compensation Committee Interlocks and Insider Participation. None of the persons who served as members of the Compensation Committee during 2014 was an officer or employee of the Company during 2014 or at any time in the past nor had reportable transactions with the Company.
AVAILABILITY OF FORM 10-K
A copy (without exhibits) of Wisconsin Electric Power Company’s Annual Report on Form 10-K for the fiscal year ended December 31, 2014, as filed with the Securities and Exchange Commission, is available without charge to any stockholder of record or beneficial owner of Wisconsin Electric preferred stock by writing to the Corporate Secretary, Susan H. Martin, at the Company’s principal business office, 231 West Michigan Street, P. O. Box 2046, Milwaukee, Wisconsin 53201. The Wisconsin Electric consolidated financial statements and certain other information found in the Form 10-K are included in the Wisconsin Electric Power Company 2014 Annual Financial Statements and Review of Operations, attached hereto as Appendix A.
| Wisconsin Electric Power Company | 50 | 2015 Annual Meeting Information Statement |
APPENDIX A
WISCONSIN ELECTRIC POWER COMPANY
2014 ANNUAL REPORT TO STOCKHOLDERS
2014 ANNUAL FINANCIAL STATEMENTS
And
REVIEW OF OPERATIONS
| Wisconsin Electric Power Company | A-1 | 2014 Annual Financial Statements |
DEFINITION OF ABBREVIATIONS AND INDUSTRY TERMS
The abbreviations and terms set forth below are used throughout this report and have the meanings assigned to them below:
| Primary Subsidiary and Affiliates | ||
| Bostco | Bostco LLC | |
| We Power | W.E. Power, LLC | |
| Wisconsin Energy | Wisconsin Energy Corporation | |
| Wisconsin Gas | Wisconsin Gas LLC | |
| Significant Assets | ||
| OC 1 | Oak Creek expansion Unit 1 | |
| OC 2 | Oak Creek expansion Unit 2 | |
| PIPP | Presque Isle Power Plant | |
| PSGS | Paris Generating Station | |
| PWGS 1 | Port Washington Generating Station Unit 1 | |
| PWGS 2 | Port Washington Generating Station Unit 2 | |
| VAPP | Valley Power Plant | |
| Other Affiliates | ||
| ATC | American Transmission Company LLC | |
| Federal and State Regulatory Agencies | ||
| DOE | United States Department of Energy | |
| EPA | United States Environmental Protection Agency | |
| FERC | Federal Energy Regulatory Commission | |
| MDEQ | Michigan Department of Environmental Quality | |
| MPSC | Michigan Public Service Commission | |
| PSCW | Public Service Commission of Wisconsin | |
| SEC | Securities and Exchange Commission | |
| WDNR | Wisconsin Department of Natural Resources | |
| Environmental Terms | ||
| Act 141 | 2005 Wisconsin Act 141 | |
| BART | Best Available Retrofit Technology | |
| BTA | Best Technology Available | |
| CAIR | Clean Air Interstate Rule | |
| CO2 | Carbon Dioxide | |
| CSAPR | Cross-State Air Pollution Rule | |
| EM | Entrainment Mortality | |
| GHG | Greenhouse Gas | |
| IM | Impingement Mortality | |
| MATS | Mercury and Air Toxics Standards | |
| NAAQS | National Ambient Air Quality Standards | |
| NOx | Nitrogen Oxide | |
| PM2.5 | Fine Particulate Matter | |
| PSD | Prevention of Significant Deterioration | |
| Wisconsin Electric Power Company | A-2 | 2014 Annual Financial Statements |
DEFINITION OF ABBREVIATIONS AND INDUSTRY TERMS
The abbreviations and terms set forth below are used throughout this report and have the meanings assigned to them below:
| SIP | State Implementation Plan | |
| SO2 | Sulfur Dioxide | |
| WPDES | Wisconsin Pollutant Discharge Elimination System | |
| Other Terms and Abbreviations | ||
| AQCS | Air Quality Control System | |
| ARRs | Auction Revenue Rights | |
| Bechtel | Bechtel Power Corporation | |
| Compensation Committee | Compensation Committee of the Board of Directors of Wisconsin Energy | |
| Exchange Act | Securities Exchange Act of 1934, as amended | |
| FTRs | Financial Transmission Rights | |
| GCRM | Gas Cost Recovery Mechanism | |
| HSR Act | Hart-Scott-Rodino Antitrust Improvements Act of 1976 | |
| Integrys | Integrys Energy Group, Inc. | |
| LMP | Locational Marginal Price | |
| Merger Agreement | Agreement and Plan of Merger, dated as of June 22, 2014, between Integrys and Wisconsin Energy Corporation | |
| MISO | Midcontinent Independent System Operator, Inc. | |
| MISO Energy Markets | MISO Energy and Operating Reserves Market | |
| Moody’s | Moody’s Investor Service | |
| OTC | Over-the-Counter | |
| Point Beach | Point Beach Nuclear Power Plant | |
| PTF | Power the Future | |
| RTO | Regional Transmission Organization | |
| S&P | Standard & Poor’s Ratings Services | |
| SSR | System Support Resource | |
| Treasury Grant | Section 1603 Renewable Energy Treasury Grant | |
| UPPCO | Upper Peninsula Power Company | |
| Measurements | ||
| Btu | British Thermal Unit(s) | |
| Dth | Dekatherm(s) (One Dth equals one million Btu) | |
| kW | Kilowatt(s) (One kW equals one thousand Watts) | |
| kWh | Kilowatt-hour(s) | |
| MW | Megawatt(s) (One MW equals one million Watts) | |
| MWh | Megawatt-hour(s) | |
| Watt | A measure of power production or usage | |
| Accounting Terms | ||
| AFUDC | Allowance for Funds Used During Construction | |
| ARO | Asset Retirement Obligation | |
| GAAP | Generally Accepted Accounting Principles | |
| OPEB | Other Post-Retirement Employee Benefits | |
| Wisconsin Electric Power Company | A-3 | 2014 Annual Financial Statements |
CAUTIONARY STATEMENT REGARDING FORWARD-LOOKING INFORMATION
Certain statements contained in this report are “forward-looking statements” within the meaning of Section 27A of the Securities Act of 1933 and Section 21E of the Securities Exchange Act of 1934, as amended (Exchange Act). These statements are based upon management’s current expectations and are subject to risks and uncertainties that could cause our actual results to differ materially from those contemplated in the statements. Readers are cautioned not to place undue reliance on these forward-looking statements. Forward-looking statements include, among other things, statements concerning management’s expectations and projections regarding earnings, completion of construction projects, retail sales and customer growth, rate actions and related filings with the appropriate regulatory authorities, current and proposed environmental regulations and other regulatory matters and related estimated expenditures, on-going legal proceedings, projections related to the pension and other post-retirement benefit plans, fuel costs, sources of electric energy supply, coal and gas deliveries, remediation costs, capital expenditures, liquidity and capital resources and other matters. In some cases, forward-looking statements may be identified by reference to a future period or periods or by the use of forward-looking terminology such as “anticipates,” “believes,” “could,” “estimates,” “expects,” “forecasts,” “goals,” “guidance,” “intends,” “may,” “objectives,” “plans,” “possible,” “potential,” “projects,” “seeks,” “should,” “targets,” “will” or similar terms or variations of these terms.
Actual results may differ materially from those set forth in forward-looking statements. In addition to the assumptions and other factors referred to specifically in connection with these statements, factors that could cause our actual results to differ materially from those contemplated in any forward-looking statements or otherwise affect our future results of operations and financial condition include, among others, the following:
| • | Factors affecting utility operations such as catastrophic weather-related damage; availability of electric generating facilities; unscheduled generation outages, or unplanned maintenance or repairs; unanticipated events causing scheduled generation outages to last longer than expected; unanticipated changes in fossil fuel, purchased power, coal supply, gas supply or water supply costs or availability due to higher demand, shortages, transportation problems or other developments; unanticipated changes in the cost or availability of materials needed to operate environmental controls at our electric generating facilities or replace and/or repair our electric and gas distribution systems; nonperformance by electric energy or natural gas suppliers under existing power purchase or gas supply contracts; environmental incidents; electric transmission or gas pipeline system constraints; unanticipated organizational structure or key personnel changes; or collective bargaining agreements with union employees or work stoppages. |
| • | Factors affecting the demand for electricity and natural gas, including weather and other natural phenomena; general economic conditions and, in particular, the economic climate in our service territories; customer growth and declines; customer business conditions, including demand for their products and services; energy conservation efforts; and customers moving to self-generation. |
| • | Timing, resolution and impact of rate cases and negotiations. |
| • | The impact across our service territories of the continued adoption of distributed generation by our electric customers. |
| • | Increased competition in our electric and gas markets, including retail choice and alternative electric suppliers, and continued industry consolidation. |
| • | The ability to control costs and avoid construction delays during the development and construction of new electric and natural gas distribution systems, as well as upgrades to these systems and our electric generation fleet. |
| • | The impact of recent and future federal, state and local legislative and regulatory changes, including any changes in rate-setting policies or procedures; regulatory initiatives regarding deregulation and restructuring of the electric and/or gas utility industry; transmission or distribution system operation and/or administration initiatives; any required changes in facilities or operations to reduce the risks or impacts of potential terrorist activities or cyber security threats; the regulatory approval process for new generation and transmission facilities and new pipeline construction; adoption of new, or changes in existing, environmental, federal and state energy, tax and other laws and regulations to which we are, or may become, subject; changes in allocation of energy assistance, including state public benefits funds; changes in the application or enforcement of existing laws and regulations; and changes in the interpretation or enforcement of permit conditions by the permitting agencies. |
| • | Internal restructuring options that may be pursued by Wisconsin Energy Corporation (Wisconsin Energy). |
| Wisconsin Electric Power Company | A-4 | 2014 Annual Financial Statements |
| • | Current and future litigation, regulatory investigations, proceedings or inquiries. |
| • | Events in the global credit markets that may affect the availability and cost of capital. |
| • | Other factors affecting our ability to access the capital markets, including general capital market conditions; our capitalization structure; market perceptions of the utility industry or us; and our credit ratings. |
| • | The direct or indirect effect on our business resulting from terrorist incidents and the threat of terrorist incidents, including cyber intrusion. |
| • | Inflation rates. |
| • | The investment performance of Wisconsin Energy’s pension and other post-retirement benefit trusts. |
| • | The financial performance of American Transmission Company LLC (ATC) and its corresponding contribution to our earnings, as well as the ability of ATC and the Duke-American Transmission Company to obtain the required approvals for their transmission projects. |
| • | The effect of accounting pronouncements issued periodically by standard setting bodies. |
| • | Advances in technology that result in competitive disadvantages and create the potential for impairment of existing assets. |
| • | Changes in the creditworthiness of the counterparties with whom we have contractual arrangements, including participants in the energy trading markets and fuel suppliers and transporters. |
| • | The ability to obtain and retain short- and long-term contracts with wholesale customers. |
| • | Incidents affecting the U.S. electric grid or operation of generating facilities. |
| • | Foreign governmental, economic, political and currency risks. |
| • | Other factors discussed elsewhere in this report and that may be disclosed from time to time in our Securities and Exchange Commission (SEC) filings or in other publicly disseminated written documents. |
We expressly disclaim any obligation to publicly update or revise any forward-looking statements, whether as a result of new information, future events or otherwise.
| Wisconsin Electric Power Company | A-5 | 2014 Annual Financial Statements |
WISCONSIN ELECTRIC POWER COMPANY
CONSOLIDATED SELECTED FINANCIAL AND STATISTICAL DATA
Financial | 2014 | 2013 | 2012 | 2011 | 2010 | |||||||||||||||
Year Ended December 31 | ||||||||||||||||||||
Earnings available for common stockholder (Millions) | $ | 376.7 | $ | 360.0 | $ | 366.1 | $ | 338.4 | $ | 314.2 | ||||||||||
Operating Revenues (Millions) | ||||||||||||||||||||
Electric | $ | 3,401.1 | $ | 3,308.7 | $ | 3,193.9 | $ | 3,211.3 | $ | 2,936.3 | ||||||||||
Gas | 614.2 | 451.9 | 385.1 | 477.3 | 481.6 | |||||||||||||||
Steam | 44.1 | 39.6 | 34.3 | 39.0 | 38.8 | |||||||||||||||
|
|
|
|
|
|
|
|
|
| |||||||||||
Total operating revenues | $ | 4,059.4 | $ | 3,800.2 | $ | 3,613.3 | $ | 3,727.6 | $ | 3,456.7 | ||||||||||
|
|
|
|
|
|
|
|
|
| |||||||||||
At December 31 (Millions) | ||||||||||||||||||||
Total assets | $ | 12,646.7 | $ | 12,285.6 | $ | 12,022.6 | $ | 11,661.3 | $ | 10,170.7 | ||||||||||
Long-term debt and capital lease obligations (including current maturities) | $ | 5,233.6 | $ | 5,258.8 | $ | 5,276.8 | $ | 5,022.0 | $ | 4,053.5 | ||||||||||
CONSOLIDATED SELECTED QUARTERLY FINANCIAL DATA
| (Millions of Dollars) (a) | ||||||||||||||||
| March | June | |||||||||||||||
Three Months Ended | 2014 | 2013 | 2014 | 2013 | ||||||||||||
Operating revenues | $ | 1,226.7 | $ | 1,004.6 | $ | 905.7 | $ | 880.5 | ||||||||
Operating income | $ | 221.8 | $ | 173.1 | $ | 144.2 | $ | 124.2 | ||||||||
Earnings available for common stockholder | $ | 127.0 | $ | 104.4 | $ | 90.0 | $ | 72.8 | ||||||||
| September | December | |||||||||||||||
Three Months Ended | 2014 | 2013 | 2014 | 2013 | ||||||||||||
Operating revenues | $ | 937.8 | $ | 964.6 | $ | 989.2 | $ | 950.5 | ||||||||
Operating income | $ | 156.2 | $ | 164.6 | $ | 128.2 | $ | 144.0 | ||||||||
Earnings available for common stockholder | $ | 89.8 | $ | 98.9 | $ | 69.9 | $ | 83.9 | ||||||||
| (a) | Quarterly results of operations are not directly comparable because of seasonal and other factors. See Management’s Discussion and Analysis of Financial Condition and Results of Operations. |
| Wisconsin Electric Power Company | A-6 | 2014 Annual Financial Statements |
MANAGEMENT’S DISCUSSION AND ANALYSIS OF
FINANCIAL CONDITION AND RESULTS OF OPERATIONS
CORPORATE DEVELOPMENTS
INTRODUCTION
Wisconsin Electric Power Company, a subsidiary of Wisconsin Energy, is engaged primarily in the business of generating and distributing electricity in Wisconsin and the Upper Peninsula of Michigan, and distributing natural gas in Wisconsin. Unless qualified by their context when used in this document, the terms Wisconsin Electric, the Company, our, us or we refer to Wisconsin Electric Power Company and its subsidiary, Bostco.
Wisconsin Energy is also the parent company of Wisconsin Gas, a natural gas distribution utility, which serves customers throughout Wisconsin; and We Power, an unregulated company that was formed in 2001 to design, construct, own and lease to us the new generating capacity included in Wisconsin Energy’s Power the Future (PTF) strategy, which is described further in this report. We have combined common functions with Wisconsin Gas and operate under the trade name of “We Energies.”
CORPORATE STRATEGY
Business Opportunities
We have two primary investment opportunities and earnings streams: our regulated utility business and our investment in ATC.
Our regulated utility business primarily consists of electric generation assets and the electric and gas distribution assets that serve our electric and gas customers. We operate under a traditional rate regulated cost of service environment. During 2014, our regulated utility business earned $650.4 million of operating income. Over the next five years, we currently expect to invest approximately $2.3 billion to $2.5 billion in this business.
We have a 23.0% ownership interest in ATC, a Midcontinent Independent System Operator, Inc. (MISO) member company regulated by Federal Energy Regulatory Commission (FERC). Our investment in ATC totaled $372.9 million as of December 31, 2014, and our 2014 pre-tax earnings from ATC totaled $57.9 million. Over the next five years, in addition to any potential investment through our undistributed earnings in ATC, we expect to make capital contributions of approximately $110 million in ATC as it continues to invest in transmission projects.
| Wisconsin Electric Power Company | A-7 | 2014 Annual Financial Statements |
RESULTS OF OPERATIONS
EARNINGS
2014 vs. 2013: Earnings increased to $376.7 million in 2014 compared with $360.0 million in 2013. Operating income increased $44.5 million between the comparative periods. The increase in operating income was primarily caused by colder winter weather and decreased other operation and maintenance expense.
2013 vs. 2012: Earnings decreased to $360.0 million in 2013 compared with $366.1 million in 2012. The decrease in earnings was due to an increase in net interest expense and a decrease in other income and deductions, offset by an increase in operating income. Operating income increased $22.6 million between the comparative periods, primarily caused by favorable winter weather during 2013 and pricing increases which were partially offset by an increase in operation and maintenance expense and depreciation expense.
The following table summarizes our consolidated earnings during 2014, 2013 and 2012:
| 2014 | 2013 | 2012 | ||||||||||
| (Millions of Dollars) | ||||||||||||
Utility Gross Margin | ||||||||||||
Electric (See below) | $ | 2,187.1 | $ | 2,164.2 | $ | 2,103.6 | ||||||
Gas (See below) | 181.6 | 173.6 | 157.4 | |||||||||
Steam | 30.0 | 26.0 | 20.8 | |||||||||
|
|
|
|
|
| |||||||
Total Gross Margin | 2,398.7 | 2,363.8 | 2,281.8 | |||||||||
Other Operating Expenses | ||||||||||||
Other operation and maintenance | 1,356.4 | 1,417.3 | 1,327.8 | |||||||||
Depreciation and amortization | 295.7 | 278.6 | 257.6 | |||||||||
Property and revenue taxes | 113.6 | 110.0 | 113.1 | |||||||||
|
|
|
|
|
| |||||||
Total Operating Expenses | 1,765.7 | 1,805.9 | 1,698.5 | |||||||||
Treasury Grant | 17.4 | 48.0 | — | |||||||||
|
|
|
|
|
| |||||||
Operating Income | 650.4 | 605.9 | 583.3 | |||||||||
Equity in Earnings of Transmission Affiliate | 57.9 | 60.2 | 57.6 | |||||||||
Other Income and Deductions, net | 8.7 | 17.4 | 32.3 | |||||||||
Interest Expense, net | 116.5 | 121.4 | 113.2 | |||||||||
|
|
|
|
|
| |||||||
Income Before Income Taxes | 600.5 | 562.1 | 560.0 | |||||||||
Income Tax Expense | 222.6 | 200.9 | 192.7 | |||||||||
Preferred Stock Dividend Requirement | 1.2 | 1.2 | 1.2 | |||||||||
|
|
|
|
|
| |||||||
Earnings Available for Common Stockholder | $ | 376.7 | $ | 360.0 | $ | 366.1 | ||||||
|
|
|
|
|
| |||||||
| Wisconsin Electric Power Company | A-8 | 2014 Annual Financial Statements |
Electric Utility Gross Margin
The following table compares our electric utility gross margin during 2014 with similar information for 2013 and 2012, including a summary of electric operating revenues and electric sales by customer class:
| Electric Revenues and Gross Margin | MWh Sales | |||||||||||||||||||||||
Electric Utility Operations | 2014 | 2013 | 2012 | 2014 | 2013 | 2012 | ||||||||||||||||||
| (Millions of Dollars) | (Thousands) | |||||||||||||||||||||||
Customer Class | ||||||||||||||||||||||||
Residential | $ | 1,199.3 | $ | 1,208.6 | $ | 1,163.9 | 7,946.3 | 8,141.9 | 8,317.7 | |||||||||||||||
Small Commercial/Industrial | 1,052.9 | 1,048.0 | 1,013.6 | 8,805.1 | 8,860.4 | 8,860.0 | ||||||||||||||||||
Large Commercial/Industrial | 637.0 | 711.9 | 744.3 | 7,393.3 | 8,673.4 | 9,710.7 | ||||||||||||||||||
Other - Retail | 23.0 | 23.4 | 22.8 | 148.7 | 152.3 | 154.8 | ||||||||||||||||||
|
|
|
|
|
|
|
|
|
|
|
| |||||||||||||
Total Retail | 2,912.2 | 2,991.9 | 2,944.6 | 24,293.4 | 25,828.0 | 27,043.2 | ||||||||||||||||||
Wholesale - Other | 131.9 | 143.7 | 144.4 | 1,852.8 | 1,953.5 | 1,566.6 | ||||||||||||||||||
Resale - Utilities | 264.1 | 143.2 | 53.4 | 6,497.9 | 4,382.7 | 1,642.4 | ||||||||||||||||||
Other Operating Revenues | 87.8 | 28.4 | 51.5 | — | — | — | ||||||||||||||||||
|
|
|
|
|
|
|
|
|
|
|
| |||||||||||||
Total | 3,396.0 | 3,307.2 | 3,193.9 | 32,644.1 | 32,164.2 | 30,252.2 | ||||||||||||||||||
|
|
|
|
|
| |||||||||||||||||||
Electric Customer Choice (a) | 5.1 | 1.5 | — | 2,440.0 | 813.0 | — | ||||||||||||||||||
|
|
|
|
|
|
|
|
|
|
|
| |||||||||||||
Total, including electric customer choice | 3,401.1 | 3,308.7 | 3,193.9 | |||||||||||||||||||||
|
|
|
|
|
| |||||||||||||||||||
Fuel and Purchased Power | ||||||||||||||||||||||||
Fuel | 656.6 | 611.1 | 541.6 | |||||||||||||||||||||
Purchased Power | 557.4 | 533.4 | 548.7 | |||||||||||||||||||||
|
|
|
|
|
| |||||||||||||||||||
Total Fuel and Purchased Power | 1,214.0 | 1,144.5 | 1,090.3 | |||||||||||||||||||||
|
|
|
|
|
| |||||||||||||||||||
Total Electric Gross Margin | $ | 2,187.1 | $ | 2,164.2 | $ | 2,103.6 | ||||||||||||||||||
|
|
|
|
|
| |||||||||||||||||||
Weather — Degree Days (b) | ||||||||||||||||||||||||
Heating (6,601 Normal) | 7,616 | 7,233 | 5,704 | |||||||||||||||||||||
Cooling (732 Normal) | 464 | 688 | 1,041 | |||||||||||||||||||||
| (a) | Represents distribution sales for customers who have purchased power from an alternative electric supplier in Michigan. |
| (b) | As measured at Mitchell International Airport in Milwaukee, Wisconsin. Normal degree days are based upon a 20-year moving average. |
Electric Utility Revenues and Sales
2014 vs. 2013: Our electric utility operating revenues increased by $92.4 million, or 2.8%, when compared to 2013. The most significant factors that caused a change in revenues were:
| • | A $120.9 million increase in sales for resale because of increased sales into the MISO Energy and Operating Reserves Market (MISO Energy Markets) as a result of Michigan’s alternative electric supplier program and increased availability of our generating units. The margin on these sales is used to reduce fuel costs for our retail customers. |
| • | A $78.4 million decrease in large commercial/industrial sales because of the two iron ore mines switching to an alternative electric supplier in September 2013. See Factors Affecting Results, Liquidity and Capital Resources — Industry Restructuring and Competition — Michigan Business, for a discussion of the impact of industry restructuring in Michigan on our electric sales. |
| • | A $59.4 million increase in other operating revenues, primarily driven by the recognition of $56.4 million related to revenues under the System Support Resource (SSR) agreement with MISO. See Factors Affecting Results, Liquidity and Capital Resources — Industry Restructuring and Competition — Michigan Business — SSR Payments for further discussion. |
| • | Wisconsin net retail pricing increases of $38.3 million, which are primarily related to our 2013 Wisconsin Rate Case. |
| • | Unseasonably cool summer weather which decreased electric revenues by an estimated $45.8 million. |
As measured by cooling degree days, 2014 was 36.6% cooler than normal, and 32.6% cooler than 2013 due to mild second and third quarters. The unfavorable impact of the cool summer weather was partially offset by the cold winter weather. Residential sales decreased by 2.4%, primarily due to the weather. Sales to our large commercial/industrial
| Wisconsin Electric Power Company | A-9 | 2014 Annual Financial Statements |
customers decreased by 14.8% primarily because of the loss of the two iron ore mines in Michigan. If the mines are excluded, sales to our large commercial/industrial customers decreased 1.1%. The two iron ore mines, which we served on an interruptible tariff rate, switched to an alternative electric supplier effective September 1, 2013. In addition, other smaller retail customers switched to an alternative electric supplier.
Effective February 1, 2015, the two mines returned as retail customers. We expect to defer the net revenue from those sales and apply these amounts for the benefit of Wisconsin retail electric customers in future rate proceedings. Michigan state law allows the mines to switch to an alternative electric supplier after sufficient notice.
2013 vs. 2012: Our electric utility operating revenues increased by $114.8 million, or 3.6%, when compared to 2012. The most significant factors that caused a change in revenues were:
| • | Wisconsin net retail pricing increases of $115.6 million ($177.7 million less $62.1 million related to Section 1603 Renewable Energy Treasury Grant (Treasury Grant) bill credits), which are primarily related to our 2013 Wisconsin Rate Case. For information on the Treasury Grant and the rate order in the 2013 rate case, see Factors Affecting Results, Liquidity and Capital Resources — Accounting Developments and — Rates and Regulatory Matters, respectively. |
| • | An $89.8 million increase in sales for resale due to increased sales into the MISO Energy Markets as a result of increased availability of our generating units. |
| • | A $48.0 million decrease in large commercial/industrial sales due to the two iron ore mines that switched to an alternative electric supplier effective September 1, 2013. |
| • | A $23.1 million decrease in other operating revenues, primarily driven by the amortization of $25.9 million in 2012 related to proceeds we received as part of a settlement with the United States Department of Energy (DOE) regarding the DOE’s failure to remove spent nuclear fuel from Point Beach Nuclear Power Plant (Point Beach). |
| • | A return to more normal summer weather as compared to 2012 that decreased electric revenues by an estimated $17.7 million. |
As measured by cooling degree days, 2013 was 5.8% cooler than normal, and 33.9% cooler than 2012. Residential sales decreased by 2.1%, primarily due to the weather. Sales to our large commercial/industrial customers decreased by 10.7% primarily because of the loss of the two iron ore mines in Michigan. If the mines are excluded, sales to our large commercial/industrial customers decreased 3.0%. Wholesale - Other sales increased 24.7% primarily due to increased off-peak energy sales which generate lower incremental revenue because the majority of our wholesale revenue is tied to demand.
Electric Fuel and Purchased Power Expenses
2014 vs. 2013: Our electric fuel and purchased power costs increased by $69.5 million, or approximately 6.1%, when compared to 2013. This increase was primarily caused by a 1.5% increase in total MWh sales and higher generating costs driven by an increase in natural gas prices.
2013 vs. 2012: Our electric fuel and purchased power costs increased by $54.2 million, or approximately 5.0%, when compared to 2012. This increase was primarily caused by a 6.3% increase in total MWh sales, partially offset by a decrease in our average cost of fuel because of outage timing and a decrease in coal costs.
| Wisconsin Electric Power Company | A-10 | 2014 Annual Financial Statements |
Gas Utility Revenues, Gross Margin and Therm Deliveries
The following table compares our total gas utility operating revenues and gross margin (total gas utility operating revenues less cost of gas sold) during 2014, 2013 and 2012.
Gas Utility Operations | 2014 | 2013 | 2012 | |||||||||
| (Millions of Dollars) | ||||||||||||
Operating Revenues | $ | 614.2 | $ | 451.9 | $ | 385.1 | ||||||
Cost of Gas Sold | 432.6 | 278.3 | 227.7 | |||||||||
|
|
|
|
|
| |||||||
Gross Margin | $ | 181.6 | $ | 173.6 | $ | 157.4 | ||||||
|
|
|
|
|
| |||||||
We believe gross margin is a better performance indicator than revenues because changes in the cost of gas sold flow through to revenue under our Gas Cost Recovery Mechanism (GCRM). Our average cost of gas per therm during 2014, 2013 and 2012 was $0.68, $0.47 and $0.49, respectively. The following table compares our gas utility gross margin and therm deliveries by customer class during 2014, 2013 and 2012:
| Gross Margin | Therm Deliveries | |||||||||||||||||||||||
Gas Utility Operations | 2014 | 2013 | 2012 | 2014 | 2013 | 2012 | ||||||||||||||||||
| (Millions of Dollars) | (Millions) | |||||||||||||||||||||||
Customer Class | ||||||||||||||||||||||||
Residential | $ | 121.2 | $ | 117.8 | $ | 106.1 | 399.3 | 380.8 | 294.3 | |||||||||||||||
Commercial/Industrial | 41.1 | 37.5 | 33.0 | 236.2 | 210.9 | 165.3 | ||||||||||||||||||
Interruptible | 0.4 | 0.5 | 0.5 | 4.9 | 5.4 | 5.0 | ||||||||||||||||||
|
|
|
|
|
|
|
|
|
|
|
| |||||||||||||
Total Retail | 162.7 | 155.8 | 139.6 | 640.4 | 597.1 | 464.6 | ||||||||||||||||||
Transported Gas | 17.3 | 16.5 | 16.5 | 343.1 | 327.6 | 344.5 | ||||||||||||||||||
Other | 1.6 | 1.3 | 1.3 | — | — | — | ||||||||||||||||||
|
|
|
|
|
|
|
|
|
|
|
| |||||||||||||
Total | $ | 181.6 | $ | 173.6 | $ | 157.4 | 983.5 | 924.7 | 809.1 | |||||||||||||||
|
|
|
|
|
|
|
|
|
|
|
| |||||||||||||
Weather — Degree Days (a) | ||||||||||||||||||||||||
Heating (6,601 Normal) | 7,616 | 7,233 | 5,704 | |||||||||||||||||||||
| (a) | As measured at Mitchell International Airport in Milwaukee, Wisconsin. Normal degree days are based upon a 20-year moving average. |
2014 vs. 2013: Our total retail gas margin increased by $6.9 million, or approximately 4.4%, when compared to 2013, primarily because of colder winter weather in 2014. We estimate that colder winter weather increased gas margins by approximately $5.0 million. As measured by heating degree days, 2014 was 5.3% colder than 2013 and 15.4% colder than normal.
2013 vs. 2012: Our total retail gas margin increased by $16.2 million, or approximately 11.6%, when compared to 2012. We estimate that colder winter weather increased gas margins by approximately $22.1 million. As measured by heating degree days, 2013 was 26.8% colder than 2012 and 9.9% colder than normal. Gas margins were reduced by $8.1 million because of lower gas rates that became effective January 1, 2013.
Other Operation and Maintenance Expense
2014 vs. 2013: Our other operation and maintenance expense decreased by $60.9 million, or approximately 4.3%, when compared to 2013. This decrease was primarily driven by lower benefit costs related to pensions and medical costs.
Our operation and maintenance expenses are influenced by, among other things, labor costs, employee benefit costs, plant outages and amortization of regulatory assets.
2013 vs. 2012: Our other operation and maintenance expense increased by $89.5 million, or approximately 6.7%, when compared to 2012. This increase was primarily driven by the reinstatement of $148.0 million of regulatory amortizations, offset in part by continued cost control efforts. For additional information on the regulatory amortizations, see Factors Affecting Results, Liquidity and Capital Resources — Rates and Regulatory Matters — 2012 Wisconsin Rate Case.
| Wisconsin Electric Power Company | A-11 | 2014 Annual Financial Statements |
Depreciation and Amortization Expense
2014 vs. 2013: Depreciation and Amortization expense increased by $17.1 million, or approximately 6.1%, when compared to 2013. This increase was primarily because of an overall increase in utility plant in service as a result of the biomass plant that went into service in November 2013. For additional information on the biomass facility, see Factors Affecting Results, Liquidity and Capital Resources — Rates and Regulatory Matters — Renewables, Efficiency, and Conservation.
2013 vs. 2012: Depreciation and Amortization expense increased by $21.0 million, or approximately 8.2%, when compared to 2012. This increase was primarily because of an overall increase in utility plant in service. In addition to the biomass facility that went into service in November 2013, the emission control equipment for units 5 and 6 of the Oak Creek Air Quality Control System (AQCS) project went into service in March 2012, and for units 7 and 8 in September 2012.
Treasury Grant
During 2014, we recognized $17.4 million of income related to a Treasury Grant associated with the completion of the biomass plant, compared to $48.0 million in 2013. The lower grant income corresponds to the lower bill credits provided to our retail electric customers in Wisconsin in 2014. For additional information on the Treasury Grant, see Factors Affecting Results, Liquidity and Capital Resources — Accounting Developments.
Other Income and Deductions, net
Other Income and Deductions, net | 2014 | 2013 | 2012 | |||||||||
| (Millions of Dollars) | ||||||||||||
AFUDC - Equity | $ | 4.4 | $ | 17.6 | $ | 34.9 | ||||||
Gain on Property Sales | 4.3 | 0.8 | 0.3 | |||||||||
Other, net | — | (1.0 | ) | (2.9 | ) | |||||||
|
|
|
|
|
| |||||||
Total Other Income and Deductions, net | $ | 8.7 | $ | 17.4 | $ | 32.3 | ||||||
|
|
|
|
|
| |||||||
2014 vs. 2013: Other income and deductions, net decreased by approximately $8.7 million, or 50.0%, when compared to 2013. This decrease primarily relates to lower AFUDC - Equity related to the biomass plant going into service in November 2013, partially offset by an increased gain on property sales.
2013 vs. 2012: Other income and deductions, net decreased by approximately $14.9 million, or 46.1%, when compared to 2012. This decrease primarily relates to lower AFUDC - Equity related to the Oak Creek AQCS project which emission control equipment went into service in March 2012 for units 5 and 6 and September 2012 for units 7 and 8, partially offset by the biomass plant which went into service in November 2013.
Interest Expense, net
Interest Expense, net | 2014 | 2013 | 2012 | |||||||||
| (Millions of Dollars) | ||||||||||||
Gross Interest Costs | $ | 118.3 | $ | 128.8 | $ | 127.7 | ||||||
Less: Capitalized Interest | 1.8 | 7.4 | 14.5 | |||||||||
|
|
|
|
|
| |||||||
Interest Expense, net | $ | 116.5 | $ | 121.4 | $ | 113.2 | ||||||
|
|
|
|
|
| |||||||
2014 vs. 2013: Our net interest expense decreased by $4.9 million, or 4.0%, as compared to 2013 primarily because of lower average interest rates on long-term debt. Our capitalized interest decreased by $5.6 million primarily because of lower construction work in progress as the biomass plant went into service in November 2013.
2013 vs. 2012: Our net interest expense increased by $8.2 million, or 7.2%, as compared to 2012, primarily because of lower capitalized interest. Our capitalized interest decreased by $7.1 million primarily because of lower construction work in progress.
| Wisconsin Electric Power Company | A-12 | 2014 Annual Financial Statements |
Income Tax Expense
2014 vs. 2013: Our effective tax rate was 37.1% in 2014 compared with 35.7% in 2013. This increase in our effective tax rate was due to reduced tax benefits associated with Treasury Grant income and decreased AFUDC - Equity. For further information, see Note G — Income Taxes in the Notes to Consolidated Financial Statements. We expect our 2015 annual effective tax rate to be between 36.0% and 37.0%.
2013 vs. 2012: Our effective tax rate was 35.7% in 2013 compared with 34.4% in 2012. This increase in our effective tax rate was primarily the result of reduced domestic production activities deductions and AFUDC - Equity.
LIQUIDITY AND CAPITAL RESOURCES
CASH FLOWS
The following table summarizes our cash flows during 2014, 2013 and 2012:
| 2014 | 2013 | 2012 | ||||||||||
| (Millions of Dollars) | ||||||||||||
Cash Provided by (Used in) | ||||||||||||
Operating Activities | $ | 862.8 | $ | 862.6 | $ | 807.0 | ||||||
Investing Activities | $ | (567.5 | ) | $ | (560.1 | ) | $ | (605.6 | ) | |||
Financing Activities | $ | (296.4 | ) | $ | (311.5 | ) | $ | (180.0 | ) | |||
Operating Activities
2014 vs. 2013: Cash provided by operating activities was $862.8 million during 2014, which was an increase of $0.2 million over 2013. The increase was related to higher net income, non-cash charges related to depreciation expense, and favorable cash flows from accounts receivable, primarily because of the timing of the Treasury Grant. Partially offsetting these favorable items were increases in working capital related to natural gas in storage and increases in regulatory assets.
2013 vs. 2012: Cash provided by operating activities was $862.6 million during 2013, which was an increase of $55.6 million over 2012. The increase is primarily because of lower contributions to our qualified benefit plans and higher non-cash charges to earnings. During 2013, we made no contributions to our qualified benefit plans, compared to contributions of $92.9 million during 2012. In addition, we had higher depreciation expense and amortization expense. Included in the higher amortization expense is a $120.9 million increase in the amortization of regulatory items. Partially offsetting these items is an increase in accounts receivable and accrued revenues of $201.3 million because of colder winter weather and the Treasury Grant.
Investing Activities
2014 vs. 2013: Cash used in investing activities was $567.5 million during 2014, which was $7.4 million higher than 2013. Our capital expenditures increased by $34.0 million during 2014 as compared to 2013, primarily because of starting the conversion of the fuel source for VAPP from coal to natural gas. Partially offsetting this increase is a decrease in cost of removal, net of salvage of $11.1 million and a decrease in customer advances for construction projects.
2013 vs. 2012: Cash used in investing activities was $560.1 million during 2013, which was $45.5 million lower than 2012. Our capital expenditures decreased by $68.9 million during 2013 as compared to 2012, primarily because of decreased spending as the Oak Creek AQCS project went into service in 2012. Our change in restricted cash decreased by $40.1 million which is related to the 2012 release of restricted cash through bill credits and the reimbursement of costs associated with the proceeds we received from the settlement with the DOE.
| Wisconsin Electric Power Company | A-13 | 2014 Annual Financial Statements |
Financing Activities
The following table summarizes our cash flows from financing activities:
| 2014 | 2013 | 2012 | ||||||||||
| (Millions of Dollars) | ||||||||||||
Dividends to Wisconsin Energy | $ | (390.0 | ) | $ | (340.0 | ) | $ | (179.6 | ) | |||
Net Increase in Debt | 81.9 | 18.4 | 0.1 | |||||||||
Other | 11.7 | 10.1 | (0.5 | ) | ||||||||
|
|
|
|
|
| |||||||
Cash Used in Financing | $ | (296.4 | ) | $ | (311.5 | ) | $ | (180.0 | ) | |||
|
|
|
|
|
| |||||||
2014 vs. 2013: Cash used in financing activities was $296.4 million during 2014 compared to $311.5 million during 2013. During 2014, we paid $50.0 million more in special dividends to Wisconsin Energy to balance our capital structure, which was more than offset by a $63.5 million increase in short-term debt.
2013 vs. 2012: Cash used in financing activities was $311.5 million during 2013 compared to $180.0 million during 2012. During 2013, we retired $300.0 million of long-term debt and issued $250 million of long-term debt. The net proceeds of the debt issuance were used to repay short-term debt and for other corporate purposes. In addition, we paid $160.4 million more dividends to Wisconsin Energy during 2013 as compared to 2012 which includes $100 million of special dividends to balance our capital structure.
CAPITAL RESOURCES AND REQUIREMENTS
Working Capital
As of December 31, 2014, our current liabilities exceeded our current assets by approximately $214.4 million. Included in our current liabilities is approximately $355.6 million of long-term debt and capital lease obligations due currently. We do not expect this to have any impact on our liquidity because we believe we have an adequate back-up line of credit in place for ongoing operations. We also have access to the capital markets to finance our construction program and to refinance current maturities of long-term debt if necessary.
Liquidity
We anticipate meeting our capital requirements through internally generated funds and short-term borrowings, supplemented by the issuance of intermediate or long-term debt securities, depending on market conditions and other factors, and equity contributions from our parent.
We currently have access to the capital markets and have been able to generate funds internally and externally to meet our capital requirements. Our ability to attract the necessary financial capital at reasonable terms is critical to our overall strategic plan. We currently believe that we have adequate capacity to fund our operations for the foreseeable future through our existing borrowing arrangement, access to capital markets and internally generated cash.
We maintain a bank back-up credit facility that provides liquidity support for our obligations with respect to commercial paper and for general corporate purposes.
As of December 31, 2014, we had approximately $494.9 million of available, undrawn lines under our bank back-up credit facility. As of December 31, 2014, we had approximately $306.8 million of commercial paper outstanding that was supported by the available line of credit. During 2014, our maximum commercial paper outstanding was $401.0 million with a weighted-average interest rate of 0.22%. For additional information regarding our commercial paper balances during 2014, see Note K — Short-Term Debt in the Notes to Consolidated Financial Statements.
| Wisconsin Electric Power Company | A-14 | 2014 Annual Financial Statements |
We review our bank back-up credit facility needs on an ongoing basis and expect to be able to maintain adequate credit facilities to support our operations. The following table summarizes such facility as of December 31, 2014:
Total Facility | Letters of Credit | Credit Available | Facility Expiration | |||||||||
| (Millions of Dollars) | ||||||||||||
| $ | 500.0 | $ | 5.1 | $ | 494.9 | December 2019 | ||||||
In December 2014, we amended our credit facility to extend the expiration from December 2017 to December 2019.
This facility has a renewal provision for two one-year extensions, subject to lender approval.
The following table shows our consolidated capitalization structure as of December 31:
Capitalization Structure | 2014 | 2013 | ||||||||||||||
| (Millions of Dollars) | ||||||||||||||||
Common Equity | $ | 3,412.8 | 37.9 | % | $ | 3,406.8 | 38.3 | % | ||||||||
Preferred Stock | 30.4 | 0.3 | % | 30.4 | 0.3 | % | ||||||||||
Long-Term Debt (a) | 2,415.5 | 26.8 | % | 2,467.3 | 27.8 | % | ||||||||||
Capital Lease Obligations (a) | 2,818.1 | 31.3 | % | 2,791.5 | 31.4 | % | ||||||||||
Short-Term Debt (b) | 329.2 | 3.7 | % | 197.3 | 2.2 | % | ||||||||||
|
|
|
|
|
|
|
| |||||||||
Total | $ | 9,006.0 | 100.0 | % | $ | 8,893.3 | 100.0 | % | ||||||||
|
|
|
|
|
|
|
| |||||||||
| (a) | Includes current maturities |
| (b) | Includes subsidiary note payable to Wisconsin Energy |
For a summary of the interest rate, maturity and amount outstanding of each series of our long-term debt on a consolidated basis, see the Consolidated Statements of Capitalization.
We are the obligor under two series of tax exempt pollution control refunding bonds in outstanding principal amounts of $147 million. In August 2009, we terminated letters of credit that provided credit and liquidity support for the bonds, which resulted in a mandatory tender of the bonds. We issued commercial paper to fund the purchase of the bonds. As of December 31, 2014, the repurchased bonds were still outstanding, but were not reported as long-term debt or included on the Consolidated Statements of Capitalization because they are held by us. Depending on market conditions and other factors, we may change the method used to determine the interest rate on the bonds and have them remarketed to third parties.
Bonus Depreciation Provisions
The Tax Increase Prevention Act of 2014 was signed into law on December 19, 2014, which extended the 50% bonus depreciation rules to include assets placed in service in 2014. As a result of the increased federal tax depreciation for 2014 and prior years, we did not make federal income tax payments for 2013 and 2014.
Credit Rating Risk
We do not have any credit agreements that would require material changes in payment schedules or terminations as a result of a credit rating downgrade. We do have certain agreements in the form of commodity contracts and employee benefit plans that could require collateral or a termination payment in the event of a credit rating change to below BBB- at Standard & Poor’s Ratings Services (S&P) and/or Baa3 at Moody’s Investor Service (Moody’s). As of December 31, 2014, we estimate that the collateral or the termination payments required under these agreements totaled approximately $195.3 million. Generally, collateral may be provided by a Wisconsin Energy guaranty, letter of credit or cash. We also have other commodity contracts that in the event of a credit rating downgrade could result in a reduction of our unsecured credit granted by counterparties.
In addition, access to capital markets at a reasonable cost is determined in large part by credit quality. Any credit ratings downgrade could impact our ability to access capital markets.
| Wisconsin Electric Power Company | A-15 | 2014 Annual Financial Statements |
In December 2014, Moody’s affirmed our ratings (commercial paper, P-1; senior unsecured, A1) and our stable ratings outlook.
In August 2014, Fitch Ratings affirmed our ratings (commercial paper, F1; senior unsecured, A+) and our stable ratings outlook.
In June 2014, S&P affirmed our ratings (commercial paper, A-2; senior unsecured, A-) and our stable ratings outlook.
Subject to other factors affecting the credit markets as a whole, we believe our current ratings should provide a significant degree of flexibility in obtaining funds on competitive terms. However, these security ratings reflect the views of the rating agencies only. An explanation of the significance of these ratings may be obtained from each rating agency. Such ratings are not a recommendation to buy, sell or hold securities. Any rating can be revised upward or downward or withdrawn at any time by a rating agency.
Capital Requirements
Capital Expenditures: Our estimated capital expenditures for the next three years are as follows:
| (Millions of Dollars) | ||||
2015 | $ | 496.2 | ||
2016 | 472.7 | |||
2017 | 498.4 | |||
|
| |||
Total | $ | 1,467.3 | ||
|
| |||
The majority of spending consists of upgrading our electric and gas distribution systems. Our actual future long-term capital requirements may vary from these estimates because of changing environmental and other regulations such as air quality standards, renewable energy standards and electric reliability initiatives that impact us.
Investments in Outside Trusts: We use outside trusts to fund our pension and certain other post-retirement obligations. These trusts had investments of approximately $1.4 billion as of December 31, 2014. These trusts hold investments that are subject to the volatility of the stock market and interest rates.
During 2014 and 2013, we made no contributions to our qualified pension plans or our qualified Other Post-Retirement Employee Benefit (OPEB) plans. In January 2015, we contributed $100 million to our qualified pension plans. Future contributions to the plans will be dependent upon many factors, including the performance of existing plan assets and long-term discount rates. For additional information, see Note N — Benefits in the Notes to Consolidated Financial Statements.
Off-Balance Sheet Arrangements: We are a party to various financial instruments with off-balance sheet risk as a part of our normal course of business, including financial guarantees and letters of credit which support construction projects, commodity contracts and other payment obligations. We believe that these agreements do not have, and are not reasonably likely to have, a current or future effect on our financial condition, changes in financial condition, revenues or expenses, results of operations, liquidity, capital expenditures or capital resources that is material to our investors. For additional information, see Note F — Variable Interest Entities in the Notes to Consolidated Financial Statements in this report.
| Wisconsin Electric Power Company | A-16 | 2014 Annual Financial Statements |
Contractual Obligations/Commercial Commitments: We have the following contractual obligations and other commercial commitments as of December 31, 2014:
| Payments Due by Period | ||||||||||||||||||||
Contractual Obligations (a) | Total | Less than 1 year | 1-3 years | 3-5 years | More than 5 years | |||||||||||||||
| (Millions of Dollars) | ||||||||||||||||||||
Long-Term Debt Obligations (b) | $ | 4,571.6 | $ | 362.4 | $ | 193.1 | $ | 686.5 | $ | 3,329.6 | ||||||||||
Capital Lease Obligations (c) | 9,775.3 | 439.2 | 880.0 | 851.6 | 7,604.5 | |||||||||||||||
Operating Lease Obligations (d) | 38.1 | 5.2 | 7.1 | 4.3 | 21.5 | |||||||||||||||
Purchase Obligations (e) | 11,251.3 | 796.5 | 1,169.7 | 966.3 | 8,318.8 | |||||||||||||||
Other Long-Term Liabilities | 884.3 | 92.1 | 183.8 | 178.9 | 429.5 | |||||||||||||||
|
|
|
|
|
|
|
|
|
| |||||||||||
Total Contractual Obligations | $ | 26,520.6 | $ | 1,695.4 | $ | 2,433.7 | $ | 2,687.6 | $ | 19,703.9 | ||||||||||
|
|
|
|
|
|
|
|
|
| |||||||||||
| (a) | The amounts included in the table are calculated using current market prices, forward curves and other estimates. |
| (b) | Principal and interest payments on Long-Term Debt (excluding capital lease obligations). |
| (c) | Capital Lease Obligations for power purchase commitments and the PTF leases. |
| (d) | Operating Lease Obligations for power purchase commitments and rail car leases. |
| (e) | Purchase Obligations under various contracts for the procurement of fuel, power, gas supply and associated transportation and for construction, information technology and other services for utility operations. This includes the power purchase agreement for Point Beach. |
The table above does not include liabilities related to the accounting treatment for uncertainty in income taxes because we are not able to make a reasonably reliable estimate as to the amount and period of related future payments at this time. For additional information regarding these liabilities, refer to Note G — Income Taxes in the Notes to Consolidated Financial Statements in this report.
Our obligations for utility operations have historically been included as part of the rate-making process and therefore are generally recoverable from customers.
FACTORS AFFECTING RESULTS, LIQUIDITY AND CAPITAL RESOURCES
MARKET RISKS AND OTHER SIGNIFICANT RISKS
We are exposed to market and other significant risks as a result of the nature of our businesses and the environment in which those businesses operate. These risks, described in further detail below, include but are not limited to:
Regulatory Recovery: We account for our regulated operations in accordance with accounting guidance for regulated entities. Our rates are determined by regulatory authorities. Our primary regulator is the Public Service Commission of Wisconsin (PSCW). Regulated entities are allowed to defer certain costs that would otherwise be charged to expense, if the regulated entity believes the recovery of these costs is probable. We record regulatory assets pursuant to specific orders or by a generic order issued by our regulators, and recovery of these deferred costs in future rates is subject to the review and approval of those regulators. We assume the risks and benefits of ultimate recovery of these items in future rates. If the recovery of these costs is not approved by our regulators, the costs are charged to income in the current period. In general, regulatory assets are recovered in a period between one to eight years. Regulatory assets associated with pension and OPEB expenses are amortized as a component of pension and OPEB expense. Regulators can impose liabilities on a prospective basis for amounts previously collected from customers and for amounts that are expected to be refunded to customers. We record these items as regulatory liabilities. As of December 31, 2014, our regulatory assets totaled $1,626.9 million and our regulatory liabilities totaled $615.9 million.
Commodity Prices: In the normal course of providing energy, we are subject to market fluctuations of the costs of coal, natural gas, purchased power and fuel oil used in the delivery of coal. We manage our fuel and gas supply costs through a portfolio of short and long-term procurement contracts with various suppliers for the purchase of coal, natural gas and fuel oil. In addition, we manage the risk of price volatility by utilizing gas and electric hedging programs.
| Wisconsin Electric Power Company | A-17 | 2014 Annual Financial Statements |
Wisconsin’s retail electric fuel cost adjustment procedure mitigates some of our risk of electric fuel cost fluctuation. The fuel rules allow for a deferral of prudently incurred fuel costs that fall outside of a symmetrical band (plus or minus 2%). Under the rules, any over or under-collection of fuel costs deferred at the end of the year would be incorporated into fuel cost recovery rates in future years. For information regarding the fuel rules, see Rates and Regulatory Matters — Wisconsin Fuel Proceedings.
Natural Gas Costs: Higher natural gas costs could increase our working capital requirements and result in higher gross receipts taxes in the state of Wisconsin. Higher natural gas costs combined with slower economic conditions also expose us to greater risks of accounts receivable write-offs as more customers are unable to pay their bills. Higher natural gas costs may also lead to increased energy efficiency investments by our customers to reduce utility usage and/or fuel substitution.
As part of its December 2014 rate order, the PSCW authorized continued use of the escrow method of accounting for bad debt costs. The escrow method of accounting for bad debt costs allows for deferral of Wisconsin residential bad debt expense that exceeds or is less than amounts allowed in rates.
As a result of our GCRM, our gas utility operation receives dollar for dollar recovery on the cost of natural gas. However, increased natural gas costs increase the risk that customers will switch to alternative fuel sources, which could reduce future gas margins. For information concerning our natural gas utility’s GCRM, see Rates and Regulatory Matters.
Weather: Our Wisconsin utility rates are set by the PSCW based upon estimated temperatures which approximate 20-year averages. Our electric revenues and sales are unfavorably sensitive to below normal temperatures during the summer cooling season, and to some extent, to above normal temperatures during the winter heating season. Our gas revenues and sales are unfavorably sensitive to above normal temperatures during the winter heating season. A summary of actual weather information in our service territory during 2014, 2013 and 2012, as measured by degree days, may be found above in Results of Operations.
Interest Rate: We have various short-term borrowing arrangements to provide working capital and general corporate funds. We also have variable rate long-term debt outstanding as of December 31, 2014. Borrowing levels under these arrangements vary from period to period depending on capital investments and other factors. Future short-term interest expense and payments will reflect both future short-term interest rates and borrowing levels.
We performed an interest rate sensitivity analysis as of December 31, 2014 of our outstanding portfolio of commercial paper and variable rate long-term debt. As of December 31, 2014, we had $306.8 million of commercial paper outstanding with a weighted-average interest rate of 0.25%. A one-percentage point change in interest rates would cause our annual interest expense to increase or decrease by approximately $3.1 million.
Marketable Securities Return: We use various trusts to fund our pension and OPEB obligations. These trusts invest in debt and equity securities. Changes in the market prices of these assets can affect future pension and OPEB expenses. Additionally, future contributions can also be affected by the investment returns on trust fund assets. We believe that the financial risks associated with investment returns would be partially mitigated through future rate actions by our various utility regulators.
The fair value of our trust fund assets and expected long-term returns as of December 31, 2014 were approximately:
| As of December 31, 2014 (Millions of Dollars) | Expected Return on Assets in 2015 | |||||||
Pension trust funds | $ | 1,160.0 | 7.00 | % | ||||
Other post-retirement benefits trust funds | $ | 224.9 | 7.25 | % | ||||
Fiduciary oversight of the pension and OPEB trust fund investments is the responsibility of an Investment Trust Policy Committee. The Committee works with external actuaries and investment consultants on an ongoing basis to establish and monitor investment strategies and target asset allocations. Forecasted cash flows for plan liabilities are regularly updated based on annual valuation results. Target asset allocations are determined utilizing projected benefit payment cash flows and risk analyses of appropriate investments. The targeted asset allocations are intended to reduce risk, provide long-term financial stability for the plans and maintain funded levels which meet long-term plan obligations while
| Wisconsin Electric Power Company | A-18 | 2014 Annual Financial Statements |
preserving sufficient liquidity for near-term benefit payments. Investment strategies utilize a wide diversification of asset types and qualified external investment managers.
Wisconsin Energy consults with its investment advisors on an annual basis to help it forecast expected long-term returns on plan assets by reviewing actual historical returns and calculating expected total trust returns using the weighted-average of long-term market returns for each of the major target asset categories utilized in the fund.
Economic Conditions: Our service territory is within the state of Wisconsin and the Upper Peninsula of Michigan. We are exposed to market risks in the regional midwest economy. In addition, any economic downturn or disruption of national or international markets could adversely affect the financial condition of our customers and demand for their products, which could affect their demand for our products.
Inflation: We continue to monitor the impact of inflation, especially with respect to the costs of medical plans, fuel, transmission access, construction costs, and regulatory and environmental compliance in order to minimize its effects in future years through pricing strategies, productivity improvements and cost reductions. We do not believe the impact of general inflation will have a material impact on our future results of operations.
For additional information concerning risk factors, including market risks, see the Cautionary Statement Regarding Forward-Looking Information at the beginning of this report.
POWER THE FUTURE
All of the PTF units have been placed into service and are positioned to provide a significant portion of our future generation needs. The PTF units include Port Washington Generating Station Unit 1 (PWGS 1), Port Washington Generating Station Unit 2 (PWGS 2), Oak Creek expansion Unit 1 (OC 1) and Oak Creek expansion Unit 2 (OC 2).
As part of our 2013 Wisconsin Rate Case, the PSCW determined that 100% of the construction costs for the Oak Creek expansion units were prudently incurred by W.E. Power, LLC (We Power), and approved the recovery in rates of more than 99.5% of these costs.
We are leasing the PTF units from We Power under long-term leases. We are recovering the lease payments associated with PWGS 1, PWGS 2, OC 1 and OC 2 in our rates as authorized by the PSCW, the Michigan Public Service Commission (MPSC) and FERC.
We operate the PTF units and are authorized by the PSCW to fully recover prudently incurred operating and maintenance costs in our Wisconsin electric rates. As the operator of the units, we may request We Power make capital improvements to or further investments in the units. Under the lease terms, we would expect the costs of any capital improvements or further investments to be added to the lease payments, and ultimately to be recovered in our rates.
We Power assigned its warranty rights to us upon turnover of each of the Oak Creek expansion units. The warranty claim for costs incurred to repair steam turbine corrosion damage identified on both units was scheduled to go to arbitration in October 2013, but we entered into a settlement agreement with Bechtel Power Corporation (Bechtel) in June 2013 resolving the claim, as well as several other warranty claims. This settlement did not have a material impact to our financial statements. All warranty claims between the Company and Bechtel have now been resolved, none of which had a material impact on our financial statements.
RATES AND REGULATORY MATTERS
The PSCW regulates our retail electric, natural gas and steam rates in the state of Wisconsin, while FERC regulates our wholesale power, electric transmission and interstate gas transportation service rates. The MPSC regulates our retail electric rates in the state of Michigan. For the year ended December 31, 2014, we estimate that approximately 85% of our electric revenues were regulated by the PSCW, 2% were regulated by the MPSC and the balance of our electric revenues was regulated by FERC. In Wisconsin, a general rate case is typically filed every two years. All of our natural gas and steam revenues are regulated by the PSCW. Orders from the PSCW can be viewed at http://psc.wi.gov/ and orders from the MPSC can be viewed at www.michigan.gov/mpsc/.
| Wisconsin Electric Power Company | A-19 | 2014 Annual Financial Statements |
General Rate Proceedings
2015 Wisconsin Rate Case: In May 2014, we applied to the PSCW for a biennial review of costs and rates. On December 23, 2014, the PSCW approved the following rate adjustments:
| • | A net bill increase related to non-fuel costs for our Wisconsin retail electric customers of approximately $2.7 million (0.1%) in 2015. This amount reflects receipt of SSR payments from MISO that are higher than anticipated when we filed our rate request in May 2014, as well as an offset of $26.6 million related to a refund of prior fuel costs and the remainder of the proceeds from the Treasury Grant we received in connection with the biomass facility. This $26.6 million is being returned to customers in the form of bill credits. |
| • | An electric rate increase for our Wisconsin retail electric customers of $26.6 million (0.9%) for 2016, related to the expiration of the bill credits provided to customers in 2015. |
| • | A rate decrease of $13.9 million (-0.5%) in 2015 related to a forecasted decrease in fuel costs. We will make an annual fuel cost filing, as required, for 2016. |
| • | A rate decrease of $10.7 million (-2.4%) for our natural gas customers in 2015, with no rate adjustment in 2016. |
| • | An increase of approximately $0.5 million (2.0%) for our downtown Milwaukee steam utility customers for 2015, with no rate adjustment in 2016. |
| • | An increase of approximately $1.2 million (7.3%) for our Milwaukee County steam utility customers for 2015, with no rate adjustment in 2016. |
These rate adjustments were effective January 1, 2015. The electric rates reflect an increased allocation to fixed charges from 7.8% to 13.6% of total electric revenue requirements to more closely reflect our cost structure. In addition, our authorized return on equity was set at 10.2%. The PSCW also authorized the financial common equity component to remain the same at an average of 51%. The PSCW’s order also allowed for escrow accounting treatment for SSR revenue from MISO.
In January 2015, certain parties appealed a portion of the PSCW’s final decision adopting the Company’s specific rate design changes, including new charges for customer owned generation within its service territory. We believe the appeal is without merit.
2013 Wisconsin Rate Case: In March 2012, we initiated rate proceedings with the PSCW. In December 2012, the PSCW approved the following rate adjustments:
| • | A net bill increase related to non-fuel costs for our Wisconsin retail electric customers of approximately $70 million (2.6%) for 2013. This amount reflects an offset of approximately $63 million (2.3%) of bill credits related to the proceeds of the Treasury Grant, including related tax benefits. Absent this offset, the retail electric rate increase for non-fuel costs was approximately $133 million (4.8%) for 2013. |
| • | An electric rate increase for our Wisconsin retail electric customers of approximately $28 million (1.0%) for 2014, and a $45 million (1.6%) reduction in bill credits. |
| • | Recovery of a forecasted increase in fuel costs of approximately $44 million (1.6%) for 2013. |
| • | A rate decrease of approximately $8 million (-1.9%) for our natural gas customers for 2013, with no rate adjustment in 2014. The rates reflected a $6.4 million reduction in bad debt expense. |
| • | An increase of approximately $1.3 million (6.0%) for our downtown Milwaukee steam utility customers for 2013 and another $1.3 million (6.0%) in 2014. |
| • | An increase of approximately $1 million (7.0%) in 2013 and $1 million (6.0%) in 2014 for our Milwaukee County steam utility customers. |
These rate adjustments were effective January 1, 2013. In addition, our allowed return on equity remained at 10.4%. The PSCW also approved escrow accounting treatment for the Treasury Grant.
2012 Wisconsin Rate Case: In May 2011, we filed an application with the PSCW to initiate rate proceedings. In lieu of a traditional rate proceeding, we requested an alternative approach, which resulted in no increase in 2012 base rates for our customers. In order for us to proceed under this alternative approach, we requested that the PSCW issue an order that, among other things:
| • | Authorized us to suspend the amortization of $148 million of regulatory costs during 2012, with amortization to begin again in 2013. |
| • | Authorized $148 million of carrying costs and depreciation on previously approved air quality and renewable energy projects, effective January 1, 2012. |
| Wisconsin Electric Power Company | A-20 | 2014 Annual Financial Statements |
| • | Authorized the refund of $26 million of net proceeds from our settlement of the spent nuclear fuel litigation with the DOE. |
We received a final written order from the PSCW in November 2011.
2012 and 2010 Michigan Rate Cases: In July 2011, we filed a $17.5 million rate increase request with the MPSC, primarily to recover the costs of environmental upgrades and OC 2. Pursuant to Michigan law, we self-implemented a $5.7 million interim electric base rate increase in January 2012. This increase was partially offset by a refund of $2.7 million of net proceeds from our settlement of the spent nuclear fuel litigation with the DOE, resulting in a net $3.0 million rate increase. In addition, approximately $2.0 million of renewable costs were included in our Michigan fuel recovery rate effective January 1, 2012. The MPSC approved a total increase in electric base rates of $9.2 million annually, effective June 27, 2012, and authorized a 10.1% return on equity.
In July 2009, we filed a $42 million rate increase request with the MPSC, primarily to recover the costs of PTF projects. In July 2010, the MPSC issued its final order, approving a total increase of $23.5 million annually, or 14.2%. In August 2010, our largest customers, two iron ore mines, filed an appeal with the MPSC regarding this rate order. In October 2010, the MPSC ruled on the mines’ appeal and reduced the rate increase by approximately $0.3 million annually. In November 2010, the mines filed a Claim of Appeal of the October 2010 order with the Michigan Court of Appeals. In May 2014, the Court of Appeals issued its decision affirming the MPSC orders in both the 2010 and 2012 rate cases. In August 2014, the mines filed an Application for Leave to Appeal with the Michigan Supreme Court, which Application was denied on February 3, 2015.
Michigan SSR Proceeding: On February 10, 2015, the MPSC issued an Order and Notice of Hearing related to the ongoing operation of Presque Isle Power Plant (PIPP) and the need for us to receive SSR payments with the return of the mines as our retail customers on February 1, 2015. We are unable to predict the resolution of this matter at this time.
For additional information relating to the SSR payments we are receiving, see Industry Restructuring and Competition below.
Wisconsin Fuel Proceedings
Embedded within our electric rates is an amount to recover fuel costs. The Wisconsin retail fuel rules require the Company to defer, for subsequent rate recovery or refund, any under-collection or over-collection of fuel costs that are outside of the utility’s symmetrical fuel cost tolerance, which the PSCW set at plus or minus 2% of the utility’s approved fuel cost plan. The deferred fuel costs are subject to an excess revenues test.
Other Rate Matters
Electric Transmission Cost Recovery: We divested our transmission assets with the formation of ATC in January 2001. We procure transmission service from ATC at FERC approved tariff rates. In connection with the formation of ATC, our transmission costs escalated due to the allocation of costs over ATC’s footprint and increased transmission infrastructure requirements in Wisconsin. In 2002, in connection with the increased costs experienced by our customers, the PSCW issued an order which allowed us to use escrow accounting whereby we deferred transmission costs that exceeded amounts embedded in our rates. We were allowed to earn a return on the unrecovered transmission costs at our weighted-average cost of capital. Our 2008 and 2010 PSCW rate orders discontinued escrow accounting for prospective transmission charges and provided for recovery of those costs as incurred. In our 2013 Wisconsin rate case, the PSCW reauthorized escrow accounting for future transmission costs whereby we defer prospective costs that exceed amounts in rates, and we are allowed to earn a return on the incremental unrecovered transmission costs at the short-term debt rate. As of December 31, 2014, we had $32 million of unrecovered transmission costs related to deferrals subsequent to 2012 that earn a return at the short-term debt rate. In addition, as of December 31, 2014, we had $114 million of unrecovered transmission costs related to deferrals prior to 2008 that earn a return at the weighted-average cost of capital. In our 2015 Wisconsin rate case, the PSCW order reaffirmed our deferral of transmission costs.
Gas Cost Recovery Mechanism: Our natural gas operations operate under a GCRM as approved by the PSCW. Generally, the GCRM allows for a dollar for dollar recovery of gas costs. The GCRM uses a modified one for one method that measures commodity purchase costs against a monthly benchmark which includes a 2% tolerance. Costs in excess of this monthly benchmark are subject to additional review by the PSCW before they can be passed through to our customers.
| Wisconsin Electric Power Company | A-21 | 2014 Annual Financial Statements |
Renewables, Efficiency and Conservation: In March 2006, Wisconsin revised the requirements for renewable energy generation by enacting 2005 Wisconsin Act 141 (Act 141). Act 141 defines “baseline renewable percentage” as the average of an energy provider’s renewable energy percentage for 2001, 2002 and 2003. A utility’s renewable energy percentage is equal to the amount of its total retail energy sales that are provided by renewable sources. Our baseline renewable energy percentage is 2.27%. Under Act 141, we were required to increase our renewable energy percentage at least two percentage points to a level of 4.27% for the years 2010-2014. As of December 31, 2014, we are in compliance with the Wisconsin renewable energy percentage of 4.27%. Act 141 further requires that for the year 2015 and beyond, the renewable energy percentage must increase at least six percentage points above the baseline to a level of 8.27%. Act 141 established a goal that 10% of all electricity consumed in Wisconsin be generated by renewable resources by December 31, 2015. To comply with increasing requirements, we have constructed and contracted for several hundred megawatts of wind generation and constructed a 50 MW biomass facility at Domtar Corporation’s Rothschild, Wisconsin paper mill site that went into commercial operation in November 2013. Wood waste and wood shavings are used to produce renewable electricity and the plant also supports Domtar’s sustainable papermaking operations. The final cost of completing this project was $268.9 million, excluding AFUDC. We also own four wind sites, consisting of 200 turbines with an installed capacity of 338 MW and a dependable capability of 66 MW.
We expect to be in compliance with Act 141’s 2015 standard, and have entered into agreements for renewable energy credits which should allow us to remain in compliance with Act 141 through 2022. If market conditions are favorable, we may purchase more renewable energy credits.
Act 141 allows the PSCW to delay a utility’s implementation of the renewable portfolio standard if it finds that achieving the renewable requirement would result in unreasonable rate increases or would lessen reliability, or that new renewable projects could not be permitted on a timely basis or could not be served by adequate transmission facilities. Act 141 provides that if a utility is in compliance with the renewable energy and energy efficiency requirements as determined by the PSCW, then the utility may not be ordered to achieve additional energy conservation or efficiency.
Act 141 also redirects the administration of energy efficiency, conservation and renewable programs from the Wisconsin Department of Administration back to the PSCW and/or contracted third parties. In addition, Act 141 required that 1.2% of utilities’ annual operating revenues be used to fund these programs in 2014. The funding required by Act 141 for 2015 is also 1.2% of annual operating revenues.
Public Act 295 enacted in Michigan requires 10% of the state’s energy to come from renewables by 2015 and energy optimization (efficiency) targets up to 1% annually by 2015. We are currently in compliance with this requirement. Public Act 295 specifically calls for current recovery of costs incurred to meet the standards and provides for ongoing review and revision to assure the measures taken are cost-effective.
ELECTRIC SYSTEM RELIABILITY
We continue to upgrade our electric distribution system, including substations, transformers and lines. We had adequate capacity to meet the MISO calculated planning reserve margin during 2014 and 2013. All of our generating plants performed as expected during the warmest periods of the summer and all power purchase commitments under firm contract were received. During this period, public appeals for conservation were not required and we did not interrupt or curtail service to non-firm customers who participate in load management programs. We expect to have adequate capacity to meet the planning reserve margin requirements during 2015. However, extremely hot weather, unexpected equipment failure or unavailability across the 15-state MISO market footprint could require us to call upon load management procedures.
ENVIRONMENTAL MATTERS
Overview
Consistent with other companies in the energy industry, we face significant ongoing environmental compliance and remediation obligations related to current and past operations. Specific environmental issues affecting us include but are not limited to current and future regulation of: (1) air emissions such as Sulfur Dioxide (SO2), Nitrogen Oxide (NOx), fine particulates, mercury and greenhouse gases; (2) water discharges; (3) disposal of coal combustion by-products such as fly ash; and (4) remediation of impacted properties, including former manufactured gas plant sites.
| Wisconsin Electric Power Company | A-22 | 2014 Annual Financial Statements |
We have continued to pursue a proactive strategy to manage our environmental compliance obligations, including: (1) the development of additional sources of renewable electric energy supply; (2) the review of water quality matters such as discharge limits and cooling water requirements and implementing improvements to our cooling water intake systems as needed; (3) the addition of emission control equipment to existing facilities to comply with new ambient air quality standards and federal clean air rules; (4) the conversion of the fuel source for Valley Power Plant (VAPP) from coal to natural gas; (5) the beneficial use of ash and other solid products from coal-fired generating units; and (6) the clean-up of former manufactured gas plant sites.
Air Quality
EPA - Consent Decree: In April 2003, we reached a Consent Decree with the United States Environmental Protection Agency (EPA), in which we agreed to significantly reduce air emissions from our coal-fired generating facilities. In July 2003, the Consent Decree was amended to include the state of Michigan, and in October 2007, the U.S. District Court for the Eastern District of Wisconsin approved and entered the amended Consent Decree. The Consent Decree was further amended in January 2012 to change the point of air monitoring at the Oak Creek Power Plant to accommodate the AQCS that began service in 2012. In September 2014, the Consent Decree was amended a third time to update some provisions related to the conversion of VAPP from coal to natural gas. In order to achieve the reductions agreed to in the Consent Decree, over the past 11 years we have installed new pollution control equipment, including the Oak Creek AQCS, upgraded existing equipment and retired certain older coal units at a cost of approximately $1.2 billion. We do not expect future costs to have a material impact on our consolidated financial statements.
National Ambient Air Quality Standards (NAAQS)
8-hour Ozone Standards: In 2008, the EPA issued a more stringent 8-hour ozone standard, and made final attainment designations for this revised standard in 2012. Sheboygan County and the eastern portion of Kenosha County were designated as non-attainment areas. As a result, construction permitting for all of our Wisconsin power plants, except the Pleasant Prairie Power Plant, is expected to be subject to less stringent permitting requirements. In addition, modifications to these facilities should not be required to obtain emission offsets. So long as eastern Kenosha County remains an ozone non-attainment area, the Pleasant Prairie Power Plant will continue to be subject to more stringent permitting requirements and offset provisions.
In April 2014, the U.S. District Court for the Northern District of California adopted a petition from environmental groups to require the EPA to propose a new ozone standard by 2014, and to finalize the standard by October 2015. On November 25, 2014, the EPA proposed to lower the 8-hour ozone standard from its current level of 75 parts per billion. As part of its proposal, the EPA requested comment on values from 60-70 parts per billion. The impact, if any, of a revised standard will depend on how much it is lowered, but could result in widespread areas of the country not being able to meet the new standard.
Fine Particulate Standard: In 2009, the EPA designated three counties in southeast Wisconsin (Milwaukee, Waukesha and Racine) as not meeting the daily standard for Fine Particulate Matter (PM2.5). In April 2012, the EPA proposed to determine that these three counties meet the PM2.5 standard, and proposed to suspend the requirement that the state submit a State Implementation Plan (SIP) including reasonably available control technology regulations. In February 2014, the EPA re-proposed this determination, and in April 2014, the EPA took action to redesignate the three counties to attainment. Our generating facilities in the counties are now subject to less stringent construction permitting requirements and emission offset provisions are no longer required for modifications to these facilities. In addition, in December 2012, the EPA issued a revised and more stringent annual PM2.5standard. On December 18, 2014, the EPA determined that all areas of Wisconsin and Michigan’s Upper Peninsula meet the revised standard and designated them as attainment areas. Therefore, we do not currently expect the lower standard to impose any additional requirements on our operations.
Sulfur Dioxide Standard: The EPA issued a new 1-Hour SO2 NAAQS that became effective in August 2010. This standard represents a significant change from the previous SO2 standard, and NAAQS in general, since attainment designations were to be based primarily on modeling rather than monitoring. Typically, attainment designations are based on monitored data. In May 2014, the EPA issued the proposed Data Requirements Rule that would establish procedures and timelines for implementation of the standard. The proposed rule describes the EPA’s plans for allowing the states to use either monitoring or modeling to make designations.
We filed comments on the proposed rule with the EPA in July 2014, and proposed a special reliability exclusion for PIPP that would recognize our request to retire the facility, and would exclude it from further modeling or monitoring requirements and subsequent emission reductions. As proposed, the rule affords state agencies latitude in rule implementation. States would have the option of modeling or monitoring to show attainment (subject to EPA approval for
| Wisconsin Electric Power Company | A-23 | 2014 Annual Financial Statements |
this selection). If the state chooses modeling and the sources in an area do not make reductions by 2017, and as a consequence the area is classified as non-attainment, then they would have to make emission reductions by 2023. Alternatively, if a state opted out of modeling and instead chose monitoring, and subsequently monitored non-attainment, then it would face a 2026 compliance date. A non-attainment designation could have negative impacts for a localized geographic area, including permitting constraints for the subject source and for other new or existing sources in the area.
We believe our fleet (with the exception of PIPP) is well positioned to meet this regulation once it is finalized. If PIPP is still operating in the 2021-2022 timeframe, it will likely need additional SO2 reductions in order to comply with the standard.
Nitrogen Dioxide Standard: In January 2010, the EPA announced a new hourly Nitrogen Dioxide standard, which became effective in April 2010. In February 2012, all areas of Wisconsin and Michigan were designated as unclassifiable. Until these areas are classified as attainment or non-attainment and any potential rules are adopted, we are unable to predict the impact on the operation of our generation facilities.
Mercury and Other Hazardous Air Pollutants:In December 2011, the EPA issued the final Mercury and Air Toxics Standards (MATS) rule, which imposes stringent limitations on numerous hazardous air pollutants, including mercury, from coal and oil-fired electric generating units. We currently anticipate that only PIPP will require modifications, and are planning for the addition of a dry sorbent injection system for further control of mercury and acid gases at the plant to comply with MATS. In April 2013, we received a one year MATS compliance extension through April 16, 2016 from the Michigan Department of Environmental Quality (MDEQ).
In addition, both Wisconsin and Michigan have mercury rules that require a 90% reduction of mercury, and compliance with those rules will no longer be required after the compliance date for MATS.
In January 2013, the EPA issued the National Emission Standards for Hazardous Air Pollutants for Major Sources: Industrial, Commercial, and Institutional Boilers and Process Heaters (Industrial Boiler MACT Rule). The Industrial Boiler MACT rule imposes stringent limitations on numerous hazardous air pollutants from large boilers that do not meet the definition of electric generating units. The compliance date set forth in the rule is January 31, 2016, but a one year extension of that deadline may be available where emission controls cannot be installed and operational by the compliance date. Along with some smaller gas fired boilers in our fleet, the three coal fired boilers at the Milwaukee County Power Plant are subject to this rule. We are currently evaluating compliance options for these boilers.
Cross-State Air Pollution Rule: In August 2011, the EPA issued Cross-State Air Interstate Rule (CSAPR), formerly known as the Clean Air Transport Rule. This rule was proposed to replace the Clean Air Interstate Rule (CAIR), which had been remanded to the EPA in 2008. The stated purpose of the CSAPR is to limit the interstate transport of emissions of NOx and SO2 that contribute to PM2.5 and ozone non-attainment in downwind states through a proposed allocation plan. In February 2012, the EPA issued final technical revisions to the rule and issued a draft final rule which together delay the implementation date for certain penalty provisions that could potentially impact the PIPP and increase the number of allowances issued to the states of Michigan and Wisconsin. We and a number of other parties sought judicial review of the rule. In April 2014, the United States Supreme Court issued a decision largely upholding the rule and remanding it for further proceedings consistent with the Court’s order. Briefing on further challenges to the rule allowed by the U.S. Supreme Court decision is ongoing. On October 23, 2014, the U.S. Court of Appeals for the D.C. Circuit issued a decision that cleared the way for the EPA to begin implementing CSAPR on January 1, 2015. We expect that there will be sufficient allowances available for PIPP to meet its obligations to operate and provide stability to the transmission system in the Upper Peninsula of Michigan. We also expect to have excess allowances available to sell from our Wisconsin power plants. In light of these developments, we withdrew our challenge to CSAPR.
Clean Air Visibility Rule: The EPA issued the Clean Air Visibility Rule in June 2005 to address Regional Haze, or regionally-impaired visibility caused by multiple sources over a wide area. The rule defines Best Available Retrofit Technology (BART) requirements for electric generating units and how BART will be addressed in the 28 states subject to the EPA’s CAIR. The pollutants from power plants that reduce visibility include PM2.5 or compounds that contribute to fine particulate formation, NOx, SO2 and ammonia.
In June 2012, the EPA promulgated a Federal Implementation Plan that approves reliance on the CSAPR to satisfy electric generating unit BART requirements for NOx and SO2. In December 2012, the EPA approved Michigan’s regional haze SIP. In August 2012, the EPA approved Wisconsin’s regional haze SIP, which also relies on the CSAPR to satisfy electric generating unit BART requirements for NOx and SO2. We believe we are well positioned to meet the requirements of the Clean Air Visibility rule based on air quality control system additions that are already in place or planned for our generating facilities.
| Wisconsin Electric Power Company | A-24 | 2014 Annual Financial Statements |
Climate Change: We continue to take measures to reduce our emissions of Greenhouse Gas (GHG). We support flexible, market-based strategies to curb GHG emissions, including emissions trading, emission offset projects and credit for early actions. We support an approach that encourages technology development and transfer and includes all sectors of the economy and all significant global emitters. We, along with our affiliates, have taken, and continue to take, several steps to reduce our emissions of GHG, including:
| • | Repowered the Port Washington Power Plant from coal to natural gas-fired combined cycle units. |
| • | Added coal-fired units as part of the Oak Creek expansion that are the most thermally efficient coal units in our system. |
| • | Increased our investment in energy efficiency and conservation. |
| • | Added renewable capacity. |
| • | Converting the fuel source at the VAPP from coal to natural gas, scheduled for completion in 2015. |
| • | Retired coal units 1-4 at PIPP. |
Federal, state, regional and international authorities have undertaken efforts to limit GHG emissions. The regulation of GHG emissions continues to be a top priority for the President’s administration.
In accordance with instructions from the President, the EPA is pursuing regulation of GHG emissions using its existing authority under the Clean Air Act. In September 2013, the EPA issued new proposed New Source Performance Standards with GHG limits for new fossil fueled power plants. The rule would not apply to certain natural gas fueled peaking plants, biomass units or oil fueled stationary combustion turbines. Based upon currently available technology and the emission limits in the proposed rule, we believe that this rule effectively prohibits new conventional coal-fired power plants.
In addition, the EPA issued proposed guidelines relating to GHG emissions from existing generating units in June 2014, and has announced plans to issue final rules by mid-summer 2015. The EPA also published proposed performance standards for modified and reconstructed generating units. The proposed guidelines for existing fossil generating units seek to attain state-specific GHG rate reductions by 2030, and require states to submit plans as early as June 30, 2016. Single states requesting a one year extension would be required to submit plans by June 30, 2017, and states that are part of a multi-state plan that request a two year extension would be required to submit plans by June 30, 2018. The EPA is seeking GHG rate reductions in Wisconsin of 34% and in Michigan of 31% by 2030, with interim reduction goals beginning in 2020 of 30% and 27% respectively, with interim goal compliance determined by averaging reductions over the ten year period of 2020 to 2029. The proposed program consists of building blocks that include a combination of power plant efficiency improvements, increased reliance on combined cycle gas units, adding new renewable energy resources, and increased demand side management. We are in the process of reviewing the proposed guidelines to determine the potential impacts to our operations, but the guidelines as currently proposed could result in significant additional compliance costs, including capital expenditures, impact how we operate our existing fossil fueled power plants and biomass facility, and could have a material adverse impact on our operating costs.
In June 2014, the U.S. Supreme Court struck down a portion of the EPA’s program for permitting GHG emissions under the Prevention of Significant Deterioration (PSD) and Title V programs. The Court held that a facility’s GHG emissions alone cannot trigger a requirement to obtain a permit and that the EPA did not have the authority to “tailor” the statutory permitting thresholds. The Court also upheld those portions of the EPA’s program that provide for implementation of GHG emissions limits based on the application of BART for facilities already subject to PSD or Title V permitting requirements for other pollutants. We do not expect that this decision will have a material impact on our facilities.
We are required to report our Carbon Dioxide (CO2) equivalent emissions from our electric generating facilities under the EPA Greenhouse Gases Reporting Program. For 2013, we reported CO2 equivalent emissions of approximately 21.9 million metric tonnes to the EPA, compared with approximately 18.1 million metric tonnes for 2012. Based upon our preliminary analysis of the data, we estimate that we will report CO2 equivalent emissions of approximately 23.3 million metric tonnes to the EPA for 2014. The level of CO2 and other greenhouse gas emissions vary from year to year and are dependent on the level of electric generation and mix of fuel sources, which is determined primarily by demand, the availability of the generating units, the unit cost of fuel consumed and how our units are dispatched by MISO.
We are also required to report CO2 equivalent amounts related to the natural gas our gas utility distributes and sells. For 2013, we reported approximately 4.1 million metric tonnes of CO2 equivalent to the EPA related to our distribution and sale of natural gas, compared with approximately 3.3 million metric tonnes for 2012. Based upon our preliminary analysis of the monitoring data, we estimate that we will report CO2emissions of approximately 4.4 million metric tonnes to the EPA for 2014.
| Wisconsin Electric Power Company | A-25 | 2014 Annual Financial Statements |
Valley Power Plant Conversion: In August 2012, we announced plans to convert the fuel source for VAPP from coal to natural gas. We currently expect the cost of this conversion to be between $65 million and $70 million, excluding AFUDC. We received PSCW approval for this project in March 2014. Construction related to the conversion of the first two boilers was completed in November 2014, and the remaining two boilers are scheduled for completion in 2015.
For further information, see Note Q — Commitments and Contingencies in the Notes to Consolidated Financial Statements.
Water Quality
Clean Water Act: Section 316(b) of the Clean Water Act requires that the location, design, construction and capacity of cooling water intake structures reflect the Best Technology Available (BTA) for minimizing adverse environmental impacts. The EPA finalized rules for new facilities (Phase I) in 2001. The EPA issued a final Phase II rule that became effective on October 14, 2014. The new rule applies to all of our existing generating facilities with cooling water intake structures, except for the Oak Creek expansion units, which were permitted under the Phase I rules.
The new Phase II rule allows facility owners to select from seven options available to meet the impingement mortality (IM) reduction standard. BTA determinations will be made over the next several years by the Wisconsin Department of Natural Resources (WDNR) and MDEQ, subject to EPA oversight, when facility permits are reissued. Based upon our assessment, we believe that the existing technologies at our generating facilities will allow us to demonstrate that, other than VAPP, all of our facilities satisfy the IM BTA standard. During 2015 and 2016, we plan to install fish protection screens at VAPP that will meet the IM BTA standard.
The BTA determinations for entrainment mortality (EM) reduction will be made by the WDNR and MDEQ on a case-by-case basis. The new rule requires state permitting agencies to determine EM BTA on a site-specific basis taking into consideration several factors. We have received an EM BTA determination by the WDNR, with EPA concurrence, for our proposed intake modification at VAPP. We cannot yet determine what, if any, intake structure or operational modifications will be required to meet the new requirements for our other generating facilities.
The WDNR issued a new Wisconsin Pollutant Discharge Elimination System (WPDES) permit for VAPP that became effective on January 1, 2013 that contains several additional requirements. Effluent toxicity testing and monitoring for additional parameters (phosphorous, mercury and ammonia-nitrogen), and a new heat addition limit from the cooling water discharges all took effect immediately. Longer term compliance requirements include thermal discharge studies, phosphorous evaluation and feasibility for reduction, mercury minimization planning and a compliance schedule for the installation of the new cooling water intake fish protection screens.
On November 10, 2014, the WDNR reissued the WPDES permit for the Paris Generating Station (PSGS). We believe that the WDNR imposed unreasonable permit conditions with respect to temperature monitoring, the control of water treatment additive and phosphorus discharges.
To address these permit conditions, we filed a petition for a contested case hearing with the WDNR on January 9, 2015. On the same day, we also filed a request to be covered by the statewide phosphorus variance to address one of our concerns with the permit. We are working with the WDNR to determine if settlement is possible. A decision on the phosphorus variance request is pending.
Steam Electric Effluent Guidelines: These guidelines regulate waste water discharges from our power plant processes. In June 2013, the EPA issued a proposed rule for comment to modify these guidelines. We submitted comments primarily addressing potential effects to our wastewater treatment facilities and coal combustion residuals effluent management activities. The rules are expected to be finalized by September 2015. After promulgation of the final rules, the WDNR and MDEQ will need to modify state rules accordingly and then incorporate new requirements into our facility permits. The rule compliance deadline is as soon as possible after July 1, 2017 with full compliance expected by July 1, 2022. We already meet many of the proposed requirements defined by the EPA, and as a result believe we will be well positioned to comply with the proposed guidelines. There are several available options outlined in the proposed rule. The amount of additional costs we may need to incur to comply with the new guidelines, if any, will depend on which option(s) the EPA selects to incorporate into the final guidelines. Until the rules are finalized, we are unable to determine the impact on our facilities.
| Wisconsin Electric Power Company | A-26 | 2014 Annual Financial Statements |
Land Quality
New Coal Combustion Products Regulation: We currently have a program of beneficial utilization for substantially all of our coal combustion products, including fly ash, bottom ash and gypsum, which minimizes the need for disposal in specially-designed landfills. Both Wisconsin and Michigan have regulations governing the use and disposal of these materials. In 2010, the EPA issued draft rules for public comment proposing two alternative rules for regulating coal combustion products, one of which would classify the materials as hazardous waste. The EPA issued the final rule on December 22, 2014, under which coal combustion residuals will be regulated as a non-hazardous waste. The rule is self-implementing which means that affected facilities must comply with the rules regardless of whether a state adopts the rule. We have been meeting the state requirements and have plans in place to implement the additional federal rule requirements.
In the preamble to the final rule, the EPA referenced reports it received with respect to the molybdenum concerns raised in southeastern Wisconsin, and indicated it will continue to evaluate the beneficial use of coal ash in unencapsulated construction.
Manufactured Gas Plant Sites: We continue to voluntarily review and address environmental conditions at a number of former manufactured gas plant sites. For further information, see Note Q — Commitments and Contingencies in the Notes to Consolidated Financial Statements.
Ash Landfill Sites: We seek environmentally acceptable, beneficial uses for our combustion byproducts. For further information, see Note Q — Commitments and Contingencies in the Notes to Consolidated Financial Statements.
LEGAL MATTERS
Stray Voltage:On July 11, 1996, the PSCW issued a final order regarding the stray voltage policies of Wisconsin’s investor-owned utilities. The order clarified the definition of stray voltage, affirmed the level at which utility action is required, and placed some of the responsibility for this issue in the hands of the customer. Additionally, the order established a uniform stray voltage tariff which delineates utility responsibility and provides for the recovery of costs associated with unnecessary customer demanded services.
Dairy farmers have made claims against us for loss of milk production and other damages to livestock allegedly caused by stray voltage and ground currents resulting from the operation of our electrical system, even though that electrical system has been operated within the parameters of the PSCW’s order. The Wisconsin Supreme Court has rejected the arguments that, if a utility company’s measurement of stray voltage is below the PSCW “level of concern,” that utility could not be found negligent in stray voltage cases. Additionally, the Court has held that the PSCW regulations regarding stray voltage were only minimum standards to be considered by a jury in stray voltage litigation. As a result of these rulings, claims by dairy farmers for livestock damage have been based upon ground currents with levels measuring less than the PSCW “level of concern.” We continue to evaluate various options and strategies to mitigate this risk.
On September 9, 2014, a new stray voltage case was filed against Wisconsin Electric in Sheboygan County, Wisconsin. We do not believe this lawsuit has any merit and intend to defend the case vigorously. This lawsuit is not expected to have a material adverse effect on our financial statements.
INDUSTRY RESTRUCTURING AND COMPETITION
Electric Utility Industry
The regulated energy industry continues to experience significant changes. FERC continues to support large Regional Transmission Organizations (RTOs), which affects the structure of the wholesale market. To this end, MISO implemented the MISO Energy Markets, including the use of Locational Marginal Price (LMP) to value electric transmission congestion and losses. The MISO Energy Markets commenced operation in April 2005 for energy distribution and in January 2009 for operating reserves. Increased competition in the retail and wholesale markets, which may result from restructuring efforts, could have a significant and adverse financial impact on us. It is uncertain when retail access might be implemented, if at all, in Wisconsin; however, Michigan has adopted retail choice.
Restructuring in Wisconsin: Electric utility revenues in Wisconsin are regulated by the PSCW. The PSCW has been focused on electric reliability infrastructure issues for the state of Wisconsin in recent years. The PSCW continues to
| Wisconsin Electric Power Company | A-27 | 2014 Annual Financial Statements |
maintain the position that the question of whether to implement electric retail competition in Wisconsin should ultimately be decided by the Wisconsin legislature. No such legislation has been introduced in Wisconsin to date.
Michigan Business
Michigan Settlement: On January 12, 2015, we, along with Wisconsin Energy, entered into an agreement with the Governor of the State of Michigan, the Attorney General of the State of Michigan, the Staff of the MPSC, and Tilden Mining Company and Empire Iron Mining Partnership, owners of the two mines in the Upper Peninsula of Michigan, to resolve all objections these parties raised at the FERC and the MPSC related to Wisconsin Energy’s proposed acquisition of Integrys. The agreement forms the basis for a settlement agreement between the parties and includes the following provisions which directly impact us:
| • | The Governor, the Attorney General and the owners of the mines will each file a letter with FERC stating that they do not have any objection to FERC’s approval of Wisconsin Energy’s acquisition of Integrys, and will refrain from taking any action at FERC seeking to oppose, otherwise condition or delay consummation of the transaction. These letters have been filed with FERC. |
| • | The settlement agreement will request that the MPSC order approve Wisconsin Energy’s acquisition of Integrys subject to the following conditions: (i) the closing of the sale of our Michigan electric distribution assets and PIPP to Upper Peninsula Power Company (UPPCO) contemporaneously with the closing of the acquisition of Integrys; (ii) the closing of the sale of Wisconsin Public Service Corporation’s Michigan electric distribution assets to UPPCO contemporaneously with the closing of the acquisition; and (iii) termination of the PIPP SSR agreement between MISO and us no later than the closing date of the acquisition. To this end, we have entered into a non-binding term sheet to sell these assets to UPPCO, which is described in more detail below. The Attorney General, the MPSC Staff and the owners of the mines will not seek or support any other conditions on granting of MPSC approval of our acquisition of Integrys. Wisconsin Public Service Corporation is a subsidiary of Integrys. |
The settlement agreements entered into by these parties, as well as two other intervenors, in the MPSC proceedings, were filed with the MPSC on January 30, 2015.
SSR Payments: Under Michigan law, our retail customers may choose an alternative electric supplier to provide power supply service. The law limits customer choice to 10% of our Michigan retail load. The two iron ore mines are excluded from this cap. When a customer switches to an alternative electric supplier, we continue to provide distribution and customer service functions for the customer.
In August 2013, the mines, which were served on an interruptible tariff, notified us that they intended to switch to an alternative electric supplier. In September 2013, the switch was made. In addition, other smaller retail customers have switched to an alternative electric supplier. Following that decision, we initiated discussions with MISO to compensate us for the continued short-term operation of the plant through 2014.
In August 2013, we filed a request with MISO to suspend the operation of all five units at PIPP. In October 2013, MISO informed us that the operation of all units is necessary to maintain reliability in the Upper Peninsula of Michigan.
In January 2014, we entered into an SSR agreement (Suspension) with MISO to recover costs for operating and maintaining the units. The agreement was effective February 1, 2014, had a one year term, and specified monthly payments to us of $4.4 million to cover fixed costs. The agreement also provided for the payment of our variable costs to operate and maintain the plant. MISO filed the SSR agreement with FERC, and on April 1, 2014, FERC conditionally accepted the agreement as filed, subject to further review and FERC order. We began receiving SSR payments from MISO in the second quarter of 2014 retroactive to the agreement’s effective date of February 1, 2014.
In addition, we issued a request for proposals regarding the potential purchase of PIPP in January 2014. We did not receive any valid proposals by the March 3, 2014 deadline. Based upon our evaluation and the lack of interest to purchase the plant, in April 2014, we filed a request with MISO to retire PIPP effective October 15, 2014. In May 2014, MISO informed us that they had determined the operation of all five units at PIPP was necessary for reliability purposes; therefore, the units would continue to be designated as SSR units.
We entered into a new SSR agreement (Retirement) with MISO, effective October 15, 2014, that covered the operating costs of PIPP through December 2015. The new SSR agreement also included, among other things, costs to comply with the MATS rule and a return on and of our investment in the plant. The new agreement is based on projected costs and is subject to a true-up mechanism. The estimated monthly payments under this agreement were approximately $8.1 million. On November 10, 2014, FERC accepted the new SSR agreement, but it is subject to further action.
| Wisconsin Electric Power Company | A-28 | 2014 Annual Financial Statements |
MISO is responsible for allocating the SSR costs to various market participants within the MISO footprint consistent with FERC approved tariffs. Several interested parties, including the PSCW and the MPSC, have filed complaints with the FERC regarding the allocation among the different jurisdictions of the SSR costs associated with the continued operation of PIPP. On February 19, 2015, FERC acted on the jurisdictional allocation of the SSR costs, reaffirming that it is unjust and unreasonable to allocate SSR costspro rata to all market participants and that SSR costs must be allocated to the load-serving entities that require the operation of SSR units for reliability purposes. FERC directed MISO to file a new study method to identify the entities that benefit from the operation of SSR units within 60 days of the decision date and to allocate the costs directly to these entities.
On February 17, 2015, we entered into an agreement with the owners of the two iron ore mines whereby we agreed to request termination of the SSR agreement effective February 1, 2015, and the two mines agreed to remain full requirements customers until the earlier of the sale of PIPP and July 31, 2015. On the same date, we requested MISO to terminate the SSR agreement, and on February 18, 2015, MISO filed a request with FERC to have the SSR terminated effective February 1, 2015. We do not expect the termination of the SSR agreement to have a material impact on our financial condition or results of operations.
Effective February 1, 2015, the mines returned as retail customers. We expect to defer the net revenue from those sales and will apply these amounts for the benefit of Wisconsin retail electric customers in future rate proceedings. Michigan state law allows the mines to switch to an alternative electric supplier after sufficient notice.
Sale of Michigan Assets: In January 2015, we entered into a non-binding term sheet to sell our Michigan electric distribution assets and PIPP to UPPCO. We currently expect to enter into a definitive agreement by the end of March 2015. The ultimate sale of these assets would have to be approved by several state and federal regulatory bodies, including the MPSC, PSCW and FERC. If the sale is consummated on terms commensurate with the non-binding term sheet, consistent with the treatment that would be applied to a generating unit retirement we will seek recovery of approximately $190 million of net unrecovered plant costs.
We believe that the sale of these assets is in the best interest of our customers because of the costs associated with the next best solution, which includes operating PIPP for at least five more years. These costs would include ongoing operating costs, decommissioning and dismantling costs and any increased costs for additional transmission capacity in the Upper Peninsula.
Electric Transmission, Capacity and Energy Markets
In connection with its status as a FERC approved RTO, MISO developed bid-based energy markets, which were implemented on April 1, 2005. In January 2009, MISO commenced the Energy and Operating Reserves Markets, which includes the bid-based energy markets and an ancillary services market. We previously self-provided both regulation reserves and contingency reserves. In the MISO ancillary services market, we buy/sell regulation and contingency reserves from/to the market. The MISO ancillary services market has been able to reduce overall ancillary services costs in the MISO footprint. The MISO ancillary services market has enabled MISO to assume significant balancing area responsibilities such as frequency control and disturbance control.
In MISO, base transmission costs are currently being paid by Load Serving Entities located in the service territories of each MISO transmission owner. FERC has previously confirmed the use of the current transmission cost allocation methodology. Certain additional costs for new transmission projects are allocated throughout the MISO footprint.
We, along with others, have sought rehearing and/or appeal of the FERC’s various Revenue Sufficiency Guarantee orders related to the determination that MISO had applied its energy markets tariff correctly in the assessment of the charges. The net effects of any final determination by FERC or the courts are uncertain at this time.
As part of MISO, a market-based platform was developed for valuing transmission congestion premised upon the LMP system that has been implemented in certain northeastern and mid-Atlantic states. The LMP system includes the ability to mitigate or eliminate congestion costs through Auction Revenue Rights (ARRs) and Financial Transmission Rights (FTRs). ARRs are allocated to market participants by MISO and FTRs are purchased through auctions. A new allocation and auction were completed for the period of June 1, 2014 through May 31, 2015. The resulting ARR valuation and the secured FTRs are expected to mitigate our transmission congestion risk for that period.
Beginning June 1, 2013, MISO instituted an annual zonal resource adequacy requirement to ensure there is sufficient generation capacity to serve the MISO market. To meet this requirement, capacity resources could be acquired through
| Wisconsin Electric Power Company | A-29 | 2014 Annual Financial Statements |
MISO’s annual capacity auction, bilateral contracts for capacity, or provided from generating or demand response resources. Our capacity requirements during 2014 were fulfilled using our own capacity resources.
Natural Gas Utility Industry
Restructuring in Wisconsin: The PSCW previously instituted generic proceedings to consider how its regulation of gas distribution utilities should change to reflect a competitive environment in the natural gas industry. To date, the PSCW has made a policy decision to deregulate the sale of natural gas in customer segments with workably competitive market choices and has adopted standards for transactions between a utility and its gas marketing affiliates. However, work on deregulation of the gas distribution industry by the PSCW continues to be on hold. Currently, we are unable to predict the impact of potential future deregulation on our results of operations or financial position.
OTHER MATTERS
Paris Generating Station Units 1 and 4 Temporary Outage:Between 2000 and 2002, we replaced the blades on the four PSGS combustion turbine generators with blades that were approximately 7% more efficient. The work was performed as routine maintenance that we did not believe required a construction permit at the time and the plant has not been operated to use the potential additional capacity; however, in January 2013, the WDNR indicated that it considered this maintenance to be a modification requiring a construction permit. This matter has since been settled. In December 2013, Act 91 was signed into law in Wisconsin, creating a process by which the EPA and WDNR were able to revise the regulations and emissions rates applicable to Units 1 and 4, allowing those units to restart. We received an “after the fact” permit from the WDNR, and the Units are now available for service. On October 24, 2014, the Sierra Club filed for a contested case hearing with the WDNR challenging this permit.
In February 2013, the Sierra Club filed for a contested case hearing with the WDNR in connection with the administration order issued in this matter, which was granted. However, a hearing has not yet been scheduled.
ACCOUNTING DEVELOPMENTS
New Pronouncements: See Note B — Recent Accounting Pronouncements in the Notes to Consolidated Financial Statements in this report for information on new accounting pronouncements.
Treasury Grant: In December 2013, we filed an application with the United States Treasury for a Treasury Grant related to the construction of our biomass facility, which was placed into service in November 2013. In December 2013, we recognized income related to the Treasury Grant and we deferred as a regulatory liability the grant proceeds that would be returned to customers subsequent to December 31, 2013. In connection with our Wisconsin retail electric rates that became effective January 1, 2013, our Wisconsin retail electric customers began receiving bill credits for the expected grant proceeds plus the related tax benefits.
In June 2014, we received approximately $76.2 million related to the Treasury Grant. The PSCW approved escrow accounting for the Treasury Grant and the proceeds we received that exceeded the amounts originally included in rates are being returned to customers in the form of bill credits.
As noted above, our Wisconsin retail electric customers are currently receiving bill credits related to the Treasury Grant plus related tax benefits. During 2014, we recognized Treasury Grant income to match the bill credits related to the grant that our Wisconsin retail electric customers received.
CRITICAL ACCOUNTING ESTIMATES
Preparation of financial statements and related disclosures in compliance with Generally Accepted Accounting Principles (GAAP) requires the application of appropriate technical accounting rules and guidance, as well as the use of estimates. The application of these policies necessarily involves judgments regarding future events, including the likelihood of success of particular projects, legal and regulatory challenges and anticipated recovery of costs. These judgments, in and of themselves, could materially impact the financial statements and disclosures based on varying assumptions. In addition, the financial and operating environment may also have a significant effect, not only on the operation of our business, but on our results reported through the application of accounting measures used in preparing the financial statements and related disclosures, even if the nature of the accounting policies applied have not changed.
| Wisconsin Electric Power Company | A-30 | 2014 Annual Financial Statements |
The following is a list of accounting policies that are most significant to the portrayal of our financial condition and results of operations and that require management’s most difficult, subjective or complex judgments:
Regulatory Accounting: We operate under rates established by state and federal regulatory commissions which are designed to recover the cost of service and provide a reasonable return to investors. The actions of our regulators may allow us to defer costs that non-regulated entities would expense and accrue liabilities that non-regulated companies would not. As of December 31, 2014, we had $1,626.9 million in regulatory assets and $615.9 million in regulatory liabilities. In the future, if we move to market based rates, or if the actions of our regulators change, we may conclude that we are unable to follow regulatory accounting. In this situation, we would record the regulatory assets related to unrecognized pension and OPEB costs as a reduction of equity, after tax. The balance of our regulatory assets net of regulatory liabilities would be recorded as an extraordinary after-tax non-cash charge to earnings. We continually review the applicability of regulatory accounting and have determined that it is currently appropriate to continue following it. In addition, each quarter we perform a review of our regulatory assets and our regulatory environment and we evaluate whether we believe that it is probable that we will recover the regulatory assets in future rates. See Note C — Regulatory Assets and Liabilities in the Notes to Consolidated Financial Statements for additional information.
Pension and OPEB: Our reported costs of providing non-contributory defined pension benefits (described in Note N — Benefits in the Notes to Consolidated Financial Statements) are dependent upon numerous factors resulting from actual plan experience and assumptions of future experience. Pension costs are impacted by actual employee demographics (including age, compensation levels and employment periods), the level of contributions made to plans and earnings on plan assets. Changes made to the provisions of the plans may also impact current and future pension costs. Pension costs may also be significantly affected by changes in key actuarial assumptions, including anticipated rates of return on plan assets, mortality and the discount rates used in determining the projected benefit obligation and pension costs.
Changes in pension obligations associated with these factors may not be immediately recognized as pension costs on the income statement, but generally are recognized in future years over the remaining average service period of plan participants. As such, significant portions of pension costs recorded in any period may not reflect the actual level of cash benefits provided to plan participants.
The following table reflects pension plan sensitivities associated with changes in certain actuarial assumptions by the indicated percentage. Each sensitivity reflects a change to the given assumption, holding all other assumptions constant.
Pension Plan Actuarial Assumption | Impact on Annual Cost | |||
| (Millions of Dollars) | ||||
0.5% decrease in discount rate and lump sum conversion rate | $ | 5.0 | ||
0.5% decrease in expected rate of return on plan assets | $ | 5.5 | ||
In addition to pension plans, we maintain OPEB plans which provide health and life insurance benefits for retired employees (described in Note N — Benefits in the Notes to Consolidated Financial Statements). Our reported costs of providing these post-retirement benefits are dependent upon numerous factors resulting from actual plan experience including employee age and other demographics, our contributions to the plans, earnings on plan assets and health care cost trends. Changes made to the provisions of the plans may also impact current and future OPEB costs. OPEB costs may also be significantly affected by changes in key actuarial assumptions, including anticipated rates of return on plan assets, mortality and the discount rates used in determining the OPEB and post-retirement costs. Our OPEB plan assets are primarily made up of equity and fixed income investments. Fluctuations in actual equity market returns, as well as changes in general interest rates, may result in increased or decreased other post-retirement costs in future periods. Similar to accounting for pension plans, our regulators have adopted accounting guidance for compensation related to retirement benefits for rate-making purposes.
| Wisconsin Electric Power Company | A-31 | 2014 Annual Financial Statements |
The following table reflects OPEB plan sensitivities associated with changes in certain actuarial assumptions by the indicated percentage. Each sensitivity reflects a change to the given assumption, holding all other assumptions constant.
OPEB Plan Actuarial Assumption | Impact on Annual Cost | |||
| (Millions of Dollars) | ||||
0.5% decrease in discount rate | $ | 0.6 | ||
0.5% decrease in health care cost trend rate in all future years | $ | (2.9 | ) | |
0.5% decrease in expected rate of return on plan assets | $ | 1.1 | ||
In October 2014, the Society of Actuaries released a new set of mortality tables (RP-2014) and an accompanying mortality improvement scale (MP-2014), which incorporates increasing life expectancy experience in the United States. Based on our initial review of the proposed tables, we believe our pension and OPEB obligations would increase by approximately 6% if we adopted these tables. We will continue to evaluate the mortality assumptions in the future, as necessary, to conform to our experience.
Unbilled Revenues: We record utility operating revenues when energy is delivered to our customers. However, the determination of energy sales to individual customers is based upon the reading of their meters, which occurs on a systematic basis throughout the month. At the end of each month, amounts of energy delivered to customers since the date of their last meter reading are estimated and corresponding unbilled revenues are calculated. This unbilled revenue is estimated each month based upon actual generation and throughput volumes, recorded sales, estimated customer usage by class, weather factors, estimated line losses and applicable customer rates. Significant fluctuations in energy demand for the unbilled period or changes in the composition of customer classes could impact the accuracy of the unbilled revenue estimate. Total operating revenues during 2014 of approximately $4.1 billion included accrued revenues of $223.1 million as of December 31, 2014.
QUANTITATIVE AND QUALITATIVE DISCLOSURES ABOUT MARKET RISK
See Management’s Discussion and Analysis of Financial Condition and Results of Operations - Factors Affecting Results, Liquidity and Capital Resources — Market Risks and Other Significant Risks in this report, as well as Note L — Derivative Instruments and Note M — Fair Value Measurements in the Notes to Consolidated Financial Statements, for information concerning potential market risks to which we are exposed.
| Wisconsin Electric Power Company | A-32 | 2014 Annual Financial Statements |
WISCONSIN ELECTRIC POWER COMPANY
CONSOLIDATED INCOME STATEMENTS
Year Ended December 31
| 2014 | 2013 | 2012 | ||||||||||
| (Millions of Dollars) | ||||||||||||
Operating Revenues | $ | 4,059.4 | $ | 3,800.2 | $ | 3,613.3 | ||||||
Operating Expenses | ||||||||||||
Fuel and purchased power | 1,228.1 | 1,158.1 | 1,103.8 | |||||||||
Cost of gas sold | 432.6 | 278.3 | 227.7 | |||||||||
Other operation and maintenance | 1,356.4 | 1,417.3 | 1,327.8 | |||||||||
Depreciation and amortization | 295.7 | 278.6 | 257.6 | |||||||||
Property and revenue taxes | 113.6 | 110.0 | 113.1 | |||||||||
|
|
|
|
|
| |||||||
Total Operating Expenses | 3,426.4 | 3,242.3 | 3,030.0 | |||||||||
Treasury Grant | 17.4 | 48.0 | — | |||||||||
|
|
|
|
|
| |||||||
Operating Income | 650.4 | 605.9 | 583.3 | |||||||||
Equity in Earnings of Transmission Affiliate | 57.9 | 60.2 | 57.6 | |||||||||
Other Income and Deductions, net | 8.7 | 17.4 | 32.3 | |||||||||
Interest Expense, net | 116.5 | 121.4 | 113.2 | |||||||||
|
|
|
|
|
| |||||||
Income Before Income Taxes | 600.5 | 562.1 | 560.0 | |||||||||
Income Tax Expense | 222.6 | 200.9 | 192.7 | |||||||||
|
|
|
|
|
| |||||||
Net Income | 377.9 | 361.2 | 367.3 | |||||||||
Preferred Stock Dividend Requirement | 1.2 | 1.2 | 1.2 | |||||||||
|
|
|
|
|
| |||||||
Earnings Available for Common Stockholder | $ | 376.7 | $ | 360.0 | $ | 366.1 | ||||||
|
|
|
|
|
| |||||||
The accompanying Notes to Consolidated Financial Statements are an integral part of these financial statements.
| Wisconsin Electric Power Company | A-33 | 2014 Annual Financial Statements |
WISCONSIN ELECTRIC POWER COMPANY
CONSOLIDATED BALANCE SHEETS
December 31
ASSETS
| 2014 | 2013 | |||||||
| (Millions of Dollars) | ||||||||
Property, Plant and Equipment | ||||||||
Electric | $ | 9,024.8 | $ | 8,717.0 | ||||
Gas | 1,025.4 | 977.4 | ||||||
Steam | 101.5 | 102.0 | ||||||
Common | 339.6 | 307.4 | ||||||
Other | 53.1 | 56.8 | ||||||
|
|
|
| |||||
| 10,544.4 | 10,160.6 | |||||||
Accumulated depreciation | (3,406.1 | ) | (3,258.8 | ) | ||||
|
|
|
| |||||
| 7,138.3 | 6,901.8 | |||||||
Construction work in progress | 140.9 | 101.9 | ||||||
Leased facilities, net | 2,215.0 | 2,279.0 | ||||||
|
|
|
| |||||
Net Property, Plant and Equipment | 9,494.2 | 9,282.7 | ||||||
Investments | ||||||||
Equity investment in transmission affiliate | 372.9 | 354.1 | ||||||
Other | 0.2 | 0.2 | ||||||
|
|
|
| |||||
Total Investments | 373.1 | 354.3 | ||||||
Current Assets | ||||||||
Cash and cash equivalents | 24.0 | 25.1 | ||||||
Accounts receivable, net of allowance for doubtful accounts of $46.8 and $39.7 | 265.3 | 335.7 | ||||||
Accounts receivable from related parties | 8.1 | 9.1 | ||||||
Accrued revenues | 223.1 | 240.7 | ||||||
Materials, supplies and inventories | 320.5 | 281.0 | ||||||
Current deferred tax asset, net | 46.7 | 75.8 | ||||||
Prepayments | 139.5 | 137.7 | ||||||
Other | 19.0 | 8.7 | ||||||
|
|
|
| |||||
Total Current Assets | 1,046.2 | 1,113.8 | ||||||
Deferred Charges and Other Assets | ||||||||
Regulatory assets | 1,626.9 | 1,370.3 | ||||||
Other | 106.3 | 164.5 | ||||||
|
|
|
| |||||
Total Deferred Charges and Other Assets | 1,733.2 | 1,534.8 | ||||||
|
|
|
| |||||
Total Assets | $ | 12,646.7 | $ | 12,285.6 | ||||
|
|
|
| |||||
The accompanying Notes to Consolidated Financial Statements are an integral part of these financial statements.
| Wisconsin Electric Power Company | A-34 | 2014 Annual Financial Statements |
WISCONSIN ELECTRIC POWER COMPANY
CONSOLIDATED BALANCE SHEETS
December 31
CAPITALIZATION AND LIABILITIES
| 2014 | 2013 | |||||||
| (Millions of Dollars) | ||||||||
Capitalization | ||||||||
Common equity | $ | 3,412.8 | $ | 3,406.8 | ||||
Preferred stock | 30.4 | 30.4 | ||||||
Long-term debt | 2,165.5 | 2,167.3 | ||||||
Capital lease obligations | 2,712.5 | 2,712.0 | ||||||
|
|
|
| |||||
Total Capitalization | 8,321.2 | 8,316.5 | ||||||
Current Liabilities | ||||||||
Long-term debt and capital lease obligations due currently | 355.6 | 379.5 | ||||||
Short-term debt | 306.8 | 174.5 | ||||||
Subsidiary note payable to Wisconsin Energy | 22.4 | 22.8 | ||||||
Accounts payable | 287.2 | 273.8 | ||||||
Accounts payable to related parties | 87.8 | 85.9 | ||||||
Accrued payroll and benefits | 87.1 | 89.3 | ||||||
Other | 113.7 | 132.3 | ||||||
|
|
|
| |||||
Total Current Liabilities | 1,260.6 | 1,158.1 | ||||||
Deferred Credits and Other Liabilities | ||||||||
Regulatory liabilities | 615.9 | 634.2 | ||||||
Deferred income taxes - long-term | 1,963.9 | 1,794.5 | ||||||
Pension and other benefit obligations | 254.5 | 160.1 | ||||||
Other | 230.6 | 222.2 | ||||||
|
|
|
| |||||
Total Deferred Credits and Other Liabilities | 3,064.9 | 2,811.0 | ||||||
Commitments and Contingencies (Note Q) | ||||||||
Total Capitalization and Liabilities | $ | 12,646.7 | $ | 12,285.6 | ||||
|
|
|
| |||||
The accompanying Notes to Consolidated Financial Statements are an integral part of these financial statements.
| Wisconsin Electric Power Company | A-35 | 2014 Annual Financial Statements |
WISCONSIN ELECTRIC POWER COMPANY
CONSOLIDATED STATEMENTS OF CASH FLOWS
Year Ended December 31
| 2014 | 2013 | 2012 | ||||||||||
| (Millions of Dollars) | ||||||||||||
Operating Activities | ||||||||||||
Net income | $ | 377.9 | $ | 361.2 | $ | 367.3 | ||||||
Reconciliation to cash | ||||||||||||
Depreciation and amortization | 303.4 | 288.3 | 263.6 | |||||||||
Deferred income taxes and investment tax credits, net | 191.4 | 193.6 | 194.1 | |||||||||
Contributions to qualified benefit plans | — | — | (92.9 | ) | ||||||||
Change in - Accounts receivable and accrued revenues | 91.0 | (137.0 | ) | 64.3 | ||||||||
Inventories | (39.5 | ) | 31.2 | 7.0 | ||||||||
Other current assets | (8.7 | ) | 0.7 | 6.9 | ||||||||
Accounts payable | 18.2 | (29.4 | ) | 41.4 | ||||||||
Accrued income taxes, net | (7.5 | ) | 23.6 | 89.4 | ||||||||
Deferred costs, net | (15.1 | ) | (8.7 | ) | 9.2 | |||||||
Other current liabilities | (21.7 | ) | 21.8 | (2.4 | ) | |||||||
Other, net | (26.6 | ) | 117.3 | (140.9 | ) | |||||||
|
|
|
|
|
| |||||||
Cash Provided by Operating Activities | 862.8 | 862.6 | 807.0 | |||||||||
Investing Activities | ||||||||||||
Capital expenditures | (540.9 | ) | (506.9 | ) | (575.8 | ) | ||||||
Investment in transmission affiliate | (11.5 | ) | (9.2 | ) | (13.8 | ) | ||||||
Change in restricted cash | — | 2.7 | 42.8 | |||||||||
Cost of removal, net of salvage | (20.9 | ) | (32.0 | ) | (32.9 | ) | ||||||
Other, net | 5.8 | (14.7 | ) | (25.9 | ) | |||||||
|
|
|
|
|
| |||||||
Cash Used in Investing Activities | (567.5 | ) | (560.1 | ) | (605.6 | ) | ||||||
Financing Activities | ||||||||||||
Dividends paid on common stock | (390.0 | ) | (340.0 | ) | (179.6 | ) | ||||||
Dividends paid on preferred stock | (1.2 | ) | (1.2 | ) | (1.2 | ) | ||||||
Issuance of long-term debt | 250.0 | 250.0 | 250.0 | |||||||||
Retirement of long-term debt | (300.0 | ) | (300.0 | ) | — | |||||||
Change in total short-term debt | 131.9 | 68.4 | (249.9 | ) | ||||||||
Other, net | 12.9 | 11.3 | 0.7 | |||||||||
|
|
|
|
|
| |||||||
Cash Used In Financing Activities | (296.4 | ) | (311.5 | ) | (180.0 | ) | ||||||
|
|
|
|
|
| |||||||
Change in Cash and Cash Equivalents | (1.1 | ) | (9.0 | ) | 21.4 | |||||||
Cash and Cash Equivalents at Beginning of Year | 25.1 | 34.1 | 12.7 | |||||||||
|
|
|
|
|
| |||||||
Cash and Cash Equivalents at End of Year | $ | 24.0 | $ | 25.1 | $ | 34.1 | ||||||
|
|
|
|
|
| |||||||
| Wisconsin Electric Power Company | A-36 | 2014 Annual Financial Statements |
WISCONSIN ELECTRIC POWER COMPANY
CONSOLIDATED STATEMENTS OF CAPITALIZATION
December 31
| 2014 | 2013 | |||||||||
| (Millions of Dollars) | ||||||||||
Common Equity (See Consolidated Statements of Common Equity) | ||||||||||
Common stock - $10 par value; authorized 65,000,000 shares; outstanding - 33,289,327 shares | $ | 332.9 | $ | 332.9 | ||||||
Other paid in capital | 984.4 | 965.1 | ||||||||
Retained earnings | 2,095.5 | 2,108.8 | ||||||||
|
|
|
| |||||||
Total Common Equity | 3,412.8 | 3,406.8 | ||||||||
Preferred Stock (Note I) | 30.4 | 30.4 | ||||||||
Long-Term Debt | ||||||||||
Debentures (unsecured) | 6.00% due 2014 | — | 300.0 | |||||||
6.25% due 2015 | 250.0 | 250.0 | ||||||||
1.70% due 2018 | 250.0 | 250.0 | ||||||||
4.25% due 2019 | 250.0 | 250.0 | ||||||||
2.95% due 2021 | 300.0 | 300.0 | ||||||||
6-1/2% due 2028 | 150.0 | 150.0 | ||||||||
5.625% due 2033 | 335.0 | 335.0 | ||||||||
5.70% due 2036 | 300.0 | 300.0 | ||||||||
3.65% due 2042 | 250.0 | 250.0 | ||||||||
4.25% due 2044 | 250.0 | — | ||||||||
6-7/8% due 2095 | 100.0 | 100.0 | ||||||||
Note (secured, nonrecourse) | 4.81% effective rate due 2030 | 2.0 | 2.0 | |||||||
Unamortized discount, net | (21.5 | ) | (19.7 | ) | ||||||
Long-term debt due currently | (250.0 | ) | (300.0 | ) | ||||||
|
|
|
| |||||||
Total Long-Term Debt | 2,165.5 | 2,167.3 | ||||||||
Obligations Under Capital Leases (see Note J) | 2,712.5 | 2,712.0 | ||||||||
|
|
|
| |||||||
Total Long-Term Capitalization | $ | 8,321.2 | $ | 8,316.5 | ||||||
|
|
|
| |||||||
The accompanying Notes to Consolidated Financial Statements are an integral part of these financial statements.
| Wisconsin Electric Power Company | A-37 | 2014 Annual Financial Statements |
WISCONSIN ELECTRIC POWER COMPANY
CONSOLIDATED STATEMENTS OF COMMON EQUITY
| Common Stock | Other Paid In Capital | Retained Earnings | Total | |||||||||||||
| (Millions of Dollars) | ||||||||||||||||
Balance - December 31, 2011 | $ | 332.9 | $ | 941.9 | $ | 1,902.3 | $ | 3,177.1 | ||||||||
Net income | 367.3 | 367.3 | ||||||||||||||
Cash dividends | ||||||||||||||||
Common stock | (179.6 | ) | (179.6 | ) | ||||||||||||
Preferred stock | (1.2 | ) | (1.2 | ) | ||||||||||||
Stock-based compensation | 2.8 | 2.8 | ||||||||||||||
Tax benefit of exercised stock options allocated from Parent | — | — | ||||||||||||||
|
|
|
|
|
|
|
| |||||||||
Balance - December 31, 2012 | 332.9 | 944.7 | 2,088.8 | 3,366.4 | ||||||||||||
Net income | 361.2 | 361.2 | ||||||||||||||
Cash dividends | ||||||||||||||||
Common stock | (340.0 | ) | (340.0 | ) | ||||||||||||
Preferred stock | (1.2 | ) | (1.2 | ) | ||||||||||||
Stock-based compensation | 3.7 | 3.7 | ||||||||||||||
Tax benefit of exercised stock options allocated from Parent | 16.7 | 16.7 | ||||||||||||||
|
|
|
|
|
|
|
| |||||||||
Balance - December 31, 2013 | 332.9 | 965.1 | 2,108.8 | 3,406.8 | ||||||||||||
Net income | 377.9 | 377.9 | ||||||||||||||
Cash dividends | ||||||||||||||||
Common stock | (390.0 | ) | (390.0 | ) | ||||||||||||
Preferred stock | (1.2 | ) | (1.2 | ) | ||||||||||||
Stock-based compensation | 3.5 | 3.5 | ||||||||||||||
Tax benefit of exercised stock options allocated from Parent | 15.8 | 15.8 | ||||||||||||||
|
|
|
|
|
|
|
| |||||||||
Balance - December 31, 2014 | $ | 332.9 | $ | 984.4 | $ | 2,095.5 | $ | 3,412.8 | ||||||||
|
|
|
|
|
|
|
| |||||||||
The accompanying Notes to Consolidated Financial Statements are an integral part of these financial statements.
| Wisconsin Electric Power Company | A-38 | 2014 Annual Financial Statements |
WISCONSIN ELECTRIC POWER COMPANY
NOTES TO CONSOLIDATED FINANCIAL STATEMENTS
A — SUMMARY OF SIGNIFICANT ACCOUNTING POLICIES
General: Wisconsin Electric Power Company (Wisconsin Electric, the Company, our, us or we), a subsidiary of Wisconsin Energy, is an electric, gas and steam utility which services electric customers in Wisconsin and the Upper Peninsula of Michigan, gas customers in Wisconsin and steam customers in metropolitan Milwaukee, Wisconsin. We consolidate our wholly-owned subsidiary, Bostco. Bostco had total assets of $28.4 million and $29.1 million as of December 31, 2014 and 2013, respectively.
All intercompany transactions and balances have been eliminated from the consolidated financial statements.
The preparation of financial statements in conformity with accounting principles generally accepted in the United States of America requires management to make estimates and assumptions that affect the reported amounts of certain assets and liabilities and disclosure of contingent assets and liabilities at the date of financial statements and the reported amounts of revenues and expenses during the reporting period. Actual results could differ from those estimates.
Revenues: We recognize energy revenues on the accrual basis and include estimated amounts for services rendered but not billed.
Our retail electric rates in Wisconsin are established by the PSCW and include base amounts for fuel and purchased power costs. The electric fuel rules in Wisconsin allow us to defer, for subsequent rate recovery or refund, any under-collection or over-collection of fuel costs that are outside of the symmetrical fuel cost tolerance, which the PSCW set at plus or minus 2% of the approved fuel cost plan. The deferred under-collected amounts are subject to an excess revenues test.
Our retail gas rates include monthly adjustments which permit the recovery or refund of actual purchased gas costs. We defer any difference between actual gas costs incurred (adjusted for a sharing mechanism) and costs recovered through rates as a current asset or liability. The deferred balance is returned to or recovered from customers at intervals throughout the year.
Accounting for MISO Energy Transactions: The MISO Energy Markets operate under both day-ahead and real-time markets. We record energy transactions in the MISO Energy Markets on a net basis for each hour.
Other Income and Deductions, Net: We recorded the following items in Other Income and Deductions, net for the years ended December 31:
Other Income and Deductions, net | 2014 | 2013 | 2012 | |||||||||
| (Millions of Dollars) | ||||||||||||
AFUDC - Equity | $ | 4.4 | $ | 17.6 | $ | 34.9 | ||||||
Gain on Property Sales | 4.3 | 0.8 | 0.3 | |||||||||
Other, net | — | (1.0 | ) | (2.9 | ) | |||||||
|
|
|
|
|
| |||||||
Total Other Income and Deductions, net | $ | 8.7 | $ | 17.4 | $ | 32.3 | ||||||
|
|
|
|
|
| |||||||
Property and Depreciation: We record property, plant and equipment at cost. Cost includes material, labor, overheads and capitalized interest. Utility property also includes AFUDC - Equity. Additions to and significant replacements of property are charged to property, plant and equipment at cost; minor items are charged to maintenance expense. The cost of depreciable utility property less salvage value is charged to accumulated depreciation when property is retired.
Our utility depreciation rates are certified by the PSCW and MPSC and include estimates for salvage value and removal costs. Depreciation as a percent of average depreciable utility plant was 2.9% in 2014, 2013 and 2012.
For assets other than our regulated assets and leased equipment, we accrue depreciation expense at straight-line rates over the estimated useful lives of the assets, or over the non-cancellable lease term for leased equipment.
| Wisconsin Electric Power Company | A-39 | 2014 Annual Financial Statements |
We collect in our rates amounts representing future removal costs for many assets that do not have an associated Asset Retirement Obligation (ARO). We record a regulatory liability on our balance sheet for the estimated amounts we have collected in rates for future removal costs less amounts we have spent in removal activities. This regulatory liability was $571.2 million as of December 31, 2014 and $558.9 million as of December 31, 2013.
Allowance For Funds Used During Construction: AFUDC is included in utility plant accounts and represents the cost of borrowed funds (AFUDC - Debt) used during plant construction, and a return on stockholders’ capital (AFUDC - Equity) used for construction purposes. AFUDC - Debt is recorded as a reduction of interest expense and AFUDC - Equity is recorded in Other Income and Deductions, net.
We recorded the following AFUDC for the years ended December 31:
| 2014 | 2013 | 2012 | ||||||||||
| (Millions of Dollars) | ||||||||||||
AFUDC - Debt | $ | 1.8 | $ | 7.4 | $ | 14.5 | ||||||
AFUDC - Equity | $ | 4.4 | $ | 17.6 | $ | 34.9 | ||||||
Materials, Supplies and Inventories: Our inventory as of December 31 consists of:
Materials, Supplies and Inventories | 2014 | 2013 | ||||||
| (Millions of Dollars) | ||||||||
Fossil Fuel | $ | 125.5 | $ | 117.5 | ||||
Materials and Supplies | 145.0 | 129.5 | ||||||
Natural Gas in Storage | 50.0 | 34.0 | ||||||
|
|
|
| |||||
Total | $ | 320.5 | $ | 281.0 | ||||
|
|
|
| |||||
Substantially all fossil fuel, materials and supplies and natural gas in storage inventories are recorded using the weighted-average cost method of accounting.
Regulatory Accounting: The economic effects of regulation can result in regulated companies recording costs that have been or are expected to be allowed in the rate-making process in a period different from the period in which the costs would be charged to expense by an unregulated enterprise. When this occurs, costs are deferred as regulatory assets on the balance sheet and expensed in the periods when they are reflected in rates. We defer regulatory assets pursuant to specific or generic orders issued by our regulators. Additionally, regulators can impose regulatory liabilities upon a regulated company for amounts previously collected from customers and for amounts that are expected to be refunded to customers. In general, regulatory assets are recovered in a period between one to eight years. For further information, see Note C.
Asset Retirement Obligations: We record a liability for a legal ARO in the period in which it is incurred. When a new legal obligation is recorded, we capitalize the costs of the liability by increasing the carrying amount of the related long-lived asset. We accrete the liability to its present value each period and depreciate the capitalized cost over the useful life of the related asset. At the end of the asset’s useful life, we settle the obligation for its recorded amount or incur a gain or loss. As it relates to our regulated operations, we apply regulatory accounting guidance and recognize regulatory assets or liabilities for the timing differences between when we recover legal AROs in rates and when we would recognize these costs. For further information, see Note E.
Derivative Financial Instruments: We have derivative physical and financial instruments which we report at fair value. For further information, see Note L.
Cash and Cash Equivalents: Cash and cash equivalents include marketable debt securities acquired three months or less from maturity.
Margin Accounts: Cash deposited in brokerage accounts for margin requirements is recorded in Other Current Assets on our Consolidated Balance Sheets.
| Wisconsin Electric Power Company | A-40 | 2014 Annual Financial Statements |
Restrictions: Various financing arrangements and regulatory requirements impose certain restrictions on our ability to transfer funds to Wisconsin Energy in the form of cash dividends, loans or advances. In addition, under Wisconsin law, we are prohibited from loaning funds, either directly or indirectly, to Wisconsin Energy. We do not believe that these restrictions will materially affect our operations. For further information, see Note H.
Impairment or Disposal of Long Lived Assets: We carry property and equipment related to businesses held for sale at the lower of cost or estimated fair value less cost to sell. As of December 31, 2014, we had no assets classified as Held for Sale. Long-lived assets are tested for recoverability whenever events or changes in circumstances indicate that their carrying value may not be recoverable from the use and eventual disposition of the asset based on the remaining useful life. An impairment loss is recognized when the carrying amount of an asset is not recoverable and exceeds the fair value of the asset. The carrying amount of an asset is not recoverable if it exceeds the sum of the undiscounted cash flows expected to result from the use and eventual disposition of the asset. An impairment loss is measured as the excess of the carrying amount of the asset in comparison to the fair value of the asset.
Investments: We account for investments in other affiliated companies in which we do not maintain control using the equity method of accounting. We had a total ownership interest of approximately 23.0% in ATC as of December 31, 2014 and 2013. We are represented by one out of ten ATC board members, each of whom has one vote. Due to the voting requirements, no individual member has more than 10% of the voting control. For further information regarding such investments, see Note P.
Income Taxes: We follow the liability method in accounting for income taxes. Accounting guidance for income taxes requires the recording of deferred assets and liabilities to recognize the expected future tax consequences of events that have been reflected in our financial statements or tax returns and the adjustment of deferred tax balances to reflect tax rate changes. We are required to assess the likelihood that our deferred tax assets would expire before being realized.
Investment tax credits related to regulated utility assets are recorded as a deferred credit on the balance sheet and amortized to income over the applicable service lives of related properties in accordance with regulatory treatment.
We are included in Wisconsin Energy’s consolidated Federal and state income tax returns. In accordance with our tax allocation agreement with Wisconsin Energy, we are allocated income tax payments and refunds based upon our separate tax computation. For further information on income taxes, see Note G.
Wisconsin Energy allocates the tax benefit of exercised stock options to us to the extent the option holder’s payroll cost was incurred by us. We record the allocated tax benefit as an addition to paid in capital.
We recognize interest and penalties accrued related to unrecognized tax benefits in Income Taxes in our Consolidated Income Statements, as well as Regulatory Assets or Regulatory Liabilities in our Consolidated Balance Sheets.
We collect sales and use taxes from our customers and remit these taxes to governmental authorities. These taxes are recorded in our Consolidated Income Statements on a net basis.
Stock Options: Our employees participate in the Wisconsin Energy stock-based compensation plan. The amounts reported represent the allocated costs related to options held by our employees.
Wisconsin Energy estimates the fair value of stock options using the binomial pricing model. Historically, all stock options have been granted with an exercise price equal to the fair market value of the common stock on the date of grant and expire no later than 10 years from the grant date. Excess tax benefits are reported as a financing cash inflow. In addition, Wisconsin Energy reports unearned stock-based compensation associated with non-vested restricted stock and performance awards within other paid in capital in its Consolidated Statements of Common Equity. For a discussion of the impacts to our Consolidated Financial Statements, see Note H.
| Wisconsin Electric Power Company | A-41 | 2014 Annual Financial Statements |
The fair value of each Wisconsin Energy option was calculated using a binomial option pricing model using the following weighted-average assumptions:
| 2014 | 2013 | 2012 | ||||
Risk-free interest rate | 0.1% - 3.0% | 0.1% - 1.9% | 0.1% - 2.0% | |||
Dividend yield | 3.8% | 3.7% | 3.9% | |||
Expected volatility | 18.0% | 18.0% | 19.0% | |||
Expected life (years) | 5.8 | 5.9 | 5.9 | |||
Expected forfeiture rate | 2.0% | 2.0% | 2.0% | |||
Weighted-average fair value of stock options granted | $4.18 | $3.45 | $3.34 |
Treasury Grant: In December 2013, we filed an application with the United States Treasury for a Section 1603 renewable energy grant related to the construction of our biomass facility in Rothschild, Wisconsin. The PSCW anticipated the recognition of this grant as income when it set rates for the two years beginning January 1, 2013. We provided bill credits to our customers in 2013 and 2014. For the years ended December 31, 2014 and 2013, $17.4 million and $48.0 million, respectively, was recognized as income, which reflects the amount that was returned to customers in the form of bill credits during the year. The accounting reflects the regulatory treatment of the grant.
In June 2014, we received approximately $76.2 million related to the Treasury Grant. The PSCW approved escrow accounting for the Treasury Grant and the proceeds we received that exceeded the amounts originally included in rates are being returned to customers in the form of bill credits.
B — RECENT ACCOUNTING PRONOUNCEMENTS
Revenue Recognition:In May 2014, the Financial Accounting Standards Board and the International Accounting Standards Board issued their joint revenue recognition standard Accounting Standards Update 2014-09, Revenue from Contracts with Customers. This guidance is effective for fiscal years and interim periods beginning after December 15, 2016, and can either be applied retrospectively or as a cumulative-effect adjustment as of the date of adoption. We are currently assessing the effects this guidance may have on our consolidated financial statements.
C — REGULATORY ASSETS AND LIABILITIES
Our primary regulator, the PSCW, considers our regulatory assets and liabilities in two categories, escrowed and deferred. In escrow accounting we expense amounts that are included in rates. If actual costs exceed or are less than the amounts that are allowed in rates, the difference in cost is escrowed on the balance sheet as a regulatory asset or regulatory liability and the escrowed balance is considered in setting future rates. Under deferred cost accounting, we defer amounts to our balance sheet based upon orders or correspondence with our regulators. These deferred costs will be considered in future rate setting proceedings. As of December 31, 2014, we had $11.7 million of regulatory assets not earning a return and $115.1 million of regulatory assets earning a return based on short-term interest rates.
In December 2014, the PSCW issued a rate order effective January 1, 2015 that, among other things, reaffirmed our accounting for the regulatory assets and liabilities identified below.
| Wisconsin Electric Power Company | A-42 | 2014 Annual Financial Statements |
Our regulatory assets and liabilities as of December 31 consist of:
| 2014 | 2013 | |||||||
| (Millions of Dollars) | ||||||||
Regulatory Assets | ||||||||
Deferred plant related — capital leases | $ | 603.0 | $ | 512.5 | ||||
Deferred unrecognized pension costs | 482.8 | 393.0 | ||||||
Deferred income tax related | 171.5 | 165.8 | ||||||
Escrowed electric transmission costs | 146.0 | 126.8 | ||||||
Other, net | 223.6 | 172.2 | ||||||
|
|
|
| |||||
Total regulatory assets | $ | 1,626.9 | $ | 1,370.3 | ||||
|
|
|
| |||||
Regulatory Liabilities | ||||||||
Deferred cost of removal obligations | $ | 571.2 | $ | 558.9 | ||||
Other, net | 44.7 | 75.3 | ||||||
|
|
|
| |||||
Total regulatory liabilities | $ | 615.9 | $ | 634.2 | ||||
|
|
|
| |||||
Our rates allow us to recover and expense capital lease payments as they are due. We defer as a regulatory asset the difference between the capital lease expense recovered in rates and the expense that would result from the amortization of the leased asset and the imputed interest expense.
D — PROPOSED ACQUISITION OF INTEGRYS BY WISCONSIN ENERGY
On June 22, 2014, our parent company, Wisconsin Energy, entered into an agreement and plan of merger (Merger Agreement) under which it will acquire Integrys Energy Group (Integrys). Integrys’ shareholders will receive 1.128 shares of Wisconsin Energy common stock and $18.58 in cash per Integrys share of common stock. We expect Wisconsin Energy to finance the acquisition through the issuance of approximately 91 million shares of Wisconsin Energy common stock to Integrys shareholders and through the issuance of approximately $1.5 billion of debt. Wisconsin Energy will also assume all of Integrys’ outstanding debt. The combined company will be named WEC Energy Group, Inc.
The acquisition is subject to several conditions, including, among others, approval of the shareholders of both Wisconsin Energy and Integrys, the expiration or termination of the waiting period under the Hart-Scott-Rodino Antitrust Improvements Act of 1976 (HSR Act), and the receipt of approvals from various government agencies, including the FERC, Federal Communications Commission, PSCW, Illinois Commerce Commission, MPSC and Minnesota Public Utilities Commission. The status of these matters as of December 31, 2014 is as follows:
| • | On August 6, 2014, Wisconsin Energy filed applications for approval with the PSCW, Illinois Commerce Commission, MPSC and Minnesota Public Utilities Commission. |
| • | On August 15, 2014, Wisconsin Energy filed an application with the FERC. The initial public comment period closed on October 17, 2014. Wisconsin Energy subsequently submitted additional information to respond to FERC questions on December 18, 2014. That comment period is now closed. |
| • | On September 24, 2014, Wisconsin Energy submitted its HSR Act filings, and on October 24, 2014, the United States Department of Justice closed its review of the transaction with no further action required. In addition, on October 24, 2014, the Federal Trade Commission granted early termination of the 30-day waiting period required by the HSR Act. |
| • | On November 21, 2014, the shareholders of Wisconsin Energy voted to approve the issuance of common stock as contemplated by the Merger Agreement, as well as to amend the restated articles of incorporation to change the name of Wisconsin Energy from Wisconsin Energy Corporation to WEC Energy Group, Inc. The shareholders of Integrys approved the adoption of the Merger Agreement at its shareholder meeting held on November 21, 2014. |
Wisconsin Energy anticipates the transaction closing in the second half of 2015.
| Wisconsin Electric Power Company | A-43 | 2014 Annual Financial Statements |
E — ASSET RETIREMENT OBLIGATIONS
AROs have been recorded for asbestos abatement at certain generation and substation facilities, and for obligations associated with the removal and dismantlement of generation facilities. AROs are recorded in other long-term liabilities on the Consolidated Balance Sheets. The following table presents the change in our AROs during 2014 and 2013:
| 2014 | 2013 | |||||||
| (Millions of Dollars) | ||||||||
Balance as of January 1 | $ | 39.4 | $ | 41.5 | ||||
Liabilities Settled | (1.1 | ) | (4.3 | ) | ||||
Accretion | 2.2 | 2.2 | ||||||
|
|
|
| |||||
Balance as of December 31 | $ | 40.5 | $ | 39.4 | ||||
|
|
|
| |||||
F — VARIABLE INTEREST ENTITIES
The primary beneficiary of a variable interest entity must consolidate the related assets and liabilities. Certain disclosures are required by sponsors, significant interest holders in variable interest entities and potential variable interest entities.
We assess our relationships with potential variable interest entities such as our coal suppliers, natural gas suppliers, coal and gas transporters, and other counterparties in power purchase agreements and joint ventures. In making this assessment, we consider the potential that our contracts or other arrangements provide subordinated financial support, the potential for us to absorb losses or rights to residual returns of the entity, the ability to directly or indirectly make decisions about the entities’ activities and other factors.
We have identified a purchased power agreement which represents a variable interest. This agreement is for 236 MW of firm capacity from a gas-fired cogeneration facility and we account for it as a capital lease. The agreement includes no minimum energy requirements over the remaining term of approximately eight years. We have examined the risks of the entity including operations and maintenance, dispatch, financing, fuel costs and other factors, and have determined that we are not the primary beneficiary of the entity. We do not hold an equity or debt interest in the entity and there is no residual guarantee associated with the purchased power agreement.
We have approximately $174.0 million of required payments over the remaining term of this agreement. We believe that the required lease payments under this contract will continue to be recoverable in rates. Total capacity and lease payments under contracts considered variable interests in 2014, 2013 and 2012 were $53.0 million, $50.3 million and $45.8 million, respectively. Our maximum exposure to loss is limited to the capacity payments under the contract.
G — INCOME TAXES
The following table is a summary of income tax expense for each of the years ended December 31:
Income Taxes | 2014 | 2013 | 2012 | |||||||||
| (Millions of Dollars) | ||||||||||||
Current tax expense (benefit) | $ | 31.2 | $ | 7.3 | $ | (1.4 | ) | |||||
Deferred income taxes, net | 192.5 | 194.7 | 195.2 | |||||||||
Investment tax credit, net | (1.1 | ) | (1.1 | ) | (1.1 | ) | ||||||
|
|
|
|
|
| |||||||
Total Income Tax Expense | $ | 222.6 | $ | 200.9 | $ | 192.7 | ||||||
|
|
|
|
|
| |||||||
| Wisconsin Electric Power Company | A-44 | 2014 Annual Financial Statements |
The provision for income taxes for each of the years ended December 31 differs from the amount of income tax determined by applying the applicable U.S. statutory federal income tax rate to income before income taxes and preferred dividend as a result of the following:
| 2014 | 2013 | 2012 | ||||||||||||||||||||||
Income Tax Expense | Amount | Effective Tax Rate | Amount | Effective Tax Rate | Amount | Effective Tax Rate | ||||||||||||||||||
| (Millions of Dollars) | ||||||||||||||||||||||||
Expected tax at statutory federal tax rates | $ | 209.8 | 35.0 | % | $ | 196.3 | 35.0 | % | $ | 195.6 | 35.0 | % | ||||||||||||
State income taxes net of federal tax benefit | 33.0 | 5.5 | % | 31.7 | 5.6 | % | 28.8 | 5.1 | % | |||||||||||||||
Production tax credits | (17.4 | ) | (2.9 | )% | (16.7 | ) | (3.0 | )% | (15.9 | ) | (2.8 | )% | ||||||||||||
Treasury Grant | (3.8 | ) | (0.6 | )% | (7.4 | ) | (1.3 | )% | — | — | % | |||||||||||||
AFUDC - Equity | (1.5 | ) | (0.2 | )% | (6.1 | ) | (1.1 | )% | (12.2 | ) | (2.2 | )% | ||||||||||||
Investment tax credit restored | (1.1 | ) | (0.2 | )% | (1.1 | ) | (0.2 | )% | (1.1 | ) | (0.2 | )% | ||||||||||||
Domestic production activities deduction | — | — | % | — | — | % | (12.6 | ) | (2.3 | )% | ||||||||||||||
Other, net | 3.6 | 0.5 | % | 4.2 | 0.7 | % | 10.1 | 1.8 | % | |||||||||||||||
|
|
|
|
|
|
|
|
|
|
|
| |||||||||||||
Total Income Tax Expense | $ | 222.6 | 37.1 | % | $ | 200.9 | 35.7 | % | $ | 192.7 | 34.4 | % | ||||||||||||
|
|
|
|
|
|
|
|
|
|
|
| |||||||||||||
The components of deferred income taxes classified as net current assets and net long-term liabilities as of December 31 are as follows:
Deferred Tax Assets | 2014 | 2013 | ||||||
| (Millions of Dollars) | ||||||||
Current | ||||||||
Future federal tax benefits | $ | 56.0 | $ | 113.1 | ||||
Uncollectible account expense | 15.6 | 17.2 | ||||||
Employee benefits and compensation | 11.6 | 11.7 | ||||||
Recoverable gas costs | 1.0 | 0.5 | ||||||
Other | 2.3 | 3.3 | ||||||
|
|
|
| |||||
Total Current Deferred Tax Assets | 86.5 | 145.8 | ||||||
Non-current | ||||||||
Deferred revenues | 221.3 | 237.0 | ||||||
Employee benefits and compensation | 92.1 | 92.4 | ||||||
Construction advances | 15.5 | 15.0 | ||||||
Emission Allowances | 0.1 | — | ||||||
Other | 31.7 | 42.2 | ||||||
|
|
|
| |||||
Total Non-Current Deferred Tax Assets | 360.7 | 386.6 | ||||||
|
|
|
| |||||
Total Deferred Tax Assets | $ | 447.2 | $ | 532.4 | ||||
|
|
|
| |||||
| Wisconsin Electric Power Company | A-45 | 2014 Annual Financial Statements |
Deferred Tax Liabilities | 2014 | 2013 | ||||||
| (Millions of Dollars) | ||||||||
Current | ||||||||
Prepaid items | $ | 39.8 | $ | 70.0 | ||||
|
|
|
| |||||
Total Current Deferred Tax Liabilities | 39.8 | 70.0 | ||||||
Non-current | ||||||||
Property-related | 1,942.2 | 1,820.9 | ||||||
Investment in transmission affiliate | 164.1 | 147.8 | ||||||
Employee benefits and compensation | 131.2 | 135.0 | ||||||
Deferred transmission costs | 58.5 | 50.8 | ||||||
Other | 28.6 | 26.6 | ||||||
|
|
|
| |||||
Total Non-current Deferred Tax Liabilities | 2,324.6 | 2,181.1 | ||||||
|
|
|
| |||||
Total Deferred Tax Liabilities | $ | 2,364.4 | $ | 2,251.1 | ||||
|
|
|
| |||||
Consolidated Balance Sheet Presentation | 2014 | 2013 | ||||||
Current Deferred Tax Asset | $ | 46.7 | $ | 75.8 | ||||
Non-Current Deferred Tax Liability | $ | 1,963.9 | $ | 1,794.5 | ||||
Consistent with rate-making treatment, deferred taxes are offset in the above table for temporary differences which have related regulatory assets or liabilities.
As of December 31, 2014, we had approximately $3.9 million and $54.6 million of net operating loss and tax credit carryforwards resulting in deferred tax assets of approximately $1.4 million and $54.6 million, respectively. As of December 31, 2013, we had approximately $216.8 million and $37.2 million of net operating loss and tax credit carryforwards resulting in deferred tax assets of approximately $75.9 million and $37.2 million, respectively. These net operating loss carryforwards begin to expire in 2030. We anticipate that we will have future taxable income sufficient to utilize these deferred tax assets.
We previously adopted accounting guidance related to uncertainty in income taxes. A reconciliation of the beginning and ending amount of unrecognized tax benefits is as follows:
| 2014 | 2013 | |||||||
| (Millions of Dollars) | ||||||||
Balance as of January 1 | $ | 8.4 | $ | 10.8 | ||||
Reductions for tax positions of prior years | (1.2 | ) | (2.4 | ) | ||||
|
|
|
| |||||
Balance as of December 31 | $ | 7.2 | $ | 8.4 | ||||
|
|
|
| |||||
The amount of unrecognized tax benefits as of December 31, 2014 and 2013 excludes deferred tax assets related to uncertainty in income taxes of $7.2 million and $8.4 million, respectively. As of December 31, 2014 and 2013, there were no unrecognized tax benefits that, if recognized, would impact the effective tax rate for continuing operations.
We recognize interest and penalties accrued related to unrecognized tax benefits as a component of income tax expense. For the years ended December 31, 2014, 2013 and 2012, we recognized approximately $0.3 million, $0.2 million and $0.2 million, respectively, of accrued interest in the Consolidated Income Statements. For the years ended December 31, 2014, 2013 and 2012, we recognized no penalties in the Consolidated Income Statements. We had approximately $0.7 million and $0.4 million of interest accrued and no penalties accrued on the Consolidated Balance Sheets as of December 31, 2014 and 2013, respectively.
We do not anticipate any significant increases or decreases in the total amounts of unrecognized tax benefits within the next 12 months.
Our primary tax jurisdictions include the United States and the state of Wisconsin. Currently, the tax years of 2011 through 2014 are subject to Federal examination, and the tax years 2010 through 2014 are subject to examination by the state of Wisconsin.
| Wisconsin Electric Power Company | A-46 | 2014 Annual Financial Statements |
H — COMMON EQUITY
Share-Based Compensation Plans: Our employees participate in a plan approved by Wisconsin Energy stockholders that provides a long-term incentive through equity interests in Wisconsin Energy to outside directors, selected officers and key employees of Wisconsin Energy and its subsidiaries. The plan provides for the granting of Wisconsin Energy stock options, stock appreciation rights, restricted stock awards and performance shares. Awards may be paid in Wisconsin Energy common stock, cash or a combination thereof. We utilize the straight-line attribution method for recognizing share-based compensation expense. Accordingly, for employee awards, equity classified share-based compensation cost is measured at the grant date based on the fair value of the award and is recognized as expense over the requisite service period. There were no modifications to the terms of outstanding Wisconsin Energy stock options held by our employees during the period.
The following table summarizes recorded pre-tax share-based compensation expense and the related tax benefit for Wisconsin Energy share-based awards made to our employees during the years ended December 31:
| 2014 | 2013 | 2012 | ||||||||||
| (Millions of Dollars) | ||||||||||||
Performance units | $ | 12.7 | $ | 11.9 | $ | 14.2 | ||||||
Stock options | 3.6 | 3.8 | 2.6 | |||||||||
Restricted stock | 2.1 | 1.6 | 2.0 | |||||||||
|
|
|
|
|
| |||||||
Share-based compensation expense | $ | 18.4 | $ | 17.3 | $ | 18.8 | ||||||
|
|
|
|
|
| |||||||
Related Tax Benefit | $ | 7.4 | $ | 6.9 | $ | 7.5 | ||||||
|
|
|
|
|
| |||||||
Stock Options: The exercise price of a Wisconsin Energy stock option under the plan is to be no less than 100% of the common stock’s fair market value on the grant date and options may not be exercised within six months of the grant date except in the event of a change in control. Option grants consist of non-qualified stock options that vest on a cliff-basis after a three year period. Options expire no later than 10 years from the date of grant. For further information regarding stock-based compensation and the valuation of Wisconsin Energy stock options, see Note A.
The following is a summary of Wisconsin Energy stock option activity by our employees during 2014:
Stock Options | Number of Options | Weighted- Average Exercise Price | Weighted-Average Remaining Contractual Life (Years) | Aggregate Intrinsic Value (Millions) | ||||||||||||
Outstanding as of January 1, 2014 | 7,688,843 | $ | 26.92 | |||||||||||||
Granted | 864,860 | $ | 41.03 | |||||||||||||
Exercised | (2,086,231 | ) | $ | 22.95 | ||||||||||||
Forfeited | (17,195 | ) | $ | 37.42 | ||||||||||||
|
| |||||||||||||||
Outstanding as of December 31, 2014 | 6,450,277 | $ | 30.07 | 5.7 | $ | 146.2 | ||||||||||
|
| |||||||||||||||
Exercisable as of December 31, 2014 | 3,682,442 | $ | 24.14 | 3.9 | $ | 105.3 | ||||||||||
|
| |||||||||||||||
We expect that substantially all of the outstanding options as of December 31, 2014 will be exercised.
In January 2015, the Compensation Committee of the Board of Directors of Wisconsin Energy (Compensation Committee) awarded 495,550 Wisconsin Energy non-qualified stock options with an exercise price of $52.895 to our officers and other key employees under its normal schedule of awarding long-term incentive compensation.
The intrinsic value of Wisconsin Energy options exercised during the years ended December 31, 2014, 2013 and 2012 was $47.5 million, $41.2 million and $42.9 million, respectively. Cash received by Wisconsin Energy from exercises of its options by our employees was $47.9 million, $45.5 million and $45.4 million during the years ended December 31, 2014, 2013 and 2012, respectively. The actual tax benefit realized for the tax deductions from option exercises for the same periods was approximately $18.8 million, $16.6 million and zero, respectively.
| Wisconsin Electric Power Company | A-47 | 2014 Annual Financial Statements |
The following table summarizes information about Wisconsin Energy stock options held by our employees and outstanding as of December 31, 2014:
| Options Outstanding | Options Exercisable | |||||||||||||||||||||||
| Weighted-Average | Weighted-Average | |||||||||||||||||||||||
Range of Exercise Prices | Number of Options | Exercise Price | Remaining Contractual Life (Years) | Number of Options | Exercise Price | Remaining Contractual Life (Years) | ||||||||||||||||||
$17.10 to $21.11 | 1,411,769 | $ | 20.88 | 3.6 | 1,411,769 | $ | 20.88 | 3.6 | ||||||||||||||||
$23.88 to $29.35 | 2,038,633 | $ | 25.07 | 3.7 | 2,038,633 | $ | 25.07 | 3.7 | ||||||||||||||||
$34.88 to $41.03 | 2,999,875 | $ | 37.79 | 8.0 | 232,040 | $ | 35.86 | 7.4 | ||||||||||||||||
|
|
|
| |||||||||||||||||||||
| 6,450,277 | $ | 30.07 | 5.7 | 3,682,442 | $ | 24.14 | 3.9 | |||||||||||||||||
|
|
|
| |||||||||||||||||||||
The following table summarizes information about non-vested Wisconsin Energy options held by our employees during 2014:
Non-Vested Stock Options | Number of Options | Weighted- Average Fair Value | ||||||
Non-Vested as of January 1, 2014 | 2,289,400 | $ | 3.38 | |||||
Granted | 864,860 | $ | 4.18 | |||||
Vested | (369,230 | ) | $ | 3.26 | ||||
Forfeited | (17,195 | ) | $ | 3.56 | ||||
|
| |||||||
Non-Vested as of December 31, 2014 | 2,767,835 | $ | 3.65 | |||||
|
| |||||||
As of December 31, 2014, total compensation costs related to non-vested Wisconsin Energy stock options held by our employees and not yet recognized was approximately $2.0 million, which is expected to be recognized over the next 19 months on a weighted-average basis.
Restricted Shares: The Compensation Committee has also approved grants of Wisconsin Energy restricted stock to certain of our key employees. The following restricted stock activity related to our employees occurred during 2014:
Restricted Shares | Number of Shares | Weighted- Average Market Price | ||||||
Outstanding as of January 1, 2014 | 98,226 | |||||||
Granted | 51,873 | $ | 40.98 | |||||
Released | (46,228 | ) | $ | 34.31 | ||||
Forfeited | (3,214 | ) | $ | 38.47 | ||||
|
| |||||||
Outstanding as of December 31, 2014 | 100,657 | |||||||
|
| |||||||
In January 2015, the Compensation Committee awarded 43,212 restricted shares to our officers and other key employees under its normal schedule of awarding long-term incentive compensation. These awards have a three-year vesting period, and one-third of the award vests on each anniversary of the grant date. During the vesting period, restricted share recipients also have voting rights and are entitled to dividends in the same manner as other shareholders.
Wisconsin Energy records the market value of the restricted stock awards on the date of grant. We then amortize our share of allocated expense over the vesting period of the awards. The intrinsic value of Wisconsin Energy restricted stock vesting and held by our employees was $2.3 million, $2.8 million and $2.2 million for the years ended December 31, 2014, 2013 and 2012, respectively. The actual tax benefit realized for the tax deductions from released restricted shares for the same years was $0.9 million, $1.1 million and zero, respectively.
As of December 31, 2014, total compensation cost related to our share of Wisconsin Energy restricted stock not yet recognized was approximately $2.1 million, which is expected to be recognized over the next 20 months on a weighted-average basis.
| Wisconsin Electric Power Company | A-48 | 2014 Annual Financial Statements |
Performance Units: In January 2014, 2013 and 2012, the Compensation Committee awarded 224,735, 230,245 and 333,685 Wisconsin Energy performance units, respectively, to our officers and other key employees under the Wisconsin Energy Performance Unit Plan. Under the grants, the ultimate number of units that will be awarded is dependent upon the achievement of certain financial performance of Wisconsin Energy’s common stock over a three-year period. Under the terms of the award, participants may earn between 0% and 175% of the base performance unit award. All grants are settled in cash. We are accruing our share of compensation costs over the three-year performance period based on our estimate of the final expected value of the awards. Performance units earned as of December 31, 2014, 2013 and 2012 vested and were settled during the first quarter of 2015, 2014 and 2013, and had a total intrinsic value of $11.6 million, $13.1 million and $17.1 million, respectively. The actual tax benefit realized for the tax deductions from the settlement of performance units was approximately $4.2 million, $4.7 million and $6.2 million, respectively. As of December 31, 2014, total compensation cost related to performance units not yet recognized was approximately $10.9 million, which is expected to be recognized over the next 20 months on a weighted-average basis.
In January 2015, the Compensation Committee awarded 187,450 performance units to our officers and other key employees under its normal schedule of awarding long-term incentive compensation.
Restrictions: Various financing arrangements and regulatory requirements impose certain restrictions on our ability to transfer funds to Wisconsin Energy in the form of cash dividends, loans or advances. In addition, under Wisconsin law, we are prohibited from loaning funds, either directly or indirectly, to Wisconsin Energy.
We are required to maintain a capital structure that differs from GAAP as it reflects regulatory adjustments. Both the 2013 PSCW rate case order and the 2015 PSCW rate case order require us to maintain a common equity ratio range of between 48.5% and 53.5%. We are in compliance with the common equity ratio range. We must obtain PSCW approval to pay dividends above the test year levels that would cause us to fall below the authorized level of common equity.
We may not pay common dividends to Wisconsin Energy under our Restated Articles of Incorporation if any dividends on our outstanding preferred stock have not been paid. In addition, pursuant to the terms of our 3.60% Serial Preferred Stock, our ability to declare common dividends would be limited to 75% or 50% of net income during a twelve month period if our common stock equity to total capitalization, as defined in the preferred stock designation, is less than 25% and 20%, respectively.
See Note K for discussion of certain financial covenants related to our bank back-up credit facility.
We do not believe that these restrictions will materially affect our operations or limit any dividend payments in the foreseeable future.
I — PREFERRED STOCK
The following table shows preferred stock authorized and outstanding at December 31, 2014 and 2013:
| Shares Authorized | Shares Outstanding | Redemption Price Per Share | Total | |||||||||||||
| (In Millions) | ||||||||||||||||
$100 par value, Six Per Cent. Preferred Stock | 45,000 | 44,498 | — | $ | 4.4 | |||||||||||
$100 par value, Serial Preferred Stock | 2,286,500 | |||||||||||||||
3.60% Series | 260,000 | $ | 101 | 26.0 | ||||||||||||
$25 par value, Serial Preferred Stock | 5,000,000 | — | — | — | ||||||||||||
|
| |||||||||||||||
Total Preferred Stock | $ | 30.4 | ||||||||||||||
|
| |||||||||||||||
| Wisconsin Electric Power Company | A-49 | 2014 Annual Financial Statements |
J — LONG-TERM DEBT AND CAPITAL LEASE OBLIGATIONS
Debentures and Notes: As of December 31, 2014, the maturities of our long-term debt outstanding (excluding obligations under capital leases) were as follows:
| (Millions of Dollars) | ||||
2015 | $ | 250.0 | ||
2016 | — | |||
2017 | — | |||
2018 | 250.0 | |||
2019 | 250.0 | |||
Thereafter | 1,687.0 | |||
|
| |||
Total | $ | 2,437.0 | ||
|
| |||
We amortize debt premiums, discounts and debt issuance costs over the lives of the debt and we include the costs in interest expense.
We are the obligor under two series of tax-exempt pollution control refunding bonds in outstanding principal amount of $147.0 million. In August 2009, we terminated letters of credit that provided credit and liquidity support for the bonds, which resulted in a mandatory tender of the bonds. We purchased the bonds at par plus accrued interest to the date of purchase. As of December 31, 2014 and 2013, the repurchased bonds were still outstanding, but were not reported in our consolidated long-term debt or included on our Consolidated Statements of Capitalization because they are held by us. Depending on market conditions and other factors, we may change the method used to determine the interest rate on the bonds and have them remarketed to third parties.
Obligations Under Capital Leases
We are the obligor under a power purchase contract with an unaffiliated third party and we lease power plants from We Power under Wisconsin Energy’s PTF strategy. Under capital lease accounting, we have recorded the leased plants and corresponding obligations under the capital leases on our Consolidated Balance Sheets. We treat these agreements as operating leases for rate-making purposes. We record our minimum lease payments under the power purchase contract as purchased power expense on the Consolidated Income Statements. We record the lease payments under our PTF leases as rent expense in other operation and maintenance in the Consolidated Income Statements. We record the difference between the minimum lease payments and the sum of imputed interest and amortization costs calculated under capital lease accounting as a deferred regulatory asset on our Consolidated Balance Sheets (see Regulatory Assets - Deferred plant related — capital leases in Note C).
Power Purchase Commitment: In 1997, we entered into a 25-year power purchase contract with an unaffiliated independent power producer. The contract, for 236 MW of firm capacity from a gas-fired cogeneration facility, includes no minimum energy requirements. When the contract expires in 2022, we may, at our option and with proper notice, renew for another ten years or purchase the generating facility at fair value or allow the contract to expire. We recorded the leased facility and corresponding obligation under the capital lease at the estimated fair value of the plant’s electric generating facilities. We are amortizing the leased facility on a straight-line basis over the original 25-year term of the contract.
PWGS: We are leasing PWGS 1 and PWGS 2, two 545 MW natural gas-fired generation units which were placed in service in July 2005 and May 2008, respectively, from We Power under PSCW approved leases. The leased plants and corresponding obligations for the plants have been recorded at the estimated fair value of $682.7 million. We are amortizing the leased plants on a straight-line basis over the original 25-year term of the leases. The lease payments are expected to be recovered through our rates, as supported by the 2001 leased generation law. Due to the timing and the amounts of the minimum lease payments, we expect the regulatory asset to increase to approximately $129.1 million in the year 2021 for PWGS 1 and to approximately $127.9 million in the year 2024 for PWGS 2, at which time the regulatory assets will be reduced to zero over the remaining lives of the contracts. The total obligation under the capital leases for the plants was $637.1 million as of December 31, 2014, and will decrease to zero over the remaining lives of the contracts.
Oak Creek Expansion: We are leasing OC 1, OC 2 and the common facilities, which are also utilized by our Oak Creek Units 5-8, from We Power under PSCW approved leases. We are amortizing the leased plants on a straight-line basis
| Wisconsin Electric Power Company | A-50 | 2014 Annual Financial Statements |
over the 30-year term of the leases. OC 1 and OC 2 were placed in service in February 2010 and January 2011, respectively. The leased plants and corresponding capital lease obligations have been recorded at the estimated fair value of $2,025.6 million. The lease payments are expected to be recovered through our rates, as supported by the 2001 leased generation law. Due to the timing and the amounts of the minimum lease payments, we expect the regulatory asset to increase to approximately $537.6 million in the year 2029 for OC 1 and to approximately $442.0 million in the year 2030 for OC2, at which time the regulatory assets will be reduced to zero over the remaining lives of the contracts. The total obligation under the capital leases was $2,096.5 million as of December 31, 2014, and will decrease to zero over the remaining life of the contracts.
We paid the following lease payments during 2014, 2013 and 2012:
| 2014 | 2013 | 2012 | ||||||||||
| (Millions of Dollars) | ||||||||||||
Long-term power purchase commitment | $ | 34.9 | $ | 33.7 | $ | 32.5 | ||||||
PWGS | 99.2 | 99.1 | 99.0 | |||||||||
Oak Creek Expansion | 277.8 | 274.9 | 269.3 | |||||||||
|
|
|
|
|
| |||||||
Total | $ | 411.9 | $ | 407.7 | $ | 400.8 | ||||||
|
|
|
|
|
| |||||||
The following table summarizes our capitalized leased facilities as of December 31:
Capital Lease Assets | 2014 | 2013 | ||||||
| (Millions of Dollars) | ||||||||
Long-term Power Purchase Commitment | ||||||||
Under capital lease | $ | 140.3 | $ | 140.3 | ||||
Accumulated amortization | (98.3 | ) | (92.5 | ) | ||||
|
|
|
| |||||
Total Long-term Power Purchase Commitment | $ | 42.0 | $ | 47.8 | ||||
|
|
|
| |||||
PWGS | ||||||||
Under capital lease | $ | 682.7 | $ | 681.5 | ||||
Accumulated amortization | (217.6 | ) | (190.1 | ) | ||||
|
|
|
| |||||
Total PWGS | $ | 465.1 | $ | 491.4 | ||||
|
|
|
| |||||
Oak Creek Expansion | ||||||||
Under capital lease | $ | 2,025.6 | $ | 1,991.1 | ||||
Accumulated amortization | (317.7 | ) | (251.3 | ) | ||||
|
|
|
| |||||
Total Oak Creek | $ | 1,707.9 | $ | 1,739.8 | ||||
|
|
|
| |||||
| ||||||||
|
|
|
| |||||
Total Leased Facilities | $ | 2,215.0 | $ | 2,279.0 | ||||
|
|
|
| |||||
| Wisconsin Electric Power Company | A-51 | 2014 Annual Financial Statements |
Future minimum lease payments under our capital leases and the present value of our net minimum lease payments as of December 31, 2014 are as follows:
Capital Lease Obligations | Power Purchase Commitment | PWGS | Oak Creek Expansion | Total | ||||||||||||
| (Millions of Dollars) | ||||||||||||||||
2015 | $ | 43.5 | $ | 99.3 | $ | 296.4 | $ | 439.2 | ||||||||
2016 | 45.1 | 99.3 | 311.0 | 455.4 | ||||||||||||
2017 | 13.9 | 99.3 | 311.4 | 424.6 | ||||||||||||
2018 | 14.7 | 99.3 | 311.4 | 425.4 | ||||||||||||
2019 | 15.5 | 99.3 | 311.4 | 426.2 | ||||||||||||
Thereafter | 41.3 | 1,184.7 | 6,378.5 | 7,604.5 | ||||||||||||
|
|
|
|
|
|
|
| |||||||||
Total Minimum Lease Payments | 174.0 | 1,681.2 | 7,920.1 | 9,775.3 | ||||||||||||
Less: Estimated Executory Costs | (54.7 | ) | — | — | (54.7 | ) | ||||||||||
|
|
|
|
|
|
|
| |||||||||
Net Minimum Lease Payments | 119.3 | 1,681.2 | 7,920.1 | 9,720.6 | ||||||||||||
Less: Interest | (34.8 | ) | (1,044.1 | ) | (5,823.6 | ) | (6,902.5 | ) | ||||||||
|
|
|
|
|
|
|
| |||||||||
Present Value of Net Minimum Lease Payments | 84.5 | 637.1 | 2,096.5 | 2,818.1 | ||||||||||||
Less: Due Currently | (24.6 | ) | (10.2 | ) | (70.8 | ) | (105.6 | ) | ||||||||
|
|
|
|
|
|
|
| |||||||||
Total Capital Lease Obligations | $ | 59.9 | $ | 626.9 | $ | 2,025.7 | $ | 2,712.5 | ||||||||
|
|
|
|
|
|
|
| |||||||||
K — SHORT-TERM DEBT
Our commercial paper balance and the corresponding weighted-average interest rate as of December 31 are shown in the following table:
| 2014 | 2013 | |||||||||||||||
| Balance | Interest Rate | Balance | Interest Rate | |||||||||||||
| (Millions of Dollars, except for percentages) | ||||||||||||||||
Commercial paper | $ | 306.8 | 0.25 | % | $ | 174.5 | 0.22 | % | ||||||||
The following information relates to commercial paper outstanding for the years ended December 31:
| 2014 | 2013 | |||||||
| (Millions of Dollars, except for percentages) | ||||||||
Maximum Commercial Paper Outstanding | $ | 401.0 | $ | 354.5 | ||||
Average Commercial Paper Outstanding | $ | 179.5 | $ | 98.0 | ||||
Weighted-Average Interest Rate | 0.22 | % | 0.22 | % | ||||
We have entered into a bank back-up credit facility to maintain short-term credit liquidity which, among other terms, requires us to maintain, subject to certain exclusions, a minimum total funded debt to capitalization ratio of less than 65%.
As of December 31, 2014, we had approximately $494.9 million of available, undrawn lines under our bank back-up credit facility and $306.8 million of commercial paper outstanding that was supported by the available lines of credit. In December 2014, we amended our credit facility to extend its expiration from December 2017 to December 2019. As of December 31, 2014, our subsidiary had a $22.4 million note payable to Wisconsin Energy with a weighted-average interest rate of 6.75%.
Our bank back-up credit facility contains customary covenants, including certain limitations on our ability to sell assets. The credit facility also contains customary events of default, including payment defaults, material inaccuracy of
| Wisconsin Electric Power Company | A-52 | 2014 Annual Financial Statements |
representations and warranties, covenant defaults, bankruptcy proceedings, certain judgments, Employee Retirement Income Security Act of 1974 defaults and change of control.
As of December 31, 2014, we were in compliance with all financial covenants.
L — DERIVATIVE INSTRUMENTS
We utilize derivatives as part of our risk management program to manage the volatility and costs of purchased power, generation and natural gas purchases for the benefit of our customers. Our approach is non-speculative and designed to mitigate risk and protect against price volatility. Regulated hedging programs require prior approval by the PSCW.
We record derivative instruments on the balance sheet as an asset or liability measured at its fair value, and changes in the derivative’s fair value are recognized currently in earnings unless specific hedge accounting criteria are met or we receive regulatory treatment for the derivative. For most energy related physical and financial contracts in our regulated operations that qualify as derivatives, the PSCW allows the effects of the fair market value accounting to be offset to regulatory assets and liabilities. As of December 31, 2014, we recognized $8.4 million in regulatory assets and $12.2 million in regulatory liabilities related to derivatives in comparison to $0.3 million in regulatory assets and $8.1 million in regulatory liabilities as of December 31, 2013.
We record our current derivative assets on the balance sheet in other current assets and the current portion of the liabilities in other current liabilities. The long-term portion of our derivative assets of $0.6 million is recorded in other deferred charges and other assets as of December 31, 2014, and the long-term portion of derivative liabilities of $0.7 million is recorded in other deferred credit and other liabilities as of December 31, 2014.
Our Consolidated Balance Sheets as of December 31, 2014 and 2013 include:
| December 31, 2014 | December 31, 2013 | |||||||||||||||
| Derivative Asset | Derivative Liability | Derivative Asset | Derivative Liability | |||||||||||||
| (Millions of Dollars) | ||||||||||||||||
Natural Gas | $ | 2.3 | $ | 7.1 | $ | 2.8 | $ | 0.1 | ||||||||
Fuel Oil | — | — | 0.6 | — | ||||||||||||
FTRs | 7.0 | — | 3.5 | — | ||||||||||||
Coal | 3.3 | 0.2 | 2.1 | 0.2 | ||||||||||||
|
|
|
|
|
|
|
| |||||||||
Total | $ | 12.6 | $ | 7.3 | $ | 9.0 | $ | 0.3 | ||||||||
|
|
|
|
|
|
|
| |||||||||
Our Consolidated Income Statements include gains (losses) on derivative instruments used in our risk management strategies under fuel and purchased power for those commodities supporting our electric operations and under cost of gas sold for the natural gas sold to our customers. Our estimated notional volumes and gains (losses) for the years ended December 31, 2014 and 2013 were as follows:
| 2014 | 2013 | |||||||||||||||
| Volume | Gains | Volume | Gains (Losses) | |||||||||||||
| (Millions of Dollars) | (Millions of Dollars) | |||||||||||||||
Natural Gas | 21.4 million Dth | $ | 4.0 | 24.0 million Dth | $ | (4.0 | ) | |||||||||
Fuel Oil | 9.2 million gallons | 0.5 | 8.6 million gallons | 0.5 | ||||||||||||
FTRs | 26.1 million MWh | 12.7 | 25.3 million MWh | 14.9 | ||||||||||||
|
|
|
| |||||||||||||
Total | $ | 17.2 | $ | 11.4 | ||||||||||||
|
|
|
| |||||||||||||
As of December 31, 2014 and 2013, we posted collateral of $6.9 million and zero, respectively, in our margin accounts. These amounts are recorded on the balance sheets in other current assets.
The fair value amounts recognized for the right to reclaim cash collateral or the obligation to return cash collateral are not offset against the fair value amounts recognized for derivative instruments executed with the same counterparty under the same master netting arrangement.
| Wisconsin Electric Power Company | A-53 | 2014 Annual Financial Statements |
The table below shows derivative assets and derivative liabilities if derivative instruments by counterparty were presented net on the balance sheet as of December 31, 2014 and 2013.
| December 31, 2014 | December 31, 2013 | |||||||||||||||
| Derivative Asset | Derivative Liability | Derivative Asset | Derivative Liability | |||||||||||||
| (Millions of Dollars) | ||||||||||||||||
Gross Amount Recognized on the Balance Sheet | $ | 12.6 | $ | 7.3 | $ | 9.0 | $ | 0.3 | ||||||||
Gross Amount Not Offset on Balance Sheet (a) | (0.4 | ) | (6.8 | ) | — | — | ||||||||||
|
|
|
|
|
|
|
| |||||||||
Net Amount | $ | 12.2 | $ | 0.5 | $ | 9.0 | $ | 0.3 | ||||||||
|
|
|
|
|
|
|
| |||||||||
| (a) | Gross Amount Not Offset on Balance Sheet includes cash collateral posted of $6.4 million and zero as of December 31, 2014 and 2013, respectively. |
M — FAIR VALUE MEASUREMENTS
Fair value measurements require enhanced disclosures about assets and liabilities that are measured and reported at fair value and establish a hierarchal disclosure framework which prioritizes and ranks the level of observable inputs used in measuring fair value.
Fair value is the price that would be received upon the sale of an asset or paid to transfer a liability in an orderly transaction between market participants at the measurement date (exit price). We primarily apply the market approach for recurring fair value measurements and attempt to utilize the best available information. Accordingly, we also utilize valuation techniques that maximize the use of observable inputs and minimize the use of unobservable inputs. We are able to classify fair value balances based on the observability of those inputs. The hierarchy gives the highest priority to unadjusted quoted prices in active markets for identical assets or liabilities (Level 1) and the lowest priority to unobservable inputs (Level 3).
Assets and liabilities measured and reported at fair value are classified and disclosed in one of the following categories:
Level 1 — Pricing inputs are unadjusted quoted prices available in active markets for identical assets or liabilities as of the reporting date. Active markets are those in which transactions for the asset or liability occur in sufficient frequency and volume to provide pricing information on an ongoing basis. Instruments in this category consist of financial instruments such as exchange-traded derivatives, cash equivalents and restricted cash investments.
Level 2 — Pricing inputs are other than quoted prices in active markets, which are either directly or indirectly observable as of the reporting date, and fair value is determined through the use of models or other valuation methodologies. Instruments in this category include non-exchange-traded derivatives such as Over-the-Counter (OTC) forwards and options.
Level 3 — Pricing inputs include significant inputs that are generally less observable from objective sources. The inputs in the determination of fair value require significant management judgment or estimation. At each balance sheet date, we perform an analysis of all instruments subject to fair value reporting and include in Level 3 all instruments whose fair value is based on significant unobservable inputs.
In certain cases, the inputs used to measure fair value may fall into different levels of the fair value hierarchy. In such cases, an instrument’s level within the fair value hierarchy is based on the lowest level of input that is significant to the fair value measurement. Our assessment of the significance of a particular input to the fair value measurement in its entirety requires judgment and considers factors specific to the instrument.
| Wisconsin Electric Power Company | A-54 | 2014 Annual Financial Statements |
The following tables summarize our financial assets and liabilities by level within the fair value hierarchy:
Recurring Fair Value Measures | As of December 31, 2014 | |||||||||||||||
| Level 1 | Level 2 | Level 3 | Total | |||||||||||||
| (Millions of Dollars) | ||||||||||||||||
Assets: | ||||||||||||||||
Derivatives | $ | 0.4 | $ | 5.2 | $ | 7.0 | $ | 12.6 | ||||||||
|
|
|
|
|
|
|
| |||||||||
Total | $ | 0.4 | $ | 5.2 | $ | 7.0 | $ | 12.6 | ||||||||
Liabilities: | ||||||||||||||||
Derivatives | $ | 6.8 | $ | 0.5 | $ | — | $ | 7.3 | ||||||||
|
|
|
|
|
|
|
| |||||||||
Total | $ | 6.8 | $ | 0.5 | $ | — | $ | 7.3 | ||||||||
Recurring Fair Value Measures | As of December 31, 2013 | |||||||||||||||
| Level 1 | Level 2 | Level 3 | Total | |||||||||||||
| (Millions of Dollars) | ||||||||||||||||
Assets: | ||||||||||||||||
Derivatives | $ | 3.2 | $ | 2.3 | $ | 3.5 | $ | 9.0 | ||||||||
|
|
|
|
|
|
|
| |||||||||
Total | $ | 3.2 | $ | 2.3 | $ | 3.5 | $ | 9.0 | ||||||||
Liabilities: | ||||||||||||||||
Derivatives | $ | — | $ | 0.3 | $ | — | $ | 0.3 | ||||||||
|
|
|
|
|
|
|
| |||||||||
Total | $ | — | $ | 0.3 | $ | — | $ | 0.3 | ||||||||
Derivatives reflect positions we hold in exchange-traded derivative contracts and OTC derivative contracts. Exchange-traded derivative contracts, which include futures and exchange-traded options, are generally based on unadjusted quoted prices in active markets and are classified within Level 1. Some OTC derivative contracts are valued using broker or dealer quotations, or market transactions in either the listed or OTC markets utilizing a mid-market pricing convention (the mid-point between bid and ask prices), as appropriate. In such cases, these derivatives are classified within Level 2. Certain OTC derivatives may utilize models to measure fair value. Generally, we use a similar model to value similar instruments. Valuation models utilize various inputs which include quoted prices for similar assets or liabilities in active markets, quoted prices for identical or similar assets or liabilities in markets that are not active, other observable inputs for the asset or liability, and market-corroborated inputs (i.e., inputs derived principally from or corroborated by observable market data by correlation or other means). Where observable inputs are available for substantially the full term of the asset or liability, the instrument is categorized in Level 2. Certain OTC derivatives are in less active markets with a lower availability of pricing information which might not be observable in or corroborated by the market. When such inputs have a significant impact on the measurement of fair value, the instrument is categorized in Level 3.
The following table summarizes the changes to derivatives classified as Level 3 in the fair value hierarchy:
| 2014 | 2013 | |||||||
| (Millions of Dollars) | ||||||||
Balance as of January 1 | $ | 3.5 | $ | 4.7 | ||||
Realized and unrealized gains (losses) | — | — | ||||||
Purchases | 15.6 | 10.6 | ||||||
Issuances | — | — | ||||||
Settlements | (12.1 | ) | (11.8 | ) | ||||
Transfers in and/or out of Level 3 | — | — | ||||||
|
|
|
| |||||
Balance as of December 31 | $ | 7.0 | $ | 3.5 | ||||
|
|
|
| |||||
Derivative instruments reflected in Level 3 of the hierarchy include MISO FTRs that are measured at fair value each reporting period using monthly or annual auction shadow prices from relevant auctions. Changes in fair value for Level 3 recurring items are recorded on our balance sheet. See Note L — Derivative Instruments for further information on the offset to regulatory assets and liabilities.
| Wisconsin Electric Power Company | A-55 | 2014 Annual Financial Statements |
The carrying amount and estimated fair value of certain of our recorded financial instruments as of December 31 are as follows:
| 2014 | 2013 | |||||||||||||||
Financial Instruments | Carrying Amount | Fair Value | Carrying Amount | Fair Value | ||||||||||||
| (Millions of Dollars) | ||||||||||||||||
Preferred stock, no redemption required | $ | 30.4 | $ | 27.1 | $ | 30.4 | $ | 26.0 | ||||||||
Long-term debt including current portion | $ | 2,437.0 | $ | 2,759.6 | $ | 2,487.0 | $ | 2,634.7 | ||||||||
The carrying value of net accounts receivable, accounts payable and short-term borrowings approximates fair value due to the short-term nature of these instruments. The fair value of our preferred stock is estimated based upon the quoted market value for the same or similar issues. The fair value of our long-term debt, including the current portion of long-term debt, but excluding capitalized leases and unamortized discount on debt, is estimated based upon quoted market value for the same or similar issues or upon the quoted market prices of U.S. Treasury issues having a similar term to maturity, adjusted for the issuing company’s bond rating and the present value of future cash flows.
N — BENEFITS
Pensions and Other Post-retirement Benefits: We participate in Wisconsin Energy’s defined benefit pension plans that cover substantially all of our employees. Generally, employees who started with the Company after 1995 receive a benefit based on a percentage of their annual salary plus an interest credit, while employees who started before 1996 receive a benefit based upon years of service and final average salary. Approximately half of our projected benefit obligation relates to benefits based upon years of service and final average salary. New management employees hired after December 31, 2014 will receive a 6% annual Company contribution to their 401(k) plan instead of being enrolled in the defined benefit plans.
We also participate in Wisconsin Energy’s OPEB plans that cover substantially all of our employees. The health care plans are contributory with participants’ contributions adjusted annually; the life insurance plans are noncontributory. The accounting for the health care plans anticipates future cost-sharing changes to the written plans that are consistent with our expressed intent to maintain the current cost sharing levels. The post-retirement health care plans include a limit on our share of costs for recent and future retirees.
The assets, obligations and the components of our pension costs are allocated by Wisconsin Energy’s actuary to each of the participating companies as if each participating company had its own plan. The disclosures below are based on an allocation to us of the amounts for Wisconsin Energy’s pension plans.
We use a year-end measurement date to measure the funded status of all of the pension and OPEB plans. Due to the regulated nature of our business, we have concluded that substantially all of the unrecognized costs resulting from the recognition of the funded status of the pension and OPEB plans qualify as a regulatory asset.
| Wisconsin Electric Power Company | A-56 | 2014 Annual Financial Statements |
The following table presents details about the pension and OPEB plans:
| Pension | OPEB | |||||||||||||||
| 2014 | 2013 | 2014 | 2013 | |||||||||||||
| (Millions of Dollars) | ||||||||||||||||
Change in Benefit Obligation | ||||||||||||||||
Benefit Obligation at January 1 | $ | 1,223.1 | $ | 1,310.3 | $ | 292.4 | $ | 305.4 | ||||||||
Service cost | 9.4 | 13.9 | 8.1 | 9.5 | ||||||||||||
Interest cost | 59.3 | 52.4 | 14.4 | 12.7 | ||||||||||||
Participants’ contributions | — | — | 8.4 | 8.1 | ||||||||||||
Plan amendments | — | (0.9 | ) | (5.2 | ) | — | ||||||||||
Actuarial loss (gain) | 110.8 | (73.9 | ) | 24.3 | (22.7 | ) | ||||||||||
Other accrued benefits | (0.1 | ) | — | — | — | |||||||||||
Gross benefits paid | (87.3 | ) | (78.7 | ) | (21.1 | ) | (21.3 | ) | ||||||||
Federal subsidy on benefits paid | N/A | N/A | 1.0 | 0.7 | ||||||||||||
|
|
|
|
|
|
|
| |||||||||
Benefit Obligation at December 31 | $ | 1,315.2 | $ | 1,223.1 | $ | 322.3 | $ | 292.4 | ||||||||
|
|
|
|
|
|
|
| |||||||||
Change in Plan Assets | ||||||||||||||||
Fair Value at January 1 | $ | 1,168.9 | $ | 1,121.1 | $ | 222.4 | $ | 194.8 | ||||||||
Actual earnings on plan assets | 71.2 | 119.0 | 12.0 | 30.7 | ||||||||||||
Employer contributions | 7.2 | 7.5 | 3.2 | 10.1 | ||||||||||||
Participants’ contributions | — | — | 8.4 | 8.1 | ||||||||||||
Gross benefits paid | (87.3 | ) | (78.7 | ) | (21.1 | ) | (21.3 | ) | ||||||||
|
|
|
|
|
|
|
| |||||||||
Fair Value at December 31 | $ | 1,160.0 | $ | 1,168.9 | $ | 224.9 | $ | 222.4 | ||||||||
|
|
|
|
|
|
|
| |||||||||
Net liability | $ | 155.2 | $ | 54.2 | $ | 97.4 | $ | 70.0 | ||||||||
|
|
|
|
|
|
|
| |||||||||
Amounts recognized in our Consolidated Balance Sheets as of December 31 related to the funded status of the benefit plans consisted of:
| Pension | OPEB | |||||||||||||||
| 2014 | 2013 | 2014 | 2013 | |||||||||||||
| (Millions of Dollars) | ||||||||||||||||
Other long-term assets | $ | — | $ | 34.3 | $ | 1.9 | $ | 1.6 | ||||||||
Other long-term liabilities | $ | 155.2 | $ | 88.5 | $ | 99.3 | $ | 71.6 | ||||||||
|
|
|
|
|
|
|
| |||||||||
Net liability | $ | 155.2 | $ | 54.2 | $ | 97.4 | $ | 70.0 | ||||||||
|
|
|
|
|
|
|
| |||||||||
The accumulated benefit obligation for all defined benefit plans was $1,314.3 million and $1,222.3 million as of December 31, 2014 and 2013, respectively.
The following table shows the amounts that have not yet been recognized in our net periodic benefit cost as of December 31 and are recorded as a regulatory asset on our balance sheet:
| Pension | OPEB | |||||||||||||||
| 2014 | 2013 | 2014 | 2013 | |||||||||||||
| (Millions of Dollars) | ||||||||||||||||
Net actuarial loss (gain) | $ | 476.4 | $ | 384.7 | $ | 20.7 | $ | (7.6 | ) | |||||||
Prior service costs (credits) | 6.3 | 8.3 | (5.2 | ) | (1.7 | ) | ||||||||||
|
|
|
|
|
|
|
| |||||||||
Total - Regulatory Assets (Liabilities) | $ | 482.7 | $ | 393.0 | $ | 15.5 | $ | (9.3 | ) | |||||||
|
|
|
|
|
|
|
| |||||||||
We estimate that 2015 periodic pension and OPEB costs will include the amortization of previously unrecognized benefit costs (credits) referred to above of $38.0 million and $(0.2) million, respectively.
| Wisconsin Electric Power Company | A-57 | 2014 Annual Financial Statements |
The components of net periodic pension and OPEB costs for the years ended December 31 are as follows:
| Pension | OPEB | |||||||||||||||||||||||
| 2014 | 2013 | 2012 | 2014 | 2013 | 2012 | |||||||||||||||||||
| (Millions of Dollars) | ||||||||||||||||||||||||
Net Periodic Benefit Cost | ||||||||||||||||||||||||
Service cost | $ | 9.4 | $ | 13.9 | $ | 19.8 | $ | 8.1 | $ | 9.5 | $ | 9.8 | ||||||||||||
Interest cost | 59.3 | 52.4 | 56.8 | 14.4 | 12.7 | 16.7 | ||||||||||||||||||
Expected return on plan assets | (79.1 | ) | (77.2 | ) | (71.8 | ) | (16.2 | ) | (14.5 | ) | (13.0 | ) | ||||||||||||
Amortization of: | ||||||||||||||||||||||||
Transition obligation | — | — | — | — | — | 0.3 | ||||||||||||||||||
Prior service cost (credit) | 2.0 | 2.2 | 2.1 | (1.7 | ) | (1.9 | ) | (1.9 | ) | |||||||||||||||
Actuarial loss | 26.9 | 41.7 | 30.6 | 0.2 | 1.5 | 5.0 | ||||||||||||||||||
Settlement charge | — | 1.5 | — | — | — | — | ||||||||||||||||||
Other | — | — | 0.4 | — | — | — | ||||||||||||||||||
|
|
|
|
|
|
|
|
|
|
|
| |||||||||||||
Net Periodic Benefit Cost | $ | 18.5 | $ | 34.5 | $ | 37.9 | $ | 4.8 | $ | 7.3 | $ | 16.9 | ||||||||||||
|
|
|
|
|
|
|
|
|
|
|
| |||||||||||||
| Pension | OPEB | |||||||||||||||||
| 2014 | 2013 | 2012 | 2014 | 2013 | 2012 | |||||||||||||
Weighted-Average assumptions used to determine benefit obligations as of Dec. 31 | ||||||||||||||||||
Discount rate | 4.15 | % | 5.00 | % | 4.10 | % | 4.20% | 4.95% | 4.15% | |||||||||
Rate of compensation increase | 4.00 | % | 4.00 | % | 4.00 | % | N/A | N/A | N/A | |||||||||
Weighted-Average assumptions used to determine net cost for year ended Dec. 31 | ||||||||||||||||||
Discount rate | 5.00 | % | 4.10 | % | 5.05 | % | 4.95% | 4.15% | 5.20% | |||||||||
Expected return on plan assets | 7.25 | % | 7.25 | % | 7.25 | % | 7.50% | 7.50% | 7.50% | |||||||||
Rate of compensation increase | 4.00 | % | 4.00 | % | 4.00 | % | N/A | N/A | N/A | |||||||||
Assumed health care cost trend rates as of Dec. 31 | ||||||||||||||||||
Health care cost trend rate assumed for next year (Pre 65 / Post 65) |
| 7.5%/7.5% | 7.5%/7.5% | 7.5%/7.5% | ||||||||||||||
Rate that the cost trend rate gradually adjusts to |
| 5.00% | 5.00% | 5.00% | ||||||||||||||
Year that the rate reaches the rate it is assumed to remain at (Pre 65 / Post 65) |
| 2021/2021 | 2021/2021 | 2017/2017 | ||||||||||||||
The expected long-term rate of return on pension and OPEB plan assets was 7.25% and 7.50%, respectively, in 2014, 2013 and 2012. Wisconsin Energy consults with its investment advisors on an annual basis to help forecast expected long-term returns on plan assets by reviewing historical returns as well as calculating expected total trust returns using the weighted-average of long-term market returns for each of the major target asset categories utilized in the fund.
A one-percentage-point change in assumed health care cost trend rates would have the following effects:
| 1% Increase | 1% Decrease | |||||||
| (Millions of Dollars) | ||||||||
Effect on | ||||||||
Post-retirement benefit obligation | $ | 29.3 | $ | (24.4 | ) | |||
Total of service and interest cost components | $ | 3.1 | $ | (2.5 | ) | |||
We use various Employees’ Benefit Trusts to fund a major portion of OPEB. The majority of the trusts’ assets are mutual funds.
Plan Assets: Current pension trust assets and amounts which are expected to be contributed to the trusts in the future are expected to be adequate to meet pension payment obligations to current and future retirees.
The Investment Trust Policy Committee oversees investment matters related to all of our funded benefit plans. The Committee works with external actuaries and investment consultants on an on-going basis to establish and monitor
| Wisconsin Electric Power Company | A-58 | 2014 Annual Financial Statements |
investment strategies and target asset allocations. Forecasted cash flows for plan liabilities are regularly updated based on annual valuation results. Target allocations are determined utilizing projected benefit payment cash flows and risk analyses of appropriate investments. They are intended to reduce risk, provide long-term financial stability for the plans and maintain funded levels which meet long-term plan obligations while preserving sufficient liquidity for near-term benefit payments.
Previously, our pension plan target allocation was 45% equity investments and 55% fixed income investments. In late 2014, we began transitioning to a target asset allocation of 35% equity investments, 55% fixed income investments and 10% private equity and real estate investments. The current OPEB target asset allocation is 60% equity investments and 40% fixed income investments. Equity securities include investments in large-cap, mid-cap and small-cap companies primarily located in the United States. Fixed income securities include corporate bonds of companies from diversified industries, mortgage and other asset backed securities, commercial paper, and U.S. Treasuries.
The following table summarizes the fair value of our share of plan assets by asset category within the fair value hierarchy (for further level information, see Note M):
| As of December 31, 2014 | ||||||||||||||||
Asset Category - Pension | Level 1 | Level 2 | Level 3 | Total | ||||||||||||
| (Millions of Dollars) | ||||||||||||||||
Cash and Cash Equivalents | $ | 5.1 | $ | — | $ | — | $ | 5.1 | ||||||||
Equities: | ||||||||||||||||
U.S. Equity | 404.5 | — | — | 404.5 | ||||||||||||
International Equity | 103.3 | 23.9 | — | 127.2 | ||||||||||||
Fixed Income: | ||||||||||||||||
Short, Intermediate and Long-term Bonds (a) | ||||||||||||||||
U.S. Bonds | 34.2 | 481.2 | — | 515.4 | ||||||||||||
International Bonds | 63.7 | 34.8 | — | 98.5 | ||||||||||||
Private equity and real estate | — | — | 9.3 | 9.3 | ||||||||||||
|
|
|
|
|
|
|
| |||||||||
Total | $ | 610.8 | $ | 539.9 | $ | 9.3 | $ | 1,160.0 | ||||||||
|
|
|
|
|
|
|
| |||||||||
| As of December 31, 2013 | ||||||||||||||||
Asset Category - Pension | Level 1 | Level 2 | Level 3 | Total | ||||||||||||
| (Millions of Dollars) | ||||||||||||||||
Cash and Cash Equivalents | $ | 16.9 | $ | — | $ | — | $ | 16.9 | ||||||||
Equities: | ||||||||||||||||
U.S. Equity | 418.5 | — | — | 418.5 | ||||||||||||
International Equity | 117.8 | 28.8 | — | 146.6 | ||||||||||||
Fixed Income: | ||||||||||||||||
Short, Intermediate and Long-term Bonds (a) | ||||||||||||||||
U.S. Bonds | 87.3 | 407.0 | — | 494.3 | ||||||||||||
International Bonds | 62.9 | 29.7 | — | 92.6 | ||||||||||||
|
|
|
|
|
|
|
| |||||||||
Total | $ | 703.4 | $ | 465.5 | $ | — | $ | 1,168.9 | ||||||||
|
|
|
|
|
|
|
| |||||||||
| (a) | This category represents investment grade bonds of U.S. and foreign issuers denominated in U.S. dollars from diverse industries. |
| Wisconsin Electric Power Company | A-59 | 2014 Annual Financial Statements |
The following table summarizes the fair value of our share of OPEB plan assets by asset category within the fair value hierarchy:
| As of December 31, 2014 | ||||||||||||||||
Asset Category - OPEB | Level 1 | Level 2 | Level 3 | Total | ||||||||||||
| (Millions of Dollars) | ||||||||||||||||
Cash and Cash Equivalents | $ | 0.9 | $ | — | $ | — | $ | 0.9 | ||||||||
Equities: | ||||||||||||||||
U.S. Equity | 98.4 | — | — | 98.4 | ||||||||||||
International Equity | 28.5 | 1.7 | — | 30.2 | ||||||||||||
Fixed Income: | ||||||||||||||||
Short, Intermediate and Long-term Bonds (a) | ||||||||||||||||
U.S. Bonds | 2.4 | 75.8 | — | 78.2 | ||||||||||||
International Bonds | 11.8 | 4.7 | — | 16.5 | ||||||||||||
Private equity and real estate | — | — | 0.7 | 0.7 | ||||||||||||
|
|
|
|
|
|
|
| |||||||||
Total | $ | 142.0 | $ | 82.2 | $ | 0.7 | $ | 224.9 | ||||||||
|
|
|
|
|
|
|
| |||||||||
| As of December 31, 2013 | ||||||||||||||||
Asset Category - OPEB | Level 1 | Level 2 | Level 3 | Total | ||||||||||||
| (Millions of Dollars) | ||||||||||||||||
Cash and Cash Equivalents | $ | 1.8 | $ | — | $ | — | $ | 1.8 | ||||||||
Equities: | ||||||||||||||||
U.S. Equity | 100.5 | — | — | 100.5 | ||||||||||||
International Equity | 31.8 | 1.9 | — | 33.7 | ||||||||||||
Fixed Income: | ||||||||||||||||
Short, Intermediate and Long-term Bonds (a) | ||||||||||||||||
U.S. Bonds | 5.7 | 65.4 | — | 71.1 | ||||||||||||
International Bonds | 11.4 | 3.9 | — | 15.3 | ||||||||||||
|
|
|
|
|
|
|
| |||||||||
Total | $151.2 | $71.2 | $— | $222.4 | ||||||||||||
|
|
|
|
|
|
|
| |||||||||
| (a) | This category represents investment grade bonds of U.S. and foreign issuers denominated in U.S. dollars from diverse industries. |
In December 2014, our pension and OPEB plans began investing in private equity funds which are a Level 3 investment.
Cash Flows:
Historical employer contributions:
| Pension | ||||||||||||
Year | Qualified | Non-Qualified | OPEB | |||||||||
| (Millions of Dollars) | ||||||||||||
2012 | $ | 88.5 | $ | 6.0 | $ | 13.6 | ||||||
2013 | $ | — | $ | 7.5 | $ | 10.1 | ||||||
2014 | $ | — | $ | 7.2 | $ | 3.2 | ||||||
In January 2015, we contributed $100.0 million to the qualified pension plan. Future contributions to the plans will be dependent upon many factors, including the performance of plan assets, long-term discount rates and mortality rates.
| Wisconsin Electric Power Company | A-60 | 2014 Annual Financial Statements |
Estimated benefit payments:
Year | Pension | Gross OPEB | ||||||
| (Millions of Dollars) | ||||||||
2015 | $ | 91.8 | $ | 13.9 | ||||
2016 | $ | 91.5 | $ | 14.8 | ||||
2017 | $ | 92.1 | $ | 16.0 | ||||
2018 | $ | 89.5 | $ | 17.1 | ||||
2019 | $ | 89.4 | $ | 18.2 | ||||
2020-2024 | $ | 429.5 | $ | 99.3 | ||||
Savings Plans: We sponsor savings plans which allow employees to contribute a portion of their pre-tax and/or after-tax income in accordance with plan-specified guidelines. Under these plans, we expensed matching contributions of $13.0 million, $13.0 million and $12.5 million during 2014, 2013 and 2012, respectively.
Postemployment Benefits: Postemployment benefits provided to former or inactive employees are recognized when an event occurs. The estimated liability for such benefits was $1.8 million and $2.8 million as of December 31, 2014 and 2013, respectively.
O — SEGMENT REPORTING
We are a subsidiary of Wisconsin Energy and have organized our reportable segments according to how we are currently regulated. Our reportable operating segments include electric, natural gas and steam utility segments. The accounting policies of the reportable operating segments are the same as those described in Note A.
Our electric utility engages in the generation, distribution and sale of electric energy in southeastern (including metropolitan Milwaukee), east central and northern Wisconsin and in the Upper Peninsula of Michigan. Our natural gas utility is engaged in the purchase, distribution and sale of natural gas to retail customers and the transportation of customer-owned natural gas in three service areas in southeastern, east central and northern Wisconsin. Our steam utility produces, distributes and sells steam to space heating and processing customers in the Milwaukee, Wisconsin area.
Total asset information is not provided for reportable segments because as an integrated electric, natural gas and steam utility, significant assets are not dedicated to a specific reportable segment. Reporting assets by segment would require arbitrary and potentially misleading allocations which may not necessarily reflect the assets that would be required for the operation of the reportable segments on a stand-alone basis.
| Wisconsin Electric Power Company | A-61 | 2014 Annual Financial Statements |
Summarized financial information concerning our reportable segments for each of the three years ended December 31, 2014 is shown in the following table:
| Reportable Segments | ||||||||||||||||||||
Year Ended | Electric | Gas | Steam | Other (a) | Total | |||||||||||||||
| (Millions of Dollars) | ||||||||||||||||||||
| December 31, 2014 | ||||||||||||||||||||
Operating Revenues (b) | $ | 3,401.1 | $ | 614.2 | $ | 44.1 | $ | — | $ | 4,059.4 | ||||||||||
Depreciation and Amortization | $ | 261.5 | $ | 30.5 | $ | 3.7 | $ | — | $ | 295.7 | ||||||||||
Operating Income (c) | $ | 565.6 | $ | 77.2 | $ | 7.6 | $ | — | $ | 650.4 | ||||||||||
Equity in Earnings of Transmission Affiliate | $ | 57.9 | $ | — | $ | — | $ | — | $ | 57.9 | ||||||||||
Capital Expenditures | $ | 470.2 | $ | 67.9 | $ | 2.8 | $ | — | $ | 540.9 | ||||||||||
| December 31, 2013 | ||||||||||||||||||||
Operating Revenues (b) | $ | 3,308.7 | $ | 451.9 | $ | 39.6 | $ | — | $ | 3,800.2 | ||||||||||
Depreciation and Amortization | $ | 249.5 | $ | 25.5 | $ | 3.6 | $ | — | $ | 278.6 | ||||||||||
Operating Income (Loss) (c) | $ | 533.2 | $ | 69.8 | $ | 2.9 | $ | — | $ | 605.9 | ||||||||||
Equity in Earnings of Transmission Affiliate | $ | 60.2 | $ | — | $ | — | $ | — | $ | 60.2 | ||||||||||
Capital Expenditures | $ | 438.5 | $ | 57.8 | $ | 10.6 | $ | — | $ | 506.9 | ||||||||||
| December 31, 2012 | ||||||||||||||||||||
Operating Revenues (b) | $ | 3,193.9 | $ | 385.1 | $ | 34.3 | $ | — | $ | 3,613.3 | ||||||||||
Depreciation and Amortization | $ | 230.3 | $ | 23.9 | $ | 3.4 | $ | — | $ | 257.6 | ||||||||||
Operating Income (c) | $ | 536.5 | $ | 50.0 | $ | (3.2 | ) | $ | — | $ | 583.3 | |||||||||
Equity in Earnings of Transmission Affiliate | $ | 57.6 | $ | — | $ | — | $ | — | $ | 57.6 | ||||||||||
Capital Expenditures | $ | 524.9 | $ | 50.8 | $ | — | $ | 0.1 | $ | 575.8 | ||||||||||
| (a) | Other includes primarily non-utility property and investments, materials and supplies, deferred charges and other corporate items. |
| (b) | We account for intersegment revenues at a tariff rate established by the PSCW. Intersegment revenues were not material. |
| (c) | We evaluate operating income to manage our utility business. Equity in Earnings of Transmission Affiliate, Interest Expense and Income Taxes are not included in segment operating income. |
P — RELATED PARTIES
We provide to and receive from certain of our Wisconsin Energy affiliates managerial, financial, accounting, legal, data processing and other services in accordance with service agreements approved by the PSCW. In addition, we make lease payments to We Power for PWGS 1, PWGS 2, OC 1 and OC 2. We also receive and/or provide certain services to other associated companies in which we have, or Wisconsin Energy has, an equity investment.
American Transmission Company LLC: As of December 31, 2014, we have a 23.0% interest in ATC. We pay ATC for transmission and other related services it provides. In addition, we provide a variety of operational, maintenance and project management work for ATC, which is reimbursed to us by ATC. We are required to pay the cost of needed transmission infrastructure upgrades for new generation projects while projects are under construction. ATC reimburses us for these costs when new generation is placed in service.
| Wisconsin Electric Power Company | A-62 | 2014 Annual Financial Statements |
During the years ended December 31, 2014, 2013 and 2012, our equity in earnings and distributions received from ATC were as follows:
Equity Investee | 2014 | 2013 | 2012 | |||||||||
| (Millions of Dollars) | ||||||||||||
Equity in Earnings | $ | 57.9 | $ | 60.2 | $ | 57.6 | ||||||
Distributions Received | $ | 50.5 | $ | 47.8 | $ | 46.1 | ||||||
Summary financial information as of December 31 from the financial statements of ATC is as follows:
| 2014 | 2013 | 2012 | ||||||||||
| (Millions of Dollars) | ||||||||||||
Operating Revenues | $ | 635.0 | $ | 626.3 | $ | 603.3 | ||||||
Operating Income | $ | 327.6 | $ | 331.3 | $ | 322.2 | ||||||
Net Income | $ | 238.7 | $ | 247.6 | $ | 237.4 | ||||||
Current Assets | $ | 66.4 | $ | 80.7 | $ | 63.1 | ||||||
Non-Current Assets | $ | 3,728.7 | $ | 3,509.5 | $ | 3,274.7 | ||||||
Current Liabilities | $ | 313.1 | $ | 381.5 | $ | 251.5 | ||||||
Non-Current Liabilities | $ | 1,864.8 | $ | 1,676.2 | $ | 1,645.8 | ||||||
We provided and received services from the following associated companies during 2014, 2013 and 2012:
Company | 2014 | 2013 | 2012 | |||||||||
| (Millions of Dollars) | ||||||||||||
| Affiliate | ||||||||||||
Services Provided | ||||||||||||
We Power (excluding lease payments) | $ | 41.5 | $ | 2.8 | $ | 2.3 | ||||||
Wisconsin Gas | $ | 81.7 | $ | 83.4 | $ | 78.7 | ||||||
Wisconsin Energy | $ | 11.3 | $ | 5.6 | $ | 5.6 | ||||||
Other | $ | 1.5 | $ | 1.6 | $ | 1.2 | ||||||
Services Received | ||||||||||||
We Power (including lease payments) | $ | 389.0 | $ | 381.7 | $ | 375.3 | ||||||
Wisconsin Gas | $ | 20.6 | $ | 23.6 | $ | 16.6 | ||||||
Wisconsin Energy | $ | 15.2 | $ | 10.2 | $ | 23.9 | ||||||
| Equity Investee - ATC | ||||||||||||
Services Provided | $ | 8.1 | $ | 9.0 | $ | 8.2 | ||||||
Services Received | $ | 231.4 | $ | 234.2 | $ | 222.7 | ||||||
As of December 31, 2014 and 2013, our Consolidated Balance Sheets included receivable and payable balances with ATC as follows:
Equity Investee | 2014 | 2013 | ||||||
| (Millions of Dollars) | ||||||||
Accounts Receivable | ||||||||
Services provided | $ | 0.6 | $ | 0.6 | ||||
Accounts Payable | ||||||||
Services received | $ | 19.3 | $ | 19.5 | ||||
| Wisconsin Electric Power Company | A-63 | 2014 Annual Financial Statements |
Q — COMMITMENTS AND CONTINGENCIES
Operating Leases: We enter into long-term purchase power contracts to meet a portion of our anticipated increase in future electric energy supply needs. These contracts expire at various times through 2018. Certain of these contracts were deemed to qualify as operating leases. In addition, we have various other operating leases, including leases for coal cars.
Future minimum payments for the next five years and thereafter for our operating lease contracts are as follows:
| (Millions of Dollars) | ||||
2015 | $ | 5.2 | ||
2016 | 3.9 | |||
2017 | 3.2 | |||
2018 | 3.1 | |||
2019 | 1.2 | |||
Thereafter | 21.5 | |||
|
| |||
Total | $ | 38.1 | ||
|
| |||
Divested Assets: We provided customary indemnifications to Wisconsin Power and Light Company, a subsidiary of Alliant Energy Corporation, in connection with the sale of our interest in Edgewater Generating Unit 5.
Environmental Matters: We periodically review our exposure for environmental remediation costs as evidence becomes available indicating that our liability has changed. Given current information, including the following, we believe that future costs in excess of the amounts accrued and/or disclosed on all presently known and quantifiable environmental contingencies will not be material to our financial position or results of operations.
We have a program of comprehensive environmental remediation planning for former manufactured gas plant sites and coal combustion product disposal sites. We perform ongoing assessments of our manufactured gas plant sites and related disposal sites, as well as our coal combustion product disposal/landfill sites. We are working with the WDNR in our investigation and remediation planning. At this time, we cannot estimate future remediation costs associated with these sites beyond those described below.
Manufactured Gas Plant Sites: We have identified several sites at which we or a predecessor company historically owned or operated a manufactured gas plant. These sites have been substantially remediated or are at various stages of investigation, monitoring and remediation. We have also identified other sites that may have been impacted by historical manufactured gas plant activities. Based upon on-going analysis, we estimate that the future costs for detailed site investigation and future remediation costs may range from $6 million to $12 million over the next ten years. This estimate is dependent upon several variables including, among other things, the extent of remediation, changes in technology and changes in regulation. As of December 31, 2014 and 2013, we established reserves of $6.5 million and $10.8 million, respectively, related to future remediation costs.
Historically, the PSCW has allowed Wisconsin utilities, including us, to defer the costs spent on the remediation of manufactured gas plant sites, and has allowed for these costs to be recovered in rates over five years. Accordingly, we have recorded a regulatory asset for remediation costs.
Coal Combustion Product Landfill Sites: We aggressively seek environmentally acceptable, beneficial uses for our coal combustion products. However, some coal combustion products have been, and to a small degree continue to be, managed in company-owned, licensed landfills. Some early designed and constructed landfills have at times required various levels of monitoring or remediation. Where we have become aware of these conditions, efforts have been made to define the nature and extent of any release, and work has been performed to address these conditions. During 2014, 2013 and 2012, we incurred $0.1 million, $0.1 million and $0.3 million, respectively, in landfill remediation expenses. As of December 31, 2014, we have no reserves established related to coal combustion product landfill sites.
Valley Power Plant Title V Air Permit: The WDNR renewed VAPP’s Title V operating permit in February 2011. The term of the permit is five years. In March 2011, the Sierra Club petitioned the EPA for additional reductions and monitoring for particulate matter and revisions to certain applicable requirements. No timeline has been set by the EPA to respond to that petition. In May 2012, the Sierra Club filed a notice of intent to bring suit to force the EPA to issue a response to that petition. We believe that the permit was properly issued and that the plant is in compliance with all applicable regulations
| Wisconsin Electric Power Company | A-64 | 2014 Annual Financial Statements |
and standards. However, if as a result of this proceeding the permit is remanded to the WDNR, the plant will continue to operate under the previous operating permit.
R — SUPPLEMENTAL CASH FLOW INFORMATION
During the year ended December 31, 2014, we paid $117.9 million in interest, net of amounts capitalized, and paid $20.8 million in income taxes, net of refunds. During the year ended December 31, 2013, we paid $120.5 million in interest, net of amounts capitalized, and received $39.2 million in net refunds from income taxes. During the year ended December 31, 2012, we paid $109.0 million in interest, net of amounts capitalized, and received $91.2 million in net refunds from income taxes.
As of December 31, 2014, 2013 and 2012, the amount of accounts payable related to capital expenditures was $1.7 million, $4.6 million and $15.7 million, respectively.
S — SUBSEQUENT EVENT
On January 12, 2015, we, along with Wisconsin Energy, entered into an agreement with the Governor of the State of Michigan, the Attorney General of the State of Michigan, the Staff of the MPSC and the owners of two large mines in the Upper Peninsula of Michigan, to resolve all objections these parties raised at the FERC and MPSC related to Wisconsin Energy’s proposed acquisition of Integrys. We believe that this agreement is in the best interest of our customers. In connection with the agreement, we entered into a non-binding term sheet to sell our Michigan electric distribution assets and the Presque Isle Power Plant to a third party. The carrying value of these assets is approximately $292 million as of December 31, 2014.
We are working to achieve a definitive agreement for the sale of these assets by the end of March 2015. This agreement would be subject to approval by several regulatory agencies including FERC, the PSCW and the MPSC. If we are able to reach a definitive agreement consistent with the financial terms of the non-binding term sheet, we would seek the recovery of approximately $190 million of net unrecovered plant costs from our remaining customers.
| Wisconsin Electric Power Company | A-65 | 2014 Annual Financial Statements |
| Deloitte & Touche LLP | ||
Suite 1400 555 East Wells Street Milwaukee, WI 53202-3824 USA | ||
Tel: +1 414 271 3000 Fax: +1 414 347 6200 www.deloitte.com |
REPORT OF INDEPENDENT REGISTERED PUBLIC ACCOUNTING FIRM
To the Board of Directors and Stockholders of
Wisconsin Electric Power Company:
We have audited the accompanying consolidated balance sheets and consolidated statements of capitalization of Wisconsin Electric Power Company and subsidiary (the “Company”) as of December 31, 2014 and 2013, and the related consolidated income statements, statements of common equity, and statements of cash flows for each of the three years in the period ended December 31, 2014. These consolidated financial statements are the responsibility of the Company’s management. Our responsibility is to express an opinion on these consolidated financial statements based on our audits.
We conducted our audits in accordance with the standards of the Public Company Accounting Oversight Board (United States). Those standards require that we plan and perform the audit to obtain reasonable assurance about whether the financial statements are free of material misstatement. The Company is not required to have, nor were we engaged to perform, an audit of its internal control over financial reporting. Our audits included consideration of internal control over financial reporting as a basis for designing audit procedures that are appropriate in the circumstances, but not for the purpose of expressing an opinion on the effectiveness of the Company’s internal control over financial reporting. Accordingly, we express no such opinion. An audit also includes examining, on a test basis, evidence supporting the amounts and disclosures in the financial statements, assessing the accounting principles used and significant estimates made by management, as well as evaluating the overall financial statement presentation. We believe that our audits provide a reasonable basis for our opinion.
In our opinion, such consolidated financial statements present fairly, in all material respects, the financial position of Wisconsin Electric Power Company and subsidiary as of December 31, 2014 and 2013, and the results of their operations and their cash flows for each of the three years in the period ended December 31, 2014, in conformity with accounting principles generally accepted in the United States of America.
 |
| Milwaukee, Wisconsin |
| February 27, 2015 |
Member of Deloitte Touche Tohmatsu Limited |
A-66
MARKET FOR OUR COMMON EQUITY
AND RELATED STOCKHOLDER MATTERS
Dividends declared on our common stock during the two most recent fiscal years are set forth below. Dividends were paid entirely in cash. Dividends were paid to our sole common stockholder, Wisconsin Energy. There is no established public trading market for our common stock.
Quarter | 2014 | 2013 | ||||||
| (Millions of Dollars) | ||||||||
First | $ | 110.0 | $ | 60.0 | ||||
Second | 110.0 | 110.0 | ||||||
Third | 110.0 | 60.0 | ||||||
Fourth | 60.0 | 110.0 | ||||||
|
|
|
| |||||
Total | $ | 390.0 | $ | 340.0 | ||||
|
|
|
| |||||
Subject to any regulatory restriction or other limitations on the payment of dividends, future dividends will be at the discretion of the board of directors and will depend upon, among other factors, our earnings, financial condition and other requirements.
Various financing arrangements and regulatory requirements impose certain restrictions on our ability to transfer funds to Wisconsin Energy in the form of cash dividends, loans or advances. Under Wisconsin law, we are prohibited from loaning funds, either directly or indirectly, to Wisconsin Energy. For additional information regarding restrictions on our ability to pay dividends, see Note H — Common Equity in the Notes to Consolidated Financial Statements.
BUSINESS OF THE COMPANY
We are an electric, gas and steam utility which was incorporated in the State of Wisconsin in 1896. Our operations are conducted in the following three reportable segments:
Electric Operations: We are the largest electric utility in the state of Wisconsin. We generate and distribute electric energy to approximately 1,133,600 customers in southeastern (including the metropolitan Milwaukee area), east central and northern Wisconsin and in the Upper Peninsula of Michigan.
Gas Operations: We purchase, distribute and sell natural gas to retail customers; we also transport customer-owned gas. We serve approximately 475,100 customers in three distinct service areas: west and south of the City of Milwaukee, the Appleton area and areas within Iron and Vilas Counties, Wisconsin. We began doing business with Wisconsin Gas, an affiliated gas utility, under the trade name “We Energies” in April 2002.
Steam Operations: We generate, distribute and sell steam supplied by our Valley and Milwaukee County Power Plants. Steam is used by approximately 440 customers in the metropolitan Milwaukee area for processing, space heating, domestic hot water and humidification.
For additional financial information about our business segments, see Results of Operations in Management’s Discussion and Analysis of Financial Condition and Results of Operations and Note O — Segment Reporting in the Notes to Consolidated Financial Statements.
| Wisconsin Electric Power Company | A-67 | 2014 Annual Financial Statements |
DIRECTORS AND EXECUTIVE OFFICERS
DIRECTORS
The information under “Nominees for Election to the Board of Directors” in Wisconsin Electric Power Company’s definitive Information Statement dated April 2, 2015, attached hereto, is incorporated herein by reference.
EXECUTIVE OFFICERS
The names and positions as of December 31, 2014 of Wisconsin Electric’s executive officers are listed below.
Gale E. Klappa – Chairman of the Board, President and Chief Executive Officer.
J. Patrick Keyes – Executive Vice President and Chief Financial Officer.
Allen L. Leverett – Executive Vice President.
Susan H. Martin – Executive Vice President, General Counsel and Corporate Secretary.
Kevin Fletcher – Senior Vice President – Customer Operations.
Robert M. Garvin – Senior Vice President – External Affairs.
Stephen P. Dickson – Vice President and Controller.
| Wisconsin Electric Power Company | A-68 | 2014 Annual Financial Statements |
[We Energies Letterhead]
VIA EDGAR AND OVERNIGHT DELIVERY
April 2, 2015
Securities and Exchange Commission
100 F Street, NE
Washington, DC 20549
| Re: | Wisconsin Electric Power Company |
Commission File No. 001-01245
Definitive Information Statement for 2015 Annual Meeting of Stockholders
Ladies and Gentlemen:
Transmitted herewith for filing via EDGAR, accompanied by a Schedule 14C cover page, are definitive copies of the letter to stockholders, notice of meeting and information statement which are scheduled to be furnished to stockholders beginning on or about April 2, 2015 in connection with the 2015 Annual Meeting of Stockholders of Wisconsin Electric Power Company (the “Company”) to be held on Thursday, April 30, 2015.
Directors of the Company will be elected at the 2015 Annual Meeting.
We are using an appendix to our information statement (Appendix A) to satisfy the requirements of Rule 14c-3(a) for an annual report to security holders. The letter to stockholders, notice of meeting and information statement (including the annual report) are being mailed to stockholders. Enclosed via overnight delivery with a hard copy of this letter, for the Commission’s information pursuant to Rule 14c-3(b), are seven copies of the information statement booklet containing the annual report. The annual report is not intended to be “filed” with the Commission, as such.
Please notify Mr. Steven Bain (414-221-2977 or steven.bain@we-energies.com) immediately if you have any questions regarding this information.
Very truly yours,
WISCONSIN ELECTRIC POWER COMPANY
/s/ Susan H. Martin
Susan H. Martin
Executive Vice President, General Counsel and Corporate Secretary
Enclosures