UNITED STATES
SECURITIES AND EXCHANGE COMMISSION
Washington, D.C. 20549
FORM N-CSR
CERTIFIED SHAREHOLDER REPORT OF REGISTERED MANAGEMENT INVESTMENT
COMPANIES
Investment Company Act file number 811-00216
| |
| Nicholas High Income Fund, Inc. |
|
| (Exact Name of Registrant as specified in charter) |
| |
| 411 East Wisconsin Avenue, Milwaukee, Wisconsin 53202 |
| (Address of Principal Executive Offices) | (Zip Code) |
| |
| Jennifer R. Kloehn, Senior Vice President and Treasurer |
| 411 East Wisconsin Avenue |
| Milwaukee, Wisconsin 53202 |
|
| (Name and Address of Agent for Service) |
Registrant's telephone number, including area code: 414-272-4650
Date of fiscal year end: 12/31/2020
Date of reporting period: 06/30/2020
Item 1. Report to Stockholders.
SEMIANNUAL REPORT
June 30, 2020
NICHOLAS HIGH
INCOME FUND, INC.

WWW.NICHOLASFUNDS.COM
NICHOLAS HIGH INCOME FUND, INC.
July 2020
Report to Fellow Shareholders:
This is the final Shareholder Letter for the Nicholas High Income Fund. The Fund’s Board of Directors voted to approve a plan to close and liquidate the Fund. In reaching their decision, the Board took into consideration the Fund’s total assets, the advisor’s ability to grow assets in the future, the Fund’s performance, and industry competition. The Nicholas High Income Fund was advised by Nicholas Company, Inc. from 1977 until July 2020. Nicholas has great appreciation for all the shareholders who invested in the Fund over this period.
Market Overview
The Nicholas High Income Fund (Fund) – Class I had a return of -4.39% for the six-months ended June 30, 2020, compared to the Morningstar High Yield Category return of -5.17% and the ICE BofAML U.S. High Yield Constrained Index of -4.84. The Fund’s returns during this period were negatively impacted due to initiating the Fund’s liquidation program resulting in greater than normal levels of cash.
The returns for high yield bonds rebounded sharply in the second quarter of 2020 following the massive fiscal and monetary stimulus programs launched to help individuals and corporations withstand the collapse of economic growth. The programs were designed to offset lost income from unemployment and allow companies to maintain payroll during the economic shutdown due to COVID. The objective for the programs was to build a bridge of time to allow the economy to recover from the pandemic.
The stock market suffered one of the swiftest declines in history with the Standard & Poor’s (S&P) 500 declining 34.7% from February 19, 2020 to the low point on March 23, 2020. Stocks and high yield corporate bonds across all sectors generally declined, but the stocks of companies most impacted by the spread of COVID were particularly hurt. Companies in industries such as entertainment, hospitality and travel fell hard. However, companies that would benefit from the new working from home (WFH) model benefitted greatly. These companies included information technology, cloud storage, network security and home delivery. The price performance between the stocks in these two disparate groups was dramatic. The trend toward WFH quickly accelerated as companies across the country deployed staff to work remotely from their homes. Many of these businesses adapted quickly and were able to maintain a level of production.
The high yield bond market tracked the volatility of the equity market during the sharp sell-off and recovery. The bond market quickly began to price in the damage to the economy and potential defaults as many businesses closed. The lessons learned from the financial crisis were quickly updated to maintain liquidity and confidence in the markets. One additional program allowed the Federal Reserve to purchase high yield bonds, which sent prices higher.
There are a number of risks that the market faces in the future including the continuing COVID pandemic, full high yield valuations, a struggling economic recovery, rising corporate defaults, and volatility related to the upcoming political cycle. We believe current spreads, or valuations, do not provide a suitable margin of safety given the risks cited above.
Performance
Nicholas High Income Fund - Class I produced a net return of -4.39% for the period ended June 30, 2020. Returns for Nicholas High Income Fund, Inc. Class I and N, and selected indices are provided in the chart below for the periods ended June 30, 2020. The Fund and Morningstar performance data is net of fees, while the ICE BofAML Indices are gross of fees.
| | | | | | | | | | | | | | |
| | | | | | Average Annual Total Return | |
| | | 6 Month | | | 1 Year | | 3 Year | | | 5 Year | | | 10 Year | |
| Nicholas High Income | | | | | | | | | | | | | | |
| Fund, Inc. – Class I | | -4.39 | % | | -0.88 | % | 1.70 | % | | 2.29 | % | | 4.87 | % |
| Nicholas High Income | | | | | | | | | | | | | | |
| Fund, Inc. – Class N | | -4.31 | % | | -0.88 | % | 1.51 | % | | 2.02 | % | | 4.55 | % |
| ICE BofAML US High Yield | | | | | | | | | | | | | | |
| Constrained Index | | -4.84 | % | | -1.17 | % | 2.92 | % | | 4.57 | % | | 6.46 | % |
| ICE BofAML US High Yield | | | | | | | | | | | | | | |
| BB-B Bond Index | | -3.49 | % | | 0.66 | % | 3.65 | % | | 4.79 | % | | 6.57 | % |
| Morningstar High Yield | | | | | | | | | | | | | | |
| Bond Funds Category | | -5.17 | % | | -1.89 | % | 2.04 | % | | 3.38 | % | | 5.49 | % |
| Ending value of $10,000 invested | | | | | | | | | | | | | | |
| in Nicholas High Income | | | | | | | | | | | | | | |
| Fund, Inc. – Class I | $ | 9,561 | | $ | 9,912 | $ | 10,520 | | $ | 11,198 | | $ | 16,089 | |
| Ending value of $10,000 invested | | | | | | | | | | | | | | |
| in Nicholas High Income | | | | | | | | | | | | | | |
| Fund, Inc. – Class N | $ | 9,569 | | $ | 9,912 | | $10,460 | | $ | 11,051 | | $ | 15,598 | |
| Fund’s Class I Expense Ratio (from 04/29/20 Prospectus): 0.74% |
| Fund’s Class N Expense Ratio (from 04/29/20 Prospectus): 0.94% |
The Fund’s expense ratios for the for the current period can be found in the financial highlights included within this report.
Performance data quoted represents past performance and is no guarantee of future results. The investment return and principal value of an investment will fluctuate so that an investor’s shares, when redeemed, may be worth more or less than their original cost. Current performance of the Fund may be lower or higher than the performance quoted. Performance data current to the most recent month-end may be obtained by visiting www.nicholasfunds.com/returns.html.
The ending values above illustrate the performance of a hypothetical $10,000 investment made in the Fund over the timeframes listed. Assumes reinvestment of dividends and capital gains. Returns shown do not reflect the deduction of taxes that a shareholder would pay on Fund distributions or the redemption of Fund shares. These figures do not imply any future performance.
Class I shares and Class N shares are invested in the same portfolio of securities. Annual returns will generally differ only to the extent that the classes do not have the same expenses. Please see the respective prospectus for details.
Thank you again for your investment and support of the Nicholas High Income Fund.
Regards,

Lawrence J. Pavelec, CFA
Senior Vice President
Portfolio Manager
The information above represents the opinions of the Fund manager, is subject to change, and any forecasts made cannot be guaranteed.
Mutual fund investing involves risk. Principal loss is possible. Investments in debt securities typically decrease in value when interest rates rise. This risk is usually greater for longer-term debt securities. Investment by the Fund in lower-rated and non-rated securities presents a greater risk of loss to principal and interest than higher-rated securities. The Fund may invest in illiquid securities which involve the risk that the securities will not be able to be sold at the time or prices desired by the fund, particularly during times of market turmoil.
Current and future portfolio holdings are subject to risk.
High yield bond spread is the percentage difference in current yields of various classes of high-yield bonds compared against investment-grade corporate bonds, Treasury bonds, or another benchmark bond measure.
Index Definitions - You cannot invest directly in an index.
The ICE BofAML US High Yield Index tracks the performance of US dollar denominated below investment grade corporate debt publicly issued in the US domestic market. Qualifying securities must have at least one year remaining term to final maturity, a fixed coupon schedule and a minimum amount outstanding of $250 million.
The ICE BoAML US High Yield Constrained Index limits any individual issuer included in the ICE BoAML US High Yield Index to a maximum of 2% benchmark exposure.
The ICE BoAML BB-B US High Yield Index is a subset of the ICE BoAML US High Yield Index including all securities rated BB1 through B3, inclusive.
The S&P 500 Index is a broad-based unmanaged index of 500 stocks, which is widely recognized as representative of the equity market in general.
Each Morningstar Category average represents a universe of Funds with similar invest objectives.
Must be preceded or accompanied by a prospectus.
The Nicholas Funds are distributed by Quasar Distributors, LLC.
Financial Highlights Class I (NCINX)
For a share outstanding throughout each period
| | | | | | | | | | | | | | | | | | |
| | | Six Months | | | | | | | | | | | | | | | | |
| | | Ended | | | | | | | | | | | | | | | | |
| | | 06/30/2020 | | | | | | Years Ended December 31, | | | | |
| | | (unaudited) | | | 2019 | | | 2018 | | | 2017 | | | 2016 | | | 2015 | |
| NET ASSET VALUE, | | | | | | | | | | | | | | | | | | |
| BEGINNING OF PERIOD | $ | 9.03 | | $ | 8.36 | | $ | 9.00 | | $ | 9.08 | | $ | 8.65 | | $ | 9.52 | |
| INCOME (LOSS) FROM | | | | | | | | | | | | | | | | | | |
| INVESTMENT OPERATIONS | | | | | | | | | | | | | | | | | | |
| Net investment income. | | .16 | (1) | | .38 | (1) | | .39 | (1) | | .44 | (1) | | .43 | (1) | | .43 | |
| Net gain (loss) on securities | | | | | | | | | | | | | | | | | | |
| (realized and unrealized) | | (.56 | ) | | .67 | | | (.64 | ) | | (.05 | ) | | .42 | | | (.84 | ) |
| Total from | | | | | | | | | | | | | | | | | | |
| investment operations | | (.40 | ) | | 1.05 | | | (.25 | ) | | .39 | | | .85 | | | (.41 | ) |
| LESS DISTRIBUTIONS | | | | | | | | | | | | | | | | | | |
| From net investment income | | (.09 | ) | | (.38 | ) | | (.39 | ) | | (.47 | ) | | (.42 | ) | | (.46 | ) |
| NET ASSET VALUE, | | | | | | | | | | | | | | | | | | |
| END OF PERIOD | $ | 8.54 | | $ | 9.03 | | $ | 8.36 | | $ | 9.00 | | $ | 9.08 | | $ | 8.65 | |
| |
| TOTAL RETURN | | (4.39 | )%(2) | | 12.68 | % | | (2.86 | )% | | 4.28 | % | | 9.94 | % | | (4.54 | )% |
| |
| SUPPLEMENTAL DATA: | | | | | | | | | | | | | | | | | | |
| Net assets, end of | | | | | | | | | | | | | | | | | | |
| period (millions) | $ | 95.5 | | $ | 104.6 | | $ | 95.0 | | $ | 101.9 | | $ | 100.5 | | $ | 93.1 | |
| Ratio of expenses | | | | | | | | | | | | | | | | | | |
| to average net assets | | .76 | %(3) | | .73 | % | | .72 | % | | .69 | % | | .68 | % | | .70 | % |
| Ratio of net investment income | | | | | | | | | | | | | | | | | | |
| to average net assets | | 3.78 | %(3) | | 4.26 | % | | 4.38 | % | | 4.80 | % | | 4.83 | % | | 4.61 | % |
| Portfolio turnover rate | | 29.19 | %(3) | | 30.24 | % | | 45.30 | % | | 44.80 | % | | 44.28 | % | | 41.30 | % |
| (1) | Computed based on average shares outstanding. |
| (2) | Not annualized. |
| (3) | Annualized. |
The accompanying notes to financial statements are an integral part of these highlights.
– 4–
Financial Highlights Class N (NNHIX)
For a share outstanding throughout each period
| | | | | | | | | | | | | | | | | | |
| | | Six Months | | | | | | | | | | | | | | | | |
| | | Ended | | | | | | | | | | | | | | | | |
| | | 06/30/2020 | | | | | | Years Ended December 31, | | | | |
| | | (unaudited) | | | 2019 | | | 2018 | | | 2017 | | | 2016 | | | 2015 | |
| NET ASSET VALUE, | | | | | | | | | | | | | | | | | | |
| BEGINNING OF PERIOD | $ | 9.20 | | $ | 8.52 | | $ | 9.16 | | $ | 9.22 | | $ | 8.78 | | $ | 9.66 | |
| INCOME (LOSS) FROM | | | | | | | | | | | | | | | | | | |
| INVESTMENT OPERATIONS | | | | | | | | | | | | | | | | | | |
| Net investment income. | | .17 | (1) | | .37 | (1) | | .36 | (1) | | .43 | (1) | | .40 | (1) | | .39 | |
| Net gain (loss) on securities | | | | | | | | | | | | | | | | | | |
| (realized and unrealized) | | (.57 | ) | | .67 | | | (.64 | ) | | (.06 | ) | | .43 | | | (.85 | ) |
| Total from | | | | | | | | | | | | | | | | | | |
| investment operations | | (.40 | ) | | 1.04 | | | (.28 | ) | | .37 | | | .83 | | | (.46 | ) |
| LESS DISTRIBUTIONS | | | | | | | | | | | | | | | | | | |
| From net investment income | | (.09 | ) | | (.36 | ) | | (.36 | ) | | (.43 | ) | | (.39 | ) | | (.42 | ) |
| NET ASSET VALUE, | | | | | | | | | | | | | | | | | | |
| END OF PERIOD | $ | 8.71 | | $ | 9.20 | | $ | 8.52 | | $ | 9.16 | | $ | 9.22 | | $ | 8.78 | |
| |
| TOTAL RETURN | | (4.31 | )%(2) | | 12.32 | % | | (3.12 | )% | | 4.03 | % | | 9.58 | % | | (4.97 | )% |
| |
| SUPPLEMENTAL DATA: | | | | | | | | | | | | | | | | | | |
| Net assets, end of | | | | | | | | | | | | | | | | | | |
| period (millions) | $ | 1.1 | | $ | 1.8 | | $ | 2.4 | | $ | 3.3 | | $ | 8.1 | | $ | 2.7 | |
| Ratio of expenses | | | | | | | | | | | | | | | | | | |
| to average net assets | | .77 | %(3) | | .93 | % | | 1.03 | % | | 1.02 | % | | 1.03 | % | | 1.05 | % |
| Ratio of net investment income | | | | | | | | | | | | | | | | | | |
| to average net assets | | 3.78 | %(3) | | 4.06 | % | | 4.08 | % | | 4.55 | % | | 4.42 | % | | 4.29 | % |
| Portfolio turnover rate | | 29.19 | %(3) | | 30.24 | % | | 45.30 | % | | 44.80 | % | | 44.28 | % | | 41.30 | % |
| (1) | Computed based on average shares outstanding. |
| (2) | Not annualized. |
| (3) | Annualized. |
The accompanying notes to financial statements are an integral part of these highlights.
– 5–
Top Ten Portfolio Issuers
June 30, 2020 (unaudited)
| | |
| | Percentage | |
| Name | of Net Assets | |
| Lamb Weston Holdings, Inc. | 2.15 | % |
| Panther BF Aggregator 2 LP | 2.14 | % |
| CDW LLC | 1.93 | % |
| IQVIA Inc. | 1.86 | % |
| XPO Logistics, Inc. | 1.83 | % |
| iShares iBoxx $ High Yield Corporate Bond ETF | 1.82 | % |
| IHS Markit Ltd. | 1.74 | % |
| PolyOne Corporation | 1.68 | % |
| Ball Corporation | 1.67 | % |
| MPLX LP | 1.67 | % |
| Total of top ten | 18.49 | % |
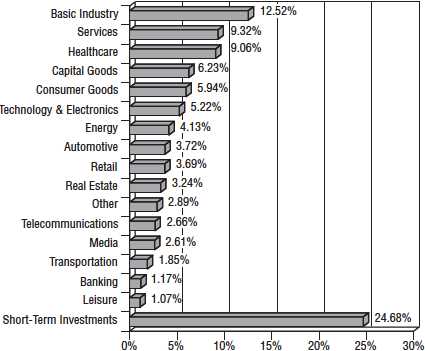
Sector Diversification (as a percentage of portfolio)
June 30, 2020 (unaudited)
– 6–
Fund Expenses
For the six month period ended June 30, 2020 (unaudited)
As a shareholder of the Fund, you incur two types of costs: (1) transaction costs and (2) ongoing costs, including management fees and other operating expenses. The following table is intended to help you understand your ongoing costs (in dollars) of investing in the Fund and to compare these costs with those of other mutual funds.
The example is based on an investment of $1,000 made at the beginning of the period and held for the entire period.
The first line of the table below for each share class of the Fund provides information about the actual account values and actual expenses. You may use the information in this line, together with the amount you invested, to estimate the expenses that you paid over the period. Simply divide your account value by $1,000 (for example, an $8,600 account value divided by $1,000 = 8.6), then multiply the result by the number in the first line under the heading entitled “Expenses Paid During Period” to estimate the expenses you paid on your account during this period.
The second line of the table below provides information about hypothetical account values and hypothetical expenses based on the Fund’s actual expense ratios for each class of the Fund and an assumed rate of return of 5% per year before expenses, which are not the Fund’s actual returns. The hypothetical account values and expenses may not be used to estimate the actual ending account balance or expenses you paid for the period. You may use this information to compare the ongoing costs of investing in the Fund with other funds. To do so, compare this 5% hypothetical example with the 5% hypothetical examples that appear in the shareholder reports of other funds.
Please note that the expenses shown in the table are meant to highlight your ongoing costs only and do not reflect any transactional costs, such as wire fees. Therefore, the second line of the table is useful in comparing ongoing costs only, and will not help you determine the relative total costs of owning different funds. In addition, if these transactional costs were included, your costs would have been higher.
| | | | | | |
| Class I | | | | | | |
| | | Beginning | | Ending | | Expenses |
| | | Account | | Account | | Paid During |
| | | Value | | Value | | Period* |
| | | 12/31/19 | | 06/30/20 | | 01/01/20 - 06/30/20 |
| Actual | $ | 1,000.00 | $ | 956.10 | $ | 3.70 |
| Hypothetical | | 1,000.00 | | 1,021.22 | | 3.82 |
| (5% return before expenses) | | | | | | |
| * | Expenses are equal to the Class I six-month annualized expense ratio of 0.76%, multiplied by the average account value over the period, multiplied by 182 then divided by 366 to reflect the one-half year period. |
– 7–
Fund Expenses (continued)
For the six month period ended June 30, 2020 (unaudited)
| | | | | | |
| Class N | | | | | | |
| | | Beginning | | Ending | | Expenses |
| | | Account | | Account | | Paid During |
| | | Value | | Value | | Period** |
| | | 12/31/19 | | 06/30/20 | | 01/01/20 - 06/30/20 |
| Actual | $ | 1,000.00 | $ | 956.90 | $ | 3.75 |
| Hypothetical | | 1,000.00 | | 1,021.17 | | 3.87 |
| (5% return before expenses) | | | | | | |
| ** | Expenses are equal to the Class N six-month annualized expense ratio of 0.77%, multiplied by the average account value over the period, multiplied by 182 then divided by 366 to reflect the one-half year period. |
– 8–
Schedule of Investments
June 30, 2020 (unaudited)
| | | | |
| | Shares or | | | |
| | Principal | | | |
| | Amount | | | Value |
| NON-CONVERTIBLE BONDS — 71.19% | | |
| | | Automotive – Parts & Equipment — 3.68% | | |
| $ | 1,500,000 | Allison Transmission, Inc. 144A restricted, 5.00%, 10/01/24 | $ | 1,496,250 |
| | 2,000,000 | Panther BF Aggregator 2 LP 144A restricted, 6.25%, 05/15/26 | | 2,062,500 |
| | | | | 3,558,750 |
| | | Banking — 1.16% | | |
| | 1,100,000 | CIT Group Inc. 5.00%, 08/01/23 | | 1,121,890 |
| | | Basic Industry – Building & Construction — 1.61% | | |
| | 500,000 | KB Home 7.625%, 05/15/23 | | 545,000 |
| | 1,000,000 | Lennar Corporation 4.125%, 01/15/22 | | 1,012,500 |
| | | | | 1,557,500 |
| | | Basic Industry – Building Materials — 3.93% | | |
| | 1,250,000 | American Woodmark Corporation 144A restricted, 4.875%, 03/15/26 | | 1,221,875 |
| | 1,100,000 | Beacon Roofing Supply, Inc. 144A restricted, 4.50%, 11/15/26 | | 1,075,932 |
| | 1,000,000 | HD Supply, Inc. 144A restricted, 5.375%, 10/15/26 | | 1,021,250 |
| | 500,000 | JELD-WEN, Inc. 144A restricted, 4.625%, 12/15/25 | | 480,000 |
| | | | | 3,799,057 |
| | | Basic Industry – Chemicals — 1.68% | | |
| | 1,500,000 | PolyOne Corporation 5.25%, 03/15/23 | | 1,620,000 |
| | | Basic Industry – Forestry & Paper — 2.58% | | |
| | 1,500,000 | Louisiana-Pacific Corporation 4.875%, 09/15/24 | | 1,511,565 |
| | 1,000,000 | Mercer International Inc. 6.50%, 02/01/24 | | 982,710 |
| | | | | 2,494,275 |
| | | Basic Industry – Metal/Mining Excluding Steel — 2.59% | | |
| | 500,000 | Alcoa Nederland Holding B.V. 144A restricted, 6.75%, 09/30/24 | | 510,625 |
| | 1,000,000 | Arconic Inc. 5.125%, 10/01/24 | | 1,035,860 |
| | 1,000,000 | Kaiser Aluminum Corporation 144A restricted, 4.625%, 03/01/28 | | 956,320 |
| | | | | 2,502,805 |
| | | Capital Goods – Aerospace/Defense — 1.46% | | |
| | 1,000,000 | Moog Inc. 144A restricted, 4.25%, 12/15/27 | | 970,000 |
| | 500,000 | TransDigm Inc. 144A restricted, 5.50%, 11/15/27 | | 436,350 |
| | | | | 1,406,350 |
| | | Capital Goods – Machinery — 0.94% | | |
| | 1,000,000 | Terex Corporation 144A restricted, 5.625%, 02/01/25 | | 910,000 |
| | | Capital Goods – Packaging — 3.76% | | |
| | 500,000 | Ball Corporation 4.00%, 11/15/23 | | 518,750 |
| | 1,000,000 | Ball Corporation 5.25%, 07/01/25 | | 1,093,750 |
| | 500,000 | Crown Americas LLC 4.25%, 09/30/26 | | 511,250 |
| | 1,500,000 | Reynolds Group Holdings Limited 144A restricted, 5.125%, 07/15/23 | | 1,511,385 |
| | | | | 3,635,135 |
The accompanying notes to financial statements are an integral part of this schedule.
– 9–
Schedule of Investments (continued)
June 30, 2020 (unaudited)
| | | | |
| | Shares or | | | |
| | Principal | | | |
| | Amount | | | Value |
| | NON-CONVERTIBLE BONDS — 71.19% (continued) | | |
| | | Consumer Goods – Food-Wholesale — 4.79% | | |
| $ | 1,500,000 | JBS USA, LLC/Finance, Inc. 144A restricted, 5.875%, 07/15/24 | $ | 1,520,625 |
| | 1,000,000 | Lamb Weston Holdings, Inc. 144A restricted, 4.625%, 11/01/24 | | 1,037,500 |
| | 1,000,000 | Lamb Weston Holdings, Inc. 144A restricted, 4.875%, 11/01/26 | | 1,035,000 |
| | 1,000,000 | Post Holdings, Inc. 144A restricted, 5.625%, 01/15/28 | | 1,035,000 |
| | | | | 4,628,125 |
| | | Consumer Goods – Personal & Household Products — 1.09% | | |
| | 1,000,000 | Newell Rubbermaid Inc. 4.45%, 04/01/26 | | 1,049,410 |
| | | Energy – Gas-Distribution — 4.09% | | |
| | 500,000 | Cheniere Corpus Christi Holdings, LLC 5.125%, 06/30/27 | | 549,435 |
| | 500,000 | Cheniere Energy Partners, L.P. 144A restricted, 4.50%, 10/01/29 | | 484,375 |
| | 1,550,000 | MPLX LP 5.25%, 01/15/25 | | 1,611,735 |
| | 1,000,000 | Transcontinental Gas Pipe Line Company, LLC 7.85%, 02/01/26 | | 1,301,655 |
| | | | | 3,947,200 |
| | | Healthcare – Facilities — 4.47% | | |
| | 1,000,000 | HCA Inc. 5.00%, 03/15/24 | | 1,111,501 |
| | 750,000 | HealthSouth Corporation 5.75%, 09/15/25 | | 765,000 |
| | 1,000,000 | LifePoint Health, Inc. 144A restricted, 4.375%, 02/15/27 | | 945,000 |
| | 500,000 | Tenet Healthcare Corporation 144A restricted, 7.50%, 04/01/25 | | 531,875 |
| | 1,000,000 | Tenet Healthcare Corporation 5.125%, 05/01/25 | | 965,210 |
| | | | | 4,318,586 |
| | | Healthcare – Services — 4.49% | | |
| | 1,000,000 | DaVita HealthCare Partners Inc. 5.125%, 07/15/24 | | 1,017,500 |
| | 1,750,000 | IQVIA Inc. 144A restricted, 5.00%, 05/15/27 | | 1,793,204 |
| | 1,500,000 | Service Corporation International 5.375%, 05/15/24 | | 1,528,125 |
| | | | | 4,338,829 |
| | | Leisure – Gaming — 1.06% | | |
| | 1,000,000 | International Game Technology PLC 144A restricted, 6.25%, 01/15/27 | | 1,025,000 |
| | | Media – Advertising — 0.52% | | |
| | 500,000 | Twitter, Inc. 144A restricted, 3.875%, 12/15/27 | | 500,050 |
| | | Media – Content — 2.07% | | |
| | 1,500,000 | AMC Networks Inc. 4.75%, 08/01/25 | | 1,477,800 |
| | 500,000 | Netflix, Inc. 4.375%, 11/15/26 | | 520,085 |
| | | | | 1,997,885 |
| | | Real Estate – REITs — 2.69% | | |
| | 1,500,000 | Equinix, Inc. 5.875%, 01/15/26 | | 1,578,600 |
| | 500,000 | MPT Operating Partnership, L.P. 5.00%, 10/15/27 | | 513,750 |
| | 500,000 | MPT Operating Partnership, L.P. 4.625%, 08/01/29 | | 502,500 |
| | | | | 2,594,850 |
The accompanying notes to financial statements are an integral part of this schedule.
– 10 –
Schedule of Investments (continued)
June 30, 2020 (unaudited)
| | | | |
| | Shares or | | | |
| | Principal | | | |
| | Amount | | | Value |
| | NON-CONVERTIBLE BONDS — 71.19% (continued) | | |
| | | Retail – Food & Drug Retailer — 0.53% | | |
| $ | 500,000 | Murphy Oil USA, Inc. 4.75%, 09/15/29 | $ | 511,250 |
| | | Retail – Restaurants — 1.09% | | |
| | 500,000 | KFC Holding Co. 144A restricted, 5.25%, 06/01/26 | | 512,500 |
| | 500,000 | Yum! Brands, Inc. 144A restricted, 7.75%, 04/01/25 | | 539,375 |
| | | | | 1,051,875 |
| | | Retail – Specialty Retail — 2.04% | | |
| | 1,000,000 | Levi Strauss & Co. 5.00%, 05/01/25 | | 1,003,760 |
| | 1,000,000 | Wolverine World Wide, Inc. 144A restricted, 5.00%, 09/01/26 | | 962,500 |
| | | | | 1,966,260 |
| | | Services – Environmental — 1.05% | | |
| | 1,000,000 | Covanta Holding Corporation 5.875%, 07/01/25 | | 1,012,500 |
| | | Services – Support-Services — 8.18% | | |
| | 1,500,000 | ADT Corporation (The) 3.50%, 07/15/22 | | 1,491,000 |
| | 1,000,000 | Aramark Services, Inc. 4.75%, 06/01/26 | | 962,500 |
| | 1,500,000 | IHS Markit Ltd. 144A restricted, 4.75%, 02/15/25 | | 1,680,000 |
| | 1,500,000 | Ritchie Bros. Auctioneers Incorporated | | |
| | | 144A restricted, 5.375%, 01/15/25 | | 1,543,125 |
| | 673,000 | ServiceMaster Company, LLC (The) | | |
| | | 144A restricted, 5.125%, 11/15/24 | | 682,254 |
| | 1,500,000 | United Rentals (North America), Inc. 5.50%, 07/15/25 | | 1,539,375 |
| | | | | 7,898,254 |
| | | Technology & Electronics – Electronics — 1.11% | | |
| | 1,000,000 | Amkor Technology, Inc. 144A restricted, 6.625%, 09/15/27 | | 1,070,370 |
| | | Technology & Electronics – Hardware & Equipment — 1.93% | | |
| | 1,250,000 | CDW LLC 5.50%, 12/01/24 | | 1,359,113 |
| | 500,000 | CDW LLC 4.25%, 04/01/28 | | 509,530 |
| | | | | 1,868,643 |
| | | Technology & Electronics – Software & Services — 2.13% | | |
| | 1,000,000 | Nuance Communications, Inc. 5.625%, 12/15/26 | | 1,040,000 |
| | 1,000,000 | SS&C Technologies, Inc. 144A restricted, 5.50%, 09/30/27 | | 1,014,640 |
| | | | | 2,054,640 |
| | | Telecommunications – Wireless — 1.58% | | |
| | 500,000 | SBA Communications Corporation 4.875%, 09/01/24 | | 511,875 |
| | 1,000,000 | T-Mobile USA, Inc. 4.50%, 02/01/26 | | 1,011,960 |
| | | | | 1,523,835 |
| | | Telecommunications – Wireline Integrated & Services — 1.06% | | |
| | 1,000,000 | Cincinnati Bell Inc. 144A restricted, 7.00%, 07/15/24 | | 1,020,000 |
The accompanying notes to financial statements are an integral part of this schedule.
– 11 –
Schedule of Investments (continued)
June 30, 2020 (unaudited)
| | | | |
| | Shares or | | | |
| | Principal | | | |
| | Amount | | | Value |
| | NON-CONVERTIBLE BONDS — 71.19% (continued) | | |
| | | Transportation – Infrastructure/Services — 1.83% | | |
| $ | 250,000 | XPO Logistics, Inc. 144A restricted, 6.50%, 06/15/22 | $ | 250,312 |
| | 1,500,000 | XPO Logistics, Inc. 144A restricted, 6.125%, 09/01/23 | | 1,518,750 |
| | | | | 1,769,062 |
| | | TOTAL NON-CONVERTIBLE BONDS | | |
| | | (cost $67,975,563) | | 68,752,386 |
| | CONVERTIBLE PREFERRED STOCK — 0.52% | | |
| | | Real Estate – REITs — 0.52% | | |
| | 20,009 | Digital Realty Trust, Inc. 5.25%, Cumulative, Redeemable, Series J | | |
| | | (cost $482,608) | | 506,628 |
| | COMMON STOCKS — 2.87% | | |
| | | Other — 2.87% | | |
| | 21,500 | iShares iBoxx $ High Yield Corporate Bond ETF | | 1,754,830 |
| | 10,000 | SPDR Bloomberg Barclays High Yield Bond ETF | | 1,011,600 |
| | | TOTAL COMMON STOCKS | | |
| | | (cost $2,766,268) | | 2,766,430 |
The accompanying notes to financial statements are an integral part of this schedule.
– 12 –
Schedule of Investments (continued)
June 30, 2020 (unaudited)
| | | | |
| | Shares or | | | |
| | Principal | | | |
| | Amount | | | Value |
| SHORT-TERM INVESTMENTS — 24.44% | | |
| | | U.S. Government Securities — 19.16% | | |
| $ | 4,000,000 | U.S. Treasury Bill 07/02/2020, 0.065% | $ | 3,999,993 |
| | 5,000,000 | U.S. Treasury Bill 07/07/2020, 0.051% | | 4,999,958 |
| | 5,000,000 | U.S. Treasury Bill 07/09/2020, 0.057% | | 4,999,938 |
| | 2,500,000 | U.S. Treasury Bill 07/16/2020, 0.035% | | 2,499,964 |
| | 1,000,000 | U.S. Treasury Bill 07/30/2020, 0.041% | | 999,968 |
| | 1,000,000 | U.S. Treasury Bill 08/13/2020, 0.051% | | 999,940 |
| | | | | 18,499,761 |
| | | Money Market Funds — 5.28% | | |
| | 3,612,935 | Invesco Treasury Portfolio Short-Term Investments Trust | | |
| | | (Institutional Class), 7-day net yield 0.08% | | 3,612,935 |
| | 1,483,978 | Morgan Stanley Liquidity Funds Government Portfolio | | |
| | | (Institutional Class), 7-day net yield 0.05% | | 1,483,978 |
| | | | | 5,096,913 |
| | | TOTAL SHORT-TERM INVESTMENTS | | |
| | | (cost $23,596,674) | | 23,596,674 |
| | | TOTAL INVESTMENTS | | |
| | | (cost $94,821,113) — 99.02% | | 95,622,118 |
| | | OTHER ASSETS, NET OF LIABILITIES — 0.98% | | 948,981 |
| | | TOTAL NET ASSETS | | |
| | | (basis of percentages disclosed above) — 100% | $ | 96,571,099 |
Securities purchased pursuant to Rule 144A under the Securities Act of 1933 may be sold in transactions exempt from registration only to qualified institutional buyers or in a public offering registered under the Securities Act of 1933.
The accompanying notes to financial statements are an integral part of this schedule.
– 13 –
Statement of Assets and Liabilities
June 30, 2020 (unaudited)
| | | | |
| ASSETS | | | | |
| Investments in securities at value (cost $94,821,113) | $ | | 95,622,118 | |
| Interest receivable | | | 1,064,284 | |
| Other | | | 7,044 | |
| Total assets | | | 96,693,446 | |
| |
| LIABILITIES | | | | |
| Payables — | | | | |
| Due to adviser — | | | | |
| Management fee | | | 36,184 | |
| Accounting and administrative fee | | | 4,098 | |
| Total due to adviser | | | 40,282 | |
| 12b-1 and servicing fee | | | 22,327 | |
| Other payables and accrued expense | | | 59,738 | |
| Total liabilities | | | 122,347 | |
| Total net assets | $ | | 96,571,099 | |
| |
| NET ASSETS CONSIST OF | | | | |
| Paid in capital | $ | | 109,927,518 | |
| Accumulated distributable earnings (loss) | | | (13,356,419 | ) |
| Total net assets | $ | | 96,571,099 | |
| |
| Class I | | | | |
| Net assets | | $ | 95,506,720 | |
| Shares outstanding | | | 11,180,863 | |
| NET ASSET VALUE PER SHARE ($.05 par value, 75,000,000 | | | | |
| shares authorized), offering price and redemption price | | $ | 8.54 | |
| |
| Class N | | | | |
| Net assets | | $ | 1,064,379 | |
| Shares outstanding | | | 122,215 | |
| NET ASSET VALUE PER SHARE ($.05 par value, 25,000,000 | | | | |
| shares authorized), offering price and redemption price | | $ | 8.71 | |
The accompanying notes to financial statements are an integral part of this statement.
– 14 –
Statement of Operations
For the six months ended June 30, 2020 (unaudited)
| | | |
| INCOME | | | |
| Interest | $ | 2,172,548 | |
| Dividend | | 58,954 | |
| Other | | 49,115 | |
| Total income | | 2,280,617 | |
| |
| EXPENSES | | | |
| Management fee | | 224,406 | |
| Registration fees | | 28,760 | |
| Accounting system and pricing service fees | | 25,700 | |
| Accounting and administrative fees | | 24,863 | |
| Transfer agent fees | | 23,971 | |
| Audit and tax fees | | 18,000 | |
| Directors’ fees | | 9,525 | |
| Printing | | 7,615 | |
| Legal fees | | 6,455 | |
| Custodian fees | | 2,497 | |
| Insurance | | 2,270 | |
| Postage and mailing | | 1,867 | |
| 12b-1 fees – Class N | | 82 | |
| Other operating expenses | | 6,204 | |
| Total expenses | | 382,215 | |
| Net investment income | | 1,898,402 | |
| |
| NET REALIZED LOSS ON INVESTMENTS | | (4,101,001 | ) |
| |
| CHANGE IN NET UNREALIZED APPRECIATION/DEPRECIATION | | | |
| ON INVESTMENTS | | (2,447,051 | ) |
| Net realized and unrealized loss on investments | | (6,548,052 | ) |
| Net decrease in net assets resulting from operations | $ | (4,649,650 | ) |
The accompanying notes to financial statements are an integral part of this statement.
– 15 –
Statements of Changes in Net Assets
For the six months ended June 30, 2020 (unaudited)
and the year ended December 31, 2019
| | | | | | |
| | | Six Months Ended | | | | |
| | | 06/30/2020 | | | Year Ended | |
| | | (unaudited) | | | 12/31/2019 | |
| INCREASE (DECREASE) IN | | | | | | |
| NET ASSETS FROM OPERATIONS | | | | | | |
| Net investment income | $ | 1,898,402 | | $ | 4,393,499 | |
| Net realized loss on investments | | (4,101,001 | ) | | (657,127 | ) |
| Change in net unrealized | | | | | | |
| appreciation/depreciation on investments | | (2,447,051 | ) | | 8,363,809 | |
| Net increase (decrease) in net | | | | | | |
| assets resulting from operations | | (4,649,650 | ) | | 12,100,181 | |
| |
| DISTRIBUTIONS TO SHAREHOLDERS | | | | | | |
| From investment operations – Class I | | (1,059,487 | ) | | (4,334,022 | ) |
| From investment operations – Class N | | (14,019 | ) | | (59,671 | ) |
| Total distributions | | (1,073,506 | ) | | (4,393,693 | ) |
| |
| CAPITAL SHARE TRANSACTIONS | | | | | | |
| Proceeds from shares issued – Class I | | | | | | |
| (205,747 and 272,316 shares, respectively) | | 1,819,964 | | | 2,416,467 | |
| Reinvestment of distributions – Class I | | | | | | |
| (113,412 and 435,716 shares, respectively) | | 949,255 | | | 3,900,532 | |
| Cost of shares redeemed – Class I | | | | | | |
| (727,401 and 481,379 shares, respectively) | | (6,235,858 | ) | | (4,284,667 | ) |
| Proceeds from shares issued – Class N | | | | | | |
| (107,875 and 212,399 shares, respectively) | | 913,927 | | | 1,926,595 | |
| Reinvestment of distributions – Class N | | | | | | |
| (1,240 and 5,216 shares, respectively) | | 10,577 | | | 47,574 | |
| Cost of shares redeemed – Class N | | | | | | |
| (183,441 and 300,184 shares, respectively) | | (1,613,687 | ) | | (2,682,908 | ) |
| Change in net assets derived from | | | | | | |
| capital share transactions | | (4,155,822 | ) | | 1,323,593 | |
| Total increase (decrease) in net assets | | (9,878,978 | ) | | 9,030,081 | |
| |
| NET ASSETS | | | | | | |
| Beginning of period | | 106,450,077 | | | 97,419,996 | |
| End of period | $ | 96,571,099 | | $ | 106,450,077 | |
The accompanying notes to financial statements are an integral part of these statements.
– 16 –
Notes to Financial Statements
June 30, 2020 (unaudited)
These financial statements have been prepared pursuant to reporting rules for interim financial statements. Accordingly, these financial statements do not include all of the information and footnotes required by generally accepted accounting principles (“GAAP”) for annual financial statements. These financial statements should be read in conjunction with the financial statements and financial highlights and notes in the Fund’s Annual Report on Form N-CSR for the year ended December 31, 2019.
These financial statements have not been audited. Management believes that these financial statements include all adjustments (which, unless otherwise noted, include only normal recurring adjustments) necessary for a fair presentation of the financial results for each period shown.
(1) Summary of Significant Accounting Policies —
Nicholas High Income Fund, Inc. (the “Fund”) is organized as a Maryland corporation and is registered as an open-end, diversified management investment company under the Investment Company Act of 1940, as amended. The primary objective of the Fund is high current income consistent with the preservation and conservation of capital values. The following is a summary of the significant accounting policies of the Fund:
(a) Equity securities traded on a stock exchange will ordinarily be valued on the basis of the last sale price on the date of valuation on the securities principal exchange, or if in the absence of any sale on that day, the closing bid price. For securities principally traded on the NASDAQ market, the Fund uses the NASDAQ Official Closing Price. Investments in shares of open-end mutual funds, including money market funds, are valued at their daily net asset value, which is calculated as of the close of regular trading on the New York Stock Exchange. Debt securities, excluding short-term investments, are valued at their current evaluated bid price as determined by an independent pricing service, which generates evaluations on the basis of dealer quotes for normal institutional-sized trading units, issuer analysis, bond market activity and various other factors. Securities for which market quotations may not be readily available are valued at their fair value as determined in good faith by procedures adopted by the Board of Directors. Short-term investments purchased at par are valued at cost, which approximates market value. Short-term investments purchased at a premium or discount are stated at amortized cost, which approximates market value. The Fund did not maintain any positions in derivative instruments or engage in hedging activities during the year. Investment transactions for financial statement purposes are recorded on trade date.
In accordance with Accounting Standards Codification (“ASC”) 820-10, “Fair Value Measurements and Disclosures” (“ASC 820-10”), fair value is defined as the price that the Fund would receive upon selling an investment in a timely transaction to an independent buyer in the principal or most advantageous market of the investment. ASC 820-10 established a three-tier hierarchy to maximize the use of observable market data and minimize the use of unobservable inputs and to establish classification of fair value measurements for disclosure purposes. Inputs refer broadly to the assumptions that market participants would use in pricing the asset or liability, including assumptions about risk, for example, the risk inherent in a particular valuation technique used to measure fair value such as a pricing model
– 17 –
Notes to Financial Statements (continued)
June 30, 2020 (unaudited)
and/or the risk inherent in the inputs to the valuation technique. Inputs may be observable or unobservable. Observable inputs are inputs that reflect the assumptions market participants would use in pricing the asset or liability based on market data obtained from sources independent of the reporting entity. Unobservable inputs are inputs that reflect the reporting entity’s own assumptions about the assumptions market participants would use in pricing the asset or liability based on the best information available in the circumstances. The three-tier hierarchy of inputs is summarized in the three broad levels listed below.
Level 1 – quoted prices in active markets for identical investments
Level 2 – other significant observable inputs (including quoted prices for similar investments, interest rates, benchmark yields, bids, offers, transactions, spreads and other relationships observed in the markets among market securities, underlying equity of the issuer, proprietary pricing models, credit risk, etc.)
Level 3 – significant unobservable inputs (including the Fund’s own assumptions in determining the fair value of investments) The inputs or methodology used for valuing securities are not necessarily an indication of the risk associated with investing in those securities.
The following is a summary of the inputs used as of June 30, 2020 in valuing the Fund’s investments carried at value:
| | |
| | | Investments |
| Valuation Inputs | | in Securities |
| Level 1 – | | |
| Common Stocks(1) | $ | 2,766,430 |
| Money Market Funds | | 5,096,913 |
| Level 2 – | | |
| Convertible Preferred Stock(1) | | 506,628 |
| Non-Convertible Bonds(1) | | 68,752,386 |
| U.S. Government Securities | | 18,499,761 |
| Level 3 – | | |
| None | | — |
| Total | $ | 95,622,118 |
| (1) See Schedule of Investments for further detail by industry. | | |
The Fund did not hold any Level 3 investments during the period.
(b) Net realized gain (loss) on portfolio securities was computed on the basis of specific identification.
(c) Dividend income is recorded on the ex-dividend date, and interest income is recognized on an accrual basis. Non-cash dividends, if any, are recorded at value on date of distribution. Generally, discounts and premiums on long-term debt security purchases, if any, are amortized over the expected lives of the respective securities using the effective yield method.
– 18 –
Notes to Financial Statements (continued)
June 30, 2020 (unaudited)
(d) Provision has not been made for federal income taxes or excise taxes since the Fund has elected to be taxed as a “regulated investment company” and intends to distribute substantially all net investment income and net realized capital gains on sales of investments to its shareholders and otherwise comply with the provisions of Subchapter M of the Internal Revenue Code applicable to regulated investment companies.
Investment income, net capital gains (losses) and all expenses incurred by the Fund are allocated based on the relative net assets of each class, except for service fees and certain other fees and expenses related to one class of shares.
Class N shares are subject to a 0.25% 12b-1 fee and a 0.10% servicing fee, as described in its prospectus. The 12b-1 fee from May 1, 2019 and the servicing fee from May 1, 2017 through November 4, 2019 were voluntarily reduced to 0.10% and 0.06%, respectively. From November 5, 2019 through February 3, 2020, the 12b-1 fee was reduced to 0.05% and from February 4, 2020 through period-end was reduced to 0.00%. From November 5, 2019 through period-end the servicing fee was reduced to 0.00%. Income, expenses (other than expenses attributable to a specific class), and realized and unrealized gains and losses are allocated daily to each class of shares based upon the relative net asset value of outstanding shares.
(e) Dividends and distributions paid to shareholders are recorded on the ex-dividend date. Distributions from net investment income are generally declared and paid at least quarterly. Distributions of net realized capital gain, if any, are declared and paid at least annually.
The amount of distributions from net investment income and net realized capital gain are determined in accordance with federal income tax regulations, which may differ from U.S. generally accepted accounting principles (“U.S. GAAP”) for financial reporting purposes. Financial reporting records are adjusted for permanent book-to-tax differences to reflect tax character.
The tax character of distributions paid during the six months ended June 30, 2020 and the year ended December 31, 2019 was as follows:
| | | | |
| | | 06/30/2020 | | 12/31/2019 |
| Distributions paid from: | | | | |
| Ordinary income | $ | 1,073,506 | $ | 4,393,693 |
As of June 30, 2020, investment cost for federal tax purposes was $94,833,308 and the tax basis components of net assets were as follows:
| | | |
| Unrealized appreciation | $ | 1,568,117 | |
| Unrealized depreciation | | (779,307 | ) |
| Net unrealized appreciation | $ | 788,810 | |
The difference between financial statement and tax-basis investment cost is attributable primarily to the deferral of wash sales losses.
– 19 –
Notes to Financial Statements (continued)
June 30, 2020 (unaudited)
For the year ended December 31, 2019, the Fund had capital loss carryforwards of approximately $10,904,000, which have no expiration date. To the extent the Fund has future net realized capital gains, distributions of capital gains to shareholders will be offset by any unused capital loss carryforwards.
The Fund had no material uncertain tax positions and has not recorded a liability for unrecognized tax benefits as of June 30, 2020. Also, the Fund recognized no interest and penalties related to uncertain tax benefits during the period ended June 30, 2020. At June 30, 2020, the fiscal years 2016 through 2019 remain open to examination in the Fund’s major tax jurisdictions.
(f) The Fund is considered an investment company under U.S. GAAP and follows the accounting and reporting guidance applicable to investment companies in the Financial Accounting Standards Board (“FASB”) ASC 946, “Financial Services –Investment Companies.” U.S. GAAP guidance requires management to make estimates and assumptions that effect the amounts reported in the financial statements and accompanying notes. Actual results could differ from estimates.
(g) In the normal course of business the Fund enters into contracts that contain general indemnification clauses. The Fund’s maximum exposure under these arrangements is unknown, as this would involve future claims against the Fund that have not yet occurred. Based on experience, the Fund expects the risk of loss to be remote.
(h) In connection with the preparation of the Fund’s financial statements, management evaluated subsequent events after the date of the Statement of Assets and Liabilities of June 30, 2020. On July 2, 2020, the Fund filed with the Securities and Exchange Commission a definitive information statement which included a notice of a plan of liquidation. The Fund expects to make liquidating distributions on or about July 24, 2020.
(2) Related Parties —
(a) Investment Adviser and Management Agreement —
The Fund has an agreement with Nicholas Company, Inc. (with whom certain officers and directors of the Fund are affiliated) (the “Adviser”) to serve as investment adviser and manager. Under the terms of the agreement, a monthly fee is paid to the Adviser based on an annualized fee of 0.50% of the average net asset value up to and including $50 million, 0.40% of the average net asset value in excess of $50 million and up to and including $100 million and 0.30% of the average net asset value in excess of $100 million.
The Adviser may be paid for accounting and administrative services rendered by its personnel, subject to the following guidelines: (i) up to five basis points, on an annual basis, of the average net asset value of the Fund up to and including $2 billion and up to three basis points, on an annual basis, of the average net asset value of the Fund greater than $2 billion, based on the average net asset value of the Fund as determined by valuations made at the close of each business day of each month, and (ii) where the preceding calculation results in an annual payment of less than $50,000, the Adviser, in its discretion, may charge the Fund up to $50,000 for such services.
– 20 –
Notes to Financial Statements (continued)
June 30, 2020 (unaudited)
(b) Legal Counsel —
A director of the Adviser is affiliated with a law firm that provides services to the Fund. The Fund incurred expenses of $3,806 for the period ended June 30, 2020 for legal services rendered by this law firm.
(3) Investment Transactions —
For the period ended June 30, 2020, the cost of purchases and the proceeds from sales of investment securities, other than short-term obligations, aggregated $12,743,946 and $31,290,190, respectively.
(4) Concentration of Risk —
The Fund invests primarily in high yield debt securities. The market values of these high yield debt securities tend to be more sensitive to economic conditions and individual corporate developments than those of higher rated securities. In addition, the market for these securities is generally less liquid than for higher rated securities.
– 21 –
Historical Record Class I(1)
(unaudited)
| | | | | | | |
| | | Net | | Net Investment | | | Growth of an |
| | | Asset Value | | Income Distributions | | | Initial $10,000 |
| | | Per Share | | Per Share | | | Investment(3) |
| November 21, 1977(2) | $ | 25.50 | $ | ��� | | $ | 10,000 |
| December 31, 1992 | | 16.90 | | 1.4775 | | | 35,143 |
| December 31, 1993 | | 17.60 | | 1.4450 | | | 39,695 |
| December 31, 1994 | | 16.05 | | 1.5050 | | | 39,626 |
| December 31, 1995 | | 17.10 | | 1.4750 | | | 46,029 |
| December 31, 1996 | | 17.65 | | 1.4800 | | | 51,721 |
| December 31, 1997 | | 18.45 | | 1.4515 | | | 58,514 |
| December 31, 1998 | | 16.95 | | 1.5775 | | | 58,788 |
| December 31, 1999 | | 15.30 | | 1.6560 | | | 58,749 |
| December 31, 2000 | | 12.00 | | 1.5300 | | | 51,620 |
| December 31, 2001 | | 11.80 | | 1.2150 | | | 56,144 |
| December 31, 2002 | | 9.65 | | 0.9925 | | | 50,459 |
| December 31, 2003 | | 10.95 | | 0.8450 | | | 61,937 |
| December 31, 2004 | | 11.15 | | 0.8200 | | | 67,915 |
| December 31, 2005 | | 10.50 | | 0.7895 | | | 68,849 |
| December 31, 2006 | | 10.70 | | 0.7455 | | | 75,221 |
| December 31, 2007 | | 10.18 | | 0.7502 | | | 76,820 |
| December 31, 2008 | | 7.18 | | 0.7140 | | | 58,955 |
| December 31, 2009 | | 9.09 | | 0.6581 | | | 80,426 |
| December 31, 2010 | | 9.52 | | 0.7230 | | | 90,876 |
| December 31, 2011 | | 9.28 | | 0.7070 | | | 95,354 |
| December 31, 2012 | | 9.86 | | 0.6375 | | | 108,095 |
| December 31, 2013 | | 9.86 | | 0.5757 | | | 114,488 |
| December 31, 2014 | | 9.52 | | 0.5065 | | | 116,347 |
| December 31, 2015 | | 8.65 | | 0.4592 | | | 111,068 |
| December 31, 2016 | | 9.08 | | 0.4204 | | | 122,109 |
| December 31, 2017 | | 9.00 | | 0.4675 | | | 127,333 |
| December 31, 2018 | | 8.36 | | 0.3876 | | | 123,690 |
| December 31, 2019 | | 9.03 | | 0.3806 | | | 139,375 |
| June 30, 2020 | | 8.54 | | 0.0918 | (a) | | 133,258 |
| (1) | Per share amounts presented for the periods prior to December 31, 2007 in this historical record have been restated or adjusted to reflect a reverse stock split of one share for every five shares outstanding effected on January 29, 2007. |
| (2) | Initial date under Nicholas Company, Inc. management. |
| (3) | Assuming reinvestment of distributions. |
| (a) | Paid on April 22, 2020 to shareholders of record on April 21, 2020. |
| | The Fund distributed no capital gains for the time periods listed. |
– 22 –
Historical Record Class N(1)
(unaudited)
| | | | | | | |
| | | Net | | Net Investment | | | Growth of an |
| | | Asset Value | | Income Distributions | | | Initial $10,000 |
| | | Per Share | | Per Share | | | Investment(3) |
| February 28, 2005(2) | $ | 11.20 | $ | — | | $ | 10,000 |
| December 31, 2005 | | 10.40 | | 0.7320 | | | 9,947 |
| December 31, 2006 | | 10.60 | | 0.7140 | | | 10,846 |
| December 31, 2007 | | 10.06 | | 0.7119 | | | 11,018 |
| December 31, 2008 | | 7.24 | | 0.5238 | | | 8,448 |
| December 31, 2009 | | 9.18 | | 0.6323 | | | 11,501 |
| December 31, 2010 | | 9.64 | | 0.6683 | | | 12,946 |
| December 31, 2011 | | 9.39 | | 0.6782 | | | 13,522 |
| December 31, 2012 | | 9.98 | | 0.6062 | | | 15,275 |
| December 31, 2013 | | 9.99 | | 0.5367 | | | 16,121 |
| December 31, 2014 | | 9.66 | | 0.4697 | | | 16,337 |
| December 31, 2015 | | 8.78 | | 0.4197 | | | 15,525 |
| December 31, 2016 | | 9.22 | | 0.3926 | | | 17,012 |
| December 31, 2017 | | 9.16 | | 0.4313 | | | 17,698 |
| December 31, 2018 | | 8.52 | | 0.3587 | | | 17,145 |
| December 31, 2019 | | 9.20 | | 0.3610 | | | 19,257 |
| June 30, 2020 | | 8.71 | | 0.0913 | (a) | | 18,427 |
| (1) | Per share amounts presented for the periods prior to December 31, 2007 in this historical record have been restated or adjusted to reflect a reverse stock split of one share for every five shares outstanding effected on January 29, 2007. |
| (2) | Date of Initial Public Offering. |
| (3) | Assuming reinvestment of distributions. |
| (a) | Paid on April 22, 2020 to shareholders of record on April 21, 2020. |
| | The Fund distributed no capital gains for the time periods listed. |
– 23 –
Approval of Investment Advisory Contract
(unaudited)
In February 2020, the Board of Directors of the Fund renewed the one-year term of the Investment Advisory Agreement by and between the Fund and the Adviser through February 2021. In connection with the renewal of the Investment Advisory Agreement, no changes to the amount or manner of calculation of the management fee or the terms of the agreement were proposed by the Adviser or adopted by the Board. For the fiscal year ended December 31, 2019, the management fee was 0.45% and the Fund’s Class I and Class N total expense ratios (including the management fee) were 0.73% and 0.93%, respectively. In renewing the Investment Advisory Agreement, the Board carefully considered the following factors on an absolute basis and relative to the Fund’s peer group: (i) the Fund’s Class I expense ratio; (ii) the Fund’s performance on a short-term and long-term basis; (iii) the Fund’s management fee; and (iv) the range and quality of the services offered by the Adviser. The peer group fund data included high-yield bond funds with similar asset sizes, credit quality and number of holdings. In terms of the peer group data used for performance comparisons, the Fund’s Class I was ranked 7th, 9th and 9th out of 12 funds for the one-, three- and five-year periods and 8th out of 11 funds for the 10-year period all ending December 31, 2019. The Fund’s Class I had the third lowest expense ratio among its peer group and ranked 7th in terms of 12-month yield out of the 12 funds.
The Board considered the range of services to be provided by the Adviser to the Fund under the Advisory Agreement. The Board discussed the nature, extent, and quality of the services to be provided by the Adviser and concluded that the services provided were consistent with the terms of the advisory agreement and the needs of the Fund, and that the services provided were appropriate in nature and the quality level is high.
The Board considered the investment performance of the Fund and the Adviser. Among other things, the Board noted its consideration of the Fund’s performance relative to peer funds. The Board reviewed the actual relative short-term and long-term performance of the Fund. Management reported that it continues to review strengths and weaknesses of the Fund’s strategies on an ongoing basis and will continue to make adjustments as appropriate. The Board expressed satisfaction with the Fund’s performance. The Board also discussed the extent to which economies of scale would be realized, and whether such economies were reflected in the Fund’s fee levels and concluded that the Adviser had been instrumental in holding down Fund costs, citing consistently low fees.
The Board also discussed the fees and services provided by the Adviser with the fees and services under its other advisory contracts and concluded such fees and services are reasonable when compared to the fees and services provided by the Adviser under its other advisory contracts.
The Board considered the cost of services provided by the Adviser. The Board also considered the profits to be realized by the Adviser from the relationship with the Fund. The Board expressed the opinion that given the Board’s focus on performance and maintaining a low fee structure, the Adviser’s profits were not relevant.
The Board determined that the Adviser had fully and adequately carried out the terms and conditions of its contract with the Fund. The Board discussed the Fund’s relatively low fees, historical returns and risk profile and management’s strategies to improve the absolute and relative performance of the Fund. The Board agreed that the Adviser had the resources, financial management and administrative capacity to continue to provide quality services. The Board expressed satisfaction with management’s control of expenses and the rate of the management fee for the Fund and the overall level of services provided to the Fund by the Adviser.
– 24 –
Liquidity Risk Management Program
(unaudited)
The Fund has adopted and implemented a liquidity risk management program (the “Program”) in accordance with Rule 22e-4 under the 1940 Act. The Program seeks to assess and manage the Fund’s liquidity risk, i.e., the risk that a Fund is unable to satisfy redemption requests without significantly diluting remaining investors’ interests in the Fund. The Board of Directors of the Fund has designated Nicholas Company, Inc., the Fund’s investment adviser, to administer the Program. Certain aspects of the Program rely on third parties to perform certain functions, including the provision of market data and application of models.
The Program is comprised of various components designed to support the assessment and/or management of liquidity risk, including: (1) the periodic assessment (no less frequently than annually) of certain factors that influence a Fund’s liquidity risk; (2) the periodic classification (no less frequently than monthly) of a Fund’s investments into one of four liquidity categories that reflect an estimate of their liquidity under current market conditions; (3) a 15% limit on the acquisition of “illiquid investments” (as defined under Rule 22e-4); (4) for a Fund that does not invest primarily in “highly liquid investments” (as defined under Rule 22e-4), the determination of a minimum percentage of the Fund’s assets that will generally be invested in highly liquid investments (a “Highly Liquid Investment Minimum”); and (5) periodic reporting to the Board of Directors.
At a meeting of the Board of Directors on February 3, 2020, Nicholas Company, Inc. provided a written report to the Board addressing the operation, and the adequacy and effectiveness of the implementation, of the Program, including, as applicable, the operation of any Highly Liquid Investment Minimum and any material changes to the Program, for the initial period from June 1, 2019 through December 31, 2019 (the “Reporting Period”). Among other things, the annual report discussed: (1) the results of stress tests designed to assess liquidity under a hypothetical stressed scenario involving elevated redemptions; and (2) an assessment of the methodologies used to classify investments into one of four liquidity categories. The report concluded that the Program was reasonably designed to assess and manage liquidity risk and was adequately and effectively implemented during the Reporting Period.
There can be no assurance that the Program will achieve its objectives under all circumstances in the future. Please refer to the Fund’s prospectus for more information regarding the Fund’s exposure to liquidity risk and other risks to which it may be subject.
– 25 –
Information on Proxy Voting
(unaudited)
A description of the policies and procedures that the Fund uses to determine how to vote proxies relating to portfolio securities is available, without charge, upon request by calling 800-544-6547 or 414-276-0535. It also appears in the Fund’s Statement of Additional Information, which can be found on the SEC’s website, www.sec.gov. A record of how the Fund voted its proxies for the most recent twelve-month period ended June 30, also is available on the Fund’s website, www.nicholasfunds.com, and the SEC’s website, www.sec.gov.
Quarterly Portfolio Schedule
(unaudited)
The Fund files its complete schedule of investments with the SEC for the first and third quarters of each fiscal year as an exhibit to its reports on Form N-PORT. The Fund’s Form N-PORT reports are available on the SEC’s website at www.sec.gov and may be reviewed and copied at the SEC’s Public Reference Room in Washington, D.C. Information on the operation of the Public Reference Room may be obtained by calling 800-SEC-0330.
– 26 –
Privacy Policy
(unaudited)
Nicholas High Income Fund, Inc. respects each shareholder’s right to privacy. We are committed to safeguarding the information that you provide us to maintain and execute transactions on your behalf.
We collect the following non-public personal information about you:
| * | Information we receive from you on applications or other forms, whether we receive the form in writing or electronically. This includes, but is not limited to, your name, address, phone number, tax identification number, date of birth, beneficiary information and investment selection. |
| * | Information about your transactions with us and account history with us. This includes, but is not limited to, your account number, balances and cost basis information. This also includes transaction requests made through our transfer agent. |
| * | Other general information that we may obtain about you such as demographic information. |
WE DO NOT SELL ANY NON-PUBLIC PERSONAL INFORMATION ABOUT CURRENT OR FORMER SHAREHOLDERS.
INFORMATION SHARED WITH OUR TRANSFER AGENT, A THIRD PARTY COMPANY, ALSO IS NOT SOLD.
We may share, only as permitted by law, non-public personal information about you with third party companies. Listed below are some examples of third parties to whom we may disclose non-public personal information. While these examples do not cover every circumstance permitted by law, we hope they help you understand how your information may be shared.
We may share non-public personal information about you:
| * | With companies who work for us to service your accounts or to process transactions that you may request. This would include, but is not limited to, our transfer agent to process your transactions, mailing houses to send you required reports and correspondence regarding the Fund and its Adviser, the Nicholas Company, Inc., and our dividend disbursing agent to process fund dividend checks. |
| * | With a party representing you, with your consent, such as your broker or lawyer. |
| * | When required by law, such as in response to a subpoena or other legal process. |
The Fund and its Adviser maintain policies and procedures to safeguard your non-public personal information. Access is restricted to employees who the Adviser determines need the information in order to perform their job duties. To guard your non-public personal information we maintain physical, electronic, and procedural safeguards that comply with federal standards.
In the event that you hold shares of the Fund with a financial intermediary, including, but not limited to, a broker-dealer, bank, or trust company, the privacy policy of your financial intermediary would govern how your non-public personal information would be shared with non-affiliated third parties.
– 27 –
Nicholas Funds Services Offered
(unaudited)
| | |
| • | IRAs | |
| | • Traditional | • SIMPLE |
| | • Roth | • SEP |
| • | Coverdell Education Accounts |
| • | Automatic Investment Plan |
| • | Direct Deposit of Dividend and Capital Gain Distributions |
| • | Systematic Withdrawal Plan |
| • | Monthly Automatic Exchange between Funds |
| • | Telephone Purchase and Redemption |
| • | Telephone Exchange | |
| • | 24-hour Automated Account Information (800-544-6547) |
| • | 24-hour Internet Account Access (www.nicholasfunds.com) |
Please call a shareholder representative for further information on the above services or with any other questions you may have regarding the Nicholas Funds (800-544-6547).
– 28 –
Directors and Officers
DAVID O. NICHOLAS, President and Director
JOHN A. HAUSER, Director
DAVID P. PELISEK, Director
JAY H. ROBERTSON, Director
DAVID L. JOHNSON, Executive Vice President
JENNIFER R. KLOEHN, Senior Vice President,
Treasurer and Chief Compliance Officer
LAWRENCE J. PAVELEC, Senior Vice President and Secretary
CANDACE L. LESAK, Vice President
Investment Adviser
NICHOLAS COMPANY, INC.
Milwaukee, Wisconsin
www.nicholasfunds.com
414-276-0535 or 800-544-6547
Transfer Agent
U.S. BANCORP FUND SERVICES, LLC
Milwaukee, Wisconsin
414-276-0535 or 800-544-6547
Distributor
QUASAR DISTRIBUTORS, LLC
Milwaukee, Wisconsin
Custodian
U.S. BANK N.A.
Milwaukee, Wisconsin
Independent Registered Public Accounting Firm
DELOITTE & TOUCHE LLP
Milwaukee, Wisconsin
Counsel
MICHAEL BEST & FRIEDRICH LLP
Milwaukee, Wisconsin
This report is submitted for the information of shareholders of the Fund. It is not authorized for distribution to prospective investors unless preceded or accompanied by an effective prospectus.
Item 2. Code of Ethics.
Applicable only to annual reports.
Item 3. Audit Committee Financial Expert.
Applicable only to annual reports.
Item 4. Principal Accountant Fees and Services.
Applicable only to annual reports.
Item 5. Audit Committee of Listed Registrants.
Not applicable to this filing.
Item 6. Schedule of Investments.
The schedule of investments in securities of unaffiliated issuers is included as part of the report to shareholders filed under Item 1.
Item 7. Disclosure of Proxy Voting Policies and Procedures for Closed-End Management Investment Companies.
Applicable only to annual reports filed by closed-end funds.
Item 8. Portfolio Managers of Closed-End Management Investment Companies.
Applicable only to annual reports filed by closed-end funds.
Item 9. Purchases of Equity Securities by Closed-End Management Investment Companies and Affiliated Purchasers.
Applicable only to closed-end funds.
Item 10. Submission of Matters to a Vote of Security Holders.
The registrant’s most recent Definitive Proxy Statement (Schedule 14A) filed on November 18, 2019 (the “Report”) indicated that the registrant did not have in place a standing nominating committee or any formal procedures by which shareholders may recommend nominees to the registrant’s board of directors. Initially, the registrant had determined that the registrant’s independent directors could sufficiently function as an informal nominating committee, without any formal charter or policy, and could sufficiently screen and select nominees to the registrant’s board of directors.
However, since the end of the period covered by the Report, the board of directors of the registrant determined that the establishment of a formal nominating and corporate governance committee of the registrant’s board of directors (the “Nominating Committee”) would be appropriate, and such Nominating Committee was established at its regular meeting held on February 3, 2020. At such meeting, the independent directors of the registrant’s board of directors (i.e., John A. Hauser, David P. Pelisek, and Jay H. Robertson) were appointed as the members of the Nominating Committee, to serve until their respective successors are appointed and qualified or until their earlier death, disqualification, resignation or removal.
At the next regular meeting of the registrant’s board of directors held on May 4, 2020, the board of directors of the registrant approved a formal Nominating and Governance Committee Charter (“Nominating Committee Charter”), which described the power and authority of such Nominating Committee. Pursuant to the Nominating Committee Charter, the Nominating Committee has the power and authority to identify, screen, evaluate and select nominees, with the assistance of the registrant’s officers, employees, independent auditors and any other experts, consultants and professionals as the Nominating Committee shall deem necessary, advisable or appropriate from time to time.
Also, with the establishment of the Nominating Committee and the adoption and approval of the Nominating Committee Charter, the registrant’s stockholders wishing to recommend a potential nominee may now communicate with the Nominating Committee (instead of the registrant’s entire board of directors) by submitting a written communication directed to the Nominating Committee in care of the Fund’s Chief Compliance Officer at 411 E. Wisconsin Ave., Ste. 2100, Milwaukee, Wisconsin 53202.
Notwithstanding the foregoing, at the regular meeting of the registrant’s board of directors held on May 4, 2020, the board of directors approved the liquidation and dissolution of the registrant pursuant to a Plan of Liquidation and Dissolution that was also adopted and approved at such meeting, and the registrant’s board of directors subsequently submitted such matter to the registrant’s stockholders for their approval. The registrant’s stockholders subsequently approved the liquidation and dissolution of the registrant, together with the Plan of Liquidation and Dissolution, at a special meeting of the stockholders of the registrant held on July 20, 2020.
Item 11. Controls and Procedures.
The Fund's principal executive officer and principal financial officer have concluded that the Fund's disclosure controls and procedures are sufficient to ensure that information required to be disclosed by the Fund in this Form N-CSR was recorded, processed, summarized and reported within the time periods specified in the Securities and Exchange Commission's rules and forms, based upon such officers' evaluation of these controls and procedures as of a date within 90 days of the filing date of the report. There were no significant changes or corrective actions with regard to significant deficiencies or material weaknesses in the Fund's internal controls or in other factors that could significantly affect the Fund's internal controls subsequent to the date of their evaluation.
Item 12. Disclosure of Securities Lending Activities for Closed-End Management Investment Companies.
Applicable only to closed-end funds.
Item 13. Exhibits.
(a)(1) Code of Ethics -- Any code of ethics, or amendments thereto, that is the subject of the disclosure required by Item 2, to the extent that the registrant intends to satisfy the Item 2 requirements through filing of an exhibit.
Not applicable to this filing.
(a)(2) Certifications of Principal Executive Officer and Principal Financial Officer pursuant to Rule 30a-2(a) under the Investment Company Act of 1940, attached hereto as part of EX-99.CERT.
(a)(3) Any written solicitation to purchase securities under Rule 23c-1 under the Act sent or given during the period covered by the report by or on behalf of the registrant to 10 or more person.
Applicable only to closed-end funds.
(a)(4) Change in the registrant’s independent public accountant.
Not applicable to this filing.
(b) Certifications of Principal Executive Officer and Principal Financial Officer pursuant to Rule 30a-2(b) under the Investment Company Act of 1940, attached hereto as part of EX-99.906CERT.
SIGNATURES
Pursuant to the requirements of the Securities Exchange Act of 1934 and the Investment Company Act of 1940, the registrant has duly caused this report to be signed on its behalf by the undersigned, thereunto duly authorized.
(Registrant) Nicholas High Income Fund, Inc.
By: /s/ David O. Nicholas
Name: David O. Nicholas
Title: Principal Executive Officer
Date: July 30, 2020
Pursuant to the requirements of the Securities Exchange Act of 1934 and the Investment Company Act of 1940, this report has been signed by the following persons on behalf of the registrant and in the capacities and on the dates indicated.
By: /s/ David O. Nicholas
Name: David O. Nicholas
Title: Principal Executive Officer
Date: July 30, 2020
By: /s/ Jennifer R. Kloehn
Name: Jennifer R. Kloehn
Title: Principal Financial Officer
Date: July 30, 2020