| |
| UNITED STATES |
| SECURITIES AND EXCHANGE COMMISSION |
| Washington, D.C. 20549 |
| |
| FORM N-CSR |
| CERTIFIED SHAREHOLDER REPORT OF REGISTERED MANAGEMENT INVESTMENT |
| COMPANIES |
| |
| Investment Company Act file number 811-00216 | |
| |
| Nicholas High Income Fund, Inc. |
|
| (Exact Name of Registrant as specified in charter) |
| |
| 411 East Wisconsin Avenue, Milwaukee, Wisconsin 53202 |
|
| (Address of Principal Executive Offices) | (Zip Code) |
| |
| Jennifer R. Kloehn, Senior Vice President and Treasurer |
| 411 East Wisconsin Avenue |
| Milwaukee, Wisconsin 53202 |
|
| (Name and Address of Agent for Service) |
Registrant's telephone number, including area code: 414-272-4650
Date of fiscal year end: 12/31/2017
Date of reporting period: 06/30/2017
Item 1. Report to Stockholders.
SEMIANNUAL REPORT
June 30, 2017
NICHOLAS HIGH
INCOME FUND, INC.

WWW.NICHOLASFUNDS.COM
NICHOLAS HIGH INCOME FUND, INC.
August 2017
Report to Fellow Shareholders:
Market Overview
The high yield bond market followed the lead of the equity market’s move higher as investor expectations remained elevated following the Trump election in 2016. Expectations for significant regulatory reform of healthcare, finance and taxes boosted prices and returns on equities and high yield. The belief that reform would benefit corporate profits and boost consumer spending drove markets to new highs during the first half of 2017. By summer, doubts rose about accomplishing the aggressive reform agenda and markets stalled. The equity and high yield markets pulled back from previous highs even as corporate earnings were generally positive. We believe the markets may need a combination of better economic growth, regulatory reform and improved earnings to regain momentum in the coming months.
The high yield bond market generated solid returns for the first six months of 2017 with the Bank of America Merrill Lynch (“BAML”) U.S. High Yield Constrained Index returning 4.90%. As measured by the respective BAML indices, lower quality, riskier assets provided the greater returns with CCC & Lower-rated bonds at 6.95% for the period ended June 30, 2017. The higher quality BB-rated bonds earned 4.65%. Over the past twelve months these two indices generated 23.08% and 9.82%, respectively. The expectations driving equity prices benefitted the high yield market as well. Sectors leading performance included banking/finance, home construction and transportation, all expecting to benefit from deregulation and better economic activity. Sectors lagging during the six-month period were energy, supermarkets and wirelines.
The Nicholas High Income Fund (Fund) Class I provided a 3.73% return for the period ended June 30, 2017. This was competitive with the Morningstar High Yield Category return of 4.09%, which is net of fees. The BAML U.S. High Yield Constrained Index was 4.90% for the six months led by the lower quality sectors as noted earlier. The Fund performance benefitted from the allocation and security selection in the basic industry, capital goods, technology and service sectors. Companies in these sectors are positioned to take advantage of an improving economy. Performance was negatively impacted by an underweight position in the healthcare and media sectors. The Fund was underweight based on the view companies in these sectors continue to struggle with disruptive technologies and policies causing a shift in demand and price pressures. It does not appear to us this wave of disruption will end in the near future and we intend to continue to underweight companies that operate in these areas.
The Fund has moved to a more defensive posture over the last 12-18 months in an effort to protect shareholders from the potential risks associated with an extended credit cycle and changing Federal Reserve policy. A shift toward securities in the BB/Ba rated bucket has been the focus. The bonds offer stronger business models and balance sheets that should withstand an unexpected market correction or economic downturn. The tradeoff is a lower yield but our view is an upgrade in quality is worth the cost of a modestly lower yield. The portfolio continues to have a shorter effective duration compared to the market. We do not anticipate a near term risk to dramatically higher interest rates, but we do not believe interest rates can move drastically lower from these levels. A shorter portfolio maturity structure seems more prudent at this point in the cycle.
Our view for the balance of 2017 is the economy, markets and interest rates will remain range bound. We believe economic growth is likely to remain approximately 2%, the high yield market is likely to produce mid-single digit returns, and 10-year U.S. Treasury yields will remain in a range of 2.0% to 3.0%. We believe the Federal Reserve will defer further hikes in the Fed Funds rate until 2018, but they have telegraphed their intention to initiate an unwinding of their massive balance sheet. The challenge will be how attractive current interest rates remain to investors after the Federal Reserve ends their buying program. Investor reaction to this unprecedented move is uncertain.
Performance
Nicholas High Income Fund – Class I produced a net return of 3.73% for the six-month period ended June 30, 2017. Returns for Nicholas High Income Fund, Inc. Class I and N, and selected indices are provided in the chart below for the periods ended June 30, 2017. The Fund and Morningstar performance data is net of fees, while the BAML Indices are gross of fees.
| | | | | | | | | | | | | | |
| | | | | | Average Annual Total Return | |
| | | 6 Month | | | 1 Year | | 3 Year | | | 5 Year | | | 10 Year | |
| Nicholas High Income | | | | | | | | | | | | | | |
| Fund, Inc. – Class I | | 3.73 | % | | 8.48 | % | 1.98 | % | | 4.40 | % | | 5.08 | % |
| Nicholas High Income | | | | | | | | | | | | | | |
| Fund, Inc. – Class N | | 3.55 | % | | 8.09 | % | 1.61 | % | | 4.02 | % | | 4.75 | % |
| BAML U.S. High Yield | | | | | | | | | | | | | | |
| Constrained Index | | 4.90 | % | | 12.74 | % | 4.49 | % | | 6.92 | % | | 7.62 | % |
| BAML BB-B U.S. | | | | | | | | | | | | | | |
| High Yield Index | | 4.57 | % | | 11.21 | % | 4.54 | % | | 6.67 | % | | 7.08 | % |
| Morningstar High Yield | | | | | | | | | | | | | | |
| Bond Funds Category | | 4.09 | % | | 10.78 | % | 3.02 | % | | 5.70 | % | | 6.04 | % |
| Ending value of $10,000 invested | | | | | | | | | | | | | | |
| in Nicholas High Income | | | | | | | | | | | | | | |
| Fund, Inc. – Class I | $ | 10,373 | | $ | 10,848 | $ | 10,606 | | $ | 12,400 | | $ | 16,414 | |
| Ending value of $10,000 invested | | | | | | | | | | | | | | |
| in Nicholas High Income | | | | | | | | | | | | | | |
| Fund, Inc. – Class N | $ | 10,355 | | $ | 10,809 | $ | $10,490 | | $ | 12,177 | | | 15,899 | |
| Fund’s Class I Expense Ratio (from 04/30/17 Prospectus): 0.69% | | | | | | | |
| (includes 0.01% in acquired funds fees and expenses) | | | | | | | | | |
| Fund’s Class N Expense Ratio (from 04/30/17 Prospectus): 1.04% | | | | | | | |
| (includes 0.01% in acquired funds fees and expenses) | | | | | | | | | |
The Fund’s expense ratios for the period ended June 30, 2017 can be found in the financial highlights included within this report.
Performance data quoted represents past performance and is no guarantee of future results. The investment return and principal value of an investment will fluctuate so that an investor’s shares, when redeemed, may be worth more or less than their original cost. Current performance of the Fund may be lower or higher than the performance quoted. Performance data current to the most recent month-end may be obtained by visiting www.nicholasfunds.com/returns.html.
The ending values above illustrate the performance of a hypothetical $10,000 investment made in the Fund over the timeframes listed. Assumes reinvestment of
dividends and capital gains. Returns shown do not reflect the deduction of taxes that a shareholder would pay on Fund distributions or the redemption of Fund shares. These figures do not imply any future performance.
Class I shares and Class N shares are invested in the same portfolio of securities. Annual returns will generally differ only to the extent that the classes do not have the same expenses. Please see the respective prospectus for details.
Philosophy and Process
The returns earned by the Fund are consistent with our investment philosophy and style. Our approach has been to identify undervalued securities using rigorous financial analysis to verify that the fundamental outlook is properly aligned with current valuations. An analysis of trends in earnings, EBITDA, leverage and asset coverage are critical for making a sound investment. Security valuation is the primary gatekeeper in deciding whether to add or eliminate a holding from the portfolio. Financially sound companies with fully priced securities do not necessarily represent a good value, while companies that have stumbled financially should not automatically be dismissed as bad investments if we believe the valuations offer a sufficient margin of safety. This process suggests a more conservative approach to investing in high yield bonds, which we believe has the potential to allow for more consistent returns with less downside risk.
We remain committed to the Fund’s long-term strategy, which is based on a process that seeks to identify value opportunities in out-of-favor or poorly followed securities of financially sound companies. Opportunities tend to arise over time in securities of companies that fall temporarily out-of-favor due to specific company or industry issues that may taint the issuers. Often times these companies are in a period of transition or restructuring where market sentiment is overly harsh or negative resulting in an undervalued situation. We are keenly aware that a cheap price alone does not guarantee a good investment; therefore, we seek to identify a catalyst we believe will allow the company and its securities to regain favor and be rewarded with higher valuations. We believe that investing in securities trading below their fair values due to non-fundamental short-term issues, emotion or misunderstanding offers significant long-term potential returns.
Thank you for your investment in the Nicholas High Income Fund.

Lawrence J. Pavelec, CFA
Senior Vice President
Portfolio Manager
The information above represents the opinions of the Fund manager, is subject to change, and any forecasts made cannot be guaranteed.
Mutual fund investing involves risk. Principal loss is possible. Investments in debt securities typically decrease in value when interest rates rise. This risk is usually greater for longer-term debt securities. Investment by the Fund in lower-rated and non-rated securities presents a greater risk of loss to principal and interest than higher-rated securities. The Fund may invest in illiquid securities which involve the risk that the securities will not be able to be sold at the time or prices desired by the fund, particularly during times of market turmoil.
Please refer to the schedule of investments in the report for complete Fund holdings information. Fund holdings and sector allocations are subject to change and should not be considered a recommendation to buy or sell any security.
Current and future portfolio holdings are subject to risk.
Earnings before interest, taxes, depreciation and amortization (EBITDA) is an approximate measure of a company’s operating cash flow based on data from the company’s income statement. Calculated by looking at earnings before the deduction of interest expenses, taxes, depreciation, and amortization.
Effective Duration is a calculation for bonds with embedded options. Effective duration takes into account that expected cash flows with fluctuate as interest rates change.
Index Definitions - You cannot invest directly in an index.
The Bank of America Merrill Lynch U.S. High Yield Index tracks the performance of US dollar denominated below investment grade corporate debt publicly issued in the US domestic market. Qualifying securities must have at least one year remaining term to final maturity, a fixed coupon schedule and a minimum amount outstanding of $250 million.
The Bank of America Merrill Lynch U.S. High Yield Constrained Index limits any individual issuer included in the Bank of America Merrill Lynch U.S. High Yield Index to a maximum of 2% benchmark exposure.
The Bank of America Merrill Lynch U.S. High Yield BB Index is a subset of the Bank of America Merrill Lynch U.S. High Yield Index including all securities rated BB1 through BB3.
The Bank of America Merrill Lynch BB-B U.S. High Yield Index is a subset of the Bank of America Merrill Lynch U.S. High Yield Index including all securities rated BB1 through B3, inclusive.
The Bank of America Merrill Lynch U.S. High Yield CCC and Lower Rated Index is a subset of the Merrill Lynch US High Yield Index including all securities rated CCC1 or lower.
Credit Quality reflects the credit rating assigned by Fitch, Moody’s or S&P. Ratings are subject to change and generally expressed as a scale from AAA to D, where higher-rated bonds are in the A’s and lower-rated in the C’s. Any bond rated BBB or higher is considered investment grade debt. Any bond rated BBB- or below is considered below investment grade and are seen as having higher default risk or other adverse credit events, but typically pay higher yields than better quality bonds in order to make them attractive. The credit quality of the investments in the portfolio does not apply to the stability or safety of the Fund or its shares.
Each Morningstar Category average represents a universe of Funds with similar invest objectives.
Must be preceded or accompanied by a prospectus.
The Nicholas Funds are distributed by Quasar Distributors, LLC.
Financial Highlights Class I (NCINX)
For a share outstanding throughout each period
| | | | | | | | | | | | | | | | | | |
| | | Six Months | | | | | | | | | | | | | | | | |
| | | Ended | | | | | | | | | | | | | | | | |
| | | 06/30/2017 | | | | | | Years Ended December 31, | | | | |
| | | (unaudited) | | | 2016 | | | 2015 | | | 2014 | | | 2013 | | | 2012 | |
| NET ASSET VALUE, | | | | | | | | | | | | | | | | | | |
| BEGINNING OF PERIOD | $ | 9.08 | | $ | 8.65 | | $ | 9.52 | | $ | 9.86 | | $ | 9.86 | | $ | 9.28 | |
| INCOME (LOSS) FROM | | | | | | | | | | | | | | | | | | |
| INVESTMENT OPERATIONS | | | | | | | | | | | | | | | | | | |
| Net investment income | | .23 | (1) | | .43 | (1) | | .43 | | | .52 | | | .58 | | | .64 | |
| Net gain (loss) on securities | | | | | | | | | | | | | | | | | | |
| (realized and unrealized) | | .11 | | | .42 | | | (.84 | ) | | (.35 | ) | | .00 | (2) | | .58 | |
| Total from | | | | | | | | | | | | | | | | | | |
| investment operations | | .34 | | | .85 | | | (.41 | ) | | .17 | | | .58 | | | 1.22 | |
| LESS DISTRIBUTIONS | | | | | | | | | | | | | | | | | | |
| From net investment income | | (.13 | ) | | (.42 | ) | | (.46 | ) | | (.51 | ) | | (.58 | ) | | (.64 | ) |
| NET ASSET VALUE, | | | | | | | | | | | | | | | | | | |
| END OF PERIOD | $ | 9.29 | | $ | 9.08 | | $ | 8.65 | | $ | 9.52 | | $ | 9.86 | | $ | 9.86 | |
| |
| TOTAL RETURN | | 3.73 | %(3) | | 9.94 | % | | (4.54 | )% | | 1.62 | % | | 5.91 | % | | 13.36 | % |
| |
| SUPPLEMENTAL DATA: | | | | | | | | | | | | | | | | | | |
| Net assets, end of | | | | | | | | | | | | | | | | | | |
| period (millions) | $ | 102.7 | | $ | 100.5 | | $ | 93.1 | | $ | 101.1 | | $ | 103.8 | | $ | 103.0 | |
| Ratio of expenses | | | | | | | | | | | | | | | | | | |
| to average net assets. | | .72 | %(4) | | .68 | % | | .70 | % | | .67 | % | | .66 | % | | .66 | % |
| Ratio of net investment income | | | | | | | | | | | | | | | | | | |
| to average net assets. | | 5.03 | %(4) | | 4.83 | % | | 4.61 | % | | 5.24 | % | | 5.74 | % | | 6.52 | % |
| Portfolio turnover rate | | 44.92 | %(4) | | 44.28 | % | | 41.30 | % | | 50.76 | % | | 51.47 | % | | 62.31 | % |
| (1) | Computed based on average shares outstanding. |
| (2) | The amount rounds to $0.00. |
| (3) | Not annualized. |
| (4) | Annualized. |
The accompanying notes to financial statements are an integral part of these highlights.
– 5–
Financial Highlights Class N (NNHIX)
For a share outstanding throughout each period
| | | | | | | | | | | | | | | | | | |
| | | Six Months | | | | | | | | | | | | | | | | |
| | | Ended | | | | | | | | | | | | | | | | |
| | | 06/30/2017 | | | | | | Years Ended December 31, | | | | |
| | | (unaudited) | | | 2016 | | | 2015 | | | 2014 | | | 2013 | | | 2012 | |
| NET ASSET VALUE, | | | | | | | | | | | | | | | | | | |
| BEGINNING OF PERIOD | $ | 9.22 | | $ | 8.78 | | $ | 9.66 | | $ | 9.99 | | $ | 9.98 | | $ | 9.39 | |
| INCOME (LOSS) FROM | | | | | | | | | | | | | | | | | | |
| INVESTMENT OPERATIONS | | | | | | | | | | | | | | | | | | |
| Net investment income | | .22 | (1) | | .40 | (1) | | .39 | | | .48 | | | .54 | | | .61 | |
| Net gain (loss) on securities | | | | | | | | | | | | | | | | | | |
| (realized and unrealized) | | .11 | | | .43 | | | (.85 | ) | | (.34 | ) | | .01 | | | .59 | |
| Total from | | | | | | | | | | | | | | | | | | |
| investment operations | | .33 | | | .83 | | | (.46 | ) | | .14 | | | .55 | | | 1.20 | |
| LESS DISTRIBUTIONS | | | | | | | | | | | | | | | | | | |
| From net investment income | | (.12 | ) | | (.39 | ) | | (.42 | ) | | (.47 | ) | | (.54 | ) | | (.61 | ) |
| NET ASSET VALUE, | | | | | | | | | | | | | | | | | | |
| END OF PERIOD | $ | 9.43 | | $ | 9.22 | | $ | 8.78 | | $ | 9.66 | | $ | 9.99 | | $ | 9.98 | |
| |
| TOTAL RETURN | | 3.55 | %(2) | | 9.58 | % | | (4.97 | )% | | 1.34 | % | | 5.54 | % | | 12.96 | % |
| |
| SUPPLEMENTAL DATA: | | | | | | | | | | | | | | | | | | |
| Net assets, end of | | | | | | | | | | | | | | | | | | |
| period (millions) | $ | 4.4 | | $ | 8.1 | | $ | 2.7 | | $ | 6.6 | | $ | 6.3 | | $ | 9.3 | |
| Ratio of expenses | | | | | | | | | | | | | | | | | | |
| to average net assets. | | 1.05 | %(3) | | 1.03 | % | | 1.05 | % | | 1.02 | % | | 1.01 | % | | 1.01 | % |
| Ratio of net investment income | | | | | | | | | | | | | | | | | | |
| to average net assets. | | 4.73 | %(3) | | 4.42 | % | | 4.29 | % | | 4.90 | % | | 5.45 | % | | 6.15 | % |
| Portfolio turnover rate | | 44.92 | %(3) | | 44.28 | % | | 41.30 | % | | 50.76 | % | | 51.47 | % | | 62.31 | % |
| (1) | Computed based on average shares outstanding. |
| (2) | Not annualized. |
| (3) | Annualized. |
The accompanying notes to financial statements are an integral part of these highlights.
– 6–
Top Ten Equity Portfolio Issuers
June 30, 2017 (unaudited)
| | |
| | Percentage | |
| Name | of Net Assets | |
| Mercer International Inc. | 2.12 | % |
| Zayo Group, LLC | 1.96 | % |
| Equinix, Inc. | 1.96 | % |
| LPL Holdings, Inc. | 1.94 | % |
| GEO Group, Inc. (The) | 1.94 | % |
| FAGE International S.A. | 1.92 | % |
| PetSmart, Inc. | 1.88 | % |
| Beacon Roofing Supply, Inc. | 1.76 | % |
| Koppers Inc. | 1.74 | % |
| Valvoline Finco Two LLC | 1.66 | % |
| Total of top ten | 18.88 | % |
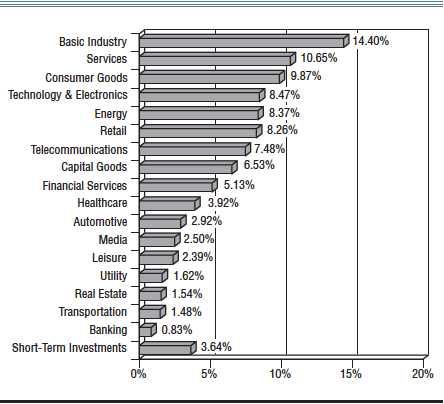
Sector Diversification (as a percentage of portfolio)
June 30, 2017 (unaudited)
– 7–
Fund Expenses
For the six month period ended June 30, 2017 (unaudited)
As a shareholder of the Fund, you incur two types of costs: (1) transaction costs and (2) ongoing costs, including management fees and other operating expenses. The following table is intended to help you understand your ongoing costs (in dollars) of investing in the Fund and to compare these costs with those of other mutual funds.
The example is based on an investment of $1,000 made at the beginning of the period and held for the entire period.
The first line of the table below for each share class of the Fund provides information about the actual account values and actual expenses. You may use the information in this line, together with the amount you invested, to estimate the expenses that you paid over the period. Simply divide your account value by $1,000 (for example, an $8,600 account value divided by $1,000 = 8.6), then multiply the result by the number in the first line under the heading entitled “Expenses Paid During Period” to estimate the expenses you paid on your account during this period.
The second line of the table below provides information about hypothetical account values and hypothetical expenses based on the Fund’s actual expense ratios for each class of the Fund and an assumed rate of return of 5% per year before expenses, which are not the Fund’s actual returns. The hypothetical account values and expenses may not be used to estimate the actual ending account balance or expenses you paid for the period. You may use this information to compare the ongoing costs of investing in the Fund with other funds. To do so, compare this 5% hypothetical example with the 5% hypothetical examples that appear in the shareholder reports of other funds.
Please note that the expenses shown in the table are meant to highlight your ongoing costs only and do not reflect any transactional costs, such as wire fees. Therefore, the second line of the table is useful in comparing ongoing costs only, and will not help you determine the relative total costs of owning different funds. In addition, if these transactional costs were included, your costs would have been higher.
| | | | | | |
| Class I | | | | | | |
| | | Beginning | | Ending | | Expenses |
| | | Account | | Account | | Paid During |
| | | Value | | Value | | Period* |
| | | 12/31/16 | | 06/30/17 | | 01/01/17 - 06/30/17 |
| Actual | $ | 1,000.00 | $ | 1,037.30 | $ | 3.64 |
| Hypothetical | | 1,000.00 | | 1,021.43 | | 3.61 |
| (5% return before expenses) | | | | | | |
| * | Expenses are equal to the Class I six-month annualized expense ratio of 0.72%, multiplied by the average account value over the period, multiplied by 181 then divided by 365 to reflect the one- half year period. |
– 8–
Fund Expenses (continued)
For the six month period ended June 30, 2017 (unaudited)
| | | | | | |
| Class N | | | | | | |
| | | Beginning | | Ending | | Expenses |
| | | Account | | Account | | Paid During |
| | | Value | | Value | | Period** |
| | | 12/31/16 | | 06/30/17 | | 01/01/17 - 06/30/17 |
| Actual | $ | 1,000.00 | $ | 1,035.50 | $ | 5.30 |
| Hypothetical | | 1,000.00 | | 1,019.79 | | 5.26 |
| (5% return before expenses) | | | | | | |
| ** | Expenses are equal to the Class N six-month annualized expense ratio of 1.05%, multiplied by the average account value over the period, multiplied by 181 then divided by 365 to reflect the one-half year period. |
– 9–
| | | | |
| | Schedule of Investments | | |
| | June 30, 2017 (unaudited) | | |
| |
| | Shares or | | | |
| | Principal | | | |
| | Amount | | | Value |
| NON-CONVERTIBLE BONDS — 91.47% | | |
| | | Automotive – Parts & Equipment — 2.87% | | |
| $ | 1,500,000 | Allison Transmission, Inc. 144A restricted, 5.00%, 10/01/24 | $ | 1,537,500 |
| | 1,500,000 | American Axle & Manufacturing, Inc. 6.625%, 10/15/22 | | 1,537,500 |
| | | | | 3,075,000 |
| | | Banking — 0.81% | | |
| | 1,000,000 | BAC Capital Trust XIV Floating Rate Preferred Hybrid | | |
| | | Income Term Securities 4.00%(1), 03/15/43 | | 872,000 |
| | | Basic Industry – Building Materials — 3.47% | | |
| | 1,750,000 | Beacon Roofing Supply, Inc. 6.375%, 10/01/23 | | 1,881,250 |
| | 1,000,000 | HD Supply, Inc. 144A restricted, 5.75%, 04/15/24 | | 1,062,500 |
| | 750,000 | USG Corporation 144A restricted, 4.875%, 06/01/27 | | 771,563 |
| | | | | 3,715,313 |
| | | Basic Industry – Chemicals — 4.86% | | |
| | 1,750,000 | Koppers Inc. 144A restricted, 6.00%, 02/15/25 | | 1,859,375 |
| | 1,500,000 | PolyOne Corporation 5.25%, 03/15/23 | | 1,575,000 |
| | 1,680,000 | Valvoline Finco Two LLC 144A restricted, 5.50%, 07/15/24 | | 1,776,600 |
| | | | | 5,210,975 |
| | | Basic Industry – Forestry & Paper — 3.56% | | |
| | 1,500,000 | Louisiana-Pacific Corporation 4.875%, 09/15/24 | | 1,531,875 |
| | 2,125,000 | Mercer International Inc. 7.75%, 12/01/22 | | 2,276,406 |
| | | | | 3,808,281 |
| | | Basic Industry – Metal/Mining Excluding Steel — 2.28% | | |
| | 1,250,000 | Alcoa Nederland Holding B.V. 144A restricted, 6.75%, 09/30/24 | | 1,356,250 |
| | 1,000,000 | Grinding Media Inc. 144A restricted, 7.375%, 12/15/23 | | 1,087,500 |
| | | | | 2,443,750 |
| | | Capital Goods – Diversified — 0.98% | | |
| | 1,000,000 | Park-Ohio Industries, Inc. 144A restricted, 6.625%, 04/15/27 | | 1,050,000 |
| | | Capital Goods – Machinery — 1.08% | | |
| | 1,000,000 | Manitowoc Foodservice, Inc. 9.50%, 02/15/24 | | 1,160,000 |
| | | Capital Goods – Packaging — 4.36% | | |
| | 1,000,000 | Ball Corporation 5.00%, 03/15/22 | | 1,067,500 |
| | 1,500,000 | Crown Americas LLC 144A restricted, 4.25%, 09/30/26 | | 1,496,250 |
| | 1,500,000 | Reynolds Group Holdings Limited 144A restricted, 5.125%, 07/15/23 | | 1,558,125 |
| | 500,000 | Sealed Air Corporation 144A restricted, 5.50%, 09/15/25 | | 546,250 |
| | | | | 4,668,125 |
| | | Consumer Goods – Food-Wholesale — 7.10% | | |
| | 1,000,000 | B&G Foods, Inc. 5.25%, 04/01/25 | | 1,020,000 |
| | 2,000,000 | FAGE International S.A. 144A restricted, 5.625%, 08/15/26 | | 2,059,600 |
| | 500,000 | KeHE Distributors, LLC 144A restricted, 7.625%, 08/15/21 | | 501,250 |
| | 1,000,000 | Lamb Weston Holdings, Inc. 144A restricted, 4.625%, 11/01/24 | | 1,030,000 |
The accompanying notes to financial statements are an integral part of this schedule.
– 10 –
Schedule of Investments (continued)
June 30, 2017 (unaudited)
| | | | |
| | Shares or | | | |
| | Principal | | | |
| | Amount | | | Value |
| | NON-CONVERTIBLE BONDS — 91.47% (continued) | | |
| | | Consumer Goods – Food-Wholesale — 7.10% (continued) | | |
| $ | 600,000 | Pinnacle Foods Inc. 5.875%, 01/15/24 | $ | 640,500 |
| | 500,000 | Post Holdings, Inc. 144A restricted, 5.50%, 03/01/25 | | 515,625 |
| | 1,250,000 | TreeHouse Foods, Inc. 4.875%, 03/15/22 | | 1,290,625 |
| | 528,000 | Wells Enterprises, Inc. 144A restricted, 6.75%, 02/01/20 | | 545,820 |
| | | | | 7,603,420 |
| | | Consumer Goods – Personal & Household Products — 2.61% | | |
| | 500,000 | Energizer Holdings, Inc. 144A restricted, 5.50%, 06/15/25 | | 523,125 |
| | 1,465,000 | FGI Operating Company, LLC 7.875%, 05/01/20 | | 981,550 |
| | 500,000 | Tempur Sealy International, Inc. 5.625%, 10/15/23 | | 518,750 |
| | 750,000 | Vista Outdoor Inc. 5.875%, 10/01/23 | | 770,625 |
| | | | | 2,794,050 |
| | | Energy – Exploration & Production — 0.94% | | |
| | 1,000,000 | RSP Permian, Inc. 144A restricted, 5.25%, 01/15/25 | | 1,001,250 |
| | | Energy – Gas-Distribution — 3.37% | | |
| | 1,500,000 | Cheniere Corpus Christi Holdings LLC | | |
| | | 144A restricted, 5.125%, 06/30/27 | | 1,537,500 |
| | 750,000 | Tesoro Logistics LP 5.25%, 01/15/25 | | 787,500 |
| | 1,000,000 | Transcontinental Gas Pipe Line Company, LLC 7.85%, 02/01/26 | | 1,286,553 |
| | | | | 3,611,553 |
| | | Energy – Oil Field Equipment & Services — 2.19% | | |
| | 1,000,000 | Hornbeck Offshore Services, Inc. 5.00%, 03/01/21 | | 537,500 |
| | 1,000,000 | Parker Drilling Company 6.75%, 07/15/22 | | 767,500 |
| | 1,000,000 | Weatherford International Ltd. 144A restricted, 9.875%, 02/15/24 | | 1,045,000 |
| | | | | 2,350,000 |
| | | Energy – Oil Refining & Marketing — 0.40% | | |
| | 500,000 | Calumet Specialty Products Partners, L.P. 6.50%, 04/15/21 | | 432,500 |
| | | Financial Services – Brokerage — 4.10% | | |
| | 1,500,000 | Jefferies Finance LLC 144A restricted, 7.375%, 04/01/20 | | 1,537,500 |
| | 2,000,000 | LPL Holdings, Inc. 144A restricted, 5.75%, 09/15/25 | | 2,080,000 |
| | 774,000 | Oppenheimer Holdings Inc. 8.75%, 04/15/18 | | 776,786 |
| | | | | 4,394,286 |
| | | Financial Services – Investments & | | |
| | | Miscellaneous Financial Services — 0.94% | | |
| | 1,000,000 | Icahn Enterprises L.P. 4.875%, 03/15/19 | | 1,010,000 |
| | | Healthcare – Facilities — 1.71% | | |
| | 750,000 | HealthSouth Corporation 5.75%, 09/15/25 | | 789,375 |
| | 1,000,000 | Sabra Health Care Limited Partnership 5.50%, 02/01/21 | | 1,040,000 |
| | | | | 1,829,375 |
The accompanying notes to financial statements are an integral part of this schedule.
– 11 –
Schedule of Investments (continued)
June 30, 2017 (unaudited)
| | | | |
| | Shares or | | | |
| | Principal | | | |
| | Amount | | | Value |
| | NON-CONVERTIBLE BONDS — 91.47% (continued) | | |
| | | Healthcare – Medical Products — 1.18% | | |
| $ | 1,225,000 | Teleflex Incorporated 5.25%, 06/15/24 | $ | 1,267,875 |
| | | Leisure – Gaming — 1.39% | | |
| | 1,500,000 | Scientific Games International, Inc. 6.25%, 09/01/20 | | 1,486,875 |
| | | Leisure – Theaters & Entertainment — 0.96% | | |
| | 1,000,000 | Cinemark USA, Inc. 5.125%, 12/15/22 | | 1,030,000 |
| | | Media – Advertising — 1.45% | | |
| | 1,500,000 | Nielsen Company (Luxembourg) S.ar.l. (The) | | |
| | | 144A restricted, 5.50%, 10/01/21 | | 1,552,500 |
| | | Media – Content — 1.01% | | |
| | 1,000,000 | Netflix, Inc. 5.50%, 02/15/22 | | 1,085,930 |
| | | Real Estate – Development & Management — 0.49% | | |
| | 500,000 | CBRE Services, Inc. 5.00%, 03/15/23 | | 520,931 |
| | | Retail – Food & Drug Retailer — 1.18% | | |
| | 1,500,000 | Fresh Market, Inc. (The) 144A restricted, 9.75%, 05/01/23 | | 1,258,125 |
| | | Retail – Restaurants — 1.24% | | |
| | 1,300,000 | Wok Acquisition Corp. 144A restricted, 10.25%, 06/30/20 | | 1,326,000 |
| | | Retail – Specialty Retail — 5.71% | | |
| | 1,000,000 | Levi Strauss & Co. 5.00%, 05/01/25 | | 1,045,000 |
| | 1,000,000 | Murphy Oil USA, Inc. 6.00%, 08/15/23 | | 1,055,000 |
| | 1,750,000 | PetSmart, Inc. 144A restricted, 7.125%, 03/15/23 | | 1,557,500 |
| | 500,000 | PetSmart, Inc. 144A restricted, 8.875%, 06/01/25 | | 461,800 |
| | 1,120,000 | Rent-A-Center, Inc. 4.75%, 05/01/21 | | 1,013,600 |
| | 1,000,000 | Wolverine World Wide, Inc. 144A restricted, 5.00%, 09/01/26 | | 986,250 |
| | | | | 6,119,150 |
| | | Services – Support-Services — 10.48% | | |
| | 1,500,000 | ADT Corporation (The) 3.50%, 07/15/22 | | 1,450,800 |
| | 1,500,000 | Aramark Services, Inc. 5.125%, 01/15/24 | | 1,576,875 |
| | 1,000,000 | Avis Budget Car Rental, LLC 144A restricted, 5.125%, 06/01/22 | | 990,000 |
| | 1,000,000 | Cardtronics, Inc. 5.125%, 08/01/22 | | 1,015,000 |
| | 1,000,000 | Corrections Corporation of America 4.625%, 05/01/23 | | 1,010,000 |
| | 2,000,000 | GEO Group, Inc. (The) 6.00%, 04/15/26 | | 2,075,000 |
| | 1,500,000 | Ritchie Bros. Auctioneers Incorporated | | |
| | | 144A restricted, 5.375%, 01/15/25 | | 1,563,750 |
| | 1,500,000 | United Rentals (North America), Inc. 5.50%, 05/15/27 | | 1,545,000 |
| | | | | 11,226,425 |
| | | Technology & Electronics – Hardware & Equipment — 5.92% | | |
| | 500,000 | Brocade Communications Systems, Inc. 4.625%, 01/15/23 | | 514,375 |
| | 1,500,000 | CommScope, Inc. 144A restricted, 5.00%, 06/15/21 | | 1,533,750 |
The accompanying notes to financial statements are an integral part of this schedule.
– 12 –
Schedule of Investments (continued)
June 30, 2017 (unaudited)
| | | | |
| | Shares or | | | |
| | Principal | | | |
| | Amount | | | Value |
| | NON-CONVERTIBLE BONDS — 91.47% (continued) | | |
| Technology & Electronics – Hardware & Equipment — 5.92% (continued) |
| $ | 1,500,000 | Dell Inc. 144A restricted, 7.125%, 06/15/24 | $ | 1,648,884 |
| | 1,000,000 | NCR Corporation 5.875%, 12/15/21 | | 1,040,000 |
| | 500,000 | NCR Corporation 5.00%, 07/15/22 | | 510,000 |
| | 1,000,000 | Western Digital Corporation 144A restricted, 7.375%, 04/01/23 | | 1,098,750 |
| | | | | 6,345,759 |
| | | Technology & Electronics – Software & Services — 2.41% | | |
| | 1,000,000 | CDK Global, Inc. 144A restricted, 4.875%, 06/01/27 | | 1,027,500 |
| | 1,500,000 | First Data Corporation 144A restricted, 5.75%, 01/15/24 | | 1,558,125 |
| | | | | 2,585,625 |
| | | Telecommunications – Wireless — 2.38% | | |
| | 1,500,000 | Digicel Limited 144A restricted, 6.00%, 04/15/21 | | 1,438,125 |
| | 1,000,000 | Sprint Corporation 7.25%, 09/15/21 | | 1,111,250 |
| | | | | 2,549,375 |
| | | Telecommunications – Wireline Integrated & Services — 4.98% | | |
| | 1,000,000 | Cincinnati Bell Inc. 144A restricted, 7.00%, 07/15/24 | | 1,045,200 |
| | 1,500,000 | Equinix, Inc. 5.375%, 04/01/23 | | 1,558,125 |
| | 591,000 | Frontier Communications Corporation 8.50%, 04/15/20 | | 621,289 |
| | 2,000,000 | Zayo Group, LLC 6.00%, 04/01/23 | | 2,105,000 |
| | | | | 5,329,614 |
| | | Transportation – Infrastructure/Services — 1.46% | | |
| | 1,500,000 | XPO Logistics, Inc. 144A restricted, 6.125%, 09/01/23 | | 1,561,875 |
| | | Utility – Electric-Generation — 1.60% | | |
| | 1,000,000 | Calpine Corporation 5.375%, 01/15/23 | | 975,000 |
| | 250,000 | Dynegy Inc. 144A restricted, 8.00%, 01/15/25 | | 242,500 |
| | 500,000 | Dynegy Inc. 7.375%, 11/01/22 | | 493,750 |
| | | | | 1,711,250 |
| | | TOTAL NON-CONVERTIBLE BONDS | | |
| | | (cost $97,018,364) | | 97,987,187 |
| | COMMON STOCKS — 1.48% | | |
| | | Energy — 0.44% | | |
| | 17,500 | Enterprise Products Partners L.P. | | 473,900 |
| | | Real Estate — 1.04% | | |
| | 5,500 | CoreSite Realty Corporation | | 569,415 |
| | 1,250 | Equinix, Inc. | | 536,450 |
| | | | | 1,105,865 |
| | | TOTAL COMMON STOCKS | | |
| | | (cost $1,603,434) | | 1,579,765 |
The accompanying notes to financial statements are an integral part of this schedule.
– 13 –
Schedule of Investments (continued)
June 30, 2017 (unaudited)
| | | | |
| | Shares or | | | |
| | Principal | | | |
| | Amount | | | Value |
| | CONVERTIBLE PREFERRED STOCKS — 1.86% | | |
| | | Energy — 0.89% | | |
| | 22,000 | Kinder Morgan, Inc. 9.75%, Cumulative, Convertible, Series A | $ | 953,040 |
| | | Healthcare – Pharmaceuticals, | | |
| | | Biotechnology & Life Sciences — 0.97% | | |
| | 1,200 | Allergan plc 5.25%, Cumulative, Mandatory Convertible, Series A | | 1,038,000 |
| | | TOTAL CONVERTIBLE PREFERRED STOCKS | | |
| | | (cost $1,973,469) | | 1,991,040 |
| SHORT-TERM INVESTMENTS — 3.58% | | |
| | | U.S. Government Securities — 2.33% | | |
| $ | 1,000,000 | U.S. Treasury Bill 0.670%, 07/06/17 | | 999,945 |
| | 1,500,000 | U.S. Treasury Bill 0.771%, 07/20/17 | | 1,499,462 |
| | | | | 2,499,407 |
| | | Money Market Fund — 1.25% | | |
| | 1,339,759 | Morgan Stanley Liquidity Funds | | |
| | | Government Portfolio (Institutional Class), 7-day net yield 0.84% | | 1,339,759 |
| | | TOTAL SHORT-TERM INVESTMENTS | | |
| | | (cost $3,839,166) | | 3,839,166 |
| | | TOTAL INVESTMENTS | | |
| | | (cost $104,434,433) — 98.39% | | 105,397,158 |
| | | OTHER ASSETS, NET OF LIABILITIES — 1.61% | | 1,730,005 |
| | | TOTAL NET ASSETS | | |
| | | (basis of percentages disclosed above) – 100% | $ | 107,127,163 |
(1) The greater of (i) 3-month LIBOR plus 0.40% and (ii) 4.00%, such rate being reset quarterly.
Securities purchased pursuant to Rule 144A under the Securities Act of 1933 may be sold in transactions exempt from registration only to qualified institutional buyers or in a public offering registered under the Securities Act of 1933.
The accompanying notes to financial statements are an integral part of this schedule.
– 14 –
Statement of Assets and Liabilities
June 30, 2017 (unaudited)
| | | |
| ASSETS | | | |
| Investments in securities at value (cost $104,434,433) | $ | 105,397,158 | |
| Receivables — | | | |
| Investment securities sold | | 371,091 | |
| Interest and dividend | | 1,610,523 | |
| Capital stock subscription | | 1,278 | |
| Total receivables | | 1,982,892 | |
| Other | | 14,338 | |
| Total assets | | 107,394,388 | |
| |
| LIABILITIES | | | |
| Payables — | | | |
| Investment securities purchased | | 159,155 | |
| Due to adviser — | | | |
| Management fee | | 41,525 | |
| Accounting and administrative fee | | 4,384 | |
| Total due to adviser | | 45,909 | |
| 12b-1 and servicing fee | | 22,099 | |
| Other payables and accrued expense | | 40,062 | |
| Total liabilities | | 267,225 | |
| Total net assets | $ | 107,127,163 | |
| |
| NET ASSETS CONSIST OF | | | |
| Paid in capital | $ | 118,647,131 | |
| Net unrealized appreciation on investments | | 962,725 | |
| Accumulated net realized loss on investments | | (13,985,590 | ) |
| Accumulated undistributed net investment income | | 1,502,897 | |
| Total net assets | $ | 107,127,163 | |
| |
| Class I | | | |
| Net assets | $ | 102,745,913 | |
| Shares outstanding | | 11,064,173 | |
| NET ASSET VALUE PER SHARE ($.05 par value, 75,000,000 | | | |
| shares authorized), offering price and redemption price | $ | 9.29 | |
| |
| Class N | | | |
| Net assets | $ | 4,381,250 | |
| Shares outstanding | | 464,598 | |
| NET ASSET VALUE PER SHARE ($.05 par value, 25,000,000 | | | |
| shares authorized), offering price and redemption price | $ | 9.43 | |
The accompanying notes to financial statements are an integral part of this statement.
– 15 –
| | |
| Statement of Operations | | |
| For the six months ended June 30, 2017 (unaudited) | | |
| |
| INCOME | | |
| Interest | $ | 2,959,142 |
| Dividend | | 136,221 |
| Total income | | 3,095,363 |
| |
| EXPENSES | | |
| Management fee | | 238,483 |
| Registration fees | | 30,001 |
| Accounting and administrative fees | | 25,068 |
| Transfer agent fees | | 23,529 |
| Accounting system and pricing service fees | | 19,367 |
| Audit and tax fees | | 16,656 |
| Printing | | 9,628 |
| 12b-1 fees – Class N | | 8,364 |
| Directors’ fees | | 6,250 |
| Legal fees | | 5,392 |
| Custodian fees | | 3,278 |
| Servicing fees – Class N | | 2,971 |
| Postage and mailing | | 2,323 |
| Insurance | | 2,243 |
| Other operating expenses | | 2,487 |
| Total expenses | | 396,040 |
| Net investment income | | 2,699,323 |
| |
| NET REALIZED GAIN ON INVESTMENTS | | 935,765 |
| |
| CHANGE IN NET UNREALIZED APPRECIATION/DEPRECIATION | | |
| ON INVESTMENTS | | 327,333 |
| Net realized and unrealized gain on investments | | 1,263,098 |
| Net increase in net assets resulting from operations | $ | 3,962,421 |
The accompanying notes to financial statements are an integral part of this statement.
– 16 –
Statements of Changes in Net Assets
For the six months ended June 30, 2017 (unaudited) and the year ended December 31, 2016
| | | | | | |
| | | Six Months Ended | | | | |
| | | 06/30/2017 | | | Year Ended | |
| | | (unaudited) | | | 12/31/2016 | |
| INCREASE (DECREASE) IN | | | | | | |
| NET ASSETS FROM OPERATIONS | | | | | | |
| Net investment income | $ | 2,699,323 | | $ | 4,974,542 | |
| Net realized gain/(loss) on investments | | 935,765 | | | (4,896,343 | ) |
| Change in net unrealized | | | | | | |
| appreciation/depreciation on investments | | 327,333 | | | 9,705,394 | |
| Net increase in net assets | | | | | | |
| resulting from operations | | 3,962,421 | | | 9,783,593 | |
| |
| DISTRIBUTIONS TO SHAREHOLDERS | | | | | | |
| From net investment income – Class I | | (1,403,176 | ) | | (4,571,047 | ) |
| From net investment income – Class N | | (70,168 | ) | | (308,943 | ) |
| Total distribution | | (1,473,344 | ) | | (4,879,990 | ) |
| |
| CAPITAL SHARE TRANSACTIONS | | | | | | |
| Proceeds from shares issued – Class I | | | | | | |
| (294,299 and 573,580 shares, respectively) | | 2,703,822 | | | 5,145,275 | |
| Reinvestment of distributions – Class I | | | | | | |
| (136,938 and 451,928 shares, respectively) | | 1,259,827 | | | 4,083,524 | |
| Cost of shares redeemed – Class I | | | | | | |
| (436,920 and 719,387 shares, respectively) | | (4,028,369 | ) | | (6,460,066 | ) |
| Proceeds from shares issued – Class N | | | | | | |
| (1,265,485 and 2,389,816 shares, respectively) | | 11,823,222 | | | 21,740,142 | |
| Reinvestment of distributions – Class N | | | | | | |
| (7,178 and 32,387 shares, respectively) | | 67,114 | | | 297,307 | |
| Cost of shares redeemed – Class N | | | | | | |
| (1,685,052 and 1,850,845 shares, respectively) | | (15,756,158 | ) | | (16,911,469 | ) |
| Change in net assets derived from | | | | | | |
| capital share transactions | | (3,930,542 | ) | | 7,894,713 | |
| Total increase (decrease) in net assets | | (1,441,465 | ) | | 12,798,316 | |
| |
| NET ASSETS | | | | | | |
| Beginning of period | | 108,568,628 | | | 95,770,312 | |
| End of period (including accumulated | | | | | | |
| undistributed net investment income of | | | | | | |
| $1,502,897 and $49,781, respectively) | $ | 107,127,163 | | $ | 108,568,628 | |
The accompanying notes to financial statements are an integral part of these statements.
– 17 –
Notes to Financial Statements
June 30, 2017 (unaudited)
These financial statements have been prepared pursuant to reporting rules for interim
financial statements. Accordingly, these financial statements do not include all of the
information and footnotes required by generally accepted accounting principles (“GAAP”) for
annual financial statements. These financial statements should be read in conjunction with the
financial statements and financial highlights and notes in the Fund’s Annual Report on Form
N-CSR for the year ended December 31, 2016.
These financial statements have not been audited. Management believes that these financial
statements include all adjustments (which, unless otherwise noted, include only normal
recurring adjustments) necessary for a fair presentation of the financial results for each
period shown.
(1) Summary of Significant Accounting Policies —
Nicholas High Income Fund, Inc. (the “Fund”) is organized as a Maryland corporation
and is registered as an open-end, diversified management investment company under
the Investment Company Act of 1940, as amended. The primary objective of the Fund is
high current income consistent with the preservation and conservation of capital values.
The following is a summary of the significant accounting policies of the Fund:
(a) Equity securities traded on a stock exchange will ordinarily be valued on the basis of
the last sale price on the date of valuation on the securities principal exchange, or if
in the absence of any sale on that day, the closing bid price. For securities
principally traded on the NASDAQ market, the Fund uses the NASDAQ Official
Closing Price. Investments in shares of open-end mutual funds, including money
market funds, are valued at their daily net asset value, which is calculated as of the
close of regular trading on the New York Stock Exchange. Debt securities, excluding
short-term investments, are valued at their current evaluated bid price as determined
by an independent pricing service, which generates evaluations on the basis of
dealer quotes for normal institutional-sized trading units, issuer analysis, bond
market activity and various other factors. Securities for which market quotations
may not be readily available are valued at their fair value as determined in good faith
by procedures adopted by the Board of Directors. Short-term investments
purchased at par are valued at cost, which approximates market value. Short-term
investments purchased at a premium or discount are stated at amortized cost, which
approximates market value. The Fund did not maintain any positions in derivative
instruments or engage in hedging activities during the year. Investment transactions
for financial statement purposes are recorded on trade date.
In accordance with Accounting Standards Codification (“ASC”) 820-10, “Fair Value
Measurements and Disclosures” (“ASC 820-10”), fair value is defined as the price
that the Fund would receive upon selling an investment in a timely transaction to an
independent buyer in the principal or most advantageous market of the investment.
ASC 820-10 established a three-tier hierarchy to maximize the use of observable
market data and minimize the use of unobservable inputs and to establish
classification of fair value measurements for disclosure purposes. Inputs refer
broadly to the assumptions that market participants would use in pricing the asset
or liability, including assumptions about risk, for example, the risk inherent in a
particular valuation technique used to measure fair value such as a pricing model
– 18 –
Notes to Financial Statements (continued)
June 30, 2017 (unaudited)
and/or the risk inherent in the inputs to the valuation technique. Inputs may be
observable or unobservable. Observable inputs are inputs that reflect the
assumptions market participants would use in pricing the asset or liability based on
market data obtained from sources independent of the reporting entity.
Unobservable inputs are inputs that reflect the reporting entity’s own assumptions
about the assumptions market participants would use in pricing the asset or liability
based on the best information available in the circumstances. The three-tier
hierarchy of inputs is summarized in the three broad levels listed below.
Level 1 – quoted prices in active markets for identical investments
Level 2 – other significant observable inputs (including quoted prices for
similar investments, interest rates, benchmark yields, bids, offers,
transactions, spreads and other relationships observed in the
markets among market securities, underlying equity of the issuer,
proprietary pricing models, credit risk, etc.)
Level 3 – significant unobservable inputs (including the Fund’s own
assumptions in determining the fair value of investments)
The inputs or methodology used for valuing securities are not necessarily an
indication of the risk associated with investing in those securities.
The following is a summary of the inputs used as of June 30, 2017 in valuing the
Fund’s investments carried at value:
| | |
| | | Investments |
| Valuation Inputs | | in Securities |
| Level 1 – | | |
| Common Stocks(1) | $ | 1,579,765 |
| Money Market Fund | | 1,339,759 |
| Level 2 – | | |
| Non-Convertible Bonds(1) | | 97,987,187 |
| Convertible Preferred Stocks(1) | | 1,991,040 |
| U.S. Treasury Bills | �� | 2,499,407 |
| Level 3 – | | |
| None | | — |
| Total | $ | 105,397,158 |
| (1) See Schedule of Investments for further detail by industry. | | |
There were no transfers between levels during the period ended June 30, 2017 and
the Fund did not hold any Level 3 investments during the period.
(b) Net realized gain (loss) on portfolio securities was computed on the basis of
specific identification.
(c) Dividend income is recorded on the ex-dividend date, and interest income is
recognized on an accrual basis. Non-cash dividends, if any, are recorded at value
on date of distribution. Generally, discounts and premiums on long-term debt
security purchases, if any, are amortized over the expected lives of the respective
securities using the effective yield method.
– 19 –
Notes to Financial Statements (continued)
June 30, 2017 (unaudited)
(d) Provision has not been made for federal income taxes or excise taxes since the
Fund has elected to be taxed as a “regulated investment company” and intends to
distribute substantially all net investment income and net realized capital gains on
sales of investments to its shareholders and otherwise comply with the provisions
of Subchapter M of the Internal Revenue Code applicable to regulated investment
companies.
Investment income, net capital gains (losses) and all expenses incurred by the Fund
are allocated based on the relative net assets of each class, except for service fees
and certain other fees and expenses related to one class of shares.
Class N shares are subject to a 0.25% 12b-1 fee and a 0.10% servicing fee, as
described in its prospectus. Subsequent to April 30, 2017 through period-end, the
servicing fee was voluntarily reduced to 0.06%. Income, expenses (other than
expenses attributable to a specific class), and realized and unrealized gains and
losses are allocated daily to each class of shares based upon the relative net asset
value of outstanding shares.
(e) Dividends and distributions paid to shareholders are recorded on the ex-dividend
date. Distributions from net investment income are generally declared and paid at
least quarterly. Distributions of net realized capital gain, if any, are declared and
paid at least annually.
The amount of distributions from net investment income and net realized capital
gain are determined in accordance with federal income tax regulations, which may
differ from U.S. generally accepted accounting principles (“U.S. GAAP”) for
financial reporting purposes. Financial reporting records are adjusted for
permanent book-to-tax differences to reflect tax character. At June 30, 2017,
reclassifications were recorded to increase accumulated undistributed net
investment income by $227,137, increase accumulated net realized loss on
investments by $226,891 and decrease paid in capital by $246.
The tax character of distributions paid during the six months ended June 30, 2017
and the year ended December 31, 2016 was as follows:
| | | | |
| | | 06/30/2017 | | 12/31/2016 |
| Distributions paid from: | | | | |
| Ordinary income | $ | 1,473,344 | $ | 4,879,990 |
As of June 30, 2017, investment cost for federal tax purposes was $104,434,433
and the tax basis components of net assets were as follows:
| | | |
| Unrealized appreciation | $ | 3,140,041 | |
| Unrealized depreciation | | (2,177,316 | ) |
| Net unrealized appreciation | $ | 962,725 | |
There were no differences between the book-basis and tax-basis components of net
assets.
For the year ended December 31, 2016, the Fund had capital loss carryforwards of
approximately $14,694,000, which expire as follows: $6,834,000 in 2017 and
– 20 –
Notes to Financial Statements (continued)
June 30, 2017 (unaudited)
$7,860,000 indefinitely. To the extent the Fund has future net realized capital gains,
distributions of capital gains to shareholders will be offset by any unused capital
loss carryforward utilizing the indefinite carryforward prior to the others.
The Fund had no material uncertain tax positions and has not recorded a liability for
unrecognized tax benefits as of June 30, 2017. Also, the Fund recognized no
interest and penalties related to uncertain tax benefits during the period ended
June 30, 2017. At June 30, 2017, the fiscal years 2013 through 2016 remain open
to examination in the Fund’s major tax jurisdictions.
(f) The Fund is considered an investment company under U.S. GAAP and follows the
accounting and reporting guidance applicable to investment companies in the
Financial Accounting Standards Board (“FASB”) ASC 946, Financial Services –
Investment Companies. U.S. GAAP guidance requires management to make
estimates and assumptions that effect the amounts reported in the financial
statements and accompanying notes. Actual results could differ from estimates.
(g) In the normal course of business the Fund enters into contracts that contain
general indemnification clauses. The Fund’s maximum exposure under these
arrangements is unknown, as this would involve future claims against the Fund that
have not yet occurred. Based on experience, the Fund expects the risk of loss to be
remote.
(h) In connection with the preparation of the Fund’s financial statements, management
evaluated subsequent events after the date of the Statement of Assets and
Liabilities of June 30, 2017. There have been no significant subsequent events
since June 30, 2017 that would require adjustment to or additional disclosure in
these financial statements.
(2) Related Parties —
(a) Investment Adviser and Management Agreement —
The Fund has an agreement with Nicholas Company, Inc. (with whom certain
officers and directors of the Fund are affiliated) (the “Adviser”) to serve as
investment adviser and manager. Under the terms of the agreement, a monthly fee
is paid to the Adviser based on an annualized fee of 0.50% of the average net asset
value up to and including $50 million, 0.40% of the average net asset value in
excess of $50 million and up to and including $100 million and 0.30% of the
average net asset value in excess of $100 million.
The Adviser may be paid for accounting and administrative services rendered by its
personnel, subject to the following guidelines: (i) up to five basis points, on an
annual basis, of the average net asset value of the Fund up to and including $2
billion and up to three basis points, on an annual basis, of the average net asset
value of the Fund greater than $2 billion, based on the average net asset value of
the Fund as determined by valuations made at the close of each business day of
each month, and (ii) where the preceding calculation results in an annual payment
of less than $50,000, the Adviser, in its discretion, may charge the Fund up to
$50,000 for such services.
– 21 –
Notes to Financial Statements (continued)
June 30, 2017 (unaudited)
(b) Legal Counsel —
A director of the Adviser is affiliated with a law firm that provides services to the
Fund. The Fund incurred expenses of $2,892 for the period ended June 30, 2017
for legal services rendered by this law firm.
(3) Investment Transactions —
For the period ended June 30, 2017, the cost of purchases and the proceeds from sales
of investment securities, other than short-term obligations, aggregated $23,127,531 and
$28,006,476, respectively.
(4) Concentration of Risk —
The Fund invests primarily in high yield debt securities. The market values of these high
yield debt securities tend to be more sensitive to economic conditions and individual
corporate developments than those of higher rated securities. In addition, the market for
these securities is generally less liquid than for higher rated securities.
– 22 –
Historical Record Class I(1)
(unaudited)
| | | | | | | |
| | | Net | | Net Investment | | | Growth of an |
| | | Asset Value | | Income Distributions | | | Initial $10,000 |
| | | Per Share | | Per Share | | | Investment(3) |
| November 21, 1977(2) | $ | 25.50 | $ | — | | $ | 10,000 |
| December 31, 1992 | | 16.90 | | 1.4775 | | | 35,143 |
| December 31, 1993 | | 17.60 | | 1.4450 | | | 39,695 |
| December 31, 1994 | | 16.05 | | 1.5050 | | | 39,626 |
| December 31, 1995 | | 17.10 | | 1.4750 | | | 46,029 |
| December 31, 1996 | | 17.65 | | 1.4800 | | | 51,721 |
| December 31, 1997 | | 18.45 | | 1.4515 | | | 58,514 |
| December 31, 1998 | | 16.95 | | 1.5775 | | | 58,788 |
| December 31, 1999 | | 15.30 | | 1.6560 | | | 58,749 |
| December 31, 2000 | | 12.00 | | 1.5300 | | | 51,620 |
| December 31, 2001 | | 11.80 | | 1.2150 | | | 56,144 |
| December 31, 2002 | | 9.65 | | 0.9925 | | | 50,459 |
| December 31, 2003 | | 10.95 | | 0.8450 | | | 61,937 |
| December 31, 2004 | | 11.15 | | 0.8200 | | | 67,915 |
| December 31, 2005 | | 10.50 | | 0.7895 | | | 68,849 |
| December 31, 2006 | | 10.70 | | 0.7455 | | | 75,221 |
| December 31, 2007 | | 10.18 | | 0.7502 | | | 76,820 |
| December 31, 2008 | | 7.18 | | 0.7140 | | | 58,955 |
| December 31, 2009 | | 9.09 | | 0.6581 | | | 80,426 |
| December 31, 2010 | | 9.52 | | 0.7230 | | | 90,876 |
| December 31, 2011 | | 9.28 | | 0.7070 | | | 95,354 |
| December 31, 2012 | | 9.86 | | 0.6375 | | | 108,095 |
| December 31, 2013 | | 9.86 | | 0.5757 | | | 114,488 |
| December 31, 2014 | | 9.52 | | 0.5065 | | | 116,347 |
| December 31, 2015 | | 8.65 | | 0.4592 | | | 111,068 |
| December 31, 2016 | | 9.08 | | 0.4204 | | | 122,109 |
| June 30, 2017 | | 9.29 | | 0.1278 | (a) | | 126,669 |
(1) Per share amounts presented for the periods prior to December 31, 2007 in this historical record
have been restated or adjusted to reflect a reverse stock split of one share for every five shares
outstanding effected on January 29, 2007.
(2) Initial date under Nicholas Company, Inc. management.
(3) Assuming reinvestment of distributions.
(a) Paid on April 26, 2017 to shareholders of record on April 25, 2017.
The Fund distributed no capital gains for the time periods listed.
– 23 –
Historical Record Class N(1)
(unaudited)
| | | | | | | |
| | | Net | | Net Investment | | | Growth of an |
| | | Asset Value | | Income Distributions | | | Initial $10,000 |
| | | Per Share | | Per Share | | | Investment(3) |
| February 28, 2005(2) | $ | 11.20 | $ | — | | $ | 10,000 |
| December 31, 2005 | | 10.40 | | 0.7320 | | | 9,947 |
| December 31, 2006 | | 10.60 | | 0.7140 | | | 10,846 |
| December 31, 2007 | | 10.06 | | 0.7119 | | | 11,018 |
| December 31, 2008 | | 7.24 | | 0.5238 | | | 8,448 |
| December 31, 2009 | | 9.18 | | 0.6323 | | | 11,501 |
| December 31, 2010 | | 9.64 | | 0.6683 | | | 12,946 |
| December 31, 2011 | | 9.39 | | 0.6782 | | | 13,522 |
| December 31, 2012 | | 9.98 | | 0.6062 | | | 15,275 |
| December 31, 2013 | | 9.99 | | 0.5367 | | | 16,121 |
| December 31, 2014 | | 9.66 | | 0.4697 | | | 16,337 |
| December 31, 2015 | | 8.78 | | 0.4197 | | | 15,525 |
| December 31, 2016 | | 9.22 | | 0.3926 | | | 17,012 |
| June 30, 2017 | | 9.43 | | 0.1165 | (a) | | 17,616 |
(1) Per share amounts presented for the periods prior to December 31, 2007 in this historical record
have been restated or adjusted to reflect a reverse stock split of one share for every five shares
outstanding effected on January 29, 2007.
(2) Date of Initial Public Offering.
(3) Assuming reinvestment of distributions.
(a) Paid on April 26, 2017 to shareholders of record on April 25, 2017.
The Fund distributed no capital gains for the time periods listed.
– 24 –
Approval of Investment Advisory Contract
(unaudited)
In January 2017, the Board of Directors of the Fund renewed the one-year term of the Investment Advisory Agreement by and between the Fund and the Adviser through January 2018. In connection with the renewal of the Investment Advisory Agreement, no changes to the amount or manner of calculation of the management fee or the terms of the agreement were proposed by the Adviser or adopted by the Board. For the fiscal year ended December 31, 2016, the management fee was 0.44% and the Fund’s Class I and Class N total expense ratios (including the management fee but absent acquired funds fees and expenses) were 0.68% and 1.03%, respectively. In renewing the Investment Advisory Agreement, the Board carefully considered the following factors on an absolute basis and relative to the Fund’s peer group: (i) the Fund’s Class I expense ratio, which was the second lowest in its overall peer group; (ii) the Fund’s performance on a short-term and long-term basis; (iii) the Fund’s management fee; and (iv) the range and quality of the services offered by the Adviser. The peer group fund data included high-yield bond funds with similar asset sizes, credit quality and number of holdings. In terms of the peer group data used for performance comparisons, the Fund’s Class I was ranked 7th, 8th, and 7th out of 10 funds for the one-, three- and five-year periods and 6th out of seven funds for the 10-year period all ending December 31, 2016. The Fund’s Class I ranked 5th in terms of 12-month yield out of the 10 funds.
The Board considered the range of services to be provided by the Adviser to the Fund under the Advisory Agreement. The Board discussed the nature, extent, and quality of the services to be provided by the Adviser and concluded that the services provided were consistent with the terms of the advisory agreement and the needs of the Fund, and that the services provided were of a high quality.
The Board considered the investment performance of the Fund and the Adviser. Among other things, the Board noted its consideration of the Fund’s performance relative to peer funds. The Board reviewed the actual relative short-term and long-term performance of the Fund. The Board expressed satisfaction with the Fund’s performance. The Board also discussed the extent to which economies of scale would be realized, and whether such economies were reflected in the Fund’s fee levels and concluded that the Adviser had been instrumental in holding down Fund costs, citing consistently low fees.
The Board considered the cost of services provided by the Adviser. The Board also considered the profits to be realized by the Adviser from the relationship with the Fund. The Board expressed the opinion that given the Board’s focus on performance and maintaining a low fee structure, the Adviser’s profits were not relevant.
The Board determined that the Adviser had fully and adequately carried out the terms and conditions of its contract with the Fund. The Board discussed the Fund’s relatively low fees, historical returns and risk profile and management’s strategies to improve the absolute and relative performance of the Fund. The Board agreed that the Adviser had the resources, financial management and administrative capacity to continue to provide quality services. The Board expressed satisfaction with the Fund’s performance, management’s control of expenses and the rate of the management fee for the Fund and the overall level of services provided to the Fund by the Adviser.
– 25 –
Information on Proxy Voting
(unaudited)
A description of the policies and procedures that the Fund uses to determine how to vote proxies relating to portfolio securities is available, without charge, upon request by calling 800-544-6547 or 414-276-0535. It also appears in the Fund’s Statement of Additional Information, which can be found on the SEC’s website, www.sec.gov. A record of how the Fund voted its proxies for the most recent twelve-month period ended June 30, also is available on the Fund’s website, www.nicholasfunds.com, and the SEC’s website, www.sec.gov.
Quarterly Portfolio Schedule
(unaudited)
The Fund files its complete schedule of investments with the SEC for the first and third quarters of each fiscal year on Form N-Q. The Fund’s Form N-Q’s are available on the SEC’s website at www.sec.gov and may be reviewed and copied at the SEC’s Public Reference Room in Washington, D.C. Information on the operation of the Public Reference Room may be obtained by calling 800-SEC-0330.
– 26 –
Privacy Policy
(unaudited)
Nicholas High Income Fund, Inc. respects each shareholder’s right to privacy. We are committed to safeguarding the information that you provide us to maintain and execute transactions on your behalf.
We collect the following non-public personal information about you:
| * | Information we receive from you on applications or other forms, whether we receive the form in writing or electronically. This includes, but is not limited to, your name, address, phone number, tax identification number, date of birth, beneficiary information and investment selection. |
| * | Information about your transactions with us and account history with us. This includes, but is not limited to, your account number, balances and cost basis information. This also includes transaction requests made through our transfer agent. |
| * | Other general information that we may obtain about you such as demographic information. |
WE DO NOT SELL ANY NON-PUBLIC PERSONAL INFORMATION ABOUT CURRENT OR FORMER SHAREHOLDERS.
INFORMATION SHARED WITH OUR TRANSFER AGENT, A THIRD PARTY COMPANY, ALSO IS NOT SOLD.
We may share, only as permitted by law, non-public personal information about you with third party companies. Listed below are some examples of third parties to whom we may disclose non-public personal information. While these examples do not cover every circumstance permitted by law, we hope they help you understand how your information may be shared.
We may share non-public personal information about you:
| * | With companies who work for us to service your accounts or to process transactions that you may request. This would include, but is not limited to, our transfer agent to process your transactions, mailing houses to send you required reports and correspondence regarding the Fund and its Adviser, the Nicholas Company, Inc., and our dividend disbursing agent to process fund dividend checks. |
| * | With a party representing you, with your consent, such as your broker or lawyer. |
| * | When required by law, such as in response to a subpoena or other legal process. |
The Fund and its Adviser maintain policies and procedures to safeguard your non-public personal information. Access is restricted to employees who the Adviser determines need the information in order to perform their job duties. To guard your non-public personal information we maintain physical, electronic, and procedural safeguards that comply with federal standards.
In the event that you hold shares of the Fund with a financial intermediary, including, but not limited to, a broker-dealer, bank, or trust company, the privacy policy of your financial intermediary would govern how your non-public personal information would be shared with non-affiliated third parties.
– 27 –
Nicholas Funds Services Offered
(unaudited)
| | |
| • | IRAs | |
| | • Traditional | • SIMPLE |
| | • Roth | • SEP |
| • | Coverdell Education Accounts |
| • | Automatic Investment Plan |
| • | Direct Deposit of Dividend and Capital Gain Distributions |
| • | Systematic Withdrawal Plan |
| • | Monthly Automatic Exchange between Funds |
| • | Telephone Purchase and Redemption |
| • | Telephone Exchange | |
| • | 24-hour Automated Account Information (800-544-6547) |
| • | 24-hour Internet Account Access (www.nicholasfunds.com) |
Please call a shareholder representative for further information on the above services or with any other questions you may have regarding the Nicholas Funds (800-544-6547).
– 28 –
Directors and Officers
DAVID O. NICHOLAS, President and Director
JOHN A. HAUSER, Director
TIMOTHY P. REILAND, Director
JAY H. ROBERTSON, Director
DAVID L. JOHNSON, Executive Vice President
JENNIFER R. KLOEHN, Senior Vice President,
Treasurer and Chief Compliance Officer
LAWRENCE J. PAVELEC, Senior Vice President and Secretary
CANDACE L. LESAK, Vice President
Investment Adviser
NICHOLAS COMPANY, INC.
Milwaukee, Wisconsin
www.nicholasfunds.com
414-276-0535 or 800-544-6547
Transfer Agent
U.S. BANCORP FUND SERVICES, LLC
Milwaukee, Wisconsin
414-276-0535 or 800-544-6547
Distributor
QUASAR DISTRIBUTORS, LLC
Milwaukee, Wisconsin
Custodian
U.S. BANK N.A.
Milwaukee, Wisconsin
Independent Registered Public Accounting Firm
DELOITTE & TOUCHE LLP
Milwaukee, Wisconsin
Counsel
MICHAEL BEST & FRIEDRICH LLP
Milwaukee, Wisconsin
This report is submitted for the information of shareholders of the Fund. It is not authorized for distribution to prospective investors unless preceded or accompanied by an effective prospectus.
Item 2. Code of Ethics.
Applicable only to annual reports.
Item 3. Audit Committee Financial Expert.
Applicable only to annual reports.
Item 4. Principal Accountant Fees and Services.
Applicable only to annual reports.
Item 5. Audit Committee of Listed Registrants.
Not applicable to this filing.
Item 6. Schedule of Investments.
The schedule of investments in securities of unaffiliated issuers is included as part of the report to shareholders filed under Item 1.
Item 7. Disclosure of Proxy Voting Policies and Procedures for Closed-End Management Investment Companies.
Applicable only to annual reports filed by closed-end funds.
Item 8. Portfolio Managers of Closed-End Management Investment Companies.
Applicable only to annual reports filed by closed-end funds.
Item 9. Purchases of Equity Securities by Closed-End Management Investment Companies and Affiliated Purchasers.
Applicable only to closed-end funds.
Item 10. Submission of Matters to a Vote of Security Holders.
Not applicable to this filing.
Item 11. Controls and Procedures.
The Fund's principal executive officer and principal financial officer have concluded that the Fund's disclosure controls and procedures are sufficient to ensure that information required to be disclosed by the Fund in this Form N-CSR was recorded, processed, summarized and reported within the time periods specified in the Securities and Exchange Commission's rules and forms, based upon such officers' evaluation of these controls and procedures as of a date within 90 days of the filing date of the report. There were no significant changes or corrective actions with regard to significant deficiencies or material weaknesses in the Fund's internal controls or in other factors that could significantly affect the Fund's internal controls subsequent to the date of their evaluation.
Item 12. Exhibits.
(a)(1) Code of Ethics -- Any code of ethics, or amendments thereto, that is the subject of the disclosure required by Item 2, to the extent that the registrant intends to satisfy the Item 2 requirements through filing of an exhibit.
Not applicable to this filing.
(a)(2) Certifications of Principal Executive Officer and Principal Financial Officer pursuant to Section 302 of the Sarbannes-Oxley Act of 2002, attached hereto as part of EX-99.CERT.
(a)(3) Any written solicitation to purchase securities under Rule 23c-1 under the Act sent or given during the period covered by the report by or on behalf of the registrant to 10 or more person.
Applicable only to closed-end funds.
(b) Certifications of Principal Executive Officer and Principal Financial Officer pursuant to Section 906 of the Sarbannes-Oxley Act of 2002, attached hereto as part of EX-99.906CERT.
SIGNATURES
Pursuant to the requirements of the Securities Exchange Act of 1934 and the Investment Company Act of 1940, the registrant has duly caused this report to be signed on its behalf by the undersigned, thereunto duly authorized.
(Registrant) Nicholas High Income Fund, Inc.
By: /s/ David O. Nicholas
Name: David O. Nicholas
Title: Principal Executive Officer
Date: 08/30/2017
Pursuant to the requirements of the Securities Exchange Act of 1934 and the Investment Company Act of 1940, this report has been signed by the following persons on behalf of the registrant and in the capacities and on the dates indicated.
By: /s/ David O. Nicholas
Name: David O. Nicholas
Title: Principal Executive Officer
Date: 08/30/2017
By: /s/ Jennifer R. Kloehn
Name: Jennifer R. Kloehn
Title: Principal Financial Officer
Date: 08/30/2017