
UNITED STATES
SECURITIES AND EXCHANGE COMMISSION
Washington, D.C. 20549
FORM N-CSRS
CERTIFIED SHAREHOLDER REPORT OF REGISTERED
MANAGEMENT INVESTMENT COMPANIES
Investment Company Act file number: 811-09253
Wells Fargo Funds Trust
(Exact name of registrant as specified in charter)
525 Market St., San Francisco, CA 94105
(Address of principal executive offices) (Zip code)
C. David Messman
Wells Fargo Funds Management, LLC
525 Market St., San Francisco, CA 94105
(Name and address of agent for service)
Registrant’s telephone number, including area code: 800-643-9691
Date of fiscal year end: October 31, 2010
Date of reporting period: April 30, 2011
ITEM 1. REPORT TO SHAREHOLDERS


Semi-Annual Report
April 30, 2011
WELLS FARGO ADVANTAGE INTERNATIONAL STOCK FUNDS
| n | | Wells Fargo Advantage Asia Pacific Fund |
| n | | Wells Fargo Advantage Disciplined Global Equity Fund |
| n | | Wells Fargo Advantage Diversified International Fund |
| n | | Wells Fargo Advantage Emerging Markets Equity Fund |
| n | | Wells Fargo Advantage Global Opportunities Fund |
| n | | Wells Fargo Advantage International Equity Fund |
| n | | Wells Fargo Advantage Intrinsic World Equity Fund |
Reduce clutter. Save trees.
Sign up for electronic delivery of prospectuses and shareholder reports at www.wellsfargo.com/advantagedelivery
Contents
The views expressed are as of April 30, 2011, and are those of the Fund managers. Any reference to a specific security in this report is not a recommendation to purchase or sell any specific security or adopt any investment strategy. The views are subject to change at any time in response to changing circumstances in the market and are not intended to predict or guarantee the future performance of any individual security, market sector or the markets generally, or the Wells Fargo Advantage International Stock Funds.
NOT FDIC INSURED ¡ NO BANK GUARANTEE ¡ MAY LOSE VALUE

WELLS FARGO INVESTMENT HISTORY
| | |
| |
| 1932 | | Keystone creates one of the first mutual fund families. |
| |
| 1971 | | Wells Fargo & Company introduces one of the first institutional index funds. |
| |
| 1978 | | Wells Fargo applies Markowitz and Sharpe’s research on Modern Portfolio Theory to introduce one of the industry’s first Tactical Asset Allocation (TAA) models in institutional separately managed accounts. |
| |
| 1984 | | Wells Fargo Stagecoach Funds launches its first asset allocation fund. |
| |
| 1989 | | The Tactical Asset Allocation (TAA) Model is first applied to Wells Fargo’s asset allocation mutual funds. |
| |
| 1994 | | Wells Fargo introduces the LifePath Funds, one of the first suites of target date funds (now the Wells Fargo Advantage Dow Jones Target Date FundsSM ). |
| |
| 1996 | | Evergreen Investments and Keystone Funds merge. |
| |
| 1997 | | Wells Fargo launches Wells Fargo Advantage WealthBuilder PortfoliosSM, a fund-of-funds suite of products that includes the use of quantitative models to shift assets among investment styles. |
| |
| 1999 | | Norwest Advantage Funds and Stagecoach Funds are reorganized into Wells Fargo Funds after the merger of Norwest and Wells Fargo. |
| |
| 2002 | | Evergreen Retail and Evergreen Institutional companies form the umbrella asset management company, Evergreen Investments. |
| |
| 2005 | | The integration of Strong Funds with Wells Fargo Funds creates Wells Fargo Advantage Funds, resulting in one of the top 20 mutual fund companies in the United States. |
| |
| 2006 | | Wells Fargo Advantage Funds relaunches the target date product line as Wells Fargo Advantage Dow Jones Target Date Funds. |
| |
| 2010 | | The mergers and reorganizations of Evergreen and Wells Fargo Advantage mutual funds are completed, unifying the families under the brand of Wells Fargo Advantage Funds. |
Wells Fargo Advantage Funds®
Wells Fargo Advantage Funds skillfully guides institutions, financial advisors, and individuals through the investment terrain to help them reach their financial objectives. Everything we do on behalf of investors is backed by our unique combination of qualifications.
Strength
Our organization is built on the standards of integrity and service established by our parent company—Wells Fargo & Company—more than 150 years ago. And, because we’re part of a highly diversified financial enterprise, we offer the depth of resources to help investors succeed.
Expertise
Our multi-boutique model offers investors access to the independent thinking of premier investment managers that have been chosen for their time-tested strategies. While each team specializes in a specific investment strategy, collectively they provide investors a wide choice of distinct investment styles. Our dedication to investment excellence doesn’t end with our expertise in manager selection—risk management, analysis, and rigorous ongoing review seek to ensure each manager’s investment process remains consistent.
Partnership
Our collaborative approach is built around understanding the needs and goals of our clients. By adhering to core principles of sound judgment and steady guidance, we support you through every stage of the investment decision process.
Carefully consider the investment objectives, risks, charges, and expenses before investing. For a current prospectus for Wells Fargo Advantage Funds containing this and other information, visit wellsfargo.com/advantagefunds. Read it carefully before investing.
Wells Fargo Funds Management, LLC, a wholly owned subsidiary of Wells Fargo & Company, provides investment advisory and administrative services for Wells Fargo Advantage Funds®. Other affiliates of Wells Fargo & Company provide subadvisory and other services for the Funds. The Funds are distributed by Wells Fargo Funds Distributor, LLC, Member FINRA/SIPC, an affiliate of Wells Fargo & Company.
The “Dow Jones Target Date Indexes” are a product of Dow Jones Indexes, a licensed trademark of CME Group Index Services LLC (“CME”). “Dow Jones” and “Dow Jones Target Date Indexes” are service marks of Dow Jones Trademark Holdings, LLC, and have been licensed for use for certain purposes by CME and sublicensed for use by Global Index Advisors, Inc., and Wells Fargo Funds Management, LLC. The Dow Jones Target Date Indexes are based in part on the Barclays Capital Bond Indexes, which are published by Barclays Capital Inc. The Wells Fargo Advantage Dow Jones Target Date Funds, based on the Dow Jones Target Date Indexes, are not sponsored, endorsed, sold, or promoted by Dow Jones, CME or Barclays Capital or any of their respective affiliates, and neither Dow Jones, CME nor Barclays Capital nor any of their respective affiliates makes any representation regarding the advisability of investing in such product(s) and/or about the quality, accuracy, and/or completeness of the Dow Jones Target Date Indexes or the Barclays Capital Bond Indexes. IN NO EVENT SHALL DOW JONES, CME, BARCLAYS CAPITAL, OR ANY OF THEIR LICENSORS HAVE ANY LIABILITY FOR ANY SPECIAL, PUNITIVE, IN DIRECT, OR CONSEQUENTIAL DAMAGES (INCLUDING LOST PROFITS), EVEN IF NOTIFIED OF THE POSSIBILITY OF SUCH DAMAGES.
NOT FDIC INSURED ¡ NO BANK GUARANTEE ¡ MAY LOSE VALUE
Not part of the semi-annual report.
Wells Fargo Advantage Funds offers more than 120 mutual funds across a wide range of asset classes, representing over $241 billion in assets under management, as of April 30, 2011.
| | | | |
| Equity Funds | | | | |
Asia Pacific Fund | | Enterprise Fund† | | Opportunity Fund† |
C&B Large Cap Value Fund | | Equity Value Fund | | Precious Metals Fund |
C&B Mid Cap Value Fund | | Global Opportunities Fund | | Premier Large Company Growth Fund |
Capital Growth Fund | | Growth Fund | | Small Cap Growth Fund |
Classic Value Fund | | Growth Opportunities Fund | | Small Cap Opportunities Fund |
Common Stock Fund | | Health Care Fund | | Small Cap Value Fund |
Core Equity Fund | | Index Fund | | Small Company Growth Fund |
Disciplined Global Equity Fund | | International Equity Fund | | Small Company Value Fund |
Disciplined U.S. Core Fund | | International Value Fund | | Small/Mid Cap Core Fund |
Disciplined Value Fund | | Intrinsic Small Cap Value Fund | | Small/Mid Cap Value Fund |
Discovery Fund† | | Intrinsic Value Fund | | Social Sustainability Fund† |
Diversified Equity Fund | | Intrinsic World Equity Fund | | Special Mid Cap Value Fund |
Diversified International Fund | | Large Cap Core Fund | | Special Small Cap Value Fund |
Diversified Small Cap Fund | | Large Cap Growth Fund | | Specialized Technology Fund |
Emerging Growth Fund | | Large Company Value Fund | | Strategic Large Cap Growth Fund |
Emerging Markets Equity Fund | | Mid Cap Growth Fund | | Traditional Small Cap Growth Fund |
Endeavor Select Fund† | | Omega Growth Fund | | Utility and Telecommunications Fund |
| Bond Funds | | | | |
Adjustable Rate Government Fund | | Inflation-Protected Bond Fund | | Short-Term Bond Fund |
California Limited-Term Tax-Free Fund | | Intermediate Tax/AMT-Free Fund | | Short-Term High Yield Bond Fund |
California Tax-Free Fund | | International Bond Fund | | Short-Term Municipal Bond Fund |
Colorado Tax-Free Fund | | Minnesota Tax-Free Fund | | Strategic Municipal Bond Fund |
Government Securities Fund | | Municipal Bond Fund | | Total Return Bond Fund |
High Income Fund | | North Carolina Tax-Free Fund | | Ultra Short-Term Income Fund |
High Yield Bond Fund | | Pennsylvania Tax-Free Fund | | Ultra Short-Term Municipal Income Fund |
Income Plus Fund | | Short Duration Government Bond Fund | | Wisconsin Tax-Free Fund |
| Asset Allocation Funds | | | | |
Asset Allocation Fund | | WealthBuilder Equity Portfolio† | | Target 2020 Fund† |
Conservative Allocation Fund | | WealthBuilder Growth Allocation Portfolio† | | Target 2025 Fund† |
Diversified Capital Builder Fund | | WealthBuilder Growth Balanced Portfolio† | | Target 2030 Fund† |
Diversified Income Builder Fund | | WealthBuilder Moderate Balanced Portfolio† | | Target 2035 Fund† |
Growth Balanced Fund | | WealthBuilder Tactical Equity Portfolio† | | Target 2040 Fund† |
Index Asset Allocation Fund | | Target Today Fund† | | Target 2045 Fund† |
Moderate Balanced Fund | | Target 2010 Fund† | | Target 2050 Fund† |
WealthBuilder Conservative Allocation Portfolio† | | Target 2015 Fund† | | |
| Money Market Funds | | | | |
100% Treasury Money Market Fund | | Minnesota Money Market Fund | | New Jersey Municipal Money Market Fund |
California Municipal Money Market Fund | | Money Market Fund | | New York Municipal Money Market Fund |
Cash Investment Money Market Fund | | Municipal Cash Management Money Market Fund | | Pennsylvania Municipal Money Market Fund |
Government Money Market Fund | | Municipal Money Market Fund | | Prime Investment Money Market Fund |
Heritage Money Market Fund† | | National Tax-Free Money Market Fund | | Treasury Plus Money Market Fund |
| Variable Trust Funds1 | | | | |
VT Core Equity Fund | | VT Intrinsic Value Fund | | VT Small Cap Value Fund |
VT Discovery Fund† | | VT Omega Growth Fund | | VT Total Return Bond Fund |
VT Index Asset Allocation Fund | | VT Opportunity Fund† | | |
VT International Equity Fund | | VT Small Cap Growth Fund | | |
An investment in a money market fund is not insured or guaranteed by the Federal Deposit Insurance Corporation or any other government agency. Although the Wells Fargo Advantage Money Market Funds seek to preserve the value of your investment at $1.00 per share, it is possible to lose money by investing in a money market fund.
| 1. | The Variable Trust Funds are generally available only through insurance company variable contracts. |
| † | In this report, the Wells Fargo Advantage Discovery FundSM, Wells Fargo Advantage Endeavor Select FundSM, Wells Fargo Advantage Enterprise FundSM, Wells Fargo Advantage Opportunity FundSM, Wells Fargo Advantage Social Sustainability FundSM, Wells Fargo Advantage WealthBuilder Conservative Allocation PortfolioSM, Wells Fargo Advantage WealthBuilder Equity PortfolioSM , Wells Fargo Advantage WealthBuilder Growth Allocation PortfolioSM, Wells Fargo Advantage WealthBuilder Growth Balanced PortfolioSM, Wells Fargo Advantage WealthBuilder Moderate Balanced PortfolioSM, Wells Fargo Advantage WealthBuilder Tactical Equity PortfolioSM , Wells Fargo Advantage Dow Jones Target Today FundSM, Wells Fargo Advantage Dow Jones Target 2010 FundSM, Wells Fargo Advantage Dow Jones Target 2015 FundSM, Wells Fargo Advantage Dow Jones Target 2020 FundSM, Wells Fargo Advantage Dow Jones Target 2025 FundSM, Wells Fargo Advantage Dow Jones Target 2030 FundSM , Wells Fargo Advantage Dow Jones Target 2035 FundSM, Wells Fargo Advantage Dow Jones Target 2040 FundSM, Wells Fargo Advantage Dow Jones Target 2045 FundSM, Wells Fargo Advantage Dow Jones Target 2050 FundSM, Wells Fargo Advantage Heritage Money Market FundSM, Wells Fargo Advantage VT Discovery FundSM, and Wells Fargo Advantage VT Opportunity FundSM are referred to as the Discovery Fund, Endeavor Select Fund, Enterprise Fund, Opportunity Fund, Social Sustainability Fund, WealthBuilder Conservative Allocation Portfolio, WealthBuilder Equity Portfolio, WealthBuilder Growth Allocation Portfolio, WealthBuilder Growth Balanced Portfolio, WealthBuilder Moderate Balanced Portfolio, WealthBuilder Tactical Equity Portfolio, Target Today Fund, Target 2010 Fund, Target 2015 Fund, Target 2020 Fund, Target 2025 Fund, Target 2030 Fund, Target 2035 Fund, Target 2040 Fund, Target 2045 Fund, Target 2050 Fund, Heritage Money Market Fund, VT Discovery Fund, and VT Opportunity Fund, respectively. |
Not part of the semi-annual report.
| | | | |
| 2 | | Wells Fargo Advantage International Stock Funds | | Letter to Shareholders |

Karla M. Rabusch,
President
Wells Fargo Advantage Funds
There certainly were a rash of geopolitical and geological issues that provided headwinds, but overall, many areas across both the global equity and bond markets showed resilience and posted solid annual returns.
Dear Valued Shareholder,
We are pleased to provide you with this semi-annual report for the Wells Fargo Advantage International Stock Funds for the six-month period that ended April 30, 2011. After a series of extraordinary financial and economic events that affected the financial markets in the United States and throughout the world—dating back to the beginning of the financial crisis in 2008—it seemed the global economy continued to move toward a more sustainable recovery throughout the period. There certainly were a rash of geopolitical and geological issues that provided headwinds, but overall, many areas across both the global equity and bond markets showed resilience and posted solid annual returns, suggesting that the most underlying fundamentals of the economy continue to strengthen.
The global economic recovery moved toward expansion.
The global economic recovery that began in mid-2009, especially within the developed countries, gained further momentum throughout the period, particularly toward the end of 2010. For example, within the U.S., gross domestic product (GDP) grew at an annualized rate of 3.1% in the fourth quarter of 2010—capping a streak of six consecutive quarters of positive GDP growth—and 2.8% for the full year. Although the path of recovery within the U.S. has been uneven at times and growth remains subpar compared with previous recoveries, the general consensus among economists is that the economy will likely continue to move toward a sustainable expansion.
Jobs and housing remained troublesome.
By the end of the reporting period, the unemployment rate in the U.S. stood at 9.0%, down from 9.8% a year earlier but still notably higher than historical averages. Unfortunately, the drop may be more attributable to a decline in the labor force than to a meaningful uptick in hiring. In fact, employers added just 1.1 million jobs during the entire 2010 calendar year, below the historical average of 1.4 million jobs created each year over the past 80 years, suggesting that the improving economy has yet to translate into widespread hiring. Meanwhile, the beleaguered housing market was an ongoing source of concern, despite some tentative late-year signs of stabilization. That said, persistent weakness in the labor and housing markets bears close watching in the months ahead.
Other economic data in the U.S. was more encouraging, reflecting greater confidence in the sustainability of the expansion on the part of both consumers and businesses. Retail sales came in strong at certain points during the period, including the critical holiday shopping season, and industrial production and new orders have picked up. Although still reluctant to hire, businesses have gradually increased spending in other areas, such as equipment and technology. Core inflation, which excludes volatile food and energy prices, remained benign.
The Federal Reserve continued to do its part.
With inflation subdued, the Federal Reserve (Fed) held its target range for the federal funds rate—a proxy for short-term interest rates—steady at 0.00% to 0.25%. On April 27, 2011, in its final statement of the six-month period, the Fed noted that economic recovery “is proceeding at a moderate pace,” while the employment situation is “improving gradually.” With regard to inflation, the Fed noted that the rate of inflation increased but that “longer-term inflation
| | | | | | |
| Letter to Shareholders | | Wells Fargo Advantage International Stock Funds | | | 3 | |
expectations have remained stable and measures of underlying inflation are still subdued.” As a result, the Fed indicated that it intends to keep short-term rates at historically low levels for as long as necessary to ensure a sustainable recovery and expansion.
The Fed also stated that “to promote a stronger pace of economic recovery,” it plans to proceed with other stimulus measures, including its second round of quantitative easing (QE2)—a plan to purchase $600 billion in long-term Treasury securities by mid-2011. The launch of QE2 in the third quarter of 2010 marked a turning point for the equity markets in that it ushered in a favorable shift in investor sentiment. Largely, investors interpreted the plan as further evidence of the Fed’s commitment to avoiding deflation and spurring economic growth.
Central banks focused on balancing the need for sustainable growth with ongoing sovereign debt concerns.
The coordinated efforts of the developed markets’ central banks to quell the worldwide financial crisis were effective in restoring order to the capital markets, and the stimulus packages provided a significant underpinning to economies, helping to restore them to growth. As a result, throughout the six-month period, stock markets in the United States and worldwide rebounded dramatically from their March 2009 lows.
While many emerging markets were not as affected by the same problems as the U.S. and eurozone economies, several emerging economies did face headwinds of their own, such as higher levels inflation and tightening monetary policies. This dynamic was most evident in China and India, which were among the poorer performing countries within the index. The best performing countries within the emerging markets index included Russia, which benefitted from rising energy prices; Taiwan and Korea, whose performance was driven by strong export activity; and South Africa, which was supported by rising commodity prices throughout the period.
After working through the eurozone sovereign debt crisis, equities rallied for the rest of 2010.
After the global equity markets stumbled during the late spring of 2010, primarily due to concerns that the global economic recovery would slide back into recession, but also in part due to the Greek sovereign debt crisis, the markets rebounded during the summer and fall of 2010. Part of the explanation for the rally lies in the precarious nature of the markets after the second quarter. By the start of the third quarter, investors had already priced in the potential effects of the sovereign debt crisis. The repricing reduced stock valuations to extremely attractive levels. When combined with earnings yields that were better than what investors were getting in the bond market, the lowered valuations were enough to convince many investors to add more risk to their portfolios. Stocks in the higher-yielding telecommunication services sector advanced due to their ability to balance risk and potential yield, driving investors back into the markets.
The coordinated efforts of the developed markets’ central banks to quell the worldwide financial crisis were effective in restoring order to the capital markets, and the stimulus packages provided a significant underpinning to economies, helping to restore them to growth.
| | | | |
| 4 | | Wells Fargo Advantage International Stock Funds | | Letter to Shareholders |
During the last three months of 2010, investors continued to struggle with a number of macroeconomic factors, most notably the continuing sovereign debt crisis in Europe and rising inflation in the emerging markets. On the plus side, the U.S. economy continued to show signs of improvement. The reaffirmation of quantitative easing by the Fed initially caused the value of the U.S. dollar to decline relative to other major currencies; however, it stabilized during the final month of the year.
Entering the new year, central banks attempted to balance growth with inflation pressures.
2011 began moderately well, building on the momentum established during the fourth quarter of 2010. Investors focused on signs of sustainable economic growth and low volatility in many countries. In step with stronger economic conditions, corporate earnings continued to improve, further bolstering investor confidence. However, during the period, investors shifted their focus away from these developments to the political unrest in the Middle East and the tragedy affecting Japan, which prompted concerns about the impact on oil prices and the supply chain. In response, investors began to rotate out of small-cap stocks and growth stocks and into larger-cap value stocks that they perceived as offering lower levels of risk.
In the developed markets, Europe and the U.S. are good examples of how many countries are attempting to balance the effects of higher inflation with the need to firmly establish sustainable economic expansion. These governments believe that this can best be achieved through an exceptionally accommodative monetary policy. In an effort to stave off the effects of rising inflation, China, India, and Brazil have already been tightening their monetary policies through rate increases and a more restrictive approach to money supply. It is possible that if the rate of inflation in those emerging markets countries begins to stabilize or even subside, particularly in China, these countries may be nearing the end of their monetary tightening cycle.
Concerns about sovereign debt re-emerged across the European peripheral countries, especially as Portugal became the third country to seek a bailout from the European Union and the International Monetary Fund. In addition, Ireland’s four largest banks failed another round of stress tests in March, forcing them to seek another 24 billion euros from public and private entities. Nevertheless, in spite of these renewed challenges, the peripheral countries, led by Greece, Italy, and Spain, had remarkable stock performance to start 2011. They outperformed their larger, more developed European neighbors, such as Germany and the United Kingdom. Last year, when the sovereign debt issue first came to the forefront, it brought along with it a high level of investor anxiety, which translated into higher volatility. However, after the bailouts of Greece and Ireland, investors may have become comfortable with how policymakers have been able to handle these problems and mitigate the risks of contagion.
A broadly diversified portfolio gives exposure to many areas of potential recovery.
As global economies continue to move toward more sustainable growth and manageable levels of inflation, there can still be moments of volatility. These periods can present both challenges and opportunities, and experience has
| | | | | | |
| Letter to Shareholders | | Wells Fargo Advantage International Stock Funds | | | 5 | |
taught us that maintaining a long-term investment strategy based on individual goals and risk tolerance can be an effective way to plan for the future.
The Wells Fargo Advantage International Stock Funds provide investment solutions across a broad range of asset classes and investment styles, giving you an opportunity to create a diversified investment portfolio. While diversification may not prevent losses in a downturn, it may help to reduce them and provide you with one way of managing risk. And, in a potential upturn, diversification can give you exposure to many areas of economic recovery.
Thank you for choosing Wells Fargo Advantage Funds. We appreciate your confidence in us. Through each market cycle, we are committed to helping you meet your financial needs. If you have any questions about your investment, please contact your investment professional or call us at 1-800-222-8222. You may also visit our website at www.wellsfargo.com/advantagefunds.
Sincerely,

Karla M. Rabusch
President
Wells Fargo Advantage Funds
| | | | |
| 6 | | Wells Fargo Advantage International Stock Funds | | Performance Highlights |
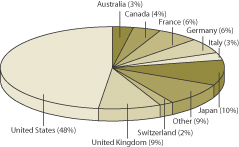
Wells Fargo Advantage Asia Pacific Fund
INVESTMENT OBJECTIVE
The Fund seeks long-term capital appreciation
ADVISER
Wells Fargo Funds Management, LLC
SUB-ADVISER
Wells Capital Management Incorporated
PORTFOLIO MANAGER
Anthony L.T. Cragg
FUND INCEPTION
December 31, 1993
| | | | |
TEN LARGEST EQUITY HOLDINGS1 (AS OF APRIL 30, 2011) | |
Newcrest Mining Limited | | | 2.67% | |
Mitsubishi UFJ Financial Group Incorporated | | | 2.01% | |
Industrial & Commercial Bank of China Class H | | | 2.01% | |
Nippon Telegraph & Telephone Corporation | | | 1.99% | |
Sumitomo Mitsui Financial Group Incorporated | | | 1.98% | |
Toray Industries Incorporated | | | 1.97% | |
China Construction Bank | | | 1.97% | |
Mitsubishi Corporation | | | 1.96% | |
Mitsubishi Electric Corporation | | | 1.80% | |
Mitsui Fudosan Company Limited | | | 1.73% | |
| | |
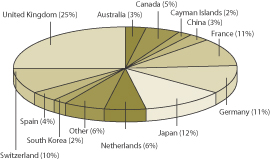
COUNTRY ALLOCATION2 (AS OF APRIL 30, 2011) |
|
 |
| 1. | The ten largest equity holdings are calculated based on the value of the securities divided by total net assets of the Fund. Holdings are subject to change and may have changed since the dates specified. |
| 2. | Country allocation is subject to change and is calculated based on the total investments of the Fund, excluding cash and cash equivalents. |
| | | | | | |
| Performance Highlights | | Wells Fargo Advantage International Stock Funds | | | 7 | |
Wells Fargo Advantage Asia Pacific Fund (continued)
AVERAGE ANNUAL TOTAL RETURN3 (%) (AS OF APRIL 30, 2011)
| | | | | | | | | | | | | | | | | | | | | | | | | | | | | | | | | | | | | | | | | | | | |
| | | | | | Including Sales Charge | | | Excluding Sales Charge | | | Expense Ratios4 | |
| | | Inception Date | | | 6-Months* | | | 1-Year | | | 5-Year | | | 10-Year | | | 6-Months* | | | 1-Year | | | 5-Year | | | 10-Year | | | Gross | | | Net5 | |
Class A (WFAAX) | | | 07/31/2007 | | | | (0.49 | ) | | | 10.37 | | | | 0.06 | | | | 9.87 | | | | 5.59 | | | | 17.13 | | | | 1.26 | | | | 10.53 | | | | 1.92% | | | | 1.62% | |
Class C (WFCAX) | | | 07/31/2007 | | | | 4.16 | | | | 15.12 | | | | 0.47 | | | | 9.79 | | | | 5.16 | | | | 16.12 | | | | 0.47 | | | | 9.79 | | | | 2.67% | | | | 2.37% | |
Administrator Class (WFADX) | | | 07/30/2010 | | | | | | | | | | | | | | | | | | | | 5.73 | | | | 17.29 | | | | 1.29 | | | | 10.55 | | | | 1.76% | | | | 1.42% | |
Institutional Class (WFPIX) | | | 07/30/2010 | | | | | | | | | | | | | | | | | | | | 5.77 | | | | 17.33 | | | | 1.29 | | | | 10.56 | | | | 1.49% | | | | 1.27% | |
Investor Class (SASPX) | | | 12/31/1993 | | | | | | | | | | | | | | | | | | | | 5.62 | | | | 17.05 | | | | 1.19 | | | | 10.50 | | | | 1.99% | | | | 1.67% | |
MSCI All Country Asia Pacific Net Index6 | | | | | | | | | | | | | | | | | | | | | | | 8.93 | | | | 13.49 | | | | 2.53 | | | | 6.81 | | | | | | | | | |
| * | Returns for periods of less than one year are not annualized. |
Figures quoted represent past performance, which is no guarantee of future results and do not reflect the deduction of taxes that a shareholder may pay on fund distributions or the redemption of fund shares. Investment return and principal value of an investment will fluctuate so that an investor’s shares, when redeemed, may be worth more or less than their original cost. Performance shown without sales charges would be lower if sales charges were reflected. Current performance may be lower or higher than the performance data quoted. Current month-end performance is available on the Fund’s Web site – www.wellsfargo.com/advantagefunds.
Index returns do not include transaction costs associated with buying and selling securities, any mutual fund fees or expenses or any taxes. It is not possible to invest directly in an index.
For Class A shares, the maximum front-end sales charge is 5.75%. For Class C shares, the maximum contingent deferred sales charge is 1.00%. Performance including sales charge assumes the sales charge for the corresponding time period. Administrator Class, Institutional Class and Investor Class shares are sold without a front-end sales charge or contingent deferred sales charge.
Stock fund values fluctuate in response to the activities of individual companies and general market and economic conditions. Foreign investments are especially volatile and can rise or fall dramatically due to differences in the political and economic conditions of the host country. These risks are generally intensified in emerging markets. The use of derivatives may reduce returns and/or increase volatility. Certain investment strategies tend to increase the total risk of an investment (relative to the broader market). This Fund is exposed to regional risk, and smaller company securities risk. Consult the Fund’s prospectus for additional information on these and other risks.
| 3. | Historical performance shown for Class A shares prior to their inception reflects the performance of the Investor Class shares, and includes the higher expenses applicable to the Investor Class shares. If these expenses had not been included, returns would be higher. Historical performance shown for Class C shares prior to their inception reflects the performance of the Investor Class shares, adjusted to reflect the higher expenses applicable to Class C shares. Historical performance shown for the Administrator and Institutional Class shares prior to their inception reflects the performance of the Class A shares, and includes the higher expenses applicable to the Class A shares. If these expenses had not been included, returns would be higher. |
| 4. | Reflects the expense ratios as stated in the most recent prospectuses. |
| 5. | The Adviser has committed through February 29, 2012 to waive fees and/or reimburse expenses to the extent necessary to cap the Fund’s Total Annual Fund Operating Expenses After Fee Waiver, excluding certain expenses, at 1.60% for Class A, 2.35% for Class C, 1.40% for Administrator Class, 1.25% for Institutional Class and 1.65% for Investor Class. Without this cap, the Fund’s returns would have been lower. |
| 6. | The Morgan Stanley Capital International All Country Asia Pacific (MSCI AC Asia Pacific) Net Index is a total return, capitalization-weighted index that measures the performance of stock markets in 15 Pacific region countries, including Australia, China, Hong Kong, India, Indonesia, Japan, Korea, Malaysia, New Zealand, Pakistan, the Philippines, Singapore, Sri Lanka, Taiwan and Thailand. You cannot invest directly in an index. |
| | | | |
| 8 | | Wells Fargo Advantage International Stock Funds | | Performance Highlights |
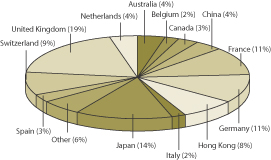
Wells Fargo Advantage Disiplined Global Equity Fund
INVESTMENT OBJECTIVE
The Fund seeks long-term capital appreciation
ADVISER
Wells Fargo Funds Management, LLC
SUB-ADVISER
Wells Capital Management Incorporated
PORTFOLIO MANAGER
Amit Chandra PhD., CFA
(Effective March 1, 2011)
FUND INCEPTION
November 1, 1995
| | | | |
TEN LARGEST EQUITY HOLDINGS1 (AS OF APRIL 30, 2011) | |
International Business Machines Corporation | | | 1.53% | |
Exxon Mobil Corporation | | | 1.52% | |
Chevron Corporation | | | 1.45% | |
BHP Bilton plc | | | 1.41% | |
Microsoft Corporation | | | 1.30% | |
Oracle Corporation | | | 1.15% | |
Vodafone Group plc | | | 1.14% | |
Royal Dutch Shell plc Class B | | | 1.11% | |
Sanofi-Aventis SA | | | 1.00% | |
BASF SE | | | 0.98% | |
| | |
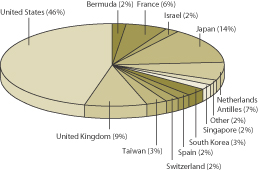
COUNTRY ALLOCATION2 (AS OF APRIL 30, 2011) |
|
 |
| 1. | The ten largest equity holdings are calculated based on the value of the securities divided by total net assets of the Fund. Holdings are subject to change and may have changed since the dates specified. |
| 2. | Country allocation is subject to change and is calculated based on the total investments of the Fund, excluding cash and cash equivalents. |
| | | | | | |
| Performance Highlights | | Wells Fargo Advantage International Stock Funds | | | 9 | |
Wells Fargo Advantage Disiplined Global Equity Fund (continued)
AVERAGE ANNUAL TOTAL RETURN3 (%) (AS OF APRIL 30, 2011)
| | | | | | | | | | | | | | | | | | | | | | | | | | | | | | | | | | | | | | | | | | | | |
| | | | | | Including Sales Charge | | | Excluding Sales Charge | | | Expense Ratios4 | |
| | | Inception Date | | | 6-Months* | | | 1-Year | | | 5-Year | | | 10-Year | | | 6-Months* | | | 1-Year | | | 5-Year | | | 10-Year | | | Gross | | | Net5 | |
Class A (EAGLX) | | | 06/03/1996 | | | | 8.77 | | | | 11.86 | | | | 0.89 | | | | 1.86 | | | | 15.41 | | | | 18.69 | | | | 2.10 | | | | 2.47 | | | | 1.61% | | | | 1.40% | |
Class C (ECGLX) | | | 06/03/1996 | | | | 13.98 | | | | 16.74 | | | | 1.33 | | | | 1.72 | | | | 14.98 | | | | 17.74 | | | | 1.33 | | | | 1.72 | | | | 2.36% | | | | 2.15% | |
Administrator Class (EYGLX) | | | 11/01/1995 | | | | | | | | | | | | | | | | | | | | 15.52 | | | | 18.97 | | | | 2.36 | | | | 2.74 | | | | 1.45% | | | | 1.15% | |
Institutional Class (EIGLX) | | | 07/30/2010 | | | | | | | | | | | | | | | | | | | | 15.65 | | | | 19.19 | | | | 2.40 | | | | 2.76 | | | | 1.18% | | | | 0.95% | |
MSCI World Free Index (Net)6 | | | | | | | | | | | | | | | | | | | | | | | 14.75 | | | | 18.25 | | | | 2.32 | | | | 3.90 | | | | | | | | | |
| * | Returns for periods of less than one year are not annualized. |
Figures quoted represent past performance, which is no guarantee of future results and do not reflect the deduction of taxes that a shareholder may pay on fund distributions or the redemption of fund shares. Investment return and principal value of an investment will fluctuate so that an investor’s shares, when redeemed, may be worth more or less than their original cost. Performance shown without sales charges would be lower if sales charges were reflected. Current performance may be lower or higher than the performance data quoted. Current month-end performance is available on the Fund’s Web site – www.wellsfargo.com/advantagefunds.
Index returns do not include transaction costs associated with buying and selling securities, any mutual fund fees or expenses or any taxes. It is not possible to invest directly in an index.
For Class A shares, the maximum front-end sales charge is 5.75%. For Class C shares, the maximum contingent deferred sales charge is 1.00%. Performance including sales charge assumes the sales charge for the corresponding time period. Administrator Class and Institutional Class shares are sold without a front-end sales charge or contingent deferred sales charge.
Stock fund values fluctuate in response to the activities of individual companies and general market and economic conditions. Foreign investments are especially volatile and can rise or fall dramatically due to differences in the political and economic conditions of the host country. These risks are generally intensified in emerging markets. The use of derivatives may reduce returns and/or increase volatility. Certain investment strategies tend to increase the total risk of an investment (relative to the broader market). This Fund is exposed to country concentration risk and smaller company securities risk. Consult the Fund’s prospectus for additional information on these and other risks.
| 3. | Historical performance shown for the Institutional Class shares prior to their inception reflects the performance of the Administrator Class shares, and includes the higher expenses applicable to the Administrator Class shares. If these expenses had not been included, returns would be higher. Historical performance shown for all classes of the Fund prior to July 19, 2010 is based on the performance of the Fund’s predecessor, Evergreen Global Large Cap Equity Fund. |
| 4. | Reflects the expense ratios as stated in the most recent prospectuses. |
| 5. | The Adviser has committed through July 18, 2013 to waive fees and/or reimburse expenses to the extent necessary to cap the Fund’s Total Annual Fund Operating Expenses After Fee Waiver, excluding certain expenses, at the amount shown above. Without this cap, the Fund’s returns would have been lower. |
| 6. | The Morgan Stanley Capital International World Free Index (Net) (MSCI World Free Index (Net)) is an unmanaged market capitalization index designed to measure the performance of securities within developed equity markets. You cannot invest directly in an index. |
| | | | |
| 10 | | Wells Fargo Advantage International Stock Funds | | Performance Highlights |
Wells Fargo Advantage Diversified International Fund
INVESTMENT OBJECTIVE
The Fund seeks long-term capital appreciation
ADVISER
Wells Fargo Funds Management, LLC
SUB-ADVISERS
Artisan Partners Limited Partnership
LSV Asset Management
Wells Capital Management Incorporated
PORTFOLIO MANAGERS
Francis X. Claró, CFA
Josef Lakonishok
Puneet Mansharamani, CFA
Menno Vermeulen, CFA
Mark L. Yockey, CFA
FUND INCEPTION
September 24, 1997
| | | | |
TEN LARGEST EQUITY HOLDINGS1 (AS OF APRIL 30, 2011) | |
Nestle SA | | | 1.65% | |
Sands China Limited | | | 1.48% | |
Bayer AG | | | 1.47% | |
Daimler AG | | | 1.29% | |
BASF SE | | | 1.16% | |
Siemens AG | | | 1.16% | |
Pernod-Ricard | | | 1.10% | |
WPP plc | | | 1.06% | |
Vodafone Group plc | | | 1.04% | |
ING Group NV | | | 1.04% | |
| | |
COUNTRY ALLOCATION2 (AS OF APRIL 30, 2011) |
|
 |
| 1. | The ten largest equity holdings are calculated based on the value of the securities divided by total net assets of the Fund. Holdings are subject to change and may have changed since the dates specified |
| 2. | Country allocation is subject to change and is calculated based on the total investments of the Fund, excluding cash and cash equivalents. |
| | | | | | |
| Performance Highlights | | Wells Fargo Advantage International Stock Funds | | | 11 | |
Wells Fargo Advantage Diversified International Fund (continued)
AVERAGE ANNUAL TOTAL RETURN3 (%) (AS OF APRIL 30, 2011)
| | | | | | | | | | | | | | | | | | | | | | | | | | | | | | | | | | | | | | | | | | | | |
| | | | | | Including Sales Charge | | | Excluding Sales Charge | | | Expense Ratios4 | |
| | | Inception Date | | | 6-Months* | | | 1-Year | | | 5-Year | | | 10-Year | | | 6-Months* | | | 1-Year | | | 5-Year | | | 10-Year | | | Gross | | | Net5 | |
Class A (SILAX) | | | 09/24/1997 | | | | 6.62 | | | | 14.82 | | | | (0.90 | ) | | | 1.73 | | | | 13.15 | | | | 21.79 | | | | 0.29 | | | | 2.34 | | | | 1.54% | | | | 1.41% | |
Class B (SILBX)** | | | 09/24/1997 | | | | 7.63 | | | | 15.82 | | | | (0.86 | ) | | | 1.77 | | | | 12.63 | | | | 20.82 | | | | (0.44 | ) | | | 1.77 | | | | 2.29% | | | | 2.16% | |
Class C (WFECX) | | | 04/01/1998 | | | | 11.67 | | | | 19.86 | | | | (0.41 | ) | | | 1.57 | | | | 12.67 | | | | 20.86 | | | | (0.41 | ) | | | 1.57 | | | | 2.29% | | | | 2.16% | |
Administrator Class (WFIEX) | | | 11/08/1999 | | | | | | | | | | | | | | | | | | | | 13.23 | | | | 22.01 | | | | 0.51 | | | | 2.55 | | | | 1.38% | | | | 1.25% | |
Institutional Class (WFISX) | | | 08/31/2006 | | | | | | | | | | | | | | | | | | | | 13.36 | | | | 22.27 | | | | 0.72 | | | | 2.66 | | | | 1.11% | | | | 0.99% | |
Investor Class (WIEVX) | | | 07/18/2008 | | | | | | | | | | | | | | | | | | | | 13.05 | | | | 21.71 | | | | 0.28 | | | | 1.96 | | | | 1.61% | | | | 1.46% | |
MSCI EAFE® Net Index6 | | | | | | | | | | | | | | | | | | | | | | | 12.71 | | | | 19.18 | | | | 1.54 | | | | 5.29 | | | | | | | | | |
| * | Returns for periods of less than one year are not annualized. |
| ** | Class B shares are closed to investment, except in connection with the reinvestment of any distributions and permitted exchanges. |
Figures quoted represent past performance, which is no guarantee of future results and do not reflect the deduction of taxes that a shareholder may pay on fund distributions or the redemption of fund shares. Investment return and principal value of an investment will fluctuate so that an investor’s shares, when redeemed, may be worth more or less than their original cost. Performance shown without sales charges would be lower if sales charges were reflected. Current performance may be lower or higher than the performance data quoted. Current month-end performance is available on the Fund’s Web site – www.wellsfargo.com/advantagefunds.
Index returns do not include transaction costs associated with buying and selling securities, any mutual fund fees or expenses or any taxes. It is not possible to invest directly in an index.
For Class A shares, the maximum front-end sales charge is 5.75%. For Class B shares, the maximum contingent deferred sales charge is 5.00%. For Class C shares, the maximum contingent deferred sales charge is 1.00%. Performance including sales charge assumes the sales charge for the corresponding time period. Administrator Class, Institutional Class and Investor Class shares are sold without a front-end sales charge or contingent deferred sales charge.
Stock fund values fluctuate in response to the activities of individual companies and general market and economic conditions. Foreign investments are especially volatile and can rise or fall dramatically due to differences in the political and economic conditions of the host country. These risks are generally intensified in emerging markets. The use of derivatives may reduce returns and/or increase volatility. Certain investment strategies tend to increase the total risk of an investment (relative to the broader market). This Fund is exposed to smaller company securities risk. Consult the Fund’s prospectus for additional information on these and other risks.
| 3. | Historical performance shown for the Investor Class shares prior to their inception reflects the performance of Class A shares, adjusted to reflect the higher expenses applicable to the Investor Class shares. Historical performance shown for the Institutional Class shares prior to their inception reflects the performance of the Administrator Class shares, and includes the higher expenses applicable to the Administrator Class shares. If these expenses had not been included, returns would be higher. |
| 4. | Reflects the expense ratios as stated in the most recent prospectuses. |
| 5. | The Adviser has committed through February 29, 2012 to waive fees and/or reimburse expenses to the extent necessary to cap the Fund’s Total Annual Fund Operating Expenses After Fee Waiver, excluding certain expenses, at the amount shown above. Without this cap, the Fund’s returns would have been lower. |
| 6. | The Morgan Stanley Capital International Europe, Australasia, and Far East (MSCI EAFE) Net Index is an unmanaged group of securities widely regarded by investors to be representations of the stock markets of Europe, Australasia, and the Far East. You cannot invest directly in an index. |
| | | | |
| 12 | | Wells Fargo Advantage International Stock Funds | | Performance Highlights |
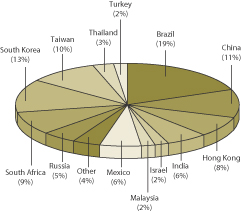
Wells Fargo Advantage Emerging Markets Equity Fund
INVESTMENT OBJECTIVE
The Fund seeks long-term capital appreciation
ADVISER
Wells Fargo Funds Management, LLC
SUB-ADVISER
Wells Capital Management Incorporated
PORTFOLIO MANAGER
Yi (Jerry) Zhang, PhD, CFA
FUND INCEPTION
September 6, 1994
| | | | |
TEN LARGEST EQUITY HOLDINGS1
(AS OF APRIL 30, 2011) | | | |
China Mobile Limited ADR | | | 3.50% | |
Sina Corporation | | | 3.41% | |
Petroleo Brasileiro SA ADR | | | 3.28% | |
Samsung Electronics Company Limited | | | 2.44% | |
Grupo Televisa SA ADR | | | 2.15% | |
KT&G Corporation | | | 2.10% | |
Taiwan Semiconductor Manufacturing Company Limited ADR | | | 2.00% | |
KT Corporation ADR | | | 1.99% | |
Banco Bradesco SA ADR | | | 1.68% | |
ICICI Bank Limited ADR | | | 1.47% | |
| | |
COUNTRY ALLOCATION2
(AS OF APRIL 30, 2011) | | |
|
 |
| 1. | The ten largest equity holdings are calculated based on the value of the securities divided by total net assets of the Fund. Holdings are subject to change and may have changed since the dates specified |
| 2. | Country allocation is subject to change and is calculated based on the total investments of the Fund, excluding cash and cash equivalents. |
| | | | | | |
| Performance Highlights | | Wells Fargo Advantage International Stock Funds | | | 13 | |
Wells Fargo Advantage Emerging Markets Equity Fund (continued)
AVERAGE ANNUAL TOTAL RETURN3 (%) (AS OF APRIL 30, 2011)
| | | | | | | | | | | | | | | | | | | | | | | | | | | | | | | | | | | | | | | | | | | | |
| | | | | | Including Sales Charge | | | Excluding Sales Charge | | | Expense Ratios4 | |
| | | Inception Date | | | 6-Months* | | | 1-Year | | | 5-Year | | | 10-Year | | | 6-Months* | | | 1-Year | | | 5-Year | | | 10-Year | | | Gross | | | Net5 | |
Class A (EMGAX) | | | 09/06/1994 | | | | 3.71 | | | | 17.02 | | | | 10.65 | | | | 17.52 | | | | 10.03 | | | | 24.15 | | | | 11.98 | | | | 18.21 | | | | 1.84% | | | | 1.82% | |
Class B (EMGBX)** | | | 09/06/1994 | | | | 4.62 | | | | 18.24 | | | | 10.89 | | | | 17.65 | | | | 9.62 | | | | 23.24 | | | | 11.15 | | | | 17.65 | | | | 2.59% | | | | 2.57% | |
Class C (EMGCX) | | | 09/06/1994 | | | | 8.64 | | | | 22.23 | | | | 11.14 | | | | 17.36 | | | | 9.64 | | | | 23.23 | | | | 11.14 | | | | 17.36 | | | | 2.59% | | | | 2.57% | |
Administrator Class (EMGYX) | | | 09/06/1994 | | | | | | | | | | | | | | | | | | | | 10.13 | | | | 24.39 | | | | 12.25 | | | | 18.55 | | | | 1.68% | | | | 1.61% | |
Institutional Class (EMGNX) | | | 07/30/2010 | | | | | | | | | | | | | | | | | | | | 10.28 | | | | 24.73 | | | | 12.31 | | | | 18.58 | | | | 1.41% | | | | 1.31% | |
MSCI Emerging Markets Net Index6 | | | | | | | | | | | | | | | | | | | | | | | 9.84 | | | | 21.00 | | | | 10.17 | | | | 16.92 | | | | | | | | | |
| * | Returns for periods of less than one year are not annualized. |
| ** | Class B shares are closed to investment, except in connection with the reinvestment of any distributions and permitted exchanges. |
Figures quoted represent past performance, which is no guarantee of future results and do not reflect the deduction of taxes that a shareholder may pay on fund distributions or the redemption of fund shares. Investment return and principal value of an investment will fluctuate so that an investor’s shares, when redeemed, may be worth more or less than their original cost. Performance shown without sales charges would be lower if sales charges were reflected. Current performance may be lower or higher than the performance data quoted. Current month-end performance is available on the Fund’s Web site – www.wellsfargo.com/advantagefunds.
Index returns do not include transaction costs associated with buying and selling securities, any mutual fund fees or expenses or any taxes. It is not possible to invest directly in an index.
For Class A shares, the maximum front-end sales charge is 5.75%. For Class B shares, the maximum contingent deferred sales charge is 5.00%. For Class C shares, the maximum contingent deferred sales charge is 1.00%. Performance including sales charge assumes the sales charge for the corresponding time period. Administrator Class and Institutional Class shares are sold without a front-end sales charge or contingent deferred sales charge.
Stock fund values fluctuate in response to the activities of individual companies and general market and economic conditions. Foreign investments are especially volatile and can rise or fall dramatically due to differences in the political and economic conditions of the host country. These risks are generally intensified in emerging markets. The use of derivatives may reduce returns and/or increase volatility. Certain investment strategies tend to increase the total risk of an investment (relative to the broader market). This Fund is exposed to regional risk and smaller company securities risk. Consult the Fund’s prospectus for additional information on these and other risks.
| 3. | Historical performance shown for the Institutional Class shares prior to their inception reflects the performance of the Administrator Class shares, and includes the higher expenses applicable to the Administrator Class shares. If these expenses had not been included, returns would be higher. Historical performance shown for all classes of the Fund prior to July 19, 2010 is based on the performance of the Fund’s predecessor, Evergreen Emerging Markets Growth Fund. |
| 4. | Reflects the expense ratios as stated in the most recent prospectuses. |
| 5. | The Adviser has committed through July 18, 2013 to waive fees and/or reimburse expenses to the extent necessary to cap the Fund’s Total Annual Fund Operating Expenses After Fee Waiver, excluding certain expenses, at 1.81% for Class A, 2.56% for Class B, 2.56% for Class C, 1.60% for Administrator Class and 1.30% for Institutional Class. Without this cap, the Fund’s returns would have been lower. |
| 6. | The Morgan Stanley Capital International Emerging Markets (MSCI Emerging Markets) Net Index is a free float-adjusted market capitalization index designed to measure the equity market performance in the global emerging markets. The index is currently comprised of 25 emerging market country indices. You cannot invest directly in an index. |
| | | | |
| 14 | | Wells Fargo Advantage International Stock Funds | | Performance Highlights |
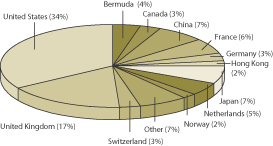
Wells Fargo Advantage Global Opportunities Fund
INVESTMENT OBJECTIVE
The Fund seeks long-term capital appreciation
ADVISER
Wells Fargo Funds Management, LLC
SUB-ADVISER
Wells Capital Management Incorporated
PORTFOLIO MANAGERS
Francis X. Claró, CFA
James M. Tringas, CFA
FUND INCEPTION
March 16, 1988
| | | | |
TEN LARGEST EQUITY HOLDINGS1
(AS OF APRIL 30, 2011) | | | |
51job Incorporated ADR | | | 2.72% | |
Ashtead Group plc | | | 2.48% | |
USG People NV | | | 2.07% | |
Persimmon plc | | | 1.63% | |
Bovis Homes Group plc | | | 1.50% | |
Travis Perkins plc | | | 1.38% | |
Isuzu Motors Limited | | | 1.36% | |
Dice Holdings Incorporated | | | 1.34% | |
Pandora AS | | | 1.29% | |
Sumitomo Heavy Industries Limited | | | 1.21% | |
| | |
COUNTRY ALLOCATION2
(AS OF APRIL 30, 2011) | | |
|
 |
| 1. | The ten largest equity holdings are calculated based on the value of the securities divided by total net assets of the Fund. Holdings are subject to change and may have changed since the dates specified |
| 2. | Country allocation is subject to change and is calculated based on the total investments of the Fund, excluding cash and cash equivalents. |
| | | | | | |
| Performance Highlights | | Wells Fargo Advantage International Stock Funds | | | 15 | |
Wells Fargo Advantage Global Opportunities Fund (continued)
AVERAGE ANNUAL TOTAL RETURN3 (%) (AS OF APRIL 30, 2011)
| | | | | | | | | | | | | | | | | | | | | | | | | | | | | | | | | | | | | | | | | | | | |
| | | | | | Including Sales Charge | | | Excluding Sales Charge | | | Expense Ratios4 | |
| | | Inception Date | | | 6-Months* | | | 1-Year | | | 5-Year | | | 10-Year | | | 6-Months* | | | 1-Year | | | 5-Year | | | 10-Year | | | Gross | | | Net5 | |
Class A (EKGAX) | | | 03/16/1988 | | | | 12.00 | | | | 18.89 | | | | 4.23 | | | | 9.75 | | | | 18.83 | | | | 26.15 | | | | 5.47 | | | | 10.41 | | | | 1.63% | | | | 1.59% | |
Class B (EKGBX)** | | | 02/01/1993 | | | | 13.36 | | | | 20.17 | | | | 4.35 | | | | 9.84 | | | | 18.36 | | | | 25.17 | | | | 4.68 | | | | 9.84 | | | | 2.38% | | | | 2.34% | |
Class C (EKGCX) | | | 02/01/1993 | | | | 17.38 | | | | 24.15 | | | | 4.69 | | | | 9.60 | | | | 18.38 | | | | 25.15 | | | | 4.69 | | | | 9.60 | | | | 2.38% | | | | 2.34% | |
Administrator Class (EKGYX) | | | 01/13/1997 | | | | | | | | | | | | | | | | | | | | 18.94 | | | | 26.43 | | | | 5.73 | | | | 10.67 | | | | 1.47% | | | | 1.41% | |
Institutional Class (EKGIX) | | | 07/30/2010 | | | | | | | | | | | | | | | | | | | | 19.07 | | | | 26.68 | | | | 5.78 | | | | 10.70 | | | | 1.20% | | | | 1.16% | |
S&P Developed SmallCap Index6 | | | | | | | | | | | | | | | | | | | | | | | 20.69 | | | | 25.15 | | | | 4.20 | | | | 9.44 | | | | | | | | | |
| * | Returns for periods of less than one year are not annualized. |
| ** | Class B shares are closed to investment, except in connection with the reinvestment of any distributions and permitted exchanges. |
Figures quoted represent past performance, which is no guarantee of future results and do not reflect the deduction of taxes that a shareholder may pay on fund distributions or the redemption of fund shares. Investment return and principal value of an investment will fluctuate so that an investor’s shares, when redeemed, may be worth more or less than their original cost. Performance shown without sales charges would be lower if sales charges were reflected. Current performance may be lower or higher than the performance data quoted. Current month-end performance is available on the Fund’s Web site – www.wellsfargo.com/advantagefunds.
Index returns do not include transaction costs associated with buying and selling securities, any mutual fund fees or expenses or any taxes. It is not possible to invest directly in an index.
For Class A shares, the maximum front-end sales charge is 5.75%. For Class B shares, the maximum contingent deferred sales charge is 5.00%. For Class C shares, the maximum contingent deferred sales charge is 1.00%. Performance including sales charge assumes the sales charge for the corresponding time period. Administrator Class and Institutional Class shares are sold without a front-end sales charge or contingent deferred sales charge.
Please keep in mind that high double-digit returns were primarily achieved during favorable market conditions. You should not expect that such favorable returns can be consistently achieved. A Fund’s performance, especially for very short time periods, should not be the sole factor in making your investment decision.
Stock fund values fluctuate in response to the activities of individual companies and general market and economic conditions. Foreign investments are especially volatile and can rise or fall dramatically due to differences in the political and economic conditions of the host country. These risks are generally intensified in emerging markets. The use of derivatives may reduce returns and/or increase volatility. Certain investment strategies tend to increase the total risk of an investment (relative to the broader market). This Fund is exposed to country concentration risk, regional risk and smaller company securities risk. Consult the Fund’s prospectus for additional information on these and other risks.
| 3. | Historical performance shown for the Institutional Class shares prior to their inception reflects the performance of the Administrator Class shares, and includes the higher expenses applicable to the Administrator Class shares. If these expenses had not been included, returns would be higher. Historical performance shown for all classes of the Fund prior to July 19, 2010 is based on the performance of the Fund’s predecessor, Evergreen Global Opportunities Fund. |
| 4. | Reflects the expense ratios as stated in the most recent prospectuses. |
| 5. | The Adviser has committed through July 18, 2013 to waive fees and/or reimburse expenses to the extent necessary to cap the Fund’s Total Annual Fund Operating Expenses After Fee Waiver, excluding certain expenses, at 1.58% for Class A, 2.33% for Class B, 2.33% for Class C, 1.40% for Administrator Class and 1.15% for Institutional Class. Without this cap, the Fund’s returns would have been lower. |
| 6. | The S&P Developed SmallCap Index is a float-adjusted market capitalization index designed to measure the equity market performance of small capitalization companies located in developed markets. The index is comprised of companies within the bottom 15% of the cumulative market capitalization in developed markets. The index covers all publicly listed equities with float-adjusted market values of US $100 million or more and annual dollar value traded of at least US $50 million in all included countries. You cannot invest directly in an index. |
| | | | |
| 16 | | Wells Fargo Advantage International Stock Funds | | Performance Highlights |
Wells Fargo Advantage International Equity Fund
INVESTMENT OBJECTIVE
The Fund seeks long-term capital appreciation
ADVISER
Wells Fargo Funds Management, LLC
SUB-ADVISER
Wells Capital Management Incorporated
PORTFOLIO MANAGER
Francis X. Claró, CFA
FUND INCEPTION
September 6, 1979
| | | | |
TEN LARGEST EQUITY HOLDINGS1
(AS OF APRIL 30, 2011) | | | |
Sina Corporation | | | 1.83% | |
Toyota Motor Corporation | | | 1.82% | |
HSBC Holdings plc | | | 1.77% | |
Nestle SA | | | 1.77% | |
Vodafone Group plc | | | 1.74% | |
BHP Billiton plc | | | 1.67% | |
Randstad Holdings NV | | | 1.59% | |
Royal Dutch Shell plc Class A | | | 1.57% | |
Rio Tinto plc | | | 1.57% | |
Repsol YPF SA | | | 1.51% | |
| | |
COUNTRY ALLOCATION2
(AS OF APRIL 30, 2011) | | |
|
 |
| 1. | The ten largest equity holdings are calculated based on the value of the securities divided by total net assets of the Fund. Holdings are subject to change and may have changed since the dates specified |
| 2. | Country allocation is subject to change and is calculated based on the total investments of the Fund, excluding cash and cash equivalents. |
| | | | | | |
| Performance Highlights | | Wells Fargo Advantage International Stock Funds | | | 17 | |
Wells Fargo Advantage International Equity Fund (continued)
AVERAGE ANNUAL TOTAL RETURN3 (%) (AS OF APRIL 30, 2011)
| | | | | | | | | | | | | | | | | | | | | | | | | | | | | | | | | | | | | | | | | | | | |
| | | | | | Including Sales Charge | | | Excluding Sales Charge | | | Expense Ratios4 | |
| | | Inception Date | | | 6-Months* | | | 1-Year | | | 5-Year | | | 10-Year | | | 6-Months* | | | 1-Year | | | 5-Year | | | 10-Year | | | Gross | | | Net5 | |
Class A (WFEAX) | | | 01/20/1998 | | | | 7.93 | | | | 15.26 | | | | (0.34 | ) | | | 5.01 | | | | 14.56 | | | | 22.28 | | | | 0.85 | | | | 5.63 | | | | 1.51% | | | | 1.09% | |
Class B (WFEBX)** | | | 09/06/1979 | | | | 9.13 | | | | 16.46 | | | | (0.20 | ) | | | 5.13 | | | | 14.13 | | | | 21.46 | | | | 0.11 | | | | 5.13 | | | | 2.26% | | | | 1.84% | |
Class C (WFEFX) | | | 03/06/1998 | | | | 13.16 | | | | 20.39 | | | | 0.11 | | | | 4.89 | | | | 14.16 | | | | 21.39 | | | | 0.11 | | | | 4.89 | | | | 2.26% | | | | 1.84% | |
Class R (WFERX) | | | 10/10/2003 | | | | | | | | | | | | | | | | | | | | 14.42 | | | | 22.02 | | | | 0.58 | | | | 5.37 | | | | 1.76% | | | | 1.34% | |
Administrator Class (WFEDX) | | | 07/16/2010 | | | | | | | | | | | | | | | | | | | | 14.51 | | | | 22.36 | | | | 1.07 | | | | 5.92 | | | | 1.35% | | | | 1.09% | |
Institutional Class (WFENX) | | | 03/09/1998 | | | | | | | | | | | | | | | | | | | | 14.65 | | | | 22.57 | | | | 1.11 | | | | 5.93 | | | | 1.08% | | | | 0.84% | |
MSCI EAFE® Free Net Index6 | | | | | | | | | | | | | | | | | | | | | | | 12.71 | | | | 19.18 | | | | 1.54 | | | | 5.29 | | | | | | | | | |
| * | Returns for periods of less than one year are not annualized. |
| ** | Class B shares are closed to investment, except in connection with the reinvestment of any distributions and permitted exchanges. |
Figures quoted represent past performance, which is no guarantee of future results and do not reflect the deduction of taxes that a shareholder may pay on fund distributions or the redemption of fund shares. Investment return and principal value of an investment will fluctuate so that an investor’s shares, when redeemed, may be worth more or less than their original cost. Performance shown without sales charges would be lower if sales charges were reflected. Current performance may be lower or higher than the performance data quoted. Current month-end performance is available on the Fund’s Web site – www.wellsfargo.com/advantagefunds.
Index returns do not include transaction costs associated with buying and selling securities, any mutual fund fees or expenses or any taxes. It is not possible to invest directly in an index.
For Class A shares, the maximum front-end sales charge is 5.75%. For Class B shares, the maximum contingent deferred sales charge is 5.00%. For Class C shares, the maximum contingent deferred sales charge is 1.00%. Performance including sales charge assumes the sales charge for the corresponding time period. Class R, Administrator Class and Institutional Class shares are sold without a front-end sales charge or contingent deferred sales charge.
Stock fund values fluctuate in response to the activities of individual companies and general market and economic conditions. Foreign investments are especially volatile and can rise or fall dramatically due to differences in the political and economic conditions of the host country. These risks are generally intensified in emerging markets. The use of derivatives may reduce returns and/or increase volatility. Certain investment strategies tend to increase the total risk of an investment (relative to the broader market). This Fund is exposed to smaller company securities risk. Consult the Fund’s prospectus for additional information on these and other risks.
| 3. | Historical performance shown for the Administrator Class shares prior to their inception reflects the performance of the Institutional Class shares, adjusted to reflect the higher expenses applicable to the Administrator Class shares. Historical performance shown for Class R shares prior to their inception reflects the performance of Class A shares, adjusted to reflect the higher expenses applicable to Class R shares. Historical performance shown for all classes of the Fund prior to July 19, 2010 is based on the performance of the Fund’s predecessor, Evergreen International Equity Fund. |
| 4. | Reflects the expense ratios as stated in the most recent prospectuses. |
| 5. | The Adviser has committed through July 18, 2013 to waive fees and/or reimburse expenses to the extent necessary to cap the Fund’s Total Annual Fund Operating Expenses After Fee Waiver, excluding certain expenses, at the amount shown above. Without this cap, the Fund’s returns would have been lower. |
| 6. | The Morgan Stanley Capital International Europe, Australasia, and Far East Free (“MSCI EAFE Free”) Net Index is an unmanaged group of securities widely regarded by investors to be representative of the stock markets of Europe, Australasia, and the Far East. MSCI Free Indices are constructed to reflect investment opportunities for global investors to account for local market restrictions on stock ownership by international investors. You cannot invest directly in an index. |
| | | | |
| 18 | | Wells Fargo Advantage International Stock Funds | | Performance Highlights |
Wells Fargo Advantage Intrinsic World Equity Fund
INVESTMENT OBJECTIVE
The Fund seeks long-term capital appreciation
ADVISER
Wells Fargo Funds Management, LLC
SUB-ADVISER
Metropolitan West Capital Management, LLC
PORTFOLIO MANAGERS
David Graham
Gary Lisenbee
Jeffrey Peck
FUND INCEPTION
April 30, 1996
| | | | |
TEN LARGEST EQUITY HOLDINGS1
(AS OF APRIL 30, 2011) | | | |
Apple Incorporated | | | 3.43% | |
Oracle Corporation | | | 3.26% | |
Enersis SA ADR | | | 2.80% | |
Unilever NV | | | 2.69% | |
Samsung Electronics Company Limited | | | 2.66% | |
EMC Corporation | | | 2.58% | |
UDR Incorporated | | | 2.43% | |
Vodafone Group plc | | | 2.43% | |
JPMorgan Chase & Company | | | 2.40% | |
Baxter International Incorporated | | | 2.35% | |
| | |
COUNTRY ALLOCATION2
(AS OF APRIL 30, 2011) |
|
 |
| 1. | The ten largest equity holdings are calculated based on the value of the securities divided by total net assets of the Fund. Holdings are subject to change and may have changed since the dates specified |
| 2. | Country allocation is subject to change and is calculated based on the total investments of the Fund, excluding cash and cash equivalents. |
| | | | | | |
| Performance Highlights | | Wells Fargo Advantage International Stock Funds | | | 19 | |
Wells Fargo Advantage Intrinsic World Equity Fund (continued)
AVERAGE ANNUAL TOTAL RETURN3 (%) (AS OF APRIL 30, 2011)
| | | | | | | | | | | | | | | | | | | | | | | | | | | | | | | | | | | | | | | | | | | | |
| | | | | | Including Sales Charge | | | Excluding Sales Charge | | | Expense Ratios4 | |
| | | Inception Date | | | 6-Months* | | | 1-Year | | | 5-Year | | | 10-Year | | | 6-Months* | | | 1-Year | | | 5-Year | | | 10-Year | | | Gross | | | Net5 | |
Class A (EWEAX) | | | 04/30/1996 | | | | 7.78 | | | | 12.65 | | | | 0.92 | | | | 4.57 | | | | 14.37 | | | | 19.52 | | | | 2.12 | | | | 5.20 | | | | 1.59% | | | | 1.40% | |
Class C (EWECX) | | | 05/18/2007 | | | | 12.97 | | | | 17.65 | | | | 1.36 | | | | 4.42 | | | | 13.97 | | | | 18.65 | | | | 1.36 | | | | 4.42 | | | | 2.34% | | | | 2.15% | |
Administrator Class (EWEIX) | | | 05/18/2007 | | | | | | | | | | | | | | | | | | | | 14.49 | | | | 19.83 | | | | 2.30 | | | | 5.29 | | | | 1.43% | | | | 1.15% | |
Institutional Class (EWENX) | | | 07/30/2010 | | | | | | | | | | | | | | | | | | | | 14.65 | | | | 20.01 | | | | 2.33 | | | | 5.31 | | | | 1.16% | | | | 0.95% | |
MSCI World Index (Net)6 | | | | | | | | | | | | | | | | | | | | | | | 14.75 | | | | 18.25 | | | | 2.32 | | | | 3.90 | | | | | | | | | |
| * | Returns for periods of less than one year are not annualized. |
Figures quoted represent past performance, which is no guarantee of future results and do not reflect the deduction of taxes that a shareholder may pay on fund distributions or the redemption of fund shares. Investment return and principal value of an investment will fluctuate so that an investor’s shares, when redeemed, may be worth more or less than their original cost. Performance shown without sales charges would be lower if sales charges were reflected. Current performance may be lower or higher than the performance data quoted. Current month-end performance is available on the Fund’s Web site – www.wellsfargo.com/advantagefunds.
Index returns do not include transaction costs associated with buying and selling securities, any mutual fund fees or expenses or any taxes. It is not possible to invest directly in an index.
For Class A shares, the maximum front-end sales charge is 5.75%. For Class C shares, the maximum contingent deferred sales charge is 1.00%. Performance including sales charge assumes the sales charge for the corresponding time period. Administrator Class and Institutional Class shares are sold without a front-end sales charge or contingent deferred sales charge.
Stock fund values fluctuate in response to the activities of individual companies and general market and economic conditions. Foreign investments are especially volatile and can rise or fall dramatically due to differences in the political and economic conditions of the host country. These risks are generally intensified in emerging markets. The use of derivatives may reduce returns and/or increase volatility. Certain investment strategies tend to increase the total risk of an investment (relative to the broader market). This Fund is exposed to smaller company securities risk. Consult the Fund’s prospectus for additional information on these and other risks.
| 3. | Historical performance shown for Class C shares prior to their inception reflects the performance of Class A shares, adjusted to reflect the higher expenses applicable to Class C shares. Historical performance shown for the Institutional Class shares prior to their inception reflects the performance of the Administrator Class shares, and includes the higher expenses applicable to the Administrator Class shares. If these expenses had not been included, returns would be higher. Historical performance shown for the Administrator Class shares prior to their inception reflects the performance of Class A shares, and includes the higher expenses applicable to Class A shares. If these expenses had not been included, returns would be higher. Historical performance shown for all classes of the Fund prior to July 19, 2010 is based on the performance of the Fund’s predecessor, Evergreen Intrinsic World Equity Fund. |
| 4. | Reflects the expense ratios as stated in the most recent prospectuses. |
| 5. | The Adviser has committed through July 18, 2013 to waive fees and/or reimburse expenses to the extent necessary to cap the Fund’s Total Annual Fund Operating Expenses After Fee Waiver, excluding certain expenses, at the amount shown above. Without this cap, the Fund’s returns would have been lower. |
| 6. | The Morgan Stanley Capital International World Index (the “MSCI World Index (Net)”) is a free float-adjusted market capitalization weighted index that is designed to measure the equity market performance of developed markets. You cannot invest directly in an index. |
| | | | |
| 20 | | Wells Fargo Advantage International Stock Funds | | Fund Expenses |
As a shareholder of the Fund, you incur two types of costs: (1) transaction costs, including sales charges (loads) on purchase payments, redemption fees (if any) and exchange fees (if any); and (2) ongoing costs, including management fees; distribution (12b-1) and/or shareholder service fees; and other Fund expenses. This example is in tended to help you understand your ongoing costs (in dollars) of investing in the Fund and to compare these costs with the ongoing costs of investing in other mutual funds.
The example is based on an investment of $1,000 invested at the beginning of the six-month period and held for the entire period from November 1, 2010 to April 30, 2011.
Actual Expenses
The “Actual” line of the table below provides in formation about actual account values and actual expenses. You may use the information in this line, together with the amount you invested, to estimate the expenses that you paid over the period. Simply divide your account value by $1,000 (for example, an $8,600 account value divided by $1,000 = 8.6), then multiply the result by the number in the “Actual” line under the heading entitled “Expenses Paid During Period” for your applicable class of shares to estimate the expenses you paid on your account during this period.
Hypothetic al Example for Comparison Purposes
The “Hypothetical” line of the table below provides in formation about hypothetical account values and hypothetical expenses based on the Fund’s actual expense ratio and an assumed rate of return of 5% per year before expenses, which is not the Fund’s actual return. The hypothetical account values and expenses may not be used to estimate the actual ending account balance or expenses you paid for the period. You may use this information to compare the ongoing costs of investing in the Fund and other funds. To do so, compare this 5% hypothetical example with the 5% hypothetical examples that appear in the shareholder reports of the other funds.
Please note that the expenses shown in the table are meant to highlight your ongoing costs only and do not reflect any transactional costs, such as sales charges (loads), redemption fees, or exchange fees. Therefore, the “Hypothetical” line of the table is useful in comparing ongoing costs only, and will not help you determine the relative total costs of owning different funds. In addition, if these transactional costs were included, your costs would have been higher.
| | | | | | | | | | | | | | | | |
| Wells Fargo Advantage Asia Pacific Fund | | Beginning
Account Value
11-01-2010 | | | Ending
Account Value
04-30-2011 | | | Expenses
Paid During
the Period1 | | | Net Annual
Expense Ratio | |
Class A | | | | | | | | | | | | | | | | |
Actual | | $ | 1,000.00 | | | $ | 1,055.88 | | | $ | 8.16 | | | | 1.60 | % |
Hypothetical | | $ | 1,000.00 | | | $ | 1,016.86 | | | $ | 8.00 | | | | 1.60 | % |
Class C | | | | | | | | | | | | | | | | |
Actual | | $ | 1,000.00 | | | $ | 1,051.58 | | | $ | 11.95 | | | | 2.35 | % |
Hypothetical | | $ | 1,000.00 | | | $ | 1,013.14 | | | $ | 11.73 | | | | 2.35 | % |
Administrator Class | | | | | | | | | | | | | | | | |
Actual | | $ | 1,000.00 | | | $ | 1,057.33 | | | $ | 7.14 | | | | 1.40 | % |
Hypothetical | | $ | 1,000.00 | | | $ | 1,017.85 | | | $ | 7.00 | | | | 1.40 | % |
Institutional Class | | | | | | | | | | | | | | | | |
Actual | | $ | 1,000.00 | | | $ | 1,057.68 | | | $ | 6.38 | | | | 1.25 | % |
Hypothetical | | $ | 1,000.00 | | | $ | 1,018.60 | | | $ | 6.26 | | | | 1.25 | % |
Investor Class | | | | | | | | | | | | | | | | |
Actual | | $ | 1,000.00 | | | $ | 1,056.19 | | | $ | 8.41 | | | | 1.65 | % |
Hypothetical | | $ | 1,000.00 | | | $ | 1,016.61 | | | $ | 8.25 | | | | 1.65 | % |
| | | | | | |
| Fund Expenses | | Wells Fargo Advantage International Stock Funds | | | 21 | |
| | | | | | | | | | | | | | | | |
| Wells Fargo Advantage Disciplined Global Equity Fund | | Beginning
Account Value
11-01-2010 | | | Ending
Account Value
04-30-2011 | | | Expenses
Paid During
the Period1 | | | Net Annual
Expense Ratio | |
Class A | | | | | | | | | | | | | | | | |
Actual | | $ | 1,000.00 | | | $ | 1,154.05 | | | $ | 7.48 | | | | 1.40 | % |
Hypothetical | | $ | 1,000.00 | | | $ | 1,017.85 | | | $ | 7.00 | | | | 1.40 | % |
Class C | | | | | | | | | | | | | | | | |
Actual | | $ | 1,000.00 | | | $ | 1,149.76 | | | $ | 11.46 | | | | 2.15 | % |
Hypothetical | | $ | 1,000.00 | | | $ | 1,014.13 | | | $ | 10.74 | | | | 2.15 | % |
Administrator Class | | | | | | | | | | | | | | | | |
Actual | | $ | 1,000.00 | | | $ | 1,155.25 | | | $ | 6.15 | | | | 1.15 | % |
Hypothetical | | $ | 1,000.00 | | | $ | 1,019.09 | | | $ | 5.76 | | | | 1.15 | % |
Institutional Class | | | | | | | | | | | | | | | | |
Actual | | $ | 1,000.00 | | | $ | 1,156.52 | | | $ | 5.08 | | | | 0.95 | % |
Hypothetical | | $ | 1,000.00 | | | $ | 1,020.08 | | | $ | 4.76 | | | | 0.95 | % |
| Wells Fargo Advantage Diversified International Fund | | | | | | | |
Class A | | | | | | | | | | | | | | | | |
Actual | | $ | 1,000.00 | | | $ | 1,131.47 | | | $ | 7.45 | | | | 1.41 | % |
Hypothetical | | $ | 1,000.00 | | | $ | 1,017.80 | | | $ | 7.05 | | | | 1.41 | % |
Class B | | | | | | | | | | | | | | | | |
Actual | | $ | 1,000.00 | | | $ | 1,126.28 | | | $ | 11.39 | | | | 2.16 | % |
Hypothetical | | $ | 1,000.00 | | | $ | 1,014.08 | | | $ | 10.79 | | | | 2.16 | % |
Class C | | | | | | | | | | | | | | | | |
Actual | | $ | 1,000.00 | | | $ | 1,126.70 | | | $ | 11.39 | | | | 2.16 | % |
Hypothetical | | $ | 1,000.00 | | | $ | 1,014.08 | | | $ | 10.79 | | | | 2.16 | % |
Administrator Class | | | | | | | | | | | | | | | | |
Actual | | $ | 1,000.00 | | | $ | 1,132.27 | | | $ | 6.61 | | | | 1.25 | % |
Hypothetical | | $ | 1,000.00 | | | $ | 1,018.60 | | | $ | 6.26 | | | | 1.25 | % |
Institutional Class | | | | | | | | | | | | | | | | |
Actual | | $ | 1,000.00 | | | $ | 1,133.62 | | | $ | 5.24 | | | | 0.99 | % |
Hypothetical | | $ | 1,000.00 | | | $ | 1,019.89 | | | $ | 4.96 | | | | 0.99 | % |
Investor Class | | | | | | | | | | | | | | | | |
Actual | | $ | 1,000.00 | | | $ | 1,130.51 | | | $ | 7.71 | | | | 1.46 | % |
Hypothetical | | $ | 1,000.00 | | | $ | 1,017.55 | | | $ | 7.30 | | | | 1.46 | % |
| Wells Fargo Advantage Emerging Markets Equity Fund | | | | | | | |
Class A | | | | | | | | | | | | | | | | |
Actual | | $ | 1,000.00 | | | $ | 1,100.32 | | | $ | 9.01 | | | | 1.73 | % |
Hypothetical | | $ | 1,000.00 | | | $ | 1,016.22 | | | $ | 8.65 | | | | 1.73 | % |
Class B | | | | | | | | | | | | | | | | |
Actual | | $ | 1,000.00 | | | $ | 1,096.17 | | | $ | 12.89 | | | | 2.48 | % |
Hypothetical | | $ | 1,000.00 | | | $ | 1,012.50 | | | $ | 12.37 | | | | 2.48 | % |
Class C | | | | | | | | | | | | | | | | |
Actual | | $ | 1,000.00 | | | $ | 1,096.36 | | | $ | 12.89 | | | | 2.48 | % |
Hypothetical | | $ | 1,000.00 | | | $ | 1,012.50 | | | $ | 12.37 | | | | 2.48 | % |
Administrator Class | | | | | | | | | | | | | | | | |
Actual | | $ | 1,000.00 | | | $ | 1,101.31 | | | $ | 8.02 | | | | 1.54 | % |
Hypothetical | | $ | 1,000.00 | | | $ | 1,017.16 | | | $ | 7.70 | | | | 1.54 | % |
Institutional Class | | | | | | | | | | | | | | | | |
Actual | | $ | 1,000.00 | | | $ | 1,102.84 | | | $ | 6.52 | | | | 1.25 | % |
Hypothetical | | $ | 1,000.00 | | | $ | 1,018.60 | | | $ | 6.26 | | | | 1.25 | % |
| | | | |
| 22 | | Wells Fargo Advantage International Stock Funds | | Fund Expenses |
| | | | | | | | | | | | | | | | |
| Wells Fargo Advantage Global Opportunities Fund | | Beginning
Account Value
11-01-2010 | | | Ending
Account Value
04-30-2011 | | | Expenses
Paid During
the Period1 | | | Net Annual
Expense Ratio | |
Class A | | | | | | | | | | | | | | | | |
Actual | | $ | 1,000.00 | | | $ | 1,188.34 | | | $ | 8.52 | | | | 1.57 | % |
Hypothetical | | $ | 1,000.00 | | | $ | 1,017.01 | | | $ | 7.85 | | | | 1.57 | % |
Class B | | | | | | | | | | | | | | | | |
Actual | | $ | 1,000.00 | | | $ | 1,183.64 | | | $ | 12.56 | | | | 2.32 | % |
Hypothetical | | $ | 1,000.00 | | | $ | 1,013.29 | | | $ | 11.58 | | | | 2.32 | % |
Class C | | | | | | | | | | | | | | | | |
Actual | | $ | 1,000.00 | | | $ | 1,183.81 | | | $ | 12.56 | | | | 2.32 | % |
Hypothetical | | $ | 1,000.00 | | | $ | 1,013.29 | | | $ | 11.58 | | | | 2.32 | % |
Administrator Class | | | | | | | | | | | | | | | | |
Actual | | $ | 1,000.00 | | | $ | 1,189.43 | | | $ | 7.55 | | | | 1.39 | % |
Hypothetical | | $ | 1,000.00 | | | $ | 1,017.90 | | | $ | 6.95 | | | | 1.39 | % |
Institutional Class | | | | | | | | | | | | | | | | |
Actual | | $ | 1,000.00 | | | $ | 1,190.68 | | | $ | 5.92 | | | | 1.09 | % |
Hypothetical | | $ | 1,000.00 | | | $ | 1,019.39 | | | $ | 5.46 | | | | 1.09 | % |
| Wells Fargo Advantage International Equity Fund | | | | | | | |
Class A | | | | | | | | | | | | | | | | |
Actual | | $ | 1,000.00 | | | $ | 1,145.63 | | | $ | 5.80 | | | | 1.09 | % |
Hypothetical | | $ | 1,000.00 | | | $ | 1,019.39 | | | $ | 5.46 | | | | 1.09 | % |
Class B | | | | | | | | | | | | | | | | |
Actual | | $ | 1,000.00 | | | $ | 1,141.30 | | | $ | 9.77 | | | | 1.84 | % |
Hypothetical | | $ | 1,000.00 | | | $ | 1,015.67 | | | $ | 9.20 | | | | 1.84 | % |
Class C | | | | | | | | | | | | | | | | |
Actual | | $ | 1,000.00 | | | $ | 1,141.60 | | | $ | 9.77 | | | | 1.84 | % |
Hypothetical | | $ | 1,000.00 | | | $ | 1,015.67 | | | $ | 9.20 | | | | 1.84 | % |
Class R | | | | | | | | | | | | | | | | |
Actual | | $ | 1,000.00 | | | $ | 1,144.23 | | | $ | 7.12 | | | | 1.34 | % |
Hypothetical | | $ | 1,000.00 | | | $ | 1,018.15 | | | $ | 6.71 | | | | 1.34 | % |
Administrator Class | | | | | | | | | | | | | | | | |
Actual | | $ | 1,000.00 | | | $ | 1,145.11 | | | $ | 5.80 | | | | 1.09 | % |
Hypothetical | | $ | 1,000.00 | | | $ | 1,019.39 | | | $ | 5.46 | | | | 1.09 | % |
Institutional Class | | | | | | | | | | | | | | | | |
Actual | | $ | 1,000.00 | | | $ | 1,146.45 | | | $ | 4.47 | | | | 0.84 | % |
Hypothetical | | $ | 1,000.00 | | | $ | 1,020.63 | | | $ | 4.21 | | | | 0.84 | % |
| Wells Fargo Advantage Intrinsic World Equity Fund | | | | | | | |
Class A | | | | | | | | | | | | | | | | |
Actual | | $ | 1,000.00 | | | $ | 1,143.66 | | | $ | 7.44 | | | | 1.40 | % |
Hypothetical | | $ | 1,000.00 | | | $ | 1,017.85 | | | $ | 7.00 | | | | 1.40 | % |
Class C | | | | | | | | | | | | | | | | |
Actual | | $ | 1,000.00 | | | $ | 1,139.67 | | | $ | 11.41 | | | | 2.15 | % |
Hypothetical | | $ | 1,000.00 | | | $ | 1,014.13 | | | $ | 10.74 | | | | 2.15 | % |
Administrator Class | | | | | | | | | | | | | | | | |
Actual | | $ | 1,000.00 | | | $ | 1,144.87 | | | $ | 6.12 | | | | 1.15 | % |
Hypothetical | | $ | 1,000.00 | | | $ | 1,019.09 | | | $ | 5.76 | | | | 1.15 | % |
Institutional Class | | | | | | | | | | | | | | | | |
Actual | | $ | 1,000.00 | | | $ | 1,146.53 | | | $ | 5.06 | | | | 0.95 | % |
Hypothetical | | $ | 1,000.00 | | | $ | 1,020.08 | | | $ | 4.76 | | | | 0.95 | % |
| 1. | Expenses paid is equal to each class’ annualized expense ratio multiplied by the average account value over the period, multiplied by the number of days in the most recent six-month period divided by 365 (to reflect the one-half year period). |
| | | | | | |
| Portfolio of Investments—April 30, 2011 (Unaudited) | | Wells Fargo Advantage International Stock Funds | | | 23 | |
ASIA PACIFIC FUND
| | | | | | | | | | | | | | | | |
| Security Name | | | | | | | | Shares | | | Value | |
| | | | | | | | | | | | | | | | |
| | | | |
Common Stocks: 95.92% | | | | | | | | | | | | | | | | |
| | | | |
| Australia: 3.23% | | | | | | | | | | | | | | | | |
Australia & New Zealand Banking Group Limited (Financials, Commercial Banks) | | | | | | | | | | | 61,600 | | | $ | 1,636,003 | |
Newcrest Mining Limited (Materials, Metals & Mining) | | | | | | | | | | | 169,751 | | | | 7,712,352 | |
Santos Limited (Energy, Oil, Gas & Consumable Fuels) | | | | | | | | | | | 1 | | | | 17 | |
| | | | |
| | | | | | | | | | | | | | | 9,348,372 | |
| | | | | | | | | | | | | | | | |
| | | | |
| China: 12.53% | | | | | | | | | | | | | | | | |
Air China (Industrials, Airlines) | | | | | | | | | | | 1,400,000 | | | | 1,421,010 | |
Anton Oilfield Services Group Limited (Energy, Energy Equipment & Services)† | | | | | | | | | | | 9,082,000 | | | | 1,861,943 | |
AviChina Industry & Technology Company (Industrials, Aerospace & Defense) | | | | | | | | | | | 4,396,000 | | | | 2,745,806 | |
Bank of Communications Limited (Financials, Commercial Banks) | | | | | | | | | | | 1,287,000 | | | | 1,365,511 | |
China Animal Healthcare Limited (Health Care, Pharmaceuticals) | | | | | | | | | | | 5,424,000 | | | | 1,339,709 | |
China Construction Bank (Financials, Commercial Banks) | | | | | | | | | | | 6,005,000 | | | | 5,684,354 | |
China Datang Corporation (Utilities, Electric Utilities) | | | | | | | | | | | 4,722,000 | | | | 1,374,115 | |
China Petroleum & Chemical Corporation (Energy, Oil, Gas & Consumable Fuels) | | | | | | | | | | | 1,412,000 | | | | 1,414,393 | |
China Shineway Pharmaceutical Group Limited (Health Care, Pharmaceuticals) | | | | | | | | | | | 589,000 | | | | 1,430,503 | |
Chongqing Rural Commercial Bank (Financials, Commercial Banks) | | | | | | | | | | | 2,084,000 | | | | 1,446,356 | |
Evergrande Real Estate (Financials, Real Estate Management & Development) | | | | | | | | | | | 3,566,000 | | | | 2,549,049 | |
Goodbaby International Holdings Limited (Consumer Discretionary, Specialty Retail) | | | | | | | | | | | 1,168,400 | | | | 773,571 | |
Industrial & Commercial Bank of China Class H (Financials, Commercial Banks) | | | | | | | | | | | 6,844,000 | | | | 5,798,843 | |
MicroPort Scientific Corporation (Health Care, Health Care Equipment & Supplies) | | | | | | | | | | | 1,849,000 | | | | 1,360,666 | |
PetroChina Company Limited (Energy, Oil, Gas & Consumable Fuels) | | | | | | | | | | | 1,118,000 | | | | 1,614,899 | |
Xingda International Holdings Limited (Materials, Metals & Mining) | | | | | | | | | | | 1,135,000 | | | | 1,312,051 | |
Zijin Mining Group Company Limited Class H (Materials, Metals & Mining) | | | | | | | | | | | 3,472,000 | | | | 2,740,009 | |
| | | | |
| | | | | | | | | | | | | | | 36,232,788 | |
| | | | | | | | | | | | | | | | |
| | | | |
| Hong Kong: 9.05% | | | | | | | | | | | | | | | | |
BOC Hong Kong Holdings Limited (Financials, Commercial Banks) | | | | | | | | | | | 889,000 | | | | 2,796,436 | |
Bosideng International Holdings Limited (Consumer Discretionary, Textiles, Apparel & Luxury Goods) | | | | | | | | | | | 5,188,000 | | | | 1,652,034 | |
China Everbright Limited (Financials, Diversified Financial Services) | | | | | | | | | | | 706,000 | | | | 1,560,428 | |
China Overseas Land & Investment Limited (Financials, Real Estate Management & Development) | | | | | | | | | | | 716,000 | | | | 1,382,097 | |
CNPC (Hong Kong) Limited (Energy, Oil, Gas & Consumable Fuels) | | | | | | | | | | | 1,048,000 | | | | 1,859,636 | |
CPMC Holdings Limited (Industrials, Industrial Conglomerates) | | | | | | | | | | | 1,565,000 | | | | 957,126 | |
First Pacific Company Limited (Financials, Diversified Financial Services) | | | | | | | | | | | 1,626,000 | | | | 1,529,940 | |
Guangdong Investment Limited (Financials, Real Estate Management & Development) | | | | | | | | | | | 6,154,000 | | | | 3,199,502 | |
Haitong International Securities Company Limited (Financials, Diversified Financial Services) | | | | | | | | | | | 1,882,000 | | | | 1,237,952 | |
Henderson Land Development Company Limited (Financials, Real Estate Management & Development) | | | | | | | | | | | 111,000 | | | | 762,105 | |
Real Gold Mining Limited (Materials, Metals & Mining)« | | | | | | | | | | | 935,000 | | | | 1,327,070 | |
Shun Tak Holdings Limited (Industrials, Marine) | | | | | | | | | | | 4,894,000 | | | | 3,060,091 | |
Sparkle Roll Group Limited (Consumer Discretionary, Distributors)† | | | | | | | | | | | 8,848,000 | | | | 1,664,651 | |
Television Broadcasts Limited (Consumer Discretionary, Media) | | | | | | | | | | | 299,000 | | | | 1,754,264 | |
Welling Holding Limited (Consumer Discretionary, Household Durables)† | | | | | | | | | | | 28,942,000 | | | | 1,437,778 | |
| | | | |
| | | | | | | | | | | | | | | 26,181,110 | |
| | | | | | | | | | | | | | | | |
| | | | |
| India: 6.27% | | | | | | | | | | | | | | | | |
Asian Paints Limited (Materials, Chemicals)† | | | | | | | | | | | 27,900 | | | | 1,750,794 | |
Bharti Airtel Limited (Telecommunication Services, Wireless Telecommunication Services)† | | | | | | | | | | | 347,100 | | | | 2,983,498 | |
Coromandel International Limited (Materials, Chemicals) | | | | | | | | | | | 243,600 | | | | 1,809,025 | |
Cox & Kings Limited (Consumer Discretionary, Hotels, Restaurants & Leisure) | | | | | | | | | | | 131,000 | | | | 1,239,041 | |
Future Mall Management Limited (Financials, Real Estate Management & Development)†(i) | | | | | | | | | | | 85 | | | | 112 | |
| | | | |
| 24 | | Wells Fargo Advantage International Stock Funds | | Portfolio of Investments—April 30, 2011 (Unaudited) |
ASIA PACIFIC FUND
| | | | | | | | | | | | | | | | |
| Security Name | | | | | | | | Shares | | | Value | |
| | | | | | | | | | | | | | | | |
| | | | |
| India (continued) | | | | | | | | | | | | | | | | |
Infosys Technologies Limited (Information Technology, IT Services) | | | | | | | | | | | 41,100 | | | $ | 2,701,501 | |
Mundra Port & Special Economic Zone Limited (Industrials, Transportation Infrastructure) | | | | | | | | | | | 642,300 | | | | 2,098,388 | |
Prestige Estates Projects Limited (Financials, Real Estate Management & Development)† | | | | | | | | | | | 76,500 | | | | 253,558 | |
Reliance Industries Limited (Energy, Oil, Gas & Consumable Fuels)† | | | | | | | | | | | 93,600 | | | | 2,082,529 | |
Shree Renuka Sugars Limited (Consumer Staples, Food Products)† | | | | | | | | | | | 884,800 | | | | 1,409,797 | |
UTV Software Communications Limited (Consumer Discretionary, Media)† | | | | | | | | | | | 124,000 | | | | 1,814,357 | |
| | | | |
| | | | | | | | | | | | | | | 18,142,600 | |
| | | | | | | | | | | | | | | | |
| | | | |
| Indonesia: 2.88% | | | | | | | | | | | | | | | | |
Indofood Sukses Makmur TBK PT (Consumer Staples, Food Products) | | | | | | | | | | | 2,355,000 | | | | 1,526,185 | |
Lippo Karawaci TBK PT (Financials, Real Estate Management & Development) | | | | | | | | | | | 31,763,000 | | | | 2,892,940 | |
Nippon Indosari Corpindo TBK PT (Consumer Staples, Food Products) | | | | | | | | | | | 5,120,000 | | | | 1,688,930 | |
Telekomunikasi Indonesia TBK PT (Telecommunication Services, Diversified Telecommunication Services) | | | | | | | | | | | 2,461,000 | | | | 2,212,716 | |
| | | | |
| | | | | | | | | | | | | | | 8,320,771 | |
| | | | | | | | | | | | | | | | |
| | | | |
| Japan: 25.34% | | | | | | | | | | | | | | | | |
Japan Tobacco Incorporated (Consumer Staples, Tobacco) | | | | | | | | | | | 760 | | | | 2,941,996 | |
JS Group Corporation (Industrials, Building Products) | | | | | | | | | | | 53,200 | | | | 1,274,990 | |
Kirin Brewery Company Limited (Consumer Staples, Beverages) | | | | | | | | | | | 216,000 | | | | 3,003,735 | |
Marubeni Corporation (Industrials, Trading Companies & Distributors) | | | | | | | | | | | 197,000 | | | | 1,423,189 | |
Mitsubishi Corporation (Industrials, Trading Companies & Distributors) | | | | | | | | | | | 210,600 | | | | 5,657,368 | |
Mitsubishi Electric Corporation (Industrials, Electrical Equipment) | | | | | | | | | | | 474,000 | | | | 5,206,608 | |
Mitsubishi Estate Company Limited (Financials, Real Estate Management & Development) | | | | | | | | | | | 219,000 | | | | 3,801,418 | |
Mitsubishi UFJ Financial Group Incorporated (Financials, Commercial Banks) | | | | | | | | | | | 1,216,100 | | | | 5,802,018 | |
Mitsui Fudosan Company Limited (Financials, Real Estate Management & Development) | | | | | | | | | | | 293,000 | | | | 5,002,835 | |
Modec Incorporated (Energy, Energy Equipment & Services) | | | | | | | | | | | 81,100 | | | | 1,495,723 | |
Mori Seiki Company Limited (Industrials, Machinery)« | | | | | | | | | | | 242,000 | | | | 3,102,755 | |
Nabtesco Corporation (Industrials, Machinery) | | | | | | | | | | | 65,000 | | | | 1,637,921 | |
Nippon Telegraph & Telephone Corporation (Telecommunication Services, Diversified Telecommunication Services) | | | | | | | | | | | 124,600 | | | | 5,752,660 | |
SMC Corporation (Industrials, Machinery) | | | | | | | | | | | 16,300 | | | | 2,964,002 | |
Sony Corporation (Consumer Discretionary, Household Durables) | | | | | | | | | | | 152,300 | | | | 4,243,334 | |
Sumitomo Mitsui Financial Group Incorporated (Financials, Commercial Banks) | | | | | | | | | | | 186,300 | | | | 5,730,364 | |
THK Company Limited (Industrials, Machinery) | | | | | | | | | | | 151,900 | | | | 3,852,041 | |
Toho Titanium Company Limited (Materials, Metals & Mining)† | | | | | | | | | | | 70,000 | | | | 1,958,947 | |
Toray Industries Incorporated (Materials, Chemicals) | | | | | | | | | | | 777,000 | | | | 5,699,501 | |
Yamada Denki Company Limited (Consumer Discretionary, Specialty Retail) | | | | | | | | | | | 39,250 | | | | 2,719,411 | |
| | | | |
| | | | | | | | | | | | | | | 73,270,816 | |
| | | | | | | | | | | | | | | | |
| | | | |
| Malaysia: 5.19% | | | | | | | | | | | | | | | | |
Boustead Holdings Berhad (Industrials, Industrial Conglomerates)† | | | | | | | | | | | 816,400 | | | | 1,596,714 | |
Eastern & Oriental Berhad (Financials, Real Estate Management & Development)† | | | | | | | | | | | 2,865,600 | | | | 1,378,110 | |
Malayan Banking Berhad (Financials, Commercial Banks) | | | | | | | | | | | 566,233 | | | | 1,673,754 | |
Mudajaya Group Berhad (Industrials, Construction & Engineering) | | | | | | | | | | | 923,200 | | | | 1,444,305 | |
Petronas Chemicals Group Berhad (Materials, Chemicals)† | | | | | | | | | | | 1,177,320 | | | | 2,873,742 | |
Selangor Properties Berhad (Financials, Real Estate Management & Development) | | | | | | | | | | | 553,800 | | | | 770,309 | |
Supermax Corporation Berhad (Health Care, Health Care Equipment & Supplies) | | | | | | | | | | | 2,753,400 | | | | 3,846,494 | |
UEM Land Holdings Berhad (Financials, Real Estate Management & Development) | | | | | | | | | | | 1,578,600 | | | | 1,436,771 | |
| | | | |
| | | | | | | | | | | | | | | 15,020,199 | |
| | | | | | | | | | | | | | | | |
| | | | | | |
| Portfolio of Investments—April 30, 2011 (Unaudited) | | Wells Fargo Advantage International Stock Funds | | | 25 | |
ASIA PACIFIC FUND
| | | | | | | | | | | | | | | | |
| Security Name | | | | | | | | Shares | | | Value | |
| | | | | | | | | | | | | | | | |
| | | | |
| Pagua New Guinea: 0.48% | | | | | | | | | | | | | | | | |
Oil Search Limited (Energy, Oil, Gas & Consumable Fuels) | | | | | | | | | | | 180,200 | | | $ | 1,392,496 | |
| | | | | | | | | | | | | | | | |
| | | | |
| Philippines: 3.90% | | | | | | | | | | | | | | | | |
Alliance Global Group Incorporated (Consumer Staples, Food & Staples Retailing) | | | | | | | | | | | 3,326,000 | | | | 921,429 | |
Ayala Corporation (Financials, Diversified Financial Services) | | | | | | | | | | | 252,000 | | | | 2,301,612 | |
Metropolitan Bank & Trust Company (Financials, Commercial Banks) | | | | | | | | | | | 1,153,470 | | | | 1,849,701 | |
Philippine Long Distance Telephone Company (Telecommunication Services, Wireless Telecommunication Services) | | | | | | | | | | | 63,330 | | | | 3,677,608 | |
Robinsons Land Company (Financials, Real Estate Management & Development)† | | | | | | | | | | | 8,159,250 | | | | 2,534,876 | |
| | | | |
| | | | | | | | | | | | | | | 11,285,226 | |
| | | | | | | | | | | | | | | | |
| | | | |
| Singapore: 7.97% | | | | | | | | | | | | | | | | |
Ascott Residence Trust (Financials, Real Estate Investment Trusts (REITs)) | | | | | | | | | | | 1,837,380 | | | | 1,790,800 | |
DBS Group Holdings Limited (Financials, Commercial Banks) | | | | | | | | | | | 129,000 | | | | 1,581,335 | |
Ezra Holdings Limited (Energy, Energy Equipment & Services) | | | | | | | | | | | 1,041,700 | | | | 1,409,813 | |
Goodpack Limited (Industrials, Air Freight & Logistics) | | | | | | | | | | | 772,700 | | | | 1,254,234 | |
Hyflux Limited (Utilities, Water Utilities) | | | | | | | | | | | 917,000 | | | | 1,615,150 | |
K-Green Trust (Financials, Diversified Financial Services) | | | | | | | | | | | 121,800 | | | | 103,609 | |
Keppel Corporation Limited (Industrials, Industrial Conglomerates) | | | | | | | | | | | 374,550 | | | | 3,649,990 | |
Kingsmen Creative Limited (Industrials, Commercial Services & Supplies) | | | | | | | | | | | 2,055,100 | | | | 968,279 | |
Mapletree Commercial Trust (Financials, Real Estate Investment Trusts (REITs))† | | | | | | | | | | | 457,700 | | | | 329,052 | |
SembCorp Marine Limited (Industrials, Machinery) | | | | | | | | | | | 463,000 | | | | 2,153,927 | |
Singapore Airlines Limited (Industrials, Airlines) | | | | | | | | | | | 130,000 | | | | 1,498,419 | |
Straits Asia Resources Limited (Energy, Oil, Gas & Consumable Fuels) | | | | | | | | | | | 1,500,800 | | | | 3,634,483 | |
Venture Corporation Limited (Information Technology, Electronic Equipment & Instruments)† | | | | | | | | | | | 202,000 | | | | 1,595,891 | |
Wing Tai Holdings Limited (Financials, Real Estate Management & Development) | | | | | | | | | | | 1,133,000 | | | | 1,467,815 | |
| | | | |
| | | | | | | | | | | | | | | 23,052,797 | |
| | | | | | | | | | | | | | | | |
| | | | |
| South Korea: 9.84% | | | | | | | | | | | | | | | | |
Crucialtec Company Limited (Information Technology, Electronic Equipment & Instruments)† | | | | | | | | | | | 62,900 | | | | 1,341,170 | |
KCC Corporation (Industrials, Building Products) | | | | | | | | | | | 5,300 | | | | 1,792,796 | |
KT&G Corporation (Consumer Staples, Tobacco) | | | | | | | | | | | 24,700 | | | | 1,461,279 | |
LG Electronics Incorporated (Consumer Discretionary, Household Durables) | | | | | | | | | | | 15,100 | | | | 1,451,313 | |
LG Phillips LCD Company Limited (Information Technology, Electronic Equipment & Instruments)† | | | | | | | | | | | 65,840 | | | | 2,365,362 | |
Lock & Lock Company Limited (Consumer Staples, Household Products) | | | | | | | | | | | 81,700 | | | | 2,984,701 | |
Lotte Shopping Company Limited (Consumer Discretionary, Multiline Retail)† | | | | | | | | | | | 8,800 | | | | 4,011,384 | |
Mando Corporation (Consumer Discretionary, Auto Components) | | | | | | | | | | | 8,200 | | | | 1,438,529 | |
Poongsan Corporation (Materials, Metals & Mining) | | | | | | | | | | | 37,000 | | | | 1,405,216 | |
POSCO (Materials, Metals & Mining)† | | | | | | | | | | | 8,400 | | | | 3,668,362 | |
Samsung Electronics Company Limited (Consumer Discretionary, Specialty Retail) | | | | | | | | | | | 5,800 | | | | 4,833,108 | |
Shinhan Financial Group Company Limited (Financials, Commercial Banks)† | | | | | | | | | | | 34,550 | | | | 1,692,600 | |
| | | | |
| | | | | | | | | | | | | | | 28,445,820 | |
| | | | | | | | | | | | | | | | |
| | | | |
| Taiwan: 4.13% | | | | | | | | | | | | | | | | |
Hon Hai Precision Industry Company Limited (Information Technology, Computers & Peripherals) | | | | | | | | | | | 384,000 | | | | 1,458,910 | |
Nan Ya Plastics Corporation (Materials, Chemicals) | | | | | | | | | | | 575,000 | | | | 1,762,176 | |
Simplo Technology Company Limited (Information Technology, Computers & Peripherals)† | | | | | | | | | | | 318,200 | | | | 2,162,336 | |
Taiwan Semiconductor Manufacturing Company Limited (Information Technology, Semiconductors & Semiconductor Equipment) | | | | | | | | | | | 1,778,000 | | | | 4,598,125 | |
| | | | |
| 26 | | Wells Fargo Advantage International Stock Funds | | Portfolio of Investments—April 30, 2011 (Unaudited) |
ASIA PACIFIC FUND
| | | | | | | | | | | | | | | | |
| Security Name | | | | | | | | Shares | | | Value | |
| | | | | | | | | | | | | | | | |
| | | | |
| Taiwan: (continued) | | | | | | | | | | | | | | | | |
TPK Holding Company Limited (Information Technology, Electronic Equipment & Instruments)† | | | | | | | | | | | 66,000 | | | $ | 1,976,132 | |
| | | | |
| | | | | | | | | | | | | | | 11,957,679 | |
| | | | | | | | | | | | | | | | |
| | | | |
| Thailand: 4.13% | | | | | | | | | | | | | | | | |
Banpu PCL (Energy, Oil, Gas & Consumable Fuels) | | | | | | | | | | | 99,250 | | | | 2,482,115 | |
Kasikornbank PCL (Financials, Commercial Banks) | | | | | | | | | | | 399,300 | | | | 1,741,395 | |
PTT Chemical PCL ADR (Materials, Chemicals) | | | | | | | | | | | 266,600 | | | | 1,429,012 | |
PTT PCL (Energy, Oil, Gas & Consumable Fuels) | | | | | | | | | | | 329,100 | | | | 4,134,422 | |
Siam Cement PCL (Materials, Construction Materials) | | | | | | | | | | | 155,100 | | | | 2,151,026 | |
| | | | |
| | | | | | | | | | | | | | | 11,937,970 | |
| | | | | | | | | | | | | | | | |
| | | | |
| United Kingdom: 0.98% | | | | | | | | | | | | | | | | |
HSBC Holdings plc (Financials, Commercial Banks) | | | | | | | | | | | 258,800 | | | | 2,823,556 | |
| | | | | | | | | | | | | | | | |
| | | | |
Total Common Stocks (Cost $257,036,669) | | | | | | | | | | | | | | | 277,412,200 | |
| | | | | | | | | | | | | | | | |
| | | | |
Investment Companies: 2.46% | | | | | | | | | | | | | | | | |
| | | | |
| Hong Kong: 1.44% | | | | | | | | | | | | | | | | |
iShares MSCI China Index ETF | | | | | | | | | | | 2,411,900 | | | | 4,161,527 | |
| | | | |
| Japan: 1.02% | | | | | | | | | | | | | | | | |
iShares MSCI Japan Index ETF | | | | | | | | | | | 281,000 | | | | 2,958,930 | |
| | | | |
Total Investment Companies (Cost $7,062,535) | | | | | | | | | | | | | | | 7,120,457 | |
| | | | | | | | | | | | | | | | |
| | | | |
| | | | | | Expiration Date | | | | | | | |
| | | | |
Warrants: 0.41% | | | | | | | | | | | | | | | | |
| | | | |
| Thailand | | | | | | | | | | | | | | | | |
Minor International PCL (Consumer Staples, Food Products)† | | | | | | | 05/18/2013 | | | | 753,090 | | | | 72,155 | |
| | | | | | | | | | | | | | | | |
| | | | |
| United Kingdom | | | | | | | | | | | | | | | | |
HSBC Bank plc (Financials, Commercial Banks)†(a) | | | | | | | 08/11/2020 | | | | 590,000 | | | | 1,101,646 | |
| | | | | | | | | | | | | | | | |
| | | | |
Total Warrants (Cost $1,001,565) | | | | | | | | | | | | | | | 1,173,801 | |
| | | | | | | | | | | | | | | | |
| | | | |
Short-Term Investments: 3.53% | | | | | | | | | | | | | | | | |
| | | | |
| | | Yield | | | | | | | | | | |
| | | | |
| Investment Companies: 3.53% | | | | | | | | | | | | | | | | |
Wells Fargo Advantage Cash Investment Money Market Fund(l)(u) | | | 0.09 | % | | | | | | | 5,642,176 | | | | 5,642,176 | |
Wells Fargo Securities Lending Cash Investments, LLC(l)(v)(u) | | | 0.20 | | | | | | | | 4,571,856 | | | | 4,571,856 | |
| | | | | | | | | | | | | | | | |
| | | | |
Total Short-Term Investments (Cost $10,214,032) | | | | | | | | | | | | | | | 10,214,032 | |
| | | | | | | | | | | | | | | | |
| | | | | | | | |
| Total Investments in Securities | | | | | | | | |
| (Cost $275,314,801)* | | | 102.32 | % | | | 295,920,490 | |
Other Assets and Liabilities, Net | | | (2.32 | ) | | | (6,714,018 | ) |
| | | | | | | | |
| Total Net Assets | | | 100.00 | % | | $ | 289,206,472 | |
| | | | | | | | |
| | | | | | |
| Portfolio of Investments—April 30, 2011 (Unaudited) | | Wells Fargo Advantage International Stock Funds | | | 27 | |
ASIA PACIFIC FUND
| « | All or a portion of this security is on loan. |
| † | Non-income earning securities. |
| (a) | Security is fair valued by the Management Valuation Team, and in certain instances by the Board of Trustees, in accordance with procedures approved by the Board of Trustees. |
| (l) | Investment in an affiliate. |
| (v) | Security represents investment of cash collateral received from securities on loan. |
| (u) | Rate shown is the 7-day annualized yield at period end. |
| * | Cost for federal income tax purposes is $275,503,848 and net unrealized appreciation (depreciation) consists of: |
| | | | |
Gross unrealized appreciation | | $ | 25,276,454 | |
Gross unrealized depreciation | | | (4,859,812 | ) |
| | | | |
Net unrealized appreciation | | $ | 20,416,642 | |
The accompanying notes are an integral part of these financial statements.
| | | | |
| 28 | | Wells Fargo Advantage International Stock Funds | | Portfolio of Investments—April 30, 2011 (Unaudited) |
DISCIPLINED GLOBAL EQUITY FUND
| | | | | | | | | | | | | | | | |
| Security Name | | | | | | | | Shares | | | Value | |
| | | | | | | | | | | | | | | | |
| | | |
Common Stocks: 97.86% | | | | | | | | | | | | | |
| | | |
| Australia: 3.03% | | | | | | | | | | | | | |
Australia & New Zealand Banking Group Limited (Financials, Commercial Banks) | | | | | | | | | | | 20,176 | | | $ | 535,844 | |
Bendigo Bank Limited (Financials, Commercial Banks) | | | | | | | | | | | 27,784 | | | | 284,441 | |
Commonwealth Bank of Australia (Financials, Commercial Banks) | | | | | | | | | | | 2,358 | | | | 138,819 | |
Fairfax Media Limited (Consumer Discretionary, Media)« | | | | | | | | | | | 116,736 | | | | 168,900 | |
Goodman Fielder Limited (Consumer Staples, Food Products) | | | | | | | | | | | 131,780 | | | | 155,277 | |
GPT Group (Financials, Real Estate Investment Trusts (REITs)) | | | | | | | | | | | 56,263 | | | | 195,190 | |
National Australia Bank Limited (Financials, Commercial Banks) | | | | | | | | | | | 14,739 | | | | 437,488 | |
Tabcorp Holdings Limited (Consumer Discretionary, Hotels, Restaurants & Leisure) | | | | | | | | | | | 31,730 | | | | 265,366 | |
| | | | |
| | | | | | | | | | | | | | | 2,181,325 | |
| | | | | | | | | | | | | | | | |
| | | |
| Austria: 0.86% | | | | | | | | | | | | | |
OMV AG (Energy, Oil, Gas & Consumable Fuels) | | | | | | | | | | | 8,418 | | | | 383,900 | |
Voestalpine AG (Materials, Metals & Mining) | | | | | | | | | | | 4,812 | | | | 236,804 | |
| | | | |
| | | | | | | | | | | | | | | 620,704 | |
| | | | | | | | | | | | | | | | |
| | | |
| Belgium: 0.54% | | | | | | | | | | | | | |
Delhaize Group (Consumer Staples, Food & Staples Retailing) | | | | | | | | | | | 2,947 | | | | 255,175 | |
KBC Groep NV (Financials, Commercial Banks) | | | | | | | | | | | 3,244 | | | | 132,230 | |
| | | | |
| | | | | | | | | | | | | | | 387,405 | |
| | | | | | | | | | | | | | | | |
| | | |
| Canada: 3.76% | | | | | | | | | | | | | |
Alimentation Couche-Tard Incorporated (Consumer Staples, Food & Staples Retailing) | | | | | | | | | | | 9,500 | | | | 249,511 | |
Bank of Nova Scotia (Financials, Commercial Banks)« | | | | | | | | | | | 7,180 | | | | 437,789 | |
Barrick Gold Corporation (Materials, Metals & Mining) | | | | | | | | | | | 2,281 | | | | 116,491 | |
Bombardier Incorporated (Industrials, Aerospace & Defense) | | | | | | | | | | | 42,000 | | | | 312,952 | |
CGI Group Incorporated (Information Technology, IT Services)† | | | | | | | | | | | 8,948 | | | | 195,766 | |
Magna International Incorporated Class A (Consumer Discretionary, Auto Components) | | | | | | | | | | | 4,627 | | | | 237,769 | |
National Bank of Canada (Financials, Commercial Banks) | | | | | | | | | | | 4,010 | | | | 332,023 | |
Nexen Incorporated (Energy, Oil, Gas & Consumable Fuels) | | | | | | | | | | | 11,376 | | | | 300,947 | |
Open Text Corporation (Information Technology, Internet Software & Services)† | | | | | | | | | | | 2,046 | | | | 125,335 | |
Research in Motion Limited (Information Technology, Communications Equipment)† | | | | | | | | | | | 8,124 | | | | 395,746 | |
| | | | |
| | | | | | | | | | | | | | | 2,704,329 | |
| | | | | | | | | | | | | | | | |
| | | |
| Finland: 1.18% | | | | | | | | | | | | | |
Stora Enso Oyj (Materials, Paper & Forest Products)« | | | | | | | | | | | 19,772 | | | | 238,236 | |
UPM-Kymmene Oyj (Materials, Paper & Forest Products) | | | | | | | | | | | 13,286 | | | | 272,351 | |
Wartsila Oyj (Industrials, Machinery) | | | | | | | | | | | 8,550 | | | | 336,098 | |
| | | | |
| | | | | | | | | | | | | | | 846,685 | |
| | | | | | | | | | | | | | | | |
| | | |
| France: 5.40% | | | | | | | | | | | | | |
AXA SA (Financials, Insurance)« | | | | | | | | | | | 11,794 | | | | 264,651 | |
BNP Paribas SA (Financials, Commercial Banks) | | | | | | | | | | | 7,268 | | | | 575,174 | |
Christian Dior SA (Consumer Discretionary, Textiles, Apparel & Luxury Goods) | | | | | | | | | | | 1,816 | | | | 291,436 | |
CNP Assurances (Financials, Insurance) | | | | | | | | | | | 10,668 | | | | 244,835 | |
Compagnie Generale Des Establissements Michelin (Consumer Discretionary, Auto Components) | | | | | | | | | | | 2,831 | | | | 283,750 | |
M6 Metropole Television (Consumer Discretionary, Media) | | | | | | | | | | | 10,569 | | | | 280,603 | |
Natixis (Financials, Commercial Banks) | | | | | | | | | | | 32,627 | | | | 187,600 | |
Peugeot SA (Consumer Discretionary, Automobiles) | | | | | | | | | | | 4,857 | | | | 220,566 | |
Renault SA (Consumer Discretionary, Automobiles) | | | | | | | | | | | 1,152 | | | | 70,197 | |
| | | | | | |
| Portfolio of Investments—April 30, 2011 (Unaudited) | | Wells Fargo Advantage International Stock Funds | | | 29 | |
DISCIPLINED GLOBAL EQUITY FUND
| | | | | | | | | | | | | | | | |
| Security Name | | | | | | | | Shares | | | Value | |
| | | | | | | | | | | | | | | | |
| | | |
| France (continued) | | | | | | | | | | | | | |
Sanofi-Aventis SA (Health Care, Pharmaceuticals)« | | | | | | | | | | | 9,107 | | | $ | 720,304 | |
Vinci SA (Industrials, Construction & Engineering) | | | | | | | | | | | 1,817 | | | | 121,375 | |
Vivendi SA (Consumer Discretionary, Media)« | | | | | | | | | | | 19,838 | | | | 622,480 | |
| | | | |
| | | | | | | | | | | | | | | 3,882,971 | |
| | | | | | | | | | | | | | | | |
| | | |
| Germany: 5.15% | | | | | | | | | | | | | |
Allianz AG (Financials, Insurance)« | | | | | | | | | | | 1,103 | | | | 173,663 | |
BASF SE (Materials, Chemicals)« | | | | | | | | | | | 6,857 | | | | 704,844 | |
Bayerische Motoren Werke AG (Consumer Discretionary, Automobiles)« | | | | | | | | | | | 6,540 | | | | 616,754 | |
Commerzbank AG (Financials, Commercial Banks)« | | | | | | | | | | | 20,652 | | | | 131,531 | |
Deutsche Lufthansa AG (Industrials, Airlines)« | | | | | | | | | | | 3,639 | | | | 82,573 | |
E.ON AG (Utilities, Electric Utilities)« | | | | | | | | | | | 15,075 | | | | 515,338 | |
Fresenius SE (Health Care, Health Care Equipment & Supplies) | | | | | | | | | | | 3,644 | | | | 382,453 | |
Hannover Rueckversicherung AG (Financials, Insurance) | | | | | | | | | | | 2,435 | | | | 147,258 | |
Infineon Technologies AG (Information Technology, Semiconductors & Semiconductor Equipment) | | | | | | | | | | | 18,504 | | | | 210,049 | |
Siemens AG (Industrials, Industrial Conglomerates) | | | | | | | | | | | 3,365 | | | | 489,535 | |
Suedzucker AG (Consumer Staples, Food Products) | | | | | | | | | | | 8,011 | | | | 247,099 | |
| | | | |
| | | | | | | | | | | | | | | 3,701,097 | |
| | | | | | | | | | | | | | | | |
| | | |
| Greece: 0.24% | | | | | | | | | | | | | |
Public Power Corporation SA (Utilities, Electric Utilities) | | | | | | | | | | | 10,288 | | | | 170,209 | |
| | | | | | | | | | | | | | | | |
| | | |
| Hong Kong: 1.11% | | | | | | | | | | | | | |
Cathay Pacific Airways (Industrials, Airlines) | | | | | | | | | | | 64,000 | | | | 159,824 | |
New World Development (Financials, Real Estate Management & Development) | | | | | | | | | | | 88,000 | | | | 154,610 | |
Wharf Holdings Limited (Financials, Real Estate Management & Development) | | | | | | | | | | | 37,000 | | | | 271,378 | |
Wheelock & Company (Financials, Real Estate Management & Development) | | | | | | | | | | | 52,000 | | | | 214,804 | |
| | | | |
| | | | | | | | | | | | | | | 800,616 | |
| | | | | | | | | | | | | | | | |
| | | |
| Italy: 2.54% | | | | | | | | | | | | | |
Enel SpA (Energy, Oil, Gas & Consumable Fuels) | | | | | | | | | | | 82,382 | | | | 587,405 | |
ENI SpA (Energy, Oil, Gas & Consumable Fuels) | | | | | | | | | | | 25,680 | | | | 686,549 | |
Finmeccanica SpA (Industrials, Aerospace & Defense) | | | | | | | | | | | 13,877 | | | | 186,912 | |
Pirelli & Company SpA (Consumer Discretionary, Auto Components) | | | | | | | | | | | 9,975 | | | | 103,390 | |
Telecom Italia SpA (Telecommunication Services, Diversified Telecommunication Services) | | | | | | | | | | | 174,676 | | | | 263,120 | |
| | | | |
| | | | | | | | | | | | | | | 1,827,376 | |
| | | | | | | | | | | | | | | | |
| | | |
| Japan: 9.80% | | | | | | | | | | | | | |
Aeon Company Limited (Consumer Staples, Food & Staples Retailing) | | | | | | | | | | | 19,000 | | | | 228,145 | |
Aisin Seiki Company Limited (Consumer Discretionary, Auto Components) | | | | | | | | | | | 3,900 | | | | 136,980 | |
Asahi Glass Company Limited (Industrials, Building Products) | | | | | | | | | | | 11,000 | | | | 139,136 | |
Brother Industries Limited (Information Technology, Office Electronics) | | | | | | | | | | | 6,000 | | | | 91,426 | |
Canon Incorporated (Information Technology, Office Electronics) | | | | | | | | | | | 1,200 | | | | 56,216 | |
Central Japan Railway Company (Industrials, Road & Rail) | | | | | | | | | | | 28 | | | | 210,910 | |
Coca-Cola West Japan Company Limited (Consumer Staples, Beverages) | | | | | | | | | | | 10,000 | | | | 206,250 | |
Daito Trust Construction Company Limited (Financials, Real Estate Management & Development) | | | | | | | | | | | 2,900 | | | | 230,599 | |
Hitachi Limited (Information Technology, Electronic Equipment & Instruments) | | | | | | | | | | | 74,000 | | | | 399,581 | |
Itochu Corporation (Industrials, Trading Companies & Distributors) | | | | | | | | | | | 34,000 | | | | 351,674 | |
Itochu Techno-Science Corporation (Information Technology, IT Services) | | | | | | | | | | | 6,300 | | | | 220,576 | |
Japan Retail Fund Investment Corporation (Financials, Real Estate Investment Trusts (REITs)) | | | | | | | | | | | 60 | | | | 96,825 | |
| | | | |
| 30 | | Wells Fargo Advantage International Stock Funds | | Portfolio of Investments—April 30, 2011 (Unaudited) |
DISCIPLINED GLOBAL EQUITY FUND
| | | | | | | | | | | | | | | | |
| Security Name | | | | | | | | Shares | | | Value | |
| | | | | | | | | | | | | | | | |
| | | |
| Japan (continued) | | | | | | | | | | | | | |
JX Holdings Incorporated (Energy, Energy Equipment & Services) | | | | | | | | | | | 37,000 | | | $ | 256,352 | |
Kyushu Electric Power Company Incorporated (Utilities, Electric Utilities) | | | | | | | | | | | 6,400 | | | | 118,035 | |
Meiji Holdings Company Limited (Consumer Staples, Food Products) | | | | | | | | | | | 3,700 | | | | 157,825 | |
Millea Holdings Incorporated (Financials, Insurance) | | | | | | | | | | | 4,300 | | | | 119,222 | |
Mitsubishi Chemical Holdings Corporation (Materials, Chemicals) | | | | | | | | | | | 25,000 | | | | 168,588 | |
Mitsubishi UFJ Financial Group Incorporated (Financials, Commercial Banks) | | | | | | | | | | | 55,000 | | | | 262,405 | |
Mitsui & Company Limited (Industrials, Trading Companies & Distributors) | | | | | | | | | | | 28,000 | | | | 494,311 | |
Mizuho Financial Group Incorporated (Financials, Commercial Banks) | | | | | | | | | | | 156,000 | | | | 246,169 | |
Nippon Meat Packers Incorporated (Consumer Staples, Food Products) | | | | | | | | | | | 11,000 | | | | 151,612 | |
Nippon Telegraph & Telephone Corporation (Telecommunication Services, Diversified Telecommunication Services) | | | | | | | | | | | 9,700 | | | | 447,839 | |
Nissan Motor Company Limited (Consumer Discretionary, Automobiles) | | | | | | | | | | | 12,000 | | | | 114,504 | |
Obic Company Limited (Information Technology, IT Services) | | | | | | | | | | | 1,030 | | | | 191,105 | |
ORIX Corporation (Financials, Consumer Finance) | | | | | | | | | | | 1,900 | | | | 185,280 | |
Sega Sammy Holdings Incorporated (Consumer Discretionary, Leisure Equipment & Products) | | | | | | | | | | | 10,000 | | | | 172,594 | |
Seven & I Holdings Company Limited (Consumer Staples, Food & Staples Retailing) | | | | | | | | | | | 11,000 | | | | 274,339 | |
Sumitomo Corporation (Industrials, Trading Companies & Distributors) | | | | | | | | | | | 16,000 | | | | 218,357 | |
Sumitomo Mitsui Financial Group Incorporated (Financials, Commercial Banks) | | | | | | | | | | | 8,300 | | | | 255,298 | |
Takeda Pharmaceutical Company Limited (Health Care, Pharmaceuticals) | | | | | | | | | | | 10,700 | | | | 517,093 | |
Tonengeneral Sekiyu KK (Energy, Oil, Gas & Consumable Fuels) | | | | | | | | | | | 14,000 | | | | 173,285 | |
Tosoh Corporation (Materials, Chemicals) | | | | | | | | | | | 40,000 | | | | 153,856 | |
| | | | |
| | | | | | | | | | | | | | | 7,046,387 | |
| | | | | | | | | | | | | | | | |
| | | |
| Netherlands: 1.07% | | | | | | | | | | | | | |
ASML Holding NV (Information Technology, Semiconductors & Semiconductor Equipment) | | | | | | | | | | | 6,270 | | | | 260,794 | |
Delta Lloyd NV (Financials, Insurance) | | | | | | | | | | | 6,097 | | | | 160,473 | |
Koninklijke DSM NV (Materials, Chemicals) | | | | | | | | | | | 5,012 | | | | 345,565 | |
| | | | |
| | | | | | | | | | | | | | | 766,832 | |
| | | | | | | | | | | | | | | | |
| | | |
| New Zealand: 0.26% | | | | | | | | | | | | | |
Telecom Corporation of New Zealand Limited (Telecommunication Services, Diversified Telecommunication Services) | | | | | | | | | | | 105,017 | | | | 184,842 | |
| | | | | | | | | | | | | | | | |
| | | |
| Norway: 0.60% | | | | | | | | | | | | | |
Statoil ASA (Energy, Oil, Gas & Consumable Fuels) | | | | | | | | | | | 14,715 | | | | 430,517 | |
| | | | | | | | | | | | | | | | |
| | | |
| Portugal: 0.28% | | | | | | | | | | | | | |
Energias de Portugal SA (Utilities, Electric Utilities) | | | | | | | | | | | 48,724 | | | | 199,354 | |
| | | | | | | | | | | | | | | | |
| | | | |
| Singapore: 0.61% | | | | | | | | | | | | | | | | |
Avago Technologies Limited (Information Technology, Semiconductors & Semiconductor Equipment) | | | | | | | | | | | 7,171 | | | | 239,942 | |
United Overseas Land Limited (Financials, Real Estate Management & Development) | | | | | | | | | | | 50,000 | | | | 197,876 | |
| | | | |
| | | | | | | | | | | | | | | 437,818 | |
| | | | | | | | | | | | | | | | |
| | | |
| Spain: 0.82% | | | | | | | | | | | | | |
Banco Santander Central Hispano SA (Financials, Commercial Banks)« | | | | | | | | | | | 15,305 | | | | 195,452 | |
Repsol YPF SA (Energy, Oil, Gas & Consumable Fuels) | | | | | | | | | | | 10,984 | | | | 392,244 | |
| | | | |
| | | | | | | | | | | | | | | 587,696 | |
| | | | | | | | | | | | | | | | |
| | | |
| Sweden: 1.44% | | | | | | | | | | | | | |
Boliden AB (Materials, Metals & Mining)« | | | | | | | | | | | 11,456 | | | | 258,224 | |
| | | | | | |
| Portfolio of Investments—April 30, 2011 (Unaudited) | | Wells Fargo Advantage International Stock Funds | | | 31 | |
DISCIPLINED GLOBAL EQUITY FUND
| | | | | | | | | | | | | | | | |
| Security Name | | | | | | | | Shares | | | Value | |
| | | | | | | | | | | | | | | | |
| | | |
| Sweden (continued) | | | | | | | | | | | | | |
Kinnevik Investment AB (Financials, Diversified Financial Services) | | | | | | | | | | | 8,234 | | | $ | 212,580 | |
Nordea Bank AB (Financials, Commercial Banks) | | | | | | | | | | | 20,176 | | | | 230,227 | |
Svenska Cellulosa AB Class B (Materials, Paper & Forest Products) | | | | | | | | | | | 21,865 | | | | 335,079 | |
| | | | |
| | | | | | | | | | | | | | | 1,036,110 | |
| | | | | | | | | | | | | | | | |
| | | |
| Switzerland: 2.42% | | | | | | | | | | | | | |
ACE Limited (Financials, Insurance) | | | | | | | | | | | 3,932 | | | | 264,427 | |
Aryzta AG (Consumer Staples, Food Products) | | | | | | | | | | | 3,654 | | | | 203,610 | |
Lonza Group AG (Health Care, Life Sciences Tools & Services) | | | | | | | | | | | 2,240 | | | | 192,079 | |
Nestle SA (Consumer Staples, Food Products) | | | | | | | | | | | 4,027 | | | | 250,000 | |
Novartis AG (Health Care, Pharmaceuticals) | | | | | | | | | | | 10,980 | | | | 651,819 | |
Zurich Financial Services AG (Financials, Insurance) | | | | | | | | | | | 649 | | | | 182,320 | |
| | | | |
| | | | | | | | | | | | | | | 1,744,255 | |
| | | | | | | | | | | | | | | | |
| | | |
| United Kingdom: 9.30% | | | | | | | | | | | | | |
Associated British Foods plc (Consumer Staples, Food Products) | | | | | | | | | | | 10,364 | | | | 174,327 | |
AstraZeneca plc (Health Care, Pharmaceuticals) | | | | | | | | | | | 12,476 | | | | 623,095 | |
Aviva plc (Financials, Insurance) | | | | | | | | | | | 36,973 | | | | 275,934 | |
BAE Systems plc (Industrials, Aerospace & Defense) | | | | | | | | | | | 33,945 | | | | 185,919 | |
Barclays plc (Financials, Commercial Banks) | | | | | | | | | | | 70,548 | | | | 332,662 | |
BHP Billiton plc (Materials, Metals & Mining) | | | | | | | | | | | 24,102 | | | | 1,016,333 | |
BP plc (Energy, Oil, Gas & Consumable Fuels) | | | | | | | | | | | 27,516 | | | | 212,594 | |
BT Group plc (Telecommunication Services, Diversified Telecommunication Services) | | | | | | | | | | | 102,594 | | | | 335,538 | |
Home Retail Group (Consumer Discretionary, Internet & Catalog Retail) | | | | | | | | | | | 52,700 | | | | 193,572 | |
HSBC Holdings plc (Financials, Commercial Banks) | | | | | | | | | | | 43,284 | | | | 473,850 | |
Imperial Tobacco Group plc (Consumer Staples, Tobacco) | | | | | | | | | | | 17,305 | | | | 609,037 | |
Old Mutual plc (Financials, Insurance) | | | | | | | | | | | 123,488 | | | | 286,713 | |
Rio Tinto plc (Materials, Metals & Mining) | | | | | | | | | | | 4,841 | | | | 352,557 | |
Royal Dutch Shell plc Class B (Energy, Oil, Gas & Consumable Fuels) | | | | | | | | | | | 20,447 | | | | 794,755 | |
Vodafone Group plc (Telecommunication Services, Wireless Telecommunication Services) | | | | | | | | | | | 285,729 | | | | 818,991 | |
| | | | |
| | | | | | | | | | | | | | | 6,685,877 | |
| | | | | | | | | | | | | | | | |
| | | |
| United States: 47.45% | | | | | | | | | | | | | |
Aetna Incorporated (Health Care, Health Care Providers & Services)« | | | | | | | | | | | 4,399 | | | | 182,031 | |
Ameriprise Financial Incorporated (Financials, Capital Markets) | | | | | | | | | | | 4,269 | | | | 264,934 | |
Annaly Capital Management Incorporated (Financials, Real Estate Investment Trusts (REITs))« | | | | | | | | | | | 5,790 | | | | 103,294 | |
Apple Incorporated (Information Technology, Computers & Peripherals)†« | | | | | | | | | | | 1,948 | | | | 678,352 | |
Applied Materials Incorporated (Information Technology, Semiconductors & Semiconductor Equipment) | | | | | | | | | | | 16,325 | | | | 256,139 | |
Archer Daniels Midland Company (Consumer Staples, Food Products) | | | | | | | | | | | 5,995 | | | | 221,935 | |
Arrow Electronics Incorporated (Information Technology, Electronic Equipment & Instruments)† | | | | | | | | | | | 6,625 | | | | 302,034 | |
Assurant Incorporated (Financials, Insurance) | | | | | | | | | | | 4,742 | | | | 188,257 | |
AT&T Incorporated (Telecommunication Services, Diversified Telecommunication Services) | | | | | | | | | | | 21,072 | | | | 655,761 | |
AutoZone Incorporated (Consumer Discretionary, Specialty Retail)† | | | | | | | | | | | 1,002 | | | | 282,945 | |
Bank of America Corporation (Financials, Diversified Financial Services) | | | | | | | | | | | 13,334 | | | | 163,742 | |
Biogen Idec Incorporated (Health Care, Biotechnology)Ǡ | | | | | | | | | | | 3,864 | | | | 376,160 | |
Capital One Financial Corporation (Financials, Consumer Finance) | | | | | | | | | | | 6,263 | | | | 342,774 | |
Cephalon Incorporated (Health Care, Biotechnology)Ǡ | | | | | | | | | | | 3,155 | | | | 242,304 | |
Chevron Corporation (Energy, Oil, Gas & Consumable Fuels) | | | | | | | | | | | 9,555 | | | | 1,045,699 | |
Chubb Corporation (Financials, Insurance)« | | | | | | | | | | | 502 | | | | 32,725 | |
Citigroup Incorporated (Financials, Diversified Financial Services) | | | | | | | | | | | 68,085 | | | | 312,510 | |
| | | | |
| 32 | | Wells Fargo Advantage International Stock Funds | | Portfolio of Investments—April 30, 2011 (Unaudited) |
DISCIPLINED GLOBAL EQUITY FUND
| | | | | | | | | | | | | | | | |
| Security Name | | | | | | | | Shares | | | Value | |
| | | | | | | | | | | | | | | | |
| | | |
| United States (continued) | | | | | | | | | | | | | |
Coca-Cola Enterprises Incorporated (Consumer Staples, Beverages) | | | | | | | | | | | 8,142 | | | $ | 231,314 | |
Comcast Corporation Class A (Consumer Discretionary, Media) | | | | | | | | | | | 10,716 | | | | 281,188 | |
Computer Sciences Corporation (Information Technology, IT Services) | | | | | | | | | | | 5,207 | | | | 265,453 | |
ConocoPhillips (Energy, Oil, Gas & Consumable Fuels) | | | | | | | | | | | 7,716 | | | | 609,024 | |
Constellation Brands Incorporated Class A (Consumer Staples, Beverages)† | | | | | | | | | | | 7,317 | | | | 163,828 | |
CSX Corporation (Industrials, Road & Rail) | | | | | | | | | | | 6,793 | | | | 534,541 | |
CVS Caremark Corporation (Consumer Staples, Food & Staples Retailing) | | | | | | | | | | | 14,575 | | | | 528,198 | |
Darden Restaurants Incorporated (Consumer Discretionary, Hotels, Restaurants & Leisure)« | | | | | | | | | | | 1,673 | | | | 78,581 | |
Deere & Company (Industrials, Machinery) | | | | | | | | | | | 4,373 | | | | 426,368 | |
Dell Incorporated (Information Technology, Computers & Peripherals)† | | | | | | | | | | | 30,865 | | | | 478,716 | |
Devon Energy Corporation (Energy, Oil, Gas & Consumable Fuels) | | | | | | | | | | | 4,297 | | | | 389,531 | |
Discover Financial Services (Financials, Consumer Finance) | | | | | | | | | | | 8,462 | | | | 210,196 | |
Dish Network Corporation (Consumer Discretionary, Media)Ǡ | | | | | | | | | | | 9,194 | | | | 230,218 | |
E.I. du Pont de Nemours & Company (Materials, Chemicals) | | | | | | | | | | | 3,430 | | | | 194,790 | |
Eaton Corporation (Industrials, Machinery) | | | | | | | | | | | 385 | | | | 20,609 | |
Eli Lilly & Company (Health Care, Pharmaceuticals) | | | | | | | | | | | 13,263 | | | | 490,864 | |
Energizer Holdings Incorporated (Consumer Staples, Household Products)† | | | | | | | | | | | 2,245 | | | | 169,565 | |
Entergy Corporation (Utilities, Electric Utilities) | | | | | | | | | | | 1,590 | | | | 110,655 | |
Exxon Mobil Corporation (Energy, Oil, Gas & Consumable Fuels) | | | | | | | | | | | 12,410 | | | | 1,092,080 | |
FedEx Corporation (Industrials, Air Freight & Logistics) | | | | | | | | | | | 4,005 | | | | 383,158 | |
Fifth Third Bancorp (Financials, Commercial Banks) | | | | | | | | | | | 7,190 | | | | 95,411 | |
FirstEnergy Corporation (Utilities, Electric Utilities) | | | | | | | | | | | 3,299 | | | | 131,828 | |
Ford Motor Company (Consumer Discretionary, Automobiles)† | | | | | | | | | | | 35,207 | | | | 544,652 | |
Forest Laboratories Incorporated (Health Care, Pharmaceuticals)† | | | | | | | | | | | 991 | | | | 32,862 | |
Freeport-McMoRan Copper & Gold Incorporated Class B (Materials, Metals & Mining) | | | | | | | | | | | 8,942 | | | | 492,078 | |
GameStop Corporation Class A (Consumer Discretionary, Specialty Retail)Ǡ | | | | | | | | | | | 4,786 | | | | 122,904 | |
Gannett Company Incorporated (Consumer Discretionary, Media) | | | | | | | | | | | 8,735 | | | | 131,549 | |
General Dynamics Corporation (Industrials, Aerospace & Defense)« | | | | | | | | | | | 3,967 | | | | 288,877 | |
General Electric Company (Industrials, Industrial Conglomerates) | | | | | | | | | | | 24,254 | | | | 495,994 | |
Goldman Sachs Group Incorporated (Financials, Capital Markets) | | | | | | | | | | | 2,053 | | | | 310,024 | |
Google Incorporated Class A (Information Technology, Internet Software & Services)† | | | | | | | | | | | 385 | | | | 209,479 | |
Hartford Financial Services Group Incorporated (Financials, Insurance) | | | | | | | | | | | 5,266 | | | | 152,556 | |
Hess Corporation (Energy, Oil, Gas & Consumable Fuels) | | | | | | | | | | | 3,342 | | | | 287,278 | |
Hewlett-Packard Company (Information Technology, Computers & Peripherals) | | | | | | | | | | | 16,290 | | | | 657,627 | |
Hormel Foods Corporation (Consumer Staples, Food Products) | | | | | | | | | | | 6,130 | | | | 180,283 | |
Humana Incorporated (Health Care, Health Care Providers & Services)« | | | | | | | | | | | 5,020 | | | | 382,122 | |
Huntington Ingalls Industries Incorporated (Industrials, Aerospace & Defense)† | | | | | | | | | | | 87 | | | | 3,467 | |
Intel Corporation (Information Technology, Semiconductors & Semiconductor Equipment) | | | | | | | | | | | 29,897 | | | | 693,311 | |
International Business Machines Corporation (Information Technology, IT Services) | | | | | | | | | | | 6,440 | | | | 1,098,535 | |
International Paper Company (Materials, Paper & Forest Products) | | | | | | | | | | | 10,780 | | | | 332,886 | |
Jabil Circuit Incorporated (Information Technology, Electronic Equipment & Instruments) | | | | | | | | | | | 9,433 | | | | 187,151 | |
Johnson & Johnson (Health Care, Pharmaceuticals) | | | | | | | | | | | 3,884 | | | | 255,256 | |
JPMorgan Chase & Company (Financials, Diversified Financial Services) | | | | | | | | | | | 15,313 | | | | 698,732 | |
KBR Incorporated (Industrials, Construction & Engineering) | | | | | | | | | | | 4,333 | | | | 166,257 | |
KeyCorp (Financials, Commercial Banks) | | | | | | | | | | | 26,024 | | | | 225,628 | |
Kroger Company (Consumer Staples, Food & Staples Retailing) | | | | | | | | | | | 10,831 | | | | 263,302 | |
L-3 Communications Holdings Incorporated (Industrials, Aerospace & Defense) | | | | | | | | | | | 2,869 | | | | 230,065 | |
Lexmark International Incorporated (Information Technology, Computers & Peripherals)† | | | | | | | | | | | 2,812 | | | | 90,687 | |
Lockheed Martin Corporation (Industrials, Aerospace & Defense) | | | | | | | | | | | 3,240 | | | | 256,770 | |
Lorillard Incorporated (Consumer Staples, Tobacco) | | | | | | | | | | | 1,976 | | | | 210,444 | |
Lubrizol Corporation (Materials, Chemicals) | | | | | | | | | | | 2,514 | | | | 338,183 | |
| | | | | | |
| Portfolio of Investments—April 30, 2011 (Unaudited) | | Wells Fargo Advantage International Stock Funds | | | 33 | |
DISCIPLINED GLOBAL EQUITY FUND
| | | | | | | | | | | | | | | | |
| Security Name | | | | | | | | Shares | | | Value | |
| | | | | | | | | | | | | | | | |
| | | |
| United States (continued) | | | | | | | | | | | | | |
Macy’s Incorporated (Consumer Discretionary, Multiline Retail) | | | | | | | | | | | 13,071 | | | $ | 312,528 | |
Marathon Oil Corporation (Energy, Oil, Gas & Consumable Fuels) | | | | | | | | | | | 10,335 | | | | 558,503 | |
McDonald’s Corporation (Consumer Discretionary, Hotels, Restaurants & Leisure) | | | | | | | | | | | 1,666 | | | | 130,464 | |
McKesson Corporation (Health Care, Health Care Providers & Services) | | | | | | | | | | | 3,369 | | | | 279,661 | |
Merck & Company Incorporated (Health Care, Pharmaceuticals) | | | | | | | | | | | 19,494 | | | | 700,809 | |
Microsoft Corporation (Information Technology, Software) | | | | | | | | | | | 36,062 | | | | 938,333 | |
National Oilwell Varco Incorporated (Energy, Energy Equipment & Services) | | | | | | | | | | | 1,182 | | | | 90,648 | |
Nisource Incorporated (Utilities, Multi-Utilities)« | | | | | | | | | | | 8,712 | | | | 169,448 | |
Northrop Grumman Corporation (Industrials, Aerospace & Defense) | | | | | | | | | | | 5,836 | | | | 371,228 | |
Oracle Corporation (Information Technology, Software) | | | | | | | | | | | 22,968 | | | | 827,996 | |
Parker Hannifin Corporation (Industrials, Machinery) | | | | | | | | | | | 2,079 | | | | 196,091 | |
Pepco Holdings Incorporated (Utilities, Electric Utilities) | | | | | | | | | | | 9,611 | | | | 185,204 | |
Pfizer Incorporated (Health Care, Pharmaceuticals) | | | | | | | | | | | 14,784 | | | | 309,873 | |
Philip Morris International (Consumer Staples, Tobacco) | | | | | | | | | | | 7,528 | | | | 522,744 | |
PNC Financial Services Group Incorporated (Financials, Commercial Banks) | | | | | | | | | | | 4,997 | | | | 311,513 | |
PPG Industries Incorporated (Materials, Chemicals) | | | | | | | | | | | 2,412 | | | | 227,704 | |
Procter & Gamble Company (Consumer Staples, Household Products) | | | | | | | | | | | 3,022 | | | | 196,128 | |
Prudential Financial Incorporated (Financials, Insurance) | | | | | | | | | | | 4,675 | | | | 296,489 | |
Raytheon Company (Industrials, Aerospace & Defense) | | | | | | | | | | | 5,254 | | | | 255,827 | |
Ross Stores Incorporated (Consumer Discretionary, Specialty Retail)« | | | | | | | | | | | 3,213 | | | | 236,766 | |
RR Donnelley & Sons Company (Industrials, Commercial Services & Supplies)« | | | | | | | | | | | 9,380 | | | | 176,907 | |
Ryder System Incorporated (Industrials, Road & Rail) | | | | | | | | | | | 3,689 | | | | 197,362 | |
Simon Property Group Incorporated (Financials, Real Estate Investment Trusts (REITs)) | | | | | | | | | | | 1,283 | | | | 146,955 | |
SLM Corporation (Financials, Consumer Finance) | | | | | | | | | | | 17,357 | | | | 287,953 | |
Synthes Incorporated (Health Care, Health Care Equipment & Supplies)† | | | | | | | | | | | 1,703 | | | | 293,349 | |
Target Corporation (Consumer Discretionary, Multiline Retail) | | | | | | | | | | | 5,151 | | | | 252,914 | |
The Travelers Companies Incorporated (Financials, Insurance) | | | | | | | | | | | 4,532 | | | | 286,785 | |
Thermo Fisher Scientific Incorporated (Health Care, Life Sciences Tools & Services)† | | | | | | | | | | | 3,918 | | | | 235,041 | |
Time Warner Incorporated (Consumer Discretionary, Media)« | | | | | | | | | | | 4,331 | | | | 163,972 | |
TJX Companies Incorporated (Consumer Discretionary, Specialty Retail)« | | | | | | | | | | | 4,276 | | | | 229,279 | |
Tyson Foods Incorporated Class A (Consumer Staples, Food Products) | | | | | | | | | | | 10,148 | | | | 201,945 | |
UnitedHealth Group Incorporated (Health Care, Health Care Providers & Services) | | | | | | | | | | | 11,723 | | | | 577,123 | |
US Bancorp (Financials, Commercial Banks) | | | | | | | | | | | 5,074 | | | | 131,011 | |
Valero Energy Corporation (Energy, Oil, Gas & Consumable Fuels) | | | | | | | | | | | 11,431 | | | | 323,497 | |
Verizon Communications Incorporated (Telecommunication Services, Diversified Telecommunication Services) | | | | | | | | | | | 5,545 | | | | 209,490 | |
Wal-Mart Stores Incorporated (Consumer Staples, Food & Staples Retailing) | | | | | | | | | | | 12,510 | | | | 687,800 | |
WellPoint Incorporated (Health Care, Health Care Providers & Services) | | | | | | | | | | | 5,273 | | | | 404,913 | |
Whirlpool Corporation (Consumer Discretionary, Household Durables) | | | | | | | | | | | 1,003 | | | | 86,443 | |
| | | | |
| | | | | | | | | | | | | | | 34,117,367 | |
| | | | | | | | | | | | | | | | |
| | | | |
Total Common Stocks (Cost $56,737,379) | | | | | | | | | | | | | | | 70,359,772 | |
| | | | | | | | | | | | | | | | |
| | | | |
| | | Dividend Yield | | | | | | | | | | |
| | | | |
Preferred Stocks: 1.09% | | | | | | | | | | | | | | | | |
| | | | |
| Germany: 1.09% | | | | | | | | | | | | | | | | |
Henkel KGaA (Materials,Chemicals)± | | | 1.49 | % | | | | | | | 2,877 | | | | 195,933 | |
| | | | |
| 34 | | Wells Fargo Advantage International Stock Funds | | Portfolio of Investments—April 30, 2011 (Unaudited) |
DISCIPLINED GLOBAL EQUITY FUND
| | | | | | | | | | | | | | | | |
| Security Name | | Dividend Yield | | | | | | Shares | | | Value | |
| | | | | | | | | | | | | | | | |
| | | | |
| Germany (continued) | | | | | | | | | | | | | | | | |
Volkswagen AG (Consumer Discretionary, Automobiles)±« | | | 1.81 | % | | | | | | | 2,978 | | | $ | 586,645 | |
| | | | |
Total Preferred Stocks (Cost $548,722) | | | | | | | | | | | | | | | 782,578 | |
| | | | | | | | | | | | | | | | |
| | | | |
| | | Yield | | | | | | | | | | |
| | | | |
Short-Term Investments: 13.00% | | | | | | | | | | | | | | | | |
| | | | |
| Investment Companies: 12.86% | | | | | | | | | | | | | | | | |
Wells Fargo Advantage Cash Investment Money Market Fund (l)(u) | | | 0.09 | % | | | | | | | 413,618 | | | | 413,618 | |
Wells Fargo Securities Lending Cash Investments, LLC(l)(u)(v) | | | 0.20 | | | | | | | | 8,836,096 | | | | 8,836,096 | |
| | | | |
| | | | | | | | | | | | | | | 9,249,714 | |
| | | | | | | | | | | | | | | | |
| | | | |
| | | Yield | | | Maturity Date | | | Principal | | | | |
| | | | |
| US Treasury Bills: 0.14% | | | | | | | | | | | | | | | | |
US Treasury Bill#^ | | | 0.02 | % | | | 07/07/2011 | | | $ | 100,000 | | | | 99,995 | |
| | | | | | | | | | | | | | | | |
| | | | |
Total Short-Term Investments (Cost $9,349,698) | | | | | | | | | | | | | | | 9,349,709 | |
| | | | | | | | | | | | | | | | |
| | | | | | | | |
| Total Investments in Securities | | | | | | | | |
| (Cost $66,635,799)* | | | 111.95 | % | | | 80,492,059 | |
Other Assets and Liabilities, Net | | | (11.95 | ) | | | (8,589,816 | ) |
| | | | | | | | |
Total Net Assets | | | 100.00 | % | | $ | 71,902,243 | |
| | | | | | | | |
| # | All or a portion of this security is segregated as collateral for futures transactions. |
| « | All or a portion of this security is on loan. |
| ^ | Zero coupon security. Rate represents yield to maturity. |
| ± | Variable rate investments. |
| (l) | Investment in an affiliate. |
| (u) | Rate shown is the 7-day annualized yield at period end. |
| (v) | Security represents investment of cash collateral received from securities on loan. |
| † | Non-income earning securities. |
| * | Cost for federal income tax purposes is $66,690,991 and net unrealized appreciation (depreciation) consists of: |
| | | | |
Gross unrealized appreciation | | $ | 15,257,315 | |
Gross unrealized depreciation | | | (1,456,247 | ) |
| | | | |
Net unrealized appreciation | | $ | 13,801,068 | |
The accompanying notes are an integral part of these financial statements.
| | | | | | |
| Portfolio of Investments—April 30, 2011 (Unaudited) | | Wells Fargo Advantage International Stock Funds | | | 35 | |
DIVERSIFIED INTERNATIONAL FUND
| | | | | | | | | | | | | | | | |
| Security Name | | | | | | | | Shares | | | Value | |
| | | | | | | | | | | | | | | | |
| | | | |
Common Stocks: 95.29% | | | | | | | | | | | | | | | | |
| | | | |
| Argentina: 0.17% | | | | | | | | | | | | | | | | |
Irsa Inversiones y Representaciones SA ADR (Financials, Real Estate Management & Development) | | | | | | | | | | | 74,840 | | | $ | 948,223 | |
| | | | | | | | | | | | | | | | |
| | | | |
| Australia: 3.58% | | | | | | | | | | | | | | | | |
AMP Limited (Financials, Insurance) | | | | | | | | | | | 119,232 | | | | 716,182 | |
Asciano Group (Industrials, Road & Rail) | | | | | | | | | | | 1,170,944 | | | | 2,117,727 | |
Bendigo Bank Limited (Financials, Commercial Banks) | | | | | | | | | | | 160,200 | | | | 1,640,058 | |
BlueScope Steel Limited (Industrials, Professional Services) | | | | | | | | | | | 166,200 | | | | 315,157 | |
Challenger Financial Services Group Limited (Financials, Diversified Financial Services) | | | | | | | | | | | 209,000 | | | | 1,104,189 | |
Coca-Cola Amatil Limited (Consumer Staples, Beverages) | | | | | | | | | | | 25,462 | | | | 333,232 | |
Commonwealth Bank of Australia (Financials, Commercial Banks) | | | | | | | | | | | 22,914 | | | | 1,348,982 | |
Downer EDI Limited (Industrials, Commercial Services & Supplies) | | | | | | | | | | | 199,250 | | | | 808,072 | |
Foster’s Group Limited (Consumer Staples, Beverages) | | | | | | | | | | | 459,195 | | | | 2,828,677 | |
Goodman Fielder Limited (Consumer Staples, Food Products) | | | | | | | | | | | 739,500 | | | | 871,358 | |
Grain Corporation Limited (Consumer Staples, Food Products) | | | | | | | | | | | 101,500 | | | | 870,007 | |
Macquarie Group Limited (Financials, Capital Markets) | | | | | | | | | | | 20,402 | | | | 786,270 | |
Metcash Limited (Consumer Staples, Food & Staples Retailing) | | | | | | | | | | | 202,900 | | | | 902,938 | |
Newcrest Mining Limited (Materials, Metals & Mining) | | | | | | | | | | | 37,574 | | | | 1,707,112 | |
OneSteel Limited (Materials, Metals & Mining) | | | | | | | | | | | 426,000 | | | | 994,579 | |
Perilya Limited (Industrials, Professional Services) | | | | | | | | | | | 397,900 | | | | 270,406 | |
Telstra Corporation Limited (Telecommunication Services, Diversified Telecommunication Services) | | | | | | | | | | | 402,500 | | | | 1,283,834 | |
Westpac Banking Corporation (Financials, Commercial Banks) | | | | | | | | | | | 44,818 | | | | 1,220,265 | |
| | | | |
| | | | | | | | | | | | | | | 20,119,045 | |
| | | | | | | | | | | | | | | | |
| | | | |
| Austria: 0.44% | | | | | | | | | | | | | | | | |
OMV AG (Energy, Oil, Gas & Consumable Fuels) | | | | | | | | | | | 38,100 | | | | 1,737,536 | |
Voestalpine AG (Materials, Metals & Mining) | | | | | | | | | | | 14,300 | | | | 703,720 | |
| | | | |
| | | | | | | | | | | | | | | 2,441,256 | |
| | | | | | | | | | | | | | | | |
| | | | |
| Belgium: 1.57% | | | | | | | | | | | | | | | | |
Anheuser-Busch InBev NV (Consumer Staples, Beverages)« | | | | | | | | | | | 82,536 | | | | 5,262,785 | |
Delhaize Group (Consumer Staples, Food & Staples Retailing) | | | | | | | | | | | 19,500 | | | | 1,688,467 | |
Dexia (Financials, Commercial Banks)† | | | | | | | | | | | 10,895 | | | | 43,409 | |
KBC Groep NV (Financials, Commercial Banks) | | | | | | | | | | | 27,900 | | | | 1,137,239 | |
Tessenderlo Chemie NV (Materials, Chemicals)† | | | | | | | | | | | 16,800 | | | | 668,864 | |
| | | | |
| | | | | | | | | | | | | | | 8,800,764 | |
| | | | | | | | | | | | | | | | |
| | | | |
| Brazil: 0.88% | | | | | | | | | | | | | | | | |
Banco Bradesco SA ADR (Financials, Commercial Banks) | | | | | | | | | | | 38,746 | | | | 783,832 | |
Banco do Brasil SA (Financials, Commercial Banks) | | | | | | | | | | | 63,900 | | | | 1,177,511 | |
Cia Saneamento Basico de Sau Paulo (Utilities, Water Utilities) | | | | | | | | | | | 36,800 | | | | 1,065,965 | |
Petroleo Brasileiro SA ADR (Energy, Oil, Gas & Consumable Fuels) | | | | | | | | | | | 51,540 | | | | 1,923,988 | |
| | | | |
| | | | | | | | | | | | | | | 4,951,296 | |
| | | | | | | | | | | | | | | | |
| | | | |
| Canada: 2.96% | | | | | | | | | | | | | | | | |
Brookfield Asset Management Incorporated (Financials, Real Estate Management & Development) | | | | | | | | | | | 69,669 | | | | 2,342,272 | |
Canadian National Railway Company (Industrials, Road & Rail)« | | | | | | | | | | | 12,223 | | | | 946,427 | |
Canadian Natural Resources Limited (Energy, Oil, Gas & Consumable Fuels) | | | | | | | | | | | 46,721 | | | | 2,197,909 | |
Canadian Pacific Railway Limited (Industrials, Road & Rail) | | | | | | | | | | | 76,765 | | | | 5,084,914 | |
EnCana Corporation (Energy, Oil, Gas & Consumable Fuels) | | | | | | | | | | | 20,392 | | | | 685,157 | |
| | | | |
| 36 | | Wells Fargo Advantage International Stock Funds | | Portfolio of Investments—April 30, 2011 (Unaudited) |
DIVERSIFIED INTERNATIONAL FUND
| | | | | | | | | | | | | | | | |
| Security Name | | | | | | | | Shares | | | Value | |
| | | | | | | | | | | | | | | | |
| | | | |
| Canada (continued) | | | | | | | | | | | | | | | | |
Goldcorp Incorporated (Materials, Metals & Mining) | | | | | | | | | | | 18,627 | | | $ | 1,041,254 | |
Metro Incorporated (Consumer Staples, Food & Staples Retailing) | | | | | | | | | | | 25,000 | | | | 1,223,379 | |
Suncor Energy Incorporated (Energy, Oil, Gas & Consumable Fuels) | | | | | | | | | | | 32,415 | | | | 1,494,074 | |
Teck Cominco Incorporated Limited (Materials, Metals & Mining) | | | | | | | | | | | 29,432 | | | | 1,599,839 | |
| | | | |
| | | | | | | | | | | | | | | 16,615,225 | |
| | | | | | | | | | | | | | | | |
| | | | |
| China: 3.97% | | | | | | | | | | | | | | | | |
Baidu.com Incorporated ADR (Information Technology, Internet Software & Services)† | | | | | | | | | | | 35,685 | | | | 5,299,936 | |
China Construction Bank (Financials, Commercial Banks) | | | | | | | | | | | 2,120,400 | | | | 2,007,178 | |
China Infrastructure Machinery Holdings Limited (Industrials, Machinery) | | | | | | | | | | | 1,097,000 | | | | 814,665 | |
China Mobile Limited ADR (Telecommunication Services, Wireless Telecommunication Services) | | | | | | | | | | | 13,191 | | | | 607,973 | |
China Petroleum & Chemical Corporation (Energy, Oil, Gas & Consumable Fuels) | | | | | | | | | | | 2,102,000 | | | | 2,105,563 | |
China Railway Construction Corporation (Industrials, Construction & Engineering) | | | | | | | | | | | 480,000 | | | | 426,725 | |
Ctrip.com International Limited ADR (Consumer Discretionary, Specialty Retail)†« | | | | | | | | | | | 48,427 | | | | 2,359,363 | |
E-Commerce China Dangdang Incorporated ADR (Consumer Discretionary, Internet & Catalog Retail)†« | | | | | | | | | | | 1,867 | | | | 42,960 | |
Netease.com Incorporated ADR (Information Technology, Internet Software & Services)† | | | | | | | | | | | 18,036 | | | | 888,814 | |
Shanghai Electric Group company Limited (Industrials, Electrical Equipment) | | | | | | | | | | | 2,002,000 | | | | 998,244 | |
SINA Corporation (Information Technology, Internet Software & Services)†« | | | | | | | | | | | 31,801 | | | | 4,285,185 | |
Sinopharm Group Company Limited (Health Care, Health Care Providers & Services) | | | | | | | | | | | 53,200 | | | | 184,646 | |
Tencent Holdings Limited (Information Technology, Internet Software & Services) | | | | | | | | | | | 53,700 | | | | 1,534,436 | |
ZTE Corporation (Telecommunication Services, Wireless Telecommunication Services) | | | | | | | | | | | 198,240 | | | | 714,975 | |
| | | | |
| | | | | | | | | | | | | | | 22,270,663 | |
| | | | | | | | | | | | | | | | |
| | | | |
| Denmark: 0.55% | | | | | | | | | | | | | | | | |
Carlsberg A/S (Consumer Staples, Beverages) | | | | | | | | | | | 11,426 | | | | 1,357,023 | |
Danske Bank A/S (Financials, Commercial Banks) | | | | | | | | | | | 16,000 | | | | 384,501 | |
H. Lundbeck A/S (Health Care, Pharmaceuticals) | | | | | | | | | | | 55,400 | | | | 1,330,234 | |
| | | | |
| | | | | | | | | | | | | | | 3,071,758 | |
| | | | | | | | | | | | | | | | |
| | | | |
| Finland: 0.36% | | | | | | | | | | | | | | | | |
Nokia Oyj (Telecommunication Services, Diversified Telecommunication Services) | | | | | | | | | | | 134,400 | | | | 1,238,194 | |
TietoEnator Oyj (Information Technology, IT Services) | | | | | | | | | | | 43,100 | | | | 794,778 | |
| | | | |
| | | | | | | | | | | | | | | 2,032,972 | |
| | | | | | | | | | | | | | | | |
| | | | |
| France: 10.07% | | | | | | | | | | | | | | | | |
Alstom SA (Industrials, Machinery) | | | | | | | | | | | 19,067 | | | | 1,267,884 | |
Arkema (Industrials, Professional Services) | | | | | | | | | | | 910 | | | | 94,821 | |
AXA SA (Financials, Insurance) | | | | | | | | | | | 26,100 | | | | 585,669 | |
BNP Paribas SA (Financials, Commercial Banks) | | | | | | | | | | | 71,783 | | | | 5,680,752 | |
Carrefour SA (Consumer Staples, Food & Staples Retailing) | | | | | | | | | | | 19,995 | | | | 947,995 | |
Casino Guichard Perrachon SA (Consumer Discretionary, Hotels, Restaurants & Leisure) | | | | | | | | | | | 10,600 | | | | 1,115,813 | |
Compagnie de Saint-Gobain (Industrials, Building Products) | | | | | | | | | | | 34,965 | | | | 2,415,153 | |
Credit Agricole SA (Financials, Commercial Banks) | | | | | | | | | | | 105,300 | | | | 1,753,048 | |
France Telecom SA (Telecommunication Services, Diversified Telecommunication Services) | | | | | | | | | | | 107,050 | | | | 2,510,752 | |
Groupe Danone (Consumer Staples, Food Products) | | | | | | | | | | | 23,400 | | | | 1,714,056 | |
LVMH Moet Hennessy Louis Vuitton SA (Consumer Discretionary, Textiles, Apparel & Luxury Goods) | | | | | | | | | | | 12,852 | | | | 2,308,084 | |
Natixis (Financials, Commercial Banks) | | | | | | | | | | | 262,706 | | | | 1,510,513 | |
Pernod-Ricard (Consumer Staples, Beverages) | | | | | | | | | | | 61,518 | | | | 6,183,227 | |
Peugeot SA (Consumer Discretionary, Automobiles) | | | | | | | | | | | 20,473 | | | | 929,721 | |
Pinault-Printempts-Redoute SA (Consumer Discretionary, Multiline Retail) | | | | | | | | | | | 10,130 | | | | 1,811,739 | |
| | | | | | |
| Portfolio of Investments—April 30, 2011 (Unaudited) | | Wells Fargo Advantage International Stock Funds | | | 37 | |
DIVERSIFIED INTERNATIONAL FUND
| | | | | | | | | | | | | | | | |
| Security Name | | | | | | | | Shares | | | Value | |
| | | | | | | | | | | | | | | | |
| | | | |
| France (continued) | | | | | | | | | | | | | | | | |
Publicis Groupe (Consumer Discretionary, Media) | | | | | | | | | | | 41,340 | | | $ | 2,342,688 | |
Rallye SA (Consumer Staples, Food & Staples Retailing)† | | | | | | | | | | | 17,551 | | | | 923,236 | |
Sanofi-Aventis SA (Health Care, Pharmaceuticals) | | | | | | | | | | | 58,085 | | | | 4,594,142 | |
Schneider Electric SA (Industrials, Electrical Equipment) | | | | | | | | | | | 2,663 | | | | 470,555 | |
SCOR SE (Financials, Insurance) | | | | | | | | | | | 50,500 | | | | 1,542,710 | |
Societe Generale (Financials, Commercial Banks) | | | | | | | | | | | 6,800 | | | | 454,843 | |
Technip SA (Energy, Energy Equipment & Services) | | | | | | | | | | | 16,503 | | | | 1,861,611 | |
Thales SA (Industrials, Aerospace & Defense) | | | | | | | | | | | 15,000 | | | | 662,630 | |
Total SA (Energy, Oil, Gas & Consumable Fuels) | | | | | | | | | | | 64,063 | | | | 4,101,012 | |
Unibail-Rodamco (Financials, Real Estate Management & Development) | | | | | | | | | | | 15,550 | | | | 3,637,886 | |
Vinci SA (Industrials, Construction & Engineering) | | | | | | | | | | | 43,317 | | | | 2,893,570 | |
Vivendi SA (Consumer Discretionary, Media) | | | | | | | | | | | 71,400 | | | | 2,240,401 | |
| | | | |
| | | | | | | | | | | | | | | 56,554,511 | |
| | | | | | | | | | | | | | | | |
| | | | |
| Germany: 10.45% | | | | | | | | | | | | | | | | |
Allianz AG (Financials, Insurance) | | | | | | | | | | | 31,605 | | | | 4,976,089 | |
BASF SE (Materials, Chemicals)« | | | | | | | | | | | 63,392 | | | | 6,516,180 | |
Bayer AG (Health Care, Pharmaceuticals)« | | | | | | | | | | | 93,875 | | | | 8,252,201 | |
Beiersdorf AG (Consumer Staples, Personal Products)« | | | | | | | | | | | 27,942 | | | | 1,819,755 | |
Brenntag AG (Materials, Chemicals) | | | | | | | | | | | 11,346 | | | | 1,394,826 | |
Daimler AG (Consumer Discretionary, Automobiles) | | | | | | | | | | | 94,014 | | | | 7,267,398 | |
Deutsche Bank AG (Financials, Capital Markets) | | | | | | | | | | | 23,800 | | | | 1,554,586 | |
Deutsche Boerse AG (Financials, Diversified Financial Services) | | | | | | | | | | | 10,063 | | | | 836,160 | |
E.ON AG (Utilities, Electric Utilities) | | | | | | | | | | | 26,500 | | | | 905,901 | |
Fresenius SE & Company KGa (Health Care, Health Care Equipment & Supplies) | | | | | | | | | | | 24,722 | | | | 2,594,680 | |
Hannover Rueckversicherung AG (Financials, Insurance) | | | | | | | | | | | 15,800 | | | | 955,511 | |
Heidelberger Druckmaschinen AG (Industrials, Professional Services) | | | | | | | | | | | 17,000 | | | | 75,866 | |
Hochtief AG (Industrials, Construction & Engineering) | | | | | | | | | | | 10,533 | | | | 997,369 | |
Linde AG (Materials, Chemicals)« | | | | | | | | | | | 23,861 | | | | 4,297,554 | |
Metro AG (Consumer Staples, Food & Staples Retailing) | | | | | | | | | | | 20,283 | | | | 1,488,740 | |
Muenchener Rueckversicherungs-Gesellschaft AG (Financials, Insurance) | | | | | | | | | | | 17,624 | | | | 2,909,268 | |
Norddeutsche Affinerie AG (Materials, Metals & Mining) | | | | | | | | | | | 11,400 | | | | 673,716 | |
RWE AG (Utilities, Multi-Utilities) | | | | | | | | | | | 24,300 | | | | 1,585,625 | |
SAP AG (Information Technology, Software) | | | | | | | | | | | 22,007 | | | | 1,417,912 | |
Siemens AG (Industrials, Industrial Conglomerates) | | | | | | | | | | | 44,612 | | | | 6,490,090 | |
Thyssenkrupp AG (Materials, Metals & Mining) | | | | | | | | | | | 36,500 | | | | 1,679,435 | |
| | | | |
| | | | | | | | | | | | | | | 58,688,862 | |
| | | | | | | | | | | | | | | | |
| | | | |
| Hong Kong: 7.16% | | | | | | | | | | | | | | | | |
AIA Group Limited (Financials, Insurance)† | | | | | | | | | | | 1,139,600 | | | | 3,844,978 | |
Bank of East Asia Limited (Financials, Commercial Banks) | | | | | | | | | | | 90,800 | | | | 375,646 | |
Beijing Enterprises Holdings Limited (Financials, Diversified Financial Services) | | | | | | | | | | | 138,642 | | | | 738,247 | |
BOC Hong Kong Holdings Limited (Financials, Commercial Banks) | | | | | | | | | | | 420,685 | | | | 1,323,306 | |
Cathay Pacific Airways Limited (Industrials, Airlines) | | | | | | | | | | | 259,000 | | | | 646,790 | |
Chaoda Modern Agriculture Limited (Consumer Staples, Food Products) | | | | | | | | | | | 1,024,000 | | | | 639,201 | |
Cheung Kong Holdings Limited (Financials, Real Estate Management & Development) | | | | | | | | | | | 160,000 | | | | 2,527,738 | |
China Overseas Land & Investment Limited (Financials, Real Estate Management & Development) | | | | | | | | | | | 266,602 | | | | 514,623 | |
China Resources Land Limited (Industrials, Machinery) | | | | | | | | | | | 422,600 | | | | 730,926 | |
Galaxy Entertainment Group Limited (Consumer Discretionary, Hotels, Restaurants & Leisure)† | | | | | | | | | | | 337,318 | | | | 609,230 | |
Hang Seng Bank Limited (Financials, Commercial Banks) | | | | | | | | | | | 97,431 | | | | 1,524,012 | |
Henderson Land Development Company Limited (Financials, Real Estate Management & Development) | | | | | | | | | | | 254,400 | | | | 1,746,661 | |
| | | | |
| 38 | | Wells Fargo Advantage International Stock Funds | | Portfolio of Investments—April 30, 2011 (Unaudited) |
DIVERSIFIED INTERNATIONAL FUND
| | | | | | | | | | | | | | | | |
| Security Name | | | | | | | | Shares | | | Value | |
| | | | | | | | | | | | | | | | |
| | | | |
| Hong Kong (continued) | | | | | | | | | | | | | | | | |
Hong Kong Exchanges & Clearing Limited (Financials, Diversified Financial Services) | | | | | | | | | | | 86,600 | | | $ | 1,979,611 | |
Hong Kong Land Holdings Limited (Financials, Real Estate Management & Development) | | | | | | | | | | | 119,058 | | | | 894,222 | |
Huabao International Holdings Limited (Materials, Chemicals) | | | | | | | | | | | 1,342,221 | | | | 1,990,972 | |
Johnson Electric Holdings Limited (Industrials, Electrical Equipment) | | | | | | | | | | | 542,500 | | | | 333,550 | |
Kingboard Laminates Holdings Limited (Information Technology, Electronic Equipment & Instruments) | | | | | | | | | | | 589,500 | | | | 523,100 | |
NWS Holdings Limited (Industrials, Industrial Conglomerates) | | | | | | | | | | | 690,530 | | | | 1,017,179 | |
Sands China Limited (Consumer Discretionary, Hotels, Restaurants & Leisure) | | | | | | | | | | | 2,963,626 | | | | 8,321,970 | |
Sino Land Company (Financials, Real Estate Management & Development) | | | | | | | | | | | 1,153,100 | | | | 2,034,489 | |
Sun Hung Kai Properties Limited (Financials, Real Estate Management & Development) | | | | | | | | | | | 151,900 | | | | 2,381,046 | |
Wynn Macau Limited (Consumer Discretionary, Hotels, Restaurants & Leisure) | | | | | | | | | | | 1,319,800 | | | | 4,713,208 | |
Yue Yuen Industrial Holdings Limited (Consumer Discretionary, Textiles, Apparel & Luxury Goods) | | | | | | | | | | | 234,500 | | | | 811,230 | |
| | | | |
| | | | | | | | | | | | | | | 40,221,935 | |
| | | | | | | | | | | | | | | | |
| | | | |
| India: 0.66% | | | | | | | | | | | | | | | | |
Coal India Limited (Energy, Oil, Gas & Consumable Fuels) | | | | | | | | | | | 22,049 | | | | 189,772 | |
Housing Development Finance Corporation (Industrials, Construction & Engineering) | | | | | | | | | | | 119,773 | | | | 1,914,634 | |
Tata Motors Limited ADR (Consumer Discretionary, Auto Components) | | | | | | | | | | | 31,800 | | | | 872,592 | |
Tata Steel Limited GDR (Industrials, Machinery) | | | | | | | | | | | 52,700 | | | | 738,854 | |
| | | | |
| | | | | | | | | | | | | | | 3,715,852 | |
| | | | | | | | | | | | | | | | |
| | | | |
| Ireland: 0.22% | | | | | | | | | | | | | | | | |
Accenture plc (Information Technology, IT Services)« | | | | | | | | | | | 20,219 | | | | 1,155,111 | |
Allied Irish Banks plc (Financials, Commercial Banks)† | | | | | | | | | | | 36,500 | | | | 12,206 | |
Bank of Ireland plc (Financials, Commercial Banks)† | | | | | | | | | | | 110,500 | | | | 44,834 | |
Connemara Gren Marble (Financials, Consumer Finance)(a) | | | | | | | | | | | 254,000 | | | | 0 | |
Irish Life & Permanent Group Holdings plc (Financials, Insurance) | | | | | | | | | | | 65,300 | | | | 14,508 | |
| | | | |
| | | | | | | | | | | | | | | 1,226,659 | |
| | | | | | | | | | | | | | | | |
| | | | |
| Israel: 0.39% | | | | | | | | | | | | | | | | |
Bank Hapoalim Limited (Financials, Commercial Banks)† | | | | | | | | | | | 219,600 | | | | 1,149,891 | |
Teva Pharmaceutical Industries Limited ADR (Health Care, Pharmaceuticals) | | | | | | | | | | | 22,898 | | | | 1,047,126 | |
| | | | |
| | | | | | | | | | | | | | | 2,197,017 | |
| | | | | | | | | | | | | | | | |
| | | | |
| Italy: 1.76% | | | | | | | | | | | | | | | | |
Benetton Group SpA (Consumer Discretionary, Textiles, Apparel & Luxury Goods) | | | | | | | | | | | 57,500 | | | | 466,710 | |
Enel SpA (Utilities, Multi-Utilities) | | | | | | | | | | | 366,600 | | | | 2,613,952 | |
ENI SpA (Energy, Oil, Gas & Consumable Fuels) | | | | | | | | | | | 65,000 | | | | 1,737,759 | |
Fiat Industrial SpA (Consumer Discretionary, Auto Components)† | | | | | | | | | | | 145,382 | | | | 2,159,786 | |
Intesa Sanpaolo (Financials, Commercial Banks) | | | | | | | | | | | 874,514 | | | | 2,904,033 | |
| | | | |
| | | | | | | | | | | | | | | 9,882,240 | |
| | | | | | | | | | | | | | | | |
| | | | |
| Japan: 13.14% | | | | | | | | | | | | | | | | |
Adeka Corporation (Materials, Chemicals) | | | | | | | | | | | 97,700 | | | | 962,366 | |
Alpine Electronics Incorporated (Information Technology, Electronic Equipment & Instruments) | | | | | | | | | | | 18,500 | | | | 231,036 | |
Bridgestone Corporation (Consumer Discretionary, Auto Components) | | | | | | | | | | | 71,600 | | | | 1,562,374 | |
Canon Incorporated (Information Technology, Office Electronics) | | | | | | | | | | | 64,500 | | | | 3,021,636 | |
Comsys Holdings Corporation (Industrials, Construction & Engineering) | | | | | | | | | | | 83,600 | | | | 871,918 | |
Edion Corporation (Consumer Discretionary, Specialty Retail) | | | | | | | | | | | 65,500 | | | | 563,632 | |
Eizo Nanao Corporation (Information Technology, Computers & Peripherals) | | | | | | | | | | | 26,100 | | | | 580,143 | |
Fuji Heavy Industries Limited (Consumer Discretionary, Automobiles) | | | | | | | | | | | 96,000 | | | | 712,470 | |
| | | | | | |
| Portfolio of Investments—April 30, 2011 (Unaudited) | | Wells Fargo Advantage International Stock Funds | | | 39 | |
DIVERSIFIED INTERNATIONAL FUND
| | | | | | | | | | | | | | | | |
| Security Name | | | | | | | | Shares | | | Value | |
| | | | | | | | | | | | | | | | |
| | | | |
| Japan (continued) | | | | | | | | | | | | | | | | |
Fukuoka Financial Group Incorporated (Financials, Commercial Banks) | | | | | | | | | | | 197,000 | | | $ | 811,169 | |
Gree Incorporated (Information Technology, Internet Software & Services) | | | | | | | | | | | 10,000 | | | | 203,415 | |
Hitachi Capital Corporation (Financials, Consumer Finance) | | | | | | | | | | | 48,100 | | | | 682,526 | |
Honda Motor Company Limited (Consumer Discretionary, Automobiles) | | | | | | | | | | | 99,200 | | | | 3,901,227 | |
Isuzu Motors Limited (Consumer Discretionary, Automobiles) | | | | | | | | | | | 540,000 | | | | 2,303,396 | |
Itochu Corporation (Industrials, Trading Companies & Distributors) | | | | | | | | | | | 104,000 | | | | 1,075,707 | |
Japan Tobacco Incorporated (Consumer Staples, Tobacco) | | | | | | | | | | | 307 | | | | 1,188,412 | |
JFE Holdings Incorporated (Materials, Metals & Mining) | | | | | | | | | | | 24,600 | | | | 669,021 | |
JX Holdings Incorporated (Energy, Energy Equipment & Services) | | | | | | | | | | | 215,600 | | | | 1,493,771 | |
Kaneka Corporation (Industrials, Professional Services) | | | | | | | | | | | 29,000 | | | | 211,293 | |
KDDI Corporation (Telecommunication Services, Wireless Telecommunication Services) | | | | | | | | | | | 240 | | | | 1,591,814 | |
Komatsu Limited (Industrials, Machinery) | | | | | | | | | | | 80,400 | | | | 2,814,966 | |
Kyorin Company Limited (Health Care, Pharmaceuticals) | | | | | | | | | | | 58,000 | | | | 1,033,224 | |
Maeda Road Construction Company Limited (Industrials, Construction & Engineering) | | | | | | | | | | | 88,000 | | | | 832,103 | |
Makita Corporation (Industrials, Machinery) | | | | | | | | | | | 39,000 | | | | 1,781,360 | |
Marubeni Corporation (Industrials, Trading Companies & Distributors) | | | | | | | | | | | 279,500 | | | | 2,019,195 | |
Miraca Holdings Incorporated (Health Care, Health Care Providers & Services) | | | | | | | | | | | 25,700 | | | | 972,681 | |
Mitsubishi Corporation (Industrials, Trading Companies & Distributors) | | | | | | | | | | | 80,900 | | | | 2,173,225 | |
Mitsubishi UFJ Financial Group Incorporated (Financials, Commercial Banks) | | | | | | | | | | | 249,700 | | | | 1,191,320 | |
Mitsui & Company Limited (Industrials, Trading Companies & Distributors) | | | | | | | | | | | 243,600 | | | | 4,300,502 | |
Mitsui Engineering & Shipbuilding Company Limited (Industrials, Machinery) | | | | | | | | | | | 328,000 | | | | 808,728 | |
Mitsui Mining & Smelting Company Limited (Materials, Metals & Mining) | | | | | | | | | | | 257,000 | | | | 912,482 | |
Mizuho Financial Group Incorporated (Financials, Commercial Banks) | | | | | | | | | | | 938,700 | | | | 1,481,275 | |
Nihon Kohden Corporation (Health Care, Health Care Equipment & Supplies) | | | | | | | | | | | 36,000 | | | | 762,917 | |
Nintendo Company Limited (Information Technology, Software) | | | | | | | | | | | 4,700 | | | | 1,110,756 | |
Nippon Electric Glass Company Limited (Information Technology, Electronic Equipment & Instruments) | | | | | | | | | | | 40,000 | | | | 603,094 | |
Nippon Telegraph & Telephone Corporation (Telecommunication Services, Diversified Telecommunication Services) | | | | | | | | | | | 35,700 | | | | 1,648,234 | |
Nissan Shatai Company Limited (Consumer Discretionary, Auto Components) | | | | | | | | | | | 105,000 | | | | 781,853 | |
NKSJ Holdings Incorporated (Financials, Insurance) | | | | | | | | | | | 102,000 | | | | 651,372 | |
Nomura Holdings Incorporated (Financials, Capital Markets) | | | | | | | | | | | 169,000 | | | | 858,386 | |
NTT DoCoMo Incorporated (Telecommunication Services, Wireless Telecommunication Services) | | | | | | | | | | | 600 | | | | 1,104,358 | |
Rengo Company Limited (Materials, Containers & Packaging) | | | | | | | | | | | 135,000 | | | | 803,859 | |
Ryosan Company Limited (Information Technology, Electronic Equipment & Instruments) | | | | | | | | | | | 13,000 | | | | 300,660 | |
Sankyu Incorporated (Industrials, Road & Rail) | | | | | | | | | | | 189,000 | | | | 864,439 | |
Sanwa Shutter Corporation (Industrials, Building Products) | | | | | | | | | | | 8,000 | | | | 25,938 | |
Sega Sammy Holdings Incorporated (Consumer Discretionary, Leisure Equipment & Products) | | | | | | | | | | | 38,700 | | | | 667,941 | |
Seino Holdings Company Limited (Industrials, Transportation Infrastructure) | | | | | | | | | | | 3,000 | | | | 22,413 | |
Softbank Corporation (Telecommunication Services, Wireless Telecommunication Services) | | | | | | | | | | | 86,600 | | | | 3,619,232 | |
Sojitz Corporation (Industrials, Trading Companies & Distributors) | | | | | | | | | | | 341,200 | | | | 647,782 | |
Sumitomo Corporation (Industrials, Trading Companies & Distributors) | | | | | | | | | | | 154,800 | | | | 2,112,601 | |
Sumitomo Heavy Industries Limited (Industrials, Machinery) | | | | | | | | | | | 402,000 | | | | 2,616,729 | |
Sumitomo Mitsui Financial Group Incorporated (Financials, Commercial Banks) | | | | | | | | | | | 63,400 | | | | 1,950,108 | |
Sumitomo Mitsui Trust Holdings Incorporated (Financials, Commercial Banks) | | | | | | | | | | | 141,000 | | | | 479,763 | |
Takeda Pharmaceutical Company Limited (Health Care, Pharmaceuticals) | | | | | | | | | | | 37,700 | | | | 1,821,907 | |
Tokyo Electron Limited (Information Technology, Semiconductors & Semiconductor Equipment) | | | | | | | | | | | 12,100 | | | | 695,882 | |
Toshiba Corporation (Information Technology, Computers & Peripherals) | | | | | | | | | | | 99,000 | | | | 521,149 | |
Toshiba TEC Corporation (Information Technology, Office Electronics) | | | | | | | | | | | 146,000 | | | | 669,568 | |
Toyota Motor Corporation (Consumer Discretionary, Automobiles) | | | | | | | | | | | 82,500 | | | | 3,285,151 | |
Tsuruha Holdings Incorporated (Consumer Staples, Food & Staples Retailing) | | | | | | | | | | | 18,900 | | | | 890,070 | |
| | | | |
| 40 | | Wells Fargo Advantage International Stock Funds | | Portfolio of Investments—April 30, 2011 (Unaudited) |
DIVERSIFIED INTERNATIONAL FUND
| | | | | | | | | | | | | | | | |
| Security Name | | | | | | | | Shares | | | Value | |
| | | | | | | | | | | | | | | | |
| | | | |
| Japan (continued) | | | | | | | | | | | | | | | | |
Yahoo! Japan Corporation (Information Technology, Internet Software & Services) | | | | | | | | | | | 3,570 | | | $ | 1,302,303 | |
| | | | |
| | | | | | | | | | | | | | | 73,776,852 | |
| | | | | | | | | | | | | | | | |
| | | | |
| Liechtenstein: 0.09% | | | | | | | | | | | | | | | | |
Verwaltungs-Und Privat-Bank AG (Financials, Capital Markets) | | | | | | | | | | | 3,587 | | | | 474,396 | |
| | | | | | | | | | | | | | | | |
| | | | |
| Luxembourg: 0.07% | | | | | | | | | | | | | | | | |
ArcelorMittal (Materials, Metals & Mining) | | | | | | | | | | | 11,242 | | | | 413,613 | |
| | | | | | | | | | | | | | | | |
| | | | |
| Netherlands: 3.55% | | | | | | | | | | | | | | | | |
Aegon NV (Financials, Insurance) | | | | | | | | | | | 60,500 | | | | 480,397 | |
Akzo Nobel NV (Materials, Chemicals)« | | | | | | | | | | | 32,633 | | | | 2,534,655 | |
ASML Holding NV (Information Technology, Semiconductors & Semiconductor Equipment) | | | | | | | | | | | 23,913 | | | | 990,131 | |
ING Groep NV (Financials, Diversified Financial Services) | | | | | | | | | | | 442,718 | | | | 5,836,013 | |
Koninklijke DSM NV (Consumer Staples, Food & Staples Retailing) | | | | | | | | | | | 29,000 | | | | 1,999,479 | |
New World Resources NV (Materials, Metals & Mining) | | | | | | | | | | | 66,302 | | | | 1,125,195 | |
Nielsen Holdings NV (Industrials, Professional Services)†« | | | | | | | | | | | 9,000 | | | | 269,010 | |
Nutreco Holding NV (Consumer Staples, Food Products) | | | | | | | | | | | 8,000 | | | | 622,676 | |
Randstad Holdings NV (Industrials, Commercial Services & Supplies) | | | | | | | | | | | 50,653 | | | | 2,849,438 | |
Unilever NV (Consumer Staples, Food Products) | | | | | | | | | | | 27,462 | | | | 903,806 | |
USG People NV (Industrials, Commercial Services & Supplies) | | | | | | | | | | | 116,863 | | | | 2,313,370 | |
| | | | |
| | | | | | | | | | | | | | | 19,924,170 | |
| | | | | | | | | | | | | | | | |
| | | | |
| Norway: 0.68% | | | | | | | | | | | | | | | | |
Atea ASA (Information Technology, IT Services)† | | | | | | | | | | | 93,700 | | | | 1,035,833 | |
DnB Nor ASA (Financials, Commercial Banks) | | | | | | | | | | | 56,100 | | | | 912,082 | |
Statoil ASA (Energy, Oil, Gas & Consumable Fuels) | | | | | | | | | | | 30,300 | | | | 886,488 | |
Telenor ASA (Telecommunication Services, Diversified Telecommunication Services) | | | | | | | | | | | 55,297 | | | | 955,414 | |
| | | | |
| | | | | | | | | | | | | | | 3,789,817 | |
| | | | | | | | | | | | | | | | |
| | | | |
| Portugal: 0.04% | | | | | | | | | | | | | | | | |
Banco Espirito Santo SA (Financials, Commercial Banks) | | | | | | | | | | | 51,000 | | | | 214,832 | |
| | | | | | | | | | | | | | | | |
| | | | |
| Russia: 1.05% | | | | | | | | | | | | | | | | |
Gazprom ADR (Energy, Oil, Gas & Consumable Fuels) | | | | | | | | | | | 170,570 | | | | 2,909,924 | |
Gazprom Neft Sponsored ADR (Energy, Oil, Gas & Consumable Fuels) | | | | | | | | | | | 38,000 | | | | 959,500 | |
Lukoil ADR (Energy, Oil, Gas & Consumable Fuels) | | | | | | | | | | | 29,100 | | | | 2,028,270 | |
| | | | | | | | | | | | | | | 5,897,694 | |
| | | | | | | | | | | | | | | | |
| | | | |
| Singapore: 0.40% | | | | | | | | | | | | | | | | |
City Developments Limited (Financials, Real Estate Management & Development) | | | | | | | | | | | 48,459 | | | | 470,068 | |
DBS Group Holdings Limited (Financials, Commercial Banks) | | | | | | | | | | | 66,000 | | | | 809,055 | |
Mobilone Limited (Telecommunication Services, Wireless Telecommunication Services) | | | | | | | | | | | 90 | | | | 176 | |
United Overseas Bank Limited (Financials, Commercial Banks) | | | | | | | | | | | 61,000 | | | | 979,404 | |
| | | | |
| | | | | | | | | | | | | | | 2,258,703 | |
| | | | | | | | | | | | | | | | |
| | | | |
| South Africa: 0.20% | | | | | | | | | | | | | | | | |
Exxaro Resources Limited (Materials, Metals & Mining) | | | | | | | | | | | 41,700 | | | | 1,125,859 | |
| | | | | | | | | | | | | | | | |
| | | | |
| South Korea: 0.85% | | | | | | | | | | | | | | | | |
Hyundai Motor Company Limited (Transportation Equipment, Automobiles) | | | | | | | | | | | 7,221 | | | | 1,660,968 | |
NHN Corporation (Internet Software, Internet Software & Services)† | | | | | | | | | | | 3,413 | | | | 676,772 | |
| | | | | | |
| Portfolio of Investments—April 30, 2011 (Unaudited) | | Wells Fargo Advantage International Stock Funds | | | 41 | |
DIVERSIFIED INTERNATIONAL FUND
| | | | | | | | | | | | | | | | |
| Security Name | | | | | | | | Shares | | | Value | |
| | | | | | | | | | | | | | | | |
| | | | |
| South Korea (continued) | | | | | | | | | | | | | | | | |
Samsung Electronics Company Limited (Information Technology, Semiconductors & Semiconductor Equipment) | | | | | | | | | | | 1,501 | | | $ | 1,250,775 | |
Woori Finance Holdings Company Limited (Financials, Commercial Banks)† | | | | | | | | | | | 88,300 | | | | 1,202,986 | |
| | | | |
| | | | | | | | | | | | | | | 4,791,501 | |
| | | | | | | | | | | | | | | | |
| | | | |
| Spain: 3.09% | | | | | | | | | | | | | | | | |
Banco Bilbao Vizcaya Argentaria SA (Financials, Commercial Banks) | | | | | | | | | | | 161,054 | | | | 2,065,801 | |
Banco Santander Central Hispano SA (Financials, Commercial Banks) | | | | | | | | | | | 307,223 | | | | 3,923,384 | |
Industria de Diseno Textil SA (Consumer Discretionary, Specialty Retail) | | | | | | | | | | | 34,874 | | | | 3,127,110 | |
International Consolidated Airlines Group SA (Industrials, Airlines)† | | | | | | | | | | | 191,944 | | | | 763,702 | |
Repsol YPF SA (Energy, Oil, Gas & Consumable Fuels) | | | | | | | | | | | 146,213 | | | | 5,221,344 | |
Telefonica SA (Telecommunication Services, Diversified Telecommunication Services) | | | | | | | | | | | 83,197 | | | | 2,236,575 | |
| | | | |
| | | | | | | | | | | | | | | 17,337,916 | |
| | | | | | | | | | | | | | | | |
| | | | |
| Sweden: 1.02% | | | | | | | | | | | | | | | | |
Boliden AB (Materials, Metals & Mining) | | | | | | | | | | | 87,500 | | | | 1,972,296 | |
Saab AB (Industrials, Aerospace & Defense)† | | | | | | | | | | | 59,800 | | | | 1,350,892 | |
Sandvik AB (Industrials, Machinery)« | | | | | | | | | | | 78,878 | | | | 1,673,520 | |
Svenska Cellulosa AB Class B (Materials, Paper & Forest Products) | | | | | | | | | | | 48,700 | | | | 746,323 | |
| | | | |
| | | | | | | | | | | | | | | 5,743,031 | |
| | | | | | | | | | | | | | | | |
| | | | |
| Switzerland: 8.11% | | | | | | | | | | | | | | | | |
ABB Limited (Industrials, Electrical Equipment) | | | | | | | | | | | 109,010 | | | | 3,009,433 | |
Adecco SA (Industrials, Professional Services) | | | | | | | | | | | 50,610 | | | | 3,612,910 | |
Baloise Holding AG (Financials, Insurance) | | | | | | | | | | | 13,300 | | | | 1,470,688 | |
Clariant AG (Materials, Chemicals) | | | | | | | | | | | 40,872 | | | | 848,153 | |
Compagnie Financiere Richemont SA (Consumer Discretionary, Textiles, Apparel & Luxury Goods) | | | | | | | | | | | 32,103 | | | | 2,074,633 | |
Credit Suisse Group (Financials, Capital Markets) | | | | | | | | | | | 70,448 | | | | 3,201,515 | |
Georg Fischer AG (Industrials, Machinery) | | | | | | | | | | | 1,400 | | | | 914,451 | |
Nestle SA (Consumer Staples, Food Products) | | | | | | | | | | | 149,463 | | | | 9,278,801 | |
Novartis AG (Health Care, Pharmaceuticals) | | | | | | | | | | | 95,087 | | | | 5,644,760 | |
Roche Holdings AG (Health Care, Pharmaceuticals) | | | | | | | | | | | 17,514 | | | | 2,840,710 | |
Swatch Group AG Class B (Consumer Discretionary, Textiles, Apparel & Luxury Goods) | | | | | | | | | | | 11,826 | | | | 5,817,299 | |
Swiss Reinsurance (Financials, Insurance) | | | | | | | | | | | 11,200 | | | | 667,468 | |
UBS AG (Financials, Capital Markets) | | | | | | | | | | | 76,650 | | | | 1,532,114 | |
Valora Holding AG (Consumer Discretionary, Specialty Retail) | | | | | | | | | | | 1,120 | | | | 382,613 | |
Zurich Financial Services AG (Financials, Insurance) | | | | | | | | | | | 14,989 | | | | 4,210,782 | |
| | | | |
| | | | | | | | | | | | | | | 45,506,330 | |
| | | | | | | | | | | | | | | | |
| | | | |
| United Kingdom: 17.81% | | | | | | | | | | | | | | | | |
Amlin plc (Financials, Insurance) | | | | | | | | | | | 101,100 | | | | 705,886 | |
Anglo American plc (Materials, Metals & Mining) | | | | | | | | | | | 23,753 | | | | 1,238,084 | |
Antofagasta plc (Materials, Metals & Mining) | | | | | | | | | | | 88,006 | | | | 2,009,501 | |
Ashtead Group plc (Industrials, Trading Companies & Distributors) | | | | | | | | | | | 510,030 | | | | 1,722,599 | |
AstraZeneca plc (Health Care, Pharmaceuticals) | | | | | | | | | | | 58,100 | | | | 2,901,715 | |
Aviva plc (Financials, Insurance) | | | | | | | | | | | 93,600 | | | | 698,548 | |
BAE Systems plc (Industrials, Aerospace & Defense) | | | | | | | | | | | 317,800 | | | | 1,740,615 | |
Barclays plc (Financials, Commercial Banks) | | | | | | | | | | | 724,917 | | | | 3,418,272 | |
BG Group plc (Health Care, Health Care Providers & Services) | | | | | | | | | | | 101,354 | | | | 2,596,164 | |
BHP Billiton plc (Materials, Metals & Mining) | | | | | | | | | | | 71,608 | | | | 3,019,565 | |
| | | | |
| 42 | | Wells Fargo Advantage International Stock Funds | | Portfolio of Investments—April 30, 2011 (Unaudited) |
DIVERSIFIED INTERNATIONAL FUND
| | | | | | | | | | | | | | | | |
| Security Name | | | | | | | | Shares | | | Value | |
| | | | | | | | | | | | | | | | |
| | | | |
| United Kingdom (continued) | | | | | | | | | | | | | | | | |
BP plc (Energy, Oil, Gas & Consumable Fuels) | | | | | | | | | | | 370,279 | | | $ | 2,860,851 | |
BT Group plc (Telecommunication Services, Diversified Telecommunication Services) | | | | | | | | | | | 811,900 | | | | 2,655,355 | |
Burberry Group plc (Consumer Discretionary, Textiles, Apparel & Luxury Goods) | | | | | | | | | | | 71,519 | | | | 1,547,030 | |
Cookson Group plc (Utilities, Multi-Utilities) | | | | | | | | | | | 77,671 | | | | 928,274 | |
Diageo plc (Consumer Staples, Beverages) | | | | | | | | | | | 83,572 | | | | 1,700,261 | |
DS Smith plc (Industrials, Professional Services) | | | | | | | | | | | 253,300 | | | | 917,703 | |
Experian Group Limited (Financials, Diversified Financial Services) | | | | | | | | | | | 306,586 | | | | 4,130,134 | |
Firstgroup plc (Industrials, Road & Rail) | | | | | | | | | | | 145,100 | | | | 786,968 | |
Game Group plc (Consumer Discretionary, Specialty Retail) | | | | | | | | | | | 838,220 | | | | 738,564 | |
Genting International plc (Consumer Staples, Hotels, Restaurants & Leisure)† | | | | | | | | | | | 705,592 | | | | 1,255,755 | |
GlaxoSmithKline plc (Health Care, Pharmaceuticals) | | | | | | | | | | | 188,018 | | | | 4,099,999 | |
Greene King plc (Consumer Discretionary, Hotels, Restaurants & Leisure) | | | | | | | | | | | 71,400 | | | | 583,912 | |
Hays plc (Industrials, Commercial Services & Supplies) | | | | | | | | | | | 424,430 | | | | 841,520 | |
Home Retail Group (Consumer Discretionary, Internet & Catalog Retail) | | | | | | | | | | | 208,100 | | | | 764,372 | |
HSBC Holdings plc (Financials, Commercial Banks) | | | | | | | | | | | 289,401 | | | | 3,168,209 | |
Imperial Tobacco Group plc (Consumer Staples, Tobacco) | | | | | | | | | | | 60,636 | | | | 2,134,040 | |
Intercontinental Hotels Group plc (Consumer Discretionary, Hotels, Restaurants & Leisure) | | | | | | | | | | | 44,514 | | | | 974,780 | |
Intertek Group plc (Industrials, Commercial Services & Supplies) | | | | | | | | | | | 24,402 | | | | 866,147 | |
Johnson Matthey plc (Materials, Chemicals) | | | | | | | | | | | 8,006 | | | | 267,858 | |
Kesa Electricals plc (Consumer Discretionary, Specialty Retail) | | | | | | | | | | | 334,144 | | | | 719,997 | |
Kingfisher plc (Consumer Discretionary, Specialty Retail) | | | | | | | | | | | 927,763 | | | | 4,253,896 | |
Lloyds TSB Group plc (Financials, Commercial Banks)† | | | | | | | | | | | 1,408,802 | | | | 1,394,266 | |
LogicaCMG plc (Industrials, Professional Services) | | | | | | | | | | | 465,700 | | | | 1,048,585 | |
Marston’s plc (Consumer Discretionary, Hotels, Restaurants & Leisure) | | | | | | | | | | | 317,490 | | | | 574,866 | |
Next plc (Consumer Discretionary, Multiline Retail) | | | | | | | | | | | 17,900 | | | | 668,846 | |
Old Mutual plc (Financials, Insurance) | | | | | | | | | | | 518,700 | | | | 1,204,311 | |
Pace plc (Consumer Discretionary, Household Durables) | | | | | | | | | | | 190,500 | | | | 512,623 | |
Persimmon plc (Consumer Discretionary, Household Durables) | | | | | | | | | | | 144,420 | | | | 1,165,391 | |
Rio Tinto plc (Materials, Metals & Mining) | | | | | | | | | | | 37,073 | | | | 2,699,925 | |
Royal & Sun Alliance Insurance Group plc (Financials, Insurance) | | | | | | | | | | | 162,400 | | | | 373,260 | |
Royal Dutch Shell plc Class A (Energy, Oil, Gas & Consumable Fuels) | | | | | | | | | | | 73,103 | | | | 2,835,949 | |
Royal Dutch Shell plc Class B (Energy, Oil, Gas & Consumable Fuels) | | | | | | | | | | | 141,000 | | | | 5,480,535 | |
SABMiller plc (Consumer Staples, Beverages) | | | | | | | | | | | 25,988 | | | | 969,975 | |
Standard Chartered plc (Financials, Commercial Banks) | | | | | | | | | | | 76,850 | | | | 2,129,598 | |
Tesco plc (Consumer Staples, Food & Staples Retailing) | | | | | | | | | | | 364,037 | | | | 2,453,863 | |
Thomas Cook Group plc (Consumer Discretionary, Hotels, Restaurants & Leisure) | | | | | | | | | | | 233,700 | | | | 668,688 | |
Travis Perkins plc (Industrials, Trading Companies & Distributors) | | | | | | | | | | | 73,999 | | | | 1,328,745 | |
Tullett Prebon plc (Financials, Capital Markets) | | | | | | | | | | | 137,500 | | | | 965,775 | |
Vodafone Group plc (Telecommunication Services, Wireless Telecommunication Services) | | | | | | | | | | | 2,036,671 | | | | 5,837,751 | |
WH Smith Public Limited Corporation (Consumer Discretionary, Specialty Retail) | | | | | | | | | | | 99,900 | | | | 784,279 | |
WPP plc (Consumer Discretionary, Media) | | | | | | | | | | | 454,296 | | | | 5,930,282 | |
Xstrata plc (Materials, Metals & Mining) | | | | | | | | | | | 186,433 | | | | 4,738,069 | |
| | | | |
| | | | | | | | | | | | | | | 100,012,156 | |
| | | | | | | | | | | | | | | | |
| | | | |
Total Common Stocks (Cost $450,048,854) | | | | | | | | | | | | | | | 535,005,148 | |
| | | | | | | | | | | | | | | | |
| | | | | | |
| Portfolio of Investments—April 30, 2011 (Unaudited) | | Wells Fargo Advantage International Stock Funds | | | 43 | |
DIVERSIFIED INTERNATIONAL FUND
| | | | | | | | | | | | | | | | |
| Security Name | | Yield | | | | | | Shares | | | Value | |
| | | | | | | | | | | | | | | | |
| | | | |
Short-Term Investments: 15.41% | | | | | | | | | | | | | | | | |
| | | | |
| Investment Companies: 15.41% | | | | | | | | | | | | | | | | |
Wells Fargo Advantage Cash Investment Money Market Fund(l)(u) | | | 0.09 | % | | | | | | | 18,933,743 | | | $ | 18,933,743 | |
Wells Fargo Securities Lending Cash Investments, LLC(v)(l)(u) | | | 0.20 | | | | | | | | 67,556,672 | | | | 67,556,672 | |
| | | | | | | | | | | | | | | | |
| | | | |
Total Short-Term Investments (Cost $86,490,415) | | | | | | | | | | | | | | | 86,490,415 | |
| | | | | | | | | | | | | | | | |
| | | | | | | | |
Total Investments in Securities
(Cost $536,539,269)* | | | 110.70 | % | | | 621,495,563 | |
Other Assets and Liabilities, Net | | | (10.70 | ) | | | (60,075,879 | ) |
| | | | | | | | |
| Total Net Assets | | | 100.00 | % | | $ | 561,419,684 | |
| | | | | | | | |
| † | Non-income earning securities. |
| (v) | Security represents investment of cash collateral received from securities on loan. |
| « | All or a portion of this security is on loan. |
| (a) | Security is fair valued by the Management Valuation Team, and in certain instances by the Board of Trustees, in accordance with procedures approved by the Board of Trustees. |
| (l) | Investment in an affiliate. |
| (u) | Rate shown is the 7-day annualized yield at period end. |
| * | Cost for federal income tax purposes is $549,027,521 and net unrealized appreciation (depreciation) consists of: |
| | | | |
Gross unrealized appreciation | | $ | 92,561,933 | |
Gross unrealized depreciation | | | (20,093,891 | ) |
| | | | |
Net unrealized appreciation | | $ | 72,468,042 | |
The accompanying notes are an integral part of these financial statements.
| | | | |
| 44 | | Wells Fargo Advantage International Stock Funds | | Portfolio of Investments—April 30, 2011 (Unaudited) |
EMERGING MARKETS EQUITY FUND
| | | | | | | | | | | | | | | | |
| Security Name | | | | | | | | Shares | | | Value | |
| | | | | | | | | | | | | | | | |
| | | | |
Common Stocks: 84.96% | | | | | | | | | | | | | | | | |
| | | | |
| Argentina: 0.09% | | | | | | | | | | | | | | | | |
Irsa Inversiones y Representaciones SA ADR (Financials, Real Estate Management & Development) | | | | | | | | | | | 148,500 | | | $ | 1,881,495 | |
| | | | | | | | | | | | | | | | |
| | | | |
| Brazil: 13.86% | | | | | | | | | | | | | | | | |
All America Latina Logistica SA (Industrials, Road & Rail) | | | | | | | | | | | 3,154,670 | | | | 26,068,338 | |
B2w Com Global do Varejo (Consumer Discretionary, Internet & Catalog Retail) | | | | | | | | | | | 853,800 | | | | 11,722,654 | |
B2w Com Global do Varejo ADR (Consumer Discretionary, Internet & Catalog Retail)(a)† | | | | | | | | | | | 358,090 | | | | 5,000,786 | |
Banco Bradesco SA ADR (Financials, Commercial Banks)« | | | | | | | | | | | 1,710,235 | | | | 34,598,054 | |
Banco do Brasil SA (Financials, Commercial Banks) | | | | | | | | | | | 1,482,100 | | | | 27,311,263 | |
Brookfield Incorporacoes SA (Financials, Real Estate Management & Development)† | | | | | | | | | | | 2,612,456 | | | | 14,530,250 | |
Campanhia de Bebidas dos Americas ADR (Consumer Staples, Beverages)« | | | | | | | | | | | 347,500 | | | | 11,321,550 | |
Cia de Concessoes Rodoviarias (Industrials, Transportation Infrastructure) | | | | | | | | | | | 294,800 | | | | 9,182,049 | |
Cielo SA (Information Technology, IT Services) | | | | | | | | | | | 1,326,000 | | | | 12,263,730 | |
Itau Unibanco Holding Preferred ADR (Financials, Commercial Banks) | | | | | | | | | | | 90,000 | | | | 2,137,500 | |
Lojas Renner SA (Consumer Discretionary, Multiline Retail)† | | | | | | | | | | | 370,200 | | | | 13,660,126 | |
Petroleo Brasileiro SA ADR (Energy, Oil, Gas & Consumable Fuels) | | | | | | | | | | | 908,400 | | | | 33,910,572 | |
Petroleo Brasileiro SA ADR Class A (Energy, Oil, Gas & Consumable Fuels)« | | | | | | | | | | | 1,009,635 | | | | 33,691,520 | |
Redecard SA (Information Technology, IT Services) | | | | | | | | | | | 818,400 | | | | 11,834,859 | |
Sao Carlos Empreendimentos (Financials, Real Estate Management & Development) | | | | | | | | | | | 258,900 | | | | 3,620,519 | |
Tim Participacoes SA (Telecommunication Services, Wireless Telecommunication Services)† | | | | | | | | | | | 1,835,363 | | | | 10,021,465 | |
Vale SA ADR (Materials, Metals & Mining)« | | | | | | | | | | | 743,236 | | | | 24,824,082 | |
| | | | |
| | | | | | | | | | | | | | | 285,699,317 | |
| | | | | | | | | | | | | | | | |
| | | | |
| China: 11.27% | | | | | | | | | | | | | | | | |
51job Incorporated ADR (Industrials, Commercial Services & Supplies)† | | | | | | | | | | | 439,604 | | | | 24,613,428 | |
Bitauto Holdings Limited ADR (Information Technology, Internet Software & Services)Ǡ | | | | | | | | | | | 252,524 | | | | 2,558,068 | |
China Life Insurance Company Limited ADR (Financials, Insurance)« | | | | | | | | | | | 279,500 | | | | 15,006,355 | |
China Telecom Corporation Limited (Telecommunication Services, Diversified Telecommunication Services) | | | | | | | | | | | 29,108,000 | | | | 16,791,095 | |
Dalian Port Company Limited (Industrials, Transportation Infrastructure) | | | | | | | | | | | 14,532,000 | | | | 5,688,367 | |
First Tractor Company (Industrials, Machinery) | | | | | | | | | | | 5,144,000 | | | | 7,087,179 | |
Li Ning Company Limited (Consumer Discretionary, Textiles, Apparel & Luxury Goods) | | | | | | | | | | | 3,897,000 | | | | 6,683,565 | |
New Oriental Education & Technology Group Incorporated (Consumer Discretionary, Diversified Consumer Services)† | | | | | | | | | | | 166,200 | | | | 20,715,168 | |
NVC Lighting Holdings Limited (Consumer Discretionary, Household Durables) | | | | | | | | | | | 12,823,000 | | | | 6,826,109 | |
PetroChina Company Limited ADR (Energy, Oil, Gas & Consumable Fuels)« | | | | | | | | | | | 132,700 | | | | 19,318,466 | |
Sichuan Expressway Company (Industrials, Transportation Infrastructure) | | | | | | | | | | | 21,374,000 | | | | 12,935,175 | |
SINA Corporation (Information Technology, Internet Software & Services)Ǡ | | | | | | | | | | | 521,050 | | | | 70,211,488 | |
Sinotrans Limited (Industrials, Air Freight & Logistics) | | | | | | | | | | | 30,149,000 | | | | 7,375,902 | |
Tsingtao Brewery Company Limited (Consumer Staples, Beverages) | | | | | | | | | | | 3,100,000 | | | | 16,465,476 | |
| | | | |
| | | | | | | | | | | | | | | 232,275,841 | |
| | | | | | | | | | | | | | | | |
| | | | |
| Hong Kong: 5.75% | | | | | | | | | | | | | | | | |
China Mobile Limited (Telecommunication Services, Wireless Telecommunication Services) | | | | | | | | | | | 950,000 | | | | 8,733,945 | |
China Mobile Limited ADR (Telecommunication Services, Wireless Telecommunication Services)« | | | | | | | | | | | 1,563,333 | | | | 72,054,018 | |
CNOOC Limited ADR (Energy, Oil, Gas & Consumable Fuels)« | | | | | | | | | | | 72,900 | | | | 18,184,905 | |
Johnson Electric Holdings Limited (Industrials, Electrical Equipment) | | | | | | | | | | | 9,800,000 | | | | 6,025,428 | |
Shangri-La Asia Limited (Consumer Discretionary, Hotels, Restaurants & Leisure) | | | | | | | | | | | 1,995,500 | | | | 5,577,286 | |
Texwinca Holdings Limited (Consumer Discretionary, Textiles, Apparel & Luxury Goods) | | | | | | | | | | | 6,992,000 | | | | 7,896,553 | |
| | | | |
| | | | | | | | | | | | | | | 118,472,135 | |
| | | | | | | | | | | | | | | | |
| | | | | | |
| Portfolio of Investments—April 30, 2011 (Unaudited) | | Wells Fargo Advantage International Stock Funds | | | 45 | |
EMERGING MARKETS EQUITY FUND
| | | | | | | | | | | | | | | | |
| Security Name | | | | | | | | Shares | | | Value | |
| | | | | | | | | | | | | | | | |
| | | | |
| India: 5.22% | | | | | | | | | | | | | | | | |
Bharti Airtel Limited (Telecommunication Services, Wireless Telecommunication Services)† | | | | | | | | | | | 2,525,849 | | | $ | 21,710,933 | |
Hindustan Unilever Limited (Consumer Staples, Household Products)† | | | | | | | | | | | 1,140,200 | | | | 7,354,632 | |
ICICI Bank Limited ADR (Financials, Commercial Banks)« | | | | | | | | | | | 599,795 | | | | 30,229,668 | |
Idea Cellular Limited (Telecommunication Services, Wireless Telecommunication Services)† | | | | | | | | | | | 5,140,500 | | | | 8,010,414 | |
Infosys Technologies Limited ADR (Information Technology, IT Services)« | | | | | | | | | | | 127,100 | | | | 8,284,378 | |
Oil & Natural Gas Corporation Limited (Energy, Oil, Gas & Consumable Fuels) | | | | | | | | | | | 825,600 | | | | 5,747,364 | |
Reliance Industries Limited (Energy, Oil, Gas & Consumable Fuels)†† | | | | | | | | | | | 439,100 | | | | 19,316,009 | |
Ultra Tech Cement Limited (Materials, Construction Materials)† | | | | | | | | | | | 286,000 | | | | 7,045,050 | |
| | | | |
| | | | | | | | | | | | | | | 107,698,448 | |
| | | | | | | | | | | | | | | | |
| | | | |
| Indonesia: 1.24% | | | | | | | | | | | | | | | | |
PT Astra Agro Lestari Tbk (Consumer Staples, Food Products) | | | | | | | | | | | 2,477,000 | | | | 6,695,767 | |
PT Astra International Incorporated (Consumer Discretionary, Automobiles) | | | | | | | | | | | 995,500 | | | | 6,527,011 | |
PT Gudang Garam Tbk (Consumer Staples, Tobacco) | | | | | | | | | | | 1,000,000 | | | | 4,740,775 | |
Telekomunik Indonesia ADR (Telecommunication Services, Diversified Telecommunication Services) | | | | | | | | | | | 210,664 | | | | 7,613,397 | |
| | | | |
| | | | | | | | | | | | | | | 25,576,950 | |
| | | | | | | | | | | | | | | | |
| | | | |
| Israel: 1.36% | | | | | | | | | | | | | | | | |
Israel Chemicals Limited (Materials, Chemicals) | | | | | | | | | | | 1,334,600 | | | | 23,531,443 | |
Teva Pharmaceutical Industries Limited ADR (Health Care, Pharmaceuticals) | | | | | | | | | | | 100,000 | | | | 4,573,000 | |
| | | | |
| | | | | | | | | | | | | | | 28,104,443 | |
| | | | | | | | | | | | | | | | |
| | | | |
| Malaysia: 1.83% | | | | | | | | | | | | | | | | |
Genting Berhad (Consumer Discretionary, Hotels, Restaurants & Leisure) | | | | | | | | | | | 3,935,200 | | | | 15,411,317 | |
KLCC Property Holdings Berhad (Financials, Real Estate Management & Development) | | | | | | | | | | | 3,387,900 | | | | 3,763,062 | |
Resorts World Berhad (Consumer Discretionary, Hotels, Restaurants & Leisure)† | | | | | | | | | | | 7,645,600 | | | | 9,498,922 | |
Sime Darby Berhad (Industrials, Industrial Conglomerates) | | | | | | | | | | | 2,969,437 | | | | 9,042,647 | |
| | | | |
| | | | | | | | | | | | | | | 37,715,948 | |
| | | | | | | | | | | | | | | | |
| | | | |
| Mexico: 5.52% | | | | | | | | | | | | | | | | |
America Movil SAB de CV ADR (Telecommunication Services, Wireless Telecommunication Services) | | | | | | | | | | | 432,200 | | | | 24,721,840 | |
Cemex SA de CV (Materials, Construction Materials)Ǡ | | | | | | | | | | | 2,620,680 | | | | 22,747,502 | |
Fibra Uno Administracion SA (Financials, Real Estate Investment Trusts (REITs))† | | | | | | | | | | | 2,184,945 | | | | 3,720,121 | |
Fomento Economico Mexicano SA de CV ADR (Consumer Staples, Beverages)« | | | | | | | | | | | 196,900 | | | | 12,385,010 | |
Grupo Financiero Banorte SA de CV (Financials, Commercial Banks) | | | | | | | | | | | 1,172,936 | | | | 5,858,719 | |
Grupo Televisa SA ADR (Consumer Discretionary, Media)Ǡ | | | | | | | | | | | 1,865,000 | | | | 44,237,800 | |
Promotora Ambiental SAB de CV (Industrials, Commercial Services & Supplies)(a)† | | | | | | | | | | | 258,800 | | | | 224,723 | |
| | | | |
| | | | | | | | | | | | | | | 113,895,715 | |
| | | | | | | | | | | | | | | | |
| | | | |
| Peru: 0.91% | | | | | | | | | | | | | | | | |
Compania de Minas Buenaventura SA ADR (Materials, Metals & Mining) | | | | | | | | | | | 448,100 | | | | 18,672,327 | |
| | | | | | | | | | | | | | | | |
| | | | |
| Philippines: 0.63% | | | | | | | | | | | | | | | | |
Ayala Corporation (Financials, Diversified Financial Services) | | | | | | | | | | | 462,153 | | | | 4,221,019 | |
Metropolitan Bank & Trust Company (Financials, Commercial Banks) | | | | | | | | | | | 2,669,903 | | | | 4,281,449 | |
SM Investments Corporation (Industrials, Industrial Conglomerates) | | | | | | | | | | | 263,016 | | | | 3,557,259 | |
Universal Robina Corporation (Consumer Staples, Food Products) | | | | | | | | | | | 1,000,000 | | | | 871,292 | |
| | | | |
| | | | | | | | | | | | | | | 12,931,019 | |
| | | | | | | | | | | | | | | | |
| | | | |
| 46 | | Wells Fargo Advantage International Stock Funds | | Portfolio of Investments—April 30, 2011 (Unaudited) |
EMERGING MARKETS EQUITY FUND
| | | | | | | | | | | | | | | | |
| Security Name | | | | | | | | Shares | | | Value | |
| | | | | | | | | | | | | | | | |
| | | | |
| Poland: 0.40% | | | | | | | | | | | | | | | | |
Telekomunikacja Polska SA (Telecommunication Services, Diversified Telecommunication Services) | | | | | | | | | | | 1,251,897 | | | $ | 8,276,187 | |
| | | | | | | | | | | | | | | | |
| | | | |
| Russia: 4.16% | | | | | | | | | | | | | | | | |
Gazprom ADR (Energy, Oil, Gas & Consumable Fuels) | | | | | | | | | | | 1,375,796 | | | | 23,209,679 | |
Lukoil Oil Company ADR (Energy, Oil, Gas & Consumable Fuels) | | | | | | | | | | | 303,430 | | | | 20,997,356 | |
Mobile Telesystems ADR (Telecommunication Services, Wireless Telecommunication Services)« | | | | | | | | | | | 1,062,100 | | | | 22,463,415 | |
Sberbank of Russia (Financials, Commercial Banks) | | | | | | | | | | | 5,217,377 | | | | 19,069,513 | |
| | | | |
| | | | | | | | | | | | | | | 85,739,963 | |
| | | | | | | | | | | | | | | | |
| | | | |
| South Africa: 8.09% | | | | | | | | | | | | | | | | |
Anglo Platinum Limited (Materials, Metals & Mining) | | | | | | | | | | | 191,332 | | | | 19,439,215 | |
AngloGold Ashanti Limited ADR (Materials, Metals & Mining)« | | | | | | | | | | | 421,800 | | | | 21,503,364 | |
Gold Fields Limited ADR (Materials, Metals & Mining) | | | | | | | | | | | 522,700 | | | | 9,324,968 | |
Impala Platinum Holdings Limited (Materials, Metals & Mining) | | | | | | | | | | | 680,758 | | | | 21,260,596 | |
MTN Group Limited (Telecommunication Services, Wireless Telecommunication Services) | | | | | | | | | | | 1,220,776 | | | | 27,147,157 | |
Pretoria Portland Cement Company Limited (Materials, Construction Materials) | | | | | | | | | | | 1,766,835 | | | | 6,728,237 | |
Sasol Limited ADR (Energy, Oil, Gas & Consumable Fuels)« | | | | | | | | | | | 453,100 | | | | 26,198,242 | |
Standard Bank Group Limited (Financials, Commercial Banks) | | | | | | | | | | | 977,174 | | | | 15,335,604 | |
Tiger Brands Limited (Consumer Staples, Food Products) | | | | | | | | | | | 675,545 | | | | 19,808,441 | |
| | | | |
| | | | | | | | | | | | | | | 166,745,824 | |
| | | | | | | | | | | | | | | | |
| | | | |
| South Korea: 11.13% | | | | | | | | | | | | | | | | |
KB Financial Group Incorporated (Financials, Commercial Banks) | | | | | | | | | | | 56,779 | | | | 3,046,510 | |
KB Financial Group Incorporated ADR (Financials, Commercial Banks)« | | | | | | | | | | | 395,104 | | | | 21,055,092 | |
Korea Electric Power Corporation (Utilities, Electric Utilities)† | | | | | | | | | | | 222,360 | | | | 5,311,824 | |
KT Corporation ADR (Telecommunication Services, Diversified Telecommunication Services)« | | | | | | | | | | | 2,022,900 | | | | 41,064,870 | |
KT&G Corporation (Consumer Staples, Tobacco) | | | | | | | | | | | 730,491 | | | | 43,216,656 | |
Lotte Chilsung Beverage Company Limited (Consumer Staples, Beverages)† | | | | | | | | | | | 6,940 | | | | 7,434,442 | |
Lotte Confectionery Company Limited (Consumer Staples, Food Products) | | | | | | | | | | | 7,366 | | | | 10,915,138 | |
Samsung Electronics Company Limited (Information Technology, Semiconductors & Semiconductor Equipment) | | | | | | | | | | | 60,386 | | | | 50,319,319 | |
Samsung Life Insurance Company Limited (Financials, Insurance) | | | | | | | | | | | 68,000 | | | | 6,161,340 | |
Shinhan Financial Group Company Limited (Financials, Commercial Banks)† | | | | | | | | | | | 348,395 | | | | 17,067,828 | |
SK Telecom Company Limited (Telecommunication Services, Wireless Telecommunication Services) | | | | | | | | | | | 23,720 | | | | 3,596,790 | |
SK Telecom Company Limited ADR (Telecommunication Services, Wireless Telecommunication Services)« | | | | | | | | | | | 1,065,319 | | | | 20,219,755 | |
| | | | |
| | | | | | | | | | | | | | | 229,409,564 | |
| | | | | | | | | | | | | | | | |
| | | | |
| Taiwan: 8.80% | | | | | | | | | | | | | | | | |
104 Corporation (Industrials, Commercial Services & Supplies)† | | | | | | | | | | | 1,455,000 | | | | 5,436,213 | |
Asustek Computer Incorporated (Information Technology, Computers & Peripherals) | | | | | | | | | | | 504,220 | | | | 4,542,443 | |
Avermedia Technologies Incorporated (Information Technology, Computers & Peripherals)† | | | | | | | | | | | 476,887 | | | | 621,118 | |
Cathay Financial Holding Company Limited (Financials, Insurance) | | | | | | | | | | | 6,751,860 | | | | 11,269,407 | |
Chunghwa Telecom Limited ADR (Telecommunication Services, Diversified Telecommunication Services)« | | | | | | | | | | | 129,534 | | | | 4,086,798 | |
Far Eastern Textile Company Limited (Industrials, Industrial Conglomerates)† | | | | | | | | | | | 12,929,458 | | | | 20,316,204 | |
First Financial Holding Company Limited (Financials, Commercial Banks)† | | | | | | | | | | | 23,673,023 | | | | 21,946,637 | |
Fuhwa Financial Holdings Company Limited (Financials, Capital Markets)† | | | | | | | | | | | 32,855,240 | | | | 22,830,081 | |
Mediatek Incorporated (Information Technology, Semiconductors & Semiconductor Equipment)† | | | | | | | | | | | 501,881 | | | | 5,546,566 | |
Pegatron Corporation (Information Technology, Computers & Peripherals) | | | | | | | | | | | 1,096,039 | | | | 1,155,800 | |
| | | | | | |
| Portfolio of Investments—April 30, 2011 (Unaudited) | | Wells Fargo Advantage International Stock Funds | | | 47 | |
EMERGING MARKETS EQUITY FUND
| | | | | | | | | | | | | | | | |
| Security Name | | | | | | | | Shares | | | Value | |
| | | | | | | | | | | | | | | | |
| | | | |
| Taiwan (continued) | | | | | | | | | | | | | | | | |
Realtek Semiconductor Corporation (Information Technology, Semiconductors & Semiconductor Equipment)† | | | | | | | | | | | 2,771,372 | | | $ | 5,515,938 | |
Siliconware Precision Industries Company (Information Technology, Semiconductors & Semiconductor Equipment)† | | | | | | | | | | | 5,900,000 | | | | 7,869,826 | |
Taiwan Semiconductor Manufacturing Company Limited (Information Technology, Semiconductors & Semiconductor Equipment) | | | | | | | | | | | 3,068,224 | | | | 7,842,380 | |
Taiwan Semiconductor Manufacturing Company Limited ADR (Information Technology, Semiconductors & Semiconductor Equipment)« | | | | | | | | | | | 3,050,952 | | | | 41,187,852 | |
United Microelectronics Corporation (Information Technology, Semiconductors & Semiconductor Equipment) | | | | | | | | | | | 38,577,092 | | | | 20,003,485 | |
United Microelectronics Corporation ADR (Information Technology, Semiconductors & Semiconductor Equipment)« | | | | | | | | | | | 463,700 | | | | 1,316,908 | |
| | | | |
| | | | | | | | | | | | | | | 181,487,656 | |
| | | | | | | | | | | | | | | | |
| | | | |
| Thailand: 2.61% | | | | | | | | | | | | | | | | |
Bangkok Bank PCL (Financials, Commercial Banks) | | | | | | | | | | | 1,587,300 | | | | 9,039,900 | |
C.P. Seven Eleven PCL (Consumer Staples, Food & Staples Retailing) | | | | | | | | | | | 6,213,200 | | | | 9,002,375 | |
PTT Exploration & Production PCL (Energy, Oil, Gas & Consumable Fuels) | | | | | | | | | | | 1,831,300 | | | | 11,411,116 | |
PTT PCL (Energy, Oil, Gas & Consumable Fuels) | | | | | | | | | | | 1,069,200 | | | | 13,432,161 | |
Thai Beverage PCL (Consumer Staples, Beverages) | | | | | | | | | | | 46,792,000 | | | | 10,894,751 | |
| | | | |
| | | | | | | | | | | | | | | 53,780,303 | |
| | | | | | | | | | | | | | | | |
| | | | |
| Turkey: 1.63% | | | | | | | | | | | | | | | | |
Anadolu Efes Biracilik Ve Malt Sanayii AS (Consumer Staples, Beverages) | | | | | | | | | | | 824,238 | | | | 12,680,581 | |
Turkcell Iletisim Hizmetleri AS ADR (Telecommunication Services, Wireless Telecommunication Services)« | | | | | | | | | | | 1,419,700 | | | | 21,011,560 | |
| | | | |
| | | | | | | | | | | | | | | 33,692,141 | |
| | | | | | | | | | | | | | | | |
| | | | |
| United Kingdom: 0.46% | | | | | | | | | | | | | | | | |
African Barrick Gold Limited (Materials, Metals & Mining) | | | | | | | | | | | 1,078,500 | | | | 9,493,762 | |
| | | | | | | | | | | | | | | | |
| | | | |
Total Common Stocks (Cost $1,301,632,763) | | | | | | | | | | | | | | | 1,751,549,038 | |
| | | | | | | | | | | | | | | | |
| | | | |
| | | Dividend Yield | | | | | | | | | | |
| | | | |
Preferred Stocks: 3.32% | | | | | | | | | | | | | | | | |
| | | | |
| Brazil: 3.32% | | | | | | | | | | | | | | | | |
Banco Estado Rio Grande Sul (Financials, Commercial Banks) | | | 1.04 | % | | | | | | | 818,100 | | | | 9,828,432 | |
Centrais Electricas Brasileiras SA (Utilities, Electric Utilities) | | | 0.68 | | | | | | | | 467,500 | | | | 8,501,891 | |
Lojas Americanas SA (Consumer Discretionary, Multiline Retail) | | | 0.47 | | | | | | | | 2,965,100 | | | | 26,386,601 | |
Vale SA ADR (Materials, Metals & Mining)« | | | 1.29 | | | | | | | | 790,100 | | | | 23,623,990 | |
| | | | |
Total Preferred Stocks (Cost $47,194,758) | | | | | | | | | | | | | | | 68,340,914 | |
| | | | | | | | | | | | | | | | |
| | | | |
| 48 | | Wells Fargo Advantage International Stock Funds | | Portfolio of Investments—April 30, 2011 (Unaudited) |
EMERGING MARKETS EQUITY FUND
| | | | | | | | | | | | | | | | |
| Security Name | | Interest Rate | | | Maturity Date | | | Principal | | | Value | |
| | | | | | | | | | | | | | | | |
| | | | |
Convertible Debentures: 0.01% | | | | | | | | | | | | | | | | |
| | | | |
| Brazil: 0.01% | | | | | | | | | | | | | | | | |
Lupatech SA (Energy, Energy Equipment & Services)(a) | | | 6.50 | % | | | 04/15/2018 | | | | $ 303,000 | | | $ | 187,343 | |
| | | | | | | | | | | | | | | | |
| | | | |
Total Convertible Debentures (Cost $160,691) | | | | | | | | | | | | | | | 187,343 | |
| | | | | | | | | | | | | | | | |
| | | | |
| | | | | | Expiration Date | | | Shares | | | | |
| | | | |
Rights: 0.00% | | | | | | | | | | | | | | | | |
| | | | |
| Brazil: 0.00% | | | | | | | | | | | | | | | | |
Tim Participacoes SA (Telecommunication Services, Wireless Telecommunication Services)† | | | | | | | 05/11/2011 | | | | 1,534 | | | | 585 | |
| | | | | | | | | | | | | | | | |
| | | | |
Total Rights (Cost $0) | | | | | | | | | | | | | | | 585 | |
| | | | | | | | | | | | | | | | |
| | | | |
Short-Term Investments: 26.68% | | | | | | | | | | | | | | | | |
| | | | |
| | | Yield | | | | | | | | | | |
| | | | |
| Investment Companies: 26.68% | | | | | | | | | | | | | | | | |
Wells Fargo Advantage Cash Investment Money Market Fund(l)(u) | | | 0.09 | % | | | | | | | 200,822,550 | | | | 200,822,550 | |
Wells Fargo Securities Lending Cash Investment, LLC(l)(u)(v) | | | 0.20 | | | | | | | | 349,220,149 | | | | 349,220,149 | |
| | | | | | | | | | | | | | | | |
| | | | |
Total Short-Term Investments (Cost $550,042,699) | | | | | | | | | | | | | | | 550,042,699 | |
| | | | | | | | | | | | | | | | |
| | | | | | | | |
| Total Investments in Securities | | | | | | | | |
| (Cost $1,899,030,911)* | | | 114.97 | % | | | 2,370,120,579 | |
Other Assets and Liabilities, Net | | | (14.97 | ) | | | (308,559,986 | ) |
| | | | | | | | |
| Total Net Assets | | | 100.00 | % | | $ | 2,061,560,593 | |
| | | | | | | | |
| « | All or a portion of this security is on loan. |
| †† | Securities that may be resold to “qualified institutional buyers” under Rule 144A or securities offered pursuant to Section 4(2) of the Securities Act of 1933, as amended. |
| (a) | Security is fair valued by the Management Valuation Team, and in certain instances by the Board of Trustees, in accordance with procedures approved by the Board of Trustees. |
| (l) | Investment in an affiliate. |
| (u) | Rate shown is the 7-day annualized yield at period end. |
| † | Non-income earning securities. |
| (v) | Security represents investment of cash collateral received from securities on loan. |
| * | Cost for federal income tax purposes is $1,902,209,555 and net unrealized appreciation (depreciation) consists of: |
| | | | |
Gross unrealized appreciation | | $ | 486,478,591 | |
Gross unrealized depreciation | | | (18,567,567 | ) |
| | | | |
Net unrealized appreciation | | $ | 467,911,024 | |
The accompanying notes are an integral part of these financial statements.
| | | | | | |
| Portfolio of Investments—April 30, 2011 (Unaudited) | | Wells Fargo Advantage International Stock Funds | | | 49 | |
GLOBAL OPPORTUNITIES FUND
| | | | | | | | | | | | | | | | |
| Security Name | | | | | | | | Shares | | | Value | |
| | | | | | | | | | | | | | | | |
| | | | |
Common Stocks: 95.39% | | | | | | | | | | | | | | | | |
| | | | |
| Argentina: 0.60% | | | | | | | | | | | | | | | | |
IRSA Inversiones y Representaciones SA ADR (Financials, Real Estate Management & Development) | | | | | | | | | | | 194,132 | | | $ | 2,459,652 | |
| | | | | | | | | | | | | | | | |
| | | | |
| Belize: 0.18% | | | | | | | | | | | | | | | | |
Embraer SA ADR (Industrials, Aerospace & Defense) | | | | | | | | | | | 23,348 | | | | 758,343 | |
| | | | | | | | | | | | | | | | |
| | | | |
| Bermuda: 3.67% | | | | | | | | | | | | | | | | |
Arch Capital Group Limited (Financials, Insurance)Ǡ | | | | | | | | | | | 15,300 | | | | 1,591,200 | |
Catlin Group Limited (Financials, Insurance) | | | | | | | | | | | 156,616 | | | | 1,034,642 | |
Everest Re Group Limited (Financials, Insurance) | | | | | | | | | | | 31,800 | | | | 2,897,616 | |
Hiscox Limited (Financials, Insurance) | | | | | | | | | | | 362,998 | | | | 2,499,914 | |
Lancashire Holdings plc (Financials, Insurance) | | | | | | | | | | | 292,208 | | | | 3,148,178 | |
Nabors Industries Limited (Energy, Energy Equipment & Services)† | | | | | | | | | | | 73,400 | | | | 2,248,976 | |
Validus Holdings Limited (Financials, Insurance) | | | | | | | | | | | 50,039 | | | | 1,628,269 | |
| | | | |
| | | | | | | | | | | | | | | 15,048,795 | |
| | | | | | | | | | | | | | | | |
| | | | |
| Canada: 3.04% | | | | | | | | | | | | | | | | |
Agnico-Eagle Mines Limited (Materials, Metals & Mining) | | | | | | | | | | | 33,259 | | | | 2,314,161 | |
Agrium Incorporated (Materials, Chemicals) | | | | | | | | | | | 20,173 | | | | 1,824,244 | |
Eldorado Gold Corporation (Materials, Metals & Mining) | | | | | | | | | | | 74,115 | | | | 1,379,448 | |
Kinross Gold Corporation (Materials, Metals & Mining) | | | | | | | | | | | 90,968 | | | | 1,440,933 | |
Mercator Minerals Limited (Materials, Metals & Mining)† | | | | | | | | | | | 489,324 | | | | 1,815,280 | |
Parex Resources Incorporated (Energy, Oil, Gas & Consumable Fuels)† | | | | | | | | | | | 150,914 | | | | 1,153,209 | |
Quadra FNX Mining Limited (Materials, Metals & Mining)† | | | | | | | | | | | 155,228 | | | | 2,547,895 | |
| | | | |
| | | | | | | | | | | | | | | 12,475,170 | |
| | | | | | | | | | | | | | | | |
| | | | |
| China: 6.29% | | | | | | | | | | | | | | | | |
51job Incorporated ADR (Industrials, Commercial Services & Supplies)† | | | | | | | | | | | 199,386 | | | | 11,163,622 | |
First Tractor Company Limited (Industrials, Machinery) | | | | | | | | | | | 3,006,000 | | | | 4,155,546 | |
Guangzhou Automobile Group H (Consumer Discretionary, Automobiles) | | | | | | | | | | | 1,177,480 | | | | 1,334,074 | |
Netease.com Incorporated ADR (Information Technology, Internet Software & Services)† | | | | | | | | | | | 31,755 | | | | 1,564,886 | |
SINA Corporation (Information Technology, Internet Software & Services)Ǡ | | | | | | | | | | | 32,093 | | | | 4,324,532 | |
Sinotrans Limited (Industrials, Air Freight & Logistics) | | | | | | | | | | | 7,288,000 | | | | 1,784,264 | |
VanceInfo Technologies Incorporated (Information Technology, Software)† | | | | | | | | | | | 45,898 | | | | 1,476,080 | |
| | | | |
| | | | | | | | | | | | | | | 25,803,004 | |
| | | | | | | | | | | | | | | | |
| | | | |
| Denmark: 1.29% | | | | | | | | | | | | | | | | |
Pandora AS (Consumer Discretionary, Specialty Retail)« | | | | | | | | | | | 117,462 | | | | 5,290,934 | |
| | | | | | | | | | | | | | | | |
| | | | |
| Finland: 0.36% | | | | | | | | | | | | | | | | |
Outotec Oyj (Industrials, Construction & Engineering) | | | | | | | | | | | 23,054 | | | | 1,461,126 | |
| | | | | | | | | | | | | | | | |
| | | | |
| France: 5.30% | | | | | | | | | | | | | | | | |
Alten Limited (Information Technology, IT Services) | | | | | | | | | | | 47,316 | | | | 1,940,924 | |
Atos Origin SA (Information Technology, IT Services) | | | | | | | | | | | 24,250 | | | | 1,494,364 | |
Eurofins Scientific (Health Care, Life Sciences Tools & Services) | | | | | | | | | | | 22,196 | | | | 2,392,029 | |
Laurent Perrier Group (Consumer Staples, Beverages) | | | | | | | | | | | 13,254 | | | | 1,692,206 | |
Mersen (Industrials, Electrical Equipment) | | | | | | | | | | | 40,014 | | | | 2,432,307 | |
Pernod-Ricard SA (Consumer Staples, Beverages) | | | | | | | | | | | 27,124 | | | | 2,726,256 | |
Peugeot SA (Consumer Discretionary, Automobiles) | | | | | | | | | | | 64,511 | | | | 2,929,578 | |
| | | | |
| 50 | | Wells Fargo Advantage International Stock Funds | | Portfolio of Investments—April 30, 2011 (Unaudited) |
GLOBAL OPPORTUNITIES FUND
| | | | | | | | | | | | | | | | |
| Security Name | | | | | | | | Shares | | | Value | |
| | | | | | | | | | | | | | | | |
| | | | |
| France (continued) | | | | | | | | | | | | | | | | |
Scor SE (Financials, Insurance) | | | | | | | | | | | 66,117 | | | $ | 2,019,790 | |
Technip SA (Energy, Energy Equipment & Services) | | | | | | | | | | | 36,323 | | | | 4,097,394 | |
| | | | |
| | | | | | | | | | | | | | | 21,724,848 | |
| | | | | | | | | | | | | | | | |
| | | | |
| Germany: 3.14% | | | | | | | | | | | | | | | | |
Amadeus Fire AG (Industrials, Commercial Services & Supplies) | | | | | | | | | | | 56,624 | | | | 2,752,569 | |
Continental AG (Consumer Discretionary, Auto Components) | | | | | | | | | | | 17,148 | | | | 1,721,274 | |
Fresenius SE (Health Care, Health Care Equipment & Supplies) | | | | | | | | | | | 33,762 | | | | 3,543,467 | |
Kloeckner & Company SE (Industrials, Trading Companies & Distributors) | | | | | | | | | | | 107,904 | | | | 3,880,479 | |
PATRIZIA Immobilien AG (Financials, Real Estate Management & Development)† | | | | | | | | | | | 128,187 | | | | 955,017 | |
| | | | |
| | | | | | | | | | | | | | | 12,852,806 | |
| | | | | | | | | | | | | | | | |
| | | | |
| Hong Kong: 1.61% | | | | | | | | | | | | | | | | |
China Gas Holdings Limited (Utilities, Gas Utilities) | | | | | | | | | | | 1,778,114 | | | | 693,427 | |
Emperor Watch & Jewellery Limited (Consumer Discretionary, Specialty Retail) | | | | | | | | | | | 4,950,000 | | | | 715,750 | |
Geely Automobile Holdings Limited (Consumer Discretionary, Automobiles) | | | | | | | | | | | 3,465,000 | | | | 1,391,957 | |
Shangri-La Asia Limited (Consumer Discretionary, Hotels, Restaurants & Leisure) | | | | | | | | | | | 610,025 | | | | 1,704,978 | |
Techtronic Industries Company Limited (Consumer Discretionary, Household Durables) | | | | | | | | | | | 1,541,000 | | | | 2,107,994 | |
| | | | |
| | | | | | | | | | | | | | | 6,614,106 | |
| | | | | | | | | | | | | | | | |
| | | | |
| India: 0.18% | | | | | | | | | | | | | | | | |
Jain Irrigation Systems Limited (Industrials, Machinery) | | | | | | | | | | | 178,975 | | | | 740,349 | |
| | | | | | | | | | | | | | | | |
| | | | |
| Iran: 0.44% | | | | | | | | | | | | | | | | |
Charter International plc (Industrials, Machinery) | | | | | | | | | | | 131,619 | | | | 1,804,967 | |
| | | | | | | | | | | | | | | | |
| | | | |
| Ireland: 0.84% | | | | | | | | | | | | | | | | |
CPL Resources plc (Industrials, Commercial Services & Supplies) | | | | | | | | | | | 340,889 | | | | 1,464,233 | |
Kingspan Group plc (Industrials, Building Products) | | | | | | | | | | | 69,788 | | | | 674,466 | |
Willis Group Holdings plc (Financials, Insurance) | | | | | | | | | | | 31,300 | | | | 1,293,316 | |
| | | | |
| | | | | | | | | | | | | | | 3,432,015 | |
| | | | | | | | | | | | | | | | |
| | | | |
| Israel: 0.55% | | | | | | | | | | | | | | | | |
Bezeq the Israeli Telecom CP (Telecommunication Services, Diversified Telecommunication Services) | | | | | | | | | | | 755,101 | | | | 2,236,095 | |
| | | | | | | | | | | | | | | | |
| | | | |
| Italy: 0.93% | | | | | | | | | | | | | | | | |
Davide Campari Milano SpA (Consumer Staples, Beverages) | | | | | | | | | | | 311,562 | | | | 2,243,668 | |
Tod’s SpA (Consumer Discretionary, Textiles, Apparel & Luxury Goods) | | | | | | | | | | | 11,447 | | | | 1,553,901 | |
| | | | |
| | | | | | | | | | | | | | | 3,797,569 | |
| | | | | | | | | | | | | | | | |
| | | | |
| Japan: 6.85% | | | | | | | | | | | | | | | | |
Amada Company Limited (Industrials, Machinery) | | | | | | | | | | | 262,000 | | | | 2,089,798 | |
Central Japan Railway Company (Industrials, Road & Rail) | | | | | | | | | | | 180 | | | | 1,355,853 | |
Hino Motors Limited (Industrials, Machinery) | | | | | | | | | | | 177,000 | | | | 831,375 | |
Isuzu Motors Limited (Consumer Discretionary, Automobiles) | | | | | | | | | | | 1,304,000 | | | | 5,562,276 | |
JFE Holdings Incorporated (Materials, Metals & Mining) | | | | | | | | | | | 52,500 | | | | 1,427,788 | |
Keyence Corporation (Information Technology, Electronic Equipment & Instruments) | | | | | | | | | | | 2,700 | | | | 704,333 | |
Makita Corporation (Industrials, Machinery) | | | | | | | | | | | 60,100 | | | | 2,745,121 | |
OKUMA Corporation (Industrials, Machinery) | | | | | | | | | | | 287,000 | | | | 2,685,484 | |
Sumitomo Heavy Industries Limited (Industrials, Machinery) | | | | | | | | | | | 765,000 | | | | 4,979,597 | |
| | | | | | |
| Portfolio of Investments—April 30, 2011 (Unaudited) | | Wells Fargo Advantage International Stock Funds | | | 51 | |
GLOBAL OPPORTUNITIES FUND
| | | | | | | | | | | | | | | | |
| Security Name | | | | | | | | Shares | | | Value | |
| | | | | | | | | | | | | | | | |
| | | | |
| Japan (continued) | | | | | | | | | | | | | | | | |
Toshiba Machine Company Limited (Industrials, Machinery) | | | | | | | | | | | 549,263 | | | $ | 2,898,164 | |
Yahoo! Japan Corporation (Information Technology, Internet Software & Services) | | | | | | | | | | | 7,696 | | | | 2,807,429 | |
| | | | |
| | | | | | | | | | | | | | | 28,087,218 | |
| | | | | | | | | | | | | | | | |
| | | | |
| Luxembourg: 0.53% | | | | | | | | | | | | | | | | |
Acergy SA (Energy, Energy Equipment & Services) | | | | | | | | | | | 83,311 | | | | 2,191,308 | |
| | | | | | | | | | | | | | | | |
| | | | |
| Netherlands: 5.19% | | | | | | | | | | | | | | | | |
Delta Lloyd NV (Financials, Insurance)« | | | | | | | | | | | 95,462 | | | | 2,512,563 | |
New World Resources NV Class A (Materials, Metals & Mining) | | | | | | | | | | | 145,871 | | | | 2,475,541 | |
Nielsen Holdings NV (Industrials, Professional Services)Ǡ | | | | | | | | | | | 39,732 | | | | 1,187,589 | |
Nutreco Holding NV (Consumer Staples, Food Products)« | | | | | | | | | | | 26,743 | | | | 2,081,526 | |
Randstad Holding NV (Industrials, Commercial Services & Supplies) | | | | | | | | | | | 80,737 | | | | 4,541,786 | |
USG People NV (Industrials, Commercial Services & Supplies) | | | | | | | | | | | 427,891 | | | | 8,470,347 | |
| | | | |
| | | | | | | | | | | | | | | 21,269,352 | |
| | | | | | | | | | | | | | | | |
| | | | |
| Norway: 1.44% | | | | | | | | | | | | | | | | |
BW Offshore Limited (Energy, Energy Equipment & Services)† | | | | | | | | | | | 785,646 | | | | 2,036,516 | |
Petroleum Geo-Services (Energy, Energy Equipment & Services)† | | | | | | | | | | | 140,385 | | | | 2,216,845 | |
TGS Nopec Geophysical Company ASA (Energy, Energy Equipment & Services) | | | | | | | | | | | 62,601 | | | | 1,647,772 | |
| | | | |
| | | | | | | | | | | | | | | 5,901,133 | |
| | | | | | | | | | | | | | | | |
| | | | |
| Russia: 1.34% | | | | | | | | | | | | | | | | |
Mechel ADR (Materials, Metals & Mining) | | | | | | | | | | | 49,003 | | | | 1,400,016 | |
Sollers OJSC (Consumer Discretionary, Automobiles)(a) | | | | | | | | | | | 201,673 | | | | 4,089,283 | |
| | | | |
| | | | | | | | | | | | | | | 5,489,299 | |
| | | | | | | | | | | | | | | | |
| | | | |
| Spain: 0.45% | | | | | | | | | | | | | | | | |
International Consolidated Airlines (Industrials, Airlines)† | | | | | | | | | | | 467,564 | | | | 1,860,331 | |
| | | | | | | | | | | | | | | | |
| | | | |
| Switzerland: 2.67% | | | | | | | | | | | | | | | | |
Allied World Assurance Company (Financials, Insurance) | | | | | | | | | | | 13,300 | | | | 864,101 | |
Barry Callebaut AG (Consumer Staples, Food Products) | | | | | | | | | | | 2,855 | | | | 2,727,928 | |
Compagnie Financiere Richemont SA (Consumer Discretionary, Textiles, Apparel & Luxury Goods) | | | | | | | | | | | 43,480 | | | | 2,809,864 | |
Givaudan SA (Materials, Chemicals) | | | | | | | | | | | 2,154 | | | | 2,395,547 | |
Julius Baer Group Limited (Financials, Capital Markets) | | | | | | | | | | | 46,036 | | | | 2,151,185 | |
| | | | |
| | | | | | | | | | | | | | | 10,948,625 | |
| | | | | | | | | | | | | | | | |
| | | | |
| Taiwan: 0.44% | | | | | | | | | | | | | | | | |
104 Corporation (Industrials, Commercial Services & Supplies)† | | | | | | | | | | | 477,000 | | | | 1,785,920 | |
| | | | | | | | | | | | | | | | |
| | | | |
| United Kingdom: 16.12% | | | | | | | | | | | | | | | | |
Afren plc (Energy, Oil, Gas & Consumable Fuels)† | | | | | | | | | | | 1,255,114 | | | | 3,352,271 | |
Antofagasta plc (Materials, Metals & Mining) | | | | | | | | | | | 69,782 | | | | 1,593,380 | |
Ashtead Group plc (Industrials, Trading Companies & Distributors) | | | | | | | | | | | 3,005,160 | | | | 10,149,769 | |
Bovis Homes Group plc (Consumer Discretionary, Household Durables) | | | | | | | | | | | 835,438 | | | | 6,140,084 | |
Britvic plc (Consumer Staples, Beverages) | | | | | | | | | | | 163,739 | | | | 1,119,988 | |
Cookson Group plc (Industrials, Industrial Conglomerates) | | | | | | | | | | | 104,826 | | | | 1,252,813 | |
Debenhams plc (Consumer Discretionary, Multiline Retail) | | | | | | | | | | | 1,103,586 | | | | 1,255,338 | |
ENSCO plc (Energy, Energy Equipment & Services)« | | | | | | | | | | | 32,500 | | | | 1,937,650 | |
| | | | |
| 52 | | Wells Fargo Advantage International Stock Funds | | Portfolio of Investments—April 30, 2011 (Unaudited) |
GLOBAL OPPORTUNITIES FUND
| | | | | | | | | | | | | | | | |
| Security Name | | | | | | | | Shares | | | Value | |
| | | | |
| United Kingdom (continued) | | | | | | | | | | | | | | | | |
| | | | | | | | | | | | | | | | |
Fresnillo plc (Materials, Metals & Mining) | | | | | | | | | | | 88,276 | | | $ | 2,419,684 | |
Game Group plc (Consumer Discretionary, Specialty Retail) | | | | | | | | | | | 5,311,259 | | | | 4,679,801 | |
Hays plc (Industrials, Commercial Services & Supplies) | | | | | | | | | | | 1,320,080 | | | | 2,617,329 | |
ICAP plc (Financials, Capital Markets) | | | | | | | | | | | 80,348 | | | | 695,875 | |
InterContinental Hotels Group plc (Consumer Discretionary, Hotels, Restaurants & Leisure) | | | | | | | | | | | 76,137 | | | | 1,667,270 | |
N. Brown Group plc (Consumer Discretionary, Internet & Catalog Retail) | | | | | | | | | | | 270,221 | | | | 1,369,437 | |
Perform Group plc (Consumer Discretionary, Media) | | | | | | | | | | | 72,619 | | | | 277,775 | |
Persimmon plc (Consumer Discretionary, Household Durables) | | | | | | | | | | | 830,648 | | | | 6,702,881 | |
Premier Oil plc (Energy, Oil, Gas & Consumable Fuels)† | | | | | | | | | | | 39,855 | | | | 1,331,436 | |
Robert Walters plc (Industrials, Commercial Services & Supplies) | | | | | | | | | | | 163,052 | | | | 838,850 | |
Salamander Energy plc (Energy, Oil, Gas & Consumable Fuels)† | | | | | | | | | | | 212,361 | | | | 1,074,084 | |
Savills plc (Financials, Real Estate Management & Development) | | | | | | | | | | | 329,199 | | | | 2,207,758 | |
SIG plc (Industrials, Trading Companies & Distributors) | | | | | | | | | | | 566,925 | | | | 1,323,854 | |
SuperGroup plc (Consumer Discretionary, Multiline Retail)† | | | | | | | | | | | 72,103 | | | | 1,910,134 | |
Taylor Woodrow plc (Consumer Discretionary, Household Durables)† | | | | | | | | | | | 6,951,526 | | | | 4,518,027 | |
Travis Perkins plc (Industrials, Trading Companies & Distributors) | | | | | | | | | | | 314,682 | | | | 5,650,512 | |
| | | | |
| | | | | | | | | | | | | | | 66,086,000 | |
| | | | | | | | | | | | | | | | |
| | | | |
| United States: 31.94% | | | | | | | | | | | | | | | | |
Allegheny Technologies Incorporated (Materials, Metals & Mining)« | | | | | | | | | | | 22,900 | | | | 1,648,800 | |
Allete Incorporated (Utilities, Electric Utilities) | | | | | | | | | | | 17,700 | | | | 716,673 | |
Ameren Corporation (Utilities, Multi-Utilities) | | | | | | | | | | | 50,400 | | | | 1,477,224 | |
ATMI Incorporated (Information Technology, Semiconductors & Semiconductor Equipment)† | | | | | | | | | | | 37,200 | | | | 740,652 | |
Atmos Energy Corporation (Utilities, Gas Utilities)« | | | | | | | | | | | 26,400 | | | | 921,096 | |
Atwood Oceanics Incorporated (Energy, Energy Equipment & Services)† | | | | | | | | | | | 12,900 | | | | 579,597 | |
BOK Financial Corporation (Financials, Commercial Banks)« | | | | | | | | | | | 46,976 | | | | 2,526,369 | |
Brown & Brown Incorporated (Financials, Insurance) | | | | | | | | | | | 43,900 | | | | 1,134,815 | |
CA Incoporated (Information Technology, Software) | | | | | | | | | | | 122,700 | | | | 3,017,193 | |
Cimarex Energy Company (Energy, Oil, Gas & Consumable Fuels) | | | | | | | | | | | 21,200 | | | | 2,344,508 | |
Comstock Resources Incorporated (Energy, Oil, Gas & Consumable Fuels)Ǡ | | | | | | | | | | | 40,300 | | | | 1,292,018 | |
Con-way Incorporated (Industrials, Road & Rail)« | | | | | | | | | | | 71,400 | | | | 2,778,888 | |
DaVita Incorporated (Health Care, Health Care Providers & Services)† | | | | | | | | | | | 19,900 | | | | 1,752,991 | |
Dice Holdings Incorporated (Information Technology, Internet Software & Services)† | | | | | | | | | | | 300,157 | | | | 5,501,878 | |
Discover Financial Services (Financials, Consumer Finance) | | | | | | | | | | | 57,200 | | | | 1,420,848 | |
Dun & Bradstreet Corporation (Industrials, Commercial Services & Supplies)« | | | | | | | | | | | 11,700 | | | | 961,506 | |
EMCOR Group Incorporated (Industrials, Construction & Engineering)Ǡ | | | | | | | | | | | 93,000 | | | | 2,880,210 | |
Fidelity National Financial Incorporated (Financials, Insurance) | | | | | | | | | | | 148,700 | | | | 2,295,928 | |
Fifth Third Bancorp (Financials, Commercial Banks) | | | | | | | | | | | 127,808 | | | | 1,696,012 | |
First Citizens Bancshares Incorporated Class A (Financials, Commercial Banks) | | | | | | | | | | | 12,227 | | | | 2,445,522 | |
FMC Corporation (Materials, Chemicals) | | | | | | | | | | | 14,300 | | | | 1,262,404 | |
Forest Oil Corporation (Energy, Oil, Gas & Consumable Fuels)† | | | | | | | | | | | 48,200 | | | | 1,730,862 | |
Global Payments Incorporated (Information Technology, IT Services)« | | | | | | | | | | | 46,801 | | | | 2,491,685 | |
Heidrick & Struggles International Incorporated (Industrials, Commercial Services & Supplies)« | | | | | | | | | | | 188,527 | | | | 4,411,532 | |
Hillenbrand Incorporated (Consumer Discretionary, Diversified Consumer Services) | | | | | | | | | | | 42,925 | | | | 983,841 | |
Huntington Ingalls Industries Incorporated (Industrials, Aerospace & Defense)† | | | | | | | | | | | 14,200 | | | | 568,000 | |
IAC/InterActiveCorporation (Information Technology, Internet Software & Services)† | | | | | | | | | | | 50,400 | | | | 1,819,944 | |
Imation Corporation (Information Technology, Computers & Peripherals)† | | | | | | | | | | | 152,902 | | | | 1,570,304 | |
Ingram Micro Incorporated Class A (Information Technology, Electronic Equipment & Instruments)† | | | | | | | | | | | 90,400 | | | | 1,693,192 | |
ITT Corporation (Industrials, Aerospace & Defense) | | | | | | | | | | | 41,800 | | | | 2,415,622 | |
Jarden Corporation (Consumer Discretionary, Household Durables) | | | | | | | | | | | 48,900 | | | | 1,779,471 | |
| | | | | | |
| Portfolio of Investments—April 30, 2011 (Unaudited) | | Wells Fargo Advantage International Stock Funds | | | 53 | |
GLOBAL OPPORTUNITIES FUND
| | | | | | | | | | | | | | | | |
| Security Name | | | | | | | | Shares | | | Value | |
| | | | | | | | | | | | | | | | |
| | | | |
| United States (continued) | | | | | | | | | | | | | | | | |
Kirby Corporation (Industrials, Marine)Ǡ | | | | | | | | | | | 39,700 | | | $ | 2,254,166 | |
Kroger Company (Consumer Staples, Food & Staples Retailing) | | | | | | | | | | | 136,400 | | | | 3,315,884 | |
L-3 Communications Holdings Incorporated (Industrials, Aerospace & Defense) | | | | | | | | | | | 27,400 | | | | 2,197,206 | |
Lear Corporation (Consumer Discretionary, Auto Components) | | | | | | | | | | | 29,900 | | | | 1,529,086 | |
McKesson Corporation (Health Care, Health Care Providers & Services) | | | | | | | | | | | 10,700 | | | | 888,207 | |
Mohawk Industries Incorporated (Consumer Discretionary, Household Durables)† | | | | | | | | | | | 25,000 | | | | 1,501,000 | |
Molex Incorporated Class A (Information Technology, Electronic Equipment & Instruments) | | | | | | | | | | | 79,300 | | | | 1,785,836 | |
Monster Worldwide Incorporated (Information Technology, Internet Software & Services)Ǡ | | | | | | | | | | | 139,336 | | | | 2,286,504 | |
Mueller Industries Incorporated (Industrials, Machinery) | | | | | | | | | | | 42,802 | | | | 1,674,414 | |
Ocean Rig UDW Incorporated (Energy, Energy Equipment & Services)† | | | | | | | | | | | 182,164 | | | | 3,923,404 | |
Olin Corporation (Materials, Chemicals) | | | | | | | | | | | 29,500 | | | | 759,330 | |
Omnicare Incorporated (Health Care, Health Care Providers & Services)« | | | | | | | | | | | 78,200 | | | | 2,457,044 | |
ON Semiconductor Corporation (Information Technology, Semiconductors & Semiconductor Equipment)† | | | | | | | | | | | 67,400 | | | | 708,374 | |
Owens Corning (Industrials, Building Products)† | | | | | | | | | | | 44,661 | | | | 1,689,972 | |
Owens-Illinois Incorporated (Materials, Containers & Packaging)† | | | | | | | | | | | 102,100 | | | | 3,029,307 | |
People’s United Financial Incorporated (Financials, Thrifts & Mortgage Finance)« | | | | | | | | | | | 194,100 | | | | 2,657,229 | |
Pharmaceutical Product Development Incorporated (Health Care, Life Sciences Tools & Services)« | | | | | | | | | | | 63,000 | | | | 1,943,550 | |
Quad Graphics Incorporated (Industrials, Commercial Services & Supplies)† | | | | | | | | | | | 26,900 | | | | 1,077,614 | |
Quest Diagnostics Incorporated (Health Care, Health Care Providers & Services)« | | | | | | | | | | | 35,700 | | | | 2,012,766 | |
Ralcorp Holdings Incorporated (Consumer Staples, Food Products)Ǡ | | | | | | | | | | | 26,300 | | | | 2,046,140 | |
Regal-Beloit Corporation (Industrials, Electrical Equipment) | | | | | | | | | | | 23,300 | | | | 1,765,907 | |
Rent-A-Center Incorporated (Consumer Discretionary, Diversified Consumer Services) | | | | | | | | | | | 46,600 | | | | 1,418,970 | |
Rock-Tenn Company Class A (Materials, Containers & Packaging)« | | | | | | | | | | | 9,000 | | | | 621,630 | |
Royal Gold Incorporated (Materials, Metals & Mining) | | | | | | | | | | | 12,400 | | | | 756,152 | |
SAIC Incorporated (Information Technology, IT Services)Ǡ | | | | | | | | | | | 149,100 | | | | 2,594,340 | |
Silgan Holdings Incorporated (Materials, Containers & Packaging) | | | | | | | | | | | 47,000 | | | | 2,155,420 | |
Sohu.com Incorporated (Information Technology, Internet Software & Services)Ǡ | | | | | | | | | | | 23,777 | | | | 2,514,656 | |
Southwestern Energy Company (Energy, Oil, Gas & Consumable Fuels)† | | | | | | | | | | | 41,800 | | | | 1,833,348 | |
Stanley Black & Decker Incorporated (Consumer Discretionary, Household Durables) | | | | | | | | | | | 21,800 | | | | 1,583,770 | |
Sysco Corporation (Consumer Staples, Food & Staples Retailing)« | | | | | | | | | | | 86,000 | | | | 2,486,260 | |
Towers Watson & Company (Industrials, Commercial Services & Supplies) | | | | | | | | | | | 26,300 | | | | 1,508,568 | |
Trinity Industries Incorporated (Industrials, Machinery) | | | | | | | | | | | 14,000 | | | | 506,800 | |
UMB Financial Corporation (Financials, Commercial Banks)« | | | | | | | | | | | 48,770 | | | | 2,053,705 | |
W.R. Berkley Corporation (Financials, Insurance) | | | | | | | | | | | 46,400 | | | | 1,513,104 | |
Wendy’s Arby’s Group Incorporated (Consumer Discretionary, Hotels, Restaurants & Leisure) | | | | | | | | | | | 142,129 | | | | 685,062 | |
Westar Energy Incorporated (Utilities, Electric Utilities)« | | | | | | | | | | | 77,200 | | | | 2,100,612 | |
Wisconsin Energy Corporation (Utilities, Electric Utilities) | | | | | | | | | | | 40,400 | | | | 1,260,884 | |
WMS Industries Incorporated (Consumer Discretionary, Hotels, Restaurants & Leisure)Ǡ | | | | | | | | | | | 20,200 | | | | 662,560 | |
Wolseley plc (Industrials, Trading Companies & Distributors) | | | | | | | | | | | 75,111 | | | | 2,720,008 | |
Zimmer Holdings Incorporated (Health Care, Health Care Equipment & Supplies)† | | | | | | | | | | | 24,800 | | | | 1,618,200 | |
| | | | |
| | | | | | | | | | | | | | | 130,956,574 | |
| | | | | | | | | | | | | | | | |
| | | |
Total Common Stocks (Cost $289,162,579) | | | | | | | | | | | | 391,075,539 | |
| | | | | | | | | | | | | | | | |
| | | | |
| 54 | | Wells Fargo Advantage International Stock Funds | | Portfolio of Investments—April 30, 2011 (Unaudited) |
GLOBAL OPPORTUNITIES FUND
| | | | | | | | | | | | |
| Security Name | | Yield | | | Shares | | | Value | |
| | | | | | | | | | | | |
| | |
Short-Term Investments: 14.55% | | | | | | | | | |
| | |
| Investment Companies: 14.55% | | | | | | | | | |
Wells Fargo Advantage Cash Investment Money Market Fund (l)(u) | | | 0.09 | % | | | 16,020,017 | | | $ | 16,020,017 | |
Wells Fargo Securities Lending Cash Investments, LLC (l)(u)(v) | | | 0.20 | | | | 43,644,285 | | | | 43,644,285 | |
| | | | | | | | | | | | |
| | |
Total Short-Term Investments (Cost $59,664,302) | | | | | | | | 59,664,302 | |
| | | | | | | | | | | | |
| | | | | | | | |
| Total Investments in Securities | | | | | | | | |
| (Cost $348,826,881)* | | | 109.94 | % | | | 450,739,841 | |
Other Assets and Liabilities, Net | | | (9.94 | ) | | | (40,765,472 | ) |
| | | | | | | | |
| Total Net Assets | | | 100.00 | % | | $ | 409,974,369 | |
| | | | | | | | |
| « | All or a portion of this security is on loan. |
| † | Non-income earning securities. |
| (a) | Security is fair valued by the Management Valuation Team, and in certain instances by the Board of Trustees, in accordance with procedures approved by the Board of Trustees. |
| (l) | Investment in an affiliate. |
| (u) | Rate shown is the 7-day annualized yield at period end. |
| (v) | Security represents investment of cash collateral received from securities on loan. |
| * | Cost for federal income tax purposes is $350,643,052 and net unrealized appreciation (depreciation) consists of: |
| | | | |
Gross unrealized appreciation | | $ | 104,899,174 | |
Gross unrealized depreciation | | | (4,802,385 | ) |
| | | | |
Net unrealized appreciation | | $ | 100,096,789 | |
The accompanying notes are an integral part of these financial statements.
| | | | | | |
| Portfolio of Investments—April 30, 2011 (Unaudited) | | Wells Fargo Advantage International Stock Funds | | | 55 | |
INTERNATIONAL EQUITY FUND
| | | | | | | | | | | | | | | | |
| Security Name | | | | | | | | Shares | | | Value | |
| | | | | | | | | | | | | | | | |
| | | |
Common Stocks: 96.63% | | | | | | | | | | | | | |
| | | |
| Argentina: 0.51% | | | | | | | | | | | | | |
Irsa Inversiones y Representaciones SA ADR (Financials, Real Estate Management & Development) | | | | | | | | | | | 252,259 | | | $ | 3,196,122 | |
| | | | | | | | | | | | | | | | |
| | | |
| Australia: 3.07% | | | | | | | | | | | | | |
AMP Limited (Financials, Insurance) | | | | | | | | | | | 392,082 | | | | 2,355,089 | |
Commonwealth Bank of Australia (Financials, Commercial Banks) | | | | | | | | | | | 78,872 | | | | 4,643,313 | |
Macquarie Group Limited (Financials, Capital Markets) | | | | | | | | | | | 71,768 | | | | 2,765,857 | |
Newcrest Mining Limited (Materials, Metals & Mining) | | | | | | | | | | | 113,015 | | | | 5,134,647 | |
Westpac Banking Corporation (Financials, Commercial Banks) | | | | | | | | | | | 154,271 | | | | 4,200,353 | |
| | | | |
| | | | | | | | | | | | | | | 19,099,259 | |
| | | | | | | | | | | | | | | | |
| | | |
| Belgium: 0.67% | | | | | | | | | | | | | |
Anheuser-Busch InBev NV (Consumer Staples, Beverages)« | | | | | | | | | | | 65,643 | | | | 4,185,628 | |
| | | | | | | | | | | | | | | | |
| | | |
| Brazil: 0.43% | | | | | | | | | | | | | |
Banco Bradesco SA ADR (Financials, Commercial Banks)« | | | | | | | | | | | 133,370 | | | | 2,698,075 | |
| | | | | | | | | | | | | | | | |
| | | |
| Canada: 4.93% | | | | | | | | | | | | | |
Brookfield Asset Management Incorporated (Financials, Real Estate Management & Development)« | | | | | | | | | | | 221,332 | | | | 7,441,182 | |
Canadian Natural Resources Limited (Energy, Oil, Gas & Consumable Fuels) | | | | | | | | | | | 154,367 | | | | 7,261,930 | |
EnCana Corporation (Energy, Oil, Gas & Consumable Fuels) | | | | | | | | | | | 58,396 | | | | 1,962,066 | |
Goldcorp Incorporated (Materials, Metals & Mining) | | | | | | | | | | | 63,844 | | | | 3,568,894 | |
Suncor Energy Incorporated (Energy, Oil, Gas & Consumable Fuels) | | | | | | | | | | | 105,788 | | | | 4,875,987 | |
Teck Cominco Incorporated Limited (Materials, Metals & Mining) | | | | | | | | | | | 101,308 | | | | 5,506,812 | |
| | | | |
| | | | | | | | | | | | | | | 30,616,871 | |
| | | | | | | | | | | | | | | | |
| | | |
| Cayman Islands: 2.30% | | | | | | | | | | | | | |
Netease.com Incorporated ADR (Information Technology, Internet Software & Services)Ǡ | | | | | | | | | | | 59,152 | | | | 2,915,011 | |
SINA Corporation (Information Technology, Internet Software & Services)Ǡ | | | | | | | | | | | 84,537 | | | | 11,391,361 | |
| | | | |
| | | | | | | | | | | | | | | 14,306,372 | |
| | | | | | | | | | | | | | | | |
| | | |
| China: 3.07% | | | | | | | | | | | | | |
Baidu.com Incorporated ADR (Information Technology, Internet Software & Services)† | | | | | | | | | | | 21,526 | | | | 3,197,042 | |
China Infrastructure Machinery Holdings Limited (Industrials, Machinery) | | | | | | | | | | | 3,664,000 | | | | 2,720,997 | |
China Mobile Limited ADR (Telecommunication Services, Wireless Telecommunication Services)« | | | | | | | | | | | 45,406 | | | | 2,092,763 | |
Ctrip.com International Limited ADR (Consumer Discretionary, Specialty Retail)Ǡ | | | | | | | | | | | 43,988 | | | | 2,143,095 | |
Shanghai Electric Group company Limited (Industrials, Electrical Equipment) | | | | | | | | | | | 6,960,000 | | | | 3,470,418 | |
Tencent Holdings Limited (Information Technology, Internet Software & Services) | | | | | | | | | | | 104,500 | | | | 2,986,005 | |
ZTE Corporation (Telecommunication Services, Wireless Telecommunication Services) | | | | | | | | | | | 682,080 | | | | 2,459,999 | |
| | | | |
| | | | | | | | | | | | | | | 19,070,319 | |
| | | | | | | | | | | | | | | | |
| | | |
| Denmark: 0.72% | | | | | | | | | | | | | |
Carlsberg A/S (Consumer Staples, Beverages) | | | | | | | | | | | 37,468 | | | | 4,449,934 | |
| | | | | | | | | | | | | | | | |
| | | |
| France: 11.05% | | | | | | | | | | | | | |
Alstom RGPT (Industrials, Machinery) | | | | | | | | | | | 65,689 | | | | 4,368,071 | |
BNP Paribas SA (Financials, Commercial Banks) | | | | | | | | | | | 86,388 | | | | 6,836,561 | |
Carrefour SA (Consumer Staples, Food & Staples Retailing) | | | | | | | | | | | 68,827 | | | | 3,263,199 | |
Compagnie de Saint-Gobain (Industrials, Building Products) | | | | | | | | | | | 90,117 | | | | 6,224,691 | |
France Telecom SA (Telecommunication Services, Diversified Telecommunication Services) | | | | | | | | | | | 225,977 | | | | 5,300,067 | |
Groupe Danone (Consumer Staples, Food Products)« | | | | | | | | | | | 53,666 | | | | 3,931,050 | |
| | | | |
| 56 | | Wells Fargo Advantage International Stock Funds | | Portfolio of Investments—April 30, 2011 (Unaudited) |
INTERNATIONAL EQUITY FUND
| | | | | | | | | | | | | | | | |
| Security Name | | | | | | | | Shares | | | Value | |
| | | | | | | | | | | | | | | | |
| | | | |
| France (continued) | | | | | | | | | | | | | | | | |
LVMH Moet Hennessy Louis Vuitton SA (Consumer Discretionary, Textiles, Apparel & Luxury Goods) | | | | | | | | | | | 36,147 | | | $ | 6,491,620 | |
Pernod-Ricard (Consumer Staples, Beverages) | | | | | | | | | | | 58,951 | | | | 5,925,215 | |
Peugeot SA (Consumer Discretionary, Automobiles) | | | | | | | | | | | 67,555 | | | | 3,067,812 | |
Pinault-Printempts-Redoute SA (Consumer Discretionary, Multiline Retail) | | | | | | | | | | | 32,280 | | | | 5,773,242 | |
Publicis Groupe (Consumer Discretionary, Media) | | | | | | | | | | | 55,344 | | | | 3,136,278 | |
Sanofi-Aventis SA (Health Care, Pharmaceuticals)« | | | | | | | | | | | 51,236 | | | | 4,052,430 | |
Technip SA (Energy, Energy Equipment & Services) | | | | | | | | | | | 56,854 | | | | 6,413,381 | |
Total SA (Energy, Oil, Gas & Consumable Fuels) | | | | | | | | | | | 60,798 | | | | 3,892,003 | |
| | | | |
| | | | | | | | | | | | | | | 68,675,620 | |
| | | | | | | | | | | | | | | | |
| | | |
| Germany: 10.20% | | | | | | | | | | | | | |
Allianz AG (Financials, Insurance)« | | | | | | | | | | | 47,069 | | | | 7,410,838 | |
BASF SE (Materials, Chemicals) | | | | | | | | | | | 56,539 | | | | 5,811,747 | |
Bayer AG (Health Care, Pharmaceuticals)« | | | | | | | | | | | 87,853 | | | | 7,722,829 | |
Daimler AG (Consumer Discretionary, Automobiles) | | | | | | | | | | | 88,582 | | | | 6,847,497 | |
Deutsche Boerse AG (Financials, Diversified Financial Services) | | | | | | | | | | | 34,639 | | | | 2,878,242 | |
Fresenius SE & Company KGa (Health Care, Health Care Equipment & Supplies) | | | | | | | | | | | 81,078 | | | | 8,509,485 | |
Hochtief AG (Industrials, Construction & Engineering) | | | | | | | | | | | 36,287 | | | | 3,436,013 | |
Metro AG (Consumer Staples, Food & Staples Retailing) | | | | | | | | | | | 64,632 | | | | 4,743,885 | |
Muenchener Rueckversicherungs-Gesellschaft AG (Financials, Insurance) | | | | | | | | | | | 25,554 | | | | 4,218,306 | |
SAP AG (Information Technology, Software) | | | | | | | | | | | 75,753 | | | | 4,880,768 | |
Siemens AG (Industrials, Industrial Conglomerates) | | | | | | | | | | | 47,616 | | | | 6,927,107 | |
| | | | |
| | | | | | | | | | | | | | | 63,386,717 | |
| | | | | | | | | | | | | | | | |
| | | |
| Israel: 0.54% | | | | | | | | | | | | | |
Teva Pharmaceutical Industries Limited ADR (Health Care, Pharmaceuticals) | | | | | | | | | | | 73,022 | | | | 3,339,296 | |
| | | | | | | | | | | | | | | | |
| | | |
| Italy: 0.65% | | | | | | | | | | | | | |
Intesa Sanpaolo (Financials, Commercial Banks) | | | | | | | | | | | 1,208,590 | | | | 4,013,411 | |
| | | | | | | | | | | | | | | | |
| | | |
| Japan: 11.69% | | | | | | | | | | | | | |
Canon Incorporated (Information Technology, Office Electronics) | | | | | | | | | | | 88,900 | | | | 4,164,704 | |
Isuzu Motors Limited (Consumer Discretionary, Automobiles) | | | | | | | | | | | 1,864,000 | | | | 7,950,983 | |
JFE Holdings Incorporated (Materials, Metals & Mining) | | | | | | | | | | | 83,400 | | | | 2,268,143 | |
Komatsu Limited (Industrials, Machinery) | | | | | | | | | | | 256,200 | | | | 8,970,080 | |
Makita Corporation (Industrials, Machinery) | | | | | | | | | | | 127,900 | | | | 5,841,947 | |
Mitsubishi UFJ Financial Group Incorporated (Financials, Commercial Banks) | | | | | | | | | | | 865,000 | | | | 4,126,919 | |
Nintendo Company Limited (Information Technology, Software) | | | | | | | | | | | 14,900 | | | | 3,521,334 | |
NKSJ Holdings Incorporated (Financials, Insurance) | | | | | | | | | | | 350,000 | | | | 2,235,098 | |
Nomura Holdings Incorporated (Financials, Capital Markets) | | | | | | | | | | | 581,700 | | | | 2,954,576 | |
Sumitomo Heavy Industries Limited (Industrials, Machinery) | | | | | | | | | | | 1,396,000 | | | | 9,086,951 | |
Sumitomo Mitsui Financial Group Incorporated (Financials, Commercial Banks) | | | | | | | | | | | 49,400 | | | | 1,519,485 | |
Tokyo Electron Limited (Information Technology, Semiconductors & Semiconductor Equipment) | | | | | | | | | | | 41,700 | | | | 2,398,206 | |
Toshiba Corporation (Information Technology, Computers & Peripherals) | | | | | | | | | | | 340,000 | | | | 1,789,805 | |
Toyota Motor Corporation (Consumer Discretionary, Automobiles) | | | | | | | | | | | 284,700 | | | | 11,336,756 | |
Yahoo! Japan Corporation (Information Technology, Internet Software & Services) | | | | | | | | | | | 12,288 | | | | 4,482,548 | |
| | | | |
| | | | | | | | | | | | | | | 72,647,535 | |
| | | | | | | | | | | | | | | | |
| | | |
| Luxembourg: 0.23% | | | | | | | | | | | | | |
ArcelorMittal (Materials, Metals & Mining) | | | | | | | | | | | 38,696 | | | | 1,423,694 | |
| | | | | | | | | | | | | | | | |
| | | | | | |
| Portfolio of Investments—April 30, 2011 (Unaudited) | | Wells Fargo Advantage International Stock Funds | | | 57 | |
INTERNATIONAL EQUITY FUND
| | | | | | | | | | | | | | | | |
| Security Name | | | | | | | | Shares | | | Value | |
| | | | | | | | | | | | | | | | |
| | | |
| Netherlands: 5.46% | | | | | | | | | | | | | |
ASML Holding NV (Information Technology, Semiconductors & Semiconductor Equipment)« | | | | | | | | | | | 82,311 | | | $ | 3,408,132 | |
ING Groep NV (Financials, Diversified Financial Services) | | | | | | | | | | | 369,605 | | | | 4,872,220 | |
New World Resources NV (Materials, Metals & Mining) | | | | | | | | | | | 228,223 | | | | 3,873,116 | |
Nielsen Holdings NV (Industrials, Professional Services)Ǡ | | | | | | | | | | | 31,700 | | | | 947,513 | |
Randstad Holdings NV (Industrials, Commercial Services & Supplies) | | | | | | | | | | | 175,628 | | | | 9,879,792 | |
Unilever NV (Consumer Staples, Food Products) | | | | | | | | | | | 87,508 | | | | 2,879,989 | |
USG People NV (Industrials, Commercial Services & Supplies) | | | | | | | | | | | 406,436 | | | | 8,045,633 | |
| | | | |
| | | | | | | | | | | | | | | 33,906,395 | |
| | | | | | | | | | | | | | | | |
| | | |
| Norway: 0.53% | | | | | | | | | | | | | |
Telenor ASA (Telecommunication Services, Diversified Telecommunication Services) | | | | | | | | | | | 190,343 | | | | 3,288,719 | |
| | | | | | | | | | | | | | | | |
| | | |
| Singapore: 0.45% | | | | | | | | | | | | | |
DBS Group Holdings Limited (Financials, Commercial Banks) | | | | | | | | | | | 227,000 | | | | 2,782,660 | |
| | | | | | | | | | | | | | | | |
| | | |
| South Korea: 1.60% | | | | | | | | | | | | | |
Hyundai Motor Company Limited (Consumer Discretionary, Automobiles) | | | | | | | | | | | 24,625 | | | | 5,664,221 | |
Samsung Electronics Company Limited (Information Technology, Semiconductors & Semiconductor Equipment) | | | | | | | | | | | 5,171 | | | | 4,308,966 | |
| | | | |
| | | | | | | | | | | | | | | 9,973,187 | |
| | | | | | | | | | | | | | | | |
| | | |
| Spain: 4.31% | | | | | | | | | | | | | |
Banco Bilbao Vizcaya Argentaria SA (Financials, Commercial Banks) | | | | | | | | | | | 197,253 | | | | 2,530,117 | |
Banco Santander Central Hispano SA (Financials, Commercial Banks)« | | | | | | | | | | | 299,991 | | | | 3,831,028 | |
Industria de Diseno Textil SA (Consumer Discretionary, Specialty Retail) | | | | | | | | | | | 37,539 | | | | 3,366,078 | |
International Consolidated Airlines Group SA (Industrials, Airlines)† | | | | | | | | | | | 660,703 | | | | 2,628,787 | |
Repsol YPF SA (Energy, Oil, Gas & Consumable Fuels) | | | | | | | | | | | 262,461 | | | | 9,372,621 | |
Telefonica SA (Telecommunication Services, Diversified Telecommunication Services) | | | | | | | | | | | 188,144 | | | | 5,057,852 | |
| | | | |
| | | | | | | | | | | | | | | 26,786,483 | |
| | | | | | | | | | | | | | | | |
| | | |
| Switzerland: 9.42% | | | | | | | | | | | | | |
ABB Limited (Industrials, Electrical Equipment) | | | | | | | | | | | 121,677 | | | | 3,359,129 | |
Compagnie Financiere Richemont SA (Consumer Discretionary, Textiles, Apparel & Luxury Goods) | | | | | | | | | | | 102,295 | | | | 6,610,740 | |
Credit Suisse Group (Financials, Capital Markets) | | | | | | | | | | | 142,728 | | | | 6,486,286 | |
Nestle SA (Consumer Staples, Food Products) | | | | | | | | | | | 177,036 | | | | 10,990,559 | |
Novartis AG (Health Care, Pharmaceuticals) | | | | | | | | | | | 150,004 | | | | 8,904,862 | |
Roche Holdings AG (Health Care, Pharmaceuticals) | | | | | | | | | | | 24,309 | | | | 3,942,835 | |
Swatch Group AG Class B (Consumer Discretionary, Textiles, Apparel & Luxury Goods) | | | | | | | | | | | 12,795 | | | | 6,293,957 | |
UBS AG (Financials, Capital Markets) | | | | | | | | | | | 265,623 | | | | 5,309,389 | |
Zurich Financial Services AG (Financials, Insurance) | | | | | | | | | | | 23,530 | | | | 6,610,162 | |
| | | | |
| | | | | | | | | | | | | | | 58,507,919 | |
| | | | | | | | | | | | | | | | |
| | | |
| United Kingdom: 24.80% | | | | | | | | | | | | | |
Anglo American plc (Materials, Metals & Mining) | | | | | | | | | | | 84,545 | | | | 4,406,761 | |
Antofagasta plc (Materials, Metals & Mining) | | | | | | | | | | | 309,548 | | | | 7,068,120 | |
Ashtead Group plc (Industrials, Trading Companies & Distributors) | | | | | | | | | | | 1,659,066 | | | | 5,603,408 | |
Barclays plc (Financials, Commercial Banks) | | | | | | | | | | | 1,546,768 | | | | 7,293,626 | |
BG Group plc (Health Care, Health Care Providers & Services) | | | | | | | | | | | 231,122 | | | | 5,920,147 | |
BHP Billiton plc (Materials, Metals & Mining) | | | | | | | | | | | 246,487 | | | | 10,393,859 | |
| | | | |
| 58 | | Wells Fargo Advantage International Stock Funds | | Portfolio of Investments—April 30, 2011 (Unaudited) |
INTERNATIONAL EQUITY FUND
| | | | | | | | | | | | | | | | |
| Security Name | | | | | | | | Shares | | | Value | |
| | | | | | | | | | | | | | | | |
| | | | |
| United Kingdom (continued) | | | | | | | | | | | | | | | | |
BP plc (Energy, Oil, Gas & Consumable Fuels) | | | | | | | | | | | 470,868 | | | $ | 3,638,022 | |
Burberry Group plc (Consumer Discretionary, Textiles, Apparel & Luxury Goods) | | | | | | | | | | | 247,980 | | | | 5,364,063 | |
Cookson Group plc (Utilities, Multi-Utilities) | | | | | | | | | | | 254,736 | | | | 3,044,440 | |
Diageo plc (Consumer Staples, Beverages) | | | | | | | | | | | 266,303 | | | | 5,417,897 | |
Experian Group Limited (Financials, Diversified Financial Services) | | | | | | | | | | | 217,780 | | | | 2,933,795 | |
Game Group plc (Consumer Discretionary, Specialty Retail) | | | | | | | | | | | 2,885,289 | | | | 2,542,256 | |
GlaxoSmithKline plc (Health Care, Pharmaceuticals) | | | | | | | | | | | 274,746 | | | | 5,991,226 | |
Hays plc (Industrials, Commercial Services & Supplies) | | | | | | | | | | | 1,392,610 | | | | 2,761,135 | |
HSBC Holdings plc (Financials, Commercial Banks) | | | | | | | | | | | 1,005,181 | | | | 11,004,191 | |
Intercontinental Hotels Group plc (Consumer Discretionary, Hotels, Restaurants & Leisure) | | | | | | | | | | | 156,572 | | | | 3,428,658 | |
Intertek Group plc (Industrials, Commercial Services & Supplies) | | | | | | | | | | | 83,996 | | | | 2,981,432 | |
Kingfisher plc (Consumer Discretionary, Specialty Retail) | | | | | | | | | | | 506,913 | | | | 2,324,252 | |
Lloyds TSB Group plc (Financials, Commercial Banks)† | | | | | | | | | | | 4,816,727 | | | | 4,767,029 | |
Persimmon plc (Consumer Discretionary, Household Durables) | | | | | | | | | | | 495,866 | | | | 4,001,371 | |
Rio Tinto plc (Materials, Metals & Mining) | | | | | | | | | | | 133,797 | | | | 9,744,068 | |
Royal Dutch Shell plc Class A (Energy, Oil, Gas & Consumable Fuels) | | | | | | | | | | | 251,633 | | | | 9,761,819 | |
SABMiller plc (Consumer Staples, Beverages) | | | | | | | | | | | 82,875 | | | | 3,093,224 | |
Standard Chartered plc (Financials, Commercial Banks) | | | | | | | | | | | 144,046 | | | | 3,991,674 | |
Travis Perkins plc (Industrials, Trading Companies & Distributors) | | | | | | | | | | | 242,942 | | | | 4,362,330 | |
Vodafone Group plc (Telecommunication Services, Wireless Telecommunication Services) | | | | | | | | | | | 3,780,961 | | | | 10,837,445 | |
WPP plc (Consumer Discretionary, Media) | | | | | | | | | | | 263,010 | | | | 3,433,276 | |
Xstrata plc (Materials, Metals & Mining) | | | | | | | | | | | 313,083 | | | | 7,956,809 | |
| | | | |
| | | | | | | | | | | | | | | 154,066,333 | |
| | | | | | | | | | | | | | | | |
| | | | |
Total Common Stocks (Cost $413,273,126) | | | | | | | | | | | | | | | 600,420,549 | |
| | | | | | | | | | | | | | | | |
| | | | |
Short-Term Investments: 13.12% | | | | | | | | | | | | | | | | |
| | | | |
| | | Yield | | | | | | Shares | | | | |
| | | | |
| Investment Companies: 12.91% | | | | | | | | | | | | | | | | |
Wells Fargo Advantage Cash Investment Money Market Fund(l)(u) | | | 0.09 | % | | | | | | | 21,159,393 | | | | 21,159,393 | |
Wells Fargo Securities Lending Cash Investments, LLC(l)(u)(v) | | | 0.20 | | | | | | | | 59,043,076 | | | | 59,043,076 | |
| | | | |
| | | | | | | | | | | | | | | 80,202,469 | |
| | | | | | | | | | | | | | | | |
| | | | |
| | | | | | Maturity Date | | | Principal | | | | |
| | | | |
| US Treasury Bills: 0.21% | | | | | | | | | | | | | | | | |
US Treasury Bill^# | | | 0.02 | % | | | 05/26/2011 | | | | $ 1,285,000 | | | | 1,284,983 | |
| | | | | | | | | | | | | | | | |
| | | | |
Total Short-Term Investments (Cost $81,487,370) | | | | | | | | | | | | | | | 81,487,452 | |
| | | | | | | | | | | | | | | | |
| | | | | | | | |
| Total Investments in Securities | | | | | | | | |
| (Cost $494,760,496)* | | | 109.75 | % | | | 681,908,001 | |
Other Assets and Liabilities, Net | | | (9.75 | ) | | | (60,577,193 | ) |
| | | | | | | | |
Total Net Assets | | | 100.00 | % | | $ | 621,330,808 | |
| | | | | | | | |
| | | | | | |
| Portfolio of Investments—April 30, 2011 (Unaudited) | | Wells Fargo Advantage International Stock Funds | | | 59 | |
INTERNATIONAL EQUITY FUND
| « | All or a portion of this security is on loan. |
| † | Non-income earning securities. |
| ^ | Zero coupon security. Rate represents yield to maturity. |
| # | All or a portion of this security is segregated as collateral for futures transactions. |
| (l) | Investment in an affiliate. |
| (u) | Rate shown is the 7-day annualized yield at period end. |
| (v) | Security represents investment of cash collateral received from securities on loan. |
| * | Cost for federal income tax purposes is $508,797,658 and net unrealized appreciation (depreciation) consists of: |
| | | | |
Gross unrealized appreciation | | $ | 177,928,197 | |
Gross unrealized depreciation | | | (4,817,854 | ) |
| | | | |
Net unrealized appreciation | | $ | 173,110,343 | |
The accompanying notes are an integral part of these financial statements.
| | | | |
| 60 | | Wells Fargo Advantage International Stock Funds | | Portfolio of Investments—April 30, 2011 (Unaudited) |
INTRINSIC WORLD EQUITY FUND
| | | | | | | | | | | | | | | | |
| Security Name | | | | | | | | Shares | | | Value | |
| | | | | | | | | | | | | | | | |
| | | | |
Common Stocks: 98.25% | | | | | | | | | | | | | | | | |
| | | | |
| Bermuda: 2.16% | | | | | | | | | | | | | | | | |
Bunge Limited (Consumer Staples, Food Products)« | | | | | | | | | | | 30,500 | | | $ | 2,300,920 | |
| | | | | | | | | | | | | | | | |
| | | |
| France: 5.51% | | | | | | | | | | | | | |
Carrefour SA (Consumer Staples, Food & Staples Retailing) | | | | | | | | | | | 31,000 | | | | 1,469,760 | |
Total SA (Energy, Oil, Gas & Consumable Fuels) | | | | | | | | | | | 30,000 | | | | 1,920,459 | |
Total SA ADR (Energy, Oil, Gas & Consumable Fuels) | | | | | | | | | | | 7,000 | | | | 449,610 | |
Vivendi SA (Consumer Discretionary, Media)« | | | | | | | | | | | 65,000 | | | | 2,039,581 | |
| | | | |
| | | | | | | | | | | | | | | 5,879,410 | |
| | | | | | | | | | | | | | | | |
| | | |
| Germany: 1.40% | | | | | | | | | | | | | |
Adidas-Salomon AG (Consumer Discretionary, Textiles, Apparel & Luxury Goods)« | | | | | | | | | | | 20,000 | | | | 1,488,852 | |
| | | | | | | | | | | | | | | | |
| | | |
| Israel: 1.61% | | | | | | | | | | | | | |
Teva Pharmaceutical Industries Limited ADR (Health Care, Pharmaceuticals) | | | | | | | | | | | 37,500 | | | | 1,714,875 | |
| | | | | | | | | | | | | | | | |
| | | |
| Italy: 1.14% | | | | | | | | | | | | | |
UniCredito Italiano SpA (Financials, Commercial Banks) | | | | | | | | | | | 470,000 | | | | 1,209,892 | |
| | | | | | | | | | | | | | | | |
| | | |
| Japan: 14.06% | | | | | | | | | | | | | |
77 Bank Limited (Financials, Commercial Banks) | | | | | | | | | | | 310,000 | | | | 1,425,507 | |
Aeon Company Limited (Consumer Staples, Food & Staples Retailing) | | | | | | | | | | | 90,000 | | | | 1,080,688 | |
Kao Corporation (Consumer Staples, Personal Products) | | | | | | | | | | | 70,000 | | | | 1,746,656 | |
Komatsu Limited (Industrials, Machinery) | | | | | | | | | | | 62,000 | | | | 2,170,745 | |
ORIX Corporation (Financials, Consumer Finance)« | | | | | | | | | | | 13,000 | | | | 1,267,706 | |
ORIX Corporation ADR (Financials, Consumer Finance) | | | | | | | | | | | 10,000 | | | | 491,700 | |
Shionogi & Company Limited (Health Care, Pharmaceuticals) | | | | | | | | | | | 57,000 | | | | 921,950 | |
Toray Industries Incorporated (Materials, Chemicals) | | | | | | | | | | | 300,000 | | | | 2,200,579 | |
Toshiba Corporation (Information Technology, Computers & Peripherals) | | | | | | | | | | | 330,000 | | | | 1,737,163 | |
TOTO Limited (Industrials, Building Products) | | | | | | | | | | | 250,000 | | | | 1,944,770 | |
| | | | |
| | | | | | | | | | | | | | | 14,987,464 | |
| | | | | | | | | | | | | | | | |
| | | |
| Netherlands: 4.90% | | | | | | | | | | | | | |
European Aeronautic Defence & Space Company (Industrials, Aerospace & Defense) | | | | | | | | | | | 76,000 | | | | 2,351,533 | |
Unilever NV (Consumer Staples, Food Products)« | | | | | | | | | | | 87,000 | | | | 2,871,000 | |
| | | | |
| | | | | | | | | | | | | | | 5,222,533 | |
| | | | | | | | | | | | | | | | |
| | | |
| Netherlands Antilles: 1.81% | | | | | | | | | | | | | |
Schlumberger Limited (Energy, Energy Equipment & Services) | | | | | | | | | | | 21,500 | | | | 1,929,625 | |
| | | | | | | | | | | | | | | | |
| | | |
| Singapore: 2.30% | | | | | | | | | | | | | |
DBS Group Holdings Limited (Financials, Commercial Banks) | | | | | | | | | | | 199,911 | | | | 2,450,592 | |
| | | | | | | | | | | | | | | | |
| | | |
| South Korea: 2.66% | | | | | | | | | | | | | |
Samsung Electronics Company Limited (Information Technology, Semiconductors & Semiconductor Equipment) | | | | | | | | | | | 3,400 | | | | 2,833,201 | |
| | | | | | | | | | | | | | | | |
| | | |
| Spain: 2.03% | | | | | | | | | | | | | |
Banco Santander Central Hispano SA ADR (Financials, Commercial Banks)« | | | | | | | | | | | 174,828 | | | | 2,167,867 | |
| | | | | | | | | | | | | | | | |
| | | | | | |
| Portfolio of Investments—April 30, 2011 (Unaudited) | | Wells Fargo Advantage International Stock Funds | | | 61 | |
INTRINSIC WORLD EQUITY FUND
| | | | | | | | | | | | | | | | |
| Security Name | | | | | | | | Shares | | | Value | |
| | | | | | | | | | | | | | | | |
| | | |
| Switzerland: 2.29% | | | | | | | | | | | | | |
Transocean Limited (Energy, Energy Equipment & Services)Ǡ | | | | | | | | | | | 11,000 | | | $ | 800,250 | |
Weatherford International Limited (Energy, Energy Equipment & Services)Ǡ | | | | | | | | | | | 76,000 | | | | 1,640,080 | |
| | | | |
| | | | | | | | | | | | | | | 2,440,330 | |
| | | | | | | | | | | | | | | | |
| | | |
| Taiwan: 3.18% | | | | | | | | | | | | | |
Cathay Financial Holding Company Limited (Financials, Insurance) | | | | | | | | | | | 850,000 | | | | 1,421,899 | |
China Trust Financial Holding Company Limited (Financials, Commercial Banks)† | | | | | | | | | | | 2,144,845 | | | | 1,970,725 | |
| | | | |
| | | | | | | | | | | | | | | 3,392,624 | |
| | | | | | | | | | | | | | | | |
| | | |
| United Kingdom: 9.03% | | | | | | | | | | | | | |
Diageo plc (Consumer Staples, Beverages) | | | | | | | | | | | 115,364 | | | | 2,347,064 | |
Royal Dutch Shell plc Class A (Energy, Oil, Gas & Consumable Fuels) | | | | | | | | | | | 63,546 | | | | 2,454,680 | |
Standard Chartered plc (Financials, Commercial Banks) | | | | | | | | | | | 80,772 | | | | 2,238,281 | |
Vodafone Group plc (Telecommunication Services, Wireless Telecommunication Services) | | | | | | | | | | | 904,000 | | | | 2,591,153 | |
| | | | |
| | | | | | | | | | | | | | | 9,631,178 | |
| | | | | | | | | | | | | | | | |
| | | |
| United States: 44.17% | | | | | | | | | | | | | |
Abbott Laboratories (Health Care, Pharmaceuticals) | | | | | | | | | | | 41,000 | | | | 2,133,640 | |
AMR Corporation (Industrials, Airlines)Ǡ | | | | | | | | | | | 111,000 | | | | 651,570 | |
Apple Incorporated (Information Technology, Computers & Peripherals)Ǡ | | | | | | | | | | | 10,500 | | | | 3,656,415 | |
Baxter International Incorporated (Health Care, Health Care Equipment & Supplies) | | | | | | | | | | | 44,000 | | | | 2,503,600 | |
Boeing Company (Industrials, Aerospace & Defense) | | | | | | | | | | | 22,000 | | | | 1,755,160 | |
Dow Chemical Company (Materials, Chemicals)« | | | | | | | | | | | 57,000 | | | | 2,336,430 | |
Ebay Incorporated (Information Technology, Internet Software & Services)† | | | | | | | | | | | 65,500 | | | | 2,253,200 | |
Eli Lilly & Company (Health Care, Pharmaceuticals) | | | | | | | | | | | 40,000 | | | | 1,480,400 | |
EMC Corporation (Information Technology, Computers & Peripherals)† | | | | | | | | | | | 97,000 | | | | 2,748,980 | |
Enersis SA ADR (Utilities, Electric Utilities) | | | | | | | | | | | 140,000 | | | | 2,990,400 | |
Home Depot Incorporated (Consumer Discretionary, Specialty Retail) | | | | | | | | | | | 62,000 | | | | 2,302,680 | |
Huntington Bancshares Incorporated (Industrials, Aerospace & Defense)† | | | | | | | | | | | 3,500 | | | | 140,000 | |
JPMorgan Chase & Company (Financials, Diversified Financial Services) | | | | | | | | | | | 56,000 | | | | 2,555,280 | |
Northrop Grumman Corporation (Industrials, Aerospace & Defense) | | | | | | | | | | | 33,000 | | | | 2,099,130 | |
NVR Incorporated (Consumer Discretionary, Household Durables)Ǡ | | | | | | | | | | | 1,800 | | | | 1,330,795 | |
Oracle Corporation (Information Technology, Software) | | | | | | | | | | | 96,500 | | | | 3,478,827 | |
Polo Ralph Lauren Corporation (Consumer Discretionary, Textiles, Apparel & Luxury Goods) | | | | | | | | | | | 12,500 | | | | 1,634,625 | |
QUALCOMM Incorporated (Information Technology, Communications Equipment) | | | | | | | | | | | 33,000 | | | | 1,875,720 | |
SPX Corporation (Industrials, Machinery) | | | | | | | | | | | 27,000 | | | | 2,334,150 | |
Texas Instruments Incorporated (Information Technology, Semiconductors & Semiconductor Equipment) | | | | | | | | | | | 63,000 | | | | 2,238,390 | |
UDR Incorporated (Financials, Real Estate Investment Trusts (REITs)) | | | | | | | | | | | 100,000 | | | | 2,589,000 | |
Visa Incorporated Class A (Information Technology, IT Services) | | | | | | | | | | | 19,000 | | | | 1,484,280 | |
Warner Music Group Corporation (Consumer Discretionary, Media)Ǡ | | | | | | | | | | | 70,000 | | | | 522,900 | |
| | | | |
| | | | | | | | | | | | | | | 47,095,572 | |
| | | | | | | | | | | | | | | | |
| | | | |
Total Common Stocks (Cost $92,577,580) | | | | | | | | | | | | | | | 104,744,935 | |
| | | | | | | | | | | | | | | | |
| | | | |
| 62 | | Wells Fargo Advantage International Stock Funds | | Portfolio of Investments—April 30, 2011 (Unaudited) |
INTRINSIC WORLD EQUITY FUND
| | | | | | | | | | | | | | | | |
| Security Name | | Yield | | | | | | Shares | | | Value | |
| | | | | | | | | | | | | | | | |
| | | | |
Short-Term Investments: 16.49% | | | | | | | | | | | | | | | | |
| | | |
| Investment Companies: 16.49% | | | | | | | | | | | | | |
Wells Fargo Advantage Cash Investment Money Market Fund(l)(u) | | | 0.09 | % | | | | | | | 1,809,772 | | | $ | 1,809,772 | |
Wells Fargo Securities Lending Cash Investments, LLC(l)(u)(v) | | | 0.20 | | | | | | | | 15,769,491 | | | | 15,769,491 | |
| | | | | | | | | | | | | | | | |
| | | | |
Total Short-Term Investments (Cost $17,579,263) | | | | | | | | | | | | | | | 17,579,263 | |
| | | | | | | | | | | | | | | | |
| | | | | | | | |
| Total Investments in Securities | | | | | | | | |
| (Cost $110,156,843)* | | | 114.73 | % | | | 122,324,198 | |
Other Assets and Liabilities, Net | | | (14.73 | ) | | | (15,708,730 | ) |
| | | | | | | | |
| Total Net Assets | | | 100.00 | % | | $ | 106,615,468 | |
| | | | | | | | |
| « | All or a portion of this security is on loan. |
| (l) | Investment in an affiliate. |
| (u) | Rate shown is the 7-day annualized yield at period end. |
| † | Non-income earning securities. |
| (v) | Security represents investment of cash collateral received from securities on loan. |
| * | Cost for federal income tax purposes is $110,299,077 and net unrealized appreciation (depreciation) consists of: |
| | | | |
Gross unrealized appreciation | | $ | 24,557,655 | |
Gross unrealized depreciation | | | (12,532,534 | ) |
| | | | |
Net unrealized appreciation | | $ | 12,025,121 | |
The accompanying notes are an integral part of these financial statements.
This page is intentionally left blank.
| | | | |
| 64 | | Wells Fargo Advantage International Stock Funds | | Statements of Assets and Liabilities—April 30, 2011 (Unaudited) |
| | | | | | | | |
| | | Asia Pacific Fund | | |
Disciplined Global Equity Fund | |
| | |
Assets | | | | | | | | |
Investments | | | | | | | | |
In unaffiliated securities (including securities on loan), at value | | $ | 285,706,458 | | | $ | 71,242,345 | |
In affiliated securities, at value | | | 10,214,032 | | | | 9,249,714 | |
| | | | | | | | |
Total investments, at value (see cost below) | | | 295,920,490 | | | | 80,492,059 | |
Foreign currency, at value (see cost below) | | | 1,748,285 | | | | 7,756 | |
Receivable for investments sold | | | 5,824,014 | | | | 3,609,941 | |
Receivable for Fund shares sold | | | 210,731 | | | | 0 | |
Receivable for dividends | | | 1,174,472 | | | | 203,577 | |
Receivable for daily variation margin on open futures contracts | | | 0 | | | | 739 | |
Receivable for securities lending income | | | 9,255 | | | | 6,862 | |
Unrealized gains on forward foreign currency exchange contracts | | | 0 | | | | 0 | |
Prepaid expenses and other assets | | | 60,583 | | | | 35,702 | |
| | | | | | | | |
Total assets | | | 304,947,830 | | | | 84,356,636 | |
| | | | | | | | |
| | |
Liabilities | | | | | | | | |
Payable for investments purchased | | | 10,019,724 | | | | 3,362,633 | |
Payable for Fund shares redeemed | | | 411,644 | | | | 110,441 | |
Unrealized losses on forward foreign currency exchange contracts | | | 0 | | | | 0 | |
Payable upon receipt of securities loaned | | | 4,571,856 | | | | 8,836,096 | |
Advisory fee payable | | | 250,515 | | | | 37,467 | |
Distribution fees payable | | | 895 | | | | 5,271 | |
Due to other related parties | | | 86,393 | | | | 18,590 | |
Accrued expenses and other liabilities | | | 400,331 | | | | 83,895 | |
| | | | | | | | |
Total liabilities | | | 15,741,358 | | | | 12,454,393 | |
| | | | | | | | |
Total net assets | | $ | 289,206,472 | | | $ | 71,902,243 | |
| | | | | | | | |
| | |
NET ASSETS CONSIST OF | | | | | | | | |
Paid-in capital | | $ | 403,780,857 | | | $ | 65,458,085 | |
Undistributed (overdistributed) net investment income (loss) | | | (1,227,109 | ) | | | 288,634 | |
Accumulated net realized losses on investments | | | (133,954,956 | ) | | | (7,727,272 | ) |
Net unrealized gains on investments | | | 20,607,680 | | | | 13,882,796 | |
| | | | | | | | |
Total net assets | | $ | 289,206,472 | | | $ | 71,902,243 | |
| | | | | | | | |
| | |
COMPUTATION OF NET ASSET VALUE AND OFFERING PRICE PER SHARE1 | | | | | | | | |
Net assets – Class A | | $ | 37,790,599 | | | $ | 60,828,380 | |
Shares outstanding – Class A | | | 3,540,024 | | | | 4,094,001 | |
Net asset value per share – Class A | | $ | 10.68 | | | $ | 14.86 | |
Maximum offering price per share – Class A2 | | $ | 11.33 | | | $ | 15.77 | |
Net assets – Class B | | | NA | | | | NA | |
Shares outstanding – Class B | | | NA | | | | NA | |
Net asset value per share – Class B | | | NA | | | | NA | |
Net assets – Class C | | $ | 1,383,167 | | | $ | 8,269,795 | |
Shares outstanding – Class C | | | 133,654 | | | | 605,253 | |
Net asset value per share – Class C | | $ | 10.35 | | | $ | 13.66 | |
Net assets – Class R | | | NA | | | | NA | |
Shares outstanding – Class R | | | NA | | | | NA | |
Net asset value per share – Class R | | | NA | | | | NA | |
Net assets – Administrator Class | | $ | 21,532,379 | | | $ | 2,086,823 | |
Shares outstanding – Administrator Class | | | 2,022,814 | | | | 136,113 | |
Net asset value per share – Administrator Class | | $ | 10.64 | | | $ | 15.33 | |
Net assets – Institutional Class | | $ | 12,157 | | | $ | 717,245 | |
Shares outstanding – Institutional Class | | | 1,141 | | | | 46,729 | |
Net asset value per share – Institutional Class | | $ | 10.65 | | | $ | 15.35 | |
Net assets – Investor Class | | $ | 228,488,170 | | | | NA | |
Shares outstanding – Investor Class | | | 21,440,126 | | | | NA | |
Net asset value per share – Investor Class | | $ | 10.66 | | | | NA | |
| | | | | | | | |
Total investments, at cost | | $ | 275,314,801 | | | $ | 66,635,799 | |
| | | | | | | | |
Securities on loan, at value | | $ | 4,346,393 | | | $ | 8,496,356 | |
| | | | | | | | |
Foreign currency, at cost | | $ | 1,746,504 | | | $ | 7,718 | |
| | | | | | | | |
| 1. | Each Fund has an unlimited number of authorized shares. |
| 2. | Maximum offering price is computed as 100/94.25 of net asset value. On investments of $50,000 or more, the offering price is reduced. |
The accompanying notes are an integral part of these financial statements.
| | | | | | |
| Statements of Assets and Liabilities—April 30, 2011 (Unaudited) | | Wells Fargo Advantage International Stock Funds | | | 65 | |
| | | | | | | | | | | | | | | | | | |
Diversified
International
Fund | | | Emerging
Markets Equity
Fund | | | Global
Opportunities
Fund | | | International
Equity Fund | | | Intrinsic
World Equity
Fund | |
| | | | |
| | | | | | | | | | | | | | | | | | |
| | | | | | | | | | | | | | | | | | |
| $ | 535,005,148 | | | $ | 1,820,077,880 | | | $ | 391,075,539 | | | $ | 601,705,532 | | | $ | 104,744,935 | |
| | 86,490,415 | | | | 550,042,699 | | | | 59,664,302 | | | | 80,202,469 | | | | 17,579,263 | |
| | | | | | | | | | | | | | | | | | | |
| | 621,495,563 | | | | 2,370,120,579 | | | | 450,739,841 | | | | 681,908,001 | | | | 122,324,198 | |
| | 6,878,823 | | | | 15,845,409 | | | | 61,565 | | | | 447,594 | | | | 21,717 | |
| | 1,262,174 | | | | 0 | | | | 3,328,553 | | | | 0 | | | | 0 | |
| | 376,547 | | | | 31,577,191 | | | | 1,183,944 | | | | 435,055 | | | | 44,406 | |
| | 2,281,491 | | | | 4,817,850 | | | | 539,157 | | | | 2,283,284 | | | | 363,249 | |
| | 0 | | | | 0 | | | | 0 | | | | 26,640 | | | | 0 | |
| | 106,650 | | | | 45,661 | | | | 5,363 | | | | 80,335 | | | | 2,267 | |
| | 454,307 | | | | 0 | | | | 643,525 | | | | 1,567,799 | | | | 0 | |
| | 74,002 | | | | 116,248 | | | | 40,358 | | | | 42,806 | | | | 40,578 | |
| | | | | | | | | | | | | | | | | | | |
| | 632,929,557 | | | | 2,422,522,938 | | | | 456,542,306 | | | | 686,791,514 | | | | 122,796,415 | |
| | | | | | | | | | | | | | | | | | | |
| | | | |
| | | | | | | | | | | | | | | | | | |
| | 2,278,318 | | | | 1,399,186 | | | | 1,296,178 | | | | 1,221,631 | | | | 304 | |
| | 228,639 | | | | 6,487,776 | | | | 276,136 | | | | 2,147,706 | | | | 212,156 | |
| | 658,179 | | | | 0 | | | | 542,220 | | | | 2,272,743 | | | | 0 | |
| | 67,556,672 | | | | 349,220,149 | | | | 43,644,285 | | | | 59,043,076 | | | | 15,769,491 | |
| | 450,638 | | | | 1,724,465 | | | | 314,864 | | | | 309,487 | | | | 64,963 | |
| | 1,030 | | | | 171,195 | | | | 63,433 | | | | 31,678 | | | | 399 | |
| | 57,371 | | | | 426,469 | | | | 98,851 | | | | 107,958 | | | | 28,335 | |
| | 279,026 | | | | 1,533,105 | | | | 331,970 | | | | 326,427 | | | | 105,299 | |
| | | | | | | | | | | | | | | | | | | |
| | 71,509,873 | | | | 360,962,345 | | | | 46,567,937 | | | | 65,460,706 | | | | 16,180,947 | |
| | | | | | | | | | | | | | | | | | | |
| $ | 561,419,684 | | | $ | 2,061,560,593 | | | $ | 409,974,369 | | | $ | 621,330,808 | | | $ | 106,615,468 | |
| | | | | | | | | | | | | | | | | | | |
| | | | |
| | | | | | | | | | | | | | | | | | |
| $ | 574,760,833 | | | $ | 1,603,174,652 | | | $ | 360,430,832 | | | $ | 560,512,375 | | | $ | 108,993,882 | |
| | 3,209,084 | | | | (1,451,001 | ) | | | (714,073 | ) | | | 2,988,341 | | | | 125,102 | |
| | (101,715,010 | ) | | | (11,455,896 | ) | | | (51,771,194 | ) | | | (130,221,987 | ) | | | (14,698,981 | ) |
| | 85,164,777 | | | | 471,292,838 | | | | 102,028,804 | | | | 188,052,079 | | | | 12,195,465 | |
| | | | | | | | | | | | | | | | | | | |
| $ | 561,419,684 | | | $ | 2,061,560,593 | | | $ | 409,974,369 | | | $ | 621,330,808 | | | $ | 106,615,468 | |
| | | | | | | | | | | | | | | | | | | |
| | | | |
| | | | | | | | | | | | | | | | | | |
| $ | 31,050,133 | | | $ | 1,033,103,110 | | | $ | 241,526,328 | | | $ | 221,957,606 | | | $ | 105,667,543 | |
| | 2,694,799 | | | | 43,376,898 | | | | 6,369,677 | | | | 18,617,568 | | | | 6,177,230 | |
| $ | 11.52 | | | $ | 23.82 | | | $ | 37.92 | | | $ | 11.92 | | | $ | 17.11 | |
| $ | 12.22 | | | $ | 25.27 | | | $ | 40.23 | | | $ | 12.65 | | | $ | 18.15 | |
| $ | 830,130 | | | $ | 29,367,714 | | | $ | 39,021,878 | | | $ | 18,901,972 | | | | NA | |
| | 75,635 | | | | 1,423,416 | | | | 1,271,617 | | | | 1,637,068 | | | | NA | |
| $ | 10.98 | | | $ | 20.63 | | | $ | 30.69 | | | $ | 11.55 | | | | NA | |
| $ | 820,976 | | | $ | 238,220,733 | | | $ | 60,012,249 | | | $ | 30,888,721 | | | $ | 602,423 | |
| | 76,302 | | | | 11,633,199 | | | | 1,945,270 | | | | 2,642,875 | | | | 36,015 | |
| $ | 10.76 | | | $ | 20.48 | | | $ | 30.85 | | | $ | 11.69 | | | $ | 16.73 | |
| | NA | | | | NA | | | | NA | | | $ | 3,898,650 | | | | NA | |
| | NA | | | | NA | | | | NA | | | | 327,646 | | | | NA | |
| | NA | | | | NA | | | | NA | | | $ | 11.90 | | | | NA | |
| $ | 6,302,813 | | | $ | 408,680,293 | | | $ | 68,079,848 | | | $ | 4,488,733 | | | $ | 327,510 | |
| | 548,011 | | | | 16,414,801 | | | | 1,741,134 | | | | 382,216 | | | | 19,212 | |
| $ | 11.50 | | | $ | 24.90 | | | $ | 39.10 | | | $ | 11.74 | | | $ | 17.05 | |
| $ | 470,188,175 | | | $ | 352,188,743 | | | $ | 1,334,066 | | | $ | 341,195,126 | | | $ | 17,992 | |
| | 40,874,549 | | | | 14,120,985 | | | | 34,082 | | | | 28,634,712 | | | | 1,055 | |
| $ | 11.50 | | | $ | 24.94 | | | $ | 39.14 | | | $ | 11.92 | | | $ | 17.05 | |
| $ | 52,227,457 | | | | NA | | | | NA | | | | NA | | | | NA | |
| | 4,548,454 | | | | NA | | | | NA | | | | NA | | | | NA | |
| $ | 11.48 | | | | NA | | | | NA | | | | NA | | | | NA | |
| | | | | | | | | | | | | | | | | | | |
| $ | 536,539,269 | | | $ | 1,899,030,911 | | | $ | 348,826,881 | | | $ | 494,760,496 | | | $ | 110,156,843 | |
| | | | | | | | | | | | | | | | | | | |
| $ | 64,724,867 | | | $ | 340,812,592 | | | $ | 42,540,956 | | | $ | 56,864,416 | | | $ | 15,316,763 | |
| | | | | | | | | | | | | | | | | | | |
| $ | 6,561,915 | | | $ | 15,678,661 | | | $ | 61,216 | | | $ | 443,849 | | | $ | 21,602 | |
| | | | | | | | | | | | | | | | | | | |
| | | | |
| 66 | | Wells Fargo Advantage International Stock Funds | | Statements of Operations—Six Months Ended April 30, 2011 (Unaudited) |
| | | | | | | | |
| | |
Asia Pacific
Fund | | | Disciplined Global
Equity Fund | |
| | |
Investment income | | | | | | | | |
Dividends* | | $ | 2,608,069 | | | $ | 810,334 | |
Income from affiliated securities | �� | | 6,655 | | | | 457 | |
Securities lending income, net | | | 38,570 | | | | 13,629 | |
| | | | | | | | |
Total investment income | | | 2,653,294 | | | | 824,420 | |
| | | | | | | | |
| | |
Expenses | | | | | | | | |
Advisory fee | | | 1,651,931 | | | | 237,493 | |
Administration fees | | | | | | | | |
Fund level | | | 75,088 | | | | 16,964 | |
Class A | | | 54,667 | | | | 75,472 | |
Class B | | | NA | | | | NA | |
Class C | | | 1,871 | | | | 10,261 | |
Class R | | | NA | | | | NA | |
Administrator Class | | | 9,909 | | | | 848 | |
Institutional Class | | | 5 | | | | 84 | |
Investor Class | | | 391,101 | | | | NA | |
Shareholder servicing fees | | | | | | | | |
Class A | | | 52,564 | | | | 71,698 | |
Class B | | | NA | | | | NA | |
Class C | | | 1,800 | | | | 9,866 | |
Class R | | | NA | | | | NA | |
Administrator Class | | | 22,062 | | | | 2,120 | |
Investor Class | | | 295,623 | | | | NA | |
Distribution fees | | | | | | | | |
Class B | | | NA | | | | NA | |
Class C | | | 5,398 | | | | 29,598 | |
Class R | | | NA | | | | NA | |
Custody and accounting fees | | | 92,398 | | | | 16,249 | |
Professional fees | | | 17,976 | | | | 19,483 | |
Registration fees | | | 9,074 | | | | 24,926 | |
Shareholder report expenses | | | 22,229 | | | | 17,117 | |
Trustees’ fees and expenses | | | 5,274 | | | | 5,811 | |
Other fees and expenses | | | 11,790 | | | | 17,781 | |
| | | | | | | | |
Total expenses | | | 2,720,760 | | | | 555,771 | |
Less: Fee waivers and/or expense reimbursements | | | (272,419 | ) | | | (53,781 | ) |
| | | | | | | | |
Net expenses | | | 2,448,341 | | | | 501,990 | |
| | | | | | | | |
Net investment income (loss) | | | 204,953 | | | | 322,430 | |
| | | | | | | | |
| | |
REALIZED AND UNREALIZED GAINS (LOSSES) ON INVESTMENTS | | | | | | | | |
| | |
Net realized gains (losses) on: | | | | | | | | |
Unaffiliated securities | | | 37,308,985 | | | | 1,612,063 | |
Futures transactions | | | 0 | | | | 55,829 | |
Forward foreign currency contract transactions | | | 0 | | | | 0 | |
| | | | | | | | |
Net realized gains (losses) on investments | | | 37,308,985 | | | | 1,667,892 | |
| | | | | | | | |
| | |
Net change in unrealized gains (losses) on: | | | | | | | | |
Unaffiliated securities | | | (21,222,673 | ) | | | 7,743,939 | |
Futures transactions | | | 0 | | | | 19,602 | |
Forward foreign currency contract transactions | | | 0 | | | | 0 | |
| | | | | | | | |
Net change in unrealized gains (losses) on investments | | | (21,222,673 | ) | | | 7,763,541 | |
| | | | | | | | |
Net realized and unrealized gains (losses) on investments | | | 16,086,312 | | | | 9,431,433 | |
| | | | | | | | |
Net increase in net assets resulting from operations | | $ | 16,291,265 | | | $ | 9,753,863 | |
| | | | | | | | |
| | |
* Net of foreign withholding taxes of | | | $241,857 | | | | $40,018 | |
The accompanying notes are an integral part of these financial statements.
| | | | | | |
| Statements of Operations—Six Months Ended April 30, 2011 (Unaudited) | | Wells Fargo Advantage International Stock Funds | | | 67 | |
| | | | | | | | | | | | | | | | | | |
Diversified
International Fund | | | Emerging
Markets Equity Fund | | | Global
Opportunities
Fund | | | International
Equity Fund | | | Intrinsic
World Equity Fund | |
| | | | |
| | | | | | | | | | | | | | | | | | |
| $ | 5,999,251 | | | $ | 14,134,536 | | | $ | 2,508,773 | | | $ | 6,014,109 | | | $ | 832,076 | |
| | 11,924 | | | | 142,401 | | | | 10,852 | | | | 11,277 | | | | 1,161 | |
| | 190,540 | | | | 237,562 | | | | 73,340 | | | | 184,850 | | | | 18,831 | |
| | | | | | | | | | | | | | | | | | | |
| | 6,201,715 | | | | 14,514,499 | | | | 2,592,965 | | | | 6,210,236 | | | | 852,068 | |
| | | | | | | | | | | | | | | | | | | |
| | | | |
| | | | | | | | | | | | | | | | | | |
| | 2,168,340 | | | | 9,010,896 | | | | 1,714,082 | | | | 2,601,000 | | | | 414,225 | |
| | | | | | | | | | | | | | | | | | |
| | 127,781 | | | | 431,855 | | | | 95,227 | | | | 154,771 | | | | 25,889 | |
| | 38,677 | | | | 1,171,700 | | | | 292,843 | | | | 280,138 | | | | 133,429 | |
| | 1,243 | | | | 39,151 | | | | 50,121 | | | | 25,153 | | | | NA | |
| | 1,011 | | | | 279,424 | | | | 73,350 | | | | 39,231 | | | | 793 | |
| | NA | | | | NA | | | | NA | | | | 4,809 | | | | NA | |
| | 73,115 | | | | 154,976 | | | | 30,218 | | | | 1,755 | | | | 147 | |
| | 113,714 | | | | 108,440 | | | | 92 | | | | 138,744 | | | | 6 | |
| | 81,058 | | | | NA | | | | NA | | | | NA | | | | NA | |
| | | | | | | | | | | | | | | | | | |
| | 37,189 | | | | 1,122,553 | | | | 279,392 | | | | 265,688 | | | | 128,297 | |
| | 1,195 | | | | 37,645 | | | | 48,194 | | | | 24,186 | | | | NA | |
| | 972 | | | | 268,677 | | | | 70,529 | | | | 37,723 | | | | 762 | |
| | NA | | | | NA | | | | NA | | | | 4,624 | | | | NA | |
| | 182,786 | | | | 347,587 | | | | 71,206 | | | | 3,325 | | | | 369 | |
| | 61,170 | | | | NA | | | | NA | | | | NA | | | | NA | |
| | | | | | | | | | | | | | | | | | |
| | 3,584 | | | | 112,934 | | | | 144,581 | | | | 72,557 | | | | NA | |
| | 2,917 | | | | 806,031 | | | | 211,586 | | | | 113,168 | | | | 2,287 | |
| | NA | | | | NA | | | | NA | | | | 4,624 | | | | NA | |
| | 121,268 | | | | 579,926 | | | | 55,285 | | | | 110,565 | | | | 16,870 | |
| | 34,084 | | | | 16,287 | | | | 26,933 | | | | 8,498 | | | | 23,319 | |
| | 23,935 | | | | 53,736 | | | | 27,356 | | | | 28,814 | | | | 26,313 | |
| | 45,507 | | | | 54,988 | | | | 36,574 | | | | 15,828 | | | | 7,736 | |
| | 5,274 | | | | 17,869 | | | | 8,661 | | | | 6,674 | | | | 6,565 | |
| | 31,509 | | | | 345,617 | | | | 110,433 | | | | 61,718 | | | | 33,290 | |
| | | | | | | | | | | | | | | | | | | |
| | 3,156,329 | | | | 14,960,292 | | | | 3,346,663 | | | | 4,003,593 | | | | 820,297 | |
| | (248,089 | ) | | | (57,223 | ) | | | (56,968 | ) | | | (869,382 | ) | | | (93,516 | ) |
| | | | | | | | | | | | | | | | | | | |
| | 2,908,240 | | | | 14,903,069 | | | | 3,289,695 | | | | 3,134,211 | | | | 726,781 | |
| | | | | | | | | | | | | | | | | | | |
| | 3,293,475 | | | | (388,570 | ) | | | (696,730 | ) | | | 3,076,025 | | | | 125,287 | |
| | | | | | | | | | | | | | | | | | | |
| | | | |
| | | | | | | | | | | | | | | | | | |
| | | | |
| | | | | | | | | | | | | | | | | | |
| | 23,066,841 | | | | 40,297,864 | | | | 34,074,557 | | | | 56,692,793 | | | | (54,978 | ) |
| | 0 | | | | 0 | | | | 0 | | | | 33,262 | | | | 0 | |
| | 305,218 | | | | 0 | | | | (90,618 | ) | | | 330 | | | | 0 | |
| | | | | | | | | | | | | | | | | | | |
| | 23,372,059 | | | | 40,297,864 | | | | 33,983,939 | | | | 56,726,385 | | | | (54,978 | ) |
| | | | | | | | | | | | | | | | | | | |
| | | | |
| | | | | | | | | | | | | | | | | | |
| | 39,149,955 | | | | 130,341,708 | | | | 31,521,729 | | | | 24,409,442 | | | | 13,896,317 | |
| | 0 | | | | 0 | | | | 0 | | | | 1,437,466 | | | | 0 | |
| | (203,872 | ) | | | 0 | | | | 101,305 | | | | (758,107 | ) | | | 0 | |
| | | | | | | | | | | | | | | | | | | |
| | 38,946,083 | | | | 130,341,708 | | | | 31,623,034 | | | | 25,088,801 | | | | 13,896,317 | |
| | | | | | | | | | | | | | | | | | | |
| | 62,318,142 | | | | 170,639,572 | | | | 65,606,973 | | | | 81,815,186 | | | | 13,841,339 | |
| | | | | | | | | | | | | | | | | | | |
| $ | 65,611,617 | | | $ | 170,251,002 | | | $ | 64,910,243 | | | $ | 84,891,211 | | | $ | 13,966,626 | |
| | | | | | | | | | | | | | | | | | | |
| | | | |
| | $508,975 | | | | $1,491,380 | | | | $72,213 | | | | $106,196 | | | | $42,382 | |
| | | | |
| 68 | | Wells Fargo Advantage International Stock Funds | | Statements of Changes in Net Assets |
| | | | | | | | | | | | | | | | | | | | | | | | |
| | | Asia Pacific Fund | |
| | | Six Months Ended
April 30, 2011
(Unaudited) | | | Period Ended
October 31, 20101 | | | Year Ended
September 30, 2010 | |
| | | | | | |
Operations | | | | | | | | | | | | | | | | | | | | | | | | |
Net investment income (loss) | | | | | | $ | 204,953 | | | | | | | $ | (255,354 | ) | | | | | | $ | 1,405,890 | |
Net realized gains on investments | | | | | | | 37,308,985 | | | | | | | | 9,269,508 | | | | | | | | 14,751,069 | |
Net change in unrealized gains (losses) on investments | | | | | | | (21,222,673 | ) | | | | | | | 2,942,160 | | | | | | | | 19,892,099 | |
| | | | | | | | | | | | | | | | | | | | | | | | |
Net increase in net assets resulting from operations | | | | | | | 16,291,265 | | | | | | | | 11,956,314 | | | | | | | | 36,049,058 | |
| | | | | | | | | | | | | | | | | | | | | | | | |
| | | | | | |
Distributions to shareholders from | | | | | | | | | | | | | | | | | | | | | | | | |
Net investment income | | | | | | | | | | | | | | | | | | | | | | | | |
Class A | | | | | | | (179,515 | ) | | | | | | | 0 | | | | | | | | (1,321,981 | ) |
Class C | | | | | | | (18,810 | ) | | | | | | | 0 | | | | | | | | (14,818 | ) |
Administrator Class | | | | | | | (201,125 | ) | | | | | | | 0 | | | | | | | | 0 | 2 |
Institutional Class | | | | | | | (103 | ) | | | | | | | 0 | | | | | | | | 0 | 2 |
Investor Class | | | | | | | (1,337,248 | ) | | | | | | | 0 | | | | | | | | (4,242,210 | ) |
| | | | | | | | | | | | | | | | | | | | | | | | |
Total distributions to shareholders | | | | | | | (1,736,801 | ) | | | | | | | 0 | | | | | | | | (5,579,009 | ) |
| | | | | | | | | | | | | | | | | | | | | | | | |
| | | | | | |
| | | Shares | | | | | | Shares | | | | | | Shares | | | | |
| | | | | | |
Capital share transactions | | | | | | | | | | | | | | | | | | | | | | | | |
Proceeds from shares sold | | | | | | | | | | | | | | | | | | | | | | | | |
Class A | | | 123,460 | | | | 1,278,648 | | | | 143,231 | | | | 1,427,513 | | | | 908,879 | | | | 8,111,351 | |
Class C | | | 19,374 | | | | 196,006 | | | | 2,597 | | | | 25,977 | | | | 72,216 | | | | 646,503 | |
Administrator Class | | | 2,659,882 | | | | 27,179,113 | | | | 0 | | | | 0 | | | | 1,131 | 2 | | | 10,000 | 2 |
Institutional Class | | | 0 | | | | 0 | | | | 0 | | | | 0 | | | | 1,131 | 2 | | | 10,000 | 2 |
Investor Class | | | 1,482,053 | | | | 15,348,767 | | | | 813,261 | | | | 8,194,118 | | | | 4,778,485 | | | | 42,903,086 | |
| | | | | | | | | | | | | | | | | | | | | | | | |
| | | | | | | 44,002,534 | | | | | | | | 9,647,608 | | | | | | | | 51,680,940 | |
| | | | | | | | | | | | | | | | | | | | | | | | |
Reinvestment of distributions | | | | | | | | | | | | | | | | | | | | | | | | |
Class A | | | 17,467 | | | | 177,817 | | | | 0 | | | | 0 | | | | 147,698 | | | | 1,308,607 | |
Class C | | | 1,414 | | | | 14,002 | | | | 0 | | | | 0 | | | | 1,306 | | | | 11,415 | |
Administrator Class | | | 18,442 | | | | 187,182 | | | | 0 | | | | 0 | | | | 0 | 2 | | | 0 | 2 |
Institutional Class | | | 10 | | | | 103 | | | | 0 | | | | 0 | | | | 0 | 2 | | | 0 | 2 |
Investor Class | | | 113,111 | | | | 1,151,343 | | | | 0 | | | | 0 | | | | 426,220 | | | | 3,776,305 | |
| | | | | | | | | | | | | | | | | | | | | | | | |
| | | | | | | 1,530,447 | | | | | | | | 0 | | | | | | | | 5,096,327 | |
| | | | | | | | | | | | | | | | | | | | | | | | |
Payment for shares redeemed | | | | | | | | | | | | | | | | | | | | | | | | |
Class A | | | (2,881,767 | ) | | | (29,567,963 | ) | | | (282,241 | ) | | | (2,843,005 | ) | | | (4,294,688 | ) | | | (38,401,391 | ) |
Class C | | | (38,493 | ) | | | (389,650 | ) | | | (2,418 | ) | | | (23,855 | ) | | | (50,562 | ) | | | (440,343 | ) |
Administrator Class | | | (656,641 | ) | | | (6,743,433 | ) | | | 0 | | | | 0 | | | | 0 | 2 | | | 0 | 2 |
Investor Class | | | (5,016,650 | ) | | | (51,664,967 | ) | | | (726,137 | ) | | | (7,316,131 | ) | | | (12,062,399 | ) | | | (107,350,261 | ) |
| | | | | | | | | | | | | | | | | | | | | | | | |
| | | | | | | (88,366,013 | ) | | | | | | | (10,182,991 | ) | | | | | | | (146,191,995 | ) |
| | | | | | | | | | | | | | | | | | | | | | | | |
Net decrease in net assets resulting
from capital share transactions | | | | | | | (42,833,032 | ) | | | | | | | (535,383 | ) | | | | | | | (89,414,728 | ) |
| | | | | | | | | | | | | | | | | | | | | | | | |
Total increase (decrease) in net assets | | | | | | | (28,278,568 | ) | | | | | | | 11,420,931 | | | | | | | | (58,944,679 | ) |
| | | | | | | | | | | | | | | | | | | | | | | | |
| | | | | | |
Net assets | | | | | | | | | | | | | | | | | | | | | | | | |
Beginning of period | | | | | | | 317,485,040 | | | | | | | | 306,064,109 | | | | | | | | 365,008,788 | |
| | | | | | | | | | | | | | | | | | | | | | | | |
End of period | | | | | | $ | 289,206,472 | | | | | | | $ | 317,485,040 | | | | | | | $ | 306,064,109 | |
| | | | | | | | | | | | | | | | | | | | | | | | |
Undistributed (overdistributed) net investment income (loss) | | | | | | $ | (1,227,109 | ) | | | | | | $ | 304,739 | | | | | | | $ | 627,857 | |
| | | | | | | | | | | | | | | | | | | | | | | | |
| 1. | For the one month ended October 31, 2010. The Fund changed its fiscal year end from September 30 to October 31, effective October 31, 2010. |
| 2. | Class commenced operations on July 30, 2010. |
The accompanying notes are an integral part of these financial statements.
| | | | | | |
| Statements of Changes in Net Assets | | Wells Fargo Advantage International Stock Funds | | | 69 | |
| | | | | | | | | | | | | | | | |
| | | Disciplined Global Equity Fund | |
| | | Six Months Ended
April 30, 2011
(Unaudited) | | | Year Ended
October 31, 20101 | |
| | | | |
Operations | | | | | | | | | | | | | | | | |
Net investment income | | | | | | $ | 322,430 | | | | | | | $ | 628,174 | |
Net realized gains (losses) on investments | | | | | | | 1,667,892 | | | | | | | | (2,869,342 | ) |
Net change in unrealized gains (losses) on investments | | | | | | | 7,763,541 | | | | | | | | 8,803,578 | |
| | | | | | | | | | | | | | | | |
Net increase in net assets resulting from operations | | | | | | | 9,753,863 | | | | | | | | 6,562,410 | |
| | | | | | | | | | | | | | | | |
| | | | |
Distributions to shareholders from | | | | | | | | | | | | | | | | |
Net investment income | | | | | | | | | | | | | | | | |
Class A | | | | | | | (630,407 | ) | | | | | | | (857,264 | ) |
Class B | | | | | | | NA | | | | | | | | (13,484 | )2 |
Class C | | | | | | | (25,641 | ) | | | | | | | (69,020 | ) |
Administrator Class | | | | | | | (22,418 | ) | | | | | | | (19,813 | )4 |
Institutional Class | | | | | | | (157 | ) | | | | | | | 0 | 3 |
| | | | | | | | | | | | | | | | |
Total distributions to shareholders | | | | | | | (678,623 | ) | | | | | | | (959,581 | ) |
| | | | | | | | | | | | | | | | |
| | | | |
| | | Shares | | | | | | Shares | | | | |
| | | | |
Capital share transactions | | | | | | | | | | | | | | | | |
Proceeds from shares sold | | | | | | | | | | | | | | | | |
Class A | | | 20,716 | | | | 290,386 | | | | 212,265 | | | | 2,469,706 | |
Class B | | | NA | | | | NA | | | | 3,281 | | | | 37,047 | 2 |
Class C | | | 4,195 | | | | 53,446 | | | | 27,160 | | | | 294,391 | |
Administrator Class | | | 61,398 | | | | 859,180 | | | | 6,714 | 4 | | | 83,738 | 4 |
Institutional Class | | | 46,509 | | | | 678,053 | | | | 812 | 3 | | | 10,000 | 3 |
| | | | | | | | | | | | | | | | |
| | | | | | | 1,881,065 | | | | | | | | 2,894,882 | |
| | | | | | | | | | | | | | | | |
Reinvestment of distributions | | | | | | | | | | | | | | | | |
Class A | | | 44,636 | | | | 592,323 | | | | 68,661 | | | | 814,325 | |
Class B | | | NA | | | | NA | | | | 1,060 | 2 | | | 11,748 | 2 |
Class C | | | 1,879 | | | | 23,005 | | | | 5,708 | | | | 62,384 | |
Administrator Class | | | 1,275 | | | | 17,446 | | | | 1,198 | 4 | | | 14,641 | 4 |
Institutional Class | | | 11 | | | | 157 | | | | 0 | 3 | | | 0 | |
| | | | | | | | | | | | | | | | |
| | | | | | | 632,931 | | | | | | | | 903,098 | |
| | | | | | | | | | | | | | | | |
Payment for shares redeemed | | | | | | | | | | | | | | | | |
Class A | | | (341,526 | ) | | | (4,674,436 | ) | | | (644,734 | ) | | | (7,810,528 | ) |
Class B | | | NA | | | | NA | | | | (217,379 | )2 | | | (2,345,033 | )2 |
Class C | | | (52,358 | ) | | | (656,848 | ) | | | (148,263 | ) | | | (1,634,745 | ) |
Administrator Class | | | (10,442 | ) | | | (148,012 | ) | | | (15,960 | )4 | | | (202,712 | )4 |
Institutional Class | | | (603 | ) | | | (8,774 | ) | | | 0 | 3 | | | 0 | 3 |
| | | | | | | | | | | | | | | | |
| | | | | | | (5,488,070 | ) | | | | | | | (11,993,018 | ) |
| | | | | | | | | | | | | | | | |
Net decrease in net assets resulting
from capital share transactions | | | | | | | (2,974,074 | ) | | | | | | | (8,195,038 | ) |
Net increase from regulatory settlement (Note 9) | | | | | | | 0 | | | | | | | | 2,080,711 | |
| | | | | | | | | | | | | | | | |
Total increase (decrease) in net assets | | | | | | | 6,101,166 | | | | | | | | (511,498 | ) |
| | | | | | | | | | | | | | | | |
| | | | |
Net assets | | | | | | | | | | | | | | | | |
Beginning of period | | | | | | | 65,801,077 | | | | | | | | 66,312,575 | |
| | | | | | | | | | | | | | | | |
End of period | | | | | | $ | 71,902,243 | | | | | | | $ | 65,801,077 | |
| | | | | | | | | | | | | | | | |
Undistributed net investment income | | | | | | $ | 288,634 | | | | | | | $ | 644,827 | |
| | | | | | | | | | | | | | | | |
| 1. | After the close of business on July 16, 2010, the Fund acquired the net assets of Evergreen Global Large Cap Equity Fund which became the accounting and performance survivor in this transaction. The information for the period prior to July 19, 2010 is that of Evergreen Global Large Cap Equity Fund. |
| 2. | Class B shares of the predecessor fund became Class A shares on July 19, 2010. |
| 3. | Class commenced operations on July 30, 2010. |
| 4. | Class I shares of the predecessor fund became Administrator Class shares on July 19, 2010. |
The accompanying notes are an integral part of these financial statements.
| | | | |
| 70 | | Wells Fargo Advantage International Stock Funds | | Statements of Changes in Net Assets |
| | | | | | | | | | | | | | | | | | | | | | | | |
| | | Diversified International Fund | |
| | | Six Months Ended
April 30, 2011
(Unaudited) | | | Period Ended
October 31, 20101 | | | Year Ended
September 30, 2010 | |
| | | | | | |
Operations | | | | | | | | | | | | | | | | | | | | | | | | |
Net investment income | | | | | | $ | 3,293,475 | | | | | | | $ | 331,866 | | | | | | | $ | 5,599,571 | |
Net realized gains on investments | | | | | | | 23,372,059 | | | | | | | | 3,096,137 | | | | | | | | 8,190,264 | |
Net change in unrealized gains (losses) on investments | | | | | | | 38,946,083 | | | | | | | | 17,829,465 | | | | | | | | 5,936,058 | |
| | | | | | | | | | | | | | | | | | | | | | | | |
Net increase in net assets resulting from operations | | | | | | | 65,611,617 | | | | | | | | 21,257,468 | | | | | | | | 19,725,893 | |
| | | | | | | | | | | | | | | | | | | | | | | | |
| | | | | | |
Distributions to shareholders from | | | | | | | | | | | | | | | | | | | | | | | | |
Net investment income | | | | | | | | | | | | | | | | | | | | | | | | |
Class A | | | | | | | (311,102 | ) | | | | | | | 0 | | | | | | | | (405,812 | ) |
Class B | | | | | | | 0 | | | | | | | | 0 | | | | | | | | (12,664 | ) |
Class C | | | | | | | (3,178 | ) | | | | | | | 0 | | | | | | | | (6,723 | ) |
Administrator Class | | | | | | | (2,469,967 | ) | | | | | | | 0 | | | | | | | | (3,609,906 | ) |
Institutional Class | | | | | | | (3,000,704 | ) | | | | | | | 0 | | | | | | | | (1,123,456 | ) |
Investor Class | | | | | | | (499,616 | ) | | | | | | | 0 | | | | | | | | (615,428 | ) |
| | | | | | | | | | | | | | | | | | | | | | | | |
Total distributions to shareholders | | | | | | | (6,284,567 | ) | | | | | | | 0 | | | | | | | | (5,773,989 | ) |
| | | | | | | | | | | | | | | | | | | | | | | | |
| | | | | | |
| | | Shares | | | | | | Shares | | | | | | Shares | | | | |
| | | | | | |
Capital share transactions | | | | | | | | | | | | | | | | | | | | | | | | |
Proceeds from shares sold | | | | | | | | | | | | | | | | | | | | | | | | |
Class A | | | 38,016 | | | | 408,976 | | | | 2,039 | | | | 20,635 | | | | 115,441 | | | | 1,017,274 | |
Class B | | | 0 | | | | 0 | | | | 495 | | | | 4,758 | | | | 3,133 | | | | 28,444 | |
Class C | | | 6,814 | | | | 68,090 | | | | 36 | | | | 340 | | | | 14,472 | | | | 129,501 | |
Administrator Class | | | 100,351 | | | | 1,074,199 | | | | 12,043 | | | | 123,433 | | | | 7,011,434 | | | | 64,232,585 | |
Institutional Class | | | 22,702,754 | | | | 246,899,756 | | | | 211,610 | | | | 2,168,301 | | | | 13,163,872 | | | | 117,799,331 | |
Investor Class | | | 288,208 | | | | 3,066,596 | | | | 19,428 | | | | 199,095 | | | | 356,882 | | | | 3,427,956 | |
| | | | | | | | | | | | | | | | | | | | | | | | |
| | | | | | | 251,517,617 | | | | | | | | 2,516,562 | | | | | | | | 186,635,091 | |
| | | | | | | | | | | | | | | | | | | | | | | | |
Reinvestment of distributions | | | | | | | | | | | | | | | | | | | | | | | | |
Class A | | | 28,499 | | | | 295,248 | | | | 0 | | | | 0 | | | | 41,062 | | | | 388,860 | |
Class B | | | 0 | | | | 0 | | | | 0 | | | | 0 | | | | 1,302 | | | | 11,744 | |
Class C | | | 277 | | | | 2,687 | | | | 0 | | | | 0 | | | | 622 | | | | 5,521 | |
Administrator Class | | | 236,741 | | | | 2,445,535 | | | | 0 | | | | 0 | | | | 218,270 | | | | 2,060,467 | |
Institutional Class | | | 124,751 | | | | 1,287,429 | | | | 0 | | | | 0 | | | | 118,932 | | | | 1,121,530 | |
Investor Class | | | 47,692 | | | | 492,178 | | | | 0 | | | | 0 | | | | 64,136 | | | | 605,441 | |
| | | | | | | | | | | | | | | | | | | | | | | | |
| | | | | | | 4,523,077 | | | | | | | | 0 | | | | | | | | 4,193,563 | |
| | | | | | | | | | | | | | | | | | | | | | | | |
Payment for shares redeemed | | | | | | | | | | | | | | | | | | | | | | | | |
Class A | | | (267,294 | ) | | | (2,843,988 | ) | | | (45,034 | ) | | | (460,915 | ) | | | (516,873 | ) | | | (4,856,745 | ) |
Class B | | | (35,690 | ) | | | (363,987 | ) | | | (1,463 | ) | | | (13,980 | ) | | | (82,911 | ) | | | (732,976 | ) |
Class C | | | (8,383 | ) | | | (84,894 | ) | | | (691 | ) | | | (6,680 | ) | | | (16,935 | ) | | | (148,253 | ) |
Administrator Class | | | (19,461,490 | ) | | | (212,681,367 | ) | | | (35,918 | ) | | | (368,537 | ) | | | (142,736,780 | ) | | | (132,845,046 | ) |
Institutional Class | | | (1,300,149 | ) | | | (13,961,622 | ) | | | (651,766 | ) | | | (6,625,683 | ) | | | (755,188 | ) | | | (7,174,823 | ) |
Investor Class | | | (474,175 | ) | | | (5,042,056 | ) | | | (50,870 | ) | | | (517,180 | ) | | | (668,621 | ) | | | (6,244,180 | ) |
| | | | | | | | | | | | | | | | | | | | | | | | |
| | | | | | | (234,977,914 | ) | | | | | | | (7,992,975 | ) | | | | | | | (152,002,023 | ) |
| | | | | | | | | | | | | | | | | | | | | | | | |
Net increase (decrease) in net assets resulting
from capital share transactions | | | | | | | 21,062,780 | | | | | | | | (5,476,413 | ) | | | | | | | 38,826,631 | |
| | | | | | | | | | | | | | | | | | | | | | | | |
Total increase in net assets | | | | | | | 80,389,830 | | | | | | | | 15,781,055 | | | | | | | | 52,778,535 | |
| | | | | | | | | | | | | | | | | | | | | | | | |
| | | | | | |
Net assets | | | | | | | | | | | | | | | | | | | | | | | | |
Beginning of period | | | | | | | 481,029,854 | | | | | | | | 465,248,799 | | | | | | | | 412,470,264 | |
| | | | | | | | | | | | | | | | | | | | | | | | |
End of period | | | | | | $ | 561,419,684 | | | | | | | $ | 481,029,854 | | | | | | | $ | 465,248,799 | |
| | | | | | | | | | | | | | | | | | | | | | | | |
Undistributed net investment income | | | | | | $ | 3,209,084 | | | | | | | $ | 6,200,176 | | | | | | | $ | 5,856,470 | |
| | | | | | | | | | | | | | | | | | | | | | | | |
| 1. | For the one month ended October 31, 2010. The Fund changed it fiscal year end from September 30 to October 31, effective October 31, 2010. |
The accompanying notes are an integral part of these financial statements.
| | | | | | |
| Statements of Changes in Net Assets | | Wells Fargo Advantage International Stock Funds | | | 71 | |
| | | | | | | | | | | | | | | | |
| | | Emerging Markets Equity Fund | |
| | | Six Months Ended
April 30, 2011
(Unaudited) | | | Year Ended
October 31, 20101 | |
| | | | |
Operations | | | | | | | | | | | | | | | | |
Net investment income (loss) | | | | | | $ | (388,570 | ) | | | | | | $ | 1,798,623 | |
Net realized gains on investments | | | | | | | 40,297,864 | | | | | | | | 18,842,643 | |
Net change in unrealized gains (losses) on investments | | | | | | | 130,341,708 | | | | | | | | 232,626,837 | |
| | | | | | | | | | | | | | | | |
Net increase in net assets resulting from operations | | | | | | | 170,251,002 | | | | | | | | 253,268,103 | |
| | | | | | | | | | | | | | | | |
| | | | |
Distributions to shareholders from | | | | | | | | | | | | | | | | |
Net investment income | | | | | | | | | | | | | | | | |
Class A | | | | | | | (69,199 | ) | | | | | | | (347,684 | ) |
Administrator Class | | | | | | | (281,655 | ) | | | | | | | (563,672 | )3 |
Institutional Class | | | | | | | (437,476 | ) | | | | | | | 0 | 2 |
| | | | | | | | | | | | | | | | |
Total distributions to shareholders | | | | | | | (788,330 | ) | | | | | | | (911,356 | ) |
| | | | | | | | | | | | | | | | |
| | | | |
| | | Shares | | | | | | Shares | | | | |
| | | | |
Capital share transactions | | | | | | | | | | | | | | | | |
Proceeds from shares sold | | | | | | | | | | | | | | | | |
Class A | | | 12,572,152 | | | | 284,214,288 | | | | 18,870,247 | | | | 360,329,766 | |
Class B | | | 50,848 | | | | 991,993 | | | | 114,030 | | | | 1,897,374 | |
Class C | | | 2,490,206 | | | | 48,343,170 | | | | 3,998,877 | | | | 66,192,554 | |
Administrator Class | | | 9,365,032 | | | | 220,607,565 | | | | 8,078,650 | 3 | | | 161,864,384 | 3 |
Institutional Class | | | 6,387,271 | | | | 151,511,412 | | | | 8,793,612 | 2 | | | 196,182,260 | 2 |
| | | | | | | | | | | | | | | | |
| | | | | | | 705,668,428 | | | | | | | | 786,466,338 | |
| | | | | | | | | | | | | | | | |
Reinvestment of distributions | | | | | | | | | | | | | | | | |
Class A | | | 2,877 | | | | 63,964 | | | | 16,438 | | | | 305,753 | |
Administrator Class | | | 10,004 | | | | 232,301 | | | | 20,117 | 3 | | | 390,875 | 3 |
Institutional Class | | | 8,289 | | | | 192,648 | | | | 0 | 2 | | | 0 | 2 |
| | | | | | | | | | | | | | | | |
| | | | | | | 488,913 | | | | | | | | 696,628 | |
| | | | | | | | | | | | | | | | |
Payment for shares redeemed | | | | | | | | | | | | | | | | |
Class A | | | (7,106,012 | ) | | | (159,278,879 | ) | | | (8,409,193 | ) | | | (158,156,799 | ) |
Class B | | | (273,664 | ) | | | (5,384,795 | ) | | | (360,744 | ) | | | (5,963,771 | ) |
Class C | | | (1,203,213 | ) | | | (23,346,522 | ) | | | (1,982,623 | ) | | | (32,087,876 | ) |
Administrator Class | | | (3,941,366 | ) | | | (93,607,185 | ) | | | (8,149,164 | )3 | | | (173,496,329 | )3 |
Institutional Class | | | (1,003,888 | ) | | | (23,763,194 | ) | | | (64,299 | )2 | | | (1,454,590 | )2 |
| | | | | | | | | | | | | | | | |
| | | | | | | (305,380,575 | ) | | | | | | | (371,159,365 | ) |
| | | | | | | | | | | | | | | | |
Net asset value of shares issued in acquisitions | | | | | | | | | | | | | | | | |
Class A | | | 0 | | | | 0 | | | | 6,401,149 | | | | 117,055,258 | |
Class B | | | 0 | | | | 0 | | | | 178,594 | | | | 2,845,791 | |
Class C | | | 0 | | | | 0 | | | | 120,371 | | | | 1,903,695 | |
Administrator Class | | | 0 | | | | 0 | | | | 954,372 | 3 | | | 18,231,179 | 3 |
| | | | | | | | | | | | | | | | |
| | | | | | | 0 | | | | | | | | 140,035,923 | |
| | | | | | | | | | | | | | | | |
Net increase in net assets resulting
from capital share transactions | | | | | | | 400,776,766 | | | | | | | | 556,039,524 | |
| | | | | | | | | | | | | | | | |
Total increase in net assets | | | | | | | 570,239,438 | | | | | | | | 808,396,271 | |
| | | | | | | | | | | | | | | | |
| | | | |
Net assets | | | | | | | | | | | | | | | | |
Beginning of period | | | | | | | 1,491,321,155 | | | | | | | | 682,924,884 | |
| | | | | | | | | | | | | | | | |
End of period | | | | | | $ | 2,061,560,593 | | | | | | | $ | 1,491,321,155 | |
| | | | | | | | | | | | | | | | |
Undistributed (accumulated) net investment income (loss) | | | | | | $ | (1,451,001 | ) | | | | | | $ | (274,101 | ) |
| | | | | | | | | | | | | | | | |
| 1. | After the close of business on July 16, 2010, the Fund acquired the net assets of Evergreen Emerging Markets Growth Fund and Wells Fargo Advantage Emerging Markets Equity Fund. Evergreen Emerging Markets Growth Fund became the accounting and performance survivor in this transaction. The information for the period prior to July 19, 2010 is that of Evergreen Emerging Markets Growth Fund. |
| 2. | Class commenced operations on July 30, 2010. |
| 3. | Class I shares of the predecessor fund became Administrator Class shares on July 19, 2010. |
| | | | |
| 72 | | Wells Fargo Advantage International Stock Funds | | Statements of Changes in Net Assets |
| | | | | | | | | | | | | | | | |
| | | Global Opportunities Fund | |
| | | Six Months Ended April 30, 2011
(Unaudited) | | | Year Ended
October 31, 20101 | |
Operations | | | | | | | | | | | | | | | | |
Net investment income (loss) | | | | | | $ | (696,730 | ) | | | | | | $ | 274,181 | |
Net realized gains on investments | | | | | | | 33,983,939 | | | | | | | | 34,651,215 | |
Net change in unrealized gains (losses) on investments | | | | | | | 31,623,034 | | | | | | | | 46,767,894 | |
| | | | | | | | | | | | | | | | |
Net increase in net assets resulting from operations | | | | | | | 64,910,243 | | | | | | | | 81,693,290 | |
| | | | | | | | | | | | | | | | |
| | | | |
Distributions to shareholders from | | | | | | | | | | | | | | | | |
Net investment income | | | | | | | | | | | | | | | | |
Class A | | | | | | | 0 | | | | | | | | (889,047 | ) |
Administrator Class | | | | | | | (68,006 | ) | | | | | | | (270,699 | )3 |
Institutional Class | | | | | | | (26 | ) | | | | | | | 0 | 2 |
| | | | | | | | | | | | | | | | |
Total distributions to shareholders | | | | | | | (68,032 | ) | | | | | | | (1,159,746 | ) |
| | | | | | | | | | | | | | | | |
| | | | |
| | | Shares | | | | | | Shares | | | | |
Capital share transactions | | | | | | | | | | | | | | | | |
Proceeds from shares sold | | | | | | | | | | | | | | | | |
Class A | | | 845,119 | | | | 29,856,402 | | | | 589,326 | | | | 16,633,004 | |
Class B | | | 22,340 | | | | 633,523 | | | | 54,851 | | | | 1,282,680 | |
Class C | | | 132,072 | | | | 3,837,118 | | | | 120,661 | | | | 2,753,092 | |
Administrator Class | | | 642,813 | | | | 22,824,554 | | | | 356,487 | 3 | | | 10,390,858 | 3 |
Institutional Class | | | 34,362 | | | | 1,294,410 | | | | 352 | 2 | | | 10,000 | 2 |
| | | | | | | | | | | | | | | | |
| | | | | | | 58,446,007 | | | | | | | | 31,069,634 | |
| | | | | | | | | | | | | | | | |
Reinvestment of distributions | | | | | | | | | | | | | | | | |
Class A | | | 0 | | | | 0 | | | | 28,683 | | | | 740,016 | |
Administrator Class | | | 1,774 | | | | 62,456 | | | | 10,170 | 3 | | | 269,912 | 3 |
Institutional Class | | | 1 | | | | 26 | | | | 0 | 2 | | | 0 | 2 |
| | | | | | | | | | | | | | | | |
| | | | | | | 62,482 | | | | | | | | 1,009,928 | |
| | | | | | | | | | | | | | | | |
Payment for shares redeemed | | | | | | | | | | | | | | | | |
Class A | | | (1,142,495 | ) | | | (39,564,316 | ) | | | (1,873,988 | ) | | | (51,686,259 | ) |
Class B | | | (207,397 | ) | | | (5,900,761 | ) | | | (316,554 | ) | | | (7,119,320 | ) |
Class C | | | (216,319 | ) | | | (6,212,982 | ) | | | (547,857 | ) | | | (12,414,766 | ) |
Administrator Class | | | (303,825 | ) | | | (11,138,048 | ) | | | (481,341 | )3 | | | (13,778,190 | )3 |
Institutional Class | | | (633 | ) | | | (24,103 | ) | | | 0 | 2 | | | 0 | 2 |
| | | | | | | | | | | | | | | | |
| | | | | | | (62,840,210 | ) | | | | | | | (84,998,535 | ) |
| | | | | | | | | | | | | | | | |
Net decrease in net assets resulting
from capital share transactions | | | | | | | (4,331,721 | ) | | | | | | | (52,918,973 | ) |
| | | | | | | | | | | | | | | | |
Total increase in net assets | | | | | | | 60,510,490 | | | | | | | | 27,614,571 | |
| | | | | | | | | | | | | | | | |
Net assets | | | | | | | | | | | | | | | | |
Beginning of period | | | | | | | 349,463,879 | | | | | | | | 321,849,308 | |
| | | | | | | | | | | | | | | | |
End of period | | | | | | $ | 409,974,369 | | | | | | | $ | 349,463,879 | |
| | | | | | | | | | | | | | | | |
Accumulated (overdistributed) net investment income (loss) | | | | | | $ | (714,073 | ) | | | | | | $ | 50,689 | |
| | | | | | | | | | | | | | | | |
| 1. | After the close of business on July 16, 2010, the Fund acquired the net assets of Evergreen Global Opportunities Fund which became the accounting and performance survivor in this transaction. The information for the period prior to July 19, 2010 is that of Evergreen Global Opportunities Fund. |
| 2. | Class commenced operations on July 30, 2010. |
| 3. | Class I shares of the predecessor fund became Administrator Class shares on July 19, 2010. |
The accompanying notes are an integral part of these financial statements.
| | | | | | |
| Statements of Changes in Net Assets | | Wells Fargo Advantage International Stock Funds | | | 73 | |
| | | | | | | | | | | | | | | | |
| | | International Equity Fund | |
| | | Six Months Ended April 30, 2011 (Unaudited) | | | Year Ended October 31, 20101 | |
| | | | |
Operations | | | | | | | | | | | | | | | | |
Net investment income | | | | | | $ | 3,076,025 | | | | | | | $ | 8,041,021 | |
Net realized gains on investments | | | | | | | 56,726,385 | | | | | | | | 62,425,153 | |
Net change in unrealized gains (losses) on investments | | | | | | | 25,088,801 | | | | | | | | 51,836,107 | |
| | | | | | | | | | | | | | | | |
Net increase in net assets resulting from operations | | | | | | | 84,891,211 | | | | | | | | 122,302,281 | |
| | | | | | | | | | | | | | | | |
| | | | |
Distributions to shareholders from | | | | | | | | | | | | | | | | |
Net investment income | | | | | | | | | | | | | | | | |
Class A | | | | | | | (107,553 | ) | | | | | | | (6,368,446 | ) |
Class B | | | | | | | 0 | | | | | | | | (252,686 | ) |
Class C | | | | | | | 0 | | | | | | | | (441,262 | ) |
Class R | | | | | | | 0 | | | | | | | | (96,363 | ) |
Administrator Class | | | | | | | (11,170 | ) | | | | | | | 0 | 2 |
Institutional Class | | | | | | | (1,065,381 | ) | | | | | | | (17,420,403 | )3 |
| | | | | | | | | | | | | | | | |
Total distributions to shareholders | | | | | | | (1,184,104 | ) | | | | | | | (24,579,160 | ) |
| | | | | | | | | | | | | | | | |
| | | | |
| | | Shares | | | | | | Shares | | | | |
| | | | |
Capital share transactions | | | | | | | | | | | | | | | | |
Proceeds from shares sold | | | | | | | | | | | | | | | | |
Class A | | | 909,753 | | | | 10,081,915 | | | | 3,179,605 | | | | 23,368,652 | |
Class B | | | 5,082 | | | | 54,268 | | | | 16,787 | | | | 129,746 | |
Class C | | | 24,714 | | | | 265,244 | | | | 107,451 | | | | 777,918 | |
Class R | | | 33,653 | | | | 371,768 | | | | 293,832 | | | | 2,297,377 | |
Administrator Class | | | 434,228 | | | | 4,586,943 | | | | 1,142 | 2 | | | 11,280 | 2 |
Institutional Class | | | 868,281 | | | | 9,636,076 | | | | 7,358,048 | 3 | | | 52,344,476 | 3 |
| | | | | | | | | | | | | | | | |
| | | | | | | 24,996,214 | | | | | | | | 78,929,449 | |
| | | | | | | | | | | | | | | | |
Reinvestment of distributions | | | | | | | | | | | | | | | | |
Class A | | | 8,673 | | | | 93,847 | | | | 828,039 | | | | 5,528,625 | |
Class B | | | 0 | | | | 0 | | | | 34,306 | | | | 225,062 | |
Class C | | | 0 | | | | 0 | | | | 54,217 | | | | 355,760 | |
Class R | | | 0 | | | | 0 | | | | 8,495 | | | | 55,962 | |
Administrator Class | | | 691 | | | | 7,364 | | | | 0 | 2 | | | 0 | 2 |
Institutional Class | | | 28,689 | | | | 309,843 | | | | 1,248,311 | 3 | | | 8,401,276 | 3 |
| | | | | | | | | | | | | | | | |
| | | | | | | 411,054 | | | | | | | | 14,566,685 | |
| | | | | | | | | | | | | | | | |
Payment for shares redeemed | | | | | | | | | | | | | | | | |
Class A | | | (3,059,121 | ) | | | (33,630,530 | ) | | | (13,157,399 | ) | | | (99,165,719 | ) |
Class B | | | (389,694 | ) | | | (4,177,908 | ) | | | (824,060 | ) | | | (5,894,008 | ) |
Class C | | | (354,786 | ) | | | (3,827,456 | ) | | | (1,621,044 | ) | | | (12,046,511 | ) |
Class R | | | (97,049 | ) | | | (1,029,054 | ) | | | (317,968 | ) | | | (2,644,362 | ) |
Administrator Class | | | (61,330 | ) | | | (667,611 | ) | | | (22 | )2 | | | (200 | )2 |
Institutional Class | | | (8,084,791 | ) | | | (88,790,103 | ) | | | (57,993,602 | )3 | | | (419,896,142 | )3 |
| | | | | | | | | | | | | | | | |
| | | | | | | (132,122,662 | ) | | | | | | | (539,646,942 | ) |
| | | | | | | | | | | | | | | | |
Net asset value of shares issued in acquisition | | | | | | | | | | | | | | | | |
Class A | | | 0 | | | | 0 | | | | 0 | | | | 2,399,642 | |
Class B | | | 0 | | | | 0 | | | | 0 | | �� | | 699,581 | |
Class C | | | 0 | | | | 0 | | | | 0 | | | | 280,009 | |
Administrator Class | | | 0 | | | | 0 | | | | 0 | | | | 66,179 | |
| | | | | | | | | | | | | | | | |
| | | | | | | 0 | | | | | | | | 3,445,411 | |
| | | | | | | | | | | | | | | | |
Net decrease in net assets resulting
from capital share transactions | | | | | | | (106,715,394 | ) | | | | | | | (442,705,397 | ) |
| | | | | | | | | | | | | | | | |
Total decrease in net assets | | | | | | | (23,008,287 | ) | | | | | | | (344,982,276 | ) |
| | | | | | | | | | | | | | | | |
| | | | |
Net assets | | | | | | | | | | | | | | | | |
Beginning of period | | | | | | | 644,339,095 | | | | | | | | 989,321,371 | |
| | | | | | | | | | | | | | | | |
End of period | | | | | | $ | 621,330,808 | | | | | | | $ | 644,339,095 | |
| | | | | | | | | | | | | | | | |
Undistributed net investment income | | | | | | $ | 2,988,341 | | | | | | | $ | 1,096,420 | |
| | | | | | | | | | | | | | | | |
| 1. | After the close of business on July 16, 2010, the Fund acquired the net assets of Evergreen International Equity Fund which became the accounting and performance survivor in the transaction. The information for the period prior to July 19, 2010 is that of Evergreen International Equity Fund. |
| 2. | Class commenced operations on July 16, 2010. |
| 3. | Class I shares of the predecessor fund became Institutional Class shares on July 19, 2010. |
The accompanying notes are an integral part of these financial statements.
| | | | |
| 74 | | Wells Fargo Advantage International Stock Funds | | Statements of Changes in Net Assets |
| | | | | | | | | | | | | | | | |
| | | Intrinsic World Equity Fund | |
| | | Six Months Ended April 30, 2011 (Unaudited) | | | Year Ended October 31, 20101 | |
| | | | |
Operations | | | | | | | | | | | | | | | | |
Net investment income | | | | | | $ | 125,287 | | | | | | | $ | 760,511 | |
Net realized losses on investments | | | | | | | (54,978 | ) | | | | | | | (1,312,960 | ) |
Net change in unrealized gains (losses) on investments | | | | | | | 13,896,317 | | | | | | | | 14,251,008 | |
| | | | | | | | | | | | | | | | |
Net increase in net assets resulting from operations | | | | | | | 13,966,626 | | | | | | | | 13,698,559 | |
| | | | | | | | | | | | | | | | |
| | | | |
Distributions to shareholders from | | | | | | | | | | | | | | | | |
Net investment income | | | | | | | | | | | | | | | | |
Class A | | | | | | | (725,935 | ) | | | | | | | (877,846 | ) |
Class B | | | | | | | NA | | | | | | | | (631 | )2 |
Class C | | | | | | | (373 | ) | | | | | | | (1,414 | ) |
Administrator Class | | | | | | | (2,809 | ) | | | | | | | (1,852 | )4 |
Institutional Class | | | | | | | (111 | ) | | | | | | | 0 | 3 |
| | | | | | | | | | | | | | | | |
Total distributions to shareholders | | | | | | | (729,228 | ) | | | | | | | (881,743 | ) |
| | | | | | | | | | | | | | | | |
| | | | |
| | | Shares | | | | | | Shares | | | | |
| | | | |
Capital share transactions | | | | | | | | | | | | | | | | |
Proceeds from shares sold | | | | | | | | | | | | | | | | |
Class A | | | 45,266 | | | | 730,792 | | | | 155,259 | | | | 2,168,313 | |
Class B | | | NA | | | | NA | | | | 5,253 | 2 | | | 71,708 | 2 |
Class C | | | 46 | | | | 687 | | | | 23,175 | | | | 321,754 | |
Administrator Class | | | 11,773 | | | | 180,036 | | | | 1,147 | 4 | | | 16,075 | 4 |
Institutional Class | | | 323 | | | | 5,326 | | | | 725 | 3 | | | 10,000 | 3 |
| | | | | | | | | | | | | | | | |
| | | | | | | 916,841 | | | | | | | | 2,587,850 | |
| | | | | | | | | | | | | | | | |
Reinvestment of distributions | | | | | | | | | | | | | | | | |
Class A | | | 45,264 | | | | 697,063 | | | | 62,022 | | | | 851,565 | |
Class B | | | NA | | | | NA | | | | 45 | 2 | | | 609² | |
Class C | | | 19 | | | | 292 | | | | 93 | | | | 1,257 | |
Administrator Class | | | 178 | | | | 2,730 | | | | 135 | 4 | | | 1,847 | 4 |
Institutional Class | | | 7 | | | | 111 | | | | 0 | 3 | | | 0 | 3 |
| | | | | | | | | | | | | | | | |
| | | | | | | 700,196 | | | | | | | | 855,278 | |
| | | | | | | | | | | | | | | | |
Payment for shares redeemed | | | | | | | | | | | | | | | | |
Class A | | | (584,072 | ) | | | (9,339,913 | ) | | | (1,384,199 | ) | | | (19,300,751 | ) |
Class B | | | NA | | | | NA | | | | (21,760 | )2 | | | (288,194 | )2 |
Class C | | | (4,083 | ) | | | (65,187 | ) | | | (16,153 | ) | | | (212,500 | ) |
Administrator Class | | | (2,304 | ) | | | (36,671 | ) | | | (3,915 | )4 | | | (52,386 | )4 |
| | | | | | | | | | | | | | | | |
| | | | | | | (9,441,771 | ) | | | | | | | (19,853,831 | ) |
| | | | | | | | | | | | | | | | |
Net decrease in net assets resulting
from capital share transactions | | | | | | | (7,824,734 | ) | | | | | | | (16,410,703 | ) |
| | | | | | | | | | | | | | | | |
Total increase (decrease) in net assets | | | | | | | 5,412,664 | | | | | | | | (3,593,887 | ) |
| | | | | | | | | | | | | | | | |
| | | | |
Net assets | | | | | | | | | | | | | | | | |
Beginning of period | | | | | | | 101,202,804 | | | | | | | | 104,796,691 | |
| | | | | | | | | | | | | | | | |
End of period | | | | | | $ | 106,615,468 | | | | | | | $ | 101,202,804 | |
| | | | | | | | | | | | | | | | |
Undistributed net investment income | | | | | | $ | 125,102 | | | | | | | $ | 729,043 | |
| | | | | | | | | | | | | | | | |
| 1. | After the close of business on July 16, 2010, the Fund acquired the net assets of Evergreen Intrinsic World Equity Fund which became the accounting and performance survivor in the transaction. The information for the period prior to July 19, 2010 is that of Evergreen Intrinsic World Equity Fund. |
| 2. | Class B shares of the predecessor fund became Class A shares on July 19, 2010. |
| 3. | Class commenced operations on July 30, 2010. |
| 4. | Class I shares of the predecessor fund became Administrator Class shares on July 19, 2010. |
The accompanying notes are an integral part of these financial statements.
This page is intentionally left blank.
| | | | |
| 76 | | Wells Fargo Advantage International Stock Funds | | Financial Highlights (Unaudited) |
| | | | | | | | | | | | | | | | |
| | | Beginning
Net Asset
Value Per
Share | | | Net
Investment
Income (Loss) | | | Net Realized
and Unrealized
Gains (Losses)
on Investments | | | Distributions
from Net
Investment
Income | |
| | | | |
Asia Pacific Fund | | | | | | | | | | | | | | | | |
Class A | | | | | | | | | | | | | | | | |
November 1, 2010 to April 30, 2011 (Unaudited) | | $ | 10.15 | | | | 0.01 | 2 | | | 0.56 | | | | (0.04 | ) |
October 1, 2010 to October 31, 20104 | | $ | 9.77 | | | | (0.01 | )2 | | | 0.39 | | | | 0.00 | |
October 1, 2009 to September 30, 2010 | | $ | 8.82 | | | | 0.04 | 2 | | | 1.05 | | | | (0.14 | ) |
October 1, 2008 to September 30, 2009 | | $ | 8.14 | | | | 0.11 | 2 | | | 0.59 | | | | (0.02 | ) |
October 1, 2007 to September 30, 2008 | | $ | 15.83 | | | | 0.09 | 2 | | | (5.20 | ) | | | 0.00 | |
July 31, 20073 to September 30, 2007 | | $ | 14.75 | | | | 0.01 | | | | 1.07 | | | | 0.00 | |
Class C | | | | | | | | | | | | | | | | |
November 1, 2010 to April 30, 2011 (Unaudited) | | $ | 9.96 | | | | (0.03 | )2 | | | 0.55 | | | | (0.13 | ) |
October 1, 2010 to October 31, 20104 | | $ | 9.59 | | | | (0.01 | )2 | | | 0.38 | | | | 0.00 | |
October 1, 2009 to September 30, 2010 | | $ | 8.67 | | | | (0.01 | )2 | | | 1.03 | | | | (0.10 | ) |
October 1, 2008 to September 30, 2009 | | $ | 8.05 | | | | 0.05 | 2 | | | 0.57 | | | | 0.00 | |
October 1, 2007 to September 30, 2008 | | $ | 15.81 | | | | 0.04 | 2 | | | (5.22 | ) | | | 0.00 | |
July 31, 20073 to September 30, 2007 | | $ | 14.75 | | | | 0.00 | | | | 1.06 | | | | 0.00 | |
Administrator Class | | | | | | | | | | | | | | | | |
November 1, 2010 to April 30, 2011 (Unaudited) | | $ | 10.15 | | | | 0.02 | 2 | | | 0.56 | | | | (0.09 | ) |
October 1, 2010 to October 31, 20104 | | $ | 9.77 | | | | (0.00 | )2 | | | 0.38 | | | | 0.00 | |
July 30, 20103 to September 30, 2010 | | $ | 8.84 | | | | 0.03 | 2 | | | 0.90 | | | | 0.00 | |
Institutional Class | | | | | | | | | | | | | | | | |
November 1, 2010 to April 30, 2011 (Unaudited) | | $ | 10.15 | | | | 0.03 | | | | 0.56 | | | | (0.09 | ) |
October 1, 2010 to October 31, 20104 | | $ | 9.77 | | | | (0.01 | )2 | | | 0.39 | | | | 0.00 | |
July 30, 20103 to September 30, 2010 | | $ | 8.84 | | | | 0.03 | 2 | | | 0.90 | | | | 0.00 | |
Investor Class | | | | | | | | | | | | | | | | |
November 1, 2010 to April 30, 2011 (Unaudited) | | $ | 10.14 | | | | 0.01 | 2 | | | 0.57 | | | | (0.06 | ) |
October 1, 2010 to October 31, 20104 | | $ | 9.76 | | | | (0.01 | )2 | | | 0.39 | | | | 0.00 | |
October 1, 2009 to September 30, 2010 | | $ | 8.81 | | | | 0.04 | 2 | | | 1.05 | | | | (0.14 | ) |
October 1, 2008 to September 30, 2009 | | $ | 8.12 | | | | 0.09 | 2 | | | 0.60 | | | | 0.00 | |
October 1, 2007 to September 30, 2008 | | $ | 15.82 | | | | 0.06 | 2 | | | (5.18 | ) | | | 0.00 | |
October 1, 2006 to September 30, 2007 | | $ | 12.56 | | | | 0.05 | | | | 4.97 | | | | (0.03 | ) |
October 1, 2005 to September 30, 2006 | | $ | 11.53 | | | | 0.07 | | | | 2.02 | | | | (0.06 | ) |
| | | | |
Disciplined Global Equity Fund10 | | | | | | | | | | | | | | | | |
Class A | | | | | | | | | | | | | | | | |
November 1, 2010 to April 30, 2011 (Unaudited) | | $ | 13.02 | | | | 0.07 | 2 | | | 1.92 | | | | (0.15 | ) |
November 1, 2009 to October 31, 2010 | | $ | 11.57 | | | | 0.13 | 2 | | | 1.12 | | | | (0.18 | ) |
November 1, 2008 to October 31, 2009 | | $ | 10.44 | | | | 0.16 | 2 | | | 1.43 | | | | (0.19 | ) |
November 1, 2007 to October 31, 2008 | | $ | 21.46 | | | | 0.21 | | | | (8.15 | ) | | | (0.21 | ) |
November 1, 2006 to October 31, 2007 | | $ | 19.18 | | | | 0.19 | 2 | | | 3.57 | | | | (0.13 | ) |
November 1, 2005 to October 31, 2006 | | $ | 16.07 | | | | 0.13 | 2 | | | 3.10 | | | | (0.12 | ) |
Class C | | | | | | | | | | | | | | | | |
November 1, 2010 to April 30, 2011 (Unaudited) | | $ | 11.92 | | | | 0.02 | 2 | | | 1.76 | | | | (0.04 | ) |
November 1, 2009 to October 31, 2010 | | $ | 10.61 | | | | 0.04 | 2 | | | 0.98 | | | | (0.09 | ) |
November 1, 2008 to October 31, 2009 | | $ | 9.54 | | | | 0.08 | 2 | | | 1.32 | | | | (0.06 | ) |
November 1, 2007 to October 31, 2008 | | $ | 19.87 | | | | 0.10 | | | | (7.49 | ) | | | (0.07 | ) |
November 1, 2006 to October 31, 2007 | | $ | 17.86 | | | | 0.05 | 2 | | | 3.31 | | | | 0.00 | |
November 1, 2005 to October 31, 2006 | | $ | 14.96 | | | | 0.00 | 2 | | | 2.90 | | | | 0.00 | |
Administrator Class | | | | | | | | | | | | | | | | |
November 1, 2010 to April 30, 2011 (Unaudited) | | $ | 13.45 | | | | 0.09 | 2 | | | 1.98 | | | | (0.19 | ) |
November 1, 2009 to October 31, 2010 | | $ | 11.95 | | | | 0.16 | 2 | | | 1.18 | | | | (0.22 | ) |
November 1, 2008 to October 31, 2009 | | $ | 10.78 | | | | 0.19 | 2 | | | 1.49 | | | | (0.24 | ) |
November 1, 2007 to October 31, 2008 | | $ | 22.09 | | | | 0.27 | 2 | | | (8.44 | ) | | | (0.27 | ) |
November 1, 2006 to October 31, 2007 | | $ | 19.70 | | | | 0.26 | 2 | | | 3.67 | | | | (0.19 | ) |
November 1, 2005 to October 31, 2006 | | $ | 16.51 | | | | 0.18 | 2 | | | 3.19 | | | | (0.18 | ) |
Please see footnotes on p. 84
The accompanying notes are an integral part of these financial statements.
| | | | | | |
| Financial Highlights (Unaudited) | | Wells Fargo Advantage International Stock Funds | | | 77 | |
| | | | | | | | | | | | | | | | | | | | | | | | | | | | | | | | | | |
Distributions
from Net
Realized Gains | | | Regulatory Settlement Proceeds | | | Ending
Net Asset
Value Per
Share | | | Ratio to Average Net Assets (Annualized) | | | Total
Return1 | | | Portfolio
Turnover
Rate | | | Net Assets at
End of Period
(000’s omitted) | |
| | | | Net Investment
Income (Loss) | | | Gross
Expenses | | | Net
Expenses | | | | |
| | | | | | | | |
| | | | | | | | | | | | | | | | | | | | | | | | | | | | | | | | | | | |
| | | | | | | | | | | | | | | | | | | | | | | | | | | | | | | | | | |
| | 0.00 | | | | 0.00 | | | $ | 10.68 | | | | 0.11 | % | | | 1.77 | % | | | 1.60 | % | | | 5.59 | % | | | 113 | % | | $ | 37,791 | |
| | 0.00 | | | | 0.00 | | | $ | 10.15 | | | | (0.91 | )% | | | 1.90 | % | | | 1.60 | % | | | 3.89 | % | | | 11 | % | | $ | 63,741 | |
| | 0.00 | | | | 0.00 | | | $ | 9.77 | | | | 0.49 | % | | | 1.90 | % | | | 1.59 | % | | | 12.58 | % | | | 137 | % | | $ | 62,700 | |
| | 0.00 | | | | 0.00 | | | $ | 8.82 | | | | 1.56 | % | | | 2.03 | % | | | 1.60 | % | | | 8.64 | % | | | 185 | % | | $ | 85,156 | |
| | (2.58 | ) | | | 0.00 | | | $ | 8.14 | | | | 0.77 | % | | | 1.99 | % | | | 1.60 | % | | | (38.53 | )% | | | 187 | % | | $ | 43,946 | |
| | 0.00 | | | | 0.00 | | | $ | 15.83 | | | | 0.93 | % | | | 1.91 | % | | | 1.50 | % | | | 7.32 | % | | | 184 | % | | $ | 431 | |
| | | | | | | | | | | | | | | | | | | | | | | | | | | | | | | | | | |
| | 0.00 | | | | 0.00 | | | $ | 10.35 | | | | (0.59 | )% | | | 2.52 | % | | | 2.35 | % | | | 5.16 | % | | | 113 | % | | $ | 1,383 | |
| | 0.00 | | | | 0.00 | | | $ | 9.96 | | | | (1.66 | )% | | | 2.65 | % | | | 2.35 | % | | | 3.86 | % | | | 11 | % | | $ | 1,507 | |
| | 0.00 | | | | 0.00 | | | $ | 9.59 | | | | (0.13 | )% | | | 2.65 | % | | | 2.34 | % | | | 11.84 | % | | | 137 | % | | $ | 1,450 | |
| | 0.00 | | | | 0.00 | | | $ | 8.67 | | | | 0.73 | % | | | 2.79 | % | | | 2.35 | % | | | 7.70 | % | | | 185 | % | | $ | 1,112 | |
| | (2.58 | ) | | | 0.00 | | | $ | 8.05 | | | | 0.36 | % | | | 2.71 | % | | | 2.35 | % | | | (39.10 | )% | | | 187 | % | | $ | 939 | |
| | 0.00 | | | | 0.00 | | | $ | 15.81 | | | | 0.08 | % | | | 2.64 | % | | | 2.25 | % | | | 7.19 | % | | | 184 | % | | $ | 44 | |
| | | | | | | | | | | | | | | | | | | | | | | | | | | | | | | | | | |
| | 0.00 | | | | 0.00 | | | $ | 10.64 | | | | 0.46 | % | | | 1.56 | % | | | 1.40 | % | | | 5.73 | % | | | 113 | % | | $ | 21,532 | |
| | 0.00 | | | | 0.00 | | | $ | 10.15 | | | | (0.70 | )% | | | 1.74 | % | | | 1.40 | % | | | 3.89 | % | | | 11 | % | | $ | 11 | |
| | 0.00 | | | | 0.00 | | | $ | 9.77 | | | | 1.98 | % | | | 1.80 | % | | | 1.40 | % | | | 10.52 | % | | | 137 | % | | $ | 11 | |
| | | | | | | | | | | | | | | | | | | | | | | | | | | | | | | | | | |
| | 0.00 | | | | 0.00 | | | $ | 10.65 | | | | 0.56 | % | | | 1.34 | % | | | 1.25 | % | | | 5.77 | % | | | 113 | % | | $ | 12 | |
| | 0.00 | | | | 0.00 | | | $ | 10.15 | | | | (0.57 | )% | | | 1.47 | % | | | 1.25 | % | | | 3.89 | % | | | 11 | % | | $ | 11 | |
| | 0.00 | | | | 0.00 | | | $ | 9.77 | | | | 2.11 | % | | | 1.47 | % | | | 1.25 | % | | | 10.52 | % | | | 137 | % | | $ | 11 | |
| | | | | | | | | | | | | | | | | | | | | | | | | | | | | | | | | | |
| | 0.00 | | | | 0.00 | | | $ | 10.66 | | | | 0.12 | % | | | 1.84 | % | | | 1.65 | % | | | 5.62 | % | | | 113 | % | | $ | 228,488 | |
| | 0.00 | | | | 0.00 | | | $ | 10.14 | | | | (0.96 | )% | | | 1.97 | % | | | 1.65 | % | | | 3.89 | % | | | 11 | % | | $ | 252,214 | |
| | 0.00 | | | | 0.00 | | | $ | 9.76 | | | | 0.41 | % | | | 1.99 | % | | | 1.64 | % | | | 12.51 | % | | | 137 | % | | $ | 241,892 | |
| | 0.00 | | | | 0.00 | | | $ | 8.81 | | | | 1.36 | % | | | 2.14 | % | | | 1.65 | % | | | 8.53 | % | | | 185 | % | | $ | 278,741 | |
| | (2.58 | ) | | | 0.00 | | | $ | 8.12 | | | | 0.52 | % | | | 2.01 | % | | | 1.65 | % | | | (38.63 | )% | | | 187 | % | | $ | 326,929 | |
| | (1.73 | ) | | | 0.00 | | | $ | 15.82 | | | | 0.34 | % | | | 1.95 | % | | | 1.65 | % | | | 44.31 | % | | | 184 | % | | $ | 583,810 | |
| | (1.00 | ) | | | 0.00 | | | $ | 12.56 | | | | 0.65 | % | | | 1.96 | % | | | 1.65 | % | | | 19.38 | % | | | 167 | % | | $ | 373,744 | |
| | | | | | | | |
| | | | | | | | | | | | | | | | | | | | | | | | | | | | | | | | | | | |
| | | | | | | | | | | | | | | | | | | | | | | | | | | | | | | | | | |
| | 0.00 | | | | 0.00 | | | $ | 14.86 | | | | 1.03 | % | | | 1.56 | % | | | 1.40 | % | | | 15.41 | % | | | 24 | % | | $ | 60,828 | |
| | 0.00 | | | | 0.38 | | | $ | 13.02 | | | | 1.06 | % | | | 1.92 | % | | | 1.55 | % | | | 14.27 | %12 | | | 58 | % | | $ | 56,894 | |
| | (0.27 | ) | | | 0.00 | | | $ | 11.57 | | | | 1.67 | % | | | 2.10 | % | | | 1.61 | % | | | 16.38 | % | | | 25 | % | | $ | 54,794 | |
| | (2.87 | ) | | | 0.00 | | | $ | 10.44 | | | | 1.45 | % | | | 1.85 | % | | | 1.61 | % | | | (42.61 | )% | | | 25 | % | | $ | 53,600 | |
| | (1.35 | ) | | | 0.00 | | | $ | 21.46 | | | | 0.97 | % | | | 1.82 | % | | | 1.64 | % | | | 20.89 | % | | | 43 | % | | $ | 110,031 | |
| | 0.00 | | | | 0.00 | | | $ | 19.18 | | | | 0.73 | % | | | 1.92 | % | | | 1.83 | % | | | 20.23 | % | | | 43 | % | | $ | 100,122 | |
| | | | | | | | | | | | | | | | | | | | | | | | | | | | | | | | | | |
| | 0.00 | | | | 0.00 | | | $ | 13.66 | | | | 0.28 | % | | | 2.31 | % | | | 2.15 | % | | | 14.98 | % | | | 24 | % | | $ | 8,270 | |
| | 0.00 | | | | 0.38 | | | $ | 11.92 | | | | 0.32 | % | | | 2.68 | % | | | 2.31 | % | | | 13.29 | %12 | | | 58 | % | | $ | 7,769 | |
| | (0.27 | ) | | | 0.00 | | | $ | 10.61 | | | | 0.93 | % | | | 2.85 | % | | | 2.36 | % | | | 15.63 | % | | | 25 | % | | $ | 8,134 | |
| | (2.87 | ) | | | 0.00 | | | $ | 9.54 | | | | 0.69 | % | | | 2.58 | % | | | 2.36 | % | | | (43.05 | )% | | | 25 | % | | $ | 8,478 | |
| | (1.35 | ) | | | 0.00 | | | $ | 19.87 | | | | 0.25 | % | | | 2.52 | % | | | 2.36 | % | | | 20.04 | % | | | 43 | % | | $ | 17,676 | |
| | 0.00 | | | | 0.00 | | | $ | 17.86 | | | | 0.01 | % | | | 2.62 | % | | | 2.53 | % | | | 19.39 | % | | | 43 | % | | $ | 17,484 | |
| | | | | | | | | | | | | | | | | | | | | | | | | | | | | | | | | | |
| | 0.00 | | | | 0.00 | | | $ | 15.33 | | | | 1.28 | % | | | 1.39 | % | | | 1.15 | % | | | 15.52 | % | | | 24 | % | | $ | 2,087 | |
| | 0.00 | | | | 0.38 | | | $ | 13.45 | | | | 0.33 | % | | | 1.70 | % | | | 1.30 | % | | | 14.54 | %12 | | | 58 | % | | $ | 1,128 | |
| | (0.27 | ) | | | 0.00 | | | $ | 11.95 | | | | 1.90 | % | | | 1.85 | % | | | 1.36 | % | | | 16.69 | % | | | 25 | % | | $ | 1,099 | |
| | (2.87 | ) | | | 0.00 | | | $ | 10.78 | | | | 1.66 | % | | | 1.58 | % | | | 1.36 | % | | | (42.49 | )% | | | 25 | % | | $ | 1,097 | |
| | (1.35 | ) | | | 0.00 | | | $ | 22.09 | | | | 1.27 | % | | | 1.52 | % | | | 1.36 | % | | | 21.26 | % | | | 43 | % | | $ | 2,897 | |
| | 0.00 | | | | 0.00 | | | $ | 19.70 | | | | 1.02 | % | | | 1.62 | % | | | 1.53 | % | | | 20.57 | % | | | 43 | % | | $ | 3,112 | |
| | | | |
| 78 | | Wells Fargo Advantage International Stock Funds | | Financial Highlights (Unaudited) |
| | | | | | | | | | | | | | | | |
| | | Beginning
Net Asset
Value Per
Share | | | Net
Investment
Income (Loss) | | | Net Realized
and Unrealized
Gains (Losses)
on Investments | | | Distributions
from Net
Investment
Income | |
| | | | |
Disciplined Global Equity Fund10 (continued) | | | | | | | | | | | | | | | | |
Institutional Class (Unaudited) | | | | | | | | | | | | | | | | |
November 1, 2010 to April 30, 2011 | | $ | 13.46 | | | | 0.14 | 2 | | | 1.94 | | | | (0.19 | ) |
July 30, 20103 to October 31, 2010 | | $ | 12.32 | | | | 0.04 | 2 | | | 1.10 | | | | 0.00 | |
| | | | |
Diversified International Fund | | | | | | | | | | | | | | | | |
Class A | | | | | | | | | | | | | | | | |
November 1, 2010 to April 30, 2011 (Unaudited) | | $ | 10.29 | | | | 0.05 | | | | 1.29 | | | | (0.11 | ) |
October 1, 2010 to October 31, 20104 | | $ | 9.84 | | | | 0.00 | 2 | | | 0.45 | | | | 0.00 | |
October 1, 2009 to September 30, 2010 | | $ | 9.62 | | | | 0.09 | 2 | | | 0.26 | | | | (0.13 | ) |
October 1, 2008 to September 30, 2009 | | $ | 11.68 | | | | 0.14 | 2 | | | (0.69 | ) | | | (0.23 | ) |
October 1, 2007 to September 30, 2008 | | $ | 19.49 | | | | 0.31 | 2 | | | (5.91 | ) | | | (0.23 | ) |
October 1, 2006 to September 30, 2007 | | $ | 15.91 | | | | 0.24 | 2 | | | 3.51 | | | | (0.17 | ) |
October 1, 2005 to September 30, 2006 | | $ | 13.69 | | | | 0.17 | 2 | | | 2.20 | | | | (0.15 | ) |
Class B | | | | | | | | | | | | | | | | |
November 1, 2010 to April 30, 2011 (Unaudited) | | $ | 9.74 | | | | 0.01 | 2 | | | 1.23 | | | | 0.00 | |
October 1, 2010 to October 31, 20104 | | $ | 9.32 | | | | 0.00 | 2 | | | 0.42 | | | | 0.00 | |
October 1, 2009 to September 30, 2010 | | $ | 9.12 | | | | (0.05 | )2 | | | 0.32 | | | | (0.07 | ) |
October 1, 2008 to September 30, 2009 | | $ | 11.07 | | | | 0.07 | 2 | | | (0.64 | ) | | | (0.10 | ) |
October 1, 2007 to September 30, 2008 | | $ | 18.52 | | | | 0.16 | 2 | | | (5.58 | ) | | | (0.05 | ) |
October 1, 2006 to September 30, 2007 | | $ | 15.13 | | | | 0.07 | 2 | | | 3.36 | | | | (0.04 | ) |
October 1, 2005 to September 30, 2006 | | $ | 13.03 | | | | 0.07 | 2 | | | 2.08 | | | | (0.05 | ) |
Class C | | | | | | | | | | | | | | | | |
November 1, 2010 to April 30, 2011 (Unaudited) | | $ | 9.59 | | | | 0.01 | 2 | | | 1.20 | | | | (0.04 | ) |
October 1, 2010 to October 31, 20104 | | $ | 9.17 | | | | 0.00 | 2 | | | 0.42 | | | | 0.00 | |
October 1, 2009 to September 30, 2010 | | $ | 8.98 | | | | 0.02 | 2 | | | 0.25 | | | | (0.08 | ) |
October 1, 2008 to September 30, 2009 | | $ | 10.98 | | | | 0.07 | 2 | | | (0.65 | ) | | | (0.14 | ) |
October 1, 2007 to September 30, 2008 | | $ | 18.46 | | | | 0.17 | 2 | | | (5.56 | ) | | | (0.11 | ) |
October 1, 2006 to September 30, 2007 | | $ | 15.10 | | | | 0.09 | 2 | | | 3.34 | | | | (0.07 | ) |
October 1, 2005 to September 30, 2006 | | $ | 13.00 | | | | 0.07 | 2 | | | 2.09 | | | | (0.06 | ) |
Administrator Class | | | | | | | | | | | | | | | | |
November 1, 2010 to April 30, 2011 (Unaudited) | | $ | 10.28 | | | | 0.02 | 2 | | | 1.33 | | | | (0.13 | ) |
October 1, 2010 to October 31, 20104 | | $ | 9.83 | | | | 0.00 | 2 | | | 0.45 | | | | 0.00 | |
October 1, 2009 to September 30, 2010 | | $ | 9.59 | | | | 0.12 | 2 | | | 0.26 | | | | (0.14 | ) |
October 1, 2008 to September 30, 2009 | | $ | 11.67 | | | | 0.16 | 2 | | | (0.65 | ) | | | (0.26 | ) |
October 1, 2007 to September 30, 2008 | | $ | 19.48 | | | | 0.31 | 2 | | | (5.87 | ) | | | (0.27 | ) |
October 1, 2006 to September 30, 2007 | | $ | 15.90 | | | | 0.26 | 2 | | | 3.53 | | | | (0.21 | ) |
October 1, 2005 to September 30, 2006 | | $ | 13.69 | | | | 0.23 | 2 | | | 2.17 | | | | (0.19 | ) |
Institutional Class | | | | | | | | | | | | | | | | |
November 1, 2010 to April 30, 2011 (Unaudited) | | $ | 10.29 | | | | 0.11 | | | | 1.25 | | | | (0.15 | ) |
October 1, 2010 to October 31, 20104 | | $ | 9.84 | | | | 0.00 | 2 | | | 0.45 | | | | 0.00 | |
October 1, 2009 to September 30, 2010 | | $ | 9.60 | | | | 0.15 | 2 | | | 0.24 | | | | (0.15 | ) |
October 1, 2008 to September 30, 2009 | | $ | 11.69 | | | | 0.18 | 2 | | | (0.70 | ) | | | (0.29 | ) |
October 1, 2007 to September 30, 2008 | | $ | 19.50 | | | | 0.38 | 2 | | | (5.90 | ) | | | (0.31 | ) |
October 1, 2006 to September 30, 2007 | | $ | 15.91 | | | | 0.45 | 2 | | | 3.37 | | | | (0.23 | ) |
August 31, 20063 to September 30, 2006 | | $ | 15.84 | | | | 0.02 | 2 | | | 0.05 | | | | 0.00 | |
Investor Class | | | | | | | | | | | | | | | | |
November 1, 2010 to April 30, 2011 (Unaudited) | | $ | 10.26 | | | | 0.05 | 2 | | | 1.28 | | | | (0.11 | ) |
October 1, 2010 to October 31, 20104 | | $ | 9.81 | | | | 0.00 | 2 | | | 0.45 | | | | 0.00 | |
October 1, 2009 to September 30, 2010 | | $ | 9.58 | | | | 0.11 | 2 | | | 0.24 | | | | (0.12 | ) |
October 1, 2008 to September 30, 2009 | | $ | 11.68 | | | | 0.14 | 2 | | | 0.70 | | | | (0.26 | ) |
July 18, 20083 to September 30, 2008 | | $ | 14.27 | | | | 0.04 | 2 | | | (2.63 | ) | | | 0.00 | |
Please see footnotes on p. 84
The accompanying notes are an integral part of these financial statements.
| | | | | | |
| Financial Highlights (Unaudited) | | Wells Fargo Advantage International Stock Funds | | | 79 | |
| | | | | | | | | | | | | | | | | | | | | | | | | | | | | | |
Distributions
from Net
Realized Gains | | | Ending
Net Asset
Value Per
Share | | | Ratio to Average Net Assets (Annualized) | | | Total
Return1 | | | Portfolio
Turnover
Rate | | | Net Assets at
End of Period
(000’s omitted) | |
| | | Net Investment
Income (Loss) | | | Gross
Expenses | | | Net
Expenses | | | | |
| | | | | | | |
| | | | | | | | | | | | | | | | | | | | | | | | | | | | | | | |
| | | | | | | | | | | | | | | | | | | | | | | | | | | | | | |
| | 0.00 | | | $ | 15.35 | | | | 1.95 | % | | | 1.07 | % | | | 0.95 | % | | | 15.65 | % | | | 24 | % | | $ | 717 | |
| | 0.00 | | | $ | 13.46 | | | | 1.31 | % | | | 1.28 | % | | | 0.96 | % | | | 9.25 | % | | | 58 | % | | $ | 11 | |
| | | | | | | |
| | | | | | | | | | | | | | | | | | | | | | | | | | | | | | | |
| | | | | | | | | | | | | | | | | | | | | | | | | | | | | | |
| | 0.00 | | | $ | 11.52 | | | | 0.98 | % | | | 1.51 | % | | | 1.41 | % | | | 13.15 | % | | | 27 | % | | $ | 31,050 | |
| | 0.00 | | | $ | 10.29 | | | | 0.59 | % | | | 1.54 | % | | | 1.41 | % | | | 4.57 | % | | | 5 | % | | $ | 29,804 | |
| | 0.00 | | | $ | 9.84 | | | | 0.99 | % | | | 1.64 | % | | | 1.38 | % | | | 3.64 | % | | | 64 | % | | $ | 28,926 | |
| | (1.28 | ) | | $ | 9.62 | | | | 1.76 | % | | | 1.76 | % | | | 1.41 | % | | | (0.78 | )% | | | 123 | % | | $ | 31,742 | |
| | (1.98 | ) | | $ | 11.68 | | | | 1.93 | % | | | 1.67 | % | | | 1.48 | % | | | (32.12 | )% | | | 62 | % | | $ | 37,819 | |
| | 0.00 | | | $ | 19.49 | | | | 1.32 | % | | | 1.70 | % | | | 1.50 | % | | | 23.68 | % | | | 49 | % | | $ | 62,693 | |
| | 0.00 | | | $ | 15.91 | | | | 1.16 | % | | | 1.67 | % | | | 1.50 | % | | | 17.50 | % | | | 44 | % | | $ | 52,243 | |
| | | | | | | | | | | | | | | | | | | | | | | | | | | | | | |
| | 0.00 | | | $ | 10.98 | | | | 0.11 | % | | | 2.26 | % | | | 2.16 | % | | | 12.63 | % | | | 27 | % | | $ | 830 | |
| | 0.00 | | | $ | 9.74 | | | | (0.16 | )% | | | 2.28 | % | | | 2.16 | % | | | 4.51 | % | | | 5 | % | | $ | 1,084 | |
| | 0.00 | | | $ | 9.32 | | | | (0.59 | )% | | | 2.39 | % | | | 2.13 | % | | | 3.00 | % | | | 64 | % | | $ | 1,046 | |
| | (1.28 | ) | | $ | 9.12 | | | | 0.93 | % | | | 2.51 | % | | | 2.16 | % | | | (1.50 | )% | | | 123 | % | | $ | 1,739 | |
| | (1.98 | ) | | $ | 11.07 | | | | 1.03 | % | | | 2.43 | % | | | 2.23 | % | | | (32.61 | )% | | | 62 | % | | $ | 3,213 | |
| | 0.00 | | | $ | 18.52 | | | | 0.39 | % | | | 2.45 | % | | | 2.25 | % | | | 22.73 | % | | | 49 | % | | $ | 9,579 | |
| | 0.00 | | | $ | 15.13 | | | | 0.49 | % | | | 2.42 | % | | | 2.25 | % | | | 16.57 | % | | | 44 | % | | $ | 15,385 | |
| | | | | | | | | | | | | | | | | | | | | | | | | | | | | | |
| | 0.00 | | | $ | 10.76 | | | | 0.24 | % | | | 2.26 | % | | | 2.16 | % | | | 12.67 | % | | | 27 | % | | $ | 821 | |
| | 0.00 | | | $ | 9.59 | | | | (0.16 | )% | | | 2.28 | % | | | 2.16 | % | | | 4.58 | % | | | 5 | % | | $ | 744 | |
| | 0.00 | | | $ | 9.17 | | | | 0.20 | % | | | 2.39 | % | | | 2.12 | % | | | 3.07 | % | | | 64 | % | | $ | 718 | |
| | (1.28 | ) | | $ | 8.98 | | | | 0.92 | % | | | 2.51 | % | | | 2.16 | % | | | (1.47 | )% | | | 123 | % | | $ | 719 | |
| | (1.98 | ) | | $ | 10.98 | | | | 1.11 | % | | | 2.42 | % | | | 2.23 | % | | | (32.64 | )% | | | 62 | % | | $ | 995 | |
| | 0.00 | | | $ | 18.46 | | | | 0.54 | % | | | 2.45 | % | | | 2.25 | % | | | 22.76 | % | | | 49 | % | | $ | 1,961 | |
| | 0.00 | | | $ | 15.10 | | | | 0.49 | % | | | 2.42 | % | | | 2.25 | % | | | 16.65 | % | | | 44 | % | | $ | 1,652 | |
| | | | | | | | | | | | | | | | | | | | | | | | | | | | | | |
| | 0.00 | | | $ | 11.50 | | | | 0.38 | % | | | 1.37 | % | | | 1.25 | % | | | 13.23 | % | | | 27 | % | | $ | 6,303 | |
| | 0.00 | | | $ | 10.28 | | | | 0.75 | % | | | 1.38 | % | | | 1.25 | % | | | 4.58 | % | | | 5 | % | | $ | 202,247 | |
| | 0.00 | | | $ | 9.83 | | | | 1.31 | % | | | 1.46 | % | | | 1.22 | % | | | 3.87 | % | | | 64 | % | | $ | 193,626 | |
| | (1.28 | ) | | $ | 9.59 | | | | 2.02 | % | | | 1.58 | % | | | 1.25 | % | | | (0.66 | )% | | | 123 | % | | $ | 261,004 | |
| | (1.98 | ) | | $ | 11.67 | | | | 1.92 | % | | | 1.50 | % | | | 1.25 | % | | | (31.98 | )% | | | 62 | % | | $ | 293,831 | |
| | 0.00 | | | $ | 19.48 | | | | 1.48 | % | | | 1.52 | % | | | 1.25 | % | | | 24.00 | % | | | 49 | % | | $ | 689,808 | |
| | 0.00 | | | $ | 15.90 | | | | 1.52 | % | | | 1.49 | % | | | 1.25 | % | | | 17.74 | % | | | 44 | % | | $ | 698,778 | |
| | | | | | | | | | | | | | | | | | | | | | | | | | | | | | |
| | 0.00 | | | $ | 11.50 | | | | 1.86 | % | | | 1.07 | % | | | 0.99 | % | | | 13.36 | % | | | 27 | % | | $ | 470,188 | |
| | 0.00 | | | $ | 10.29 | | | | 1.00 | % | | | 1.11 | % | | | 0.99 | % | | | 4.57 | % | | | 5 | % | | $ | 199,081 | |
| | 0.00 | | | $ | 9.84 | | | | 1.63 | % | | | 1.19 | % | | | 0.96 | % | | | 4.13 | % | | | 64 | % | | $ | 194,651 | |
| | (1.28 | ) | | $ | 9.60 | | | | 2.30 | % | | | 1.31 | % | | | 0.99 | % | | | (0.41 | )% | | | 123 | % | | $ | 69,698 | |
| | (1.98 | ) | | $ | 11.69 | | | | 2.46 | % | | | 1.23 | % | | | 1.04 | % | | | (31.79 | )% | | | 62 | % | | $ | 59,620 | |
| | 0.00 | | | $ | 19.50 | | | | 2.43 | % | | | 1.22 | % | | | 1.05 | % | | | 24.22 | % | | | 49 | % | | $ | 69,756 | |
| | 0.00 | | | $ | 15.91 | | | | 1.77 | % | | | 1.29 | % | | | 0.89 | % | | | 0.44 | % | | | 44 | % | | $ | 10 | |
| | | | | | | | | | | | | | | | | | | | | | | | | | | | | | |
| | 0.00 | | | $ | 11.48 | | | | 0.94 | % | | | 1.58 | % | | | 1.46 | % | | | 13.05 | % | | | 27 | % | | $ | 52,227 | |
| | 0.00 | | | $ | 10.26 | | | | 0.54 | % | | | 1.61 | % | | | 1.46 | % | | | 4.59 | % | | | 5 | % | | $ | 48,070 | |
| | 0.00 | | | $ | 9.81 | | | | 1.18 | % | | | 1.73 | % | | | 1.43 | % | | | 3.74 | % | | | 64 | % | | $ | 46,282 | |
| | (1.28 | ) | | $ | 9.58 | | | | 1.75 | % | | | 1.87 | % | | | 1.46 | % | | | (0.82 | )% | | | 123 | % | | $ | 47,569 | |
| | 0.00 | | | $ | 11.68 | | | | 1.60 | % | | | 1.85 | % | | | 1.46 | % | | | (18.15 | )% | | | 62 | % | | $ | 47,062 | |
| | | | |
| 80 | | Wells Fargo Advantage International Stock Funds | | Financial Highlights (Unaudited) |
| | | | | | | | | | | | | | | | |
| | | Beginning
Net Asset
Value Per
Share | | | Net
Investment
Income (Loss) | | | Net Realized
and Unrealized
Gains (Losses)
on Investments | | | Distributions
from Net
Investment
Income | |
| | | | |
Emerging Markets Equity Fund5 | | | | | | | | | | | | | | | | |
Class A | | | | | | | | | | | | | | | | |
November 1, 2010 to April 30, 2011 (Unaudited) | | $ | 21.65 | | | | (0.01 | )2 | | | 2.18 | | | | (0.00 | )13 |
November 1, 2009 to October 31, 2010 | | $ | 16.99 | | | | 0.04 | 2 | | | 4.63 | | | | (0.01 | ) |
November 1, 2008 to October 31, 2009 | | $ | 12.90 | | | | 0.04 | 2 | | | 5.98 | | | | (0.12 | ) |
November 1, 2007 to October 31, 2008 | | $ | 30.53 | | | | 0.16 | | | | (14.22 | ) | | | (0.15 | ) |
November 1, 2006 to October 31, 2007 | | $ | 21.97 | | | | 0.19 | | | | 12.04 | | | | (0.17 | ) |
November 1, 2005 to October 31, 2006 | | $ | 16.48 | | | | 0.14 | 2 | | | 7.01 | | | | (0.13 | ) |
Class B | | | | | | | | | | | | | | | | |
November 1, 2010 to April 30, 2011 (Unaudited) | | $ | 18.82 | | | | (0.09 | )2 | | | 1.90 | | | | 0.00 | |
November 1, 2009 to October 31, 2010 | | $ | 14.87 | | | | (0.09 | )2 | | | 4.04 | | | | 0.00 | |
November 1, 2008 to October 31, 2009 | | $ | 11.51 | | | | (0.03 | ) | | | 5.20 | | | | 0.00 | |
November 1, 2007 to October 31, 2008 | | $ | 27.69 | | | | (0.01 | ) | | | (12.74 | ) | | | (0.01 | ) |
November 1, 2006 to October 31, 2007 | | $ | 20.34 | | | | (0.01 | )2 | | | 11.00 | | | | (0.14 | ) |
November 1, 2005 to October 31, 2006 | | $ | 15.38 | | | | 0.01 | 2 | | | 6.51 | | | | (0.03 | ) |
Class C | | | | | | | | | | | | | | | | |
November 1, 2010 to April 30, 2011 (Unaudited) | | $ | 18.68 | | | | (0.08 | )2 | | | 1.88 | | | | 0.00 | |
November 1, 2009 to October 31, 2010 | | $ | 14.77 | | | | (0.08 | )2 | | | 3.95 | | | | 0.00 | |
November 1, 2008 to October 31, 2009 | | $ | 11.44 | | | | (0.05 | ) | | | 5.19 | | | | 0.00 | |
November 1, 2007 to October 31, 2008 | | $ | 27.57 | | | | (0.02 | ) | | | (12.66 | ) | | | (0.03 | ) |
November 1, 2006 to October 31, 2007 | | $ | 20.27 | | | | 0.00 | 2 | | | 10.94 | | | | (0.14 | ) |
November 1, 2005 to October 31, 2006 | | $ | 15.35 | | | | 0.01 | 2 | | | 6.49 | | | | (0.05 | ) |
Administrator Class | | | | | | | | | | | | | | | | |
November 1, 2010 to April 30, 2011 (Unaudited) | | $ | 22.63 | | | | 0.02 | 2 | | | 2.27 | | | | (0.02 | ) |
November 1, 2009 to October 31, 2010 | | $ | 17.75 | | | | 0.09 | 2 | | | 4.83 | | | | (0.04 | ) |
November 1, 2008 to October 31, 2009 | | $ | 13.42 | | | | 0.08 | | | | 6.25 | | | | (0.19 | ) |
November 1, 2007 to October 31, 2008 | | $ | 31.59 | | | | 0.22 | | | | (14.77 | ) | | | 0.20 | |
November 1, 2006 to October 31, 2007 | | $ | 22.59 | | | | 0.20 | | | | 12.48 | | | | (0.18 | ) |
November 1, 2005 to October 31, 2006 | | $ | 16.90 | | | | 0.19 | | | | 7.22 | | | | (0.19 | ) |
Institutional Class | | | | | | | | | | | | | | | | |
November 1, 2010 to April 30, 2011 (Unaudited) | | $ | 22.66 | | | | 0.05 | 2 | | | 2.28 | | | | (0.05 | ) |
July 30, 20103 to October 31, 2010 | | $ | 20.11 | | | | 0.00 | 2 | | | 2.55 | | | | 0.00 | |
| | | | |
Global Opportunities Fund6 | | | | | | | | | | | | | | | | |
Class A | | | | | | | | | | | | | | | | |
November 1, 2010 to April 30, 2011 (Unaudited) | | $ | 31.91 | | | | (0.04 | )2 | | | 6.05 | | | | 0.00 | |
November 1, 2009 to October 31, 2010 | | $ | 24.96 | | | | 0.07 | 2 | | | 6.99 | | | | (0.11 | ) |
November 1, 2008 to October 31, 2009 | | $ | 21.20 | | | | 0.10 | 2 | | | 3.74 | | | | (0.08 | ) |
November 1, 2007 to October 31, 2008 | | $ | 40.22 | | | | 0.04 | 2 | | | (16.97 | ) | | | 0.00 | |
November 1, 2006 to October 31, 2007 | | $ | 32.61 | | | | (0.03 | )2 | | | 10.16 | | | | (0.04 | ) |
November 1, 2005 to October 31, 2006 | | $ | 27.86 | | | | (0.02 | )2 | | | 7.02 | | | | 0.00 | |
Class B | | | | | | | | | | | | | | | | |
November 1, 2010 to April 30, 2011 (Unaudited) | | $ | 25.92 | | | | (0.14 | )2 | | | 4.91 | | | | 0.00 | |
November 1, 2009 to October 31, 2010 | | $ | 20.33 | | | | (0.11 | )2 | | | 5.70 | | | | 0.00 | |
November 1, 2008 to October 31, 2009 | | $ | 17.34 | | | | (0.05 | )2 | | | 3.04 | | | | 0.00 | |
November 1, 2007 to October 31, 2008 | | $ | 33.54 | | | | (0.16 | )2 | | | (13.95 | ) | | | 0.00 | |
November 1, 2006 to October 31, 2007 | | $ | 27.73 | | | | (0.24 | ) | | | 8.53 | | | | 0.00 | |
November 1, 2005 to October 31, 2006 | | $ | 24.16 | | | | (0.20 | )2 | | | 6.02 | | | | 0.00 | |
Class C | | | | | | | | | | | | | | | | |
November 1, 2010 to April 30, 2011 (Unaudited) | | $ | 26.05 | | | | (0.14 | )2 | | | 4.94 | | | | 0.00 | |
November 1, 2009 to October 31, 2010 | | $ | 20.44 | | | | (0.11 | )2 | | | 5.72 | | | | 0.00 | |
November 1, 2008 to October 31, 2009 | | $ | 17.44 | | | | (0.05 | )2 | | | 3.05 | | | | 0.00 | |
November 1, 2007 to October 31, 2008 | | $ | 33.72 | | | | (0.16 | )2 | | | (14.03 | ) | | | 0.00 | |
November 1, 2006 to October 31, 2007 | | $ | 27.86 | | | | (0.24 | )2 | | | 8.58 | | | | 0.00 | |
November 1, 2005 to October 31, 2006 | | $ | 24.27 | | | | (0.19 | )2 | | | 6.03 | | | | 0.00 | |
Please see footnotes on p. 84
The accompanying notes are an integral part of these financial statements.
| | | | | | |
| Financial Highlights (Unaudited) | | Wells Fargo Advantage International Stock Funds | | | 81 | |
| | | | | | | | | | | | | | | | | | | | | | | | | | | | | | |
Distributions
from Net
Realized Gains | | | Ending
Net Asset
Value Per
Share | | | Ratio to Average Net Assets (Annualized) | | | Total
Return1 | | | Portfolio
Turnover
Rate | | | Net Assets at
End of Period
(000’s omitted) | |
| | | Net Investment
Income (Loss) | | | Gross
Expenses | | | Net
Expenses | | | | |
| | | | | | | |
| | | | | | | | | | | | | | | | | | | | | | | | | | | | | | | |
| | | | | | | | | | | | | | | | | | | | | | | | | | | | | | |
| | 0.00 | | | $ | 23.82 | | | | (0.08 | )% | | | 1.73 | % | | | 1.73 | % | | | 10.03 | % | | | 4 | % | | $ | 1,033,103 | |
| | 0.00 | | | $ | 21.65 | | | | 0.27 | % | | | 1.91 | % | | | 1.89 | % | | | 27.51 | % | | | 6 | % | | $ | 820,716 | |
| | (1.81 | ) | | $ | 16.99 | | | | 0.29 | % | | | 2.04 | % | | | 2.03 | % | | | 57.88 | % | | | 23 | % | | $ | 357,354 | |
| | (3.42 | ) | | $ | 12.90 | | | | 0.69 | % | | | 1.88 | % | | | 1.84 | % | | | (51.64 | )% | | | 39 | % | | $ | 128,714 | |
| | (3.50 | ) | | $ | 30.53 | | | | 0.72 | % | | | 1.90 | % | | | 1.87 | % | | | 63.88 | % | | | 58 | % | | $ | 305,698 | |
| | (1.53 | ) | | $ | 21.97 | | | | 0.72 | % | | | 2.06 | % | | | 2.02 | % | | | 47.34 | % | | | 96 | % | | $ | 102,687 | |
| | | | | | | | | | | | | | | | | | | | | | | | | | | | | | |
| | 0.00 | | | $ | 20.63 | | | | (0.90 | )% | | | 2.48 | % | | | 2.48 | % | | | 9.62 | % | | | 4 | % | | $ | 29,368 | |
| | 0.00 | | | $ | 18.82 | | | | (0.54 | )% | | | 2.66 | % | | | 2.64 | % | | | 26.56 | % | | | 6 | % | | $ | 30,989 | |
| | (1.81 | ) | | $ | 14.87 | | | | (0.43 | )% | | | 2.80 | % | | | 2.79 | % | | | 56.75 | % | | | 23 | % | | $ | 25,499 | |
| | (3.42 | ) | | $ | 11.51 | | | | (0.08 | )% | | | 2.61 | % | | | 2.59 | % | | | (51.99 | )% | | | 39 | % | | $ | 17,949 | |
| | (3.50 | ) | | $ | 27.69 | | | | (0.05 | )% | | | 2.61 | % | | | 2.60 | % | | | 62.68 | % | | | 58 | % | | $ | 42,477 | |
| | (1.53 | ) | | $ | 20.34 | | | | 0.06 | % | | | 2.76 | % | | | 2.72 | % | | | 46.29 | % | | | 96 | % | | $ | 18,243 | |
| | | | | | | | | | | | | | | | | | | | | | | | | | | | | | |
| | 0.00 | | | $ | 20.48 | | | | (0.83 | )% | | | 2.48 | % | | | 2.48 | % | | | 9.64 | % | | | 4 | % | | $ | 238,221 | |
| | 0.00 | | | $ | 18.68 | | | | (0.50 | )% | | | 2.66 | % | | | 2.64 | % | | | 26.47 | % | | | 6 | % | | $ | 193,300 | |
| | (1.81 | ) | | $ | 14.77 | | | | (0.46 | )% | | | 2.79 | % | | | 2.78 | % | | | 56.84 | % | | | 23 | % | | $ | 121,216 | |
| | (3.42 | ) | | $ | 11.44 | | | | (0.07 | )% | | | 2.61 | % | | | 2.59 | % | | | (52.01 | )% | | | 39 | % | | $ | 56,839 | |
| | (3.50 | ) | | $ | 27.57 | | | | 0.01 | % | | | 2.60 | % | | | 2.59 | % | | | 62.64 | % | | | 58 | % | | $ | 134,342 | |
| | (1.53 | ) | | $ | 20.27 | | | | 0.04 | % | | | 2.76 | % | | | 2.72 | % | | | 46.29 | % | | | 96 | % | | $ | 44,439 | |
| | | | | | | | | | | | | | | | | | | | | | | | | | | | | | |
| | 0.00 | | | $ | 24.90 | | | | 0.20 | % | | | 1.54 | % | | | 1.54 | % | | | 10.13 | % | | | 4 | % | | $ | 408,680 | |
| | 0.00 | | | $ | 22.63 | | | | 0.50 | % | | | 1.69 | % | | | 1.65 | % | | | 27.78 | % | | | 6 | % | | $ | 248,493 | |
| | (1.81 | ) | | $ | 17.75 | | | | 0.54 | % | | | 1.80 | % | | | 1.79 | % | | | 58.34 | % | | | 23 | % | | $ | 178,856 | |
| | (3.42 | ) | | $ | 13.42 | | | | 0.89 | % | | | 1.61 | % | | | 1.59 | % | | | (51.51 | )% | | | 39 | % | | $ | 141,996 | |
| | (3.50 | ) | | $ | 31.59 | | | | 0.84 | % | | | 1.62 | % | | | 1.61 | % | | | 64.23 | % | | | 58 | % | | $ | 364,958 | |
| | 1.53 | | | $ | 22.59 | | | | 0.95 | % | | | 1.75 | % | | | 1.71 | % | | | 47.81 | % | | | 96 | % | | $ | 313,391 | |
| | | | | | | | | | | | | | | | | | | | | | | | | | | | | | |
| | 0.00 | | | $ | 24.94 | | | | 0.50 | % | | | 1.29 | % | | | 1.25 | % | | | 10.28 | % | | | 4 | % | | $ | 352,189 | |
| | 0.00 | | | $ | 22.66 | | | | 0.02 | % | | | 1.48 | % | | | 1.30 | % | | | 12.68 | % | | | 6 | % | | $ | 197,823 | |
| | | | | | | |
| | | | | | | | | | | | | | | | | | | | | | | | | | | | | | | |
| | | | | | | | | | | | | | | | | | | | | | | | | | | | | | |
| | 0.00 | | | $ | 37.92 | | | | (0.21 | )% | | | 1.60 | % | | | 1.57 | % | | | 18.83 | % | | | 29 | % | | $ | 241,526 | |
| | 0.00 | | | $ | 31.91 | | | | 0.25 | % | | | 1.66 | % | | | 1.63 | % | | | 28.41 | % | | | 104 | % | | $ | 212,729 | |
| | 0.00 | | | $ | 24.96 | | | | 0.45 | % | | | 1.72 | % | | | 1.72 | % | | | 18.22 | % | | | 170 | % | | $ | 197,721 | |
| | (2.09 | ) | | $ | 21.20 | | | | 0.13 | % | | | 1.54 | % | | | 1.52 | % | | | (44.14 | )% | | | 161 | % | | $ | 214,883 | |
| | (2.48 | ) | | $ | 40.22 | | | | (0.08 | )% | | | 1.55 | % | | | 1.53 | % | | | 33.21 | % | | | 71 | % | | $ | 474,252 | |
| | (2.25 | ) | | $ | 32.61 | | | | (0.05 | )% | | | 1.67 | % | | | 1.67 | % | | | 26.78 | % | | | 103 | % | | $ | 259,898 | |
| | | | | | | | | | | | | | | | | | | | | | | | | | | | | | |
| | 0.00 | | | $ | 30.69 | | | | (0.96 | )% | | | 2.35 | % | | | 2.32 | % | | | 18.36 | % | | | 29 | % | | $ | 39,022 | |
| | 0.00 | | | $ | 25.92 | | | | (0.49 | )% | | | 2.41 | % | | | 2.38 | % | | | 27.43 | % | | | 104 | % | | $ | 37,752 | |
| | 0.00 | | | $ | 20.33 | | | | (0.30 | )% | | | 2.47 | % | | | 2.47 | % | | | 17.30 | % | | | 170 | % | | $ | 34,934 | |
| | (2.09 | ) | | $ | 17.34 | | | | (0.62 | )% | | | 2.27 | % | | | 2.27 | % | | | (44.54 | )% | | | 161 | % | | $ | 39,980 | |
| | (2.48 | ) | | $ | 33.54 | | | | (0.82 | )% | | | 2.25 | % | | | 2.25 | % | | | 32.28 | % | | | 71 | % | | $ | 87,408 | |
| | (2.25 | ) | | $ | 27.73 | | | | (0.75 | )% | | | 2.36 | % | | | 2.36 | % | | | 25.92 | % | | | 103 | % | | $ | 53,681 | |
| | | | | | | | | | | | | | | | | | | | | | | | | | | | | | |
| | 0.00 | | | $ | 30.85 | | | | (0.96 | )% | | | 2.35 | % | | | 2.32 | % | | | 18.38 | % | | | 29 | % | | $ | 60,012 | |
| | 0.00 | | | $ | 26.05 | | | | (0.50 | )% | | | 2.41 | % | | | 2.38 | % | | | 27.43 | % | | | 104 | % | | $ | 52,866 | |
| | 0.00 | | | $ | 20.44 | | | | (0.30 | )% | | | 2.47 | % | | | 2.47 | % | | | 17.33 | % | | | 170 | % | | $ | 50,218 | |
| | (2.09 | ) | | $ | 17.44 | | | | (0.61 | )% | | | 2.27 | % | | | 2.27 | % | | | (44.56 | )% | | | 161 | % | | $ | 59,382 | |
| | (2.48 | ) | | $ | 33.72 | | | | (0.81 | )% | | | 2.25 | % | | | 2.25 | % | | | 32.28 | % | | | 71 | % | | $ | 124,831 | |
| | (2.25 | ) | | $ | 27.86 | | | | (0.73 | )% | | | 2.37 | % | | | 2.37 | % | | | 25.88 | % | | | 103 | % | | $ | 61,777 | |
| | | | |
| 82 | | Wells Fargo Advantage International Stock Funds | | Financial Highlights (Unaudited) |
| | | | | | | | | | | | | | | | |
| | | Beginning
Net Asset
Value Per
Share | | | Net
Investment
Income (Loss) | | | Net Realized
and Unrealized
Gains (Losses)
on Investments | | | Distributions
from Net
Investment
Income | |
| | | | |
Global Opportunities Fund6 (continued) | | | | | | | | | | | | | | | | |
Administrator Class | | | | | | | | | | | | | | | | |
November 1, 2010 to April 30, 2011 (Unaudited) | | $ | 32.92 | | | | (0.01 | )2 | | | 6.23 | | | | (0.04 | ) |
November 1, 2009 to October 31, 2010 | | $ | 25.73 | | | | 0.14 | 2 | | | 7.23 | | | | (0.18 | ) |
November 1, 2008 to October 31, 2009 | | $ | 21.91 | | | | 0.16 | | | | 3.85 | | | | (0.19 | ) |
November 1, 2007 to October 31, 2008 | | $ | 41.42 | | | | 0.15 | 2 | | | (17.57 | ) | | | 0.00 | |
November 1, 2006 to October 31, 2007 | | $ | 33.46 | | | | 0.07 | 2 | | | 10.49 | | | | (0.12 | ) |
November 1, 2005 to October 31, 2006 | | $ | 28.46 | | | | 0.09 | 2 | | | 7.16 | | | | 0.00 | |
Institutional Class | | | | | | | | | | | | | | | | |
November 1, 2010 to April 30, 2011 (Unaudited) | | $ | 32.94 | | | | 0.03 | 2 | | | 6.24 | | | | (0.07 | ) |
July 30, 20103 to October 31, 2010 | | $ | 28.37 | | | | 0.04 | 2 | | | 4.53 | | | | 0.00 | |
| | | | |
International Equity Fund7 | | | | | | | | | | | | | | | | |
Class A | | | | | | | | | | | | | | | | |
November 1, 2010 to April 30, 2011 (Unaudited) | | $ | 10.41 | | | | 0.05 | | | | 1.47 | | | | (0.01 | ) |
November 1, 2009 to October 31, 2010 | | $ | 9.14 | | | | 0.09 | 2 | | | 1.42 | | | | (0.24 | ) |
November 1, 2008 to October 31, 2009 | | $ | 8.54 | | | | 0.17 | | | | 0.69 | | | | (0.26 | ) |
November 1, 2007 to October 31, 2008 | | $ | 17.72 | | | | 0.31 | 2 | | | (7.50 | ) | | | (0.36 | ) |
November 1, 2006 to October 31, 2007 | | $ | 15.51 | | | | 0.24 | | | | 3.79 | | | | (0.43 | ) |
November 1, 2005 to October 31, 2006 | | $ | 13.42 | | | | 0.32 | 2 | | | 2.68 | | | | (0.33 | ) |
Class B | | | | | | | | | | | | | | | | |
November 1, 2010 to April 30, 2011 (Unaudited) | | $ | 10.12 | | | | 0.01 | 2 | | | 1.42 | | | | 0.00 | |
November 1, 2009 to October 31, 2010 | | $ | 8.81 | | | | 0.01 | 2 | | | 1.41 | | | | (0.11 | ) |
November 1, 2008 to October 31, 2009 | | $ | 8.18 | | | | 0.11 | 2 | | | 0.66 | | | | (0.14 | ) |
November 1, 2007 to October 31, 2008 | | $ | 17.02 | | | | 0.21 | 2 | | | (7.20 | ) | | | (0.23 | ) |
November 1, 2006 to October 31, 2007 | | $ | 14.95 | | | | 0.15 | 2 | | | 3.62 | | | | (0.32 | ) |
November 1, 2005 to October 31, 2006 | | $ | 12.96 | | | | 0.22 | 2 | | | 2.58 | | | | (0.23 | ) |
Class C | | | | | | | | | | | | | | | | |
November 1, 2010 to April 30, 2011 (Unaudited) | | $ | 10.24 | | | | 0.01 | 2 | | | 1.45 | | | | 0.00 | |
November 1, 2009 to October 31, 2010 | | $ | 8.93 | | | | 0.01 | 2 | | | 1.41 | | | | (0.11 | ) |
November 1, 2008 to October 31, 2009 | | $ | 8.27 | | | | 0.07 | 2 | | | 0.72 | | | | (0.13 | ) |
November 1, 2007 to October 31, 2008 | | $ | 17.22 | | | | 0.21 | 2 | | | (7.27 | ) | | | (0.25 | ) |
November 1, 2006 to October 31, 2007 | | $ | 15.14 | | | | 0.15 | 2 | | | 3.67 | | | | (0.34 | ) |
November 1, 2005 to October 31, 2006 | | $ | 13.14 | | | | 0.22 | 2 | | | 2.61 | | | | (0.24 | ) |
Class R | | | | | | | | | | | | | | | | |
November 1, 2010 to April 30, 2011 (Unaudited) | | $ | 10.40 | | | | 0.04 | 2 | | | 1.46 | | | | 0.00 | |
November 1, 2009 to October 31, 2010 | | $ | 9.13 | | | | 0.06 | 2 | | | 1.42 | | | | (0.21 | ) |
November 1, 2008 to October 31, 2009 | | $ | 8.51 | | | | 0.14 | | | | 0.71 | | | | (0.23 | ) |
November 1, 2007 to October 31, 2008 | | $ | 17.70 | | | | 0.27 | 2 | | | (7.46 | ) | | | (0.35 | ) |
November 1, 2006 to October 31, 2007 | | $ | 15.55 | | | | 0.21 | | | | 3.77 | | | | (0.42 | ) |
November 1, 2005 to October 31, 2006 | | $ | 13.50 | | | | 0.30 | 2 | | | 2.68 | | | | (0.34 | ) |
Administrator Class | | | | | | | | | | | | | | | | |
November 1, 2010 to April 30, 2011 (Unaudited) | | $ | 10.28 | | | | 0.03 | | | | 1.46 | | | | (0.03 | ) |
July 16, 20103 to October 31, 2010 | | $ | 8.82 | | | | 0.01 | | | | 1.45 | | | | 0.00 | |
Institutional Class | | | | | | | | | | | | | | | | |
November 1, 2010 to April 30, 2011 (Unaudited) | | $ | 10.42 | | | | 0.08 | | | | 1.45 | | | | (0.03 | ) |
November 1, 2009 to October 31, 2010 | | $ | 9.17 | | | | 0.11 | 2 | | | 1.43 | | | | (0.29 | ) |
November 1, 2008 to October 31, 2009 | | $ | 8.59 | | | | 0.21 | | | | 0.67 | | | | (0.30 | ) |
November 1, 2007 to October 31, 2008 | | $ | 17.82 | | | | 0.32 | 2 | | | (7.52 | ) | | | (0.41 | ) |
November 1, 2006 to October 31, 2007 | | $ | 15.57 | | | | 0.32 | | | | 3.78 | | | | (0.47 | ) |
November 1, 2005 to October 31, 2006 | | $ | 13.47 | | | | 0.36 | | | | 2.68 | | | | (0.36 | ) |
Please see footnotes on p. 84
The accompanying notes are an integral part of these financial statements.
| | | | | | |
| Financial Highlights (Unaudited) | | Wells Fargo Advantage International Stock Funds | | | 83 | |
| | | | | | | | | | | | | | | | | | | | | | | | | | | | | | |
Distributions
from Net
Realized Gains | | | Ending
Net Asset
Value Per
Share | | | Ratio to Average Net Assets (Annualized) | | | Total
Return1 | | | Portfolio
Turnover
Rate | | | Net Assets at
End of Period
(000’s omitted) | |
| | | Net Investment
Income (Loss) | | | Gross
Expenses | | | Net
Expenses | | | | |
| | | | | | | |
| | | | | | | | | | | | | | | | | | | | | | | | | | | | | | | |
| | | | | | | | | | | | | | | | | | | | | | | | | | | | | | |
| | 0.00 | | | $ | 39.10 | | | | (0.03 | )% | | | 1.43 | % | | | 1.39 | % | | | 18.94 | % | | | 29 | % | | $ | 68,080 | |
| | 0.00 | | | $ | 32.92 | | | | 0.49 | % | | | 1.43 | % | | | 1.40 | % | | | 28.77 | % | | | 104 | % | | $ | 46,106 | |
| | 0.00 | | | $ | 25.73 | | | | 0.69 | % | | | 1.47 | % | | | 1.47 | % | | | 18.45 | % | | | 170 | % | | $ | 38,977 | |
| | (2.09 | ) | | $ | 21.91 | | | | 0.46 | % | | | 1.28 | % | | | 1.28 | % | | | (43.98 | )% | | | 161 | % | | $ | 36,027 | |
| | (2.48 | ) | | $ | 41.42 | | | | 0.20 | % | | | 1.25 | % | | | 1.25 | % | | | 33.57 | % | | | 71 | % | | $ | 43,378 | |
| | (2.25 | ) | | $ | 33.46 | | | | 0.28 | % | | | 1.37 | % | | | 1.37 | % | | | 27.19 | % | | | 103 | % | | $ | 14,931 | |
| | | | | | | | | | | | | | | | | | | | | | | | | | | | | | |
| | 0.00 | | | $ | 39.14 | | | | 0.17 | % | | | 1.09 | % | | | 1.09 | % | | | 19.07 | % | | | 29 | % | | $ | 1,334 | |
| | 0.00 | | | $ | 32.94 | | | | 0.53 | % | | | 1.22 | % | | | 1.15 | % | | | 16.11 | % | | | 104 | % | | $ | 12 | |
| | | | | | | |
| | | | | | | | | | | | | | | | | | | | | | | | | | | | | | | |
| | | | | | | | | | | | | | | | | | | | | | | | | | | | | | |
| | 0.00 | | | $ | 11.92 | | | | 0.93 | % | | | 1.47 | % | | | 1.09 | % | | | 14.56 | % | | | 23 | % | | $ | 221,958 | |
| | 0.00 | | | $ | 10.41 | | | | 0.91 | % | | | 1.19 | % | | | 1.07 | % | | | 16.90 | % | | | 42 | % | | $ | 216,096 | |
| | 0.00 | | | $ | 9.14 | | | | 2.16 | % | | | 1.08 | % | | | 1.08 | % | | | 10.55 | % | | | 203 | % | | $ | 255,075 | |
| | (1.63 | ) | | $ | 8.54 | | | | 2.30 | % | | | 0.97 | % | | | 0.95 | % | | | (45.46 | )% | | | 111 | % | | $ | 298,809 | |
| | (1.39 | ) | | $ | 17.72 | | | | 1.71 | % | | | 0.97 | % | | | 0.95 | % | | | 28.72 | % | | | 42 | % | | $ | 768,386 | |
| | (0.58 | ) | | $ | 15.51 | | | | 2.23 | % | | | 1.02 | % | | | 1.02 | % | | | 23.46 | % | | | 80 | % | | $ | 615,351 | |
| | | | | | | | | | | | | | | | | | | | | | | | | | | | | | |
| | 0.00 | | | $ | 11.55 | | | | 0.15 | % | | | 2.23 | % | | | 1.84 | % | | | 14.13 | % | | | 23 | % | | $ | 18,902 | |
| | 0.00 | | | $ | 10.12 | | | | 0.15 | % | | | 1.94 | % | | | 1.82 | % | | | 16.15 | % | | | 42 | % | | $ | 20,450 | |
| | 0.00 | | | $ | 8.81 | | | | 1.45 | % | | | 1.83 | % | | | 1.83 | % | | | 9.64 | % | | | 203 | % | | $ | 22,300 | |
| | (1.62 | ) | | $ | 8.18 | | | | 1.59 | % | | | 1.70 | % | | | 1.70 | % | | | (45.86 | )% | | | 111 | % | | $ | 29,756 | |
| | (1.38 | ) | | $ | 17.02 | | | | 0.98 | % | | | 1.67 | % | | | 1.67 | % | | | 27.77 | % | | | 42 | % | | $ | 70,187 | |
| | (0.58 | ) | | $ | 14.95 | | | | 1.54 | % | | | 1.72 | % | | | 1.72 | % | | | 22.57 | % | | | 80 | % | | $ | 69,621 | |
| | | | | | | | | | | | | | | | | | | | | | | | | | | | | | |
| | 0.00 | | | $ | 11.69 | | | | 0.17 | % | | | 2.23 | % | | | 1.84 | % | | | 14.16 | % | | | 23 | % | | $ | 30,889 | |
| | 0.00 | | | $ | 10.24 | | | | 0.16 | % | | | 1.94 | % | | | 1.82 | % | | | 16.13 | % | | | 42 | % | | $ | 30,439 | |
| | 0.00 | | | $ | 8.93 | | | | 1.39 | % | | | 1.83 | % | | | 1.83 | % | | | 9.62 | % | | | 203 | % | | $ | 36,718 | |
| | (1.64 | ) | | $ | 8.27 | | | | 1.61 | % | | | 1.70 | % | | | 1.70 | % | | | (45.85 | )% | | | 111 | % | | $ | 47,114 | |
| | (1.40 | ) | | $ | 17.22 | | | | 0.98 | % | | | 1.67 | % | | | 1.67 | % | | | 27.76 | % | | | 42 | % | | $ | 117,643 | |
| | (0.59 | ) | | $ | 15.14 | | | | 1.55 | % | | | 1.72 | % | | | 1.72 | % | | | 22.50 | % | | | 80 | % | | $ | 99,371 | |
| | | | | | | | | | | | | | | | | | | | | | | | | | | | | | |
| | 0.00 | | | $ | 11.90 | | | | 0.70 | % | | | 1.73 | % | | | 1.34 | % | | | 14.42 | % | | | 23 | % | | $ | 3,899 | |
| | 0.00 | | | $ | 10.40 | | | | 0.66 | % | | | 1.45 | % | | | 1.33 | % | | | 16.58 | % | | | 42 | % | | $ | 4,066 | |
| | 0.00 | | | $ | 9.13 | | | | 1.79 | % | | | 1.33 | % | | | 1.33 | % | | | 10.13 | % | | | 203 | % | | $ | 3,811 | |
| | (1.65 | ) | | $ | 8.51 | | | | 2.03 | % | | | 1.20 | % | | | 1.20 | % | | | (45.52 | )% | | | 111 | % | | $ | 3,603 | |
| | (1.41 | ) | | $ | 17.70 | | | | 1.49 | % | | | 1.16 | % | | | 1.16 | % | | | 28.40 | % | | | 42 | % | | $ | 9,107 | |
| | (0.59 | ) | | $ | 15.55 | | | | 2.02 | % | | | 1.22 | % | | | 1.22 | % | | | 23.16 | % | | | 80 | % | | $ | 4,694 | |
| | | | | | | | | | | | | | | | | | | | | | | | | | | | | | |
| | 0.00 | | | $ | 11.74 | | | | 0.86 | % | | | 1.25 | % | | | 1.09 | % | | | 14.51 | % | | | 23 | % | | $ | 4,489 | |
| | 0.00 | | | $ | 10.28 | | | | 0.32 | % | | | 1.36 | % | | | 1.09 | % | | | 16.55 | % | | | 42 | % | | $ | 89 | |
| | | | | | | | | | | | | | | | | | | | | | | | | | | | | | |
| | 0.00 | | | $ | 11.92 | | | | 1.15 | % | | | 1.05 | % | | | 0.84 | % | | | 14.65 | % | | | 23 | % | | $ | 341,195 | |
| | 0.00 | | | $ | 10.42 | | | | 1.15 | % | | | 0.87 | % | | | 0.82 | % | | | 17.17 | % | | | 42 | % | | $ | 373,200 | |
| | 0.00 | | | $ | 9.17 | | | | 2.39 | % | | | 0.83 | % | | | 0.83 | % | | | 10.73 | % | | | 203 | % | | $ | 671,417 | |
| | (1.62 | ) | | $ | 8.59 | | | | 2.34 | % | | | 0.69 | % | | | 0.69 | % | | | (45.26 | )% | | | 111 | % | | $ | 795,416 | |
| | (1.38 | ) | | $ | 17.82 | | | | 1.99 | % | | | 0.67 | % | | | 0.67 | % | | | 29.09 | % | | | 42 | % | | $ | 2,519,261 | |
| | (0.58 | ) | | $ | 15.57 | | | | 2.52 | % | | | 0.72 | % | | | 0.72 | % | | | 23.77 | % | | | 80 | % | | $ | 2,403,053 | |
| | | | |
| 84 | | Wells Fargo Advantage International Stock Funds | | Financial Highlights (Unaudited) |
| | | | | | | | | | | | | | | | |
| | | Beginning
Net Asset
Value Per
Share | | | Net
Investment
Income (Loss) | | | Net Realized
and Unrealized
Gains (Losses)
on Investments | | | Distributions
from Net
Investment
Income | |
| | | | |
Intrinsic World Equity Fund8 | | | | | | | | | | | | | | | | |
Class A | | | | | | | | | | | | | | | | |
November 1, 2010 to April 30, 2011 (Unaudited) | | $ | 15.06 | | | | 0.03 | | | | 2.13 | | | | (0.11 | ) |
November 1, 2009 to October 31, 2010 | | $ | 13.27 | | | | 0.12 | | | | 1.78 | | | | (0.11 | ) |
November 1, 2008 to October 31, 2009 | | $ | 13.76 | | | | 0.09 | 2 | | | 1.89 | | | | (0.24 | ) |
November 1, 2007 to October 31, 2008 | | $ | 24.23 | | | | 0.29 | | | | (9.55 | ) | | | (0.13 | ) |
January 1, 2007 to October 31, 20079,11 | | $ | 26.61 | | | | 0.17 | 2 | | | 2.29 | | | | 0.00 | |
January 1, 2006 to December 31, 200611 | | $ | 23.65 | | | | 0.17 | 2 | | | 3.62 | | | | (0.16 | ) |
January 1, 2005 to December 31, 200511 | | $ | 21.02 | | | | 0.09 | 2 | | | 2.65 | | | | (0.11 | ) |
Class C | | | | | | | | | | | | | | | | |
November 1, 2010 to April 30, 2011 (Unaudited) | | $ | 14.68 | | | | (0.04 | )2 | | | 2.10 | | | | (0.01 | ) |
November 1, 2009 to October 31, 2010 | | $ | 12.96 | | | | 0.07 | | | | 1.69 | | | | (0.04 | ) |
November 1, 2008 to October 31, 2009 | | $ | 13.58 | | | | (0.03 | )2 | | | 1.87 | | | | (0.23 | ) |
November 1, 2007 to October 31, 2008 | | $ | 24.14 | | | | (0.03 | )2 | | | (9.28 | ) | | | (0.17 | ) |
May 18, 20073 to October 31, 2007 | | $ | 28.59 | | | | (0.10 | )2 | | | 0.49 | | | | 0.00 | |
Administrator Class | | | | | | | | | | | | | | | | |
November 1, 2010 to April 30, 2011 (Unaudited) | | $ | 15.02 | | | | 0.03 | 2 | | | 2.14 | | | | (0.14 | ) |
November 1, 2009 to October 31, 2010 | | $ | 13.23 | | | | 0.15 | 2 | | | 1.78 | | | | (0.14 | ) |
November 1, 2008 to October 31, 2009 | | $ | 13.76 | | | | 0.15 | 2 | | | 1.85 | | | | (0.30 | ) |
November 1, 2007 to October 31, 2008 | | $ | 24.26 | | | | 0.38 | 2 | | | (9.60 | ) | | | (0.20 | ) |
May 18, 20073 to October 31, 2007 | | $ | 28.59 | | | | 0.01 | | | | 0.50 | | | | 0.00 | |
Institutional Class | | | | | | | | | | | | | | | | |
November 1, 2010 to April 30, 2011 (Unaudited) | | $ | 15.02 | | | | 0.09 | | | | 2.09 | | | | (0.15 | ) |
July 30, 20103 to October 31, 2010 | | $ | 13.80 | | | | 0.03 | 2 | | | 1.19 | | | | 0.00 | |
| 1. | Total return calculations do not include any sales charges. Returns for periods of less than one year are not annualized. |
| 2. | Calculated based upon average shares outstanding |
| 3. | Commencement of class operations. |
| 4. | For the one month ended October 31, 2010. The Fund changed it fiscal year end from September 30 to October 31, effective October 31, 2010. |
| 5. | After the close of business on July 16, 2010, the Fund acquired the net assets of Evergreen Emerging Markets Growth Fund and Wells Fargo Advantage Emerging Markets Equity Fund. Evergreen Emerging Markets Growth Fund became the accounting and performance survivor in this transaction. The information for the periods prior to July 19, 2010 are those of Evergreen Emerging Markets Growth Fund. |
| 6. | After the close of business on July 16, 2010, the Fund acquired the net assets of Evergreen Global Opportunities Fund which became the accounting and performance survivor in this transaction. The information for the periods prior to July 19, 2010 are those of Evergreen Global Opportunities Fund. |
| 7. | After the close of business on July 16, 2010, the Fund acquired the net assets of Evergreen International Equity Fund which became the accounting and performance survivor in the transaction. The information for the periods prior to July 19, 2010 are those of Evergreen International Equity Fund. The per share information has been adjusted to give effect to this transaction. |
| 8. | After the close of business on July 16, 2010, the Fund acquired the net assets of Evergreen Intrinsic World Equity Fund which became the accounting and performance survivor in the transaction. The information for the periods prior to July 19, 2010 are those of Evergreen Intrinsic World Equity Fund. |
| 9. | For the ten months ended October 31, 2007. The Fund changed it fiscal year end from December 31 to October 31, effective October 31, 2007. |
| 10. | After the close of business on July 16, 2010, the Fund acquired the net assets of Evergreen Global Large Cap Equity Fund which became the accounting and performance survivor in this transaction. The information for the periods prior to July 19, 2010 are those of Evergreen Global Large Cap Equity Fund. |
| 11. | On May 21, 2007, the predecessor fund acquired the net assets of Atlas Global Growth Fund (“Atlas Fund”). Atlas Fund was the accounting and performance survivor in this transaction. The financial highlights for the periods prior to May 21, 2007 are those of Atlas Fund. |
| 12. | Amount includes the impact of proceeds from a regulatory settlement which was received by the Fund from an unaffiliated third party. Without the proceeds from the settlement, total return would have been 10.68%, 9.48% and 10.91% for Class A, Class C and Administrator Class, respectively. |
| 13. | Amount represents less than $0.005 per share. |
The accompanying notes are an integral part of these financial statements.
| | | | | | |
| Financial Highlights (Unaudited) | | Wells Fargo Advantage International Stock Funds | | | 85 | |
| | | | | | | | | | | | | | | | | | | | | | | | | | | | | | |
Distributions
from Net
Realized Gains | | | Ending
Net Asset
Value Per
Share | | | Ratio to Average Net Assets (Annualized) | | | Total
Return1 | | | Portfolio
Turnover
Rate | | | Net Assets at
End of Period
(000’s omitted) | |
| | | Net Investment
Income (Loss) | | | Gross
Expenses | | | Net
Expenses | | | | |
| | | | | | | |
| | | | | | | | | | | | | | | | | | | | | | | | | | | | | | | |
| | | | | | | | | | | | | | | | | | | | | | | | | | | | | | |
| | 0.00 | | | $ | 17.11 | | | | 0.25 | % | | | 1.58 | % | | | 1.40 | % | | | 14.37 | % | | | 4 | % | | $ | 105,668 | |
| | 0.00 | | | $ | 15.06 | | | | 0.75 | % | | | 1.53 | % | | | 1.46 | % | | | 14.43 | % | | | 11 | % | | $ | 100,460 | |
| | (2.23 | ) | | $ | 13.27 | | | | 0.77 | % | | | 1.57 | % | | | 1.57 | % | | | 20.29 | % | | | 16 | % | | $ | 103,995 | |
| | (1.08 | ) | | $ | 13.76 | | | | 1.04 | % | | | 1.36 | % | | | 1.36 | % | | | (40.11 | )% | | | 44 | % | | $ | 107,210 | |
| | (4.84 | ) | | $ | 24.23 | | | | 0.78 | % | | | 1.24 | % | | | 1.24 | % | | | 10.42 | % | | | 66 | % | | $ | 279,146 | |
| | (0.67 | ) | | $ | 26.61 | | | | 0.66 | % | | | 1.29 | % | | | 1.29 | % | | | 16.02 | % | | | 21 | % | | $ | 457,035 | |
| | 0.00 | | | $ | 23.65 | | | | 0.43 | % | | | 1.31 | % | | | 1.31 | % | | | 13.02 | % | | | 28 | % | | $ | 321,219 | |
| | | | | | | | | | | | | | | | | | | | | | | | | | | | | | |
| | 0.00 | | | $ | 16.73 | | | | (0.51 | )% | | | 2.33 | % | | | 2.15 | % | | | 13.97 | % | | | 4 | % | | $ | 602 | |
| | 0.00 | | | $ | 14.68 | | | | 0.04 | % | | | 2.28 | % | | | 2.21 | % | | | 13.58 | % | | | 11 | % | | $ | 588 | |
| | (2.23 | ) | | $ | 12.96 | | | | (0.28 | )% | | | 2.33 | % | | | 2.33 | % | | | 19.35 | % | | | 16 | % | | $ | 427 | |
| | (1.08 | ) | | $ | 13.58 | | | | (0.19 | )% | | | 2.21 | % | | | 2.21 | % | | | (40.55 | )% | | | 44 | % | | $ | 154 | |
| | (4.84 | ) | | $ | 24.14 | | | | (0.92 | )% | | | 2.05 | % | | | 2.05 | % | | | 2.44 | % | | | 66 | % | | $ | 14 | |
| | | | | | | | | | | | | | | | | | | | | | | | | | | | | | |
| | 0.00 | | | $ | 17.05 | | | | 0.40 | % | | | 1.42 | % | | | 1.15 | % | | | 14.49 | % | | | 4 | % | | $ | 328 | |
| | 0.00 | | | $ | 15.02 | | | | 1.06 | % | | | 1.29 | % | | | 1.21 | % | | | 14.72 | % | | | 11 | % | | $ | 144 | |
| | (2.23 | ) | | $ | 13.23 | | | | 1.33 | % | | | 1.31 | % | | | 1.31 | % | | | 20.60 | % | | | 16 | % | | $ | 161 | |
| | (1.08 | ) | | $ | 13.76 | | | | 1.70 | % | | | 1.01 | % | | | 1.01 | % | | | (40.01 | )% | | | 44 | % | | $ | 1,567 | |
| | (4.84 | ) | | $ | 24.26 | | | | 0.12 | % | | | 1.05 | % | | | 1.05 | % | | | 2.89 | % | | | 66 | % | | $ | 71,656 | |
| | | | | | | | | | | | | | | | | | | | | | | | | | | | | | |
| | 0.00 | | | $ | 17.05 | | | | 0.74 | % | | | 1.16 | % | | | 0.95 | % | | | 14.65 | % | | | 4 | % | | $ | 18 | |
| | 0.00 | | | $ | 15.02 | | | | 0.91 | % | | | 1.23 | % | | | 0.95 | % | | | 8.84 | % | | | 11 | % | | $ | 11 | |
| | | | |
| 86 | | Wells Fargo Advantage International Stock Funds | | Notes to Financial Statements (Unaudited) |
1. ORGANIZATION
Wells Fargo Funds Trust (the “Trust”), a Delaware statutory trust organized on March 10, 1999, is an open-end management investment company registered under the Investment Company Act of 1940, as amended (the “1940 Act”). These financial statements report on the following funds: Wells Fargo Advantage Asia Pacific Fund (“Asia Pacific Fund”), Wells Fargo Advantage Disciplined Global Equity Fund (“Disciplined Global Equity Fund”), Wells Fargo Advantage Diversified International Fund (“Diversified International Fund”), Wells Fargo Advantage Emerging Markets Equity Fund (“Emerging Markets Equity Fund”), Wells Fargo Advantage Global Opportunities Fund (“Global Opportunities Fund”), Wells Fargo Advantage International Equity Fund (“International Equity Fund”) and Wells Fargo Advantage Intrinsic World Equity Fund (“Intrinsic World Equity Fund”) (each, a “Fund”, collectively, the “Funds”). Each Fund is a diversified series of the Trust.
2. SIGNIFICANT ACCOUNTING POLICIES
The following significant accounting policies, which are consistently followed in the preparation of the financial statements of each Fund, are in conformity with U.S. generally accepted accounting principles which require management to make estimates and assumptions that affect the reported amounts of assets and liabilities, disclosure of contingent assets and liabilities at the date of the financial statements, and the reported amounts of revenues and expenses during the reporting period. Actual results could differ from those estimates.
Securities valuation
Investments in securities are valued each business day as of the close of regular trading on the New York Stock Exchange, which is usually 4:00 p.m. (Eastern Time). Securities which are traded on a national or foreign securities exchange are valued at the last reported sales price, except that securities listed on The Nasdaq Stock Market, Inc. (“Nasdaq”) are valued at the Nasdaq Official Closing Price (“NOCP”), and if no NOCP is available, then at the last reported sales price. If no sales price is shown on the Nasdaq, the bid price will be used. In the absence of any sale of securities listed on the Nasdaq, and in the case of other securities, including U.S. Government obligations, but excluding debt securities maturing in 60 days or less, the price will be deemed “stale” and the valuations will be determined in accordance with the Funds’ Fair Value Procedures.
Securities denominated in foreign currencies are translated into U.S. dollars using the closing rates of exchange in effect on the day of valuation.
Many securities markets and exchanges outside the U.S. close prior to the close of the New York Stock Exchange and therefore may not fully reflect trading or events that occur after the close of the principal exchange in which the foreign investments are traded but before the close of the New York Stock Exchange. If such trading or events are expected to materially affect the value of the investments, then those investments are fair valued following procedures approved by the Board of Trustees. These procedures take into account multiple factors including movements in U.S. securities markets after foreign exchanges close. Depending on market activity, such fair valuations may be frequent. Such fair value pricing may result in NAVs that are higher or lower than NAVs based on the closing price or latest quoted bid price.
Investments in open-end mutual funds and non-registered investment companies are generally valued at net asset value.
Certain investments which are not valued using any of the methods discussed above, are valued at their fair value, as determined by procedures established in good faith and approved by the Board of Trustees.
The valuation techniques used by the Funds to measure fair value are consistent with the market approach, income approach and/or cost approach, where applicable, for each security type.
Foreign currency translation
The accounting records of the Funds are maintained in U.S. dollars. Assets, including investment securities, and liabilities denominated in foreign currency are translated into U.S. dollars at the prevailing rates of exchange at the date of valuation. Purchases and sales of securities, and income and expenses are translated at the prevailing rate of exchange on the respective dates of such transactions. Reported net realized foreign exchange gains or losses arise from sales of foreign currencies, currency gains or losses realized between the trade and settlement dates on securities transactions, and the difference between the amounts of dividends, interest and foreign withholding taxes recorded and the U.S. dollar equivalent of the amounts actually paid or received. Net unrealized foreign exchange gains and losses arise from changes in the fair value of assets and liabilities other than investments in securities resulting in changes in exchange rates.
| | | | | | |
| Notes to Financial Statements (Unaudited) | | Wells Fargo Advantage International Stock Funds | | | 87 | |
The changes in net assets arising from changes in exchange rates and the changes in net assets resulting from changes in market prices of securities are not separately presented. Such changes are recorded with net realized and unrealized gains or losses from investments. Gains and losses from certain foreign currency transactions are treated as ordinary income for U.S. federal income tax purposes.
Forward foreign currency contracts
Certain Funds may be subject to foreign currency exchange rate risk in the normal course of pursuing its investment objectives. A forward foreign currency contract is an agreement between two parties to purchase or sell a specific currency for an agreed-upon price at a future date. The Fund enters into forward foreign currency contracts to facilitate transactions in foreign-denominated securities and to attempt to minimize the risk to the Fund from adverse changes in the relationship between currencies. Forward foreign currency contracts are recorded at the forward rate and marked-to-market daily. When the contracts are closed, realized gains and losses arising from such transactions are recorded as realized gains or losses on forward foreign currency contract transactions. The Fund could be exposed to risks if the counterparties to the contracts are unable to meet the terms of their contracts or if the value of the foreign currency changes unfavorably. The Fund’s maximum risk of loss from counterparty credit risk is the unrealized gains or losses on the contracts. This risk is mitigated by having a master netting arrangement between the Fund and the counterparty.
Security loans
The Funds may lend their securities from time to time in order to earn additional income in the form of fees or interest on securities received as collateral or the investment of any cash received as collateral. A Fund continues to receive interest or dividends on the securities loaned. A Fund receives collateral in the form of cash or securities with a value at least equal to the value of the securities on loan. The value of the loaned securities is determined at the close of each business day and any additional required collateral is delivered to the Fund on the next business day. In the event of default or bankruptcy by the borrower, a Fund could experience delays and costs in recovering the loaned securities or in gaining access to the collateral. In addition, the investment of any cash collateral received may lose all or part of its value. The Fund has the right under the lending agreement to recover the securities from the borrower on demand.
The Funds lend their securities through an unaffiliated securities lending agent. Cash collateral received in connection with their securities lending transactions is invested in Wells Fargo Securities Lending Cash Investments, LLC (the “Cash Collateral Fund”). The Cash Collateral Fund is exempt from registration under Section 3(c)(7) of the 1940 Act and is managed by Wells Fargo Funds Management LLC (“Funds Management”) and is sub-advised by Wells Capital Management Incorporated (“Wells Capital Management”). Funds Management receives an advisory fee starting at 0.05% and declining to 0.01% as the average daily net assets of the Cash Collateral Fund increase. All of the fees received by Funds Management are paid to Wells Capital Management for its services as sub-adviser. The Cash Collateral Fund seeks to provide a positive return compared to the daily Fed Funds Open rate by investing in high-quality, U.S. dollar-denominated short-term money market instruments. Cash Collateral Fund investments are fair valued based upon the amortized cost valuation technique. Income earned from investment in the Cash Collateral Fund is included in securities lending income on the Statements of Operations.
Futures contracts
Certain Funds may be subject to equity price risk in the normal course of pursuing its investment objectives. The Funds may buy and sell futures contracts in order to gain exposure to, or protect against changes in, security values and interest rates. The primary risks associated with the use of futures contracts are the imperfect correlation between changes in market values of securities held by the Fund and the prices of futures contracts, and the possibility of an illiquid market.
Futures contracts are valued based upon their quoted daily settlement prices when available. The aggregate principal amounts of the contracts are not recorded in the financial statements. Fluctuations in the value of the contracts are recorded in the Statements of Assets and Liabilities as an asset or liability and in the Statements of Operations as unrealized gains or losses until the contracts are closed, at which point they are recorded as net realized gains or losses on futures contracts. With futures contracts, there is minimal counterparty risk to the Fund since futures are exchange traded and the exchange’s clearinghouse, as counterparty to all exchange traded futures, guarantees the futures against default.
| | | | |
| 88 | | Wells Fargo Advantage International Stock Funds | | Notes to Financial Statements (Unaudited) |
Security transactions and income recognition
Securities transactions are recorded on a trade date basis. Realized gains or losses are reported on the basis of identified cost of securities delivered.
Dividend income is recognized on the ex-dividend date, except for certain dividends from foreign securities, which are recorded as soon as the Fund is informed of the ex-dividend date. Dividend income from foreign securities is recorded net of foreign taxes withheld where recovery of such taxes is not assured.
Distributions to shareholders
Distributions to shareholders from net investment income and net realized gains, if any, are recorded on the ex-dividend date. Such distributions are determined in conformity with income tax regulations, which may differ from generally accepted accounting principles.
Federal and other taxes
Each Fund is treated as a separate entity for federal income tax purposes. Each Fund intends to continue to qualify as a regulated investment company by distributing substantially all of its investment company taxable income and any net realized capital gains (after reduction for capital loss carryforwards) sufficient to relieve it from all, or substantially all, federal income taxes. Accordingly, no provision for federal income taxes was required.
Each Fund’s income and federal excise tax returns and all financial records supporting those returns for the prior three fiscal years are subject to examination by the federal and Delaware revenue authorities.
At October 31, 2010, estimated net capital loss carryforwards, which are available to offset future net realized capital gains, were as follows:
| | | | | | | | | | | | |
| | | Expiration | |
| | | 2016 | | | 2017 | | | 2018 | |
Asia Pacific Fund | | $ | 90,181,236 | | | $ | 80,817,204 | | | $ | 0 | |
Disciplined Global Equity Fund | | | 0 | | | | 8,548,169 | | | | 737,120 | |
Diversified International Fund | | | 16,110,795 | | | | 95,119,882 | | | | 0 | |
Emerging Markets Equity Fund | | | 25,750,716 | | | | 22,695,719 | | | | 0 | |
Global Opportunities Fund | | | 0 | | | $ | 81,628,224 | | | | 0 | |
International Equity Fund | | | 171,044,854 | | | | 0 | | | | 0 | |
Intrinsic World Equity | | | 0 | | | | 13,228,770 | | | | 1,273,005 | |
Under the recently enacted Regulated Investment Company Modernization Act of 2010, the Funds will be permitted to carry forward capital losses incurred in taxable years beginning after December 22, 2010 for an unlimited period. However, any losses incurred during those future taxable years will be required to be utilized prior to the losses incurred in pre-enactment taxable years. As a result of this ordering rule, pre-enactment capital loss carryforwards may be more likely to expire unused. Additionally, post-enactment capital losses that are carried forward will retain their character as either short-term or long-term capital losses rather than being considered all short-term as under previous law.
Class allocations
The separate classes of shares offered by each Fund differ principally in applicable sales charges, distribution, shareholder servicing and administration fees. Shareholders of each class bear certain expenses that pertain to that particular class. All shareholders bear the common expenses of a Fund, earn income from the portfolio, and are allocated unrealized gains and losses pro rata based on the average daily net assets of each class, without distinction between share classes. Dividends are determined separately for each class based on income and expenses allocable to each class. Realized gains and losses are allocated to each class pro rata based upon the net assets of each class on the date realized. Differences in per share dividend rates generally result from the relative weightings of pro rata income and realized gain allocations and from differences in separate class expenses, including distribution, shareholder servicing, and administration fees.
| | | | | | |
| Notes to Financial Statements (Unaudited) | | Wells Fargo Advantage International Stock Funds | | | 89 | |
3. FAIR VALUATION MEASUREMENTS
Fair value measurements of investments are determined within a framework that has established a fair value hierarchy based upon the various data inputs utilized in determining the value of each Fund’s investments. The three-level hierarchy gives the highest priority to unadjusted quoted prices in active markets for identical assets or liabilities (Level 1) and the lowest priority to unobservable inputs (Level 3). Each Fund’s investments are classified within the fair value hierarchy based on the lowest level of input that is significant to the fair value measurement. The inputs are summarized into three broad levels as follows:
| n | | Level 1 – quoted prices in active markets for identical securities |
| n | | Level 2 – other significant observable inputs (including quoted prices for similar securities, interest rates, prepayment speeds, credit risk, etc.) |
| n | | Level 3 – significant unobservable inputs (including the Fund’s own assumptions in determining the fair value of investments) |
The inputs or methodologies used for valuing securities are not necessarily an indication of the risk associated with investing in those securities.
As of April 30, 2011, the inputs used in valuing each Fund’s assets, which are carried at fair value, were as follows:
| | | | | | | | | | | | | | | | |
| Investments in Securities | | Quoted Prices (Level 1) | | | Significant Other
Observable Inputs (Level 2) | | | Significant Unobservable Inputs (Level 3) | | | Total | |
Asia Pacific Fund | | | | | | | | | | | | | | | | |
| | | | |
Equity securities | | | | | | | | | | | | | | | | |
Common stocks | | $ | 277,412,200 | | | $ | 0 | | | $ | 0 | | | $ | 277,412,200 | |
Investment companies | | | 7,120,457 | | | | 0 | | | | 0 | | | | 7,120,457 | |
Warrants | | | 0 | | | | 1,173,801 | | | | 0 | | | | 1,173,801 | |
| | | | |
Short-term investments | | | | | | | | | | | | | | | | |
Investment companies | | | 5,642,176 | | | | 4,571,856 | | | | 0 | | | | 10,214,032 | |
| | | $ | 290,174,833 | | | $ | 5,745,657 | | | $ | 0 | | | $ | 295,920,490 | |
Disciplined Global Equity Fund | | | | | | | | | | | | | | | | |
| | | | |
Equity securities | | | | | | | | | | | | | | | | |
Common stocks | | | 70,359,772 | | | | 0 | | | | 0 | | | | 70,359,772 | |
Preferred stocks | | | 782,578 | | | | 0 | | | | 0 | | | | 782,578 | |
| | | | |
Short-term investments | | | | | | | | | | | | | | | | |
Investment companies | | | 413,618 | | | | 8,836,096 | | | | 0 | | | | 9,249,714 | |
U.S. Treasury obligations | | | 99,995 | | | | 0 | | | | 0 | | | | 99,995 | |
| | | $ | 71,655,963 | | | $ | 8,836,096 | | | $ | 0 | | | $ | 80,492,059 | |
Diversified International Fund | | | | | | | | | | | | | | | | |
| | | | |
Equity securities | | | | | | | | | | | | | | | | |
Common stocks | | $ | 535,005,148 | | | $ | 0 | | | $ | 0 | | | $ | 535,005,148 | |
| | | | |
Short-term investments | | | | | | | | | | | | | | | | |
Investment companies | | | 18,933,743 | | | | 67,556,672 | | | | 0 | | | | 86,490,415 | |
Total | | $ | 553,938,891 | | | $ | 67,556,672 | | | $ | 0 | | | $ | 621,495,563 | |
| | | | |
| 90 | | Wells Fargo Advantage International Stock Funds | | Notes to Financial Statements (Unaudited) |
| | | | | | | | | | | | | | | | |
| Investments in Securities | | Quoted Prices (Level 1) | | | Significant Other
Observable Inputs (Level 2) | | | Significant Unobservable Inputs (Level 3) | | | Total | |
Emerging Markets Equity Fund | | | | | | | | | | | | | | | | |
| | | | |
Equity securities | | | | | | | | | | | | | | | | |
Common stocks | | $ | 1,746,548,252 | | | $ | 5,000,786 | | | $ | 0 | | | $ | 1,751,549,038 | |
Preferred stocks | | | 68,340,914 | | | | 0 | | | | 0 | | | | 68,340,914 | |
Rights | | | 0 | | | | 585 | | | | 0 | | | | 585 | |
| | | | |
Convertible debenture | | | 0 | | | | 0 | | | | 187,343 | | | | 187,343 | |
| | | | |
Short-term investments | | | | | | | | | | | | | | | | |
Investment companies | | | 200,822,550 | | | | 349,220,149 | | | | 0 | | | | 550,042,699 | |
Total | | $ | 2,095,768,986 | | | $ | 274,164,250 | | | $ | 187,343 | | | $ | 2,370,120,579 | |
Global Opportunities Fund | | | | | | | | | | | | | | | | |
| | | | |
Equity securities | | | | | | | | | | | | | | | | |
Common stocks | | $ | 386,986,256 | | | $ | 0 | | | $ | 4,089,283 | | | $ | 391,075,539 | |
| | | | |
Short-term investments | | | | | | | | | | | | | | | | |
Investment companies | | | 16,020,017 | | | | 43,644,285 | | | | 0 | | | | 59,664,302 | |
Total | | $ | 403,006,273 | | | $ | 43,644,285 | | | $ | 4,089,283 | | | $ | 450,739,841 | |
International Equity Fund | | | | | | | | | | | | | | | | |
| | | | |
Equity securities | | | | | | | | | | | | | | | | |
Common stocks | | $ | 600,420,549 | | | $ | 0 | | | $ | 0 | | | $ | 600,420,549 | |
| | | | |
Short-term investments | | | | | | | | | | | | | | | | |
Investment companies | | | 21,159,393 | | | | 59,043,076 | | | | 0 | | | | 80,202,469 | |
U.S. Treasury obligations | | | 0 | | | | 1,284,983 | | | | 0 | | | | 1,284,983 | |
| | | $ | 621,579,942 | | | $ | 60,328,059 | | | $ | 0 | | | $ | 681,908,001 | |
Intrinsic World Equity Fund | | | | | | | | | | | | | | | | |
| | | | |
Equity securities | | | | | | | | | | | | | | | | |
Common stocks | | $ | 104,744,935 | | | $ | 0 | | | $ | 0 | | | $ | 104,744,935 | |
| | | | |
Short-term investments | | | | | | | | | | | | | | | | |
Investment companies | | | 1,809,772 | | | | 15,769,491 | | | | 0 | | | | 17,579,263 | |
| | | $ | 106,554,707 | | | $ | 15,769,491 | | | $ | 0 | | | $ | 122,324,198 | |
Further details on the majority security types listed above can be found on the Funds’ Portfolios of Investments.
As of April 30, 2011, the inputs used in valuing each Fund’s other financial instruments, which are carried at fair value, were as follows:
| | | | | | | | | | | | | | | | |
| Other financial instruments | | Quoted Prices (Level 1) | | | Significant Other
Observable Inputs (Level 2) | | | Significant Unobservable Inputs (Level 3) | | | Total | |
Futures Contracts | | | | | | | | | | | | | | | | |
Disciplined Global Equity Fund | | $ | 23,488 | | | $ | 0 | | | $ | 0 | | | $ | 23,488 | |
International Equity Fund | | | 1,437,466 | | | | 0 | | | | 0 | | | | 1,437,466 | |
Forward Foreign Currency Contracts | | | | | | | | | | | | | | | | |
Diversified International Fund | | $ | 0 | | | $ | (203,872 | ) | | $ | 0 | | | $ | (203,872 | ) |
Global Opportunities Fund | | | 0 | | | | 101,305 | | | | 0 | | | | 101,305 | |
International Equity Fund | | | 0 | | | | (704,944 | ) | | | 0 | | | | (704,944 | ) |
| | | | | | |
| Notes to Financial Statements (Unaudited) | | Wells Fargo Advantage International Stock Funds | | | 91 | |
Transfers in and transfers out are recognized at the end of the reporting period. For the six months ended April 30, 2011, the Funds did not have any significant transfers into/out of Level 1 and Level 2.
The following is a reconciliation of investments in which significant unobservable inputs (Level 3) were used in determining value:
| | | | | | | | | | | | |
| | | Diversified
International
Fund | | | Emerging Market
Equity Fund | | | Global
Opportunities
Fund | |
| | | Common stocks | | | Convertible
debentures | | | Common stocks | |
Balance as of October 31, 2010 | | $ | 103,217 | | | $ | 189,530 | | | $ | 0 | |
Accrued discounts (premiums) | | | 0 | | | | 0 | | | | 0 | |
Realized gains (losses) | | | 0 | | | | 0 | | | | 0 | |
Change in unrealized gains (losses) | | | (15,925 | ) | | | (2,187 | ) | | | 0 | |
Purchases | | | 0 | | | | 0 | | | | 0 | |
Sales | | | (87,292 | ) | | | 0 | | | | 0 | |
Transfers into Level 3 | | | 0 | | | | 0 | | | | 4,089,283 | |
Transfers out of Level 3 | | | 0 | | | | 0 | | | | 0 | |
Balance as of April 30, 2011 | | $ | 0 | | | $ | 187,343 | | | $ | 4,089,283 | |
Change in unrealized gains (losses)
relating to securities still held at April 30, 2011 | | $ | 0 | | | $ | (2,187 | ) | | $ | 0 | |
4. TRANSACTIONS WITH AFFILIATES AND OTHER EXPENSES
Advisory Fees
The Trust has entered into an advisory contract with Funds Management, an indirect wholly owned subsidiary of Wells Fargo & Company (“Wells Fargo”). The adviser is responsible for implementing investment policies and guidelines and for supervising the sub-advisers, who are responsible for day-to-day portfolio management of the Funds.
Pursuant to the contract, Funds Management is paid an annual advisory fee which is calculated based on the average daily net assets of each Fund as follows:
| | | | | | | | | | | | |
| | | Advisory Fee | | | Effective rate for
six months ended
April 30, 2011 | |
| | | starting at | | | declining to | | |
Asia Pacific Fund | | | 1.10 | % | | | 0.95 | % | | | 1.10 | % |
Disciplined Global Equity Fund | | | 0.70 | | | | 0.55 | | | | 0.70 | |
Diversified International Fund | | | 0.85 | | | | 0.70 | | | | 0.85 | |
Emerging Markets Equity Fund | | | 1.10 | | | | 0.95 | | | | 1.04 | |
Global Opportunities Fund | | | 0.90 | | | | 0.80 | | | | 0.90 | |
International Equity Fund | | | 0.85 | | | | 0.70 | | | | 0.84 | |
Intrinsic World Equity Fund | | | 0.80 | | | | 0.65 | | | | 0.80 | |
| | | | |
| 92 | | Wells Fargo Advantage International Stock Funds | | Notes to Financial Statements (Unaudited) |
Funds Management may retain the services of certain sub-advisers to provide daily portfolio management to the Funds. Funds Management has engaged Wells Capital Management, an affiliate of Funds Management, Metropolitan West Capital Management, LLC, a majority-owned subsidiary of Wells Fargo, Artisan Partners Limited Partnership and LSV Asset Management as sub-advisers. The fees related to sub-advisory services are borne directly by the adviser and do not increase the overall fees paid by a Fund to the adviser. The sub-advisers are each paid an annual sub-advisory fee which is calculated based on the average daily net assets of each Fund as follows:
| | | | | | | | | | |
| | | | | Sub-advisory Fee | |
| | | Sub-adviser | | starting at | | | declining to | |
Asia Pacific Fund | | Wells Capital Management | | | 0.65 | % | | | 0.45 | % |
Disciplined Global Equity Fund | | Wells Capital Management | | | 0.35 | | | | 0.30 | |
Diversified International Fund | | Artisan Partners Limited Partnership | | | 0.80 | | | | 0.50 | |
| | Wells Capital Management | | | 0.45 | | | | 0.40 | |
| | LSV Asset Management | | | 0.35 | | | | 0.30 | |
Emerging Markets Equity Fund | | Wells Capital Management | | | 0.65 | | | | 0.45 | |
Global Opportunities Fund | | Wells Capital Management | | | 0.55 | | | | 0.40 | |
International Equity Fund | | Wells Capital Management | | | 0.45 | | | | 0.40 | |
Intrinsic World Equity Fund | | Metropolitan West Capital Management, LLC. | | | 0.35 | | | | 0.20 | |
Administration and transfer agent fees
The Trust has entered into an administration agreement with Funds Management. Under this agreement, for providing administrative services, which includes paying fees and expenses for services provided by the transfer agent, sub-transfer agents, omnibus account servicers and record-keepers, Funds Management is entitled to receive from each Fund an annual fund level administration fee starting at 0.05% and declining to 0.03% as the average daily net assets of each Fund increase and a class level administration fee which is calculated based on the average daily net assets of each Fund as follows:
| | | | |
| | | Class Level Administration Fee | |
Class A, Class B, Class C, and Class R | | | 0.26 | % |
Administrator Class | | | 0.10 | |
Institutional Class | | | 0.08 | |
Investor Class | | | 0.33 | |
Funds Management has contractually waived and/or reimbursed advisory and administration fees to the extent necessary to maintain certain net operating expense ratios for the Funds. Waiver of fees and/or reimbursement of expenses by Funds Management were made first from fund level expenses on a proportionate basis and then from class specific expenses.
Distribution fees
The Trust has adopted a Distribution Plan for Class B, Class C and Class R shares of the applicable Funds pursuant to Rule 12b-1 under the 1940 Act. Distribution fees are charged to the Class B and Class C shares and paid to Wells Fargo Funds Distributor, LLC, the principal underwriter of each Fund, at an annual rate of 0.75% of the average daily net assets of Class B and Class C shares and 0.25% of Class R shares.
| | | | | | |
| Notes to Financial Statements (Unaudited) | | Wells Fargo Advantage International Stock Funds | | | 93 | |
For the six months ended April 30, 2011, Wells Fargo Funds Distributor, LLC received the following amounts in front-end sales charges and contingent deferred sales charges.
| | | | | | | | | | | | | | | | |
| | | Front-end
sales charges Class A | | | Contingent deferred sales charges | |
| | | Class A | | | Class B | | | Class C | |
Asia Pacific Fund | | $ | 1,905 | | | $ | 0 | | | | NA | | | $ | 4 | |
Disciplined Global Equity Fund | | | 523 | | | | 0 | | | | NA | | | | 64 | |
Diversified International Fund | | | 439 | | | | 0 | | | | 854 | | | | 256 | |
Emerging Markets Equity Fund | | | 108,781 | | | | 13,330 | | | | 26,066 | | | | 7,272 | |
Global Opportunities Fund | | | 19,080 | | | | 251 | | | | 36,268 | | | | 328 | |
International Equity Fund | | | 2,031 | | | | 70 | | | | 16,072 | | | | 596 | |
Intrinsic World Equity Fund | | | 569 | | | | 0 | | | | NA | | | | 0 | |
Shareholder servicing fees
The Trust has entered into contracts with one or more shareholder servicing agents, whereby Class A, Class B, Class C, Class R, Administrator Class and Investor Class of each applicable Fund is charged a fee at an annual rate of 0.25% of the average daily net assets of each respective class.
A portion of these total shareholder servicing fees were paid to affiliates of Wells Fargo.
5. INVESTMENT PORTFOLIO TRANSACTIONS
Purchases and sales of investments, excluding short-term securities (securities with maturities of one year or less at purchase date), for the six months ended April 30, 2011 were as follows:
| | | | | | | | |
| | | Purchases at Cost | | | Sales Proceeds | |
Asia Pacific Fund | | $ | 325,100,470 | | | $ | 350,504,261 | |
Disciplined Global Equity Fund | | | 15,290,010 | | | | 19,213,890 | |
Diversified International Fund | | | 142,312,444 | | | | 135,037,800 | |
Emerging Markets Equity Fund | | | 336,312,529 | | | | 68,816,916 | |
Global Opportunities Fund | | | 107,462,682 | | | | 123,018,687 | |
International Equity Fund | | | 140,699,579 | | | | 249,190,946 | |
Intrinsic World Equity Fund | | | 4,580,264 | | | | 14,404,462 | |
6. DERIVATIVE TRANSACTIONS
During the six months ended April 30, 2011, Disciplined Global Equity Fund and International Equity Fund entered into futures contracts for hedging purposes.
At April 30, 2011, Disciplined Global Equity Fund and International Equity Fund had long futures contracts outstanding as follows:
| | | | | | | | | | | | | | | | | | | | | | | | |
| | | Expiration Date | | | Contracts | | | Type | | | Initial
Contract
Amount | | | Value at
April 30,
2011 | | | Net Unrealized
Gains (Losses) | |
Disciplined Global Equity Fund | | | June 2011 | | | | 3 Long | | | | FTSE 100 Index | | | $ | 288,359 | | | $ | 302,317 | | | $ | 13,958 | |
| | | June 2011 | | | | 2 Long | | | | Euro STOXX 50 Index | | | | 84,701 | | | | 87,299 | | | | 2,598 | |
| | | | June 2011 | | | | 6 Long | | | | S&P 500 Index | | | | 400,978 | | | | 407,910 | | | | 6,932 | |
International Equity Fund | | | June 2011 | | | | 144 Long | | | | MSCI EAFE Index | | | | 11,502,374 | | | | 12,939,840 | | | | 1,437,466 | |
Disciplined Global Equity Fund and International Equity Fund had average notional amounts of $647,881 and $10,625,674, respectively, in long futures contracts during the six months ended April 30, 2011.
| | | | |
| 94 | | Wells Fargo Advantage International Stock Funds | | Notes to Financial Statements (Unaudited) |
On April 30, 2011, the cumulative unrealized gains on futures contracts in the amounts of $23,488 and $1,437,466 are reflected in net unrealized gains on investments on the Statements of Assets and Liabilities for Disciplined Global Equity Fund and International Equity Fund, respectively. The receivable for daily variation margin on open futures contracts reflected in the Statements of Assets and Liabilities only represents the current day’s variation margin. The realized gains (losses) and change in unrealized gains (losses) on futures contracts are reflected in the Statements of Operations.
During the six months ended April 30, 2011, the Diversified International Fund, Global Opportunities Fund and International Equity Fund entered into forward foreign currency contracts for hedging purposes.
At April 30, 2011, Diversified International Fund, Global Opportunities Fund and International Equity Fund had forward foreign currency contracts outstanding as follows:
Forward Foreign Currency Contracts to Buy:
| | | | | | | | | | | | | | | | | | | | | | | | |
| | | Exchange Date | | | Counterparty | | | Contracts to
Receive | | | U.S. Value at
April 30, 2011 | | | In Exchange
for U.S. $ | | | Net Unrealized
Gains (Losses) | |
Diversified International Fund | | | 05/09/2011 | | | | Barclays | | | | 4,185,000 EUR | | | $ | 6,197,592 | | | $ | 6,028,911 | | | $ | 168,681 | |
| | | | 05/09/2011 | | | | Barclays | | | | 2,741,700 GBP | | | | 4,579,311 | | | | 4,418,935 | | | | 160,376 | |
Global Opportunities Fund | | | 05/09/2011 | | | | Barclays | | | | 4,704,300 GBP | | | | 7,857,335 | | | | 7,582,156 | | | | 275,179 | |
| | | | 05/09/2011 | | | | Barclays | | | | 4,704,300 GBP | | | | 7,857,335 | | | | 7,649,968 | | | | 207,367 | |
International Equity Fund | | | 05/09/2011 | | | | Barclays | | | | 14,455,600 EUR | | | | 21,407,386 | | | | 20,824,739 | | | | 582,647 | |
| | | | 05/09/2011 | | | | Barclays | | | | 9,458,000 GBP | | | | 15,797,179 | | | | 15,243,932 | | | | 553,247 | |
Forward Foreign Currency Contracts to Sell:
| | | | | | | | | | | | | | | | | | | | | | | | |
| | | Exchange Date | | | Counterparty | | | Contracts to
Deliver | | | U.S. Value at
April 30, 2011 | | | In Exchange
for U.S. $ | | | Net Unrealized
Gains (Losses) | |
Diversified International Fund | | | 05/09/2011 | | | | Barclays | | | | 4,185,000 EUR | | | $ | 6,197,592 | | | $ | 5,697,417 | | | $ | (500,175 | ) |
| | | 05/09/2011 | | | | Barclays | | | | 2,741,700 GBP | | | | 4,579,311 | | | | 4,421,307 | | | | (158,004 | ) |
| | | | 06/20/2011 | | | | JPMorgan | | | | 355,418,000 JPY | | | | 4,382,556 | | | | 4,507,806 | | | | 125,250 | |
Global Opportunities Fund | | | 05/09/2011 | | | | Barclays | | | | 9,408,600 GBP | | | | 15,714,669 | | | | 15,172,449 | | | | (542,220 | ) |
| | | | 06/20/2011 | | | | JPMorgan | | | | 456,804,000 JPY | | | | 5,632,717 | | | | 5,793,696 | | | | 160,979 | |
International Equity Fund | | | 05/09/2011 | | | | Barclays | | | | 14,455,600 EUR | | | | 21,407,386 | | | | 19,679,709 | | | | (1,727,677 | ) |
| | | 05/09/2011 | | | | Barclays | | | | 9,458,000 GBP | | | | 15,797,179 | | | | 15,252,113 | | | | (545,066 | ) |
| | | | 06/20/2011 | | | | JPMorgan | | | | 1,225,600,000 JPY | | | | 15,112,518 | | | | 15,544,423 | | | | 431,905 | |
The Funds had average market values in forward foreign currency contracts during the six months ended April 30, 2011 as follows.
| | | | | | | | |
| | | Forward Foreign
Currency Exchange
Contracts to Buy | | | Forward Foreign
Currency Exchange
Contracts to Sell | |
Diversified International Fund | | $ | 2,006,706 | | | $ | 6,107,609 | |
Global Opportunities Fund | | | 6,816,602 | | | | 12,027,958 | |
International Equity Fund | | | 6,236,891 | | | | 20,376,195 | |
The fair value, realized gains or losses and change in unrealized gains or losses on derivative instruments are reflected in the appropriate financial statements.
| | | | | | |
| Notes to Financial Statements (Unaudited) | | Wells Fargo Advantage International Stock Funds | | | 95 | |
7. ACQUISITIONS
After the close of business on July 16, 2010, Emerging Markets Equity Fund (formerly Wells Fargo Advantage Emerging Markets Equity Fund II) acquired the net assets of Evergreen Emerging Markets Growth Fund and Wells Fargo Advantage Emerging Markets Equity Fund. The purpose of the transactions was to combine three funds with similar investment objectives and strategies. The acquisitions were accomplished by a tax-free exchange of all of the shares of Evergreen Emerging Markets Growth Fund and Wells Fargo Advantage Emerging Markets Equity Fund. Shareholders holding Class A, Class B and Class C shares of Evergreen Emerging Markets Growth Fund and Wells Fargo Advantage Emerging Markets Equity Fund received Class A, Class B and Class C shares, respectively, of Emerging Markets Equity Fund in the reorganizations. Class I shares of Evergreen Emerging Markets Growth Fund received Administrator Class shares of Emerging Markets Equity Fund. Administrator Class shares of Wells Fargo Advantage Emerging Markets Equity Fund received Administrator Class shares of Emerging Markets Equity Fund. The investment portfolio of Evergreen Emerging Markets Growth Fund and Wells Fargo Advantage Emerging Markets Equity Fund with fair values of $940,934,846 and $104,854,236, respectively, and identified costs of $794,372,539 and $105,814,107, respectively, at July 16, 2010, were the principal assets acquired by Emerging Markets Equity Fund. For financial reporting purposes, assets received and shares issued by Emerging Markets Equity Fund were recorded at fair value; however, the cost basis of the investments received from Evergreen Emerging Markets Growth Fund and Wells Fargo Advantage Emerging Markets Equity Fund were carried forward to align ongoing reporting of Emerging Markets Equity Fund’s realized and unrealized gains and losses with amounts distributable to shareholders for tax purposes. The value of net assets acquired, unrealized gains/losses acquired, exchange ratio and number of shares issued were as follows:
| | | | | | | | | | | | | | | | | | |
| Acquired Fund | | Value of Net
Assets Acquired | | | Unrealized
Gains (Losses) | | | Exchange
Ratio | | | Number of Shares Issued |
Evergreen Emerging Markets Growth Fund | | $ | 942,448,909 | | | $ | 146,562,307 | | | | 1.00 | | | | 28,326,028 | | | Class A |
| | | | | | | | | | | 1.00 | | | | 1,563,012 | | | Class B |
| | | | | | | | | | | 1.00 | | | | 9,580,034 | | | Class C |
| | | | | | | | | | | 1.00 | | | | 12,984,854 | | | Administrator Class |
Wells Fargo Advantage Emerging Markets Equity Fund | | $ | 140,035,923 | | | $ | (959,871 | ) | | | 1.86 | | | | 6,401,149 | | | Class A |
| | | | | | | | | | | 2.04 | | | | 178,594 | | | Class B |
| | | | | | | | | | | 2.05 | | | | 120,371 | | | Class C |
| | | | | | | | | | | 1.78 | | | | 954,372 | | | Administrator Class |
The aggregate net assets of Emerging Markets Equity Fund immediately after the acquisitions were $1,082,484,832.
Assuming the acquisitions had been completed November 1, 2009, the beginning of the annual reporting period for Emerging Markets Equity Fund, the pro forma results of operations for the year ended October 31, 2010 would have been
| | | | |
Net investment income (loss) | | $ | 1,886,861 | |
Net realized and unrealized gains (losses) on investments | | $ | 253,695,622 | |
Net increase (decrease) in net assets resulting from operations | | $ | 255,582,483 | |
Because the combined investment portfolios have been managed as a single integrated portfolio since the acquisition was completed, it is not practicable to separate the amounts of revenue and earnings of Evergreen Emerging Markets Growth Fund and Wells Fargo Advantage Emerging Markets Equity Fund that have been included in Emerging Markets Equity Fund’s Statement of Operations since July 19, 2010.
Effective at the close of business on July 16, 2010, Wells Fargo Advantage International Core Fund acquired the net assets of Evergreen International Equity Fund. Wells Fargo Advantage International Core Fund was renamed Wells Fargo Advantage International Equity Fund after the reorganization and became the legal survivor in the transaction. Evergreen International Equity Fund became the accounting and performance survivor in the transaction. The purpose of the transaction was to combine 2 funds with similar investment objectives and strategies. The acquisition was accomplished
by a tax-free exchange of all of the shares of Evergreen International Equity Fund. Shareholders holding Class A, Class B,
| | | | |
| 96 | | Wells Fargo Advantage International Stock Funds | | Notes to Financial Statements (Unaudited) |
Class C, Class I and Class R shares of Evergreen International Equity Fund received Class A, Class B, Class C, Institutional Class and Class R shares, respectively, of the International Equity Fund in the reorganization. The exchange ratio and number of shares issued to the Evergreen International Equity Fund were as follows:
| | | | | | | | | | | | | | | | | | |
| Acquired Fund | | Value of Net
Assets Acquired | | | Unrealized
Gains | | | Exchange
Ratio | | | Number of Shares Issued |
Evergreen International Equity Fund | | $ | 628,217,626 | | | $ | 3,445,411 | | | | 0.72 | | | | 23,466,321 | | | Class A |
| | | | | | | | | | | 0.72 | | | | 2,096,391 | | | Class C |
| | | | | | | | | | | 0.71 | | | | 3,385,599 | | | Administrator Class |
| | | | | | | | | | | 0.72 | | | | 41,069,005 | | | Institutional Class |
| | | | | | | | | | | 0.71 | | | | 444,042 | | | Class R |
The investment portfolio of the International Equity Fund with a fair value of $3,465,243, identified cost of $3,076,152 and unrealized appreciation of $389,091 at July 16, 2010 were the principal assets acquired by the accounting and performance survivor. The shares and net assets of the International Equity Fund immediately prior to the acquisition were 388,539 and $3,445,411, respectively. The aggregate net assets of Evergreen International Equity Fund immediately prior to the acquisition was $628,217,626. The aggregate net assets of the International Equity Fund immediately after the acquisition were $631,663,037. For financial reporting purposes, assets received and shares issued by International Equity Fund were recorded at fair value; however, the cost basis of the investments received from International Equity Fund was carried forward to align ongoing reporting of International Equity Fund’s realized and unrealized gains and losses with amounts distributable to shareholders for tax purposes.
Assuming the acquisition had been completed November 1, 2009, the beginning of the annual reporting period for International Equity Fund, the pro forma results of operations for the year ended October 31, 2010 would have been:
| | | | |
Net investment income (loss) | | $ | 7,904,908 | |
Net realized and unrealized gains (losses) on investments | | $ | 113,855,703 | |
Net increase (decrease) in net assets resulting from operations | | $ | 121,760,611 | |
Because the combined investment portfolios have been managed as a single integrated portfolio since the acquisition was completed, it is not practicable to separate the amounts of revenue and earnings of the International Equity Fund that have been included in the Statement of Operations since July 19, 2010.
8. BANK BORROWINGS
The Trust (excluding the money market funds) and Wells Fargo Variable Trust are parties to a $125,000,000 revolving credit agreement with State Street Bank and Trust Company, whereby the Funds are permitted to use bank borrowings for temporary or emergency purposes, such as to fund shareholder redemption requests. Interest under the credit agreement is charged to each Fund based on a borrowing rate equal to the higher of the Federal Funds rate in effect on that day plus 1.25% or the overnight LIBOR rate in effect on that day plus 1.25%. In addition, under the credit agreement, the Funds pay an annual commitment fee equal to 0.125% of the unused balance, which is allocated pro rata.
During the six months ended April 30, 2011, the Funds had the following borrowing activity:
| | | | | | | | | | | | |
| | | Average
Borrowings
Outstanding | | | Weighted Average
Interest Rate
(annualized) | | | Interest Paid | |
Asia Pacific Fund | | $ | 50,743 | | | | 1.48 | % | | $ | 751 | |
International Equity Fund | | | 227,867 | | | | 1.50 | | | | 3,418 | |
9. REGULATORY SETTLEMENT PROCEEDS
During the year ended October 31, 2010, Disciplined Global Equity received $2,080,711 due to the settlement of administrative proceedings against an unaffiliated third party involving findings by the Securities and Exchange Commission of market timing activity in certain mutual funds. The settlement proceeds received are recorded as an increase to paid-in capital in the financial statements of Disciplined Global Equity Fund contained herein.
| | | | | | |
| Notes to Financial Statements (Unaudited) | | Wells Fargo Advantage International Stock Funds | | | 97 | |
10. INDEMNIFICATION
Under the Trust’s organizational documents, the officers and directors are indemnified against certain liabilities that may arise out of performance of their duties to the Trust. Additionally, in the normal course of business, the Trust may enter into contracts with service providers that contain a variety of indemnification clauses. The Trust’s maximum exposure under these arrangements is dependent on future claims that may be made against the Funds and, therefore, cannot be estimated.
11. REORGANIZATION
At a regular meeting of the Board of Trustees held on May 18-19, 2011, the Trustees approved the reorganization of Disciplined Global Equity Fund into Intrinsic World Equity Fund. Under the reorganization, Intrinsic World Equity Fund will acquire the assets and assume the liabilities of Disciplined Global Equity Fund in exchange for shares of Intrinsic World Equity Fund.
A Special Meeting of Shareholders of Disciplined Global Equity Fund will be held in August 2011 to consider and vote on the reorganization. In July 2011, materials for this meeting will be mailed to shareholders of record on May 26, 2011.
| | | | |
| 98 | | Wells Fargo Advantage International Stock Funds | | Other Information (Unaudited) |
PORTFOLIO HOLDINGS INFORMATION
The complete portfolio holdings for the Funds are publicly available on the Funds’ Web site (www.wellsfargo.com/advantagefunds) on a monthly, 30-day or more delayed basis. In addition, top ten holdings information for the Fund is publicly available on the Funds’ Web site on a monthly, seven-day or more delayed basis. Each Fund files its complete schedule of portfolio holdings with the SEC for the first and third quarters of each fiscal year on Form N-Q, which is available without charge by visiting the SEC Web site at www.sec.gov. In addition, each Fund’s Form N-Q may be reviewed and copied at the SEC’s Public Reference Room in Washington, DC, and at regional offices in New York City, at 233 Broadway, and in Chicago, at 175 West Jackson Boulevard, Suite 900. Information about the Public Reference Room may be obtained by calling 1-800-SEC-0330.
PROXY VOTING INFORMATION
A description of the policies and procedures that the Funds use to determine how to vote proxies relating to portfolio securities is available without charge, upon request, by calling 1-800-222-8222, visiting our Web site at www.wellsfargo.com/advantagefunds, or visiting the SEC Web site at www.sec.gov. Information regarding how the Funds voted proxies relating to portfolio securities during the most recent 12-month period ended June 30 is available without charge on the Funds’ Web site at www.wellsfargo.com/advantagefunds or by visiting the SEC Web site at www.sec.gov.
| | | | | | |
| Other Information (Unaudited) | | Wells Fargo Advantage International Stock Funds | | | 99 | |
BOARD OF TRUSTEES
The following table provides basic information about the Board of Trustees (the “Trustees”) of the Wells Fargo Funds Trust (the “Trust”) and Officers of the Trust. This table should be read in conjunction with the Prospectus and the Statement of Additional Information1 of the Fund. Each of the Trustees and Officers listed below acts in identical capacities for the Wells Fargo Advantage family of funds, which consists of 152 funds comprising the Trust, Wells Fargo Variable Trust, Wells Fargo Master Trust and four closed-end funds (collectively the “Fund Complex”). All of the Trustees are also Members of the Audit and Governance Committees of each Trust in the Fund Complex. The mailing address of each Trustee and Officer is 525 Market Street, 12th Floor, San Francisco, CA 94105. Each Trustee and Officer serves an indefinite term, however, each Trustee serves such term until reaching the mandatory retirement age established by the Trustees.
Independent Trustees
| | | | | | |
Name and Year of Birth | | Position Held and Length of Service | | Principal Occupations During Past Five Years | | Other Directorships |
Peter G. Gordon
(Born 1942) | | Trustee, since 1998; Chairman, since 2005 | | Co-Founder, Chairman, President and CEO of Crystal Geyser. Water Company. Trustee Emeritus, Colby College | | Asset Allocation Trust |
Isaiah Harris, Jr.
(Born 1952) | | Trustee, since 2009 | | Retired. Prior thereto, President and CEO of BellSouth Advertising and Publishing Corp. from 2005 to 2007, President and CEO of BellSouth Enterprises from 2004 to 2005 and President of BellSouth Consumer Services from 2000 to 2003. Emeritus member of the Iowa State University Foundation Board of Governors. Emeritus Member of the Advisory Board of Iowa State University School of Business. Mr. Harris is a certified public accountant. | | CIGNA Corporation; Deluxe Corporation; Asset Allocation Trust |
Judith M. Johnson
(Born 1949) | | Trustee, since 2008 | | Retired. Prior thereto, Chief Executive Officer and Chief Investment Officer of Minneapolis Employees Retirement Fund from 1996 to 2008. Ms. Johnson is an attorney, certified public accountant and a certified managerial accountant. | | Asset Allocation Trust |
Leroy Keith, Jr.
(Born 1939) | | Trustee, since 2010 | | Chairman, Bloc Global Services (development and construction), Trustee of the Evergreen Funds from 1983 to 2010. Former Managing Director, Almanac Capital Management (commodities firm), former Partner, Stonington Partners, In c. (private equity fund), former Director, Obagi Medical Products Co. and former Director, Lincoln Educational Services. | | Trustee, Virtus Fund Complex (consisting of 45 portfolios as of 12/31/10); Director, Diversapack Co. (packaging company); Asset Allocation Trust |
David F. Larcker
(Born 1950) | | Trustee, since 2009 | | James Irvin Miller Professor of Accounting at the Graduate School of Business, Stanford University, Director of Corporate Governance Research Program and Co-Director of The Rock Center for Corporate Governance since 2006. From 2005 to 2008, Professor of Accounting at the Graduate School of Business, Stanford University. Prior thereto, Ernst & Young Professor of Accounting at The Wharton School, University of Pennsylvania from 1985 to 2005. | | Asset Allocation Trust |
Olivia S. Mitchell
(Born 1953) | | Trustee, since 2006 | | International Foundation of Employee Benefit Plans Professor and Chair of the Department of Insurance and Risk Management, Wharton School of the University of Pennsylvania since 1993. Director of Wharton’s Pension Research Council and Boettner Center on Pensions & Retirement Research, and Research Associate at the National Bureau of Economic Research. Previously, Cornell University Professor from 1978 to 1993. | | Asset Allocation Trust |
| | | | |
| 100 | | Wells Fargo Advantage International Stock Funds | | Other Information (Unaudited) |
| | | | | | |
Name and Year of Birth | | Position Held and Length of Service | | Principal Occupations During Past Five Years | | Other Directorships |
Timothy J. Penny
(Born 1951) | | Trustee, since 1996 | | President and CEO of Southern Minnesota Initiative Foundation, a non-profit organization, since 2007 and Senior Fellow at the Humphrey Institute Policy Forum at the University of Minnesota since 1995. Member of the Board of Trustees of NorthStar Education Finance, Inc., a non-profit organization, since 2007. | | Asset Allocation Trust |
Michael S. Scofield
(Born 1943) | | Trustee, since 2010 | | Currently serves on the Investment Company Institute’s Board of Governors and Executive Committee as well the In dependent Director’s Counsel Board of Governors and Executive Committee. Former Chairman of the Independent Directors Counsel. Trustee of the Evergreen Funds from 1984 to 2010. Retired Attorney, Law Offices of Michael S. Scofield and former Director and Chairman, Branded Media Corporation (multi-media branding company). | | Asset Allocation Trust |
Donald C. Willeke
(Born 1940) | | Trustee, since 1996 | | Principal of the law firm of Willeke & Daniels. General Counsel of the Minneapolis Employees Retirement Fund from 1984 until its consolidation into the Minnesota Public Employees Retirement Association on June 30, 2010. | | Asset Allocation Trust |
Officers
| | | | | | |
Name and Year of Birth | | Position Held and
Length of Service | | Principal Occupations During Past Five Years | | |
Karla M. Rabusch
(Born 1959) | | President, since 2003 | | Executive Vice President of Wells Fargo Bank, N.A. and President of Wells Fargo Funds Management, LLC since 2003. Senior Vice President and Chief Administrative Officer of Wells Fargo Funds Management, LLC from 2001 to 2003. | | |
C. David Messman
(Born 1960) | | Secretary, since 2000; Chief Legal Counsel, since 2003 | | Senior Vice President and Secretary of Wells Fargo Funds Management, LLC since 2001. Vice President and Managing Counsel of Wells Fargo Bank, N.A. since 1996. | | |
Kasey Phillips
(Born 1970) | | Treasurer, since 2009 | | Senior Vice President of Wells Fargo Funds Management, LLC since 2009. Senior Vice President of Evergreen Investment Management Company, LLC from 2006 to 2010. Treasurer of the Evergreen Funds from 2005 to 2010. Vice President and Assistant Vice President of Evergreen Investment Services, Inc. from 1999 to 2006. | | |
David Berardi
(Born 1975) | | Assistant Treasurer, since 2009 | | Vice President of Wells Fargo Funds Management, LLC since 2009 . Vice President of Evergreen Investment Management Company, LLC from 2008 to 2010. Assistant Vice President of Evergreen Investment Services, Inc. from 2004 to 2008. Manager of Fund Reporting and Control for Evergreen Investment Management Company, LLC from 2004 to 2010. | | |
Jeremy DePalma
(Born 1974) | | Assistant Treasurer, since 2009 | | Senior Vice President of Wells Fargo Funds Management, LLC since 2009. Senior Vice President of Evergreen Investment Management Company, LLC from 2008 to 2010. Vice President, Evergreen Investment Services, Inc. from 2004 to 2007. Assistant Vice President, Evergreen Investment Services, Inc. from 2000 to 2004 and the head of the Fund Reporting and Control Team within Fund Administration from 2005 to 2010. | | |
Debra Ann Early
(Born 1964) | | Chief Compliance Officer, since 2007 | | Chief Compliance Officer of Wells Fargo Funds Management, LLC since 2007. Chief Compliance Officer of Parnassus Investments from 2005 to 2007. Chief Financial Officer of Parnassus Investments from 2004 to 2007 and Senior Audit Manager of PricewaterhouseCoopers LLP from 1998 to 2004. | | |
| 1. | The Statement of Additional Information includes additional information about the Funds’ Trustees and is available, without charge, upon request, by calling 1-800-222-8222 or by visiting the Funds’ Web site at www.wellsfargo.com/advantagefunds. |
| | | | | | |
| Other Information (Unaudited) | | Wells Fargo Advantage International Stock Funds | | | 101 | |
BOARD CONSIDERATION OF INVESTMENT ADVISORY AND SUB-ADVISORY AGREEMENTS:
Asia Pacific Fund, Disciplined Global Equity Fund, Diversified International Fund, Emerging Markets Equity Fund, Global Opportunities Fund, International Equity Fund and Intrinsic World Equity Fund
Each year, as required by Section 15 of the Investment Company Act of 1940 (the “1940 Act”), the Board of Trustees (the “Board”) of Wells Fargo Funds Trust (the “Trust”), all the members of which have no direct or indirect interest in the investment advisory and sub-advisory agreements and are not “interested persons” of the Trust, as defined in the 1940 Act (the “Independent Trustees”), determines whether to approve the continuation of the Trust’s investment advisory and sub-advisory agreements. In this regard, at an in person meeting held on March 24-25, 2011 (the “Meeting”), the Board reviewed and re-approved: (i) an investment advisory agreement with Wells Fargo Funds Management, LLC (“Funds Management”) for each of the Asia Pacific Fund, Disciplined Global Equity Fund, Diversified International Fund, Emerging Markets Equity Fund, Global Opportunities Fund, International Equity Fund and Intrinsic World Equity Fund (collectively, the “Funds”); (ii) an investment sub-advisory agreement with Wells Capital Management Incorporated (“Wells Capital Management”) for each of the Asia Pacific Fund, Disciplined Global Equity Fund, Diversified International Fund, Emerging Markets Equity Fund, Global Opportunities Fund and International Equity Fund; (iii) an investment sub-advisory agreement with Artisan Partners Limited Partnership (“Artisan”) for the Diversified International Fund; (iv) an investment sub-advisory agreement with LSV Asset Management (“LSV”) for the Diversified International Fund; and (v) an investment sub-advisory agreement with Metropolitan West Capital Management, LLC (“MetWest”) for the Intrinsic World Equity Fund. The investment advisory agreements with Funds Management and the investment sub-advisory agreements with Wells Capital Management, Artisan, LSV and MetWest (the “Sub-Advisers”) are collectively referred to as the “Advisory Agreements.”
At the Meeting, the Board considered the factors and reached the conclusions described below relating to the selection of Funds Management and the Sub-Advisers and continuation of the Advisory Agreements. Prior to the Meeting, the Trustees conferred extensively among themselves and with representatives of Funds Management about these matters. The Board also met throughout the year and received information that was useful to them in considering the continuation of the Advisory Agreements. The Independent Trustees were assisted in their evaluation of the Advisory Agreements by independent legal counsel, from whom they received separate legal advice and with whom they met separately from Funds Management.
Nature, extent and quality of services
The Board received and considered various information regarding the nature, extent and quality of services provided to the Funds by Funds Management and the Sub-Advisers under the Advisory Agreements. The Board also received and considered information provided in response to a detailed set of requests submitted by the Independent Trustees’ independent legal counsel on their behalf. The Board received and considered, among other things, information about the background and experience of senior management of Funds Management, and the qualifications, backgrounds, tenures and responsibilities of the portfolio managers primarily responsible for the day-to-day portfolio management of the Funds.
The Board evaluated the ability of Funds Management and the Sub-Advisers, based on their respective financial condition, resources, reputation and other attributes, to attract and retain qualified investment professionals, including research, advisory, and supervisory personnel. The Board further considered the compliance programs and compliance records of Funds Management and the Sub-Advisers. In addition, the Board took into account the administrative services provided to the Funds by Funds Management and its affiliates.
The Board’s decision to approve the continuation of the Advisory Agreements was based on a comprehensive evaluation of all of the information provided to it. In approving the continuation of the Advisory Agreements, the Board did not identify any particular information or consideration that was all-important or controlling, and each Trustee attributed different weights to various factors. The Board evaluated information provided to it both in terms of the Funds generally and with respect to each Fund specifically as it considered appropriate. Although the Board considered the continuation of the Advisory Agreements for each of the Funds as part of the larger process of considering the continuation of the Advisory Agreements for all of the Funds, its decision to continue the Advisory Agreements for each of the Funds was ultimately made on a fund-by-fund basis.
| | | | |
| 102 | | Wells Fargo Advantage International Stock Funds | | Other Information (Unaudited) |
In considering these matters, the Board considered not only the specific information presented in connection with the Meeting, but also the knowledge gained over time through interaction with Funds Management and the Sub-Advisers about various topics, including Funds Management’s oversight of service providers. The above factors, together with those referenced below, are some of the most important, but not necessarily all, factors considered by the Board in concluding that it was satisfied with the nature, extent and quality of the investment advisory services provided to each Fund by Funds Management and the respective Sub-Adviser.
Fund performance and expenses
The Board considered the performance results for each of the Funds over various time periods ended December 31, 2010. The Board also considered these results in comparison to the median performance of a universe of relevant funds (the “Universe”) that were determined by Lipper Inc. (“Lipper”) to be similar to the Funds, and in comparison to each Fund’s benchmark index and to other comparative data. Lipper is an independent provider of investment company data. The Board received a description of the methodology used by Lipper to select the mutual funds in the Universe.
The Board noted that the performance of the Disciplined Global Equity Fund, the Emerging Markets Equity Fund, the Global Opportunities Fund and the Intrinsic World Equity Fund was generally higher than the median performance of the Universe. The Board also noted that the more recent performance of the Diversified International Fund and the International Equity Fund was higher than the median performance of the Universe and the longer-term performance was lower than the median performance of the Universe. The Board also noted that the longer-term performance of the Asia Pacific Fund was higher than the median performance of the Universe and the more recent performance was lower than the median performance of the Universe. Furthermore, the Board noted that performance of each of the Asia Pacific Fund, the Global Opportunities Fund, the International Equity Fund and the Intrinsic World Equity Fund warranted further discussion. As part of its further review, the Board received an analysis of, and discussed factors contributing to, the underperformance of the Asia Pacific Fund, the Global Opportunities Fund, the International Equity Fund and the Intrinsic World Equity Fund relative to the Universe. The Board noted (i) that the Asia Pacific Fund’s rolling one-year results have been in an upward trend since mid-2009; (ii) that the Global Opportunities Fund and the International Equity Fund outperformed their benchmarks for the most recent period under review; and (iii) that the Intrinsic World Equity Fund’s annualized three-year results were above its benchmark. The Board was satisfied that Funds Management and the Sub-Advisers were taking appropriate actions with respect to each of the Fund’s investment performance and requested continued reports on the performance of each of the Funds.
The Board received and considered information regarding each Fund’s contractual advisory fee and net operating expense ratios and their various components, including actual management fees (which reflect fee waivers, if any), transfer agent, custodian and other non-management fees, Rule 12b-1 and non-Rule 12b-1 fees, service fees and fee waiver and expense reimbursement arrangements. The Board also considered these ratios in comparison to the median ratios of an expense Universe and a narrower expense group of mutual funds (each, an “Expense Group”) that was determined by Lipper to be similar to each Fund. The Board received a description of the methodology used by Lipper to select the mutual funds in a Fund’s Expense Group. The Board noted that the net operating expense ratios of each of the Funds were in range of or lower than each Fund’s respective Expense Group’s median net operating expense ratio.
Based on the above-referenced considerations and other factors, the Board concluded that the overall performance and expense structure of the Funds supported the re-approval of the Advisory Agreements for the Funds.
Investment advisory and sub-advisory fee rates
The Board reviewed and considered the contractual investment advisory fee rates that are payable by the Funds to Funds Management for investment advisory services (the “Advisory Agreement Rates”), both on a stand-alone basis and on a combined basis with the Funds’ administration fee rates. The Board took into account the separate administrative and other services covered by the administration fee rates. The Board also reviewed and considered the contractual investment sub-advisory fee rates that are payable by Funds Management to the Sub-Advisers for investment sub-advisory services (the “Sub-Advisory Agreement Rates”). In addition, the Board reviewed and considered the existing fee waiver/cap arrangements applicable to the Advisory Agreement Rates and considered the Advisory Agreement Rates after taking the waivers/caps into account (the “Net Advisory Rates”).
The Board received and considered information comparing the Advisory Agreement Rates and Net Advisory Rates with those of other funds in each Fund’s Expense Group median. The Board noted that the Advisory Agreement Rates for
| | | | | | |
| Other Information (Unaudited) | | Wells Fargo Advantage International Stock Funds | | | 103 | |
Class A of each of the Funds were higher than the median rate of each Fund’s Expense Group, except for the International Equity Fund and the Intrinsic World Equity Fund. The Board also noted that the Advisory Agreement Rates for the Administrator Class and Institutional Class of each of the Funds, except for the Global Opportunities Fund (Administrator Class), were in range of or not appreciably higher the median rate of each Fund’s Expense Group. The Board noted that the Net Advisory Rates for each of the Funds were in range of or lower than the median rates of each Fund’s respective Expense Group, except for the Diversified International Fund (Class A), Emerging Markets Equity Fund (Class A) and the Global Opportunities Fund (Class A). The Board further noted that Funds Management had agreed to continue and, in certain instances, reduce contractual fee cap arrangements for the Funds designed to lower the Funds’ expenses.
The Board also received and considered information about the nature and extent of services offered and fee rates charged by Funds Management and the Sub-Advisers to other types of clients. In this regard, the Board received information about differences between the services, and the compliance, reporting, and other legal burdens and risks of providing investment advice to mutual funds and those associated with providing advice to non-mutual fund clients such as collective funds or institutional separate accounts. In each case, the Board determined that the Advisory Agreement Rates for the Funds, both with and without administration fee rates and before and after waivers, were acceptable in light of the Funds’ Expense Group information, the net expense ratio commitments, the services covered by the Advisory Agreements and other information provided.
The Board also reviewed and considered the Sub-Advisory Agreement Rates and concluded that the Sub-Advisory Agreement Rates were acceptable in light of the services covered by the Sub-Advisory Agreement and other information provided.
Profitability
The Board received and considered a profitability analysis of Funds Management, as well as an analysis of the profitability to the collective Wells Fargo businesses that provide services to the Funds. It considered that the information provided to it was necessarily estimated, and that the profitability information provided to it, especially on a fund-by-fund basis, did not necessarily provide a precise tool for evaluating the appropriateness of each Fund’s Advisory Agreement Rates in isolation. It noted that the levels of profitability of the Funds to Funds Management varied widely, depending on, among other things, the size and type of fund. The Board concluded that the profitability to Funds Management of the services provided to any of the Funds, individually or in the aggregate, was not unreasonable.
The Board did not consider separate profitability information with respect to Wells Capital Management and MetWest, because, as affiliates of Funds Management, their profitability information was subsumed in the collective Wells Fargo profitability analysis provided by Funds Management. The Board did not consider separate profitability information with respect to Artisan and LSV, which are not affiliated with Funds Management. The Board considered that the sub-advisory fees paid to Artisan and LSV had been negotiated by Funds Management on an arm’s-length basis and that their profitability from their relationships with the Diversified International Fund, was not a material factor in determining whether to renew the agreements.
Economies of scale
With respect to possible economies of scale, the Board reviewed the breakpoints in each Fund’s advisory fee structure, which operate generally to reduce the effective Advisory Agreement Rates of the Funds (as a percentage of Fund assets) as the Funds grow in size. It considered that, as a fund shrinks in size, breakpoints conversely result in increasing fee levels. The Board noted that it would continue to review the appropriate levels of breakpoints in the future, and concluded that the breakpoints as implemented appeared to be a reasonable step toward sharing economies of scale with the Funds. However, the Board acknowledged the inherent limitations of any analysis of an investment adviser’s economies of scale and of any attempt to correlate breakpoints with such economies, stemming largely from the Board’s understanding that economies of scale are realized, if at all, by an investment adviser across a variety of products and services, not just with respect to a single fund.
Other benefits to Funds Management and the Sub-Advisers
The Board received and considered information regarding potential “fall-out” or ancillary benefits received by Funds Management and its affiliates and the Sub-Advisers as a result of their relationship with the Funds. Ancillary benefits could include, among others, benefits directly attributable to the relationship of Funds Management and the Sub-Advisers with the Funds and benefits potentially derived from an increase in Funds Management’s and each
| | | | |
| 104 | | Wells Fargo Advantage International Stock Funds | | Other Information (Unaudited) |
Sub-Adviser’s business as a result of their relationship with the Funds (such as the ability to market to shareholders other financial products offered by Funds Management and its affiliates or the Sub-Adviser and their affiliates).
The Board considered that Wells Fargo Funds Distributor, LLC, an affiliate of Funds Management, serves as distributor to the Funds and receives certain compensation for those services. The Board noted that the Funds pay sub-transfer agency fees to various financial institutions, including affiliates of Funds Management that hold fund shares in omnibus accounts. It also considered that these entities may receive distribution-related fees and shareholder servicing payments (including amounts derived from payments under the funds’ Rule 12b-1 plans) in respect of shares sold or held through them.
The Board also reviewed information about whether and to what extent soft dollar credits are sought and how any such credits are utilized and any benefits that may be realized by using an affiliated broker.
Other factors and broader review
The Board also considered the markets for distribution of the Funds’ shares, including the multiple channels through which the Funds’ shares are offered and sold. The Board noted that the Funds are part of one of the few fund families that have both direct-to-fund and intermediary distribution channels. As discussed above, the Board reviews detailed materials received from Funds Management and each Sub-Adviser annually as part of the re-approval process under Section 15 of the 1940 Act and also reviews and assesses information about the quality of the services that the Funds receive throughout the year. In this regard, the Board has reviewed reports of Funds Management at each of its quarterly meetings, which include, among other things, portfolio reviews and performance reports. In addition, the Board confers with portfolio managers at various times throughout the year.
Conclusion
After considering the above-described factors and based on its deliberations and its evaluation of the information described above, the Board concluded that approval of the continuation of the Advisory Agreements for the Funds was in the best interest of the Funds and their shareholders. Accordingly, the Board unanimously approved the continuation of the Advisory Agreements for an additional one-year period.
| | | | | | |
| List of Abbreviations | | Wells Fargo Advantage International Stock Funds | | | 105 | |
The following is a list of common abbreviations for terms and entities which may have appeared in this report.
| ABAG | — Association of Bay Area Governments |
| ACB | — Agricultural Credit Bank |
| ADR | — American Depositary Receipt |
| ADS | — American Depository Shares |
| AGC-ICC | — Assured Guaranty Corporation - Insured Custody Certificates |
| AGM | — Assured Guaranty Municipal |
| AMBAC | — American Municipal Bond Assurance Corporation |
| AMT | — Alternative Minimum Tax |
| ARM | — Adjustable Rate Mortgages |
| BAN | — Bond Anticipation Notes |
| BART | — Bay Area Rapid Transit |
| BHAC | — Berkshire Hathaway Assurance Corporation |
| CDA | — Community Development Authority |
| CDO | — Collateralized Debt Obligation |
| CDSC | — Contingent Deferred Sales Charge |
| CGIC | — Capital Guaranty Insurance Company |
| CGY | — Capital Guaranty Corporation |
| CIFG | — CDC (Caisse des Dépôts et Consignations) IX IS Financial Guarantee |
| COP | — Certificate of Participation |
| DRIVER | — Derivative Inverse Tax-Exempt Receipts |
| DW&P | — Department of Water & Power |
| DWR | — Department of Water Resources |
| ECFA | — Educational & Cultural Facilities Authority |
| EDFA | — Economic Development Finance Authority |
| ETET | — Eagle Tax-Exempt Trust |
| ETF | — Exchange-Traded Fund |
| FFCB | — Federal Farm Credit Bank |
| FGIC | — Financial Guaranty Insurance Corporation |
| FHA | — Federal Housing Authority |
| FHAG | — Federal Housing Agency |
| FHLB | — Federal Home Loan Bank |
| FHLMC | — Federal Home Loan Mortgage Corporation |
| FNMA | — Federal National Mortgage Association |
| GDR | — Global Depositary Receipt |
| GNMA | — Government National Mortgage Association |
| HCFR | — Healthcare Facilities Revenue |
| HEFA | — Health & Educational Facilities Authority |
| HEFAR | — Higher Education Facilities Authority Revenue |
| HFA | — Housing Finance Authority |
| HFFA | — Health Facilities Financing Authority |
| HUD | — Housing & Urban Development |
| IDA | — Industrial Development Authority |
| IDAG | — Industrial Development Agency |
| IDR | — Industrial Development Revenue |
| KRW | — Republic of Korea Won |
| LIBOR | — London Interbank Offered Rate |
| LLC | — Limited Liability Company |
| LLP | — Limited Liability Partnership |
| MBIA | — Municipal Bond Insurance Association |
| MFHR | — Multi-Family Housing Revenue |
| MFMR | — Multi-Family Mortgage Revenue |
| MMD | — Municipal Market Data |
| MSTR | — Municipal Securities Trust Receipts |
| MUD | — Municipal Utility District |
| NATL-RE | — National Public Finance Guarantee Corporation |
| PCFA | — Pollution Control Finance Authority |
| PCR | — Pollution Control Revenue |
| PFA | — Public Finance Authority |
| PFFA | — Public Facilities Financing Authority |
| PFOTER | — Puttable Floating Option Tax-Exempt Receipts |
| plc | — Public Limited Company |
| PSFG | — Public School Fund Guaranty |
| PUTTER | — Puttable Tax-Exempt Receipts |
| R&D | — Research & Development |
| RDA | — Redevelopment Authority |
| RDFA | — Redevelopment Finance Authority |
| REIT | — Real Estate Investment Trust |
| ROC | — Reset Option Certificates |
| SFHR | — Single Family Housing Revenue |
| SFMR | — Single Family Mortgage Revenue |
| SLMA | — Student Loan Marketing Association |
| SPDR | — Standard & Poor’s Depositary Receipts |
| STIT | — Short-Term Investment Trust |
| TAN | — Tax Anticipation Notes |
| TRAN | — Tax Revenue Anticipation Notes |
| TCR | — Transferable Custody Receipts |
| TTFA | — Transportation Trust Fund Authority |
| USD | — Unified School District |
| XLCA | — XL Capital Assurance |
This page is intentionally left blank.

More information about Wells Fargo Advantage Funds is available free upon request. To obtain literature, please write, e-mail, visit the Funds’ Web site, or call:
Wells Fargo Advantage Funds
P.O. Box 8266
Boston, MA 02266-8266
E-mail: wfaf@wellsfargo.com
Web site: www.wellsfargo.com/advantagefunds Individual Investors: 1- 800-222-8222
Retail Investment Professionals: 1- 888-877-9275 Institutional Investment Professionals: 1- 866-765-0778
This report and the financial statements contained herein are submitted for the general information of the shareholders of Wells Fargo Advantage Funds. If this report is used for promotional purposes, distribution of the report must be accompanied or preceded by a current prospectus. For a prospectus containing more complete information, including charges and expenses, call 1-800-222-8222 or visit the Funds’ Web site at www.wellsfargo.com/advantagefunds. Please consider the investment objectives, risks, charges, and expenses of the investment carefully before investing. This and other information about Wells Fargo Advantage Funds can be found in the current prospectus. Read the prospectus carefully before you invest or send money.
Source: MSCI. MSCI makes no express or implied warranties or representations and shall have no liability whatsoever with respect to any MSCI data contained herein. The MSCI data may not be further redistributed or used as a basis for other indexes or any securities or financial products. This report is not approved, reviewed, or produced by MSCI.
Wells Fargo Funds Management, LLC, a wholly owned subsidiary of Wells Fargo & Company, provides investment advisory and administrative services for Wells Fargo Advantage Funds. Other affiliates of Wells Fargo & Company provide subadvisory and other services for the Funds. The Funds are distributed by Wells Fargo Funds Distributor, LLC, Member FINRA/SIPC, an affiliate of Wells Fargo & Company.
NOT FDIC INSURED ¡ NO BANK GUARANTEE ¡ MAY LOSE VALUE

| | | | | | |
| | | |
© 2011 Wells Fargo Funds Management, LLC. All rights reserved. | | www.wellsfargo.com/advantagefunds | | 202911 06-11 SINTLD/SAR108 04-11 |


Semi-Annual Report
April 30, 2011
WELLS FARGO ADVANTAGE SMALL AND MID CAP STOCK FUNDS
| n | | Wells Fargo Advantage Intrinsic Small Cap Value Fund |
| n | | Wells Fargo Advantage Small Cap Growth Fund |
| n | | Wells Fargo Advantage Small Cap Opportunities Fund |
| n | | Wells Fargo Advantage Small Cap Value Fund |
| n | | Wells Fargo Advantage Small/Mid Cap Value Fund |
| n | | Wells Fargo Advantage Special Small Cap Value Fund |
| n | | Wells Fargo Advantage Traditional Small Cap Growth Fund |
Reduce clutter. Save trees.
Sign up for electronic delivery of prospectuses and shareholder reports at www.wellsfargo.com/advantagedelivery
Contents
The views expressed are as of April 30, 2011, and are those of the Fund managers. Any reference to a specific security in this report is not a recommendation to purchase or sell any specific security or adopt any investment strategy. The views are subject to change at any time in response to changing circumstances in the market and are not intended to predict or guarantee the future performance of any individual security, market sector or the markets generally, or the Wells Fargo Advantage Small and Mid Cap Stock Funds.
NOT FDIC INSURED ¡ NO BANK GUARANTEE ¡ MAY LOSE VALUE

WELLS FARGO INVESTMENT HISTORY
| | |
| |
| 1932 | | Keystone creates one of the first mutual fund families. |
| |
| 1971 | | Wells Fargo & Company introduces one of the first institutional index funds. |
| |
| 1978 | | Wells Fargo applies Markowitz and Sharpe’s research on Modern Portfolio Theory to introduce one of the industry’s first Tactical Asset Allocation (TAA) models in institutional separately managed accounts. |
| |
| 1984 | | Wells Fargo Stagecoach Funds launches its first asset allocation fund. |
| |
| 1989 | | The Tactical Asset Allocation (TAA) Model is first applied to Wells Fargo’s asset allocation mutual funds. |
| |
| 1994 | | Wells Fargo introduces the LifePath Funds, one of the first suites of target date funds (now the Wells Fargo Advantage Dow Jones Target Date FundsSM ). |
| |
| 1996 | | Evergreen Investments and Keystone Funds merge. |
| |
| 1997 | | Wells Fargo launches Wells Fargo Advantage WealthBuilder PortfoliosSM, a fund-of-funds suite of products that includes the use of quantitative models to shift assets among investment styles. |
| |
| 1999 | | Norwest Advantage Funds and Stagecoach Funds are reorganized into Wells Fargo Funds after the merger of Norwest and Wells Fargo. |
| |
| 2002 | | Evergreen Retail and Evergreen Institutional companies form the umbrella asset management company, Evergreen Investments. |
| |
| 2005 | | The integration of Strong Funds with Wells Fargo Funds creates Wells Fargo Advantage Funds, resulting in one of the top 20 mutual fund companies in the United States. |
| |
| 2006 | | Wells Fargo Advantage Funds relaunches the target date product line as Wells Fargo Advantage Dow Jones Target Date Funds. |
| |
| 2010 | | The mergers and reorganizations of Evergreen and Wells Fargo Advantage mutual funds are completed, unifying the families under the brand of Wells Fargo Advantage Funds. |
Wells Fargo Advantage Funds®
Wells Fargo Advantage Funds skillfully guides institutions, financial advisors, and individuals through the investment terrain to help them reach their financial objectives. Everything we do on behalf of investors is backed by our unique combination of qualifications.
Strength
Our organization is built on the standards of integrity and service established by our parent company—Wells Fargo & Company—more than 150 years ago. And, because we’re part of a highly diversified financial enterprise, we offer the depth of resources to help investors succeed.
Expertise
Our multi-boutique model offers investors access to the independent thinking of premier investment managers that have been chosen for their time-tested strategies. While each team specializes in a specific investment strategy, collectively they provide investors a wide choice of distinct investment styles. Our dedication to investment excellence doesn’t end with our expertise in manager selection—risk management, analysis, and rigorous ongoing review seek to ensure each manager’s investment process remains consistent.
Partnership
Our collaborative approach is built around understanding the needs and goals of our clients. By adhering to core principles of sound judgment and steady guidance, we support you through every stage of the investment decision process.
Carefully consider the investment objectives, risks, charges, and expenses before investing. For a current prospectus for Wells Fargo Advantage Funds containing this and other information, visit wellsfargo.com/advantagefunds. Read it carefully before investing.
Wells Fargo Funds Management, LLC, a wholly owned subsidiary of Wells Fargo & Company, provides investment advisory and administrative services for Wells Fargo Advantage Funds®. Other affiliates of Wells Fargo & Company provide subadvisory and other services for the Funds. The Funds are distributed by Wells Fargo Funds Distributor, LLC, Member FINRA/SIPC, an affiliate of Wells Fargo & Company.
The “Dow Jones Target Date Indexes” are a product of Dow Jones Indexes, a licensed trademark of CME Group Index Services LLC (“CME”). “Dow Jones” and “Dow Jones Target Date Indexes” are service marks of Dow Jones Trademark Holdings, LLC, and have been licensed for use for certain purposes by CME and sublicensed for use by Global Index Advisors, Inc., and Wells Fargo Funds Management, LLC. The Dow Jones Target Date Indexes are based in part on the Barclays Capital Bond Indexes, which are published by Barclays Capital Inc. The Wells Fargo Advantage Dow Jones Target Date Funds, based on the Dow Jones Target Date Indexes, are not sponsored, endorsed, sold, or promoted by Dow Jones, CME or Barclays Capital or any of their respective affiliates, and neither Dow Jones, CME nor Barclays Capital nor any of their respective affiliates makes any representation regarding the advisability of investing in such product(s) and/or about the quality, accuracy, and/or completeness of the Dow Jones Target Date Indexes or the Barclays Capital Bond Indexes. IN NO EVENT SHALL DOW JONES, CME, BARCLAYS CAPITAL, OR ANY OF THEIR LICENSORS HAVE ANY LIABILITY FOR ANY SPECIAL, PUNITIVE, IN DIRECT, OR CONSEQUENTIAL DAMAGES (INCLUDING LOST PROFITS), EVEN IF NOTIFIED OF THE POSSIBILITY OF SUCH DAMAGES.
NOT FDIC INSURED ¡ NO BANK GUARANTEE ¡ MAY LOSE VALUE
Not part of the semi-annual report.
Wells Fargo Advantage Funds offers more than 120 mutual funds across a wide range of asset classes, representing over $241 billion in assets under management, as of April 30, 2011.
| | | | |
| Equity Funds | | | | |
Asia Pacific Fund | | Enterprise Fund† | | Opportunity Fund† |
C&B Large Cap Value Fund | | Equity Value Fund | | Precious Metals Fund |
C&B Mid Cap Value Fund | | Global Opportunities Fund | | Premier Large Company Growth Fund |
Capital Growth Fund | | Growth Fund | | Small Cap Growth Fund |
Classic Value Fund | | Growth Opportunities Fund | | Small Cap Opportunities Fund |
Common Stock Fund | | Health Care Fund | | Small Cap Value Fund |
Core Equity Fund | | Index Fund | | Small Company Growth Fund |
Disciplined Global Equity Fund | | International Equity Fund | | Small Company Value Fund |
Disciplined U.S. Core Fund | | International Value Fund | | Small/Mid Cap Core Fund |
Disciplined Value Fund | | Intrinsic Small Cap Value Fund | | Small/Mid Cap Value Fund |
Discovery Fund† | | Intrinsic Value Fund | | Social Sustainability Fund† |
Diversified Equity Fund | | Intrinsic World Equity Fund | | Special Mid Cap Value Fund |
Diversified International Fund | | Large Cap Core Fund | | Special Small Cap Value Fund |
Diversified Small Cap Fund | | Large Cap Growth Fund | | Specialized Technology Fund |
Emerging Growth Fund | | Large Company Value Fund | | Strategic Large Cap Growth Fund |
Emerging Markets Equity Fund | | Mid Cap Growth Fund | | Traditional Small Cap Growth Fund |
Endeavor Select Fund† | | Omega Growth Fund | | Utility and Telecommunications Fund |
| Bond Funds | | | | |
Adjustable Rate Government Fund | | Inflation-Protected Bond Fund | | Short-Term Bond Fund |
California Limited-Term Tax-Free Fund | | Intermediate Tax/AMT-Free Fund | | Short-Term High Yield Bond Fund |
California Tax-Free Fund | | International Bond Fund | | Short-Term Municipal Bond Fund |
Colorado Tax-Free Fund | | Minnesota Tax-Free Fund | | Strategic Municipal Bond Fund |
Government Securities Fund | | Municipal Bond Fund | | Total Return Bond Fund |
High Income Fund | | North Carolina Tax-Free Fund | | Ultra Short-Term Income Fund |
High Yield Bond Fund | | Pennsylvania Tax-Free Fund | | Ultra Short-Term Municipal Income Fund |
Income Plus Fund | | Short Duration Government Bond Fund | | Wisconsin Tax-Free Fund |
| Asset Allocation Funds | | | | |
Asset Allocation Fund | | WealthBuilder Equity Portfolio† | | Target 2020 Fund† |
Conservative Allocation Fund | | WealthBuilder Growth Allocation Portfolio† | | Target 2025 Fund† |
Diversified Capital Builder Fund | | WealthBuilder Growth Balanced Portfolio† | | Target 2030 Fund† |
Diversified Income Builder Fund | | WealthBuilder Moderate Balanced Portfolio† | | Target 2035 Fund† |
Growth Balanced Fund | | WealthBuilder Tactical Equity Portfolio† | | Target 2040 Fund† |
Index Asset Allocation Fund | | Target Today Fund† | | Target 2045 Fund† |
Moderate Balanced Fund | | Target 2010 Fund† | | Target 2050 Fund† |
WealthBuilder Conservative Allocation Portfolio† | | Target 2015 Fund† | | |
| Money Market Funds | | | | |
100% Treasury Money Market Fund | | Minnesota Money Market Fund | | New Jersey Municipal Money Market Fund |
California Municipal Money Market Fund | | Money Market Fund | | New York Municipal Money Market Fund |
Cash Investment Money Market Fund | | Municipal Cash Management Money Market Fund | | Pennsylvania Municipal Money Market Fund |
Government Money Market Fund | | Municipal Money Market Fund | | Prime Investment Money Market Fund |
Heritage Money Market Fund† | | National Tax-Free Money Market Fund | | Treasury Plus Money Market Fund |
| Variable Trust Funds1 | | | | |
VT Core Equity Fund | | VT Intrinsic Value Fund | | VT Small Cap Value Fund |
VT Discovery Fund† | | VT Omega Growth Fund | | VT Total Return Bond Fund |
VT Index Asset Allocation Fund | | VT Opportunity Fund† | | |
VT International Equity Fund | | VT Small Cap Growth Fund | | |
An investment in a money market fund is not insured or guaranteed by the Federal Deposit Insurance Corporation or any other government agency. Although the Wells Fargo Advantage Money Market Funds seek to preserve the value of your investment at $1.00 per share, it is possible to lose money by investing in a money market fund.
| 1. | The Variable Trust Funds are generally available only through insurance company variable contracts. |
| † | In this report, the Wells Fargo Advantage Discovery FundSM, Wells Fargo Advantage Endeavor Select FundSM, Wells Fargo Advantage Enterprise FundSM, Wells Fargo Advantage Opportunity FundSM, Wells Fargo Advantage Social Sustainability FundSM, Wells Fargo Advantage WealthBuilder Conservative Allocation PortfolioSM, Wells Fargo Advantage WealthBuilder Equity PortfolioSM , Wells Fargo Advantage WealthBuilder Growth Allocation PortfolioSM, Wells Fargo Advantage WealthBuilder Growth Balanced PortfolioSM, Wells Fargo Advantage WealthBuilder Moderate Balanced PortfolioSM, Wells Fargo Advantage WealthBuilder Tactical Equity PortfolioSM , Wells Fargo Advantage Dow Jones Target Today FundSM, Wells Fargo Advantage Dow Jones Target 2010 FundSM, Wells Fargo Advantage Dow Jones Target 2015 FundSM, Wells Fargo Advantage Dow Jones Target 2020 FundSM, Wells Fargo Advantage Dow Jones Target 2025 FundSM, Wells Fargo Advantage Dow Jones Target 2030 FundSM , Wells Fargo Advantage Dow Jones Target 2035 FundSM, Wells Fargo Advantage Dow Jones Target 2040 FundSM, Wells Fargo Advantage Dow Jones Target 2045 FundSM, Wells Fargo Advantage Dow Jones Target 2050 FundSM, Wells Fargo Advantage Heritage Money Market FundSM, Wells Fargo Advantage VT Discovery FundSM, and Wells Fargo Advantage VT Opportunity FundSM are referred to as the Discovery Fund, Endeavor Select Fund, Enterprise Fund, Opportunity Fund, Social Sustainability Fund, WealthBuilder Conservative Allocation Portfolio, WealthBuilder Equity Portfolio, WealthBuilder Growth Allocation Portfolio, WealthBuilder Growth Balanced Portfolio, WealthBuilder Moderate Balanced Portfolio, WealthBuilder Tactical Equity Portfolio, Target Today Fund, Target 2010 Fund, Target 2015 Fund, Target 2020 Fund, Target 2025 Fund, Target 2030 Fund, Target 2035 Fund, Target 2040 Fund, Target 2045 Fund, Target 2050 Fund, Heritage Money Market Fund, VT Discovery Fund, and VT Opportunity Fund, respectively. |
Not part of the semi-annual report.
| | | | |
| 2 | | Wells Fargo Advantage Small and Mid Cap Stock Funds | | Letter to Shareholders |

Karla M. Rabusch,
President
Wells Fargo Advantage Funds
Interest rates rose for the period as investors demanded more yield to compensate for potentially higher inflation, with longer-term bonds showing the largest rate increases.
Dear Valued Shareholder,
We are pleased to provide you with this semi-annual report for the Wells Fargo Advantage Small and Mid Cap Stock Funds for the six-month period that ended April 30, 2011. The period was marked by growing optimism, as most economic data continued to point toward recovery—even as a sluggish employment market remained worrisome. Most major areas of the global stock market ended the period with double-digit gains, but persistently high prices for commodities such as oil, cotton, and corn led to increased fears of inflation and higher interest rates. As a result, most bond market sectors posted either modest gains or moderate losses.
Solid economic reports helped support a stock market rally.
Economic numbers throughout the reporting period supported the case for a gradual recovery. Reported real gross domestic product (GDP) grew by 3.1% in the fourth quarter of 2010. Although GDP growth slowed in the first quarter of 2011, it remained solidly positive at 1.8%, supporting consensus opinion that a double-dip recession was unlikely. The unemployment rate began the period at 9.7% in October 2010 and ended the period modestly lower at 9.0% in April 2011. This still stubbornly high unemployment rate was the main sour note and the primary reason why most analysts believed that an economic recovery would be gradual. Persistent weakness in the housing market remained another source of concern, and by the end of the period, higher prices for food and energy led to concerns about renewed inflation. Interest rates rose for the period as investors demanded more yield to compensate for potentially higher inflation, with longer-term bonds showing the largest rate increases.
Europe’s sovereign debt problems weighed on confidence.
Even before the period began, investors were concerned about the possibility that eurozone member Greece would default on its sovereign debt. Greece applied for a bailout from the European Union and the International Monetary Fund in April 2010, and Ireland followed in November. Portugal also requested a bailout in early April 2011. Concerns about default led to worries about the debt burdens of other member states such as Italy and Spain and about the effect of possible defaults on European banks and pension funds. Despite the debt worries, European stocks rallied during the period. The euro weakened in late 2010 but later recovered, and toward the end of the period, it was trading at levels last reached in late 2009.
Central banks continued to provide stimulus.
Throughout the reporting period, the Federal Open Market Committee (FOMC) kept its key interest rates at effectively zero in order to support the financial system. In November the Federal Reserve (Fed) announced a second round of monetary stimulus in which it planned to purchase $600 billion in long-term U.S. Treasuries by the end of the second quarter of 2011, as well as reinvest an additional $250 billion to $300 billion in Treasuries with the proceeds from earlier investments. At the beginning of the period, the European Central Bank (ECB) had a key rate of 1.00% but raised it to 1.25% in early April in an attempt to keep inflation in check. The ECB continued to provide unlimited liquidity for banks and, in December 2010, announced the purchase of Irish and Portuguese bonds in an attempt to reduce those countries’ borrowing costs.
| | | | | | |
| Letter to Shareholders | | Wells Fargo Advantage Small and Mid Cap Stock Funds | | | 3 | |
Global stock markets rallied, but bonds posted losses on fears of renewed inflation.
For the period, domestic small-cap stocks outperformed large-cap stocks as investors bid up shares in companies that stood to gain the most from resumed economic growth. Both developed and emerging markets stocks posted solid gains for the period, as measured by the MSCI indexes.
Within the fixed-income universe, higher interest rates put pressure on bond prices. Although high-grade corporate bonds eked out a modest gain for the period, intermediate and longer-term U.S. Treasury bonds posted losses. High-yield bonds continued to post gains on improved economic conditions and investors’ increased willingness to take on credit risk in exchange for higher yields.
Many variables are at work in the market.
The full effect of the credit crisis remains unknown. Elevated unemployment and debt defaults continue to pressure consumers and businesses alike.
Experience tells us that strict adherence to time-tested strategies has its rewards. As a whole, Wells Fargo Advantage Funds represents investments across a range of asset classes and investment styles, giving you an opportunity to create a diversified investment portfolio. While diversification may not prevent losses in a downturn, it does provide you with one way of managing risk.
Thank you for choosing to invest with Wells Fargo Advantage Funds. We appreciate your confidence in us and remain committed to helping you meet your financial needs. For current information about your fund investments, contact your investment professional, visit our website at www.wellsfargo.com/advantagefunds, or call us directly at 1-800-222-8222. We are available 24 hours a day, 7 days a week.
Sincerely,

Karla M. Rabusch
President
Wells Fargo Advantage Funds
For the period, domestic small-cap stocks outperformed large-cap stocks as investors bid up shares in companies that stood to gain the most from resumed economic growth.
| | | | |
| 4 | | Wells Fargo Advantage Small and Mid Cap Stock Funds | | Performance Highlights |
Wells Fargo Advantage Intrinsic Small Cap Value Fund
INVESTMENT OBJECTIVE
The Fund seeks long-term capital appreciation.
ADVISER
Wells Fargo Funds Management, LLC
SUB-ADVISER
Metropolitan West Capital Management, LLC
PORTFOLIO MANAGERS
Alex Alvarez, CFA
Samir Sikka
FUND INCEPTION
March 28, 2002
| | | | |
TEN LARGEST EQUITY HOLDINGS1 (AS OF APRIL 30, 2011) | |
Entegris Incorporated | | | 3.04% | |
Covance Incorporated | | | 2.91% | |
Ralcorp Holdings Incorporated | | | 2.43% | |
Cathay General Bancorp | | | 2.20% | |
Electronics For Imaging Incorporated | | | 2.17% | |
Landstar Systems Incorporated | | | 2.15% | |
Jabil Circuit Incorporated | | | 2.04% | |
Charles River Laboratories International Incorporated | | | 2.04% | |
Steris Corporation | | | 2.00% | |
Amedisys Incorporated | | | 1.97% | |
| | |
SECTOR DISTRIBUTION2 (AS OF APRIL 30, 2011) |
|
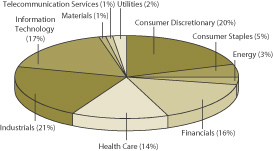 |
| 1. | The ten largest equity holdings are calculated based on the value of the securities divided by total net assets of the Fund. Holdings are subject to change and may have changed since the dates specified. |
| 2. | Sector distribution is subject to change and is calculated based on the total common stocks of the Fund. |
| | | | | | |
| Performance Highlights | | Wells Fargo Advantage Small and Mid Cap Stock Funds | | | 5 | |
Wells Fargo Advantage Intrinsic Small Cap Value Fund (continued)
AVERAGE ANNUAL TOTAL RETURN3 (%) (AS OF APRIL 30, 2011)
| | | | | | | | | | | | | | | | | | | | | | | | | | | | | | | | | | | | | | | | | | | | |
| | | | | | Including Sales Charge | | | Excluding Sales Charge | | | Expense Ratios4 | |
| | | Inception Date | | | 6-Months* | | | 1-Year | | | 5-Year | | | Life of Fund | | | 6-Months* | | | 1-Year | | | 5-Year | | | Life of Fund | | | Gross | | | Net5 | |
Class A (WFSMX) | | | 03/31/2008 | | | | 14.06 | | | | 7.53 | | | | (0.16 | ) | | | 8.69 | | | | 21.00 | | | | 14.06 | | | | 1.03 | | | | 9.40 | | | | 1.50% | | | | 1.46% | |
Class C (WSCDX) | | | 03/31/2008 | | | | 19.67 | | | | 12.26 | | | | 0.33 | | | | 8.75 | | | | 20.67 | | | | 13.26 | | | | 0.33 | | | | 8.75 | | | | 2.25% | | | | 2.21% | |
Administrator Class (WFSDX) | | | 04/08/2005 | | | | | | | | | | | | | | | | | | | | 21.21 | | | | 14.38 | | | | 1.33 | | | | 9.62 | | | | 1.34% | | | | 1.21% | |
Institutional Class (WFSSX) | | | 04/08/2005 | | | | | | | | | | | | | | | | | | | | 21.29 | | | | 14.57 | | | | 1.53 | | | | 9.76 | | | | 1.07% | | | | 1.01% | |
Investor Class (SCOVX) | | | 03/28/2002 | | | | | | | | | | | | | | | | | | | | 20.95 | | | | 14.04 | | | | 1.00 | | | | 9.38 | | | | 1.57% | | | | 1.50% | |
Russell 2000® Value Index6 | | | | | | | | | | | | | | | | | | | | | | | 20.31 | | | | 14.57 | | | | 2.50 | | | | 7.60 | | | | | | | | | |
| * | Returns for periods of less than one year are not annualized. |
Figures quoted represent past performance, which is no guarantee of future results and do not reflect the deduction of taxes that a shareholder may pay on fund distributions or the redemption of fund shares. Investment return and principal value of an investment will fluctuate so that an investor’s shares, when redeemed, may be worth more or less than their original cost. Performance shown without sales charges would be lower if sales charges were reflected. Current performance may be lower or higher than the performance data quoted. Current month-end performance is available on the Fund’s Web site – www.wellsfargo.com/advantagefunds.
Index returns do not include transaction costs associated with buying and selling securities, any mutual fund fees or expenses or any taxes. It is not possible to invest directly in an index.
For Class A shares, the maximum front-end sales charge is 5.75%. For Class C shares, the maximum contingent deferred sales charge is 1.00%. Performance including sales charge assumes the sales charge for the corresponding time period. Administrator Class, Institutional Class and Investor Class shares are sold without a front-end sales charge or contingent deferred sales charge.
Stock fund values fluctuate in response to the activities of individual companies and general market and economic conditions. Smaller company stocks tend to be more volatile and less liquid than those of larger companies. The use of derivatives may reduce returns and/or increase volatility. Certain investment strategies tend to increase the total risk of an investment (relative to the broader market). This Fund is exposed to foreign investment risk. Consult the Fund’s prospectus for additional information on these and other risks.
| 3. | Prior to June 1, 2010, the Fund was named Wells Fargo Advantage Small Cap Disciplined Fund. Metropolitan West Capital Management, LLC replaced Wells Capital Management as a sub-adviser for the Fund effective June 1, 2010. Accordingly, performance figures shown prior to June 1, 2010 do not reflect the principal investment strategies or performance of Metropolitan West Capital Management, LLC. Historical performance shown for Class A, the Administrator Class and the Institutional Class shares prior to their inception reflects the performance of the Investor Class shares, and includes the higher expenses applicable to the Investor Class shares. If these expenses had not been included, returns would be higher. Historical performance shown for Class C shares prior to their inception reflects the performance of the Investor Class shares, adjusted to reflect the higher expenses applicable to Class C shares. |
| 4. | Reflects the expense ratios as stated in the most recent prospectuses. |
| 5. | The Adviser has committed through February 29, 2012 to waive fees and/or reimburse expenses to the extent necessary to cap the Fund’s Total Annual Fund Operating Expenses After Fee Waiver, excluding certain expenses, at 1.45% for Class A, 2.20% for Class C, 1.20% for Administrator Class, 1.00% for Institutional Class and 1.49% for Investor Class. Without this cap, the Fund’s returns would have been lower. |
| 6. | The Russell 2000® Value Index measures the performance of those Russell 2000 companies with lower price-to-book ratios and lower forecasted growth values. You cannot invest directly in an index. |
| | | | |
| 6 | | Wells Fargo Advantage Small and Mid Cap Stock Funds | | Performance Highlights |
Wells Fargo Advantage Small Cap Growth Fund
The Fund is closed to new investors1.
INVESTMENT OBJECTIVE
The Fund seeks long-term capital appreciation.
ADVISER
Wells Fargo Funds Management, LLC
SUB-ADVISER
Wells Capital Management Incorporated
PORTFOLIO MANAGERS
Joseph M. Eberhardy, CFA, CPA
Thomas C. Ognar, CFA
Bruce C. Olson, CFA
FUND INCEPTION
July 13, 1990
| | | | |
TEN LARGEST EQUITY HOLDINGS2 (AS OF APRIL 30, 2011) | |
iShares Russell 2000 Growth Index Fund | | | 4.90% | |
Polypore International Incorporated | | | 2.30% | |
Northern Oil & Gas Incorporated | | | 2.24% | |
HMS Holdings Corporation | | | 2.11% | |
Aruba Networks Incorporated | | | 2.00% | |
Microsemi Corporation | | | 1.90% | |
Shutterfly Incorporated | | | 1.79% | |
Gaylord Entertainment Company | | | 1.78% | |
GSI Commerce Incorporated | | | 1.72% | |
Life Time Fitness Incorporated | | | 1.71% | |
| | |
SECTOR DISTRIBUTION3 (AS OF APRIL 30, 2011) |
|
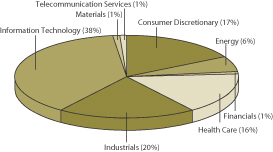 |
| 1. | The Fund is closed to all new investors except those that invest through existing wrap programs and registered investment advisors (RIAs) that use the Fund in existing models. Please see the Statement of Additional Information for further details. |
| 2. | The ten largest equity holdings are calculated based on the value of the securities divided by total net assets of the Fund. Holdings are subject to change and may have changed since the dates specified. |
| 3. | Sector distribution is subject to change and is calculated based on the total common stocks of the Fund. |
| | | | | | |
| Performance Highlights | | Wells Fargo Advantage Small and Mid Cap Stock Funds | | | 7 | |
Wells Fargo Advantage Small Cap Growth Fund (continued)
AVERAGE ANNUAL TOTAL RETURN4 (%) (AS OF APRIL 30, 2011)
| | | | | | | | | | | | | | | | | | | | | | | | | | | | | | | | | | | | | | | | | | | | |
| | | | | | Including Sales Charge | | | Excluding Sales Charge | | | Expense Ratios5 | |
| | | Inception Date | | | 6-Months* | | | 1-Year | | | 5-Year | | | 10-Year | | | 6-Months* | | | 1-Year | | | 5-Year | | | 10-Year | | | Gross | | | Net6 | |
Class A (MNSCX) | | | 07/13/1990 | | | | 15.58 | | | | 10.84 | | | | 6.28 | | | | 6.64 | | | | 22.63 | | | | 17.60 | | | | 7.55 | | | | 7.27 | | | | 1.40% | | | | 1.40% | |
Class B (WMNBX)** | | | 06/06/2003 | | | | 17.20 | | | | 11.75 | | | | 6.40 | | | | 6.71 | | | | 22.20 | | | | 16.75 | | | | 6.71 | | | | 6.71 | | | | 2.15% | | | | 2.15% | |
Class C (WMNCX) | | | 06/06/2003 | | | | 21.25 | | | | 15.80 | | | | 6.72 | | | | 6.47 | | | | 22.25 | | | | 16.80 | | | | 6.72 | | | | 6.47 | | | | 2.15% | | | | 2.15% | |
Administrator Class (WMNIX) | | | 06/06/2003 | | | | | | | | | | | | | | | | | | | | 22.71 | | | | 17.85 | | | | 7.74 | | | | 7.43 | | | | 1.24% | | | | 1.21% | |
Institutional Class (WFSIX) | | | 04/08/2005 | | | | | | | | | | | | | | | | | | | | 22.99 | | | | 18.20 | | | | 8.08 | | | | 7.63 | | | | 0.97% | | | | 0.91% | |
Investor Class (WFSZX) | | | 04/08/2005 | | | | | | | | | | | | | | | | | | | | 22.60 | | | | 17.53 | | | | 7.40 | | | | 7.11 | | | | 1.47% | | | | 1.47% | |
Russell 2000® Growth Index7 | | | | | | | | | | | | | | | | | | | | | | | 27.07 | | | | 30.29 | | | | 5.14 | | | | 5.59 | | | | | | | | | |
| * | Returns for periods of less than one year are not annualized. |
| ** | Class B shares are closed to investment, except in connection with the reinvestment of any distributions and permitted exchanges. |
Figures quoted represent past performance, which is no guarantee of future results and do not reflect the deduction of taxes that a shareholder may pay on fund distributions or the redemption of fund shares. Investment return and principal value of an investment will fluctuate so that an investor’s shares, when redeemed, may be worth more or less than their original cost. Performance shown without sales charges would be lower if sales charges were reflected. Current performance may be lower or higher than the performance data quoted. Current month-end performance is available on the Fund’s Web site – www.wellsfargo.com/advantagefunds.
Index returns do not include transaction costs associated with buying and selling securities, any mutual fund fees or expenses or any taxes. It is not possible to invest directly in an index.
For Class A shares, the maximum front-end sales charge is 5.75%. For Class B shares, the maximum contingent deferred sales charge is 5.00%. For Class C shares, the maximum contingent deferred sales charge is 1.00%. Performance including sales charge assumes the sales charge for the corresponding time period. Administrator Class, Institutional Class and Investor Class shares are sold without a front-end sales charge or contingent deferred sales charge.
Stock fund values fluctuate in response to the activities of individual companies and general market and economic conditions. Smaller company stocks tend to be more volatile and less liquid than those of larger companies. The use of derivatives may reduce returns and/or increase volatility. Consult the Fund’s prospectus for additional information on these and other risks.
| 4. | Historical performance shown for Class B, Class C and the Investor Class shares prior to their inception reflects the performance of Class A shares, adjusted to reflect the higher expenses applicable to Class B, Class C and the Investor Class shares. Historical performance shown for the Institutional Class shares prior to their inception reflects the performance of the Administrator Class shares, and includes the higher expenses applicable to the Administrator Class shares. If these expenses had not been included, returns would be higher. Historical performance shown for the Administrator Class shares prior to their inception reflects the performance of Class A shares, and includes the higher expenses applicable to Class A shares. If these expenses had not been included, returns would be higher. Effective June 20, 2008, Class Z was renamed Investor Class and modified to assume the features and attributes of the Investor Class. |
| 5. | Reflects the expense ratios as stated in the most recent prospectuses. |
| 6. | The Adviser has committed through February 29, 2012 to waive fees and/or reimburse expenses to the extent necessary to cap the Fund’s Total Annual Fund Operating Expenses After Fee Waiver, excluding certain expenses, at 1.40% for Class A, 2.15% for Class B, 2.15% for Class C, 1.20% for Administrator Class, 0.90% for Institutional Class and 1.47% for Investor Class. Without this cap, the Fund’s returns would have been lower. |
| 7. | The Russell 2000® Growth Index measures the performance of those Russell 2000 companies with higher price-to-book ratios and higher forecasted growth values. You cannot invest directly in an index. |
| | | | |
| 8 | | Wells Fargo Advantage Small and Mid Cap Stock Funds | | Performance Highlights |
Wells Fargo Advantage Small Cap Opportunities Fund
The Fund is closed to new investors1.
INVESTMENT OBJECTIVE
The Fund seeks long-term capital appreciation.
ADVISER
Wells Fargo Funds Management, LLC
SUB-ADVISER
Schroder Investment Management North America Inc.
PORTFOLIO MANAGER
Jenny B. Jones
FUND INCEPTION
August 1, 1993
| | | | |
TEN LARGEST EQUITY HOLDINGS2 (AS OF APRIL 30, 2011) | | | |
iShares Russell 2000 Index Fund | | | 2.93% | |
Helix Energy Solutions Group Incorporated | | | 1.49% | |
Cooper Companies Incorporated | | | 1.38% | |
Home Properties Incorporated | | | 1.36% | |
Superior Energy Services Incorporated | | | 1.24% | |
Parametric Technology Corporation | | | 1.24% | |
Cleco Corporation | | | 1.19% | |
AboveNet Incorporated | | | 1.12% | |
SM Energy Company | | | 1.11% | |
Ocwen Financial Corporation | | | 1.06% | |
| | |
SECTOR DISTRIBUTION3 (AS OF APRIL 30, 2011) |
|
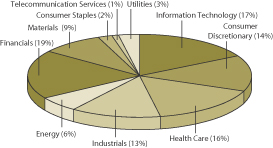
|
| 1. | Please see the Statement of Additional Information for further details. |
| 2. | The ten largest equity holdings are calculated based on the value of the securities divided by total net assets of the Fund. Holdings are subject to change and may have changed since the dates specified. |
| 3. | Sector distribution is subject to change and is calculated based on the total common stocks of the Fund. |
| | | | | | |
| Performance Highlights | | Wells Fargo Advantage Small and Mid Cap Stock Funds | | | 9 | |
Wells Fargo Advantage Small Cap Opportunities Fund (continued)
AVERAGE ANNUAL TOTAL RETURN (%) (AS OF APRIL 30, 2011)
| | | | | | | | | | | | | | | | | | | | | | | | | | | | |
| | | | | | | | | Expense Ratios4 | |
| | | Inception Date | | | 6-Months* | | | 1-Year | | | 5-Year | | | 10-Year | | | Gross | | | Net5 | |
Administrator Class (NVSOX) | | | 08/01/1993 | | | | 18.83 | | | | 20.45 | | | | 6.98 | | | | 10.26 | | | | 1.25% | | | | 1.23% | |
Russell 2000® Index6 | | | | | | | 23.73 | | | | 22.20 | | | | 3.89 | | | | 7.34 | | | | | | | | | |
| * | Returns for periods of less than one year are not annualized. |
Figures quoted represent past performance, which is no guarantee of future results and do not reflect the deduction of taxes that a shareholder may pay on fund distributions or the redemption of fund shares. Investment return and principal value of an investment will fluctuate so that an investor’s shares, when redeemed, may be worth more or less than their original cost. Current performance may be lower or higher than the performance data quoted. Current month-end performance is available on the Fund’s Web site – www.wellsfargo.com/advantagefunds.
Index returns do not include transaction costs associated with buying and selling securities, any mutual fund fees or expenses or any taxes. It is not possible to invest directly in an index.
Administrator Class shares are sold without a front-end sales charge or contingent deferred sales charge.
Stock fund values fluctuate in response to the activities of individual companies and general market and economic conditions. Smaller company stocks tend to be more volatile and less liquid than those of larger companies. The use of derivatives may reduce returns and/or increase volatility. Consult the Fund's prospectus for additional information on these and other risks.
| 4. | Reflects the expense ratios as stated in the most recent prospectus. |
| 5. | The Adviser has committed through February 29, 2012 to waive fees and/or reimburse expenses to the extent necessary to cap the Fund’s Total Annual Fund Operating Expenses After Fee Waiver, excluding certain expenses, at 1.20% for Administrator Class. Without this cap, the Fund’s returns would have been lower. |
| 6. | The Russell 2000® Index measures the performance of the 2,000 smallest companies in the Russell 3000® Index, which represents approximately 8% of the total market capitalization of the Russell 3000 Index. You cannot investd directly in an index. |
| | | | |
| 10 | | Wells Fargo Advantage Small and Mid Cap Stock Funds | | Performance Highlights |
Wells Fargo Advantage Small Cap Value Fund
INVESTMENT OBJECTIVE
The Fund seeks long-term capital appreciation.
ADVISER
Wells Fargo Funds Management, LLC
SUB-ADVISER
Wells Capital Management Incorporated
PORTFOLIO MANAGER
I. Charles Rinaldi
FUND INCEPTION
December 31, 1997
| | | | |
TEN LARGEST EQUITY HOLDINGS1
(AS OF APRIL 30, 2011) | | | |
Randgold Resources Limited ADR | | | 6.15% | |
InterOil Corporation | | | 5.95% | |
Chimera Investment Corporation | | | 3.45% | |
McMoRan Exploration Company | | | 2.60% | |
Range Resources Corporation | | | 2.43% | |
Chicago Bridge & Iron Company NV | | | 2.31% | |
United Continental Holdings Incorporated | | | 1.84% | |
ION Geophysical Corporation | | | 1.80% | |
Global Industries Limited | | | 1.49% | |
Newpark Resources Incorporated | | | 1.45% | |
| | |
SECTOR DISTRIBUTION2
(AS OF APRIL 30, 2011) |
|
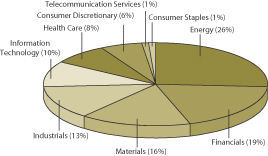 |
| 1. | The ten largest equity holdings are calculated based on the value of the securities divided by total net assets of the Fund. Holdings are subject to change and may have changed since the dates specified. |
| 2. | Sector distribution is subject to change and is calculated based on the total common stocks of the Fund. |
| | | | | | |
| Performance Highlights | | Wells Fargo Advantage Small and Mid Cap Stock Funds | | | 11 | |
Wells Fargo Advantage Small Cap Value Fund (continued)
AVERAGE ANNUAL TOTAL RETURN3 (%) (AS OF APRIL 30, 2011)
| | | | | | | | | | | | | | | | | | | | | | | | | | | | | | | | | | | | | | | | | | | | |
| | | | | | Including Sales Charge | | | Excluding Sales Charge | | | Expense Ratios4 | |
| | | Inception Date | | | 6-Months* | | | 1-Year | | | 5-Year | | | 10-Year | | | 6-Months* | | | 1-Year | | | 5-Year | | | 10-Year | | | Gross | | | Net5 | |
Class A (SMVAX) | | | 11/30/2000 | | | | 7.99 | | | | 8.58 | | | | 4.61 | | | | 10.28 | | | | 14.57 | | | | 15.19 | | | | 5.86 | | | | 10.93 | | | | 1.36% | | | | 1.32% | |
Class B (SMVBX)** | | | 11/30/2000 | | | | 9.14 | | | | 9.31 | | | | 4.73 | | | | 10.35 | | | | 14.14 | | | | 14.31 | | | | 5.06 | | | | 10.35 | | | | 2.11% | | | | 2.07% | |
Class C (SMVCX) | | | 11/30/2000 | | | | 13.14 | | | | 13.35 | | | | 5.07 | | | | 10.11 | | | | 14.14 | | | | 14.35 | | | | 5.07 | | | | 10.11 | | | | 2.11% | | | | 2.07% | |
Administrator Class (SMVDX) | | | 07/30/2010 | | | | | | | | | | | | | | | | | | | | 14.64 | | | | 15.43 | | | | 6.06 | | | | 11.02 | | | | 1.20% | | | | 1.12% | |
Institutional Class (WFSVX) | | | 07/31/2007 | | | | | | | | | | | | | | | | | | | | 14.80 | | | | 15.68 | | | | 6.25 | | | | 11.21 | | | | 0.93% | | | | 0.93% | |
Investor Class (SSMVX) | | | 12/31/1997 | | | | | | | | | | | | | | | | | | | | 14.55 | | | | 15.20 | | | | 5.92 | | | | 11.04 | | | | 1.43% | | | | 1.35% | |
Russell 2000® Value Index6 | | | | | | | | | | | | | | | | | | | | | | | 20.31 | | | | 14.57 | | | | 2.50 | | | | 8.69 | | | | | | | | | |
| * | Returns for periods of less than one year are not annualized. |
| ** | Class B shares are closed to investment, except in connection with the reinvestment of any distributions and permitted exchanges. |
Figures quoted represent past performance, which is no guarantee of future results and do not reflect the deduction of taxes that a shareholder may pay on fund distributions or the redemption of fund shares. Investment return and principal value of an investment will fluctuate so that an investor’s shares, when redeemed, may be worth more or less than their original cost. Performance shown without sales charges would be lower if sales charges were reflected. Current performance may be lower or higher than the performance data quoted. Current month-end performance is available on the Fund’s Web site – www.wellsfargo.com/advantagefunds.
Index returns do not include transaction costs associated with buying and selling securities, any mutual fund fees or expenses or any taxes. It is not possible to invest directly in an index.
For Class A shares, the maximum front-end sales charge is 5.75%. For Class B shares, the maximum contingent deferred sales charge is 5.00%. For Class C shares, the maximum contingent deferred sales charge is 1.00%. Performance including sales charge assumes the sales charge for the corresponding time period. Administrator Class, Institutional Class and Investor Class shares are sold without a front-end sales charge or contingent deferred sales charge.
Stock fund values fluctuate in response to the activities of individual companies and general market and economic conditions. Smaller company stocks tend to be more volatile and less liquid than those of larger companies. The use of derivatives may reduce returns and/or increase volatility. Certain investment strategies tend to increase the total risk of an investment (relative to the broader market). This Fund is exposed to foreign investment risk. Consult the Fund’s prospectus for additional information on these and other risks.
| 3. | Historical performance shown for the Administrator Class shares prior to their inception reflects the performance of the Institutional Class shares, adjusted to reflect the higher expenses applicable to the Administrator Class shares. Historical performance shown for the Institutional Class shares prior to their inception reflects the performance of the Investor Class shares, and includes the higher expenses applicable to the Investor Class shares. If these expenses had not been included, returns would be higher. Effective June 20, 2008, Class Z was renamed Investor Class and modified to assume the features and attributes of the Investor Class. |
| 4. | Reflects the expense ratios as stated in the most recent prospectuses. |
| 5. | The Adviser has committed through February 29, 2012 to waive fees and/or reimburse expenses to the extent necessary to cap the Fund’s Total Annual Fund Operating Expenses After Fee Waiver, excluding certain expenses, at 1.30% for Class A, 2.05% for Class B, 2.05% for Class C, 1.10% for Administrator Class, 0.95% for Institutional Class and 1.33% for Investor Class. Without this cap, the Fund’s returns would have been lower. |
| 6. | The Russell 2000® Value Index measures the performance of those Russell 2000 companies with lower price-to-book ratios and lower forecasted growth values. You cannot invest directly in an index. |
| | | | |
| 12 | | Wells Fargo Advantage Small and Mid Cap Stock Funds | | Performance Highlights |
Wells Fargo Advantage Small/Mid Cap Value Fund
INVESTMENT OBJECTIVE
The Fund seeks long-term capital appreciation.
ADVISER
Wells Fargo Funds Management, LLC
SUB-ADVISER
Wells Capital Management Incorporated
PORTFOLIO MANAGERS
Erik C. Astheimer
I. Charles Rinaldi
Michael Schneider, CFA
FUND INCEPTION
March 28, 2002
| | | | |
TEN LARGEST EQUITY HOLDINGS1 (AS OF APRIL 30, 2011) | | | |
InterOil Corporation | | | 4.98% | |
Randgold Resources Limited ADR | | | 4.84% | |
Chimera Investment Corporation | | | 3.10% | |
McMoRan Exploration Company | | | 2.53% | |
Minera Andes Incorporated | | | 1.96% | |
Trilogy Energy Corporation | | | 1.94% | |
Primoris Services Corporation | | | 1.92% | |
Range Resources Corporation | | | 1.89% | |
Sandvine Corporation | | | 1.78% | |
Newpark Resources Incorporated | | | 1.62% | |
| | |
SECTOR DISTRIBUTION2 (AS OF APRIL 30, 2011) |
|
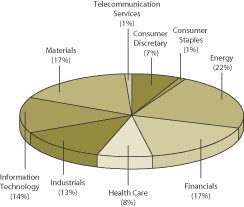
|
| 1. | The ten largest equity holdings are calculated based on the value of the securities divided by total net assets of the Fund. Holdings are subject to change and may have changed since the dates specified. |
| 2. | Sector distribution is subject to change and is calculated based on the total common stocks of the Fund. |
| | | | | | |
| Performance Highlights | | Wells Fargo Advantage Small and Mid Cap Stock Funds | | | 13 | |
Wells Fargo Advantage Small/Mid Cap Value Fund (continued)
AVERAGE ANNUAL TOTAL RETURN3 (%) (AS OF APRIL 30, 2011)
| | | | | | | | | | | | | | | | | | | | | | | | | | | | | | | | | | | | | | | | | | | | |
| | | | | | Including Sales Charge | | | Excluding Sales Charge | | | Expense Ratios4 | |
| | | Inception Date | | | 6-Months* | | | 1-Year | | | 5-Year | | | Life of Fund | | | 6-Months* | | | 1-Year | | | 5-Year | | | Life of Fund | | | Gross | | | Net5 | |
Class A (WFVAX) | | | 07/31/2007 | | | | 10.21 | | | | 7.94 | | | | 1.39 | | | | 7.67 | | | | 16.90 | | | | 14.50 | | | | 2.60 | | | | 8.37 | | | | 1.39% | | | | 1.39% | |
Class C (WFCVX) | | | 07/31/2007 | | | | 15.54 | | | | 12.64 | | | | 1.89 | | | | 7.80 | | | | 16.54 | | | | 13.64 | | | | 1.89 | | | | 7.80 | | | | 2.14% | | | | 2.14% | |
Administrator Class (WWMDX) | | | 04/08/2005 | | | | | | | | | | | | | | | | | | | | 17.11 | | | | 14.83 | | | | 2.89 | | | | 8.60 | | | | 1.23% | | | | 1.16% | |
Institutional Class (WWMSX) | | | 08/31/2006 | | | | | | | | | | | | | | | | | | | | 17.22 | | | | 15.02 | | | | 3.07 | | | | 8.70 | | | | 0.96% | | | | 0.96% | |
Investor Class (SSMVX) | | | 03/28/2002 | | | | | | | | | | | | | | | | | | | | 16.88 | | | | 14.41 | | | | 2.53 | | | | 8.33 | | | | 1.46% | | | | 1.46% | |
Russell 2500™ Value Index6 | | | | | | | | | | | | | | | | | | | | | | | 20.73 | | | | 18.63 | | | | 3.71 | | | | 8.50 | | | | | | | | | |
| * | Returns for periods of less than one year are not annualized. |
Figures quoted represent past performance, which is no guarantee of future results and do not reflect the deduction of taxes that a shareholder may pay on fund distributions or the redemption of fund shares. Investment return and principal value of an investment will fluctuate so that an investor’s shares, when redeemed, may be worth more or less than their original cost. Performance shown without sales charges would be lower if sales charges were reflected. Current performance may be lower or higher than the performance data quoted. Current month-end performance is available on the Fund’s Web site – www.wellsfargo.com/advantagefunds.
Index returns do not include transaction costs associated with buying and selling securities, any mutual fund fees or expenses or any taxes. It is not possible to invest directly in an index.
For Class A shares, the maximum front-end sales charge is 5.75%. For Class C shares, the maximum contingent deferred sales charge is 1.00%. Performance including sales charge assumes the sales charge for the corresponding time period. Administrator Class, Institutional Class and Investor Class shares are sold without a front-end sales charge or contingent deferred sales charge.
Stock fund values fluctuate in response to the activities of individual companies and general market and economic conditions. Smaller company stocks tend to be more volatile and less liquid than those of larger companies. The use of derivatives may reduce returns and/or increase volatility. Certain investment strategies tend to increase the total risk of an investment (relative to the broader market). This Fund is exposed to foreign investment risk. Consult the Fund’s prospectus for additional information on these and other risks.
| 3. | Historical performance shown for Class A and the Administrator Class shares prior to their inception reflects the performance of the Investor Class shares, and includes the higher expenses applicable to the Investor Class shares. If these expenses had not been included, returns would be higher. Historical performance shown for Class C shares prior to their inception reflects the performance of the Investor Class shares, adjusted to reflect the higher expenses applicable to Class C shares. Historical performance shown for the Institutional Class shares prior to their inception reflects the performance of the Administrator Class shares, and includes the higher expenses applicable to the Administrator Class shares. If these expenses had not been included, returns would be higher. |
| 4. | Reflects the expense ratios as stated in the most recent prospectuses. |
| 5. | The Adviser has committed through February 29, 2012 to waive fees and/or reimburse expenses to the extent necessary to cap the Fund’s Total Annual Fund Operating Expenses After Fee Waiver, excluding certain expenses, at 1.40% for Class A, 2.15% for Class C, 1.15% for Administrator Class, 0.95% for Institutional Class and 1.47% for Investor Class. Without this cap, the Fund’s returns would have been lower. |
| 6. | The Russell 2500TM Value Index measures the performance of those Russell 2500 companies with lower price-to-book ratios and lower forecasted growth values. You cannot invest directly in an index. |
| | | | |
| 14 | | Wells Fargo Advantage Small and Mid Cap Stock Funds | | Performance Highlights |
Wells Fargo Advantage Special Small Cap Value Fund
INVESTMENT OBJECTIVE
The Fund seeks long-term capital appreciation.
ADVISER
Wells Fargo Funds Management, LLC
SUB-ADVISER
Wells Capital Management Incorporated
PORTFOLIO MANAGERS
James M. Tringas, CFA, CPA
Robert Rifkin, CFA
FUND INCEPTION
May 7, 1993
| | | | |
TEN LARGEST EQUITY HOLDINGS1 (AS OF APRIL 30, 2011) | | | |
Mueller Industries Incorporated | | | 5.00% | |
First Citizens BancShares Incorporated | | | 4.21% | |
ALLETE Incorporated | | | 3.49% | |
UMB Financial Corporation | | | 3.22% | |
Kadant Incorporated | | | 2.49% | |
Imation Corporation | | | 2.38% | |
Blyth Incorporated | | | 2.22% | |
Quanex Building Products Corporation | | | 1.91% | |
Neenah Paper Incorporated | | | 1.91% | |
Modine Manufacturing Company | | | 1.73% | |
| | |
SECTOR DISTRIBUTION2 (AS OF APRIL 30, 2011) | | |
|
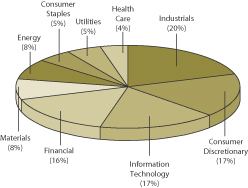
|
| 1 | The ten largest equity holdings are calculated based on the value of the securities divided by total net assets of the Fund. Holdings are subject to change and may have changed since the dates specified. |
| 2. | Sector distribution is subject to change and is calculated based on the total common stocks of the Fund. |
| | | | | | |
| Performance Highlights | | Wells Fargo Advantage Small and Mid Cap Stock Funds | | | 15 | |
Wells Fargo Advantage Special Small Cap Value Fund (continued)
AVERAGE ANNUAL TOTAL RETURN3 (%) (AS OF APRIL 30, 2011)
| | | | | | | | | | | | | | | | | | | | | | | | | | | | | | | | | | | | | | | | | | | | |
| | | | | | Including Sales Charge | | | Excluding Sales Charge | | | Expense Ratios4 | |
| | | Inception Date | | | 6-Months* | | | 1-Year | | | 5-Year | | | 10-Year | | | 6-Months* | | | 1-Year | | | 5-Year | | | 10-Year | | | Gross | | | Net5 | |
Class A (ESPAX) | | | 05/07/1993 | | | | 11.77 | | | | 5.11 | | | | 1.76 | | | | 8.52 | | | | 18.60 | | | | 11.50 | | | | 2.97 | | | | 9.17 | | | | 1.47% | | | | 1.35% | |
Class B (ESPBX)** | | | 03/26/1999 | | | | 13.12 | | | | 5.62 | | | | 1.91 | | | | 8.60 | | | | 18.12 | | | | 10.62 | | | | 2.19 | | | | 8.60 | | | | 2.22% | | | | 2.10% | |
Class C (ESPCX) | | | 12/12/2000 | | | | 17.11 | | | | 9.63 | | | | 2.21 | | | | 8.36 | | | | 18.11 | | | | 10.63 | | | | 2.21 | | | | 8.36 | | | | 2.22% | | | | 2.10% | |
Administrator Class (ESPIX) | | | 07/23/1996 | | | | | | | | | | | | | | | | | | | | 18.69 | | | | 11.75 | | | | 3.23 | | | | 9.45 | | | | 1.31% | | | | 1.10% | |
Institutional Class (ESPNX) | | | 07/30/2010 | | | | | | | | | | | | | | | | | | | | 18.79 | | | | 11.84 | | | | 3.25 | | | | 9.46 | | | | 1.04% | | | | 0.95% | |
Russell 2000® Value Index6 | | | | | | | | | | | | | | | | | | | | | | | 20.31 | | | | 14.57 | | | | 2.50 | | | | 8.69 | | | | | | | | | |
| * | Returns for periods of less than one year are not annualized. |
| ** | Class B shares are closed to investment, except in connection with the reinvestment of any distributions and permitted exchanges. |
Figures quoted represent past performance, which is no guarantee of future results and do not reflect the deduction of taxes that a shareholder may pay on fund distributions or the redemption of fund shares. Investment return and principal value of an investment will fluctuate so that an investor’s shares, when redeemed, may be worth more or less than their original cost. Performance shown without sales charges would be lower if sales charges were reflected. Current performance may be lower or higher than the performance data quoted. Current month-end performance is available on the Fund’s Web site – www.wellsfargo.com/advantagefunds.
Index returns do not include transaction costs associated with buying and selling securities, any mutual fund fees or expenses or any taxes. It is not possible to invest directly in an index.
For Class A shares, the maximum front-end sales charge is 5.75%. For Class B shares, the maximum contingent deferred sales charge is 5.00%. For Class C shares, the maximum contingent deferred sales charge is 1.00%. Performance including sales charge assumes the sales charge for the corresponding time period. Administrator Class and Institutional Class shares are sold without a front-end sales charge or contingent deferred sales charge.
Stock fund values fluctuate in response to the activities of individual companies and general market and economic conditions. Smaller company stocks tend to be more volatile and less liquid than those of larger companies. The use of derivatives may reduce returns and/or increase volatility. Consult the Fund’s prospectus for additional information on these and other risks.
| 3. | Historical performance shown for the Institutional Class shares prior to their inception, reflects the performance of the Administrator Class shares, and includes the higher expenses applicable to the Administrator Class shares. If these expenses had not been included, returns would be higher. Historical performance shown for all classes of the Fund prior to July 19, 2010 is based on the performance of the fund’s predecessor, Evergreen Special Values Fund. |
| 4. | Reflects the expense ratios as stated in the most recent prospectuses. |
| 5. | The Adviser has committed through July 18, 2013 to waive fees and/or reimburse expenses to the extent necessary to cap the Fund’s Total Annual Fund Operating Expenses After Fee Waiver, excluding certain expenses, at 1.34% for Class A, 2.09% for Class B, 2.09% for Class C, 1.09% for Administrator Class and 0.94% for Administrator Class. Without this cap, the Fund’s returns would have been lower. |
| 6. | The Russell 2000® Value Index measures the performance of those Russell 2000 companies with lower price-to-book ratios and lower forecasted growth values. You cannot invest directly in an index. |
| | | | |
| 16 | | Wells Fargo Advantage Small and Mid Cap Stock Funds | | Performance Highlights |
Wells Fargo Advantage Traditional Small Cap Growth Fund
INVESTMENT OBJECTIVE
The Fund seeks long-term capital appreciation.
ADVISER
Wells Fargo Funds Management, LLC
SUB-ADVISER
Wells Capital Management Incorporated
PORTFOLIO MANAGERS
Paul Carder
Jeffrey. S. Drummond
Linda Freeman
Jeffrey Harrison
FUND INCEPTION
April 15, 1985
| | | | |
TEN LARGEST EQUITY HOLDINGS1 (AS OF APRIL 30, 2011) | | | |
Taleo Corporation Class A | | | 1.76% | |
Hexcel Corporation | | | 1.67% | |
World Fuel Services Corporation | | | 1.63% | |
Dollar Financial Corporation | | | 1.56% | |
Equinix Incorporated | | | 1.56% | |
MSC Industrial Direct Company | | | 1.53% | |
Goodrich Petroleum Corporation | | | 1.53% | |
ComScore Incorporated | | | 1.50% | |
Portfolio Recovery Associates Incorporated | | | 1.47% | |
Ciena Corporation | | | 1.45% | |
| | |
SECTOR DISTRIBUTION2 (AS OF APRIL 30, 2011) | | |
|
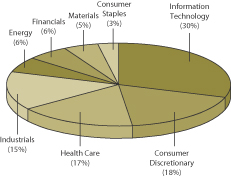
|
| 1. | The ten largest equity holdings are calculated based on the value of the securities divided by total net assets of the Fund. Holdings are subject to change and may have changed since the dates specified. |
| 2. | Sector distribution is subject to change and is calculated based on the total common stocks of the Fund. |
| | | | | | |
| Performance Highlights | | Wells Fargo Advantage Small and Mid Cap Stock Funds | | | 17 | |
Wells Fargo Advantage Traditional Small Cap Growth Fund (continued)
AVERAGE ANNUAL TOTAL RETURN3 (%) (AS OF APRIL 30, 2011)
| | | | | | | | | | | | | | | | | | | | | | | | | | | | | | | | | | | | | | | | | | | | |
| | | | | | Including Sales Charge | | | Excluding Sales Charge | | | Expense Ratios4 | |
| | | Inception Date | | | 6-Months* | | | 1-Year | | | 5-Year | | | 10-Year | | | 6-Months* | | | 1-Year | | | 5-Year | | | 10-Year | | | Gross | | | Net5 | |
Class A (EGWAX) | | | 06/05/1995 | | | | 21.28 | | | | 21.84 | | | | 3.91 | | | | 5.46 | | | | 28.65 | | | | 29.28 | | | | 5.14 | | | | 6.09 | | | | 1.48% | | | | 1.34% | |
Class C (EGWCX) | | | 07/30/2010 | | | | 27.13 | | | | 27.34 | | | | 4.36 | | | | 5.30 | | | | 28.13 | | | | 28.34 | | | | 4.36 | | | | 5.30 | | | | 2.23% | | | | 2.09% | |
Administrator Class (EGWDX) | | | 07/30/2010 | | | | | | | | | | | | | | | | | | | | 28.69 | | | | 29.39 | | | | 5.19 | | | | 6.15 | | | | 1.32% | | | | 1.21% | |
Institutional Class (EGRYX) | | | 11/19/1997 | | | | | | | | | | | | | | | | | | | | 28.78 | | | | 29.73 | | | | 5.43 | | | | 6.39 | | | | 1.05% | | | | 0.99% | |
Russell 2000™ Growth Index6 | | | | | | | | | | | | | | | | | | | | | | | 27.07 | | | | 30.29 | | | | 5.14 | | | | 5.59 | | | | | | | | | |
| * | Returns for periods of less than one year are not annualized. |
Figures quoted represent past performance, which is no guarantee of future results and do not reflect the deduction of taxes that a shareholder may pay on fund distributions or the redemption of fund shares. Investment return and principal value of an investment will fluctuate so that an investor’s shares, when redeemed, may be worth more or less than their original cost. Performance shown without sales charges would be lower if sales charges were reflected. Current performance may be lower or higher than the performance data quoted. Current month-end performance is available on the Fund’s Web site – www.wellsfargo.com/advantagefunds.
Index returns do not include transaction costs associated with buying and selling securities, any mutual fund fees or expenses or any taxes. It is not possible to invest directly in an index.
For Class A shares, the maximum front-end sales charge is 5.75%. For Class C shares, the maximum contingent deferred sales charge is 1.00%. Performance including sales charge assumes the sales charge for the corresponding time period. Administrator Class and Institutional Class shares are sold without a front-end sales charge or contingent deferred sales charge.
Stock fund values fluctuate in response to the activities of individual companies and general market and economic conditions. Smaller company stocks tend to be more volatile and less liquid than those of larger companies. The use of derivatives may reduce returns and/or increase volatility. Consult the Fund’s prospectus for additional information on these and other risks.
| 3. | Historical performance shown for Class C shares prior to their inception reflects the performance of Class A shares, adjusted to reflect the higher expenses applicable to Class C shares. Historical performance shown for the Administrator Class shares prior to their inception reflects the performance of the Institutional Class shares, adjusted to reflect the higher expenses applicable to the Administrator Class shares. Historical performance shown for all classes of the Fund prior to July 19, 2010 is based on the performance of the Fund’s predecessor, Evergreen Growth Fund. |
| 4. | Reflects the expense ratios as stated in the most recent prospectuses. |
| 5. | The Adviser has committed through July 18, 2013 to waive fees and/or reimburse expenses to the extent necessary to cap the Fund’s Total Annual Fund Operating Expenses After Fee Waiver, excluding certain expenses, at 1.33% for Class A, 2.08% for Class C, 1.20% for Administrator Class and 0.98% for Institutional Class. Without this cap, the Fund’s returns would have been lower. |
| 6. | The Russell 2000TM Growth Index measures the performance of those Russell 2000 companies with higher price-to-book ratios and higher forecasted growth values. You cannot invest directly in an index. |
| | | | |
| 18 | | Wells Fargo Advantage Small and Mid Cap Stock Funds | | Fund Expenses |
As a shareholder of the Fund, you incur two types of costs: (1) transaction costs, including sales charges (loads) on purchase payments, redemption fees (if any) and exchange fees (if any); and (2) ongoing costs, including management fees; distribution (12b-1) and/or shareholder service fees; and other Fund expenses. This example is intended to help you understand your ongoing costs (in dollars) of investing in the Fund and to compare these costs with the ongoing costs of investing in other mutual funds.
The example is based on an investment of $1,000 invested at the beginning of the six-month period and held for the entire period from November 1, 2010 to April 30, 2011.
Actual Expenses
The “Actual” line of the table below provides information about actual account values and actual expenses. You may use the information in this line, together with the amount you invested, to estimate the expenses that you paid over the period. Simply divide your account value by $1,000 (for example, an $8,600 account value divided by $1,000 = 8.6), then multiply the result by the number in the “Actual” line under the heading entitled “Expenses Paid During Period” for your applicable class of shares to estimate the expenses you paid on your account during this period.
Hypothetical Example for Comparison Purposes
The “Hypothetical” line of the table below provides information about hypothetical account values and hypothetical expenses based on the Fund’s actual expense ratio and an assumed rate of return of 5% per year before expenses, which is not the Fund’s actual return. The hypothetical account values and expenses may not be used to estimate the actual ending account balance or expenses you paid for the period. You may use this information to compare the ongoing costs of investing in the Fund and other funds. To do so, compare this 5% hypothetical example with the 5% hypothetical examples that appear in the shareholder reports of the other funds.
Please note that the expenses shown in the table are meant to highlight your ongoing costs only and do not reflect any transactional costs, such as sales charges (loads), redemption fees, or exchange fees. Therefore, the “Hypothetical” line of the table is useful in comparing ongoing costs only, and will not help you determine the relative total costs of owning different funds. In addition, if these transactional costs were included, your costs would have been higher.
| | | | | | | | | | | | | | | | |
| Wells Fargo Advantage Intrinsic Small Cap Value Fund | | Beginning
Account Value
11-01-2010 | | | Ending
Account Value
04-30-2011 | | | Expenses
Paid During
the Period1 | | | Net Annual
Expense Ratio | |
Class A | | | | | | | | | | | | | | | | |
Actual | | $ | 1,000.00 | | | $ | 1,209.99 | | | $ | 7.78 | | | | 1.42 | % |
Hypothetical | | $ | 1,000.00 | | | $ | 1,017.75 | | | $ | 7.10 | | | | 1.42 | % |
Class C | | | | | | | | | | | | | | | | |
Actual | | $ | 1,000.00 | | | $ | 1,206.69 | | | $ | 11.87 | | | | 2.17 | % |
Hypothetical | | $ | 1,000.00 | | | $ | 1,014.03 | | | $ | 10.84 | | | | 2.17 | % |
Administrator Class | | | | | | | | | | | | | | | | |
Actual | | $ | 1,000.00 | | | $ | 1,212.08 | | | $ | 6.58 | | | | 1.20 | % |
Hypothetical | | $ | 1,000.00 | | | $ | 1,018.84 | | | $ | 6.01 | | | | 1.20 | % |
Institutional Class | | | | | | | | | | | | | | | | |
Actual | | $ | 1,000.00 | | | $ | 1,212.86 | | | $ | 5.38 | | | | 0.98 | % |
Hypothetical | | $ | 1,000.00 | | | $ | 1,019.93 | | | $ | 4.91 | | | | 0.98 | % |
Investor Class | | | | | | | | | | | | | | | | |
Actual | | $ | 1,000.00 | | | $ | 1,209.49 | | | $ | 8.11 | | | | 1.48 | % |
Hypothetical | | $ | 1,000.00 | | | $ | 1,017.46 | | | $ | 7.40 | | | | 1.48 | % |
| | | | | | |
| Fund Expenses | | Wells Fargo Advantage Small and Mid Cap Stock Funds | | | 19 | |
| | | | | | | | | | | | | | | | |
| Wells Fargo Advantage Small Cap Growth Fund | | Beginning
Account Value
11-01-2010 | | | Ending
Account Value
04-30-2011 | | | Expenses
Paid During
the Period1 | | | Net Annual
Expense Ratio | |
Class A | | | | | | | | | | | | | | | | |
Actual | | $ | 1,000.00 | | | $ | 1,226.30 | | | $ | 7.51 | | | | 1.36 | % |
Hypothetical | | $ | 1,000.00 | | | $ | 1,018.05 | | | $ | 6.80 | | | | 1.36 | % |
Class B | | | | | | | | | | | | | | | | |
Actual | | $ | 1,000.00 | | | $ | 1,222.04 | | | $ | 11.68 | | | | 2.12 | % |
Hypothetical | | $ | 1,000.00 | | | $ | 1,014.28 | | | $ | 10.59 | | | | 2.12 | % |
Class C | | | | | | | | | | | | | | | | |
Actual | | $ | 1,000.00 | | | $ | 1,222.50 | | | $ | 11.68 | | | | 2.12 | % |
Hypothetical | | $ | 1,000.00 | | | $ | 1,014.28 | | | $ | 10.59 | | | | 2.12 | % |
Administrator Class | | | | | | | | | | | | | | | | |
Actual | | $ | 1,000.00 | | | $ | 1,227.12 | | | $ | 6.63 | | | | 1.20 | % |
Hypothetical | | $ | 1,000.00 | | | $ | 1,018.84 | | | $ | 6.01 | | | | 1.20 | % |
Institutional Class | | | | | | | | | | | | | | | | |
Actual | | $ | 1,000.00 | | | $ | 1,229.89 | | | $ | 4.98 | | | | 0.90 | % |
Hypothetical | | $ | 1,000.00 | | | $ | 1,020.33 | | | $ | 4.51 | | | | 0.90 | % |
Investor Class | | | | | | | | | | | | | | | | |
Actual | | $ | 1,000.00 | | | $ | 1,226.04 | | | $ | 7.95 | | | | 1.44 | % |
Hypothetical | | $ | 1,000.00 | | | $ | 1,017.65 | | | $ | 7.20 | | | | 1.44 | % |
| Wells Fargo Advantage Small Cap Opportunities Fund | | | | | | | | | | | | |
Administrator Class | | | | | | | | | | | | | | | | |
Actual | | $ | 1,000.00 | | | $ | 1,188.32 | | | $ | 6.51 | | | | 1.20 | % |
Hypothetical | | $ | 1,000.00 | | | $ | 1,018.84 | | | $ | 6.01 | | | | 1.20 | % |
| Wells Fargo Advantage Small Cap Value Fund | | | | | | | | | | | | |
Class A | | | | | | | | | | | | | | | | |
Actual | | $ | 1,000.00 | | | $ | 1,145.73 | | | $ | 6.92 | | | | 1.30 | % |
Hypothetical | | $ | 1,000.00 | | | $ | 1,018.35 | | | $ | 6.51 | | | | 1.30 | % |
Class B | | | | | | | | | | | | | | | | |
Actual | | $ | 1,000.00 | | | $ | 1,141.38 | | | $ | 10.83 | | | | 2.04 | % |
Hypothetical | | $ | 1,000.00 | | | $ | 1,014.68 | | | $ | 10.19 | | | | 2.04 | % |
Class C | | | | | | | | | | | | | | | | |
Actual | | $ | 1,000.00 | | | $ | 1,141.43 | | | $ | 10.88 | | | | 2.05 | % |
Hypothetical | | $ | 1,000.00 | | | $ | 1,014.63 | | | $ | 10.24 | | | | 2.05 | % |
Administrator Class | | | | | | | | | | | | | | | | |
Actual | | $ | 1,000.00 | | | $ | 1,146.42 | | | $ | 5.85 | | | | 1.10 | % |
Hypothetical | | $ | 1,000.00 | | | $ | 1,019.34 | | | $ | 5.51 | | | | 1.10 | % |
Institutional Class | | | | | | | | | | | | | | | | |
Actual | | $ | 1,000.00 | | | $ | 1,148.02 | | | $ | 4.74 | | | | 0.89 | % |
Hypothetical | | $ | 1,000.00 | | | $ | 1,020.38 | | | $ | 4.46 | | | | 0.89 | % |
Investor Class | | | | | | | | | | | | | | | | |
Actual | | $ | 1,000.00 | | | $ | 1,145.49 | | | $ | 7.08 | | | | 1.33 | % |
Hypothetical | | $ | 1,000.00 | | | $ | 1,018.20 | | | $ | 6.66 | | | | 1.33 | % |
| | | | |
| 20 | | Wells Fargo Advantage Small and Mid Cap Stock Funds | | Fund Expenses |
| | | | | | | | | | | | | | | | |
| Wells Fargo Advantage Small/Mid Cap Value Fund | | Beginning
Account Value
11-01-2010 | | | Ending
Account Value
04-30-2011 | | | Expenses
Paid During
the Period1 | | | Net Annual
Expense Ratio | |
Class A | | | | | | | | | | | | | | | | |
Actual | | $ | 1,000.00 | | | $ | 1,168.97 | | | $ | 7.48 | | | | 1.39 | % |
Hypothetical | | $ | 1,000.00 | | | $ | 1,017.90 | | | $ | 6.95 | | | | 1.39 | % |
Class C | | | | | | | | | | | | | | | | |
Actual | | $ | 1,000.00 | | | $ | 1,165.44 | | | $ | 11.49 | | | | 2.14 | % |
Hypothetical | | $ | 1,000.00 | | | $ | 1,014.18 | | | $ | 10.69 | | | | 2.14 | % |
Administrator Class | | | | | | | | | | | | | | | | |
Actual | | $ | 1,000.00 | | | $ | 1,171.09 | | | $ | 6.19 | | | | 1.15 | % |
Hypothetical | | $ | 1,000.00 | | | $ | 1,019.09 | | | $ | 5.76 | | | | 1.15 | % |
Institutional Class | | | | | | | | | | | | | | | | |
Actual | | $ | 1,000.00 | | | $ | 1,172.20 | | | $ | 5.12 | | | | 0.95 | % |
Hypothetical | | $ | 1,000.00 | | | $ | 1,020.08 | | | $ | 4.76 | | | | 0.95 | % |
Investor Class | | | | | | | | | | | | | | | | |
Actual | | $ | 1,000.00 | | | $ | 1,168.78 | | | $ | 7.85 | | | | 1.46 | % |
Hypothetical | | $ | 1,000.00 | | | $ | 1,017.55 | | | $ | 7.30 | | | | 1.46 | % |
| Wells Fargo Advantage Special Small Cap Value Fund | | | | | | | | | | | | |
Class A | | | | | | | | | | | | | | | | |
Actual | | $ | 1,000.00 | | | $ | 1,186.05 | | | $ | 7.26 | | | | 1.34 | % |
Hypothetical | | $ | 1,000.00 | | | $ | 1,018.15 | | | $ | 6.71 | | | | 1.34 | % |
Class B | | | | | | | | | | | | | | | | |
Actual | | $ | 1,000.00 | | | $ | 1,181.24 | | | $ | 11.30 | | | | 2.09 | % |
Hypothetical | | $ | 1,000.00 | | | $ | 1,014.43 | | | $ | 10.44 | | | | 2.09 | % |
Class C | | | | | | | | | | | | | | | | |
Actual | | $ | 1,000.00 | | | $ | 1,181.10 | | | $ | 11.30 | | | | 2.09 | % |
Hypothetical | | $ | 1,000.00 | | | $ | 1,014.43 | | | $ | 10.44 | | | | 2.09 | % |
Administrator Class | | | | | | | | | | | | | | | | |
Actual | | $ | 1,000.00 | | | $ | 1,186.87 | | | $ | 5.91 | | | | 1.09 | % |
Hypothetical | | $ | 1,000.00 | | | $ | 1,019.39 | | | $ | 5.46 | | | | 1.09 | % |
Institutional Class | | | | | | | | | | | | | | | | |
Actual | | $ | 1,000.00 | | | $ | 1,187.88 | | | $ | 5.05 | | | | 0.93 | % |
Hypothetical | | $ | 1,000.00 | | | $ | 1,020.18 | | | $ | 4.66 | | | | 0.93 | % |
| Wells Fargo Advantage Traditional Small Cap Growth Fund | | | | | | | | | | | | |
Class A | | | | | | | | | | | | | | | | |
Actual | | $ | 1,000.00 | | | $ | 1,286.51 | | | $ | 7.54 | | | | 1.33 | % |
Hypothetical | | $ | 1,000.00 | | | $ | 1,018.20 | | | $ | 6.66 | | | | 1.33 | % |
Class C | | | | | | | | | | | | | | | | |
Actual | | $ | 1,000.00 | | | $ | 1,281.32 | | | $ | 11.77 | | | | 2.08 | % |
Hypothetical | | $ | 1,000.00 | | | $ | 1,014.48 | | | $ | 10.39 | | | | 2.08 | % |
Administrator Class | | | | | | | | | | | | | | | | |
Actual | | $ | 1,000.00 | | | $ | 1,286.86 | | | $ | 6.80 | | | | 1.20 | % |
Hypothetical | | $ | 1,000.00 | | | $ | 1,018.84 | | | $ | 6.01 | | | | 1.20 | % |
Institutional Class | | | | | | | | | | | | | | | | |
Actual | | $ | 1,000.00 | | | $ | 1,287.81 | | | $ | 5.56 | | | | 0.98 | % |
Hypothetical | | $ | 1,000.00 | | | $ | 1,019.93 | | | $ | 4.91 | | | | 0.98 | % |
| 1. | Expenses paid is equal to each class’ annualized expense ratio multiplied by the average account value over the period, multiplied by the number of days in the most recent six-month period divided by 365 (to reflect the one-half year period). |
| | | | | | |
| Portfolio of Investments—April 30, 2011 (Unaudited) | | Wells Fargo Advantage Small and Mid Cap Stock Funds | | | 21 | |
INTRINSIC SMALL CAP VALUE FUND
| | | | | | | | | | | | | | | | |
| Security Name | | | | | | | | Shares | | | Value | |
| | | | | | | | | | | | | | | | |
| | | | |
Common Stocks: 96.34% | | | | | | | | | | | | | | | | |
| | | | |
Consumer Discretionary: 19.20% | | | | | | | | | | | | | | | | |
| | | | |
| Automobiles: 1.40% | | | | | | | | | | | | | | | | |
Thor Industries Incorporated« | | | | | | | | | | | 63,500 | | | $ | 1,969,135 | |
| | | | | | | | | | | | | | | | |
| | | | |
| Hotels, Restaurants & Leisure: 4.00% | | | | | | | | | | | | | | | | |
CEC Entertainment Incorporated | | | | | | | | | | | 44,500 | | | | 1,683,435 | |
P.F. Chang’s China Bistro Incorporated | | | | | | | | | | | 49,500 | | | | 1,984,950 | |
Papa Johns International Incorporated†« | | | | | | | | | | | 65,500 | | | | 1,968,930 | |
| | | | |
| | | | | | | | | | | | | | | 5,637,315 | |
| | | | | | | | | | | | | | | | |
| | | | |
| Household Durables: 3.10% | | | | | | | | | | | | | | | | |
Ethan Allen Interiors Incorporated | | | | | | | | | | | 76,500 | | | | 1,842,885 | |
MDC Holdings Incorporated« | | | | | | | | | | | 86,500 | | | | 2,524,935 | |
| | | | |
| | | | | | | | | | | | | | | 4,367,820 | |
| | | | | | | | | | | | | | | | |
| | | | |
| Specialty Retail: 6.15% | | | | | | | | | | | | | | | | |
Aeropostale Incorporated†« | | | | | | | | | | | 76,500 | | | | 1,953,045 | |
Group 1 Automotive Incorporated« | | | | | | | | | | | 35,000 | | | | 1,506,400 | |
Jo S.A. Bank Clothiers Incorporated† | | | | | | | | | | | 48,500 | | | | 2,542,370 | |
OfficeMax Incorporated†« | | | | | | | | | | | 268,000 | | | | 2,669,280 | |
| | | | |
| | | | | | | | | | | | | | | 8,671,095 | |
| | | | | | | | | | | | | | | | |
| | | | |
| Textiles, Apparel & Luxury Goods: 4.55% | | | | | | | | | | | | | | | | |
Carter Incorporated† | | | | | | | | | | | 66,500 | | | | 2,056,180 | |
Jones Group Incorporated | | | | | | | | | | | 153,500 | | | | 2,092,205 | |
Volcom Incorporated« | | | | | | | | | | | 114,500 | | | | 2,259,085 | |
| | | | |
| | | | | | | | | | | | | | | 6,407,470 | |
| | | | | | | | | | | | | | | | |
| | | | |
Consumer Staples: 4.83% | | | | | | | | | | | | | | | | |
| | | | |
| Food Products: 4.83% | | | | | | | | | | | | | | | | |
Flowers Foods Incorporated« | | | | | | | | | | | 65,500 | | | | 2,001,680 | |
J&J Snack Foods Corporation | | | | | | | | | | | 27,000 | | | | 1,372,140 | |
Ralcorp Holdings Incorporated†« | | | | | | | | | | | 44,000 | | | | 3,423,200 | |
| | | | |
| | | | | | | | | | | | | | | 6,797,020 | |
| | | | | | | | | | | | | | | | |
| | | | |
Energy: 2.75% | | | | | | | | | | | | | | | | |
| | | | |
| Energy Equipment & Services: 2.75% | | | | | | | | | | | | | | | | |
Oceaneering International Incorporated† | | | | | | | | | | | 22,500 | | | | 1,966,950 | |
Tetra Technologies Incorporated† | | | | | | | | | | | 129,000 | | | | 1,905,330 | |
| | | | |
| | | | | | | | | | | | | | | 3,872,280 | |
| | | | | | | | | | | | | | | | |
| | | | |
Financials: 15.89% | | | | | | | | | | | | | | | | |
| | | | |
| Commercial Banks: 10.74% | | | | | | | | | | | | | | | | |
Associated Banc-Corporation« | | | | | | | | | | | 158,000 | | | | 2,306,800 | |
Cathay General Bancorporation« | | | | | | | | | | | 182,000 | | | | 3,103,100 | |
CVB Financial Corporation | | | | | | | | | | | 270,500 | | | | 2,634,670 | |
First Midwest Bancorp Incorporated | | | | | | | | | | | 168,000 | | | | 2,200,800 | |
Glacier Bancorp Incorporated« | | | | | | | | | | | 145,500 | | | | 2,186,865 | |
| | | | |
| 22 | | Wells Fargo Advantage Small and Mid Cap Stock Funds | | Portfolio of Investments—April 30, 2011 (Unaudited) |
INTRINSIC SMALL CAP VALUE FUND
| | | | | | | | | | | | | | | | |
| Security Name | | | | | | | | Shares | | | Value | |
| | | | | | | | | | | | | | | | |
| | | | |
| Commercial Banks (continued) | | | | | | | | | | | | | | | | |
Zions Bancorporation« | | | | | | | | | | | 110,500 | | | $ | 2,701,725 | |
| | | | |
| | | | | | | | | | | | | | | 15,133,960 | |
| | | | | | | | | | | | | | | | |
| | | | |
| Insurance: 5.15% | | | | | | | | | | | | | | | | |
Horace Mann Educators Corporation | | | | | | | | | | | 118,000 | | | | 2,109,840 | |
Selective Insurance Group Incorporated | | | | | | | | | | | 150,000 | | | | 2,646,000 | |
Stancorp Financial Group Incorporated« | | | | | | | | | | | 58,000 | | | | 2,499,800 | |
| | | | |
| | | | | | | | | | | | | | | 7,255,640 | |
| | | | | | | | | | | | | | | | |
| | | | |
Health Care: 13.68% | | | | | | | | | | | | | | | | |
| | | | |
| Health Care Equipment & Supplies: 2.18% | | | | | | | | | | | | | | | | |
ICU Medical Incorporated† | | | | | | | | | | | 5,820 | | | | 262,540 | |
Steris Corporation | | | | | | | | | | | 78,000 | | | | 2,811,120 | |
| | | | |
| | | | | | | | | | | | | | | 3,073,660 | |
| | | | | | | | | | | | | | | | |
| | | | |
| Health Care Providers & Services: 4.69% | | | | | | | | | | | | | | | | |
Amedisys Incorporated†« | | | | | | | | | | | 83,500 | | | | 2,782,220 | |
AMN Healthcare Services Incorporated†« | | | | | | | | | | | 241,500 | | | | 2,084,145 | |
Chemed Corporation | | | | | | | | | | | 25,000 | | | | 1,740,750 | |
| | | | |
| | | | | | | | | | | | | | | 6,607,115 | |
| | | | | | | | | | | | | | | | |
| | | | |
| Life Sciences Tools & Services: 6.81% | | | | | | | | | | | | | | | | |
Bio-Rad Laboratories Incorporated†« | | | | | | | | | | | 21,000 | | | | 2,627,520 | |
Charles River Laboratories International Incorporated† | | | | | | | | | | | 68,000 | | | | 2,868,920 | |
Covance Incorporated†« | | | | | | | | | | | 65,500 | | | | 4,100,300 | |
| | | | |
| | | | | | | | | | | | | | | 9,596,740 | |
| | | | | | | | | | | | | | | | |
| | | | |
Industrials: 20.08% | | | | | | | | | | | | | | | | |
| | | | |
| Air Freight & Logistics: 1.70% | | | | | | | | | | | | | | | | |
Forward Air Corporation« | | | | | | | | | | | 71,000 | | | | 2,387,020 | |
| | | | | | | | | | | | | | | | |
| | | | |
| Commercial Services & Supplies: 11.08% | | | | | | | | | | | | | | | | |
Copart Incorporated† | | | | | | | | | | | 50,000 | | | | 2,268,500 | |
FTI Consulting Incorporated†« | | | | | | | | | | | 35,500 | | | | 1,416,450 | |
Heidrick & Struggles International Incorporated | | | | | | | | | | | 53,950 | | | | 1,262,430 | |
Kar Auction Services Incorporated† | | | | | | | | | | | 99,700 | | | | 1,944,150 | |
Resources Connection Incorporated | | | | | | | | | | | 170,500 | | | | 2,521,695 | |
Schawk Incorporated« | | | | | | | | | | | 98,000 | | | | 1,848,280 | |
School Specialty Incorporated† | | | | | | | | | | | 162,500 | | | | 2,406,625 | |
United Stationers Incorporated | | | | | | | | | | | 27,000 | | | | 1,945,620 | |
| | | | |
| | | | | | | | | | | | | | | 15,613,750 | |
| | | | | | | | | | | | | | | | |
| | | | |
| Construction & Engineering: 1.35% | | | | | | | | | | | | | | | | |
Pike Electric Corporation† | | | | | | | | | | | 187,000 | | | | 1,899,920 | |
| | | | | | | | | | | | | | | | |
| | | | |
| Machinery: 3.80% | | | | | | | | | | | | | | | | |
Trinity Industries Incorporated | | | | | | | | | | | 75,500 | | | | 2,733,100 | |
Wabtec Corporation | | | | | | | | | | | 29,000 | | | | 2,070,020 | |
Watts Water Technologies Incorporated | | | | | | | | | | | 14,300 | | | | 553,410 | |
| | | | |
| | | | | | | | | | | | | | | 5,356,530 | |
| | | | | | | | | | | | | | | | |
| | | | | | |
| Portfolio of Investments—April 30, 2011 (Unaudited) | | Wells Fargo Advantage Small and Mid Cap Stock Funds | | | 23 | |
INTRINSIC SMALL CAP VALUE FUND
| | | | | | | | | | | | | | | | |
| Security Name | | | | | | | | Shares | | | Value | |
| | | | | | | | | | | | | | | | |
| | | | |
| Road & Rail: 2.15% | | | | | | | | | | | | | | | | |
Landstar System Incorporated | | | | | | | | | | | 64,000 | | | $ | 3,033,600 | |
| | | | | | | | | | | | | | | | |
| | | | |
Information Technology: 16.32% | | | | | | | | | | | | | | | | |
| | | | |
| Communications Equipment: 3.32% | | | | | | | | | | | | | | | | |
Brocade Communications Systems Incorporated† | | | | | | | | | | | 419,000 | | | | 2,618,750 | |
Plantronics Incorporated | | | | | | | | | | | 55,500 | | | | 2,057,385 | |
| | | | |
| | | | | | | | | | | | | | | 4,676,135 | |
| | | | | | | | | | | | | | | | |
| | | | |
| Computers & Peripherals: 3.79% | | | | | | | | | | | | | | | | |
Avid Technology Incorporated†« | | | | | | | | | | | 122,800 | | | | 2,281,624 | |
Electronics for Imaging Incorporated† | | | | | | | | | | | 170,500 | | | | 3,062,180 | |
| | | | |
| | | | | | | | | | | | | | | 5,343,804 | |
| | | | | | | | | | | | | | | | |
| | | | |
| Electronic Equipment & Instruments: 2.53% | | | | | | | | | | | | | | | | |
Ingenico ADR | | | | | | | | | | | 69,300 | | | | 688,946 | |
Jabil Circuit Incorporated« | | | | | | | | | | | 145,000 | | | | 2,876,800 | |
| | | | |
| | | | | | | | | | | | | | | 3,565,746 | |
| | | | | | | | | | | | | | | | |
| | | | |
| Internet Software & Services: 1.40% | | | | | | | | | | | | | | | | |
DealerTrack Holdings Incorporated† | | | | | | | | | | | 87,550 | | | | 1,966,373 | |
| | | | | | | | | | | | | | | | |
| | | | |
| Semiconductors & Semiconductor Equipment: 5.28% | | | | | | | | | | | | | | | | |
ATMI Incorporated†« | | | | | | | | | | | 84,500 | | | | 1,682,395 | |
Entegris Incorporated† | | | | | | | | | | | 496,500 | | | | 4,284,795 | |
Varian Semiconductor Equipment Associates Incorporated† | | | | | | | | | | | 35,000 | | | | 1,467,550 | |
| | | | |
| | | | | | | | | | | | | | | 7,434,740 | |
| | | | | | | | | | | | | | | | |
| | | | |
Materials: 1.17% | | | | | | | | | | | | | | | | |
| | | | |
| Paper & Forest Products: 1.17% | | | | | | | | | | | | | | | | |
P.H Glatfelter Company« | | | | | | | | | | | 121,500 | | | | 1,652,400 | |
| | | | | | | | | | | | | | | | |
| | | | |
Telecommunication Services: 0.96% | | | | | | | | | | | | | | | | |
| | | | |
| Diversified Telecommunication Services: 0.96% | | | | | | | | | | | | | | | | |
General Communication Incorporated Class A† | | | | | | | | | | | 118,000 | | | | 1,357,000 | |
| | | | | | | | | | | | | | | | |
| | | | |
Utilities: 1.46% | | | | | | | | | | | | | | | | |
| | | | |
| Electric Utilities: 1.46% | | | | | | | | | | | | | | | | |
Westar Energy Incorporated« | | | | | | | | | | | 75,500 | | | | 2,054,355 | |
| | | | | | | | | | | | | | | | |
| | | | |
Total Common Stocks (Cost $110,474,740) | | | | | | | | | | | | | | | 135,730,623 | |
| | | | | | | | | | | | | | | | |
| | | | |
| 24 | | Wells Fargo Advantage Small and Mid Cap Stock Funds | | Portfolio of Investments—April 30, 2011 (Unaudited) |
INTRINSIC SMALL CAP VALUE FUND
| | | | | | | | | | | | | | | | |
| Security Name | | Interest Rate | | | Maturity Date | | | Principal | | | Value | |
| | | | | | | | | | | | | | | | |
| | | | |
Short-Term Investments: 26.21% | | | | | | | | | | | | | | | | |
| | | | |
| Corporate Bonds and Notes: 0.72% | | | | | | | | | | | | | | | | |
Gryphon Funding Limited(a)(i)(v) | | | 0.00 | % | | | 08/05/2011 | | | $ | 890,194 | | | $ | 383,318 | |
VFNC Corporation(a)††(i)(v)± | | | 0.25 | | | | 09/29/2011 | | | | 1,073,565 | | | | 633,403 | |
| | | | |
| | | | | | | | | | | | | | | 1,016,721 | |
| | | | | | | | | | | | | | | | |
| | | | |
| | | Yield | | | | | | Shares | | | | |
| | | | |
| Investment Companies: 25.49% | | | | | | | | | | | | | | | | |
Wells Fargo Advantage Cash Investment Money Market Fund(l)(u) | | | 0.09 | | | | | | | | 7,505,010 | | | | 7,505,010 | |
Wells Fargo Securities Lending Cash Investment, LLC(v)(l)(u) | | | 0.20 | | | | | | | | 28,398,654 | | | | 28,398,654 | |
| | | | |
| | | | | | | | | | | | | | | 35,903,664 | |
| | | | | | | | | | | | | | | | |
| | | | |
Total Short-Term Investments (Cost $36,408,805) | | | | | | | | | | | | | | | 36,920,385 | |
| | | | | | | | | | | | | | | | |
| | | | | | | | |
Total Investments in Securities (Cost $146,883,545)* | | | 122.55 | % | | | 172,651,008 | |
Other Assets and Liabilities, Net | | | (22.55 | ) | | | (31,773,383 | ) |
| | | | | | | | |
| Total Net Assets | | | 100.00 | % | | $ | 140,877,625 | |
| | | | | | | | |
| † | Non-income earning security. |
| « | All or a portion of this security is on loan. |
| (a) | Security is fair valued by the Management Valuation Team, and in certain instances by the Board of Trustees, in accordance with procedures approved by the Board of Trustees. |
| †† | Securities that may be resold to “qualified institutional buyers” under Rule 144A or securities offered pursuant to Section 4(2) of the Securities Act of 1933, as amended. |
| (v) | Security represents investment of cash collateral received from securities on loan. |
| (l) | Investment in an affiliate. |
| (u) | Rate shown is the 7-day annualized yield at period end. |
| ± | Variable rate investments. |
| * | Cost for federal income tax purposes is $149,087,488 and net unrealized appreciation (depreciation) consist of: |
| | | | |
Gross unrealized appreciation | | $ | 24,998,159 | |
Gross unrealized depreciation | | | (1,434,639 | ) |
| | | | |
Net unrealized appreciation | | $ | 23,563,520 | |
The accompanying notes are an integral part of these financial statements.
| | | | | | |
| Portfolio of Investments—April 30, 2011 (Unaudited) | | Wells Fargo Advantage Small and Mid Cap Stock Funds | | | 25 | |
SMALL CAP GROWTH FUND
| | | | | | | | | | | | | | | | |
| Security Name | | | | | | | | Shares | | | Value | |
| | | | | | | | | | | | | | | | |
| | | | |
Common Stocks: 91.84% | | | | | | | | | | | | | | | | |
| | | | |
Consumer Discretionary: 15.65% | | | | | | | | | | | | | | | | |
| | | | |
| Diversified Consumer Services: 0.89% | | | | | | | | | | | | | | | | |
Bridgepoint Education Incorporated† | | | | | | | | | | | 432,205 | | | $ | 7,585,198 | |
Coinstar Incorporated† | | | | | | | | | | | 45,900 | | | | 2,477,682 | |
Grand Canyon Education Incorporated† | | | | | | | | | | | 154,564 | | | | 2,234,995 | |
| | | | |
| | | | | | | | | | | | | | | 12,297,875 | |
| | | | | | | | | | | | | | | | |
| | | | |
| Hotels, Restaurants & Leisure: 7.12% | | | | | | | | | | | | | | | | |
BJ’s Restaurants Incorporated†« | | | | | | | | | | | 345,560 | | | | 16,224,042 | |
Bravo Brio Restaurant Group Incorporated† | | | | | | | | | | | 304,178 | | | | 6,278,234 | |
Gaylord Entertainment Company†« | | | | | | | | | | | 685,700 | | | | 24,596,059 | |
Life Time Fitness Incorporated†« | | | | | | | | | | | 603,700 | | | | 23,616,744 | |
Scientific Games Corporation Class A† | | | | | | | | | | | 2,197,430 | | | | 23,116,964 | |
Shuffle Master Incorporated† | | | | | | | | | | | 419,407 | | | | 4,584,119 | |
| | | | |
| | | | | | | | | | | | | | | 98,416,162 | |
| | | | | | | | | | | | | | | | |
| | | | |
| Internet & Catalog Retail: 1.79% | | | | | | | | | | | | | | | | |
Shutterfly Incorporated† | | | | | | | | | | | 401,929 | | | | 24,742,749 | |
| | | | | | | | | | | | | | | | |
| | | | |
| Media: 2.12% | | | | | | | | | | | | | | | | |
IMAX Corporation† | | | | | | | | | | | 231,300 | | | | 8,114,004 | |
Live Nation Incorporated†« | | | | | | | | | | | 1,056,105 | | | | 11,712,204 | |
Reachlocal Incorporated† | | | | | | | | | | | 406,852 | | | | 9,455,240 | |
| | | | |
| | | | | | | | | | | | | | | 29,281,448 | |
| | | | | | | | | | | | | | | | |
| | | | |
| Specialty Retail: 2.50% | | | | | | | | | | | | | | | | |
Hibbett Sports Incorporated†« | | | | | | | | | | | 200,200 | | | | 7,563,556 | |
Tractor Supply Company« | | | | | | | | | | | 108,600 | | | | 6,719,082 | |
Ulta Salon Cosmetics & Fragrance Incorporated†« | | | | | | | | | | | 73,800 | | | | 3,925,422 | |
Vitamin Shoppe Incorporated† | | | | | | | | | | | 420,000 | | | | 16,388,400 | |
| | | | |
| | | | | | | | | | | | | | | 34,596,460 | |
| | | | | | | | | | | | | | | | |
| | | | |
| Textiles, Apparel & Luxury Goods: 1.23% | | | | | | | | | | | | | | | | |
Vera Bradley Incorporated† | | | | | | | | | | | 192,963 | | | | 9,385,720 | |
Warnaco Group Incorporated†« | | | | | | | | | | | 119,100 | | | | 7,665,276 | |
| | | | |
| | | | | | | | | | | | | | | 17,050,996 | |
| | | | | | | | | | | | | | | | |
| | | | |
Energy: 5.85% | | | | | | | | | | | | | | | | |
| | | | |
| Oil, Gas & Consumable Fuels: 5.85% | | | | | | | | | | | | | | | | |
Approach Resources Incorporated† | | | | | | | | | | | 495,000 | | | | 14,572,800 | |
Brigham Exploration Company†« | | | | | | | | | | | 495,450 | | | | 16,612,439 | |
Carrizo Oil & Gas Incorporated†« | | | | | | | | | | | 92,625 | | | | 3,690,180 | |
Kodiak Oil & Gas Corporation†« | | | | | | | | | | | 375,900 | | | | 2,638,818 | |
Northern Oil & Gas Incorporated†« | | | | | | | | | | | 1,306,200 | | | | 31,035,312 | |
Oasis Petroleum Incorporated† | | | | | | | | | | | 400,000 | | | | 12,292,000 | |
| | | | |
| | | | | | | | | | | | | | | 80,841,549 | |
| | | | | | | | | | | | | | | | |
| | | | |
| 26 | | Wells Fargo Advantage Small and Mid Cap Stock Funds | | Portfolio of Investments—April 30, 2011 (Unaudited) |
SMALL CAP GROWTH FUND
| | | | | | | | | | | | | | | | |
| Security Name | | | | | | | | Shares | | | Value | |
| | | | | | | | | | | | | | | | |
| | | | |
Financials: 0.21% | | | | | | | | | | | | | | | | |
| | | | |
| Capital Markets: 0.15% | | | | | | | | | | | | | | | | |
Financial Engines Incorporated† | | | | | | | | | | | 71,100 | | | $ | 2,021,373 | |
| | | | | | | | | | | | | | | | |
| | | | |
| Commercial Banks: 0.06% | | | | | | | | | | | | | | | | |
Park Sterling Corporation† | | | | | | | | | | | 173,015 | | | | 826,147 | |
| | | | | | | | | | | | | | | | |
| | | | |
Health Care: 14.71% | | | | | | | | | | | | | | | | |
| | | | |
| Biotechnology: 0.15% | | | | | | | | | | | | | | | | |
Exact Sciences Corporation†« | | | | | | | | | | | 264,620 | | | | 2,119,606 | |
| | | | | | | | | | | | | | | | |
| | | | |
| Health Care Equipment & Supplies: 6.23% | | | | | | | | | | | | | | | | |
DexCom Incorporated† | | | | | | | | | | | 335,900 | | | | 5,592,735 | |
Greatbatch Incorporated† | | | | | | | | | | | 132,379 | | | | 3,583,500 | |
Masimo Corporation | | | | | | | | | | | 116,620 | | | | 4,057,210 | |
NxStage Medical Incorporated†« | | | | | | | | | | | 556,300 | | | | 13,707,232 | |
Sirona Dental Systems Incorporated† | | | | | | | | | | | 50,610 | | | | 2,888,313 | |
SonoSite Incorporated† | | | | | | | | | | | 533,542 | | | | 18,513,907 | |
Volcano Corporation† | | | | | | | | | | | 805,000 | | | | 21,461,300 | |
Zoll Medical Corporation†« | | | | | | | | | | | 287,600 | | | | 16,301,168 | |
| | | | |
| | | | | | | | | | | | | | | 86,105,365 | |
| | | | | | | | | | | | | | | | |
| | | | |
| Health Care Providers & Services: 3.93% | | | | | | | | | | | | | | | | |
Catalyst Health Solutions Incorporated† | | | | | | | | | | | 210,745 | | | | 12,551,972 | |
Centene Corporation†« | | | | | | | | | | | 238,900 | | | | 8,655,347 | |
ePocrates Incorporated†« | | | | | | | | | | | 172,252 | | | | 4,030,697 | |
HMS Holdings Corporation†« | | | | | | | | | | | 370,390 | | | | 29,153,397 | |
| | | | |
| | | | | | | | | | | | | | | 54,391,413 | |
| | | | | | | | | | | | | | | | |
| | | | |
| Health Care Technology: 1.28% | | | | | | | | | | | | | | | | |
Quality Systems Incorporated | | | | | | | | | | | 77,726 | | | | 6,973,577 | |
SXC Health Solutions Corporation† | | | | | | | | | | | 194,270 | | | | 10,715,933 | |
| | | | |
| | | | | | | | | | | | | | | 17,689,510 | |
| | | | | | | | | | | | | | | | |
| | | | |
| Life Sciences Tools & Services: 0.61% | | | | | | | | | | | | | | | | |
Luminex Corporation† | | | | | | | | | | | 434,639 | | | | 8,427,650 | |
| | | | | | | | | | | | | | | | |
| | | | |
| Pharmaceuticals: 2.51% | | | | | | | | | | | | | | | | |
Akorn Incorporated†« | | | | | | | | | | | 1,086,686 | | | | 7,193,861 | |
Auxilium Pharmaceuticals Incorporated† | | | | | | | | | | | 179,900 | | | | 4,382,364 | |
Impax Laboratories Incorporated† | | | | | | | | | | | 364,700 | | | | 9,985,486 | |
Jazz Pharmaceuticals Incorporated†« | | | | | | | | | | | 409,500 | | | | 13,067,145 | |
| | | | |
| | | | | | | | | | | | | | | 34,628,856 | |
| | | | | | | | | | | | | | | | |
| | | | |
Industrials: 18.38% | | | | | | | | | | | | | | | | |
| | | | |
| Aerospace & Defense: 0.69% | | | | | | | | | | | | | | | | |
Esterline Technologies Corporation† | | | | | | | | | | | 132,108 | | | | 9,485,354 | |
| | | | | | | | | | | | | | | | |
| | | | |
| Air Freight & Logistics: 0.06% | | | | | | | | | | | | | | | | |
UTI Worldwide Incorporated | | | | | | | | | | | 36,190 | | | | 811,018 | |
| | | | | | | | | | | | | | | | |
| | | | | | |
| Portfolio of Investments—April 30, 2011 (Unaudited) | | Wells Fargo Advantage Small and Mid Cap Stock Funds | | | 27 | |
SMALL CAP GROWTH FUND
| | | | | | | | | | | | | | | | |
| Security Name | | | | | | | | Shares | | | Value | |
| | | | | | | | | | | | | | | | |
| | | | |
| Commercial Services & Supplies: 5.60% | | | | | | | | | | | | | | | | |
Clean Harbors Incorporated† | | | | | | | | | | | 54,519 | | | $ | 5,370,122 | |
Corporate Executive Board Company | | | | | | | | | | | 539,751 | | | | 21,509,077 | |
ICF International Incorporated† | | | | | | | | | | | 97,926 | | | | 2,385,477 | |
InnerWorkings Incorporated† | | | | | | | | | | | 2,056,151 | | | | 18,443,674 | |
Kforce Incorporated† | | | | | | | | | | | 120,252 | | | | 1,881,944 | |
On Assignment Incorporated† | | | | | | | | | | | 1,188,277 | | | | 13,035,399 | |
Sykes Enterprises Incorporated†« | | | | | | | | | | | 607,136 | | | | 12,160,934 | |
United Stationers Incorporated | | | | | | | | | | | 36,700 | | | | 2,644,602 | |
| | | | |
| | | | | | | | | | | | | | | 77,431,229 | |
| | | | | | | | | | | | | | | | |
| | | | |
| Electrical Equipment: 3.48% | | | | | | | | | | | | | | | | |
Altra Holdings Incorporated†« | | | | | | | | | | | 643,310 | | | | 16,333,641 | |
Polypore International Incorporated†« | | | | | | | | | | | 514,800 | | | | 31,799,196 | |
| | | | |
| | | | | | | | | | | | | | | 48,132,837 | |
| | | | | | | | | | | | | | | | |
| | | | |
| Machinery: 4.23% | | | | | | | | | | | | | | | | |
Chart Industries Incorporated† | | | | | | | | | | | 329,895 | | | | 16,036,196 | |
Circor International Incorporated | | | | | | | | | | | 58,569 | | | | 2,660,790 | |
Robbins & Myers Incorporated« | | | | | | | | | | | 423,000 | | | | 18,387,810 | |
The Middleby Corporation†« | | | | | | | | | | | 121,200 | | | | 10,868,004 | |
Trimas Corporation† | | | | | | | | | | | 456,587 | | | | 10,597,384 | |
| | | | |
| | | | | | | | | | | | | | | 58,550,184 | |
| | | | | | | | | | | | | | | | |
| | | | |
| Road & Rail: 2.70% | | | | | | | | | | | | | | | | |
Genesee & Wyoming Incorporated† | | | | | | | | | | | 337,400 | | | | 20,912,052 | |
Greenbrier Companies Incorporated†« | | | | | | | | | | | 605,500 | | | | 16,390,885 | |
| | | | |
| | | | | | | | | | | | | | | 37,302,937 | |
| | | | | | | | | | | | | | | | |
| | | | |
| Trading Companies & Distributors: 1.62% | | | | | | | | | | | | | | | | |
DXP Enterprises Incorporated† | | | | | | | | | | | 234,998 | | | | 6,168,698 | |
Titan Machinery Incorporated†« | | | | | | | | | | | 278,800 | | | | 8,771,048 | |
Wesco International Incorporated†« | | | | | | | | | | | 121,300 | | | | 7,514,535 | |
| | | | |
| | | | | | | | | | | | | | | 22,454,281 | |
| | | | | | | | | | | | | | | | |
| | | | |
Information Technology: 34.93% | | | | | | | | | | | | | | | | |
| | | | |
| Communications Equipment: 3.81% | | | | | | | | | | | | | | | | |
Aruba Networks Incorporated†« | | | | | | | | | | | 769,200 | | | | 27,637,356 | |
Blue Coat Systems Incorporated†« | | | | | | | | | | | 189,900 | | | | 5,469,120 | |
Ixia†« | | | | | | | | | | | 924,126 | | | | 15,100,219 | |
ShoreTel Incorporated† | | | | | | | | | | | 432,500 | | | | 4,519,625 | |
| | | | |
| | | | | | | | | | | | | | | 52,726,320 | |
| | | | | | | | | | | | | | | | |
| | | | |
| Electronic Equipment & Instruments: 0.94% | | | | | | | | | | | | | | | | |
Rofin-Sinar Technologies Incorporated† | | | | | | | | | | | 299,600 | | | | 12,975,676 | |
| | | | | | | | | | | | | | | | |
| | | | |
| Internet Software & Services: 9.91% | | | | | | | | | | | | | | | | |
Constant Contact Incorporrated†« | | | | | | | | | | | 176,100 | | | | 4,879,731 | |
DealerTrack Holdings Incorporated†« | | | | | | | | | | | 119,000 | | | | 2,672,740 | |
| | | | |
| 28 | | Wells Fargo Advantage Small and Mid Cap Stock Funds | | Portfolio of Investments—April 30, 2011 (Unaudited) |
SMALL CAP GROWTH FUND
| | | | | | | | | | | | | | | | |
| Security Name | | | | | | | | Shares | | | Value | |
| | | | | | | | | | | | | | | | |
| | | | |
| Internet Software & Services (continued) | | | | | | | | | | | | | | | | |
Demand Media Incorporated†« | | | | | | | | | | | 121,300 | | | $ | 2,009,941 | |
Envestnet Incorporated† | | | | | | | | | | | 434,911 | | | | 5,762,571 | |
GSI Commerce Incorporated† | | | | | | | | | | | 814,226 | | | | 23,832,395 | |
Liveperson Incorporated†« | | | | | | | | | | | 65,000 | | | | 868,400 | |
LogMeIn Incorporated†« | | | | | | | | | | | 292,300 | | | | 12,589,361 | |
LoopNet Incorporated† | | | | | | | | | | | 593,663 | | | | 11,030,259 | |
Marchex Incorporated Class B | | | | | | | | | | | 970,447 | | | | 6,851,356 | |
Mercadolibre Incorporated« | | | | | | | | | | | 78,000 | | | | 7,129,200 | |
Move Incorporated† | | | | | | | | | | | 3,617,702 | | | | 8,646,308 | |
Perficient Incorporated† | | | | | | | | | | | 220,000 | | | | 2,747,800 | |
Quinstreet Incorporated† | | | | | | | | | | | 810,562 | | | | 14,654,961 | |
SciQuest Incorporated† | | | | | | | | | | | 487,005 | | | | 6,944,691 | |
Support.com Incorporated† | | | | | | | | | | | 818,840 | | | | 4,691,953 | |
VistaPrint NV† | | | | | | | | | | | 399,022 | | | | 21,706,797 | |
| | | | |
| | | | | | | | | | | | | | | 137,018,464 | |
| | | | | | | | | | | | | | | | |
| | | | |
| IT Services: 3.70% | | | | | | | | | | | | | | | | |
Gartner Incorporated† | | | | | | | | | | | 223,058 | | | | 9,571,419 | |
Sapient Corporation†« | | | | | | | | | | | 1,189,149 | | | | 15,013,006 | |
Syntel Incorporated« | | | | | | | | | | | 136,800 | | | | 7,480,224 | |
Wright Express Corporation† | | | | | | | | | | | 337,591 | | | | 19,016,501 | |
| | | | |
| | | | | | | | | | | | | | | 51,081,150 | |
| | | | | | | | | | | | | | | | |
| | | | |
| Semiconductors & Semiconductor Equipment: 7.30% | | | | | | | | | | | | | | | | |
Cavium Networks Incorporated†« | | | | | | | | | | | 304,100 | | | | 14,359,602 | |
Entegris Incorporated† | | | | | | | | | | | 977,600 | | | | 8,436,688 | |
EZchip Semiconductor Limited† | | | | | | | | | | | 316,838 | | | | 10,135,648 | |
Microsemi Corporation† | | | | | | | | | | | 1,111,159 | | | | 26,223,352 | |
Monolithic Power Systems Incorporated† | | | | | | | | | | | 170,768 | | | | 2,899,641 | |
NetLogic Microsystems Incorporated† | | | | | | | | | | | 425,400 | | | | 18,347,502 | |
PMC-Sierra Incorporated† | | | | | | | | | | | 2,565,350 | | | | 20,574,107 | |
| | | | |
| | | | | | | | | | | | | | | 100,976,540 | |
| | | | | | | | | | | | | | | | |
| | | | |
| Software: 9.27% | | | | | | | | | | | | | | | | |
Allot Communications Limited†« | | | | | | | | | | | 452,040 | | | | 7,390,854 | |
Blackboard Incorporated† | | | | | | | | | | | 182,600 | | | | 8,784,886 | |
ChinaCache International Holdings Limited ADR†« | | | | | | | | | | | 527,800 | | | | 8,872,318 | |
Fortinet Incorporated† | | | | | | | | | | | 161,500 | | | | 7,865,050 | |
Radiant Systems Incorporated†« | | | | | | | | | | | 368,700 | | | | 7,344,504 | |
Realpage Incorporated† | | | | | | | | | | | 266,400 | | | | 8,498,160 | |
SuccessFactors Incorporated† | | | | | | | | | | | 479,040 | | | | 16,608,317 | |
Synchronoss Technologies Incorporated† | | | | | | | | | | | 646,661 | | | | 20,861,284 | |
Taleo Corporation Class A†« | | | | | | | | | | | 357,557 | | | | 12,968,592 | |
Ultimate Software Group Incorporated†« | | | | | | | | | | | 173,200 | | | | 9,699,200 | |
VanceInfo Technologies Incorporated ADR†« | | | | | | | | | | | 569,700 | | | | 18,321,552 | |
Velti plc† | | | | | | | | | | | 50,000 | | | | 921,000 | |
| | | | |
| | | | | | | | | | | | | | | 128,135,717 | |
| | | | | | | | | | | | | | | | |
| | | | | | |
| Portfolio of Investments—April 30, 2011 (Unaudited) | | Wells Fargo Advantage Small and Mid Cap Stock Funds | | | 29 | |
SMALL CAP GROWTH FUND
| | | | | | | | | | | | | | | | |
| Security Name | | | | | | | | Shares | | | Value | |
| | | | | | | | | | | | | | | | |
| | | | |
Materials: 1.02% | | | | | | | | | | | | | | | | |
| | | | |
| Chemicals: 1.02% | | | | | | | | | | | | | | | | |
Solutia Incorporated† | | | | | | | | | | | 536,900 | | | $ | 14,147,315 | |
| | | | | | | | | | | | | | | | |
| | | | |
Telecommunication Services: 1.09% | | | | | | | | | | | | | | | | |
| | | | |
| Diversified Telecommunication Services: 1.09% | | | | | | | | | | | | | | | | |
Cbeyond Incorporated† | | | | | | | | | | | 1,182,483 | | | | 15,088,483 | |
| | | | | | | | | | | | | | | | |
| | | | |
Total Common Stocks (Cost $1,059,531,515) | | | | | | | | | | | | | | | 1,269,754,664 | |
| | | | | | | | | | | | | | | | |
| | | | |
Investment Companies: 4.90% | | | | | | | | | | | | | | | | |
iShares Russell 2000 Growth Index Fund« | | | | | | | | | | | 686,409 | | | | 67,796,616 | |
| | | | |
Total Investment Companies (Cost $63,829,641) | | | | | | | | | | | | | | | 67,796,616 | |
| | | | | | | | | | | | | | | | |
| | | | |
| | | Interest Rate | | | Maturity Date | | | Principal | | | | |
| | | | |
Short-Term Investments: 20.91% | | | | | | | | | | | | | | | | |
| | | | |
| Corporate Bonds and Notes: 0.36% | | | | | | | | | | | | | | | | |
Gryphon Funding Limited(a)(i)(v) | | | 0.00 | % | | | 08/05/2011 | | | $ | 4,350,670 | | | | 1,873,398 | |
VFNC Corporation(a)††(i)(v)± | | | 0.25 | | | | 09/29/2011 | | | | 5,246,861 | | | | 3,095,648 | |
| | | | |
| | | | | | | | | | | | | | | 4,969,046 | |
| | | | | | | | | | | | | | | | |
| | | | |
| | | Yield | | | | | | Shares | | | | |
| | | | |
| Investment Companies: 20.55% | | | | | | | | | | | | | | | | |
Wells Fargo Advantage Cash Investment Money Market Fund (l)(u) | | | 0.09 | | | | | | | | 35,472,049 | | | | 35,472,049 | |
Wells Fargo Securities Lending Cash Investments, LLC(v)(l)(u) | | | 0.20 | | | | | | | | 248,728,380 | | | | 248,728,380 | |
| | | | |
| | | | | | | | | | | | | | | 284,200,429 | |
| | | | | | | | | | | | | | | | |
| | | | |
Total Short-Term Investments (Cost $286,669,220) | | | | | | | | | | | | | | | 289,169,475 | |
| | | | | | | | | | | | | | | | |
| | | | | | | | |
| Total Investments in Securities | | | | | | | | |
| (Cost $1,410,030,376)* | | | 117.65 | % | | | 1,626,720,755 | |
Other Assets and Liabilities, Net | | | (17.65 | ) | | | (244,073,000 | ) |
| | | | | | | | |
| Total Net Assets | | | 100.00 | % | | $ | 1,382,647,755 | |
| | | | | | | | |
| † | Non-income earning security. |
| « | All or a portion of this security is on loan. |
| (a) | Security is fair valued by the Management Valuation Team, and in certain instances by the Board of Trustees, in accordance with procedures approved by the Board of Trustees. |
| †† | Securities that may be resold to “qualified institutional buyers” under Rule 144A or securities offered pursuant to Section 4(2) of the Securities Act of 1933, as amended. |
| (v) | Security represents investment of cash collateral received from securities on loan. |
| (l) | Investment in an affiliate. |
| (u) | Rate shown is the 7-day annualized yield at period end. |
| ± | Variable rate investments. |
| * | Cost for federal income tax purposes is $1,417,149,493 and net unrealized appreciation (depreciation) consists of: |
| | | | |
Gross unrealized appreciation | | $ | 229,267,480 | |
Gross unrealized depreciation | | | (19,696,218 | ) |
| | | | |
Net unrealized appreciation | | $ | 209,571,262 | |
The accompanying notes are an integral part of these financial statements.
| | | | |
| 30 | | Wells Fargo Advantage Small and Mid Cap Stock Funds | | Portfolio of Investments—April 30, 2011 (Unaudited) |
SMALL CAP OPPORTUNITIES FUND
| | | | | | | | | | | | | | | | |
| Security Name | | | | | | | | Shares | | | Value | |
| | | | | | | | | | | | | | | | |
| | | | |
Common Stocks: 86.00% | | | | | | | | | | | | | | | | |
| | | | |
Consumer Discretionary: 12.75% | | | | | | | | | | | | | | | | |
| | | | |
| Auto Components: 0.33% | | | | | | | | | | | | | | | | |
BorgWarner Incorporated† | | | | | | | | | | | 35,300 | | | $ | 2,726,572 | |
| | | | | | | | | | | | | | | | |
| | | | |
| Distributors: 0.67% | | | | | | | | | | | | | | | | |
LKQ Corporation† | | | | | | | | | | | 218,900 | | | | 5,520,658 | |
| | | | | | | | | | | | | | | | |
| | | | |
| Diversified Consumer Services: 0.58% | | | | | | | | | | | | | | | | |
Capella Education Company†« | | | | | | | | | | | 43,500 | | | | 2,157,600 | |
Matthews International Corporation | | | | | | | | | | | 65,800 | | | | 2,641,212 | |
| | | | |
| | | | | | | | | | | | | | | 4,798,812 | |
| | | | | | | | | | | | | | | | |
| | | | |
| Hotels, Restaurants & Leisure: 3.02% | | | | | | | | | | | | | | | | |
Ambassadors Group Incorporated(i) | | | | | | | | | | | 428,900 | | | | 4,323,312 | |
Bally Technologies Incorporated | | | | | | | | | | | 168,300 | | | | 6,562,017 | |
Home Inns & Hotels Management ADR†« | | | | | | | | | | | 45,900 | | | | 1,984,257 | |
Life Time Fitness Incorporated† | | | | | | | | | | | 64,200 | | | | 2,511,504 | |
Pinnacle Entertainment Incorporated†« | | | | | | | | | | | 333,900 | | | | 4,634,532 | |
Scientific Games Corporation Class A†« | | | | | | | | | | | 205,400 | | | | 2,160,808 | |
Wendy’s Arby’s Group Incorporated | | | | | | | | | | | 563,700 | | | | 2,717,034 | |
| | | | |
| | | | | | | | | | | | | | | 24,893,464 | |
| | | | | | | | | | | | | | | | |
| | | | |
| Household Durables: 1.60% | | | | | | | | | | | | | | | | |
American Greetings Corporation Class A« | | | | | | | | | | | 85,200 | | | | 2,095,920 | |
Harman International Industries Incorporated | | | | | | | | | | | 141,300 | | | | 6,857,289 | |
Jarden Corporation | | | | | | | | | | | 114,900 | | | | 4,181,211 | |
| | | | |
| | | | | | | | | | | | | | | 13,134,420 | |
| | | | | | | | | | | | | | | | |
| | | | |
| Media: 2.62% | | | | | | | | | | | | | | | | |
Arbitron Incorporated | | | | | | | | | | | 205,500 | | | | 7,948,740 | |
Clear Channel Outdoor Holdings Incorporated† | | | | | | | | | | | 384,300 | | | | 5,287,968 | |
DreamWorks Animation SKG Incorporated†« | | | | | | | | | | | 102,100 | | | | 2,704,629 | |
Lamar Advertising Company Class A† | | | | | | | | | | | 53,600 | | | | 1,743,072 | |
Meredith Corporation« | | | | | | | | | | | 58,600 | | | | 1,958,412 | |
Valassis Communications Incorporated† | | | | | | | | | | | 65,700 | | | | 1,897,429 | |
| | | | |
| | | | | | | | | | | | | | | 21,540,250 | |
| | | | | | | | | | | | | | | | |
| | | | |
| Specialty Retail: 3.59% | | | | | | | | | | | | | | | | |
Children’s Place Retail Stores Incorporated†« | | | | | | | | | | | 75,800 | | | | 4,030,286 | |
Citi Trends Incorporated† | | | | | | | | | | | 84,700 | | | | 1,885,422 | |
Collective Brands Incorporated†« | | | | | | | | | | | 231,200 | | | | 4,855,200 | |
Lithia Motors Incorporated Class A | | | | | | | | | | | 139,800 | | | | 2,542,962 | |
Men’s Wearhouse Incorporated« | | | | | | | | | | | 287,100 | | | | 8,007,219 | |
Rent-A-Center Incorporated | | | | | | | | | | | 268,800 | | | | 8,184,960 | |
| | | | |
| | | | | | | | | | | | | | | 29,506,049 | |
| | | | | | | | | | | | | | | | |
| | | | |
| Textiles, Apparel & Luxury Goods: 0.34% | | | | | | | | | | | | | | | | |
Volcom Incorporated« | | | | | | | | | | | 140,600 | | | | 2,774,038 | |
| | | | | | | | | | | | | | | | |
| | | | | | |
| Portfolio of Investments—April 30, 2011 (Unaudited) | | Wells Fargo Advantage Small and Mid Cap Stock Funds | | | 31 | |
SMALL CAP OPPORTUNITIES FUND
| | | | | | | | | | | | | | | | |
| Security Name | | | | | | | | Shares | | | Value | |
| | | | | | | | | | | | | | | | |
| | | | |
Consumer Staples: 1.63% | | | | | | | | | | | | | | | | |
| | | | |
| Food & Staples Retailing: 0.85% | | | | | | | | | | | | | | | | |
Nash Finch Company | | | | | | | | | | | 188,100 | | | $ | 7,001,082 | |
| | | | | | | | | | | | | | | | |
| | | | |
| Food Products: 0.78% | | | | | | | | | | | | | | | | |
Diamond Foods Incorporated« | | | | | | | | | | | 32,600 | | | | 2,138,560 | |
Sanderson Farms Incorporated« | | | | | | | | | | | 88,900 | | | | 4,231,640 | |
| | | | |
| | | | | | | | | | | | | | | 6,370,200 | |
| | | | | | | | | | | | | | | | |
| | | | |
Energy: 5.52% | | | | | | | | | | | | | | | | |
| | | | |
| Energy Equipment & Services: 2.83% | | | | | | | | | | | | | | | | |
Helix Energy Solutions Group Incorporated†« | | | | | | | | | | | 647,200 | | | | 12,251,496 | |
Ram Power Corporation | | | | | | | | | | | 1,080,900 | | | | 799,693 | |
Superior Energy Services Incorporated† | | | | | | | | | | | 265,900 | | | | 10,215,878 | |
| | | | |
| | | | | | | | | | | | | | | 23,267,067 | |
| | | | | | | | | | | | | | | | |
| | | | |
| Oil, Gas & Consumable Fuels: 2.69% | | | | | | | | | | | | | | | | |
Approach Resources Incorporated† | | | | | | | | | | | 103,200 | | | | 3,038,208 | |
Carrizo Oil & Gas Incorporated†« | | | | | | | | | | | 169,200 | | | | 6,740,928 | |
Penn Virginia Corporation« | | | | | | | | | | | 207,800 | | | | 3,212,588 | |
SM Energy Company | | | | | | | | | | | 120,300 | | | | 9,125,958 | |
| | | | |
| | | | | | | | | | | | | | | 22,117,682 | |
| | | | | | | | | | | | | | | | |
| | | | |
Financials: 13.55% | | | | | | | | | | | | | | | | |
| | | | |
| Capital Markets: 1.82% | | | | | | | | | | | | | | | | |
Apollo Global Management† | | | | | | | | | | | 287,300 | | | | 5,194,384 | |
Knight Capital Group Incorporated Class A†« | | | | | | | | | | | 315,800 | | | | 4,332,776 | |
Lazard Limited | | | | | | | | | | | 132,600 | | | | 5,436,600 | |
| | | | |
| | | | | | | | | | | | | | | 14,963,760 | |
| | | | | | | | | | | | | | | | |
| | | | |
| Commercial Banks: 3.98% | | | | | | | | | | | | | | | | |
Bank of Hawaii Corporation« | | | | | | | | | | | 50,300 | | | | 2,454,137 | |
CVB Financial Corporation | | | | | | | | | | | 389,810 | | | | 3,796,749 | |
IBERIABANK Corporation | | | | | | | | | | | 71,300 | | | | 4,278,713 | |
MB Financial Incorporated | | | | | | | | | | | 93,300 | | | | 1,930,377 | |
Old National Bancorp« | | | | | | | | | | | 260,100 | | | | 2,692,035 | |
Simmons First National Corporation | | | | | | | | | | | 126,000 | | | | 3,325,140 | |
SVB Financial Group†« | | | | | | | | | | | 100,100 | | | | 6,050,044 | |
Texas Capital Bancshares Incorporated†« | | | | | | | | | | | 126,100 | | | | 3,253,380 | |
Westamerica Bancorporation« | | | | | | | | | | | 97,300 | | | | 4,941,867 | |
| | | | |
| | | | | | | | | | | | | | | 32,722,442 | |
| | | | | | | | | | | | | | | | |
| | | | |
| Consumer Finance: 0.22% | | | | | | | | | | | | | | | | |
Cash America International Incorporated« | | | | | | | | | | | 38,700 | | | | 1,836,315 | |
| | | | | | | | | | | | | | | | |
| | | | |
| Diversified Financial Services: 0.45% | | | | | | | | | | | | | | | | |
Compass Diversified Holdings | | | | | | | | | | | 221,700 | | | | 3,715,692 | |
| | | | | | | | | | | | | | | | |
| | | | |
| 32 | | Wells Fargo Advantage Small and Mid Cap Stock Funds | | Portfolio of Investments—April 30, 2011 (Unaudited) |
SMALL CAP OPPORTUNITIES FUND
| | | | | | | | | | | | | | | | |
| Security Name | | | | | | | | Shares | | | Value | |
| | | | | | | | | | | | | | | | |
| | | | |
| Insurance: 2.45% | | | | | | | | | | | | | | | | |
Brown & Brown Incorporated | | | | | | | | | | | 134,100 | | | $ | 3,466,485 | |
Employers Holdings Incorporated« | | | | | | | | | | | 112,400 | | | | 2,265,984 | |
Infinity Property & Casualty Corporation | | | | | | | | | | | 34,200 | | | | 2,021,220 | |
Primerica Incorporated | | | | | | | | | | | 76,500 | | | | 1,768,680 | |
Reinsurance Group of America Incorporated | | | | | | | | | | | 97,200 | | | | 6,152,760 | |
RLI Corporation« | | | | | | | | | | | 46,500 | | | | 2,754,660 | |
Stancorp Financial Group Incorporated« | | | | | | | | | | | 39,800 | | | | 1,715,380 | |
| | | | |
| | | | | | | | | | | | | | | 20,145,169 | |
| | | | | | | | | | | | | | | | |
| | | | |
| Real Estate Investment Trusts (REITs): 3.16% | | | | | | | | | | | | | | | | |
Colonial Properties Trust | | | | | | | | | | | 194,700 | | | | 4,119,852 | |
Home Properties Incorporated« | | | | | | | | | | | 176,100 | | | | 11,164,740 | |
Investors Real Estate Trust« | | | | | | | | | | | 51,800 | | | | 487,438 | |
Pebblebrook Hotel Trust | | | | | | | | | | | 203,000 | | | | 4,354,350 | |
Redwood Trust Incorporated« | | | | | | | | | | | 290,900 | | | | 4,604,947 | |
Sabra Health Care REIT Incorporated | | | | | | | | | | | 76,100 | | | | 1,280,002 | |
| | | | |
| | | | | | | | | | | | | | | 26,011,329 | |
| | | | | | | | | | | | | | | | |
| | | | |
| Real Estate Management & Development: 0.41% | | | | | | | | | | | | | | | | |
Altisource Portfolio Solutions† | | | | | | | | | | | 104,700 | | | | 3,400,656 | |
| | | | | | | | | | | | | | | | |
| | | | |
| Thrifts & Mortgage Finance: 1.06% | | | | | | | | | | | | | | | | |
Ocwen Financial Corporation†« | | | | | | | | | | | 725,700 | | | | 8,686,629 | |
| | | | | | | | | | | | | | | | |
| | | | |
Health Care: 14.16% | | | | | | | | | | | | | | | | |
| | | | |
| Biotechnology: 1.37% | | | | | | | | | | | | | | | | |
Cepheid Incorporated†« | | | | | | | | | | | 100,900 | | | | 3,260,079 | |
Lexicon Genetics Incorporated†« | | | | | | | | | | | 1,028,600 | | | | 1,728,048 | |
Onyx Pharmaceuticals Incorporated† | | | | | | | | | | | 73,700 | | | | 2,768,909 | |
Seattle Genetics Incorporated†« | | | | | | | | | | | 213,400 | | | | 3,544,574 | |
| | | | |
| | | | | | | | | | | | | | | 11,301,610 | |
| | | | | | | | | | | | | | | | |
| | | | |
| Health Care Equipment & Supplies: 4.91% | | | | | | | | | | | | | | | | |
Cooper Companies Incorporated | | | | | | | | | | | 151,500 | | | | 11,347,350 | |
Haemonetics Corporation†« | | | | | | | | | | | 108,600 | | | | 7,623,720 | |
Masimo Corporation« | | | | | | | | | | | 223,900 | | | | 7,789,481 | |
Orthofix International NV† | | | | | | | | | | | 22,600 | | | | 769,982 | |
Sirona Dental Systems Incorporated† | | | | | | | | | | | 55,400 | | | | 3,161,678 | |
Volcano Corporation†« | | | | | | | | | | | 87,000 | | | | 2,319,420 | |
West Pharmaceutical Services Incorporated« | | | | | | | | | | | 155,900 | | | | 7,364,716 | |
| | | | |
| | | | | | | | | | | | | | | 40,376,347 | |
| | | | | | | | | | | | | | | | |
| | | | |
| Health Care Providers & Services: 6.14% | | | | | | | | | | | | | | | | |
Amedisys Incorporated†« | | | | | | | | | | | 53,800 | | | | 1,792,616 | |
AMERIGROUP Corporation†« | | | | | | | | | | | 111,100 | | | | 7,588,130 | |
Brookdale Senior Living Incorporated† | | | | | | | | | | | 190,400 | | | | 5,186,496 | |
Centene Corporation† | | | | | | | | | | | 218,800 | | | | 7,927,124 | |
Emergency Medical Services Corporation† | | | | | | | | | | | 124,200 | | | | 7,923,960 | |
HMS Holdings Corporation†« | | | | | | | | | | | 23,900 | | | | 1,881,169 | |
IPA The Hospitalist Company†« | | | | | | | | | | | 90,900 | | | | 4,714,074 | |
Kindred Healthcare Incorporated†« | | | | | | | | | | | 82,600 | | | | 2,083,172 | |
| | | | | | |
| Portfolio of Investments—April 30, 2011 (Unaudited) | | Wells Fargo Advantage Small and Mid Cap Stock Funds | | | 33 | |
SMALL CAP OPPORTUNITIES FUND
| | | | | | | | | | | | | | | | |
| Security Name | | | | | | | | Shares | | | Value | |
| | | | | | | | | | | | | | | | |
| | | | |
| Health Care Providers & Services (continued) | | | | | | | | | | | | | | | | |
RehabCare Group Incorporated† | | | | | | | | | | | 173,700 | | | $ | 6,525,909 | |
Team Health Holdings LLC† | | | | | | | | | | | 147,900 | | | | 2,940,252 | |
VCA Antech Incorporated†« | | | | | | | | | | | 77,900 | | | | 1,916,340 | |
| | | | |
| | | | | | | | | | | | | | | 50,479,242 | |
| | | | | | | | | | | | | | | | |
| | | | |
| Life Sciences Tools & Services: 1.04% | | | | | | | | | | | | | | | | |
Fluidigm Corporation†« | | | | | | | | | | | 46,300 | | | | 766,265 | |
Parexel International Corporation†« | | | | | | | | | | | 184,600 | | | | 5,124,496 | |
TECHNE Corporation | | | | | | | | | | | 34,200 | | | | 2,657,682 | |
| | | | |
| | | | | | | | | | | | | | | 8,548,443 | |
| | | | | | | | | | | | | | | | |
| | | | |
| Pharmaceuticals: 0.70% | | | | | | | | | | | | | | | | |
Medicis Pharmaceutical Corporation Class A | | | | | | | | | | | 57,100 | | | | 2,024,766 | |
Salix Pharmaceuticals Limited† | | | | | | | | | | | 95,300 | | | | 3,744,337 | |
| | | | |
| | | | | | | | | | | | | | | 5,769,103 | |
| | | | | | | | | | | | | | | | |
| | | | |
Industrials: 11.63% | | | | | | | | | | | | | | | | |
| | | | |
| Aerospace & Defense: 0.24% | | | | | | | | | | | | | | | | |
Kratos Defense & Security Solutions Incorporated† | | | | | | | | | | | 142,700 | | | | 1,950,709 | |
| | | | | | | | | | | | | | | | |
| | | | |
| Air Freight & Logistics: 0.34% | | | | | | | | | | | | | | | | |
Atlas Air Worldwide Holdings Incorporated† | | | | | | | | | | | 41,100 | | | | 2,832,201 | |
| | | | | | | | | | | | | | | | |
| | | | |
| Airlines: 0.70% | | | | | | | | | | | | | | | | |
Allegiant Travel Company« | | | | | | | | | | | 41,200 | | | | 1,848,644 | |
Hawaiian Holdings Incorporated† | | | | | | | | | | | 669,300 | | | | 3,915,405 | |
| | | | |
| | | | | | | | | | | | | | | 5,764,049 | |
| | | | | | | | | | | | | | | | |
| | | | |
| Commercial Services & Supplies: 4.39% | | | | | | | | | | | | | | | | |
FTI Consulting Incorporated†« | | | | | | | | | | | 152,100 | | | | 6,068,790 | |
Healthcare Services Group« | | | | | | | | | | | 240,300 | | | | 4,267,728 | |
IESI-BFC Limited | | | | | | | | | | | 261,800 | | | | 6,634,012 | |
Standard Parking Corporation†(i) | | | | | | | | | | | 290,861 | | | | 5,087,159 | |
Stantec Incorporated† | | | | | | | | | | | 111,894 | | | | 3,526,586 | |
Towers Watson & Company | | | | | | | | | | | 93,400 | | | | 5,357,424 | |
Waste Connections Incorporated | | | | | | | | | | | 168,425 | | | | 5,182,437 | |
| | | | |
| | | | | | | | | | | | | | | 36,124,136 | |
| | | | | | | | | | | | | | | | |
| | | | |
| Construction & Engineering: 1.91% | | | | | | | | | | | | | | | | |
Dycom Industries Incorporated | | | | | | | | | | | 235,000 | | | | 3,492,100 | |
Michael Baker Corporation†« | | | | | | | | | | | 69,900 | | | | 1,722,336 | |
Orion Marine Group Incorporated† | | | | | | | | | | | 192,600 | | | | 1,989,558 | |
Pike Electric Corporation†(i) | | | | | | | | | | | 449,100 | | | | 4,562,856 | |
Shaw Group Incorporated† | | | | | | | | | | | 101,800 | | | | 3,960,020 | |
| | | | |
| | | | | | | | | | | | | | | 15,726,870 | |
| | | | | | | | | | | | | | | | |
| | | | |
| Electrical Equipment: 0.95% | | | | | | | | | | | | | | | | |
GrafTech International Limited†« | | | | | | | | | | | 337,800 | | | | 7,836,960 | |
| | | | | | | | | | | | | | | | |
| | | | |
| 34 | | Wells Fargo Advantage Small and Mid Cap Stock Funds | | Portfolio of Investments—April 30, 2011 (Unaudited) |
SMALL CAP OPPORTUNITIES FUND
| | | | | | | | | | | | | | | | |
| Security Name | | | | | | | | Shares | | | Value | |
| | | | | | | | | | | | | | | | |
| | | | |
| Machinery: 2.26% | | | | | | | | | | | | | | | | |
Columbus Mckinnon Corporation†« | | | | | | | | | | | 84,000 | | | $ | 1,680,000 | |
Enpro Industries Incorporated†« | | | | | | | | | | | 174,100 | | | | 6,977,928 | |
ESCO Technologies Incorporated | | | | | | | | | | | 30,900 | | | | 1,133,412 | |
IDEX Corporation | | | | | | | | | | | 110,100 | | | | 5,165,892 | |
Wabash National Corporation†« | | | | | | | | | | | 327,600 | | | | 3,613,428 | |
| | | | |
| | | | | | | | | | | | | | | 18,570,660 | |
| | | | | | | | | | | | | | | | |
| | | | |
| Road & Rail: 0.24% | | | | | | | | | | | | | | | | |
Genesee & Wyoming Incorporated† | | | | | | | | | | | 32,100 | | | | 1,989,558 | |
| | | | | | | | | | | | | | | | |
| | | | |
| Trading Companies & Distributors: 0.60% | | | | | | | | | | | | | | | | |
Applied Industrial Technologies Incorporated | | | | | | | | | | | 139,800 | | | | 4,929,348 | |
| | | | | | | | | | | | | | | | |
| | | | |
Information Technology: 15.18% | | | | | | | | | | | | | | | | |
| | | | |
| Communications Equipment: 0.68% | | | | | | | | | | | | | | | | |
EXFO Incorporated† | | | | | | | | | | | 337,100 | | | | 3,172,111 | |
Mitel Networks Corporation†(i) | | | | | | | | | | | 464,694 | | | | 2,458,231 | |
| | | | |
| | | | | | | | | | | | | | | 5,630,342 | |
| | | | | | | | | | | | | | | | |
| | | | |
| Computers & Peripherals: 0.40% | | | | | | | | | | | | | | | | |
QLogic Corporation†« | | | | | | | | | | | 181,500 | | | | 3,263,370 | |
| | | | | | | | | | | | | | | | |
| | | | |
| Electronic Equipment & Instruments: 1.93% | | | | | | | | | | | | | | | | |
Aeroflex Holding Corporation† | | | | | | | | | | | 174,700 | | | | 3,092,190 | |
Methode Electronics Incorporated | | | | | | | | | | | 216,000 | | | | 2,669,760 | |
Power One Incorporated†« | | | | | | | | | | | 352,800 | | | | 2,914,128 | |
Rofin-Sinar Technologies Incorporated† | | | | | | | | | | | 100,300 | | | | 4,343,993 | |
ScanSource Incorporated« | | | | | | | | | | | 80,100 | | | | 2,865,177 | |
| | | | |
| | | | | | | | | | | | | | | 15,885,248 | |
| | | | | | | | | | | | | | | | |
| | | | |
| Internet Software & Services: 2.13% | | | | | | | | | | | | | | | | |
ComScore Incorporated†« | | | | | | | | | | | 238,300 | | | | 7,103,723 | |
Digital River Incorporated† | | | | | | | | | | | 202,400 | | | | 6,586,096 | |
Monster Worldwide Incorporated†« | | | | | | | | | | | 235,200 | | | | 3,859,632 | |
| | | | |
| | | | | | | | | | | | | | | 17,549,451 | |
| | | | | | | | | | | | | | | | |
| | | | |
| IT Services: 1.74% | | | | | | | | | | | | | | | | |
Forrester Research Incorporated | | | | | | | | | | | 195,000 | | | | 7,704,450 | |
Gartner Incorporated† | | | | | | | | | | | 45,600 | | | | 1,956,696 | |
Genpact Limited† | | | | | | | | | | | 125,300 | | | | 2,016,077 | |
TNS Incorporated† | | | | | | | | | | | 158,145 | | | | 2,598,322 | |
| | | | |
| | | | | | | | | | | | | | | 14,275,545 | |
| | | | | | | | | | | | | | | | |
| | | | |
| Semiconductors & Semiconductor Equipment: 2.92% | | | | | | | | | | | | | | | | |
Anadigics Incorporated† | | | | | | | | | | | 432,700 | | | | 1,691,857 | |
Atmel Corporation† | | | | | | | | | | | 388,300 | | | | 5,940,990 | |
FEI Company† | | | | | | | | | | | 102,100 | | | | 3,314,166 | |
Integrated Device Technology Incorporated† | | | | | | | | | | | 874,400 | | | | 7,113,244 | |
Standard Microsystems Corporation† | | | | | | | | | | | 220,300 | | | | 5,981,145 | |
| | | | |
| | | | | | | | | | | | | | | 24,041,402 | |
| | | | | | | | | | | | | | | | |
| | | | | | |
| Portfolio of Investments—April 30, 2011 (Unaudited) | | Wells Fargo Advantage Small and Mid Cap Stock Funds | | | 35 | |
SMALL CAP OPPORTUNITIES FUND
| | | | | | | | | | | | | | | | |
| Security Name | | | | | | | | Shares | | | Value | |
| | | | | | | | | | | | | | | | |
| | | | |
| Software: 5.38% | | | | | | | | | | | | | | | | |
Ariba Incorporated†« | | | | | | | | | | | 152,300 | | | $ | 5,295,471 | |
Cadence Design Systems Incorporated†« | | | | | | | | | | | 563,300 | | | | 5,847,054 | |
Informatica Corporation† | | | | | | | | | | | 38,300 | | | | 2,145,183 | |
Kenexa Corporation†« | | | | | | | | | | | 254,100 | | | | 7,475,622 | |
Netscout Systems Incorporated† | | | | | | | | | | | 332,600 | | | | 8,511,234 | |
Parametric Technology Corporation† | | | | | | | | | | | 418,800 | | | | 10,164,276 | |
Progress Software Corporation† | | | | | | | | | | | 41,850 | | | | 1,240,853 | |
Websense Incorporated† | | | | | | | | | | | 138,500 | | | | 3,571,915 | |
| | | | |
| | | | | | | | | | | | | | | 44,251,608 | |
| | | | | | | | | | | | | | | | |
| | | | |
Materials: 7.54% | | | | | | | | | | | | | | | | |
| | | | |
| Chemicals: 3.23% | | | | | | | | | | | | | | | | |
Cabot Corporation | | | | | | | | | | | 167,000 | | | | 7,489,950 | |
Cytec Industries Incorporated | | | | | | | | | | | 58,200 | | | | 3,415,176 | |
Innophos Holdings Incorporated | | | | | | | | | | | 154,100 | | | | 7,140,994 | |
Olin Corporation | | | | | | | | | | | 184,200 | | | | 4,741,308 | |
STR Holdings Incorporated†« | | | | | | | | | | | 227,900 | | | | 3,753,513 | |
| | | | |
| | | | | | | | | | | | | | | 26,540,941 | |
| | | | | | | | | | | | | | | | |
| | | | |
| Containers & Packaging: 0.58% | | | | | | | | | | | | | | | | |
Graham Packaging Corporation†« | | | | | | | | | | | 208,300 | | | | 4,790,900 | |
| | | | | | | | | | | | | | | | |
| | | | |
| Metals & Mining: 2.72% | | | | | | | | | | | | | | | | |
AMCOL International Corporation« | | | | | | | | | | | 174,200 | | | | 6,483,724 | |
Jaguar Mining Incorporated†« | | | | | | | | | | | 267,500 | | | | 1,495,325 | |
Kaiser Aluminum Corporation« | | | | | | | | | | | 65,400 | | | | 3,277,194 | |
Stillwater Mining Company | | | | | | | | | | | 297,200 | | | | 6,779,132 | |
Taseko Mines Limited† | | | | | | | | | | | 825,000 | | | | 4,353,641 | |
| | | | |
| | | | | | | | | | | | | | | 22,389,016 | |
| | | | | | | | | | | | | | | | |
| | | | |
| Paper & Forest Products: 1.01% | | | | | | | | | | | | | | | | |
Kapstone Paper & Packaging Corporation† | | | | | | | | | | | 479,500 | | | | 8,333,710 | |
| | | | | | | | | | | | | | | | |
| | | | |
Telecommunication Services: 1.12% | | | | | | | | | | | | | | | | |
| | | | |
| Diversified Telecommunication Services: 1.12% | | | | | | | | | | | | | | | | |
AboveNet Incorporated | | | | | | | | | | | 138,500 | | | | 9,244,875 | |
| | | | | | | | | | | | | | | | |
| | | | |
Utilities: 2.92% | | | | | | | | | | | | | | | | |
| | | | |
| Electric Utilities: 2.13% | | | | | | | | | | | | | | | | |
Cleco Corporation« | | | | | | | | | | | 279,000 | | | | 9,792,900 | |
UniSource Energy Corporation« | | | | | | | | | | | 209,200 | | | | 7,767,598 | |
| | | | |
| | | | | | | | | | | | | | | 17,560,498 | |
| | | | | | | | | | | | | | | | |
| | | | |
| Multi-Utilities: 0.79% | | | | | | | | | | | | | | | | |
Northwestern Corporation | | | | | | | | | | | 198,300 | | | | 6,454,665 | |
| | | | | | | | | | | | | | | | |
| | | | |
Total Common Stocks (Cost $543,217,614) | | | | | | | | | | | | | | | 707,543,093 | |
| | | | | | | | | | | | | | | | |
| | | | |
| 36 | | Wells Fargo Advantage Small and Mid Cap Stock Funds | | Portfolio of Investments—April 30, 2011 (Unaudited) |
SMALL CAP OPPORTUNITIES FUND
| | | | | | | | | | | | | | | | |
| Security Name | | | | | | | | Shares | | | Value | |
| | | | | | | | | | | | | | | | |
| | | | |
Investment Companies: 2.93% | | | | | | | | | | | | | | | | |
iShares Russell 2000 Index ETF« | | | | | | | | | | | 279,100 | | | $ | 24,105,867 | |
| | | | |
Total Investment Companies (Cost $22,406,188) | | | | | | | | | | | | | | | 24,105,867 | |
| | | | | | | | | | | | | | | | |
| | | | |
| | | Interest Rate | | | Maturity Date | | | Principal | | | | |
| | | | |
Short-Term Investments: 31.15% | | | | | | | | | | | | | | | | |
| | | | |
| Corporate Bonds and Notes: 0.37% | | | | | | | | | | | | | | | | |
Gryphon Funding Limited(a)(i)(v) | | | 0.00 | % | | | 08/05/2011 | | | $ | 3,220,049 | | | | 1,899,829 | |
VFNC Corporation(a)††(i)(v)± | | | 0.25 | | | | 09/29/2011 | | | | 2,670,048 | | | | 1,149,722 | |
| | | | |
| | | | | | | | | | | | | | | 3,049,551 | |
| | | | | | | | | | | | | | | | |
| | | | |
| | | Yield | | | | | | Shares | | | | |
| | | | |
| Investment Companies: 30.78% | | | | | | | | | | | | | | | | |
Wells Fargo Advantage Cash Investment Money Market Fund(l)(u) | | | 0.09 | | | | | | | | 92,799,933 | | | | 92,799,933 | |
Wells Fargo Securities Lending Cash Investments, LLC(v)(l)(u) | | | 0.20 | | | | | | | | 160,472,968 | | | | 160,472,968 | |
| | | | |
| | | | | | | | | | | | | | | 253,272,901 | |
| | | | | | | | | | | | | | | | |
| | | | |
Total Short-Term Investments (Cost $254,788,021) | | | | | | | | | | | | | | | 256,322,452 | |
| | | | | | | | | | | | | | | | |
| | | | | | | | |
Total Investments in Securities
(Cost $820,411,823)* | | | 120.08 | % | | | 987,971,412 | |
Other Assets and Liabilities, Net | | | (20.08 | ) | | | (165,197,721 | ) |
| | | | | | | | |
| Total Net Assets | | | 100.00 | % | | $ | 822,773,691 | |
| | | | | | | | |
| † | Non-income earning security. |
| « | All or a portion of this security is on loan. |
| (a) | Security is fair valued by the Management Valuation Team, and in certain instances by the Board of Trustees, in accordance with procedures approved by the Board of Trustees. |
| †† | Securities that may be resold to “qualified institutional buyers” under Rule 144A or securities offered pursuant to Section 4(2) of the Securities Act of 1933, as amended. |
| (v) | Security represents investment of cash collateral received from securities on loan. |
| (l) | Investment in an affiliate. |
| (u) | Rate shown is the 7-day annualized yield at period end. |
| ± | Variable rate investments. |
| * | Cost for federal income tax purposes is $824,140,813 and net unrealized appreciation (depreciation) consists of: |
| | | | |
Gross unrealized appreciation | | $ | 182,061,012 | |
Gross unrealized depreciation | | | (18,230,413 | ) |
| | | | |
Net unrealized appreciation | | $ | 163,830,599 | |
The accompanying notes are an integral part of these financial statements.
| | | | | | |
| Portfolio of Investments—April 30, 2011 (Unaudited) | | Wells Fargo Advantage Small and Mid Cap Stock Funds | | | 37 | |
SMALL CAP VALUE FUND
| | | | | | | | | | | | | | | | |
| Security Name | | | | | | | | Shares | | | Value | |
| | | | | | | | | | | | | | | | |
| | | | |
Common Stocks: 91.98% | | | | | | | | | | | | | | | | |
| | | | |
Consumer Discretionary: 5.63% | | | | | | | | | | | | | | | | |
| | | | |
| Diversified Consumer Services: 0.36% | | | | | | | | | | | | | | | | |
Cambium Learning Group Incorporated† | | | | | | | | | | | 1,345,400 | | | $ | 4,628,176 | |
Corinthian Colleges Incorporated† | | | | | | | | | | | 2,654,100 | | | | 11,810,745 | |
Voyager Expanded Learning Corporation(a)(i) | | | | | | | | | | | 1,649,100 | | | | 2 | |
| | | | |
| | | | | | | | | | | | | | | 16,438,923 | |
| | | | | | | | | | | | | | | | |
| | | | |
| Hotels, Restaurants & Leisure: 1.33% | | | | | | | | | | | | | | | | |
Denny’s Corporation† | | | | | | | | | | | 2,595,400 | | | | 10,615,186 | |
Scientific Games Corporation Class A† | | | | | | | | | | | 2,291,400 | | | | 24,105,528 | |
Wendy’s Arby’s Group Incorporated | | | | | | | | | | | 5,416,000 | | | | 26,105,120 | |
| | | | |
| | | | | | | | | | | | | | | 60,825,834 | |
| | | | | | | | | | | | | | | | |
| | | | |
| Household Durables: 0.80% | | | | | | | | | | | | | | | | |
Cavco Industries Incorporated**†(l) | | | | | | | | | | | 360,000 | | | | 16,732,800 | |
KB Home Incorporated | | | | | | | | | | | 644,400 | | | | 7,610,364 | |
Skyline Corporation**(l) | | | | | | | | | | | 638,700 | | | | 12,524,907 | |
| | | | |
| | | | | | | | | | | | | | | 36,868,071 | |
| | | | | | | | | | | | | | | | |
| | | | |
| Internet & Catalog Retail: 0.07% | | | | | | | | | | | | | | | | |
dELiA*s Incorporated**†(l) | | | | | | | | | | | 1,862,800 | | | | 3,297,156 | |
| | | | | | | | | | | | | | | | |
| | | | |
| Media: 0.59% | | | | | | | | | | | | | | | | |
Discovery Communications Incorporated† | | | | | | | | | | | 683,500 | | | | 26,970,910 | |
| | | | | | | | | | | | | | | | |
| | | | |
| Multiline Retail: 0.20% | | | | | | | | | | | | | | | | |
Saks Incorporated† | | | | | | | | | | | 756,267 | | | | 9,044,953 | |
| | | | | | | | | | | | | | | | |
| | | | |
| Specialty Retail: 2.28% | | | | | | | | | | | | | | | | |
Collective Brands Incorporated† | | | | | | | | | | | 2,299,000 | | | | 48,279,000 | |
Foot Locker Incorporated# | | | | | | | | | | | 402,500 | | | | 8,661,800 | |
GameStop Corporation Class A† | | | | | | | | | | | 437,700 | | | | 11,240,136 | |
rue21 Incorporated† | | | | | | | | | | | 336,400 | | | | 10,132,368 | |
Talbots Incorporated† | | | | | | | | | | | 2,528,700 | | | | 13,604,406 | |
Vitamin Shoppe Incorporated† | | | | | | | | | | | 323,300 | | | | 12,615,166 | |
| | | | |
| | | | | | | | | | | | | | | 104,532,876 | |
| | | | | | | | | | | | | | | | |
| | | | |
Consumer Staples: 0.60% | | | | | | | | | | | | | | | | |
| | | | |
| Personal Products: 0.60% | | | | | | | | | | | | | | | | |
Prestige Brands Holdings Incorporated† | | | | | | | | | | | 2,362,900 | | | | 27,291,495 | |
| | | | | | | | | | | | | | | | |
| | | | |
Energy: 24.95% | | | | | | | | | | | | | | | | |
| | | | |
| Energy Equipment & Services: 10.40% | | | | | | | | | | | | | | | | |
Global Industries Limited**†(l)# | | | | | | | | | | | 6,920,600 | | | | 68,237,116 | |
Helix Energy Solutions Group Incorporated† | | | | | | | | | | | 1,232,100 | | | | 23,323,653 | |
Helmerich & Payne Incorporated# | | | | | | | | | | | 866,300 | | | | 57,470,342 | |
ION Geophysical Corporation† | | | | | | | | | | | 6,513,600 | | | | 82,331,904 | |
Key Energy Services Incorporated†# | | | | | | | | | | | 2,634,100 | | | | 47,940,620 | |
Newpark Resources Incorporated**†(l) | | | | | | | | | | | 7,371,000 | | | | 66,560,130 | |
| | | | |
| 38 | | Wells Fargo Advantage Small and Mid Cap Stock Funds | | Portfolio of Investments—April 30, 2011 (Unaudited) |
SMALL CAP VALUE FUND
| | | | | | | | | | | | | | | | |
| Security Name | | | | | | | | Shares | | | Value | |
| | | | | | | | | | | | | | | | |
| | | | |
| Energy Equipment & Services (continued) | | | | | | | | | | | | | | | | |
Oceaneering International Incorporated†# | | | | | | | | | | | 540,900 | | | $ | 47,285,478 | |
Parker Drilling Company† | | | | | | | | | | | 2,199,900 | | | | 15,685,287 | |
PHI Incorporated (non-voting)**†(l) | | | | | | | | | | | 833,800 | | | | 18,660,444 | |
PHI Incorporated (voting)† | | | | | | | | | | | 126,792 | | | | 2,770,405 | |
Pride International Incorporated†# | | | | | | | | | | | 401,400 | | | | 17,625,474 | |
Vantage Drilling Company† | | | | | | | | | | | 3,548,800 | | | | 6,316,864 | |
Willbros Group Incorporated† | | | | | | | | | | | 2,046,000 | | | | 21,994,500 | |
| | | | |
| | | | | | | | | | | | | | | 476,202,217 | |
| | | | | | | | | | | | | | | | |
| | | | |
| Oil, Gas & Consumable Fuels: 14.55% | | | | | | | | | | | | | | | | |
Forest Oil Corporation† | | | | | | | | | | | 1,000,300 | | | | 35,920,773 | |
InterOil Corporation**†(l)# | | | | | | | | | | | 4,279,600 | | | | 272,182,560 | |
McMoRan Exploration Company† | | | | | | | | | | | 6,496,300 | | | | 118,947,253 | |
Newfield Exploration Company†# | | | | | | | | | | | 246,200 | | | | 17,430,960 | |
Petrohawk Energy Corporation | | | | | | | | | | | 862,500 | | | | 23,296,125 | |
PetroQuest Energy Incorporated† | | | | | | | | | | | 905,300 | | | | 7,930,428 | |
Pioneer Natural Resources Company | | | | | | | | | | | 145,200 | | | | 14,843,796 | |
Plains Exploration & Product Company† | | | | | | | | | | | 286,600 | | | | 10,902,264 | |
Range Resources Corporation | | | | | | | | | | | 1,968,800 | | | | 111,138,760 | |
Trilogy Energy Corporation | | | | | | | | | | | 2,209,400 | | | | 53,218,016 | |
| | | | |
| | | | | | | | | | | | | | | 665,810,935 | |
| | | | | | | | | | | | | | | | |
| | | | |
Financials: 17.10% | | | | | | | | | | | | | | | | |
| | | | |
| Commercial Banks: 3.86% | | | | | | | | | | | | | | | | |
Ameris Bancorp | | | | | | | | | | | 336,600 | | | | 3,345,804 | |
Associated Banc-Corporation | | | | | | | | | | | 652,100 | | | | 9,520,660 | |
Bancorp Incorporated† | | | | | | | | | | | 1,337,955 | | | | 13,098,579 | |
Center Financial Corporation† | | | | | | | | | | | 1,546,719 | | | | 11,275,582 | |
CenterState Banks Incorporated | | | | | | | | | | | 1,265,950 | | | | 7,874,209 | |
City National Corporation | | | | | | | | | | | 433,600 | | | | 24,762,896 | |
First Horizon National Corporation | | | | | | | | | | | 1,198,000 | | | | 13,118,100 | |
IBERIABANK Corporation | | | | | | | | | | | 445,396 | | | | 26,728,214 | |
Park Sterling Corporation† | | | | | | | | | | | 985,600 | | | | 4,706,240 | |
Sandy Spring Bancorp Incorporated | | | | | | | | | | | 363,100 | | | | 6,488,597 | |
SVB Financial Group† | | | | | | | | | | | 276,900 | | | | 16,735,836 | |
Western Liberty Bancorp**†(l) | | | | | | | | | | | 815,562 | | | | 3,042,046 | |
Whitney Holding Corporation | | | | | | | | | | | 2,239,900 | | | | 30,328,246 | |
Wilmington Trust Corporation | | | | | | | | | | | 1,239,500 | | | | 5,590,145 | |
| | | | |
| | | | | | | | | | | | | | | 176,615,154 | |
| | | | | | | | | | | | | | | | |
| | | | |
| Diversified Financial Services: 0.23% | | | | | | | | | | | | | | | | |
NBH Holdings Corporation(a)†† | | | | | | | | | | | 597,606 | | | | 10,637,387 | |
| | | | | | | | | | | | | | | | |
| | | | |
| Insurance: 2.31% | | | | | | | | | | | | | | | | |
Argo Group International Holdings Limited**(l) | | | | | | | | | | | 1,801,500 | | | | 56,585,115 | |
Hilltop Holdings Incorporated† | | | | | | | | | | | 1,768,900 | | | | 17,158,330 | |
Mercury General Corporation | | | | | | | | | | | 514,208 | | | | 20,434,626 | |
OneBeacon Insurance Group Limited | | | | | | | | | | | 835,700 | | | | 11,741,585 | |
| | | | |
| | | | | | | | | | | | | | | 105,919,656 | |
| | | | | | | | | | | | | | | | |
| | | | | | |
| Portfolio of Investments—April 30, 2011 (Unaudited) | | Wells Fargo Advantage Small and Mid Cap Stock Funds | | | 39 | |
SMALL CAP VALUE FUND
| | | | | | | | | | | | | | | | |
| Security Name | | | | | | | | Shares | | | Value | |
| | | | | | | | | | | | | | | | |
| | | | |
| Real Estate Investment Trusts (REITs): 10.34% | | | | | | | | | | | | | | | | |
Anworth Mortgage Asset Corporation | | | | | | | | | | | 2,951,400 | | | $ | 21,191,052 | |
Armour Residential Incorporated**(l) | | | | | | | | | | | 327,688 | | | | 2,434,722 | |
Capstead Mortgage Corporation**(l) | | | | | | | | | | | 4,242,300 | | | | 56,168,052 | |
Chimera Investment Corporation | | | | | | | | | | | 38,976,000 | | | | 157,852,800 | |
Crexus Investment Corporation**(l) | | | | | | | | | | | 4,207,900 | | | | 49,064,114 | |
Hatteras Financial Corporation | | | | | | | | | | | 1,113,300 | | | | 31,628,853 | |
Invesco Mortgage Capital | | | | | | | | | | | 2,520,600 | | | | 57,318,444 | |
MFA Mortgage Investments Incorporated | | | | | | | | | | | 5,278,300 | | | | 42,120,834 | |
Redwood Trust Incorporated | | | | | | | | | | | 1,733,600 | | | | 27,442,888 | |
Sun Communities Incorporated | | | | | | | | | | | 735,881 | | | | 28,316,701 | |
| | | | |
| | | | | | | | | | | | | | | 473,538,460 | |
| | | | | | | | | | | | | | | | |
| | | | |
| Thrifts & Mortgage Finance: 0.36% | | | | | | | | | | | | | | | | |
First Niagara Financial Group Incorporated | | | | | | | | | | | 760,100 | | | | 10,945,440 | |
Northwest Bancshares Incorporated | | | | | | | | | | | 419,500 | | | | 5,281,505 | |
| | | | |
| | | | | | | | | | | | | | | 16,226,945 | |
| | | | | | | | | | | | | | | | |
| | | | |
Health Care: 7.54% | | | | | | | | | | | | | | | | |
| | | | |
| Health Care Equipment & Supplies: 3.24% | | | | | | | | | | | | | | | | |
Gen-Probe Incorporated†# | | | | | | | | | | | 204,129 | | | | 16,926,377 | |
Hologic Incorporated†# | | | | | | | | | | | 871,600 | | | | 19,192,632 | |
Invacare Corporation | | | | | | | | | | | 251,600 | | | | 8,277,640 | |
Orasure Technologies Incorporated**†(l)# | | | | | | | | | | | 5,537,000 | | | | 48,780,970 | |
Steris Corporation# | | | | | | | | | | | 385,400 | | | | 13,889,816 | |
Symmetry Medical Incorporated† | | | | | | | | | | | 1,144,400 | | | | 11,386,780 | |
Thoratec Corporation† | | | | | | | | | | | 435,100 | | | | 13,357,570 | |
Varian Medical Systems Incorporated† | | | | | | | | | | | 232,900 | | | | 16,349,580 | |
| | | | |
| | | | | | | | | | | | | | | 148,161,365 | |
| | | | | | | | | | | | | | | | |
| | | | |
| Health Care Providers & Services: 2.70% | | | | | | | | | | | | | | | | |
Amedisys Incorporated†# | | | | | | | | | | | 1,044,300 | | | | 34,796,076 | |
Community Health Systems Incorporated†# | | | | | | | | | | | 469,900 | | | | 14,440,027 | |
Cross Country Healthcare Incorporated**†(l) | | | | | | | | | | | 2,330,100 | | | | 17,289,342 | |
Gentiva Health Services Incorporated† | | | | | | | | | | | 1,395,300 | | | | 39,068,400 | |
Healthways Incorporated† | | | | | | | | | | | 552,400 | | | | 9,346,608 | |
Omnicare Incorporated# | | | | | | | | | | | 274,500 | | | | 8,624,790 | |
| | | | |
| | | | | | | | | | | | | | | 123,565,243 | |
| | | | | | | | | | | | | | | | |
| | | | |
| Health Care Technology: 0.22% | | | | | | | | | | | | | | | | |
Medidata Solutions Incorporated† | | | | | | | | | | | 392,900 | | | | 10,085,743 | |
| | | | | | | | | | | | | | | | |
| | | | |
| Life Sciences Tools & Services: 1.38% | | | | | | | | | | | | | | | | |
Accelrys Incorporated† | | | | | | | | | | | 1,760,500 | | | | 13,326,985 | |
Life Technologies Corporation† | | | | | | | | | | | 234,900 | | | | 12,966,480 | |
Nordion Incorporated | | | | | | | | | | | 1,409,300 | | | | 16,516,996 | |
Parexel International Corporation† | | | | | | | | | | | 735,300 | | | | 20,411,928 | |
| | | | |
| | | | | | | | | | | | | | | 63,222,389 | |
| | | | | | | | | | | | | | | | |
| | | | |
| 40 | | Wells Fargo Advantage Small and Mid Cap Stock Funds | | Portfolio of Investments—April 30, 2011 (Unaudited) |
SMALL CAP VALUE FUND
| | | | | | | | | | | | | | | | |
| Security Name | | | | | | | | Shares | | | Value | |
| | | | | | | | | | | | | | | | |
| | | | |
Industrials: 12.24% | | | | | | | | | | | | | | | | |
| | | | |
| Aerospace & Defense: 0.02% | | | | | | | | | | | | | | | | |
Ascent Solar Technologies Incorporated† | | | | | | | | | | | 453,600 | | | $ | 730,296 | |
| | | | | | | | | | | | | | | | |
| | | | |
| Airlines: 4.01% | | | | | | | | | | | | | | | | |
Alaska Air Group Incorporated†# | | | | | | | | | | | 656,300 | | | | 43,230,481 | |
Delta Air Lines Incorporated† | | | | | | | | | | | 4,361,200 | | | | 45,269,256 | |
LAN Airlines SA ADR | | | | | | | | | | | 391,600 | | | | 10,941,304 | |
United Continental Holdings Incorporated† | | | | | | | | | | | 3,684,100 | | | | 84,071,162 | |
| | | | |
| | | | | | | | | | | | | | | 183,512,203 | |
| | | | | | | | | | | | | | | | |
| | | | |
| Commercial Services & Supplies: 4.17% | | | | | | | | | | | | | | | | |
ABM Industries Incorporated | | | | | | | | | | | 1,857,500 | | | | 45,174,400 | |
ACCO Brands Corporation**†(l) | | | | | | | | | | | 2,904,100 | | | | 28,198,811 | |
GEO Group Incorporated | | | | | | | | | | | 2,432,600 | | | | 64,901,768 | |
Healthcare Services Group | | | | | | | | | | | 1,145,700 | | | | 20,347,632 | |
Hill International Incorporated**†(l) | | | | | | | | | | | 2,413,839 | | | | 12,238,164 | |
Kforce Incorporated† | | | | | | | | | | | 516,400 | | | | 8,081,660 | |
Verisk Analytics Incorporated Class A† | | | | | | | | | | | 365,800 | | | | 12,034,820 | |
| | | | |
| | | | | | | | | | | | | | | 190,977,255 | |
| | | | | | | | | | | | | | | | |
| | | | |
| Construction & Engineering: 2.53% | | | | | | | | | | | | | | | | |
Chicago Bridge & Iron Company NV# | | | | | | | | | | | 2,606,700 | | | | 105,675,618 | |
Primoris Services Corporation | | | | | | | | | | | 854,700 | | | | 10,068,366 | |
| | | | |
| | | | | | | | | | | | | | | 115,743,984 | |
| | | | | | | | | | | | | | | | |
| | | | |
| Electrical Equipment: 0.94% | | | | | | | | | | | | | | | | |
GrafTech International Limited† | | | | | | | | | | | 1,848,100 | | | | 42,875,920 | |
| | | | | | | | | | | | | | | | |
| | | | |
| Road & Rail: 0.27% | | | | | | | | | | | | | | | | |
Covenant Transport Incorporated Class A**†(l) | | | | | | | | | | | 1,320,000 | | | | 12,592,800 | |
| | | | | | | | | | | | | | | | |
| | | | |
| Trading Companies & Distributors: 0.30% | | | | | | | | | | | | | | | | |
Air Lease Corporation† | | | | | | | | | | | 178,908 | | | | 4,937,861 | |
Applied Industrial Technologies Incorporated# | | | | | | | | | | | 254,100 | | | | 8,959,566 | |
| | | | |
| | | | | | | | | | | | | | | 13,897,427 | |
| | | | | | | | | | | | | | | | |
| | | | |
Information Technology: 8.14% | | | | | | | | | | | | | | | | |
| | | | |
| Communications Equipment: 2.08% | | | | | | | | | | | | | | | | |
Brocade Communications Systems Incorporated† | | | | | | | | | | | 4,502,600 | | | | 28,141,250 | |
China GrenTech Corporation Limited ADR**†(l) | | | | | | | | | | | 2,120,000 | | | | 6,423,600 | |
Harmonic Incorporated† | | | | | | | | | | | 2,634,800 | | | | 21,816,144 | |
InterDigital Incorporated | | | | | | | | | | | 402,700 | | | | 18,640,983 | |
MRV Communications Incorporated**†(l) | | | | | | | | | | | 13,386,300 | | | | 20,481,039 | |
| | | | |
| | | | | | | | | | | | | | | 95,503,016 | |
| | | | | | | | | | | | | | | | |
| | | | |
| Computers & Peripherals: 1.76% | | | | | | | | | | | | | | | | |
Cray Incorporated**†(l) | | | | | | | | | | | 4,055,700 | | | | 27,254,304 | |
Intermec Incorporated**†(l) | | | | | | | | | | | 3,523,900 | | | | 40,454,372 | |
Quantum Corporation† | | | | | | | | | | | 4,043,300 | | | | 12,857,694 | |
| | | | |
| | | | | | | | | | | | | | | 80,566,370 | |
| | | | | | | | | | | | | | | | |
| | | | | | |
| Portfolio of Investments—April 30, 2011 (Unaudited) | | Wells Fargo Advantage Small and Mid Cap Stock Funds | | | 41 | |
SMALL CAP VALUE FUND
| | | | | | | | | | | | | | | | |
| Security Name | | | | | | | | Shares | | | Value | |
| | | | | | | | | | | | | | | | |
| | | | |
| Electronic Equipment & Instruments: 3.86% | | | | | | | | | | | | | | | | |
Checkpoint Systems Incorporated† | | | | | | | | | | | 636,600 | | | $ | 13,406,796 | |
Cognex Corporation | | | | | | | | | | | 886,200 | | | | 27,720,336 | |
Coherent Incorporated†# | | | | | | | | | | | 903,100 | | | | 56,452,781 | |
Itron Incorporated†# | | | | | | | | | | | 153,000 | | | | 8,327,790 | |
OSI Systems Incorporated**†(l) | | | | | | | | | | | 1,042,800 | | | | 40,033,092 | |
Power One Incorporated† | | | | | | | | | | | 3,715,300 | | | | 30,688,378 | |
| | | | |
| | | | | | | | | | | | | | | 176,629,173 | |
| | | | | | | | | | | | | | | | |
| | | | |
| Internet Software & Services: 0.34% | | | | | | | | | | | | | | | | |
Monster Worldwide Incorporated† | | | | | | | | | | | 937,900 | | | | 15,390,939 | |
| | | | | | | | | | | | | | | | |
| | | | |
| Office Electronics: 0.10% | | | | | | | | | | | | | | | | |
Zebra Technologies Corporation† | | | | | | | | | | | 119,400 | | | | 4,691,226 | |
| | | | | | | | | | | | | | | | |
| | | | |
Materials: 15.12% | | | | | | | | | | | | | | | | |
| | | | |
| Chemicals: 0.52% | | | | | | | | | | | | | | | | |
Calgon Carbon Corporation†# | | | | | | | | | | | 1,379,600 | | | | 23,673,936 | |
| | | | | | | | | | | | | | | | |
| | | | |
| Containers & Packaging: 0.25% | | | | | | | | | | | | | | | | |
Intertape Polymer Group Incorporated**†(l) | | | | | | | | | | | 7,509,224 | | | | 11,714,389 | |
| | | | | | | | | | | | | | | | |
| | | | |
| Metals & Mining: 14.09% | | | | | | | | | | | | | | | | |
Agnico-Eagle Mines Limited# | | | | | | | | | | | 757,900 | | | | 52,734,682 | |
Carpenter Technology Corporation# | | | | | | | | | | | 1,095,297 | | | | 56,144,924 | |
Eldorado Gold Corporation | | | | | | | | | | | 1,576,800 | | | | 29,296,944 | |
Great Basin Gold Limited† | | | | | | | | | | | 4,518,500 | | | | 12,019,210 | |
Harry Winston Diamond Corporation† | | | | | | | | | | | 561,000 | | | | 9,570,660 | |
Jaguar Mining Incorporated† | | | | | | | | | | | 3,784,600 | | | | 21,155,914 | |
Petaquilla Minerals Limited† | | | | | | | | | | | 2,160,400 | | | | 2,009,172 | |
Randgold Resources Limited ADR# | | | | | | | | | | | 3,253,700 | | | | 281,672,809 | |
Royal Gold Incorporated# | | | | | | | | | | | 778,189 | | | | 47,453,965 | |
Sandstorm Gold Limited†(i) | | | | | | | | | | | 12,409,548 | | | | 13,771,628 | |
Silver Standard Resources Incorporated† | | | | | | | | | | | 717,100 | | | | 24,912,054 | |
Steel Dynamics Incorporated | | | | | | | | | | | 2,365,300 | | | | 43,024,807 | |
United States Steel Corporation# | | | | | | | | | | | 458,000 | | | | 21,851,180 | |
Webco Industries Incorporated**†(a)(l)(i) | | | | | | | | | | | 89,257 | | | | 9,818,270 | |
Yamana Gold Incorporated | | | | | | | | | | | 1,543,000 | | | | 19,611,530 | |
| | | | |
| | | | | | | | | | | | | | | 645,047,749 | |
| | | | | | | | | | | | | | | | |
| | | | |
| Paper & Forest Products: 0.26% | | | | | | | | | | | | | | | | |
Wausau Paper Corporation | | | | | | | | | | | 1,740,500 | | | | 11,748,375 | |
| | | | | | | | | | | | | | | | |
| | | | |
Telecommunication Services: 0.66% | | | | | | | | | | | | | | | | |
| | | | |
| Diversified Telecommunication Services: 0.66% | | | | | | | | | | | | | | | | |
Cincinnati Bell Incorporated**†(l) | | | | | | | | | | | 10,186,600 | | | | 30,457,934 | |
| | | | | | | | | | | | | | | | |
| | | | |
Total Common Stocks (Cost $3,090,475,870) | | | | | | | | | | | | | | | 4,211,008,704 | |
| | | | | | | | | | | | | | | | |
| | | | |
Investment Companies: 1.33% | | | | | | | | | | | | | | | | |
KBW Regional Banking ETF | | | | | | | | | | | 600,600 | | | | 16,036,020 | |
Market Vectors Gold Miners ETF | | | | | | | | | | | 720,100 | | | | 44,761,416 | |
| | | | |
Total Investment Companies (Cost $38,007,341) | | | | | | | | | | | | | | | 60,797,436 | |
| | | | | | | | | | | | | | | | |
| | | | |
| 42 | | Wells Fargo Advantage Small and Mid Cap Stock Funds | | Portfolio of Investments—April 30, 2011 (Unaudited) |
SMALL CAP VALUE FUND
| | | | | | | | | | | | | | | | |
| Security Name | | | | | Expiration Date | | | Shares | | | Value | |
| | | | | | | | | | | | | | | | |
| | | | |
Warrants: 0.00% | | | | | | | | | | | | | | | | |
| | | | |
Financials: 0.00% | | | | | | | | | | | | | | | | |
| | | | |
| Real Estate Investment Trusts (REITs): 0.00% | | | | | | | | | | | | | | | | |
Armour Residential Incorporated†(a) | | | | | | | 11/07/2011 | | | | 314,556 | | | $ | 22,019 | |
| | | | | | | | | | | | | | | | |
| | | | |
Materials: 0.00% | | | | | | | | | | | | | | | | |
| | | | |
| Metals & Mining: 0.00% | | | | | | | | | | | | | | | | |
Sandstorm Gold Limited†(i) | | | | | | | 10/19/2015 | | | | 470,263 | | | | 198,811 | |
| | | | | | | | | | | | | | | | |
| | | | |
Total Warrants (Cost $0) | | | | | | | | | | | | | | | 220,830 | |
| | | | | | | | | | | | | | | | |
| | | | |
| | | | | | Yield | | | | | | | |
| | | | |
Short-Term Investments: 6.94% | | | | | | | | | | | | | | | | |
| | | | |
| Investment Companies: 6.94% | | | | | | | | | | | | | | | | |
Wells Fargo Advantage Cash Investment Money Market Fund(l)(u) | | | | | | | 0.09% | | | | 317,489,043 | | | | 317,489,043 | |
| | | | |
Total Short-Term Investments (Cost $317,489,043) | | | | | | | | | | | | | | | 317,489,043 | |
| | | | | | | | | | | | | | | | |
| | | | | | | | |
| Total Investments in Securities | | | | | | | | |
| (Cost $3,445,972,254)* | | | 100.25 | % | | | 4,589,516,013 | |
Other Assets and Liabilities, Net | | | (0.25 | ) | | | (11,531,719 | ) |
| | | | | | | | |
| Total Net Assets | | | 100.00 | % | | $ | 4,577,984,294 | |
| | | | | | | | |
| # | All or a portion of this security is segregated as collateral for derivative investments. |
| ** | Represents an affiliate of the Fund under section 2(a)(2) and 2(a)(3) of the Investment Company Act of 1940, as the Fund holds 5% or more of the issuer’s outstanding voting shares. |
| † | Non-income earning security. |
| (a) | Security is fair valued by the Management Valuation Team, and in certain instances by the Board of Trustees, in accordance with procedures approved by the Board of Trustees. |
| †† | Securities that may be resold to “qualified institutional buyers” under Rule 144A or securities offered pursuant to Section 4(2) of the Securities Act of 1933, as amended. |
| (l) | Investment in an affiliate.The total cost of affiliated investments is $1,234,932,014. |
| (u) | Rate shown is the 7-day annualized yield at period end. |
| * | Cost for federal income tax purposes is $3,473,286,663 and net unrealized appreciation (depreciation) consists of: |
| | | | |
Gross unrealized appreciation | | $ | 1,395,049,160 | |
Gross unrealized depreciation | | | (278,819,810 | ) |
| | | | |
Net unrealized appreciation | | $ | 1,116,229,350 | |
The accompanying notes are an integral part of these financial statements.
| | | | | | |
| Portfolio of Investments—April 30, 2011 (Unaudited) | | Wells Fargo Advantage Small and Mid Cap Stock Funds | | | 43 | |
SMALL/MID CAP VALUE FUND
| | | | | | | | | | | | | | | | |
| Security Name | | | | | | | | Shares | | | Value | |
| | | | | | | | | | | | | | | | |
| | | | |
Common Stocks: 98.37% | | | | | | | | | | | | | | | | |
| | | | |
Consumer Discretionary: 6.49% | | | | | | | | | | | | | | | | |
| | | | |
| Auto Components: 0.85% | | | | | | | | | | | | | | | | |
Gentex Corporation | | | | | | | | | | | 76,700 | | | $ | 2,404,545 | |
| | | | | | | | | | | | | | | | |
| | | | |
| Hotels, Restaurants & Leisure: 0.88% | | | | | | | | | | | | | | | | |
Century Casinos Incorporated† | | | | | | | | | | | 714,220 | | | | 2,149,802 | |
Empire Resorts Incorporated | | | | | | | | | | | 540,000 | | | | 361,800 | |
| | | | |
| | | | | | | | | | | | | | | 2,511,602 | |
| | | | | | | | | | | | | | | | |
| | | | |
| Household Durables: 1.23% | | | | | | | | | | | | | | | | |
Cavco Industries Incorporated† | | | | | | | | | | | 75,485 | | | | 3,508,543 | |
| | | | | | | | | | | | | | | | |
| | | | |
| Leisure Equipment & Products: 0.58% | | | | | | | | | | | | | | | | |
Black Diamond Incorporated† | | | | | | | | | | | 239,400 | | | | 1,637,496 | |
| | | | | | | | | | | | | | | | |
| | | | |
| Media: 2.48% | | | | | | | | | | | | | | | | |
Entravision Communications Corporation Class A† | | | | | | | | | | | 628,243 | | | | 1,482,653 | |
Interpublic Group of Companies Incorporated | | | | | | | | | | | 91,100 | | | | 1,070,425 | |
Outdoor Channel Holdings Incorporated | | | | | | | | | | | 169,931 | | | | 1,215,007 | |
Regal Entertainment Group Class A | | | | | | | | | | | 131,405 | | | | 1,810,761 | |
Scripps Networks Interactive Incorporated | | | | | | | | | | | 28,740 | | | | 1,477,811 | |
| | | | |
| | | | | | | | | | | | | | | 7,056,657 | |
| | | | | | | | | | | | | | | | |
| | | | |
| Specialty Retail: 0.47% | | | | | | | | | | | | | | | | |
Bakers Footwear Group Incorporated†**(l) | | | | | | | | | | | 498,335 | | | | 573,085 | |
Vitamin Shoppe Incorporated† | | | | | | | | | | | 19,325 | | | | 754,062 | |
| | | | |
| | | | | | | | | | | | | | | 1,327,147 | |
| | | | | | | | | | | | | | | | |
| | | | |
Consumer Staples: 0.60% | | | | | | | | | | | | | | | | |
| | | | |
| Household Products: 0.60% | | | | | | | | | | | | | | | | |
WD-40 Company | | | | | | | | | | | 40,850 | | | | 1,695,275 | |
| | | | | | | | | | | | | | | | |
| | | | |
Energy: 22.08% | | | | | | | | | | | | | | | | |
| | | | |
| Energy Equipment & Services: 6.10% | | | | | | | | | | | | | | | | |
Global Industries Limited† | | | | | | | | | | | 354,025 | | | | 3,490,687 | |
Helix Energy Solutions Group Incorporated† | | | | | | | | | | | 146,550 | | | | 2,774,192 | |
Helmerich & Payne Incorporated | | | | | | | | | | | 20,095 | | | | 1,333,102 | |
Key Energy Services Incorporated† | | | | | | | | | | | 117,180 | | | | 2,132,676 | |
Newpark Resources Incorporated† | | | | | | | | | | | 509,276 | | | | 4,598,762 | |
Pride International Incorporated† | | | | | | | | | | | 26,325 | | | | 1,155,931 | |
Willbros Group Incorporated† | | | | | | | | | | | 171,700 | | | | 1,845,775 | |
| | | | |
| | | | | | | | | | | | | | | 17,331,125 | |
| | | | | | | | | | | | | | | | |
| | | | |
| Oil, Gas & Consumable Fuels: 15.98% | | | | | | | | | | | | | | | | |
Canadian Natural Resources Limited | | | | | | | | | | | 78,500 | | | | 3,686,360 | |
El Paso Corporation | | | | | | | | | | | 50,535 | | | | 980,884 | |
Energy XXI Bermuda Limited† | | | | | | | | | | | 56,522 | | | | 2,048,923 | |
InterOil Corporation† | | | | | | | | | | | 222,699 | | | | 14,163,656 | |
James River Coal Company† | | | | | | | | | | | 63,815 | | | | 1,488,166 | |
| | | | |
| 44 | | Wells Fargo Advantage Small and Mid Cap Stock Funds | | Portfolio of Investments—April 30, 2011 (Unaudited) |
SMALL/MID CAP VALUE FUND
| | | | | | | | | | | | | | | | |
| Security Name | | | | | | | | Shares | | | Value | |
| | | | | | | | | | | | | | | | |
| | | | |
| Oil, Gas & Consumable Fuels (continued) | | | | | | | | | | | | | | | | |
Marathon Oil Corporation | | | | | | | | | | | 15,000 | | | $ | 810,600 | |
McMoRan Exploration Company† | | | | | | | | | | | 392,835 | | | | 7,192,809 | |
Penn West Petroleum Limited | | | | | | | | | | | 32,435 | | | | 830,660 | |
Pioneer Natural Resources Company | | | | | | | | | | | 10,520 | | | | 1,075,460 | |
Plains Exploration & Product Company† | | | | | | | | | | | 30,700 | | | | 1,167,828 | |
Range Resources Corporation | | | | | | | | | | | 95,100 | | | | 5,368,395 | |
Triangle Petroleum Corporation† | | | | | | | | | | | 136,549 | | | | 1,077,372 | |
Trilogy Energy Corporation | | | | | | | | | | | 228,600 | | | | 5,506,309 | |
| | | | |
| | | | | | | | | | | | | | | 45,397,422 | |
| | | | | | | | | | | | | | | | |
| | | | |
Financials: 17.74% | | | | | | | | | | | | | | | | |
| | | | |
| Capital Markets: 0.49% | | | | | | | | | | | | | | | | |
Artio Global Investos Incorporated | | | | | | | | | | | 84,200 | | | | 1,383,406 | |
| | | | | | | | | | | | | | | | |
| | | | |
| Commercial Banks: 4.71% | | | | | | | | | | | | | | | | |
1st United Bancorp Incorporated† | | | | | | | | | | | 207,394 | | | | 1,445,536 | |
American River Holdings† | | | | | | | | | | | 184,000 | | | | 1,150,000 | |
Bancorp Incorporated† | | | | | | | | | | | 86,922 | | | | 850,966 | |
Center Financial Corporation† | | | | | | | | | | | 98,870 | | | | 720,762 | |
Iberiabank Corporation | | | | | | | | | | | 28,298 | | | | 1,698,163 | |
Midsouth Bancorp Incorporated | | | | | | | | | | | 71,625 | | | | 1,014,210 | |
Pacific Premier Bancorp Incorporated† | | | | | | | | | | | 265,535 | | | | 1,858,745 | |
Sierra Bancorp | | | | | | | | | | | 130,295 | | | | 1,452,789 | |
Sterling Bancorp | | | | | | | | | | | 76,850 | | | | 795,398 | |
Univest Corporation of Pennsylvania | | | | | | | | | | | 41,023 | | | | 690,007 | |
Washington Banking Company | | | | | | | | | | | 66,750 | | | | 933,833 | |
Western Liberty Bancorp† | | | | | | | | | | | 71,795 | | | | 267,795 | |
Wilmington Trust Corporation | | | | | | | | | | | 114,678 | | | | 517,198 | |
| | | | |
| | | | | | | | | | | | | | | 13,395,402 | |
| | | | | | | | | | | | | | | | |
| | | | |
| Consumer Finance: 0.60% | | | | | | | | | | | | | | | | |
Western Union Company | | | | | | | | | | | 79,970 | | | | 1,699,363 | |
| | | | | | | | | | | | | | | | |
| | | | |
| Insurance: 2.36% | | | | | | | | | | | | | | | | |
Argo Group International Holdings Limited | | | | | | | | | | | 103,744 | | | | 3,258,599 | |
First Acceptance Corporation† | | | | | | | | | | | 676,060 | | | | 1,223,669 | |
Hilltop Holdings Incorporated† | | | | | | | | | | | 111,686 | | | | 1,083,354 | |
Mercury General Corporation | | | | | | | | | | | 28,525 | | | | 1,133,584 | |
| | | | |
| | | | | | | | | | | | | | | 6,699,206 | |
| | | | | | | | | | | | | | | | |
| | | | |
| Real Estate Investment Trusts (REITs): 8.70% | | | | | | | | | | | | | | | | |
Annaly Capital Management Incorporated | | | | | | | | | | | 63,888 | | | | 1,139,762 | |
Anworth Mortgage Asset Corporation | | | | | | | | | | | 157,695 | | | | 1,132,250 | |
Capstead Mortgage Corporation | | | | | | | | | | | 195,525 | | | | 2,588,751 | |
Chimera Investment Corporation | | | | | | | | | | | 2,175,716 | | | | 8,811,650 | |
Hatteras Financial Corporation | | | | | | | | | | | 63,115 | | | | 1,793,097 | |
MFA Mortgage Investments Incorporated | | | | | | | | | | | 129,165 | | | | 1,030,737 | |
Origen Financial Incorporated | | | | | | | | | | | 781,700 | | | | 1,407,060 | |
Redwood Trust Incorporated | | | | | | | | | | | 105,000 | | | | 1,662,150 | |
Sun Communities Incorporated | | | | | | | | | | | 59,345 | | | | 2,283,596 | |
| | | | | | |
| Portfolio of Investments—April 30, 2011 (Unaudited) | | Wells Fargo Advantage Small and Mid Cap Stock Funds | | | 45 | |
SMALL/MID CAP VALUE FUND
| | | | | | | | | | | | | | | | |
| Security Name | | | | | | | | Shares | | | Value | |
| | | | | | | | | | | | | | | | |
| | | | |
| Real Estate Investment Trusts (REITs) (continued) | | | | | | | | | | | | | | | | |
UMH Properties Incorporated | | | | | | | | | | | 276,400 | | | $ | 2,857,976 | |
| | | | |
| | | | | | | | | | | | | | | 24,707,029 | |
| | | | | | | | | | | | | | | | |
| | | | |
| Real Estate Management & Development: 0.51% | | | | | | | | | | | | | | | | |
Kennedy Wilson Holdings Incorporated† | | | | | | | | | | | 127,850 | | | | 1,463,883 | |
| | | | | | | | | | | | | | | | |
| | | | |
| Thrifts & Mortgage Finance: 0.37% | | | | | | | | | | | | | | | | |
First Niagara Financial Group Incorporated | | | | | | | | | | | 48,345 | | | | 696,168 | |
Northwest Bancshares Incorporated | | | | | | | | | | | 29,415 | | | | 370,335 | |
| | | | |
| | | | | | | | | | | | | | | 1,066,503 | |
| | | | | | | | | | | | | | | | |
| | | | |
Health Care: 7.18% | | | | | | | | | | | | | | | | |
| | | | |
| Health Care Equipment & Supplies: 3.73% | | | | | | | | | | | | | | | | |
Allied Healthcare Products Incorporated† | | | | | | | | | | | 377,247 | | | | 1,588,210 | |
EnteroMedics Incorporated†**(l) | | | | | | | | | | | 524,500 | | | | 1,442,375 | |
Haemonetics Corporation† | | | | | | | | | | | 12,105 | | | | 849,771 | |
Orasure Technologies Incorporated† | | | | | | | | | | | 465,800 | | | | 4,103,698 | |
Stryker Corporation | | | | | | | | | | | 16,990 | | | | 1,002,410 | |
Wright Medical Group Incorporated† | | | | | | | | | | | 65,525 | | | | 1,083,128 | |
Zoll Medical Corporation† | | | | | | | | | | | 9,540 | | | | 540,727 | |
| | | | |
| | | | | | | | | | | | | | | 10,610,319 | |
| | | | | | | | | | | | | | | | |
| | | | |
| Health Care Providers & Services: 0.87% | | | | | | | | | | | | | | | | |
Cross Country Healthcare Incorporated† | | | | | | | | | | | 136,744 | | | | 1,014,640 | |
Ensign Group Incorporated | | | | | | | | | | | 32,700 | | | | 904,482 | |
PharMerica Corporation† | | | | | | | | | | | 42,400 | | | | 557,984 | |
| | | | |
| | | | | | | | | | | | | | | 2,477,106 | |
| | | | | | | | | | | | | | | | |
| | | | |
| Health Care Technology: 2.10% | | | | | | | | | | | | | | | | |
Computer Programs & Systems Incorporated | | | | | | | | | | | 24,525 | | | | 1,441,825 | |
Merge Healthcare Incorporated† | | | | | | | | | | | 297,605 | | | | 1,467,193 | |
Omnicell Incorporated† | | | | | | | | | | | 124,500 | | | | 1,914,810 | |
Transcend Services Incorporated† | | | | | | | | | | | 47,145 | | | | 1,137,609 | |
| | | | |
| | | | | | | | | | | | | | | 5,961,437 | |
| | | | | | | | | | | | | | | | |
| | | | |
| Life Sciences Tools & Services: 0.48% | | | | | | | | | | | | | | | | |
Accelrys Incorporated† | | | | | | | | | | | 179,565 | | | | 1,359,307 | |
| | | | | | | | | | | | | | | | |
| | | | |
Industrials: 13.28% | | | | | | | | | | | | | | | | |
| | | | |
| Aerospace & Defense: 1.46% | | | | | | | | | | | | | | | | |
Alliant Techsystems Incorporated | | | | | | | | | | | 15,600 | | | | 1,102,140 | |
Orbital Sciences Corporation† | | | | | | | | | | | 160,925 | | | | 3,030,218 | |
| | | | |
| | | | | | | | | | | | | | | 4,132,358 | |
| | | | | | | | | | | | | | | | |
| | | | |
| Airlines: 0.61% | | | | | | | | | | | | | | | | |
JetBlue Airways Corporation† | | | | | | | | | | | 307,600 | | | | 1,741,016 | |
| | | | | | | | | | | | | | | | |
| | | | |
| Building Products: 0.61% | | | | | | | | | | | | | | | | |
Patrick Industries Incorporated† | | | | | | | | | | | 300,277 | | | | 714,659 | |
| | | | |
| 46 | | Wells Fargo Advantage Small and Mid Cap Stock Funds | | Portfolio of Investments—April 30, 2011 (Unaudited) |
SMALL/MID CAP VALUE FUND
| | | | | | | | | | | | | | | | |
| Security Name | | | | | | | | Shares | | | Value | |
| | | | | | | | | | | | | | | | |
| | | | |
| Building Products (continued) | | | | | | | | | | | | | | | | |
U.S. Home Systems Incorporated† | | | | | | | | | | | 194,700 | | | $ | 1,002,705 | |
| | | | |
| | | | | | | | | | | | | | | 1,717,364 | |
| | | | | | | | | | | | | | | | |
| | | | |
| Commercial Services & Supplies: 5.23% | | | | | | | | | | | | | | | | |
ABM Industries Incorporated | | | | | | | | | | | 86,905 | | | | 2,113,530 | |
ACCO Brands Corporation† | | | | | | | | | | | 150,945 | | | | 1,465,676 | |
Avery Dennison Corporation | | | | | | | | | | | 54,400 | | | | 2,270,656 | |
Cintas Corporation | | | | | | | | | | | 42,100 | | | | 1,307,205 | |
Corrections Corporation of America† | | | | | | | | | | | 11,300 | | | | 281,257 | |
GEO Group Incorporated | | | | | | | | | | | 148,462 | | | | 3,960,966 | |
Healthcare Services Group | | | | | | | | | | | 71,323 | | | | 1,266,696 | |
Standard Parking Corporation† | | | | | | | | | | | 84,997 | | | | 1,486,598 | |
Verisk Analytics Incorporated Class A† | | | | | | | | | | | 21,725 | | | | 714,753 | |
| | | | |
| | | | | | | | | | | | | | | 14,867,337 | |
| | | | | | | | | | | | | | | | |
| | | | |
| Construction & Engineering: 2.15% | | | | | | | | | | | | | | | | |
Integrated Electrical Services Incorporated† | | | | | | | | | | | 192,300 | | | | 649,974 | |
Primoris Services Corporation | | | | | | | | | | | 463,830 | | | | 5,463,917 | |
| | | | |
| | | | | | | | | | | | | | | 6,113,891 | |
| | | | | | | | | | | | | | | | |
| | | | |
| Machinery: 1.50% | | | | | | | | | | | | | | | | |
Actuant Corporation Class A | | | | | | | | | | | 77,645 | | | | 2,155,425 | |
Kaydon Corporation | | | | | | | | | | | 35,690 | | | | 1,381,203 | |
Kennametal Incorporated | | | | | | | | | | | 17,400 | | | | 734,628 | |
| | | | |
| | | | | | | | | | | | | | | 4,271,256 | |
| | | | | | | | | | | | | | | | |
| | | | |
| Marine: 0.41% | | | | | | | | | | | | | | | | |
Star Bulk Carriers Corporation | | | | | | | | | | | 488,490 | | | | 1,147,952 | |
| | | | | | | | | | | | | | | | |
| | | | |
| Professional Services: 1.31% | | | | | | | | | | | | | | | | |
Hill International Incorporated† | | | | | | | | | | | 735,790 | | | | 3,730,455 | |
| | | | | | | | | | | | | | | | |
| | | | |
Information Technology: 13.61% | | | | | | | | | | | | | | | | |
| | | | |
| Communications Equipment: 4.86% | | | | | | | | | | | | | | | | |
Bigband Networks Incorporated† | | | | | | | | | | | 378,800 | | | | 969,728 | |
Brocade Communications Systems Incorporated† | | | | | | | | | | | 294,720 | | | | 1,842,000 | |
China GrenTech Corporation Limited ADR† | | | | | | | | | | | 408,804 | | | | 1,238,676 | |
InterDigital Incorporated | | | | | | | | | | | 24,655 | | | | 1,141,280 | |
MRV Communications Incorporated† | | | | | | | | | | | 2,324,035 | | | | 3,555,774 | |
Sandvine Corporation† | | | | | | | | | | | 1,978,945 | | | | 5,057,194 | |
| | | | |
| | | | | | | | | | | | | | | 13,804,652 | |
| | | | | | | | | | | | | | | | |
| | | | |
| Computers & Peripherals: 1.59% | | | | | | | | | | | | | | | | |
Cray Incorporated† | | | | | | | | | | | 278,730 | | | | 1,873,066 | |
Intermec Incorporated† | | | | | | | | | | | 230,340 | | | | 2,644,303 | |
| | | | |
| | | | | | | | | | | | | | | 4,517,369 | |
| | | | | | | | | | | | | | | | |
| | | | |
| Electronic Equipment & Instruments: 1.68% | | | | | | | | | | | | | | | | |
Evans & Sutherland Computer Corporation† | | | | | | | | | | | 511,952 | | | | 261,096 | |
GSI Group Incorporated† | | | | | | | | | | | 89,200 | | | | 1,012,420 | |
| | | | | | |
| Portfolio of Investments—April 30, 2011 (Unaudited) | | Wells Fargo Advantage Small and Mid Cap Stock Funds | | | 47 | |
SMALL/MID CAP VALUE FUND
| | | | | | | | | | | | | | | | |
| Security Name | | | | | | | | Shares | | | Value | |
| | | | | | | | | | | | | | | | |
| | | | |
| Electronic Equipment & Instruments (continued) | | | | | | | | | | | | | | | | |
OSI Systems Incorporated† | | | | | | | | | | | 39,111 | | | $ | 1,501,471 | |
Power One Incorporated† | | | | | | | | | | | 243,725 | | | | 2,013,169 | |
| | | | |
| | | | | | | | | | | | | | | 4,788,156 | |
| | | | | | | | | | | | | | | | |
| | | | |
| IT Services: 1.21% | | | | | | | | | | | | | | | | |
Tier Technologies Incorporated Class B† | | | | | | | | | | | 615,679 | | | | 3,441,646 | |
| | | | | | | | | | | | | | | | |
| | | | |
| Semiconductors & Semiconductor Equipment: 3.97% | | | | | | | | | | | | | | | | |
Advanced Micro Devices Incorporated† | | | | | | | | | | | 125,200 | | | | 1,139,320 | |
FormFactor Incorporated† | | | | | | | | | | | 221,445 | | | | 2,296,385 | |
MEMC Electronic Materials Incorporated† | | | | | | | | | | | 214,360 | | | | 2,535,879 | |
Micron Technology Incorporated† | | | | | | | | | | | 361,150 | | | | 4,077,384 | |
Trident Microsystems Incorporated† | | | | | | | | | | | 1,214,626 | | | | 1,226,772 | |
| | | | |
| | | | | | | | | | | | | | | 11,275,740 | |
| | | | | | | | | | | | | | | | |
| | | | |
| Software: 0.30% | | | | | | | | | | | | | | | | |
Henry Jack & Associates Incorporated | | | | | | | | | | | 25,120 | | | | 853,326 | |
| | | | | | | | | | | | | | | | |
| | | | |
Materials: 16.74% | | | | | | | | | | | | | | | | |
| | | | |
| Chemicals: 0.38% | | | | | | | | | | | | | | | | |
International Flavors & Fragrances Incorporated | | | | | | | | | | | 16,905 | | | | 1,073,806 | |
| | | | | | | | | | | | | | | | |
| | | | |
| Containers & Packaging: 0.40% | | | | | | | | | | | | | | | | |
Intertape Polymer Group Incorporated† | | | | | | | | | | | 729,751 | | | | 1,138,412 | |
| | | | | | | | | | | | | | | | |
| | | | |
| Metals & Mining: 15.96% | | | | | | | | | | | | | | | | |
Agnico-Eagle Mines Limited | | | | | | | | | | | 36,450 | | | | 2,536,191 | |
Endeavour Mining Corporation† | | | | | | | | | | | 535,944 | | | | 1,353,809 | |
Goldcorp Incorporated | | | | | | | | | | | 42,400 | | | | 2,367,192 | |
Goldgroup Mining Incorporated - Legend Shares† | | | | | | | | | | | 1,041,000 | | | | 1,639,370 | |
Goldgroup Mining Incorporated† | | | | | | | | | | | 148,800 | | | | 234,331 | |
Lucara Diamond Corporation† | | | | | | | | | | | 1,082,660 | | | | 1,533,696 | |
Minera Andes Incorporated† | | | | | | | | | | | 1,883,400 | | | | 5,574,864 | |
Newmont Mining Corporation | | | | | | | | | | | 44,455 | | | | 2,605,508 | |
Petaquilla Minerals Limited† | | | | | | | | | | | 583,300 | | | | 542,469 | |
Randgold Resources Limited ADR | | | | | | | | | | | 158,700 | | | | 13,738,659 | |
Rockwell Diamonds Incorporated† | | | | | | | | | | | 2,992,475 | | | | 134,661 | |
Rockwell Diamonds Incorporated - Toronto Exchange† | | | | | | | | | | | 12,881,250 | | | | 680,719 | |
Royal Gold Incorporated | | | | | | | | | | | 54,755 | | | | 3,338,960 | |
San Gold Corporation† | | | | | | | | | | | 567,020 | | | | 1,719,318 | |
Sandstorm Gold Limited† | | | | | | | | | | | 3,101,385 | | | | 3,441,795 | |
Sandstorm Metals & Energy Limited† | | | | | | | | | | | 346,933 | | | | 190,673 | |
Silver Standard Resources Incorporated† | | | | | | | | | | | 43,668 | | | | 1,517,026 | |
United States Steel Corporation | | | | | | | | | | | 24,985 | | | | 1,192,034 | |
Yamana Gold Incorporated | | | | | | | | | | | 78,740 | | | | 1,000,779 | |
| | | | |
| | | | | | | | | | | | | | | 45,342,054 | |
| | | | | | | | | | | | | | | | |
| | | | |
| 48 | | Wells Fargo Advantage Small and Mid Cap Stock Funds | | Portfolio of Investments—April 30, 2011 (Unaudited) |
SMALL/MID CAP VALUE FUND
| | | | | | | | | | | | | | | | |
| Security Name | | | | | | | | Shares | | | Value | |
| | | | | | | | | | | | | | | | |
| | | | |
Telecommunication Services: 0.65% | | | | | | | | | | | | | | | | |
| | | | |
| Diversified Telecommunication Services: 0.65% | | | | | | | | | | | | | | | | |
Cincinnati Bell Incorporated† | | | | | | | | | | | 616,420 | | | $ | 1,843,096 | |
| | | | | | | | | | | | | | | | |
| | | | |
Total Common Stocks (Cost $207,266,759) | | | | | | | | | | | | | | | 279,492,659 | |
| | | | | | | | | | | | | | | | |
| | | | |
| | | | | | Expiration Date | | | | | | | |
| | | | |
Rights: 0.00% | | | | | | | | | | | | | | | | |
| | | | |
Consumer Discretionary: 0.00% | | | | | | | | | | | | | | | | |
| | | | |
| Hotels, Restaurants & Leisure: 0.00% | | | | | | | | | | | | | | | | |
Empire Resorts Incorporated(a)† | | | | | | | 05/20/2011 | | | | 540,000 | | | | 0 | |
| | | | |
Total Rights (Cost $0) | | | | | | | | | | | | | | | 0 | |
| | | | | | | | | | | | | | | | |
| | | | |
Warrants: 0.43% | | | | | | | | | | | | | | | | |
| | | | |
Health Care: 0.24% | | | | | | | | | | | | | | | | |
| | | | |
| Health Care Equipment & Supplies: 0.24% | | | | | | | | | | | | | | | | |
EnteroMedics Incorporated(a)†(i) | | | | | | | 05/14/2016 | | | | 270,908 | | | | 690,815 | |
| | | | | | | | | | | | | | | | |
| | | | |
Materials: 0.19% | | | | | | | | | | | | | | | | |
| | | | |
| Metals & Mining: 0.19% | | | | | | | | | | | | | | | | |
Sandstorm Gold Limited† | | | | | | | 04/23/2014 | | | | 904,067 | | | | 525,537 | |
| | | | | | | | | | | | | | | | |
| | | | |
Total Warrants (Cost $15,995) | | | | | | | | | | | | | | | 1,216,352 | |
| | | | | | | | | | | | | | | | |
| | | | |
Investment Companies: 1.17% | | | | | | | | | | | | | | | | |
Market Vectors Junior Gold Miners ETF | | | | | | | | | | | 50,359 | | | | 2,097,452 | |
SPDR KBW Regional Banking ETF | | | | | | | | | | | 45,980 | | | | 1,227,666 | |
| | | | |
Total Investment Companies (Cost $2,318,777) | | | | | | | | | | | | | | | 3,325,118 | |
| | | | | | | | | | | | | | | | |
| | | | |
| | | Yield | | | | | | | | | | |
| | | | |
Short-Term Investments: 0.03% | | | | | | | | | | | | | | | | |
| | | | |
| Investment Companies: 0.03% | | | | | | | | | | | | | | | | |
Wells Fargo Advantage Cash Investment Money Market Fund(l)(u) | | | 0.09 | % | | | | | | | 94,766 | | | | 94,766 | |
| | | | |
Total Short-Term Investments (Cost $94,766) | | | | | | | | | | | | | | | 94,766 | |
| | | | | | | | | | | | | | | | |
| | | | | | | | |
| Total Investments in Securities | | | | | | | | |
| (Cost $209,696,297)* | | | 100.00 | % | | | 284,128,895 | |
Other Assets and Liabilities, Net | | | 0.00 | | | | (1,255 | ) |
| | | | | | | | |
| Total Net Assets | | | 100.00 | % | | $ | 284,127,640 | |
| | | | | | | | |
| | | | | | |
| Portfolio of Investments—April 30, 2011 (Unaudited) | | Wells Fargo Advantage Small and Mid Cap Stock Funds | | | 49 | |
SMALL/MID CAP VALUE FUND
| † | Non-income earning security. |
| ** | Represents an affiliate of the Fund under Section 2(a)(2) and 2(a)(3) of the Investment Company Act of 1940, as the Fund holds 5% or more of the issuer’s outstanding voting shares. |
| (a) | Security is fair valued by the Management Valuation Team, and in certain instances by the Board of Trustees, in accordance with procedures approved by the Board of Trustees. |
| (l) | Investment in an affiliate. The total cost of affiliated investments is $1,721,836. |
| (u) | Rate shown is the 7-day annualized yield at period end. |
| * | Cost for federal income tax purposes is $218,863,612 and net unrealized appreciation (depreciation) consist of: |
| | | | |
Gross unrealized appreciation | | $ | 79,623,642 | |
Gross unrealized depreciation | | | (14,358,359 | ) |
| | | | |
Net unrealized appreciation | | $ | 65,265,283 | |
The accompanying notes are an integral part of these financial statements.
| | | | |
| 50 | | Wells Fargo Advantage Small and Mid Cap Stock Funds | | Portfolio of Investments—April 30, 2011 (Unaudited) |
SPECIAL SMALL CAP VALUE FUND
| | | | | | | | | | | | | | | | |
| Security Name | | | | | | | | Shares | | | Value | |
| | | | | | | | | | | | | | | | |
| | | | |
Common Stocks: 96.84% | | | | | | | | | | | | | | | | |
| | | | |
Consumer Discretionary: 16.67% | | | | | | | | | | | | | | | | |
| | | | |
| Auto Components: 1.73% | | | | | | | | | | | | | | | | |
Modine Manufacturing Company† | | | | | | | | | | | 908,325 | | | $ | 16,177,265 | |
| | | | | | | | | | | | | | | | |
| | | | |
| Automobiles: 0.17% | | | | | | | | | | | | | | | | |
Thor Industries Incorporated | | | | | | | | | | | 50,700 | | | | 1,572,207 | |
| | | | | | | | | | | | | | | | |
| | | | |
| Diversified Consumer Services: 3.00% | | | | | | | | | | | | | | | | |
Hillenbrand Incorporated | | | | | | | | | | | 696,302 | | | | 15,959,242 | |
Matthews International Corporation Class A« | | | | | | | | | | | 299,447 | | | | 12,019,803 | |
| | | | |
| | | | | | | | | | | | | | | 27,979,045 | |
| | | | | | | | | | | | | | | | |
| | | | |
| Hotels, Restaurants & Leisure: 1.97% | | | | | | | | | | | | | | | | |
Dennys Corporation†« | | | | | | | | | | | 2,731,044 | | | | 11,169,970 | |
Ruby Tuesday Incorporated† | | | | | | | | | | | 126,000 | | | | 1,324,260 | |
Wendy’s Arby’s Group Incorporated | | | | | | | | | | | 1,225,377 | | | | 5,906,317 | |
| | | | |
| | | | | | | | | | | | | | | 18,400,547 | |
| | | | | | | | | | | | | | | | |
| | | | |
| Household Durables: 4.78% | | | | | | | | | | | | | | | | |
Blyth Incorporated**(l) | | | | | | | | | | | 438,460 | | | | 20,669,004 | |
Cavco Industries Incorporated† | | | | | | | | | | | 190,648 | | | | 8,861,319 | |
Dixie Group Incorporated**†(l) | | | | | | | | | | | 698,377 | | | | 3,003,021 | |
Furniture Brands International Incorporated†« | | | | | | | | | | | 498,562 | | | | 2,413,040 | |
La-Z-Boy Incorporated†« | | | | | | | | | | | 817,112 | | | | 9,609,237 | |
| | | | |
| | | | | | | | | | | | | | | 44,555,621 | |
| | | | | | | | | | | | | | | | |
| | | | |
| Media: 0.92% | | | | | | | | | | | | | | | | |
AH Belo Corporation« | | | | | | | | | | | 947,960 | | | | 7,887,027 | |
Dex One Corporation†« | | | | | | | | | | | 161,693 | | | | 679,111 | |
| | | | |
| | | | | | | | | | | | | | | 8,566,138 | |
| | | | | | | | | | | | | | | | |
| | | | |
| Specialty Retail: 2.41% | | | | | | | | | | | | | | | | |
AC Moore Arts & Crafts Incorporated† | | | | | | | | | | | 204,098 | | | | 555,147 | |
Christopher & Banks Corporation | | | | | | | | | | | 434,945 | | | | 2,674,912 | |
Genesco Incorporated†« | | | | | | | | | | | 297,168 | | | | 11,999,644 | |
Men’s Wearhouse Incorporated« | | | | | | | | | | | 234,437 | | | | 6,538,448 | |
Zale Corporation†« | | | | | | | | | | | 197,537 | | | | 726,936 | |
| | | | |
| | | | | | | | | | | | | | | 22,495,087 | |
| | | | | | | | | | | | | | | | |
| | | | |
| Textiles, Apparel & Luxury Goods: 1.69% | | | | | | | | | | | | | | | | |
Delta Apparel Incorporated†« | | | | | | | | | | | 256,239 | | | | 4,532,868 | |
Kenneth Cole Productions Incorporated Class A**†(l) | | | | | | | | | | | 661,368 | | | | 8,908,627 | |
Skechers USA Incorporated Class A†« | | | | | | | | | | | 121,000 | | | | 2,305,050 | |
| | | | |
| | | | | | | | | | | | | | | 15,746,545 | |
| | | | | | | | | | | | | | | | |
| | | | |
Consumer Staples: 4.91% | | | | | | | | | | | | | | | | |
| | | | |
| Food & Staples Retailing: 1.52% | | | | | | | | | | | | | | | | |
Casey’s General Stores Incorporated« | | | | | | | | | | | 244,909 | | | | 9,558,798 | |
| | | | | | |
| Portfolio of Investments—April 30, 2011 (Unaudited) | | Wells Fargo Advantage Small and Mid Cap Stock Funds | | | 51 | |
SPECIAL SMALL CAP VALUE FUND
| | | | | | | | | | | | | | | | |
| Security Name | | | | | | | | Shares | | | Value | |
| | | | | | | | | | | | | | | | |
| | | | |
| Food & Staples Retailing (continued) | | | | | | | | | | | | | | | | |
Winn-Dixie Stores Incorporated†« | | | | | | | | | | | 650,332 | | | $ | 4,610,854 | |
| | | | |
| | | | | | | | | | | | | | | 14,169,652 | |
| | | | | | | | | | | | | | | | |
| | | | |
| Food Products: 0.74% | | | | | | | | | | | | | | | | |
Seneca Foods Corporation Class A†« | | | | | | | | | | | 89,952 | | | | 2,515,058 | |
Snyders Lance Incorporated | | | | | | | | | | | 222,000 | | | | 4,384,500 | |
| | | | |
| | | | | | | | | | | | | | | 6,899,558 | |
| | | | | | | | | | | | | | | | |
| | | | |
| Household Products: 1.85% | | | | | | | | | | | | | | | | |
Central Garden & Pet Company† | | | | | | | | | | | 186,192 | | | | 1,819,096 | |
Central Garden & Pet Company Class A† | | | | | | | | | | | 300,002 | | | | 3,006,020 | |
Spectrum Brands Holdings Incorporated†« | | | | | | | | | | | 131,349 | | | | 4,268,843 | |
WD-40 Company« | | | | | | | | | | | 198,236 | | | | 8,226,794 | |
| | | | |
| | | | | | | | | | | | | | | 17,320,753 | |
| | | | | | | | | | | | | | | | |
| | | | |
| Personal Products: 0.80% | | | | | | | | | | | | | | | | |
Medifast Incorporated†« | | | | | | | | | | | 80,800 | | | | 1,595,800 | |
Prestige Brands Holdings Incorporated† | | | | | | | | | | | 506,842 | | | | 5,854,025 | |
| | | | |
| | | | | | | | | | | | | | | 7,449,825 | |
| | | | | | | | | | | | | | | | |
| | | | |
Energy: 7.70% | | | | | | | | | | | | | | | | |
| | | | |
| Energy Equipment & Services: 2.49% | | | | | | | | | | | | | | | | |
Atwood Oceanics Incorporated† | | | | | | | | | | | 212,232 | | | | 9,535,584 | |
Cal Dive International Incorporated† | | | | | | | | | | | 1,160,217 | | | | 9,119,306 | |
Complete Production Services Incorporated†« | | | | | | | | | | | 72,600 | | | | 2,464,044 | |
Willbros Group Incorporated† | | | | | | | | | | | 195,654 | | | | 2,103,281 | |
| | | | |
| | | | | | | | | | | | | | | 23,222,215 | |
| | | | | | | | | | | | | | | | |
| | | | |
| Oil, Gas & Consumable Fuels: 5.21% | | | | | | | | | | | | | | | | |
Bill Barrett Corporation†« | | | | | | | | | | | 132,600 | | | | 5,533,398 | |
Biofuel Energy Corporation†« | | | | | | | | | | | 3,095,764 | | | | 2,259,908 | |
Comstock Resources Incorporated†« | | | | | | | | | | | 413,425 | | | | 13,254,406 | |
Energy XXI Bermuda Limited† | | | | | | | | | | | 86,100 | | | | 3,121,125 | |
Northern Oil & Gas Incorporated†« | | | | | | | | | | | 103,000 | | | | 2,447,280 | |
Stone Energy Corporation† | | | | | | | | | | | 400,135 | | | | 14,148,774 | |
Swift Energy Company† | | | | | | | | | | | 87,647 | | | | 3,434,886 | |
Tidewater Incorporated« | | | | | | | | | | | 75,100 | | | | 4,469,201 | |
| | | | |
| | | | | | | | | | | | | | | 48,668,978 | |
| | | | | | | | | | | | | | | | |
| | | | |
Financials: 15.91% | | | | | | | | | | | | | | | | |
| | | | |
| Capital Markets: 3.49% | | | | | | | | | | | | | | | | |
CIFC Deerfield Corporation† | | | | | | | | | | | 253,585 | | | | 1,584,906 | |
Investment Technology Group Incorporated†« | | | | | | | | | | | 604,651 | | | | 10,345,579 | |
Knight Capital Group Incorporated Class A†« | | | | | | | | | | | 701,500 | | | | 9,624,580 | |
Kohlberg Capital Corporation | | | | | | | | | | | 566,066 | | | | 4,234,174 | |
Westwood Holdings Group Incorporated | | | | | | | | | | | 181,012 | | | | 6,815,102 | |
| | | | |
| | | | | | | | | | | | | | | 32,604,341 | |
| | | | | | | | | | | | | | | | |
| | | | |
| 52 | | Wells Fargo Advantage Small and Mid Cap Stock Funds | | Portfolio of Investments—April 30, 2011 (Unaudited) |
SPECIAL SMALL CAP VALUE FUND
| | | | | | | | | | | | | | | | |
| Security Name | | | | | | | | Shares | | | Value | |
| | | | | | | | | | | | | | | | |
| | | | |
| Commercial Banks: 9.77% | | | | | | | | | | | | | | | | |
BOK Financial Corporation | | | | | | | | | | | 55,500 | | | $ | 2,984,790 | |
First Citizens BancShares Incorporated | | | | | | | | | | | 196,556 | | | | 39,313,166 | |
First Commonwealth Financial Corporation« | | | | | | | | | | | 852,050 | | | | 5,282,710 | |
IBERIABANK Corporation« | | | | | | | | | | | 122,009 | | | | 7,321,760 | |
Old National Bancorp« | | | | | | | | | | | 592,087 | | | | 6,128,100 | |
UMB Financial Corporation | | | | | | | | | | | 714,761 | | | | 30,098,586 | |
| | | | |
| | | | | | | | | | | | | | | 91,129,112 | |
| | | | | | | | | | | | | | | | |
| | | | |
| Insurance: 2.40% | | | | | | | | | | | | | | | | |
Endurance Specialty Holdings Limited | | | | | | | | | | | 31,300 | | | | 1,399,442 | |
Fortegra Financial Corporation† | | | | | | | | | | | 240,430 | | | | 2,632,709 | |
Stewart Information Services Corporation**«(l) | | | | | | | | | | | 964,018 | | | | 9,775,143 | |
Validus Holdings Limited | | | | | | | | | | | 263,861 | | | | 8,586,037 | |
| | | | |
| | | | | | | | | | | | | | | 22,393,331 | |
| | | | | | | | | | | | | | | | |
| | | | |
| Thrifts & Mortgage Finance: 0.25% | | | | | | | | | | | | | | | | |
Provident New York Bancorp | | | | | | | | | | | 244,716 | | | | 2,295,436 | |
| | | | | | | | | | | | | | | | |
| | | | |
Health Care: 3.47% | | | | | | | | | | | | | | | | |
| | | | |
| Health Care Equipment & Supplies: 1.29% | | | | | | | | | | | | | | | | |
Haemonetics Corporation†« | | | | | | | | | | | 20,300 | | | | 1,425,060 | |
ICU Medical Incorporated† | | | | | | | | | | | 79,703 | | | | 3,595,402 | |
Immucor Incorporated†« | | | | | | | | | | | 159,400 | | | | 3,479,702 | |
West Pharmaceutical Services Incorporated« | | | | | | | | | | | 75,500 | | | | 3,566,620 | |
| | | | |
| | | | | | | | | | | | | | | 12,066,784 | |
| | | | | | | | | | | | | | | | |
| | | | |
| Health Care Providers & Services: 0.93% | | | | | | | | | | | | | | | | |
AMN Healthcare Services Incorporated†« | | | | | | | | | | | 675,845 | | | | 5,832,542 | |
Pharmerica Corporation†« | | | | | | | | | | | 212,240 | | | | 2,793,078 | |
| | | | |
| | | | | | | | | | | | | | | 8,625,620 | |
| | | | | | | | | | | | | | | | |
| | | | |
| Life Sciences Tools & Services: 0.56% | | | | | | | | | | | | | | | | |
Cambrex Corporation†« | | | | | | | | | | | 995,127 | | | | 5,234,368 | |
| | | | | | | | | | | | | | | | |
| | | | |
| Pharmaceuticals: 0.69% | | | | | | | | | | | | | | | | |
Lannett Company Incorporated† | | | | | | | | | | | 601,045 | | | | 3,468,030 | |
Par Pharmaceutical Companies Incorporated† | | | | | | | | | | | 85,600 | | | | 2,948,064 | |
| | | | |
| | | | | | | | | | | | | | | 6,416,094 | |
| | | | | | | | | | | | | | | | |
| | | | |
Industrials: 18.93% | | | | | | | | | | | | | | | | |
| | | | |
| Aerospace & Defense: 0.40% | | | | | | | | | | | | | | | | |
GenCorp Incorporated† | | | | | | | | | | | 572,370 | | | | 3,737,576 | |
| | | | | | | | | | | | | | | | |
| | | | |
| Building Products: 3.15% | | | | | | | | | | | | | | | | |
Builders FirstSource Incorporated†« | | | | | | | | | | | 573,206 | �� | | | 1,518,996 | |
Griffon Corporation†« | | | | | | | | | | | 113,100 | | | | 1,440,894 | |
Quanex Building Products Corporation | | | | | | | | | | | 851,915 | | | | 17,856,138 | |
Simpson Manufacturing Company Incorporated« | | | | | | | | | | | 305,700 | | | | 8,535,144 | |
| | | | |
| | | | | | | | | | | | | | | 29,351,172 | |
| | | | | | | | | | | | | | | | |
| | | | | | |
| Portfolio of Investments—April 30, 2011 (Unaudited) | | Wells Fargo Advantage Small and Mid Cap Stock Funds | | | 53 | |
SPECIAL SMALL CAP VALUE FUND
| | | | | | | | | | | | | | | | |
| Security Name | | | | | | | | Shares | | | Value | |
| | | | | | | | | | | | | | | | |
| | | | |
| Commercial Services & Supplies: 2.91% | | | | | | | | | | | | | | | | |
ACCO Brands Corporation†« | | | | | | | | | | | 1,056,563 | | | $ | 10,259,227 | |
Cenveo Incorporated†« | | | | | | | | | | | 164,662 | | | | 1,067,010 | |
Courier Corporation | | | | | | | | | | | 401,399 | | | | 5,499,166 | |
Viad Corporation | | | | | | | | | | | 414,791 | | | | 10,290,965 | |
| | | | |
| | | | | | | | | | | | | | | 27,116,368 | |
| | | | | | | | | | | | | | | | |
| | | | |
| Electrical Equipment: 0.92% | | | | | | | | | | | | | | | | |
Franklin Electric Company Incorporated | | | | | | | | | | | 190,291 | | | | 8,584,027 | |
| | | | | | | | | | | | | | | | |
| | | | |
| Industrial Conglomerates: 0.56% | | | | | | | | | | | | | | | | |
Tredegar Corporation | | | | | | | | | | | 239,395 | | | | 5,237,963 | |
| | | | | | | | | | | | | | | | |
| | | | |
| Machinery: 8.58% | | | | | | | | | | | | | | | | |
Commercial Vehicle Group Incorporated† | | | | | | | | | | | 192,970 | | | | 3,330,662 | |
Douglas Dynamics Incorporated | | | | | | | | | | | 358,648 | | | | 5,555,458 | |
John Bean Technologies Corporation | | | | | | | | | | | 57,700 | | | | 1,166,117 | |
Kadant Incorporated**†(l) | | | | | | | | | | | 754,129 | | | | 23,264,880 | |
Mueller Industries Incorporated | | | | | | | | | | | 1,193,569 | | | | 46,692,419 | |
| | | | |
| | | | | | | | | | | | | | | 80,009,536 | |
| | | | | | | | | | | | | | | | |
| | | | |
| Marine: 0.09% | | | | | | | | | | | | | | | | |
Horizon Lines Incorporated« | | | | | | | | | | | 488,120 | | | | 863,972 | |
| | | | | | | | | | | | | | | | |
| | | | |
| Professional Services: 1.46% | | | | | | | | | | | | | | | | |
Heidrick & Struggles International Incorporated | | | | | | | | | | | 583,086 | | | | 13,644,212 | |
| | | | | | | | | | | | | | | | |
| | | | |
| Road & Rail: 0.86% | | | | | | | | | | | | | | | | |
Arkansas Best Corporation« | | | | | | | | | | | 350,328 | | | | 8,061,047 | |
| | | | | | | | | | | | | | | | |
| | | | |
Information Technology: 16.43% | | | | | | | | | | | | | | | | |
| | | | |
| Communications Equipment: 0.25% | | | | | | | | | | | | | | | | |
Aviat Networks Incorporated† | | | | | | | | | | | 454,047 | | | | 2,324,721 | |
| | | | | | | | | | | | | | | | |
| | | | |
| Computers & Peripherals: 4.77% | | | | | | | | | | | | | | | | |
ADPT Corporation† | | | | | | | | | | | 3,542,998 | | | | 10,132,974 | |
Imation Corporation**†(l) | | | | | | | | | | | 2,163,321 | | | | 22,217,307 | |
Quantum Corporation†« | | | | | | | | | | | 3,811,745 | | | | 12,121,349 | |
| | | | |
| | | | | | | | | | | | | | | 44,471,630 | |
| | | | | | | | | | | | | | | | |
| | | | |
| Electronic Equipment & Instruments: 4.04% | | | | | | | | | | | | | | | | |
AVX Corporation | | | | | | | | | | | 709,348 | | | | 11,569,466 | |
Benchmark Electronics Incorporated† | | | | | | | | | | | 224,227 | | | | 3,789,436 | |
Insight Enterprises Incorporated† | | | | | | | | | | | 101,200 | | | | 1,736,592 | |
Orbotech Limited† | | | | | | | | | | | 877,555 | | | | 11,250,255 | |
Pulse Electronics Corporation« | | | | | | | | | | | 1,561,202 | | | | 9,335,988 | |
| | | | |
| | | | | | | | | | | | | | | 37,681,737 | |
| | | | | | | | | | | | | | | | |
| | | | |
| Internet Software & Services: 0.82% | | | | | | | | | | | | | | | | |
EarthLink Incorporated« | | | | | | | | | | | 929,700 | | | | 7,642,134 | |
| | | | | | | | | | | | | | | | |
| | | | |
| 54 | | Wells Fargo Advantage Small and Mid Cap Stock Funds | | Portfolio of Investments—April 30, 2011 (Unaudited) |
SPECIAL SMALL CAP VALUE FUND
| | | | | | | | | | | | | | | | |
| Security Name | | | | | | | | Shares | | | Value | |
| | | | | | | | | | | | | | | | |
| | | | |
| IT Services: 0.71% | | | | | | | | | | | | | | | | |
Corelogic Incorporated | | | | | | | | | | | 128,300 | | | $ | 2,362,003 | |
TNS Incorporated†« | | | | | | | | | | | 261,774 | | | | 4,300,947 | |
| | | | |
| | | | | | | | | | | | | | | 6,662,950 | |
| | | | | | | | | | | | | | | | |
| | | | |
| Semiconductors & Semiconductor Equipment: 4.05% | | | | | | | | | | | | | | | | |
ATMI Incorporated†« | | | | | | | | | | | 704,745 | | | | 14,031,473 | |
DSP Group Incorporated† | | | | | | | | | | | 825,064 | | | | 6,666,517 | |
Exar Corporation† | | | | | | | | | | | 1,375,316 | | | | 8,403,181 | |
Lattice Semiconductor Corporation† | | | | | | | | | | | 1,049,581 | | | | 7,126,655 | |
Spansion Incorporated Class A† | | | | | | | | | | | 81,131 | | | | 1,598,281 | |
| | | | |
| | | | | | | | | | | | | | | 37,826,107 | |
| | | | | | | | | | | | | | | | |
| | | | |
| Software: 1.79% | | | | | | | | | | | | | | | | |
ACI Worldwide Incorporated† | | | | | | | | | | | 311,132 | | | | 10,279,801 | |
S1 Corporation† | | | | | | | | | | | 932,160 | | | | 6,403,939 | |
| | | | |
| | | | | | | | | | | | | | | 16,683,740 | |
| | | | | | | | | | | | | | | | |
| | | | |
Materials: 8.22% | | | | | | | | | | | | | | | | |
| | | | |
| Chemicals: 1.65% | | | | | | | | | | | | | | | | |
A. Schulman Incorporated« | | | | | | | | | | | 419,405 | | | | 10,619,335 | |
American Pacific Corporation**†(l) | | | | | | | | | | | 402,733 | | | | 2,484,863 | |
Arch Chemicals Incorporated« | | | | | | | | | | | 58,405 | | | | 2,258,521 | |
| | | | |
| | | | | | | | | | | | | | | 15,362,719 | |
| | | | | | | | | | | | | | | | |
| | | | |
| Containers & Packaging: 0.14% | | | | | | | | | | | | | | | | |
Plastec Technologies Limited†«(a) | | | | | | | | | | | 145,800 | | | | 1,348,096 | |
| | | | | | | | | | | | | | | | |
| | | | |
| Metals & Mining: 1.91% | | | | | | | | | | | | | | | | |
Aurizon Mines Limited† | | | | | | | | | | | 771,660 | | | | 5,231,855 | |
Royal Gold Incorporated« | | | | | | | | | | | 205,598 | | | | 12,537,366 | |
| | | | |
| | | | | | | | | | | | | | | 17,769,221 | |
| | | | | | | | | | | | | | | | |
| | | | |
| Paper & Forest Products: 4.52% | | | | | | | | | | | | | | | | |
Clearwater Paper Corporation†« | | | | | | | | | | | 84,047 | | | | 6,596,009 | |
Glatfelter Corporation« | | | | | | | | | | | 386,080 | | | | 5,250,688 | |
Neenah Paper Incorporated**«(l) | | | | | | | | | | | 764,134 | | | | 17,827,246 | |
Rock-Tenn Company Class A« | | | | | | | | | | | 50,900 | | | | 3,515,663 | |
Schweitzer Manduit International Incorporated | | | | | | | | | | | 116,512 | | | | 6,039,982 | |
Wausau Paper Corporation« | | | | | | | | | | | 438,800 | | | | 2,961,900 | |
| | | | |
| | | | | | | | | | | | | | | 42,191,488 | |
| | | | | | | | | | | | | | | | |
| | | | |
Utilities: 4.60% | | | | | | | | | | | | | | | | |
| | | | |
| Electric Utilities: 4.30% | | | | | | | | | | | | | | | | |
ALLETE Incorporated« | | | | | | | | | | | 803,573 | | | | 32,536,671 | |
El Paso Electric Company« | | | | | | | | | | | 60,286 | | | | 1,867,660 | |
MGE Energy Incorporated | | | | | | | | | | | 92,041 | | | | 3,866,642 | |
Portland General Electric Company | | | | | | | | | | | 75,002 | | | | 1,872,050 | |
| | | | |
| | | | | | | | | | | | | | | 40,143,023 | |
| | | | | | | | | | | | | | | | |
| | | | | | |
| Portfolio of Investments—April 30, 2011 (Unaudited) | | Wells Fargo Advantage Small and Mid Cap Stock Funds | | | 55 | |
SPECIAL SMALL CAP VALUE FUND
| | | | | | | | | | | | | | | | |
| Security Name | | | | | | | | Shares | | | Value | |
| | | | | | | | | | | | | | | | |
| | | | |
| Multi-Utilities: 0.30% | | | | | | | | | | | | | | | | |
Northwestern Corporation | | | | | | | | | | | 86,700 | | | $ | 2,822,083 | |
| | | | | | | | | | | | | | | | |
| | | | |
Total Common Stocks (Cost $845,109,674) | | | | | | | | | | | | | | | 903,524,044 | |
| | | | | | | | | | | | | | | | |
| | | | |
| | | Interest Rate | | | Maturity Date | | | Principal | | | | |
| | | | |
Convertible Debenture: 0.08% | | | | | | | | | | | | | | | | |
| | | | |
Information Technology: 0.08% | | | | | | | | | | | | | | | | |
| | | | |
| Computers & Peripherals: 0.08% | | | | | | | | | | | | | | | | |
Quantum Corporation | | | 3.50 | % | | | 11/15/2015 | | | $ | 697,000 | | | | 742,305 | |
| | | | | | | | | | | | | | | | |
| | | | |
Total Convertible Debentures (Cost $697,000) | | | | | | | | | | | | | | | 742,305 | |
| | | | | | | | | | | | | | | | |
| | | | |
| | | | | | Expiration Date | | | Shares | | | | |
| | | | |
Warrants: 0.01% | | | | | | | | | | | | | | | | |
| | | | |
Materials: 0.01% | | | | | | | | | | | | | | | | |
| | | | |
| Containers & Packaging: 0.01% | | | | | | | | | | | | | | | | |
Plastec Technologies Limited†(a) | | | | | | | 11/18/2014 | | | | 145,800 | | | | 58,320 | |
| | | | |
Total Warrants (Cost $0) | | | | | | | | | | | | | | | 58,320 | |
| | | | | | | | | | | | | | | | |
| | | | |
| | | Interest Rate | | | Maturity Date | | | Principal | | | | |
| | | | |
Short-Term Investments: 20.04% | | | | | | | | | | | | | | | | |
| | | | |
| Corporate Bonds and Notes: 0.44% | | | | | | | | | | | | | | | | |
Gryphon Funding Limited(a)(i) | | | 0.00 | % | | | 08/05/2011 | | | $ | 9,534,969 | | | | 4,105,758 | |
| | | | | | | | | | | | | | | | |
| | | | |
| | | Yield | | | | | | Shares | | | | |
| | | | |
| Investment Companies: 19.60% | | | | | | | | | | | | | | | | |
Wells Fargo Advantage Cash Investment Money Market Fund(l)(u) | | | 0.09 | | | | | | | | 24,792,600 | | | | 24,792,600 | |
Wells Fargo Securities Lending Cash Investments, LLC(v)(l)(u) | | | 0.20 | | | | | | | | 158,135,459 | | | | 158,135,459 | |
| | | | |
| | | | | | | | | | | | | | | 182,928,059 | |
| | | | | | | | | | | | | | | | |
| | | | |
Total Short-Term Investments (Cost $187,011,273) | | | | | | | | | | | | | | | 187,033,817 | |
| | | | | | | | | | | | | | | | |
| | | | | | | | |
| Total Investments in Securities | | | | | | | | |
| (Cost $1,032,817,947)* | | | 116.97 | % | | | 1,091,358,486 | |
Other Assets and Liabilities, Net | | | (16.97 | ) | | | (158,325,115 | ) |
| | | | | | | | |
| Total Net Assets | | | 100.00 | % | | $ | 933,033,371 | |
| | | | | | | | |
| | | | |
| 56 | | Wells Fargo Advantage Small and Mid Cap Stock Funds | | Portfolio of Investments—April 30, 2011 (Unaudited) |
SPECIAL SMALL CAP VALUE FUND
| ** | Represents an affiliate of the Fund under section 2(a)(2) and 2(a)(3) of the Investment Company Act of 1940, as the Fund holds 5% or more of the issuer’s outstanding voting shares. |
| † | Non-income earning security. |
| « | All or a portion of this security is on loan. |
| (a) | Security is fair valued by the Management Valuation Team, and in certain instances by the Board of Trustees, in accordance with procedures approved by the Board of Trustees. |
| (v) | Security represents investment of cash collateral received from securities on loan. |
| (l) | Investment in an affiliate. The total cost of affiliated investments is $352,950,815. |
| (u) | Rate shown is the 7-day annualized yield at period end. |
| * | Cost for federal income tax purposes is $1,046,817,682 and net unrealized appreciation (depreciation) consists of: |
| | | | |
Gross unrealized appreciation | | $ | 192,487,972 | |
Gross unrealized depreciation | | | (147,947,168 | ) |
| | | | |
Net unrealized appreciation | | $ | 44,540,804 | |
The accompanying notes are an integral part of these financial statements.
| | | | | | |
| Portfolio of Investments—April 30, 2011 (Unaudited) | | Wells Fargo Advantage Small and Mid Cap Stock Funds | | | 57 | |
TRADITIONAL SMALL CAP GROWTH FUND
| | | | | | | | | | | | | | | | |
| Security Name | | | | | | | | Shares | | | Value | |
| | | | | | | | | | | | | | | | |
| | | | |
Common Stocks: 97.97% | | | | | | | | | | | | | | | | |
| | | | |
Consumer Discretionary: 17.29% | | | | | | | | | | | | | | | | |
| | | | |
| Diversified Consumer Services: 3.11% | | | | | | | | | | | | | | | | |
Coinstar Incorporated†« | | | | | | | | | | | 42,800 | | | $ | 2,310,344 | |
K12 Incorporated†« | | | | | | | | | | | 85,700 | | | | 3,374,009 | |
Steiner Leisure Limited†« | | | | | | | | | | | 58,174 | | | | 2,823,766 | |
| | | | |
| | | | | | | | | | | | | | | 8,508,119 | |
| | | | | | | | | | | | | | | | |
| | | | |
| Hotels, Restaurants & Leisure: 3.73% | | | | | | | | | | | | | | | | |
Gaylord Entertainment Company† | | | | | | | | | | | 75,000 | | | | 2,690,250 | |
Pinnacle Entertainment Incorporated†« | | | | | | | | | | | 208,400 | | | | 2,892,592 | |
Shuffle Master Incorporated† | | | | | | | | | | | 233,100 | | | | 2,547,783 | |
Texas Roadhouse Incorporated Class A | | | | | | | | | | | 128,500 | | | | 2,090,695 | |
| | | | |
| | | | | | | | | | | | | | | 10,221,320 | |
| | | | | | | | | | | | | | | | |
| | | | |
| Household Durables: 0.72% | | | | | | | | | | | | | | | | |
Sodastream International Limited†« | | | | | | | | | | | 42,900 | | | | 1,962,246 | |
| | | | | | | | | | | | | | | | |
| | | | |
| Media: 2.63% | | | | | | | | | | | | | | | | |
IMAX Corporation† | | | | | | | | | | | 88,200 | | | | 3,094,056 | |
Knology Incorporated† | | | | | | | | | | | 88,197 | | | | 1,345,004 | |
National CineMedia Incorporated | | | | | | | | | | | 149,326 | | | | 2,604,245 | |
ReachLocal Incorporated† | | | | | | | | | | | 7,400 | | | | 171,976 | |
| | | | |
| | | | | | | | | | | | | | | 7,215,281 | |
| | | | | | | | | | | | | | | | |
| | | | |
| Specialty Retail: 4.20% | | | | | | | | | | | | | | | | |
Children’s Place Retail Stores Incorporated† | | | | | | | | | | | 43,000 | | | | 2,286,310 | |
DSW Incorporated Class A†« | | | | | | | | | | | 42,900 | | | | 2,036,892 | |
Hibbett Sports Incorporated†« | | | | | | | | | | | 57,900 | | | | 2,187,462 | |
Ulta Salon Cosmetics & Fragrance Incorporated†« | | | | | | | | | | | 39,200 | | | | 2,085,048 | |
Vitamin Shoppe Incorporated† | | | | | | | | | | | 74,338 | | | | 2,900,669 | |
| | | | |
| | | | | | | | | | | | | | | 11,496,381 | |
| | | | | | | | | | | | | | | | |
| | | | |
| Textiles, Apparel & Luxury Goods: 2.90% | | | | | | | | | | | | | | | | |
Deckers Outdoor Corporation†« | | | | | | | | | | | 31,100 | | | | 2,639,146 | |
Iconix Brand Group Incorporated†« | | | | | | | | | | | 122,400 | | | | 2,997,576 | |
Warnaco Group Incorporated†« | | | | | | | | | | | 35,800 | | | | 2,304,088 | |
| | | | |
| | | | | | | | | | | | | | | 7,940,810 | |
| | | | | | | | | | | | | | | | |
| | | | |
Consumer Staples: 2.53% | | | | | | | | | | | | | | | | |
| | | | |
| Food Products: 1.34% | | | | | | | | | | | | | | | | |
Diamond Foods Incorporated« | | | | | | | | | | | 56,100 | | | | 3,680,160 | |
| | | | | | | | | | | | | | | | |
| | | | |
| Personal Products: 1.19% | | | | | | | | | | | | | | | | |
Elizabeth Arden Incorporated† | | | | | | | | | | | 108,200 | | | | 3,252,492 | |
| | | | | | | | | | | | | | | | |
| | | | |
Energy: 5.94% | | | | | | | | | | | | | | | | |
| | | | |
| Energy Equipment & Services: 0.99% | | | | | | | | | | | | | | | | |
Matrix Service Company† | | | | | | | | | | | 187,338 | | | | 2,708,907 | |
| | | | | | | | | | | | | | | | |
| | | | |
| 58 | | Wells Fargo Advantage Small and Mid Cap Stock Funds | | Portfolio of Investments—April 30, 2011 (Unaudited) |
TRADITIONAL SMALL CAP GROWTH FUND
| | | | | | | | | | | | | | | | |
| Security Name | | | | | | | | Shares | | | Value | |
| | | | | | | | | | | | | | | | |
| | | | |
| Oil, Gas & Consumable Fuels: 4.95% | | | | | | | | | | | | | | | | |
Georesources Incorporated†« | | | | | | | | | | | 75,300 | | | $ | 2,185,206 | |
Goodrich Petroleum Corporation†« | | | | | | | | | | | 186,400 | | | | 4,188,408 | |
Petrohawk Energy Corporation | | | | | | | | | | | 100,900 | | | | 2,725,309 | |
World Fuel Services Corporation« | | | | | | | | | | | 112,580 | | | | 4,455,916 | |
| | | | |
| | | | | | | | | | | | | | | 13,554,839 | |
| | | | | | | | | | | | | | | | |
| | | | |
Financials: 6.08% | | | | | | | | | | | | | | | | |
| | | | |
| Capital Markets: 1.87% | | | | | | | | | | | | | | | | |
Evercore Partners Incorporated Class A | | | | | | | | | | | 84,500 | | | | 2,948,205 | |
Stifel Financial Corporation† | | | | | | | | | | | 47,397 | | | | 2,165,095 | |
| | | | |
| | | | | | | | | | | | | | | 5,113,300 | |
| | | | | | | | | | | | | | | | |
| | | | |
| Consumer Finance: 1.56% | | | | | | | | | | | | | | | | |
Dollar Financial Corporation† | | | | | | | | | | | 186,301 | | | | 4,283,060 | |
| | | | | | | | | | | | | | | | |
| | | | |
| Diversified Financial Services: 2.65% | | | | | | | | | | | | | | | | |
Higher One Holding Incorporated†« | | | | | | | | | | | 82,200 | | | | 1,158,198 | |
MarketAxess Holdings Incorporated | | | | | | | | | | | 85,200 | | | | 2,074,620 | |
Portfolio Recovery Associates Incorporated† | | | | | | | | | | | 44,500 | | | | 4,016,570 | |
| | | | |
| | | | | | | | | | | | | | | 7,249,388 | |
| | | | | | | | | | | | | | | | |
| | | | |
Health Care: 16.74% | | | | | | | | | | | | | | | | |
| | | | |
| Biotechnology: 3.40% | | | | | | | | | | | | | | | | |
Alexion Pharmaceuticals Incorporated† | | | | | | | | | | | 22,700 | | | | 2,199,403 | |
Cubist Pharmaceuticals Incorporated† | | | | | | | | | | | 23,700 | | | | 802,245 | |
Exact Sciences Corporation†« | | | | | | | | | | | 257,600 | | | | 2,063,376 | |
Incyte Corporation†« | | | | | | | | | | | 117,200 | | | | 2,165,856 | |
Pharmasset Incorporated† | | | | | | | | | | | 20,400 | | | | 2,069,988 | |
| | | | |
| | | | | | | | | | | | | | | 9,300,868 | |
| | | | | | | | | | | | | | | | |
| | | | |
| Health Care Equipment & Supplies: 7.67% | | | | | | | | | | | | | | | | |
DexCom Incorporated† | | | | | | | | | | | 223,988 | | | | 3,729,400 | |
Merit Medical Systems Incorporated† | | | | | | | | | | | 148,600 | | | | 3,465,352 | |
Natus Medical Incorporated† | | | | | | | | | | | 158,091 | | | | 2,682,804 | |
NuVasive Incorporated†« | | | | | | | | | | | 108,400 | | | | 3,348,476 | |
SonoSite Incorporated† | | | | | | | | | | | 75,900 | | | | 2,633,730 | |
Volcano Corporation† | | | | | | | | | | | 104,200 | | | | 2,777,972 | |
Zoll Medical Corporation†« | | | | | | | | | | | 41,900 | | | | 2,374,892 | |
| | | | |
| | | | | | | | | | | | | | | 21,012,626 | |
| | | | | | | | | | | | | | | | |
| | | | |
| Health Care Providers & Services: 4.45% | | | | | | | | | | | | | | | | |
HMS Holdings Corporation†« | | | | | | | | | | | 37,600 | | | | 2,959,496 | |
IPC The Hospitalist Company† | | | | | | | | | | | 76,078 | | | | 3,945,405 | |
PSS World Medical Incorporated† | | | | | | | | | | | 70,800 | | | | 2,036,208 | |
Team Health Holdings LLC† | | | | | | | | | | | 82,500 | | | | 1,640,100 | |
U.S. Physical Therapy Incorporated | | | | | | | | | | | 66,000 | | | | 1,607,100 | |
| | | | |
| | | | | | | | | | | | | | | 12,188,309 | |
| | | | | | | | | | | | | | | | |
| | | | | | |
| Portfolio of Investments—April 30, 2011 (Unaudited) | | Wells Fargo Advantage Small and Mid Cap Stock Funds | | | 59 | |
TRADITIONAL SMALL CAP GROWTH FUND
| | | | | | | | | | | | | | | | |
| Security Name | | | | | | | | Shares | | | Value | |
| | | | | | | | | | | | | | | | |
| | | | |
| Health Care Technology: 1.22% | | | | | | | | | | | | | | | | |
SXC Health Solutions Corporation† | | | | | | | | | | | 60,600 | | | $ | 3,342,696 | |
| | | | | | | | | | | | | | | | |
| | | | |
Industrials: 15.22% | | | | | | | | | | | | | | | | |
| | | | |
| Aerospace & Defense: 2.27% | | | | | | | | | | | | | | | | |
Hexcel Corporation† | | | | | | | | | | | 211,943 | | | | 4,563,133 | |
KEYW Holding Corporation† | | | | | | | | | | | 149,296 | | | | 1,670,622 | |
| | | | |
| | | | | | | | | | | | | | | 6,233,755 | |
| | | | | | | | | | | | | | | | |
| | | | |
| Air Freight & Logistics: 0.89% | | | | | | | | | | | | | | | | |
Forward Air Corporation | | | | | | | | | | | 72,261 | | | | 2,429,415 | |
| | | | | | | | | | | | | | | | |
| | | | |
| Commercial Services & Supplies: 2.03% | | | | | | | | | | | | | | | | |
Consolidated Graphics Incorporated† | | | | | | | | | | | 49,500 | | | | 2,779,425 | |
InnerWorkings Incorporated†« | | | | | | | | | | | 309,236 | | | | 2,773,847 | |
| | | | |
| | | | | | | | | | | | | | | 5,553,272 | |
| | | | | | | | | | | | | | | | |
| | | | |
| Electrical Equipment: 2.80% | | | | | | | | | | | | | | | | |
EnerSys Company† | | | | | | | | | | | 104,000 | | | | 3,940,560 | |
Polypore International Incorporated†« | | | | | | | | | | | 60,237 | | | | 3,720,839 | |
| | | | |
| | | | | | | | | | | | | | | 7,661,399 | |
| | | | | | | | | | | | | | | | |
| | | | |
| Machinery: 3.92% | | | | | | | | | | | | | | | | |
Barnes Group Incorporated« | | | | | | | | | | | 137,300 | | | | 3,396,802 | |
RBC Bearings Incorporated†« | | | | | | | | | | | 89,347 | | | | 3,507,763 | |
Tennant Company | | | | | | | | | | | 34,100 | | | | 1,398,782 | |
Titan International Incorporated« | | | | | | | | | | | 78,700 | | | | 2,431,043 | |
| | | | |
| | | | | | | | | | | | | | | 10,734,390 | |
| | | | | | | | | | | | | | | | |
| | | | |
| Road & Rail: 0.98% | | | | | | | | | | | | | | | | |
Knight Transportation Incorporated | | | | | | | | | | | 149,300 | | | | 2,688,893 | |
| | | | | | | | | | | | | | | | |
| | | | |
| Trading Companies & Distributors: 2.33% | | | | | | | | | | | | | | | | |
Interline Brands Incorporated† | | | | | | | | | | | 103,523 | | | | 2,186,406 | |
MSC Industrial Direct Company« | | | | | | | | | | | 58,600 | | | | 4,195,174 | |
| | | | |
| | | | | | | | | | | | | | | 6,381,580 | |
| | | | | | | | | | | | | | | | |
| | | | |
Information Technology: 29.22% | | | | | | | | | | | | | | | | |
| | | | |
| Communications Equipment: 2.03% | | | | | | | | | | | | | | | | |
Finisar Corporation†« | | | | | | | | | | | 102,500 | | | | 2,879,225 | |
Shoretel Incorporated† | | | | | | | | | | | 256,300 | | | | 2,678,335 | |
| | | | |
| | | | | | | | | | | | | | | 5,557,560 | |
| | | | | | | | | | | | | | | | |
| | | | |
| Electronic Equipment & Instruments: 2.26% | | | | | | | | | | | | | | | | |
Ciena Corporation†« | | | | | | | | | | | 140,300 | | | | 3,962,072 | |
DTS Incorporated† | | | | | | | | | | | 50,700 | | | | 2,233,842 | |
| | | | |
| | | | | | | | | | | | | | | 6,195,914 | |
| | | | | | | | | | | | | | | | |
| | | | |
| Internet Software & Services: 10.79% | | | | | | | | | | | | | | | | |
Cogent Communications Group Incorporated† | | | | | | | | | | | 201,900 | | | | 2,929,569 | |
| | | | |
| 60 | | Wells Fargo Advantage Small and Mid Cap Stock Funds | | Portfolio of Investments—April 30, 2011 (Unaudited) |
TRADITIONAL SMALL CAP GROWTH FUND
| | | | | | | | | | | | | | | | |
| Security Name | | | | | | | | Shares | | | Value | |
| | | | | | | | | | | | | | | | |
| | | | |
| Internet Software & Services (continued) | | | | | | | | | | | | | | | | |
ComScore Incorporated† | | | | | | | | | | | 137,936 | | | $ | 4,111,872 | |
Constant Contact Incorporated†« | | | | | | | | | | | 65,218 | | | | 1,807,191 | |
Dice Holdings Incorporated† | | | | | | | | | | | 110,000 | | | | 2,016,300 | |
Equinix Incorporated† | | | | | | | | | | | 42,454 | | | | 4,273,420 | |
LivePerson Incorporated† | | | | | | | | | | | 176,442 | | | | 2,357,265 | |
LogMeIn Incorporated†« | | | | | | | | | | | 53,900 | | | | 2,321,473 | |
NIC Incorporated | | | | | | | | | | | 204,216 | | | | 2,625,197 | |
SPS Commerce Incorporated† | | | | | | | | | | | 91,635 | | | | 1,503,730 | |
Support.com Incorporated† | | | | | | | | | | | 419,482 | | | | 2,403,632 | |
Vocus Incorporated† | | | | | | | | | | | 107,708 | | | | 3,191,388 | |
| | | | |
| | | | | | | | | | | | | | | 29,541,037 | |
| | | | | | | | | | | | | | | | |
| | | | |
| IT Services: 0.40% | | | | | | | | | | | | | | | | |
Lionbridge Technologies Incorporated† | | | | | | | | | | | 328,400 | | | | 1,106,708 | |
| | | | | | | | | | | | | | | | |
| | | | |
| Semiconductors & Semiconductor Equipment: 6.14% | | | | | | | | | | | | | | | | |
Cavium Networks Incorporated† | | | | | | | | | | | 50,300 | | | | 2,375,166 | |
Inphi Corporation† | | | | | | | | | | | 108,516 | | | | 2,341,775 | |
Mellanox Technologies†« | | | | | | | | | | | 69,784 | | | | 2,061,419 | |
NetLogic Microsystems Incorporated† | | | | | | | | | | | 60,300 | | | | 2,600,739 | |
Power Integrations Incorporated | | | | | | | | | | | 77,400 | | | | 3,122,316 | |
Silicon Image Incorporated† | | | | | | | | | | | 158,900 | | | | 1,322,048 | |
Volterra Semiconductor Corporation†« | | | | | | | | | | | 113,900 | | | | 2,994,431 | |
| | | | |
| | | | | | | | | | | | | | | 16,817,894 | |
| | | | | | | | | | | | | | | | |
| | | | |
| Software: 7.60% | | | | | | | | | | | | | | | | |
Concur Technologies Incorporated†« | | | | | | | | | | | 61,478 | | | | 3,557,732 | |
Radiant Systems Incorporated† | | | | | | | | | | | 121,200 | | | | 2,414,304 | |
Reald Incorporated†« | | | | | | | | | | | 95,000 | | | | 2,762,600 | |
Realpage Incorporated† | | | | | | | | | | | 51,395 | | | | 1,639,501 | |
Sourcefire Incorporated†« | | | | | | | | | | | 94,800 | | | | 2,523,576 | |
Taleo Corporation Class A† | | | | | | | | | | | 133,100 | | | | 4,827,537 | |
Ultimate Software Group Incorporated† | | | | | | | | | | | 55,274 | | | | 3,095,344 | |
| | | | |
| | | | | | | | | | | | | | | 20,820,594 | |
| | | | | | | | | | | | | | | | |
| | | | |
Materials: 4.95% | | | | | | | | | | | | | | | | |
| | | | |
| Chemicals: 3.67% | | | | | | | | | | | | | | | | |
Cytec Industries Incorporated | | | | | | | | | | | 59,900 | | | | 3,514,932 | |
Intrepid Potash Incorporated†« | | | | | | | | | | | 75,838 | | | | 2,598,210 | |
Rockwood Holdings Incorporated†« | | | | | | | | | | | 69,752 | | | | 3,957,730 | |
| | | | |
| | | | | | | | | | | | | | | 10,070,872 | |
| | | | | | | | | | | | | | | | |
| | | | |
| Metals & Mining: 1.28% | | | | | | | | | | | | | | | | |
Materion Corporation† | | | | | | | | | | | 83,797 | | | | 3,499,363 | |
| | | | | | | | | | | | | | | | |
| | | | |
Total Common Stocks (Cost $180,647,692) | | | | | | | | | | | | | | | 268,323,448 | |
| | | | | | | | | | | | | | | | |
| | | | | | |
| Portfolio of Investments—April 30, 2011 (Unaudited) | | Wells Fargo Advantage Small and Mid Cap Stock Funds | | | 61 | |
TRADITIONAL SMALL CAP GROWTH FUND
| | | | | | | | | | | | | | | | |
| Security Name | | | | | Yield | | | Shares | | | Value | |
| | | | | | | | | | | | | | | | |
| | | | |
Short-Term Investments: 27.34% | | | | | | | | | | | | | | | | |
| | | | |
| Investment Companies: 27.34% | | | | | | | | | | | | | | | | |
Wells Fargo Advantage Cash Investment Money Market Fund(l)(u) | | | | | | | 0.09 | % | | | 7,148,532 | | | $ | 7,148,532 | |
Wells Fargo Securities Lending Cash Investments, LLC(l)(u)(v) | | | | | | | 0.20 | | | | 67,744,654 | | | | 67,744,654 | |
| | | | |
Total Short-Term Investments (Cost $74,893,186) | | | | | | | | | | | | | | | 74,893,186 | |
| | | | | | | | | | | | | | | | |
| | | | | | | | |
| Total Investments in Securities | | | | | | | | |
| (Cost $255,540,878)* | | | 125.31 | % | | | 343,216,634 | |
Other Assets and Liabilities, Net | | | (25.31 | ) | | | (69,319,217 | ) |
| | | | | | | | |
| Total Net Assets | | | 100.00 | % | | $ | 273,897,417 | |
| | | | | | | | |
| † | Non-income earning security. |
| « | All or a portion of this security is on loan. |
| (l) | Investment in an affiliate. |
| (u) | Rate shown is the 7-day annualized yield at period end. |
| (v) | Security represents investment of cash collateral received from securities on loan. |
| * | Cost for federal income tax purposes is $259,483,044 and net unrealized appreciation (depreciation) consists of: |
| | | | |
Gross unrealized appreciation | | $ | 84,617,800 | |
Gross unrealized depreciation | | | (884,210 | ) |
| | | | |
Net unrealized appreciation | | $ | 83,733,590 | |
The accompanying notes are an integral part of these financial statements.
| | | | |
| 62 | | Wells Fargo Advantage Small and Mid Cap Stock Funds | | Statement of Assets and Liabilities—April 30, 2011 (Unaudited) |
| | | | | | | | |
| | | Intrinsic Small Cap Value Fund | | | Small Cap
Growth Fund | |
| | |
Assets | | | | | | | | |
Investments | | | | | | | | |
In unaffiliated securities (including securities on loan), at value | | $ | 136,747,344 | | | $ | 1,342,520,326 | |
In affiliated securities, at value | | | 35,903,664 | | | | 284,200,429 | |
| | | | | | | | |
Total investments, at value (see cost below) | | | 172,651,008 | | | | 1,626,720,755 | |
Foreign currency, at value (see cost below) | | | 0 | | | | 0 | |
Receivable for investments sold | | | 615,761 | | | | 60,867,421 | |
Receivable for Fund shares sold | | | 143,888 | | | | 2,202,517 | |
Receivable for dividends | | | 11,745 | | | | 19,402 | |
Receivable for securities lending income | | | 4,805 | | | | 67,450 | |
Prepaid expenses and other assets | | | 73,732 | | | | 52,606 | |
| | | | | | | | |
Total assets | | | 173,500,939 | | | | 1,689,930,151 | |
| | | | | | | | |
| | |
Liabilities | | | | | | | | |
Payable for investments purchased | | | 3,154,564 | | | | 53,480,797 | |
Payable for Fund shares redeemed | | | 238,579 | | | | 1,289,139 | |
Payable upon receipt of securities loaned | | | 28,903,795 | | | | 251,197,171 | |
Written options, at value | | | 0 | | | | 0 | |
Advisory fee payable | | | 98,254 | | | | 862,159 | |
Distribution fees payable | | | 80 | | | | 5,828 | |
Due to other related parties | | | 21,310 | | | | 184,158 | |
Shareholder servicing fees payable | | | 16,009 | | | | 125,860 | |
Accrued expenses and other liabilities | | | 190,723 | | | | 137,284 | |
| | | | | | | | |
Total liabilities | | | 32,623,314 | | | | 307,282,396 | |
| | | | | | | | |
Total net assets | | $ | 140,877,625 | | | $ | 1,382,647,755 | |
| | | | | | | | |
| | |
NET ASSETS CONSIST OF | | | | | | | | |
Paid-in capital | | $ | 209,289,131 | | | $ | 1,035,993,981 | |
Undistributed (overdistributed) net investment income (loss) | | | (203,070 | ) | | | (4,885,728 | ) |
Accumulated net realized gains (losses) on investments | | | (93,975,899 | ) | | | 134,849,123 | |
Net unrealized gains on investments | | | 25,767,463 | | | | 216,690,379 | |
| | | | | | | | |
Total net assets | | $ | 140,877,625 | | | $ | 1,382,647,755 | |
| | | | | | | | |
| | |
COMPUTATION OF NET ASSET VALUE AND OFFERING PRICE PER SHARE1 | | | | | | | | |
Net assets – Class A | | $ | 251,116 | | | $ | 167,303,616 | |
Shares outstanding – Class A | | | 15,025 | | | | 11,394,125 | |
Net asset value per share – Class A | | $ | 16.71 | | | $ | 14.68 | |
Maximum offering price per share – Class A2 | | $ | 17.73 | | | $ | 15.58 | |
Net assets – Class B | | | NA | | | $ | 3,333,320 | |
Shares outstanding – Class B | | | NA | | | | 245,169 | |
Net asset value per share – Class B | | | NA | | | $ | 13.60 | |
Net assets – Class C | | $ | 133,272 | | | $ | 6,087,855 | |
Shares outstanding – Class C | | | 8,213 | | | | 446,930 | |
Net asset value per share – Class C | | $ | 16.23 | | | $ | 13.62 | |
Net assets – Administrator Class | | $ | 15,254,077 | | | $ | 425,697,337 | |
Shares outstanding – Administrator Class | | | 904,596 | | | | 28,444,563 | |
Net asset value per share – Administrator Class | | $ | 16.86 | | | $ | 14.97 | |
Net assets – Institutional Class | | $ | 56,493,917 | | | $ | 745,623,898 | |
Shares outstanding – Institutional Class | | | 3,327,037 | | | | 48,757,615 | |
Net asset value per share – Institutional Class | | $ | 16.98 | | | $ | 15.29 | |
Net assets – Investor Class | | $ | 68,745,243 | | | $ | 34,601,729 | |
Shares outstanding – Investor Class | | | 4,147,988 | | | | 2,381,018 | |
Net asset value per share – Investor Class | | $ | 16.57 | | | $ | 14.53 | |
| | | | | | | | |
Total investments, at cost | | $ | 146,883,545 | | | $ | 1,410,030,376 | |
| | | | | | | | |
Securities on loan, at value | | $ | 28,217,780 | | | $ | 245,290,484 | |
| | | | | | | | |
Foreign currency, at cost | | $ | 0 | | | $ | 0 | |
| | | | | | | | |
Written options, premiums received | | $ | 0 | | | $ | 0 | |
| | | | | | | | |
| 1. | Each Fund has an unlimited number of authorized shares. |
| 2. | Maximum offering price is computed as 100/94.25 of net asset value. On investments of $50,000 or more, the offering price is reduced. |
The accompanying notes are an integral part of these financial statements.
| | | | | | |
| Statement of Assets and Liabilities—April 30, 2011 (Unaudited) | | Wells Fargo Advantage Small and Mid Cap Stock Funds | | | 63 | |
| | | | | | | | | | | | | | | | | | |
Small Cap
Opportunities
Fund | | | Small Cap Value Fund | | | Small/Mid Cap
Value Fund | | | Special Small Cap
Value Fund | | | Traditional Small
Cap Growth Fund | |
| | | | |
| | | | | | | | | | | | | | | | | | |
| | | | | | | | | | | | | | | | | | |
| $ | 734,698,511 | | | $ | 3,340,800,721 | | | $ | 282,018,669 | | | $ | 800,280,336 | | | $ | 268,323,448 | |
| | 253,272,901 | | | | 1,248,715,292 | | | | 2,110,226 | | | | 291,078,150 | | | | 74,893,186 | |
| | | | | | | | | | | | | | | | | | | |
| | 987,971,412 | | | | 4,589,516,013 | | | | 284,128,895 | | | | 1,091,358,486 | | | | 343,216,634 | |
| | 872,277 | | | | 1,024,521 | | | | 0 | | | | 0 | | | | 0 | |
| | 10,195,007 | | | | 2,411,935 | | | | 732,614 | | | | 6,071,820 | | | | 3,962,950 | |
| | 741,540 | | | | 10,729,217 | | | | 161,062 | | | | 384,569 | | | | 66,367 | |
| | 101,873 | | | | 802,764 | | | | 40,918 | | | | 268,522 | | | | 3,342 | |
| | 42,692 | | | | 0 | | | | 0 | | | | 3,330 | | | | 18,628 | |
| | 25,717 | | | | 118,463 | | | | 51,457 | | | | 31,280 | | | | 32,032 | |
| | | | | | | | | | | | | | | | | | | |
| | 999,950,518 | | | | 4,604,602,913 | | | | 285,114,946 | | | | 1,098,118,007 | | | | 347,299,953 | |
| | | | | | | | | | | | | | | | | | | |
| | | | |
| | | | | | | | | | | | | | | | | | |
| | 11,152,089 | | | | 1,348,406 | | | | 194,763 | | | | 3,468,479 | | | | 4,938,061 | |
| | 3,109,896 | | | | 17,868,536 | | | | 473,370 | | | | 2,058,551 | | | | 375,642 | |
| | 161,988,088 | | | | 0 | | | | 0 | | | | 158,135,459 | | | | 67,744,654 | |
| | 0 | | | | 2,564,136 | | | | 0 | | | | 0 | | | | 0 | |
| | 575,730 | | | | 2,716,321 | | | | 173,598 | | | | 600,270 | | | | 172,814 | |
| | 0 | | | | 83,205 | | | | 9,309 | | | | 49,770 | | | | 218 | |
| | 100,320 | | | | 1,043,849 | | | | 62,219 | | | | 200,894 | | | | 54,300 | |
| | 167,200 | | | | 652,544 | | | | 53,076 | | | | 185,997 | | | | 34,712 | |
| | 83,504 | | | | 341,622 | | | | 20,971 | | | | 385,216 | | | | 82,135 | |
| | | | | | | | | | | | | | | | | | | |
| | 177,176,827 | | | | 26,618,619 | | | | 987,306 | | | | 165,084,636 | | | | 73,402,536 | |
| | | | | | | | | | | | | | | | | | | |
| $ | 822,773,691 | | | $ | 4,577,984,294 | | | $ | 284,127,640 | | | $ | 933,033,371 | | | $ | 273,897,417 | |
| | | | | | | | | | | | | | | | | | | |
| | | | |
| | | | | | | | | | | | | | | | | | |
| $ | 626,655,994 | | | $ | 3,268,428,661 | | | $ | 242,309,239 | | | $ | 1,002,617,378 | | | $ | 224,061,903 | |
| | 703,853 | | | | 9,237,929 | | | | (205,046 | ) | | | (1,055,639 | ) | | | (1,025,679 | ) |
| | 27,801,371 | | | | 157,015,621 | | | | (32,409,102 | ) | | | (127,068,907 | ) | | | (36,814,563 | ) |
| | 167,612,473 | | | | 1,143,302,083 | | | | 74,432,549 | | | | 58,540,539 | | | | 87,675,756 | |
| | | | | | | | | | | | | | | | | | | |
| $ | 822,773,691 | | | $ | 4,577,984,294 | | | $ | 284,127,640 | | | $ | 933,033,371 | | | $ | 273,897,417 | |
| | | | | | | | | | | | | | | | | | | |
| | | | |
| | | | | | | | | | | | | | | | | | |
| | NA | | | $ | 767,576,479 | | | $ | 49,766,066 | | | $ | 507,750,482 | | | $ | 160,477,519 | |
| | NA | | | | 22,692,164 | | | | 2,994,829 | | | | 21,646,509 | | | | 8,717,417 | |
| | NA | | | $ | 33.83 | | | $ | 16.62 | | | $ | 23.46 | | | $ | 18.41 | |
| | NA | | | $ | 35.89 | | | $ | 17.63 | | | $ | 24.89 | | | $ | 19.53 | |
| | NA | | | $ | 11,704,743 | | | | NA | | | $ | 32,249,297 | | | | NA | |
| | NA | | | | 379,569 | | | | NA | | | | 1,446,860 | | | | NA | |
| | NA | | | $ | 30.84 | | | | NA | | | $ | 22.29 | | | | NA | |
| | NA | | | $ | 121,815,348 | | | $ | 14,858,456 | | | $ | 44,065,297 | | | $ | 116,698 | |
| | NA | | | | 3,940,251 | | | | 906,235 | | | | 1,970,017 | | | | 6,374 | |
| | NA | | | $ | 30.92 | | | $ | 16.40 | | | $ | 22.37 | | | $ | 18.31 | |
| $ | 822,773,691 | | | $ | 469,892,033 | | | $ | 88,188,907 | | | $ | 319,378,102 | | | $ | 3,932,653 | |
| | 22,101,869 | | | | 13,650,320 | | | | 5,213,223 | | | | 13,481,741 | | | | 203,836 | |
| $ | 37.23 | | | $ | 34.42 | | | $ | 16.92 | | | $ | 23.69 | | | $ | 19.29 | |
| | NA | | | $ | 1,173,666,701 | | | $ | 29,409,724 | | | $ | 29,590,193 | | | $ | 109,370,547 | |
| | NA | | | | 34,032,264 | | | | 1,731,209 | | | | 1,248,053 | | | | 5,658,035 | |
| | NA | | | $ | 34.49 | | | $ | 16.99 | | | $ | 23.71 | | | $ | 19.33 | |
| | NA | | | $ | 2,033,328,990 | | | $ | 101,904,487 | | | | NA | | | | NA | |
| | NA | | | | 59,150,848 | | | | 6,106,747 | | | | NA | | | | NA | |
| | NA | | | $ | 34.38 | | | $ | 16.69 | | | | NA | | | | NA | |
| | | | | | | | | | | | | | | | | | | |
| $ | 820,411,823 | | | $ | 3,445,972,254 | | | $ | 209,696,297 | | | $ | 1,032,817,947 | | | $ | 255,540,878 | |
| | | | | | | | | | | | | | | | | | | |
| $ | 157,997,360 | | | $ | 0 | | | $ | 0 | | | $ | 153,363,485 | | | $ | 66,132,619 | |
| | | | | | | | | | | | | | | | | | | |
| $ | 819,393 | | | $ | 1,018,332 | | | $ | 0 | | | $ | 0 | | | $ | 0 | |
| | | | | | | | | | | | | | | | | | | |
| $ | 0 | | | $ | 2,315,905 | | | $ | 0 | | | $ | 0 | | | $ | 0 | |
| | | | | | | | | | | | | | | | | | | |
| | | | |
| 64 | | Wells Fargo Advantage Small and Mid Cap Stock Funds | | Statement of Operations—Six Months Ended April 30, 2011 (Unaudited) |
| | | | | | | | |
| | | Intrinsic Small
Cap Value Fund | | | Small Cap
Growth Fund | |
| | |
Investment income | | | | | | | | |
Dividends* | | $ | 681,608 | | | $ | 1,675,641 | |
Interest | | | 0 | | | | 0 | |
Income from affiliated securities | | | 6,406 | | | | 45,489 | |
Securities lending income, net | | | 33,299 | | | | 280,163 | |
| | | | | | | | |
Total investment income | | | 721,313 | | | | 2,001,293 | |
| | | | | | | | |
| | |
Expenses | | | | | | | | |
Advisory fee | | | 596,136 | | | | 4,981,227 | |
Administration fees | | | | | | | | |
Fund level | | | 37,258 | | | | 319,616 | |
Class A | | | 366 | | | | 227,474 | |
Class B | | | NA | | | | 4,384 | |
Class C | | | 188 | | | | 7,569 | |
Administrator Class | | | 6,987 | | | | 194,761 | |
Institutional Class | | | 25,650 | | | | 268,920 | |
Investor Class | | | 116,339 | | | | 53,569 | |
Shareholder servicing fees | | | | | | | | |
Class A | | | 352 | | | | 214,479 | |
Class B | | | NA | | | | 4,215 | |
Class C | | | 180 | | | | 7,278 | |
Administrator Class | | | 12,515 | | | | 475,429 | |
Investor Class | | | 86,618 | | | | 40,115 | |
Distribution fees | | | | | | | | |
Class B | | | NA | | | | 12,645 | |
Class C | | | 541 | | | | 21,833 | |
Custody and accounting fees | | | 6,636 | | | | 40,311 | |
Professional fees | | | 11,857 | | | | 16,870 | |
Registration fees | | | 16,417 | | | | 33,756 | |
Shareholder report expenses | | | 31,068 | | | | 97,234 | |
Trustees’ fees and expenses | | | 5,274 | | | | 5,274 | |
Other fees and expenses | | | 5,862 | | | | 7,119 | |
| | | | | | | | |
Total expenses | | | 960,244 | | | | 7,034,078 | |
Less: Fee waivers and/or expense reimbursements | | | (35,861 | ) | | | (147,057 | ) |
| | | | | | | | |
Net expenses | | | 924,383 | | | | 6,887,021 | |
| | | | | | | | |
Net investment income (loss) | | | (203,070 | ) | | | (4,885,728 | ) |
| | | | | | | | |
| | |
REALIZED AND UNREALIZED GAINS (LOSSES) ON INVESTMENTS | | | | | | | | |
| | |
Net realized gains (losses) on: | | | | | | | | |
Unaffiliated securities | | | 12,069,964 | | | | 156,866,318 | |
Affiliated securities | | | 0 | | | | 0 | |
Written options | | | 0 | | | | 0 | |
| | | | | | | | |
Net realized gains on investments | | | 12,069,964 | | | | 156,866,318 | |
| | | | | | | | |
| | |
Net change in unrealized gains (losses) on: | | | | | | | | |
Unaffiliated securities | | | 17,553,575 | | | | 105,370,589 | |
Affiliated securities | | | 0 | | | | 0 | |
Written options | | | 0 | | | | 0 | |
| | | | | | | | |
Net change in unrealized gains (losses) on investments | | | 17,553,575 | | | | 105,370,589 | |
| | | | | | | | |
Net realized and unrealized gains (losses) on investments | | | 29,623,539 | | | | 262,236,907 | |
| | | | | | | | |
Net increase in net assets resulting from operations | | $ | 29,420,469 | | | $ | 257,351,179 | |
| | | | | | | | |
| | |
* Net of foreign withholding taxes of | | | $0 | | | | $0 | |
The accompanying notes are an integral part of these financial statements.
| | | | | | |
| Statement of Operations—Six Months Ended April 30, 2011 (Unaudited) | | Wells Fargo Advantage Small and Mid Cap Stock Funds | | | 65 | |
| | | | | | | | | | | | | | | | | | |
Small Cap
Opportunities
Fund | | | Small Cap
Value Fund | | | Small/Mid Cap
Value Fund | | | Special Small Cap
Value Fund | | | Traditional Small
Cap Growth Fund | |
| | | | |
| | | | | | | | | | | | | | | | | | |
| | 5,036,863 | | | | 30,664,150 | | | | 2,492,817 | | | | 4,829,581 | | | | 406,041 | |
| | 0 | | | | 0 | | | | 0 | | | | 34,288 | | | | 0 | |
| | 81,632 | | | | 4,944,621 | | | | 2,487 | | | | 632,292 | | | | 5,112 | |
| | 232,302 | | | | 0 | | | | 0 | | | | 118,195 | | | | 107,254 | |
| | | | | | | | | | | | | | | | | | | |
| | 5,350,797 | | | | 35,608,771 | | | | 2,495,304 | | | | 5,614,356 | | | | 518,407 | |
| | | | | | | | | | | | | | | | | | | |
| | | | |
| | | | | | | | | | | | | | | | | | |
| | 3,063,480 | | | | 15,671,097 | | | | 1,002,619 | | | | 3,627,010 | | | | 1,031,335 | |
| | | | | | | | | | | | | | | | | | |
| | 193,623 | | | | 1,061,487 | | | | 66,841 | | | | 229,979 | | | | 64,458 | |
| | NA | | | | 945,159 | | | | 60,495 | | | | 650,043 | | | | 190,355 | |
| | NA | | | | 24,813 | | | | NA | | | | 45,204 | | | | NA | |
| | NA | | | | 144,386 | | | | 17,866 | | | | 55,420 | | | | 137 | |
| | 387,245 | | | | 82,743 | | | | 40,816 | | | | 160,332 | | | | 1,531 | |
| | NA | | | | 472,547 | | | | 9,803 | | | | 8,727 | | | | 43,296 | |
| | NA | | | | 3,369,133 | | | | 166,565 | | | | NA | | | | NA | |
| | | | | | | | | | | | | | | | | | |
| | NA | | | | 894,508 | | | | 58,168 | | | | 606,784 | | | | 180,777 | |
| | NA | | | | 23,572 | | | | NA | | | | 43,466 | | | | NA | |
| | NA | | | | 138,833 | | | | 17,179 | | | | 53,289 | | | | 132 | |
| | 968,113 | | | | 196,644 | | | | 99,453 | | | | 391,522 | | | | 3,328 | |
| | NA | | | | 2,515,767 | | | | 125,756 | | | | NA | | | | NA | |
| | | | | | | | | | | | | | | | | | |
| | NA | | | | 71,577 | | | | NA | | | | 130,397 | | | | NA | |
| | NA | | | | 416,497 | | | | 51,537 | | | | 159,865 | | | | 395 | �� |
| | 24,881 | | | | 114,994 | | | | 31,951 | | | | 34,071 | | | | 12,154 | |
| | 19,192 | | | | 30,736 | | | | 17,128 | | | | 18,429 | | | | 22,277 | |
| | 5,984 | | | | 32,411 | | | | 29,917 | | | | 19,329 | | | | 12,912 | |
| | 30,915 | | | | 198,884 | | | | 22,439 | | | | 33,725 | | | | 19,252 | |
| | 5,274 | | | | 5,274 | | | | 5,274 | | | | 10,761 | | | | 10,156 | |
| | 9,355 | | | | 40,299 | | | | 3,904 | | | | 87,196 | | | | 2,000 | |
| | | | | | | | | | | | | | | | | | | |
| | 4,708,062 | | | | 26,451,361 | | | | 1,827,711 | | | | 6,365,549 | | | | 1,594,495 | |
| | (61,118 | ) | | | (659,481 | ) | | | (33,452 | ) | | | (357,079 | ) | | | (73,757 | ) |
| | | | | | | | | | | | | | | | | | | |
| | 4,646,944 | | | | 25,791,880 | | | | 1,794,259 | | | | 6,008,470 | | | | 1,520,738 | |
| | | | | | | | | | | | | | | | | | | |
| | 703,853 | | | | 9,816,891 | | | | 701,045 | | | | (394,114 | ) | | | (1,002,331 | ) |
| | | | | | | | | | | | | | | | | | | |
| | | | |
| | | | | | | | | | | | | | | | | | |
| | | | |
| | | | | | | | | | | | | | | | | | |
| | 67,381,655 | | | | 226,755,520 | | | | 2,372,765 | | | | 36,136,030 | | | | 40,475,388 | |
| | 0 | | | | 45,764,174 | | | | (2,085 | ) | | | (3,375,818 | ) | | | 0 | |
| | 0 | | | | (1,637,928 | ) | | | 53,498 | | | | 0 | | | | 0 | |
| | | | | | | | | | | | | | | | | | | |
| | 67,381,655 | | | | 270,881,766 | | | | 2,424,178 | | | | 32,760,212 | | | | 40,475,388 | |
| | | | | | | | | | | | | | | | | | | |
| | | | |
| | | | | | | | | | | | | | | | | | |
| | 64,122,981 | | | | 353,067,238 | | | | 37,711,237 | | | | 96,592,667 | | | | 25,489,493 | |
| | 0 | | | | (44,642,747 | ) | | | 388,390 | | | | 28,429,845 | | | | 0 | |
| | 0 | | | | (42,579 | ) | | | 0 | | | | 0 | | | | 0 | |
| | | | | | | | | | | | | | | | | | | |
| | 64,122,981 | | | | 308,381,912 | | | | 38,099,627 | | | | 125,022,512 | | | | 25,489,493 | |
| | | | | | | | | | | | | | | | | | | |
| | 131,504,636 | | | | 579,263,678 | | | | 40,523,805 | | | | 157,782,724 | | | | 65,964,881 | |
| | | | | | | | | | | | | | | | | | | |
| | 132,208,489 | | | | 589,080,569 | | | | 41,224,850 | | | | 157,388,610 | | | | 64,962,550 | |
| | | | | | | | | | | | | | | | | | | |
| | | | |
| | $5,636 | | | | $204,389 | | | | $15,899 | | | | $0 | | | | $0 | |
| | | | |
| 66 | | Wells Fargo Advantage Small and Mid Cap Stock Funds | | Statements of Changes in Net Assets |
| | | | | | | | | | | | | | | | |
| | | Intrinsic Small Cap Value Fund | |
| | | Six Months Ended
April 30, 2011
(Unaudited) | | | Year Ended
October 31, 2010 | |
| | | | |
Operations | | | | | | | | | | | | | | | | |
Net investment income (loss) | | | | | | $ | (203,070 | ) | | | | | | $ | (821,870 | ) |
Net realized gains (loss) on investments | | | | | | | 12,069,964 | | | | | | | | (9,453,633 | ) |
Net change in unrealized gains (losses) on investments | | | | | | | 17,553,575 | | | | | | | | 46,501,202 | |
| | | | | | | | | | | | | | | | |
Net increase in net assets resulting from operations | | | | | | | 29,420,469 | | | | | | | | 36,225,699 | |
| | | | | | | | | | | | | | | | |
| | | | |
Distributions to shareholders from | | | | | | | | | | | | | | | | |
Net realized gains | | | | | | | | | | | | | | | | |
Class A | | | | | | | 0 | | | | | | | | 0 | |
Class B | | | | | | | NA | | | | | | | | NA | |
Class C | | | | | | | 0 | | | | | | | | 0 | |
Administrator Class | | | | | | | 0 | | | | | | | | 0 | |
Institutional Class | | | | | | | 0 | | | | | | | | 0 | |
Investor Class | | | | | | | 0 | | | | | | | | 0 | |
| | | | | | | | | | | | | | | | |
Total distributions to shareholders | | | | | | | 0 | | | | | | | | 0 | |
| | | | | | | | | | | | | | | | |
| | | | |
| | | Shares | | | | | | Shares | | | | |
| | | | |
Capital share transactions | | | | | | | | | | | | | | | | |
Proceeds from shares sold | | | | | | | | | | | | | | | | |
Class A | | | 2,655 | | | | 41,446 | | | | 15,776 | | | | 204,434 | |
Class B | | | NA | | | | NA | | | | NA | | | | NA | |
Class C | | | 2,397 | | | | 37,744 | | | | 1,800 | | | | 24,769 | |
Administrator Class | | | 960,748 | | | | 14,201,857 | | | | 108,637 | | | | 1,415,320 | |
Institutional Class | | | 223,577 | | | | 3,481,834 | | | | 588,714 | | | | 7,777,802 | |
Investor Class | | | 117,233 | | | | 1,816,009 | | | | 1,018,026 | | | | 13,060,377 | |
| | | | | | | | | | | | | | | | |
| | | | | | | 19,578,890 | | | | | | | | 22,482,702 | |
| | | | | | | | | | | | | | | | |
Reinvestment of distributions | | | | | | | | | | | | | | | | |
Class A | | | 0 | | | | 0 | | | | 0 | | | | 0 | |
Class B | | | NA | | | | NA | | | | NA | | | | NA | |
Class C | | | 0 | | | | 0 | | | | 0 | | | | 0 | |
Administrator Class | | | 0 | | | | 0 | | | | 0 | | | | 0 | |
Institutional Class | | | 0 | | | | 0 | | | | 0 | | | | 0 | |
Investor Class | | | 0 | | | | 0 | | | | 0 | | | | 0 | |
| | | | | | | | | | | | | | | | |
| | | | | | | 0 | | | | | | | | 0 | |
| | | | | | | | | | | | | | | | |
Payment for shares redeemed | | | | | | | | | | | | | | | | |
Class A | | | (13,246 | ) | | | (201,408 | ) | | | (15,336 | ) | | | (193,486 | ) |
Class B | | | NA | | | | NA | | | | NA | | | | NA | |
Class C | | | (4,724 | ) | | | (72,106 | ) | | | (2,903 | ) | | | (35,895 | ) |
Administrator Class | | | (471,285 | ) | | | (7,215,437 | ) | | | (188,383 | ) | | | (2,456,938 | ) |
Institutional Class | | | (2,054,283 | ) | | | (32,382,758 | ) | | | (1,021,167 | ) | | | (13,279,134 | ) |
Investor Class | | | (1,747,196 | ) | | | (25,852,789 | ) | | | (10,988,353 | ) | | | (136,366,356 | ) |
| | | | | | | | | | | | | | | | |
| | | | | | | (65,724,498 | ) | | | | | | | (152,331,809 | ) |
| | | | | | | | | | | | | | | | |
Net increase (decrease) in net assets resulting
from capital share transactions | | | | | | | (46,145,608 | ) | | | | | | | (129,849,107 | ) |
| | | | | | | | | | | | | | | | |
Total increase (decrease) in net assets | | | | | | | (16,725,139 | ) | | | | | | | (93,623,408 | ) |
| | | | | | | | | | | | | | | | |
| | | | |
Net assets | | | | | | | | | | | | | | | | |
Beginning of period | | | | | | | 157,602,764 | | | | | | | | 251,226,172 | |
| | | | | | | | | | | | | | | | |
End of period | | | | | | $ | 140,877,625 | | | | | | | $ | 157,602,764 | |
| | | | | | | | | | | | | | | | |
Undistributed net investment income (loss) | | | | | | $ | (203,070 | ) | | | | | | $ | 0 | |
| | | | | | | | | | | | | | | | |
Please see footnotes on page 72
The accompanying notes are an integral part of these financial statements.
| | | | | | |
| Statements of Changes in Net Assets | | Wells Fargo Advantage Small and Mid Cap Stock Funds | | | 67 | |
| | | | | | | | | | | | | | | | | | | | | | | | | | | | | | |
| Small Cap Growth Fund | | | Small Cap Opportunities Fund | |
Six Months Ended
April 30, 2011
(Unaudited) | | | Year Ended
October 31, 2010 | | | Six Months Ended
April 30, 2011
(Unaudited) | | | Year Ended
October 31, 2010 | |
| | | | | | | |
| | | | | | | | | | | | | | | | | | | | | | | | | | | | | | |
| | | | $ | (4,885,728 | ) | | | | | | $ | (7,212,470 | ) | | | | | | $ | 703,853 | | | | | | | $ | (1,353,940 | ) |
| | | | | 156,866,318 | | | | | | | | 114,530,031 | | | | | | | | 67,381,655 | | | | | | | | 70,698,464 | |
| | | | | 105,370,589 | | | | | | | | 99,730,490 | | | | | | | | 64,122,981 | | | | | | | | 55,657,152 | |
| | | | | | | | | | | | | | | | | | | | | | | | | | | | | | | |
| | | | | 257,351,179 | | | | | | | | 207,048,051 | | | | | | | | 132,208,489 | | | | | | | | 125,001,676 | |
| | | | | | | | | | | | | | | | | | | | | | | | | | | | | | | |
| | | | | | | |
| | | | | | | | | | | | | | | | | | | | | | | | | | | | | | |
| | | | | | | | | | | | | | | | | | | | | | | | | | | | | | |
| | | | | (9,033,514 | ) | | | | | | | 0 | | | | | | | | NA | | | | | | | | NA | |
| | | | | (191,258 | ) | | | | | | | 0 | | | | | | | | NA | | | | | | | | NA | |
| | | | | (327,883 | ) | | | | | | | 0 | | | | | | | | NA | | | | | | | | NA | |
| | | | | (19,911,813 | ) | | | | | | | 0 | | | | | | | | 0 | | | | | | | | 0 | |
| | | | | (32,747,371 | ) | | | | | | | 0 | | | | | | | | NA | | | | | | | | NA | |
| | | | | (1,702,524 | ) | | | | | | | 0 | | | | | | | | NA | | | | | | | | NA | |
| | | | | | | | | | | | | | | | | | | | | | | | | | | | | | | |
| | | | | (63,914,363 | ) | | | | | | | 0 | | | | | | | | 0 | | | | | | | | 0 | |
| | | | | | | | | | | | | | | | | | | | | | | | | | | | | | | |
| | | | | | | |
| Shares | | | | | | Shares | | | | | | Shares | | | | | | Shares | | | | |
| | | | | | | |
| | | | | | | | | | | | | | | | | | | | | | | | | | | | | | |
| | | | | | | | | | | | | | | | | | | | | | | | | | | | | | |
| | 1,365,939 | | | | 18,714,605 | | | | 4,266,265 | | | | 50,476,661 | | | | NA | | | | NA | | | | NA | | | | NA | |
| | 7,097 | | | | 90,218 | | | | 4,040 | | | | 48,404 | | | | NA | | | | NA | | | | NA | | | | NA | |
| | 7,264 | | | | 91,660 | | | | 7,655 | | | | 83,474 | | | | NA | | | | NA | | | | NA | | | | NA | |
| | 6,095,816 | | | | 85,277,050 | | | | 7,997,587 | | | | 98,610,395 | | | | 1,833,437 | | | | 63,714,015 | | | | 2,085,857 | | | | 61,033,972 | |
| | 6,398,997 | | | | 90,876,467 | | | | 20,560,823 | | | | 249,326,976 | | | | NA | | | | NA | | | | NA | | | | NA | |
| | 74,458 | | | | 1,012,264 | | | | 155,921 | | | | 1,831,264 | | | | NA | | | | NA | | | | NA | | | | NA | |
| | | | | | | | | | | | | | | | | | | | | | | | | | | | | | | |
| | | | | 196,062,264 | | | | | | | | 400,377,174 | | | | | | | | 63,714,015 | | | | | | | | 61,033,972 | |
| | | | | | | | | | | | | | | | | | | | | | | | | | | | | | | |
| | | | | | | | | | | | | | | | | | | | | | | | | | | | | | |
| | 650,579 | | | | 8,750,287 | | | | 0 | | | | 0 | | | | NA | | | | NA | | | | NA | | | | NA | |
| | 14,813 | | | | 185,015 | | | | 0 | | | | 0 | | | | NA | | | | NA | | | | NA | | | | NA | |
| | 21,086 | | | | 263,994 | | | | 0 | | | | 0 | | | | NA | | | | NA | | | | NA | | | | NA | |
| | 1,249,349 | | | | 17,116,077 | | | | 0 | | | | 0 | | | | 0 | | | | 0 | | | | 0 | | | | 0 | |
| | 2,310,723 | | | | 32,327,018 | | | | 0 | | | | 0 | | | | NA | | | | NA | | | | NA | | | | NA | |
| | 123,734 | | | | 1,648,137 | | | | 0 | | | | 0 | | | | NA | | | | NA | | | | NA | | | | NA | |
| | | | | | | | | | | | | | | | | | | | | | | | | | | | | | | |
| | | | | 60,290,528 | | | | | | | | 0 | | | | | | | | 0 | | | | | | | | 0 | |
| | | | | | | | | | | | | | | | | | | | | | | | | | | | | | | |
| | | | | | | | | | | | | | | | | | | | | | | | | | | | | | |
| | (4,888,108 | ) | | | (67,202,207 | ) | | | (6,092,122 | ) | | | (73,513,935 | ) | | | NA | | | | NA | | | | NA | | | | NA | |
| | (57,569 | ) | | | (733,825 | ) | | | (158,029 | ) | | | (1,719,313 | ) | | | NA | | | | NA | | | | NA | | | | NA | |
| | (35,526 | ) | | | (459,317 | ) | | | (98,601 | ) | | | (1,083,889 | ) | | | NA | | | | NA | | | | NA | | | | NA | |
| | (4,048,219 | ) | | | (56,366,935 | ) | | | (5,990,184 | ) | | | (71,308,218 | ) | | | (2,326,101 | ) | | | (81,106,556 | ) | | | (3,145,084 | ) | | | (90,187,639 | ) |
| | (4,790,259 | ) | | | (68,038,617 | ) | | | (15,425,742 | ) | | | (187,160,977 | ) | | | NA | | | | NA | | | | NA | | | | NA | |
| | (197,161 | ) | | | (2,648,783 | ) | | | (378,909 | ) | | | (4,367,056 | ) | | | NA | | | | NA | | | | NA | | | | NA | |
| | | | | | | | | | | | | | | | | | | | | | | | | | | | | | | |
| | | | | (195,449,684 | ) | | | | | | | (339,153,388 | ) | | | | | | | (81,106,556 | ) | | | | | | | (90,187,639 | ) |
| | | | | | | | | | | | | | | | | | | | | | | | | | | | | | | |
| | | |
|
60,903,108 |
| | | | | | | 61,223,786 | | | | | | | | (17,392,541 | ) | | | | | | | (29,153,667 | ) |
| | | | | | | | | | | | | | | | | | | | | | | | | | | | | | | |
| | | | | 254,339,924 | | | | | | | | 268,271,837 | | | | | | | | 114,815,948 | | | | | | | | 95,848,009 | |
| | | | | | | | | | | | | | | | | | | | | | | | | | | | | | | |
| | | | | | | |
| | | | | | | | | | | | | | | | | | | | | | | | | | | | | | |
| | | | | 1,128,307,831 | | | | | | | | 860,035,994 | | | | | | | | 707,957,743 | | | | | | | | 612,109,734 | |
| | | | | | | | | | | | | | | | | | | | | | | | | | | | | | | |
| | | | $ | 1,382,647,755 | | | | | | | $ | 1,128,307,831 | | | | | | | $ | 822,773,691 | | | | | | | $ | 707,957,743 | |
| | | | | | | | | | | | | | | | | | | | | | | | | | | | | | | |
| | | | $ | (4,885,728 | ) | | | | | | $ | 0 | | | | | | | $ | 703,853 | | | | | | | $ | 0 | |
| | | | | | | | | | | | | | | | | | | | | | | | | | | | | | | |
| | | | |
| 68 | | Wells Fargo Advantage Small and Mid Cap Stock Funds | | Statements of Changes in Net Assets |
| | | | | | | | | | | | | | | | |
| | | Small Cap Value Fund | |
| | | Six Months Ended
April 30, 2011 (Unaudited) | | | Year Ended
October 31, 2010 | |
| | | | |
Operations | | | | | | | | | | | | | | | | |
Net investment income | | | | | | $ | 9,816,891 | | | | | | | $ | 32,353,442 | |
Net realized gains (losses) on investments | | | | | | | 270,881,766 | | | | | | | | 123,590,495 | |
Net change in unrealized gains (losses) on investments | | | | | | | 308,381,912 | | | | | | | | 671,127,923 | |
| | | | | | | | | | | | | | | | |
Net increase in net assets resulting from operations | | | | | | | 589,080,569 | | | | | | | | 827,071,860 | |
| | | | | | | | | | | | | | | | |
| | | | |
Distributions to shareholders from | | | | | | | | | | | | | | | | |
Net investment income | | | | | | | | | | | | | | | | |
Class A | | | | | | | (4,396,555 | ) | | | | | | | (2,300,935 | ) |
Class C | | | | | | | (83,480 | ) | | | | | | | 0 | |
Administrator Class | | | | | | | (531,686 | ) | | | | | | | 0 | 1 |
Institutional Class | | | | | | | (13,357,649 | ) | | | | | | | (8,020,614 | ) |
Investor Class | | | | | | | (11,250,575 | ) | | | | | | | (8,550,957 | ) |
| | | | | | | | | | | | | | | | |
Total distributions to shareholders | | | | | | | (29,619,945 | ) | | | | | | | (18,872,506 | ) |
| | | | | | | | | | | | | | | | |
| | | | |
| | | Shares | | | | | | Shares | | | | |
| | | | |
Capital share transactions | | | | | | | | | | | | | | | | |
Proceeds from shares sold | | | | | | | | | | | | | | | | |
Class A | | | 4,375,177 | | | | 139,670,441 | | | | 7,352,697 | | | | 205,305,892 | |
Class B | | | 11,408 | | | | 334,543 | | | | 16,458 | | | | 408,266 | |
Class C | | | 570,189 | | | | 16,704,764 | | | | 810,271 | | | | 20,900,709 | |
Administrator Class | | | 14,035,608 | | | | 457,444,817 | | | | 293,096 | 1 | | | 8,751,407 | 1 |
Institutional Class | | | 9,279,837 | | | | 303,974,218 | | | | 11,306,842 | | | | 320,492,637 | |
Investor Class | | | 5,655,345 | | | | 184,236,327 | | | | 14,625,960 | | | | 414,414,308 | |
| | | | | | | | | | | | | | | | |
| | | | | | | 1,102,365,110 | | | | | | | | 970,273,219 | |
| | | | | | | | | | | | | | | | |
Reinvestment of distributions | | | | | | | | | | | | | | | | |
Class A | | | 135,471 | | | | 4,274,122 | | | | 86,806 | | | | 2,251,740 | |
Class C | | | 2,516 | | | | 72,756 | | | | 0 | | | | 0 | |
Administrator Class | | | 13,805 | | | | 442,990 | | | | 0 | 1 | | | 0 | 1 |
Institutional Class | | | 403,997 | | | | 12,976,398 | | | | 300,086 | | | | 7,916,268 | |
Investor Class | | | 345,521 | | | | 11,080,846 | | | | 319,963 | | | | 8,431,013 | |
| | | | | | | | | | | | | | | | |
| | | | | | | 28,847,112 | | | | | | | | 18,599,021 | |
| | | | | | | | | | | | | | | | |
Payment for shares redeemed | | | | | | | | | | | | | | | | |
Class A | | | (3,542,407 | ) | | | (113,535,964 | ) | | | (4,525,953 | ) | | | (123,963,621 | ) |
Class B | | | (980,087 | ) | | | (28,502,156 | ) | | | (838,314 | ) | | | (21,019,777 | ) |
Class C | | | (235,708 | ) | | | (6,941,144 | ) | | | (513,039 | ) | | | (12,870,302 | ) |
Administrator Class | | | (690,684 | ) | | | (22,820,507 | ) | | | (1,505 | )1 | | | (45,492 | )1 |
Institutional Class | | | (17,829,657 | ) | | | (583,000,456 | ) | | | (4,882,349 | ) | | | (136,197,206 | ) |
Investor Class | | | (12,088,237 | ) | | | (394,013,919 | ) | | | (14,008,359 | ) | | | (389,717,612 | ) |
| | | | | | | | | | | | | | | | |
| | | | | | | (1,148,814,146 | ) | | | | | | | (683,814,010 | ) |
| | | | | | | | | | | | | | | | |
Net increase (decrease) in net assets resulting
from capital share transactions | | | | | | | (17,601,924 | ) | | | | | | | 305,058,230 | |
| | | | | | | | | | | | | | | | |
Total increase in net assets | | | | | | | 541,858,700 | | | | | | | | 1,113,257,584 | |
| | | | | | | | | | | | | | | | |
| | | | |
Net assets | | | | | | | | | | | | | | | | |
Beginning of period | | | | | | | 4,036,125,594 | | | | | | | | 2,922,868,010 | |
| | | | | | | | | | | | | | | | |
End of period | | | | | | $ | 4,577,984,294 | | | | | | | $ | 4,036,125,594 | |
| | | | | | | | | | | | | | | | |
Undistributed (overdistributed) net investment income | | | | | | $ | 9,237,929 | | | | | | | $ | 29,040,983 | |
| | | | | | | | | | | | | | | | |
Please see footnotes on page 72
The accompanying notes are an integral part of these financial statements.
| | | | | | |
| Statements of Changes in Net Assets | | Wells Fargo Advantage Small and Mid Cap Stock Funds | | | 69 | |
| | | | | | | | | | | | | | |
| Small/Mid Cap Value Fund | |
Six Months Ended
April 30, 2011 (Unaudited) | | | Year Ended
October 31, 2010 | |
| | | |
| | | | | | | | | | | | | | |
| | | | $ | 701,045 | | | | | | | $ | 1,791,343 | |
| | | | | 2,424,178 | | | | | | | | (1,615,073 | ) |
| | | | | 38,099,627 | | | | | | | | 43,829,760 | |
| | | | | | | | | | | | | | | |
| | | | | 41,224,850 | | | | | | | | 44,006,030 | |
| | | | | | | | | | | | | | | |
| | | |
| | | | | | | | | | | | | | |
| | | | | | | | | | | | | | |
| | | | | (383,440 | ) | | | | | | | (229,084 | ) |
| | | | | (26,770 | ) | | | | | | | (23,540 | ) |
| | | | | (831,378 | ) | | | | | | | (516,883 | ) |
| | | | | (245,567 | ) | | | | | | | (124,564 | ) |
| | | | | (705,992 | ) | | | | | | | (607,038 | ) |
| | | | | | | | | | | | | | | |
| | | | | (2,193,147 | ) | | | | | | | (1,501,109 | ) |
| | | | | | | | | | | | | | | |
| | | |
| Shares | | | | | | Shares | | | | |
| | | |
| | | | | | | | | | | | | | |
| | | | | | | | | | | | | | |
| | 429,731 | | | | 6,712,324 | | | | 1,160,932 | | | | 15,591,911 | |
| | NA | | | | NA | | | | NA | | | | NA | |
| | 64,211 | | | | 991,897 | | | | 175,615 | | | | 2,307,636 | |
| | 750,856 | | | | 11,858,744 | | | | 1,169,903 | | | | 16,405,268 | |
| | 498,718 | | | | 7,991,487 | | | | 511,614 | | | | 7,026,403 | |
| | 281,827 | | | | 4,411,389 | | | | 993,998 | | | | 13,435,960 | |
| | | | | | | | | | | | | | | |
| | | | | 31,965,841 | | | | | | | | 54,767,178 | |
| | | | | | | | | | | | | | | |
| | | | | | | | | | | | | | |
| | 24,476 | | | | 374,730 | | | | 17,533 | | | | 223,551 | |
| | 1,059 | | | | 16,044 | | | | 1,123 | | | | 14,179 | |
| | 46,488 | | | | 723,817 | | | | 34,793 | | | | 450,909 | |
| | 2,541 | | | | 39,719 | | | | 1,693 | | | | 22,007 | |
| | 44,502 | | | | 684,436 | | | | 44,856 | | | | 574,160 | |
| | | | | | | | | | | | | | | |
| | | | | 1,838,746 | | | | | | | | 1,284,806 | |
| | | | | | | | | | | | | | | |
| | | | | | | | | | | | | | |
| | (353,782 | ) | | | (5,554,010 | ) | | | (606,554 | ) | | | (8,163,876 | ) |
| | NA | | | | NA | | | | NA | | | | NA | |
| | (36,741 | ) | | | (565,102 | ) | | | (77,855 | ) | | | (1,035,038 | ) |
| | (463,037 | ) | | | (7,406,142 | ) | | | (951,079 | ) | | | (13,004,355 | ) |
| | (65,201 | ) | | | (1,041,808 | ) | | | (39,688 | ) | | | (551,999 | ) |
| | (1,134,882 | ) | | | (17,687,431 | ) | | | (2,141,737 | ) | | | (28,762,565 | ) |
| | | | | | | | | | | | | | | |
| | | | | (32,254,493 | ) | | | | | | | (51,517,833 | ) |
| | | | | | | | | | | | | | | |
| | | |
|
1,550,094 |
| | | | | | | 4,534,151 | |
| | | | | | | | | | | | | | | |
| | | | | 40,581,797 | | | | | | | | 47,039,072 | |
| | | | | | | | | | | | | | | |
| | | |
| | | | | | | | | | | | | | |
| | | | | 243,545,843 | | | | | | | | 196,506,771 | |
| | | | | | | | | | | | | | | |
| | | | $ | 284,127,640 | | | | | | | $ | 243,545,843 | |
| | | | | | | | | | | | | | | |
| | | | $ | (205,046 | ) | | | | | | $ | 1,287,056 | |
| | | | | | | | | | | | | | | |
| | | | |
| 70 | | Wells Fargo Advantage Small and Mid Cap Stock Funds | | Statements of Changes in Net Assets |
| | | | | | | | | | | | | | | | | | | | | | | | |
| | | Special Small Cap Value Fund | |
| | | Six Months Ended
April 30, 2011 (Unaudited) | | | Period Ended
October 31, 20103 | | | Year Ended
July 31, 20102 | |
| | | | | | |
Operations | | | | | | | | | | | | | | | | | | | | | | | | |
Net investment loss | | | | | | $ | (394,114 | ) | | | | | | $ | (351,182 | ) | | | | | | $ | (219,955 | ) |
Net realized gains (losses) on investments | | | | | | | 32,760,212 | | | | | | | | (3,159,846 | ) | | | | | | | 60,548,206 | |
Net change in unrealized gains (losses) on investments | | | | | | | 125,022,512 | | | | | | | | 61,205,076 | | | | | | | | 124,279,447 | |
| | | | | | | | | | | | | | | | | | | | | | | | |
Net increase in net assets resulting from operations | | | | | | | 157,388,610 | | | | | | | | 57,694,048 | | | | | | | | 184,607,698 | |
| | | | | | | | | | | | | | | | | | | | | | | | |
| | | | | | |
Distribution to shareholders from | | | | | | | | | | | | | | | | | | | | | | | | |
Net investment income | | | | | | | | | | | | | | | | | | | | | | | | |
Class A | | | | | | | 0 | | | | | | | | 0 | | | | | | | | (160,174 | ) |
Class R | | | | | | | NA | | | | | | | | NA | | | | | | | | (498 | )4 |
Administrator Class | | | | | | | 0 | | | | | | | | 0 | | | | | | | | (155,625 | )13 |
Institutional Class | | | | | | | 0 | | | | | | | | 0 | | | | | | | | 0 | 1 |
Tax basis return of capital | | | | | | | | | | | | | | | | | | | | | | | | |
Class A | | | | | | | 0 | | | | | | | | 0 | | | | | | | | (1,601,895 | ) |
Class R | | | | | | | NA | | | | | | | | NA | | | | | | | | (4,983 | )4 |
Administrator Class | | | | | | | 0 | | | | | | | | 0 | | | | | | | | (1,556,395 | )13 |
| | | | | | | | | | | | | | | | | | | | | | | | |
Total distributions to shareholders | | | | | | | 0 | | | | | | | | 0 | | | | | | | | (3,479,570 | ) |
| | | | | | | | | | | | | | | | | | | | | | | | |
| | | | | | |
| | | Shares | | | | | | Shares | | | | | | Shares | | | | |
| | | | | | |
Capital share transactions | | | | | | | | | | | | | | | | | | | | | | | | |
Proceeds from shares sold | | | | | | | | | | | | | | | | | | | | | | | | |
Class A | | | 1,579,117 | | | | 34,333,235 | | | | 572,045 | | | | 10,578,712 | | | | 4,024,494 | | | | 72,865,099 | |
Class B | | | 5,022 | | | | 105,246 | | | | 1,939 | | | | 35,417 | | | | 27,827 | | | | 513,465 | |
Class C | | | 57,046 | | | | 1,193,892 | | | | 13,815 | | | | 248,918 | | | | 138,443 | | | | 2,433,750 | |
Class R | | | NA | | | | NA | | | | NA | | | | NA | | | | 70,560 | 4 | | | 1,311,195 | 4 |
Administrator Class | | | 775,456 | | | | 16,889,389 | | | | 310,206 | | | | 5,783,749 | | | | 2,680,413 | 13 | | | 48,815,052 | 13 |
Institutional Class | | | 1,177,829 | | | | 25,169,987 | | | | 155,100 | | | | 3,091,150 | | | | 536 | 1 | | | 10,000 | 1 |
| | | | | | | | | | | | | | | | | | | | | | | | |
| | | | | | | 77,691,749 | | | | | | | | 19,737,946 | | | | | | | | 125,948,561 | |
| | | | | | | | | | | | | | | | | | | | | | | | |
Reinvestment of distributions | | | | | | | | | | | | | | | | | | | | | | | | |
Class A | | | 0 | | | | 0 | | | | 0 | | | | 0 | | | | 96,500 | | | | 1,659,805 | |
Class R | | | NA | | | | NA | | | | NA | | | | NA | | | | 259 | 4 | | | 4,418 | 4 |
Administrator Class | | | 0 | | | | 0 | | | | 0 | | | | 0 | | | | 82,232 | 13 | | | 1,423,440 | 13 |
Institutional Class | | | 0 | | | | 0 | | | | 0 | | | | 0 | | | | 0 | 1 | | | 0 | 1 |
| | | | | | | | | | | | | | | | | | | | | | | | |
| | | | | | | 0 | | | | | | | | 0 | | | | | | | | 3,087,663 | |
| | | | | | | | | | | | | | | | | | | | | | | | |
Payment for shares redeemed | | | | | | | | | | | | | | | | | | | | | | | | |
Class A | | | (4,048,278 | ) | | | (88,556,794 | ) | | | (2,013,218 | ) | | | (37,272,786 | ) | | | (7,637,254 | ) | | | (137,812,855 | ) |
Class B | | | (514,930 | ) | | | (10,687,128 | ) | | | (118,120 | ) | | | (2,103,766 | ) | | | (877,766 | ) | | | (14,825,372 | ) |
Class C | | | (244,352 | ) | | | (5,074,288 | ) | | | (165,257 | ) | | | (2,906,308 | ) | | | (608,350 | ) | | | (10,506,226 | ) |
Class R | | | NA | | | | NA | | | | NA | | | | NA | | | | (307,089 | )4 | | | (5,403,377 | )4 |
Administrator Class | | | (4,119,834 | ) | | | (89,551,866 | ) | | | (682,921 | ) | | | (12,775,162 | ) | | | (20,343,660 | )13 | | | (357,876,240 | )13 |
Institutional Class | | | (85,379 | ) | | | (1,899,195 | ) | | | (33 | ) | | | (665 | ) | | | 0 | 1 | | | 0 | 1 |
| | | | | | | | | | | | | | | | | | | | | | | | |
| | | | | | | (195,769,271 | ) | | | | | | | (55,058,687 | ) | | | | | | | (526,426,070 | ) |
| | | | | | | | | | | | | | | | | | | | | | | | |
Please see footnotes on page 72
The accompanying notes are an integral part of these financial statements.
| | | | | | |
| Statements of Changes in Net Assets | | Wells Fargo Advantage Small and Mid Cap Stock Funds | | | 71 | |
| | | | | | | | | | | | | | | | | | | | | | |
| Traditional Small Cap Growth Fund | |
Six Months Ended
April 30, 2011 (Unaudited) | | | Period Ended
October 31, 20106 | | | Year Ended
September 30, 20105 | |
| | | | | |
| | | | | | | | | | | | | | | | | | | | | | |
| | | | $ | (1,002,331 | ) | | | | | | $ | (99,640 | ) | | | | | | $ | (2,365,842 | ) |
| | | | | 40,475,388 | | | | | | | | 5,519,378 | | | | | | | | 75,168,601 | |
| | | | | 25,489,493 | | | | | | | | 3,956,067 | | | | | | | | (45,508,254 | ) |
| | | | | | | | | | | | | | | | | | | | | | | |
| | | | | 64,962,550 | | | | | | | | 9,375,805 | | | | | | | | 27,294,505 | |
| | | | | | | | | | | | | | | | | | | | | | | |
| | | | | |
| | | | | | | | | | | | | | | | | | | | | | |
| | | | | | | | | | | | | | | | | | | | | | |
| | | | | 0 | | | | | | | | 0 | | | | | | | | 0 | |
| | | | | NA | | | | | | | | NA | | | | | | | | NA | |
| | | | | 0 | | | | | | | | 0 | | | | | | | | 0 | 1 |
| | | | | 0 | | | | | | | | 0 | | | | | | | | (40,111 | )14 |
| | | | | | | | | | | | | | | | | | | | | | |
| | | | | 0 | | | | | | | | 0 | | | | | | | | 0 | |
| | | | | NA | | | | | | | | NA | | | | | | | | NA | |
| | | | | 0 | | | | | | | | 0 | | | | | | | | 0 | 1 |
| | | | | | | | | | | | | | | | | | | | | | | |
| | | | | 0 | | | | | | | | 0 | | | | | | | | (40,111 | ) |
| | | | | | | | | | | | | | | | | | | | | | | |
| | | | | |
| Shares | | | | | | Shares | | | | | | Shares | | | | |
| | | | | |
| | | | | | | | | | | | | | | | | | | | | | |
| | | | | | | | | | | | | | | | | | | | | | |
| | 264,955 | | | | 4,344,693 | | | | 22,304 | | | | 314,821 | | | | 7,193,261 | 9 | | | 90,203,235 | 10 |
| | NA | | | | NA | | | | NA | | | | NA | | | | 18,881 | 7 | | | 196,355 | 7 |
| | 2,141 | | | | 34,923 | | | | 6,596 | | | | 91,175 | | | | 759 | 1 | | | 10,000 | 1 |
| | NA | | | | NA | | | | NA | | | | NA | | | | NA | | | | NA | |
| | 236,590 | | | | 3,727,359 | | | | 0 | | | | 0 | | | | 725 | 1 | | | 10,000 | 1 |
| | 177,045 | | | | 3,040,447 | | | | 70,081 | | | | 1,041,993 | | | | 1,904,800 | 14 | | | 24,579,833 | 14 |
| | | | | | | | | | | | | | | | | | | | | | | |
| | | | | 11,147,422 | | | | | | | | 1,447,989 | | | | | | | | 114,999,423 | |
| | | | | | | | | | | | | | | | | | | | | | | |
| | | | | | | | | | | | | | | | | | | | | | |
| | 0 | | | | 0 | | | | 0 | | | | 0 | | | | 0 | | | | 0 | |
| | NA | | | | NA | | | | NA | | | | NA | | | | NA | | | | NA | |
| | 0 | | | | 0 | | | | 0 | | | | 0 | | | | 0 | 1 | | | 0 | 1 |
| | 0 | | | | 0 | | | | 0 | | | | 0 | | | | 1,136 | 14 | | | 14,115 | 14 |
| | | | | | | | | | | | | | | | | | | | | | | |
| | | | | 0 | | | | | | | | 0 | | | | | | | | 14,115 | |
| | | | | | | | | | | | | | | | | | | | | | | |
| | | | | | | | | | | | | | | | | | | | | | |
| | (1,071,477 | ) | | | (17,110,613 | ) | | | (172,259 | ) | | | (2,426,788 | ) | | | (9,748,106 | )11 | | | (105,655,406 | )12 |
| | NA | | | | NA | | | | NA | | | | NA | | | | (521,262 | )7 | | | (5,375,679 | )7 |
| | (2,673 | ) | | | (43,577 | ) | | | (449 | ) | | | (6,388 | ) | | | 0 | 1 | | | 0 | 1 |
| | NA | | | | NA | | | | NA | | | | NA | | | | NA | | | | NA | |
| | (33,479 | ) | | | (585,180 | ) | | | 0 | | | | 0 | | | | 0 | 1 | | | 0 | 1 |
| | (1,548,219 | ) | | | (26,389,603 | ) | | | (146,368 | ) | | | (2,160,333 | ) | | | (21,713,838 | )14 | | | (277,885,539 | )14 |
| | | | | | | | | | | | | | | | | | | | | | | |
| | | | | (44,128,973 | ) | | | | | | | (4,593,509 | ) | | | | | | | (388,916,624 | ) |
| | | | | | | | | | | | | | | | | | | | | | | |
| | | | |
| 72 | | Wells Fargo Advantage Small and Mid Cap Stock Funds | | Statements of Changes in Net Assets |
| | | | | | | | | | | | | | | | | | | | | | | | |
| | | Special Small Cap Value Fund | |
| | | Six Months Ended
April 30, 2011 (Unaudited) | | | Period Ended
October 31, 20103 | | | Year Ended
July 31, 20102 | |
| | | | | | |
| | | Shares | | | | | | Shares | | | | | | Shares | | | | |
| | | | | | |
Capital share transactions (continued) | | | | | | | | | | | | | | | | | | | | | | | | |
Net asset value of shares issued in acquisition | | | | | | | | | | | | | | | | | | | | | | | | |
Class A | | | 0 | | | | $0 | | | | 0 | | | | $0 | | | | 520,841 | | | $ | 9,190,148 | |
Class B | | | 0 | | | | 0 | | | | 0 | | | | 0 | | | | 167,510 | | | | 2,825,351 | |
Class C | | | 0 | | | | 0 | | | | 0 | | | | 0 | | | | 183,875 | | | | 3,111,534 | |
Administrator Class | | | 0 | | | | 0 | | | | 0 | | | | 0 | | | | 1,139,052 | | | | 20,258,550 | |
| | | | | | | | | | | | | | | | | | | | | | | | |
| | | | | | | 0 | | | | | | | | 0 | | | | | | | | 35,385,583 | |
| | | | | | | | | | | | | | | | | | | | | | | | |
Net decrease in net assets resulting
from capital share transactions | | | | | | | (118,077,522 | ) | | | | | | | (35,320,741 | ) | | | | | | | (362,002,263 | ) |
| | | | | | | | | | | | | | | | | | | | | | | | |
Total increase (decrease) in net assets | | | | | | | 39,311,088 | | | | | | | | 22,373,307 | | | | | | | | (180,874,135 | ) |
| | | | | | | | | | | | | | | | | | | | | | | | |
| | | | | | |
Net assets | | | | | | | | | | | | | | | | | | | | | | | | |
Beginning of period | | | | | | | 893,722,283 | | | | | | | | 871,348,976 | | | | | | | | 1,052,223,111 | |
| | | | | | | | | | | | | | | | | | | | | | | | |
End of period | | | | | | $ | 933,033,371 | | | | | | | $ | 893,722,283 | | | | | | | $ | 871,348,976 | |
| | | | | | | | | | | | | | | | | | | | | | | | |
Undistributed (overdistributed) net investment loss | | | | | | $ | (1,055,639 | ) | | | | | | $ | (661,525 | ) | | | | | | $ | (268,406 | ) |
| | | | | | | | | | | | | | | | | | | | | | | | |
| 1. | Class commenced operation on July 30, 2010. |
| 2. | After the close of business on July 16, 2010, the Fund acquired the net assets of Evergreen Special Values Fund and Evergreen Small Cap Value Fund. Evergreen Special Values Fund became the accounting and performance survivor in this transaction. The information for the period prior to July 19, 2010 is that of Evergreen Special Values Fund. |
| 3. | For the three months ended October 31, 2010. The Fund changed its fiscal year end from July 31 to October 31, effective October 31, 2010. |
| 4. | Class R shares of the predecessor fund became Class A share on July 19, 2010. |
| 5. | After the close of business on July 16, 2010, the Fund acquired the net assets of Evergreen Growth Fund, which became the accounting and performance survivor in this transaction. The information for the period prior to July 19, 2010 is that of Evergreen Growth Fund. |
| 6. | For the one month ended October 31, 2010. The Fund changed its fiscal year end from September 30 to October 31, effective October 31, 2010. |
| 7. | Class B shares of the predecessor fund became Class A shares on July 19, 2010. |
| 8. | Class C shares of the predecessor fund became Class A shares on July 19, 2010. |
| 9. | Amount includes 6,177,555 shares of Class C shares of the predecessor fund which became Class A shares on July 19, 2010. |
| 10. | Amount includes $77,317,477 of Class C shares of the predecessor fund which became Class A shares on July 19, 2010. |
| 11. | Amount includes 8,329,992 shares of Class C shares of the predecessor fund which became Class A shares on July 19, 2010. |
| 12. | Amount includes $87,460,732 of Class C shares of the predecessor fund which became Class A shares on July 19, 2010. |
| 13. | Class I shares of the predecessor fund became Administrator Class shares on July 19, 2010. |
| 14. | Class I shares of the predecessor fund became Institutional Class shares on July 19, 2010. |
The accompanying notes are an integral part of these financial statements.
| | | | | | |
| Statements of Changes in Net Assets | | Wells Fargo Advantage Small and Mid Cap Stock Funds | | | 73 | |
| | | | | | | | | | | | | | | | | | | | | | |
| Traditional Small Cap Growth Fund | |
Six Months Ended
April 30, 2011 (Unaudited) | | | Period Ended
October 31, 20106 | | | Year Ended
September 30, 20105 | |
| | | | | |
| Shares | | | | | | Shares | | | | | | Shares | | | | |
| | | | | |
| | | | | | | | | | | | | | | | | | | | | | |
| | | | | | | | | | | | | | | | | | | | | | |
| | 0 | | | $ | 0 | | | | 0 | | | $ | 0 | | | | 0 | | | $ | 0 | |
| | NA | | | | NA | | | | NA | | | | NA | | | | 0 | | | | 0 | |
| | 0 | | | | 0 | | | | 0 | | | | 0 | | | | 0 | | | | 0 | |
| | 0 | | | | 0 | | | | 0 | | | | 0 | | | | 0 | | | | 0 | |
| | | | | | | | | | | | | | | | | | | | | | | |
| | | | | 0 | | | | | | | | 0 | | | | | | | | 0 | |
| | | | | | | | | | | | | | | | | | | | | | | |
| | | |
|
(32,981,551 |
) | | | | | | | (3,145,520 | ) | | | | | | | (273,903,086 | ) |
| | | | | | | | | | | | | | | | | | | | | | | |
| | | | | 31,980,999 | | | | | | | | 6,230,285 | | | | | | | | (246,648,692 | ) |
| | | | | | | | | | | | | | | | | | | | | | | |
| | | | | |
| | | | | | | | | | | | | | | | | | | | | | |
| | | | | 241,916,418 | | | | | | | | 235,686,133 | | | | | | | | 482,334,825 | |
| | | | | | | | | | | | | | | | | | | | | | | |
| | | | $ | 273,897,417 | | | | | | | $ | 241,916,418 | | | | | | | $ | 235,686,133 | |
| | | | | | | | | | | | | | | | | | | | | | | |
| | | | $ | (1,025,679 | ) | | | | | | $ | (23,348 | ) | | | | | | $ | (22,844 | ) |
| | | | | | | | | | | | | | | | | | | | | | | |
| | | | |
| 74 | | Wells Fargo Advantage Small and Mid Cap Stock Funds | | Financial Highlights |
| | | | | | | | | | | | | | | | | | | | |
| | | Beginning
Net Asset
Value Per
Share | | | Net
Investment
Income (Loss) | | | Net Realized
and Unrealized
Gains (Losses)
on Investments | | | Distributions
from Net
Investment
Income | | | Distributions
from Net
Realized Gains | |
| | | | | |
Intrinsic Small Cap Value Fund | | | | | | | | | | | | | | | | | | | | |
Class A | | | | | | | | | | | | | | | | | | | | |
November 1, 2010 to April 30, 2011 (Unaudited) | | $ | 13.81 | | | | (0.03 | )2 | | | 2.93 | | | | 0.00 | | | | 0.00 | |
November 1, 2009 to October 31, 2010 | | $ | 11.52 | | | | (0.06 | ) | | | 2.35 | | | | 0.00 | | | | 0.00 | |
November 1, 2008 to October 31, 2009 | | $ | 11.08 | | | | (0.02 | )2 | | | 0.47 | | | | 0.00 | | | | 0.00 | |
March 31, 20083 to October 31, 2008 | | $ | 13.72 | | | | 0.00 | 2 | | | (2.64 | ) | | | 0.00 | | | | 0.00 | |
Class C | | | | | | | | | | | | | | | | | | | | |
November 1, 2010 to April 30, 2011 (Unaudited) | | $ | 13.45 | | | | (0.09 | )2 | | | 2.87 | | | | 0.00 | | | | 0.00 | |
November 1, 2009 to October 31, 2010 | | $ | 11.31 | | | | (0.18 | ) | | | 2.32 | | | | 0.00 | | | | 0.00 | |
November 1, 2008 to October 31, 2009 | | $ | 10.95 | | | | (0.09 | )2 | | | 0.45 | | | | 0.00 | | | | 0.00 | |
March 31, 20083 October 31, 2008 | | $ | 13.61 | | | | (0.06 | )2 | | | (2.60 | ) | | | 0.00 | | | | 0.00 | |
Administrator Class | | | | | | | | | | | | | | | | | | | | |
November 1, 2010 to April 30, 2011 (Unaudited) | | $ | 13.91 | | | | (0.03 | )2 | | | 2.98 | | | | 0.00 | | | | 0.00 | |
November 1, 2009 to October 31, 2010 | | $ | 11.58 | | | | (0.02 | ) | | | 2.35 | | | | 0.00 | | | | 0.00 | |
November 1, 2008 to October 31, 2009 | | $ | 11.10 | | | | 0.02 | 2 | | | 0.46 | | | | 0.00 | | | | 0.00 | |
November 1, 2007 to October 31, 2008 | | $ | 18.10 | | | | 0.06 | 2 | | | (5.70 | ) | | | (0.22 | ) | | | (1.14 | ) |
November 1, 2006 to October 31, 2007 | | $ | 18.11 | | | | 0.11 | 2 | | | 0.75 | | | | 0.00 | | | | (0.87 | ) |
November 1, 2005 to October 31, 2006 | | $ | 16.07 | | | | 0.01 | 2 | | | 2.81 | | | | 0.00 | | | | (0.78 | ) |
Institutional Class | | | | | | | | | | | | | | | | | | | | |
November 1, 2010 to April 30, 2011 (Unaudited) | | $ | 14.00 | | | | 0.00 | 2 | | | 2.98 | | | | 0.00 | | | | 0.00 | |
November 1, 2009 to October 31, 2010 | | $ | 11.63 | | | | 0.00 | 2 | | | 2.37 | | | | 0.00 | | | | 0.00 | |
November 1, 2008 to October 31, 2009 | | $ | 11.15 | | | | 0.04 | 2 | | | 0.47 | | | | 0.00 | | | | 0.00 | |
November 1, 2007 to October 31, 2008 | | $ | 18.19 | | | | 0.09 | 2 | | | (5.73 | ) | | | (0.26 | ) | | | (1.14 | ) |
November 1, 2006 to October 31, 2007 | | $ | 18.16 | | | | 0.15 | 2 | | | 0.75 | | | | 0.00 | | | | (0.87 | ) |
November 1, 2005 to October 31, 2006 | | $ | 16.09 | | | | 0.03 | 2 | | | 2.82 | | | | 0.00 | | | | (0.78 | ) |
Investor Class | | | | | | | | | | | | | | | | | | | | |
November 1, 2010 to April 30, 2011 (Unaudited) | | $ | 13.70 | | | | (0.04 | )2 | | | 2.91 | | | | 0.00 | | | | 0.00 | |
November 1, 2009 to October 31, 2010 | | $ | 11.43 | | | | (0.06 | )2 | | | 2.33 | | | | 0.00 | | | | 0.00 | |
November 1, 2008 to October 31, 2009 | | $ | 10.99 | | | | (0.01 | )2 | | | 0.45 | | | | 0.00 | | | | 0.00 | |
November 1, 2007 to October 31, 2008 | | $ | 17.92 | | | | 0.02 | 2 | | | (5.65 | ) | | | (0.16 | ) | | | (1.14 | ) |
November 1, 2006 to October 31, 2007 | | $ | 18.00 | | | | 0.05 | 2 | | | 0.74 | | | | 0.00 | | | | (0.87 | ) |
November 1, 2005 to October 31, 2006 | | $ | 16.04 | | | | (0.06 | )2 | | | 2.80 | | | | 0.00 | | | | (0.78 | ) |
| | | | | |
Small Cap Growth Fund | | | | | | | | | | | | | | | | | | | | |
Class A | | | | | | | | | | | | | | | | | | | | |
November 1, 2010 to April 30, 2011 (Unaudited) | | $ | 12.62 | | | | (0.07 | )2 | | | 2.86 | | | | 0.00 | | | | (0.73 | ) |
November 1, 2009 to October 31, 2010 | | $ | 10.23 | | | | (0.11 | )2 | | | 2.50 | | | | 0.00 | | | | 0.00 | |
November 1, 2008 to October 31, 2009 | | $ | 7.58 | | | | (0.08 | )2 | | | 2.73 | | | | 0.00 | | | | 0.00 | |
November 1, 2007 to October 31, 2008 | | $ | 16.02 | | | | (0.10 | ) | | | (6.04 | ) | | | 0.00 | | | | (2.30 | ) |
November 1, 2006 to October 31, 2007 | | $ | 14.03 | | | | (0.13 | )2 | | | 3.66 | | | | 0.00 | | | | (1.54 | ) |
November 1, 2005 to October 31, 2006 | | $ | 12.19 | | | | (0.16 | ) | | | 2.93 | | | | 0.00 | | | | (0.93 | ) |
Class B | | | | | | | | | | | | | | | | | | | | |
November 1, 2010 to April 30, 2011 (Unaudited) | | $ | 11.78 | | | | (0.11 | )2 | | | 2.66 | | | | 0.00 | | | | (0.73 | ) |
November 1, 2009 to October 31, 2010 | | $ | 9.62 | | | | (0.19 | )2 | | | 2.35 | | | | 0.00 | | | | 0.00 | |
November 1, 2008 to October 31, 2009 | | $ | 7.18 | | | | (0.13 | )2 | | | 2.57 | | | | 0.00 | | | | 0.00 | |
November 1, 2007 to October 31, 2008 | | $ | 15.41 | | | | (0.18 | )2 | | | (5.75 | ) | | | 0.00 | | | | (2.30 | ) |
November 1, 2006 to October 31, 2007 | | $ | 13.65 | | | | (0.23 | )2 | | | 3.53 | | | | 0.00 | | | | (1.54 | ) |
November 1, 2005 to October 31, 2006 | | $ | 11.97 | | | | (0.28 | ) | | | 2.89 | | | | 0.00 | | | | (0.93 | ) |
Class C | | | | | | | | | | | | | | | | | | | | |
November 1, 2010 to April 30, 2011 (Unaudited) | | $ | 11.80 | | | | (0.13 | ) | | | 2.68 | | | | 0.00 | | | | (0.73 | ) |
November 1, 2009 to October 31, 2010 | | $ | 9.64 | | | | (0.19 | )2 | | | 2.35 | | | | 0.00 | | | | 0.00 | |
November 1, 2008 to October 31, 2009 | | $ | 7.19 | | | | (0.13 | )2 | | | 2.58 | | | | 0.00 | | | | 0.00 | |
November 1, 2007 to October 31, 2008 | | $ | 15.43 | | | | (0.18 | )2 | | | (5.76 | ) | | | 0.00 | | | | (2.30 | ) |
November 1, 2006 to October 31, 2007 | | $ | 13.66 | | | | (0.23 | )2 | | | 3.54 | | | | 0.00 | | | | (1.54 | ) |
November 1, 2005 to October 31, 2006 | | $ | 11.98 | | | | (0.25 | ) | | | 2.86 | | | | 0.00 | | | | (0.93 | ) |
Please see footnotes on page 82
| | | | | | |
| Financial Highlights | | Wells Fargo Advantage Small and Mid Cap Stock Funds | | | 75 | |
| | | | | | | | | | | | | | | | | | | | | | | | | | | | | | |
Distributions
from Tax
Basis Return
of capital | | | Ending
Net Asset
Value Per
Share | | | Ratio to Average Net Assets (Annualized) | | | Total
Return1 | | | Portfolio
Turnover
Rate | | | Net Assets at
End of Period
(000’s omitted) | |
| | | Net Investment
Income (Loss) | | | Gross
Expenses | | | Net
Expenses | | | | |
| | | | | | | |
| | | | | | | | | | | | | | | | | | | | | | | | | | | | | | | |
| | | | | | | | | | | | | | | | | | | | | | | | | | | | | | |
| | 0.00 | | | $ | 16.71 | | | | (0.42 | )% | | | 1.47 | % | | | 1.42 | % | | | 21.00 | % | | | 24 | % | | $ | 251 | |
| | 0.00 | | | $ | 13.81 | | | | (0.49 | )% | | | 1.54 | % | | | 1.45 | % | | | 19.88 | % | | | 147 | % | | $ | 354 | |
| | (0.01 | ) | | $ | 11.52 | | | | (0.17 | )% | | | 1.57 | % | | | 1.45 | % | | | 4.09 | % | | | 64 | % | | $ | 290 | |
| | 0.00 | | | $ | 11.08 | | | | 0.01 | % | | | 1.55 | % | | | 1.45 | % | | | (19.24 | )% | | | 77 | % | | $ | 29 | |
| | | | | | | | | | | | | | | | | | | | | | | | | | | | | | |
| | 0.00 | | | $ | 16.23 | | | | (1.23 | )% | | | 2.21 | % | | | 2.17 | % | | | 20.67 | % | | | 24 | % | | $ | 133 | |
| | 0.00 | | | $ | 13.45 | | | | (1.24 | )% | | | 2.30 | % | | | 2.20 | % | | | 18.92 | % | | | 147 | % | | $ | 142 | |
| | 0.00 | | | $ | 11.31 | | | | (0.90 | )% | | | 2.31 | % | | | 2.20 | % | | | 3.29 | % | | | 64 | % | | $ | 132 | |
| | 0.00 | | | $ | 10.95 | | | | (0.76 | )% | | | 2.33 | % | | | 2.20 | % | | | (19.54 | )% | | | 77 | % | | $ | 26 | |
| | | | | | | | | | | | | | | | | | | | | | | | | | | | | | |
| | 0.00 | | | $ | 16.86 | | | | (0.40 | )% | | | 1.22 | % | | | 1.20 | % | | | 21.21 | % | | | 24 | % | | $ | 15,254 | |
| | 0.00 | | | $ | 13.91 | | | | (0.23 | )% | | | 1.37 | % | | | 1.20 | % | | | 20.12 | % | | | 147 | % | | $ | 5,774 | |
| | 0.00 | | | $ | 11.58 | | | | 0.18 | % | | | 1.38 | % | | | 1.20 | % | | | 4.32 | % | | | 64 | % | | $ | 5,730 | |
| | 0.00 | | | $ | 11.10 | | | | 0.41 | % | | | 1.38 | % | | | 1.20 | % | | | (33.26 | )% | | | 77 | % | | $ | 6,447 | |
| | 0.00 | | | $ | 18.10 | | | | 0.58 | % | | | 1.39 | % | | | 1.20 | % | | | 4.84 | % | | | 97 | % | | $ | 12,548 | |
| | 0.00 | | | $ | 18.11 | | | | 0.08 | % | | | 1.39 | % | | | 1.20 | % | | | 18.17 | % | | | 100 | % | | $ | 5,999 | |
| | | | | | | | | | | | | | | | | | | | | | | | | | | | | | |
| | 0.00 | | | $ | 16.98 | | | | 0.00 | % | | | 1.04 | % | | | 0.98 | % | | | 21.29 | % | | | 24 | % | | $ | 56,494 | |
| | 0.00 | | | $ | 14.00 | | | | (0.03 | )% | | | 1.10 | % | | | 1.00 | % | | | 20.38 | % | | | 147 | % | | $ | 72,200 | |
| | (0.03 | ) | | $ | 11.63 | | | | 0.36 | % | | | 1.11 | % | | | 1.00 | % | | | 4.61 | % | | | 64 | % | | $ | 65,014 | |
| | 0.00 | | | $ | 11.15 | | | | 0.60 | % | | | 1.11 | % | | | 1.00 | % | | | (33.17 | )% | | | 77 | % | | $ | 64,444 | |
| | 0.00 | | | $ | 18.19 | | | | 0.84 | % | | | 1.12 | % | | | 1.00 | % | | | 5.05 | % | | | 97 | % | | $ | 114,345 | |
| | 0.00 | | | $ | 18.16 | | | | 0.20 | % | | | 1.11 | % | | | 1.00 | % | | | 18.34 | % | | | 100 | % | | $ | 63,905 | |
| | | | | | | | | | | | | | | | | | | | | | | | | | | | | | |
| | 0.00 | | | $ | 16.57 | | | | (0.50 | )% | | | 1.53 | % | | | 1.48 | % | | | 20.95 | % | | | 24 | % | | $ | 68,745 | |
| | 0.00 | | | $ | 13.70 | | | | (0.47 | )% | | | 1.63 | % | | | 1.49 | % | | | 19.86 | % | | | 147 | % | | $ | 79,132 | |
| | 0.00 | | | $ | 11.43 | | | | (0.12 | )% | | | 1.67 | % | | | 1.49 | % | | | 4.00 | % | | | 64 | % | | $ | 180,060 | |
| | 0.00 | | | $ | 10.99 | | | | 0.11 | % | | | 1.70 | % | | | 1.49 | % | | | (33.46 | )% | | | 77 | % | | $ | 213,243 | |
| | 0.00 | | | $ | 17.92 | | | | 0.26 | % | | | 1.74 | % | | | 1.53 | % | | | 4.46 | % | | | 97 | % | | $ | 384,047 | |
| | 0.00 | | | $ | 18.00 | | | | (0.37 | )% | | | 1.73 | % | | | 1.61 | % | | | (2.71 | )% | | | 100 | % | | $ | 172,013 | |
| | | | | | | |
| | | | | | | | | | | | | | | | | | | | | | | | | | | | | | | |
| | | | | | | | | | | | | | | | | | | | | | | | | | | | | | |
| | 0.00 | | | $ | 14.68 | | | | (1.05 | )% | | | 1.36 | % | | | 1.36 | % | | | 22.63 | % | | | 73 | % | | $ | 167,304 | |
| | 0.00 | | | $ | 12.62 | | | | (0.97 | )% | | | 1.43 | % | | | 1.40 | % | | | 23.36 | % | | | 69 | % | | $ | 180,062 | |
| | 0.00 | | | $ | 10.23 | | | | (0.93 | )% | | | 1.51 | % | | | 1.40 | % | | | 34.96 | % | | | 76 | % | | $ | 164,636 | |
| | 0.00 | | | $ | 7.58 | | | | (0.91 | )% | | | 1.54 | % | | | 1.40 | % | | | (43.80 | )% | | | 82 | % | | $ | 115,579 | |
| | 0.00 | | | $ | 16.02 | | | | (0.91 | )% | | | 1.55 | % | | | 1.40 | % | | | 27.63 | % | | | 122 | % | | $ | 199,396 | |
| | 0.00 | | | $ | 14.03 | | | | (1.15 | )% | | | 1.61 | % | | | 1.40 | % | | | 23.82 | % | | | 142 | % | | $ | 110,813 | |
| | | | | | | | | | | | | | | | | | | | | | | | | | | | | | |
| | 0.00 | | | $ | 13.60 | | | | (1.80 | )% | | | 2.12 | % | | | 2.12 | % | | | 22.20 | % | | | 73 | % | | $ | 3,333 | |
| | 0.00 | | | $ | 11.78 | | | | (1.71 | )% | | | 2.18 | % | | | 2.15 | % | | | 22.35 | % | | | 69 | % | | $ | 3,307 | |
| | 0.00 | | | $ | 9.62 | | | | (1.67 | )% | | | 2.26 | % | | | 2.15 | % | | | 33.98 | % | | | 76 | % | | $ | 4,182 | |
| | 0.00 | | | $ | 7.18 | | | | (1.67 | )% | | | 2.29 | % | | | 2.15 | % | | | (44.24 | )% | | | 82 | % | | $ | 4,648 | |
| | 0.00 | | | $ | 15.41 | | | | (1.70 | )% | | | 2.30 | % | | | 2.15 | % | | | 26.62 | % | | | 122 | % | | $ | 14,311 | |
| | 0.00 | | | $ | 13.65 | | | | (1.90 | )% | | | 2.36 | % | | | 2.15 | % | | | 22.86 | % | | | 142 | % | | $ | 20,226 | |
| | | | | | | | | | | | | | | | | | | | | | | | | | | | | | |
| | 0.00 | | | $ | 13.62 | | | | (1.81 | )% | | | 2.12 | % | | | 2.12 | % | | | 22.25 | % | | | 73 | % | | $ | 6,088 | |
| | 0.00 | | | $ | 11.80 | | | | (1.72 | )% | | | 2.18 | % | | | 2.15 | % | | | 22.30 | % | | | 69 | % | | $ | 5,357 | |
| | 0.00 | | | $ | 9.64 | | | | (1.67 | )% | | | 2.26 | % | | | 2.15 | % | | | 34.08 | % | | | 76 | % | | $ | 5,252 | |
| | 0.00 | | | $ | 7.19 | | | | (1.67 | )% | | | 2.27 | % | | | 2.15 | % | | | (44.25 | )% | | | 82 | % | | $ | 4,519 | |
| | 0.00 | | | $ | 15.43 | | | | (1.66 | )% | | | 2.30 | % | | | 2.15 | % | | | 26.68 | % | | | 122 | % | | $ | 10,187 | |
| | 0.00 | | | $ | 13.66 | | | | (1.90 | )% | | | 2.36 | % | | | 2.15 | % | | | 22.84 | % | | | 142 | % | | $ | 6,543 | |
| | | | |
| 76 | | Wells Fargo Advantage Small and Mid Cap Stock Funds | | Financial Highlights |
| | | | | | | | | | | | | | | | | | | | |
| | | Beginning
Net Asset
Value Per
Share | | | Net
Investment
Income (Loss) | | | Net Realized
and Unrealized
Gains (Losses)
on Investments | | | Distributions
from Net
Investment
Income | | | Distributions
from Net
Realized Gains | |
| | | | | |
Small Cap Growth Fund (continued) | | | | | | | | | | | | | | | | | | | | |
Administrator Class | | | | | | | | | | | | | | | | | | | | |
November 1, 2010 to April 30, 2011 (Unaudited) | | $ | 12.84 | | | | (0.06 | ) | | | 2.92 | | | | 0.00 | | | | (0.73 | ) |
November 1, 2009 to October 31, 2010 | | $ | 10.39 | | | | (0.09 | )2 | | | 2.54 | | | | 0.00 | | | | 0.00 | |
November 1, 2008 to October 31, 2009 | | $ | 7.68 | | | | (0.06 | )2 | | | 2.77 | | | | 0.00 | | | | 0.00 | |
November 1, 2007 to October 31, 2008 | | $ | 16.17 | | | | (0.08 | )2 | | | (6.11 | ) | | | 0.00 | | | | (2.30 | ) |
November 1, 2006 to October 31, 2007 | | $ | 14.12 | | | | (0.10 | )2 | | | 3.69 | | | | 0.00 | | | | (1.54 | ) |
November 1, 2005 to October 31, 2006 | | $ | 12.24 | | | | (0.13 | ) | | | 2.94 | | | | 0.00 | | | | (0.93 | ) |
Institutional Class | | | | | | | | | | | | | | | | | | | | |
November 1, 2010 to April 30, 2011 (Unaudited) | | $ | 13.09 | | | | (0.05 | ) | | | 2.98 | | | | 0.00 | | | | (0.73 | ) |
November 1, 2009 to October 31, 2010 | | $ | 10.56 | | | | (0.06 | )2 | | | 2.59 | | | | 0.00 | | | | 0.00 | |
November 1, 2008 to October 31, 2009 | | $ | 7.78 | | | | (0.04 | )2 | | | 2.82 | | | | 0.00 | | | | 0.00 | |
November 1, 2007 to October 31, 2008 | | $ | 16.30 | | | | (0.04 | )2 | | | (6.18 | ) | | | 0.00 | | | | (2.30 | ) |
November 1, 2006 to October 31, 2007 | | $ | 14.19 | | | | (0.06 | )2 | | | 3.71 | | | | 0.00 | | | | (1.54 | ) |
November 1, 2005 to October 31, 2006 | | $ | 12.26 | | | | (0.11 | ) | | | 2.97 | | | | 0.00 | | | | (0.93 | ) |
Investor Class | | | | | | | | | | | | | | | | | | | | |
November 1, 2010 to April 30, 2011 (Unaudited) | | $ | 12.50 | | | | (0.08 | ) | | | 2.84 | | | | 0.00 | | | | (0.73 | ) |
November 1, 2009 to October 31, 2010 | | $ | 10.14 | | | | (0.12 | )2 | | | 2.48 | | | | 0.00 | | | | 0.00 | |
November 1, 2008 to October 31, 2009 | | $ | 7.52 | | | | (0.08 | )2 | | | 2.70 | | | | 0.00 | | | | 0.00 | |
November 1, 2007 to October 31, 20087 | | $ | 15.93 | | | | (0.12 | )2 | | | (5.99 | ) | | | 0.00 | | | | (2.30 | ) |
November 1, 2006 to October 31, 2007 | | $ | 13.99 | | | | (0.16 | )2 | | | 3.64 | | | | 0.00 | | | | (1.54 | ) |
November 1, 2005 to October 31, 2006 | | $ | 12.18 | | | | (0.19 | ) | | | 2.93 | | | | 0.00 | | | | (0.93 | ) |
| | | | | |
Small Cap Opportunities Fund | | | | | | | | | | | | | | | | | | | | |
Administrator Class | | | | | | | | | | | | | | | | | | | | |
November 1, 2010 to April 30, 2011 (Unaudited) | | $ | 31.33 | | | | 0.03 | | | | 5.87 | | | | 0.00 | | | | 0.00 | |
November 1, 2009 to October 31, 2010 | | $ | 25.88 | | | | (0.06 | ) | | | 5.51 | | | | 0.00 | | | | 0.00 | |
November 1, 2008 to October 31, 2009 | | $ | 23.47 | | | | (0.02 | ) | | | 3.38 | | | | 0.00 | | | | (0.93 | ) |
November 1, 2007 to October 31, 2008 | | $ | 39.68 | | | | 0.01 | | | | (11.23 | ) | | | (0.10 | ) | | | (4.89 | ) |
November 1, 2006 to October 31, 2007 | | $ | 38.56 | | | | 0.11 | | | | 6.99 | | | | 0.00 | | | | (5.98 | ) |
November 1, 2005 to October 31, 2006 | | $ | 33.97 | | | | (0.04 | ) | | | 7.30 | | | | 0.00 | | | | (2.67 | ) |
| | | | | |
Small Cap Value Fund | | | | | | | | | | | | | | | | | | | | |
Class A | | | | | | | | | | | | | | | | | | | | |
November 1, 2010 to April 30, 2011 (Unaudited) | | $ | 29.71 | | | | 0.05 | | | | 4.27 | | | | (0.20 | ) | | | 0.00 | |
November 1, 2009 to October 31, 2010 | | $ | 23.32 | | | | 0.22 | 2 | | | 6.29 | | | | (0.12 | ) | | | 0.00 | |
November 1, 2008 to October 31, 2009 | | $ | 18.22 | | | | 0.15 | 2 | | | 4.95 | | | | 0.00 | | | | 0.00 | |
November 1, 2007 to October 31, 2008 | | $ | 36.28 | | | | (0.02 | )2 | | | (13.25 | ) | | | (0.01 | ) | | | (4.78 | ) |
November 1, 2006 to October 31, 2007 | | $ | 32.63 | | | | (0.15 | )2 | | | 6.76 | | | | 0.00 | | | | (2.96 | ) |
November 1, 2005 to October 31, 2006 | | $ | 31.17 | | | | (0.04 | ) | | | 4.61 | | | | 0.00 | | | | (3.11 | ) |
Class B | | | | | | | | | | | | | | | | | | | | |
November 1, 2010 to April 30, 2011 (Unaudited) | | $ | 27.02 | | | | (0.10 | )2 | | | 3.92 | | | | 0.00 | | | | 0.00 | |
November 1, 2009 to October 31, 2010 | | $ | 21.28 | | | | 0.00 | 2 | | | 5.74 | | | | 0.00 | | | | 0.00 | |
November 1, 2008 to October 31, 2009 | | $ | 16.75 | | | | 0.01 | 2 | | | 4.52 | | | | 0.00 | | | | 0.00 | |
November 1, 2007 to October 31, 2008 | | $ | 33.98 | | | | (0.22 | )2 | | | (12.23 | ) | | | 0.00 | | | | (4.78 | ) |
November 1, 2006 to October 31, 2007 | | $ | 30.96 | | | | (0.38 | )2 | | | 6.36 | | | | 0.00 | | | | (2.96 | ) |
November 1, 2005 to October 31, 2006 | | $ | 29.92 | | | | (0.35 | ) | | | 4.50 | | | | 0.00 | | | | (3.11 | ) |
Class C | | | | | | | | | | | | | | | | | | | | |
November 1, 2010 to April 30, 2011 (Unaudited) | | $ | 27.11 | | | | (0.06 | )2 | | | 3.89 | | | | (0.02 | ) | | | 0.00 | |
November 1, 2009 to October 31, 2010 | | $ | 21.34 | | | | 0.01 | 2 | | | 5.76 | | | | 0.00 | | | | 0.00 | |
November 1, 2008 to October 31, 2009 | | $ | 16.80 | | | | 0.01 | 2 | | | 4.53 | | | | 0.00 | | | | 0.00 | |
November 1, 2007 to October 31, 2008 | | $ | 34.07 | | | | (0.22 | )2 | | | (12.27 | ) | | | 0.00 | | | | (4.78 | ) |
November 1, 2006 to October 31, 2007 | | $ | 31.03 | | | | (0.38 | )2 | | | 6.38 | | | | 0.00 | | | | (2.96 | ) |
November 1, 2005 to October 31, 2006 | | $ | 29.99 | | | | (0.34 | ) | | | 4.49 | | | | 0.00 | | | | (3.11 | ) |
Please see footnotes on page 82
| | | | | | |
| Financial Highlights | | Wells Fargo Advantage Small and Mid Cap Stock Funds | | | 77 | |
| | | | | | | | | | | | | | | | | | | | | | | | | | | | | | |
Distributions
from Tax
Basis Return
of capital | | | Ending
Net Asset
Value Per
Share | | | Ratio to Average Net Assets (Annualized) | | | Total
Return1 | | | Portfolio
Turnover
Rate | | | Net Assets at
End of Period
(000’s omitted) | |
| | | Net Investment
Income (Loss) | | | Gross
Expenses | | | Net
Expenses | | | | |
| | | | | | | |
| | | | | | | | | | | | | | | | | | | | | | | | | | | | | | | |
| | | | | | | | | | | | | | | | | | | | | | | | | | | | | | |
| | 0.00 | | | $ | 14.97 | | | | (0.89 | )% | | | 1.20 | % | | | 1.20 | % | | | 22.71 | % | | | 73 | % | | $ | 425,697 | |
| | 0.00 | | | $ | 12.84 | | | | (0.79 | )% | | | 1.26 | % | | | 1.20 | % | | | 23.58 | % | | | 69 | % | | $ | 322,945 | |
| | 0.00 | | | $ | 10.39 | | | | (0.73 | )% | | | 1.32 | % | | | 1.20 | % | | | 35.29 | % | | | 76 | % | | $ | 240,411 | |
| | 0.00 | | | $ | 7.68 | | | | (0.70 | )% | | | 1.36 | % | | | 1.20 | % | | | (43.69 | )% | | | 82 | % | | $ | 148,493 | |
| | 0.00 | | | $ | 16.17 | | | | (0.71 | )% | | | 1.37 | % | | | 1.20 | % | | | 27.90 | % | | | 122 | % | | $ | 110,917 | |
| | 0.00 | | | $ | 14.12 | | | | (0.95 | )% | | | 1.43 | % | | | 1.20 | % | | | 24.07 | % | | | 142 | % | | $ | 62,302 | |
| | | | | | | | | | | | | | | | | | | | | | | | | | | | | | |
| | 0.00 | | | $ | 15.29 | | | | (0.59 | )% | | | 0.94 | % | | | 0.90 | % | | | 22.99 | % | | | 73 | % | | $ | 745,624 | |
| | 0.00 | | | $ | 13.09 | | | | (0.49 | )% | | | 0.99 | % | | | 0.90 | % | | | 23.86 | % | | | 69 | % | | $ | 586,879 | |
| | 0.00 | | | $ | 10.56 | | | | (0.43 | )% | | | 1.07 | % | | | 0.90 | % | | | 35.73 | % | | | 76 | % | | $ | 419,154 | |
| | 0.00 | | | $ | 7.78 | | | | (0.40 | )% | | | 1.09 | % | | | 0.90 | % | | | (43.50 | )% | | | 82 | % | | $ | 197,150 | |
| | 0.00 | | | $ | 16.30 | | | | (0.41 | )% | | | 1.10 | % | | | 0.90 | % | | | 28.22 | % | | | 122 | % | | $ | 85,664 | |
| | 0.00 | | | $ | 14.19 | | | | (0.64 | )% | | | 1.16 | % | | | 0.90 | % | | | 24.46 | % | | | 142 | % | | $ | 55,921 | |
| | | | | | | | | | | | | | | | | | | | | | | | | | | | | | |
| | 0.00 | | | $ | 14.53 | | | | (1.12 | )% | | | 1.44 | % | | | 1.44 | % | | | 22.60 | % | | | 73 | % | | $ | 34,602 | |
| | 0.00 | | | $ | 12.50 | | | | (1.06 | )% | | | 1.52 | % | | | 1.48 | % | | | 23.27 | % | | | 69 | % | | $ | 29,757 | |
| | 0.00 | | | $ | 10.14 | | | | (1.02 | )% | | | 1.62 | % | | | 1.49 | % | | | 34.84 | % | | | 76 | % | | $ | 26,402 | |
| | 0.00 | | | $ | 7.52 | | | | (1.05 | )% | | | 1.71 | % | | | 1.55 | % | | | (43.87 | )% | | | 82 | % | | $ | 19,322 | |
| | 0.00 | | | $ | 15.93 | | | | (1.09 | )% | | | 1.72 | % | | | 1.57 | % | | | 27.32 | % | | | 122 | % | | $ | 43,069 | |
| | 0.00 | | | $ | 13.99 | | | | (1.32 | )% | | | 1.78 | % | | | 1.57 | % | | | 23.59 | % | | | 142 | % | | $ | 37,082 | |
| | | | | | | |
| | | | | | | | | | | | | | | | | | | | | | | | | | | | | | | |
| | | | | | | | | | | | | | | | | | | | | | | | | | | | | | |
| | 0.00 | | | $ | 37.23 | | | | 0.18 | % | | | 1.22 | % | | | 1.20 | % | | | 18.83 | % | | | 45 | % | | $ | 822,774 | |
| | 0.00 | | | $ | 31.33 | | | | (0.20 | )% | | | 1.25 | % | | | 1.20 | % | | | 21.06 | % | | | 66 | % | | $ | 707,958 | |
| | (0.02 | ) | | $ | 25.88 | | | | (0.07 | )% | | | 1.31 | % | | | 1.20 | % | | | 15.44 | % | | | 68 | % | | $ | 612,110 | |
| | 0.00 | | | $ | 23.47 | | | | 0.08 | % | | | 1.28 | % | | | 1.20 | % | | | (31.65 | )% | | | 72 | % | | $ | 541,369 | |
| | 0.00 | | | $ | 39.68 | | | | 0.29 | % | | | 1.33 | % | | | 1.20 | % | | | 20.94 | % | | | 65 | % | | $ | 910,162 | |
| | 0.00 | | | $ | 38.56 | | | | (0.11 | )% | | | 1.34 | % | | | 1.20 | % | | | 22.57 | % | | | 79 | % | | $ | 800,078 | |
| | | | | | | |
| | | | | | | | | | | | | | | | | | | | | | | | | | | | | | | |
| | | | | | | | | | | | | | | | | | | | | | | | | | | | | | |
| | 0.00 | | | $ | 33.83 | | | | 0.34 | % | | | 1.31 | % | | | 1.30 | % | | | 14.57 | % | | | 7 | % | | $ | 767,576 | |
| | 0.00 | | | $ | 29.71 | | | | 0.79 | % | | | 1.38 | % | | | 1.37 | % | | | 28.01 | % | | | 21 | % | | $ | 645,371 | |
| | 0.00 | | | $ | 23.32 | | | | 0.79 | % | | | 1.44 | % | | | 1.44 | % | | | 27.99 | % | | | 27 | % | | $ | 438,744 | |
| | 0.00 | | | $ | 18.22 | | | | (0.08 | )% | | | 1.44 | % | | | 1.44 | % | | | (41.27 | )% | | | 27 | % | | $ | 382,412 | |
| | 0.00 | | | $ | 36.28 | | | | (0.45 | )% | | | 1.44 | % | | | 1.44 | % | | | 21.87 | % | | | 48 | % | | $ | 715,334 | |
| | 0.00 | | | $ | 32.63 | | | | (0.15 | )% | | | 1.44 | % | | | 1.43 | % | | | 15.44 | % | | | 33 | % | | $ | 656,151 | |
| | | | | | | | | | | | | | | | | | | | | | | | | | | | | | |
| | 0.00 | | | $ | 30.84 | | | | (0.72 | )% | | | 2.06 | % | | | 2.04 | % | | | 14.14 | % | | | 7 | % | | $ | 11,705 | |
| | 0.00 | | | $ | 27.02 | | | | 0.00 | % | | | 2.13 | % | | | 2.13 | % | | | 26.97 | % | | | 21 | % | | $ | 36,436 | |
| | 0.00 | | | $ | 21.28 | | | | 0.03 | % | | | 2.19 | % | | | 2.19 | % | | | 27.04 | % | | | 27 | % | | $ | 46,175 | |
| | 0.00 | | | $ | 16.75 | | | | (0.87 | )% | | | 2.19 | % | | | 2.19 | % | | | (41.68 | )% | | | 27 | % | | $ | 53,515 | |
| | 0.00 | | | $ | 33.98 | | | | (1.20 | )% | | | 2.19 | % | | | 2.19 | % | | | 20.94 | % | | | 48 | % | | $ | 123,492 | |
| | 0.00 | | | $ | 30.96 | | | | (0.91 | )% | | | 2.19 | % | | | 2.18 | % | | | 14.61 | % | | | 33 | % | | $ | 128,970 | |
| | | | | | | | | | | | | | | | | | | | | | | | | | | | | | |
| | 0.00 | | | $ | 30.92 | | | | (0.41 | )% | | | 2.07 | % | | | 2.05 | % | | | 14.14 | % | | | 7 | % | | $ | 121,815 | |
| | 0.00 | | | $ | 27.11 | | | | 0.04 | % | | | 2.13 | % | | | 2.12 | % | | | 27.04 | % | | | 21 | % | | $ | 97,675 | |
| | 0.00 | | | $ | 21.34 | | | | 0.03 | % | | | 2.19 | % | | | 2.19 | % | | | 27.02 | % | | | 27 | % | | $ | 70,558 | |
| | 0.00 | | | $ | 16.80 | | | | (0.85 | )% | | | 2.19 | % | | | 2.19 | % | | | (41.69 | )% | | | 27 | % | | $ | 69,952 | |
| | 0.00 | | | $ | 34.07 | | | | (1.20 | )% | | | 2.19 | % | | | 2.19 | % | | | 20.96 | % | | | 48 | % | | $ | 146,997 | |
| | 0.00 | | | $ | 31.03 | | | | (0.91 | )% | | | 2.19 | % | | | 2.18 | % | | | 14.57 | % | | | 33 | % | | $ | 143,872 | |
| | | | |
| 78 | | Wells Fargo Advantage Small and Mid Cap Stock Funds | | Financial Highlights |
| | | | | | | | | | | | | | | | | | | | |
| | | Beginning
Net Asset
Value Per
Share | | | Net
Investment
Income (Loss) | | | Net Realized
and Unrealized
Gains (Losses)
on Investments | | | Distributions
from Net
Investment
Income | | | Distributions
from Net
Realized Gains | |
| | | | | |
Small Cap Value Fund (continued) | | | | | | | | | | | | | | | | | | | | |
Administrator Class | | | | | | | | | | | | | | | | | | | | |
November 1, 2010 to April 30, 2011 (Unaudited) | | $ | 30.32 | | | | 0.17 | 2 | | | 4.25 | | | | (0.32 | ) | | | 0.00 | |
July 30, 20103 to October 31, 2010 | | $ | 28.12 | | | | 0.05 | 2 | | | 2.15 | | | | 0.00 | | | | 0.00 | |
Institutional Class | | | | | | | | | | | | | | | | | | | | |
November 1, 2010 to April 30, 2011 (Unaudited) | | $ | 30.33 | | | | 0.16 | | | | 4.31 | | | | (0.31 | ) | | | 0.00 | |
November 1, 2009 to October 31, 2010 | | $ | 23.80 | | | | 0.34 | 2 | | | 6.42 | | | | (0.23 | ) | | | 0.00 | |
November 1, 2008 to October 31, 2009 | | $ | 18.50 | | | | 0.25 | 2 | | | 5.05 | | | | 0.00 | | | | 0.00 | |
November 1, 2007 to October 31, 2008 | | $ | 36.77 | | | | 0.13 | 2 | | | (13.45 | ) | | | (0.17 | ) | | | (4.78 | ) |
July 31, 20073 to October 31, 2007 | | $ | 34.30 | | | | 0.01 | 2 | | | 2.46 | | | | 0.00 | | | | 0.00 | |
Investor Class | | | | | | | | | | | | | | | | | | | | |
November 1, 2010 to April 30, 2011 (Unaudited) | | $ | 30.18 | | | | 0.05 | 2 | | | 4.33 | | | | (0.18 | ) | | | 0.00 | |
November 1, 2009 to October 31, 2010 | | $ | 23.70 | | | | 0.22 | 2 | | | 6.39 | | | | (0.13 | ) | | | 0.00 | |
November 1, 2008 to October 31, 2009 | | $ | 18.50 | | | | 0.17 | 2 | | | 5.03 | | | | 0.00 | | | | 0.00 | |
November 1, 2007 to October 31, 2008 | | $ | 36.73 | | | | (0.01 | )2 | | | (13.43 | ) | | | (0.01 | ) | | | (4.78 | ) |
November 1, 2006 to October 31, 2007 | | $ | 32.98 | | | | (0.13 | )2 | | | 6.84 | | | | 0.00 | | | | (2.96 | ) |
November 1, 2005 to October 31, 2006 | | $ | 31.45 | | | | (0.02 | ) | | | 4.66 | | | | 0.00 | | | | (3.11 | ) |
| | | | | |
Small/Mid Cap Value Fund | | | | | | | | | | | | | | | | | | | | |
Class A | | | | | | | | | | | | | | | | | | | | |
November 1, 2010 to April 30, 2011 (Unaudited) | | $ | 14.33 | | | | 0.04 | | | | 2.38 | | | | (0.13 | ) | | | 0.00 | |
November 1, 2009 to October 31, 2010 | | $ | 11.78 | | | | 0.08 | | | | 2.56 | | | | (0.09 | ) | | | 0.00 | |
November 1, 2008 to October 31, 2009 | | $ | 8.78 | | | | 0.11 | 2 | | | 2.89 | | | | 0.00 | | | | 0.00 | |
November 1, 2007 to October 31, 2008 | | $ | 18.19 | | | | 0.11 | 2 | | | (7.84 | ) | | | (0.09 | ) | | | (1.59 | ) |
July 31, 20073 to October 31, 2007 | | $ | 17.09 | | | | (0.02 | )2 | | | 1.12 | | | | 0.00 | | | | 0.00 | |
Class C | | | | | | | | | | | | | | | | | | | | |
November 1, 2010 to April 30, 2011 (Unaudited) | | $ | 14.10 | | | | (0.02 | ) | | | 2.35 | | | | (0.03 | ) | | | 0.00 | |
November 1, 2009 to October 31, 2010 | | $ | 11.62 | | | | 0.00 | | | | 2.51 | | | | (0.03 | ) | | | 0.00 | |
November 1, 2008 to October 31, 2009 | | $ | 8.72 | | | | 0.04 | 2 | | | 2.86 | | | | 0.00 | | | | 0.00 | |
November 1, 2007 to October 31, 2008 | | $ | 18.15 | | | | 0.02 | 2 | | | (7.81 | ) | | | (0.05 | ) | | | (1.59 | ) |
July 31, 20073 to October 31, 2007 | | $ | 17.09 | | | | (0.06 | )2 | | | 1.12 | | | | 0.00 | | | | 0.00 | |
Administrator Class | | | | | | | | | | | | | | | | | | | | |
November 1, 2010 to April 30, 2011 (Unaudited) | | $ | 14.60 | | | | 0.05 | | | | 2.43 | | | | (0.16 | ) | | | 0.00 | |
November 1, 2009 to October 31, 2010 | | $ | 11.99 | | | | 0.13 | | | | 2.59 | | | | (0.11 | ) | | | 0.00 | |
November 1, 2008 to October 31, 2009 | | $ | 8.92 | | | | 0.13 | 2 | | | 2.94 | | | | 0.00 | | | | 0.00 | |
November 1, 2007 to October 31, 2008 | | $ | 18.37 | | | | 0.12 | 2 | | | (7.91 | ) | | | (0.07 | ) | | | (1.59 | ) |
November 1, 2006 to October 31, 2007 | | $ | 16.45 | | | | (0.05 | )2 | | | 2.20 | | | | 0.00 | | | | (0.23 | ) |
November 1, 2005 to October 31, 2006 | | $ | 14.65 | | | | 0.00 | | | | 2.12 | | | | 0.00 | | | | (0.32 | ) |
Institutional Class | | | | | | | | | | | | | | | | | | | | |
November 1, 2010 to April 30, 2011 (Unaudited) | | $ | 14.67 | | | | 0.06 | | | | 2.45 | | | | (0.19 | ) | | | 0.00 | |
November 1, 2009 to October 31, 2010 | | $ | 12.04 | | | | 0.17 | 2 | | | 2.59 | | | | (0.13 | ) | | | 0.00 | |
November 1, 2008 to October 31, 2009 | | $ | 8.93 | | | | 0.15 | 2 | | | 2.96 | | | | 0.00 | | | | 0.00 | |
November 1, 2007 to October 31, 2008 | | $ | 18.40 | | | | 0.15 | 2 | | | (7.93 | ) | | | (0.10 | ) | | | (1.59 | ) |
November 1, 2006 to October 31, 2007 | | $ | 16.45 | | | | (0.03 | )2 | | | 2.21 | | | | 0.00 | | | | (0.23 | ) |
November 1, 2005 to October 31, 2006 | | $ | 16.01 | | | | 0.01 | | | | 0.43 | | | | 0.00 | | | | 0.00 | |
Investor Class | | | | | | | | | | | | | | | | | | | | |
November 1, 2010 to April 30, 2011 (Unaudited) | | $ | 14.38 | | | | 0.02 | | | | 2.40 | | | | (0.11 | ) | | | 0.00 | |
November 1, 2009 to October 31, 2010 | | $ | 11.81 | | | | 0.09 | | | | 2.56 | | | | (0.08 | ) | | | 0.00 | |
November 1, 2008 to October 31, 2009 | | $ | 8.81 | | | | 0.10 | 2 | | | 2.90 | | | | 0.00 | | | | 0.00 | |
November 1, 2007 to October 31, 2008 | | $ | 18.18 | | | | 0.06 | 2 | | | (7.82 | ) | | | (0.02 | ) | | | (1.59 | ) |
November 1, 2006 to October 31, 2007 | | $ | 16.34 | | | | (0.12 | )2 | | | 2.19 | | | | 0.00 | | | | (0.23 | ) |
November 1, 2005 to October 31, 2006 | | $ | 14.62 | | | | (0.01 | ) | | | 2.05 | | | | 0.00 | | | | (0.32 | ) |
Please see footnotes on page 82
| | | | | | |
| Financial Highlights | | Wells Fargo Advantage Small and Mid Cap Stock Funds | | | 79 | |
| | | | | | | | | | | | | | | | | | | | | | | | | | |
Ending
Net Asset
Value Per
Share | | | Ratio to Average Net Assets (Annualized) | | | Total
Return1 | | | Portfolio
Turnover
Rate | | | Net Assets at
End of Period
(000’s omitted) | |
| | Net Investment
Income (Loss) | | | Gross
Expenses | | | Net
Expenses | | | | |
| | | | | | |
| | | | | | | | | | | | | | | | | | | | | | | | | | | |
| | | | | | | | | | | | | | | | | | | | | | | | | | |
| $ | 34.42 | | | | 1.02 | % | | | 1.15 | % | | | 1.10 | % | | | 14.64 | % | | | 7 | % | | $ | 469,892 | |
| $ | 30.32 | | | | 0.79 | % | | | 1.28 | % | | | 1.10 | % | | | 7.82 | % | | | 21 | % | | $ | 8,841 | |
| | | | | | | | | | | | | | | | | | | | | | | | | | |
| $ | 34.49 | | | | 0.83 | % | | | 0.89 | % | | | 0.89 | % | | | 14.80 | % | | | 7 | % | | $ | 1,173,667 | |
| $ | 30.33 | | | | 1.23 | % | | | 0.94 | % | | | 0.93 | % | | | 28.53 | % | | | 21 | % | | $ | 1,279,201 | |
| $ | 23.80 | | | | 1.24 | % | | | 1.00 | % | | | 0.95 | % | | | 28.65 | % | | | 27 | % | | $ | 843,753 | |
| $ | 18.50 | | | | 0.49 | % | | | 0.99 | % | | | 0.95 | % | | | (40.96 | )% | | | 27 | % | | $ | 340,878 | |
| $ | 36.77 | | | | 0.13 | % | | | 0.97 | % | | | 0.94 | % | | | 7.20 | % | | | 48 | % | | $ | 8,707 | |
| | | | | | | | | | | | | | | | | | | | | | | | | | |
| $ | 34.38 | | | | 0.31 | % | | | 1.38 | % | | | 1.33 | % | | | 14.55 | % | | | 7 | % | | $ | 2,033,329 | |
| $ | 30.18 | | | | 0.80 | % | | | 1.47 | % | | | 1.35 | % | | | 27.99 | % | | | 21 | % | | $ | 1,968,601 | |
| $ | 23.70 | | | | 0.88 | % | | | 1.55 | % | | | 1.36 | % | | | 28.11 | % | | | 27 | % | | $ | 1,523,637 | |
| $ | 18.50 | | | | (0.02 | )% | | | 1.57 | % | | | 1.36 | % | | | (41.20 | )% | | | 27 | % | | $ | 1,461,833 | |
| $ | 36.73 | | | | (0.37 | )% | | | 1.61 | % | | | 1.36 | % | | | 21.95 | % | | | 48 | % | | $ | 3,183,124 | |
| $ | 32.98 | | | | (0.05 | )% | | | 1.61 | % | | | 1.36 | % | | | 15.53 | % | | | 33 | % | | $ | 2,571,031 | |
| | | | | | |
| | | | | | | | | | | | | | | | | | | | | | | | | | | |
| | | | | | | | | | | | | | | | | | | | | | | | | | |
| $ | 16.62 | | | | 0.48 | % | | | 1.39 | % | | | 1.39 | % | | | 16.90 | % | | | 19 | % | | $ | 49,766 | |
| $ | 14.33 | | | | 0.77 | % | | | 1.47 | % | | | 1.40 | % | | | 22.63 | % | | | 41 | % | | $ | 41,491 | |
| $ | 11.78 | | | | 1.12 | % | | | 1.57 | % | | | 1.40 | % | | | 34.17 | % | | | 35 | % | | $ | 27,370 | |
| $ | 8.78 | | | | 0.83 | % | | | 1.55 | % | | | 1.40 | % | | | (46.09 | )% | | | 43 | % | | $ | 12,859 | |
| $ | 18.19 | | | | (0.50 | )% | | | 1.50 | % | | | 1.27 | % | | | 6.44 | % | | | 89 | % | | $ | 444 | |
| | | | | | | | | | | | | | | | | | | | | | | | | | |
| $ | 16.40 | | | | (0.27 | )% | | | 2.14 | % | | | 2.14 | % | | | 16.54 | % | | | 19 | % | | $ | 14,858 | |
| $ | 14.10 | | | | 0.00 | % | | | 2.22 | % | | | 2.15 | % | | | 21.62 | % | | | 41 | % | | $ | 12,379 | |
| $ | 11.62 | | | | 0.40 | % | | | 2.26 | % | | | 2.11 | % | | | 33.26 | % | | | 35 | % | | $ | 9,052 | |
| $ | 8.72 | | | | 0.16 | % | | | 2.30 | % | | | 2.15 | % | | | (46.46 | )% | | | 43 | % | | $ | 4,700 | |
| $ | 18.15 | | | | (1.32 | )% | | | 2.27 | % | | | 2.10 | % | | | 6.20 | % | | | 89 | % | | $ | 45 | |
| | | | | | | | | | | | | | | | | | | | | | | | | | |
| $ | 16.92 | | | | 0.73 | % | | | 1.23 | % | | | 1.15 | % | | | 17.11 | % | | | 19 | % | | $ | 88,189 | |
| $ | 14.60 | | | | 1.00 | % | | | 1.29 | % | | | 1.15 | % | | | 22.82 | % | | | 41 | % | | $ | 71,246 | |
| $ | 11.99 | | | | 1.34 | % | | | 1.39 | % | | | 1.15 | % | | | 34.42 | % | | | 35 | % | | $ | 55,463 | |
| $ | 8.92 | | | | 0.86 | % | | | 1.43 | % | | | 1.15 | % | | | (45.89 | )% | | | 43 | % | | $ | 35,489 | |
| $ | 18.37 | | | | (0.30 | )% | | | 1.37 | % | | | 1.15 | % | | | 13.24 | % | | | 89 | % | | $ | 41,988 | |
| $ | 16.45 | | | | 0.08 | % | | | 1.43 | % | | | 1.15 | % | | | 14.66 | % | | | 56 | % | | $ | 75,172 | |
| | | | | | | | | | | | | | | | | | | | | | | | | | |
| $ | 16.99 | | | | 0.87 | % | | | 0.97 | % | | | 0.95 | % | | | 17.22 | % | | | 19 | % | | $ | 29,410 | |
| $ | 14.67 | | | | 1.22 | % | | | 1.02 | % | | | 0.95 | % | | | 23.08 | % | | | 41 | % | | $ | 19,005 | |
| $ | 12.04 | | | | 1.58 | % | | | 1.12 | % | | | 0.95 | % | | | 34.83 | % | | | 35 | % | | $ | 9,985 | |
| $ | 8.93 | | | | 1.07 | % | | | 1.16 | % | | | 0.95 | % | | | (45.83 | )% | | | 43 | % | | $ | 6,679 | |
| $ | 18.40 | | | | (0.18 | )% | | | 1.10 | % | | | 0.94 | % | | | 13.42 | % | | | 89 | % | | $ | 2,902 | |
| $ | 16.45 | | | | 0.53 | % | | | 1.04 | % | | | 0.89 | % | | | 2.75 | % | | | 56 | % | | $ | 10 | |
| | | | | | | | | | | | | | | | | | | | | | | | | | |
| $ | 16.69 | | | | 0.41 | % | | | 1.46 | % | | | 1.46 | % | | | 16.88 | % | | | 19 | % | | $ | 101,904 | |
| $ | 14.38 | | | | 0.67 | % | | | 1.56 | % | | | 1.48 | % | | | 22.49 | % | | | 41 | % | | $ | 99,424 | |
| $ | 11.81 | | | | 1.02 | % | | | 1.67 | % | | | 1.49 | % | | | 34.05 | % | | | 35 | % | | $ | 94,728 | |
| $ | 8.81 | | | | 0.44 | % | | | 1.69 | % | | | 1.49 | % | | | (46.14 | )% | | | 43 | % | | $ | 75,324 | |
| $ | 18.18 | | | | (0.68 | )% | | | 1.73 | % | | | 1.52 | % | | | 12.83 | % | | | 89 | % | | $ | 169,624 | |
| $ | 16.34 | | | | (0.33 | )% | | | 1.78 | % | | | 1.57 | % | | | 14.13 | % | | | 56 | % | | $ | 150,180 | |
| | | | |
| 80 | | Wells Fargo Advantage Small and Mid Cap Stock Funds | | Financial Highlights |
| | | | | | | | | | | | | | | | | | | | |
| | | Beginning
Net Asset
Value Per
Share | | | Net
Investment
Income (Loss) | | | Net Realized
and Unrealized
Gains (Losses)
on Investments | | | Distributions
from Net
Investment
Income | | | Distributions
from Net
Realized Gains | |
| | | | | |
Special Small Cap Value Fund10 | | | | | | | | | | | | | | | | | | | | |
Class A | | | | | | | | | | | | | | | | | | | | |
November 1, 2010 to April 30, 2011 (Unaudited) | | $ | 19.78 | | | | (0.02 | ) | | | 3.70 | | | | 0.00 | | | | 0.00 | |
August 1, 2010 to October 31, 20108 | | $ | 18.50 | | | | (0.01 | ) | | | 1.29 | | | | 0.00 | | | | 0.00 | |
August 1, 2009 to July 31, 2010 | | $ | 15.51 | | | | (0.02 | ) | | | 3.07 | | | | (0.01 | ) | | | 0.00 | |
August 1, 2008 to July 31, 2009 | | $ | 18.78 | | | | 0.11 | | | | (3.19 | ) | | | (0.19 | ) | | | (0.00 | )4 |
August 1, 2007 to July 31, 2008 | | $ | 27.25 | | | | 0.15 | | | | (3.83 | ) | | | (0.27 | ) | | | (4.52 | ) |
August 1, 2006 to July 31, 2007 | | $ | 28.55 | | | | 0.30 | | | | 3.43 | | | | (0.10 | ) | | | (4.93 | ) |
August 1, 2005 to July 31, 2006 | | $ | 30.03 | | | | 0.07 | | | | 1.95 | | | | (0.21 | ) | | | (3.29 | ) |
Class B | | | | | | | | | | | | | | | | | | | | |
November 1, 2010 to April 30, 2011 (Unaudited) | | $ | 18.87 | | | | (0.09 | )2 | | | 3.51 | | | | 0.00 | | | | 0.00 | |
August 1, 2010 to October 31, 20108 | | $ | 17.68 | | | | (0.08 | ) | | | 1.27 | | | | 0.00 | | | | 0.00 | |
August 1, 2009 to July 31, 2010 | | $ | 14.88 | | | | (0.14 | )2 | | | 2.94 | | | | 0.00 | | | | 0.00 | |
August 1, 2008 to July 31, 2009 | | $ | 17.92 | | | | 0.00 | 2 | | | (3.02 | ) | | | (0.02 | ) | | | (0.00 | )4 |
August 1, 2007 to July 31, 2008 | | $ | 26.17 | | | | 0.00 | | | | (3.67 | ) | | | (0.06 | ) | | | (4.52 | ) |
August 1, 2006 to July 31, 2007 | | $ | 27.69 | | | | 0.08 | 2 | | | 3.33 | | | | 0.00 | | | | (4.93 | ) |
August 1, 2005 to July 31, 2006 | | $ | 29.25 | | | | (0.13 | ) | | | 1.86 | | | | 0.00 | | | | (3.29 | ) |
Class C | | | | | | | | | | | | | | | | | | | | |
November 1, 2010 to April 30, 2011 (Unaudited) | | $ | 18.94 | | | | (0.09 | ) | | | 3.52 | | | | 0.00 | | | | 0.00 | |
August 1, 2010 to October 31, 20108 | | $ | 17.74 | | | | (0.07 | ) | | | 1.27 | | | | 0.00 | | | | 0.00 | |
August 1, 2009 to July 31, 2010 | | $ | 14.93 | | | | (0.18 | ) | | | 2.99 | | | | 0.00 | | | | 0.00 | |
August 1, 2008 to July 31, 2009 | | $ | 17.98 | | | | 0.00 | 3 | | | (3.03 | ) | | | (0.02 | ) | | | (0.00 | )4 |
August 1, 2007 to July 31, 2008 | | $ | 26.24 | | | | 0.00 | 3 | | | (3.69 | ) | | | (0.05 | ) | | | (4.52 | ) |
August 1, 2006 to July 31, 2007 | | $ | 27.75 | | | | 0.09 | | | | 3.33 | | | | 0.00 | | | | (4.93 | ) |
August 1, 2005 to July 31, 2006 | | $ | 29.30 | | | | (0.12 | ) | | | 1.86 | | | | 0.00 | | | | (3.29 | ) |
Administrator Class | | | | | | | | | | | | | | | | | | | | |
November 1, 2010 to April 30, 2011 (Unaudited) | | $ | 19.96 | | | | 0.02 | 2 | | | 3.71 | | | | 0.00 | | | | 0.00 | |
August 1, 2010 to October 31, 20108 | | $ | 18.65 | | | | 0.01 | | | | 1.30 | | | | 0.00 | | | | 0.00 | |
August 1, 2009 to July 31, 2010 | | $ | 15.63 | | | | 0.04 | 2 | | | 3.04 | | | | (0.01 | ) | | | 0.00 | |
August 1, 2008 to July 31, 2009 | | $ | 18.95 | | | | 0.16 | | | | (3.23 | ) | | | (0.25 | ) | | | (0.00 | )4 |
August 1, 2007 to July 31, 2008 | | $ | 27.46 | | | | 0.21 | | | | (3.87 | ) | | | (0.33 | ) | | | (4.52 | ) |
August 1, 2006 to July 31, 2007 | | $ | 28.73 | | | | 0.37 | | | | 3.47 | | | | (0.18 | ) | | | (4.93 | ) |
August 1, 2005 to July 31, 2006 | | $ | 30.20 | | | | 0.15 | | | | 1.94 | | | | (0.27 | ) | | | (3.29 | ) |
Institutional Class | | | | | | | | | | | | | | | | | | | | |
November 1, 2010 to April 30, 2011 (Unaudited) | | $ | 19.96 | | | | 0.02 | 2 | | | 3.73 | | | | 0.00 | | | | 0.00 | |
August 1, 2010 to October 31, 20108 | | $ | 18.66 | | | | (0.02 | )2 | | | 1.32 | | | | 0.00 | | | | 0.00 | |
July 30, 20103 to July 31, 2010 | | $ | 18.66 | | | | 0.00 | 2 | | | 0.00 | | | | 0.00 | | | | 0.00 | |
| | | | | |
Traditional Small Cap Growth Fund9 | | | | | | | | | | | | | | | | | | | | |
Class A | | | | | | | | | | | | | | | | | | | | |
November 1, 2010 to April 30, 2011 (Unaudited) | | $ | 14.31 | | | | (0.08 | )2 | | | 4.18 | | | | 0.00 | | | | 0.00 | |
October 1, 2010 to October 31, 20105 | | $ | 13.77 | | | | (0.02 | )2 | | | 0.56 | | | | 0.00 | | | | 0.00 | |
October 1, 2009 to September 30, 2010 | | $ | 12.24 | | | | (0.12 | )2 | | | 1.65 | | | | 0.00 | | | | 0.00 | |
October 1, 2008 to September 30, 2009 | | $ | 12.20 | | | | (0.04 | )2 | | | 0.10 | 6 | | | 0.00 | | | | (0.02 | ) |
October 1, 2007 to September 30, 2008 | | $ | 18.70 | | | | (0.03 | )2 | | | (3.61 | ) | | | 0.00 | | | | (2.84 | ) |
October 1, 2006 to September 30, 2007 | | $ | 17.35 | | | | (0.12 | )2 | | | 3.63 | | | | 0.00 | | | | (2.16 | ) |
October 1, 2005 to September 30, 2006 | | $ | 19.03 | | | | (0.16 | )2 | | | 0.55 | | | | 0.00 | | | | (2.07 | ) |
Class C | | | | | | | | | | | | | | | | | | | | |
November 1, 2010 to April 30, 2011 (Unaudited) | | $ | 14.29 | | | | (0.13 | ) | | | 4.15 | | | | 0.00 | | | | 0.00 | |
October 1, 2010 to October 31, 20105 | | $ | 13.66 | | | | (0.02 | )2 | | | 0.65 | | | | 0.00 | | | | 0.00 | |
July 30, 20103 to September 30, 2010 | | $ | 13.18 | | | | (0.04 | )2 | | | 0.52 | | | | 0.00 | | | | 0.00 | |
Please see footnotes on page 82
| | | | | | |
| Financial Highlights | | Wells Fargo Advantage Small and Mid Cap Stock Funds | | | 81 | |
| | | | | | | | | | | | | | | | | | | | | | | | | | | | | | |
Distributions
from Tax
Basis Return
of capital | | | Ending
Net Asset
Value Per
Share | | | Ratio to Average Net Assets (Annualized) | | | Total
Return1 | | | Portfolio
Turnover
Rate | | | Net Assets at
End of Period
(000’s omitted) | |
| | | Net Investment
Income (Loss) | | | Gross
Expenses | | | Net
Expenses | | | | |
| | | | | | | |
| | | | | | | | | | | | | | | | | | | | | | | | | | | | | | | |
| | | | | | | | | | | | | | | | | | | | | | | | | | | | | | |
| | 0.00 | | | $ | 23.46 | | | | (0.12 | )% | | | 1.39 | % | | | 1.34 | % | | | 18.60 | % | | | 19 | % | | $ | 507,750 | |
| | 0.00 | | | $ | 19.78 | | | | (0.19 | )% | | | 1.46 | % | | | 1.34 | % | | | 6.92 | % | | | 7 | % | | $ | 477,079 | |
| | (0.05 | )2 | | $ | 18.50 | | | | (0.07 | )% | | | 1.43 | % | | | 1.39 | % | | | 19.72 | % | | | 45 | % | | $ | 472,903 | |
| | 0.00 | | | $ | 15.51 | | | | 0.69 | % | | | 1.43 | % | | | 1.33 | % | | | (16.17 | )% | | | 43 | % | | $ | 442,973 | |
| | 0.00 | | | $ | 18.78 | | | | 0.73 | % | | | 1.36 | % | | | 1.31 | % | | | (15.22 | )% | | | 48 | % | | $ | 598,656 | |
| | 0.00 | | | $ | 27.25 | | | | 1.07 | % | | | 1.32 | % | | | 1.31 | % | | | 13.30 | % | | | 45 | % | | $ | 959,305 | |
| | 0.00 | | | $ | 28.55 | | | | 0.33 | % | | | 1.34 | % | | | 1.31 | % | | | 7.82 | % | | | 49 | % | | $ | 923,225 | |
| | | | | | | | | | | | | | | | | | | | | | | | | | | | | | |
| | 0.00 | | | $ | 22.29 | | | | (0.86 | )% | | | 2.14 | % | | | 2.09 | % | | | 18.12 | % | | | 19 | % | | $ | 32,249 | |
| | 0.00 | | | $ | 18.87 | | | | (0.93 | )% | | | 2.21 | % | | | 2.09 | % | | | 6.73 | % | | | 7 | % | | $ | 36,922 | |
| | 0.00 | | | $ | 17.68 | | | | (0.82 | )% | | | 2.18 | % | | | 2.15 | % | | | 18.82 | % | | | 45 | % | | $ | 36,654 | |
| | 0.00 | | | $ | 14.88 | | | | 0.01 | % | | | 2.17 | % | | | 2.07 | % | | | (16.83 | )% | | | 43 | % | | $ | 41,008 | |
| | 0.00 | | | $ | 17.92 | | | | (0.02 | )% | | | 2.11 | % | | | 2.06 | % | | | (15.80 | )% | | | 48 | % | | $ | 91,409 | |
| | 0.00 | | | $ | 26.17 | | | | 0.30 | % | | | 2.07 | % | | | 2.06 | % | | | 12.46 | % | | | 45 | % | | $ | 163,723 | |
| | 0.00 | | | $ | 27.69 | | | | (0.42 | )% | | | 2.09 | % | | | 2.06 | % | | | 6.94 | % | | | 49 | % | | $ | 179,710 | |
| | | | | | | | | | | | | | | | | | | | | | | | | | | | | | |
| | 0.00 | | | $ | 22.37 | | | | (0.87 | )% | | | 2.14 | % | | | 2.09 | % | | | 18.11 | % | | | 19 | % | | $ | 44,065 | |
| | 0.00 | | | $ | 18.94 | | | | (0.93 | )% | | | 2.21 | % | | | 2.09 | % | | | 6.76 | % | | | 7 | % | | $ | 40,850 | |
| | 0.00 | | | $ | 17.74 | | | | (0.80 | )% | | | 2.18 | % | | | 2.12 | % | | | 18.82 | % | | | 45 | % | | $ | 40,968 | |
| | 0.00 | | | $ | 14.93 | | | | (0.03 | )% | | | 2.17 | % | | | 2.07 | % | | | (16.79 | )% | | | 43 | % | | $ | 38,744 | |
| | 0.00 | | | $ | 17.98 | | | | (0.02 | )% | | | 2.11 | % | | | 2.06 | % | | | (15.86 | )% | | | 48 | % | | $ | 61,307 | |
| | 0.00 | | | $ | 26.24 | | | | 0.31 | % | | | 2.07 | % | | | 2.06 | % | | | 12.48 | % | | | 45 | % | | $ | 131,213 | |
| | 0.00 | | | $ | 27.75 | | | | (0.42 | )% | | | 2.09 | % | | | 2.06 | % | | | 6.97 | % | | | 49 | % | | $ | 137,808 | |
| | | | | | | | | | | | | | | | | | | | | | | | | | | | | | |
| | 0.00 | | | $ | 23.69 | | | | 0.14 | % | | | 1.23 | % | | | 1.09 | % | | | 18.69 | % | | | 19 | % | | $ | 319,378 | |
| | 0.00 | | | $ | 19.96 | | | | 0.05 | % | | | 1.30 | % | | | 1.09 | % | | | 7.02 | % | | | 7 | % | | $ | 335,766 | |
| | (0.05 | )2 | | $ | 18.65 | | | | 0.21 | % | | | 1.17 | % | | | 1.13 | % | | | 20.02 | % | | | 45 | % | | $ | 320,814 | |
| | 0.00 | | | $ | 15.63 | | | | 0.95 | % | | | 1.18 | % | | | 1.08 | % | | | (15.96 | )% | | | 43 | % | | $ | 525,865 | |
| | 0.00 | | | $ | 18.95 | | | | 0.98 | % | | | 1.11 | % | | | 1.06 | % | | | (15.00 | )% | | | 48 | % | | $ | 722,786 | |
| | 0.00 | | | $ | 27.46 | | | | 1.32 | % | | | 1.07 | % | | | 1.06 | % | | | 13.62 | % | | | 45 | % | | $ | 1,067,452 | |
| | 0.00 | | | $ | 28.73 | | | | (0.58 | )% | | | 1.09 | % | | | 1.06 | % | | | 8.05 | % | | | 49 | % | | $ | 1,072,390 | |
| | | | | | | | | | | | | | | | | | | | | | | | | | | | | | |
| | 0.00 | | | $ | 23.71 | | | | 0.14 | % | | | 0.95 | % | | | 0.93 | % | | | 18.79 | % | | | 19 | % | | $ | 29,590 | |
| | 0.00 | | | $ | 19.96 | | | | (0.38 | )% | | | 1.10 | % | | | 0.94 | % | | | 7.02 | % | | | 7 | % | | $ | 3,106 | |
| | 0.00 | | | $ | 18.66 | | | | 0.00 | % | | | 0.00 | % | | | 0.00 | % | | | 0.00 | % | | | 45 | % | | $ | 10 | |
| | | | | | | |
| | | | | | | | | | | | | | | | | | | | | | | | | | | | | | | |
| | | | | | | | | | | | | | | | | | | | | | | | | | | | | | |
| | 0.00 | | | $ | 18.41 | | | | (0.93 | )% | | | 1.42 | % | | | 1.33 | % | | | 28.65 | % | | | 52 | % | | $ | 160,478 | |
| | 0.00 | | | $ | 14.31 | | | | (0.64 | )% | | | 1.47 | % | | | 1.33 | % | | | 3.92 | % | | | 9 | % | | $ | 136,332 | |
| | 0.00 | | | $ | 13.77 | | | | 0.92 | % | | | 1.39 | % | | | 1.33 | % | | | 12.50 | % | | | 80 | % | | $ | 133,166 | |
| | 0.00 | | | $ | 12.24 | | | | (0.45 | )% | | | 1.33 | % | | | 1.33 | % | | | 0.53 | % | | | 118 | % | | $ | 48,067 | |
| | (0.02 | ) | | $ | 12.20 | | | | (0.24 | )% | | | 1.27 | % | | | 1.25 | % | | | (22.75 | )% | | | 113 | % | | $ | 56,068 | |
| | 0.00 | | | $ | 18.70 | | | | (0.68 | )% | | | 1.26 | % | | | 1.25 | % | | | 21.93 | % | | | 98 | % | | $ | 90,563 | |
| | 0.00 | | | $ | 17.35 | | | | (0.88 | )% | | | 1.26 | % | | | 1.26 | % | | | 2.55 | % | | | 91 | % | | $ | 91,606 | |
| | | | | | | | | | | | | | | | | | | | | | | | | | | | | | |
| | 0.00 | | | $ | 18.31 | | | | (1.67 | )% | | | 2.17 | % | | | 2.08 | % | | | 28.13 | % | | | 52 | % | | $ | 117 | |
| | 0.00 | | | $ | 14.29 | | | | (1.31 | )% | | | 2.25 | % | | | 2.08 | % | | | 3.93 | % | | | 9 | % | | $ | 99 | |
| | 0.00 | | | $ | 13.66 | | | | (1.67 | )% | | | 2.19 | % | | | 2.08 | % | | | 4.32 | % | | | 80 | % | | $ | 10 | |
| | | | |
| 82 | | Wells Fargo Advantage Small and Mid Cap Stock Funds | | Financial Highlights |
| | | | | | | | | | | | | | | | | | | | |
| | | Beginning
Net Asset
Value Per
Share | | | Net
Investment
Income (Loss) | | | Net Realized
and Unrealized
Gains (Losses)
on Investments | | | Distributions
from Net
Investment
Income | | | Distributions
from Net
Realized Gains | |
| | | |
Traditional Small Cap Growth Fund9 (continued) | | | | | | | | | | | | | |
Administrator Class | | | | | | | | | | | | | | | | | | | | |
November 1, 2010 to April 30, 2011 (Unaudited) | | $ | 14.99 | | | | (0.07 | )2 | | | 4.37 | | | | 0.00 | | | | 0.00 | |
October 1, 2010 to October 31, 20105 | | $ | 14.43 | | | | (0.01 | )2 | | | 0.57 | | �� | | 0.00 | | | | 0.00 | |
July 30, 20103 to September 30, 2010 | | $ | 13.80 | | | | (0.02 | )2 | | | 0.65 | | | | 0.00 | | | | 0.00 | |
Institutional Class | | | | | | | | | | | | | | | | | | | | |
November 1, 2010 to April 30, 2011 (Unaudited) | | $ | 15.01 | | | | (0.05 | )2 | | | 4.37 | | | | 0.00 | | | | 0.00 | |
October 1, 2010 to October 31, 20105 | | $ | 14.43 | | | | 0.00 | 2 | | | 0.58 | | | | 0.00 | | | | 0.00 | |
October 1, 2009 to September 30, 2010 | | $ | 12.79 | | | | (0.10 | )2 | | | 1.74 | | | | (0.00 | )4 | | | 0.00 | |
October 1, 2008 to September 30, 2009 | | $ | 12.75 | | | | (0.02 | )2 | | | 0.10 | 6 | | | (0.02 | ) | | | (0.02 | ) |
October 1, 2007 to September 30, 2008 | | $ | 19.37 | | | | 0.01 | | | | (3.77 | ) | | | 0.00 | | | | (2.84 | ) |
October 1, 2006 to September 30, 2007 | | $ | 17.86 | | | | (0.07 | )2 | | | 3.74 | | | | 0.00 | | | | (2.16 | ) |
October 1, 2005 to September 30, 2006 | | $ | 19.47 | | | | (0.11 | )2 | | | 0.57 | | | | 0.00 | | | | (2.07 | ) |
| 1. | Total return calculations do not include any sales charges. Returns for periods of less than one year are not annualized. |
| 2. | Calculated based upon average shares outstanding. |
| 3. | Commencement of class operations. |
| 4. | Amount shown is less than $0.005 per share. |
| 5. | For the one month ended October 31, 2010. The Fund changed its fiscal year end from September 30 to October 31, effective October 31, 2010. |
| 6. | The per share net realized and unrealized gains or losses is not in accord with the net realized and unrealized gains or losses for the period due to the timing of sales and redemptions of fund shares in relation to fluctuating market values of the portfolio. |
| 7. | Effective June 20, 2008, Class Z was renamed Investor Class. |
| 8. | For the three months ended October 31, 2010. The fund changed it’s fiscal year end from July 31 to October 31, effective October 31, 2010. |
| 9. | After the close of business on July 16, 2010, the Fund acquired the net assets of Evergreen Growth Fund, which became the accounting and performance survivor in this transaction. The information for the periods prior to July 19, 2010 are those of Evergreen Growth Fund. |
| 10. | After the close of business on July 16, 2010, the Fund acquired the net assets of Evergreen Special Values Fund and Evergreen Small Cap Value Fund. Evergreen Special Values Fund became the accounting and performance survivor in this transaction. The information for the periods prior to July 19, 2010 are those of Evergreen Special Values Fund. |
The accompanying notes are an integral part of these financial statements.
| | | | | | |
| Financial Highlights | | Wells Fargo Advantage Small and Mid Cap Stock Funds | | | 83 | |
| | | | | | | | | | | | | | | | | | | | | | | | | | | | | | |
Distributions
from Tax
Basis Return
of capital | | | Ending
Net Asset
Value Per
Share | | | Ratio to Average Net Assets (Annualized) | | | Total
Return1 | | | Portfolio
Turnover
Rate | | | Net Assets at
End of Period
(000’s omitted) | |
| | | Net Investment
Income (Loss) | | | Gross
Expenses | | | Net
Expenses | | | | |
| | | | | | | |
| | | | | | | | | | | | | | | | | | | | | | | | | | | | | | | |
| | | | | | | | | | | | | | | | | | | | | | | | | | | | | | |
| | 0.00 | | | $ | 19.29 | | | | (0.81 | )% | | | 1.23 | % | | | 1.20 | % | | | 28.69 | % | | | 52 | % | | $ | 3,933 | |
| | 0.00 | | | $ | 14.99 | | | | (0.55 | )% | | | 1.31 | % | | | 1.20 | % | | | 3.95 | % | | | 9 | % | | $ | 11 | |
| | 0.00 | | | $ | 14.43 | | | | (0.77 | )% | | | 1.37 | % | | | 1.20 | % | | | 4.49 | % | | | 80 | % | | $ | 10 | |
| | | | | | | | | | | | | | | | | | | | | | | | | | | | | | |
| | 0.00 | | | $ | 19.33 | | | | (0.57 | )% | | | 0.99 | % | | | 0.98 | % | | | 28.78 | % | | | 52 | % | | $ | 109,371 | |
| | 0.00 | | | $ | 15.01 | | | | (0.29 | )% | | | 1.04 | % | | | 0.98 | % | | | 4.02 | % | | | 9 | % | | $ | 105,475 | |
| | 0.00 | | | $ | 14.43 | | | | (0.78 | )% | | | 1.06 | % | | | 1.05 | % | | | 12.87 | % | | | 80 | % | | $ | 102,499 | |
| | 0.00 | | | $ | 12.79 | | | | (0.20 | )% | | | 1.08 | % | | | 1.08 | % | | | 0.74 | % | | | 118 | % | | $ | 344,313 | |
| | (0.02 | ) | | $ | 12.75 | | | | 0.02 | % | | | 0.99 | % | | | 0.99 | % | | | (22.56 | )% | | | 113 | % | | $ | 395,954 | |
| | 0.00 | | | $ | 19.37 | | | | (0.39 | )% | | | 0.96 | % | | | 0.96 | % | | | 22.23 | % | | | 98 | % | | $ | 621,896 | |
| | 0.00 | | | $ | 17.86 | | | | (0.59 | )% | | | 0.96 | % | | | 0.96 | % | | | 2.89 | % | | | 91 | % | | $ | 692,450 | |
| | | | |
| 84 | | Wells Fargo Advantage Small and Mid Cap Stock Funds | | Notes to Financial Statements (Unaudited) |
1. ORGANIZATION
Wells Fargo Funds Trust (the “Trust”), a Delaware statutory trust organized on March 10, 1999, is an open-end management investment company registered under the Investment Company Act of 1940, as amended (the “1940 Act”). These financial statements report on the following funds: Wells Fargo Advantage Intrinsic Small Cap Value Fund (“Intrinsic Small Cap Value Fund”), Wells Fargo Advantage Small Cap Growth Fund (“Small Cap Growth Fund”), Wells Fargo Advantage Small Cap Opportunities Fund (“Small Cap Opportunities Fund” ) , Wells Fargo Advantage Small Cap Value Fund (“Small Cap Value Fund”), Wells Fargo Advantage Small/Mid Cap Value Fund (“Small/Mid Cap Value Fund”), Wells Fargo Advantage Special Small Cap Value Fund (“Special Small Cap Value Fund”) and Wells Fargo Advantage Traditional Small Cap Growth Fund (“Traditional Small Cap Growth Fund”) (each, a “Fund”, collectively, the “Funds”). Each Fund is a diversified series of the Trust.
2. SIGNIFICANT ACCOUNTING POLICIES
The following significant accounting policies, which are consistently followed in the preparation of the financial statements of each Fund, are in conformity with U.S. generally accepted accounting principles which require management to make estimates and assumptions that affect the reported amounts of assets and liabilities, disclosure of contingent assets and liabilities at the date of the financial statements, and the reported amounts of revenues and expenses during the reporting period. Actual results could differ from those estimates.
Securities valuation
Investments in securities are valued each business day as of the close of regular trading on the New York Stock Exchange, which is usually 4:00 p.m. (Eastern Time). Securities which are traded on a national or foreign securities exchange are valued at the last reported sales price, except that securities listed on The Nasdaq Stock Market, Inc. (“Nasdaq”) are valued at the Nasdaq Official Closing Price (“NOCP”), and if no NOCP is available, then at the last reported sales price. If no sales price is shown on the Nasdaq, the bid price will be used. In the absence of any sale of securities listed on the Nasdaq, and in the case of other securities, including U.S. Government obligations, but excluding debt securities maturing in 60 days or less, the price will be deemed “stale” and the valuations will be determined in accordance with the Funds’ Fair Value Procedures.
Securities denominated in foreign currencies are translated into U.S. dollars using the closing rates of exchange in effect on the day of valuation.
Many securities markets and exchanges outside the U.S. close prior to the close of the New York Stock Exchange and therefore may not fully reflect trading or events that occur after the close of the principal exchange in which the foreign investments are traded but before the close of the New York Stock Exchange. If such trading or events are expected to materially affect the value of the investments, then those investments are fair valued following procedures approved by the Board of Trustees. These procedures take into account multiple factors including movements in U.S. securities markets after foreign exchanges close. Depending on market activity, such fair valuations may be frequent. Such fair value pricing may result in NAVs that are higher or lower than NAVs based on the closing price or latest quoted bid price.
Debt securities of sufficient credit quality with original maturities of 60 days or less generally are valued at amortized cost which approximates fair value. The amortized cost method involves valuing a security at its cost, plus accretion of discount or minus amortization of premium over the period until maturity.
Investments in open-end mutual funds and non-registered investment companies are generally valued at net asset value.
Certain investments which are not valued using any of the methods discussed above, are valued at their fair value, as determined by procedures established in good faith and approved by the Board of Trustees.
The valuation techniques used by the Funds to measure fair value are consistent with the market approach, income approach and/or cost approach, where applicable, for each security type.
Foreign currency translation
The accounting records of the Funds are maintained in U.S. dollars. Assets, including investment securities, and liabilities denominated in foreign currency are translated into U.S. dollars at the prevailing rates of exchange at the date of valuation. Purchases and sales of securities, and income and expenses are translated at the prevailing rate of exchange on the respective dates of such transactions. Reported net realized foreign exchange gains or losses arise from sales of
| | | | | | |
| Notes to Financial Statements (Unaudited) | | Wells Fargo Advantage Small and Mid Cap Stock Funds | | | 85 | |
foreign currencies, currency gains or losses realized between the trade and settlement dates on securities transactions, and the difference between the amounts of dividends, interest and foreign withholding taxes recorded and the U.S. dollar equivalent of the amounts actually paid or received. Net unrealized foreign exchange gains and losses arise from changes in the fair value of assets and liabilities other than investments in securities resulting in changes in exchange rates.
The changes in net assets arising from changes in exchange rates and the changes in net assets resulting from changes in market prices of securities are not separately presented. Such changes are recorded with net realized and unrealized gains or losses from investments. Gains and losses from certain foreign currency transactions are treated as ordinary income for U.S. federal income tax purposes.
Security loans
The Funds may lend their securities from time to time in order to earn additional income in the form of fees or interest on securities received as collateral or the investment of any cash received as collateral. A Fund continues to receive interest or dividends on the securities loaned. A Fund receives collateral in the form of cash or securities with a value at least equal to the value of the securities on loan. The value of the loaned securities is determined at the close of each business day and any additional required collateral is delivered to the Fund on the next business day. In the event of default or bankruptcy by the borrower, a Fund could experience delays and costs in recovering the loaned securities or in gaining access to the collateral. In addition, the investment of any cash collateral received may lose all or part of its value. The Fund has the right under the lending agreement to recover the securities from the borrower on demand.
The Funds lend their securities through an unaffiliated securities lending agent. Cash collateral received in connection with their securities lending transactions is invested in Wells Fargo Securities Lending Cash Investments, LLC (the “Cash Collateral Fund”). The Cash Collateral Fund is exempt from registration under Section 3(c)(7) of the 1940 Act and is managed by Wells Fargo Funds Management LLC (“Funds Management”) and is sub-advised by Wells Capital Management Incorporated (“Wells Capital Management”). Funds Management receives an advisory fee starting at 0.05% and declining to 0.01% as the average daily net assets of the Cash Collateral Fund increase. All of the fees received by Funds Management are paid to Wells Capital Management for its services as sub-adviser. The Cash Collateral Fund seeks to provide a positive return compared to the daily Fed Funds Open rate by investing in high-quality, U.S. dollar-denominated short-term money market instruments. Cash Collateral Fund investments are fair valued based upon the amortized cost valuation technique. Income earned from investment in the Cash Collateral Fund is included in securities lending income on the Statements of Operations.
In a securities lending transaction, the net asset value of a Fund will be affected by an increase or decrease in the value of the securities loaned and by an increase or decrease in the value of instruments in which cash collateral is invested. The amount of securities lending activity undertaken by a Fund fluctuates from time to time. After the occurrence of a default or impairment of structured investment vehicles purchased in a joint account by the former securities lending agent of each Fund (except, Special Small Cap Value Fund and Traditional Small Cap Growth Fund), as the various participating Funds’ lending activity fluctuated, their ratable interest in the joint account, including their ratable exposure to the defaulted or impaired structured investment vehicles fluctuated depending on the relative activity of each participating Fund. In order to eliminate the fluctuation of the various Funds’ ratable exposure to the defaulted or impaired structured investment vehicles, the adviser to the Funds recommended to the Board of Trustees, and the Board of Trustees approved, actions designed to fix the allocation of percentage ownership in defaulted or impaired structured investment vehicles among all funds participating in securities lending (“side pocketing”) based on each Fund’s percentage ownership of the total cash collateral investment joint account as of the date the fixed allocation is implemented. Accordingly, on February 13, 2009 a side pocketing occurred, which fixed each Fund’s ownership of defaulted or impaired structured investment vehicle in the joint account based on each such Fund’s percentage ownership of the joint account as of such date.
Futures contracts
Certain Funds may be subject to equity price risk in the normal course of pursuing its investment objectives. The Funds may buy and sell futures contracts in order to gain exposure to, or protect against changes in, security values and interest rates. The primary risks associated with the use of futures contracts are the imperfect correlation between changes in market values of securities held by the Fund and the prices of futures contracts, and the possibility of an illiquid market.
| | | | |
| 86 | | Wells Fargo Advantage Small and Mid Cap Stock Funds | | Notes to Financial Statements (Unaudited) |
Futures contracts are valued based upon their quoted daily settlement prices when available. The aggregate principal amounts of the contracts are not recorded in the financial statements. Fluctuations in the value of the contracts are recorded in the Statements of Assets and Liabilities as an asset or liability and in the Statements of Operations as unrealized gains or losses until the contracts are closed, at which point they are recorded as net realized gains or losses on futures contracts. With futures contracts, there is minimal counterparty risk to the Fund since futures are exchange traded and the exchange’s clearinghouse, as counterparty to all exchange traded futures, guarantees the futures against default.
Options
Certain Funds may be subject to equity price risk in the normal course of pursuing its investment objectives. A Fund may write covered put or call options. When a Fund writes an option, an amount equal to the premium received is recorded as a liability and is subsequently adjusted to the current market value of the written option. Premiums received from written options, which expire unexercised, are recognized as realized gains from investments on the expiration date. The difference between the premium received and the amount paid on effecting a closing purchase transaction, including brokerage commissions, is treated as a realized gain or loss. If a call option is exercised, the premium is added to the proceeds from the sale of the underlying security in calculating the realized gain or loss on the sale. If a put option is exercised, the premium reduces the cost of the security purchased. The Fund, as a writer of an option, bears the market risk of an unfavorable change in the price of the security underlying the written option.
A Fund may also purchase call or put options. The premium is included in the Statements of Assets and Liabilities as an investment which is subsequently adjusted to the current market value of the option. Premiums paid for purchased options which expire are recognized as realized losses from investments on the expiration date. Premiums paid for purchased options which are exercised or closed are added to the amount paid or offset against the proceeds on the underlying security to determine the realized gain or loss. The risk of loss associated with purchased options is limited to the premium paid.
Options traded on an exchange are regulated and terms of the options are standardized. Options traded over the counter expose the Fund to counterparty risk in the event the counterparty does not perform. This risk is mitigated by having a master netting arrangement between the Fund and the counterparty and by having the counterparty post collateral to cover the Fund’s exposure to the counterparty.
Security transactions and income recognition
Securities transactions are recorded on a trade date basis. Realized gains or losses are reported on the basis of identified cost of securities delivered.
Interest income is accrued daily and bond discounts are accreted and premiums are amortized daily based on the effective interest method. To the extent debt obligations are placed on non-accrual status, any related interest income may be reduced by writing off interest receivables when the collection of all or a portion of interest has become doubtful based on consistently applied procedures. If the issuer subsequently resumes interest payments or when the collectability of interest is reasonably assured, the debt obligation is removed from non-accrual status.
Dividend income is recognized on the ex-dividend date, except for certain dividends from foreign securities, which are recorded as soon as the Fund is informed of the ex-dividend date. Dividend income from foreign securities is recorded net of foreign taxes withheld where recovery of such taxes is not assured.
Distributions to shareholders
Distributions to shareholders from net investment income and net realized gains, if any, are recorded on the ex-dividend date. Such distributions are determined in conformity with income tax regulations, which may differ from generally accepted accounting principles.
Federal and other taxes
Each Fund is treated as a separate entity for federal income tax purposes. Each Fund intends to continue to qualify as a regulated investment company by distributing substantially all of its investment company taxable income and any net realized capital gains (after reduction for capital loss carryforwards) sufficient to relieve it from all, or substantially all, federal income taxes. Accordingly, no provision for federal income taxes was required.
| | | | | | |
| Notes to Financial Statements (Unaudited) | | Wells Fargo Advantage Small and Mid Cap Stock Funds | | | 87 | |
Each Fund’s income and federal excise tax returns and all financial records supporting those returns for the prior three fiscal years are subject to examination by the federal and Delaware revenue authorities.
At October 31, 2010, estimated net capital loss carryforwards, which were available to offset future net realized capital gains, were as follows:
| | | | | | | | | | | | |
| | | Expiration | |
| | | 2016 | | | 2017 | | | 2018 | |
Intrinsic Small Cap Value Fund | | $ | 15,661,688 | | | $ | 79,906,522 | | | $ | 7,594,268 | |
Small Cap Opportunities Fund | | | 0 | | | | 32,303,454 | | | | 0 | |
Small Cap Value Fund | | | 0 | | | | 49,919,400 | | | | 0 | |
Small/Mid Cap Value Fund | | | 165,370 | | | | 26,417,452 | | | | 0 | |
Special Small Cap Value Fund | | | 16,742,143 | | | | 119,931,973 | | | | 362,132 | |
Traditional Small Cap Growth Fund | | | 72,546,184 | | | | 0 | | | | 0 | |
Under the recently enacted Regulated Investment Company Modernization Act of 2010, the Funds will be permitted to carry forward capital losses incurred in taxable years beginning after December 22, 2010 for an unlimited period. However, any losses incurred during those future taxable years will be required to be utilized prior to the losses incurred in pre-enactment taxable years. As a result of this ordering rule, pre-enactment capital loss carryforwards may be more likely to expire unused. Additionally, post-enactment capital losses that are carried forward will retain their character as either short-term or long-term capital losses rather than being considered all short-term as under previous law.
Class allocations
The separate classes of shares offered by each Fund differ principally in applicable sales charges, distribution, shareholder servicing and administration fees. Shareholders of each class bear certain expenses that pertain to that particular class. All shareholders bear the common expenses of a Fund, earn income from the portfolio, and are allocated unrealized gains and losses pro rata based on the average daily net assets of each class, without distinction between share classes. Dividends are determined separately for each class based on income and expenses allocable to each class. Realized gains and losses are allocated to each class pro rata based upon the net assets of each class on the date realized. Differences in per share dividend rates generally result from the relative weightings of pro rata income and realized gain allocations and from differences in separate class expenses, including distribution, shareholder servicing, and administration fees.
3. FAIR VALUATION MEASUREMENTS
Fair value measurements of investments are determined within a framework that has established a fair value hierarchy based upon the various data inputs utilized in determining the value of each Fund’s investments. The three-level hierarchy gives the highest priority to unadjusted quoted prices in active markets for identical assets or liabilities (Level 1) and the lowest priority to unobservable inputs (Level 3). Each Fund’s investments are classified within the fair value hierarchy based on the lowest level of input that is significant to the fair value measurement. The inputs are summarized into three broad levels as follows:
| n | | Level 1 – quoted prices in active markets for identical securities |
| n | | Level 2 – other significant observable inputs (including quoted prices for similar securities, interest rates, prepayment speeds, credit risk, etc.) |
| n | | Level 3 – significant unobservable inputs (including the Fund’s own assumptions in determining the fair value of investments) |
The inputs or methodologies used for valuing securities are not necessarily an indication of the risk associated with investing in those securities.
| | | | |
| 88 | | Wells Fargo Advantage Small and Mid Cap Stock Funds | | Notes to Financial Statements (Unaudited) |
As of April 30, 2011, the inputs used in valuing each Fund’s assets, which are carried at fair value, were as follows:
| | | | | | | | | | | | | | | | |
| Investments in Securities | | Quoted Prices (Level 1) | | | Significant Other
Observable Inputs (Level 2) | | | Significant Unobservable Inputs (Level 3) | | | Total | |
Intrinsic Small Cap Value Fund | | | | | | | | | | | | | | | | |
| | | | |
Equity securities | | | | | | | | | | | | | | | | |
Common stocks | | $ | 135,041,677 | | | $ | 688,946 | | | $ | 0 | | | $ | 135,730,623 | |
| | | | |
Short-term investments | | | | | | | | | | | | | | | | |
Corporate bonds and notes | | | 0 | | | | 0 | | | | 1,016,721 | | | | 1,016,721 | |
Investment companies | | | 7,505,010 | | | | 28,398,654 | | | | 0 | | | | 35,903,664 | |
| | | $ | 142,546,687 | | | $ | 29,087,600 | | | $ | 1,016,721 | | | $ | 172,651,008 | |
Small Cap Growth Fund | | | | | | | | | | | | | | | | |
| | | | |
Equity securities | | | | | | | | | | | | | | | | |
Common stocks | | $ | 1,269,754,664 | | | $ | 0 | | | $ | 0 | | | $ | 1,269,754,664 | |
Investment companies | | | 67,796,616 | | | | 0 | | | | 0 | | | | 67,796,616 | |
| | | | |
Short-term investments | | | | | | | | | | | | | | | | |
Corporate bonds and notes | | | 0 | | | | 0 | | | | 4,969,046 | | | | 4,969,046 | |
Investment companies | | | 35,472,049 | | | | 248,728,380 | | | | 0 | | | | 284,200,429 | |
| | | $ | 1,373,023,329 | | | $ | 248,728,380 | | | $ | 4,969,046 | | | $ | 1,626,720,755 | |
Small Cap Opportunities Fund | | | | | | | | | | | | | | | | |
| | | | |
Equity securities | | | | | | | | | | | | | | | | |
Common stocks | | $ | 707,543,093 | | | $ | 0 | | | $ | 0 | | | $ | 707,543,093 | |
Investment companies | | | 24,105,867 | | | | 0 | | | | 0 | | | | 24,105,867 | |
| | | | |
Short-term investments | | | | | | | | | | | | | | | | |
Corporate bonds and notes | | | 0 | | | | 0 | | | | 3,049,551 | | | | 3,049,551 | |
Investment companies | | | 92,799,933 | | | | 160,472,968 | | | | 0 | | | | 253,272,901 | |
| | | $ | 824,448,893 | | | $ | 160,472,968 | | | $ | 3,049,551 | | | $ | 987,971,412 | |
Small Cap Value Fund | | | | | | | | | | | | | | | | |
| | | | |
Equity securities | | | | | | | | | | | | | | | | |
Common stocks | | $ | 4,190,553,045 | | | $ | 0 | | | $ | 20,455,659 | | | $ | 4,211,008,704 | |
Investment companies | | | 60,797,436 | | | | 0 | | | | 0 | | | | 60,797,436 | |
Warrants | | | 0 | | | | 220,830 | | | | 0 | | | | 220,830 | |
| | | | |
Short-term investments | | | | | | | | | | | | | | | | |
Investment companies | | | 317,489,043 | | | | 0 | | | | 0 | | | | 317,489,043 | |
| | | $ | 4,568,839,524 | | | $ | 220,830 | | | $ | 20,455,659 | | | $ | 4,589,516,013 | |
Small/Mid Cap Value Fund | | | | | | | | | | | | | | | | |
| | | | |
Equity securities | | | | | | | | | | | | | | | | |
Common stocks | | $ | 279,492,659 | | | $ | 0 | | | $ | 0 | | | $ | 279,492,659 | |
Investment companies | | | 3,325,118 | | | | 0 | | | | 0 | | | | 3,325,118 | |
Warrants | | | 0 | | | | 525,537 | | | | 690,815 | | | | 1,216,352 | |
| | | | |
Short-term investments | | | | | | | | | | | | | | | | |
Investment companies | | | 94,766 | | | | 0 | | | | 0 | | | | 94,766 | |
| | | $ | 282,912,543 | | | $ | 525,537 | | | $ | 690,815 | | | $ | 284,128,895 | |
| | | | | | |
| Notes to Financial Statements (Unaudited) | | Wells Fargo Advantage Small and Mid Cap Stock Funds | | | 89 | |
| | | | | | | | | | | | | | | | |
| Investments in Securities | | Quoted Prices (Level 1) | | | Significant Other
Observable Inputs (Level 2) | | | Significant Unobservable Inputs (Level 3) | | | Total | |
Special Small Cap Value Fund | | | | | | | | | | | | | | | | |
| | | | |
Equity securities | | | | | | | | | | | | | | | | |
Common stocks | | $ | 902,175,948 | | | $ | 1,348,096 | | | $ | 0 | | | $ | 903,524,044 | |
Warrants | | | 0 | | | | 58,320 | | | | 0 | | | | 58,320 | |
| | | | |
Convertible debenture | | | 0 | | | | 742,305 | | | | 0 | | | | 742,305 | |
| | | | |
Short-term investments | | | | | | | | | | | | | | | | |
Corporate bonds and notes | | | 0 | | | | 0 | | | | 4,105,758 | | | | 4,105,758 | |
Investment companies | | | 24,792,600 | | | | 158,135,459 | | | | 0 | | | | 182,928,059 | |
| | | $ | 926,968,548 | | | $ | 160,284,180 | | | $ | 4,105,758 | | | $ | 1,091,358,486 | |
Traditional Small Cap Growth Fund | | | | | | | | | | | | | | | | |
| | | | |
Equity securities | | | | | | | | | | | | | | | | |
Common stocks | | $ | 268,323,448 | | | $ | 0 | | | $ | 0 | | | $ | 268,323,448 | |
| | | | |
Short-term investments | | | | | | | | | | | | | | | | |
Investment companies | | | 7,148,532 | | | | 67,744,654 | | | | 0 | | | | 74,893,186 | |
| | | $ | 275,471,980 | | | $ | 67,744,654 | | | $ | 0 | | | $ | 343,216,634 | |
Further details on the major security types listed above can be found in the each Fund’s Portfolio of Investments.
As of April 30, 2011, the inputs used in valuing the Fund’s other financial instruments, which are carried at fair value, were as follows:
| | | | | | | | | | | | | | | | |
| Written options | | Quoted Prices (Level 1) | | | Significant Other
Observable Inputs (Level 2) | | | Significant Unobservable Inputs (Level 3) | | | Total | |
Small Cap Value Fund | | $ | 0 | | | $ | (2,564,136 | ) | | $ | 0 | | | $ | (2,564,136 | ) |
Transfers in and transfers out are recognized at the end of the reporting period. For the six months ended April 30, 2011, the Funds did not have any significant transfers into/out of Level 1 and Level 2.
The following is a reconciliation of investments in which significant unobservable inputs (Level 3) were used in determining value:
| | | | | | | | | | | | | | | | |
| | | Intrinsic
Small Cap
Value
Fund | | | Small Cap
Growth
Fund | | | Small Cap
Opportunities
Fund | | | Special
Small Cap
Value
Fund | |
Corporate bonds and notes | | | | | | | | | | | | | | | | |
Balance as of October 31, 2010 | | $ | 1,099,067 | | | $ | 5,371,500 | | | $ | 3,296,542 | | | $ | 4,207,936 | |
Accrued discounts (premiums) | | | 0 | | | | 0 | | | | 0 | | | | 0 | |
Realized gains (losses) | | | 0 | | | | 0 | | | | 0 | | | | 93,473 | |
Change in unrealized gains (losses) | | | 153,860 | | | | 751,963 | | | | 461,487 | | | | 562,765 | |
Purchases | | | 0 | | | | 0 | | | | 0 | | | | 0 | |
Sales | | | (236,206 | ) | | | (1,154,417 | ) | | | (708,478 | ) | | | (758,417 | ) |
Transfers into Level 3 | | | 0 | | | | 0 | | | | 0 | | | | 0 | |
Transfers out of Level 3 | | | 0 | | | | 0 | | | | 0 | | | | 0 | |
Transfers in from acquisition | | | 0 | | | | 0 | | | | 0 | | | | 0 | |
Balance as of April 30, 2011 | | $ | 1,016,721 | | | $ | 4,969,046 | | | $ | 3,049,551 | | | $ | 4,105,758 | |
Change in unrealized gains (losses)
relating to securities still held at April 30, 2011 | | $ | 40,878 | | | $ | 199,782 | | | $ | 122,608 | | | $ | 207,862 | |
| | | | |
| 90 | | Wells Fargo Advantage Small and Mid Cap Stock Funds | | Notes to Financial Statements (Unaudited) |
| | | | | | | | |
| | | Small Cap Value Fund | | | Small/Mid
Cap Value
Fund | |
| | | Common stocks | | | | Warrants | |
Balance as of October 31, 2010 | | $ | 15,403,700 | | | $ | 0 | |
Accrued discounts (premiums) | | | 0 | | | | 0 | |
Realized gains (losses) | | | 603,758 | | | | 0 | |
Change in unrealized gains (losses) | | | 3,152,708 | | | | 690,815 | |
Purchases | | | 3,141,132 | | | | 0 | |
Sales | | | (1,845,639 | ) | | | 0 | |
Transfers into Level 3 | | | 0 | | | | 0 | |
Transfers out of Level 3 | | | 0 | | | | 0 | |
Transfers in from acquisition | | | 0 | | | | 0 | |
Balance as of April 30, 2011 | | $ | 20,455,659 | | | $ | 690,815 | |
Change in unrealized gains (losses)
relating to securities still held at April 30, 2011 | | $ | 3,000,636 | | | $ | 690,815 | |
4. TRANSACTIONS WITH AFFILIATES AND OTHER EXPENSES
Advisory fees
The Trust has entered into an advisory contract with Funds Management, an indirect wholly owned subsidiary of Wells Fargo & Company (“Wells Fargo”). The adviser is responsible for implementing investment policies and guidelines and for supervising the sub-advisers, who are responsible for day-to-day portfolio management of the Funds.
Pursuant to the contract, Funds Management is paid an annual advisory fee which is calculated based on the average daily net assets of each Fund as follows:
| | | | | | | | | | | | |
| | | Advisory Fee | | | Effective rate for
six months ended
April 30, 2011 | |
| | | starting at | | | declining to | | |
Intrinsic Small Cap Value Fund | | | 0.80 | % | | | 0.70 | % | | | 0.80 | % |
Small Cap Growth Fund | | | 0.80 | | | | 0.70 | | | | 0.78 | |
Small Cap Opportunities Fund | | | 0.80 | | | | 0.70 | | | | 0.79 | |
Small Cap Value Fund | | | 0.80 | | | | 0.70 | | | | 0.74 | |
Small/Mid Cap Value Fund | | | 0.75 | | | | 0.60 | | | | 0.75 | |
Special Small Cap Value Fund | | | 0.80 | | | | 0.70 | | | | 0.79 | |
Traditional Small Cap Growth Fund | | | 0.80 | | | | 0.70 | | | | 0.80 | |
Funds Management may retain the services of certain sub-advisers to provide daily portfolio management to the Funds. Funds Management has engaged Wells Capital Management (an affiliate of Funds Management), Metropolitan West Capital Management, LLC (“MWCM”) (a majority-owned subsidiary of Wells Fargo) and Schroder Investment Management North America Inc. (“Schroder”) as investment sub-advisers.
| | | | | | |
| Notes to Financial Statements (Unaudited) | | Wells Fargo Advantage Small and Mid Cap Stock Funds | | | 91 | |
The fees related to sub-advisory services are borne directly by the adviser and do not increase the overall fees paid by a Fund to the adviser. The sub-advisers are each paid an annual sub-advisory fee which is calculated based on the average daily net assets of each Fund as follows:
| | | | | | | | | | |
| | | Sub-adviser | | Sub-advisory Fee | |
| | | | starting at | | | declining to | |
Intrinsic Small Cap Value Fund | | MWCM | | | 0.55 | % | | | 0.40 | % |
Small Cap Growth Fund | | Wells Capital Management | | | 0.55 | | | | 0.40 | |
Small Cap Opportunities Fund | | Schroder | | | 0.50 | | | | 0.45 | |
Small Cap Value Fund | | Wells Capital Management | | | 0.55 | | | | 0.40 | |
Small/Mid Cap Value Fund | | Wells Capital Management | | | 0.45 | | | | 0.35 | |
Special Small Cap Value Fund | | Wells Capital Management | | | 0.55 | | | | 0.40 | |
Traditional Small Cap Growth Fund | | Wells Capital Management | | | 0.55 | | | | 0.40 | |
Administration and transfer agent fees
The Trust has entered into an administration agreement with Funds Management. Under this agreement, for providing administrative services, which includes paying fees and expenses for services provided by the transfer agent, sub-transfer agents, omnibus account servicers and record-keepers, Funds Management is entitled to receive from each Fund an annual fund level administration fee starting at 0.05% and declining to 0.03% as the average daily net assets of each Fund increase and a class level administration fee which is calculated based on the average daily net assets of each Fund as follows:
| | | | |
| | | Class Level Administration Fee | |
Class A, Class B, Class C | | | 0.26 | % |
Administrator Class | | | 0.10 | |
Institutional Class | | | 0.08 | |
Investor Class | | | 0.33 | |
Funds Management has contractually waived and/or reimbursed advisory and administration fees to the extent necessary to maintain certain net operating expense ratios for the Funds. Waiver of fees and/or reimbursement of expenses by Funds Management were made first from fund level expenses on a proportionate basis and then from class specific expenses.
Distribution fees
The Trust has adopted a Distribution Plan for Class B and Class C shares of the applicable Funds pursuant to Rule 12b-1 under the 1940 Act. Distribution fees are charged to the Class B and Class C shares and paid to Wells Fargo Funds Distributor, LLC, the principal underwriter of each Fund, at an annual rate of 0.75% of the average daily net assets of Class B and Class C shares.
For the six months ended April 30, 2011, Wells Fargo Funds Distributor, LLC received the following amounts in front-end sales charges and contingent deferred sales charges.
| | | | | | | | | | | | | | | | |
| | | Front-end
sales charges Class A | | | Contingent deferred sales charges | |
| | | | Class A | | | Class B | | | Class C | |
Intrinsic Small Cap Value Fund | | $ | 31 | | | $ | 0 | | | | NA | | | $ | 168 | |
Small Cap Growth Fund | | | 975 | | | | 0 | | | $ | 886 | | | | 0 | |
Small Cap Value Fund | | | 37,838 | | | | 1,479 | | | | 143 | | | | 3,193 | |
Small/Mid Cap Value Fund | | | 1,705 | | | | 0 | | | | NA | | | | 281 | |
Special Small Cap Value Fund | | | 3,524 | | | | 390 | | | | 5,216 | | | | 495 | |
Traditional Small Cap Growth Fund | | | 2,629 | | | | 132 | | | | NA | | | | 0 | |
| | | | |
| 92 | | Wells Fargo Advantage Small and Mid Cap Stock Funds | | Notes to Financial Statements (Unaudited) |
Shareholder servicing fees
The Trust has entered into contracts with one or more shareholder servicing agents, whereby Class A, Class B, Class C, Administrator Class and Investor Class of each applicable Fund is charged a fee at an annual rate of 0.25% of the average daily net assets of each respective class.
A portion of these total shareholder servicing fees were paid to affiliates of Wells Fargo.
5. INVESTMENT PORTFOLIO TRANSACTIONS
Purchases and sales of investments, excluding short-term securities (securities with maturities of one year or less at purchase date), for the six months ended April 30, 2011 were as follows:
| | | | | | | | |
| | | Purchases at Cost | | | Sales Proceeds | |
Intrinsic Small Cap Value Fund | | $ | 34,397,217 | | | $ | 81,112,220 | |
Small Cap Growth Fund | | | 899,531,460 | | | | 923,393,553 | |
Small Cap Opportunities Fund | | | 317,331,285 | | | | 309,162,905 | |
Small Cap Value Fund | | | 673,024,096 | | | | 265,178,871 | |
Small/Mid Cap Value Fund | | | 57,265,808 | | | | 50,404,874 | |
Special Small Cap Value Fund | | | 164,046,975 | | | | 246,067,227 | |
Traditional Small Cap Growth Fund | | | 131,373,090 | | | | 163,216,966 | |
6. INVESTMENTS IN AFFILIATES
An affiliate company is a company in which a Fund has ownership of at least 5% of the outstanding voting shares. A summary of the transactions with affiliates for the six months ended April 30, 2011 was as follows:
| | | | | | | | | | | | | | | | | | | | |
| | | Value, Beginning
of Period | | | Cost of
Purchases | | | Proceeds
from Sales | | | Income
from
Affiliated
Securities | | | Value, End of Period | |
Small Cap Value Fund | | | | | | | | | | | | | | | | | | | | |
ACCO Brand Corporation | | $ | 18,924,248 | | | $ | 1,532,032 | | | $ | 2,701,030 | | | $ | 0 | | | $ | 28,198,811 | |
Argo Group International Holdings Limited | | | 63,323,126 | | | | 6,130,030 | | | | 7,544,510 | | | | 425,628 | | | | 56,585,115 | |
Armour Residential Incorporated | | | 4,879,375 | | | | 145,191 | | | | 2,796,284 | | | | 330,511 | | | | 2,434,722 | |
Capstead Mortgage Corporation | | | 52,108,260 | | | | 2,521,384 | | | | 6,629,985 | | | | 3,428,782 | | | | 56,168,052 | |
Cavco Industries Incorporated | | | 11,014,715 | | | | 1,944,184 | | | | 1,655,908 | | | | 0 | | | | 16,732,800 | |
China GrenTech Corporation Limited ADR | | | 4,899,655 | | | | 2,235,995 | | | | 687,956 | | | | 0 | | | | 6,423,600 | |
Cincinnati Bell Incorporated | | | 23,207,380 | | | | 4,491,122 | | | | 2,827,096 | | | | 0 | | | | 30,457,934 | |
Covenant Transport Incorporated Class A | | | 9,044,592 | | | | 1,976,390 | | | | 1,336,636 | | | | 0 | | | | 12,592,800 | |
Cray Incorporated | | | 23,235,290 | | | | 4,138,155 | | | | 2,901,012 | | | | 0 | | | | 27,254,304 | |
Crexus Investment Corporation | | | 6,012,545 | | | | 43,674,263 | | | | 727,958 | | | | 219,705 | | | | 49,064,114 | |
Cross Country Healthcare Incorporated | | | 18,158,750 | | | | 816,396 | | | | 2,287,733 | | | | 0 | | | | 17,289,342 | |
dELiA*s Incorporated | | | 3,141,499 | | | | 244,393 | | | | 348,571 | | | | 0 | | | | 3,297,156 | |
Global Industries Limited | | | 44,527,416 | | | | 115,740 | | | | 5,438,688 | | | | 0 | | | | 68,237,116 | |
Hill International Incorporated | | | 13,768,143 | | | | 680,980 | | | | 1,744,707 | | | | 0 | | | | 12,238,164 | |
Intermec Incorporated | | | 40,180,850 | | | | 4,858,065 | | | | 4,574,704 | | | | 0 | | | | 40,454,372 | |
InterOil Corporation | | | 297,909,654 | | | | 39,928,741 | | | | 34,016,631 | | | | 0 | | | | 272,182,560 | |
Intertape Polymer Group Incorporated | | | 8,509,139 | | | | 116,689 | | | | 981,267 | | | | 0 | | | | 11,714,389 | |
MRV Communications Incorporated | | | 19,046,352 | | | | 572,820 | | | | 2,688,304 | | | | 0 | | | | 20,481,039 | |
Newpark Resources Incorporated | | | 45,957,492 | | | | 2,282,201 | | | | 4,970,551 | | | | 0 | | | | 66,560,130 | |
Orasure Technologies Incorporated | | | 23,084,633 | | | | 2,970,135 | | | | 3,399,262 | | | | 0 | | | | 48,780,970 | |
OSI Systems Incorporated | | | 44,344,800 | | | | 556,320 | | | | 7,487,436 | | | | 0 | | | | 40,033,092 | |
PHI Incorporated (non voting) | | | 14,849,413 | | | | 1,440,765 | | | | 1,685,728 | | | | 0 | | | | 18,660,444 | |
Skyline Corporation | | | 11,364,842 | | | | 1,323,360 | | | | 1,696,191 | | | | 225,216 | | | | 12,524,907 | |
Webco Industries Incorporated | | | 6,461,000 | | | | 0 | | | | 933,156 | | | | 0 | | | | 9,818,270 | |
Western Liberty Bancorp | | | 6,399,617 | | | | 0 | | | | 570,582 | | | | 0 | | | | 3,042,046 | |
| | | | | | |
| Notes to Financial Statements (Unaudited) | | Wells Fargo Advantage Small and Mid Cap Stock Funds | | | 93 | |
| | | | | | | | | | | | | | | | | | | | |
| | | Value, Beginning
of Period | | | Cost of
Purchases | | | Proceeds
from Sales | | | Income
from
Affiliated
Securities | | | Value, End of Period | |
Small/Mid Cap Value Fund | | | | | | | | | | | | | | | | | | | | |
Bakers Footwear Group Incorporated | | $ | 491,832 | | | $ | 2,220 | | | $ | 372 | | | $ | 0 | | | $ | 573,085 | |
EnteroMedics Incorporated | | | 0 | | | | 1,173,150 | | | | 37,676 | | | | 0 | | | | 1,442,375 | |
Special Small Cap Value Fund | | | | | | | | | | | | | | | | | | | | |
American Pacific Corporation | | $ | 2,424,453 | | | $ | 0 | | | $ | 0 | | | $ | 0 | | | $ | 2,484,863 | |
Blyth Incorporated | | | 14,023,023 | | | | 3,108,945 | | | | 4,716 | | | | 34,953 | | | | 20,669,004 | |
Dixie Group Incorporated | | | 2,518,774 | | | | 18,763 | | | | 0 | | | | 0 | | | | 3,003,021 | |
Imation Corporation | | | 21,938,581 | | | | 246,774 | | | | 1,227,885 | | | | 0 | | | | 22,217,307 | |
Kadant Incorporated | | | 16,925,864 | | | | 364,448 | | | | 3,368,723 | | | | 0 | | | | 23,264,880 | |
Kenneth Cole Productions Incorporated Class A | | | 8,607,570 | | | | 291,443 | | | | 0 | | | | 0 | | | | 8,908,627 | |
Neenah Paper Incorporated | | | 11,995,012 | | | | 197,758 | | | | 638,723 | | | | 78,143 | | | | 17,827,246 | |
Stewart Information Services Corporation | | | 10,430,675 | | | | 0 | | | | 0 | | | | 48,201 | | | | 9,775,143 | |
7. DERIVATIVE TRANSACTIONS
During the six months ended April 30, 2011, the Small Cap Value Fund and Small/Mid Cap Value Fund entered into written options for hedging purposes, in order to reduce market exposure.
During the six months ended April 30, 2011, Small Cap Value Fund had written option activities as follows:
| | | | | | | | |
| | | Number of
Contracts | | | Premiums
Received | |
Options outstanding at October 31, 2010 | | | 6,100 | | | $ | 1,244,421 | |
Options written | | | 46,380 | | | | 11,155,273 | |
Options expired | | | (1,200 | ) | | | (173,797 | ) |
Options terminated in closing purchase transactions | | | (41,383 | ) | | | (9,824,454 | ) |
Options exercised | | | (433 | ) | | | (85,538 | ) |
Options outstanding at April 30, 2011 | | | 9,464 | | | $ | 2,315,905 | |
Open call options written at April 30, 2011 were as follow for Small Cap Value Fund:
| | | | | | | | | | | | | | | | | | | | | | |
Expiration
Date | | Issuer Name | | Number of
Contracts | | | Call/
Put | | | Strike
Price | | | Market
Value | | | Premiums
Received | |
May 2011 | | Agnico-Eagle Mines Limited | | | 50 | | | | Call | | | $ | 70.00 | | | $ | 8,600 | | | $ | 7,350 | |
May 2011 | | Alaska Air Group Incorporated | | | 150 | | | | Call | | | | 60.00 | | | | 93,000 | | | | 44,999 | |
May 2011 | | Amedisys Incorporated | | | 150 | | | | Call | | | | 32.00 | | | | 31,050 | | | | 33,623 | |
May 2011 | | Amedisys Incorporated | | | 100 | | | | Call | | | | 35.00 | | | | 5,300 | | | | 11,100 | |
May 2011 | | Applied Industrial Technologies Incorporated | | | 100 | | | | Call | | | | 35.00 | | | | 6,500 | | | | 10,700 | |
May 2011 | | Calgon Carbon Corporation | | | 100 | | | | Call | | | | 15.00 | | | | 21,000 | | | | 10,700 | |
May 2011 | | Chicago Bridge & Iron Company | | | 50 | | | | Call | | | | 40.00 | | | | 7,250 | | | | 8,100 | |
May 2011 | | Chicago Bridge & Iron Company | | | 100 | | | | Call | | | | 41.00 | | | | 9,300 | | | | 19,919 | |
May 2011 | | Chicago Bridge & Iron Company | | | 100 | | | | Call | | | | 42.00 | | | | 6,000 | | | | 15,900 | |
May 2011 | | Coherent Incorporated | | | 250 | | | | Call | | | | 55.00 | | | | 205,000 | | | | 58,160 | |
May 2011 | | Coherent Incorporated | | | 100 | | | | Call | | | | 60.00 | | | | 50,000 | | | | 17,827 | |
May 2011 | | Community Health Systems Incorporated | | | 100 | | | | Call | | | | 35.00 | | | | 1,000 | | | | 14,816 | |
May 2011 | | Foot Locker Incorporated | | | 200 | | | | Call | | | | 20.00 | | | | 35,000 | | | | 16,800 | |
May 2011 | | Gen-Probe Incorporated | | | 190 | | | | Call | | | | 65.00 | | | | 304,000 | | | | 90,878 | |
May 2011 | | Global Industries Limited | | | 400 | | | | Call | | | | 10.00 | | | | 14,000 | | | | 19,628 | |
May 2011 | | Helmerich & Payne Incorporated | | | 100 | | | | Call | | | | 65.00 | | | | 25,000 | | | | 47,699 | |
May 2011 | | Helmerich & Payne Incorporated | | | 150 | | | | Call | | | | 67.50 | | | | 21,000 | | | | 46,049 | |
May 2011 | | Itron Incorporated | | | 100 | | | | Call | | | | 50.00 | | | | 43,000 | | | | 41,699 | |
May 2011 | | Itron Incorporated | | | 100 | | | | Call | | | | 55.00 | | | | 8,700 | | | | 15,700 | |
| | | | |
| 94 | | Wells Fargo Advantage Small and Mid Cap Stock Funds | | Notes to Financial Statements (Unaudited) |
| | | | | | | | | | | | | | | | | | | | | | |
Expiration
Date | | Issuer Name | | Number of
Contracts | | | Call/
Put | | | Strike
Price | | | Market
Value | | | Premiums
Received | |
May 2011 | | Newfield Exploration Company | | | 100 | | | | Call | | | $ | 70.00 | | | $ | 24,500 | | | $ | 37,311 | |
May 2011 | | Oceaneering International Incorporated | | | 250 | | | | Call | | | | 85.00 | | | | 105,000 | | | | 107,997 | |
May 2011 | | Oceaneering International Incorporated | | | 250 | | | | Call | | | | 90.00 | | | | 38,750 | | | | 51,749 | |
May 2011 | | Pride International Incorporated | | | 100 | | | | Call | | | | 45.00 | | | | 4,500 | | | | 8,400 | |
May 2011 | | Randgold Resources Limited ADR | | | 200 | | | | Call | | | | 90.00 | | | | 27,000 | | | | 47,599 | |
May 2011 | | United States Steel Corporation | | | 100 | | | | Call | | | | 55.00 | | | | 1,800 | | | | 30,499 | |
May 2011 | | United States Steel Corporation | | | 200 | | | | Call | | | | 60.00 | | | | 1,400 | | | | 39,199 | |
June 2011 | | Agnico-Eagle Mines Limited | | | 50 | | | | Call | | | | 70.00 | | | | 15,000 | | | | 11,700 | |
June 2011 | | Alaska Air Group Incorporated | | | 50 | | | | Call | | | | 65.00 | | | | 18,500 | | | | 8,450 | |
June 2011 | | Carpenter Technology Corporation | | | 77 | | | | Call | | | | 40.00 | | | | 86,086 | | | | 24,794 | |
June 2011 | | Carpenter Technology Corporation | | | 150 | | | | Call | | | | 45.00 | | | | 96,150 | | | | 30,424 | |
June 2011 | | Community Health Systems Incorporated | | | 100 | | | | Call | | | | 30.00 | | | | 23,000 | | | | 29,699 | |
June 2011 | | Community Health Systems Incorporated | | | 400 | | | | Call | | | | 31.00 | | | | 75,200 | | | | 98,798 | |
June 2011 | | Community Health Systems Incorporated | | | 200 | | | | Call | | | | 32.00 | | | | 28,000 | | | | 44,399 | |
June 2011 | | Community Health Systems Incorporated | | | 100 | | | | Call | | | | 35.00 | | | | 4,000 | | | | 19,822 | |
June 2011 | | Community Health Systems Incorporated | | | 50 | | | | Call | | | | 40.00 | | | | 500 | | | | 12,950 | |
June 2011 | | Hologic Incorporated | | | 200 | | | | Call | | | | 23.00 | | | | 13,000 | | | | 19,088 | |
June 2011 | | InterOil Corporation | | | 200 | | | | Call | | | | 60.00 | | | | 110,000 | | | | 94,398 | |
June 2011 | | InterOil Corporation | | | 250 | | | | Call | | | | 65.00 | | | | 69,750 | | | | 81,748 | |
June 2011 | | Key Energy Services Incorporated | | | 300 | | | | Call | | | | 17.50 | | | | 39,000 | | | | 19,500 | |
June 2011 | | Omnicare Incorporated | | | 100 | | | | Call | | | | 31.00 | | | | 15,000 | | | | 10,700 | |
June 2011 | | Randgold Resources Limited ADR | | | 850 | | | | Call | | | | 90.00 | | | | 216,750 | | | | 234,717 | |
June 2011 | | Randgold Resources Limited ADR | | | 100 | | | | Call | | | | 95.00 | | | | 13,000 | | | | 17,700 | |
June 2011 | | Steris Corporation | | | 297 | | | | Call | | | | 30.00 | | | | 118,800 | | | | 120,875 | |
July 2011 | | Calgon Carbon Corporation | | | 150 | | | | Call | | | | 17.50 | | | | 14,250 | | | | 10,350 | |
July 2011 | | Chicago Bridge & Iron Company | | | 100 | | | | Call | | | | 40.00 | | | | 29,500 | | | | 25,227 | |
July 2011 | | Chicago Bridge & Iron Company | | | 150 | | | | Call | | | | 42.00 | | | | 28,500 | | | | 29,699 | |
July 2011 | | Chicago Bridge & Iron Company | | | 200 | | | | Call | | | | 45.00 | | | | 15,000 | | | | 23,000 | |
July 2011 | | Orasure Technologies Incorporated | | | 200 | | | | Call | | | | 7.50 | | | | 29,000 | | | | 18,300 | |
July 2011 | | Royal Gold Incorporated | | | 100 | | | | Call | | | | 55.00 | | | | 69,000 | | | | 22,200 | |
September 2011 | | Randgold Resources Limited ADR | | | 200 | | | | Call | | | | 90.00 | | | | 98,000 | | | | 130,397 | |
September 2011 | | Randgold Resources Limited ADR | | | 250 | | | | Call | | | | 95.00 | | | | 80,000 | | | | 105,312 | |
September 2011 | | Randgold Resources Limited ADR | | | 700 | | | | Call | | | | 100.00 | | | | 143,500 | | | | 182,758 | |
September 2011 | | Randgold Resources Limited ADR | | | 150 | | | | Call | | | | 105.00 | | | | 18,000 | | | | 34,499 | |
Small Cap Value Fund had average premiums received on written options in the amount of $1,164,411 during the six months ended April 30, 2011.
During the six months ended April 30, 2011, Small/Mid Cap Value Fund had written option activities as follows:
| | | | | | | | |
| | | Number of
Contracts | | | Premiums
Received (Paid) | |
Options outstanding at October 31, 2010 | | | 0 | | | $ | 0 | |
Options written | | | 250 | | | | 79,848 | |
Options expired | | | 0 | | | | 0 | |
Options terminated in closing purchase transactions | | | (250 | ) | | | (79,848 | ) |
Options exercised | | | 0 | | | | 0 | |
Options outstanding at April 30, 2011 | | | 0 | | | $ | 0 | |
As of April 30, 2011, Small/Mid Cap Value Fund did not have any open written options but had average premiums received on written options in the amount of $11,136 during the six months ended April 30, 2011.
| | | | | | |
| Notes to Financial Statements (Unaudited) | | Wells Fargo Advantage Small and Mid Cap Stock Funds | | | 95 | |
The fair value, realized gains or losses and change in unrealized gains or losses on derivative instruments are reflected in the appropriate financial statements.
8. ACQUISITIONS
Effective at the close of business on July 16, 2010, Special Small Cap Value Fund acquired the net assets of Evergreen Small Cap Value Fund and Evergreen Special Values Fund. The purpose of the transactions was to combine three funds with similar investment objectives and strategies. The acquisitions were accomplished by a tax-free exchange of all of the shares of Evergreen Small Cap Value Fund and Evergreen Special Values Fund. Shareholders holding Class A, Class B, Class C and Class I shares of Evergreen Small Cap Value Fund and Evergreen Special Values Fund received Class A, Class B, Class C and Administrator Class shares, respectively, of Special Small Cap Value Fund in the reorganizations. Class R shares of Evergreen Special Values Fund received Class A shares of Special Small Cap Value Fund. Special Small Cap Value Fund was newly created to receive the assets of Evergreen Small Cap Value Fund and Evergreen Special Values Fund. Evergreen Special Values Fund became the accounting and performance survivor in the reorganizations. The investment portfolio of Evergreen Small Cap Value Fund and Evergreen Special Values Fund with fair values of $35,452,361 and $798,049,201, respectively, and identified costs of $30,733,820 and $971,212,867, respectively, at July 16, 2010, were the principal assets acquired by Special Small Cap Value Fund. For financial reporting purposes, assets received and shares issued by Special Small Cap Value Fund were recorded at fair value; however, the cost basis of the investments received from Evergreen Small Cap Value Fund and Evergreen Special Values Fund were carried forward to align ongoing reporting of Special Small Cap Value Fund’s realized and unrealized gains and losses with amounts distributable to shareholders for tax purposes. The value of net assets acquired, unrealized appreciation acquired, exchange ratio and number of shares issued were as follows:
| | | | | | | | | | | | | | | | | | |
| Acquired Fund | | Value of Net
Assets Acquired | | | Unrealized
Gains/Losses | | | Exchange
Ratio | | | Number of Shares Issued |
Evergreen Small Cap Value Fund | | $ | 35,385,583 | | | $ | 4,718,541 | | | | 0.56 | | | | 520,841 | | | Class A |
| | | | | | | | | | | 0.56 | | | | 167,510 | | | Class B |
| | | | | | | | | | | 0.56 | | | | 183,875 | | | Class C |
| | | | | | | | | | | | 0.59 | | | | 1,139,052 | | | Administrator Class |
Evergreen Special Values Fund | | | 799,508,182 | | | $ | (173,163,666 | ) | | | 1.00 | | | | 25,184,391 | | | Class A* |
| | | | | | | | | | | 1.00 | | | | 1,927,434 | | | Class B |
| | | | | | | | | | | 1.00 | | | | 2,145,954 | | | Class C |
| | | | | | | | | | | 1.00 | | | | 16,097,853 | | | Administrator Class |
| * | Amount includes 241,431 shares of Class A issued for Class R shares. |
The aggregate net assets of the Special Small Cap Value Fund immediately after the acquisitions were $834,893,765.
Assuming the acquisitions had been completed August 1, 2009, the beginning of the annual reporting period for Special Small Cap Value Fund, the pro forma results of operations for the year ended July 31, 2010 would have been:
| | | | |
Net investment income | | $ | 254,306 | |
Net realized and unrealized gains on investments | | $ | 187,069,382 | |
Net increase in net assets resulting from operations | | $ | 187,323,688 | |
Because the combined investment portfolios have been managed as a single integrated portfolio since the acquisition was completed, it is not practicable to separate the amounts of revenue and earnings of Evergreen Small Cap Value Fund that have been included in Special Small Cap Value Fund’s Statement of Operations since July 19, 2010.
9. BANK BORROWINGS
The Trust (excluding the money market funds) and Wells Fargo Variable Trust are parties to a $125,000,000 revolving credit agreement with State Street Bank and Trust Company, whereby the Funds are permitted to use bank borrowings for temporary or emergency purposes, such as to fund shareholder redemption requests. Interest under the credit agreement is charged to each Fund based on a borrowing rate equal to the higher of the Federal Funds rate in effect on that day plus 1.25% or the overnight LIBOR rate in effect on that day plus 1.25%. In addition, under the credit agreement, the Funds pay an annual commitment fee equal to 0.125% of the unused balance, which is allocated pro rata.
| | | | |
| 96 | | Wells Fargo Advantage Small and Mid Cap Stock Funds | | Notes to Financial Statements (Unaudited) |
For the six months ended April 30, 2011, there were no borrowings by the Funds under the agreement.
10. INDEMNIFICATION
Under the Trust’s organizational documents, the officers and directors are indemnified against certain liabilities that may arise out of performance of their duties to the Trust. Additionally, in the normal course of business, the Trust may enter into contracts with service providers that contain a variety of indemnification clauses. The Trust’s maximum exposure under these arrangements is dependent on future claims that may be made against the Funds and, therefore, cannot be estimated.
11. REORGANIZATION
At a regular meeting of the Board of Trustees held on May 18-19, 2011, the Trustees approved the reorganization of Small Cap Growth Fund into Wells Fargo Advantage Emerging Growth Fund. Under the reorganization, Wells Fargo Advantage Emerging Growth Fund will acquire the assets and assume the liabilities of Small Cap Growth Fund in exchange for shares of Wells Fargo Advantage Emerging Growth Fund.
A Special Meeting of Shareholders of Small Cap Growth Fund will be held in August 2011 to consider and vote on the reorganization. In July 2011, materials for this meeting will be mailed to shareholders of record on May 26, 2011.
| | | | | | |
| Other Information (Unaudited) | | Wells Fargo Advantage Small and Mid Cap Stock Funds | | | 97 | |
PORTFOLIO HOLDINGS INFORMATION
The complete portfolio holdings for the Funds are publicly available on the Funds’ Web site (www.wellsfargo.com/advantagefunds) on a monthly, 30-day or more delayed basis. In addition, top ten holdings information for the Fund is publicly available on the Funds’ Web site on a monthly, seven-day or more delayed basis. Each Fund files its complete schedule of portfolio holdings with the SEC for the first and third quarters of each fiscal year on Form N-Q, which is available without charge by visiting the SEC Web site at www.sec.gov. In addition, each Fund’s Form N-Q may be reviewed and copied at the SEC’s Public Reference Room in Washington, DC, and at regional offices in New York City, at 233 Broadway, and in Chicago, at 175 West Jackson Boulevard, Suite 900. Information about the Public Reference Room may be obtained by calling 1-800-SEC-0330.
PROXY VOTING INFORMATION
A description of the policies and procedures that the Funds use to determine how to vote proxies relating to portfolio securities is available without charge, upon request, by calling 1-800-222-8222, visiting our Web site at www.wellsfargo.com/advantagefunds, or visiting the SEC Web site at www.sec.gov. Information regarding how the Funds voted proxies relating to portfolio securities during the most recent 12-month period ended June 30 is available without charge on the Funds’ Web site at www.wellsfargo.com/advantagefunds or by visiting the SEC Web site at www.sec.gov.
| | | | |
| 98 | | Wells Fargo Advantage Small and Mid Cap Stock Funds | | Other Information (Unaudited) |
BOARD OF TRUSTEES
The following table provides basic information about the Board of Trustees (the “Trustees”) of the Wells Fargo Funds Trust (the “Trust”) and Officers of the Trust. This table should be read in conjunction with the Prospectus and the Statement of Additional Information1 of the Fund. Each of the Trustees and Officers listed below acts in identical capacities for the Wells Fargo Advantage family of funds, which consists of 152 funds comprising the Trust, Wells Fargo Variable Trust, Wells Fargo Master Trust and four closed-end funds (collectively the “Fund Complex”). All of the Trustees are also Members of the Audit and Governance Committees of each Trust in the Fund Complex. The mailing address of each Trustee and Officer is 525 Market Street, 12th Floor, San Francisco, CA 94105. Each Trustee and Officer serves an indefinite term, however, each Trustee serves such term until reaching the mandatory retirement age established by the Trustees.
Independent Trustees
| | | | | | |
Name and Year of Birth | | Position Held and Length of Service | | Principal Occupations During Past Five Years | | Other Directorships |
Peter G. Gordon
(Born 1942) | | Trustee, since 1998; Chairman, since 2005 | | Co-Founder, Chairman, President and CEO of Crystal Geyser. Water Company. Trustee Emeritus, Colby College | | Asset Allocation Trust |
Isaiah Harris, Jr.
(Born 1952) | | Trustee, since 2009 | | Retired. Prior thereto, President and CEO of BellSouth Advertising and Publishing Corp. from 2005 to 2007, President and CEO of BellSouth Enterprises from 2004 to 2005 and President of BellSouth Consumer Services from 2000 to 2003. Emeritus member of the Iowa State University Foundation Board of Governors. Emeritus Member of the Advisory Board of Iowa State University School of Business. Mr. Harris is a certified public accountant. | | CIGNA Corporation; Deluxe Corporation; Asset Allocation Trust |
Judith M. Johnson
(Born 1949) | | Trustee, since 2008 | | Retired. Prior thereto, Chief Executive Officer and Chief Investment Officer of Minneapolis Employees Retirement Fund from 1996 to 2008. Ms. Johnson is an attorney, certified public accountant and a certified managerial accountant. | | Asset Allocation Trust |
Leroy Keith, Jr.
(Born 1939) | | Trustee, since 2010 | | Chairman, Bloc Global Services (development and construction), Trustee of the Evergreen Funds from 1983 to 2010. Former Managing Director, Almanac Capital Management (commodities firm), former Partner, Stonington Partners, Inc. (private equity fund), former Director, Obagi Medical Products Co. and former Director, Lincoln Educational Services. | | Trustee, Virtus Fund Complex (consisting of 45 portfolios as of 12/31/10); Director, Diversapack Co. (packaging company); Asset Allocation Trust |
David F. Larcker
(Born 1950) | | Trustee, since 2009 | | James Irvin Miller Professor of Accounting at the Graduate School of Business, Stanford University, Director of Corporate Governance Research Program and Co-Director of The Rock Center for Corporate Governance since 2006. From 2005 to 2008, Professor of Accounting at the Graduate School of Business, Stanford University. Prior thereto, Ernst & Young Professor of Accounting at The Wharton School, University of Pennsylvania from 1985 to 2005. | | Asset Allocation Trust |
Olivia S. Mitchell
(Born 1953) | | Trustee, since 2006 | | International Foundation of Employee Benefit Plans Professor and Chair of the Department of Insurance and Risk Management, Wharton School of the University of Pennsylvania since 1993. Director of Wharton’s Pension Research Council and Boettner Center on Pensions & Retirement Research, and Research Associate at the National Bureau of Economic Research. Previously, Cornell University Professor from 1978 to 1993. | | Asset Allocation Trust |
| | | | | | |
| Other Information (Unaudited) | | Wells Fargo Advantage Small and Mid Cap Stock Funds | | | 99 | |
| | | | | | |
Name and Year of Birth | | Position Held and Length of Service | | Principal Occupations During Past Five Years | | Other Directorships |
Timothy J. Penny
(Born 1951) | | Trustee, since 1996 | | President and CEO of Southern Minnesota Initiative Foundation, a non-profit organization, since 2007 and Senior Fellow at the Humphrey Institute Policy Forum at the University of Minnesota since 1995. Member of the Board of Trustees of NorthStar Education Finance, Inc., a non-profit organization, since 2007. | | Asset Allocation Trust |
Michael S. Scofield
(Born 1943) | | Trustee, since 2010 | | Currently serves on the Investment Company Institute’s Board of Governors and Executive Committee as well the In dependent Director’s Counsel Board of Governors and Executive Committee. Former Chairman of the Independent Directors Counsel. Trustee of the Evergreen Funds from 1984 to 2010. Retired Attorney, Law Offices of Michael S. Scofield and former Director and Chairman, Branded Media Corporation (multi-media branding company). | | Asset Allocation Trust |
Donald C. Willeke
(Born 1940) | | Trustee, since 1996 | | Principal of the law firm of Willeke & Daniels. General Counsel of the Minneapolis Employees Retirement Fund from 1984 until its consolidation into the Minnesota Public Employees Retirement Association on June 30, 2010. | | Asset Allocation Trust |
Officers
| | | | | | |
Name and Year of Birth | | Position Held and
Length of Service | | Principal Occupations During Past Five Years | | |
Karla M. Rabusch
(Born 1959) | | President, since 2003 | | Executive Vice President of Wells Fargo Bank, N.A. and President of Wells Fargo Funds Management, LLC since 2003. Senior Vice President and Chief Administrative Officer of Wells Fargo Funds Management, LLC from 2001 to 2003. | | |
C. David Messman
(Born 1960) | | Secretary, since 2000; Chief Legal Counsel, since 2003 | | Senior Vice President and Secretary of Wells Fargo Funds Management, LLC since 2001. Vice President and Managing Counsel of Wells Fargo Bank, N.A. since 1996. | | |
Kasey Phillips
(Born 1970) | | Treasurer, since 2008 | | Senior Vice President of Wells Fargo Funds Management, LLC since 2009. Senior Vice President of Evergreen Investment Management Company, LLC from 2006 to 2010. Treasurer of the Evergreen Funds from 2005 to 2010. Vice President and Assistant Vice President of Evergreen Investment Services, Inc. from 1999 to 2006. | | |
David Berardi
(Born 1975) | | Assistant Treasurer, since 2009 | | Vice President of Wells Fargo Funds Management, LLC since 2009 . Vice President of Evergreen Investment Management Company, LLC from 2008 to 2010. Assistant Vice President of Evergreen Investment Services, Inc. from 2004 to 2008. Manager of Fund Reporting and Control for Evergreen Investment Management Company, LLC from 2004 to 2010. | | |
Jeremy DePalma
(Born 1974) | | Assistant Treasurer, since 2009 | | Senior Vice President of Wells Fargo Funds Management, LLC since 2009. Senior Vice President of Evergreen Investment Management Company, LLC from 2008 to 2010. Vice President, Evergreen Investment Services, Inc. from 2004 to 2007. Assistant Vice President, Evergreen Investment Services, Inc. from 2000 to 2004 and the head of the Fund Reporting and Control Team within Fund Administration from 2005 to 2010. | | |
Debra Ann Early
(Born 1964) | | Chief Compliance Officer, since 2007 | | Chief Compliance Officer of Wells Fargo Funds Management, LLC since 2007. Chief Compliance Officer of Parnassus Investments from 2005 to 2007. Chief Financial Officer of Parnassus Investments from 2004 to 2007 and Senior Audit Manager of PricewaterhouseCoopers LLP from 1998 to 2004. | | |
| | | | |
| 100 | | Wells Fargo Advantage Small and Mid Cap Stock Funds | | Other Information (Unaudited) |
BOARD CONSIDERATION OF INVESTMENT ADVISORY AND SUB-ADVISORY AGREEMENTS:
Intrinsic Small Cap Value Fund, Small Cap Growth Fund, Small Cap Opportunities Fund, Small Cap Value Fund, Small/Mid Cap Value Fund, Special Small Cap Value Fund and Traditional Small Cap Growth Fund
Each year, as required by Section 15 of the Investment Company Act of 1940 (the “1940 Act”), the Board of Trustees (the “Board”) of Wells Fargo Funds Trust (the “Trust”), all the members of which have no direct or indirect interest in the investment advisory and sub-advisory agreements and are not “interested persons” of the Trust, as defined in the 1940 Act (the “Independent Trustees”), determines whether to approve the continuation of the Trust’s investment advisory and sub-advisory agreements. In this regard, at an in person meeting held on March 24-25, 2011 (the “Meeting”), the Board reviewed and re-approved: (i) an investment advisory agreement with Wells Fargo Funds Management, LLC (“Funds Management”) for each of the Intrinsic Small Cap Value Fund, Small Cap Growth Fund, Small Cap Opportunities Fund, Small Cap Value Fund, Small/Mid Cap Value Fund, Special Small Cap Value Fund and Traditional Small Cap Growth Fund (collectively, the “Funds”); (ii) an investment sub-advisory agreement with Wells Capital Management Incorporated (“Wells Capital Management”) for each of the Small Cap Growth Fund, Small Cap Value Fund, Small/Mid Cap Value Fund, Special Small Cap Value Fund and Traditional Small Cap Growth Fund; (iii) an investment sub-advisory agreement with Metropolitan West Capital Management LLC (“MetWest”) for the Intrinsic Small Cap Value Fund; and (iv) an investment sub-advisory agreement with Schroder Investment Management North America Inc. (“Schroder”) for the Small Cap Opportunities Fund. The investment advisory agreements with Funds Management and the investment sub-advisory agreements with Wells Capital Management, MetWest and Schroder (the “Sub-Advisers”) are collectively referred to as the “Advisory Agreements.”
At the Meeting, the Board considered the factors and reached the conclusions described below relating to the selection of Funds Management and the Sub-Advisers and continuation of the Advisory Agreements. Prior to the Meeting, the Trustees conferred extensively among themselves and with representatives of Funds Management about these matters. The Board also met throughout the year and received information that was useful to them in considering the continuation of the Advisory Agreements. The Independent Trustees were assisted in their evaluation of the Advisory Agreements by independent legal counsel, from whom they received separate legal advice and with whom they met separately from Funds Management.
Nature, extent and quality of services
The Board received and considered various information regarding the nature, extent and quality of services provided to the Funds by Funds Management and the Sub-Advisers under the Advisory Agreements. The Board also received and considered information provided in response to a detailed set of requests submitted by the Independent Trustees’ independent legal counsel on their behalf. The Board received and considered, among other things, information about the background and experience of senior management of Funds Management, and the qualifications, backgrounds, tenures and responsibilities of the portfolio managers primarily responsible for the day-to-day portfolio management of the Funds.
The Board evaluated the ability of Funds Management and the Sub-Advisers, based on their respective financial condition, resources, reputation and other attributes, to attract and retain qualified investment professionals, including research, advisory, and supervisory personnel. The Board further considered the compliance programs and compliance records of Funds Management and the Sub-Advisers. In addition, the Board took into account the administrative services provided to the Funds by Funds Management and its affiliates.
The Board’s decision to approve the continuation of the Advisory Agreements was based on a comprehensive evaluation of all of the information provided to it. In approving the continuation of the Advisory Agreements, the Board did not identify any particular information or consideration that was all-important or controlling, and each Trustee attributed different weights to various factors. The Board evaluated information provided to it both in terms of the Funds generally and with respect to each Fund specifically as it considered appropriate. Although the Board considered the continuation of the Advisory Agreements for each of the Funds as part of the larger process of considering the continuation of the Advisory Agreements for all of the Funds, its decision to continue the Advisory Agreements for each of the Funds was ultimately made on a fund-by-fund basis.
In considering these matters, the Board considered not only the specific information presented in connection with the Meeting, but also the knowledge gained over time through interaction with Funds Management and the Sub-Advisers
| | | | | | |
| Other Information (Unaudited) | | Wells Fargo Advantage Small and Mid Cap Stock Funds | | | 101 | |
about various topics, including Funds Management’s oversight of service providers. The above factors, together with those referenced below, are some of the most important, but not necessarily all, factors considered by the Board in concluding that it was satisfied with the nature, extent and quality of the investment advisory services provided to each Fund by Funds Management and the respective Sub-Adviser.
Fund performance and expenses
The Board considered the performance results for each of the Funds over various time periods ended December 31, 2010. The Board also considered these results in comparison to the median performance of a universe of relevant funds (the “Universe”) that were determined by Lipper Inc. (“Lipper”) to be similar to the Funds, and in comparison to each Fund’s benchmark index and to other comparative data. Lipper is an independent provider of investment company data. The Board received a description of the methodology used by Lipper to select the mutual funds in the Universe.
The Board noted that the performance of each of the Funds was higher than the median performance of the Universe for the 3-year, 5-year and 10-year periods under review, except for the Intrinsic Small Cap Value Fund and the Special Small Cap Value Fund. The Board also noted that the performance of the Special Small Cap Value Fund was in range of or higher than the median performance of the Universe for the 5-year and 10-year periods under review. The Board noted that the Intrinsic Small Cap Value Fund’s performance was lower than the median performance of the Universe for all periods under review. The Board also noted that the performance of the Small Cap Opportunities Fund, the Intrinsic Small Cap Value Fund, the Small Cap Value Fund and the Small/Mid Cap Value Fund warranted further discussion. As part of its further review, the Board received an analysis of, and discussed factors contributing to, the underperformance of each of these Funds relative to the Universe. The Board received a report that showed (i) that the Small Cap Opportunities Fund’s performance is consistent with expectations, given the bias towards a higher-quality investment process; (ii) that the Intrinsic Small Cap Value Fund recently outperformed its benchmark; (iii) that the Small Cap Value Fund’s investment performance was being appropriately monitored; and (iv) that the Small/Mid Cap Value Fund’s performance for the most recent period was much improved and the Small/Mid Cap Value Fund is ranked in the top six percent of its peers over the one-year period. The Board was satisfied that Funds Management and the Sub-Advisers were taking appropriate actions with respect to each of the Fund’s investment performance and requested continued reports on the performance of each of the Funds.
The Board received and considered information regarding each Fund’s contractual advisory fee and net operating expense ratios and their various components, including actual management fees (which reflect fee waivers, if any), transfer agent, custodian and other non-management fees, Rule 12b-1 and non-Rule 12b-1 fees, service fees and fee waiver and expense reimbursement arrangements. The Board also considered these ratios in comparison to the median ratios of an expense Universe and a narrower expense group of mutual funds (each, an “Expense Group”) that was determined by Lipper to be similar to each Fund. The Board received a description of the methodology used by Lipper to select the mutual funds in a Fund’s Expense Group. The Board noted that, except for the Intrinsic Small Cap Value Fund (Class A), the net operating expense ratios of each of the Funds were in range of or lower than each Fund’s respective Expense Group’s median net operating expense ratio.
Based on the above-referenced considerations and other factors, the Board concluded that the overall performance and expense structure of the Funds supported the re-approval of the Advisory Agreements for the Funds.
Investment advisory and sub-advisory fee rates
The Board reviewed and considered the contractual investment advisory fee rates that are payable by the Funds to Funds Management for investment advisory services (the “Advisory Agreement Rates”), both on a stand-alone basis and on a combined basis with the Funds’ administration fee rates. The Board took into account the separate administrative and other services covered by the administration fee rates. The Board also reviewed and considered the contractual investment sub-advisory fee rates that are payable by Funds Management to the Sub-Advisers for investment sub-advisory services (the “Sub-Advisory Agreement Rates”). In addition, the Board reviewed and considered the existing fee waiver/cap arrangements applicable to the Advisory Agreement Rates and considered the Advisory Agreement Rates after taking the waivers/caps into account (the “Net Advisory Rates”).
The Board received and considered information comparing the Advisory Agreement Rates and Net Advisory Rates with those of other funds in each Fund’s Expense Group median. The Board noted that the Advisory Agreement Rates for the Intrinsic Small Cap Value Fund, the Small Cap Opportunities Fund and the Small/Mid Cap Value Fund were in range of
| | | | |
| 102 | | Wells Fargo Advantage Small and Mid Cap Stock Funds | | Other Information (Unaudited) |
the median rate of each Fund’s Expense Group, except for Class A of the Intrinsic Small Cap Value Fund and the Small/Mid Cap Value Fund, which were higher than the median rate of each Fund’s Expense Group. The Board noted that the Advisory Agreement Rates for the Small Cap Growth Fund, the Small Cap Value Fund, the Special Small Cap Value Fund and the Traditional Small Cap Growth Fund were in range of or not appreciably higher than the median rate of each Fund’s Expense Group, except for each Fund’s Class A and the Administrator Class of the Small Cap Growth Fund and Small Cap Value Fund, which were higher than the median rate of the Fund’s Expense Group. The Board noted that the Net Advisory Rates for each of the Funds were in range of or not appreciably higher than the median rates of each Fund’s respective Expense Group, except for Class A of each of the Funds and the Small Cap Growth Fund’s Administrator Class, which were higher than the median rate of each Fund’s respective Expense Group. The Board further noted that Funds Management had agreed to continue and, in certain instances, reduce contractual fee cap arrangements for the Funds designed to lower the Funds’ expenses.
The Board also received and considered information about the nature and extent of services offered and fee rates charged by Funds Management and the Sub-Advisers to other types of clients. In this regard, the Board received information about differences between the services, and the compliance, reporting, and other legal burdens and risks of providing investment advice to mutual funds and those associated with providing advice to non-mutual fund clients such as collective funds or institutional separate accounts. In each case, the Board determined that the Advisory Agreement Rates for the Funds, both with and without administration fee rates and before and after waivers, were acceptable in light of the Funds’ Expense Group information, the net expense ratio commitments, the services covered by the Advisory Agreements and other information provided.
The Board also reviewed and considered the Sub-Advisory Agreement Rates and concluded that the Sub-Advisory Agreement Rates were acceptable in light of the services covered by the Sub-Advisory Agreement and other information provided.
Profitability
The Board received and considered a profitability analysis of Funds Management, as well as an analysis of the profitability to the collective Wells Fargo businesses that provide services to the Funds. It considered that the information provided to it was necessarily estimated, and that the profitability information provided to it, especially on a fund-by-fund basis, did not necessarily provide a precise tool for evaluating the appropriateness of each Fund’s Advisory Agreement Rates in isolation. It noted that the levels of profitability of the Funds to Funds Management varied widely, depending on, among other things, the size and type of fund. The Board concluded that the profitability to Funds Management of the services provided to any of the Funds, individually or in the aggregate, was not unreasonable.
The Board did not consider separate profitability information with respect to Wells Capital Management and MetWest, because, as affiliates of Funds Management, their profitability information was subsumed in the collective Wells Fargo profitability analysis provided by Funds Management. The Board did not consider separate profitability information with respect to Schroder, which is not affiliated with Funds Management. The Board considered that the sub-advisory fees paid to Schroder had been negotiated by Funds Management on an arm’s-length basis and that their profitability from their relationship with the Small Cap Opportunities Fund, was not a material factor in determining whether to renew the agreements.
Economies of scale
With respect to possible economies of scale, the Board reviewed the breakpoints in each Fund’s advisory fee structure, which operate generally to reduce the effective Advisory Agreement Rates of the Funds (as a percentage of Fund assets) as the Funds grow in size. It considered that, as a fund shrinks in size, breakpoints conversely result in increasing fee levels. The Board noted that it would continue to review the appropriate levels of breakpoints in the future, and concluded that the breakpoints as implemented appeared to be a reasonable step toward sharing economies of scale with the Funds. However, the Board acknowledged the inherent limitations of any analysis of an investment adviser’s economies of scale and of any attempt to correlate breakpoints with such economies, stemming largely from the Board’s understanding that economies of scale are realized, if at all, by an investment adviser across a variety of products and services, not just with respect to a single fund.
| | | | | | |
| Other Information (Unaudited) | | Wells Fargo Advantage Small and Mid Cap Stock Funds | | | 103 | |
Other benefits to Funds Management and the Sub-Advisers
The Board received and considered information regarding potential “fall-out” or ancillary benefits received by Funds Management and its affiliates and the Sub-Advisers as a result of their relationship with the Funds. Ancillary benefits could include, among others, benefits directly attributable to the relationship of Funds Management and the Sub-Advisers with the Funds and benefits potentially derived from an increase in Funds Management’s and each Sub-Adviser’s business as a result of their relationship with the Funds (such as the ability to market to shareholders other financial products offered by Funds Management and its affiliates or the Sub-Adviser and their affiliates).
The Board considered that Wells Fargo Funds Distributor, LLC, an affiliate of Funds Management, serves as distributor to the Funds and receives certain compensation for those services. The Board noted that the Funds pay sub-transfer agency fees to various financial institutions, including affiliates of Funds Management that hold fund shares in omnibus accounts. It also considered that these entities may receive distribution-related fees and shareholder servicing payments (including amounts derived from payments under the funds’ Rule 12b-1 plans) in respect of shares sold or held through them.
The Board also reviewed information about whether and to what extent soft dollar credits are sought and how any such credits are utilized and any benefits that may be realized by using an affiliated broker.
Other factors and broader review
The Board also considered the markets for distribution of the Funds’ shares, including the multiple channels through which the Funds’ shares are offered and sold. The Board noted that the Funds are part of one of the few fund families that have both direct-to-fund and intermediary distribution channels. As discussed above, the Board reviews detailed materials received from Funds Management and each Sub-Adviser annually as part of the re-approval process under Section 15 of the 1940 Act and also reviews and assesses information about the quality of the services that the Funds receive throughout the year. In this regard, the Board has reviewed reports of Funds Management at each of its quarterly meetings, which include, among other things, portfolio reviews and performance reports. In addition, the Board confers with portfolio managers at various times throughout the year.
Conclusion
After considering the above-described factors and based on its deliberations and its evaluation of the information described above, the Board concluded that approval of the continuation of the Advisory Agreements for the Funds was in the best interest of the Funds and their shareholders. Accordingly, the Board unanimously approved the continuation of the Advisory Agreements for an additional one-year period.
| | | | |
| 104 | | Wells Fargo Advantage Small and Mid Cap Stock Funds | | List of Abbreviations |
The following is a list of common abbreviations for terms and entities which may have appeared in this report.
| ABAG | — Association of Bay Area Governments |
| ACB | — Agricultural Credit Bank |
| ADR | — American Depositary Receipt |
| ADS | — American Depository Shares |
| AGC-ICC | — Assured Guaranty Corporation - Insured Custody Certificates |
| AGM | — Assured Guaranty Municipal |
| AMBAC | — American Municipal Bond Assurance Corporation |
| AMT | — Alternative Minimum Tax |
| ARM | — Adjustable Rate Mortgages |
| BAN | — Bond Anticipation Notes |
| BART | — Bay Area Rapid Transit |
| BHAC | — Berkshire Hathaway Assurance Corporation |
| CDA | — Community Development Authority |
| CDO | — Collateralized Debt Obligation |
| CDSC | — Contingent Deferred Sales Charge |
| CGIC | — Capital Guaranty Insurance Company |
| CGY | — Capital Guaranty Corporation |
| CIFG | — CDC (Caisse des Dépôts et Consignations) IX IS Financial Guarantee |
| COP | — Certificate of Participation |
| DRIVER | — Derivative Inverse Tax-Exempt Receipts |
| DW&P | — Department of Water & Power |
| DWR | — Department of Water Resources |
| ECFA | — Educational & Cultural Facilities Authority |
| EDFA | — Economic Development Finance Authority |
| ETET | — Eagle Tax-Exempt Trust |
| ETF | — Exchange-Traded Fund |
| FFCB | — Federal Farm Credit Bank |
| FGIC | — Financial Guaranty Insurance Corporation |
| FHA | — Federal Housing Authority |
| FHAG | — Federal Housing Agency |
| FHLB | — Federal Home Loan Bank |
| FHLMC | — Federal Home Loan Mortgage Corporation |
| FNMA | — Federal National Mortgage Association |
| GDR | — Global Depositary Receipt |
| GNMA | — Government National Mortgage Association |
| HCFR | — Healthcare Facilities Revenue |
| HEFA | — Health & Educational Facilities Authority |
| HEFAR | — Higher Education Facilities Authority Revenue |
| HFA | — Housing Finance Authority |
| HFFA | — Health Facilities Financing Authority |
| HUD | — Housing & Urban Development |
| IDA | — Industrial Development Authority |
| IDAG | — Industrial Development Agency |
| IDR | — Industrial Development Revenue |
| KRW | — Republic of Korea Won |
| LIBOR | — London Interbank Offered Rate |
| LLC | — Limited Liability Company |
| LLP | — Limited Liability Partnership |
| MBIA | — Municipal Bond Insurance Association |
| MFHR | — Multi-Family Housing Revenue |
| MFMR | — Multi-Family Mortgage Revenue |
| MMD | — Municipal Market Data |
| MSTR | — Municipal Securities Trust Receipts |
| MUD | — Municipal Utility District |
| NATL-RE | — National Public Finance Guarantee Corporation |
| PCFA | — Pollution Control Finance Authority |
| PCR | — Pollution Control Revenue |
| PFA | — Public Finance Authority |
| PFFA | — Public Facilities Financing Authority |
| PFOTER | — Puttable Floating Option Tax-Exempt Receipts |
| plc | — Public Limited Company |
| PSFG | — Public School Fund Guaranty |
| PUTTER | — Puttable Tax-Exempt Receipts |
| R&D | — Research & Development |
| RDA | — Redevelopment Authority |
| RDFA | — Redevelopment Finance Authority |
| REIT | — Real Estate Investment Trust |
| ROC | — Reset Option Certificates |
| SFHR | — Single Family Housing Revenue |
| SFMR | — Single Family Mortgage Revenue |
| SLMA | — Student Loan Marketing Association |
| SPDR | — Standard & Poor’s Depositary Receipts |
| STIT | — Short-Term Investment Trust |
| TAN | — Tax Anticipation Notes |
| TRAN | — Tax Revenue Anticipation Notes |
| TCR | — Transferable Custody Receipts |
| TTFA | — Transportation Trust Fund Authority |
| USD | — Unified School District |
| XLCA | — XL Capital Assurance |
This page is intentionally left blank.
This page is intentionally left blank.

More information about Wells Fargo Advantage Funds is available free upon request. To obtain literature, please write, e-mail, visit the Funds’ Web site, or call:
Wells Fargo Advantage Funds
P.O. Box 8266
Boston, MA 02266-8266
E-mail: wfaf@wellsfargo.com
Web site: www.wellsfargo.com/advantagefunds Individual Investors: 1- 800-222-8222
Retail Investment Professionals: 1- 888-877-9275 Institutional Investment Professionals: 1- 866-765-0778
This report and the financial statements contained herein are submitted for the general information of the shareholders of Wells Fargo Advantage Funds. If this report is used for promotional purposes, distribution of the report must be accompanied or preceded by a current prospectus. For a prospectus containing more complete information, including charges and expenses, call 1-800-222-8222 or visit the Funds’ Web site at www.wellsfargo.com/advantagefunds. Please consider the investment objectives, risks, charges, and expenses of the investment carefully before investing. This and other information about Wells Fargo Advantage Funds can be found in the current prospectus. Read the prospectus carefully before you invest or send money.
Wells Fargo Funds Management, LLC, a wholly owned subsidiary of Wells Fargo & Company, provides investment advisory and administrative services for Wells Fargo Advantage Funds. Other affiliates of Wells Fargo & Company provide subadvisory and other services for the Funds. The Funds are distributed by Wells Fargo Funds Distributor, LLC, Member FINRA/SIPC, an affiliate of Wells Fargo & Company.
NOT FDIC INSURED ¡ NO BANK GUARANTEE ¡ MAY LOSE VALUE

| | | | | | |
| | | |
© 2011 Wells Fargo Funds Management, LLC. All rights reserved. | | www.wellsfargo.com/advantagefunds | | 202912 06-11 SMCFLD/SAR122 04-11 |


Semi-Annual Report
April 30, 2011
WELLS FARGO ADVANTAGE INCOME FUNDS
| n | | Wells Fargo Advantage International Bond Fund |
Reduce clutter. Save trees.
Sign up for electronic delivery of prospectuses and shareholder reports at www.wellsfargo.com/advantagedelivery
Contents
The views expressed are as of April 30, 2011, and are those of the Fund managers. Any reference to a specific security in this report is not a recommendation to purchase or sell any specific security or adopt any investment strategy. The views are subject to change at any time in response to changing circumstances in the market and are not intended to predict or guarantee the future performance of any individual security, market sector or the markets generally, or the Wells Fargo Advantage International Bond Fund.
NOT FDIC INSURED ¡ NO BANK GUARANTEE ¡ MAY LOSE VALUE

WELLS FARGO INVESTMENT HISTORY
| | |
| |
| 1932 | | Keystone creates one of the first mutual fund families. |
| |
| 1971 | | Wells Fargo & Company introduces one of the first institutional index funds. |
| |
| 1978 | | Wells Fargo applies Markowitz and Sharpe’s research on Modern Portfolio Theory to introduce one of the industry’s first Tactical Asset Allocation (TAA) models in institutional separately managed accounts. |
| |
| 1984 | | Wells Fargo Stagecoach Funds launches its first asset allocation fund. |
| |
| 1989 | | The Tactical Asset Allocation (TAA) Model is first applied to Wells Fargo’s asset allocation mutual funds. |
| |
| 1994 | | Wells Fargo introduces the LifePath Funds, one of the first suites of target date funds (now the Wells Fargo Advantage Dow Jones Target Date FundsSM ). |
| |
| 1996 | | Evergreen Investments and Keystone Funds merge. |
| |
| 1997 | | Wells Fargo launches Wells Fargo Advantage WealthBuilder PortfoliosSM, a fund-of-funds suite of products that includes the use of quantitative models to shift assets among investment styles. |
| |
| 1999 | | Norwest Advantage Funds and Stagecoach Funds are reorganized into Wells Fargo Funds after the merger of Norwest and Wells Fargo. |
| |
| 2002 | | Evergreen Retail and Evergreen Institutional companies form the umbrella asset management company, Evergreen Investments. |
| |
| 2005 | | The integration of Strong Funds with Wells Fargo Funds creates Wells Fargo Advantage Funds, resulting in one of the top 20 mutual fund companies in the United States. |
| |
| 2006 | | Wells Fargo Advantage Funds relaunches the target date product line as Wells Fargo Advantage Dow Jones Target Date Funds. |
| |
| 2010 | | The mergers and reorganizations of Evergreen and Wells Fargo Advantage mutual funds are completed, unifying the families under the brand of Wells Fargo Advantage Funds. |
Wells Fargo Advantage Funds®
Wells Fargo Advantage Funds skillfully guides institutions, financial advisors, and individuals through the investment terrain to help them reach their financial objectives. Everything we do on behalf of investors is backed by our unique combination of qualifications.
Strength
Our organization is built on the standards of integrity and service established by our parent company—Wells Fargo & Company—more than 150 years ago. And, because we’re part of a highly diversified financial enterprise, we offer the depth of resources to help investors succeed.
Expertise
Our multi-boutique model offers investors access to the independent thinking of premier investment managers that have been chosen for their time-tested strategies. While each team specializes in a specific investment strategy, collectively they provide investors a wide choice of distinct investment styles. Our dedication to investment excellence doesn’t end with our expertise in manager selection—risk management, analysis, and rigorous ongoing review seek to ensure each manager’s investment process remains consistent.
Partnership
Our collaborative approach is built around understanding the needs and goals of our clients. By adhering to core principles of sound judgment and steady guidance, we support you through every stage of the investment decision process.
Carefully consider the investment objectives, risks, charges, and expenses before investing. For a current prospectus for Wells Fargo Advantage Funds containing this and other information, visit wellsfargo.com/advantagefunds. Read it carefully before investing.
Wells Fargo Funds Management, LLC, a wholly owned subsidiary of Wells Fargo & Company, provides investment advisory and administrative services for Wells Fargo Advantage Funds®. Other affiliates of Wells Fargo & Company provide subadvisory and other services for the Funds. The Funds are distributed by Wells Fargo Funds Distributor, LLC, Member FINRA/SIPC, an affiliate of Wells Fargo & Company.
The “Dow Jones Target Date Indexes” are a product of Dow Jones Indexes, a licensed trademark of CME Group Index Services LLC (“CME”). “Dow Jones” and “Dow Jones Target Date Indexes” are service marks of Dow Jones Trademark Holdings, LLC, and have been licensed for use for certain purposes by CME and sublicensed for use by Global Index Advisors, Inc., and Wells Fargo Funds Management, LLC. The Dow Jones Target Date Indexes are based in part on the Barclays Capital Bond Indexes, which are published by Barclays Capital Inc. The Wells Fargo Advantage Dow Jones Target Date Funds, based on the Dow Jones Target Date Indexes, are not sponsored, endorsed, sold, or promoted by Dow Jones, CME or Barclays Capital or any of their respective affiliates, and neither Dow Jones, CME nor Barclays Capital nor any of their respective affiliates makes any representation regarding the advisability of investing in such product(s) and/or about the quality, accuracy, and/or completeness of the Dow Jones Target Date Indexes or the Barclays Capital Bond Indexes. IN NO EVENT SHALL DOW JONES, CME, BARCLAYS CAPITAL, OR ANY OF THEIR LICENSORS HAVE ANY LIABILITY FOR ANY SPECIAL, PUNITIVE, IN DIRECT, OR CONSEQUENTIAL DAMAGES (INCLUDING LOST PROFITS), EVEN IF NOTIFIED OF THE POSSIBILITY OF SUCH DAMAGES.
NOT FDIC INSURED ¡ NO BANK GUARANTEE ¡ MAY LOSE VALUE
Not part of the semi-annual report.
Wells Fargo Advantage Funds offers more than 120 mutual funds across a wide range of asset classes, representing over $241 billion in assets under management, as of April 30, 2011.
| | | | |
| Equity Funds | | | | |
Asia Pacific Fund | | Enterprise Fund† | | Opportunity Fund† |
C&B Large Cap Value Fund | | Equity Value Fund | | Precious Metals Fund |
C&B Mid Cap Value Fund | | Global Opportunities Fund | | Premier Large Company Growth Fund |
Capital Growth Fund | | Growth Fund | | Small Cap Growth Fund |
Classic Value Fund | | Growth Opportunities Fund | | Small Cap Opportunities Fund |
Common Stock Fund | | Health Care Fund | | Small Cap Value Fund |
Core Equity Fund | | Index Fund | | Small Company Growth Fund |
Disciplined Global Equity Fund | | International Equity Fund | | Small Company Value Fund |
Disciplined U.S. Core Fund | | International Value Fund | | Small/Mid Cap Core Fund |
Disciplined Value Fund | | Intrinsic Small Cap Value Fund | | Small/Mid Cap Value Fund |
Discovery Fund† | | Intrinsic Value Fund | | Social Sustainability Fund† |
Diversified Equity Fund | | Intrinsic World Equity Fund | | Special Mid Cap Value Fund |
Diversified International Fund | | Large Cap Core Fund | | Special Small Cap Value Fund |
Diversified Small Cap Fund | | Large Cap Growth Fund | | Specialized Technology Fund |
Emerging Growth Fund | | Large Company Value Fund | | Strategic Large Cap Growth Fund |
Emerging Markets Equity Fund | | Mid Cap Growth Fund | | Traditional Small Cap Growth Fund |
Endeavor Select Fund† | | Omega Growth Fund | | Utility and Telecommunications Fund |
| Bond Funds | | | | |
Adjustable Rate Government Fund | | Inflation-Protected Bond Fund | | Short-Term Bond Fund |
California Limited-Term Tax-Free Fund | | Intermediate Tax/AMT-Free Fund | | Short-Term High Yield Bond Fund |
California Tax-Free Fund | | International Bond Fund | | Short-Term Municipal Bond Fund |
Colorado Tax-Free Fund | | Minnesota Tax-Free Fund | | Strategic Municipal Bond Fund |
Government Securities Fund | | Municipal Bond Fund | | Total Return Bond Fund |
High Income Fund | | North Carolina Tax-Free Fund | | Ultra Short-Term Income Fund |
High Yield Bond Fund | | Pennsylvania Tax-Free Fund | | Ultra Short-Term Municipal Income Fund |
Income Plus Fund | | Short Duration Government Bond Fund | | Wisconsin Tax-Free Fund |
| Asset Allocation Funds | | | | |
Asset Allocation Fund | | WealthBuilder Equity Portfolio† | | Target 2020 Fund† |
Conservative Allocation Fund | | WealthBuilder Growth Allocation Portfolio† | | Target 2025 Fund† |
Diversified Capital Builder Fund | | WealthBuilder Growth Balanced Portfolio† | | Target 2030 Fund† |
Diversified Income Builder Fund | | WealthBuilder Moderate Balanced Portfolio† | | Target 2035 Fund† |
Growth Balanced Fund | | WealthBuilder Tactical Equity Portfolio† | | Target 2040 Fund† |
Index Asset Allocation Fund | | Target Today Fund† | | Target 2045 Fund† |
Moderate Balanced Fund | | Target 2010 Fund† | | Target 2050 Fund† |
WealthBuilder Conservative Allocation Portfolio† | | Target 2015 Fund† | | |
| Money Market Funds | | | | |
100% Treasury Money Market Fund | | Minnesota Money Market Fund | | New Jersey Municipal Money Market Fund |
California Municipal Money Market Fund | | Money Market Fund | | New York Municipal Money Market Fund |
Cash Investment Money Market Fund | | Municipal Cash Management Money Market Fund | | Pennsylvania Municipal Money Market Fund |
Government Money Market Fund | | Municipal Money Market Fund | | Prime Investment Money Market Fund |
Heritage Money Market Fund† | | National Tax-Free Money Market Fund | | Treasury Plus Money Market Fund |
| Variable Trust Funds1 | | | | |
VT Core Equity Fund | | VT Intrinsic Value Fund | | VT Small Cap Value Fund |
VT Discovery Fund† | | VT Omega Growth Fund | | VT Total Return Bond Fund |
VT Index Asset Allocation Fund | | VT Opportunity Fund† | | |
VT International Equity Fund | | VT Small Cap Growth Fund | | |
An investment in a money market fund is not insured or guaranteed by the Federal Deposit Insurance Corporation or any other government agency. Although the Wells Fargo Advantage Money Market Funds seek to preserve the value of your investment at $1.00 per share, it is possible to lose money by investing in a money market fund.
| 1. | The Variable Trust Funds are generally available only through insurance company variable contracts. |
| † | In this report, the Wells Fargo Advantage Discovery FundSM, Wells Fargo Advantage Endeavor Select FundSM, Wells Fargo Advantage Enterprise FundSM, Wells Fargo Advantage Opportunity FundSM, Wells Fargo Advantage Social Sustainability FundSM, Wells Fargo Advantage WealthBuilder Conservative Allocation PortfolioSM, Wells Fargo Advantage WealthBuilder Equity PortfolioSM , Wells Fargo Advantage WealthBuilder Growth Allocation PortfolioSM, Wells Fargo Advantage WealthBuilder Growth Balanced PortfolioSM, Wells Fargo Advantage WealthBuilder Moderate Balanced PortfolioSM, Wells Fargo Advantage WealthBuilder Tactical Equity PortfolioSM , Wells Fargo Advantage Dow Jones Target Today FundSM, Wells Fargo Advantage Dow Jones Target 2010 FundSM, Wells Fargo Advantage Dow Jones Target 2015 FundSM, Wells Fargo Advantage Dow Jones Target 2020 FundSM, Wells Fargo Advantage Dow Jones Target 2025 FundSM, Wells Fargo Advantage Dow Jones Target 2030 FundSM , Wells Fargo Advantage Dow Jones Target 2035 FundSM, Wells Fargo Advantage Dow Jones Target 2040 FundSM, Wells Fargo Advantage Dow Jones Target 2045 FundSM, Wells Fargo Advantage Dow Jones Target 2050 FundSM, Wells Fargo Advantage Heritage Money Market FundSM, Wells Fargo Advantage VT Discovery FundSM, and Wells Fargo Advantage VT Opportunity FundSM are referred to as the Discovery Fund, Endeavor Select Fund, Enterprise Fund, Opportunity Fund, Social Sustainability Fund, WealthBuilder Conservative Allocation Portfolio, WealthBuilder Equity Portfolio, WealthBuilder Growth Allocation Portfolio, WealthBuilder Growth Balanced Portfolio, WealthBuilder Moderate Balanced Portfolio, WealthBuilder Tactical Equity Portfolio, Target Today Fund, Target 2010 Fund, Target 2015 Fund, Target 2020 Fund, Target 2025 Fund, Target 2030 Fund, Target 2035 Fund, Target 2040 Fund, Target 2045 Fund, Target 2050 Fund, Heritage Money Market Fund, VT Discovery Fund, and VT Opportunity Fund, respectively. |
Not part of the semi-annual report.
| | | | |
| 2 | | Wells Fargo Advantage International Bond Fund | | Letter to Shareholders |

Karla M. Rabusch,
President
Wells Fargo Advantage Funds
The ongoing recovery of global growth continued to face significant challenges, as sovereign debt problems around the world spurred additional calls for fiscal austerity and a renewed focus on deficit reduction
Dear Valued Shareholder,
We are pleased to provide you with this semi-annual report for the Wells Fargo Advantage International Bond Fund, which covers the six-month period that ended April 30, 2011. Wells Fargo Advantage Funds provides many different mutual funds, giving you the flexibility to invest in a family of funds that covers nearly every asset class and investment style. We are pleased to have you as an investor in our Wells Fargo Advantage International Bond Fund and welcome the opportunity to provide you with solutions to all of your investment needs.
Global fixed-income securities declined and then rallied on continued monetary accommodation.
Global fixed-income markets experienced mixed performance during the period. The ongoing recovery of global growth continued to face significant challenges, as sovereign debt problems around the world spurred additional calls for fiscal austerity and a renewed focus on deficit reduction, which curtailed some of the postcrisis optimism and resulted in a decline in global bond markets in the first couple months of the period. Inflation continued to be mostly subdued around the world, allowing those governments that were concentrating on reducing their deficits to keep an extreme accommodation in monetary policy. In fact, the United States announced a second round of quantitative easing (QE2) early in the period, citing continued low inflation and low growth expectations. The announcement resulted in mixed results for global bond prices. Debt securities around the globe had previously appreciated in value on early indications that more quantitative easing was possible, but after the announcement was made official, global bond markets declined, likely due to the projections that this would be the U.S. Federal Reserve (Fed) final monetary easing program.
In the months following, global fixed-income markets once again modestly rallied, led by higher-yielding securities, particularly in the investment-grade and high-yield corporate debt sectors. This rally in higher-yielding securities appeared to be motivated in part by the lack of income-returning investment opportunities—a consequence of extraordinarily low interest rates, low inflation conditions, and restrained expectations for economic growth in the largest economies. The QE2 program in the U.S. not only drove rates lower, but also created further scarcity in income-producing securities, thus driving investors to other sectors of the global fixed-income markets, particularly the higher-yielding segments.
We believe it is likely that monetary accommodation will continue across many of the largest economic sovereignties around the globe in the near term. However, whether or not these influences will continue to produce rallies in fixed-income securities is open for debate. At some stage, yields will have to move higher, and we continue to manage our strategies with such future considerations in mind. Yet, at the same time, we do not intend to restrict ourselves from participating in the opportunities to add higher levels of yield for our investors. The recent period produced compelling performance from global fixed-income securities, and while we believe it is not likely that the same conditions will repeat themselves in the upcoming period, we remain optimistic about the opportunities to invest for attractive levels of yield.
| | | | | | |
| Letter to Shareholders | | Wells Fargo Advantage International Bond Fund | | | 3 | |
Bonds and currencies of smaller economies continued to demonstrate strength.
Global bond market yields continued to shift higher during the final months of the period but not to the same magnitude as in the earlier months. This was partially offset by strong performance from the corporate bond sectors later in the period. However, sovereign debt concerns regarding the eurozone and the U.S. continued to weigh on bond valuations across the global markets. In the U.S., the growth outlook improved, but the deficit outlook continued to deteriorate while inflation expectations began to increase. An exit strategy for the U.S. central bank’s highly accommodative monetary policy is unclear and appears requisite to sustainable economic growth in the near term.
In Europe, conditions were similar but were also more complex. In the core euro region, the growth outlook improved, courtesy of trade economies. Deficit reduction began in earnest during the first quarter, while inflation expectations appeared stable. However, in the eurozone periphery, growth continued to languish in recession, due in part to deficit reduction measures. These types of issues (low growth, highly accommodative monetary policy) continue to be most prevalent among the largest economies, while the smaller economies, in our view, will likely see monetary tightening and better prospects for growth.
Throughout the period, we were positioned for underperformance from the largest economies and a devaluing of the U.S. dollar. We continue to anticipate similar conditions throughout 2011 despite the volatility in the first quarter, which saw the Japanese yen sharply depreciate and the euro rise to the position of global strength. The case for a structurally weaker U.S. dollar is well known, and the same case can be made for the British sterling. However, the euro is only marginally better. We believe that the structural bear market in the U.S. is likely to re-emerge later in 2011 but not until we have a framework for the settlement of sovereign debt problems in peripheral Europe.
Meanwhile, we should expect increased, coordinated intervention in an effort to ensure a stable currency background following the earthquake and tsunami in Japan. Therefore, with markets trading on the latest news, we believe that it is unwise to take significant positions in any of the three major currencies and that only a weak sterling outlook should be allowed for. Longer term, we believe the currencies of the smaller, more dynamic economies with trade surpluses, healthier growth, and higher interest rates should appreciate. We particularly like the smaller, more dynamic Asian and South American economies. While concerns about the health of the largest economies continue, we believe several opportunities for investor value in the smaller economies of the global fixed-income markets continue to develop.
In our opinion, diligent and earnest assessment of the fundamental risks in individual fixed-income securities will be a key factor in determining which investment strategies perform well and which do not. We believe it is important to have the right caretakers in charge of investors’ assets during times of uncertainty and opportunity. At Wells Fargo Advantage Funds, we intend to continue measuring relative-value opportunities in the international fixed-income markets. As evidenced by the performance of international fixed-income assets during the recent six-month period, heightened risks often accompany opportunities.
We believe it is likely that monetary accommodation will continue across many of the largest economic sovereignties around the globe for at least the next couple of quarters.
| | | | |
| 4 | | Wells Fargo Advantage International Bond Fund | | Letter to Shareholders |
Short-term volatility shouldn’t derail long-term investment goals.
While periods of volatility can present challenges, experience has taught us that maintaining a long-term investment strategy based on individual goals and risk tolerance can be an effective way to plan for the future. As a whole, Wells Fargo Advantage Funds represents investments across a broad range of asset classes and investment styles with more than 120 mutual funds, giving you an opportunity to create a diversified investment portfolio. While diversification may not prevent losses in a downturn, it may help reduce them and provide you with one way of managing risk.
Thank you for choosing Wells Fargo Advantage Funds. We appreciate your confidence in us. Through each market cycle, we are committed to helping you meet your financial needs. If you have any questions about your investment, please contact your investment professional or call us at 1-800-222-8222, 24 hours a day, 7 days a week. You may also visit our website at www.wellsfargo.com/advantagefunds.
Sincerely,

Karla M. Rabusch
President
Wells Fargo Advantage Funds
| | | | | | |
| Performance Highlights | | Wells Fargo Advantage International Bond Fund | | | 5 | |
Wells Fargo Advantage International Bond Fund
INVESTMENT OBJECTIVE
The Fund seeks total return, consisting of income and capital appreciation.
ADVISER
Wells Fargo Funds Management, LLC
SUB-ADVISER
First International Advisors, LLC
PORTFOLIO MANAGERS
Michael Lee
Tony Norris
Alex Perrin
Peter Wilson
FUND INCEPTION
December 15, 1993
| | |
COUNTRY ALLOCATION1 (AS OF APRIL 30, 2011) |
|
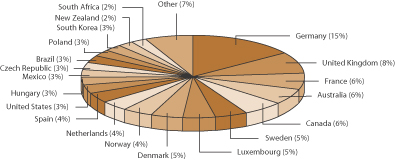 |
| | | | |
TEN LARGEST HOLDINGS2
(AS OF APRIL 30, 2011) | |
Sweden 4.50%, 08/12/2015 | | | 4.71% | |
Spain 4.85%, 10/31/2020 | | | 3.70% | |
Australia Series 25CI 3.14%, 09/20/2025 | | | 2.92% | |
Canada 2.50%, 09/01/2013 | | | 2.89% | |
Czech Republic 5.00%, 04/11/2019 | | | 2.87% | |
Mexico 8.50%, 11/18/2038 | | | 2.75% | |
Eurohypo AG 3.75%, 03/24/2014 | | | 2.71% | |
Dexia Kommunalbank AG 3.50%, 06/05/2014 | | | 2.68% | |
Poland 5.50%, 04/25/2015 | | | 2.65% | |
Nykredit 4.00%, 10/01/2041 | | | 2.48% | |
| 1. | Country allocation is subject to change and is calculated based on the total investments of the Fund, excluding cash and cash equivalents. |
| 2. | The ten largest holdings are calculated based on the value of the securities divided by total net assets of the Fund. Holdings are subject to change and may have changed since the dates specified. |
| | | | |
| 6 | | Wells Fargo Advantage International Bond Fund | | Performance Highlights |
Wells Fargo Advantage International Bond Fund (continued)
AVERAGE ANNUAL TOTAL RETURN3 (%) (AS OF APRIL 30, 2011)
| | | | | | | | | | | | | | | | | | | | | | | | | | | | | | | | | | | | | | | | | | | | |
| | | | | | Including Sales Charge | | | Excluding Sales Charge | | | Expense Ratios4 | |
| | | Inception Date | | | 6-Months* | | | 1-Year | | | 5-Year | | | 10-Year | | | 6-Months* | | | 1-Year | | | 5-Year | | | 10-Year | | | Gross | | | Net5 | |
Class A (ESIYX) | | | 09/30/2003 | | | | (2.85 | ) | | | 7.45 | | | | 7.34 | | | | 9.04 | | | | 1.76 | | | | 12.51 | | | | 8.34 | | | | 9.55 | | | | 1.11% | | | | 1.03% | |
Class B (ESIUX)** | | | 09/30/2003 | | | | (3.56 | ) | | | 6.66 | | | | 7.23 | | | | 9.01 | | | | 1.36 | | | | 11.66 | | | | 7.53 | | | | 9.01 | | | | 1.86% | | | | 1.78% | |
Class C (ESIVX) | | | 09/30/2003 | | | | 0.36 | | | | 10.69 | | | | 7.55 | | | | 8.76 | | | | 1.36 | | | | 11.69 | | | | 7.55 | | | | 8.76 | | | | 1.86% | | | | 1.78% | |
Administrator Class (ESIDX) | | | 07/30/2010 | | | | | | | | | | | | | | | | | | | | 1.83 | | | | 12.67 | | | | 8.50 | | | | 9.72 | | | | 1.05% | | | | 0.85% | |
Institutional Class (ESICX) | | | 12/15/1993 | | | | | | | | | | | | | | | | | | | | 1.86 | | | | 12.77 | | | | 8.62 | | | | 9.84 | | | | 0.78% | | | | 0.73% | |
BofA Merrill Lynch Global Broad Market Ex. U.S. Index6 | | | | | | | | | | | | | | | | | | | | | | | 2.64 | | | | 14.02 | | | | 7.84 | | | | 8.87 | | | | | | | | | |
| * | Returns for periods of less than one year are not annualized. |
| ** | Class B shares are closed to investment, except in connection with the reinvestment of any distributions and permitted exchanges. |
Figures quoted represent past performance, which is no guarantee of future results and do not reflect the deduction of taxes that a shareholder may pay on fund distributions or the redemption of fund shares. Investment return and principal value of an investment will fluctuate so that an investor’s shares, when redeemed, may be worth more or less than their original cost. Performance shown without sales charges would be lower if sales charges were reflected. Current performance may be lower or higher than the performance data quoted. Current month-end performance is available on the Fund’s Web site – www.wellsfargo.com/advantagefunds.
Index returns do not include transaction costs associated with buying and selling securities, any mutual fund fees or expenses or any taxes. It is not possible to invest directly in an index.
For Class A shares, the maximum front-end sales charge is 4.50%. For Class B shares, the maximum contingent deferred sales charge is 5.00%. For Class C shares, the maximum contingent deferred sales charge is 1.00%. Performance including sales charge assumes the sales charge for the corresponding time period. Administrator Class and Institutional Class shares are sold without a front-end sales charge or contingent deferred sales charge.
Bond fund values fluctuate in response to the financial condition of individual issuers, general market and economic conditions, and changes in interest rates. In general, when interest rates rise, bond fund values fall and investors may lose principal value. Foreign investments are especially volatile and can rise or fall dramatically due to differences in the political and economic conditions of the host country. The use of derivatives may reduce returns and/or increase volatility. Certain investment strategies tend to increase the total risk of an investment (relative to the broader market). This Fund is exposed to active trading risk, high yield securities risk, mortgage- and asset-backed securities risk, and regional risk. Consult the Fund’s prospectus for additional information on these and other risks.
| 3. | Historical performance shown for Classes A, B, C and Administrator Class shares prior to their inception reflects the performance of the Institutional Class shares, adjusted to reflect the higher expenses applicable to Classes A, B, C and Administrator Class shares. Historical performance shown for all classes of the Fund prior to July 12, 2010 is based on the performance of the Fund’s predecessor, Evergreen International Bond Fund. |
| 4. | Reflects the expense ratios as stated in the most recent prospectuses. |
| 5. | The Adviser has committed through July 11, 2013 to waive fees and/or reimburse expenses to the extent necessary to cap the Fund’s Total Annual Fund Operating Expenses After Fee Waiver, excluding certain expenses, at the amount shown above. Without this cap, the Fund’s returns would have been lower. |
| 6. | The BofA Merrill Lynch Global Broad Market Ex. U.S. Index tracks the performance of investment grade debt publicly issued in the major domestic and eurobond markets, including sovereign, quasi-government, corporate, securitized and collateralized securities and excludes all securities denominated in US dollars. You cannot invest directly in an index. |
| | | | | | |
| Fund Expenses | | Wells Fargo Advantage International Bond Fund | | | 7 | |
As a shareholder of the Fund, you incur two types of costs: (1) transaction costs, including sales charges (loads) on purchase payments, redemption fees (if any) and exchange fees (if any); and (2) ongoing costs, including management fees; distribution (12b-1) and/or shareholder service fees; and other Fund expenses. This example is in tended to help you understand your ongoing costs (in dollars) of investing in the Fund and to compare these costs with the ongoing costs of investing in other mutual funds.
The example is based on an investment of $1,000 invested at the beginning of the six-month period and held for the entire period from November 1, 2010 to April 30, 2011.
Actual Expenses
The “Actual” line of the table below provides in formation about actual account values and actual expenses. You may use the information in this line, together with the amount you invested, to estimate the expenses that you paid over the period. Simply divide your account value by $1,000 (for example, an $8,600 account value divided by $1,000 = 8.6), then multiply the result by the number in the “Actual” line under the heading entitled “Expenses Paid During Period” for your applicable class of shares to estimate the expenses you paid on your account during this period.
Hypothetic al Example for Comparison Purposes
The “Hypothetical” line of the table below provides in formation about hypothetical account values and hypothetical expenses based on the Fund’s actual expense ratio and an assumed rate of return of 5% per year before expenses, which is not the Fund’s actual return. The hypothetical account values and expenses may not be used to estimate the actual ending account balance or expenses you paid for the period. You may use this information to compare the ongoing costs of investing in the Fund and other funds. To do so, compare this 5% hypothetical example with the 5% hypothetical examples that appear in the shareholder reports of the other funds.
Please note that the expenses shown in the table are meant to highlight your ongoing costs only and do not reflect any transactional costs, such as sales charges (loads), redemption fees, or exchange fees. Therefore, the “Hypothetical” line of the table is useful in comparing ongoing costs only, and will not help you determine the relative total costs of owning different funds. In addition, if these transactional costs were included, your costs would have been higher.
| | | | | | | | | | | | | | | | |
| | | Beginning
Account Value
11-01-2010 | | | Ending
Account Value
04-30-2011 | | | Expenses
Paid During
the Period1 | | | Net Annual
Expense Ratio | |
Class A | | | | | | | | | | | | | | | | |
Actual | | $ | 1,000.00 | | | $ | 1,017.62 | | | $ | 5.10 | | | | 1.02 | % |
Hypothetical | | $ | 1,000.00 | | | $ | 1,019.74 | | | $ | 5.11 | | | | 1.02 | % |
Class B | | | | | | | | | | | | | | | | |
Actual | | $ | 1,000.00 | | | $ | 1,013.63 | | | $ | 8.84 | | | | 1.77 | % |
Hypothetical | | $ | 1,000.00 | | | $ | 1,016.02 | | | $ | 8.85 | | | | 1.77 | % |
Class C | | | | | | | | | | | | | | | | |
Actual | | $ | 1,000.00 | | | $ | 1,013.61 | | | $ | 8.84 | | | | 1.77 | % |
Hypothetical | | $ | 1,000.00 | | | $ | 1,016.02 | | | $ | 8.85 | | | | 1.77 | % |
Administrator Class | | | | | | | | | | | | | | | | |
Actual | | $ | 1,000.00 | | | $ | 1,018.26 | | | $ | 4.25 | | | | 0.85 | % |
Hypothetical | | $ | 1,000.00 | | | $ | 1,020.58 | | | $ | 4.26 | | | | 0.85 | % |
Institutional Class | | | | | | | | | | | | | | | | |
Actual | | $ | 1,000.00 | | | $ | 1,018.58 | | | $ | 3.50 | | | | 0.70 | % |
Hypothetical | | $ | 1,000.00 | | | $ | 1,021.32 | | | $ | 3.51 | | | | 0.70 | % |
| 1. | Expenses paid is equal to each class’ annualized expense ratio multiplied by the average account value over the period, multiplied by the number of days in the most recent six-month period divided by 365 (to reflect the one-half year period). |
| | | | |
| 8 | | Wells Fargo Advantage International Bond Fund | | Portfolio of Investments—April 30, 2011 (Unaudited) |
| | | | | | | | | | | | | | | | |
| Security Name | | Interest Rate | | | Maturity Date | | | Principal | | | Value | |
| | | | | | | | | | | | | | | | |
| | | | |
Corporate Bonds and Notes: 0.77% | | | | | | | | | | | | | | | | |
| | | | |
| United States: 0.77% | | | | | | | | | | | | | | | | |
Anheuser-Busch In Bev Worldwide Incorporated (Consumer Staples, Beverages) | | | 6.88 | % | | | 11/15/2019 | | | $ | 9,525,000 | | | $ | 11,479,949 | |
ARAMARK Corporation (Industrials, Commercial Services & Supplies) | | | 8.50 | | | | 02/01/2015 | | | | 1,850,000 | | | | 1,930,938 | |
TNK-BP Finance SA (Financials, Diversified Financial Services)††(i) | | | 6.25 | | | | 02/02/2015 | | | | 200,000 | | | | 214,880 | |
| | | | |
Total Corporate Bonds and Notes (Cost $11,473,081) | | | | | | | | | | | | | | | 13,625,767 | |
| | | | | | | | | | | | | | | | |
| | | | |
Foreign Corporate Bonds@: 35.99% | | | | | | | | | | | | | | | | |
| | | | |
| Australia: 0.65% | | | | | | | | | | | | | | | | |
General Electric Capital Australia Funding (Financials, Diversified Financial Services, AUD) | | | 6.00 | | | | 03/15/2019 | | | | 1,405,000 | | | | 1,437,684 | |
International Bank for Reconstruction & Development (Financials, Commercial Banks, AUD) | | | 5.75 | | | | 10/01/2020 | | | | 4,000,000 | | | | 4,248,964 | |
Telstra Corporation Limited (Telecommunication Services, Diversified Telecommunication Services, EUR) | | | 4.25 | | | | 03/23/2020 | | | | 4,000,000 | | | | 5,914,997 | |
| | | | |
| | | | | | | | | | | | | | | 11,601,645 | |
| | | | | | | | | | | | | | | | |
| | | | |
| Brazil: 0.01% | | | | | | | | | | | | | | | | |
Banco Do Brasil (Financials, Commercial Banks, EUR)†† | | | 4.50 | | | | 01/20/2016 | | | | 150,000 | | | | 220,129 | |
| | | | | | | | | | | | | | | | |
| | | | |
| Canada: 0.18% | | | | | | | | | | | | | | | | |
Bombardier Incorporated (Industrials, Aerospace & Defense, EUR) | | | 7.25 | | | | 11/15/2016 | | | | 2,035,000 | | | | 3,149,777 | |
| | | | | | | | | | | | | | | | |
| | | | |
| Cayman Islands: 0.01% | | | | | | | | | | | | | | | | |
Voto-Votorantim Limited (Financials, Diversified Financial Services, EUR) | | | 5.25 | | | | 04/28/2017 | | | | 150,000 | | | | 221,506 | |
| | | | | | | | | | | | | | | | |
| | | | |
| Denmark: 4.54% | | | | | | | | | | | | | | | | |
Nykredit (Financials, Diversified Financial Services, DKK) | | | 4.00 | | | | 10/01/2041 | | | | 235,061,129 | | | | 43,183,163 | |
Realkredit Denmark (Financials, Thrifts & Mortgage Finance, DKK) | | | 4.00 | | | | 10/01/2041 | | | | 205,184,269 | | | | 37,623,161 | |
| | | | |
| | | | | | | | | | | | | | | 80,806,324 | |
| | | | | | | | | | | | | | | | |
| | | | |
| France: 1.37% | | | | | | | | | | | | | | | | |
Casino Guichard Perrach (Consumer Staples, Food & Staples Retailing, EUR) | | | 4.38 | | | | 02/08/2017 | | | | 5,000,000 | | | | 7,463,915 | |
France Telecom (Telecommunication Services, Diversified Telecommunication Services, EUR) | | | 4.75 | | | | 02/21/2017 | | | | 3,500,000 | | | | 5,477,338 | |
Veolia Environnement SA (Utilities, Multi-Utilities, EUR) | | | 4.00 | | | | 02/12/2016 | | | | 2,500,000 | | | | 3,772,212 | |
Veolia Environnement SA (Utilities, Multi-Utilities, EUR) | | | 4.38 | | | | 01/16/2017 | | | | 5,000,000 | | | | 7,607,565 | |
| | | | |
| | | | | | | | | | | | | | | 24,321,030 | |
| | | | | | | | | | | | | | | | |
| | | | |
| Germany: 10.83% | | | | | | | | | | | | | | | | |
Bayerische Landesbank (Financials, Commercial Banks, EUR)%% | | | 1.88 | | | | 06/30/2014 | | | | 15,000,000 | | | | 21,677,040 | |
Dexia Kommunalbank AG (Financials, Commercial Banks, EUR) | | | 3.50 | | | | 06/05/2014 | | | | 31,080,000 | | | | 46,811,755 | |
Eurohypo AG (Financials, Commercial Banks, EUR) | | | 3.75 | | | | 03/24/2014 | | | | 31,080,000 | | | | 47,142,234 | |
KfW Bankengruppe (Financials, Commercial Banks, AUD) | | | 6.25 | | | | 12/04/2019 | | | | 7,700,000 | | | | 8,392,997 | |
Kreditanstalt fur Wiederaufbau (Financials, Commercial Banks, EUR) | | | 3.88 | | | | 01/21/2019 | | | | 4,750,000 | | | | 7,216,099 | |
Kreditanstalt fur Wiederaufbau (Financials, Commercial Banks, EUR) | | | 4.38 | | | | 07/04/2018 | | | | 13,250,000 | | | | 20,807,405 | |
Landwirtschaftliche Rentenbank (Financials, Commercial Banks, AUD) | | | 5.75 | | | | 01/21/2015 | | | | 13,912,000 | | | | 15,179,263 | |
LB Baden-Wuerttemberg (Financials, Commercial Banks, EUR)%% | | | 1.75 | | | | 01/17/2014 | | | | 15,000,000 | | | | 21,758,088 | |
| | | | | | |
| Portfolio of Investments—April 30, 2011 (Unaudited) | | Wells Fargo Advantage International Bond Fund | | | 9 | |
| | | | | | | | | | | | | | | | |
| Security Name | | Interest Rate | | | Maturity Date | | | Principal | | | Value | |
| | | | | | | | | | | | | | | | |
| | | |
| Germany (continued) | | | | | | | | | | | | | |
UPC Holdings BV (Consumer Discretionary, Media, EUR) | | | 9.63 | % | | | 12/01/2019 | | | | 2,400,000 | | | $ | 3,883,576 | |
| | | | |
| | | | | | | | | | | | | | | 192,868,457 | |
| | | | | | | | | | | | | | | | |
| | | | |
| Ireland: 0.57% | | | | | | | | | | | | | | | | |
Ardagh Glass Finance plc (Financials, Consumer Finance, EUR) | | | 8.75 | | | | 02/01/2020 | | | | 3,100,000 | | | | 4,763,749 | |
Smurfit Kappa Acquisitions (Materials, Paper & Forest Products, EUR) | | | 7.75 | | | | 11/15/2019 | | | | 800,000 | | | | 1,244,166 | |
Smurfit Kappa Funding plc (Materials, Paper & Forest Products, EUR) | | | 7.25 | | | | 11/15/2017 | | | | 2,650,000 | | | | 4,082,050 | |
| | | | |
| | | | | | | | | | | | | | | 10,089,965 | |
| | | | | | | | | | | | | | | | |
| | | | |
| Liberia: 0.07% | | | | | | | | | | | | | | | | |
Royal Caribbean Cruises Limited (Consumer Discretionary, Hotels, Restaurants & Leisure, EUR) | | | 5.63 | | | | 01/27/2014 | | | | 900,000 | | | | 1,333,035 | |
| | | | | | | | | | | | | | | | |
| | | | |
| Luxembourg: 4.59% | | | | | | | | | | | | | | | | |
European Investment Bank (Financials, Commercial Banks, EUR) | | | 3.13 | | | | 03/03/2017 | | | | 12,350,000 | | | | 18,177,238 | |
European Investment Bank (Financials, Commercial Banks, EUR) | | | 4.25 | | | | 10/15/2014 | | | | 4,640,000 | | | | 7,234,245 | |
European Investment Bank (Financials, Commercial Banks, EUR) | | | 4.75 | | | | 10/15/2017 | | | | 10,000,000 | | | | 16,002,272 | |
European Investment Bank (Financials, Commercial Banks, NZD) | | | 6.50 | | | | 09/10/2014 | | | | 11,189,000 | | | | 9,591,018 | |
European Investment Bank (Financials, Commercial Banks, AUD) | | | 6.50 | | | | 08/07/2019 | | | | 20,400,000 | | | | 22,540,743 | |
European Investment Bank (Financials, Commercial Banks, ZAR) | | | 9.00 | | | | 12/21/2018 | | | | 14,450,000 | | | | 2,244,658 | |
European Investment Bank (Financials, Commercial Banks, TRY) | | | 9.63 | | | | 04/01/2015 | | | | 1,050,000 | | | | 720,986 | |
European Investment Bank (Financials, Commercial Banks, TRY) | | | 10.00 | | | | 09/10/2013 | | | | 1,200,000 | | | | 823,905 | |
Fiat Industrial Finance SpA (Financials, Diversified Financial Services, EUR)%% | | | 6.25 | | | | 03/09/2018 | | | | 3,000,000 | | | | 4,449,227 | |
| | | | |
| | | | | | | | | | | | | | | 81,784,292 | |
| | | | | | | | | | | | | | | | |
| | | | |
| Netherlands: 3.14% | | | | | | | | | | | | | | | | |
Bank Nederlandse Gemeenten (Financials, Commercial Banks, EUR) | | | 2.63 | | | | 09/01/2020 | | | | 12,250,000 | | | | 16,447,980 | |
Heidelberg Cement AG (Materials, Construction Materials, EUR) | | | 8.50 | | | | 10/31/2019 | | | | 1,730,000 | | | | 2,889,094 | |
New World Resources NV (Materials, Metals & Mining, EUR) | | | 7.38 | | | | 05/15/2015 | | | | 2,765,000 | | | | 4,208,003 | |
Owens-Illinois European Group BV (Materials, Containers & Packaging, EUR) | | | 6.88 | | | | 03/31/2017 | | | | 2,296,000 | | | | 3,477,237 | |
Rabobank Nederland (Financials, Commercial Banks, EUR) | | | 4.13 | | | | 01/14/2020 | | | | 5,000,000 | | | | 7,283,697 | |
Rabobank Nederland (Financials, Commercial Banks, EUR) | | | 4.25 | | | | 01/16/2017 | | | | 5,541,000 | | | | 8,390,169 | |
Rabobank Nederland (Financials, Commercial Banks, NZD) | | | 5.25 | | | | 08/05/2014 | | | | 6,000,000 | | | | 4,926,764 | |
Rabobank Nederland (Financials, Commercial Banks, NZD) | | | 6.25 | | | | 07/10/2014 | | | | 4,361,000 | | | | 3,698,619 | |
Rabobank Nederland (Financials, Commercial Banks, TRY) | | | 9.50 | | | | 01/22/2014 | | | | 1,000,000 | | | | 683,958 | |
Ziggo Bond Company BV (Consumer Discretionary, Media, EUR)††(i) | | | 8.00 | | | | 05/15/2018 | | | | 2,500,000 | | | | 3,892,648 | |
| | | | |
| | | | | | | | | | | | | | | 55,898,169 | |
| | | | | | | | | | | | | | | | |
| | | | |
| South Africa: 0.15% | | | | | | | | | | | | | | | | |
Foodcorp Limited (Consumer Discretionary, Food & Staples Retailing, EUR)†† | | | 8.75 | | | | 03/01/2018 | | | | 100,000 | | | | 146,264 | |
Savcio Holdings Limited (Industrials, Machinery, EUR) | | | 8.00 | | | | 02/15/2013 | | | | 1,701,000 | | | | 2,506,839 | |
| | | | |
| | | | | | | | | | | | | | | 2,653,103 | |
| | | | | | | | | | | | | | | | |
| | | | |
| Spain: 0.27% | | | | | | | | | | | | | | | | |
Inaer Aviation Finance Limited (Financials, Diversified Financial Services, EUR)†† | | | 9.50 | | | | 08/01/2017 | | | | 3,200,000 | | | | 4,810,776 | |
| | | | | | | | | | | | | | | | |
| | | | |
| Switzerland: 1.29% | | | | | | | | | | | | | | | | |
Eurofima (Financials, Commercial Banks, AUD) | | | 6.25 | | | | 12/28/2018 | | | | 21,000,000 | | | | 22,932,944 | |
| | | | | | | | | | | | | | | | |
| | | | |
| 10 | | Wells Fargo Advantage International Bond Fund | | Portfolio of Investments—April 30, 2011 (Unaudited) |
| | | | | | | | | | | | | | | | |
| Security Name | | Interest Rate | | | Maturity Date | | | Principal | | | Value | |
| | | | | | | | | | | | | | | | |
| | | | |
| United Kingdom: 5.88% | | | | | | | | | | | | | | | | |
Bakkavor Finance 2 plc (Consumer Discretionary, Food Products, GBP)†† | | | 8.25 | % | | | 02/15/2018 | | | | 3,360,000 | | | $ | 5,303,576 | |
British American Tobacco plc (Consumer Staples, Tobacco, EUR) | | | 5.88 | | | | 03/12/2015 | | | | 8,175,000 | | | | 13,117,856 | |
Exova (Industrials, Professional Services, GBP)†† | | | 10.50 | | | | 10/15/2018 | | | | 1,900,000 | | | | 3,328,489 | |
Ford Credit Europe Bank plc (Financials, Commercial Banks, EUR) | | | 7.13 | | | | 01/15/2013 | | | | 1,750,000 | | | | 2,738,461 | |
Ford Credit Europe Bank plc (Financials, Commercial Banks, EUR) | | | 9.38 | | | | 01/17/2014 | | | | 800,000 | | | | 1,333,035 | |
GlaxoSmithKline plc (Health Care, Pharmaceuticals, EUR) | | | 5.63 | | | | 12/13/2017 | | | | 8,000,000 | | | | 13,202,878 | |
Imperial Tobacco Group plc (Consumer Staples, Tobacco, EUR) | | | 7.25 | | | | 09/15/2014 | | | | 1,450,000 | | | | 2,394,102 | |
Imperial Tobacco Group plc (Consumer Staples, Tobacco, EUR) | | | 8.38 | | | | 02/17/2016 | | | | 5,000,000 | | | | 8,782,717 | |
Infinis plc (Utilities, Independent Power Producers & Energy Traders, GBP) | | | 9.13 | | | | 12/15/2014 | | | | 2,172,000 | | | | 3,791,260 | |
ISS Financing plc (Financials, Consumer Finance, EUR) | | | 11.00 | | | | 06/15/2014 | | | | 2,250,000 | | | | 3,632,521 | |
JTI UK Finance plc (Financials, Consumer Finance, EUR) | | | 4.50 | | | | 04/02/2014 | | | | 2,780,000 | | | | 4,309,568 | |
Kerling plc (Materials, Chemicals, EUR) | | | 10.63 | | | | 02/01/2017 | | | | 3,150,000 | | | | 5,143,849 | |
Marks & Spencer Group plc (Consumer Discretionary, Multiline Retail, GBP) | | | 6.13 | | | | 12/02/2019 | | | | 4,000,000 | | | | 7,019,932 | |
Nationwide Building Society, FRN (Financials, Thrifts & Mortgage Finance, EUR)± | | | 3.75 | | | | 01/20/2015 | | | | 4,000,000 | | | | 5,804,005 | |
R&R Ice Cream plc (Consumer Staples, Food & Staples Retailing, EUR)††(i) | | | 8.38 | | | | 11/15/2017 | | | | 2,950,000 | | | | 4,314,776 | |
Tesco plc (Consumer Staples, Food & Staples Retailing, EUR) | | | 5.88 | | | | 09/12/2016 | | | | 5,350,000 | | | | 8,793,980 | |
Virgin Media Finance plc (Financials, Consumer Finance, GBP) | | | 8.88 | | | | 10/15/2019 | | | | 1,213,000 | | | | 2,289,532 | |
Vodafone Group (Telecommunication Services, Wireless Telecommunication Services, EUR) | | | 6.88 | | | | 12/04/2013 | | | | 3,440,000 | | | | 5,592,597 | |
William Hill plc (Consumer Discretionary, Hotels, Restaurants & Leisure, GBP) | | | 7.13 | | | | 11/11/2016 | | | | 2,250,000 | | | | 3,908,619 | |
| | | | |
| | | | | | | | | | | | | | | 104,801,753 | |
| | | | | | | | | | | | | | | | |
| | | | |
| United States: 2.44% | | | | | | | | | | | | | | | | |
General Electric Capital Corporation (Financial Services, Aerospace & Defense, NZD) | | | 7.63 | | | | 12/10/2014 | | | | 10,200,000 | | | | 8,908,970 | |
Iron Mountain Incorporated (Industrials, Commercial Services & Supplies, EUR) | | | 6.75 | | | | 10/15/2018 | | | | 4,020,000 | | | | 5,835,139 | |
Owens-Brockway Glass Containers Incorporated (Materials, Containers & Packaging, EUR) | | | 6.75 | | | | 12/01/2014 | | | | 376,000 | | | | 569,443 | |
Pfizer Incorporated (Health Care, Pharmaceuticals, EUR) | | | 4.75 | | | | 06/03/2016 | | | | 6,600,000 | | | | 10,337,922 | |
Procter & Gamble Company (Consumer Staples, Household Products, EUR) | | | 4.50 | | | | 05/12/2014 | | | | 9,000,000 | | | | 13,943,574 | |
Rockwood Specialties Group Incorporated (Materials, Chemicals, EUR) | | | 7.63 | | | | 11/15/2014 | | | | 2,600,000 | | | | 3,928,010 | |
| | | | |
| | | | | | | | | | | | | | | 43,523,058 | |
| | | | | | | | | | | | | | | | |
| | | | |
Total Foreign Corporate Bonds (Cost $580,485,222) | | | | | | | | | | | | | | | 641,015,963 | |
| | | | | | | | | | | | | | | | |
| | | | |
| Foreign Government Bonds and Notes@: 55.30% | | | | | | | | | | | | | | | | |
Australia Series 124 (AUD) | | | 5.75 | | | | 05/15/2021 | | | | 25,000,000 | | | | 28,052,198 | |
Australia Series 19 (AUD) | | | 6.00 | | | | 04/01/2019 | | | | 13,950,000 | | | | 15,574,074 | |
Australia Series 25CI (AUD) | | | 3.14 | | | | 09/20/2025 | | | | 41,985,000 | | | | 50,825,115 | |
Brazil (BRL) | | | 10.25 | | | | 01/10/2028 | | | | 4,520,000 | | | | 3,072,807 | |
Brazil (BRL) | | | 12.50 | | | | 01/05/2016 | | | | 16,300,000 | | | | 12,049,898 | |
Brazil (BRL) | | | 12.50 | | | | 01/05/2022 | | | | 34,700,000 | | | | 26,710,971 | |
Caisse d’Amortissement de la Dette Sociale (EUR) | | | 3.38 | | | | 04/25/2021 | | | | 8,175,000 | | | | 11,717,543 | |
Caisse d’Amortissement de la Dette Sociale (EUR) | | | 4.13 | | | | 04/25/2017 | | | | 10,735,000 | | | | 16,584,998 | |
Canada (CAD) | | | 2.50 | | | | 09/01/2013 | | | | 47,000,000 | | | | 50,370,449 | |
Canada (NZD) | | | 6.25 | | | | 06/16/2015 | | | | 18,150,000 | | | | 15,413,029 | |
Canada Series 23 (CAD)†† | | | 4.10 | | | | 12/15/2018 | | | | 29,700,000 | | | | 33,054,375 | |
Czech Republic (CZK) | | | 5.00 | | | | 04/11/2019 | | | | 756,600,000 | | | | 49,998,792 | |
France (EUR) | | | 3.50 | | | | 04/25/2020 | | | | 19,000,000 | | | | 28,178,437 | |
France Obligations Assimilables du Tresor (EUR) | | | 3.75 | | | | 04/25/2017 | | | | 10,400,000 | | | | 15,961,585 | |
French Treasury Note (EUR) | | | 2.00 | | | | 07/12/2015 | | | | 10,400,000 | | | | 14,967,259 | |
| | | | | | |
| Portfolio of Investments—April 30, 2011 (Unaudited) | | Wells Fargo Advantage International Bond Fund | | | 11 | |
| | | | | | | | | | | | | | | | |
| Security Name | | Interest Rate | | | Maturity Date | | | Principal | | | Value | |
| | | | | | | | | | | | | | | | |
| | | | |
| Foreign Government Bonds and Notes@ (continued) | | | | | | | | | | | | | | | | |
Germany (EUR) | | | 1.75 | % | | | 10/09/2015 | | | | 8,250,000 | | | $ | 11,853,515 | |
Germany (EUR) | | | 2.25 | | | | 04/11/2014 | | | | 27,800,000 | | | | 41,425,500 | |
Germany (EUR) | | | 4.25 | | | | 07/04/2017 | | | | 13,280,000 | | | | 21,231,446 | |
Hungary (HUF) | | | 5.50 | | | | 02/12/2016 | | | | 7,257,000,000 | | | | 38,628,656 | |
Hungary (HUF) | | | 6.75 | | | | 02/24/2017 | | | | 2,652,500,000 | | | | 14,798,520 | |
Indonesia (IDR) | | | 10.00 | | | | 07/15/2017 | | | | 13,050,000,000 | | | | 1,737,259 | |
Korea (KRW) | | | 5.25 | | | | 09/10/2015 | | | | 11,400,000,000 | | | | 11,156,660 | |
Korea (KRW) | | | 5.25 | | | | 03/10/2027 | | | | 33,590,000,000 | | | | 33,530,289 | |
Malaysia (MYR) | | | 3.50 | | | | 05/31/2027 | | | | 4,350,000 | | | | 1,318,317 | |
Mexico (MXN) | | | 8.50 | | | | 11/18/2038 | | | | 530,400,000 | | | | 47,935,089 | |
Mexico (MXN) | | | 10.00 | | | | 12/05/2024 | | | | 27,720,000 | | | | 2,917,033 | |
Morocco (EUR) | | | 5.38 | | | | 06/27/2017 | | | | 245,000 | | | | 360,378 | |
New Zealand (NZD) | | | 6.00 | | | | 12/15/2017 | | | | 46,290,000 | | | | 39,408,864 | |
Norway (NOK) | | | 3.75 | | | | 05/25/2021 | | | | 180,000,000 | | | | 34,464,648 | |
Norway (NOK) | | | 4.25 | | | | 05/19/2017 | | | | 100,790,000 | | | | 20,155,118 | |
Norway (NOK) | | | 5.00 | | | | 05/15/2015 | | | | 104,100,000 | | | | 21,335,599 | |
Philippines (EUR) | | | 6.25 | | | | 03/15/2016 | | | | 750,000 | | | | 1,195,621 | |
Poland (PLN) | | | 5.50 | | | | 04/25/2015 | | | | 123,195,000 | | | | 46,182,881 | |
Portuguese OTs (EUR) | | | 6.40 | | | | 02/15/2016 | | | | 14,450,000 | | | | 17,469,332 | |
Republic of Peru (PEN) | | | 8.20 | | | | 08/12/2026 | | | | 1,600,000 | | | | 600,432 | |
Slovenia (EUR) | | | 4.38 | | | | 02/06/2019 | | | | 12,575,000 | | | | 18,621,365 | |
South Africa (ZAR) | | | 6.75 | | | | 03/31/2021 | | | | 222,905,000 | | | | 30,136,654 | |
Spain (EUR) | | | 4.85 | | | | 10/31/2020 | | | | 44,950,000 | | | | 64,340,688 | |
Sweden (SEK) | | | 4.50 | | | | 08/12/2015 | | | | 466,600,000 | | | | 82,038,882 | |
Turkey (EUR) | | | 5.50 | | | | 02/16/2017 | | | | 620,000 | | | | 952,750 | |
United Kingdom (GBP) | | | 4.75 | | | | 03/07/2020 | | | | 4,500,000 | | | | 8,293,788 | |
| | | | |
Total Foreign Government Bonds and Notes (Cost $893,429,089) | | | | | | | | | | | | | | | 984,620,814 | |
| | | | | | | | | | | | | | | | |
| | | | |
Yankee Corporate Bonds and Notes: 5.21% | | | | | | | | | | | | | | | | |
| | | | |
| Bermuda: 0.29% | | | | | | | | | | | | | | | | |
Qtel International Finance Limited (Telecommunication Services, Diversified Telecommunication Services) | | | 4.75 | | | | 02/16/2021 | | | $ | 5,550,000 | | | | 5,251,688 | |
| | | | | | | | | | | | | | | | |
| | | | |
| Brazil: 0.24% | | | | | | | | | | | | | | | | |
Banco Votorantim (Financials, Commercial Banks)†† | | | 5.25 | | | | 02/11/2016 | | | | 4,070,000 | | | | 4,110,700 | |
BM&F Bovespa SA (Financials, Diversified Financial Services) | | | 5.50 | | | | 07/16/2020 | | | | 200,000 | | | | 206,290 | |
| | | | |
| | | | | | | | | | | | | | | 4,316,990 | |
| | | | | | | | | | | | | | | | |
| | | | |
| Cayman Islands: 0.92% | | | | | | | | | | | | | | | | |
International Petroleum Investment Company (Energy, Oil, Gas & Consumable Fuels)†† | | | 5.00 | | | | 11/15/2020 | | | | 5,700,000 | | | | 5,678,625 | |
Petroplus Finance Limited (Financials, Consumer Finance) | | | 5.75 | | | | 01/20/2020 | | | | 10,185,000 | | | | 10,581,920 | |
| | | | |
| | | | | | | | | | | | | | | 16,260,545 | |
| | | | | | | | | | | | | | | | |
| | | | |
| Ireland: 0.19% | | | | | | | | | | | | | | | | |
VimpelCom Limited (Telecommunication Services, Diversified Telecommunication Services)†† | | | 7.75 | | | | 02/02/2021 | | | | 3,000,000 | | | | 3,165,000 | |
VimpelCom Limited (Telecommunication Services, Diversified Telecommunication Services) | | | 9.13 | | | | 04/30/2018 | | | | 120,000 | | | | 137,550 | |
| | | | |
| | | | | | | | | | | | | | | 3,302,550 | |
| | | | | | | | | | | | | | | | |
| | | | |
| 12 | | Wells Fargo Advantage International Bond Fund | | Portfolio of Investments—April 30, 2011 (Unaudited) |
| | | | | | | | | | | | | | | | |
| Security Name | | Interest Rate | | | Maturity Date | | | Principal | | | Value | |
| | | | | | | | | | | | | | | | |
| | | | |
| Kazakhstan: 0.03% | | | | | | | | | | | | | | | | |
Eurasian Development Bank (Financials, Commercial Banks)††(i) | | | 7.38 | % | | | 09/29/2014 | | | $ | 300,000 | | | $ | 330,000 | |
Kazatomprom (Materials, Metals & Mining)†† | | | 6.25 | | | | 05/20/2015 | | | | 200,000 | | | | 212,500 | |
| | | | |
| | | | | | | | | | | | | | | 542,500 | |
| | | | | | | | | | | | | | | | |
| | | | |
| Netherlands: 0.79% | | | | | | | | | | | | | | | | |
Deutsche Telekom (Telecommunication Services, Diversified Telecommunication Services) | | | 4.88 | | | | 07/08/2014 | | | | 10,000,000 | | | | 10,895,170 | |
Mubadala Development Company-Global Medium Term Note (Energy, Oil, Gas & Consumable Fuels)†† | | | 5.50 | | | | 04/20/2021 | | | | 3,200,000 | | | | 3,227,510 | |
| | | | |
| | | | | | | | | | | | | | | 14,122,680 | |
| | | | | | | | | | | | | | | | |
| | | | |
| Panama: 0.60% | | | | | | | | | | | | | | | | |
Banco De Credito Del Peru (Financials, Commercial Banks)†† | | | 4.75 | | | | 03/16/2016 | | | | 10,940,000 | | | | 10,611,800 | |
| | | | | | | | | | | | | | | | |
| | | | |
| South Africa: 0.32% | | | | | | | | | | | | | | | | |
Eskom Holdings Limited (Utilities, Electric Utilities)†† | | | 5.75 | | | | 01/26/2021 | | | | 225,000 | | | | 229,500 | |
Sable International Finance Limited (Telecommunication Services, Diversified Telecommunication Services) | | | 7.75 | | | | 02/15/2017 | | | | 2,795,000 | | | | 2,920,775 | |
Transnet Limited (Industrials, Transportation Infrastructure)†† | | | 4.50 | | | | 02/10/2016 | | | | 2,500,000 | | | | 2,559,620 | |
| | | | |
| | | | | | | | | | | | | | | 5,709,895 | |
| | | | | | | | | | | | | | | | |
| | | | |
| United Kingdom: 1.83% | | | | | | | | | | | | | | | | |
BP Capital Markets plc (Financials, Capital Markets) | | | 5.25 | | | | 11/07/2013 | | | | 7,500,000 | | | | 8,130,818 | |
Lloyds TSB Bank plc (Financials, Commercial Banks) | | | 6.38 | | | | 01/21/2021 | | | | 7,700,000 | | | | 8,250,712 | |
Marks & Spencer Group plc (Consumer Discretionary, Multiline Retail) | | | 6.25 | | | | 12/01/2017 | | | | 2,500,000 | | | | 2,687,693 | |
Royal Bank of Scotland plc (Financials, Commercial Banks) | | | 6.13 | | | | 01/11/2021 | | | | 7,700,000 | | | | 8,153,584 | |
Tesco plc (Consumer Staples, Food & Staples Retailing) | | | 5.50 | | | | 11/15/2017 | | | | 3,250,000 | | | | 3,669,851 | |
Virgin Media Finance plc (Financials, Consumer Finance) | | | 9.13 | | | | 08/15/2016 | | | | 1,591,000 | | | | 1,688,449 | |
| | | | |
| | | | | | | | | | | | | | | 32,581,107 | |
| | | | | | | | | | | | | | | | |
| | | | |
Total Yankee Corporate Bonds and Notes (Cost $88,827,436) | | | | | | | | | | | | | | | 92,699,755 | |
| | | | | | | | | | | | | | | | |
| | | | |
| Yankee Government Bonds: 0.47% | | | | | | | | | | | | | | | | |
Bahamas†† | | | 6.95 | | | | 11/20/2029 | | | | 400,000 | | | | 417,895 | |
Brazil | | | 7.13 | | | | 01/20/2037 | | | | 1,850,000 | | | | 2,220,000 | |
Colombia | | | 7.38 | | | | 03/18/2019 | | | | 850,000 | | | | 1,032,750 | |
Colombia | | | 8.13 | | | | 05/21/2024 | | | | 775,000 | | | | 998,975 | |
Croatia†† | | | 6.63 | | | | 07/14/2020 | | | | 500,000 | | | | 524,750 | |
Dominican Republic | | | 7.50 | | | | 05/06/2021 | | | | 250,000 | | | | 261,750 | |
Indonesia | | | 7.75 | | | | 01/17/2038 | | | | 250,000 | | | | 305,000 | |
Peru | | | 8.38 | | | | 05/03/2016 | | | | 196,000 | | | | 235,102 | |
Republic of Panama | | | 5.20 | | | | 01/30/2020 | | | | 600,000 | | | | 639,000 | |
Republic of Peru | | | 7.13 | | | | 03/30/2019 | | | | 165,000 | | | | 191,400 | |
Republic of Philippines | | | 5.50 | | | | 03/30/2026 | | | | 625,000 | | | | 622,656 | |
Russia, Step Bond | | | 7.50 | | | | 03/31/2030 | | | | 346,000 | | | | 403,308 | |
Sri Lanka†† | | | 7.40 | | | | 01/22/2015 | | | | 215,000 | | | | 234,887 | |
Vietnam††(i) | | | 6.75 | | | | 01/29/2020 | | | | 300,000 | | | | 313,500 | |
| | | | |
Total Yankee Government Bonds (Cost $7,675,828) | | | | | | | | | | | | | | | 8,400,973 | |
| | | | | | | | | | | | | | | | |
| | | | | | |
| Portfolio of Investments—April 30, 2011 (Unaudited) | | Wells Fargo Advantage International Bond Fund | | | 13 | |
| | | | | | | | | | | | | | | | |
| Security Name | | Yield | | | | | | Shares | | | Value | |
| | | | | | | | | | | | | | | | |
| | | | |
Short-Term Investments: 3.86% | | | | | | | | | | | | | | | | |
| | | | |
| Investment Companies: 3.86% | | | | | | | | | | | | | | | | |
Wells Fargo Advantage Cash Investment Money Market Fund(l)(u)(o) | | | 0.09 | % | | | | | | | 68,737,877 | | | $ | 68,737,877 | |
| | | | |
Total Short-Term Investments (Cost $68,737,877) | | | | | | | | | | | | | | | 68,737,877 | |
| | | | | | | | | | | | | | | | |
| | | | | | | | |
| Total Investments in Securities | | | | | | | | |
| (Cost $1,650,628,533)* | | | 101.60 | % | | | 1,809,101,149 | |
Other Assets and Liabilities, Net | | | (1.60 | ) | | | (28,509,797 | ) |
| | | | | | | | |
| Total Net Assets | | | 100.00 | % | | $ | 1,780,591,352 | |
| | | | | | | | |
| †† | Securities that may be resold to “qualified institutional buyers” under Rule 144A or securities offered pursuant to Section 4(2) of the Securities Act of 1933, as amended. |
| ± | Variable rate investments. |
| @ | Foreign bond principal is denominated in local currency. |
| (l) | Investment in an affiliate. |
| %% | Securities issued on a when-issued (TBA) and/or delayed delivery basis. |
| (u) | Rate shown is the 7-day annualized yield at period end. |
| (o) | All or a portion of this security has been segregated for when-issued and/or delayed delivery securities. |
| * | Cost for federal income tax purposes is $1,650,840,841 and net unrealized appreciation (depreciation) consists of: |
| | | | |
Gross unrealized appreciation | | $ | 162,099,573 | |
Gross unrealized depreciation | | | (3,839,265 | ) |
| | | | |
Net unrealized appreciation | | $ | 158,260,308 | |
The accompanying notes are an integral part of these financial statements.
| | | | |
| 14 | | Wells Fargo Advantage International Bond Fund | | Statement of Assets and Liabilities—April 30, 2011 (Unaudited) |
| | | | |
| | | | |
| |
Assets | | | | |
Investments | | | | |
In unaffiliated securities, at value | | $ | 1,740,363,272 | |
In affiliated securities, at value | | | 68,737,877 | |
| | | | |
Total investments, at value (see cost below) | | | 1,809,101,149 | |
Foreign currency, at value (see cost below) | | | 10,168,008 | |
Receivable for investments sold | | | 1,143,726 | |
Receivable for Fund shares sold | | | 8,465,624 | |
Receivable for interest | | | 29,884,962 | |
Unrealized gains on forward foreign currency contracts | | | 12,941,492 | |
Prepaid expenses and other assets | | | 188,038 | |
| | | | |
Total assets | | | 1,871,892,999 | |
| | | | |
| |
Liabilities | | | | |
Payable for investments purchased | | | 49,350,426 | |
Payable for Fund shares redeemed | | | 2,307,300 | |
Unrealized losses on forward foreign currency contracts | | | 38,192,099 | |
Advisory fee payable | | | 777,176 | |
Distribution fees payable | | | 21,806 | |
Due to other related parties | | | 215,509 | |
Accrued expenses and other liabilities | | | 437,331 | |
| | | | |
Total liabilities | | | 91,301,647 | |
| | | | |
Total net assets | | $ | 1,780,591,352 | |
| | | | |
| |
NET ASSETS CONSIST OF | | | | |
Paid-in capital | | $ | 1,656,426,512 | |
Undistributed net investment income | | | 5,743,997 | |
Accumulated net realized losses on investments | | | (16,517,355 | ) |
Net unrealized gains on investments | | | 134,938,198 | |
| | | | |
Total net assets | | $ | 1,780,591,352 | |
| | | | |
| |
COMPUTATION OF NET ASSET VALUE AND OFFERING PRICE PER SHARE1 | | | | |
Net assets – Class A | | $ | 275,627,042 | |
Shares outstanding – Class A | | | 22,872,039 | |
Net asset value per share – Class A | | $ | 12.05 | |
Maximum offering price per share – Class A2 | | $ | 12.62 | |
Net assets – Class B | | $ | 8,762,938 | |
Shares outstanding – Class B | | | 725,983 | |
Net asset value per share – Class B | | $ | 12.07 | |
Net assets – Class C | | $ | 24,917,168 | |
Shares outstanding – Class C | | | 2,073,159 | |
Net asset value per share – Class C | | $ | 12.02 | |
Net assets – Administrator Class | | $ | 27,526,873 | |
Shares outstanding – Administrator Class | | | 2,286,249 | |
Net asset value per share – Administrator Class | | $ | 12.04 | |
Net assets – Institutional Class | | $ | 1,443,757,331 | |
Shares outstanding – Institutional Class | | | 119,881,969 | |
Net asset value per share – Institutional Class | | $ | 12.04 | |
| | | | |
| | | | |
Total investments, at cost | | $ | 1,650,628,533 | |
| | | | |
Foreign currency, at cost | | $ | 9,786,746 | |
| | | | |
| 1. | The Fund has an unlimited number of authorized shares. |
| 2. | Maximum offering price is computed as 100/95.50 of net asset value. On investments of $50,000 or more, the offering price is reduced. |
The accompanying notes are an integral part of these financial statements.
| | | | | | |
| Statement of Operations—Six Months Ended April 30, 2011 (Unaudited) | | Wells Fargo Advantage International Bond Fund | | | 15 | |
| | | | |
| | | | |
| |
Investment income | | | | |
Interest* | | $ | 35,972,107 | |
Income from affiliated securities | | | 32,149 | |
| | | | |
Total investment income | | | 36,004,256 | |
| | | | |
| |
Expenses | | | | |
Advisory fee | | | 4,190,929 | |
Administration fees | | | | |
Fund level | | | 400,394 | |
Class A | | | 197,110 | |
Class B | | | 7,154 | |
Class C | | | 21,328 | |
Administrator Class | | | 8,781 | |
Institutional Class | | | 520,811 | |
Shareholder servicing fees | | | | |
Class A | | | 306,278 | |
Class B | | | 11,179 | |
Class C | | | 33,326 | |
Administrator Class | | | 19,868 | |
Distribution fees | | | | |
Class B | | | 33,536 | |
Class C | | | 99,977 | |
Custody and accounting fees | | | 190,931 | |
Professional fees | | | 22,837 | |
Registration fees | | | 52,966 | |
Shareholder report expenses | | | 65,371 | |
Trustees’ fees and expenses | | | 5,984 | |
Other fees and expenses | | | 1,198 | |
| | | | |
Total expenses | | | 6,189,958 | |
Less: Fee waivers and/or expense reimbursements | | | (12,062 | ) |
| | | | |
Net expenses | | | 6,177,896 | |
| | | | |
Net investment income | | | 29,826,360 | |
| | | | |
| |
REALIZED AND UNREALIZED GAINS (LOSSES) ON INVESTMENTS | | | | |
| |
Net realized gains (losses) on: | | | | |
Unaffiliated securities | | | (24,210,819 | ) |
Forward foreign currency contract transactions | | | 9,091,696 | |
| | | | |
Net realized losses on investments | | | (15,119,123 | ) |
| | | | |
| |
Net change in unrealized gains (losses) on: | | | | |
Unaffiliated securities | | | 49,638,252 | |
Forward foreign currency contract transactions | | | (27,216,458 | ) |
| | | | |
Net change in unrealized gains (losses) on investments | | | 22,421,794 | |
| | | | |
Net realized and unrealized gains (losses) on investments | | | 7,302,671 | |
| | | | |
Net increase in net assets resulting from operations | | $ | 37,129,031 | |
| | | | |
| |
* Net of foreign withholding taxes of | | | $325 | |
The accompanying notes are an integral part of these financial statements.
| | | | |
| 16 | | Wells Fargo Advantage International Bond Fund | | Statements of Changes in Net Assets |
| | | | | | | | | | | | | | | | |
| | | Six Months Ended
April 30, 2011
(Unaudited) | | | Year Ended
October 31, 20101 | |
| | | | |
Operations | | | | | | | | | | | | | | | | |
Net investment income | | | | | | $ | 29,826,360 | | | | | | | $ | 50,118,820 | |
Net realized gains (losses) on investments | | | | | | | (15,119,123 | ) | | | | | | | 33,374,365 | |
Net change in unrealized gains (losses) on investments | | | | | | | 22,421,794 | | | | | | | | 45,467,242 | |
| | | | | | | | | | | | | | | | |
Net increase in net assets resulting from operations | | | | | | | 37,129,031 | | | | | | | | 128,960,427 | |
| | | | | | | | | | | | | | | | |
| | | | |
Distributions to shareholders from | | | | | | | | | | | | | | | | |
Net investment income | | | | | | | | | | | | | | | | |
Class A | | | | | | | (6,192,594 | ) | | | | | | | (10,297,645 | ) |
Class B | | | | | | | (192,566 | ) | | | | | | | (225,571 | ) |
Class C | | | | | | | (574,938 | ) | | | | | | | (769,834 | ) |
Administrator Class | | | | | | | (486,444 | ) | | | | | | | (27,636 | )2 |
Institutional Class | | | | | | | (35,012,642 | ) | | | | | | | (39,498,213 | )3 |
Class IS | | | | | | | NA | | | | | | | | (120,983 | )4 |
Net realized gains | | | | | | | | | | | | | | | | |
Class A | | | | | | | (1,598,161 | ) | | | | | | | 0 | |
Class B | | | | | | | (60,416 | ) | | | | | | | 0 | |
Class C | | | | | | | (191,188 | ) | | | | | | | 0 | |
Administrator Class | | | | | | | (105,788 | ) | | | | | | | 0 | 2 |
Institutional Class | | | | | | | (8,219,774 | ) | | | | | | | 0 | 3 |
| | | | | | | | | | | | | | | | |
Total distributions to shareholders | | | | | | | (52,634,511 | ) | | | | | | | (50,939,882 | ) |
| | | | | | | | | | | | | | | | |
| | | | |
Capital share transactions | | | Shares | | | | | | | | Shares | | | | | |
Proceeds from shares sold | | | | | | | | | | | | | | | | |
Class A | | | 6,530,881 | | | | 75,663,877 | | | | 21,018,393 | | | | 239,477,394 | |
Class B | | | 23,328 | | | | 271,371 | | | | 97,238 | | | | 1,112,583 | |
Class C | | | 103,866 | | | | 1,199,593 | | | | 750,802 | | | | 8,632,783 | |
Administrator Class | | | 2,184,902 | | | | 25,370,418 | | | | 403,036 | 2 | | | 4,724,608 | 2 |
Institutional Class | | | 25,700,156 | | | | 297,469,992 | | | | 44,463,194 | 3 | | | 514,090,908 | 3 |
Class IS | | | NA | | | | NA | | | | 3,748 | 4 | | | 42,407 | 4 |
| | | | | | | | | | | | | | | | |
| | | | | | | 399,975,251 | | | | | | | | 768,080,683 | |
| | | | | | | | | | | | | | | | |
Reinvestment of distributions | | | | | | | | |
Class A | | | 611,732 | | | | 6,951,471 | | | | 786,024 | | | | 8,838,701 | |
Class B | | | 16,103 | | | | 183,619 | | | | 14,397 | | | | 162,008 | |
Class C | | | 41,391 | | | | 469,806 | | | | 40,113 | | | | 451,225 | |
Administrator Class | | | 21,638 | | | | 246,657 | | | | 55 | 2 | | | 656 | 2 |
Institutional Class | | | 1,846,555 | | | | 20,968,154 | | | | 1,813,472 | 3 | | | 20,557,478 | 3 |
Class IS | | | NA | | | | NA | | | | 6,808 | 4 | | | 76,222 | 4 |
| | | | | | | | | | | | | | | | |
| | | | | | | 28,819,707 | | | | | | | | 30,086,290 | |
| | | | | | | | | | | | | | | | |
Payment for shares redeemed | | | | | | | | |
Class A | | | (5,126,265 | ) | | | (59,027,318 | ) | | | (22,240,525 | ) | | | (254,648,040 | ) |
Class B | | | (134,441 | ) | | | (1,558,719 | ) | | | (297,508 | ) | | | (3,385,236 | ) |
Class C | | | (610,673 | ) | | | (7,015,923 | ) | | | (1,147,740 | ) | | | (12,953,242 | ) |
Administrator Class | | | (318,068 | ) | | | (3,647,084 | ) | | | (5,314 | )2 | | | (63,377 | )2 |
Institutional Class | | | (12,010,704 | ) | | | (138,666,173 | ) | | | (27,964,429 | )3 | | | (316,984,637 | )3 |
Class IS | | | NA | | | | NA | | | | (437,013 | )4 | | | (4,854,537 | )4 |
| | | | | | | | | | | | | | | | |
| | | | | | | (209,915,217 | ) | | | | | | | (592,889,069 | ) |
| | | | | | | | | | | | | | | | |
Net increase in net assets resulting
from capital share transactions | | | | | | | 218,879,741 | | | | | | | | 205,277,904 | |
| | | | | | | | | | | | | | | | |
Total increase in net assets | | | | | | | 203,374,261 | | | | | | | | 283,298,449 | |
| | | | | | | | | | | | | | | | |
Please see footnotes on page 17
The accompanying notes are an integral part of these financial statements.
| | | | | | |
| Statements of Changes in Net Assets | | Wells Fargo Advantage International Bond Fund | | | 17 | |
| | | | | | | | | | | | | | | | |
| | | Six Months Ended
April 30, 2011
(Unaudited) | | | Year Ended
October 31, 20101 | |
| | |
Net assets | | | | | | | | |
Beginning of period | | | | | | $ | 1,577,217,091 | | | | | | | $ | 1,293,918,642 | |
| | | | | | | | | | | | | | | | |
End of period | | | | | | $ | 1,780,591,352 | | | | | | | $ | 1,577,217,091 | |
| | | | | | | | | | | | | | | | |
Undistributed net investment income | | | | | | $ | 5,743,997 | | | | | | | $ | 18,376,821 | |
| | | | | | | | | | | | | | | | |
| 1. | After the close of business on July 9, 2010, the Fund acquired the net assets of Evergreen International Bond Fund, which became the accounting and performance survivor in the transaction. The information for the period prior to July 12, 2010 is that of Evergreen International Bond Fund. |
| 2. | Class commenced operations on July 30, 2010. |
| 3. | Class I shares of the predecessor fund became Institutional Class shares on July 12, 2010. |
| 4. | Class IS shares of the predecessor fund became Class A shares on July 12, 2010. |
The accompanying notes are an integral part of these financial statements.
| | | | |
| 18 | | Wells Fargo Advantage International Bond Fund1 | | Financial Highlights |
| | | | | | | | | | | | | | | | | | | | |
| | | Beginning
Net Asset
Value Per
Share | | | Net
Investment
Income | | | Net Realized
and Unrealized
Gains (Losses)
on Investments | | | Distributions
from Net
Investment
Income | | | Distributions
from Net
Realized Gains | |
Class A | | | | | | | | | | | | | | | | | | | | |
November 1, 2010 to April 30, 2011 (Unaudited) | | $ | 12.23 | | | | 0.20 | 3 | | | (0.01 | ) | | | (0.29 | ) | | | (0.08 | ) |
November 1, 2009 to October 31, 2010 | | $ | 11.59 | | | | 0.40 | | | | 0.65 | | | | (0.41 | ) | | | 0.00 | |
November 1, 2008 to October 31, 2009 | | $ | 10.36 | | | | 0.39 | 3 | | | 2.20 | | | | (1.36 | ) | | | 0.00 | |
November 1, 2007 to October 31, 2008 | | $ | 11.57 | | | | 0.47 | 3 | | | (0.92 | ) | | | (0.76 | ) | | | 0.00 | |
November 1, 2006 to October 31, 2007 | | $ | 10.54 | | | | 0.43 | 3 | | | 0.71 | | | | (0.11 | ) | | | 0.00 | |
November 1, 2005 to October 31, 2006 | | $ | 10.74 | | | | 0.39 | | | | (0.17 | ) | | | 0.00 | | | | (0.02 | ) |
Class B | | | | | | | | | | | | | | | | | | | | |
November 1, 2010 to April 30, 2011 (Unaudited) | | $ | 12.25 | | | | 0.16 | | | | (0.01 | ) | | | (0.25 | ) | | | (0.08 | ) |
November 1, 2009 to October 31, 2010 | | $ | 11.54 | | | | 0.29 | | | | 0.67 | | | | (0.25 | ) | | | 0.00 | |
November 1, 2008 to October 31, 2009 | | $ | 10.37 | | | | 0.30 | 3 | | | 2.21 | | | | (1.34 | ) | | | 0.00 | |
November 1, 2007 to October 31, 2008 | | $ | 11.58 | | | | 0.38 | 3 | | | (0.91 | ) | | | (0.68 | ) | | | 0.00 | |
November 1, 2006 to October 31, 2007 | | $ | 10.56 | | | | 0.35 | 3 | | | 0.70 | | | | (0.03 | ) | | | 0.00 | |
November 1, 2005 to October 31, 2006 | | $ | 10.75 | | | | 0.31 | 3 | | | (0.16 | ) | | | 0.00 | | | | (0.02 | ) |
Class C | | | | | | | | | | | | | | | | | | | | |
November 1, 2010 to April 30, 2011 (Unaudited) | | $ | 12.20 | | | | 0.16 | 3 | | | (0.01 | ) | | | (0.25 | ) | | | (0.08 | ) |
November 1, 2009 to October 31, 2010 | | $ | 11.51 | | | | 0.33 | | | | 0.64 | | | | (0.28 | ) | | | 0.00 | |
November 1, 2008 to October 31, 2009 | | $ | 10.35 | | | | 0.30 | 3 | | | 2.20 | | | | (1.34 | ) | | | 0.00 | |
November 1, 2007 to October 31, 2008 | | $ | 11.56 | | | | 0.38 | 3 | | | (0.91 | ) | | | (0.68 | ) | | | 0.00 | |
November 1, 2006 to October 31, 2007 | | $ | 10.53 | | | | 0.35 | 3 | | | 0.71 | | | | (0.03 | ) | | | 0.00 | |
November 1, 2005 to October 31, 2006 | | $ | 10.73 | | | | 0.31 | 3 | | | (0.17 | ) | | | 0.00 | | | | (0.02 | ) |
Administrator Class | | | | | | | | | | | | | | | | | | | | |
November 1, 2010 to April 30, 2011 (Unaudited) | | $ | 12.23 | | | | 0.21 | 3 | | | (0.01 | ) | | | (0.31 | ) | | | (0.08 | ) |
July 30, 20104 to October 31, 2010 | | $ | 11.39 | | | | 0.11 | | | | 0.82 | | | | (0.09 | ) | | | 0.00 | |
Institutional Class5 | | | | | | | | | | | | | | | | | | | | |
November 1, 2010 to April 30, 2011 (Unaudited) | | $ | 12.23 | | | | 0.21 | | | | (0.01 | ) | | | (0.31 | ) | | | (0.08 | ) |
November 1, 2009 to October 31, 2010 | | $ | 11.59 | | | | 0.44 | | | | 0.65 | | | | (0.45 | ) | | | 0.00 | |
November 1, 2008 to October 31, 2009 | | $ | 10.35 | | | | 0.43 | | | | 2.18 | | | | (1.37 | ) | | | 0.00 | |
November 1, 2007 to October 31, 2008 | | $ | 11.56 | | | | 0.50 | | | | (0.92 | ) | | | (0.79 | ) | | | 0.00 | |
November 1, 2006 to October 31, 2007 | | $ | 10.54 | | | | 0.47 | | | | 0.69 | | | | (0.14 | ) | | | 0.00 | |
November 1, 2005 to October 31, 2006 | | $ | 10.73 | | | | 0.42 | 3 | | | (0.16 | ) | | | 0.00 | | | | (0.02 | ) |
| 1. | After the close of business on July 9, 2010, the Fund acquired the net assets of Evergreen International Bond Fund which became the accounting and performance survivor in the transaction. The information for the periods prior to July 12, 2010 are those of Evergreen International Bond Fund. |
| 2. | Total return calculations do not include any sales charges. Returns for periods of less than one year are not annualized. |
| 3. | Calculated based upon average shares outstanding. |
| 4. | Class commenced operations on July 30, 2010. |
| 5. | Class I shares of the predecessor fund became Institutional Class shares on July 12, 2010. |
The accompanying notes are an integral part of these financial statements.
| | | | | | |
| Financial Highlights | | Wells Fargo Advantage International Bond Fund1 | | | 19 | |
| | | | | | | | | | | | | | | | | | | | | | | | | | | | | | |
Distributions
from Tax
Basis Return
of Capital | | | Ending
Net Asset
Value Per
Share | | | Ratio to Average Net Assets (Annualized) | | | | | | Portfolio
Turnover
Rate | | | Net Assets at
End of Period
(000’s omitted) | |
| | | Net Investment
Income | | | Gross
Expenses | | | Net
Expenses | | | Total
Return2 | | | |
| | | | | | | | | | | | | | | | | | | | | | | | | | | | | | |
| | 0.00 | | | $ | 12.05 | | | | 3.47 | % | | | 1.02 | % | | | 1.02 | % | | | 1.76 | % | | | 43 | % | | $ | 275,627 | |
| | 0.00 | | | $ | 12.23 | | | | 3.53 | % | | | 1.10 | % | | | 1.08 | % | | | 9.35 | % | | | 89 | % | | $ | 255,134 | |
| | 0.00 | | | $ | 11.59 | | | | 3.65 | % | | | 1.05 | % | | | 1.05 | % | | | 26.34 | % | | | 118 | % | | $ | 246,719 | |
| | 0.00 | | | $ | 10.36 | | | | 4.05 | % | | | 1.01 | % | | | 0.99 | % | | | (4.07 | )% | | | 87 | % | | $ | 66,649 | |
| | 0.00 | | | $ | 11.57 | | | | 4.01 | % | | | 1.05 | % | | | 1.00 | % | | | 10.90 | % | | | 106 | % | | $ | 49,993 | |
| | (0.40 | ) | | $ | 10.54 | | | | 3.70 | % | | | 1.11 | % | | | 1.09 | % | | | 2.06 | % | | | 196 | % | | $ | 90,166 | |
| | | | | | | | | | | | | | | | | | | | | | | | | | | | | | |
| | 0.00 | | | $ | 12.07 | | | | 2.71 | % | | | 1.78 | % | | | 1.77 | % | | | 1.36 | % | | | 43 | % | | $ | 8,763 | |
| | 0.00 | | | $ | 12.25 | | | | 2.77 | % | | | 1.85 | % | | | 1.82 | % | | | 8.55 | % | | | 89 | % | | $ | 10,060 | |
| | 0.00 | | | $ | 11.54 | | | | 2.86 | % | | | 1.79 | % | | | 1.79 | % | | | 25.44 | % | | | 118 | % | | $ | 11,615 | |
| | 0.00 | | | $ | 10.37 | | | | 3.30 | % | | | 1.74 | % | | | 1.74 | % | | | (4.74 | )% | | | 87 | % | | $ | 10,345 | |
| | 0.00 | | | $ | 11.58 | | | | 3.28 | % | | | 1.74 | % | | | 1.74 | % | | | 10.08 | % | | | 106 | % | | $ | 7,747 | |
| | (0.32 | ) | | $ | 10.56 | | | | 2.96 | % | | | 1.81 | % | | | 1.81 | % | | | 1.32 | % | | | 196 | % | | $ | 9,157 | |
| | | | | | | | | | | | | | | | | | | | | | | | | | | | | | |
| | 0.00 | | | $ | 12.02 | | | | 2.69 | % | | | 1.78 | % | | | 1.77 | % | | | 1.36 | % | | | 43 | % | | $ | 24,917 | |
| | 0.00 | | | $ | 12.20 | | | | 2.77 | % | | | 1.85 | % | | | 1.82 | % | | | 8.61 | % | | | 89 | % | | $ | 30,974 | |
| | 0.00 | | | $ | 11.51 | | | | 2.87 | % | | | 1.79 | % | | | 1.79 | % | | | 25.47 | % | | | 118 | % | | $ | 33,330 | |
| | 0.00 | | | $ | 10.35 | | | | 3.31 | % | | | 1.74 | % | | | 1.74 | % | | | (4.85 | )% | | | 87 | % | | $ | 18,044 | |
| | 0.00 | | | $ | 11.56 | | | | 3.27 | % | | | 1.74 | % | | | 1.74 | % | | | 10.09 | % | | | 106 | % | | $ | 19,983 | |
| | (0.32 | ) | | $ | 10.53 | | | | 2.96 | % | | | 1.81 | % | | | 1.81 | % | | | 1.31 | % | | | 196 | % | | $ | 26,057 | |
| | | | | | | | | | | | | | | | | | | | | | | | | | | | | | |
| | 0.00 | | | $ | 12.04 | | | | 3.70 | % | | | 0.94 | % | | | 0.85 | % | | | 1.83 | % | | | 43 | % | | $ | 27,527 | |
| | 0.00 | | | $ | 12.23 | | | | 3.63 | % | | | 1.05 | % | | | 0.85 | % | | | 8.21 | % | | | 89 | % | | $ | 4,866 | |
| | | | | | | | | | | | | | | | | | | | | | | | | | | | | | |
| | 0.00 | | | $ | 12.04 | | | | 3.80 | % | | | 0.70 | % | | | 0.70 | % | | | 1.86 | % | | | 43 | % | | $ | 1,443,757 | |
| | 0.00 | | | $ | 12.23 | | | | 3.79 | % | | | 0.82 | % | | | 0.80 | % | | | 9.73 | % | | | 89 | % | | $ | 1,276,184 | |
| | 0.00 | | | $ | 11.59 | | | | 3.86 | % | | | 0.79 | % | | | 0.79 | % | | | 26.71 | % | | | 118 | % | | $ | 997,308 | |
| | 0.00 | | | $ | 10.35 | | | | 4.31 | % | | | 0.73 | % | | | 0.73 | % | | | (3.88 | )% | | | 87 | % | | $ | 902,304 | |
| | 0.00 | | | $ | 11.56 | | | | 4.31 | % | | | 0.74 | % | | | 0.74 | % | | | 11.14 | % | | | 106 | % | | $ | 1,032,304 | |
| | (0.43 | ) | | $ | 10.54 | | | | 3.98 | % | | | 0.81 | % | | | 0.81 | % | | | 2.45 | % | | | 196 | % | | $ | 943,309 | |
| | | | |
| 20 | | Wells Fargo Advantage International Bond Fund | | Notes to Financial Statements (Unaudited) |
1. ORGANIZATION
Wells Fargo Funds Trust (the “Trust”), a Delaware statutory trust organized on March 10, 1999, is an open-end management investment company registered under the Investment Company Act of 1940, as amended (the “1940 Act”). These financial statements report on Wells Fargo Advantage International Bond Fund (the “Fund”) which is a diversified series of the Trust.
2. SIGNIFICANT ACCOUNTING POLICIES
The following significant accounting policies, which are consistently followed in the preparation of the financial statements of the Fund, are in conformity with U.S. generally accepted accounting principles which require management to make estimates and assumptions that affect the reported amounts of assets and liabilities, disclosure of contingent assets and liabilities at the date of the financial statements, and the reported amounts of revenues and expenses during the reporting period. Actual results could differ from those estimates.
Securities valuation
Certain fixed income securities with maturities exceeding 60 days are valued based on available market quotations received from an independent pricing service approved by the Trust’s Board of Trustees which may utilize both transaction data and market information such as yield, prices of securities of comparable quality, coupon rate, maturity, type of issue, trading characteristics and other market data. If valuations are not available from the pricing service or values received are deemed not representative of market value, values will be obtained from a third party broker-dealer or determined based on the Fund’s Fair Value Procedures.
Debt securities of sufficient credit quality with original maturities of 60 days or less generally are valued at amortized cost which approximates fair value. The amortized cost method involves valuing a security at its cost, plus accretion of discount or minus amortization of premium over the period until maturity.
Investments in open-end mutual funds and non-registered investment companies are generally valued at net asset value.
Certain investments which are not valued using any of the methods discussed above, are valued at their fair value, as determined by procedures established in good faith and approved by the Board of Trustees.
The valuation techniques used by the Fund to measure fair value are consistent with the market approach, income approach and/or cost approach, where applicable, for each security type.
Foreign currency translation
The accounting records of the Fund are maintained in U.S. dollars. Assets, including investment securities, and liabilities denominated in foreign currency are translated into U.S. dollars at the prevailing rates of exchange at the date of valuation. Purchases and sales of securities, and income and expenses are translated at the prevailing rate of exchange on the respective dates of such transactions. Reported net realized foreign exchange gains or losses arise from sales of foreign currencies, currency gains or losses realized between the trade and settlement dates on securities transactions, and the difference between the amounts of dividends, interest and foreign withholding taxes recorded and the U.S. dollar equivalent of the amounts actually paid or received. Net unrealized foreign exchange gains and losses arise from changes in the fair value of assets and liabilities other than investments in securities resulting in changes in exchange rates.
The changes in net assets arising from changes in exchange rates and the changes in net assets resulting from changes in market prices of securities are not separately presented. Such changes are recorded with net realized and unrealized gains or losses from investments. Gains and losses from certain foreign currency transactions are treated as ordinary income for U.S. federal income tax purposes.
Forward foreign currency contracts
The Fund may be subject to foreign currency exchange rate risk in the normal course of pursuing its investment objectives. A forward foreign currency contract is an agreement between two parties to purchase or sell a specific currency for an agreed-upon price at a future date. The Fund enters into forward foreign currency contracts to facilitate transactions in foreign-denominated securities and to attempt to minimize the risk to the Fund from adverse changes in the relationship between currencies. Forward foreign currency contracts are recorded at the forward rate and marked-to-market daily. When the contracts are closed, realized gains and losses arising from such transactions are
| | | | | | |
| Notes to Financial Statements (Unaudited) | | Wells Fargo Advantage International Bond Fund | | | 21 | |
recorded as realized gains or losses on foreign currency related transactions. The Fund could be exposed to risks if the counterparties to the contracts are unable to meet the terms of their contracts or if the value of the foreign currency changes unfavorably. The Fund’s maximum risk of loss from counterparty credit risk is the unrealized gains or losses on the contracts. This risk is mitigated by having a master netting arrangement between the Fund and the counterparty.
When-issued transactions
The Fund may purchase securities on a forward commitment or ‘when-issued’ basis. The Fund records a when-issued transaction on the trade date and will segregate assets to cover its obligation by confirming the availability of qualifying assets having a value sufficient to make payment for the securities purchased. Securities purchased on a when-issued basis are marked-to-market daily and the Fund begins earning interest on the settlement date. Losses may arise due to changes in the market value of the underlying securities or if the counterparty does not perform under the contract.
Security transactions and income recognition
Securities transactions are recorded on a trade date basis. Realized gains or losses are reported on the basis of identified cost of securities delivered.
Interest income is accrued daily and bond discounts are accreted and premiums are amortized daily based on the effective interest method. To the extent debt obligations are placed on non-accrual status, any related interest income may be reduced by writing off interest receivables when the collection of all or a portion of interest has become doubtful based on consistently applied procedures. If the issuer subsequently resumes interest payments or when the collectability of interest is reasonably assured, the debt obligation is removed from non-accrual status.
Distributions to shareholders
Distributions to shareholders from net investment income and net realized gains, if any, are recorded on the ex-dividend date. Such distributions are determined in conformity with income tax regulations, which may differ from generally accepted accounting principles.
Federal and other taxes
The Fund intends to continue to qualify as a regulated investment company by distributing substantially all of its investment company taxable income and any net realized capital gains (after reduction for capital loss carryforwards) sufficient to relieve it from all, or substantially all, federal income taxes. Accordingly, no provision for federal income taxes was required.
The Fund’s income and federal excise tax returns and all financial records supporting those returns for the prior three fiscal years are subject to examination by the federal and Delaware revenue authorities.
Under the recently enacted Regulated Investment Company Modernization Act of 2010, the Fund will be permitted to carry forward capital losses incurred in taxable years beginning after December 22, 2010 for an unlimited period. However, any losses incurred during those future taxable years will be required to be utilized prior to the losses incurred in pre-enactment taxable years. As a result of this ordering rule, pre-enactment capital loss carryforwards may be more likely to expire unused. Additionally, post-enactment capital losses that are carried forward will retain their character as either short-term or long-term capital losses rather than being considered all short-term as under previous law.
Class allocations
The separate classes of shares offered by the Fund differ principally in applicable sales charges, distribution, shareholder servicing and administration fees. Shareholders of each class bear certain expenses that pertain to that particular class. All shareholders bear the common expenses of the Fund, earn income from the portfolio, and are allocated unrealized gains and losses pro rata based on the average daily net assets of each class, without distinction between share classes. Dividends are determined separately for each class based on income and expenses allocable to each class. Realized gains and losses are allocated to each class pro rata based upon the net assets of each class on the date realized. Differences in per share dividend rates generally result from the relative weightings of pro rata income and realized gain allocations and from differences in separate class expenses, including distribution, shareholder servicing, and administration fees.
| | | | |
| 22 | | Wells Fargo Advantage International Bond Fund | | Notes to Financial Statements (Unaudited) |
3. FAIR VALUATION MEASUREMENTS
Fair value measurements of investments are determined within a framework that has established a fair value hierarchy based upon the various data inputs utilized in determining the value of the Fund’s investments. The three-level hierarchy gives the highest priority to unadjusted quoted prices in active markets for identical assets or liabilities (Level 1) and the lowest priority to unobservable inputs (Level 3). The Fund’s investments are classified within the fair value hierarchy based on the lowest level of input that is significant to the fair value measurement. The inputs are summarized into three broad levels as follows:
| n | | Level 1 – quoted prices in active markets for identical securities |
| n | | Level 2 – other significant observable inputs (including quoted prices for similar securities, interest rates, prepayment speeds, credit risk, etc.) |
| n | | Level 3 – significant unobservable inputs (including the Fund’s own assumptions in determining the fair value of investments) |
The inputs or methodologies used for valuing securities are not necessarily an indication of the risk associated with investing in those securities.
As of April 30, 2011, the inputs used in valuing the Fund’s assets, which are carried at fair value, were as follows:
| | | | | | | | | | | | | | | | |
| Investments in Securities | | Quoted Prices (Level 1) | | | Significant Other
Observable Inputs (Level 2) | | | Significant Unobservable Inputs (Level 3) | | | Total | |
| | | | |
Corporate bonds and notes | | $ | 0 | | | $ | 13,625,767 | | | $ | 0 | | | $ | 13,625,767 | |
| | | | |
Foreign corporate bonds | | | 0 | | | | 641,015,963 | | | | 0 | | | | 641,015,963 | |
| | | | |
Foreign government bonds and notes | | | 0 | | | | 984,620,814 | | | | 0 | | | | 984,620,814 | |
| | | | |
Yankee corporate bonds and notes | | | 0 | | | | 92,699,755 | | | | 0 | | | | 92,699,755 | |
| | | | |
Yankee government bonds | | | 0 | | | | 8,400,973 | | | | 0 | | | | 8,400,973 | |
| | | | |
Short-term investments | | | | | | | | | | | | | | | | |
Investment companies | | | 68,737,877 | | | | 0 | | | | 0 | | | | 68,737,877 | |
| | | $ | 68,737,877 | | | $ | 1,740,363,272 | | | $ | 0 | | | $ | 1,809,101,149 | |
Further details on the major security types listed above can be found in the Fund’s Portfolio of Investments.
As of April 30, 2011, the inputs used in valuing the Fund’s other financial instruments, which are carried at fair value, were as follows:
| | | | | | | | | | | | | | | | |
| Other financial instruments | | Quoted Prices (Level 1) | | | Significant Other
Observable Inputs (Level 2) | | | Significant Unobservable Inputs (Level 3) | | | Total | |
Forward foreign currency contracts | | $ | 0 | | | $ | (25,250,607 | ) | | $ | 0 | | | $ | (25,250,607 | ) |
Transfers in and transfers out are recognized at the end of the reporting period. For the six months ended April 30, 2011, the Fund did not have any significant transfers into/out of Level 1 and Level 2.
The following is a reconciliation of assets in which significant unobservable inputs (Level 3) were used in determining fair value:
| | | | |
| | | Corporate
bonds and
notes | |
Balance as of October 31, 2010 | | $ | 3,044,467 | |
Accrued discounts (premiums) | | | 0 | |
Realized gains (losses) | | | 0 | |
Change in unrealized gains (losses) | | | 284,022 | |
Purchases | | | 0 | |
Sales | | | 0 | |
Transfers into Level 3 | | | 0 | |
Transfers out of Level 3 | | | (3,328,489 | ) |
Balance as of April 30, 2011 | | $ | 0 | |
Change in unrealized gains (losses) relating to securities still held at April 30, 2011 | | $ | 0 | |
| | | | | | |
| Notes to Financial Statements (Unaudited) | | Wells Fargo Advantage International Bond Fund | | | 23 | |
4. TRANSACTIONS WITH AFFILIATES AND OTHER EXPENSES
Advisory fee
The Trust has entered into an advisory contract with Funds Management, an indirect wholly owned subsidiary of Wells Fargo & Company (“Wells Fargo”). The adviser is responsible for implementing investment policies and guidelines and for supervising the sub-adviser, who is responsible for day-to-day portfolio management of the Fund.
Pursuant to the contract, Funds Management is paid an annual advisory fee starting at 0.55% and declining to 0.45% as the average daily net assets of the Fund increase. For the six months ended April 30, 2011, the advisory fee was equivalent to an annual rate of 0.52% of the Fund’s average daily net assets.
Funds Management may retain the services of certain sub-advisers to provide daily portfolio management to the Fund. The fees related to sub-advisory services are borne directly by the adviser and do not increase the overall fees paid by the Fund to the adviser. First International Advisors, LLC, an affiliate of Funds Management and indirect wholly owned subsidiary of Wells Fargo, is the sub-adviser to the Fund and is paid a fee by the adviser at an annual rate starting at 0.35% and declining to 0.20% as the average daily net assets of the Fund increase.
Administration and transfer agent fees
The Trust has entered into an administration agreement with Funds Management. Under this agreement, for providing administrative services, which includes paying fees and expenses for services provided by the transfer agent, sub-transfer agents, omnibus account servicers and record-keepers, Funds Management is entitled to receive from the Fund an annual fund level administration fee starting at 0.05% and declining to 0.03% as the average daily net assets of the Fund increase and a class level administration fee which is calculated based on the average daily net assets of the Fund as follows:
| | | | |
| | | Class Level
Administration Fee | |
Class A, Class B, Class C | | | 0.16 | % |
Administrator Class | | | 0.10 | |
Institutional Class | | | 0.08 | |
Funds Management has contractually waived and/or reimbursed advisory and administration fees to the extent necessary to maintain certain net operating expense ratios for the Fund. Waiver of fees and/or reimbursement of expenses by Funds Management were made first from fund level expenses on a proportionate basis and then from class specific expenses.
Distribution fees
The Trust has adopted a Distribution Plan for Class B and Class C shares of the Fund pursuant to Rule 12b-1 under the 1940 Act. Distribution fees are charged to the Class B and Class C shares and paid to Wells Fargo Funds Distributor, LLC, the principal underwriter, at an annual rate of 0.75% of the average daily net assets of Class B and Class C shares.
For the six months ended April 30, 2011, Wells Fargo Funds Distributor, LLC received $9,050 from the sale of Class A shares and $77, $3,657 and $320 in contingent deferred sales charges from redemptions of Class A, Class B and Class C shares, respectively.
Shareholder servicing fees
The Trust has entered into contracts with one or more shareholder servicing agents, whereby Class A, Class B, Class C and Administrator Class of the Fund is charged a fee at an annual rate of 0.25% of the average daily net assets of each respective class.
5. INVESTMENT PORTFOLIO TRANSACTIONS
Purchases and sales of investments, excluding U.S. Government obligations and short-term securities (securities with maturities of one year or less at purchase date), for the six months ended April 30, 2011 were $836,805,820 and $692,444,603, respectively.
6. DERIVATIVE TRANSACTIONS
During the six months ended April 30, 2011, the Fund entered into forward foreign currency contracts for hedging purposes.
| | | | |
| 24 | | Wells Fargo Advantage International Bond Fund | | Notes to Financial Statements (Unaudited) |
At April 30, 2011, the Fund had forward foreign currency contracts outstanding as follows:
Forward foreign currency contracts to buy:
| | | | | | | | | | | | | | | | | | | | |
| Exchange Date | | Counterparty | | Contracts to
Receive | | U.S. Value at
April 30, 2011 | | | In Exchange
for U.S. $ | | | Net Unrealized
Gains
(Losses) | |
| 05/09/2011 | | State Street Bank | | | 7,865,000,000 | | | JPY | | $ | 96,962,331 | | | $ | 96,384,804 | | | $ | 577,527 | |
| 05/09/2011 | | State Street Bank | | | 1,234,000,000 | | | JPY | | | 15,213,162 | | | | 14,911,125 | | | | 302,037 | |
| 05/09/2011 | | State Street Bank | | | 1,710,000,000 | | | JPY | | | 21,081,448 | | | | 20,917,431 | | | | 164,017 | |
| 05/09/2011 | | State Street Bank | | | 1,126,000,000 | | | JPY | | | 13,881,702 | | | | 13,724,761 | | | | 156,941 | |
| 05/18/2011 | | State Street Bank | | | 260,000,000 | | | HUF | | | 1,455,623 | | | | 1,412,000 | | | | 43,623 | |
| 05/24/2011 | | State Street Bank | | | 9,121,740,000 | | | HUF | | | 51,028,421 | | | | 49,497,737 | | | | 1,530,684 | |
| 06/01/2011 | | State Street Bank | | | 70,610,000 | | | EUR | | | 104,500,778 | | | | 98,183,911 | | | | 6,316,867 | |
| | | | | | | | | | | | | | | | | | | | | | | | | | |
| Exchange Date | | Counterparty | | Contracts to
Receive | | U.S. Value at
April 30, 2011 | | | In Exchange
For | | U.S. Value at
April 30, 2011 | | | Net Unrealized
Gains (Losses) | |
| 05/02/2011 | | State Street Bank | | | 12,562,637,200 | | | JPY | | $ | 154,874,403 | | | | 151,600,000 | | | CAD | | $ | 160,228,294 | | | $ | (5,353,891 | ) |
| 05/02/2011 | | State Street Bank | | | 709,553,385 | | | JPY | | | 8,747,499 | | | | 8,550,000 | | | CAD | | | 9,036,622 | | | | (289,123 | ) |
| 05/02/2011 | | State Street Bank | | | 63,800,000 | | | CAD | | | 67,431,168 | | | | 5,387,016,800 | | | JPY | | | 66,412,091 | | | | 1,019,077 | |
| 05/02/2011 | | State Street Bank | | | 16,800,000 | | | CAD | | | 17,756,170 | | | | 1,429,092,000 | | | JPY | | | 17,618,098 | | | | 138,072 | |
| 05/18/2011 | | State Street Bank | | | 3,564,053,900 | | | JPY | | | 43,940,507 | | | | 124,300,000 | | | PLN | | | 46,761,488 | | | | (2,820,981 | ) |
| 05/25/2011 | | State Street Bank | | | 5,841,252,500 | | | JPY | | | 72,017,757 | | | | 71,300,000 | | | AUD | | | 77,935,582 | | | | (5,917,825 | ) |
| 05/25/2011 | | State Street Bank | | | 6,902,000,000 | | | JPY | | | 85,095,887 | | | | 85,000,000 | | | AUD | | | 92,910,582 | | | | (7,814,695 | ) |
| 05/25/2011 | | State Street Bank | | | 31,400,000 | | | AUD | | | 34,322,262 | | | | 2,759,416,300 | | | JPY | | | 34,021,295 | | | | 300,967 | |
| 06/01/2011 | | State Street Bank | | | 4,525,000,000 | | | JPY | | | 55,791,111 | | | | 34,438,145 | | | GBP | | | 57,503,584 | | | | (1,712,473 | ) |
| 06/01/2011 | | State Street Bank | | | 2,764,469,400 | | | JPY | | | 34,084,601 | | | | 23,100,000 | | | EUR | | | 34,187,339 | | | | (102,738 | ) |
| 06/01/2011 | | State Street Bank | | | 8,441,096 | | | GBP | | | 14,094,641 | | | | 1,126,000,000 | | | JPY | | | 13,883,048 | | | | 211,593 | |
| 06/01/2011 | | State Street Bank | | | 5,625,000 | | | GBP | | | 9,392,424 | | | | 6,426,074 | | | EUR | | | 9,510,406 | | | | (117,982 | ) |
| 06/01/2011 | | State Street Bank | | | 5,415,243 | | | EUR | | | 8,014,404 | | | | 610,000,000 | | | JPY | | | 7,521,012 | | | | 493,392 | |
| 06/21/2011 | | State Street Bank | | | 41,250,000 | | | GBP | | | 68,859,595 | | | | 5,526,386,250 | | | JPY | | | 68,144,628 | | | | 714,967 | |
| 07/13/2011 | | State Street Bank | | | 6,371,761,500 | | | JPY | | | 78,578,532 | | | | 96,850,000 | | | NZD | | | 78,002,099 | | | | 576,433 | |
| 07/13/2011 | | State Street Bank | | | 415,615,208 | | | JPY | | | 5,125,495 | | | | 6,320,000 | | | NZD | | | 5,090,070 | | | | 35,425 | |
| 08/02/2011 | | State Street Bank | | | 6,830,958,500 | | | JPY | | | 84,252,134 | | | | 79,550,000 | | | CAD | | | 83,892,264 | | | | 359,870 | |
Forward foreign currency contracts to sell:
| | | | | | | | | | | | | | | | | | | | |
| Exchange Date | | Counterparty | | Contracts to
Deliver | | U.S. Value at
April 30, 2011 | | | In Exchange
for U.S. $ | | | Net Unrealized
Gains
(Losses) | |
| 05/18/2011 | | State Street Bank | | | 260,000,000 | | | HUF | | $ | 1,455,623 | | | $ | 1,283,951 | | | $ | (171,672 | ) |
| 05/18/2011 | | State Street Bank | | | 3,800,000 | | | PLN | | | 1,429,555 | | | | 1,304,117 | | | | (125,438 | ) |
| 05/18/2011 | | State Street Bank | | | 418,500,000 | | | DKK | | | 83,092,059 | | | | 78,084,185 | | | | (5,007,874 | ) |
| 05/24/2011 | | State Street Bank | | | 2,103,440,000 | | | HUF | | | 11,766,968 | | | | 10,474,256 | | | | (1,292,712 | ) |
| 05/24/2011 | | State Street Bank | | | 4,669,400,000 | | | HUF | | | 26,121,344 | | | | 23,198,529 | | | | (2,922,815 | ) |
| 05/24/2011 | | State Street Bank | | | 2,348,900,000 | | | HUF | | | 13,140,109 | | | | 11,888,349 | | | | (1,251,760 | ) |
| 05/24/2011 | | State Street Bank | | | 14,890,000 | | | ZAR | | | 2,261,824 | | | | 2,036,796 | | | | (225,028 | ) |
| 05/24/2011 | | State Street Bank | | | 123,385,000 | | | ZAR | | | 18,742,457 | | | | 17,066,879 | | | | (1,675,578 | ) |
| 05/24/2011 | | State Street Bank | | | 78,070,000 | | | ZAR | | | 11,859,007 | | | | 11,108,740 | | | | (750,267 | ) |
| 05/24/2011 | | State Street Bank | | | 1,155,000 | | | EUR | | | 1,709,742 | | | | 1,641,844 | | | | (67,898 | ) |
| 06/01/2011 | | State Street Bank | | | 30,116,359 | | | EUR | | | 44,571,349 | | | | 44,000,000 | | | | (571,349 | ) |
The Fund had average market values of $695,044,880 and $131,968,515 in forward foreign currency contracts to buy and forward foreign currency contracts to sell, respectively, during the six months ended April 30, 2011.
| | | | | | |
| Notes to Financial Statements (Unaudited) | | Wells Fargo Advantage International Bond Fund | | | 25 | |
The fair value, realized gains or losses and change in unrealized gains or losses on derivative instruments are reflected in the appropriate financial statements.
7. BANK BORROWINGS
The Trust (excluding the money market funds) and Wells Fargo Variable Trust are parties to a $125,000,000 revolving credit agreement with State Street Bank and Trust Company, whereby the Fund is permitted to use bank borrowings for temporary or emergency purposes, such as to fund shareholder redemption requests. Interest under the credit agreement is charged to the Fund based on a borrowing rate equal to the higher of the Federal Funds rate in effect on that day plus 1.25% or the overnight LIBOR rate in effect on that day plus 1.25%. In addition, under the credit agreement, the Fund pays an annual commitment fee equal to 0.125% of the unused balance, which is allocated pro rata.
For the six months ended April 30, 2011, there were no borrowings by the Fund under the agreement.
8. INDEMNIFICATION
Under the Trust’s organizational documents, the officers and directors are indemnified against certain liabilities that may arise out of performance of their duties to the Trust. Additionally, in the normal course of business, the Trust may enter into contracts with service providers that contain a variety of indemnification clauses. The Trust’s maximum exposure under these arrangements is dependent on future claims that may be made against the Fund and, therefore, cannot be estimated.
| | | | |
| 26 | | Wells Fargo Advantage International Bond Fund | | Other Information (Unaudited) |
PORTFOLIO HOLDINGS INFORMATION
The complete portfolio holdings for the Fund are publicly available on the Fund’s Web site (www.wellsfargo.com/advantagefunds) on a monthly, 30-day or more delayed basis. In addition, top ten holdings information for the Fund is publicly available on the Fund’s Web site on a monthly, seven-day or more delayed basis. The Fund files its complete schedule of portfolio holdings with the SEC for the first and third quarters of each fiscal year on Form N-Q, which is available without charge by visiting the SEC Web site at www.sec.gov. In addition, the Fund’s Form N-Q may be reviewed and copied at the SEC’s Public Reference Room in Washington, DC, and at regional offices in New York City, at 233 Broadway, and in Chicago, at 175 West Jackson Boulevard, Suite 900. Information about the Public Reference Room may be obtained by calling 1-800-SEC-0330.
PROXY VOTING INFORMATION
A description of the policies and procedures that the Fund uses to determine how to vote proxies relating to portfolio securities is available without charge, upon request, by calling 1-800-222-8222, visiting our Web site at www.wellsfargo.com/advantagefunds, or visiting the SEC Web site at www.sec.gov. Information regarding how the Fund voted proxies relating to portfolio securities during the most recent 12-month period ended June 30 is available without charge on the Fund’s Web site at www.wellsfargo.com/advantagefunds or by visiting the SEC Web site at www.sec.gov.
| | | | | | |
| Other Information (Unaudited) | | Wells Fargo Advantage International Bond Fund | | | 27 | |
BOARD OF TRUSTEES
The following table provides basic information about the Board of Trustees (the “Trustees”) of the Wells Fargo Funds Trust (the “Trust”) and Officers of the Trust. This table should be read in conjunction with the Prospectus and the Statement of Additional Information1 of the Fund. Each of the Trustees and Officers listed below acts in identical capacities for the Wells Fargo Advantage family of funds, which consists of 152 funds comprising the Trust, Wells Fargo Variable Trust, Wells Fargo Master Trust and four closed-end funds (collectively the “Fund Complex”). All of the Trustees are also Members of the Audit and Governance Committees of each Trust in the Fund Complex. The mailing address of each Trustee and Officer is 525 Market Street, 12th Floor, San Francisco, CA 94105. Each Trustee and Officer serves an indefinite term, however, each Trustee serves such term until reaching the mandatory retirement age established by the Trustees.
Independent Trustees
| | | | | | |
Name and Year of Birth | | Position Held and Length of Service | | Principal Occupations During Past Five Years | | Other Directorships |
Peter G. Gordon
(Born 1942) | | Trustee, since 1998; Chairman, since 2005 | | Co-Founder, Chairman, President and CEO of Crystal Geyser. Water Company. Trustee Emeritus, Colby College | | Asset Allocation Trust |
Isaiah Harris, Jr.
(Born 1952) | | Trustee, since 2009 | | Retired. Prior thereto, President and CEO of BellSouth Advertising and Publishing Corp. from 2005 to 2007, President and CEO of BellSouth Enterprises from 2004 to 2005 and President of BellSouth Consumer Services from 2000 to 2003. Emeritus member of the Iowa State University Foundation Board of Governors. Emeritus Member of the Advisory Board of Iowa State University School of Business. Mr. Harris is a certified public accountant. | | CIGNA Corporation; Deluxe Corporation; Asset Allocation Trust |
Judith M. Johnson
(Born 1949) | | Trustee, since 2008 | | Retired. Prior thereto, Chief Executive Officer and Chief Investment Officer of Minneapolis Employees Retirement Fund from 1996 to 2008. Ms. Johnson is an attorney, certified public accountant and a certified managerial accountant. | | Asset Allocation Trust |
Leroy Keith, Jr.
(Born 1939) | | Trustee, since 2010 | | Chairman, Bloc Global Services (development and construction), Trustee of the Evergreen Funds from 1983 to 2010. Former Managing Director, Almanac Capital Management (commodities firm), former Partner, Stonington Partners, Inc. (private equity fund), former Director, Obagi Medical Products Co. and former Director, Lincoln Educational Services. | | Trustee, Virtus Fund Complex (consisting of 45 portfolios as of 12/31/10); Director, Diversapack Co. (packaging company); Asset Allocation Trust |
David F. Larcker
(Born 1950) | | Trustee, since 2009 | | James Irvin Miller Professor of Accounting at the Graduate School of Business, Stanford University, Director of Corporate Governance Research Program and Co-Director of The Rock Center for Corporate Governance since 2006. From 2005 to 2008, Professor of Accounting at the Graduate School of Business, Stanford University. Prior thereto, Ernst & Young Professor of Accounting at The Wharton School, University of Pennsylvania from 1985 to 2005. | | Asset Allocation Trust |
Olivia S. Mitchell
(Born 1953) | | Trustee, since 2006 | | International Foundation of Employee Benefit Plans Professor and Chair of the Department of Insurance and Risk Management, Wharton School of the University of Pennsylvania since 1993. Director of Wharton’s Pension Research Council and Boettner Center on Pensions & Retirement Research, and Research Associate at the National Bureau of Economic Research. Previously, Cornell University Professor from 1978 to 1993. | | Asset Allocation Trust |
| | | | |
| 28 | | Wells Fargo Advantage International Bond Fund | | Other Information (Unaudited) |
| | | | | | |
Name and Year of Birth | | Position Held and Length of Service | | Principal Occupations During Past Five Years | | Other Directorships |
Timothy J. Penny
(Born 1951) | | Trustee, since 1996 | | President and CEO of Southern Minnesota Initiative Foundation, a non-profit organization, since 2007 and Senior Fellow at the Humphrey Institute Policy Forum at the University of Minnesota since 1995. Member of the Board of Trustees of NorthStar Education Finance, Inc., a non-profit organization, since 2007. | | Asset Allocation Trust |
Michael S. Scofield
(Born 1943) | | Trustee, since 2010 | | Currently serves on the Investment Company Institute’s Board of Governors and Executive Committee as well the In dependent Director’s Counsel Board of Governors and Executive Committee. Former Chairman of the Independent Directors Counsel. Trustee of the Evergreen Funds from 1984 to 2010. Retired Attorney, Law Offices of Michael S. Scofield and former Director and Chairman, Branded Media Corporation (multi-media branding company). | | Asset Allocation Trust |
Donald C. Willeke
(Born 1940) | | Trustee, since 1996 | | Principal of the law firm of Willeke & Daniels. General Counsel of the Minneapolis Employees Retirement Fund from 1984 until its consolidation into the Minnesota Public Employees Retirement Association on June 30, 2010. | | Asset Allocation Trust |
Officers
| | | | | | |
Name and Year of Birth | | Position Held and
Length of Service | | Principal Occupations During Past Five Years | | |
Karla M. Rabusch
(Born 1959) | | President, since 2003 | | Executive Vice President of Wells Fargo Bank, N.A. and President of Wells Fargo Funds Management, LLC since 2003. Senior Vice President and Chief Administrative Officer of Wells Fargo Funds Management, LLC from 2001 to 2003. | | |
C. David Messman
(Born 1960) | | Secretary, since 2000; Chief Legal Counsel, since 2003 | | Senior Vice President and Secretary of Wells Fargo Funds Management, LLC since 2001. Vice President and Managing Counsel of Wells Fargo Bank, N.A. since 1996. | | |
Kasey Phillips
(Born 1970) | | Treasurer, since 2009 | | Senior Vice President of Wells Fargo Funds Management, LLC since 2009. Senior Vice President of Evergreen Investment Management Company, LLC from 2006 to 2010. Treasurer of the Evergreen Funds from 2005 to 2010. Vice President and Assistant Vice President of Evergreen Investment Services, Inc. from 1999 to 2006. | | |
David Berardi
(Born 1975) | | Assistant Treasurer, since 2009 | | Vice President of Wells Fargo Funds Management, LLC since 2009 . Vice President of Evergreen Investment Management Company, LLC from 2008 to 2010. Assistant Vice President of Evergreen Investment Services, Inc. from 2004 to 2008. Manager of Fund Reporting and Control for Evergreen Investment Management Company, LLC from 2004 to 2010. | | |
Jeremy DePalma
(Born 1974) | | Assistant Treasurer, since 2009 | | Senior Vice President of Wells Fargo Funds Management, LLC since 2009. Senior Vice President of Evergreen Investment Management Company, LLC from 2008 to 2010. Vice President, Evergreen Investment Services, Inc. from 2004 to 2007. Assistant Vice President, Evergreen Investment Services, Inc. from 2000 to 2004 and the head of the Fund Reporting and Control Team within Fund Administration from 2005 to 2010. | | |
Debra Ann Early
(Born 1964) | | Chief Compliance Officer, since 2007 | | Chief Compliance Officer of Wells Fargo Funds Management, LLC since 2007. Chief Compliance Officer of Parnassus Investments from 2005 to 2007. Chief Financial Officer of Parnassus Investments from 2004 to 2007 and Senior Audit Manager of PricewaterhouseCoopers LLP from 1998 to 2004. | | |
| 1. | The Statement of Additional Information includes additional information about the Fund’s Trustees and is available, without charge, upon request, by calling 1-800-222-8222 or by visiting the Fund’s Web site at www.wellsfargo.com/advantagefunds. |
| | | | | | |
| Other Information (Unaudited) | | Wells Fargo Advantage International Bond Fund | | | 29 | |
BOARD CONSIDERATION OF INVESTMENT ADVISORY AND SUB-ADVISORY AGREEMENTS:
Each year, as required by Section 15 of the Investment Company Act of 1940 (the “1940 Act”), the Board of Trustees (the “Board”) of Wells Fargo Funds Trust (the “Trust”), all the members of which have no direct or indirect interest in the investment advisory and sub-advisory agreements and are not “interested persons” of the Trust, as defined in the 1940 Act (the “Independent Trustees”), determines whether to approve the continuation of the Trust’s investment advisory and sub-advisory agreements. In this regard, at an in person meeting held on March 24-25, 2011 (the “Meeting”), the Board reviewed and re-approved: (i) an investment advisory agreement with Wells Fargo Funds Management, LLC (“Funds Management”) for the International Bond Fund (the “Fund”) and (ii) an investment sub-advisory agreement with First International Advisors, LLC (“FIA”) for the Fund. The investment advisory agreement with Funds Management and the investment sub-advisory agreement with FIA are collectively referred to as the “Advisory Agreements.”
At the Meeting, the Board considered the factors and reached the conclusions described below relating to the selection of Funds Management and FIA and continuation of the Advisory Agreements. Prior to the Meeting, the Trustees conferred extensively among themselves and with representatives of Funds Management about these matters. The Board also met throughout the year and received information that was useful to them in considering the continuation of the Advisory Agreements. The Independent Trustees were assisted in their evaluation of the Advisory Agreements by independent legal counsel, from whom they received separate legal advice and with whom they met separately from Funds Management.
Nature, extent and quality of services
The Board received and considered various information regarding the nature, extent and quality of services provided to the Fund by Funds Management and FIA under the Advisory Agreements. The Board also received and considered information provided in response to a detailed set of requests submitted by the Independent Trustees’ independent legal counsel on their behalf. The Board received and considered, among other things, information about the background and experience of senior management of Funds Management, and the qualifications, backgrounds, tenures and responsibilities of the portfolio managers primarily responsible for the day-to-day portfolio management of the Fund.
The Board evaluated the ability of Funds Management and FIA, based on their respective financial condition, resources, reputation and other attributes, to attract and retain qualified investment professionals, including research, advisory, and supervisory personnel. The Board further considered the compliance programs and compliance records of Funds Management and FIA. In addition, the Board took into account the administrative services provided to the Fund by Funds Management and its affiliates.
The Board’s decision to approve the continuation of the Advisory Agreements was based on a comprehensive evaluation of all of the information provided to it. In approving the continuation of the Advisory Agreements, the Board did not identify any particular information or consideration that was all-important or controlling, and each Trustee attributed different weights to various factors. The Board evaluated information provided to it both in terms of the funds generally and with respect to the Fund, specifically as it considered appropriate. Although the Board considered the continuation of the Advisory Agreements for the Fund as part of the larger process of considering the continuation of the advisory agreements for all of the funds, its decision to continue the Advisory Agreements for the Fund was ultimately made on a fund-by-fund basis.
In considering these matters, the Board considered not only the specific information presented in connection with the Meeting, but also the knowledge gained over time through interaction with Funds Management and FIA about various topics, including Funds Management’s oversight of service providers. The above factors, together with those referenced below, are some of the most important, but not necessarily all, factors considered by the Board in concluding that it was satisfied with the nature, extent and quality of the investment advisory services provided to the Fund by Funds Management and FIA.
Fund performance and expenses
The Board considered the performance results for the Fund over various time periods ended December 31, 2010. The Board also considered these results in comparison to the median performance of a universe of relevant funds (the “Universe”) that was determined by Lipper Inc. (“Lipper”) to be similar to the Fund, and in comparison to the Fund’s
| | | | |
| 30 | | Wells Fargo Advantage International Bond Fund | | Other Information (Unaudited) |
benchmark index and to other comparative data. Lipper is an independent provider of investment company data. The Board received a description of the methodology used by Lipper to select the mutual funds in the Universe.
The Board noted that the performance of the Fund was higher than the median performance of the Universe for the periods under review.
The Board received and considered information regarding the Fund’s contractual advisory fee and net operating expense ratios and their various components, including actual management fees (which reflect fee waivers, if any), transfer agent, custodian and other non-management fees, Rule 12b-1 and non-Rule 12b-1 fees, service fees and fee waiver and expense reimbursement arrangements. The Board also considered these ratios in comparison to the median ratios of an expense Universe and a narrower expense group of mutual funds (each, an “Expense Group”) that was determined by Lipper to be similar to the Fund. The Board received a description of the methodology used by Lipper to select the mutual funds in the Fund’s Expense Group. The Board noted that the net operating expense ratio of the Fund was in range of or lower than the Fund’s Expense Group’s median net operating expense ratio.
Based on the above-referenced considerations and other factors, the Board concluded that the overall performance and expense structure of the Fund supported the re-approval of the Advisory Agreements for the Fund.
Investment advisory and sub-advisory fee rates
The Board reviewed and considered the contractual investment advisory fee rate that is payable by the Fund to Funds Management for investment advisory services (the “Advisory Agreement Rate”), both on a stand-alone basis and on a combined basis with the Fund’s administration fee rate. The Board took into account the separate administrative and other services covered by the administration fee rate. The Board also reviewed and considered the contractual investment sub-advisory fee rate that is payable by Funds Management to FIA for investment sub-advisory services (the “Sub-Advisory Agreement Rate”). In addition, the Board reviewed and considered the existing fee waiver/cap arrangements applicable to the Advisory Agreement Rate and considered the Advisory Agreement Rate after taking the waivers/caps into account (the “Net Advisory Rate”).
The Board received and considered information comparing the Advisory Agreement Rate and Net Advisory Rate with those of other funds in the Fund’s Expense Group median. The Board noted that the Advisory Agreement Rate and Net Advisory Rate for the Fund were in range of the median rates for the Fund’s Expense Group. The Board further noted that Funds Management had agreed to continue contractual fee cap arrangements for the Fund designed to lower the Fund’s expenses.
The Board also received and considered information about the nature and extent of services offered and fee rates charged by Funds Management and FIA to other types of clients. In this regard, the Board received information about differences between the services, and the compliance, reporting, and other legal burdens and risks of providing investment advice to mutual funds and those associated with providing advice to non-mutual fund clients such as collective funds or institutional separate accounts.
The Board determined that the Advisory Agreement Rate for the Fund, both with and without an administration fee rate and before and after waivers, were acceptable in light of the Fund’s Expense Group information, the net expense ratio commitments, the services covered by the Advisory Agreements and other information provided. The Board also reviewed and considered the Sub-Advisory Agreement Rate and concluded that the Sub-Advisory Agreement Rate was acceptable in light of the services covered by the Sub-Advisory Agreement and other information provided.
Profitability
The Board received and considered a profitability analysis of Funds Management, as well as an analysis of the profitability to the collective Wells Fargo businesses that provide services to the Fund. It considered that the information provided to it was necessarily estimated, and that the profitability information provided to it, especially on a fund-by-fund basis, did not necessarily provide a precise tool for evaluating the appropriateness of the Fund’s Advisory Agreement Rates in isolation. It noted that the levels of profitability of the Fund to Funds Management varied widely, depending on, among other things, the size and type of fund. The Board concluded that the profitability to Funds Management of the services provided to the Fund, individually or in the aggregate, was not unreasonable.
| | | | | | |
| Other Information (Unaudited) | | Wells Fargo Advantage International Bond Fund | | | 31 | |
The Board did not consider separate profitability information with respect to FIA, because, as an affiliate of Funds Management, its profitability information was subsumed in the collective Wells Fargo profitability analysis provided by Funds Management.
Economies of scale
With respect to possible economies of scale, the Board reviewed the breakpoints in the Fund’s advisory fee structure, which operate generally to reduce the effective Advisory Agreement Rate of the Fund (as a percentage of Fund assets) as the Fund grows in size. It considered that, as a fund shrinks in size, breakpoints conversely result in increasing fee levels. The Board noted that it would continue to review the appropriate levels of breakpoints in the future, and concluded that the breakpoints as implemented appeared to be a reasonable step toward sharing economies of scale with the Fund. However, the Board acknowledged the inherent limitations of any analysis of an investment adviser’s economies of scale and of any attempt to correlate breakpoints with such economies, stemming largely from the Board’s understanding that economies of scale are realized, if at all, by an investment adviser across a variety of products and services, not just with respect to a single fund.
Other benefits to Funds Management and FIA
The Board received and considered information regarding potential “fall-out” or ancillary benefits received by Funds Management and its affiliates, including FIA, as a result of their relationship with the Fund. Ancillary benefits could include, among others, benefits directly attributable to the relationship of Funds Management and FIA with the Fund and benefits potentially derived from an increase in Funds Management’s and FIA’s business as a result of their relationship with the Fund (such as the ability to market to shareholders other financial products offered by Funds Management and its affiliates, including FIA).
The Board considered that Wells Fargo Funds Distributor, LLC, an affiliate of Funds Management, serves as distributor to the Fund and receives certain compensation for those services. The Board noted that the Fund pays sub-transfer agency fees to various financial institutions, including affiliates of Funds Management that hold fund shares in omnibus accounts. It also considered that these entities may receive distribution-related fees and shareholder servicing payments (including amounts derived from payments under the funds’ Rule 12b-1 plans) in respect of shares sold or held through them.
The Board also reviewed information about whether and to what extent soft dollar credits are sought and how any such credits are utilized and any benefits that may be realized by using an affiliated broker.
Other factors and broader review
The Board also considered the markets for distribution of the Fund’s shares, including the multiple channels through which the Fund’s shares are offered and sold. The Board noted that the Fund is part of one of the few fund families that have both direct-to-fund and intermediary distribution channels. As discussed above, the Board reviews detailed materials received from Funds Management and FIA annually as part of the re-approval process under Section 15 of the 1940 Act and also reviews and assesses information about the quality of the services that the Fund receives throughout the year. In this regard, the Board has reviewed reports of Funds Management at each of its quarterly meetings, which include, among other things, portfolio reviews and performance reports. In addition, the Board confers with portfolio managers at various times throughout the year.
Conclusion
After considering the above-described factors and based on its deliberations and its evaluation of the information described above, the Board concluded that approval of the continuation of the Advisory Agreements for the Fund was in the best interest of the Fund and its shareholders. Accordingly, the Board unanimously approved the continuation of the Advisory Agreements for an additional one-year period.
| | | | |
| 32 | | Wells Fargo Advantage International Bond Fund | | List of Abbreviations |
The following is a list of common abbreviations for terms and entities which may have appeared in this report.
| ABAG | — Association of Bay Area Governments |
| ACB | — Agricultural Credit Bank |
| ADR | — American Depositary Receipt |
| ADS | — American Depository Shares |
| AGC-ICC | — Assured Guaranty Corporation - Insured Custody Certificates |
| AGM | — Assured Guaranty Municipal |
| AMBAC | — American Municipal Bond Assurance Corporation |
| AMT | — Alternative Minimum Tax |
| ARM | — Adjustable Rate Mortgages |
| BAN | — Bond Anticipation Notes |
| BART | — Bay Area Rapid Transit |
| BHAC | — Berkshire Hathaway Assurance Corporation |
| CDA | — Community Development Authority |
| CDO | — Collateralized Debt Obligation |
| CDSC | — Contingent Deferred Sales Charge |
| CGIC | — Capital Guaranty Insurance Company |
| CGY | — Capital Guaranty Corporation |
| CIFG | — CDC (Caisse des Dépôts et Consignations) IX IS Financial Guarantee |
| COP | — Certificate of Participation |
| DRIVER | — Derivative Inverse Tax-Exempt Receipts |
| DW&P | — Department of Water & Power |
| DWR | — Department of Water Resources |
| ECFA | — Educational & Cultural Facilities Authority |
| EDFA | — Economic Development Finance Authority |
| ETET | — Eagle Tax-Exempt Trust |
| ETF | — Exchange-Traded Fund |
| FFCB | — Federal Farm Credit Bank |
| FGIC | — Financial Guaranty Insurance Corporation |
| FHA | — Federal Housing Authority |
| FHAG | — Federal Housing Agency |
| FHLB | — Federal Home Loan Bank |
| FHLMC | — Federal Home Loan Mortgage Corporation |
| FNMA | — Federal National Mortgage Association |
| GDR | — Global Depositary Receipt |
| GNMA | — Government National Mortgage Association |
| HCFR | — Healthcare Facilities Revenue |
| HEFA | — Health & Educational Facilities Authority |
| HEFAR | — Higher Education Facilities Authority Revenue |
| HFA | — Housing Finance Authority |
| HFFA | — Health Facilities Financing Authority |
| HUD | — Housing & Urban Development |
| IDA | — Industrial Development Authority |
| IDAG | — Industrial Development Agency |
| IDR | — Industrial Development Revenue |
| KRW | — Republic of Korea Won |
| LIBOR | — London Interbank Offered Rate |
| LLC | — Limited Liability Company |
| LLP | — Limited Liability Partnership |
| MBIA | — Municipal Bond Insurance Association |
| MFHR | — Multi-Family Housing Revenue |
| MFMR | — Multi-Family Mortgage Revenue |
| MMD | — Municipal Market Data |
| MSTR | — Municipal Securities Trust Receipts |
| MUD | — Municipal Utility District |
| NATL-RE | — National Public Finance Guarantee Corporation |
| PCFA | — Pollution Control Finance Authority |
| PCR | — Pollution Control Revenue |
| PFA | — Public Finance Authority |
| PFFA | — Public Facilities Financing Authority |
| PFOTER | — Puttable Floating Option Tax-Exempt Receipts |
| plc | — Public Limited Company |
| PSFG | — Public School Fund Guaranty |
| PUTTER | — Puttable Tax-Exempt Receipts |
| R&D | — Research & Development |
| RDA | — Redevelopment Authority |
| RDFA | — Redevelopment Finance Authority |
| REIT | — Real Estate Investment Trust |
| ROC | — Reset Option Certificates |
| SFHR | — Single Family Housing Revenue |
| SFMR | — Single Family Mortgage Revenue |
| SLMA | — Student Loan Marketing Association |
| SPDR | — Standard & Poor’s Depositary Receipts |
| STIT | — Short-Term Investment Trust |
| TAN | — Tax Anticipation Notes |
| TRAN | — Tax Revenue Anticipation Notes |
| TCR | — Transferable Custody Receipts |
| TTFA | — Transportation Trust Fund Authority |
| USD | — Unified School District |
| XLCA | — XL Capital Assurance |
This page is intentionally left blank.
This page is intentionally left blank.

More information about Wells Fargo Advantage Funds is available free upon request. To obtain literature, please write, e-mail, visit the Funds’ Web site, or call:
Wells Fargo Advantage Funds
P.O. Box 8266
Boston, MA 02266-8266
E-mail: wfaf@wellsfargo.com
Web site: www.wellsfargo.com/advantagefunds Individual Investors: 1- 800-222-8222
Retail Investment Professionals: 1- 888-877-9275 Institutional Investment Professionals: 1- 866-765-0778
This report and the financial statements contained herein are submitted for the general information of the shareholders of Wells Fargo Advantage Funds. If this report is used for promotional purposes, distribution of the report must be accompanied or preceded by a current prospectus. For a prospectus containing more complete information, including charges and expenses, call 1-800-222-8222 or visit the Fund’s Web site at www.wellsfargo.com/advantagefunds. Please consider the investment objectives, risks, charges, and expenses of the investment carefully before investing. This and other information about Wells Fargo Advantage Funds can be found in the current prospectus. Read the prospectus carefully before you invest or send money.
Wells Fargo Funds Management, LLC, a wholly owned subsidiary of Wells Fargo & Company, provides investment advisory and administrative services for Wells Fargo Advantage Funds. Other affiliates of Wells Fargo & Company provide subadvisory and other services for the Funds. The Funds are distributed by Wells Fargo Funds Distributor, LLC, Member FINRA/SIPC, an affiliate of Wells Fargo & Company.
NOT FDIC INSURED ¡ NO BANK GUARANTEE ¡ MAY LOSE VALUE

| | | | | | |
| | | |
© 2011 Wells Fargo Funds Management, LLC. All rights reserved. | | www.wellsfargo.com/advantagefunds | | 202913 06-11 SIF2/SAR157 04-11 |
ITEM 2. CODE OF ETHICS
Not required in this filing
ITEM 3. AUDIT COMMITTEE FINANCIAL EXPERT
Not required in this filing.
ITEM 4. PRINCIPAL ACCOUNTANT FEES AND SERVICES
Not required in this filing.
ITEM 5. AUDIT COMMITTEE OF LISTED REGISTRANTS
Not required in this filing.
ITEM 6. SCHEDULE OF INVESTMENTS
The Schedule of Investments is included as part of the report to shareholders filed under Item 1 of this Form.
ITEM 7. DISCLOSURE OF PROXY VOTING POLICIES AND PROCEDURES FOR CLOSED-END MANAGEMENT INVESTMENT COMPANIES
Not applicable.
ITEM 8. PORTFOLIO MANAGERS OF CLOSED-END MANAGEMENT INVESTMENT COMPANIES
Not applicable.
ITEM 9. PURCHASES OF EQUITY SECURITIES BY CLOSED-END MANAGEMENT INVESTMENT COMPANY AND AFFILIATED PURCHASES
Not applicable.
ITEM 10. SUBMISSION OF MATTERS TO A VOTE OF SECURITY HOLDERS
The Governance Committee (the “Committee”) of the Board of Trustees of the registrant (the “Trust”) has adopted procedures by which a shareholder of any series of the Trust may submit properly a nominee recommendation for the Committee’s consideration.
The shareholder must submit any such recommendation (a “Shareholder Recommendation”) in writing to the Trust, to the attention of the Trust’s Secretary, at the address of the principal executive offices of the Trust.
The Shareholder Recommendation must be delivered to, or mailed and received at, the principal executive offices of the Trust not less than forty-five (45) calendar days nor more than seventy-five (75) calendar days prior to the date of the Committee meeting at which the nominee would be considered.
The Shareholder Recommendation must include: (i) a statement in writing setting forth (A) the name, age, date of birth, business address, residence address and nationality of the person recommended by the shareholder (the “candidate”); (B) the series (and, if applicable, class) and number of all shares of the Trust owned of record or beneficially by the candidate, as reported to such shareholder by the candidate; (C) any other information regarding the candidate called for with respect to director nominees by paragraphs (a), (d), (e) and (f) of Item 401 of Regulation S-K or paragraph (b) of Item 22 of Rule 14a-101 (Schedule 14A) under the Securities Exchange Act of 1934, as amended (the “Exchange Act”), adopted by the Securities and Exchange Commission (or the corresponding provisions of any regulation or rule subsequently adopted by the Securities and Exchange Commission or any successor agency applicable to the Trust); (D) any other information regarding the candidate that would be required to be disclosed if the candidate were a nominee in a proxy statement or other filing required to be made in connection with solicitation of proxies for election of directors pursuant to Section 14 of the Exchange Act and the rules and regulations promulgated thereunder; and (E) whether the recommending shareholder believes that the candidate is or will be an “interested person” of the Trust (as defined in the Investment Company Act of 1940, as amended) and, if not an “interested person,” information regarding the candidate that will be sufficient for the Trust to make such determination; (ii) the written and signed consent of the candidate to be named as a nominee and to serve as a Trustee if elected; (iii) the recommending shareholder’s name as it appears on the Trust’s books; (iv) the series (and, if applicable, class) and number of all shares of the Trust owned beneficially and of record by the recommending shareholder; and (v) a description of all arrangements or understandings between the recommending shareholder and the candidate and any other person or persons (including their names) pursuant to which the recommendation is being made by the recommending shareholder. In addition, the Committee may require the
candidate to interview in person and furnish such other information as it may reasonably require or deem necessary to determine the eligibility of such candidate to serve as a Trustee of the Trust.
ITEM 11. CONTROLS AND PROCEDURES
(a) The President and Treasurer have concluded that the Wells Fargo Funds Trust (the “Trust”) disclosure controls and procedures (as defined in Rule 30a-3(c) under the Investment Company Act of 1940) provide reasonable assurances that material information relating to the Trust is made known to them by the appropriate persons, based on their evaluation of these controls and procedures as of a date within 90 days of the filing of this report.
(b) There were no significant changes in the Trust’s internal controls over financial reporting (as defined in Rule 30a-3(d) under the Investment Company Act of 1940) that occurred during the second quarter of the period covered by this report that materially affected, or is reasonably likely to materially affect, the registrant’s internal control over financial reporting.
ITEM 12. EXHIBITS
(a)(1) Not required in this filing.
(a)(2) Certification pursuant to Rule 30a-2(a) under the Investment Company Act of 1940 (17 CFR 270.30a-2(a)) is filed and attached hereto as Exhibit 99.CERT.
(a)(3) Not applicable.
(b) Certification pursuant to Rule 30a-2(b) under the Investment Company Act of 1940 (17 CFR 270.30a-2(b)) is filed and attached hereto as Exhibit 99.906CERT.
SIGNATURES
Pursuant to the requirements of the Securities Exchange Act of 1934 and the Investment Company Act of 1940, the registrant has duly caused this report to be signed on its behalf by the undersigned, thereunto duly authorized.
| | |
| Wells Fargo Funds Trust |
| |
| By: | | /s/ KARLA M. RABUSCH |
| | Karla M. Rabusch |
| | President |
|
| Date: June 28, 2011 |
Pursuant to the requirements of the Securities Exchange Act of 1934 and the Investment Company Act of 1940, this report has been signed below by the following persons on behalf of the registrant and in the capacities and on the date indicated.
| | |
| By: | | /s/ KARLA M. RABUSCH |
| | Karla M. Rabusch |
| | President |
|
| Date: June 28, 2011 |
| |
| By: | | /s/ KASEY L. PHILLIPS |
| | Kasey L. Phillips |
| | Treasurer |
|
| Date: June 28, 2011 |