
UNITED STATES
SECURITIES AND EXCHANGE COMMISSION
Washington, D.C. 20549
FORM N-CSRS
CERTIFIED SHAREHOLDER REPORT OF REGISTERED
MANAGEMENT INVESTMENT COMPANIES
Investment Company Act file number: 811-09253
Wells Fargo Funds Trust
(Exact name of registrant as specified in charter)
525 Market St., San Francisco, CA 94105
(Address of principal executive offices) (Zip code)
C. David Messman
Wells Fargo Funds Management, LLC
525 Market St., San Francisco, CA 94105
(Name and address of agent for service)
Registrant’s telephone number, including area code: 800-643-9691
Date of fiscal year end: January 31, 2011
Date of reporting period: July 31, 2011
| ITEM 1. | REPORT TO SHAREHOLDERS |

Wells Fargo Advantage
100% Treasury Money Market Fund

Semi-Annual Report
July 31, 2011

Reduce clutter. Save trees.
Sign up for electronic delivery of prospectuses and shareholder reports at www.wellsfargo.com/advantagedelivery
Contents
The views expressed and any forward-looking statements are as of July 31, 2011, unless otherwise noted and are those of the Fund managers and/or Wells Fargo Funds Management, LLC. Discussions of individual securities, or the markets generally, or any Wells Fargo Advantage Fund are not intended as individual recommendations. Future events or results may vary significantly from those expressed in any forward-looking statements; the views expressed are subject to change at any time in response to changing circumstances in the market. Wells Fargo Funds Management, LLC, disclaims any obligation to publicly update or revise any views expressed or forward-looking statements.
NOT FDIC INSURED ¡ NO BANK GUARANTEE ¡ MAY LOSE VALUE

WELLS FARGO INVESTMENT HISTORY
| | |
| |
| 1932 | | Keystone creates one of the first mutual fund families. |
| |
| 1971 | | Wells Fargo & Company introduces one of the first institutional index funds. |
| |
| 1978 | | Wells Fargo applies Markowitz and Sharpe’s research on Modern Portfolio Theory to introduce one of the industry’s first Tactical Asset Allocation (TAA) models in institutional separately managed accounts. |
| |
| 1984 | | Wells Fargo Stagecoach Funds launches its first asset allocation fund. |
| |
| 1989 | | The Tactical Asset Allocation (TAA) Model is first applied to Wells Fargo’s asset allocation mutual funds. |
| |
| 1994 | | Wells Fargo introduces the LifePath Funds, one of the first suites of target date funds (now the Wells Fargo Advantage Dow Jones Target Date FundsSM ). |
| |
| 1996 | | Evergreen Investments and Keystone Funds merge. |
| |
| 1997 | | Wells Fargo launches Wells Fargo Advantage WealthBuilder PortfoliosSM, a fund-of-funds suite of products that includes the use of quantitative models to shift assets among investment styles. |
| |
| 1999 | | Norwest Advantage Funds and Stagecoach Funds are reorganized into Wells Fargo Funds after the merger of Norwest and Wells Fargo. |
| |
| 2002 | | Evergreen Retail and Evergreen Institutional companies form the umbrella asset management company, Evergreen Investments. |
| |
| 2005 | | The integration of Strong Funds with Wells Fargo Funds creates Wells Fargo Advantage Funds, resulting in one of the top 20 mutual fund companies in the United States. |
| |
| 2006 | | Wells Fargo Advantage Funds relaunches the target date product line as Wells Fargo Advantage Dow Jones Target Date Funds. |
| |
| 2010 | | The mergers and reorganizations of Evergreen and Wells Fargo Advantage mutual funds are completed, unifying the families under the brand of Wells Fargo Advantage Funds. |
Wells Fargo Advantage Funds®
Wells Fargo Advantage Funds skillfully guides institutions, financial advisors, and individuals through the investment terrain to help them reach their financial objectives. Everything we do on behalf of investors is backed by our unique combination of qualifications.
Strength
Our organization is built on the standards of integrity and service established by our parent company—Wells Fargo & Company—more than 150 years ago. And, because we’re part of a highly diversified financial enterprise, we offer the depth of resources to help investors succeed.
Expertise
Our multi-boutique model offers investors access to the independent thinking of premier investment managers that have been chosen for their time-tested strategies. While each team specializes in a specific investment strategy, collectively they provide investors a wide choice of distinct investment styles. Our dedication to investment excellence doesn’t end with our expertise in manager selection—risk management, analysis, and rigorous ongoing review seek to ensure each manager’s investment process remains consistent.
Partnership
Our collaborative approach is built around understanding the needs and goals of our clients. By adhering to core principles of sound judgment and steady guidance, we support you through every stage of the investment decision process.
Carefully consider the investment objectives, risks, charges, and expenses before investing. For a current prospectus for Wells Fargo Advantage Funds containing this and other information, visit wellsfargo.com/advantagefunds. Read it carefully before investing.
Wells Fargo Funds Management, LLC, a wholly owned subsidiary of Wells Fargo & Company, provides investment advisory and administrative services for Wells Fargo Advantage Funds®. Other affiliates of Wells Fargo & Company provide subadvisory and other services for the Funds. The Funds are distributed by Wells Fargo Funds Distributor, LLC, Member FINRA/SIPC, an affiliate of Wells Fargo & Company.
The “Dow Jones Target Date Indexes” are a product of Dow Jones Indexes, a licensed trademark of CME Group Index Services LLC (“CME”). “Dow Jones” and “Dow Jones Target Date Indexes” are service marks of Dow Jones Trademark Holdings, LLC, and have been licensed for use for certain purposes by CME and sublicensed for use by Global Index Advisors, Inc., and Wells Fargo Funds Management, LLC. The Dow Jones Target Date Indexes are based in part on the Barclays Capital Bond Indexes, which are published by Barclays Capital Inc. The Wells Fargo Advantage Dow Jones Target Date Funds, based on the Dow Jones Target Date Indexes, are not sponsored, endorsed, sold, or promoted by Dow Jones, CME or Barclays Capital or any of their respective affiliates, and neither Dow Jones, CME nor Barclays Capital nor any of their respective affiliates makes any representation regarding the advisability of investing in such product(s) and/or about the quality, accuracy, and/or completeness of the Dow Jones Target Date Indexes or the Barclays Capital Bond Indexes. IN NO EVENT SHALL DOW JONES, CME, BARCLAYS CAPITAL, OR ANY OF THEIR LICENSORS HAVE ANY LIABILITY IN CONNECTION WITH THE Wells Fargo Advantage Dow Jones Target Date Funds INCLUDING, WITHOUT LIMITATION, FOR ANY SPECIAL, PUNITIVE, IN DIRECT, OR CONSEQUENTIAL DAMAGES (INCLUDING LOST PROFITS), EVEN IF NOTIFIED OF THE POSSIBILITY OF SUCH DAMAGES.
NOT FDIC INSURED ¡ NO BANK GUARANTEE ¡ MAY LOSE VALUE
Not part of the semi-annual report.
Wells Fargo Advantage Funds offers more than 110 mutual funds across a wide range of asset classes, representing over $221 billion in assets under management, as of July 31, 2011.
| | | | |
| Equity Funds | | | | |
Asia Pacific Fund | | Global Opportunities Fund | | Premier Large Company Growth Fund |
C&B Large Cap Value Fund | | Growth Fund | | Small Cap Opportunities Fund |
C&B Mid Cap Value Fund | | Health Care Fund | | Small Cap Value Fund |
Capital Growth Fund | | Index Fund | | Small Company Growth Fund |
Common Stock Fund | | International Equity Fund | | Small Company Value Fund |
Disciplined U.S. Core Fund | | International Value Fund | | Small/Mid Cap Core Fund |
Discovery Fund† | | Intrinsic Small Cap Value Fund | | Small/Mid Cap Value Fund |
Diversified Equity Fund | | Intrinsic Value Fund | | Social Sustainability Fund† |
Diversified International Fund | | Intrinsic World Equity Fund | | Special Mid Cap Value Fund |
Diversified Small Cap Fund | | Large Cap Core Fund | | Special Small Cap Value Fund |
Emerging Growth Fund | | Large Cap Growth Fund | | Specialized Technology Fund |
Emerging Markets Equity Fund | | Large Company Value Fund | | Strategic Large Cap Growth Fund |
Endeavor Select Fund† | | Omega Growth Fund | | Traditional Small Cap Growth Fund |
Enterprise Fund† | | Opportunity Fund† | | Utility and Telecommunications Fund |
Equity Value Fund | | Precious Metals Fund | | |
| Bond Funds | | | | |
Adjustable Rate Government Fund | | Inflation-Protected Bond Fund | | Short-Term Bond Fund |
California Limited-Term Tax-Free Fund | | Intermediate Tax/AMT-Free Fund | | Short-Term High Yield Bond Fund |
California Tax-Free Fund | | International Bond Fund | | Short-Term Municipal Bond Fund |
Colorado Tax-Free Fund | | Minnesota Tax-Free Fund | | Strategic Municipal Bond Fund |
Government Securities Fund | | Municipal Bond Fund | | Total Return Bond Fund |
High Income Fund | | North Carolina Tax-Free Fund | | Ultra Short-Term Income Fund |
High Yield Bond Fund | | Pennsylvania Tax-Free Fund | | Ultra Short-Term Municipal Income Fund |
Income Plus Fund | | Short Duration Government Bond Fund | | Wisconsin Tax-Free Fund |
| Asset Allocation Funds | | | | |
Asset Allocation Fund | | WealthBuilder Equity Portfolio† | | Target 2020 Fund† |
Conservative Allocation Fund | | WealthBuilder Growth Allocation Portfolio† | | Target 2025 Fund† |
Diversified Capital Builder Fund | | WealthBuilder Growth Balanced Portfolio† | | Target 2030 Fund† |
Diversified Income Builder Fund | | WealthBuilder Moderate Balanced Portfolio† | | Target 2035 Fund† |
Growth Balanced Fund | | WealthBuilder Tactical Equity Portfolio† | | Target 2040 Fund† |
Index Asset Allocation Fund | | Target Today Fund† | | Target 2045 Fund† |
Moderate Balanced Fund | | Target 2010 Fund† | | Target 2050 Fund† |
WealthBuilder Conservative Allocation Portfolio† | | Target 2015 Fund† | | Target 2055 Fund† |
| Money Market Funds | | | | |
100% Treasury Money Market Fund | | Minnesota Money Market Fund | | New Jersey Municipal Money Market Fund |
California Municipal Money Market Fund | | Money Market Fund | | New York Municipal Money Market Fund |
Cash Investment Money Market Fund | | Municipal Cash Management Money Market Fund | | Pennsylvania Municipal Money Market Fund |
Government Money Market Fund | | Municipal Money Market Fund | | Prime Investment Money Market Fund |
Heritage Money Market Fund† | | National Tax-Free Money Market Fund | | Treasury Plus Money Market Fund |
| Variable Trust Funds1 | | | | |
VT Discovery Fund† | | VT Intrinsic Value Fund | | VT Small Cap Growth Fund |
VT Index Asset Allocation Fund | | VT Omega Growth Fund | | VT Small Cap Value Fund |
VT International Equity Fund | | VT Opportunity Fund† | | VT Total Return Bond Fund |
An investment in a money market fund is not insured or guaranteed by the Federal Deposit Insurance Corporation or any other government agency. Although the Wells Fargo Advantage Money Market Funds seek to preserve the value of your investment at $1.00 per share, it is possible to lose money by investing in a money market fund.
| 1. | The Variable Trust Funds are generally available only through insurance company variable contracts. |
| † | In this report, the Wells Fargo Advantage Discovery FundSM, Wells Fargo Advantage Endeavor Select FundSM, Wells Fargo Advantage Enterprise FundSM, Wells Fargo Advantage Opportunity FundSM, Wells Fargo Advantage Social Sustainability FundSM, Wells Fargo Advantage WealthBuilder Conservative Allocation PortfolioSM, Wells Fargo Advantage WealthBuilder Equity PortfolioSM, Wells Fargo Advantage WealthBuilder Growth Allocation PortfolioSM, Wells Fargo Advantage WealthBuilder Growth Balanced PortfolioSM, Wells Fargo Advantage WealthBuilder Moderate Balanced PortfolioSM, Wells Fargo Advantage WealthBuilder Tactical Equity PortfolioSM, Wells Fargo Advantage Dow Jones Target Today FundSM, Wells Fargo Advantage Dow Jones Target 2010 FundSM, Wells Fargo Advantage Dow Jones Target 2015 FundSM, Wells Fargo Advantage Dow Jones Target 2020 FundSM, Wells Fargo Advantage Dow Jones Target 2025 FundSM, Wells Fargo Advantage Dow Jones Target 2030 FundSM, Wells Fargo Advantage Dow Jones Target 2035 FundSM, Wells Fargo Advantage Dow Jones Target 2040 FundSM, Wells Fargo Advantage Dow Jones Target 2045 FundSM, Wells Fargo Advantage Dow Jones Target 2050 FundSM, Wells Fargo Advantage Dow Jones Target 2055 FundSM, Wells Fargo Advantage Heritage Money Market FundSM, Wells Fargo Advantage VT Discovery FundSM, and Wells Fargo Advantage VT Opportunity FundSM are referred to as the Discovery Fund, Endeavor Select Fund, Enterprise Fund, Opportunity Fund, Social Sustainability Fund, WealthBuilder Conservative Allocation Portfolio, WealthBuilder Equity Portfolio, WealthBuilder Growth Allocation Portfolio, WealthBuilder Growth Balanced Portfolio, WealthBuilder Moderate Balanced Portfolio, WealthBuilder Tactical Equity Portfolio, Target Today Fund, Target 2010 Fund, Target 2015 Fund, Target 2020 Fund, Target 2025 Fund, Target 2030 Fund, Target 2035 Fund, Target 2040 Fund, Target 2045 Fund, Target 2050 Fund, Target 2055 Fund, Heritage Money Market Fund, VT Discovery Fund, and VT Opportunity Fund, respectively. |
Not part of the semi-annual report.
| | | | |
| 2 | | Wells Fargo Advantage 100% Treasury Money Market Fund | | Letter to Shareholders |

Karla M. Rabusch,
President
Wells Fargo Advantage Funds
Dear Valued Shareholder,
We’re pleased to offer you this semi-annual report for the Wells Fargo Advantage 100% Treasury Money Market Fund for the six-month period that ended July 31, 2011. Upon reviewing the report, you may notice a few changes from past reports, the most significant of which is the change from a multi-fund report to a single-fund report. We believe this change will give you more convenient access to your fund data.
The period began modestly as improving economic optimism generally shifted investors toward equities and riskier assets and away from U.S. Treasuries and lower-yielding fixed-income securities. Returns from fixed income were modest in the opening months of 2011 but were generally still positive as U.S. Treasury yields incrementally climbed higher. But after the slow start, bond prices once again strongly improved, sparked by a sharp decline in U.S. Treasury prices in April that carried into May. Late in the period, lower-rated bonds declined in price more than the higher credit-quality tiers but not enough to outweigh the stronger performance from lower-rated securities during the period. Lower-quality and longer-maturity fixed-income securities generally outperformed higher-quality and shorter-maturity securities over the full period.
The activity within the broader bond market also resonated with money market participants. As the economic and credit environment reverberated from the ongoing sovereign debt concerns and softening economic data, many participants continued to balance a need for stability and desire for higher yields. The result has been good demand for domestic commercial paper and certificate of deposits. Also, in spite of all the discussion about sovereign debt, many money market participants continue to maintain some exposures to foreign banks based on the quality of their fundamentals. By focusing more on the fundamentals and taking a more selective approach to the short-term security market helped the markets avoid the severe yield volatility or significant flight-to-quality experienced during the spring of 2010, when the Greek sovereign debt crisis first emerged.
The global economic “recovery” hit a snag, but the end of 2011 could regain momentum.
The U.S. economic recovery that began in mid-2009 and gained further momentum throughout 2010, particularly during the fourth quarter, has failed to maintain that level of growth through the first seven months of 2011. For example, gross domestic product (GDP), the broadest measure of economic activity, grew at an annualized rate of 3.1% in the fourth quarter of 2010, only to slow dramatically during the first quarter of 2011. The latest revision to first-quarter GDP data during the period indicated that the economy grew at an annualized rate of 0.4% during the first quarter of 2011. While still positive, it’s a much slower pace of growth than experienced in the second half of 2010 and notably lower than consensus forecasts. Nevertheless, the advance estimate of second-quarter 2011 GDP, which was released on July 29, 2011, was 1.3%, suggesting that the U.S. economy continues to expand, though at a slow and uneven pace.
Jobs and housing remained troublesome.
The July 2011 unemployment rate in the U.S. was reported at 9.1%, down from 9.5% a year earlier but still notably higher than historical averages. Unfortunately,
| | | | | | |
| Letter to Shareholders | | Wells Fargo Advantage 100% Treasury Money Market Fund | | | 3 | |
the drop may be more attributable to a decline in the labor force than to a meaningful uptick in hiring. The level of job creation in 2011 has been trending below historical averages, suggesting that the improving economy has yet to translate into widespread hiring. Meanwhile, the beleaguered housing market was an ongoing source of concern, despite some tentative late-year signs of stabilization. That said, persistent weakness in the labor and housing markets bears close watching in the months ahead.
Other economic data in the U.S. has been more encouraging, reflecting greater confidence in the sustainability of the expansion on the part of both consumers and businesses. Retail sales came in strong at certain points during the period and industrial production and new orders have picked up. Although still reluctant to hire, businesses have gradually increased spending in other areas, such as equipment and information technology. Core inflation, which excludes volatile food and energy prices, remained benign.
The Federal Reserve believes the economic recovery will accelerate in future quarters.
With inflation subdued, the Federal Open Market Committee (FOMC) held its target range for the federal funds rate—a proxy for short-term interest rates—steady at 0.00% to 0.25%. On June 22, 2011, in its final statement of the six-month period, the Fed reiterated that the economic recovery “is proceeding at a moderate pace,” but that “recent labor market indicators have been weaker than anticipated.” It described the recent increase in inflation as temporary, suggesting that inflation pressures will ease going forward. While the FOMC explained that it “expects the pace of recovery to pick up over coming quarters,” it indicated that the federal funds rate will remain at an exceptionally low level for as long as necessary to ensure a sustainable recovery and expansion.
As recent headwinds subside, it is reasonable to expect markets to regain focus.
Now that it appears the debt ceiling has been increased and a U.S. default will be averted, money market participants and the broader bond market can get back to more fundamental and lasting concerns—chiefly, the economy. After avoiding short-term Treasuries in late July 2011, ahead of pending U.S. debt ceiling deadline, money market participants have returned to the U.S. short-term markets1. Economic indicators released in the second half of 2011 might not be as soft as those reported during the first half of the year. While that would not mean that the economy is robust, it might remind the markets that the first half of the slowdown was transitory. Most indicators still point toward real GDP growth in the 2% to 3% range in the second half of 2011. While that is not enough to produce big employment gains, it might be sufficient to cause Treasury yields to retrace some of the late-July declines.
Don’t let short-term uncertainty derail long-term investment goals.
While periods of uncertainty can present challenges, experience has taught us that maintaining a long-term investment strategy based on individual goals and risk tolerance can be an effective way to plan for the future. As a whole, Wells Fargo Advantage Funds represents investments across a broad range of asset classes and investment styles with more than 110 mutual funds, giving you an
| 1. | Comments expressed that do not fall within the reporting period are as of August 2, 2011. |
While the FOMC explained that it “expects the pace of recovery to pick up over coming quarters,” it indicated that the federal funds rate will remain at an exceptionally low level for as long as necessary to ensure a sustainable recovery and expansion.
Economic indicators released in the second half of 2011 might not be as soft as those reported during the first half of the year. While that would not mean that the economy is robust, it might remind the markets that the first half of the slowdown was transitory.
| | | | |
| 4 | | Wells Fargo Advantage 100% Treasury Money Market Fund | | Letter to Shareholders |
opportunity to create a diversified investment portfolio. While diversification may not prevent losses in a downturn, it may help to reduce them and provide you with one way of managing risk.
In our opinion, diligent and earnest assessment of the fundamental characteristics of money market eligible securities will be a key differentiating factor between which investment strategies meet client expectations and which do not. At Wells Fargo Advantage Funds, we intend to continue the emphasis of principal preservation and high liquidity across our lineup of Wells Fargo Advantage Money Market Funds. In changing markets, we believe it is particularly important to have diligent investment analysts in charge of investor assets.
Thank you for choosing Wells Fargo Advantage Funds. We appreciate your confidence in us and are committed to helping you meet your financial needs. If you have any questions about your investments, please contact your investment professional, call us at 1-800-222-8222, or visit www.wellsfargo.com/advantagefunds.
Sincerely,

Karla M. Rabusch
President
Wells Fargo Advantage Funds
| | | | | | |
| Performance Highlights (Unaudited) | | Wells Fargo Advantage 100% Treasury Money Market Fund | | | 5 | |
INVESTMENT OBJECTIVE
The Fund seeks current income exempt from most state and local individual income taxes, while preserving capital and liquidity.
ADVISER
Wells Fargo Funds Management, LLC
SUB-ADVISER
Wells Capital Management Incorporated
PORTFOLIO MANAGERS
David D. Sylvester
Laurie White
FUND INCEPTION
December 3, 1990
| | |
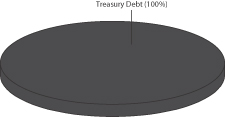
PORTFOLIO COMPOSITION1 (AS OF JULY 31, 2011) |
|
 |
|
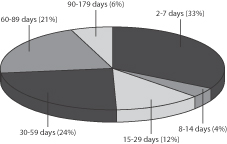
EFFECTIVE MATURITY DISTRIBUTION1 (AS OF JULY 31, 2011) |
|
 |
| | |
WEIGHTED AVERAGE MATURITY2 (AS OF JULY 31, 2011) | | |
36 Days |
| | |
WEIGHTED AVERAGE FINAL MATURITY3 (AS OF
JULY 31, 2011) | | |
36 Days |
| 1. | Portfolio composition and effective maturity distribution are subject to change and are calculated based on the total investments of the Fund. Effective maturity distribution is based on the weighted average maturity of each security. |
| 2. | Weighted Average Maturity (WAM): WAM calculates an average time to maturity of all of the securities held in the portfolio, weighted by each security’s percentage of net assets. The calculation takes into account the final maturity of a fixed-income security and the interest rate reset date for floating-rate securities held in the portfolio. This is a way to measure a fund’s sensitivity to potential interest rate changes. |
| 3. | Weighted Average Final Maturity (WAFM): WAFM calculates a fund’s average time to maturity for all of the securities held in the portfolio, weighted to their percentage of assets in the Fund. In contrast to WAM, the WAFM calculation takes into account the final maturity date for each security held in the portfolio. This is a way to measure a fund’s potential sensitivity to credit spread changes. |
| | | | |
| 6 | | Wells Fargo Advantage 100% Treasury Money Market Fund | | Performance Highlights (Unaudited) |
AVERAGE ANNUAL TOTAL RETURN4 (%) (AS OF JULY 31, 2011)
| | | | | | | | | | | | | | | | | | | | | | | | | | | | |
| | | | | | | | | | | | | | | | | | Expense Ratios5 | |
| | | Inception Date | | | 6 Months* | | | 1 Year | | | 5 Year | | | 10 Year | | | Gross | | | Net6 | |
Class A (WFTXX) | | | 11/08/1999 | | | | 0.00 | | | | 0.01 | | | | 1.42 | | | | 1.49 | | | | 0.80% | | | | 0.65% | |
Administrator Class (WTRXX) | | | 06/30/2010 | | | | 0.00 | | | | 0.01 | | | | 1.49 | | | | 1.61 | | | | 0.53% | | | | 0.30% | |
Service Class (NWTXX) | | | 12/03/1990 | | | | 0.00 | | | | 0.01 | | | | 1.49 | | | | 1.61 | | | | 0.70% | | | | 0.50% | |
Sweep Class | | | 06/30/2010 | | | | 0.00 | | | | 0.01 | | | | 1.49 | | | | 1.61 | | | | 1.15% | | | | 1.05% | |
| * | Returns for periods of less than one year are not annualized. |
| | | | | | | | | | | | | | | | |
FUND YIELD SUMMARY6 (AS OF JULY 31, 2011) | | Class A | | | Administrator Class | | | Service Class | | | Sweep Class | |
7-Day Current Yield | | | 0.01% | | | | 0.01% | | | | 0.01% | | | | 0.01% | |
7-Day Compound Yield | | | 0.01% | | | | 0.01% | | | | 0.01% | | | | 0.01% | |
30-Day Simple Yield | | | 0.01% | | | | 0.01% | | | | 0.01% | | | | 0.01% | |
30-Day Compound Yield | | | 0.01% | | | | 0.01% | | | | 0.01% | | | | 0.01% | |
Figures quoted represent past performance, which is no guarantee of future results and do not reflect the deduction of taxes that a shareholder may pay on fund distributions or the redemption of fund shares. Investment returns will fluctuate. The Fund’s yield figures more closely reflect the current earnings of the Fund than the total return figures. Current performance may be lower or higher than the performance data quoted. Current month-end performance is available at the Fund’s Web site – www.wellsfargo.com/advantagefunds.
Each class is sold without a front-end sales charge or contingent deferred sales charge. Other fees and expenses apply to an investment in the Fund and are described in the Fund’s current prospectus.
An investment in a money market fund is not insured or guaranteed by the Federal Deposit Insurance Corporation or any other government agency. Although the Fund seeks to preserve the value of your investment at $1.00 per share, it is possible to lose money by investing in a money market fund. The U.S. Government guarantee applies to certain of the underlying securities held by the Fund and not to shares of the Fund itself.
| 4. | Historical performance shown for the Administrator Class shares prior to their inception reflects the performance of the Service Class shares, and includes the higher expenses applicable to the Service Class shares. If these expenses had not been included, returns would be higher. Historical performance shown for the Sweep Class shares prior to their inception reflects the performance of the Service Class shares, and has not been adjusted to reflect the higher expenses applicable to the Sweep Class shares. If these expenses had been adjusted, returns would be lower. |
| 5. | Reflects the expense ratios as stated in the most recent prospectuses. |
| 6. | The Adviser has committed through July 11, 2013 to waive fees and/or reimburse expenses to the extent necessary to cap the Fund’s Total Annual Fund Operating Expenses After Fee Waiver, excluding certain expenses, at the amount shown above. Without this cap, the Fund’s returns would have been lower. Without waived fees and/or reimbursed expenses, the Fund’s 7-day current yield would have been (0.75)%, (0.48)%, (0.65)% and (1.10)% for Class A, Administrator Class, Service Class and Sweep Class, respectively. |
| | | | | | |
| Fund Expenses | | Wells Fargo Advantage 100% Treasury Money Market Fund | | | 7 | |
As a shareholder of the Fund, you incur two types of costs: (1) transaction costs, including contingent deferred sales charges (if any) and (2) ongoing costs, including management fees; distribution (12b-1) and/or shareholder service fees; and other Fund expenses. This example is intended to help you understand your ongoing costs (in dollars) of investing in the Fund and to compare these costs with the ongoing costs of investing in other mutual funds.
The example is based on an investment of $1,000 invested at the beginning of the six-month period and held for the entire period from February 1, 2011 to July 31, 2011.
Actual Expenses
The “Actual” line of the table below provides information about actual account values and actual expenses. You may use the information in this line, together with the amount you invested, to estimate the expenses that you paid over the period. Simply divide your account value by $1,000 (for example, an $8,600 account value divided by $1,000 = 8.6), then multiply the result by the number in the “Actual” line under the heading entitled “Expenses Paid During Period” for your applicable class of shares to estimate the expenses you paid on your account during this period.
Hypothetical Example for Comparison Purposes
The “Hypothetical” line of the table below provides information about hypothetical account values and hypothetical expenses based on the Fund’s actual expense ratio and an assumed rate of return of 5% per year before expenses, which is not the Fund’s actual return. The hypothetical account values and expenses may not be used to estimate the actual ending account balance or expenses you paid for the period. You may use this information to compare the ongoing costs of investing in the Fund and other funds. To do so, compare this 5% hypothetical example with the 5% hypothetical examples that appear in the shareholder reports of the other funds.
Please note that the expenses shown in the table are meant to highlight your ongoing costs only and do not reflect any transactional costs, such as any contingent deferred sales charges. Therefore, the “Hypothetical” line of the table is useful in comparing ongoing costs only, and will not help you determine the relative total costs of owning different funds. In addition, if these transactional costs were included, your costs would have been higher.
| | | | | | | | | | | | | | | | |
| | | Beginning
Account Value
02-01-2011 | | | Ending
Account Value
07-31-2011 | | | Expenses
Paid During
the Period¹ | | | Net Annual
Expense Ratio | |
Class A | | | | | | | | | | | | | | | | |
Actual | | $ | 1,000.00 | | | $ | 1,000.05 | | | $ | 0.40 | | | | 0.08 | % |
Hypothetical (5% return before expenses) | | $ | 1,000.00 | | | $ | 1,024.40 | | | $ | 0.40 | | | | 0.08 | % |
Administrator Class | | | | | | | | | | | | | | | | |
Actual | | $ | 1,000.00 | | | $ | 1,000.05 | | | $ | 0.35 | | | | 0.07 | % |
Hypothetical (5% return before expenses) | | $ | 1,000.00 | | | $ | 1,024.45 | | | $ | 0.35 | | | | 0.07 | % |
Service Class | | | | | | | | | | | | | | | | |
Actual | | $ | 1,000.00 | | | $ | 1,000.05 | | | $ | 0.40 | | | | 0.08 | % |
Hypothetical (5% return before expenses) | | $ | 1,000.00 | | | $ | 1,024.40 | | | $ | 0.40 | | | | 0.08 | % |
Sweep Class | | | | | | | | | | | | | | | | |
Actual | | $ | 1,000.00 | | | $ | 1,000.05 | | | $ | 0.35 | | | | 0.07 | % |
Hypothetical (5% return before expenses) | | $ | 1,000.00 | | | $ | 1,024.45 | | | $ | 0.35 | | | | 0.07 | % |
| 1. | Expenses paid is equal to the annualized expense ratio of each class multiplied by the average account value over the period, multiplied by the number of days in the most recent fiscal half-year divided by the number of days in the fiscal year (to reflect the one-half year period). |
| | | | |
| 8 | | Wells Fargo Advantage 100% Treasury Money Market Fund | | Portfolio of Investments—July 31, 2011 (Unaudited) |
| | | | | | | | | | | | | | | | |
| Security Name | | Yield | | | Maturity Date | | | Principal | | | Value | |
| | | | |
Treasury Debt: 70.55% | | | | | | | | | | | | | | | | |
US Treasury Bill | | | 0.01 | % | | | 08/04/2011 | | | $ | 370,000,000 | | | $ | 369,999,655 | |
US Treasury Bill | | | 0.01 | | | | 08/11/2011 | | | | 409,540,000 | | | | 409,536,399 | |
US Treasury Bill | | | 0.01 | | | | 08/25/2011 | | | | 678,575,000 | | | | 678,563,899 | |
US Treasury Bill | | | 0.01 | | | | 09/01/2011 | | | | 650,000,000 | | | | 649,978,551 | |
US Treasury Bill | | | 0.01 | | | | 09/22/2011 | | | | 708,470,000 | | | | 708,429,836 | |
US Treasury Bill | | | 0.01 | | | | 10/20/2011 | | | | 570,000,000 | | | | 569,976,000 | |
US Treasury Bill | | | 0.02 | | | | 08/18/2011 | | | | 632,590,000 | | | | 632,584,129 | |
US Treasury Bill | | | 0.02 | | | | 09/29/2011 | | | | 540,000,000 | | | | 539,977,384 | |
US Treasury Bill | | | 0.03 | | | | 10/06/2011 | | | | 487,490,000 | | | | 487,465,422 | |
US Treasury Bill | | | 0.03 | | | | 10/13/2011 | | | | 580,000,000 | | | | 579,966,136 | |
US Treasury Bill | | | 0.04 | | | | 09/08/2011 | | | | 567,070,000 | | | | 567,042,446 | |
US Treasury Bill | | | 0.05 | | | | 09/15/2011 | | | | 570,000,000 | | | | 569,960,464 | |
US Treasury Bill | | | 0.06 | | | | 10/27/2011 | | | | 630,000,000 | | | | 629,912,456 | |
| | | | | | | | |
| Total Investments in Securities | | | | | | | | |
| (Cost $7,393,392,777)* | | | 70.55 | % | | | 7,393,392,777 | |
Other Assets and Liabilities, Net | | | 29.45 | | | | 3,085,557,101 | |
| | | | | | | | |
| Total Net Assets | | | 100.00 | % | | $ | 10,478,949,878 | |
| | | | | | | | |
| * | Cost for federal income tax purposes is substantially the same as for financial reporting purposes. |
The accompanying notes are an integral part of these financial statements.
| | | | | | |
| Statement of Assets and Liabilities—July 31, 2011 (Unaudited) | | Wells Fargo Advantage 100% Treasury Money Market Fund | | | 9 | |
| | | | |
| | | | |
| |
Assets | | | | |
Investments in unaffiliated securities, at amortized cost | | $ | 7,393,392,777 | |
Cash | | | 3,093,085,376 | |
Receivable for Fund shares sold | | | 3,216,591 | |
Receivable from adviser | | | 3,762,523 | |
Prepaid expenses and other assets | | | 206,042 | |
| | | | |
Total assets | | | 10,493,663,309 | |
| | | | |
| |
Liabilities | | | | |
Dividends payable | | | 53,474 | |
Payable for Fund shares redeemed | | | 10,217,670 | |
Distribution fees payable | | | 74,304 | |
Due to other related parties | | | 1,639,472 | |
Shareholder servicing fees payable | | | 2,268,494 | |
Accrued expenses and other liabilities | | | 460,017 | |
| | | | |
Total liabilities | | | 14,713,431 | |
| | | | |
Total net assets | | $ | 10,478,949,878 | |
| | | | |
| |
NET ASSETS CONSIST OF | | | | |
Paid-in capital | | $ | 10,478,278,699 | |
Overdistributed net investment income | | | (5,010 | ) |
Accumulated net realized gains on investments | | | 676,189 | |
| | | | |
Total net assets | | $ | 10,478,949,878 | |
| | | | |
| |
COMPUTATION OF NET ASSET VALUE PER SHARE1 | | | | |
Net assets – Class A | | $ | 218,047,650 | |
Shares outstanding – Class A | | | 218,020,853 | |
Net asset value per share – Class A | | | $1.00 | |
Net assets – Administrator Class | | $ | 1,421,234,141 | |
Shares outstanding – Administrator Class | | | 1,421,137,378 | |
Net asset value per share – Administrator Class | | | $1.00 | |
Net assets – Service Class | | $ | 8,582,303,225 | |
Shares outstanding – Service Class | | | 8,581,256,660 | |
Net asset value per share – Service Class | | | $1.00 | |
Net assets – Sweep Class | | $ | 257,364,862 | |
Shares outstanding – Sweep Class | | | 257,352,513 | |
Net asset value per share – Sweep Class | | | $1.00 | |
| 1. | The Fund has an unlimited number of authorized shares. |
The accompanying notes are an integral part of these financial statements.
| | | | |
| 10 | | Wells Fargo Advantage 100% Treasury Money Market Fund | | Statement of Operations—Six Months Ended July 31, 2011 (Unaudited) |
| | | | |
| | | | |
| |
Investment income | | | | |
Interest | | $ | 4,886,671 | |
| | | | |
| |
Expenses | | | | |
Advisory fee | | | 14,188,493 | |
Administration fees | | | | |
Fund level | | | 2,354,599 | |
Class A | | | 229,749 | |
Administrator Class | | | 498,221 | |
Service Class | | | 5,650,625 | |
Sweep Class | | | 145,984 | |
Shareholder servicing fees | | | | |
Class A | | | 140,316 | |
Administrator Class | | | 493,664 | |
Service Class | | | 11,672,757 | |
Sweep Class | | | 165,890 | |
Distribution fees | | | | |
Sweep Class | | | 232,246 | |
Custody and accounting fees | | | 215,987 | |
Professional fees | | | 17,195 | |
Registration fees | | | 53,956 | |
Shareholder report expenses | | | 34,772 | |
Trustees’ fees and expenses | | | 8,592 | |
Other fees and expenses | | | 73,527 | |
| | | | |
Total expenses | | | 36,176,573 | |
Less: Fee waivers and/or expense reimbursements | | | (31,827,650 | ) |
| | | | |
Net expenses | | | 4,348,923 | |
| | | | |
Net investment income | | | 537,748 | |
Net realized gains on investments | | | 669,962 | |
| | | | |
Net increase in net assets resulting from operations | | $ | 1,207,710 | |
| | | | |
The accompanying notes are an integral part of these financial statements.
| | | | | | |
| Statements of Changes in Net Assets | | Wells Fargo Advantage 100% Treasury Money Market Fund | | | 11 | |
| | | | | | | | | | | | | | | | | | | | | | | | |
| | | Six Months Ended July 31, 2011 (Unaudited) | | | Year Ended January 31, 20111 | | | Year Ended February 28, 2010 | |
| | | | | | |
Operations | | | | | | | | | | | | | | | | | | | | | | | | |
Net investment income | | | | | | $ | 537,748 | | | | | | | $ | 783,699 | | | | | | | $ | 683,644 | |
Net realized gains on investments | | | | | | | 669,962 | | | | | | | | 402,741 | | | | | | | | 360,468 | |
| | | | | | | | | | | | | | | | | | | | | | | | |
Net increase in net assets resulting from operations | | | | | | | 1,207,710 | | | | | | | | 1,186,440 | | | | | | | | 1,044,112 | |
| | | | | | | | | | | | | | | | | | | | | | | | |
| | | | | | |
Distributions to shareholders from | | | | | | | | | | | | | | | | | | | | | | | | |
Net investment income | | | | | | | | | | | | | | | | | | | | | | | | |
Class A | | | | | | | (10,442 | ) | | | | | | | (23,261 | ) | | | | | | | (26,382 | ) |
Administrator Class | | | | | | | (49,819 | ) | | | | | | | (31,383 | )2 | | | | | | | NA | |
Service Class | | | | | | | (470,851 | ) | | | | | | | (727,528 | ) | | | | | | | (657,259 | ) |
Sweep Class | | | | | | | (6,636 | ) | | | | | | | (1,527 | )2 | | | | | | | NA | |
Net realized gains | | | | | | | | | | | | | | | | | | | | | | | | |
Class A | | | | | | | 0 | | | | | | | | (5,976 | ) | | | | | | | (61,610 | ) |
Administrator Class | | | | | | | 0 | | | | | | | | (16,757 | )2 | | | | | | | NA | |
Service Class | | | | | | | 0 | | | | | | | | (225,828 | ) | | | | | | | (1,569,437 | ) |
Sweep Class | | | | | | | 0 | | | | | | | | (1,348 | )2 | | | | | | | NA | |
| | | | | | | | | | | | | | | | | | | | | | | | |
Total distributions to shareholders | | | | | | | (537,748 | ) | | | | | | | (1,033,608 | ) | | | | | | | (2,314,688 | ) |
| | | | | | | | | | | | | | | | | | | | | | | | |
| | | | | | |
| | | Shares | | | | | | Shares | | | | | | Shares | | | | |
| | | | | | |
Capital share transactions | | | | | | | | | | | | | | | | | | | | | | | | |
Proceeds from shares sold | | | | | | | | | | | | | | | | | | | | | | | | |
Class A | | | 114,107,492 | | | | 114,107,492 | | | | 344,729,879 | | | | 344,729,879 | | | | 373,885,007 | | | | 373,885,007 | |
Administrator Class | | | 2,068,944,842 | | | | 2,068,944,842 | | | | 1,512,300,388 | 2 | | | 1,512,300,388 | 2 | | | NA | | | | NA | |
Service Class | | | 19,920,607,260 | | | | 19,920,607,260 | | | | 37,849,862,686 | | | | 37,849,862,686 | | | | 18,506,252,685 | | | | 18,506,252,685 | |
Sweep Class | | | 856,448,361 | | | | 856,448,361 | | | | 204,563,566 | 2 | | | 204,563,566 | 2 | | | NA | | | | NA | |
| | | | | | | | | | | | | | | | | | | | | | | | |
| | | | | | | 22,960,107,955 | | | | | | | | 39,911,456,519 | | | | | | | | 18,880,137,692 | |
| | | | | | | | | | | | | | | | | | | | | | | | |
Reinvestment of distributions | | | | | | | | | | | | | | | | | | | | | | | | |
Class A | | | 9,882 | | | | 9,882 | | | | 28,088 | | | | 28,088 | | | | 85,089 | | | | 85,089 | |
Administrator Class | | | 25,683 | | | | 25,683 | | | | 25,081 | 2 | | | 25,081 | 2 | | | NA | | | | NA | |
Service Class | | | 192,564 | | | | 192,564 | | | | 368,241 | | | | 368,241 | | | | 757,091 | | | | 757,091 | |
Sweep Class | | | 6,636 | | | | 6,636 | | | | 2,875 | 2 | | | 2,875 | 2 | | | NA | | | | NA | |
| | | | | | | | | | | | | | | | | | | | | | | | |
| | | | | | | 234,765 | | | | | | | | 424,285 | | | | | | | | 842,180 | |
| | | | | | | | | | | | | | | | | | | | | | | | |
Payment for shares redeemed | | | | | | | | | | | | | | | | | | | | | | | | |
Class A | | | (121,581,973 | ) | | | (121,581,973 | ) | | | (391,614,560 | ) | | | (391,614,560 | ) | | | (407,974,452 | ) | | | (407,974,452 | ) |
Administrator Class | | | (1,310,673,795 | ) | | | (1,310,673,795 | ) | | | (1,356,794,570 | )2 | | | (1,356,794,570 | )2 | | | NA | | | | NA | |
Service Class | | | (19,774,250,916 | ) | | | (19,774,250,916 | ) | | | (37,668,051,986 | ) | | | (37,668,051,986 | ) | | | (17,985,525,624 | ) | | | (17,985,525,624 | ) |
Sweep Class | | | (711,746,649 | ) | | | (711,746,649 | ) | | | (91,922,276 | )2 | | | (91,922,276 | )2 | | | NA | | | | NA | |
| | | | | | | | | | | | | | | | | | | | | | | | |
| | | | | | | (21,918,253,333 | ) | | | | | | | (39,508,383,392 | ) | | | | | | | (18,393,500,076 | ) |
| | | | | | | | | | | | | | | | | | | | | | | | |
Net asset value of shares issued in acquisition | | | | | | | | | | | | | | | | | | | | | | | | |
Administrator Class | | | 0 | | | | 0 | | | | 507,309,749 | | | | 507,326,387 | | | | 0 | | | | 0 | |
Service Class | | | 0 | | | | 0 | | | | 91,148,028 | | | | 91,202,804 | | | | 0 | | | | 0 | |
| | | | | | | | | | | | | | | | | | | | | | | | |
| | | | | | | 0 | | | | | | | | 598,529,191 | | | | | | | | 0 | |
| | | | | | | | | | | | | | | | | | | | | | | | |
Net increase in net assets resulting
from capital share transactions | | | | | | | 1,042,089,387 | | | | | | | | 1,002,026,603 | | | | | | | | 487,479,796 | |
| | | | | | | | | | | | | | | | | | | | | | | | |
Total increase in net assets | | | | | | | 1,042,759,349 | | | | | | | | 1,002,179,435 | | | | | | | | 486,209,220 | |
| | | | | | | | | | | | | | | | | | | | | | | | |
| | | | | | |
Net assets | | | | | | | | | | | | | | | | | | | | | | | | |
Beginning of period | | | | | | | 9,436,190,529 | | | | | | | | 8,434,011,094 | | | | | | | | 7,947,801,874 | |
| | | | | | | | | | | | | | | | | | | | | | | | |
End of period | | | | | | $ | 10,478,949,878 | | | | | | | $ | 9,436,190,529 | | | | | | | $ | 8,434,011,094 | |
| | | | | | | | | | | | | | | | | | | | | | | | |
Overdistributed net investment income | | | | | | $ | (5,010 | ) | | | | | | $ | (5,010 | ) | | | | | | $ | 0 | |
| | | | | | | | | | | | | | | | | | | | | | | | |
| 1. | For the eleven months ended January 31, 2011. The Fund changed its fiscal year ended from February 28 to January 31, 2011. |
| 2. | Class commenced operations on June 30, 2010. |
The accompanying notes are an integral part of these financial statements.
| | | | |
| 12 | | Wells Fargo Advantage 100% Treasury Money Market Fund | | Financial Highlights |
(For a share outstanding throughout each period)
| | | | | | | | | | | | | | | | | | | | | | | | | | | | |
| | | Six Months Ended
July 31, 2011
(Unaudited) | | | Year Ended
January 31,
20111 | | | Year Ended February 28, | |
| Class A | | | | 2010 | | | 2009 | | | 2008 | | | 2007 | | | 2006 | |
Net asset value, beginning of period | | $ | 1.00 | | | $ | 1.00 | | | $ | 1.00 | | | $ | 1.00 | | | $ | 1.00 | | | $ | 1.00 | | | $ | 1.00 | |
Net investment income | | | 0.00 | 2 | | | 0.00 | 2 | | | 0.00 | 2 | | | 0.01 | | | | 0.04 | | | | 0.04 | | | | 0.02 | |
Net realized gains (losses) on investments | | | 0.00 | 2 | | | 0.00 | 2 | | | 0.00 | | | | 0.00 | | | | 0.00 | | | | 0.00 | | | | 0.00 | |
| | | | | | | | | | | | | | | | | | | | | | | | | | | | |
Total from investment operations | | | 0.00 | 2 | | | 0.00 | 2 | | | 0.00 | 2 | | | 0.01 | | | | 0.04 | | | | 0.04 | | | | 0.02 | |
Distributions to shareholders from | | | | | | | | | | | | | | | | | | | | | | | | | | | | |
Net investment income | | | (0.00 | )2 | | | (0.00 | )2 | | | (0.00 | )2 | | | (0.01 | ) | | | (0.04 | ) | | | (0.04 | ) | | | (0.02 | ) |
Net realized gains | | | 0.00 | | | | (0.00 | )2 | | | (0.00 | )2 | | | 0.00 | | | | 0.00 | | | | 0.00 | | | | 0.00 | |
| | | | | | | | | | | | | | | | | | | | | | | | | | | | |
Total distributions to shareholders | | | (0.00 | )2 | | | (0.00 | )2 | | | (0.00 | )2 | | | (0.01 | ) | | | (0.04 | ) | | | (0.04 | ) | | | (0.02 | ) |
Net asset value, end of period | | $ | 1.00 | | | $ | 1.00 | | | $ | 1.00 | | | $ | 1.00 | | | $ | 1.00 | | | $ | 1.00 | | | $ | 1.00 | |
Total return3 | | | 0.00 | % | | | 0.01 | % | | | 0.03 | % | | | 0.74 | % | | | 3.81 | % | | | 4.29 | % | | | 2.50 | % |
Ratios to average net assets (annualized) | | | | | | | | | | | | | | | | | | | | | | | | | | | | |
Gross expenses | | | 0.67 | % | | | 0.75 | % | | | 0.80 | % | | | 0.83 | % | | | 0.83 | % | | | 0.84 | % | | | 0.83 | % |
Net expenses | | | 0.08 | % | | | 0.14 | % | | | 0.18 | % | | | 0.58 | % | | | 0.65 | % | | | 0.65 | % | | | 0.65 | % |
Net investment income | | | 0.01 | % | | | 0.01 | % | | | 0.01 | % | | | 0.68 | % | | | 3.75 | % | | | 4.23 | % | | | 2.72 | % |
Supplemental data | | | | | | | | | | | | | | | | | | | | | | | | | | | | |
Net assets, end of period (000’s omitted) | | | $218,048 | | | | $225,499 | | | | $272,399 | | | | $306,451 | | | | $298,220 | | | | $256,430 | | | | $201,384 | |
| 1. | For the eleven months ended January 31, 2011. The Fund changed its fiscal year end from February 28 to January 31, effective January 31, 2011. |
| 2. | Amount represents less than $0.005. |
| 3. | Returns for periods of less than one year are not annualized. |
The accompanying notes are an integral part of these financial statements.
| | | | | | |
| Financial Highlights | | Wells Fargo Advantage 100% Treasury Money Market Fund | | | 13 | |
(For a share outstanding throughout each period)
| | | | | | | | |
| Administrator Class | | Six Months Ended
July 31, 2011
(Unaudited) | | | Year Ended
January 31,
20111 | |
Net asset value, beginning of period | | $ | 1.00 | | | $ | 1.00 | |
Net investment income | | | 0.00 | 2 | | | 0.00 | 2 |
Net realized gains (losses) on investments | | | 0.00 | 2 | | | 0.00 | 2 |
| | | | | | | | |
Total from investment operations | | | 0.00 | 2 | | | 0.00 | 2 |
Distributions to shareholders from | | | | | | | | |
Net investment income | | | (0.00 | )2 | | | (0.00 | )2 |
Net realized gains | | | (0.00 | )2 | | | (0.00 | )2 |
| | | | | | | | |
Total distributions to shareholders | | | (0.00 | )2 | | | (0.00 | )2 |
Net asset value, end of period | | $ | 1.00 | | | $ | 1.00 | |
Total return3 | | | 0.00 | % | | | 0.01 | % |
Ratios to average net assets (annualized) | | | | | | | | |
Gross expenses | | | 0.51 | % | | | 0.52 | % |
Net expenses | | | 0.07 | % | | | 0.14 | % |
Net investment income | | | 0.01 | % | | | 0.01 | % |
Supplemental data | | | | | | | | |
Net assets, end of period (000’s omitted) | | | $1,421,234 | | | | $662,873 | |
| 1. | For the period from June 30, 2010 (commencement of class operations) to January 31, 2011. |
| 2. | Amount represents less than $0.005. |
| 3. | Returns for periods of less than one year are not annualized. |
The accompanying notes are an integral part of these financial statements.
| | | | |
| 14 | | Wells Fargo Advantage 100% Treasury Money Market Fund | | Financial Highlights |
(For a share outstanding throughout each period)
| | | | | | | | | | | | | | | | | | | | | | | | | | | | |
| | | Six Months Ended
July 31, 2011
(Unaudited) | | | Year Ended
January 31,
20111 | | | Year Ended February 28, | |
| Service Class | | | | 2010 | | | 2009 | | | 2008 | | | 2007 | | | 2006 | |
Net asset value, beginning of period | | $ | 1.00 | | | $ | 1.00 | | | $ | 1.00 | | | $ | 1.00 | | | $ | 1.00 | | | $ | 1.00 | | | $ | 1.00 | |
Net investment income | | | 0.00 | 2 | | | 0.00 | 2 | | | 0.00 | 2 | | | 0.01 | | | | 0.04 | | | | 0.04 | | | | 0.03 | |
Net realized gains (losses) on investments | | | 0.00 | 2 | | | 0.00 | 2 | | | 0.00 | 2 | | | 0.00 | | | | 0.00 | | | | 0.00 | | | | 0.00 | |
| | | | | | | | | | | | | | | | | | | | | | | | | | | | |
Total from investment operations | | | 0.00 | 2 | | | 0.00 | 2 | | | 0.00 | 2 | | | 0.01 | | | | 0.04 | | | | 0.04 | | | | 0.03 | |
Distributions to shareholders from | | | | | | | | | | | | | | | | | | | | | | | | | | | | |
Net investment income | | | (0.00 | )2 | | | (0.00 | )2 | | | (0.00 | )2 | | | (0.01 | ) | | | (0.04 | ) | | | (0.04 | ) | | | (0.03 | ) |
Net realized gains | | | 0.00 | | | | (0.00 | )2 | | | (0.00 | )2 | | | (0.00 | )2 | | | 0.00 | | | | 0.00 | | | | 0.00 | |
| | | | | | | | | | | | | | | | | | | | | | | | | | | | |
Total distributions to shareholders | | | (0.00 | )2 | | | (0.00 | )2 | | | (0.00 | )2 | | | (0.01 | ) | | | (0.04 | ) | | | (0.04 | ) | | | (0.03 | ) |
Net asset value, end of period | | $ | 1.00 | | | $ | 1.00 | | | $ | 1.00 | | | $ | 1.00 | | | $ | 1.00 | | | $ | 1.00 | | | $ | 1.00 | |
Total return3 | | | 0.00 | % | | | 0.01 | % | | | 0.03 | % | | | 0.86 | % | | | 3.97 | % | | | 4.44 | % | | | 2.64 | % |
Ratios to average net assets (annualized) | | | | | | | | | | | | | | | | | | | | | | | | | | | | |
Gross expenses | | | 0.68 | % | | | 0.70 | % | | | 0.73 | % | | | 0.73 | % | | | 0.73 | % | | | 0.74 | % | | | 0.73 | % |
Net expenses | | | 0.08 | % | | | 0.14 | % | | | 0.17 | % | | | 0.46 | % | | | 0.50 | % | | | 0.50 | % | | | 0.50 | % |
Net investment income | | | 0.01 | % | | | 0.01 | % | | | 0.01 | % | | | 0.74 | % | | | 3.85 | % | | | 4.36 | % | | | 2.89 | % |
Supplemental data | | | | | | | | | | | | | | | | | | | | | | | | | | | | |
Net assets, end of period (000’s omitted) | | | $8,582,303 | | | | $8,435,170 | | | | $8,161,612 | | | | $7,641,351 | | | | $6,039,209 | | | | $4,049,964 | | | | $3,581,797 | |
| 1. | For the eleven months ended January 31, 2011. The Fund changed its fiscal year end from February 28 to January 31, effective January 31, 2011. |
| 2. | Amount represents less than $0.005. |
| 3. | Returns for periods of less than one year are not annualized. |
The accompanying notes are an integral part of these financial statements.
| | | | | | |
| Financial Highlights | | Wells Fargo Advantage 100% Treasury Money Market Fund | | | 15 | |
(For a share outstanding throughout each period)
| | | | | | | | |
| Sweep Class | | Six Months Ended
July 31, 2011
(Unaudited) | | | Year Ended
January 31,
20111 | |
Net asset value, beginning of period | | $ | 1.00 | | | $ | 1.00 | |
Net investment income | | | 0.00 | 2 | | | 0.00 | 2 |
Net realized gains (losses) on investments | | | 0.00 | 2 | | | 0.00 | 2 |
| | | | | | | | |
Total from investment operations | | | 0.00 | 2 | | | 0.00 | 2 |
Distributions to shareholders from | | | | | | | | |
Net investment income | | | (0.00 | )2 | | | (0.00 | )2 |
Net realized gains | | | 0.00 | | | | (0.00 | )2 |
| | | | | | | | |
Total distributions to shareholders | | | (0.00 | )2 | | | (0.00 | )2 |
Net asset value, end of period | | $ | 1.00 | | | $ | 1.00 | |
Total return3 | | | 0.00 | % | | | 0.01 | % |
Ratios to average net assets (annualized) | | | | | | | | |
Gross expenses | | | 1.13 | % | | | 1.14 | % |
Net expenses | | | 0.07 | % | | | 0.14 | % |
Net investment income | | | 0.01 | % | | | 0.01 | % |
Supplemental data | | | | | | | | |
Net assets, end of period (000’s omitted) | | | $257,365 | | | | $112,648 | |
| 1. | For the periods from June 30, 2010 (commencement of class operations) to January 31, 2011. |
| 2. | Amount represents less than $0.005. |
| 3. | Returns for periods of less than one year are not annualized. |
The accompanying notes are an integral part of these financial statements.
| | | | |
| 16 | | Wells Fargo Advantage 100% Treasury Money Market Fund | | Notes to Financial Statements (Unaudited) |
1. ORGANIZATION
Wells Fargo Funds Trust (the “Trust”), a Delaware statutory trust organized on March 10, 1999, is an open-end management investment company registered under the Investment Company Act of 1940, as amended (the “1940 Act”). These financial statements report on Wells Fargo Advantage 100% Treasury Money Market Fund (the “Fund”) which is a diversified series of the Trust.
2. SIGNIFICANT ACCOUNTING POLICIES
The following significant accounting policies, which are consistently followed in the preparation of the financial statements of the Fund, are in conformity with U.S. generally accepted accounting principles which require management to make estimates and assumptions that affect the reported amounts of assets and liabilities, disclosure of contingent assets and liabilities at the date of the financial statements, and the reported amounts of revenues and expenses during the reporting period. Actual results could differ from those estimates.
Securities valuation
As permitted under Rule 2a-7 of the 1940 Act, securities are valued at amortized cost, which approximates fair value.
The valuation techniques used by the Fund to measure fair value are consistent with the market approach, income approach and/or cost approach, where applicable, for each security type.
Security transactions and income recognition
Securities transactions are recorded on a trade date basis. Realized gains or losses are reported on the basis of identified cost of securities delivered.
Interest income is accrued daily and bond discounts are accreted and premiums are amortized daily based on the effective interest method. To the extent debt obligations are placed on non-accrual status, any related interest income may be reduced by writing off interest receivables when the collection of all or a portion of interest has become doubtful based on consistently applied procedures. If the issuer subsequently resumes interest payments or when the collectability of interest is reasonably assured, the debt obligation is removed from non-accrual status.
Distributions to shareholders
Distributions to shareholders from net investment income are accrued daily and paid monthly. Distributions from net realized gains, if any, are recorded on the ex-dividend date. Such distributions are determined in conformity with income tax regulations, which may differ from generally accepted accounting principles.
Federal and other taxes
The Fund intends to continue to qualify as a regulated investment company by distributing substantially all of its investment company taxable income and any net realized capital gains (after reduction for capital loss carryforwards) sufficient to relieve it from all, or substantially all, federal income taxes. Accordingly, no provision for federal income taxes was required.
The Fund’s income and federal excise tax returns and all financial records supporting those returns for the prior three fiscal years are subject to examination by the federal and Delaware revenue authorities.
Under the recently enacted Regulated Investment Company Modernization Act of 2010, the Fund will be permitted to carry forward capital losses incurred in taxable years beginning after December 22, 2010 for an unlimited period. However, any losses incurred during those future taxable years will be required to be utilized prior to the losses incurred in pre-enactment taxable years. As a result of this ordering rule, pre-enactment capital loss carryforwards may be more likely to expire unused. Additionally, post-enactment capital losses that are carried forward will retain their character as either short-term or long-term capital losses rather than being considered all short-term as under previous law.
Class allocations
The separate classes of shares offered by the Fund differ principally in distribution, shareholder servicing and administration fees. Shareholders of each class bear certain expenses that pertain to that particular class. All shareholders bear the common expenses of the Fund, earn income from the portfolio, and are allocated unrealized gains and losses pro rata based on the average daily net assets of each class, without distinction between share classes. Dividends are determined separately for each class based on income and expenses allocable to each class. Realized gains and losses are allocated to each class pro rata based upon the net assets of each class on the date realized. Differences in per share
| | | | | | |
| Notes to Financial Statements (Unaudited) | | Wells Fargo Advantage 100% Treasury Money Market Fund | | | 17 | |
dividend rates generally result from the relative weightings of pro rata income and realized gain allocations and from differences in separate class expenses, including distribution, shareholder servicing and administration fees.
3. FAIR VALUATION MEASUREMENTS:
Fair value measurements of investments are determined within a framework that has established a fair value hierarchy based upon the various data inputs utilized in determining the value of the Fund’s investments. The three-level hierarchy gives the highest priority to unadjusted quoted prices in active markets for identical assets or liabilities (Level 1) and the lowest priority to unobservable inputs (Level 3). The Fund’s investments are classified within the fair value hierarchy based on the lowest level of input that is significant to the fair value measurement. The inputs are summarized into three broad levels as follows:
| n | | Level 1 – quoted prices in active markets for identical securities |
| n | | Level 2 – other significant observable inputs (including quoted prices for similar securities, interest rates, prepayment speeds, credit risk, etc.) |
| n | | Level 3 – significant unobservable inputs (including the Fund’s own assumptions in determining the fair value of investments) |
The inputs or methodologies used for valuing securities are not necessarily an indication of the risk associated with investing in those securities.
At July 31, 2011, all of the Fund’s investments in securities carried at fair value were designated as Level 2 since the primary inputs include credit quality of the issuer and short-term interest rates which are observable.
Further details on the major security types can be found in the Fund’s Portfolio of Investments.
4. TRANSACTIONS WITH AFFILIATES AND OTHER EXPENSES
Advisory fee
The Trust has entered into an advisory contract with Wells Fargo Funds Management, LLC (“Funds Management”), an indirect wholly owned subsidiary of Wells Fargo & Company (“Wells Fargo”). The adviser is responsible for implementing investment policies and guidelines and for supervising the sub-adviser, who is responsible for day-to-day portfolio management of the Fund.
Pursuant to the contract, Funds Management is entitled to receive an annual advisory fee starting at 0.30% and declining to 0.20% as the average daily net assets of the Fund increase. For the six months ended July 31, 2011, the advisory fee was equivalent to an annual rate of 0.26% of the Fund’s average daily net assets.
Funds Management may retain the services of certain sub-advisers to provide daily portfolio management to the Fund. The fees related to sub-advisory services are borne directly by the adviser and do not increase the overall fees paid by the Fund to the adviser. Wells Capital Management Incorporated, an affiliate of Funds Management, is the sub-adviser to the Fund and is entitled to receive a fee from the adviser at an annual rate starting at 0.05% and declining to 0.01% as the average daily net assets of the Fund increase.
Administration and transfer agent fees
The Trust has entered into an administration agreement with Funds Management. Under this agreement, for providing administrative services, which includes paying fees and expenses for services provided by the transfer agent, sub-transfer agents, omnibus account servicers and record-keepers, Funds Management is entitled to receive from the Fund an annual fund level administration fee starting at 0.05% and declining to 0.03% as the average daily net assets of the Fund increase and a class level administration fee which is calculated based on the average daily net assets of each class as follows:
| | | | |
| | | Class Level Administration Fee | |
Class A, Sweep Class | | | 0.22 | % |
Administrator Class | | | 0.10 | |
Service Class | | | 0.12 | |
| | | | |
| 18 | | Wells Fargo Advantage 100% Treasury Money Market Fund | | Notes to Financial Statements (Unaudited) |
Funds Management has contractually waived and/or reimbursed advisory and administration fees to the extent necessary to maintain certain net operating expense ratios for the Fund. Waiver of fees and/or reimbursement of expenses by Funds Management were made first from fund level expenses on a proportionate basis and then from class specific expenses.
Distribution fees
The Trust has adopted a Distribution Plan for Sweep Class shares of the Fund pursuant to Rule 12b-1 under the 1940 Act. Distribution fees are charged to the Sweep Class shares and paid to Wells Fargo Funds Distributor, LLC, the principal underwriter, at an annual rate of 0.35% of the average daily net assets.
Shareholder servicing fees
The Trust has entered into contracts with one or more shareholder servicing agents, whereby Class A, Service Class and Sweep Class of the Fund is charged a fee at an annual rate of 0.25% of the respective average daily net assets of each class. Administrator Class is charged a fee at an annual rate of 0.10% of its average daily net assets.
A portion of these total shareholder servicing fees were paid to affiliates of Wells Fargo.
5. ACQUISITION
After the close of business on July 9, 2010, the Fund acquired the net assets of Evergreen Institutional 100% Treasury Money Market Fund. The purpose of the transaction was to combine two funds with similar investment objectives and strategies. The acquisition was accomplished by a tax-free exchange of all of the shares of Evergreen Institutional 100% Treasury Money Market Fund for 598,457,777 shares of the Fund valued at $598,529,191 at an exchange ratio of 1.00 for each class. Shareholders holding Class I and Class IS shares of Evergreen Institutional 100% Treasury Money Market Fund received Administrator Class and Service Class shares, respectively, of the Fund in the reorganization. The investment portfolio of Evergreen Institutional the Fund with a fair value of $598,561,496 and amortized cost of $598,561,496 at July 9, 2010 were the principal assets acquired by the Fund. The aggregate net assets of Evergreen Institutional 100% Treasury Money Market Fund and the Fund immediately prior to the acquisition were $598,529,191 and $8,130,274,496, respectively. The aggregate net assets of the Fund immediately after the acquisition were $8,728,803,687. For financial reporting purposes, assets received and shares issued by the Fund were recorded at fair value; however, the cost basis of the investments received from Evergreen Institutional 100% Treasury Money Market Fund was carried forward to align ongoing reporting of the Fund’s realized and unrealized gains and losses with amounts distributable to shareholders for tax purposes.
Assuming the acquisition had been completed March 1, 2010, the beginning of the annual reporting period for the Fund, the pro forma results of operations for the period ended January 31, 2011 would have been:
| | | | |
Net investment income | | $ | 889,744 | |
Net realized gains on investments | | $ | 421,602 | |
Net increase in net assets resulting from operations | | $ | 1,311,346 | |
6. INDEMNIFICATION
Under the Trust’s organizational documents, the officers and directors are indemnified against certain liabilities that may arise out of performance of their duties to the Trust. Additionally, in the normal course of business, the Trust may enter into contracts with service providers that contain a variety of indemnification clauses. The Trust’s maximum exposure under these arrangements is dependent on future claims that may be made against the Fund and, therefore, cannot be estimated.
7. NEW ACCOUNTING PRONOUNCEMENTS
In May 2011, the Financial Accounting Standards Board (“FASB”) issued Accounting Standards Update (“ASU”) No. 2011-04 “Amendments to Achieve Common Fair Value Measurement and Disclosure Requirements in U.S. GAAP and IFRSs”. ASU No. 2011-04 amends FASB ASC Topic 820, Fair Value Measurements and Disclosures, to establish common requirements for measuring fair value and for disclosing information about fair value measurements in accordance with GAAP. The ASU is effective prospectively for interim and annual periods beginning after December 15, 2011.
| | | | | | |
| Notes to Financial Statements (Unaudited) | | Wells Fargo Advantage 100% Treasury Money Market Fund | | | 19 | |
In April 2011, FASB issued ASU No. 2011-03 “Reconsideration of Effective Control for Repurchase Agreements”. ASU No. 2011-03 amends FASB ASC Topic 860, Transfers and Servicing, specifically the criteria required to determine whether a repurchase agreement (repo) and similar agreements should be accounted for as sales of financial assets or secured borrowings with commitments. ASU No. 2011-03 changes the assessment of effective control by focusing on the transferor’s contractual rights and obligations and removing the criterion to assess its ability to exercise those rights or honor those obligations. This could result in changes to the way entities account for certain transactions including repurchase agreements, mortgage dollar rolls and reverse repurchase agreements. The ASU will become effective on a prospective basis for new transfers and modifications to existing transactions as of the beginning of the first interim or annual period beginning on or after December 15, 2011.
As of July 31, 2011, management of the Fund is currently assessing the potential impact, in addition to expanded financial statement disclosure, that may result from adopting these ASUs.
| | | | |
| 20 | | Wells Fargo Advantage 100% Treasury Money Market Fund | | Other Information (Unaudited) |
PORTFOLIO HOLDINGS INFORMATION
The complete portfolio holdings for the Fund are publicly available on the Fund’s Web site (www.wellsfargo.com/advantagefunds) on a monthly, seven-day delayed basis. The Fund files its complete schedule of portfolio holdings with the SEC for the first and third quarters of each fiscal year on Form N-Q, which is available without charge by visiting the SEC Web site at www.sec.gov. In addition, the Fund’s Form N-Q may be reviewed and copied at the SEC’s Public Reference Room in Washington, DC, and at regional offices in New York City, at 233 Broadway, and in Chicago, at 175 West Jackson Boulevard, Suite 900. Information about the Public Reference Room may be obtained by calling 1-800-SEC-0330.
PROXY VOTING INFORMATION
A description of the policies and procedures that the Fund uses to determine how to vote proxies relating to portfolio securities is available without charge, upon request, by calling 1-800-222-8222, visiting our Web site at www.wellsfargo.com/advantagefunds, or visiting the SEC Web site at www.sec.gov. Information regarding how the Fund voted proxies relating to portfolio securities during the most recent 12-month period ended June 30 is available without charge on the Fund’s Web site at www.wellsfargo.com/advantagefunds or by visiting the SEC Web site at www.sec.gov.
| | | | | | |
| Other Information (Unaudited) | | Wells Fargo Advantage 100% Treasury Money Market Fund | | | 21 | |
BOARD OF TRUSTEES
The following table provides basic information about the Board of Trustees (the “Trustees”) of the Trust and Officers of the Trust. This table should be read in conjunction with the Prospectus and the Statement of Additional Information1 of the Fund. Each of the Trustees and Officers listed below acts in identical capacities for the Wells Fargo Advantage family of funds, which consists of 144 funds comprising the Wells Fargo Funds Trust, Wells Fargo Variable Trust, Wells Fargo Master Trust and four closed-end funds (collectively the “Fund Complex”). All of the Trustees are also Members of the Audit and Governance Committees of each Trust in the Fund Complex. The mailing address of each Trustee and Officer is 525 Market Street, 12th Floor, San Francisco, CA 94105. Each Trustee and Officer serves an indefinite term, however, each Trustee serves such term until reaching the mandatory retirement age established by the Trustees.
Independent Trustees
| | | | | | |
Name and Year of Birth | | Position Held and Length of Service | | Principal Occupations During Past Five Years | | Other Directorships During
Past Five Years |
Peter G. Gordon
(Born 1942) | | Trustee, since 1998; Chairman, since 2005 | | Co-Founder, Chairman, President and CEO of Crystal Geyser. Water Company. Trustee Emeritus, Colby College | | Asset Allocation Trust |
Isaiah Harris, Jr.
(Born 1952) | | Trustee, since 2009 | | Retired. Prior thereto, President and CEO of BellSouth Advertising and Publishing Corp. from 2005 to 2007, President and CEO of BellSouth Enterprises from 2004 to 2005 and President of BellSouth Consumer Services from 2000 to 2003. Emeritus member of the Iowa State University Foundation Board of Governors. Emeritus Member of the Advisory Board of Iowa State University School of Business. Mr. Harris is a certified public accountant. | | CIGNA Corporation; Deluxe Corporation; Asset Allocation Trust |
Judith M. Johnson
(Born 1949) | | Trustee, since 2008 | | Retired. Prior thereto, Chief Executive Officer and Chief Investment Officer of Minneapolis Employees Retirement Fund from 1996 to 2008. Ms. Johnson is an attorney, certified public accountant and a certified managerial accountant. | | Asset Allocation Trust |
Leroy Keith, Jr.
(Born 1939) | | Trustee, since 2010 | | Chairman, Bloc Global Services (development and construction), Trustee of the Evergreen Funds from 1983 to 2010. Former Managing Director, Almanac Capital Management (commodities firm), former Partner, Stonington Partners, Inc. (private equity fund), former Director, Obagi Medical Products Co. and former Director, Lincoln Educational Services. | | Trustee, Virtus Fund Complex (consisting of 45 portfolios as of 12/31/10); Director, Diversapack Co. (packaging company); Asset Allocation Trust |
David F. Larcker
(Born 1950) | | Trustee, since 2009 | | James Irvin Miller Professor of Accounting at the Graduate School of Business, Stanford University, Director of Corporate Governance Research Program and Co-Director of The Rock Center for Corporate Governance since 2006. From 2005 to 2008, Professor of Accounting at the Graduate School of Business, Stanford University. Prior thereto, Ernst & Young Professor of Accounting at The Wharton School, University of Pennsylvania from 1985 to 2005. | | Asset Allocation Trust |
Olivia S. Mitchell
(Born 1953) | | Trustee, since 2006 | | International Foundation of Employee Benefit Plans Professor and Chair of the Department of Insurance and Risk Management, Wharton School of the University of Pennsylvania since 1993. Director of Wharton’s Pension Research Council and Boettner Center on Pensions & Retirement Research, and Research Associate at the National Bureau of Economic Research. Previously, Cornell University Professor from 1978 to 1993. | | Asset Allocation Trust |
| | | | |
| 22 | | Wells Fargo Advantage 100% Treasury Money Market Fund | | Other Information (Unaudited) |
| | | | | | |
Name and Year of Birth | | Position Held and Length of Service | | Principal Occupations During Past Five Years | | Other Directorships During
Past Five Years |
Timothy J. Penny
(Born 1951) | | Trustee, since 1996 | | President and CEO of Southern Minnesota Initiative Foundation, a non-profit organization, since 2007 and Senior Fellow at the Humphrey Institute Policy Forum at the University of Minnesota since 1995. Member of the Board of Trustees of NorthStar Education Finance, Inc., a non-profit organization, since 2007. | | Asset Allocation Trust |
Michael S. Scofield
(Born 1943) | | Trustee, since 2010 | | Currently serves on the Investment Company Institute’s Board of Governors and Executive Committee as well the In dependent Director’s Counsel Board of Governors and Executive Committee. Former Chairman of the Independent Directors Counsel. Trustee of the Evergreen Funds from 1984 to 2010. Retired Attorney, Law Offices of Michael S. Scofield and former Director and Chairman, Branded Media Corporation (multi-media branding company). | | Asset Allocation Trust |
Donald C. Willeke
(Born 1940) | | Trustee, since 1996 | | Principal of the law firm of Willeke & Daniels. General Counsel of the Minneapolis Employees Retirement Fund from 1984 until its consolidation into the Minnesota Public Employees Retirement Association on June 30, 2010. | | Asset Allocation Trust |
Officers
| | | | | | |
Name and Year of Birth | | Position Held and
Length of Service | | Principal Occupations During Past Five Years | | |
Karla M. Rabusch
(Born 1959) | | President, since 2003 | | Executive Vice President of Wells Fargo Bank, N.A. and President of Wells Fargo Funds Management, LLC since 2003. Senior Vice President and Chief Administrative Officer of Wells Fargo Funds Management, LLC from 2001 to 2003. | | |
C. David Messman
(Born 1960) | | Secretary, since 2000; Chief Legal Counsel, since 2003 | | Senior Vice President and Secretary of Wells Fargo Funds Management, LLC since 2001. Vice President and Managing Counsel of Wells Fargo Bank, N.A. since 1996. | | |
Kasey Phillips
(Born 1970) | | Treasurer, since 2008 | | Senior Vice President of Wells Fargo Funds Management, LLC since 2009. Senior Vice President of Evergreen Investment Management Company, LLC from 2006 to 2010. Treasurer of the Evergreen Funds from 2005 to 2010. Vice President and Assistant Vice President of Evergreen Investment Services, Inc. from 1999 to 2006. | | |
David Berardi
(Born 1975) | | Assistant Treasurer, since 2009 | | Vice President of Wells Fargo Funds Management, LLC since 2009 . Vice President of Evergreen Investment Management Company, LLC from 2008 to 2010. Assistant Vice President of Evergreen Investment Services, Inc. from 2004 to 2008. Manager of Fund Reporting and Control for Evergreen Investment Management Company, LLC from 2004 to 2010. | | |
Jeremy DePalma
(Born 1974) | | Assistant Treasurer, since 2009 | | Senior Vice President of Wells Fargo Funds Management, LLC since 2009. Senior Vice President of Evergreen Investment Management Company, LLC from 2008 to 2010. Vice President, Evergreen Investment Services, Inc. from 2004 to 2007. Assistant Vice President, Evergreen Investment Services, Inc. from 2000 to 2004 and the head of the Fund Reporting and Control Team within Fund Administration from 2005 to 2010. | | |
Debra Ann Early
(Born 1964) | | Chief Compliance Officer, since 2007 | | Chief Compliance Officer of Wells Fargo Funds Management, LLC since 2007. Chief Compliance Officer of Parnassus Investments from 2005 to 2007. Chief Financial Officer of Parnassus Investments from 2004 to 2007 and Senior Audit Manager of PricewaterhouseCoopers LLP from 1998 to 2004. | | |
| 1. | The Statement of Additional Information includes additional information about the Fund’s Trustees and is available, without charge, upon request, by calling 1-800-222-8222 or by visiting the Fund’s Web site at www.wellsfargo.com/advantagefunds. |
| | | | | | |
| Other Information (Unaudited) | | Wells Fargo Advantage 100% Treasury Money Market Fund | | | 23 | |
BOARD CONSIDERATION OF INVESTMENT ADVISORY AND SUB-ADVISORY AGREEMENTS:
100% Treasury Money Market Fund, Cash Investment Money Market Fund, Government Money Market Fund, Heritage Money Market Fund, Money Market Fund, Prime Investment Money Market Fund and Treasury Plus Money Market Fund
(Not all of the funds described in this Board considerations section are part of this shareholder report. This shareholder report only relates to 100% Treasury Money Market Fund.)
Each year, as required by Section 15 of the Investment Company Act of 1940 (the “1940 Act”), the Board of Trustees (the “Board”) of Wells Fargo Funds Trust (the “Trust”), all the members of which have no direct or indirect interest in the investment advisory and sub-advisory agreements and are not “interested persons” of the Trust, as defined in the 1940 Act (the “Independent Trustees”), determines whether to approve the continuation of the Trust’s investment advisory and sub-advisory agreements. In this regard, at an in person meeting held on March 24-25, 2011 (the “Meeting”), the Board reviewed and re-approved: (i) an investment advisory agreement with Wells Fargo Funds Management, LLC (“Funds Management”) for each of the 100% Treasury Money Market Fund, Cash Investment Money Market Fund, Government Money Market Fund, Heritage Money Market Fund, Money Market Fund, Prime Investment Money Market Fund and Treasury Plus Money Market Fund (collectively, the “Funds”); and (ii) an investment sub-advisory agreement with Wells Capital Management Incorporated (“Wells Capital Management”) for each of the Funds. The investment advisory agreements with Funds Management and the investment sub-advisory agreements with Wells Capital Management are collectively referred to as the “Advisory Agreements.”
At the Meeting, the Board considered the factors and reached the conclusions described below relating to the selection of Funds Management and Wells Capital Management and continuation of the Advisory Agreements. Prior to the Meeting, the Trustees conferred extensively among themselves and with representatives of Funds Management about these matters. The Board also met throughout the year and received information that was useful to them in considering the continuation of the Advisory Agreements. The Independent Trustees were assisted in their evaluation of the Advisory Agreements by independent legal counsel, from whom they received separate legal advice and with whom they met separately from Funds Management.
Nature, extent and quality of services
The Board received and considered various information regarding the nature, extent and quality of services provided to the Funds by Funds Management and Wells Capital Management under the Advisory Agreements. The Board also received and considered information provided in response to a detailed set of requests submitted by the Independent Trustees’ independent legal counsel on their behalf. The Board received and considered, among other things, information about the background and experience of senior management of Funds Management, and the qualifications, backgrounds, tenures and responsibilities of the portfolio managers primarily responsible for the day-to-day portfolio management of the Funds.
The Board evaluated the ability of Funds Management and Wells Capital Management, based on their respective financial condition, resources, reputation and other attributes, to attract and retain qualified investment professionals, including research, advisory, and supervisory personnel. The Board further considered the compliance programs and compliance records of Funds Management and Wells Capital Management. In addition, the Board took into account the administrative services provided to the Funds by Funds Management and its affiliates.
The Board’s decision to approve the continuation of the Advisory Agreements was based on a comprehensive evaluation of all of the information provided to it. In approving the continuation of the Advisory Agreements, the Board did not identify any particular information or consideration that was all-important or controlling, and each Trustee attributed different weights to various factors. The Board evaluated information provided to it both in terms of the funds generally and with respect to each Fund specifically as it considered appropriate. Although the Board considered the continuation of the Advisory Agreements for each of the Funds as part of the larger process of considering the continuation of the advisory agreements for all of the funds, its decision to continue the Advisory Agreements for each of the Funds was ultimately made on a fund-by-fund basis.
In considering these matters, the Board considered not only the specific information presented in connection with the Meeting, but also the knowledge gained over time through interaction with Funds Management and Wells Capital Management about various topics, including Funds Management��s oversight of service providers. The above factors,
| | | | |
| 24 | | Wells Fargo Advantage 100% Treasury Money Market Fund | | Other Information (Unaudited) |
together with those referenced below, are some of the most important, but not necessarily all, factors considered by the Board in concluding that it was satisfied with the nature, extent and quality of the investment advisory services provided to each Fund by Funds Management and Wells Capital Management.
Fund performance and expenses
The Board considered the performance results for each of the Funds over various time periods ended December 31, 2010. The Board also considered these results in comparison to the median performance of a universe of relevant funds (the “Universe”) that were determined by Lipper Inc. (“Lipper”) to be similar to the Funds, and in comparison to each Fund’s benchmark index and to other comparative data. Lipper is an independent provider of investment company data. The Board received a description of the methodology used by Lipper to select the mutual funds in the Universe.
The Board noted that the performance of each of the Funds was higher than or in range of the median performance of the Universe for the periods under review, except for the Money Market Fund (Class B).
The Board received and considered information regarding each Fund’s contractual advisory fee and net operating expense ratios and their various components, including actual management fees (which reflect fee waivers, if any), transfer agent, custodian and other non-management fees, Rule 12b-1 and non-Rule 12b-1 fees, service fees and fee waiver and expense reimbursement arrangements. The Board also considered these ratios in comparison to the median ratios of an expense Universe and a narrower expense group of mutual funds (each, an “Expense Group”) that was determined by Lipper to be similar to each Fund. The Board received a description of the methodology used by Lipper to select the mutual funds in a Fund’s Expense Group. The Board noted that the net operating expense ratios of the Service Class, Administrator Class, Institutional Class and Select Class of each of the Funds were in range of each Fund’s respective Expense Group’s median net operating expense ratio, except for the 100% Treasury Money Market Fund (Service Class). The Board also noted that the net operating expense ratios of the Class A and Sweep Class of each of the Funds, the Money Market Fund (A, B, C, Daily and Investor Classes) were higher than each Fund’s respective Expense Group’s median net operating expense ratio.
Based on the above-referenced considerations and other factors, the Board concluded that the overall performance and expense structure of the Funds supported the re-approval of the Advisory Agreements for the Funds.
Investment advisory and sub-advisory fee rates
The Board reviewed and considered the contractual investment advisory fee rates that are payable by the Funds to Funds Management for investment advisory services (the “Advisory Agreement Rates”), both on a stand-alone basis and on a combined basis with the Funds’ administration fee rates. The Board took into account the separate administrative and other services covered by the administration fee rates. The Board also reviewed and considered the contractual investment sub-advisory fee rates that are payable by Funds Management to Wells Capital Management for investment sub-advisory services (the “Sub-Advisory Agreement Rates”). In addition, the Board reviewed and considered the existing fee waiver/cap arrangements applicable to the Advisory Agreement Rates and considered the Advisory Agreement Rates after taking the waivers/caps into account (the “Net Advisory Rates”).
The Board received and considered information comparing the Advisory Agreement Rates and Net Advisory Rates with those of other funds in each Fund’s Expense Group median. The Board noted that the Advisory Agreement Rates for the Class A, Service Class, Administrator Class, Institutional Class and Select Class of each of the Funds were in range of each Fund’s respective Expense Group, except for the 100% Treasury Money Market Fund (Administrator Class). The Board noted that the Advisory Agreement Rates for the Sweep Class of each of the Funds was not appreciably higher than the median rate of each Fund’s Expense Group, except for the 100% Treasury Money Market Fund. The Board also noted that the Advisory Agreement Rates for the Money Market Fund (Class B, Class C, Daily Class and Investor Class) were higher than the median rate of the Expense Group. The Board noted that the Net Advisory Rates for the Service Class, Administrator Class, Institutional Class and Select Class of each of the Funds were in range of each Fund’s respective Expense Group. The Board also noted that the Net Advisory Rates for the Class A and Sweep Class of each of the Funds and the Money Market Fund (Class B, Class C, Daily Class and Investor Class) were higher than each Fund’s respective Expense Group. The Board further noted that Funds Management had agreed to continue and, in certain instances, reduce contractual fee cap arrangements for the Funds designed to lower the Funds’ expenses.
The Board also received and considered information about the nature and extent of services offered and fee rates charged by Funds Management and Wells Capital Management to other types of clients. In this regard, the Board
| | | | | | |
| Other Information (Unaudited) | | Wells Fargo Advantage 100% Treasury Money Market Fund | | | 25 | |
received information about differences between the services, and the compliance, reporting, and other legal burdens and risks of providing investment advice to mutual funds and those associated with providing advice to non-mutual fund clients such as collective funds or institutional separate accounts.
In each case, the Board determined that the Advisory Agreement Rates for the Funds, both with and without administration fee rates and before and after waivers, were acceptable in light of the Funds’ Expense Group information, the net expense ratio commitments, the services covered by the Advisory Agreements and other information provided. The Board also reviewed and considered the Sub-Advisory Agreement Rates and concluded that the Sub-Advisory Agreement Rates were acceptable in light of the services covered by the Sub-Advisory Agreement and other information provided.
Profitability
The Board received and considered a profitability analysis of Funds Management, as well as an analysis of the profitability to the collective Wells Fargo businesses that provide services to the Funds. It considered that the information provided to it was necessarily estimated, and that the profitability information provided to it, especially on a fund-by-fund basis, did not necessarily provide a precise tool for evaluating the appropriateness of each Fund’s Advisory Agreement Rates in isolation. It noted that the levels of profitability of the Funds to Funds Management varied widely, depending on, among other things, the size and type of fund. The Board concluded that the profitability to Funds Management of the services provided to any of the Funds, individually or in the aggregate, was not unreasonable.
The Board did not consider separate profitability information with respect to Wells Capital Management, because, as an affiliate of Funds Management, its profitability information was subsumed in the collective Wells Fargo profitability analysis provided by Funds Management.
Economies of scale
With respect to possible economies of scale, the Board reviewed the breakpoints in each Fund’s advisory fee structure, which operate generally to reduce the effective Advisory Agreement Rates of the Funds (as a percentage of Fund assets) as the Funds grow in size. It considered that, as a fund shrinks in size, breakpoints conversely result in increasing fee levels. The Board noted that it would continue to review the appropriate levels of breakpoints in the future, and concluded that the breakpoints as implemented appeared to be a reasonable step toward sharing economies of scale with the Funds. However, the Board acknowledged the inherent limitations of any analysis of an investment adviser’s economies of scale and of any attempt to correlate breakpoints with such economies, stemming largely from the Board’s understanding that economies of scale are realized, if at all, by an investment adviser across a variety of products and services, not just with respect to a single fund.
Other benefits to Funds Management and Wells Capital Management
The Board received and considered information regarding potential “fall-out” or ancillary benefits received by Funds Management and its affiliates, including Wells Capital Management, as a result of their relationship with the Funds. Ancillary benefits could include, among others, benefits directly attributable to the relationship of Funds Management and Wells Capital Management with the Funds and benefits potentially derived from an increase in Funds Management’s and Wells Capital Management’s business as a result of their relationship with the Funds (such as the ability to market to shareholders other financial products offered by Funds Management and its affiliates, including Wells Capital Management).
The Board considered that Wells Fargo Funds Distributor, LLC, an affiliate of Funds Management, serves as distributor to the Funds and receives certain compensation for those services. The Board noted that the Funds pay sub-transfer agency fees to various financial institutions, including affiliates of Funds Management that hold fund shares in omnibus accounts. It also considered that these entities may receive distribution-related fees and shareholder servicing payments (including amounts derived from payments under the funds’ Rule 12b-1 plans) in respect of shares sold or held through them.
The Board also reviewed information about whether and to what extent soft dollar credits are sought and how any such credits are utilized and any benefits that may be realized by using an affiliated broker.
Other factors and broader review
The Board also considered the markets for distribution of the Funds’ shares, including the multiple channels through which the Funds’ shares are offered and sold. The Board noted that the Funds are part of one of the few fund families that have both direct-to-fund and intermediary distribution channels. As discussed above, the Board reviews detailed materials received from Funds Management and Wells Capital Management annually as part of the re-approval process
| | | | |
| 26 | | Wells Fargo Advantage 100% Treasury Money Market Fund | | Other Information (Unaudited) |
under Section 15 of the 1940 Act and also reviews and assesses information about the quality of the services that the Funds receive throughout the year. In this regard, the Board has reviewed reports of Funds Management at each of its quarterly meetings, which include, among other things, portfolio reviews and performance reports. In addition, the Board confers with portfolio managers at various times throughout the year.
Conclusion
After considering the above-described factors and based on its deliberations and its evaluation of the information described above, the Board concluded that approval of the continuation of the Advisory Agreements for the Funds was in the best interest of the Funds and their shareholders. Accordingly, the Board unanimously approved the continuation of the Advisory Agreements for an additional one-year period.
| | | | | | |
| List of Abbreviations | | Wells Fargo Advantage 100% Treasury Money Market Fund | | | 27 | |
The following is a list of common abbreviations for terms and entities which may have appeared in this report.
| ABAG | — Association of Bay Area Governments |
| ACB | — Agricultural Credit Bank |
| ADR | — American Depositary Receipt |
| ADS | — American Depository Shares |
| AGC-ICC | — Assured Guaranty Corporation - Insured Custody Certificates |
| AGM | — Assured Guaranty Municipal |
| AMBAC | — American Municipal Bond Assurance Corporation |
| AMT | — Alternative Minimum Tax |
| ARM | — Adjustable Rate Mortgages |
| BAN | — Bond Anticipation Notes |
| BART | — Bay Area Rapid Transit |
| BHAC | — Berkshire Hathaway Assurance Corporation |
| CCAB | — Convertible Capital Appreciation Bond |
| CDA | — Community Development Authority |
| CDO | — Collateralized Debt Obligation |
| CDSC | — Contingent Deferred Sales Charge |
| CGIC | — Capital Guaranty Insurance Company |
| CGY | — Capital Guaranty Corporation |
| CIFG | — CDC (Caisse des Dépôts et Consignations) IX IS Financial Guarantee |
| COP | — Certificate of Participation |
| DRIVER | — Derivative Inverse Tax-Exempt Receipts |
| DW&P | — Department of Water & Power |
| DWR | — Department of Water Resources |
| ECFA | — Educational & Cultural Facilities Authority |
| EDFA | — Economic Development Finance Authority |
| ETET | — Eagle Tax-Exempt Trust |
| ETF | — Exchange-Traded Fund |
| FFCB | — Federal Farm Credit Bank |
| FGIC | — Financial Guaranty Insurance Corporation |
| FHA | — Federal Housing Authority |
| FHAG | — Federal Housing Agency |
| FHLB | — Federal Home Loan Bank |
| FHLMC | — Federal Home Loan Mortgage Corporation |
| FNMA | — Federal National Mortgage Association |
| GDR | — Global Depositary Receipt |
| GNMA | — Government National Mortgage Association |
| HCFR | — Healthcare Facilities Revenue |
| HEFA | — Health & Educational Facilities Authority |
| HEFAR | — Higher Education Facilities Authority Revenue |
| HFA | — Housing Finance Authority |
| HFFA | — Health Facilities Financing Authority |
| HUD | — Housing & Urban Development |
| IBC | — Insured Bond Certificate |
| IDA | — Industrial Development Authority |
| IDAG | — Industrial Development Agency |
| IDR | — Industrial Development Revenue |
| KRW | — Republic of Korea Won |
| LIBOR | — London Interbank Offered Rate |
| LLC | — Limited Liability Company |
| LLP | — Limited Liability Partnership |
| MBIA | — Municipal Bond Insurance Association |
| MFHR | — Multi-Family Housing Revenue |
| MFMR | — Multi-Family Mortgage Revenue |
| MMD | — Municipal Market Data |
| MSTR | — Municipal Securities Trust Receipts |
| MUD | — Municipal Utility District |
| NATL-RE | — National Public Finance Guarantee Corporation |
| PCFA | — Pollution Control Finance Authority |
| PCR | — Pollution Control Revenue |
| PFA | — Public Finance Authority |
| PFFA | — Public Facilities Financing Authority |
| PFOTER | — Puttable Floating Option Tax-Exempt Receipts |
| plc | — Public Limited Company |
| PSFG | — Public School Fund Guaranty |
| PUTTER | — Puttable Tax-Exempt Receipts |
| R&D | — Research & Development |
| RDA | — Redevelopment Authority |
| RDFA | — Redevelopment Finance Authority |
| REIT | — Real Estate Investment Trust |
| RIB | — Residual Interest Bond |
| ROC | — Reset Option Certificates |
| SAVRS | — Select Auction Variable Rate Securities |
| SFHR | — Single Family Housing Revenue |
| SFMR | — Single Family Mortgage Revenue |
| SLMA | — Student Loan Marketing Association |
| SPDR | — Standard & Poor’s Depositary Receipts |
| STIT | — Short-Term Investment Trust |
| TAN | — Tax Anticipation Notes |
| TIPS | — Treasury Inflation-Protected Securities |
| TRAN | — Tax Revenue Anticipation Notes |
| TCR | — Transferable Custody Receipts |
| TTFA | — Transportation Trust Fund Authority |
| USD | — Unified School District |
| XLCA | — XL Capital Assurance |
This page is intentionally left blank.
This page is intentionally left blank.
This page is intentionally left blank.


FOR MORE INFORMATION
More information about Wells Fargo Advantage Funds is available free upon request. To obtain literature, please write, e-mail, visit the Funds’ Web site, or call:
Wells Fargo Advantage Funds
P.O. Box 8266
Boston, MA 02266-8266
E-mail: wfaf@wellsfargo.com
Web site: www.wellsfargo.com/advantagefunds
Individual investors: 1-800-222-8222
Retail investment professionals: 1-888-877-9275
Institutional investment professionals: 1-866-765-0778
This report and the financial statements contained herein are submitted for the general information of the shareholders of Wells Fargo Advantage Funds. If this report is used for promotional purposes, distribution of the report must be accompanied or preceded by a current prospectus. For a prospectus containing more complete information, including charges and expenses, call 1-800-222-8222 or visit the Funds’ Web site at www.wellsfargo.com/advantagefunds. Please consider the investment objectives, risks, charges, and expenses of the investment carefully before investing. This and other information about Wells Fargo Advantage Funds can be found in the current prospectus. Read the prospectus carefully before you invest or send money.
Wells Fargo Funds Management, LLC, a wholly owned subsidiary of Wells Fargo & Company, provides investment advisory and administrative services for Wells Fargo Advantage Funds. Other affiliates of Wells Fargo & Company provide subadvisory and other services for the Funds. The Funds are distributed by Wells Fargo Funds Distributor, LLC, Member FINRA/SIPC, an affiliate of Wells Fargo & Company.
NOT FDIC INSURED ¡ NO BANK GUARANTEE ¡ MAY LOSE VALUE
© 2011 Wells Fargo Funds Management, LLC. All rights reserved.
| | |
 | | 204796 09-11 SA300/SAR300 7-11 |

Wells Fargo Advantage
California Municipal Money Market Fund

Semi-Annual Report
July 31, 2011

Reduce clutter. Save trees.
Sign up for electronic delivery of prospectuses and shareholder reports at www.wellsfargo.com/advantagedelivery
Contents
The views expressed and any forward-looking statements are as of July 31, 2011, unless otherwise noted and are those of the Fund managers and/or Wells Fargo Funds Management, LLC. Discussions of individual securities, or the markets generally, or any Wells Fargo Advantage Fund are not intended as individual recommendations. Future events or results may vary significantly from those expressed in any forward-looking statements; the views expressed are subject to change at any time in response to changing circumstances in the market. Wells Fargo Funds Management, LLC, disclaims any obligation to publicly update or revise any views expressed or forward-looking statements.
NOT FDIC INSURED ¡ NO BANK GUARANTEE ¡ MAY LOSE VALUE

WELLS FARGO INVESTMENT HISTORY
| | |
| |
| 1932 | | Keystone creates one of the first mutual fund families. |
| |
| 1971 | | Wells Fargo & Company introduces one of the first institutional index funds. |
| |
| 1978 | | Wells Fargo applies Markowitz and Sharpe’s research on Modern Portfolio Theory to introduce one of the industry’s first Tactical Asset Allocation (TAA) models in institutional separately managed accounts. |
| |
| 1984 | | Wells Fargo Stagecoach Funds launches its first asset allocation fund. |
| |
| 1989 | | The Tactical Asset Allocation (TAA) Model is first applied to Wells Fargo’s asset allocation mutual funds. |
| |
| 1994 | | Wells Fargo introduces the LifePath Funds, one of the first suites of target date funds (now the Wells Fargo Advantage Dow Jones Target Date FundsSM ). |
| |
| 1996 | | Evergreen Investments and Keystone Funds merge. |
| |
| 1997 | | Wells Fargo launches Wells Fargo Advantage WealthBuilder PortfoliosSM, a fund-of-funds suite of products that includes the use of quantitative models to shift assets among investment styles. |
| |
| 1999 | | Norwest Advantage Funds and Stagecoach Funds are reorganized into Wells Fargo Funds after the merger of Norwest and Wells Fargo. |
| |
| 2002 | | Evergreen Retail and Evergreen Institutional companies form the umbrella asset management company, Evergreen Investments. |
| |
| 2005 | | The integration of Strong Funds with Wells Fargo Funds creates Wells Fargo Advantage Funds, resulting in one of the top 20 mutual fund companies in the United States. |
| |
| 2006 | | Wells Fargo Advantage Funds relaunches the target date product line as Wells Fargo Advantage Dow Jones Target Date Funds. |
| |
| 2010 | | The mergers and reorganizations of Evergreen and Wells Fargo Advantage mutual funds are completed, unifying the families under the brand of Wells Fargo Advantage Funds. |
Wells Fargo Advantage Funds®
Wells Fargo Advantage Funds skillfully guides institutions, financial advisors, and individuals through the investment terrain to help them reach their financial objectives. Everything we do on behalf of investors is backed by our unique combination of qualifications.
Strength
Our organization is built on the standards of integrity and service established by our parent company—Wells Fargo & Company—more than 150 years ago. And, because we’re part of a highly diversified financial enterprise, we offer the depth of resources to help investors succeed.
Expertise
Our multi-boutique model offers investors access to the independent thinking of premier investment managers that have been chosen for their time-tested strategies. While each team specializes in a specific investment strategy, collectively they provide investors a wide choice of distinct investment styles. Our dedication to investment excellence doesn’t end with our expertise in manager selection—risk management, analysis, and rigorous ongoing review seek to ensure each manager’s investment process remains consistent.
Partnership
Our collaborative approach is built around understanding the needs and goals of our clients. By adhering to core principles of sound judgment and steady guidance, we support you through every stage of the investment decision process.
Carefully consider the investment objectives, risks, charges, and expenses before investing. For a current prospectus for Wells Fargo Advantage Funds containing this and other information, visit wellsfargo.com/advantagefunds. Read it carefully before investing.
Wells Fargo Funds Management, LLC, a wholly owned subsidiary of Wells Fargo & Company, provides investment advisory and administrative services for Wells Fargo Advantage Funds®. Other affiliates of Wells Fargo & Company provide subadvisory and other services for the Funds. The Funds are distributed by Wells Fargo Funds Distributor, LLC, Member FINRA/SIPC, an affiliate of Wells Fargo & Company.
The “Dow Jones Target Date Indexes” are a product of Dow Jones Indexes, a licensed trademark of CME Group Index Services LLC (“CME”). “Dow Jones” and “Dow Jones Target Date Indexes” are service marks of Dow Jones Trademark Holdings, LLC, and have been licensed for use for certain purposes by CME and sublicensed for use by Global Index Advisors, Inc., and Wells Fargo Funds Management, LLC. The Dow Jones Target Date Indexes are based in part on the Barclays Capital Bond Indexes, which are published by Barclays Capital Inc. The Wells Fargo Advantage Dow Jones Target Date Funds, based on the Dow Jones Target Date Indexes, are not sponsored, endorsed, sold, or promoted by Dow Jones, CME or Barclays Capital or any of their respective affiliates, and neither Dow Jones, CME nor Barclays Capital nor any of their respective affiliates makes any representation regarding the advisability of investing in such product(s) and/or about the quality, accuracy, and/or completeness of the Dow Jones Target Date Indexes or the Barclays Capital Bond Indexes. IN NO EVENT SHALL DOW JONES, CME, BARCLAYS CAPITAL, OR ANY OF THEIR LICENSORS HAVE ANY LIABILITY IN CONNECTION WITH THE Wells Fargo Advantage Dow Jones Target Date Funds INCLUDING, WITHOUT LIMITATION, FOR ANY SPECIAL, PUNITIVE, IN DIRECT, OR CONSEQUENTIAL DAMAGES (INCLUDING LOST PROFITS), EVEN IF NOTIFIED OF THE POSSIBILITY OF SUCH DAMAGES.
NOT FDIC INSURED ¡ NO BANK GUARANTEE ¡ MAY LOSE VALUE
Not part of the semi-annual report.
Wells Fargo Advantage Funds offers more than 110 mutual funds across a wide range of asset classes, representing over $221 billion in assets under management, as of July 31, 2011.
| | | | |
| Equity Funds | | | | |
Asia Pacific Fund | | Global Opportunities Fund | | Premier Large Company Growth Fund |
C&B Large Cap Value Fund | | Growth Fund | | Small Cap Opportunities Fund |
C&B Mid Cap Value Fund | | Health Care Fund | | Small Cap Value Fund |
Capital Growth Fund | | Index Fund | | Small Company Growth Fund |
Common Stock Fund | | International Equity Fund | | Small Company Value Fund |
Disciplined U.S. Core Fund | | International Value Fund | | Small/Mid Cap Core Fund |
Discovery Fund† | | Intrinsic Small Cap Value Fund | | Small/Mid Cap Value Fund |
Diversified Equity Fund | | Intrinsic Value Fund | | Social Sustainability Fund† |
Diversified International Fund | | Intrinsic World Equity Fund | | Special Mid Cap Value Fund |
Diversified Small Cap Fund | | Large Cap Core Fund | | Special Small Cap Value Fund |
Emerging Growth Fund | | Large Cap Growth Fund | | Specialized Technology Fund |
Emerging Markets Equity Fund | | Large Company Value Fund | | Strategic Large Cap Growth Fund |
Endeavor Select Fund† | | Omega Growth Fund | | Traditional Small Cap Growth Fund |
Enterprise Fund† | | Opportunity Fund† | | Utility and Telecommunications Fund |
Equity Value Fund | | Precious Metals Fund | | |
| Bond Funds | | | | |
Adjustable Rate Government Fund | | Inflation-Protected Bond Fund | | Short-Term Bond Fund |
California Limited-Term Tax-Free Fund | | Intermediate Tax/AMT-Free Fund | | Short-Term High Yield Bond Fund |
California Tax-Free Fund | | International Bond Fund | | Short-Term Municipal Bond Fund |
Colorado Tax-Free Fund | | Minnesota Tax-Free Fund | | Strategic Municipal Bond Fund |
Government Securities Fund | | Municipal Bond Fund | | Total Return Bond Fund |
High Income Fund | | North Carolina Tax-Free Fund | | Ultra Short-Term Income Fund |
High Yield Bond Fund | | Pennsylvania Tax-Free Fund | | Ultra Short-Term Municipal Income Fund |
Income Plus Fund | | Short Duration Government Bond Fund | | Wisconsin Tax-Free Fund |
| Asset Allocation Funds | | | | |
Asset Allocation Fund | | WealthBuilder Equity Portfolio† | | Target 2020 Fund† |
Conservative Allocation Fund | | WealthBuilder Growth Allocation Portfolio† | | Target 2025 Fund† |
Diversified Capital Builder Fund | | WealthBuilder Growth Balanced Portfolio† | | Target 2030 Fund† |
Diversified Income Builder Fund | | WealthBuilder Moderate Balanced Portfolio† | | Target 2035 Fund† |
Growth Balanced Fund | | WealthBuilder Tactical Equity Portfolio† | | Target 2040 Fund† |
Index Asset Allocation Fund | | Target Today Fund† | | Target 2045 Fund† |
Moderate Balanced Fund | | Target 2010 Fund† | | Target 2050 Fund† |
WealthBuilder Conservative Allocation Portfolio† | | Target 2015 Fund† | | Target 2055 Fund† |
| Money Market Funds | | | | |
100% Treasury Money Market Fund | | Minnesota Money Market Fund | | New Jersey Municipal Money Market Fund |
California Municipal Money Market Fund | | Money Market Fund | | New York Municipal Money Market Fund |
Cash Investment Money Market Fund | | Municipal Cash Management Money Market Fund | | Pennsylvania Municipal Money Market Fund |
Government Money Market Fund | | Municipal Money Market Fund | | Prime Investment Money Market Fund |
Heritage Money Market Fund† | | National Tax-Free Money Market Fund | | Treasury Plus Money Market Fund |
| Variable Trust Funds1 | | | | |
VT Discovery Fund† | | VT Intrinsic Value Fund | | VT Small Cap Growth Fund |
VT Index Asset Allocation Fund | | VT Omega Growth Fund | | VT Small Cap Value Fund |
VT International Equity Fund | | VT Opportunity Fund† | | VT Total Return Bond Fund |
An investment in a money market fund is not insured or guaranteed by the Federal Deposit Insurance Corporation or any other government agency. Although the Wells Fargo Advantage Money Market Funds seek to preserve the value of your investment at $1.00 per share, it is possible to lose money by investing in a money market fund.
| 1. | The Variable Trust Funds are generally available only through insurance company variable contracts. |
| † | In this report, the Wells Fargo Advantage Discovery FundSM, Wells Fargo Advantage Endeavor Select FundSM, Wells Fargo Advantage Enterprise FundSM, Wells Fargo Advantage Opportunity FundSM, Wells Fargo Advantage Social Sustainability FundSM, Wells Fargo Advantage WealthBuilder Conservative Allocation PortfolioSM, Wells Fargo Advantage WealthBuilder Equity PortfolioSM , Wells Fargo Advantage WealthBuilder Growth Allocation PortfolioSM, Wells Fargo Advantage WealthBuilder Growth Balanced PortfolioSM, Wells Fargo Advantage WealthBuilder Moderate Balanced PortfolioSM, Wells Fargo Advantage WealthBuilder Tactical Equity PortfolioSM, Wells Fargo Advantage Dow Jones Target Today FundSM, Wells Fargo Advantage Dow Jones Target 2010 FundSM, Wells Fargo Advantage Dow Jones Target 2015 FundSM, Wells Fargo Advantage Dow Jones Target 2020 FundSM, Wells Fargo Advantage Dow Jones Target 2025 FundSM, Wells Fargo Advantage Dow Jones Target 2030 FundSM, Wells Fargo Advantage Dow Jones Target 2035 FundSM, Wells Fargo Advantage Dow Jones Target 2040 FundSM, Wells Fargo Advantage Dow Jones Target 2045 FundSM, Wells Fargo Advantage Dow Jones Target 2050 FundSM, Wells Fargo Advantage Dow Jones Target 2055 FundSM, Wells Fargo Advantage Heritage Money Market FundSM, Wells Fargo Advantage VT Discovery FundSM, and Wells Fargo Advantage VT Opportunity FundSM are referred to as the Discovery Fund, Endeavor Select Fund, Enterprise Fund, Opportunity Fund, Social Sustainability Fund, WealthBuilder Conservative Allocation Portfolio, WealthBuilder Equity Portfolio, WealthBuilder Growth Allocation Portfolio, WealthBuilder Growth Balanced Portfolio, WealthBuilder Moderate Balanced Portfolio, WealthBuilder Tactical Equity Portfolio, Target Today Fund, Target 2010 Fund, Target 2015 Fund, Target 2020 Fund, Target 2025 Fund, Target 2030 Fund, Target 2035 Fund, Target 2040 Fund, Target 2045 Fund, Target 2050 Fund, Target 2055 Fund, Heritage Money Market Fund, VT Discovery Fund, and VT Opportunity Fund, respectively. |
Not part of the semi-annual report.
| | | | |
| 2 | | Wells Fargo Advantage California Municipal Money Market Fund | | Letter to Shareholders |

Karla M. Rabusch,
President
Wells Fargo Advantage Funds
While the FOMC explained that it “expects the pace of recovery to pick up over coming quarters,” it indicated that the federal funds rate will remain at an exceptionally low level for as long as necessary to ensure a sustainable recovery and expansion.
Dear Valued Shareholder,
We’re pleased to offer you this semi-annual report for the Wells Fargo Advantage California Municipal Money Market Fund for the six-month period that ended July 31, 2011. Upon reviewing the report, you may notice a few changes from past reports, the most significant of which is the change from a multi-fund report to a single-fund report. We believe this change will give you more convenient access to your fund data.
The period began modestly as improving economic optimism generally shifted investors toward equities and riskier assets and away from U.S. Treasuries and lower-yielding fixed-income securities. Returns from fixed income were modest in the opening months of 2011 but were generally still positive as U.S. Treasury yields incrementally climbed higher. But after the slow start, bond prices once again strongly improved, sparked by a sharp decline in U.S. Treasury prices in April that carried into May. Late in the period, lower-rated bonds declined in price more than the higher credit-quality tiers but not enough to outweigh the stronger performance from lower-rated securities during the period. Lower-quality and longer-maturity fixed-income securities generally outperformed higher-quality and shorter-maturity securities over the full period.
The activity within the broader bond market also resonated with money market participants. As the economic and credit environment reverberated from the ongoing sovereign debt concerns and softening economic data, many participants continued to balance a need for stability and desire for higher yields. The result has been good demand for domestic commercial paper and certificate of deposits. Also, in spite of all the discussion about sovereign debt, many money market participants continue to maintain some exposures to foreign banks based on the quality of their fundamentals. By focusing more on the fundamentals and taking a more selective approach to the short-term security market helped the markets avoid the severe yield volatility or significant flight-to-quality experienced during the spring of 2010, when the Greek sovereign debt crisis first emerged.
The global economic “recovery” hit a snag, but the end of 2011 could regain momentum.
The U.S. economic recovery that began in mid-2009 and gained further momentum throughout 2010, particularly during the fourth quarter, has failed to maintain that level of growth through the first seven months of 2011. For example, gross domestic product (GDP), the broadest measure of economic activity, grew at an annualized rate of 3.1% in the fourth quarter of 2010, only to slow dramatically during the first quarter of 2011. The latest revision to first-quarter GDP data during the period indicated that the economy grew at an annualized rate of 0.4% during the first quarter of 2011. While still positive, it’s a much slower pace of growth than experienced in the second half of 2010 and notably lower than consensus forecasts. Nevertheless, the advance estimate of second-quarter 2011 GDP, which was released on July 29, 2011, was 1.3%, suggesting that the U.S. economy continues to expand, though at a slow and uneven pace.
Jobs and housing remained troublesome.
The July 2011 unemployment rate in the U.S. was reported at 9.1%, down from 9.5% a year earlier but still notably higher than historical averages. Unfortunately,
| | | | | | |
| Letter to Shareholders | | Wells Fargo Advantage California Municipal Money Market Fund | | | 3 | |
the drop may be more attributable to a decline in the labor force than to a meaningful uptick in hiring. The level of job creation in 2011 has been trending below historical averages, suggesting that the improving economy has yet to translate into widespread hiring. Meanwhile, the beleaguered housing market was an ongoing source of concern, despite some tentative late-year signs of stabilization. That said, persistent weakness in the labor and housing markets bears close watching in the months ahead.
Other economic data in the U.S. has been more encouraging, reflecting greater confidence in the sustainability of the expansion on the part of both consumers and businesses. Retail sales came in strong at certain points during the period and industrial production and new orders have picked up. Although still reluctant to hire, businesses have gradually increased spending in other areas, such as equipment and information technology. Core inflation, which excludes volatile food and energy prices, remained benign.
The Federal Reserve believes the economic recovery will accelerate in future quarters.
With inflation subdued, the Federal Open Market Committee (FOMC) held its target range for the federal funds rate—a proxy for short-term interest rates—steady at 0.00% to 0.25%. On June 22, 2011, in its final statement of the six-month period, the Fed reiterated that the economic recovery “is proceeding at a moderate pace,” but that “recent labor market indicators have been weaker than anticipated.” It described the recent increase in inflation as temporary, suggesting that inflation pressures will ease going forward. While the FOMC explained that it “expects the pace of recovery to pick up over coming quarters,” it indicated that the federal funds rate will remain at an exceptionally low level for as long as necessary to ensure a sustainable recovery and expansion.
As recent headwinds subside, it is reasonable to expect markets to regain focus.
Now that it appears the debt ceiling has been increased and a U.S. default will be averted, money market participants and the broader bond market can get back to more fundamental and lasting concerns-chiefly, the economy. After avoiding short-term Treasuries in late July 2011, ahead of pending U.S. debt ceiling deadline, money market participants have returned to the U.S. short-term markets1. Economic indicators released in the second half of 2011 might not be as soft as those reported during the first half of the year. While that would not mean that the economy is robust, it might remind the markets that the first half of the slowdown was transitory. Most indicators still point toward real GDP growth in the 2% to 3% range in the second half of 2011. While that is not enough to produce big employment gains, it might be sufficient to cause Treasury yields to retrace some of the late-July declines.
Don’t let short-term uncertainty derail long-term investment goals.
While periods of uncertainty can present challenges, experience has taught us that maintaining a long-term investment strategy based on individual goals and risk tolerance can be an effective way to plan for the future. As a whole, Wells Fargo Advantage Funds represents investments across a broad range of asset
| 1. | Comments expressed that do not fall within the reporting period are as of August 2, 2011. |
Economic indicators released in the second half of 2011 might not be as soft as those reported during the first half of the year. While that would not mean that the economy is robust, it might remind the markets that the first half of the slowdown was transitory.
| | | | |
| 4 | | Wells Fargo Advantage California Municipal Money Market Fund | | Letter to Shareholders |
classes and investment styles with more than 110 mutual funds, giving you an opportunity to create a diversified investment portfolio. While diversification may not prevent losses in a downturn, it may help to reduce them and provide you with one way of managing risk.
In our opinion, diligent and earnest assessment of the fundamental characteristics of money market eligible securities will be a key differentiating factor between which investment strategies meet client expectations and which do not. At Wells Fargo Advantage Funds, we intend to continue the emphasis of principal preservation and high liquidity across our lineup of Wells Fargo Advantage Money Market Funds. In changing markets, we believe it is particularly important to have diligent investment analysts in charge of investor assets.
Thank you for choosing Wells Fargo Advantage Funds. We appreciate your confidence in us and are committed to helping you meet your financial needs. If you have any questions about your investments, please contact your investment professional, call us at 1-800-222-8222, or visit www.wellsfargo.com/advantagefunds.
Sincerely,

Karla M. Rabusch
President
Wells Fargo Advantage Funds
| | | | | | |
| Performance Highlights (Unaudited) | | Wells Fargo Advantage California Municipal Money Market Fund | | | 5 | |
INVESTMENT OBJECTIVE
The Fund seeks current income exempt from regular federal income tax and California individual income tax, while preserving capital and liquity.
ADVISER
Wells Fargo Funds Management, LLC
SUB-ADVISER
Wells Capital Management Incorporated
PORTFOLIO MANAGERS
David D. Sylvester
James Randazzo
FUND INCEPTION
January 1, 1992
|
SECTOR DISTRIBUTION1 (AS OF JULY 31, 2011) |
|
 |
|
EFFECTIVE MATURITY DISTRIBUTION1 (AS OF JULY 31, 2011) |
|
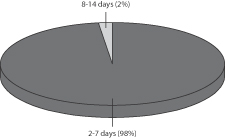 |
| | |
WEIGHTED AVERAGE MATURITY2 (AS OF JULY 31, 2011) | | |
6 Days |
| | |
WEIGHTED AVERAGE FINAL MATURITY3 (AS OF JULY 31, 2011) | | |
6 Days |
| 1. | Sector distribution and effective maturity distribution are subject to change and are calculated based on the total investments of the Fund. Effective maturity distribution is based on the weighted average maturity of each security. |
| 2. | Weighted Average Maturity (WAM): WAM calculates an average time to maturity of all of the securities held in the portfolio, weighted by each security’s percentage of net assets. The calculation takes into account the final maturity of a fixed-income security and the interest rate reset date for floating-rate securities held in the portfolio. This is a way to measure a fund’s sensitivity to potential interest rate changes. |
| 3. | Weighted Average Final Maturity (WAFM): WAFM calculates a fund’s average time to maturity for all of the securities held in the portfolio, weighted to their percentage of assets in the Fund. In contrast to WAM, the WAFM calculation takes into account the final maturity date for each security held in the portfolio. This is a way to measure a fund’s potential sensitivity to credit spread changes. |
| | | | |
| 6 | | Wells Fargo Advantage California Municipal Money Market Fund | | Performance Highlights (Unaudited) |
AVERAGE ANNUAL TOTAL RETURN4 (%) (AS OF JULY 31, 2011)
| | | | | | | | | | | | | | | | | | | | | | | | | | | | |
| | | | | | | | | | | | | | | | | | Expense Ratios5 | |
| | | Inception Date | | | 6 Months* | | | 1 Year | | | 5 Year | | | 10 Year | | | Gross | | | Net6 | |
Class A (SGCXX) | | | 01/01/1992 | | | | 0.00 | | | | 0.01 | | | | 1.15 | | | | 1.14 | | | | 0.63% | | | | 0.63% | |
Administrator Class (WCMXX) | | | 06/30/2010 | | | | 0.01 | | | | 0.01 | | | | 1.35 | | | | 1.34 | | | | 0.36% | | | | 0.30% | |
Institutional Class A (WCTXX) | | | 03/31/2008 | | | | 0.02 | | | | 0.06 | | | | 1.36 | | | | 1.34 | | | | 0.24% | | | | 0.20% | |
Service Class (WFCXX) | | | 11/08/1999 | | | | 0.00 | | | | 0.01 | | | | 1.26 | | | | 1.30 | | | | 0.53% | | | | 0.45% | |
Sweep Class | | | 06/30/2010 | | | | 0.00 | | | | 0.01 | | | | 1.26 | | | | 1.30 | | | | 0.98% | | | | 0.98% | |
| * | Returns for periods of less than one year are not annualized. |
| | | | | | | | | | | | | | | | | | | | |
FUND YIELD SUMMARY6 (AS OF JULY 31, 2011) | | Class A | | | Administrator
Class | | | Institutional
Class | | | Service
Class | | | Sweep
Class | |
7-Day Current Yield | | | 0.01% | | | | 0.01% | | | | 0.01% | | | | 0.01% | | | | 0.01% | |
7-Day Compound Yield | | | 0.01% | | | | 0.01% | | | | 0.01% | | | | 0.01% | | | | 0.01% | |
30-Day Simple Yield | | | 0.01% | | | | 0.01% | | | | 0.01% | | | | 0.01% | | | | 0.01% | |
30-Day Compound Yield | | | 0.01% | | | | 0.01% | | | | 0.01% | | | | 0.01% | | | | 0.01% | |
Figures quoted represent past performance, which is no guarantee of future results and do not reflect the deduction of taxes that a shareholder may pay on fund distributions or the redemption of fund shares. Investment returns will fluctuate. The Fund’s yield figures more closely reflect the current earnings of the Fund than the total return figures. Current performance may be lower or higher than the performance data quoted. Current month-end performance is available at the Fund’s Web site – www.wellsfargo.com/advantagefunds.
Each class is sold without a front-end sales charge or contingent deferred sales charge. Other fees and expenses apply to an investment in the Fund and are described in the Fund’s current prospectus.
An investment in a money market fund is not insured or guaranteed by the Federal Deposit Insurance Corporation or any other government agency. Although the Fund seeks to preserve the value of your investment at $1.00 per share, it is possible to lose money by investing in a money market fund. A portion of the Fund’s income may be subject to federal, state and/or local income taxes or the alternative minimum tax (AMT).
| 4. | Historical performance shown for the Administrator Class shares prior to their inception reflects the performance of the Institutional Class shares, and has not been adjusted to reflect higher expenses applicable to the Administrator Class shares. If these expenses had been adjusted, returns would be lower. Historical performance shown for the Institutional Class shares prior to their inception reflects the performance of the Service Class shares, and includes the higher expenses applicable to the Service Class shares. If these expenses had not been included, returns would be higher. Historical performance shown for the Sweep Class shares prior to their inception reflects the performance of the Service Class shares, and has not been adjusted to reflect the higher expenses applicable to the Sweep Class shares. If these expenses had been adjusted, returns would be lower. |
| 5. | Reflects the expense ratios as stated in the most recent prospectuses. |
| 6. | The Adviser has committed through July 11, 2013 to waive fees and/or reimburse expenses to the extent necessary to cap the Fund’s Total Annual Fund Operating Expenses After Fee Waiver, excluding certain expenses, at 0.65% for Class A, 0.30% for Administrator Class, 0.20% for Institutional Class, 0.45% for Service Class and 1.05% for Sweep Class. Without this cap, the Fund’s returns would have been lower. Without waived fees and/or reimbursed expenses, the Fund’s 7-day current yield would have been (0.54)%, (0.26)%, (0.15)%, (0.44)% and (0.89)% for Class A, Administrator Class, Institutional Class, Service Class and Sweep Class, respectively. |
| | | | | | |
| Fund Expenses | | Wells Fargo Advantage California Municipal Money Market Fund | | | 7 | |
As a shareholder of the Fund, you incur two types of costs: (1) transaction costs, including contingent deferred sales charges (if any) and (2) ongoing costs, including management fees; distribution (12b-1) and/or shareholder service fees; and other Fund expenses. This example is intended to help you understand your ongoing costs (in dollars) of investing in the Fund and to compare these costs with the ongoing costs of investing in other mutual funds.
The example is based on an investment of $1,000 invested at the beginning of the six-month period and held for the entire period from February 1, 2011 to July 31, 2011.
Actual Expenses
The “Actual” line of the table below provides information about actual account values and actual expenses. You may use the information in this line, together with the amount you invested, to estimate the expenses that you paid over the period. Simply divide your account value by $1,000 (for example, an $8,600 account value divided by $1,000 = 8.6), then multiply the result by the number in the “Actual” line under the heading entitled “Expenses Paid During Period” for your applicable class of shares to estimate the expenses you paid on your account during this period.
Hypothetical Example for Comparison Purposes
The “Hypothetical” line of the table below provides information about hypothetical account values and hypothetical expenses based on the Fund’s actual expense ratio and an assumed rate of return of 5% per year before expenses, which is not the Fund’s actual return. The hypothetical account values and expenses may not be used to estimate the actual ending account balance or expenses you paid for the period. You may use this information to compare the ongoing costs of investing in the Fund and other funds. To do so, compare this 5% hypothetical example with the 5% hypothetical examples that appear in the shareholder reports of the other funds.
Please note that the expenses shown in the table are meant to highlight your ongoing costs only and do not reflect any transactional costs, such as any contingent deferred sales charges. Therefore, the “Hypothetical” line of the table is useful in comparing ongoing costs only, and will not help you determine the relative total costs of owning different funds. In addition, if these transactional costs were included, your costs would have been higher.
| | | | | | | | | | | | | | | | |
| | | Beginning
Account Value
02-01-2011 | | | Ending
Account Value
07-31-2011 | | | Expenses
Paid During
the Period1 | | | Net Annual
Expense Ratio | |
Class A | | | | | | | | | | | | | | | | |
Actual | | $ | 1,000.00 | | | $ | 1,000.05 | | | $ | 0.89 | | | | 0.18 | % |
Hypothetical (5% return before expenses) | | $ | 1,000.00 | | | $ | 1,023.90 | | | $ | 0.90 | | | | 0.18 | % |
Administrator Class | | | | | | | | | | | | | | | | |
Actual | | $ | 1,000.00 | | | $ | 1,000.05 | | | $ | 0.89 | | | | 0.18 | % |
Hypothetical (5% return before expenses) | | $ | 1,000.00 | | | $ | 1,023.90 | | | $ | 0.90 | | | | 0.18 | % |
Institutional Class | | | | | | | | | | | | | | | | |
Actual | | $ | 1,000.00 | | | $ | 1,000.16 | | | $ | 0.79 | | | | 0.16 | % |
Hypothetical (5% return before expenses) | | $ | 1,000.00 | | | $ | 1,024.00 | | | $ | 0.80 | | | | 0.16 | % |
Service Class | | | | | | | | | | | | | | | | |
Actual | | $ | 1,000.00 | | | $ | 1,000.05 | | | $ | 0.89 | | | | 0.18 | % |
Hypothetical (5% return before expenses) | | $ | 1,000.00 | | | $ | 1,023.90 | | | $ | 0.90 | | | | 0.18 | % |
Sweep Class | | | | | | | | | | | | | | | | |
Actual | | $ | 1,000.00 | | | $ | 1,000.05 | | | $ | 0.94 | | | | 0.19 | % |
Hypothetical (5% return before expenses) | | $ | 1,000.00 | | | $ | 1,023.85 | | | $ | 0.95 | | | | 0.19 | % |
| 1. | Expenses paid is equal to the annualized expense ratio of each class multiplied by the average account value over the period, multiplied by the number of days in the most recent fiscal half-year divided by the number of days in the fiscal year (to reflect the one-half year period). |
| | | | |
| 8 | | Wells Fargo Advantage California Municipal Money Market Fund | | Portfolio of Investments—July 31, 2011 (Unaudited) |
| | | | | | | | | | | | | | | | |
| Security Name | | Interest Rate | | | Maturity Date | | | Principal | | | Value | |
| | | | | | | | | | | | | | | | |
| | | | |
Municipal Bonds and Notes: 91.84% | | | | | | | | | | | | | | | | |
| | | | |
California: 88.86% | | | | | | | | | | | | | | | | |
| | | | |
| Other Municipal Debt: 2.08% | | | | | | | | | | | | | | | | |
Riverside County CA Teeter Financing (Miscellaneous Revenue) | | | 0.27 | % | | | 08/03/2011 | | | $ | 5,000,000 | | | $ | 5,000,000 | |
San Diego County CA School Districts Series B-1 (Tax Revenue, GO of Participants Insured) | | | 2.00 | | | | 01/31/2012 | | | | 1,000,000 | | | | 1,007,610 | |
San Joaquin County CA Transportation Authority Series A (Transportation Revenue) | | | 0.09 | | | | 08/09/2011 | | | | 10,000,000 | | | | 10,000,000 | |
San Joaquin County CA Transportation Authority Series A (Transportation Revenue) | | | 0.09 | | | | 08/10/2011 | | | | 38,000,000 | | | | 38,000,000 | |
| | | | |
| | | | | | | | | | | | | | | 54,007,610 | |
| | | | | | | | | | | | | | | | |
| | | | |
| Variable Rate Demand Notes§: 86.78% | | | | | | | | | | | | | | | | |
ABAG Finance Authority for Nonprofit Corporation California Berkeleyan Project A (Housing Revenue, FNMA Insured) | | | 0.12 | | | | 05/15/2033 | | | | 2,000,000 | | | | 2,000,000 | |
ABAG Finance Authority for Nonprofit Corporation California Branson School (Education Revenue, Northern Trust Company LOC) | | | 0.07 | | | | 07/01/2038 | | | | 6,700,000 | | | | 6,700,000 | |
ABAG Finance Authority for Nonprofit Corporation California MFHR Acton Courtyard Series A (Housing Revenue, FHLMC Insured) | | | 0.11 | | | | 04/01/2037 | | | | 1,300,000 | | | | 1,300,000 | |
ABAG Finance Authority for Nonprofit Corporation California MFHR Fine Arts Building Projects Series A (Housing Revenue, FNMA Insured) | | | 0.12 | | | | 07/15/2035 | | | | 14,200,000 | | | | 14,200,000 | |
ABAG Finance Authority for Nonprofit Corporation California The Head-Royce School (Education Revenue, Bank of America NA LOC) | | | 0.08 | | | | 09/01/2036 | | | | 11,300,000 | | | | 11,300,000 | |
ABAG Finance Authority For Nonprofit Corporation Valley Christian Schools (Education Revenue, Bank of America NA LOC) | | | 0.12 | | | | 07/01/2039 | | | | 19,480,000 | | | | 19,480,000 | |
ABAG Finance Authority for Nonprofit Corporations California Colma BART Apartments Series A (Housing Revenue, Bank of America NA LOC) | | | 0.13 | | | | 11/15/2035 | | | | 10,110,000 | | | | 10,110,000 | |
ABAG Finance Authority for Nonprofit Corporations California Menlo School (Education Revenue, Northern Trust Company LOC) | | | 0.05 | | | | 09/01/2033 | | | | 15,000,000 | | | | 15,000,000 | |
ABAG Finance Authority for Nonprofit Corporations California San Francisco University Series A (Education Revenue, Northern Trust Company LOC) | | | 0.05 | | | | 04/01/2035 | | | | 1,515,000 | | | | 1,515,000 | |
ABAG Finance Authority for Nonprofit Corporations California Zoological Society of San Diego (Miscellaneous Revenue, Bank of America NA LOC) | | | 0.10 | | | | 10/01/2034 | | | | 14,385,000 | | | | 14,385,000 | |
ABAG Finance Authority for Nonprofit Corporations Caliifornia Jewish Community Center (Miscellaneous Revenue, Bank of America NA LOC) | | | 0.11 | | | | 06/01/2029 | | | | 4,515,000 | | | | 4,515,000 | |
ABAG Finance Authority For Nonprofit Corporations San Francisco High University Series A (Education Revenue, Northern Trust Company LOC) | | | 0.05 | | | | 04/01/2036 | | | | 6,835,000 | | | | 6,835,000 | |
Alameda CA PFA MFHA Eagle Parrot Project Series A (Housing Revenue, FNMA Insured) | | | 0.09 | | | | 05/15/2035 | | | | 1,565,000 | | | | 1,565,000 | |
Anaheim CA Housing Authority Cobblestone Apartments Series B (Housing Revenue, FNMA Insured) | | | 0.18 | | | | 03/15/2033 | | | | 2,000,000 | | | | 2,000,000 | |
Anaheim CA Housing Authority MFHR Monterey Apartments Series B (Housing Revenue, FNMA Insured) | | | 0.09 | | | | 05/15/2027 | | | | 1,895,000 | | | | 1,895,000 | |
Anaheim CA Housing Authority Sea Wind Apartments Project Series C (Housing Revenue, FNMA Insured) | | | 0.18 | | | | 07/15/2033 | | | | 6,000,000 | | | | 6,000,000 | |
Arcadia County CA USD Series 2679 (GO-Local, FSA Insured) | | | 0.12 | | | | 08/01/2013 | | | | 8,680,000 | | | | 8,680,000 | |
Austin Certificates Bank of America Series 2008-3312 (Miscellaneous Revenue) | | | 0.14 | | | | 08/01/2032 | | | | 7,000,000 | | | | 7,000,000 | |
Azusa CA Public Financing Authority Parity Water Systems Project (Water & Sewer Revenue, FSA Insured) | | | 0.08 | | | | 02/01/2038 | | | | 14,550,000 | | | | 14,550,000 | |
Bay Area Toll Authority California Toll Bridge (Transportation Revenue, Union Bank NA LOC) | | | 0.04 | | | | 04/01/2047 | | | | 4,190,000 | | | | 4,190,000 | |
| | | | | | |
| Portfolio of Investments—July 31, 2011 (Unaudited) | | Wells Fargo Advantage California Municipal Money Market Fund | | | 9 | |
| | | | | | | | | | | | | | | | |
| Security Name | | Interest Rate | | | Maturity Date | | | Principal | | | Value | |
| | | | | | | | | | | | | | | | |
| | | | |
| Variable Rate Demand Notes§ (continued) | | | | | | | | | | | | | | | | |
Bay Area Toll Authority California Toll Bridge (Transportation Revenue, Morgan Stanley Bank LOC) | | | 0.05 | % | | | 04/01/2045 | | | $ | 15,550,000 | | | $ | 15,550,000 | |
Bay Area Toll Authority California Toll Bridge Series A (Transportation Revenue, Sumitomo Mitsui Banking LOC) | | | 0.05 | | | | 04/01/2045 | | | | 2,300,000 | | | | 2,300,000 | |
Bay Area Toll Authority California Toll Bridge Series A2 (Transportation Revenue, Union Bank NA LOC) | | | 0.05 | | | | 04/01/2047 | | | | 9,400,000 | | | | 9,400,000 | |
Branch Banking & Trust Municipal Trust Floaters Series 2049 (GO-Local, FSA Insured) | | | 0.09 | | | | 02/01/2027 | | | | 9,075,000 | | | | 9,075,000 | |
California Alternative Energy Source Financing Authority GE Capital Corporation Series A (Utilities Revenue) | | | 0.09 | | | | 10/01/2020 | | | | 25,330,000 | | | | 25,330,000 | |
California CDA Multifamily Housing Glen Haven Apartments Series 2002 (Housing Revenue, FNMA Insured) | | | 0.18 | | | | 04/15/2035 | | | | 7,000,000 | | | | 7,000,000 | |
California CDA Multifamily Housing PUTTER Series 2680 (Miscellaneous Revenue, JPMorgan Chase Bank LOC) | | | 0.22 | | | | 05/15/2018 | | | | 21,700,000 | | | | 21,700,000 | |
California Finance Authority Kehillah Jewish High School Series 2009 (Education Revenue, California Bank & Trust LOC) | | | 0.07 | | | | 08/01/2039 | | | | 13,790,000 | | | | 13,790,000 | |
California HFA Home Mortgage Series H (Housing Revenue, FNMA LOC) | | | 0.05 | | | | 02/01/2036 | | | | 4,900,000 | | | | 4,900,000 | |
California HFFA California Presbyterian Homes (Continuing Care Retirement Community, Union Bank NA LOC) | | | 0.08 | | | | 07/01/2034 | | | | 8,080,000 | | | | 8,080,000 | |
California HFFA St. Joseph Health System Series B (Health Revenue, U.S. Bank NA LOC) | | | 0.24 | | | | 07/01/2041 | | | | 10,000,000 | | | | 10,000,000 | |
California HFFA St. Joseph Health System Series C (Health Revenue, Northern Trust Company LOC) | | | 0.24 | | | | 07/01/2041 | | | | 5,000,000 | | | | 5,000,000 | |
California Infrastructure & Economic Development Bank California Academy Series C (Education Revenue, East West Bank LOC) | | | 0.11 | | | | 12/01/2040 | | | | 4,940,000 | | | | 4,940,000 | |
California Infrastructure & Economic Development Bank Haig Precision Corporation Project (IDR, Bank of the West LOC) | | | 0.23 | | | | 07/01/2030 | | | | 1,400,000 | | | | 1,400,000 | |
California Infrastructure & Economic Development Bank J. Paul Getty Project Series A2 (Miscellaneous Revenue) | | | 0.23 | | | | 10/01/2047 | | | | 15,975,000 | | | | 15,975,000 | |
California Infrastructure & Economic Development Bank J. Paul Getty Project Series B (Miscellaneous Revenue) | | | 0.23 | | | | 04/01/2033 | | | | 16,835,000 | | | | 16,835,000 | |
California Infrastructure & Economic Development Bank J. Paul Getty Project Series A4 (Miscellaneous Revenue) | | | 0.23 | | | | 10/01/2047 | | | | 15,250,000 | | | | 15,250,000 | |
California Infrastructure & Economic Development Bank Lycee Francias de Los Angeles Project (Education Revenue, U.S. Bank NA LOC) | | | 0.06 | | | | 09/01/2036 | | | | 3,000,000 | | | | 3,000,000 | |
California Infrastructure & Economic Development Bank Pacific Gas & Electric Company Series B (Utilities Revenue, Mizuho Corporate Bank LOC) | | | 0.24 | | | | 11/01/2026 | | | | 40,325,000 | | | | 40,325,000 | |
California Infrastructure & Economic Development Bank Pacific Gas & Electric Company Series C (Utilities Revenue, Sumitomo Mitsui Banking LOC) | | | 0.23 | | | | 12/01/2016 | | | | 8,600,000 | | | | 8,600,000 | |
California Infrastructure & Economic Development Bank ROC RR II R-11527 (Transportation Revenue, AMBAC Insured) | | | 0.11 | | | | 07/01/2030 | | | | 6,755,000 | | | | 6,755,000 | |
California Infrastructure & Economic Development Bank Society for the Blind Project (Miscellaneous Revenue, U.S. Bank NA LOC) | | | 0.11 | | | | 01/01/2037 | | | | 2,185,000 | | | | 2,185,000 | |
California Infrastructure & Economic Development Bank The Bay Institute Aquarium Foundation (Miscellaneous Revenue) | | | 0.05 | | | | 06/01/2025 | | | | 6,400,000 | | | | 6,400,000 | |
California Municipal Finance Authority Pacific Institute Series A (Health Revenue, California Bank & Trust LOC) | | | 0.07 | | | | 08/01/2037 | | | | 21,055,000 | | | | 21,055,000 | |
California Municipal Finance Authority San Francisco Planning Project (Miscellaneous Revenue) | | | 0.05 | | | | 12/01/2042 | | | | 6,935,000 | | | | 6,935,000 | |
California PCFA Burney Forest Products Project Series A (Resource Recovery Revenue, Union Bank of California LOC) | | | 0.21 | | | | 09/01/2020 | | | | 14,700,000 | | | | 14,700,000 | |
California PCFA Musco Family Olive Series A (Resource Recovery Revenue, Bank of the West LOC) | | | 0.07 | | | | 11/01/2019 | | | | 3,200,000 | | | | 3,200,000 | |
| | | | |
| 10 | | Wells Fargo Advantage California Municipal Money Market Fund | | Portfolio of Investments—July 31, 2011 (Unaudited) |
| | | | | | | | | | | | | | | | |
| Security Name | | Interest Rate | | | Maturity Date | | | Principal | | | Value | |
| | | | | | | | | | | | | | | | |
| | | | |
| Variable Rate Demand Notes§ (continued) | | | | | | | | | | | | | | | | |
California PCFA Solid Waste John & Ann M Verwey Project (Miscellaneous Revenue, Bank of America NA LOC) | | | 0.12 | % | | | 05/01/2028 | | | $ | 3,400,000 | | | $ | 3,400,000 | |
California PCFA Solid Waste Milk Time Dairy Farms Project (Miscellaneous Revenue, CoBank ACB LOC) | | | 0.12 | | | | 11/01/2027 | | | | 6,000,000 | | | | 6,000,000 | |
California PCFA Solid Waste Milk Time Dairy Farms Project (Miscellaneous Revenue, Bank of the West LOC) | | | 0.12 | | | | 11/01/2027 | | | | 1,400,000 | | | | 1,400,000 | |
California PCFA Solid Waste P&D Dairy & Poso Creek (Miscellaneous Revenue, Bank of the West LOC) | | | 0.12 | | | | 05/01/2028 | | | | 3,000,000 | | | | 3,000,000 | |
California PCFA Wadham Energy Series C (Resource Recovery Revenue, BNP Paribas LOC) | | | 0.16 | | | | 11/01/2017 | | | | 14,000,000 | | | | 14,000,000 | |
California PCFA Waste Connection Incorporated Project (Resource Recovery Revenue, Bank of America NA LOC) | | | 0.18 | | | | 08/01/2018 | | | | 10,100,000 | | | | 10,100,000 | |
California Refunding GO Branch Banking & Trust Company Municipal Trust Series 2000 (GO-State, Branch Banking & Trust LOC, FSA Insured) | | | 0.15 | | | | 07/10/2027 | | | | 15,640,000 | | | | 15,640,000 | |
California Scripps Health Series F (Hospital Revenue, Northern Trust Company LOC) | | | 0.04 | | | | 10/01/2031 | | | | 4,285,000 | | | | 4,285,000 | |
California DWR Series 3019 (Water & Sewer Revenue) | | | 0.12 | | | | 06/01/2016 | | | | 4,885,000 | | | | 4,885,000 | |
California EDFA Joseph Schmidt Project Series A (IDR, Bank of the West LOC) | | | 0.16 | | | | 12/01/2026 | | | | 2,700,000 | | | | 2,700,000 | |
California Enterprise Development Authority Pocino Foods Company Project Series A (IDR) | | | 0.11 | | | | 11/01/2033 | | | | 7,665,000 | | | | 7,665,000 | |
California Enterprise Development Authority Ramar International Corporation Project Series A (IDR, Bank of the West LOC) | | | 0.11 | | | | 11/01/2033 | | | | 4,000,000 | | | | 4,000,000 | |
California Series A Subseries A-1-1 (GO-State, Royal Bank of Canada LOC) | | | 0.04 | | | | 05/01/2040 | | | | 20,000,000 | | | | 20,000,000 | |
California Series A Subseries A-1-2 (GO-State, Barclays Bank plc LOC) | | | 0.04 | | | | 05/01/2040 | | | | 10,000,000 | | | | 10,000,000 | |
California Series A Subseries C-2 (GO-State, Bank of Nova Scotia LOC) | | | 0.04 | | | | 05/01/2033 | | | | 1,000,000 | | | | 1,000,000 | |
California Series A Subseries A-1-1 (GO-State, Royal Bank of Canada LOC) | | | 0.04 | | | | 05/01/2040 | | | | 20,000,000 | | | | 20,000,000 | |
California Series A2 (GO-State, Bank of Montreal LOC) | | | 0.24 | | | | 05/01/2033 | | | | 45,700,000 | | | | 45,700,000 | |
California Series A3 (GO-State, Bank of Montreal LOC) | | | 0.21 | | | | 05/01/2033 | | | | 18,150,000 | | | | 18,150,000 | |
California Series B Subseries B3 (GO-State, Barclays Bank plc LOC) | | | 0.04 | | | | 05/01/2040 | | | | 12,475,000 | | | | 12,475,000 | |
California CDA (Health Revenue, FHLMC Insured)†† | | | 0.08 | | | | 11/15/2048 | | | | 28,367,789 | | | | 28,367,789 | |
California CDA (Hospital Revenue, FSA Insured)†† | | | 0.12 | | | | 08/15/2032 | | | | 12,825,000 | | | | 12,825,000 | |
California CDA Aegis Moraga Project C (Housing Revenue, FNMA Insured) | | | 0.20 | | | | 07/01/2027 | | | | 7,255,000 | | | | 7,255,000 | |
California CDA Aegis Pleasant Hill Series H (Housing Revenue, FNMA Insured) | | | 0.18 | | | | 07/01/2027 | | | | 6,270,000 | | | | 6,270,000 | |
California CDA Arbor Ridge Apartments Series B (Housing Revenue, FHLMC Insured) | | | 0.14 | | | | 11/01/2036 | | | | 9,500,000 | | | | 9,500,000 | |
California CDA Avian Glen Apartment Project CC (Housing Revenue, CitiBank NA LOC) | | | 0.20 | | | | 08/01/2039 | | | | 5,190,000 | | | | 5,190,000 | |
California CDA Belmont Project Series F (Housing Revenue, FNMA Insured) | | | 0.17 | | | | 06/15/2038 | | | | 9,390,000 | | | | 9,390,000 | |
California CDA Charter Court Apartments Series L (Housing Revenue, FHLMC Insured) | | | 0.14 | | | | 09/01/2040 | | | | 4,000,000 | | | | 4,000,000 | |
California CDA Gas Supply (Energy Revenue, Royal Bank of Canada SPA) | | | 0.07 | | | | 11/01/2040 | | | | 64,575,000 | | | | 64,575,000 | |
California CDA Grande Apartments Series TT (Housing Revenue, FNMA Insured) | | | 0.19 | | | | 12/15/2034 | | | | 1,925,000 | | | | 1,925,000 | |
California CDA Greenback Manor Apartments Series A (Housing Revenue, East West Bank LOC) | | | 0.18 | | | | 02/01/2028 | | | | 4,660,000 | | | | 4,660,000 | |
California CDA Health Facility Community Hospital (Hospital Revenue) (Hospital Revenue, U.S. Bank NA LOC) | | | 0.05 | | | | 06/01/2033 | | | | 8,500,000 | | | | 8,500,000 | |
California CDA La Puente Apartments Series JJ (Housing Revenue, U.S. Bank NA LOC) | | | 0.33 | | | | 11/01/2031 | | | | 6,775,000 | | | | 6,775,000 | |
California CDA Livermore Valley Arts Center Project (Miscellaneous Revenue, Bank of New York LOC) | | | 0.04 | | | | 12/01/2036 | | | | 12,170,000 | | | | 12,170,000 | |
| | | | | | |
| Portfolio of Investments—July 31, 2011 (Unaudited) | | Wells Fargo Advantage California Municipal Money Market Fund | | | 11 | |
| | | | | | | | | | | | | | | | |
| Security Name | | Interest Rate | | | Maturity Date | | | Principal | | | Value | |
| | | | | | | | | | | | | | | | |
| | | | |
| Variable Rate Demand Notes§ (continued) | | | | | | | | | | | | | | | | |
California CDA MFHR Canyon Country Apartments Series M (Housing Revenue, FHLMC Insured) | | | 0.18 | % | | | 12/01/2034 | | | $ | 10,500,000 | | | $ | 10,500,000 | |
California CDA MFHR Granite Oaks Apartments Series R (Housing Revenue, FNMA Insured) | | | 0.19 | | | | 10/15/2030 | | | | 3,985,000 | | | | 3,985,000 | |
California CDA MFHR Imperial Park Apartments Series 00 (Housing Revenue, FHLMC Insured) | | | 0.09 | | | | 11/01/2040 | | | | 10,935,000 | | | | 10,935,000 | |
California CDA Multifamily Housing Desert Palms Series A (Housing Revenue, FHLMC LOC) | | | 0.09 | | | | 08/01/2045 | | | | 7,000,000 | | | | 7,000,000 | |
California CDA Multifamily Housing PFOTER MT 381 (Housing Revenue, FNMA Insured) | | | 0.18 | | | | 02/01/2050 | | | | 14,000,000 | | | | 14,000,000 | |
California CDA Multifamily Housing PFOTER MT 381 (Housing Revenue, FHLMC Insured) | | | 0.18 | | | | 02/01/2053 | | | | 11,000,000 | | | | 11,000,000 | |
California CDA Multifamily Housing PUTTERS Series 2681 (Housing Revenue, JPMorgan Chase Bank LOC) | | | 0.32 | | | | 05/15/2018 | | | | 1,300,000 | | | | 1,300,000 | |
California CDA Multifamily Housing Seasons at Lakewood Series A (Housing Revenue, FNMA Insured) | | | 0.19 | | | | 05/15/2037 | | | | 3,200,000 | | | | 3,200,000 | |
California CDA Oakmont Senior Living Series Y (Housing Revenue, FNMA Insured) | | | 0.18 | | | | 08/01/2031 | | | | 7,840,000 | | | | 7,840,000 | |
California CDA Olympus Park Apartments Series Y (Housing Revenue, FNMA Insured) | | | 0.18 | | | | 10/15/2030 | | | | 6,440,000 | | | | 6,440,000 | |
California CDA Seasons Senior Apartments Series B (Housing Revenue, FNMA Insured) | | | 0.18 | | | | 05/15/2037 | | | | 5,265,000 | | | | 5,265,000 | |
California CDA Series 3108 (Hospital Revenue, AMBAC Insured)†† | | | 0.08 | | | | 08/15/2038 | | | | 6,000,000 | | | | 6,000,000 | |
California CDA Sunrise of Danville Project Series A (Housing Revenue, FNMA Insured) | | | 0.18 | | | | 05/01/2027 | | | | 5,665,000 | | | | 5,665,000 | |
California CDA Tyrella Gardens Apartments Series B (Housing Revenue, CitiBank NA LOC) | | | 0.10 | | | | 06/01/2036 | | | | 2,545,000 | | | | 2,545,000 | |
California CDA University Retirement Community Project (Health Revenue, Bank of America NA LOC) | | | 0.27 | | | | 11/15/2038 | | | | 1,110,000 | | | | 1,110,000 | |
California CDA Villa Paseo Senior Project MM (Housing Revenue, East West Bank LOC) | | | 0.19 | | | | 11/01/2035 | | | | 4,000,000 | | | | 4,000,000 | |
California CDA Village at Hesperia Series CCC (Housing Revenue, FNMA Insured) | | | 0.19 | | | | 11/15/2039 | | | | 2,300,000 | | | | 2,300,000 | |
California CDA Village at Ninth Apartments Series D (Housing Revenue, FNMA Insured) | | | 0.18 | | | | 11/15/2035 | | | | 4,375,000 | | | | 4,375,000 | |
California CDA Village at Shaw Apartments Series E (Housing Revenue, FNMA Insured) | | | 0.19 | | | | 11/15/2035 | | | | 3,605,000 | | | | 3,605,000 | |
Camarillo CA Hacienda de Camarillo Project (Housing Revenue, FNMA Insured) | | | 0.17 | | | | 10/15/2026 | | | | 1,755,000 | | | | 1,755,000 | |
Central Basin California Municipal Water Distribution Series B (Utilities Revenue, U.S. Bank NA LOC) | | | 0.05 | | | | 08/01/2037 | | | | 10,620,000 | | | | 10,620,000 | |
Chino Basin California Regional Financing Authority Inland Empire Utility Series B (Water & Sewer Revenue, Lloyds TSB Bank LOC) | | | 0.05 | | | | 06/01/2032 | | | | 8,580,000 | | | | 8,580,000 | |
Concord CA MFHR (Housing Revenue, FHLMC Insured) | | | 0.12 | | | | 12/01/2016 | | | | 2,100,000 | | | | 2,100,000 | |
Corona CA Household Bank Project B (Housing Revenue, FNMA Insured) | | | 0.10 | | | | 02/01/2023 | | | | 11,000,000 | | | | 11,000,000 | |
Deutsche Bank Spears Lifers Trust DB-383 (Tax Revenue, FGIC Insured) | | | 0.08 | | | | 08/01/2035 | | | | 11,575,000 | | | | 11,575,000 | |
Deutsche Bank Spears Lifers Trust DB-384 (Tax Revenue, NATL-RE Insured) | | | 0.08 | | | | 06/01/2032 | | | | 16,725,000 | | | | 16,725,000 | |
Deutsche Bank Spears Lifers Trust Series 445 (GO-Local, FSA Insured) | | | 0.08 | | | | 08/01/2032 | | | | 270,000 | | | | 270,000 | |
Deutsche Bank Spears Lifers Trust Series DB-287 (GO-Local, NATL-RE Insured) | | | 0.08 | | | | 09/01/2037 | | | | 38,530,000 | | | | 38,530,000 | |
Deutsche Bank Spears Lifers Trust Series DB-430 (Tax Revenue, NATL-RE Insured) | | | 0.08 | | | | 09/01/2038 | | | | 1,830,000 | | | | 1,830,000 | |
Deutsche Bank Spears Lifers Trust Series DB-448 (GO-Local, FSA Insured) | | | 0.08 | | | | 07/01/2032 | | | | 9,290,000 | | | | 9,290,000 | |
| | | | |
| 12 | | Wells Fargo Advantage California Municipal Money Market Fund | | Portfolio of Investments—July 31, 2011 (Unaudited) |
| | | | | | | | | | | | | | | | |
| Security Name | | Interest Rate | | | Maturity Date | | | Principal | | | Value | |
| | | | | | | | | | | | | | | | |
| | | | |
| Variable Rate Demand Notes§ (continued) | | | | | | | | | | | | | | | | |
Deutsche Bank Spears Lifers Trust Series DB-457 (GO-Local, FSA Insured) | | | 0.08 | % | | | 08/01/2032 | | | $ | 3,977,000 | | | $ | 3,977,000 | |
Deutsche Bank Spears Lifers Trust Series DB-477 (GO-Local, FSA FGIC AMBAC Insured) | | | 0.08 | | | | 12/01/2024 | | | | 210,000 | | | | 210,000 | |
Deutsche Bank Spears Lifers Trust Series DB-490 (Tax Revenue, FSA Insured) | | | 0.08 | | | | 02/01/2031 | | | | 10,460,000 | | | | 10,460,000 | |
Deutsche Bank Spears Lifers Trust Series DB-628 (GO-Local, FSA Insured) | | | 0.08 | | | | 08/01/2031 | | | | 4,175,000 | | | | 4,175,000 | |
Deutsche Bank Spears Lifers Trust Series DB-629 (GO-Local, NATL-RE Insured) | | | 0.08 | | | | 08/01/2031 | | | | 7,065,000 | | | | 7,065,000 | |
Deutsche Bank Spears Lifers Trust Series DB-630 (GO-Local, NATL-RE Insured) | | | 0.08 | | | | 02/01/2024 | | | | 4,520,000 | | | | 4,520,000 | |
Deutsche Bank Spears Lifers Trust Series DB-632 (GO-Local, FSA-CR FGIC Insured) | | | 0.08 | | | | 08/01/2033 | | | | 15,325,000 | | | | 15,325,000 | |
Deutsche Bank Spears Lifers Trust Series DBE-247 (Tax Revenue, FGIC Insured) | | | 0.08 | | | | 12/01/2030 | | | | 10,000,000 | | | | 10,000,000 | |
Deutsche Bank Spears Lifers Trust Series DBE-444 (GO-Local, FGIC Insured) | | | 0.08 | | | | 08/01/2032 | | | | 3,155,000 | | | | 3,155,000 | |
Deutsche Bank Spears Lifers Trust Series DBE-500 (Water & Sewer Revenue, AMBAC Insured) | | | 0.08 | | | | 11/01/2038 | | | | 2,690,000 | | | | 2,690,000 | |
Deutsche Bank Spears Lifers Trust Series DBE-575 (Tax Revenue, AMBAC Insured) | | | 0.08 | | | | 09/01/2029 | | | | 1,025,000 | | | | 1,025,000 | |
Deutsche Bank Spears Lifers Trust Series DBE-625 (Tobacco Revenue, AMBAC Insured) | | | 0.08 | | | | 06/01/2028 | | | | 7,165,000 | | | | 7,165,000 | |
Deutsche Bank Spears Lifers Trust Series DBE-637 (GO-Local) | | | 0.08 | | | | 08/01/2047 | | | | 8,800,000 | | | | 8,800,000 | |
Deutsche Bank Spears Lifers Trust Series DBE-675 (Tax Revenue, Assured Guaranty Insured) | | | 0.08 | | | | 08/01/2048 | | | | 7,827,000 | | | | 7,827,000 | |
East Bay CA Municipal Utilities District Water System Series A-1 (Water & Sewer Revenue) | | | 0.04 | | | | 06/01/2038 | | | | 50,820,000 | | | | 50,820,000 | |
East Bay CA Municipal Utilities District Water System Series A-3 (Water & Sewer Revenue) | | | 0.03 | | | | 06/01/2038 | | | | 9,955,000 | | | | 9,955,000 | |
Eclipse Funding Trust 2006-0002 Solar Eclipse Los Angeles (GO-Local, U.S. Bank NA LOC) | | | 0.07 | | | | 07/01/2030 | | | | 25,735,000 | | | | 25,735,000 | |
Eclipse Funding Trust 2007-0079 Solar Eclipse Los Angeles (GO-Local, U.S. Bank NA LOC) | | | 0.07 | | | | 08/01/2032 | | | | 10,200,000 | | | | 10,200,000 | |
Eclipse Funding Trust California Educational Facilities 2006-0065 Solar Eclipse Pepperdine (Education Revenue, U.S. Bank NA LOC) | | | 0.07 | | | | 12/01/2013 | | | | 2,175,000 | | | | 2,175,000 | |
Elsinore Valley CA Municipal Water District COP Series B (Water & Sewer Revenue, U.S. Bank NA LOC) | | | 0.05 | | | | 07/01/2035 | | | | 6,750,000 | | | | 6,750,000 | |
Fremont CA Treetops Apartments Series A (Housing Revenue, FNMA Insured) | | | 0.19 | | | | 08/15/2026 | | | | 9,800,000 | | | | 9,800,000 | |
Glendale CA Water Authority(GO - Local, NATL-RE Insured) | | | 0.08 | | | | 09/01/2027 | | | | 13,205,000 | | | | 13,205,000 | |
Golden State CA Tobacco Securitization Corporation Series 3123 (Miscellaneous Revenue)†† | | | 0.13 | | | | 06/01/2045 | | | | 21,290,000 | | | | 21,290,000 | |
Golden State CA Tobacco Securitization Corporation Tobacco Settlement ROC RR II R-11442 (Tobacco Revenue, AGC-ICC Insured) | | | 0.28 | | | | 06/01/2035 | | | | 6,255,000 | | | | 6,255,000 | |
Grossmont CA USD Capital Appreciation Election of 2004 (Tobacco Revenue, FGIC Insured) | | | 0.08 | | | | 06/01/2035 | | | | 3,375,000 | | | | 3,375,000 | |
Grossmont Cuyamaca CA Community College District ROC RR II R-11519 (GO-Local, Assured Guaranty Insured) | | | 0.11 | | | | 02/01/2016 | | | | 7,425,000 | | | | 7,425,000 | |
Hayward CA MFHR Shorewood Series A (Housing Revenue, FNMA Insured) | | | 0.09 | | | | 07/15/2014 | | | | 4,000,000 | | | | 4,000,000 | |
Hemet CA MFHR Sunwest Retirement Series A (Housing Revenue, FHLMC Insured) | | | 0.18 | | | | 01/01/2025 | | | | 1,000,000 | | | | 1,000,000 | |
Hemet CA USD Facilities Project (Lease Revenue, State Street Bank & Trust Company LOC) | | | 0.05 | | | | 10/01/2036 | | | | 3,970,000 | | | | 3,970,000 | |
Highland CA RDA Jeffrey Court Senior Apartments (Housing Revenue, East West Bank LOC) | | | 0.09 | | | | 03/01/2028 | | | | 6,620,000 | | | | 6,620,000 | |
| | | | | | |
| Portfolio of Investments—July 31, 2011 (Unaudited) | | Wells Fargo Advantage California Municipal Money Market Fund | | | 13 | |
| | | | | | | | | | | | | | | | |
| Security Name | | Interest Rate | | | Maturity Date | | | Principal | | | Value | |
| | | | | | | | | | | | | | | | |
| | | | |
| Variable Rate Demand Notes§ (continued) | | | | | | | | | | | | | | | | |
JPMorgan Chase PUTTER/DRIVER Trust Series 3903Z (Tax Revenue) (Tax Revenue, NATL-RE Insured)†† | | | 0.12 | % | | | 12/01/2027 | | | $ | 5,000,000 | | | $ | 5,000,000 | |
JPMorgan Chase PUTTER/DRIVER Trust Series 3931 (Tax Revenue) | | | 0.21 | | | | 08/12/2012 | | | | 25,000,000 | | | | 25,000,000 | |
JPMorgan Chase PUTTER/DRIVER Trust Series 3934 (Tax Revenue)†† | | | 0.20 | | | | 08/07/2012 | | | | 5,000,000 | | | | 5,000,000 | |
Kings County CA Housing Authority Edgewater Isle Apartments Series A (Housing Revenue, FNMA Insured) | | | 0.08 | | | | 02/15/2031 | | | | 6,100,000 | | | | 6,100,000 | |
Lancaster CA Redevelopment Agency MFHR 20th Street Apartments Project Series C (Housing Revenue, FNMA Insured) | | | 0.17 | | | | 12/01/2026 | | | | 5,500,000 | | | | 5,500,000 | |
Los Angeles CA Community RDA Second & Central Apartments Project (Housing Revenue, HSBC Bank USA NA LOC) | | | 0.07 | | | | 12/01/2038 | | | | 26,665,000 | | | | 26,665,000 | |
Los Angeles CA Community RDA Security Building Project Series A (Housing Revenue, FNMA Insured) | | | 0.14 | | | | 12/15/2034 | | | | 6,290,000 | | | | 6,290,000 | |
Los Angeles CA COP Notre Dame High School Series 2006-A (Lease Revenue, Bank of America NA LOC) | | | 0.08 | | | | 09/01/2036 | | | | 6,790,000 | | | | 6,790,000 | |
Los Angeles CA COP Samuel A Fryer Yavney Series A (Education Revenue, California Bank & Trust LOC) | | | 0.08 | | | | 08/01/2038 | | | | 10,000,000 | | | | 10,000,000 | |
Los Angeles CA Department Water & Power Revenue System Subseries A-2 (Water & Sewer Revenue, AGM-CR AMBAC Insured)†† | | | 0.12 | | | | 01/01/2015 | | | | 4,125,000 | | | | 4,125,000 | |
Los Angeles CA DW&P ROC RR II R-11531 (Water & Sewer Revenue, NATL-RE Insured) | | | 0.11 | | | | 01/01/2013 | | | | 10,505,000 | | | | 10,505,000 | |
Los Angeles CA Mission Village Terrace Apartments (Housing Revenue, East West Bank LOC) | | | 0.19 | | | | 07/01/2027 | | | | 3,540,000 | | | | 3,540,000 | |
Los Angeles CA Waste Water System Series 2254 (Water & Sewer Revenue, NATL-RE Insured) | | | 0.12 | | | | 06/01/2013 | | | | 5,780,000 | | | | 5,780,000 | |
Los Angeles CA Waste Water System Subseries G (Water & Sewer Revenue, Bank of America NA LOC) | | | 0.07 | | | | 06/01/2032 | | | | 8,330,000 | | | | 8,330,000 | |
Los Angeles CA Watts Athens Apartments Series A (Housing Revenue, CitiBank (West) FSB LOC) | | | 0.18 | | | | 08/15/2030 | | | | 4,300,000 | | | | 4,300,000 | |
Los Angeles County CA CDA MFHR Met Apartments Project (Housing Revenue, FNMA Insured) | | | 0.06 | | | | 12/15/2024 | | | | 635,000 | | | | 635,000 | |
Los Rios CA Community College District Series 2972 (GO-Local, FSA Insured) | | | 0.12 | | | | 02/01/2013 | | | | 5,065,000 | | | | 5,065,000 | |
Manteca CA RDA Amended Merger Project (Tax Revenue, State Street Bank & Trust Company LOC) | | | 0.33 | | | | 10/01/2042 | | | | 10,590,000 | | | | 10,590,000 | |
Menlo Park CA CDA Las Pulgas Community Development (Tax Revenue, State Street Bank & Trust Company LOC) | | | 0.33 | | | | 01/01/2031 | | | | 29,985,000 | | | | 29,985,000 | |
Metropolitan Water District Southern California Waterworks (Water & Sewer Revenue)†† | | | 0.11 | | | | 02/01/2015 | | | | 12,515,000 | | | | 12,515,000 | |
Metropolitan Water District Southern California Waterworks Class A (Water & Sewer Revenue) | | | 0.11 | | | | 07/01/2037 | | | | 29,800,000 | | | | 29,800,000 | |
Metropolitan Water District Southern California Waterworks Series A-2 (Water & Sewer Revenue) | | | 0.14 | | | | 07/01/2037 | | | | 4,065,000 | | | | 4,065,000 | |
Metropolitan Water District Southern California Waterworks Series B4 (Water & Sewer Revenue) | | | 0.07 | | | | 07/01/2035 | | | | 6,500,000 | | | | 6,500,000 | |
Metropolitan Water District Southern California Waterworks Series C (Water & Sewer Revenue) | | | 0.10 | | | | 07/01/2027 | | | | 11,900,000 | | | | 11,900,000 | |
Modesto CA MFHR Live Oak Apartments Project (Housing Revenue) (Housing Revenue, FNMA Insured) | | | 0.08 | | | | 09/15/2024 | | | | 5,875,000 | | | | 5,875,000 | |
Modesto County CA Multifamily Housing Shadowbrook Apartments Series A (Housing Revenue, FNMA Insured) | | | 0.09 | | | | 05/15/2031 | | | | 700,000 | | | | 700,000 | |
Morgan Hill CA RDA Tax Allocation Ojo de Agua Redevelopment Project A (Tax Revenue, Scotia Bank LOC) | | | 0.05 | | | | 09/01/2033 | | | | 55,915,000 | | | | 55,915,000 | |
Napa CA Water Utility Improvements (Water & Sewer Revenue, AMBAC Insured)†† | | | 0.12 | | | | 11/01/2015 | | | | 10,585,000 | | | | 10,585,000 | |
| | | | |
| 14 | | Wells Fargo Advantage California Municipal Money Market Fund | | Portfolio of Investments—July 31, 2011 (Unaudited) |
| | | | | | | | | | | | | | | | |
| Security Name | | Interest Rate | | | Maturity Date | | | Principal | | | Value | |
| | | | | | | | | | | | | | | | |
| | | | |
| Variable Rate Demand Notes§ (continued) | | | | | | | | | | | | | | | | |
Oakland CA Redevelopment Authority MFHR (Housing Revenue, FHLMC Insured) | | | 0.18 | % | | | 10/01/2050 | | | $ | 29,500,000 | | | $ | 29,500,000 | |
Oceanside CA Ace-Shadow Way (Housing Revenue, FHLMC Insured) | | | 0.07 | | | | 03/01/2049 | | | | 1,050,000 | | | | 1,050,000 | |
Ontario County CA Multifamily Revenue (Housing Revenue,
FHLMC Insured) | | | 0.15 | | | | 12/01/2035 | | | | 6,500,000 | | | | 6,500,000 | |
Orange County CA Apartment Development Authority Project Class A (Housing Revenue, FNMA Insured) | | | 0.09 | | | | 12/15/2028 | | | | 6,070,000 | | | | 6,070,000 | |
Orange County CA Apartment Development Revenue Park Place Apartments Project Series A (Housing Revenue, FHLMC Insured) | | | 0.17 | | | | 04/01/2024 | | | | 4,900,000 | | | | 4,900,000 | |
Orange County CA Apartment Development Revenue Park Ridge Villas Project (Housing Revenue, FNMA Insured) | | | 0.16 | | | | 11/15/2028 | | | | 4,000,000 | | | | 4,000,000 | |
Orange County CA Apartment Development Revenue Series D Harbor Pointe Project (Housing Revenue, FHLMC Insured) | | | 0.16 | | | | 12/01/2022 | | | | 449,000 | | | | 449,000 | |
Orange County CA Apartment Development Villas Aliento Series E Project (Housing Revenue, FNMA Insured) | | | 0.10 | | | | 08/15/2028 | | | | 2,640,000 | | | | 2,640,000 | |
Orange County CA Water District Series A (Water & Sewer Revenue, CitiBank NA LOC) | | | 0.06 | | | | 08/01/2042 | | | | 7,500,000 | | | | 7,500,000 | |
Peralta CA Community College District Election 2000 Project Series D
(GO-Local)†† | | | 0.12 | | | | 08/01/2015 | | | | 30,205,000 | | | | 30,205,000 | |
Petaluma CA CDS MFHR Oakmont at Petaluma Series A (Housing Revenue, U.S. Bank NA LOC) | | | 0.16 | | | | 04/01/2026 | | | | 500,000 | | | | 500,000 | |
Pittsburg CA Pubic Financing Authority (Water & Sewer Revenue, Bank of the West LOC) | | | 0.06 | | | | 06/01/2035 | | | | 5,850,000 | | | | 5,850,000 | |
Poway CA School District Series 3063 (GO-Local, FSA Insured)†† | | | 0.08 | | | | 08/01/2030 | | | | 10,000,000 | | | | 10,000,000 | |
PFOTER PPT-1007 Class A (Housing Revenue, FHLMC Insured) | | | 0.18 | | | | 05/01/2027 | | | | 6,420,000 | | | | 6,420,000 | |
PFOTER PPT-1007 Class A (Housing Revenue) (Housing Revenue, FHLMC Insured) | | | 0.18 | | | | 06/01/2032 | | | | 1,090,000 | | | | 1,090,000 | |
Rancho CA Water District Financing Authority Series B (Water & Sewer Revenue, U.S. Bank NA LOC) | | | 0.04 | | | | 08/15/2031 | | | | 7,000,000 | | | | 7,000,000 | |
RBC Municipal Products Incorporated Trust Floater Certificates Series E-17 (Tax Revenue)†† | | | 0.08 | | | | 03/01/2034 | | | | 35,985,000 | | | | 35,985,000 | |
Riverside CA Electric Project PUTTER Series 3042Z (Utilities Revenue, FSA Insured)†† | | | 0.21 | | | | 04/01/2016 | | | | 3,245,000 | | | | 3,245,000 | |
Roseville CA Electric System Series A (Utilities Revenue, Morgan Stanley Bank LOC) | | | 0.07 | | | | 02/01/2035 | | | | 20,000,000 | | | | 20,000,000 | |
Sacramento CA Housing Authority Shenandoah Apartments Series F (Housing Revenue, FNMA Insured) | | | 0.18 | | | | 09/15/2036 | | | | 7,000,000 | | | | 7,000,000 | |
Sacramento County CA Housing Authority (Housing Revenue, FNMA Insured) | | | 0.16 | | | | 07/15/2029 | | | | 5,000,000 | | | | 5,000,000 | |
Sacramento County CA Housing Authority Arlington Creek Apartment Series I (Housing Revenue, FNMA Insured) | | | 0.18 | | | | 05/15/2034 | | | | 8,350,000 | | | | 8,350,000 | |
Sacramento County CA Housing Authority Logan Park Apartments Series E (Housing Revenue, FHLMC Insured) | | | 0.20 | | | | 05/01/2042 | | | | 10,000,000 | | | | 10,000,000 | |
Sacramento County CA Housing Authority MFHR Cascades Series D (Housing Revenue, FNMA Insured) | | | 0.18 | | | | 09/15/2035 | | | | 6,535,000 | | | | 6,535,000 | |
Sacramento County CA Housing Authority MFHR Normandy Park Apartments Series A (Housing Revenue, FNMA Insured) | | | 0.18 | | | | 02/15/2033 | | | | 6,000,000 | | | | 6,000,000 | |
Sacramento County CA Housing Authority Seasons at Winter Series C2 (Housing Revenue, FHLMC Insured) | | | 0.08 | | | | 08/01/2034 | | | | 2,900,000 | | | | 2,900,000 | |
Sacramento County CA Housing Authority Shadowood Apartments Project Issue A (Housing Revenue, FHLMC Insured) | | | 0.08 | | | | 12/01/2022 | | | | 6,555,000 | | | | 6,555,000 | |
Sacramento County CA Sanitation District Finance Authority Series B (Water & Sewer Revenue, Morgan Stanley Bank LOC) | | | 0.21 | | | | 12/01/2037 | | | | 25,000,000 | | | | 25,000,000 | |
| | | | | | |
| Portfolio of Investments—July 31, 2011 (Unaudited) | | Wells Fargo Advantage California Municipal Money Market Fund | | | 15 | |
| | | | | | | | | | | | | | | | |
| Security Name | | Interest Rate | | | Maturity Date | | | Principal | | | Value | |
| | | | | | | | | | | | | | | | |
| | | | |
| Variable Rate Demand Notes§ (continued) | | | | | | | | | | | | | | | | |
Sacramento County CA Sanitation District Financing Authority Municipal Trust Receipts SGC-48 Class A (Water & Sewer Revenue, Societe Generale LOC, FGIC Insured) | | | 0.11 | % | | | 12/01/2035 | | | $ | 10,000,000 | | | $ | 10,000,000 | |
Sacramento County CA Sanitation District Financing Authority Series D (Water & Sewer Revenue, Morgan Stanley Bank LOC) | | | 0.18 | | | | 12/01/2039 | | | | 15,000,000 | | | | 15,000,000 | |
Sacramento County CA Sanitation District Financing Authority Subordinate Lien Sacramento District E (Water & Sewer Revenue, JPMorgan Chase Bank LOC) | | | 0.05 | | | | 12/01/2040 | | | | 5,000,000 | | | | 5,000,000 | |
Sacramento County CA Sanitation District Financing Authority Subordinate Lien Sacramento Regulation Series C (Water & Sewer Revenue, Bank of America NA LOC) | | | 0.06 | | | | 12/01/2030 | | | | 11,520,000 | | | | 11,520,000 | |
San Bernardino CA RDA Silver Woods Apartments Project (Housing Revenue, FNMA Insured) | | | 0.19 | | | | 05/01/2026 | | | | 7,000,000 | | | | 7,000,000 | |
San Bernardino County CA Flood Control District (Tax Revenue, Bank of America NA LOC) | | | 0.06 | | | | 08/01/2037 | | | | 5,500,000 | | | | 5,500,000 | |
San Bernardino County CA MFHR Green Valley Apartments Project Series A (Housing Revenue, FNMA Insured) | | | 0.16 | | | | 05/15/2029 | | | | 6,115,000 | | | | 6,115,000 | |
San Bernardino County CA MFHR Sycamore Terrace Project Series A (Housing Revenue, FNMA Insured) | | | 0.16 | | | | 05/15/2029 | | | | 5,600,000 | | | | 5,600,000 | |
San Bernardino County CA Parkview Series A (Housing Revenue,
FNMA Insured) | | | 0.16 | | | | 02/15/2027 | | | | 1,500,000 | | | | 1,500,000 | |
San Diego County CA Housing Authority Multifamily Housing Studio 15 Series B (Housing Revenue, CitiBank NA LOC) | | | 0.19 | | | | 10/01/2039 | | | | 5,395,000 | | | | 5,395,000 | |
San Diego County CA Regional Transportation Community Limited Tax Series A (Tax Revenue) | | | 0.05 | | | | 04/01/2038 | | | | 4,600,000 | | | | 4,600,000 | |
San Diego County CA Regional Transportation Community Limited Tax Series B (Tax Revenue) | | | 0.07 | | | | 04/01/2038 | | | | 3,925,000 | | | | 3,925,000 | |
San Diego County CA Water Authority COP Series 2873 (Water & Sewer Revenue, FSA Insured) | | | 0.12 | | | | 05/01/2013 | | | | 1,545,000 | | | | 1,545,000 | |
San Francisco CA Bay Area Rapid Transit District (Tax Revenue)†† | | | 0.10 | | | | 08/01/2030 | | | | 7,500,000 | | | | 7,500,000 | |
San Francisco CA Bay Area Rapid Transportation District Election of 2004 Series B (Education Revenue, AGM-CR FGIC Insured)†† | | | 0.12 | | | | 11/15/2015 | | | | 4,700,000 | | | | 4,700,000 | |
San Francisco CA City & County Airports Commisison Second Series 36C (Port, Airport, & Marina Authority Revenue, U.S. Bank NA LOC) | | | 0.06 | | | | 05/01/2026 | | | | 14,070,000 | | | | 14,070,000 | |
San Francisco CA City & County Airports Commission Second Series 37C (Port, Airport, & Marina Authority Revenue, Union Bank NA LOC) | | | 0.04 | | | | 05/01/2029 | | | | 10,000,000 | | | | 10,000,000 | |
San Francisco CA City & County Airports Commission Series 36-B (Airport Revenue, U.S. Bank NA LOC) | | | 0.06 | | | | 05/01/2026 | | | | 12,310,000 | | | | 12,310,000 | |
San Francisco CA City & County RDA Fillmore Center Series B1 (Housing Revenue, FHLMC Insured) | | | 0.10 | | | | 12/01/2017 | | | | 38,900,000 | | | | 38,900,000 | |
San Francisco CA City & County RDA Notre Dame Apartments Series G (Housing Revenue, CitiBank NA LOC) | | | 0.09 | | | | 12/01/2033 | | | | 12,940,000 | | | | 12,940,000 | |
San Francisco CA City & County RDA Orlando Cepeda Place Series D (Housing Revenue, CitiBank NA LOC) | | | 0.12 | | | | 11/01/2033 | | | | 8,525,000 | | | | 8,525,000 | |
San Jose CA Financing Authority Civic Center Project Series B (Lease Revenue, AMBAC Insured)†† | | | 0.12 | | | | 12/01/2011 | | | | 7,000,000 | | | | 7,000,000 | |
San Jose CA MFHR Raintree Apartments Series A (Housing Revenue,
FHLMC Insured) | | | 0.09 | | | | 02/01/2038 | | | | 10,600,000 | | | | 10,600,000 | |
San Jose CA Turnleaf Apartments Series A (Housing Revenue,
FHLMC Insured) | | | 0.11 | | | | 06/01/2036 | | | | 4,230,000 | | | | 4,230,000 | |
San Leandro CA Carlton Plaza Series A (Housing Revenue, FNMA Insured) | | | 0.14 | | | | 09/15/2032 | | | | 1,120,000 | | | | 1,120,000 | |
San Mateo County CA Community College District Capital Appreciation Election 2001 Series B (GO-Local, NATL-RE Insured) | | | 0.08 | | | | 06/01/2031 | | | | 9,716,000 | | | | 9,716,000 | |
Santa Clara Valley CA Transportation Authority Series A (Tax Revenue) | | | 0.04 | | | | 06/01/2026 | | | | 25,385,000 | | | | 25,385,000 | |
| | | | |
| 16 | | Wells Fargo Advantage California Municipal Money Market Fund | | Portfolio of Investments—July 31, 2011 (Unaudited) |
| | | | | | | | | | | | | | | | |
| Security Name | | Interest Rate | | | Maturity Date | | | Principal | | | Value | |
| | | | | | | | | | | | | | | | |
| | | | |
| Variable Rate Demand Notes§ (continued) | | | | | | | | | | | | | | | | |
Santa Clara Valley CA Transportation Authority Series C (Tax Revenue) | | | 0.06 | % | | | 06/01/2026 | | | $ | 12,495,000 | | | $ | 12,495,000 | |
Santa Rosa CA Alderbrook Heights Apartments (Housing Revenue, Exchange Bank LOC) | | | 0.14 | | | | 05/01/2040 | | | | 3,120,000 | | | | 3,120,000 | |
Sequoia CA University High School District (GO-Local, FSA Insured) | | | 0.12 | | | | 07/01/2014 | | | | 2,025,000 | | | | 2,025,000 | |
Simi Valley CA MFHA Series A (Housing Revenue, FHLMC Insured) | | | 0.15 | | | | 07/01/2023 | | | | 695,000 | | | | 695,000 | |
Simi Valley CA Shadowridge Apartments Project (Housing Revenue, FHLMC Insured) | | | 0.09 | | | | 09/01/2019 | | | | 5,700,000 | | | | 5,700,000 | |
Stockton CA HCFR Series A (Hospital Revenue, CitiBank NA LOC) | | | 0.33 | | | | 12/01/2032 | | | | 5,750,000 | | | | 5,750,000 | |
Sweetwater CA Union High School District ROC RR II-11484 (GO-Local,
FSA Insured) | | | 0.20 | | | | 02/01/2013 | | | | 8,220,000 | | | | 8,220,000 | |
Tahoe Forest CA Hospital District (Hospital Revenue, U.S. Bank NA LOC) | | | 0.33 | | | | 07/01/2033 | | | | 2,540,000 | | | | 2,540,000 | |
Upland CA Community RDA Sunset Ridge Apartments (Housing Revenue, East West Bank LOC) | | | 0.05 | | | | 08/01/2037 | | | | 18,000,000 | | | | 18,000,000 | |
Vacaville CA MFHR Sycamore Apartments Series A (Housing Revenue,
FNMA Insured) | | | 0.17 | | | | 05/15/2029 | | | | 2,350,000 | | | | 2,350,000 | |
Vallejo CA Housing Authority Multifamily Mortgage Refunding (Housing Revenue, FNMA Insured) | | | 0.10 | | | | 05/15/2022 | | | | 885,000 | | | | 885,000 | |
Victorville CA Joint Powers Finance Authority Project A (Utilities Revenue, BNP Paribas LOC) | | | 1.35 | | | | 05/01/2040 | | | | 1,990,000 | | | | 1,990,000 | |
Walnut Creek CA Creekside Drive (Housing Revenue, FHLMC Insured) | | | 0.10 | | | | 04/01/2027 | | | | 3,620,000 | | | | 3,620,000 | |
Western Municipal Water District Facilities Authority (Water & Sewer Revenue, U.S. Bank NA LOC) | | | 0.06 | | | | 10/01/2032 | | | | 11,400,000 | | | | 11,400,000 | |
Whittier CA Health Facilities Presbyterian Intercommunity Project Series C (Hospital Revenue, U.S. Bank NA LOC) | | | 0.04 | | | | 06/01/2036 | | | | 5,800,000 | | | | 5,800,000 | |
Whittier CA Whittier College Series 2008 (Education Revenue, Bank of America NA LOC) | | | 0.08 | | | | 12/01/2038 | | | | 7,655,000 | | | | 7,655,000 | |
| | | | |
| | | | | | | | | | | | | | | 2,250,251,789 | |
| | | | | | | | | | | | | | | | |
| | | | |
Other: 0.50% | | | | | | | | | | | | | | | | |
| | | | |
| Variable Rate Demand Notes§: 0.50% | | | | | | | | | | | | | | | | |
FHMLC Multifamily Certificates (Housing Revenue) | | | 0.18 | | | | 08/15/2045 | | | | 2,821,531 | | | | 2,821,531 | |
FHMLC Multifamily Certificates (Housing Revenue) | | | 0.18 | | | | 11/15/2034 | | | | 10,298,778 | | | | 10,298,778 | |
| | | | |
| | | | | | | | | | | | | | | 13,120,309 | |
| | | | | | | | | | | | | | | | |
| | | | |
Puerto Rico: 2.48% | | | | | | | | | | | | | | | | |
| | | | |
| Variable Rate Demand Notes§: 2.48% | | | | | | | | | | | | | | | | |
Puerto Rico Commonwealth Highway & Transportation Authority Series 2148 (Tax Revenue, AGC-ICC CIFG Insured) | | | 0.13 | | | | 07/01/2041 | | | | 26,760,000 | | | | 26,760,000 | |
Puerto Rico Commonwealth Highway & Transportation Authority Series A (Tax Revenue, Scotia Bank LOC) | | | 0.04 | | | | 07/01/2028 | | | | 2,605,000 | | | | 2,605,000 | |
Puerto Rico Electric Power Authority Municipal Trust Receipts-SGC-57 Class A (Utilities Revenue, Societe Generale LOC, FSA Insured) | | | 0.11 | | | | 07/01/2029 | | | | 10,780,000 | | | | 10,780,000 | |
Puerto Rico Sales Tax Finance Corporation Deutsche Bank Spears Trust Series DBE-627A (Tax Revenue, AMBAC Insured) | | | 0.08 | | | | 08/01/2050 | | | | 7,486,000 | | | | 7,486,000 | |
Puerto Rico Sales Tax Financing Corporation ROC RR II R-11760 (Tax Revenue, CitiBank NA Insured)†† | | | 0.11 | | | | 12/01/2047 | | | | 2,000,000 | | | | 2,000,000 | |
Puerto Rico Sales Tax Financing Corporation ROC-RR-II-R11763
(Tax Revenue)†† | | | 0.11 | | | | 12/01/2047 | | | | 12,750,000 | | | | 12,750,000 | |
| | | | | | |
| Portfolio of Investments—July 31, 2011 (Unaudited) | | Wells Fargo Advantage California Municipal Money Market Fund | | | 17 | |
| | | | | | | | | | | | | | | | |
| Security Name | | Interest Rate | | | Maturity Date | | | Principal | | | Value | |
| | | | | | | | | | | | | | | | |
| | | | |
| Variable Rate Demand Notes§ (continued) | | | | | | | | | | | | | | | | |
Puerto Rico Sales Tax Financing Corporation Series 11829 (Tax Revenue, AGM Insured)†† | | | 0.20 | % | | | 02/01/2034 | | | $ | 1,900,000 | | | $ | 1,900,000 | |
| | | | |
| | | | | | | | | | | | | | | 64,281,000 | |
| | | | | | | | | | | | | | | | |
| | | | | | | | |
Total Investments in Securities
(Cost $2,381,660,708)* | | | 91.84 | % | | | 2,381,660,708 | |
Other Assets and Liabilities, Net | | | 8.16 | | | | 211,562,935 | |
| | | | | | | | |
| Total Net Assets | | | 100.00 | % | | $ | 2,593,223,643 | |
| | | | | | | | |
| †† | Security that may be resold to “qualified institutional buyers” under Rule 144A or securities offered pursuant to Section 4(2) of the Securities Act of 1933, as amended. |
| § | These securities are subject to a demand feature which reduces the effective maturity. |
| * | Cost for federal income tax purposes is substantially the same as for financial reporting purposes. |
The accompanying notes are an integral part of these financial statements.
| | | | |
| 18 | | Wells Fargo Advantage California Municipal Money Market Fund | | Statement of Assets and Liabilities—July 31, 2011 (Unaudited) |
| | | | |
| | | | |
| |
Assets | | | | |
Investments in unaffiliated securities, at amortized cost | | $ | 2,381,660,708 | |
Cash | | | 133,637,015 | |
Receivable for investments sold | | | 83,970,232 | |
Receivable for Fund shares sold | | | 135 | |
Receivable for interest | | | 565,896 | |
Receivable from adviser | | | 825,178 | |
| | | | |
Total assets | | | 2,600,659,164 | |
| | | | |
| |
Liabilities | | | | |
Dividends payable | | | 8,714 | |
Payable for Fund shares redeemed | | | 6,340,000 | |
Distribution fees payable | | | 85,561 | |
Due to other related parties | | | 493,213 | |
Accrued expenses and other liabilities | | | 508,033 | |
| | | | |
Total liabilities | | | 7,435,521 | |
| | | | |
Total net assets | | $ | 2,593,223,643 | |
| | | | |
| |
NET ASSETS CONSIST OF | | | | |
Paid-in capital | | $ | 2,593,171,754 | |
Overdistributed net investment income | | | (5,862 | ) |
Accumulated net realized gains on investments | | | 57,751 | |
| | | | |
Total net assets | | $ | 2,593,223,643 | |
| | | | |
| |
COMPUTATION OF NET ASSET VALUE PER SHARE1 | | | | |
Net assets – Class A | | $ | 1,306,616,214 | |
Shares outstanding – Class A | | | 1,306,594,920 | |
Net asset value per share – Class A | | | $1.00 | |
Net assets – Administrator Class | | $ | 100,024 | |
Shares outstanding – Administrator Class | | | 100,021 | |
Net asset value per share – Administrator Class | | | $1.00 | |
Net assets – Institutional Class | | $ | 921,546,952 | |
Shares outstanding – Institutional Class | | | 921,514,121 | |
Net asset value per share – Institutional Class | | | $1.00 | |
Net assets – Service Class | | $ | 101,122,270 | |
Shares outstanding – Service Class | | | 101,121,402 | |
Net asset value per share – Service Class | | | $1.00 | |
Net assets – Sweep Class | | $ | 263,838,183 | |
Shares outstanding – Sweep Class | | | 263,829,821 | |
Net asset value per share – Sweep Class | | | $1.00 | |
| 1. | The Fund has an unlimited number of authorized shares. |
The accompanying notes are an integral part of these financial statements.
| | | | | | |
| Statement of Operations—Six Months Ended July 31, 2011 (Unaudited) | | Wells Fargo Advantage California Municipal Money Market Fund | | | 19 | |
| | | | |
| | | | |
| |
Investment income | | | | |
Interest | | $ | 2,695,996 | |
| | | | |
| |
Expenses | | | | |
Advisory fee | | | 1,404,454 | |
Administration fees | | | | |
Fund level | | | 702,227 | |
Class A | | | 1,568,675 | |
Administrator Class | | | 49 | |
Institutional Class | | | 365,864 | |
Service Class | | | 62,572 | |
Sweep Class | | | 400,172 | |
Shareholder servicing fees | | | | |
Class A | | | 1,736,152 | |
Administrator Class | | | 49 | |
Service Class | | | 128,323 | |
Sweep Class | | | 454,741 | |
Distribution fees | | | | |
Sweep Class | | | 636,637 | |
Custody and accounting fees | | | 85,499 | |
Professional fees | | | 14,509 | |
Registration fees | | | 20,241 | |
Shareholder report expenses | | | 652 | |
Trustees’ fees and expenses | | | 8,592 | |
Other fees and expenses | | | 22,260 | |
| | | | |
Total expenses | | | 7,611,668 | |
Less: Fee waivers and/or expense reimbursements | | | (5,155,683 | ) |
| | | | |
Net expenses | | | 2,455,985 | |
| | | | |
Net investment income | | | 240,011 | |
Net realized gains on investments | | | 62,629 | |
| | | | |
Net increase in net assets resulting from operations | | $ | 302,640 | |
| | | | |
The accompanying notes are an integral part of these financial statements.
| | | | |
| 20 | | Wells Fargo Advantage California Municipal Money Market Fund | | Statements of Changes in Net Assets |
| | | | | | | | | | | | | | | | | | | | | | | | |
| | | Six Months Ended
July 31, 2011
(Unaudited) | | | Year Ended
January 31, 20111 | | | Year Ended
February 28, 2010 | |
| | | | | | |
Operations | | | | | | | | | | | | | | | | | | | | | | | | |
Net investment income | | | | | | $ | 240,011 | | | | | | | $ | 798,376 | | | | | | | $ | 1,446,118 | |
Net realized gains (losses) on investments | | | | | | | 62,629 | | | | | | | | 0 | | | | | | | | (4,878 | ) |
| | | | | | | | | | | | | | | | | | | | | | | | |
Net increase in net assets resulting from operations | | | | | | | 302,640 | | | | | | | | 798,376 | | | | | | | | 1,441,240 | |
| | | | | | | | | | | | | | | | | | | | | | | | |
| | | | | | |
Distributions to shareholders from | | | | | | | | | | | | | | | | | | | | | | | | |
Net investment income | | | | | | | | | | | | | | | | | | | | | | | | |
Class A | | | | | | | (71,302 | ) | | | | | | | (155,827 | ) | | | | | | | (321,031 | ) |
Administrator Class | | | | | | | (5 | ) | | | | | | | (16 | )2 | | | | | | | NA | |
Institutional Class | | | | | | | (145,299 | ) | | | | | | | (580,733 | ) | | | | | | | (765,282 | ) |
Service Class | | | | | | | (5,214 | ) | | | | | | | (34,310 | ) | | | | | | | (359,805 | ) |
Sweep Class | | | | | | | (18,191 | ) | | | | | | | (27,487 | )2 | | | | | | | NA | |
Net realized gains | | | | | | | | | | | | | | | | | | | | | | | | |
Class A | | | | | | | 0 | | | | | | | | 0 | | | | | | | | (123,014 | ) |
Institutional Class | | | | | | | 0 | | | | | | | | 0 | | | | | | | | (17,769 | ) |
Service Class | | | | | | | 0 | | | | | | | | 0 | | | | | | | | (27,272 | ) |
| | | | | | | | | | | | | | | | | | | | | | | | |
Total distributions to shareholders | | | | | | | (240,011 | ) | | | | | | | (798,373 | ) | | | | | | | (1,614,173 | ) |
| | | | | | | | | | | | | | | | | | | | | | | | |
| | | | | | |
| | | Shares | | | | | | Shares | | | | | | Shares | | | | |
| | | | | | |
Capital share transactions | | | | | | | | | | | | | | | | | | | | | | | | |
Proceeds from shares sold | | | | | | | | | | | | | | | | | | | | | | | | |
Class A | | | 1,183,766,823 | | | | 1,183,766,823 | | | | 1,758,649,756 | | | | 1,758,649,756 | | | | 2,402,281,400 | | | | 2,402,281,400 | |
Administrator Class | | | 0 | | | | 0 | | | | 100,000 | 2 | | | 100,000 | 2 | | | NA | | | | NA | |
Institutional Class | | | 1,188,583,014 | | | | 1,188,583,014 | | | | 1,947,266,295 | | | | 1,947,266,295 | | | | 1,790,297,628 | | | | 1,790,297,628 | |
Service Class | | | 60,321,905 | | | | 60,321,905 | | | | 602,791,622 | | | | 602,791,622 | | | | 742,085,161 | | | | 742,085,161 | |
Sweep Class | | | 607,014,705 | | | | 607,014,705 | | | | 948,753,970 | 2 | | | 948,753,970 | 2 | | | NA | | | | NA | |
| | | | | | | | | | | | | | | | | | | | | | | | |
| | | | | | | 3,039,686,447 | | | | | | | | 5,257,561,643 | | | | | | | | 4,934,664,189 | |
| | | | | | | | | | | | | | | | | | | | | | | | |
Reinvestment of distributions | | | | | | | | | | | | | | | | | | | | | | | | |
Class A | | | 68,420 | | | | 68,420 | | | | 143,754 | | | | 143,754 | | | | 417,490 | | | | 417,490 | |
Administrator Class | | | 5 | | | | 5 | | | | 16 | 2 | | | 16 | 2 | | | NA | | | | NA | |
Institutional Class | | | 18,539 | | | | 18,539 | | | | 311,627 | | | | 311,627 | | | | 464,816 | | | | 464,816 | |
Service Class | | | 2,993 | | | | 2,993 | | | | 7,386 | | | | 7,386 | | | | 108,140 | | | | 108,140 | |
Sweep Class | | | 18,191 | | | | 18,191 | | | | 27,487 | 2 | | | 27,487 | 2 | | | NA | | | | NA | |
| | | | | | | | | | | | | | | | | | | | | | | | |
| | | | | | | 108,148 | | | | | | | | 490,270 | | | | | | | | 990,446 | |
| | | | | | | | | | | | | | | | | | | | | | | | |
Payment for shares redeemed | | | | | | | | | | | | | | | | | | | | | | | | |
Class A | | | (1,364,126,195 | ) | | | (1,364,126,195 | ) | | | (2,228,327,432 | ) | | | (2,228,327,432 | ) | | | (3,746,180,886 | ) | | | (3,746,180,886 | ) |
Institutional Class | | | (1,098,184,016 | ) | | | (1,098,184,016 | ) | | | (1,747,941,455 | ) | | | (1,747,941,455 | ) | | | (1,924,963,024 | ) | | | (1,924,963,024 | ) |
Service Class | | | (60,506,193 | ) | | | (60,506,193 | ) | | | (899,182,277 | ) | | | (899,182,277 | ) | | | (1,053,686,469 | ) | | | (1,053,686,469 | ) |
Sweep Class | | | (746,043,100 | ) | | | (746,043,100 | ) | | | (983,907,411 | )2 | | | (983,907,411 | )2 | | | NA | | | | NA | |
| | | | | | | | | | | | | | | | | | | | | | | | |
| | | | | | | (3,268,859,504 | ) | | | | | | | (5,859,358,575 | ) | | | | | | | (6,724,830,379 | ) |
| | | | | | | | | | | | | | | | | | | | | | | | |
Net asset value of shares issued in acquisitions | | | | | | | | | | | | | | | | | | | | | | | | |
Class A | | | 0 | | | | 0 | | | | 8,219,387 | | | | 8,208,874 | | | | 0 | | | | 0 | |
Institutional Class | | | 0 | | | | 0 | | | | 395,086,399 | | | | 395,098,848 | | | | 0 | | | | 0 | |
Service Class | | | 0 | | | | 0 | | | | 134,479 | | | | 134,798 | | | | 0 | | | | 0 | |
Sweep Class | | | 0 | | | | 0 | | | | 437,965,979 | | | | 437,916,409 | | | | NA | | | | NA | |
| | | | | | | | | | | | | | | | | | | | | | | | |
| | | | | | | 0 | | | | | | | | 841,358,929 | | | | | | | | 0 | |
| | | | | | | | | | | | | | | | | | | | | | | | |
Net increase (decrease) in net assets resulting from capital share transactions | | | | | | | (229,064,909 | ) | | | | | | | 240,052,267 | | | | | | | | (1,789,175,744 | ) |
| | | | | | | | | | | | | | | | | | | | | | | | |
Total increase (decrease) in net assets | | | | | | | (229,002,280 | ) | | | | | | | 240,052,270 | | | | | | | | (1,789,348,677 | ) |
| | | | | | | | | | | | | | | | | | | | | | | | |
| | | | | | |
Net assets | | | | | | | | | | | | | | | | | | | | | | | | |
Beginning of period | | | | | | | 2,822,225,923 | | | | | | | | 2,582,173,653 | | | | | | | | 4,371,522,330 | |
| | | | | | | | | | | | | | | | | | | | | | | | |
End of period | | | | | | $ | 2,593,223,643 | | | | | | | $ | 2,822,225,923 | | | | | | | $ | 2,582,173,653 | |
| | | | | | | | | | | | | | | | | | | | | | | | |
Overdistributed net investment income | | | | | | $ | (5,862 | ) | | | | | | $ | (5,862 | ) | | | | | | $ | (1,037 | ) |
| | | | | | | | | | | | | | | | | | | | | | | | |
| 1. | For the eleven months ended January 31, 2011. The Fund changed its fiscal year end from February 28 to January 31, effective January 31, 2011. |
| 2. | Class commenced operations on June 30, 2010. |
The accompanying notes are an integral part of these financial statements.
| | | | | | |
| Financial Highlights | | Wells Fargo Advantage California Municipal Money Market Fund | | | 21 | |
(For a share outstanding throughout each period)
| | | | | | | | | | | | | | | | | | | | | | | | | | | | |
| | | Six Months Ended
July 31, 2011
(Unaudited) | | | Year Ended
January 31, 20111 | | | Year Ended February 28 | |
| Class A | | | | 2010 | | | 2009 | | | 2008 | | | 2007 | | | 20062 | |
Net asset value, beginning of period | | $ | 1.00 | | | $ | 1.00 | | | $ | 1.00 | | | $ | 1.00 | | | $ | 1.00 | | | $ | 1.00 | | | $ | 1.00 | |
Net investment income | | | 0.00 | 4 | | | 0.00 | 4 | | | 0.00 | 4 | | | 0.01 | | | | 0.03 | | | | 0.03 | | | | 0.02 | |
Net realized gains on investments | | | 0.00 | 4 | | | 0.00 | | | | 0.00 | | | | 0.00 | | | | 0.00 | | | | 0.00 | | | | 0.00 | |
| | | | | | | | | | | | | | | | | | | | | | | | | | | | |
Total from investment operations | | | 0.00 | 4 | | | 0.00 | 4 | | | 0.00 | 4 | | | 0.01 | | | | 0.03 | | | | 0.03 | | | | 0.02 | |
Distributions to shareholders from | | | | | | | | | | | | | | | | | | | | | | | | | | | | |
Net investment income | | | (0.00 | )4 | | | (0.00 | )4 | | | (0.00 | )4 | | | (0.01 | ) | | | (0.03 | ) | | | (0.03 | ) | | | (0.02 | ) |
Net realized gains | | | 0.00 | | | | 0.00 | | | | (0.00 | )4 | | | (0.00 | )4 | | | 0.00 | | | | 0.00 | | | | 0.00 | |
| | | | | | | | | | | | | | | | | | | | | | | | | | | | |
Total distributions to shareholders | | | (0.00 | )4 | | | (0.00 | )4 | | | (0.00 | )4 | | | (0.01 | ) | | | (0.03 | ) | | | (0.03 | ) | | | (0.02 | ) |
Net asset value, end of period | | $ | 1.00 | | | $ | 1.00 | | | $ | 1.00 | | | $ | 1.00 | | | $ | 1.00 | | | $ | 1.00 | | | $ | 1.00 | |
Total return3 | | | 0.00 | % | | | 0.01 | % | | | 0.02 | % | | | 1.22 | % | | | 2.85 | % | | | 2.85 | % | | | 1.85 | % |
Ratios to average net assets (annualized) | | | | | | | | | | | | | | | | | | | | | | | | | | | | |
Gross expenses | | | 0.62 | % | | | 0.69 | % | | | 0.87 | % | | | 0.85 | % | | | 0.83 | % | | | 0.84 | % | | | 0.84 | % |
Net expenses | | | 0.18 | % | | | 0.32 | % | | | 0.44 | % | | | 0.66 | % | | | 0.65 | % | | | 0.65 | % | | | 0.65 | % |
Net investment income | | | 0.01 | % | | | 0.01 | % | | | 0.01 | % | | | 1.19 | % | | | 2.79 | % | | | 2.81 | % | | | 2.01 | % |
Supplemental data | | | | | | | | | | | | | | | | | | | | | | | | | | | | |
Net assets, end of period (000’s omitted) | | | $1,306,616 | | | | $1,486,876 | | | | $1,948,313 | | | | $3,291,922 | | | | $3,837,463 | | | | $3,064,445 | | | | $2,552,430 | |
| 1. | For the eleven months ended January 31, 2011. The Fund changed its fiscal year end from February 28 to January 31, effective January 31, 2011. |
| 2. | For the eleven months ended February 28, 2006. The Fund changed its fiscal year end from March 31 to February 28, effective February 28, 2006. |
| 3. | Returns for periods of less than one year are not annualized. |
| 4. | Amount is less than $0.005. |
The accompanying notes are an integral part of these financial statements.
| | | | |
| 22 | | Wells Fargo Advantage California Municipal Money Market Fund | | Financial Highlights |
(For a share outstanding throughout each period)
| | | | | | | | |
| Administrator Class | | Six Months Ended
July 31, 2011
(Unaudited) | | | Year Ended
January 31,
20111 | |
Net asset value, beginning of period | | $ | 1.00 | | | $ | 1.00 | |
Net investment income | | | 0.00 | 3 | | | 0.00 | 3 |
Net realized gains on investments | | | 0.00 | 3 | | | 0.00 | 3 |
| | | | | | | | |
Total from investment operations | | | 0.00 | 3 | | | 0.00 | 3 |
Distributions to shareholders from | | | | | | | | |
Net investment income | | | (0.00 | )3 | | | (0.00 | )3 |
Net asset value, end of period | | $ | 1.00 | | | $ | 1.00 | |
Total return2 | | | 0.01 | % | | | 0.01 | % |
Ratios to average net assets (annualized) | | | | | | | | |
Gross expenses | | | 0.35 | % | | | 0.37 | % |
Net expenses | | | 0.18 | % | | | 0.30 | % |
Net investment income | | | 0.01 | % | | | 0.03 | % |
Supplemental data | | | | | | | | |
Net assets, end of period (000’s omitted) | | | $100 | | | | $100 | |
| 1. | For the period from June 30, 2010 (commencement of class operations) to January 31, 2011. |
| 2. | Returns for periods of less than one year are not annualized. |
| 3. | Amount is less than $0.005. |
The accompanying notes are an integral part of these financial statements.
| | | | | | |
| Financial Highlights | | Wells Fargo Advantage California Municipal Money Market Fund | | | 23 | |
(For a share outstanding throughout each period)
| | | | | | | | | | | | | | | | |
| | | Six Months Ended
July 31, 2011
(Unaudited) | | | Year Ended
January 31,
20111 | | | Year Ended February 28 | |
Institutional Class | | | | | 2010 | | | | 2009 | 2 |
Net asset value, beginning of period | | $ | 1.00 | | | $ | 1.00 | | | $ | 1.00 | | | $ | 1.00 | |
Net investment income | | | 0.00 | 4 | | | 0.00 | 4 | | | 0.00 | 4 | | | 0.01 | |
Net realized gains on investments | | | 0.00 | 4 | | | 0.00 | 4 | | | 0.00 | | | | 0.00 | |
| | | | | | | | | | | | | | | | |
Total from investment operations | | | 0.00 | 4 | | | 0.00 | 4 | | | 0.00 | 4 | | | 0.01 | |
Distributions to shareholders from | | | | | | | | | | | | | | | | |
Net investment income | | | (0.00 | )4 | | | (0.00 | )4 | | | (0.00 | )4 | | | (0.01 | ) |
Net realized gains | | | 0.00 | | | | 0.00 | | | | (0.00 | )4 | | | (0.00 | )4 |
| | | | | | | | | | | | | | | | |
Total distributions to shareholders | | | (0.00 | )4 | | | (0.00 | )4 | | | (0.00 | )4 | | | (0.01 | ) |
Net asset value, end of period | | $ | 1.00 | | | $ | 1.00 | | | $ | 1.00 | | | $ | 1.00 | |
Total return3 | | | 0.02 | % | | | 0.12 | % | | | 0.20 | % | | | 1.47 | % |
Ratios to average net assets (annualized) | | | | | | | | | | | | | | | | |
Gross expenses | | | 0.24 | % | | | 0.28 | % | | | 0.48 | % | | | 0.46 | % |
Net expenses | | | 0.16 | % | | | 0.20 | % | | | 0.24 | % | | | 0.22 | % |
Net investment income | | | 0.03 | % | | | 0.12 | % | | | 0.23 | % | | | 1.59 | % |
Supplemental data | | | | | | | | | | | | | | | | |
Net assets, end of period (000’s omitted) | | | $921,547 | | | | $831,108 | | | | $236,353 | | | | $370,572 | |
| 1. | For the eleven months ended January 31, 2011. The Fund changed its fiscal year end from February 28 to January 31, effective January 31, 2011. |
| 2. | For the period from March 31, 2008 (commencement of class operations) to February 28, 2009. |
| 3. | Returns for periods of less than one year are not annualized. |
| 4. | Amount is less than $0.005. |
The accompanying notes are an integral part of these financial statements.
| | | | |
| 24 | | Wells Fargo Advantage California Municipal Money Market Fund | | Financial Highlights |
(For a share outstanding throughout each period)
| | | | | | | | | | | | | | | | | | | | | | | | | | | | |
| | | Six Months Ended
July 31, 2011
(Unaudited) | | | Year Ended
January 31,
20111 | | | Year Ended February 28 | |
| Service Class | | | | 2010 | | | 2009 | | | 2008 | | | 2007 | | | 20062 | |
Net asset value, beginning of period | | $ | 1.00 | | | $ | 1.00 | | | $ | 1.00 | | | $ | 1.00 | | | $ | 1.00 | | | $ | 1.00 | | | $ | 1.00 | |
Net investment income | | | 0.00 | 4 | | | 0.00 | 4 | | | 0.00 | 4 | | | 0.01 | | | | 0.03 | | | | 0.03 | | | | 0.02 | |
Net realized gains on investments | | | 0.00 | 4 | | | 0.00 | 4 | | | 0.00 | | | | 0.00 | | | | 0.00 | | | | 0.00 | | | | 0.00 | |
| | | | | | | | | | | | | | | | | | | | | | | | | | | | |
Total from investment operations | | | 0.00 | 4 | | | 0.00 | 4 | | | 0.00 | 4 | | | 0.01 | | | | 0.03 | | | | 0.03 | | | | 0.02 | |
Distributions to shareholders from | | | | | | | | | | | | | | | | | | | | | | | | | | | | |
Net investment income | | | (0.00 | )4 | | | (0.00 | )4 | | | (0.00 | )4 | | | (0.01 | ) | | | (0.03 | ) | | | (0.03 | ) | | | (0.02 | ) |
Net realized gains | | | 0.00 | | | | 0.00 | | | | (0.00 | )4 | | | (0.00 | )4 | | | 0.00 | | | | 0.00 | | | | 0.00 | |
| | | | | | | | | | | | | | | | | | | | | | | | | | | | |
Total distributions to shareholders | | | (0.00 | )4 | | | (0.00 | )4 | | | (0.00 | )4 | | | (0.01 | ) | | | (0.03 | ) | | | (0.03 | ) | | | (0.02 | ) |
Net asset value, end of period | | $ | 1.00 | | | $ | 1.00 | | | $ | 1.00 | | | $ | 1.00 | | | $ | 1.00 | | | $ | 1.00 | | | $ | 1.00 | |
Total return3 | | | 0.00 | % | | | 0.01 | % | | | 0.06 | % | | | 1.42 | % | | | 3.05 | % | | | 3.06 | % | | | 2.04 | % |
Ratios to average net assets (annualized) | | | | | | | | | | | | | | | | | | | | | | | | | | | | |
Gross expenses | | | 0.53 | % | | | 0.62 | % | | | 0.77 | % | | | 0.75 | % | | | 0.73 | % | | | 0.73 | % | | | 0.74 | % |
Net expenses | | | 0.18 | % | | | 0.32 | % | | | 0.38 | % | | | 0.47 | % | | | 0.45 | % | | | 0.45 | % | | | 0.45 | % |
Net investment income | | | 0.01 | % | | | 0.01 | % | | | 0.07 | % | | | 1.43 | % | | | 2.94 | % | | | 3.01 | % | | | 2.18 | % |
Supplemental data | | | | | | | | | | | | | | | | | | | | | | | | | | | | |
Net assets, end of period (000’s omitted) | | | $101,122 | | | | $101,301 | | | | $397,508 | | | | $709,029 | | | | $970,945 | | | | $500,024 | | | | $416,048 | |
| 1. | For the eleven months ended January 31, 2011. The Fund changed its fiscal year end from February 28 to January 31, effective January 31, 2011. |
| 2. | For the eleven months ended February 28, 2006. The Fund changed its fiscal year end from March 31 to February 28, effective February 28, 2006. |
| 3. | Returns for periods of less than one year are not annualized. |
| 4. | Amount is less than $0.005. |
The accompanying notes are an integral part of these financial statements.
| | | | | | |
| Financial Highlights | | Wells Fargo Advantage California Municipal Money Market Fund | | | 25 | |
| | | | | | | | |
(For a share outstanding throughout each period) | | | | |
| | |
| | | Six Months Ended
July 31, 2011
(Unaudited) | | | Year Ended
January 31,
20111 | |
| Sweep Class | | |
Net asset value, beginning of period | | $ | 1.00 | | | $ | 1.00 | |
Net investment income | | | 0.00 | 3 | | | 0.00 | 3 |
Net realized gains on investments | | | 0.00 | 3 | | | 0.00 | |
| | | | | | | | |
Total from investment operations | | | 0.00 | 3 | | | 0.00 | 3 |
Distributions to shareholders from | | | | | | | | |
Net investment income | | | (0.00 | )3 | | | (0.00 | )3 |
Net asset value, end of period | | $ | 1.00 | | | $ | 1.00 | |
Total return2 | | | 0.00 | % | | | 0.01 | % |
Ratios to average net assets (annualized) | | | | | | | | |
Gross expenses | | | 0.98 | % | | | 0.98 | % |
Net expenses | | | 0.19 | % | | | 0.29 | % |
Net investment income | | | 0.01 | % | | | 0.01 | % |
Supplemental data | | | | | | | | |
Net assets, end of period (000’s omitted) | | | $263,838 | | | | $402,840 | |
| 1. | For the period from June 30, 2010 (commencement of class operations) to January 31, 2011. |
| 2. | Returns for periods of less than one year are not annualized. |
| 3. | Amount is less than $0.005. |
The accompanying notes are an integral part of these financial statements.
| | | | |
| 26 | | Wells Fargo Advantage California Municipal Money Market Fund | | Notes to Financial Statements (Unaudited) |
1. ORGANIZATION
Wells Fargo Funds Trust (the “Trust”), a Delaware statutory trust organized on March 10, 1999, is an open-end management investment company registered under the Investment Company Act of 1940, as amended (the “1940 Act”). These financial statements report on Wells Fargo Advantage California Municipal Money Market Fund (the “Fund”) which is a diversified series of the Trust.
2. SIGNIFICANT ACCOUNTING POLICIES
The following significant accounting policies, which are consistently followed in the preparation of the financial statements of the Fund, are in conformity with U.S. generally accepted accounting principles which require management to make estimates and assumptions that affect the reported amounts of assets and liabilities, disclosure of contingent assets and liabilities at the date of the financial statements, and the reported amounts of revenues and expenses during the reporting period. Actual results could differ from those estimates.
Securities valuation
As permitted under Rule 2a-7 of the 1940 Act, securities are valued at amortized cost, which approximates fair value.
Certain investments which are not valued using any of the methods discussed above, are valued at their fair value, as determined by procedures established in good faith and approved by the Board of Trustees.
The valuation techniques used by the Fund to measure fair value are consistent with the market approach, income approach and/or cost approach, where applicable, for each security type.
Security transactions and income recognition
Securities transactions are recorded on a trade date basis. Realized gains or losses are reported on the basis of identified cost of securities delivered.
Interest income is accrued daily and bond discounts are accreted and premiums are amortized daily based on the effective interest method. To the extent debt obligations are placed on non-accrual status, any related interest income may be reduced by writing off interest receivables when the collection of all or a portion of interest has become doubtful based on consistently applied procedures. If the issuer subsequently resumes interest payments or when the collectability of interest is reasonably assured, the debt obligation is removed from non-accrual status.
Distributions to shareholders
Distributions to shareholders from net investment income are accrued daily and paid monthly. Distributions from net realized gains, if any, are recorded on the ex-dividend date. Such distributions are determined in conformity with income tax regulations, which may differ from generally accepted accounting principles.
Federal and other taxes
The Fund intends to continue to qualify as a regulated investment company by distributing substantially all of its investment company taxable and tax-exempt income and any net realized capital gains (after reduction for capital loss carryforwards) sufficient to relieve it from all, or substantially all, federal income taxes. Accordingly, no provision for federal income taxes was required.
The Fund’s income and federal excise tax returns and all financial records supporting those returns for the prior three fiscal years are subject to examination by the federal and Delaware revenue authorities.
As of January 31, 2011, the Fund had estimated net capital loss carryforwards, which are available to offset future net realized capital gains, in the amount of $4,875 expiring in 2018.
Under the recently enacted Regulated Investment Company Modernization Act of 2010, the Fund will be permitted to carry forward capital losses incurred in taxable years beginning after December 22, 2010 for an unlimited period. However, any losses incurred during those future taxable years will be required to be utilized prior to the losses incurred in pre-enactment taxable years. As a result of this ordering rule, pre-enactment capital loss carryforwards may be more likely to expire unused. Additionally, post-enactment capital losses that are carried forward will retain their character as either short-term or long-term capital losses rather than being considered all short-term as under previous law.
| | | | | | |
| Notes to Financial Statements (Unaudited) | | Wells Fargo Advantage California Municipal Money Market Fund | | | 27 | |
Class allocations
The separate classes of shares offered by the Fund differ principally in distribution, shareholder servicing and administration fees. Shareholders of each class bear certain expenses that pertain to that particular class. All shareholders bear the common expenses of the Fund, earn income from the portfolio, and are allocated unrealized gains and losses pro rata based on the average daily net assets of each class, without distinction between share classes. Dividends are determined separately for each class based on income and expenses allocable to each class. Realized gains and losses are allocated to each class pro rata based upon the net assets of each class on the date realized. Differences in per share dividend rates generally result from the relative weightings of pro rata income and realized gain allocations and from differences in separate class expenses, including distribution, shareholder servicing and administration fees.
3. FAIR VALUATION MEASUREMENTS
Fair value measurements of investments are determined within a framework that has established a fair value hierarchy based upon the various data inputs utilized in determining the value of the Fund’s investments. The three-level hierarchy gives the highest priority to unadjusted quoted prices in active markets for identical assets or liabilities (Level 1) and the lowest priority to unobservable inputs (Level 3). The Fund’s investments are classified within the fair value hierarchy based on the lowest level of input that is significant to the fair value measurement. The inputs are summarized into three broad levels as follows:
| n | | Level 1 – quoted prices in active markets for identical securities |
| n | | Level 2 – other significant observable inputs (including quoted prices for similar securities, interest rates, prepayment speeds, credit risk, etc.) |
| n | | Level 3 – significant unobservable inputs (including the Fund’s own assumptions in determining the fair value of investments) |
The inputs or methodologies used for valuing securities are not necessarily an indication of the risk associated with investing in those securities.
At July 31, 2011, all of the Fund’s investments in securities carried at fair value were designated as Level 2 since the primary inputs include credit quality of the issuer and short-term interest rates which are observable.
Further details on the major security types can be found in the Fund’s Portfolio of Investments.
4. TRANSACTIONS WITH AFFILIATES AND OTHER EXPENSES
Advisory fee
The Trust has entered into an advisory contract with Wells Fargo Funds Management, LLC (“Funds Management”) , an indirect wholly owned subsidiary of Wells Fargo & Company (“Wells Fargo”). The adviser is responsible for implementing investment policies and guidelines and for supervising the sub-adviser, who is responsible for day-to-day portfolio management of the Fund.
Pursuant to the contract, Funds Management is entitled to receive an annual advisory fee of 0.10% of the average daily net assets of the Fund.
Funds Management may retain the services of certain sub-advisers to provide daily portfolio management to the Fund. The fees related to sub-advisory services are borne directly by the adviser and do not increase the overall fees paid by the Fund to the adviser. Wells Capital Management Incorporated, an affiliate of Funds Management, is the sub-adviser to the Fund and is entitled to receive a fee from the adviser at an annual rate starting at 0.05% and declining to 0.01% as the average daily net assets of the Fund increase.
| | | | |
| 28 | | Wells Fargo Advantage California Municipal Money Market Fund | | Notes to Financial Statements (Unaudited) |
Administration and transfer agent fees
The Trust has entered into an administration agreement with Funds Management. Under this agreement, for providing administrative services, which includes paying fees and expenses for services provided by the transfer agent, sub-transfer agents, omnibus account servicers and record-keepers, Funds Management is entitled to receive from the Fund an annual fund level administration fee starting at 0.05% and declining to 0.03% as the average daily net assets of the Fund increase and a class level administration fee which is calculated based on the average daily net assets of each class as follows:
| | | | |
| | | Class Level Administration Fee | |
Class A, Sweep Class | | | 0.22 | % |
Administrator Class | | | 0.10 | |
Institutional Class | | | 0.08 | |
Service Class | | | 0.12 | |
Funds Management has contractually waived and/or reimbursed advisory and administration fees to the extent necessary to maintain certain net operating expense ratios for the Fund. Waiver of fees and/or reimbursement of expenses by Funds Management were made first from fund level expenses on a proportionate basis and then from class specific expenses.
Distribution fees
The Trust has adopted a Distribution Plan for Sweep Class shares of the Fund pursuant to Rule 12b-1 under the 1940 Act. Distribution fees are charged to the Sweep Class shares and paid to Wells Fargo Funds Distributor, LLC, the principal underwriter, at an annual rate of 0.35% of the average daily net assets of Sweep Class shares.
Shareholder servicing
The Trust has entered into contracts with one or more shareholder servicing agents, whereby Class A, Service Class and Sweep Class of the Fund is charged a fee at an annual rate of 0.25% of the average daily net assets of the class. Administrator Class is charged a fee at an annual rate of 0.10% of its average daily net assets.
A portion of these total shareholder servicing fees were paid to affiliates of Wells Fargo.
5. ACQUISITIONS
After the close of business on July 9, 2010, the Fund acquired the net assets of Evergreen California Municipal Money Market Fund. The purpose of the transaction was to combine two funds with similar investment objectives and strategies. The acquisition was accomplished by a tax-free exchange of all of the shares of Evergreen California Municipal Money Market Fund for 446,319,845 shares of the Fund valued at $446,260,081 at an exchange ratio of 1.00 for each class. Shareholders holding Class A, Class S and Class I shares of Evergreen California Municipal Money Market Fund received Class A, Sweep Class and Service Class shares, respectively, of the Fund in the reorganization.
The investment portfolio of Evergreen California Municipal Money Market Fund with a fair value of $445,550,863 and amortized cost of $445,550,863 at July 9, 2010 were the principal assets acquired by the Fund. The aggregate net assets of Evergreen California Municipal Money Market Fund and the Fund immediately prior to the acquisition were $446,260,081 and $2,586,576,466, respectively. The aggregate net assets of the Fund immediately after the acquisition were $3,032,836,547. For financial reporting purposes, assets received and shares issued by the Fund were recorded at fair value; however, the cost basis of the investments received from Evergreen California Municipal Money Market Fund was carried forward to align ongoing reporting of the Fund’s realized and unrealized gains and losses with amounts distributable to shareholders for tax purposes.
| | | | | | |
| Notes to Financial Statements (Unaudited) | | Wells Fargo Advantage California Municipal Money Market Fund | | | 29 | |
Assuming the acquisition had been completed March 1, 2010, the beginning of the annual reporting period for the Fund, the pro forma results of operations for the period ended January 31, 2011 would have been:
| | | | |
Net investment income | | $ | 455,272 | |
Net realized gains on investments | | $ | 28,076 | |
Net increase in net assets resulting from operations | | $ | 483,358 | |
In addition, after the close of business on November 5, 2010, the Fund also acquired the net assets of Wells Fargo Advantage California Municipal Money Market Trust. The purpose of the transaction was to combine two funds with similar investment objectives and strategies. Existing shareholders of Wells Fargo Advantage California Municipal Money Market Trust received Institutional Class shares of the Fund in the reorganization. The acquisition was accomplished by a tax-free exchange of all of the shares of Wells Fargo Advantage California Municipal Money Market Trust for 395,086,399 shares of the Fund valued at $395,098,848 at an exchange ratio of 1.00 for Institutional Class shares.
The investment portfolio of Wells Fargo Advantage California Municipal Money Market Trust with a fair value of $394,896,500 and amortized cost of $394,896,500 at November 5, 2010 were the principal assets acquired by the Fund. The aggregate net assets of Wells Fargo Advantage California Municipal Money Market Trust and the Fund immediately prior to the acquisition were $395,098,848 and $2,730,601,555, respectively. The aggregate net assets of the Fund immediately after the acquisition were $3,125,700,403. For financial reporting purposes, assets received and shares issued by the Fund were recorded at fair value; however, the cost basis of the investments received from Wells Fargo Advantage California Municipal Money Market Trust was carried forward to align ongoing reporting of the Fund’s realized and unrealized gains and losses with amounts distributable to shareholders for tax purposes.
Assuming the acquisitions of Evergreen California Municipal Money Market Fund and Wells Fargo Advantage California Municipal Money Market Trust had both been completed March 1, 2010, the beginning of the annual reporting period for the Fund, the pro forma results of operations for the period ended January 31, 2011 would have been:
| | | | |
Net investment income | | $ | 850,232 | |
Net realized gains on investments | | $ | 28,242 | |
Net increase in net assets resulting from operations | | $ | 878,474 | |
6. CONCENTRATION RISK
The Fund invests a substantial portion of its assets in issuers of municipal debt securities located in a single state, therefore, it may be more affected by economic and political developments in that state or region than would be a comparable general tax-exempt mutual fund.
7. INDEMNIFICATION
Under the Trust’s organizational documents, the officers and directors are indemnified against certain liabilities that may arise out of performance of their duties to the Trust. Additionally, in the normal course of business, the Trust may enter into contracts with service providers that contain a variety of indemnification clauses. The Trust’s maximum exposure under these arrangements is dependent on future claims that may be made against the Fund and, therefore, cannot be estimated.
8. NEW ACCOUNTING PRONOUNCEMENTS
In May 2011, the Financial Accounting Standards Board (“FASB”) issued Accounting Standards Update (“ASU”) No. 2011-04 “Amendments to Achieve Common Fair Value Measurement and Disclosure Requirements in U.S. GAAP and IFRSs”. ASU No. 2011-04 amends FASB ASC Topic 820, Fair Value Measurements and Disclosures, to establish common requirements for measuring fair value and for disclosing information about fair value measurements in accordance with GAAP. The ASU is effective prospectively for interim and annual periods beginning after December 15, 2011.
| | | | |
| 30 | | Wells Fargo Advantage California Municipal Money Market Fund | | Notes to Financial Statements (Unaudited) |
In April 2011, FASB issued ASU No. 2011-03 “Reconsideration of Effective Control for Repurchase Agreements”. ASU No. 2011-03 amends FASB ASC Topic 860, Transfers and Servicing, specifically the criteria required to determine whether a repurchase agreement (repo) and similar agreements should be accounted for as sales of financial assets or secured borrowings with commitments. ASU No. 2011-03 changes the assessment of effective control by focusing on the transferor’s contractual rights and obligations and removing the criterion to assess its ability to exercise those rights or honor those obligations. This could result in changes to the way entities account for certain transactions including repurchase agreements, mortgage dollar rolls and reverse repurchase agreements. The ASU will become effective on a prospective basis for new transfers and modifications to existing transactions as of the beginning of the first interim or annual period beginning on or after December 15, 2011.
As of July 31, 2011, management of the Fund is currently assessing the potential impact, in addition to expanded financial statement disclosure, that may result from adopting these ASUs.
| | | | | | |
| Other Information (Unaudited) | | Wells Fargo Advantage California Municipal Money Market Fund | | | 31 | |
PORTFOLIO HOLDINGS INFORMATION
The complete portfolio holdings for the Fund are publicly available on the Fund’s Web site
(www.wellsfargo.com/advantagefunds) on a monthly, seven-day delayed basis. The Fund files its complete schedule of portfolio holdings with the SEC for the first and third quarters of each fiscal year on Form N-Q, which is available without charge by visiting the SEC Web site at www.sec.gov. In addition, the Fund’s Form N-Q may be reviewed and copied at the SEC’s Public Reference Room in Washington, DC, and at regional offices in New York City, at 233 Broadway, and in Chicago, at 175 West Jackson Boulevard, Suite 900. Information about the Public Reference Room may be obtained by calling 1-800-SEC-0330.
PROXY VOTING INFORMATION
A description of the policies and procedures that the Fund uses to determine how to vote proxies relating to portfolio securities is available without charge, upon request, by calling 1-800-222-8222, visiting our Web site at www.wellsfargo.com/advantagefunds, or visiting the SEC Web site at www.sec.gov. Information regarding how the Fund voted proxies relating to portfolio securities during the most recent 12-month period ended June 30 is available without charge on the Fund’s Web site at www.wellsfargo.com/advantagefunds or by visiting the SEC Web site at www.sec.gov.
| | | | |
| 32 | | Wells Fargo Advantage California Municipal Money Market Fund | | Other Information (Unaudited) |
BOARD OF TRUSTEES
The following table provides basic information about the Board of Trustees (the “Trustees”) of the Trust and Officers of the Trust. This table should be read in conjunction with the Prospectus and the Statement of Additional Information1 of the Fund. Each of the Trustees and Officers listed below acts in identical capacities for the Wells Fargo Advantage family of funds, which consists of 144 funds comprising the Wells Fargo Funds Trust, Wells Fargo Variable Trust, Wells Fargo Master Trust and four closed-end funds (collectively the “Fund Complex”). All of the Trustees are also Members of the Audit and Governance Committees of each Trust in the Fund Complex. The mailing address of each Trustee and Officer is 525 Market Street, 12th Floor, San Francisco, CA 94105. Each Trustee and Officer serves an indefinite term, however, each Trustee serves such term until reaching the mandatory retirement age established by the Trustees.
Independent Trustees
| | | | | | |
Name and Year of Birth | | Position Held and Length of Service | | Principal Occupations During Past Five Years | | Other Directorships During
Past Five Years |
Peter G. Gordon
(Born 1942) | | Trustee, since 1998; Chairman, since 2005 | | Co-Founder, Chairman, President and CEO of Crystal Geyser. Water Company. Trustee Emeritus, Colby College | | Asset Allocation Trust |
Isaiah Harris, Jr.
(Born 1952) | | Trustee, since 2009 | | Retired. Prior thereto, President and CEO of BellSouth Advertising and Publishing Corp. from 2005 to 2007, President and CEO of BellSouth Enterprises from 2004 to 2005 and President of BellSouth Consumer Services from 2000 to 2003. Emeritus member of the Iowa State University Foundation Board of Governors. Emeritus Member of the Advisory Board of Iowa State University School of Business. Mr. Harris is a certified public accountant. | | CIGNA Corporation; Deluxe Corporation; Asset Allocation Trust |
Judith M. Johnson
(Born 1949) | | Trustee, since 2008 | | Retired. Prior thereto, Chief Executive Officer and Chief Investment Officer of Minneapolis Employees Retirement Fund from 1996 to 2008. Ms. Johnson is an attorney, certified public accountant and a certified managerial accountant. | | Asset Allocation Trust |
Leroy Keith, Jr.
(Born 1939) | | Trustee, since 2010 | | Chairman, Bloc Global Services (development and construction), Trustee of the Evergreen Funds from 1983 to 2010. Former Managing Director, Almanac Capital Management (commodities firm), former Partner, Stonington Partners, Inc. (private equity fund), former Director, Obagi Medical Products Co. and former Director, Lincoln Educational Services. | | Trustee, Virtus Fund Complex (consisting of 45 portfolios as of 12/31/10); Director, Diversapack Co. (packaging company); Asset Allocation Trust |
David F. Larcker
(Born 1950) | | Trustee, since 2009 | | James Irvin Miller Professor of Accounting at the Graduate School of Business, Stanford University, Director of Corporate Governance Research Program and Co-Director of The Rock Center for Corporate Governance since 2006. From 2005 to 2008, Professor of Accounting at the Graduate School of Business, Stanford University. Prior thereto, Ernst & Young Professor of Accounting at The Wharton School, University of Pennsylvania from 1985 to 2005. | | Asset Allocation Trust |
Olivia S. Mitchell
(Born 1953) | | Trustee, since 2006 | | International Foundation of Employee Benefit Plans Professor and Chair of the Department of Insurance and Risk Management, Wharton School of the University of Pennsylvania since 1993. Director of Wharton’s Pension Research Council and Boettner Center on Pensions & Retirement Research, and Research Associate at the National Bureau of Economic Research. Previously, Cornell University Professor from 1978 to 1993. | | Asset Allocation Trust |
| | | | | | |
| Other Information (Unaudited) | | Wells Fargo Advantage California Municipal Money Market Fund | | | 33 | |
| | | | | | |
Name and Year of Birth | | Position Held and Length of Service | | Principal Occupations During Past Five Years | | Other Directorships During
Past Five Years |
Timothy J. Penny
(Born 1951) | | Trustee, since 1996 | | President and CEO of Southern Minnesota Initiative Foundation, a non-profit organization, since 2007 and Senior Fellow at the Humphrey Institute Policy Forum at the University of Minnesota since 1995. Member of the Board of Trustees of NorthStar Education Finance, Inc., a non-profit organization, since 2007. | | Asset Allocation Trust |
Michael S. Scofield
(Born 1943) | | Trustee, since 2010 | | Currently serves on the Investment Company Institute’s Board of Governors and Executive Committee as well the In dependent Director’s Counsel Board of Governors and Executive Committee. Former Chairman of the Independent Directors Counsel. Trustee of the Evergreen Funds from 1984 to 2010. Retired Attorney, Law Offices of Michael S. Scofield and former Director and Chairman, Branded Media Corporation (multi-media branding company). | | Asset Allocation Trust |
Donald C. Willeke
(Born 1940) | | Trustee, since 1996 | | Principal of the law firm of Willeke & Daniels. General Counsel of the Minneapolis Employees Retirement Fund from 1984 until its consolidation into the Minnesota Public Employees Retirement Association on June 30, 2010. | | Asset Allocation Trust |
Officers
| | | | | | |
Name and Year of Birth | | Position Held and
Length of Service | | Principal Occupations During Past Five Years | | |
Karla M. Rabusch
(Born 1959) | | President, since 2003 | | Executive Vice President of Wells Fargo Bank, N.A. and President of Wells Fargo Funds Management, LLC since 2003. Senior Vice President and Chief Administrative Officer of Wells Fargo Funds Management, LLC from 2001 to 2003. | | |
C. David Messman
(Born 1960) | | Secretary, since 2000; Chief Legal Counsel, since 2003 | | Senior Vice President and Secretary of Wells Fargo Funds Management, LLC since 2001. Vice President and Managing Counsel of Wells Fargo Bank, N.A. since 1996. | | |
Kasey Phillips
(Born 1970) | | Treasurer, since 2008 | | Senior Vice President of Wells Fargo Funds Management, LLC since 2009. Senior Vice President of Evergreen Investment Management Company, LLC from 2006 to 2010. Treasurer of the Evergreen Funds from 2005 to 2010. Vice President and Assistant Vice President of Evergreen Investment Services, Inc. from 1999 to 2006. | | |
David Berardi
(Born 1975) | | Assistant Treasurer, since 2009 | | Vice President of Wells Fargo Funds Management, LLC since 2009 . Vice President of Evergreen Investment Management Company, LLC from 2008 to 2010. Assistant Vice President of Evergreen Investment Services, Inc. from 2004 to 2008. Manager of Fund Reporting and Control for Evergreen Investment Management Company, LLC from 2004 to 2010. | | |
Jeremy DePalma
(Born 1974) | | Assistant Treasurer, since 2009 | | Senior Vice President of Wells Fargo Funds Management, LLC since 2009. Senior Vice President of Evergreen Investment Management Company, LLC from 2008 to 2010. Vice President, Evergreen Investment Services, Inc. from 2004 to 2007. Assistant Vice President, Evergreen Investment Services, Inc. from 2000 to 2004 and the head of the Fund Reporting and Control Team within Fund Administration from 2005 to 2010. | | |
Debra Ann Early
(Born 1964) | | Chief Compliance Officer, since 2007 | | Chief Compliance Officer of Wells Fargo Funds Management, LLC since 2007. Chief Compliance Officer of Parnassus Investments from 2005 to 2007. Chief Financial Officer of Parnassus Investments from 2004 to 2007 and Senior Audit Manager of PricewaterhouseCoopers LLP from 1998 to 2004. | | |
| 1. | The Statement of Additional Information includes additional information about the Fund’s Trustees and is available, without charge, upon request, by calling 1-800-222-8222 or by visiting the Fund’s Web site at www.wellsfargo.com/advantagefunds. |
| | | | |
| 34 | | Wells Fargo Advantage California Municipal Money Market Fund | | Other Information (Unaudited) |
BOARD CONSIDERATION OF INVESTMENT ADVISORY AND SUB-ADVISORY AGREEMENTS:
California Municipal Money Market Fund, Municipal Cash Management Money Market Fund, Municipal Money Market Fund, National Tax-Free Money Market Fund, New Jersey Municipal Money Market Fund, New York Municipal Money Market Fund and Pennsylvania Municipal Money Market Fund
(Not all of the funds described in this Board considerations section are part of this shareholder report. This shareholder report only relates to California Municipal Money Market Fund.)
Each year, as required by Section 15 of the Investment Company Act of 1940 (the “1940 Act”), the Board of Trustees (the “Board”) of Wells Fargo Funds Trust (the “Trust”), all the members of which have no direct or indirect interest in the investment advisory and sub-advisory agreements and are not “interested persons” of the Trust, as defined in the 1940 Act (the “Independent Trustees”), determines whether to approve the continuation of the Trust’s investment advisory and sub-advisory agreements. In this regard, at an in person meeting held on March 24-25, 2011 (the “Meeting”), the Board reviewed and re-approved: (i) an investment advisory agreement with Wells Fargo Funds Management, LLC (“Funds Management”) for each of the California Municipal Money Market Fund, Municipal Cash Management Money Market Fund, Municipal Money Market Fund, National Tax-Free Money Market Fund, New Jersey Municipal Money Market Fund, New York Municipal Money Market Fund and Pennsylvania Municipal Money Market Fund (collectively, the “Funds”); and (ii) an investment sub-advisory agreement with Wells Capital Management Incorporated (“Wells Capital Management”) for each of the Funds. The investment advisory agreements with Funds Management and the investment sub-advisory agreements with Wells Capital Management are collectively referred to as the “Advisory Agreements.”
At the Meeting, the Board considered the factors and reached the conclusions described below relating to the selection of Funds Management and Wells Capital Management and continuation of the Advisory Agreements. Prior to the Meeting, the Trustees conferred extensively among themselves and with representatives of Funds Management about these matters. The Board also met throughout the year and received information that was useful to them in considering the continuation of the Advisory Agreements. The Independent Trustees were assisted in their evaluation of the Advisory Agreements by independent legal counsel, from whom they received separate legal advice and with whom they met separately from Funds Management.
Nature, extent and quality of services
The Board received and considered various information regarding the nature, extent and quality of services provided to the Funds by Funds Management and Wells Capital Management under the Advisory Agreements. The Board also received and considered information provided in response to a detailed set of requests submitted by the Independent Trustees’ independent legal counsel on their behalf. The Board received and considered, among other things, information about the background and experience of senior management of Funds Management, and the qualifications, backgrounds, tenures and responsibilities of the portfolio managers primarily responsible for the day-to-day portfolio management of the Funds.
The Board evaluated the ability of Funds Management and Wells Capital Management, based on their respective financial condition, resources, reputation and other attributes, to attract and retain qualified investment professionals, including research, advisory, and supervisory personnel. The Board further considered the compliance programs and compliance records of Funds Management and Wells Capital Management. In addition, the Board took into account the administrative services provided to the Funds by Funds Management and its affiliates.
The Board’s decision to approve the continuation of the Advisory Agreements was based on a comprehensive evaluation of all of the information provided to it. In approving the continuation of the Advisory Agreements, the Board did not identify any particular information or consideration that was all-important or controlling, and each Trustee attributed different weights to various factors. The Board evaluated information provided to it both in terms of the funds generally and with respect to each Fund specifically as it considered appropriate. Although the Board considered the continuation of the Advisory Agreements for each of the Funds as part of the larger process of considering the continuation of the advisory agreements for all of the funds, its decision to continue the Advisory Agreements for each of the Funds was ultimately made on a fund-by-fund basis.
In considering these matters, the Board considered not only the specific information presented in connection with the Meeting, but also the knowledge gained over time through interaction with Funds Management and Wells Capital
| | | | | | |
| Other Information (Unaudited) | | Wells Fargo Advantage California Municipal Money Market Fund | | | 35 | |
Management about various topics, including Funds Management’s oversight of service providers. The above factors, together with those referenced below, are some of the most important, but not necessarily all, factors considered by the Board in concluding that it was satisfied with the nature, extent and quality of the investment advisory services provided to each Fund by Funds Management and Wells Capital Management.
Fund performance and expenses
The Board considered the performance results for each of the Funds over various time periods ended December 31, 2010. The Board also considered these results in comparison to the median performance of a universe of relevant funds (the “Universe”) that were determined by Lipper Inc. (“Lipper”) to be similar to the Funds, and in comparison to each Fund’s benchmark index and to other comparative data. Lipper is an independent provider of investment company data. The Board received a description of the methodology used by Lipper to select the mutual funds in the Universe.
The Board noted that the performance of each of the Funds was generally higher than or in range of the median performance of the Universe for the periods under review.
The Board received and considered information regarding each Fund’s contractual advisory fee and net operating expense ratios and their various components, including actual management fees (which reflect fee waivers, if any), transfer agent, custodian and other non-management fees, Rule 12b-1 and non-Rule 12b-1 fees, service fees and fee waiver and expense reimbursement arrangements. The Board also considered these ratios in comparison to the median ratios of an expense Universe and a narrower expense group of mutual funds (each, an “Expense Group”) that was determined by Lipper to be similar to each Fund. The Board received a description of the methodology used by Lipper to select the mutual funds in a Fund’s Expense Group. The Board noted that the net operating expense ratios of the Service Class, Administrator Class and Institutional Class of each of the Funds were in range of each Fund’s respective Expense Group’s median net operating expense ratio. The Board also noted that the net operating expense ratios of the Class A and Sweep Class of each of the Funds were higher than each Fund’s respective Expense Group’s median net operating expense ratio and that the net operating expense ratio of the Municipal Money Market Fund (Investor Class) was not appreciably higher than the Expense Group’s median net operating expense ratio.
Based on the above-referenced considerations and other factors, the Board concluded that the overall performance and expense structure of the Funds supported the re-approval of the Advisory Agreements for the Funds.
Investment advisory and sub-advisory fee rates
The Board reviewed and considered the contractual investment advisory fee rates that are payable by the Funds to Funds Management for investment advisory services (the “Advisory Agreement Rates”), both on a stand-alone basis and on a combined basis with the Funds’ administration fee rates. The Board took into account the separate administrative and other services covered by the administration fee rates. The Board also reviewed and considered the contractual investment sub-advisory fee rates that are payable by Funds Management to Wells Capital Management for investment sub-advisory services (the “Sub-Advisory Agreement Rates”). In addition, the Board reviewed and considered the existing fee waiver/cap arrangements applicable to the Advisory Agreement Rates and considered the Advisory Agreement Rates after taking the waivers/caps into account (the “Net Advisory Rates”).
The Board received and considered information comparing the Advisory Agreement Rates and Net Advisory Rates with those of other funds in each Fund’s Expense Group median. The Board noted that the Advisory Agreement Rates for each of the Funds were in range of the median rate of each Fund’s Expense Group, except for the Municipal Money Market Fund and the New York Municipal Money Market Fund (Sweep Class). The Board noted that the Net Advisory Rates for the Service Class, Administrator Class and the Institutional Class of each of the Funds were lower than or in range of the median rate of each Fund’s Expense Group. The Board noted that the Net Advisory Rate for the Investor Class, Class A and Sweep Class of each of the Funds was not appreciably higher than the median rate for the Fund’s Expense, except for the Sweep Class of the Municipal Money Market Fund, New Jersey Municipal Money Market Fund and the New York Municipal Money Market Fund. The Board further noted that Funds Management had agreed to continue and, in certain instances, reduce contractual fee cap arrangements for the Funds designed to lower the Funds’ expenses.
The Board also received and considered information about the nature and extent of services offered and fee rates charged by Funds Management and Wells Capital Management to other types of clients. In this regard, the Board received information about differences between the services, and the compliance, reporting, and other legal burdens
| | | | |
| 36 | | Wells Fargo Advantage California Municipal Money Market Fund | | Other Information (Unaudited) |
and risks of providing investment advice to mutual funds and those associated with providing advice to non-mutual fund clients such as collective funds or institutional separate accounts.
In each case, the Board determined that the Advisory Agreement Rates for the Funds, both with and without administration fee rates and before and after waivers, were acceptable in light of the Funds’ Expense Group information, the net expense ratio commitments, the services covered by the Advisory Agreements and other information provided. The Board also reviewed and considered the Sub-Advisory Agreement Rates and concluded that the Sub-Advisory Agreement Rates were acceptable in light of the services covered by the Sub-Advisory Agreement and other information provided.
Profitability
The Board received and considered a profitability analysis of Funds Management, as well as an analysis of the profitability to the collective Wells Fargo businesses that provide services to the Funds. It considered that the information provided to it was necessarily estimated, and that the profitability information provided to it, especially on a fund-by-fund basis, did not necessarily provide a precise tool for evaluating the appropriateness of each Fund’s Advisory Agreement Rates in isolation. It noted that the levels of profitability of the Funds to Funds Management varied widely, depending on, among other things, the size and type of fund. The Board concluded that the profitability to Funds Management of the services provided to any of the Funds, individually or in the aggregate, was not unreasonable.
The Board did not consider separate profitability information with respect to Wells Capital Management, because, as an affiliate of Funds Management, its profitability information was subsumed in the collective Wells Fargo profitability analysis provided by Funds Management.
Economies of scale
With respect to possible economies of scale, the Board reviewed the breakpoints in each Fund’s advisory fee structure, which operate generally to reduce the effective Advisory Agreement Rates of the Funds (as a percentage of Fund assets) as the Funds grow in size. It considered that, as a fund shrinks in size, breakpoints conversely result in increasing fee levels. The Board noted that it would continue to review the appropriate levels of breakpoints in the future, and concluded that the breakpoints as implemented appeared to be a reasonable step toward sharing economies of scale with the Funds. However, the Board acknowledged the inherent limitations of any analysis of an investment adviser’s economies of scale and of any attempt to correlate breakpoints with such economies, stemming largely from the Board’s understanding that economies of scale are realized, if at all, by an investment adviser across a variety of products and services, not just with respect to a single fund.
Other benefits to Funds Management and Wells Capital Management
The Board received and considered information regarding potential “fall-out” or ancillary benefits received by Funds Management and its affiliates, including Wells Capital Management, as a result of their relationship with the Funds. Ancillary benefits could include, among others, benefits directly attributable to the relationship of Funds Management and Wells Capital Management with the Funds and benefits potentially derived from an increase in Funds Management’s and Wells Capital Management’s business as a result of their relationship with the Funds (such as the ability to market to shareholders other financial products offered by Funds Management and its affiliates, including Wells Capital Management).
The Board considered that Wells Fargo Funds Distributor, LLC, an affiliate of Funds Management, serves as distributor to the Funds and receives certain compensation for those services. The Board noted that the Funds pay sub-transfer agency fees to various financial institutions, including affiliates of Funds Management that hold fund shares in omnibus accounts. It also considered that these entities may receive distribution-related fees and shareholder servicing payments (including amounts derived from payments under the funds’ Rule 12b-1 plans) in respect of shares sold or held through them.
The Board also reviewed information about whether and to what extent soft dollar credits are sought and how any such credits are utilized and any benefits that may be realized by using an affiliated broker.
Other factors and broader review
The Board also considered the markets for distribution of the Funds’ shares, including the multiple channels through which the Funds’ shares are offered and sold. The Board noted that the Funds are part of one of the few fund families that have both direct-to-fund and intermediary distribution channels. As discussed above, the Board reviews detailed materials received from Funds Management and Wells Capital Management annually as part of the re-approval process under Section 15 of the 1940 Act and also reviews and assesses information about the quality of the services that the
| | | | | | |
| Other Information (Unaudited) | | Wells Fargo Advantage California Municipal Money Market Fund | | | 37 | |
Funds receive throughout the year. In this regard, the Board has reviewed reports of Funds Management at each of its quarterly meetings, which include, among other things, portfolio reviews and performance reports. In addition, the Board confers with portfolio managers at various times throughout the year.
Conclusion
After considering the above-described factors and based on its deliberations and its evaluation of the information described above, the Board concluded that approval of the continuation of the Advisory Agreements for the Funds was in the best interest of the Funds and their shareholders. Accordingly, the Board unanimously approved the continuation of the Advisory Agreements for an additional one-year period.
| | | | |
| 38 | | Wells Fargo Advantage California Municipal Money Market Fund | | List of Abbreviations |
The following is a list of common abbreviations for terms and entities which may have appeared in this report.
| ABAG | — Association of Bay Area Governments |
| ACB | — Agricultural Credit Bank |
| ADR | — American Depositary Receipt |
| ADS | — American Depository Shares |
| AGC-ICC | — Assured Guaranty Corporation - Insured Custody Certificates |
| AGM | — Assured Guaranty Municipal |
| AMBAC | — American Municipal Bond Assurance Corporation |
| AMT | — Alternative Minimum Tax |
| ARM | — Adjustable Rate Mortgages |
| BAN | — Bond Anticipation Notes |
| BART | — Bay Area Rapid Transit |
| BHAC | — Berkshire Hathaway Assurance Corporation |
| CCAB | — Convertible Capital Appreciation Bond |
| CDA | — Community Development Authority |
| CDO | — Collateralized Debt Obligation |
| CDSC | — Contingent Deferred Sales Charge |
| CGIC | — Capital Guaranty Insurance Company |
| CGY | — Capital Guaranty Corporation |
| CIFG | — CDC (Caisse des Dépôts et Consignations) IX IS Financial Guarantee |
| COP | — Certificate of Participation |
| DRIVER | — Derivative Inverse Tax-Exempt Receipts |
| DW&P | — Department of Water & Power |
| DWR | — Department of Water Resources |
| ECFA | — Educational & Cultural Facilities Authority |
| EDFA | — Economic Development Finance Authority |
| ETET | — Eagle Tax-Exempt Trust |
| ETF | — Exchange-Traded Fund |
| FFCB | — Federal Farm Credit Bank |
| FGIC | — Financial Guaranty Insurance Corporation |
| FHA | — Federal Housing Authority |
| FHAG | — Federal Housing Agency |
| FHLB | — Federal Home Loan Bank |
| FHLMC | — Federal Home Loan Mortgage Corporation |
| FNMA | — Federal National Mortgage Association |
| GDR | — Global Depositary Receipt |
| GNMA | — Government National Mortgage Association |
| HCFR | — Healthcare Facilities Revenue |
| HEFA | — Health & Educational Facilities Authority |
| HEFAR | — Higher Education Facilities Authority Revenue |
| HFA | — Housing Finance Authority |
| HFFA | — Health Facilities Financing Authority |
| HUD | — Housing & Urban Development |
| IBC | — Insured Bond Certificate |
| IDA | — Industrial Development Authority |
| IDAG | — Industrial Development Agency |
| IDR | — Industrial Development Revenue |
| KRW | — Republic of Korea Won |
| LIBOR | — London Interbank Offered Rate |
| LLC | — Limited Liability Company |
| LLP | — Limited Liability Partnership |
| MBIA | — Municipal Bond Insurance Association |
| MFHR | — Multi-Family Housing Revenue |
| MFMR | — Multi-Family Mortgage Revenue |
| MMD | — Municipal Market Data |
| MSTR | — Municipal Securities Trust Receipts |
| MUD | — Municipal Utility District |
| NATL-RE | — National Public Finance Guarantee Corporation |
| PCFA | — Pollution Control Finance Authority |
| PCR | — Pollution Control Revenue |
| PFA | — Public Finance Authority |
| PFFA | — Public Facilities Financing Authority |
| PFOTER | — Puttable Floating Option Tax-Exempt Receipts |
| plc | — Public Limited Company |
| PSFG | — Public School Fund Guaranty |
| PUTTER | — Puttable Tax-Exempt Receipts |
| R&D | — Research & Development |
| RDA | — Redevelopment Authority |
| RDFA | — Redevelopment Finance Authority |
| REIT | — Real Estate Investment Trust |
| RIB | — Residual Interest Bond |
| ROC | — Reset Option Certificates |
| SAVRS | — Select Auction Variable Rate Securities |
| SFHR | — Single Family Housing Revenue |
| SFMR | — Single Family Mortgage Revenue |
| SLMA | — Student Loan Marketing Association |
| SPDR | — Standard & Poor’s Depositary Receipts |
| STIT | — Short-Term Investment Trust |
| TAN | — Tax Anticipation Notes |
| TIPS | — Treasury Inflation-Protected Securities |
| TRAN | — Tax Revenue Anticipation Notes |
| TCR | — Transferable Custody Receipts |
| TTFA | — Transportation Trust Fund Authority |
| USD | — Unified School District |
| XLCA | — XL Capital Assurance |


FOR MORE INFORMATION
More information about Wells Fargo Advantage Funds is available free upon request. To obtain literature, please write, e-mail, visit the Funds’ Web site, or call:
Wells Fargo Advantage Funds
P.O. Box 8266
Boston, MA 02266-8266
E-mail: wfaf@wellsfargo.com
Web site: www.wellsfargo.com/advantagefunds
Individual investors: 1-800-222-8222
Retail investment professionals: 1-888-877-9275
Institutional investment professionals: 1-866-765-0778
This report and the financial statements contained herein are submitted for the general information of the shareholders of Wells Fargo Advantage Funds. If this report is used for promotional purposes, distribution of the report must be accompanied or preceded by a current prospectus. For a prospectus containing more complete information, including charges and expenses, call 1-800-222-8222 or visit the Funds’ Web site at www.wellsfargo.com/advantagefunds. Please consider the investment objectives, risks, charges, and expenses of the investment carefully before investing. This and other information about Wells Fargo Advantage Funds can be found in the current prospectus. Read the prospectus carefully before you invest or send money.
Wells Fargo Funds Management, LLC, a wholly owned subsidiary of Wells Fargo & Company, provides investment advisory and administrative services for Wells Fargo Advantage Funds. Other affiliates of Wells Fargo & Company provide subadvisory and other services for the Funds. The Funds are distributed by Wells Fargo Funds Distributor, LLC, Member FINRA/SIPC, an affiliate of Wells Fargo & Company.
NOT FDIC INSURED ¡ NO BANK GUARANTEE ¡ MAY LOSE VALUE
© 2011 Wells Fargo Funds Management, LLC. All rights reserved.
| | |
 | | 204797 09-11 SA301/SAR301 7-11 |

Wells Fargo Advantage
Cash Investment Money Market Fund

Semi-Annual Report
July 31, 2011

Reduce clutter. Save trees.
Sign up for electronic delivery of prospectuses and shareholder reports at www.wellsfargo.com/advantagedelivery
Contents
The views expressed and any forward-looking statements are as of July 31, 2011, unless otherwise noted and are those of the Fund managers and/or Wells Fargo Funds Management, LLC. Discussions of individual securities, or the markets generally, or any Wells Fargo Advantage Fund are not intended as individual recommendations. Future events or results may vary significantly from those expressed in any forward-looking statements; the views expressed are subject to change at any time in response to changing circumstances in the market. Wells Fargo Funds Management, LLC, disclaims any obligation to publicly update or revise any views expressed or forward-looking statements.
NOT FDIC INSURED ¡ NO BANK GUARANTEE ¡ MAY LOSE VALUE

WELLS FARGO INVESTMENT HISTORY
| | |
| |
| 1932 | | Keystone creates one of the first mutual fund families. |
| |
| 1971 | | Wells Fargo & Company introduces one of the first institutional index funds. |
| |
| 1978 | | Wells Fargo applies Markowitz and Sharpe’s research on Modern Portfolio Theory to introduce one of the industry’s first Tactical Asset Allocation (TAA) models in institutional separately managed accounts. |
| |
| 1984 | | Wells Fargo Stagecoach Funds launches its first asset allocation fund. |
| |
| 1989 | | The Tactical Asset Allocation (TAA) Model is first applied to Wells Fargo’s asset allocation mutual funds. |
| |
| 1994 | | Wells Fargo introduces the LifePath Funds, one of the first suites of target date funds (now the Wells Fargo Advantage Dow Jones Target Date FundsSM ). |
| |
| 1996 | | Evergreen Investments and Keystone Funds merge. |
| |
| 1997 | | Wells Fargo launches Wells Fargo Advantage WealthBuilder PortfoliosSM, a fund-of-funds suite of products that includes the use of quantitative models to shift assets among investment styles. |
| |
| 1999 | | Norwest Advantage Funds and Stagecoach Funds are reorganized into Wells Fargo Funds after the merger of Norwest and Wells Fargo. |
| |
| 2002 | | Evergreen Retail and Evergreen Institutional companies form the umbrella asset management company, Evergreen Investments. |
| |
| 2005 | | The integration of Strong Funds with Wells Fargo Funds creates Wells Fargo Advantage Funds, resulting in one of the top 20 mutual fund companies in the United States. |
| |
| 2006 | | Wells Fargo Advantage Funds relaunches the target date product line as Wells Fargo Advantage Dow Jones Target Date Funds. |
| |
| 2010 | | The mergers and reorganizations of Evergreen and Wells Fargo Advantage mutual funds are completed, unifying the families under the brand of Wells Fargo Advantage Funds. |
Wells Fargo Advantage Funds®
Wells Fargo Advantage Funds skillfully guides institutions, financial advisors, and individuals through the investment terrain to help them reach their financial objectives. Everything we do on behalf of investors is backed by our unique combination of qualifications.
Strength
Our organization is built on the standards of integrity and service established by our parent company—Wells Fargo & Company—more than 150 years ago. And, because we’re part of a highly diversified financial enterprise, we offer the depth of resources to help investors succeed.
Expertise
Our multi-boutique model offers investors access to the independent thinking of premier investment managers that have been chosen for their time-tested strategies. While each team specializes in a specific investment strategy, collectively they provide investors a wide choice of distinct investment styles. Our dedication to investment excellence doesn’t end with our expertise in manager selection—risk management, analysis, and rigorous ongoing review seek to ensure each manager’s investment process remains consistent.
Partnership
Our collaborative approach is built around understanding the needs and goals of our clients. By adhering to core principles of sound judgment and steady guidance, we support you through every stage of the investment decision process.
Carefully consider the investment objectives, risks, charges, and expenses before investing. For a current prospectus for Wells Fargo Advantage Funds containing this and other information, visit wellsfargo.com/advantagefunds. Read it carefully before investing.
Wells Fargo Funds Management, LLC, a wholly owned subsidiary of Wells Fargo & Company, provides investment advisory and administrative services for Wells Fargo Advantage Funds®. Other affiliates of Wells Fargo & Company provide subadvisory and other services for the Funds. The Funds are distributed by Wells Fargo Funds Distributor, LLC, Member FINRA/SIPC, an affiliate of Wells Fargo & Company.
The “Dow Jones Target Date Indexes” are a product of Dow Jones Indexes, a licensed trademark of CME Group Index Services LLC (“CME”). “Dow Jones” and “Dow Jones Target Date Indexes” are service marks of Dow Jones Trademark Holdings, LLC, and have been licensed for use for certain purposes by CME and sublicensed for use by Global Index Advisors, Inc., and Wells Fargo Funds Management, LLC. The Dow Jones Target Date Indexes are based in part on the Barclays Capital Bond Indexes, which are published by Barclays Capital Inc. The Wells Fargo Advantage Dow Jones Target Date Funds, based on the Dow Jones Target Date Indexes, are not sponsored, endorsed, sold, or promoted by Dow Jones, CME or Barclays Capital or any of their respective affiliates, and neither Dow Jones, CME nor Barclays Capital nor any of their respective affiliates makes any representation regarding the advisability of investing in such product(s) and/or about the quality, accuracy, and/or completeness of the Dow Jones Target Date Indexes or the Barclays Capital Bond Indexes. IN NO EVENT SHALL DOW JONES, CME, BARCLAYS CAPITAL, OR ANY OF THEIR LICENSORS HAVE ANY LIABILITY IN CONNECTION WITH THE Wells Fargo Advantage Dow Jones Target Date Funds INCLUDING, WITHOUT LIMITATION, FOR ANY SPECIAL, PUNITIVE, IN DIRECT, OR CONSEQUENTIAL DAMAGES (INCLUDING LOST PROFITS), EVEN IF NOTIFIED OF THE POSSIBILITY OF SUCH DAMAGES.
NOT FDIC INSURED ¡ NO BANK GUARANTEE ¡ MAY LOSE VALUE
Not part of the semi-annual report.
Wells Fargo Advantage Funds offers more than 110 mutual funds across a wide range of asset classes, representing over $221 billion in assets under management, as of July 31, 2011.
| | | | |
| Equity Funds | | | | |
Asia Pacific Fund | | Global Opportunities Fund | | Premier Large Company Growth Fund |
C&B Large Cap Value Fund | | Growth Fund | | Small Cap Opportunities Fund |
C&B Mid Cap Value Fund | | Health Care Fund | | Small Cap Value Fund |
Capital Growth Fund | | Index Fund | | Small Company Growth Fund |
Common Stock Fund | | International Equity Fund | | Small Company Value Fund |
Disciplined U.S. Core Fund | | International Value Fund | | Small/Mid Cap Core Fund |
Discovery Fund† | | Intrinsic Small Cap Value Fund | | Small/Mid Cap Value Fund |
Diversified Equity Fund | | Intrinsic Value Fund | | Social Sustainability Fund† |
Diversified International Fund | | Intrinsic World Equity Fund | | Special Mid Cap Value Fund |
Diversified Small Cap Fund | | Large Cap Core Fund | | Special Small Cap Value Fund |
Emerging Growth Fund | | Large Cap Growth Fund | | Specialized Technology Fund |
Emerging Markets Equity Fund | | Large Company Value Fund | | Strategic Large Cap Growth Fund |
Endeavor Select Fund† | | Omega Growth Fund | | Traditional Small Cap Growth Fund |
Enterprise Fund† | | Opportunity Fund† | | Utility and Telecommunications Fund |
Equity Value Fund | | Precious Metals Fund | | |
| Bond Funds | | | | |
Adjustable Rate Government Fund | | Inflation-Protected Bond Fund | | Short-Term Bond Fund |
California Limited-Term Tax-Free Fund | | Intermediate Tax/AMT-Free Fund | | Short-Term High Yield Bond Fund |
California Tax-Free Fund | | International Bond Fund | | Short-Term Municipal Bond Fund |
Colorado Tax-Free Fund | | Minnesota Tax-Free Fund | | Strategic Municipal Bond Fund |
Government Securities Fund | | Municipal Bond Fund | | Total Return Bond Fund |
High Income Fund | | North Carolina Tax-Free Fund | | Ultra Short-Term Income Fund |
High Yield Bond Fund | | Pennsylvania Tax-Free Fund | | Ultra Short-Term Municipal Income Fund |
Income Plus Fund | | Short Duration Government Bond Fund | | Wisconsin Tax-Free Fund |
| Asset Allocation Funds | | | | |
Asset Allocation Fund | | WealthBuilder Equity Portfolio† | | Target 2020 Fund† |
Conservative Allocation Fund | | WealthBuilder Growth Allocation Portfolio† | | Target 2025 Fund† |
Diversified Capital Builder Fund | | WealthBuilder Growth Balanced Portfolio† | | Target 2030 Fund† |
Diversified Income Builder Fund | | WealthBuilder Moderate Balanced Portfolio† | | Target 2035 Fund† |
Growth Balanced Fund | | WealthBuilder Tactical Equity Portfolio† | | Target 2040 Fund† |
Index Asset Allocation Fund | | Target Today Fund† | | Target 2045 Fund† |
Moderate Balanced Fund | | Target 2010 Fund† | | Target 2050 Fund† |
WealthBuilder Conservative Allocation Portfolio† | | Target 2015 Fund† | | Target 2055 Fund† |
| Money Market Funds | | | | |
100% Treasury Money Market Fund | | Minnesota Money Market Fund | | New Jersey Municipal Money Market Fund |
California Municipal Money Market Fund | | Money Market Fund | | New York Municipal Money Market Fund |
Cash Investment Money Market Fund | | Municipal Cash Management Money Market Fund | | Pennsylvania Municipal Money Market Fund |
Government Money Market Fund | | Municipal Money Market Fund | | Prime Investment Money Market Fund |
Heritage Money Market Fund† | | National Tax-Free Money Market Fund | | Treasury Plus Money Market Fund |
| Variable Trust Funds1 | | | | |
VT Discovery Fund† | | VT Intrinsic Value Fund | | VT Small Cap Growth Fund |
VT Index Asset Allocation Fund | | VT Omega Growth Fund | | VT Small Cap Value Fund |
VT International Equity Fund | | VT Opportunity Fund† | | VT Total Return Bond Fund |
An investment in a money market fund is not insured or guaranteed by the Federal Deposit Insurance Corporation or any other government agency. Although the Wells Fargo Advantage Money Market Funds seek to preserve the value of your investment at $1.00 per share, it is possible to lose money by investing in a money market fund.
| 1. | The Variable Trust Funds are generally available only through insurance company variable contracts. |
| † | In this report, the Wells Fargo Advantage Discovery FundSM, Wells Fargo Advantage Endeavor Select FundSM, Wells Fargo Advantage Enterprise FundSM, Wells Fargo Advantage Opportunity FundSM, Wells Fargo Advantage Social Sustainability FundSM, Wells Fargo Advantage WealthBuilder Conservative Allocation PortfolioSM, Wells Fargo Advantage WealthBuilder Equity PortfolioSM , Wells Fargo Advantage WealthBuilder Growth Allocation PortfolioSM, Wells Fargo Advantage WealthBuilder Growth Balanced PortfolioSM, Wells Fargo Advantage WealthBuilder Moderate Balanced PortfolioSM, Wells Fargo Advantage WealthBuilder Tactical Equity PortfolioSM , Wells Fargo Advantage Dow Jones Target Today FundSM, Wells Fargo Advantage Dow Jones Target 2010 FundSM, Wells Fargo Advantage Dow Jones Target 2015 FundSM, Wells Fargo Advantage Dow Jones Target 2020 FundSM, Wells Fargo Advantage Dow Jones Target 2025 FundSM, Wells Fargo Advantage Dow Jones Target 2030 FundSM , Wells Fargo Advantage Dow Jones Target 2035 FundSM, Wells Fargo Advantage Dow Jones Target 2040 FundSM, Wells Fargo Advantage Dow Jones Target 2045 FundSM, Wells Fargo Advantage Dow Jones Target 2050 FundSM, Wells Fargo Advantage Dow Jones Target 2055 FundSM, Wells Fargo Advantage Heritage Money Market FundSM, Wells Fargo Advantage VT Discovery FundSM, and Wells Fargo Advantage VT Opportunity FundSM are referred to as the Discovery Fund, Endeavor Select Fund, Enterprise Fund, Opportunity Fund, Social Sustainability Fund, WealthBuilder Conservative Allocation Portfolio, WealthBuilder Equity Portfolio, WealthBuilder Growth Allocation Portfolio, WealthBuilder Growth Balanced Portfolio, WealthBuilder Moderate Balanced Portfolio, WealthBuilder Tactical Equity Portfolio, Target Today Fund, Target 2010 Fund, Target 2015 Fund, Target 2020 Fund, Target 2025 Fund, Target 2030 Fund, Target 2035 Fund, Target 2040 Fund, Target 2045 Fund, Target 2050 Fund, Target 2055 Fund, Heritage Money Market Fund, VT Discovery Fund, and VT Opportunity Fund, respectively. |
Not part of the semi-annual report.
| | | | |
| 2 | | Wells Fargo Advantage Cash Investment Money Market Fund | | Letter to Shareholders |

Karla M. Rabusch,
President
Wells Fargo Advantage Funds
Dear Valued Shareholder,
We’re pleased to offer you this semi-annual report for the Wells Fargo Advantage Cash Investment Money Market Fund for the six-month period that ended July 31, 2011. Upon reviewing the report, you may notice a few changes from past reports, the most significant of which is the change from a multi-fund report to a single-fund report. We believe this change will give you more convenient access to your fund data.
The period began modestly as improving economic optimism generally shifted investors toward equities and riskier assets and away from U.S. Treasuries and lower-yielding fixed-income securities. Returns from fixed income were modest in the opening months of 2011 but were generally still positive as U.S. Treasury yields incrementally climbed higher. But after the slow start, bond prices once again strongly improved, sparked by a sharp decline in U.S. Treasury prices in April that carried into May. Late in the period, lower-rated bonds declined in price more than the higher credit-quality tiers but not enough to outweigh the stronger performance from lower-rated securities during the period. Lower-quality and longer-maturity fixed-income securities generally outperformed higher-quality and shorter-maturity securities over the full period.
The activity within the broader bond market also resonated with money market participants. As the economic and credit environment reverberated from the ongoing sovereign debt concerns and softening economic data, many participants continued to balance a need for stability and desire for higher yields. The result has been good demand for domestic commercial paper and certificate of deposits. Also, in spite of all the discussion about sovereign debt, many money market participants continue to maintain some exposures to foreign banks based on the quality of their fundamentals. By focusing more on the fundamentals and taking a more selective approach to the short-term security market helped the markets avoid the severe yield volatility or significant flight-to-quality experienced during the spring of 2010, when the Greek sovereign debt crisis first emerged.
The global economic “recovery” hit a snag, but the end of 2011 could regain momentum.
The U.S. economic recovery that began in mid-2009 and gained further momentum throughout 2010, particularly during the fourth quarter, has failed to maintain that level of growth through the first seven months of 2011. For example, gross domestic product (GDP), the broadest measure of economic activity, grew at an annualized rate of 3.1% in the fourth quarter of 2010, only to slow dramatically during the first quarter of 2011. The latest revision to first-quarter GDP data during the period indicated that the economy grew at an annualized rate of 0.4% during the first quarter of 2011. While still positive, it’s a much slower pace of growth than experienced in the second half of 2010 and notably lower than consensus forecasts. Nevertheless, the advance estimate of second-quarter 2011 GDP, which was released on July 29, 2011, was 1.3%, suggesting that the U.S. economy continues to expand, though at a slow and uneven pace.
Jobs and housing remained troublesome.
The July 2011 unemployment rate in the U.S. was reported at 9.1%, down from 9.5% a year earlier but still notably higher than historical averages. Unfortunately,
| | | | | | |
| Letter to Shareholders | | Wells Fargo Advantage Cash Investment Money Market Fund | | | 3 | |
the drop may be more attributable to a decline in the labor force than to a meaningful uptick in hiring. The level of job creation in 2011 has been trending below historical averages, suggesting that the improving economy has yet to translate into widespread hiring. Meanwhile, the beleaguered housing market was an ongoing source of concern, despite some tentative late-year signs of stabilization. That said, persistent weakness in the labor and housing markets bears close watching in the months ahead.
Other economic data in the U.S. has been more encouraging, reflecting greater confidence in the sustainability of the expansion on the part of both consumers and businesses. Retail sales came in strong at certain points during the period and industrial production and new orders have picked up. Although still reluctant to hire, businesses have gradually increased spending in other areas, such as equipment and information technology. Core inflation, which excludes volatile food and energy prices, remained benign.
The Federal Reserve believes the economic recovery will accelerate in future quarters.
With inflation subdued, the Federal Open Market Committee (FOMC) held its target range for the federal funds rate—a proxy for short-term interest rates—steady at 0.00% to 0.25%. On June 22, 2011, in its final statement of the six-month period, the Fed reiterated that the economic recovery “is proceeding at a moderate pace,” but that “recent labor market indicators have been weaker than anticipated.” It described the recent increase in inflation as temporary, suggesting that inflation pressures will ease going forward. While the FOMC explained that it “expects the pace of recovery to pick up over coming quarters,” it indicated that the federal funds rate will remain at an exceptionally low level for as long as necessary to ensure a sustainable recovery and expansion.
As recent headwinds subside, it is reasonable to expect markets to regain focus.
Now that it appears the debt ceiling has been increased and a U.S. default will be averted, money market participants and the broader bond market can get back to more fundamental and lasting concerns-chiefly, the economy. After avoiding short-term Treasuries in late July 2011, ahead of pending U.S. debt ceiling deadline, money market participants have returned to the U.S. short-term markets1. Economic indicators released in the second half of 2011 might not be as soft as those reported during the first half of the year. While that would not mean that the economy is robust, it might remind the markets that the first half of the slowdown was transitory. Most indicators still point toward real GDP growth in the 2% to 3% range in the second half of 2011. While that is not enough to produce big employment gains, it might be sufficient to cause Treasury yields to retrace some of the late-July declines.
Don’t let short-term uncertainty derail long-term investment goals.
While periods of uncertainty can present challenges, experience has taught us that maintaining a long-term investment strategy based on individual goals and risk tolerance can be an effective way to plan for the future. As a whole, Wells Fargo Advantage Funds represents investments across a broad range of asset classes and investment styles with more than 110 mutual funds, giving you an
| 1. | Comments expressed that do not fall within the reporting period are as of August 2, 2011. |
While the FOMC explained that it “expects the pace of recovery to pick up over coming quarters,” it indicated that the federal funds rate will remain at an exceptionally low level for as long as necessary to ensure a sustainable recovery and expansion.
Economic indicators released in the second half of 2011 might not be as soft as those reported during the first half of the year. While that would not mean that the economy is robust, it might remind the markets that the first half of the slowdown was transitory.
| | | | |
| 4 | | Wells Fargo Advantage Cash Investment Money Market Fund | | Letter to Shareholders |
opportunity to create a diversified investment portfolio. While diversification may not prevent losses in a downturn, it may help to reduce them and provide you with one way of managing risk.
In our opinion, diligent and earnest assessment of the fundamental characteristics of money market eligible securities will be a key differentiating factor between which investment strategies meet client expectations and which do not. At Wells Fargo Advantage Funds, we intend to continue the emphasis of principal preservation and high liquidity across our lineup of Wells Fargo Advantage Money Market Funds. In changing markets, we believe it is particularly important to have diligent investment analysts in charge of investor assets.
Thank you for choosing Wells Fargo Advantage Funds. We appreciate your confidence in us and are committed to helping you meet your financial needs. If you have any questions about your investments, please contact your investment professional, call us at 1-800-222-8222, or visit www.wellsfargo.com/advantagefunds.
Sincerely,

Karla M. Rabusch
President
Wells Fargo Advantage Funds
| | | | | | |
| Performance Highlights (Unaudited) | | Wells Fargo Advantage Cash Investment Money Market Fund | | | 5 | |
INVESTMENT OBJECTIVE
The Fund seeks current income, while preserving capital and liquidity.
ADVISER
Wells Fargo Funds Management, LLC
SUB-ADVISER
Wells Capital Management Incorporated
PORTFOLIO MANAGERS
David D. Sylvester
Laurie White
FUND INCEPTION
October 14, 1987
|
PORTFOLIO COMPOSITION1
(AS OF JULY 31, 2011) |
|
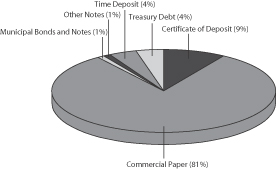 |
|
EFFECTIVE MATURITY DISTRIBUTION1 (AS OF JULY 31, 2011) |
|
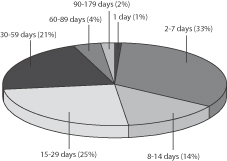 |
| | |
WEIGHTED AVERAGE MATURITY2 (AS OF JULY 31, 2011) |
23 Days |
| | |
WEIGHTED AVERAGE FINAL MATURITY3 (AS OF JULY 31, 2011) |
34 Days |
| 1. | Portfolio composition and effective maturity distribution are subject to change and are calculated based on the total investments of the Fund. Effective maturity distribution is based on the weighted average maturity of each security. |
| 2. | Weighted Average Maturity (WAM): WAM calculates an average time to maturity of all of the securities held in the portfolio, weighted by each security’s percentage of net assets. The calculation takes into account the final maturity of a fixed-income security and the interest rate reset date for floating-rate securities held in the portfolio. This is a way to measure a fund’s sensitivity to potential interest rate changes. |
| 3. | Weighted Average Final Maturity (WAFM): WAFM calculates a fund’s average time to maturity for all of the securities held in the portfolio, weighted to their percentage of assets in the Fund. In contrast to WAM, the WAFM calculation takes into account the final maturity date for each security held in the portfolio. This is a way to measure a fund’s potential sensitivity to credit spread changes. |
| | | | |
| 6 | | Wells Fargo Advantage Cash Investment Money Market Fund | | Performance Highlights (Unaudited) |
AVERAGE ANNUAL TOTAL RETURN4 (%) (AS OF JULY 31, 2011)
| | | | | | | | | | | | | | | | | | | | | | | | | | | | |
| | | | | | | | | | | | | | | | | | Expense Ratios5 | |
| | | Inception Date | | | 6 Months* | | | 1 Year | | | 5 Year | | | 10 Year | | | Gross | | | Net6 | |
Administrator Class (WFAXX) | | | 07/31/2003 | | | | 0.00 | | | | 0.02 | | | | 2.05 | | | | 2.05 | | | | 0.35% | | | | 0.35% | |
Institutional Class (WFIXX) | | | 10/14/1987 | | | | 0.04 | | | | 0.12 | | | | 2.18 | | | | 2.20 | | | | 0.23% | | | | 0.20% | |
Select Class (WFQXX) | | | 06/29/2007 | | | | 0.07 | | | | 0.19 | | | | 2.23 | | | | 2.23 | | | | 0.19% | | | | 0.13% | |
Service Class (NWIXX) | | | 10/14/1987 | | | | 0.00 | | | | 0.01 | | | | 1.94 | | | | 1.94 | | | | 0.52% | | | | 0.50% | |
| * | Returns for periods of less than one year are not annualized. |
| | | | | | | | | | | | | | | | |
FUND YIELD SUMMARY6 (AS OF JULY 31, 2011) | | Administrator Class | | | Institutional Class | | | Select Class | | | Service Class | |
7-Day Current Yield | | | 0.01% | | | | 0.02% | | | | 0.09% | | | | 0.01% | |
7-Day Compound Yield | | | 0.01% | | | | 0.02% | | | | 0.09% | | | | 0.01% | |
30-Day Simple Yield | | | 0.01% | | | | 0.02% | | | | 0.09% | | | | 0.01% | |
30-Day Compound Yield | | | 0.01% | | | | 0.02% | | | | 0.09% | | | | 0.01% | |
Figures quoted represent past performance, which is no guarantee of future results and do not reflect the deduction of taxes that a shareholder may pay on fund distributions or the redemption of fund shares. Investment returns will fluctuate. The Fund’s yield figures more closely reflect the current earnings of the Fund than the total return figures. Current performance may be lower or higher than the performance data quoted. Current month-end performance is available at the Fund’s Web site – www.wellsfargo.com/advantagefunds.
Each class is sold without a front-end sales charge or contingent deferred sales charge. Other fees and expenses apply to an investment in the Fund and are described in the Fund’s current prospectus.
An investment in a money market fund is not insured or guaranteed by the Federal Deposit Insurance Corporation or any other government agency. Although the Fund seeks to preserve the value of your investment at $1.00 per share, it is possible to lose money by investing in a money market fund.
| 4. | Historical performance shown for the Administrator Class shares prior to their inception reflects the performance of the Service Class shares, and includes the higher expenses applicable to the Service Class shares. If these expenses had not been included, returns would be higher. Historical performance shown for the Select Class shares prior to their inception reflects the performance of the Institutional Class shares, and includes the higher expenses applicable to Institutional Class shares. If these expenses had not been included, returns would be higher. |
| 5. | Reflects the expense ratios as stated in the most recent prospectuses. |
| 6. | The Adviser has committed through May 31, 2012 to waive fees and/or reimburse expenses to the extent necessary to cap the Fund’s Total Annual Fund Operating Expenses After Fee Waiver, excluding certain expenses, at the amount shown above. Without this cap, the Fund’s returns would have been lower. Without waived fees and/or reimbursed expenses, the Fund’s 7-day current yield would have been (0.13)%, (0.01)%, 0.03% and (0.30)% for Administrator Class, Institutional Class, Select Class and Service Class, respectively. |
| | | | | | |
| Fund Expenses | | Wells Fargo Advantage Cash Investment Money Market Fund | | | 7 | |
As a shareholder of the Fund, you incur two types of costs: (1) transaction costs and (2) ongoing costs, including management fees; shareholder service fees; and other Fund expenses. This example is intended to help you understand your ongoing costs (in dollars) of investing in the Fund and to compare these costs with the ongoing costs of investing in other mutual funds.
The example is based on an investment of $1,000 invested at the beginning of the six-month period and held for the entire period from February 1, 2011 to July 31, 2011.
Actual Expenses
The “Actual” line of the table below provides information about actual account values and actual expenses. You may use the information in this line, together with the amount you invested, to estimate the expenses that you paid over the period. Simply divide your account value by $1,000 (for example, an $8,600 account value divided by $1,000 = 8.6), then multiply the result by the number in the “Actual” line under the heading entitled “Expenses Paid During Period” for your applicable class of shares to estimate the expenses you paid on your account during this period.
Hypothetical Example for Comparison Purposes
The “Hypothetical” line of the table below provides information about hypothetical account values and hypothetical expenses based on the Fund’s actual expense ratio and an assumed rate of return of 5% per year before expenses, which is not the Fund’s actual return. The hypothetical account values and expenses may not be used to estimate the actual ending account balance or expenses you paid for the period. You may use this information to compare the ongoing costs of investing in the Fund and other funds. To do so, compare this 5% hypothetical example with the 5% hypothetical examples that appear in the shareholder reports of the other funds.
Please note that the expenses shown in the table are meant to highlight your ongoing costs only and do not reflect any transactional costs. Therefore, the “Hypothetical” line of the table is useful in comparing ongoing costs only, and will not help you determine the relative total costs of owning different funds. In addition, if these transactional costs were included, your costs would have been higher.
| | | | | | | | | | | | | | | | |
| | | Beginning
Account Value
02-01-2011 | | | Ending
Account Value
07-31-2011 | | | Expenses
Paid During
the Period1 | | | Net Annual
Expense Ratio | |
Administrator Class | | | | | | | | | | | | | | | | |
Actual | | $ | 1,000.00 | | | $ | 1,000.05 | | | $ | 1.34 | | | | 0.27 | % |
Hypothetical (5% return before expenses) | | $ | 1,000.00 | | | $ | 1,023.46 | | | $ | 1.35 | | | | 0.27 | % |
Institutional Class | | | | | | | | | | | | | | | | |
Actual | | $ | 1,000.00 | | | $ | 1,000.37 | | | $ | 0.99 | | | | 0.20 | % |
Hypothetical (5% return before expenses) | | $ | 1,000.00 | | | $ | 1,023.80 | | | $ | 1.00 | | | | 0.20 | % |
Select Class | | | | | | | | | | | | | | | | |
Actual | | $ | 1,000.00 | | | $ | 1,000.72 | | | $ | 0.64 | | | | 0.13 | % |
Hypothetical (5% return before expenses) | | $ | 1,000.00 | | | $ | 1,024.15 | | | $ | 0.65 | | | | 0.13 | % |
Service Class | | | | | | | | | | | | | | | | |
Actual | | $ | 1,000.00 | | | $ | 1,000.05 | | | $ | 1.29 | | | | 0.26 | % |
Hypothetical (5% return before expenses) | | $ | 1,000.00 | | | $ | 1,023.51 | | | $ | 1.30 | | | | 0.26 | % |
| 1. | Expenses paid is equal to the annualized expense ratio of each class multiplied by the average account value over the period, multiplied by the number of days in the most recent fiscal half-year divided by the number of days in the fiscal year (to reflect the one-half year period). |
| | | | |
| 8 | | Wells Fargo Advantage Cash Investment Money Market Fund | | Portfolio of Investments—July 31, 2011 (Unaudited) |
| | | | | | | | | | | | | | | | |
| Security Name | | Interest Rate | | | Maturity Date | | | Principal | | | Value | |
| | | | | | | | | | | | | | | | |
| | | | | | | | | | | | | | | | |
| | | | |
Certificates of Deposit: 19.93% | | | | | | | | | | | | | | | | |
Bank of Montreal | | | 0.11 | % | | | 08/23/2011 | | | $ | 50,000,000 | | | $ | 50,000,000 | |
Bank of Montreal | | | 0.12 | | | | 08/24/2011 | | | | 75,000,000 | | | | 75,000,000 | |
Bank of Montreal | | | 0.12 | | | | 08/26/2011 | | | | 80,000,000 | | | | 80,000,000 | |
Bank of Nova Scotia± | | | 0.22 | | | | 08/09/2011 | | | | 30,000,000 | | | | 30,000,000 | |
Barclays Bank plc (New York)± | | | 0.74 | | | | 08/12/2011 | | | | 105,000,000 | | | | 105,000,000 | |
Barclays Bank plc (New York)± | | | 0.59 | | | | 04/16/2012 | | | | 49,000,000 | | | | 49,000,000 | |
Barclays Bank plc (New York)± | | | 0.65 | | | | 01/17/2012 | | | | 50,000,000 | | | | 50,000,000 | |
Barclays Bank plc (New York)± | | | 0.69 | | | | 10/24/2011 | | | | 49,000,000 | | | | 49,000,000 | |
BNP Paribas | | | 0.13 | | | | 08/01/2011 | | | | 128,550,000 | | | | 128,550,000 | |
Credit Agricole | | | 0.16 | | | | 08/01/2011 | | | | 76,000,000 | | | | 76,000,000 | |
Credit Agricole | | | 0.23 | | | | 08/12/2011 | | | | 44,000,000 | | | | 44,000,000 | |
Credit Agricole | | | 0.23 | | | | 08/15/2011 | | | | 69,000,000 | | | | 69,000,000 | |
Credit Industriel et Commercial | | | 0.11 | | | | 08/01/2011 | | | | 43,000,000 | | | | 43,000,000 | |
Credit Suisse NY± | | | 0.25 | | | | 09/02/2011 | | | | 127,000,000 | | | | 127,000,975 | |
DG Bank NY Branch | | | 0.23 | | | | 08/15/2011 | | | | 162,000,000 | | | | 162,000,000 | |
National Bank of Canada± | | | 0.35 | | | | 09/21/2011 | | | | 82,000,000 | | | | 82,000,000 | |
National Bank of Canada± | | | 0.36 | | | | 10/07/2011 | | | | 133,000,000 | | | | 133,000,000 | |
Natixis Corporation± | | | 0.34 | | | | 08/15/2011 | | | | 30,000,000 | | | | 30,000,359 | |
Natixis NY Branch± | | | 0.50 | | | | 08/08/2011 | | | | 132,000,000 | | | | 132,000,000 | |
Nordea Bank Funding plc | | | 0.15 | | | | 09/14/2011 | | | | 64,000,000 | | | | 64,000,000 | |
Nordea Bank Funding plc | | | 0.15 | | | | 09/19/2011 | | | | 64,000,000 | | | | 64,000,000 | |
Norinchukin Bank | | | 0.15 | | | | 08/01/2011 | | | | 55,000,000 | | | | 55,000,000 | |
Norinchukin Bank | | | 0.15 | | | | 08/02/2011 | | | | 95,000,000 | | | | 95,000,000 | |
Rabobank Nederland NV± | | | 0.27 | | | | 12/06/2011 | | | | 70,000,000 | | | | 70,000,000 | |
Rabobank Nederland NV± | | | 0.27 | | | | 01/10/2012 | | | | 45,000,000 | | | | 45,000,000 | |
Rabobank Nederland NV | | | 0.27 | | | | 10/21/2011 | | | | 60,000,000 | | | | 60,000,000 | |
Rabobank Nederland NV | | | 0.28 | | | | 04/24/2012 | | | | 60,000,000 | | | | 59,997,772 | |
Rabobank Nederland NV± | | | 0.29 | | | | 08/08/2011 | | | | 46,200,000 | | | | 46,201,109 | |
Royal Bank of Scotland plc± | | | 0.46 | | | | 10/31/2011 | | | | 50,000,000 | | | | 50,000,000 | |
Royal Bank of Scotland plc± | | | 0.47 | | | | 09/13/2011 | | | | 105,000,000 | | | | 105,000,000 | |
Skandinaviska Enskilda Banken AB | | | 0.20 | | | | 09/15/2011 | | | | 41,000,000 | | | | 41,000,000 | |
Skandinaviska Enskilda Banken AB | | | 0.20 | | | | 09/19/2011 | | | | 71,000,000 | | | | 71,000,000 | |
Skandinaviska Enskilda Banken AB | | | 0.24 | | | | 09/01/2011 | | | | 64,000,000 | | | | 64,000,000 | |
Societe Generale (New York) | | | 0.51 | | | | 08/12/2011 | | | | 112,000,000 | | | | 112,000,000 | |
Sumitomo Trust & Banking Corporation | | | 0.14 | | | | 08/03/2011 | | | | 205,000,000 | | | | 205,000,000 | |
Sumitomo Trust & Banking Corporation | | | 0.15 | | | | 08/02/2011 | | | | 107,000,000 | | | | 107,000,000 | |
Sumitomo Trust & Banking Corporation | | | 0.15 | | | | 08/04/2011 | | | | 10,000,000 | | | | 10,000,000 | |
Toronto-Dominion Bank | | | 0.12 | | | | 08/19/2011 | | | | 90,000,000 | | | | 90,000,000 | |
Toronto-Dominion Bank | | | 0.12 | | | | 08/22/2011 | | | | 75,000,000 | | | | 75,000,000 | |
Toronto-Dominion Bank | | | 0.17 | | | | 08/02/2011 | | | | 75,000,000 | | | | 75,000,125 | |
Toronto-Dominion Bank± | | | 0.27 | | | | 01/12/2012 | | | | 30,000,000 | | | | 30,000,000 | |
| | | | |
Total Certificates of Deposit (Cost $3,108,750,340) | | | | | | | | | | | | | | | 3,108,750,340 | |
| | | | | | | | | | | | | | | | |
| | | | |
Commercial Paper: 51.36% | | | | | | | | | | | | | | | | |
| | | | |
| Asset-Backed Commercial Paper: 35.08% | | | | | | | | | | | | | | | | |
Alpine Securitzation Corporation††^ | | | 0.13 | | | | 08/19/2011 | | | | 92,000,000 | | | | 91,993,560 | |
Alpine Securitzation Corporation††^ | | | 0.13 | | | | 08/23/2011 | | | | 20,000,000 | | | | 19,998,289 | |
Alpine Securitzation Corporation††^ | | | 0.13 | | | | 08/26/2011 | | | | 51,447,000 | | | | 51,441,998 | |
Amsterdam Funding Corporation††^ | | | 0.15 | | | | 08/25/2011 | | | | 8,000,000 | | | | 7,999,147 | |
Amsterdam Funding Corporation††^ | | | 0.15 | | | | 08/30/2011 | | | | 32,000,000 | | | | 31,995,876 | |
Amsterdam Funding Corporation††^ | | | 0.22 | | | | 08/22/2011 | | | | 3,000,000 | | | | 2,999,598 | |
| | | | | | |
| Portfolio of Investments—July 31, 2011 (Unaudited) | | Wells Fargo Advantage Cash Investment Money Market Fund | | | 9 | |
| | | | | | | | | | | | | | | | |
| Security Name | | Interest Rate | | | Maturity Date | | | Principal | | | Value | |
| | | | | | | | | | | | | | | | |
| | | | |
| Asset-Backed Commercial Paper (continued) | | | | | | | | | | | | | | | | |
Antalis US Funding Corporation††^ | | | 0.00 | % | | | 08/01/2011 | | | $ | 100,000,000 | | | $ | 100,000,000 | |
Arabella Finance LLC††^ | | | 0.38 | | | | 08/08/2011 | | | | 55,000,000 | | | | 54,995,401 | |
Argento Funding Companies Limited††^ | | | 0.17 | | | | 08/24/2011 | | | | 65,000,000 | | | | 64,992,333 | |
Argento Funding Companies Limited††^ | | | 0.19 | | | | 08/04/2011 | | | | 3,000,000 | | | | 2,999,938 | |
Argento Funding Companies Limited††^ | | | 0.19 | | | | 08/05/2011 | | | | 20,000,000 | | | | 19,999,467 | |
Argento Funding Companies Limited††^ | | | 0.21 | | | | 09/07/2011 | | | | 32,000,000 | | | | 31,992,764 | |
Argento Funding Companies Limited††^ | | | 0.21 | | | | 09/09/2011 | | | | 25,000,000 | | | | 24,994,042 | |
Argento Funding Companies Limited††^ | | | 0.22 | | | | 08/11/2011 | | | | 15,000,000 | | | | 14,999,000 | |
Argento Funding Companies Limited††^ | | | 0.23 | | | | 08/09/2011 | | | | 30,000,000 | | | | 29,998,266 | |
Argento Funding Companies Limited††^ | | | 0.23 | | | | 08/17/2011 | | | | 30,000,000 | | | | 29,996,800 | |
Argento Funding Companies Limited††^ | | | 0.29 | | | | 08/08/2011 | | | | 15,000,000 | | | | 14,999,038 | |
Aspen Funding Corporation††^ | | | 0.16 | | | | 08/11/2011 | | | | 35,000,000 | | | | 34,998,250 | |
Atlantic Asset Securitization Corporation††^ | | | 0.11 | | | | 08/02/2011 | | | | 27,000,000 | | | | 26,999,835 | |
Autobahn Funding Company LLC††^ | | | 0.00 | | | | 08/01/2011 | | | | 22,000,000 | | | | 22,000,000 | |
Autobahn Funding Company LLC††^ | | | 0.27 | | | | 08/15/2011 | | | | 10,000,000 | | | | 9,998,872 | |
Bryant Park Funding LLC††^ | | | 0.14 | | | | 08/22/2011 | | | | 75,000,000 | | | | 74,993,438 | |
Bryant Park Funding LLC††^ | | | 0.14 | | | | 08/24/2011 | | | | 12,000,000 | | | | 11,998,850 | |
CAFCO LLC††^ | | | 0.17 | | | | 09/20/2011 | | | | 21,000,000 | | | | 20,995,042 | |
Cancara Asset Securitization LLC††^ | | | 0.15 | | | | 08/10/2011 | | | | 25,000,000 | | | | 24,998,938 | |
Cancara Asset Securitization LLC††^ | | | 0.16 | | | | 08/24/2011 | | | | 40,000,000 | | | | 39,995,656 | |
Cancara Asset Securitization LLC††^ | | | 0.18 | | | | 08/30/2011 | | | | 32,000,000 | | | | 31,995,102 | |
Cancara Asset Securitization LLC††^ | | | 0.20 | | | | 09/07/2011 | | | | 21,000,000 | | | | 20,995,468 | |
Cancara Asset Securitization LLC††^ | | | 0.20 | | | | 09/08/2011 | | | | 35,000,000 | | | | 34,992,242 | |
Cancara Asset Securitization LLC††^ | | | 0.21 | | | | 08/08/2011 | | | | 38,000,000 | | | | 37,998,227 | |
Cancara Asset Securitization LLC††^ | | | 0.21 | | | | 08/12/2011 | | | | 25,000,000 | | | | 24,998,243 | |
Cancara Asset Securitization LLC††^ | | | 0.21 | | | | 09/20/2011 | | | | 45,000,000 | | | | 44,986,875 | |
Cancara Asset Securitization LLC††^ | | | 0.25 | | | | 09/19/2011 | | | | 29,000,000 | | | | 28,990,132 | |
Chariot Funding LLC††^ | | | 0.12 | | | | 08/15/2011 | | | | 137,000,000 | | | | 136,992,880 | |
Chariot Funding LLC††^ | | | 0.12 | | | | 08/17/2011 | | | | 7,703,000 | | | | 7,702,555 | |
Chariot Funding LLC††^ | | | 0.14 | | | | 08/16/2011 | | | | 29,300,000 | | | | 29,298,169 | |
Charta LLC††^ | | | 0.19 | | | | 09/09/2011 | | | | 29,000,000 | | | | 28,994,031 | |
Charta LLC††^ | | | 0.25 | | | | 10/06/2011 | | | | 21,000,000 | | | | 20,990,375 | |
Ciesco LLC††^ | | | 0.19 | | | | 09/15/2011 | | | | 16,800,000 | | | | 16,795,940 | |
Concord Minuteman Capital Company††^ | | | 0.36 | | | | 08/09/2011 | | | | 49,000,000 | | | | 48,995,644 | |
Concord Minuteman Capital Company††^ | | | 0.38 | | | | 08/16/2011 | | | | 15,000,000 | | | | 14,997,500 | |
Concord Minuteman Capital Company††^ | | | 0.38 | | | | 08/17/2011 | | | | 35,000,000 | | | | 34,993,778 | |
Concord Minuteman Capital Company††^ | | | 0.39 | | | | 08/26/2011 | | | | 24,000,000 | | | | 23,993,333 | |
CRC Funding LLC††^ | | | 0.17 | | | | 09/19/2011 | | | | 14,000,000 | | | | 13,996,761 | |
Crown Point Capital Company††^ | | | 0.27 | | | | 08/03/2011 | | | | 45,000,000 | | | | 44,999,000 | |
Crown Point Capital Company††^ | | | 0.36 | | | | 08/10/2011 | | | | 44,000,000 | | | | 43,995,600 | |
Crown Point Capital Company††^ | | | 0.36 | | | | 08/11/2011 | | | | 21,000,000 | | | | 20,997,667 | |
Crown Point Capital Company††^ | | | 0.37 | | | | 08/12/2011 | | | | 39,000,000 | | | | 38,995,233 | |
Crown Point Capital Company††^ | | | 0.38 | | | | 08/17/2011 | | | | 35,000,000 | | | | 34,993,778 | |
Crown Point Capital Company††^ | | | 0.38 | | | | 08/18/2011 | | | | 31,000,000 | | | | 30,994,144 | |
Crown Point Capital Company††^ | | | 0.38 | | | | 08/19/2011 | | | | 15,000,000 | | | | 14,997,000 | |
Crown Point Capital Company††^ | | | 0.39 | | | | 08/26/2011 | | | | 10,000,000 | | | | 9,997,222 | |
Falcon Asset Securitization Corporation LLC††^ | | | 0.10 | | | | 08/05/2011 | | | | 42,000,000 | | | | 41,999,393 | |
Falcon Asset Securitization Corporation LLC††^ | | | 0.13 | | | | 08/18/2011 | | | | 35,660,000 | | | | 35,657,642 | |
Gemini Securitization Corporation LLC††^ | | | 0.15 | | | | 08/03/2011 | | | | 23,000,000 | | | | 22,999,707 | |
Gemini Securitization Corporation LLC††^ | | | 0.16 | | | | 08/09/2011 | | | | 53,000,000 | | | | 52,997,880 | |
Gemini Securitization Corporation LLC††^ | | | 0.17 | | | | 08/04/2011 | | | | 3,000,000 | | | | 2,999,943 | |
| | | | |
| 10 | | Wells Fargo Advantage Cash Investment Money Market Fund | | Portfolio of Investments—July 31, 2011 (Unaudited) |
| | | | | | | | | | | | | | | | |
| Security Name | | Interest Rate | | | Maturity Date | | | Principal | | | Value | |
| | | | | | | | | | | | | | | | |
| | | | |
| Asset-Backed Commercial Paper (continued) | | | | | | | | | | | | | | | | |
Gemini Securitization Corporation LLC††^ | | | 0.20 | % | | | 09/14/2011 | | | $ | 25,032,000 | | | $ | 25,025,881 | |
Govco LLC††^ | | | 0.21 | | | | 08/22/2011 | | | | 51,500,000 | | | | 51,493,391 | |
Grampian Funding LLC††^ | | | 0.17 | | | | 08/16/2011 | | | | 85,000,000 | | | | 84,993,625 | |
Grampian Funding LLC††^ | | | 0.17 | | | | 08/25/2011 | | | | 15,000,000 | | | | 14,998,200 | |
Grampian Funding LLC††^ | | | 0.21 | | | | 09/08/2011 | | | | 48,000,000 | | | | 47,988,853 | |
Grampian Funding LLC††^ | | | 0.23 | | | | 08/15/2011 | | | | 56,000,000 | | | | 55,994,505 | |
Grampian Funding LLC††^ | | | 0.24 | | | | 08/10/2011 | | | | 43,000,000 | | | | 42,997,023 | |
Grampian Funding LLC†† | | | 0.34 | | | | 09/02/2011 | | | | 51,000,000 | | | | 51,005,143 | |
Grampian Funding LLCl††^ | | | 0.23 | | | | 08/11/2011 | | | | 11,000,000 | | | | 10,999,236 | |
Jupiter Securitization Company LLC††^ | | | 0.12 | | | | 08/15/2011 | | | | 40,000,000 | | | | 39,997,978 | |
Jupiter Securitization Company LLC††^ | | | 0.12 | | | | 08/17/2011 | | | | 7,703,000 | | | | 7,702,555 | |
Jupiter Securitization Company LLC††^ | | | 0.13 | | | | 08/12/2011 | | | | 5,000,000 | | | | 4,999,786 | |
Kells Funding LLC†† | | | 0.30 | | | | 12/16/2011 | | | | 85,000,000 | | | | 85,000,000 | |
Kells Funding LLC††± | | | 0.33 | | | | 11/29/2011 | | | | 108,000,000 | | | | 108,000,000 | |
Legacy Capital Company LLC††^ | | | 0.30 | | | | 08/04/2011 | | | | 39,000,000 | | | | 38,998,700 | |
Legacy Capital Company LLC††^ | | | 0.37 | | | | 08/12/2011 | | | | 30,000,000 | | | | 29,996,333 | |
Legacy Capital Company LLC††^ | | | 0.39 | | | | 08/26/2011 | | | | 10,000,000 | | | | 9,997,222 | |
Lexington Parker Capital Company LLC††^ | | | 0.30 | | | | 08/04/2011 | | | | 36,000,000 | | | | 35,998,800 | |
Lexington Parker Capital Company LLC††^ | | | 0.35 | | | | 08/08/2011 | | | | 33,000,000 | | | | 32,997,433 | |
Lexington Parker Capital Company LLC††^ | | | 0.36 | | | | 08/11/2011 | | | | 20,000,000 | | | | 19,997,778 | |
Lexington Parker Capital Company LLC††^ | | | 0.38 | | | | 08/16/2011 | | | | 30,000,000 | | | | 29,995,000 | |
Lexington Parker Capital Company LLC††^ | | | 0.38 | | | | 08/19/2011 | | | | 35,000,000 | | | | 34,993,000 | |
Lexington Parker Capital Company LLC††^ | | | 0.38 | | | | 08/22/2011 | | | | 25,000,000 | | | | 24,994,167 | |
Lexington Parker Capital Company LLC††^ | | | 0.38 | | | | 08/23/2011 | | | | 32,000,000 | | | | 31,992,178 | |
Liberty Funding LLC††^ | | | 0.14 | | | | 08/25/2011 | | | | 49,000,000 | | | | 48,995,100 | |
LMA Americas LLC††^ | | | 0.00 | | | | 08/01/2011 | | | | 121,000,000 | | | | 121,000,000 | |
LMA Americas LLC††^ | | | 0.22 | | | | 08/24/2011 | | | | 8,000,000 | | | | 7,998,824 | |
LMA Americas LLC††^ | | | 0.24 | | | | 08/30/2011 | | | | 15,500,000 | | | | 15,496,879 | |
Metlife Short Term Funding LLC††^ | | | 0.14 | | | | 08/17/2011 | | | | 55,000,000 | | | | 54,996,333 | |
Metlife Short Term Funding LLC††^ | | | 0.14 | | | | 08/18/2011 | | | | 75,000,000 | | | | 74,994,688 | |
Metlife Short Term Funding LLC††^ | | | 0.14 | | | | 08/19/2011 | | | | 10,000,000 | | | | 9,999,250 | |
Metlife Short Term Funding LLC††^ | | | 0.20 | | | | 08/09/2011 | | | | 15,000,000 | | | | 14,999,233 | |
Metlife Short Term Funding LLC††^ | | | 0.21 | | | | 08/11/2011 | | | | 23,000,000 | | | | 22,998,530 | |
Metlife Short Term Funding LLC††^ | | | 0.21 | | | | 08/12/2011 | | | | 14,000,000 | | | | 13,999,016 | |
Metlife Short Term Funding LLC††^ | | | 0.21 | | | | 08/15/2011 | | | | 58,000,000 | | | | 57,994,812 | |
Mont Blanc Capital Corporation††^ | | | 0.19 | | | | 08/08/2011 | | | | 17,000,000 | | | | 16,999,273 | |
Mont Blanc Capital Corporation††^ | | | 0.20 | | | | 09/06/2011 | | | | 27,000,000 | | | | 26,994,330 | |
Mont Blanc Capital Corporation††^ | | | 0.20 | | | | 09/07/2011 | | | | 16,000,000 | | | | 15,996,547 | |
Mont Blanc Capital Corporation††^ | | | 0.20 | | | | 09/09/2011 | | | | 12,000,000 | | | | 11,997,270 | |
Mont Blanc Capital Corporation††^ | | | 0.20 | | | | 09/14/2011 | | | | 28,000,000 | | | | 27,993,156 | |
Newport Funding Corporation††^ | | | 0.16 | | | | 08/10/2011 | | | | 35,000,000 | | | | 34,998,425 | |
Newport Funding Corporation††^ | | | 0.24 | | | | 09/23/2011 | | | | 3,000,000 | | | | 2,998,940 | |
Nieuw Amsterdam Receivables Corporation††^ | | | 0.00 | | | | 08/01/2011 | | | | 35,000,000 | | | | 35,000,000 | |
Nieuw Amsterdam Receivables Corporation††^ | | | 0.15 | | | | 08/03/2011 | | | | 7,000,000 | | | | 6,999,911 | |
Nieuw Amsterdam Receivables Corporation††^ | | | 0.15 | | | | 08/26/2011 | | | | 15,000,000 | | | | 14,998,333 | |
Nieuw Amsterdam Receivables Corporation††^ | | | 0.17 | | | | 08/04/2011 | | | | 13,000,000 | | | | 12,999,751 | |
Nieuw Amsterdam Receivables Corporation††^ | | | 0.18 | | | | 08/05/2011 | | | | 4,000,000 | | | | 3,999,902 | |
Nieuw Amsterdam Receivables Corporation††^ | | | 0.18 | | | | 08/16/2011 | | | | 16,000,000 | | | | 15,998,733 | |
Nieuw Amsterdam Receivables Corporation††^ | | | 0.18 | | | | 09/08/2011 | | | | 19,000,000 | | | | 18,996,390 | |
Nieuw Amsterdam Receivables Corporation††^ | | | 0.18 | | | | 09/22/2011 | | | | 15,000,000 | | | | 14,996,100 | |
Nieuw Amsterdam Receivables Corporation††^ | | | 0.20 | | | | 08/09/2011 | | | | 10,000,000 | | | | 9,999,511 | |
| | | | | | |
| Portfolio of Investments—July 31, 2011 (Unaudited) | | Wells Fargo Advantage Cash Investment Money Market Fund | | | 11 | |
| | | | | | | | | | | | | | | | |
| Security Name | | Interest Rate | | | Maturity Date | | | Principal | | | Value | |
| | | | | | | | | | | | | | | | |
| | | | |
| Asset-Backed Commercial Paper (continued) | | | | | | | | | | | | | | | | |
Nieuw Amsterdam Receivables Corporation††^ | | | 0.20 | % | | | 09/19/2011 | | | $ | 37,000,000 | | | $ | 36,989,928 | |
Northern Pines Funding LLC††^ | | | 0.15 | | | | 08/11/2011 | | | | 32,000,000 | | | | 31,998,578 | |
Northern Pines Funding LLC††^ | | | 0.21 | | | | 08/23/2011 | | | | 31,000,000 | | | | 30,995,007 | |
Northern Pines Funding LLC††^ | | | 0.26 | | | | 08/08/2011 | | | | 3,000,000 | | | | 2,999,825 | |
Old Line Funding LLC††^ | | | 0.14 | | | | 08/29/2011 | | | | 13,941,000 | | | | 13,939,482 | |
Regency Markets #1 LLC††^ | | | 0.14 | | | | 08/11/2011 | | | | 50,000,000 | | | | 49,997,917 | |
Regency Markets #1 LLC††^ | | | 0.14 | | | | 08/15/2011 | | | | 125,000,000 | | | | 124,992,708 | |
Regency Markets #1 LLC††^ | | | 0.14 | | | | 08/17/2011 | | | | 40,000,000 | | | | 39,997,333 | |
Regency Markets #1 LLC††^ | | | 0.15 | | | | 08/25/2011 | | | | 75,000,000 | | | | 74,992,000 | |
Rhein-Main Security Limited††^ | | | 0.41 | | | | 09/13/2011 | | | | 37,000,000 | | | | 36,981,438 | |
Rhein-Main Security Limited††^ | | | 0.42 | | | | 09/06/2011 | | | | 21,000,000 | | | | 20,990,970 | |
Rhein-Main Security Limited††^ | | | 0.42 | | | | 09/23/2011 | | | | 6,000,000 | | | | 5,996,202 | |
Rheingold Securitization Limited††^ | | | 0.41 | | | | 09/06/2011 | | | | 38,000,000 | | | | 37,983,850 | |
Rheingold Securitization Limited††^ | | | 0.41 | | | | 09/16/2011 | | | | 52,000,000 | | | | 51,972,093 | |
Rheingold Securitization Limited††^ | | | 0.42 | | | | 09/20/2011 | | | | 20,000,000 | | | | 19,988,056 | |
Salisbury Receivables Company LLC††^ | | | 0.14 | | | | 08/22/2011 | | | | 9,000,000 | | | | 8,999,213 | |
Salisbury Receivables Company LLC††^ | | | 0.14 | | | | 08/24/2011 | | | | 11,000,000 | | | | 10,998,946 | |
Salisbury Receivables Company LLC††^ | | | 0.15 | | | | 08/12/2011 | | | | 9,000,000 | | | | 8,999,560 | |
Salisbury Receivables Company LLC††^ | | | 0.15 | | | | 08/15/2011 | | | | 7,000,000 | | | | 6,999,564 | |
Salisbury Receivables Company LLC††^ | | | 0.15 | | | | 08/18/2011 | | | | 12,000,000 | | | | 11,999,093 | |
Salisbury Receivables Company LLC††^ | | | 0.15 | | | | 08/29/2011 | | | | 6,000,000 | | | | 5,999,253 | |
Scaldis Capital LLC††^ | | | 0.00 | | | | 08/01/2011 | | | | 12,000,000 | | | | 12,000,000 | |
Scaldis Capital LLC††^ | | | 0.20 | | | | 08/09/2011 | | | | 20,000,000 | | | | 19,999,022 | |
Sheffield Receivable Corporation††^ | | | 0.17 | | | | 09/21/2011 | | | | 47,000,000 | | | | 46,988,681 | |
Sheffield Receivables Corporation††^ | | | 0.14 | | | | 08/25/2011 | | | | 25,000,000 | | | | 24,997,500 | |
Sheffield Receivables Corporation††^ | | | 0.15 | | | | 08/15/2011 | | | | 8,000,000 | | | | 7,999,502 | |
Sheffield Receivables Corporation††^ | | | 0.17 | | | | 09/23/2011 | | | | 7,000,000 | | | | 6,998,248 | |
Sheffield Receivables Corporation††^ | | | 0.17 | | | | 09/26/2011 | | | | 16,000,000 | | | | 15,995,769 | |
Sheffield Receivables Corporation††^ | | | 0.17 | | | | 09/27/2011 | | | | 25,000,000 | | | | 24,993,271 | |
Sheffield Receivables Corporation††^ | | | 0.18 | | | | 10/03/2011 | | | | 10,000,000 | | | | 9,996,850 | |
Solitaire Funding LLC††^ | | | 0.15 | | | | 08/16/2011 | | | | 10,000,000 | | | | 9,999,333 | |
Solitaire Funding LLC††^ | | | 0.15 | | | | 08/22/2011 | | | | 5,000,000 | | | | 4,999,533 | |
Solitaire Funding LLC††^ | | | 0.15 | | | | 08/24/2011 | | | | 20,000,000 | | | | 19,997,956 | |
Solitaire Funding LLC††^ | | | 0.15 | | | | 08/25/2011 | | | | 81,000,000 | | | | 80,989,601 | |
Solitaire Funding LLC††^ | | | 0.16 | | | | 08/30/2011 | | | | 15,000,000 | | | | 14,997,946 | |
Solitaire Funding LLC††^ | | | 0.20 | | | | 09/09/2011 | | | | 45,000,000 | | | | 44,989,763 | |
Solitaire Funding LLC††^ | | | 0.21 | | | | 08/09/2011 | | | | 15,000,000 | | | | 14,999,200 | |
Solitaire Funding LLC††^ | | | 0.21 | | | | 09/02/2011 | | | | 16,000,000 | | | | 15,996,871 | |
Solitaire Funding LLC††^ | | | 0.21 | | | | 09/12/2011 | | | | 65,000,000 | | | | 64,984,075 | |
Straight-A Funding LLC††^ | | | 0.74 | | | | 10/27/2011 | | | | 336,000,000 | | | | 335,391,000 | |
Surrey Funding Corporation††^ | | | 0.14 | | | | 08/09/2011 | | | | 25,000,000 | | | | 24,999,111 | |
Surrey Funding Corporation††^ | | | 0.15 | | | | 08/30/2011 | | | | 21,360,000 | | | | 21,357,247 | |
Surrey Funding Corporation††^ | | | 0.19 | | | | 09/07/2011 | | | | 16,293,000 | | | | 16,289,651 | |
Sydney Capital Corporation††^ | | | 0.30 | | | | 08/10/2011 | | | | 7,000,000 | | | | 6,999,423 | |
Sydney Capital Corporation††^ | | | 0.30 | | | | 08/16/2011 | | | | 5,000,000 | | | | 4,999,333 | |
Sydney Capital Corporation††^ | | | 0.34 | | | | 09/12/2011 | | | | 16,000,000 | | | | 15,993,467 | |
Sydney Capital Corporation††^ | | | 0.34 | | | | 09/14/2011 | | | | 20,000,000 | | | | 19,991,444 | |
Sydney Capital Corporation††^ | | | 0.34 | | | | 09/16/2011 | | | | 3,000,000 | | | | 2,998,658 | |
Tasman Funding Incorporated††^ | | | 0.16 | | | | 08/11/2011 | | | | 14,000,000 | | | | 13,999,300 | |
Tasman Funding Incorporated††^ | | | 0.18 | | | | 08/16/2011 | | | | 18,000,000 | | | | 17,998,575 | |
Tasman Funding Incorporated††^ | | | 0.18 | | | | 08/18/2011 | | | | 14,000,000 | | | | 13,998,744 | |
| | | | |
| 12 | | Wells Fargo Advantage Cash Investment Money Market Fund | | Portfolio of Investments—July 31, 2011 (Unaudited) |
| | | | | | | | | | | | | | | | |
| Security Name | | Interest Rate | | | Maturity Date | | | Principal | | | Value | |
| | | | | | | | | | | | | | | | |
| | | | |
| Asset-Backed Commercial Paper (continued) | | | | | | | | | | | | | | | | |
Tasman Funding Incorporated††^ | | | 0.18 | % | | | 08/24/2011 | | | $ | 11,000,000 | | | $ | 10,998,665 | |
Tasman Funding Incorporated††^ | | | 0.20 | | | | 08/08/2011 | | | | 13,000,000 | | | | 12,999,419 | |
Tasman Funding Incorporated††^ | | | 0.23 | | | | 08/17/2011 | | | | 3,000,000 | | | | 2,999,680 | |
Thames Asset Global Securitization #1 Incorporated††^ | | | 0.14 | | | | 08/10/2011 | | | | 95,000,000 | | | | 94,996,200 | |
Thames Asset Global Securitization #1 Incorporated††^ | | | 0.15 | | | | 08/12/2011 | | | | 20,027,000 | | | | 20,026,021 | |
Thames Asset Global Securitization #1 Incorporated††^ | | | 0.15 | | | | 08/17/2011 | | | | 13,315,000 | | | | 13,314,053 | |
Thames Asset Global Securitization #1 Incorporated††^ | | | 0.15 | | | | 08/18/2011 | | | | 53,855,000 | | | | 53,850,766 | |
Thames Asset Global Securitization #1 Incorporated††^ | | | 0.16 | | | | 08/25/2011 | | | | 4,111,000 | | | | 4,110,534 | |
Versailles CDS LLC††^ | | | 0.20 | | | | 08/05/2011 | | | | 80,000,000 | | | | 79,997,778 | |
Windmill Funding Corporation††^ | | | 0.11 | | | | 08/04/2011 | | | | 14,000,000 | | | | 13,999,825 | |
Windmill Funding Corporation††^ | | | 0.12 | | | | 08/03/2011 | | | | 5,000,000 | | | | 4,999,950 | |
Windmill Funding Corporation††^ | | | 0.15 | | | | 08/23/2011 | | | | 53,600,000 | | | | 53,594,759 | |
Windmill Funding Corporation††^ | | | 0.15 | | | | 08/30/2011 | | | | 20,000,000 | | | | 19,997,422 | |
Windmill Funding Corporation††^ | | | 0.22 | | | | 08/22/2011 | | | | 4,000,000 | | | | 3,999,463 | |
Working Capital Management Company††^ | | | 0.15 | | | | 08/03/2011 | | | | 10,000,000 | | | | 9,999,872 | |
| | | | |
| | | | | | | | | | | | | | | 5,470,936,383 | |
| | | | | | | | | | | | | | | | |
| | | | |
| Financial Company Commerical Paper: 12.51% | | | | | | | | | | | | | | | | |
ABN AMRO Funding USA LLC††^ | | | 0.18 | | | | 08/15/2011 | | | | 27,000,000 | | | | 26,998,005 | |
ABN AMRO Funding USA LLC††^ | | | 0.18 | | | | 08/17/2011 | | | | 57,000,000 | | | | 56,995,187 | |
ABN AMRO Funding USA LLC††^ | | | 0.18 | | | | 08/19/2011 | | | | 9,000,000 | | | | 8,999,145 | |
ABN AMRO Funding USA LLC††^ | | | 0.20 | | | | 08/05/2011 | | | | 5,000,000 | | | | 4,999,861 | |
ANZ National Limited††± | | | 0.34 | | | | 09/13/2011 | | | | 71,000,000 | | | | 71,000,000 | |
ASB Finance Limited††± | | | 0.35 | | | | 12/02/2011 | | | | 52,000,000 | | | | 52,000,000 | |
ASB Finance Limited††± | | | 0.35 | | | | 12/05/2011 | | | | 53,000,000 | | | | 53,000,000 | |
ASB Finance Limited††± | | | 0.35 | | | | 09/02/2011 | | | | 70,000,000 | | | | 70,000,000 | |
BNZ International Funding Limited††^ | | | 0.15 | | | | 08/10/2011 | | | | 17,000,000 | | | | 16,999,278 | |
BNZ International Funding Limited | | | 0.34 | | | | 10/07/2011 | | | | 6,000,000 | | | | 5,999,996 | |
BNZ International Funding Limited††± | | | 0.34 | | | | 10/12/2011 | | | | 23,000,000 | | | | 23,000,228 | |
BNZ International Funding Limited††± | | | 0.35 | | | | 01/06/2012 | | | | 10,000,000 | | | | 10,000,000 | |
BNZ International Funding Limited††± | | | 0.35 | | | | 09/01/2011 | | | | 49,000,000 | | | | 49,000,172 | |
Credit Suisse NY^ | | | 0.00 | | | | 08/01/2011 | | | | 63,000,000 | | | | 63,000,000 | |
Credit Suisse NY^ | | | 0.15 | | | | 09/07/2011 | | | | 99,000,000 | | | | 98,984,738 | |
ICICI Bank Limited^ | | | 0.64 | | | | 09/16/2011 | | | | 55,000,000 | | | | 54,954,319 | |
Macquarie Bank Limited††^ | | | 0.33 | | | | 09/06/2011 | | | | 22,000,000 | | | | 21,992,520 | |
Nordea North America Incorporated^ | | | 0.15 | | | | 09/15/2011 | | | | 136,000,000 | | | | 135,974,500 | |
Nordea North America Incorporated^ | | | 0.15 | | | | 09/22/2011 | | | | 45,000,000 | | | | 44,990,250 | |
PB Financing Incorporated††^ | | | 0.00 | | | | 08/01/2011 | | | | 11,000,000 | | | | 11,000,000 | |
PB Financing Incorporated††^ | | | 0.33 | | | | 08/03/2011 | | | | 15,000,000 | | | | 14,999,582 | |
PB Financing Incorporated††^ | | | 0.45 | | | | 08/10/2011 | | | | 13,000,000 | | | | 12,998,375 | |
PB Financing Incorporated††^ | | | 0.47 | | | | 08/22/2011 | | | | 23,000,000 | | | | 22,993,426 | |
PB Financing Incorporated††^ | | | 0.47 | | | | 08/29/2011 | | | | 7,000,000 | | | | 6,997,332 | |
PB Financing Incorporated††^ | | | 0.49 | | | | 09/08/2011 | | | | 28,000,000 | | | | 27,985,222 | |
PB Financing Incorporated††^ | | | 0.49 | | | | 09/09/2011 | | | | 28,000,000 | | | | 27,984,833 | |
PB Financing Incorporated††^ | | | 0.50 | | | | 09/16/2011 | | | | 13,000,000 | | | | 12,991,528 | |
PB Financing Incorporated††^ | | | 0.50 | | | | 09/19/2011 | | | | 13,000,000 | | | | 12,990,976 | |
PB Financing Incorporated††^ | | | 0.51 | | | | 09/23/2011 | | | | 10,000,000 | | | | 9,992,344 | |
Prudential plc††^ | | | 0.20 | | | | 08/18/2011 | | | | 33,000,000 | | | | 32,996,728 | |
Prudential plc††^ | | | 0.21 | | | | 09/08/2011 | | | | 12,000,000 | | | | 11,997,213 | |
Prudential plc††^ | | | 0.22 | | | | 09/13/2011 | | | | 12,000,000 | | | | 11,996,847 | |
Prudential plc††^ | | | 0.23 | | | | 09/06/2011 | | | | 12,000,000 | | | | 11,997,120 | |
| | | | | | |
| Portfolio of Investments—July 31, 2011 (Unaudited) | | Wells Fargo Advantage Cash Investment Money Market Fund | | | 13 | |
| | | | | | | | | | | | | | | | |
| Security Name | | Interest Rate | | | Maturity Date | | | Principal | | | Value | |
| | | | | | | | | | | | | | | | |
| | | | |
| Financial Company Commerical Paper (continued) | | | | | | | | | | | | | | | | |
Prudential plc††^ | | | 0.23 | % | | | 09/12/2011 | | | $ | 18,000,000 | | | $ | 17,994,960 | |
RBS Holdings USA Incorporated^ | | | 0.22 | | | | 08/11/2011 | | | | 125,000,000 | | | | 124,991,667 | |
Skandinaviska Enskilda Banken AB††^ | | | 0.23 | | | | 08/29/2011 | | | | 25,000,000 | | | | 24,995,333 | |
Skandinaviska Enskilda Banken AB††^ | | | 0.23 | | | | 09/08/2011 | | | | 100,000,000 | | | | 99,974,667 | |
Sumitomo Trust & Banking Corporation††^ | | | 0.00 | | | | 08/01/2011 | | | | 95,000,000 | | | | 95,000,000 | |
Suncorp-Metway Limited††^ | | | 0.26 | | | | 08/03/2011 | | | | 11,000,000 | | | | 10,999,765 | |
Suncorp-Metway Limited††^ | | | 0.36 | | | | 08/09/2011 | | | | 10,000,000 | | | | 9,999,111 | |
Suncorp-Metway Limited††^ | | | 0.39 | | | | 09/08/2011 | | | | 73,000,000 | | | | 72,969,178 | |
Suncorp-Metway Limited††^ | | | 0.39 | | | | 09/12/2011 | | | | 30,000,000 | | | | 29,986,000 | |
Swedbank AB^ | | | 0.11 | | | | 08/02/2011 | | | | 15,000,000 | | | | 14,999,908 | |
Swedbank AB^ | | | 0.18 | | | | 08/03/2011 | | | | 25,000,000 | | | | 24,999,625 | |
Swedbank AB^ | | | 0.20 | | | | 08/04/2011 | | | | 25,000,000 | | | | 24,999,438 | |
Swedbank AB^ | | | 0.23 | | | | 08/08/2011 | | | | 45,000,000 | | | | 44,997,681 | |
Swedbank AB^ | | | 0.24 | | | | 08/09/2011 | | | | 32,000,000 | | | | 31,998,116 | |
Swedbank AB^ | | | 0.24 | | | | 08/10/2011 | | | | 45,000,000 | | | | 44,997,019 | |
Swedbank AB^ | | | 0.26 | | | | 09/29/2011 | | | | 22,000,000 | | | | 21,990,445 | |
Westpac Securities NZ Limited††^ | | | 0.17 | | | | 08/24/2011 | | | | 34,000,000 | | | | 33,996,199 | |
Westpac Securities NZ Limited††± | | | 0.33 | | | | 08/19/2011 | | | | 57,000,000 | | | | 57,000,000 | |
Westpac Securities NZ Limited††± | | | 0.34 | | | | 10/13/2011 | | | | 65,000,000 | | | | 65,000,000 | |
| | | | |
| | | | | | | | | | | | | | | 1,950,698,837 | |
| | | | | | | | | | | | | | | | |
| | | | |
| Other Commercial Paper: 3.77% | | | | | | | | | | | | | | | | |
ACTS Retirement Life Communities Incorporated^ | | | 0.22 | | | | 09/15/2011 | | | | 3,000,000 | | | | 2,999,175 | |
Alaska Housing Finance Corporation^ | | | 0.21 | | | | 08/15/2011 | | | | 2,000,000 | | | | 1,999,821 | |
Caisse D’amortissement de la Dette Sociale††^ | | | 0.22 | | | | 09/28/2011 | | | | 35,000,000 | | | | 34,987,594 | |
Caisse D’amortissement de la Dette Sociale††^ | | | 0.22 | | | | 10/03/2011 | | | | 36,000,000 | | | | 35,986,140 | |
Caisse D’amortissement de la Dette Sociale††^ | | | 0.22 | | | | 10/24/2011 | | | | 51,000,000 | | | | 50,973,820 | |
Caisse D’amortissement de la Dette Sociale††^ | | | 0.23 | | | | 10/11/2011 | | | | 120,000,000 | | | | 119,944,383 | |
EDF SA††^ | | | 0.12 | | | | 08/05/2011 | | | | 44,000,000 | | | | 43,999,267 | |
EDF SA††^ | | | 0.19 | | | | 09/06/2011 | | | | 26,000,000 | | | | 25,995,060 | |
EDF SA††^ | | | 0.19 | | | | 09/07/2011 | | | | 18,000,000 | | | | 17,996,485 | |
Erste Abwicklungsanstalt††^ | | | 0.19 | | | | 08/08/2011 | | | | 40,000,000 | | | | 39,998,289 | |
Erste Abwicklungsanstalt††^ | | | 0.24 | | | | 09/28/2011 | | | | 26,000,000 | | | | 25,989,947 | |
Erste Abwicklungsanstalt††^ | | | 0.25 | | | | 09/07/2011 | | | | 40,000,000 | | | | 39,989,311 | |
Erste Abwicklungsanstalt††^ | | | 0.25 | | | | 09/14/2011 | | | | 40,000,000 | | | | 39,987,289 | |
Louis Dreyfus Corporation^ | | | 0.00 | | | | 08/01/2011 | | | | 8,000,000 | | | | 8,000,000 | |
SBAB Bank AB††^ | | | 0.16 | | | | 08/02/2011 | | | | 6,000,000 | | | | 5,999,947 | |
SBAB Bank AB††^ | | | 0.20 | | | | 08/03/2011 | | | | 3,000,000 | | | | 2,999,950 | |
SBAB Bank AB††^ | | | 0.24 | | | | 08/04/2011 | | | | 6,000,000 | | | | 5,999,840 | |
SBAB Bank AB††^ | | | 0.27 | | | | 09/01/2011 | | | | 27,000,000 | | | | 26,993,490 | |
SBAB Bank AB††^ | | | 0.27 | | | | 09/09/2011 | | | | 39,000,000 | | | | 38,987,899 | |
SBAB Bank AB††^ | | | 0.29 | | | | 09/13/2011 | | | | 2,000,000 | | | | 1,999,283 | |
Trinity Health Corporation^ | | | 0.00 | | | | 08/01/2011 | | | | 9,000,000 | | | | 9,000,000 | |
Trinity Health Corporation^ | | | 0.15 | | | | 08/16/2011 | | | | 7,000,000 | | | | 6,999,533 | |
| | | | |
| | | | | | | | | | | | | | | 587,826,523 | |
| | | | | | | | | | | | | | | | |
| | | | |
Total Commercial Paper (Cost $8,009,461,743) | | | | | | | | | | | | | | | 8,009,461,743 | |
| | | | | | | | | | | | | | | | |
| | | | |
Government Agency Debt: 0.39% | | | | | | | | | | | | | | | | |
FHLMC± | | | 0.11 | | | | 02/02/2012 | | | | 60,000,000 | | | | 59,975,521 | |
| | | | | | | | | | | | | | | | |
| | | | |
Total Government Agency Debt (Cost $59,975,521) | | | | | | | | | | | | | | | 59,975,521 | |
| | | | | | | | | | | | | | | | |
| | | | |
| 14 | | Wells Fargo Advantage Cash Investment Money Market Fund | | Portfolio of Investments—July 31, 2011 (Unaudited) |
| | | | | | | | | | | | | | | | |
| Security Name | | Interest Rate | | | Maturity Date | | | Principal | | | Value | |
| | | | | | | | | | | | | | | | |
| | | | |
Municipal Bonds and Notes: 12.76% | | | | | | | | | | | | | | | | |
| | | | |
Alabama: 0.70% | | | | | | | | | | | | | | | | |
| | | | |
| Variable Rate Demand Notes§: 0.70% | | | | | | | | | | | | | | | | |
Lower Alabama Gas District Supply Revenue Series A (Utilities Revenue, Societe Generale LOC) | | | 0.13 | % | | | 11/01/2027 | | | $ | 32,000,000 | | | $ | 32,000,000 | |
Southeast Alabama Gas District Alabama Supply Project Series 2007-A (Utilities Revenue) | | | 0.24 | | | | 08/01/2027 | | | | 77,000,000 | | | | 77,000,000 | |
| | | | |
| | | | | | | | | | | | | | | 109,000,000 | |
| | | | | | | | | | | | | | | | |
| | | | | | | | | | | | | | | | |
| | | | |
Arizona: 0.07% | | | | | | | | | | | | | | | | |
| | | | |
| Variable Rate Demand Note§: 0.07% | | | | | | | | | | | | | | | | |
Phoenix AZ IDA (Housing Revenue, FHLMC Insured) | | | 0.08 | | | | 10/01/2029 | | | | 11,500,000 | | | | 11,500,000 | |
| | | | | | | | | | | | | | | | |
| | | | |
California: 4.23% | | | | | | | | | | | | | | | | |
| | | | |
| Other Municipal Debt: 0.62% | | | | | | | | | | | | | | | | |
City of San Francisco CA (Miscellaneous Revenue) | | | 0.17 | | | | 09/12/2011 | | | | 4,000,000 | | | | 4,000,000 | |
City of San Francisco CA (Miscellaneous Revenue) | | | 0.17 | | | | 10/03/2011 | | | | 21,000,000 | | | | 21,000,000 | |
City of San Francisco CA (Miscellaneous Revenue) | | | 0.19 | | | | 08/03/2011 | | | | 7,000,000 | | | | 7,000,000 | |
City of San Francisco CA (Miscellaneous Revenue) | | | 0.20 | | | | 10/03/2011 | | | | 19,000,000 | | | | 19,000,000 | |
San Jose CA International Airport (Airport Revenue) | | | 0.22 | | | | 08/02/2011 | | | | 25,000,000 | | | | 25,000,000 | |
San Jose CA International Airport Series C-2 (Airport Revenue) | | | 0.22 | | | | 08/02/2011 | | | | 5,000,000 | | | | 5,000,000 | |
San Jose CA International Airport Series F (Airport Revenue) | | | 0.20 | | | | 08/02/2011 | | | | 16,000,000 | | | | 16,000,000 | |
| | | | |
| | | | | | | | | | | | | | | 97,000,000 | |
| | | | | | | | | | | | | | | | |
| | | | |
| Variable Rate Demand Notes§: 3.61% | | | | | | | | | | | | | | | | |
ABAG Finance Authority for Nonprofit Corporation CA Marin Country Day School (Education Revenue, U.S. Bank NA LOC) | | | 0.06 | | | | 07/01/2037 | | | | 3,000,000 | | | | 3,000,000 | |
California Educational Facilities Authority (Education Revenue, Bank of America NA LOC, NATL-RE Insured) | | | 0.07 | | | | 10/01/2043 | | | | 19,690,000 | | | | 19,690,000 | |
California HFA Revenue Home Mortgage Series M (Housing Revenue, FNMA LOC) | | | 0.07 | | | | 08/01/2034 | | | | 14,300,000 | | | | 14,300,000 | |
California HFFA Catholic Healthcare Series C (Health Revenue, JPMorgan Chase Bank LOC, NATL-RE Insured) | | | 0.05 | | | | 07/01/2020 | | | | 18,000,000 | | | | 18,000,000 | |
California PCFA Pacific Gas & Electric Series B (Utilities Revenue, JPMorgan Chase Bank LOC) | | | 0.31 | | | | 11/01/2026 | | | | 51,800,000 | | | | 51,800,000 | |
California State Series A Subseries C-2 (GO- State, Bank of Nova Scotia LOC) | | | 0.04 | | | | 05/01/2033 | | | | 21,000,000 | | | | 21,000,000 | |
California State Series B Subseries B1 (GO-State, Bank of America NA LOC) | | | 0.06 | | | | 05/01/2040 | | | | 10,000,000 | | | | 10,000,000 | |
California State Series I (Health Revenue, Bank of America NA LOC) | | | 0.05 | | | | 07/01/2035 | | | | 22,000,000 | | | | 22,000,000 | |
California Statewide CDA Dublin Ranch Senior Apartments (Housing Revenue) | | | 0.19 | | | | 12/15/2037 | | | | 14,900,000 | | | | 14,900,000 | |
California Statewide CDA Ivy Hill Apartments Project Series I (Housing Revenue, FNMA Insured) | | | 0.18 | | | | 02/01/2033 | | | | 11,337,000 | | | | 11,337,000 | |
California Statewide CDA Oakmont Senior Living Series Y (Housing Revenue, FNMA Insured) | | | 0.18 | | | | 08/01/2031 | | | | 3,000,000 | | | | 3,000,000 | |
California Statewide CDA Pravillions Apartments Series M (Housing Revenue, FNMA Insured) | | | 0.18 | | | | 08/15/2034 | | | | 7,700,000 | | | | 7,700,000 | |
Camarillo CA Hacienda de Camarillo Project (Housing Revenue, FNMA Insured) | | | 0.17 | | | | 10/15/2026 | | | | 12,000,000 | | | | 12,000,000 | |
Contra Costa County CA Creekview Apartments Series B (Housing Revenue, FHLMC Insured) | | | 0.17 | | | | 07/01/2036 | | | | 10,500,000 | | | | 10,500,000 | |
| | | | | | |
| Portfolio of Investments—July 31, 2011 (Unaudited) | | Wells Fargo Advantage Cash Investment Money Market Fund | | | 15 | |
| | | | | | | | | | | | | | | | |
| Security Name | | Interest Rate | | | Maturity Date | | | Principal | | | Value | |
| | | | | | | | | | | | | | | | |
| | | | |
| Variable Rate Demand Notes§ (continued) | | | | | | | | | | | | | | | | |
Irvine Ranch CA Water District Series A (Water & Sewer Revenue, Sumitomo Mitsui Banking LOC) | | | 0.07 | % | | | 07/01/2035 | | | $ | 39,900,000 | | | $ | 39,900,000 | |
Los Angeles CA Beverly Park Apartments Series A (Housing Revenue, FHLMC Insured) | | | 0.06 | | | | 08/01/2018 | | | | 12,000,000 | | | | 12,000,000 | |
Los Angeles CA Community RDA Academy Village Apartments (Housing Revenue, FHLMC Insured) | | | 0.15 | | | | 10/01/2019 | | | | 16,000,000 | | | | 16,000,000 | |
Metropolitan Water District of Southern California (Water & Sewer Revenue) | | | 0.05 | | | | 07/01/2027 | | | | 8,800,000 | | | | 8,800,000 | |
Metropolitan Water District of Southern California Series B-2 (Water & Sewer Revenue) | | | 0.08 | | | | 07/01/2035 | | | | 7,000,000 | | | | 7,000,000 | |
Newport Beach CA Hoag Memorial Hospital Series F (Health Revenue, Bank of America NA LOC) | | | 0.06 | | | | 12/01/2040 | | | | 21,180,000 | | | | 21,180,000 | |
Pasadena CA COP Series A (Lease Revenue, Bank of America NA LOC) | | | 0.09 | | | | 02/01/2035 | | | | 53,650,000 | | | | 53,650,000 | |
Riverside CA COP Riverside Renaissance Project Series 2008 (Lease Revenue, Bank of America NA LOC) | | | 0.09 | | | | 03/01/2037 | | | | 53,260,000 | | | | 53,260,000 | |
Riverside CA Series C (Lease Revenue, Bank of America NA LOC) | | | 0.06 | | | | 10/01/2035 | | | | 16,135,000 | | | | 16,135,000 | |
Sacramento County CA Housing Authority Natomas Park Apartments Issue B (Housing Revenue, FNMA Insured) | | | 0.17 | | | | 07/15/2035 | | | | 15,550,000 | | | | 15,550,000 | |
Sacramento County CA Housing Authority Shadowood Apartments Project Issue A (Housing Revenue, FHLMC Insured) | | | 0.08 | | | | 12/01/2022 | | | | 7,945,000 | | | | 7,945,000 | |
San Diego CA HFA MFHR Stratton Apartments Project Series A (Housing Revenue, FNMA Insured) | | | 0.17 | | | | 01/15/2033 | | | | 11,325,000 | | | | 11,325,000 | |
San Diego CA Housing Authority MFHR Hillside Garden Apartments Series B (Housing Revenue, FNMA Insured) | | | 0.19 | | | | 01/15/2035 | | | | 8,500,000 | | | | 8,500,000 | |
San Francisco CA City & County Finance Corporation Moscone Center Project (Lease Revenue, Bank of America NA LOC) | | | 0.05 | | | | 04/01/2030 | | | | 2,775,000 | | | | 2,775,000 | |
San Francisco CA City & County Redevelopment Agency Community (Lease Revenue, FNMA Insured) | | | 0.18 | | | | 06/15/2034 | | | | 8,700,000 | | | | 8,700,000 | |
San Francisco CA City & County Redevelopment Agency Community (Lease Revenue)†† | | | 0.23 | | | | 11/01/2041 | | | | 2,000,000 | | | | 2,000,000 | |
San Francisco CA City & County Redevelopment Agency Community Facilities District # 4 (Tax Revenue, Bank of America NA LOC) | | | 0.07 | | | | 08/01/2032 | | | | 14,000,000 | | | | 14,000,000 | |
San Leandro CA Carlton Plaza Series A (Housing Revenue, FNMA Insured) | | | 0.14 | | | | 09/15/2032 | | | | 5,800,000 | | | | 5,800,000 | |
Simi Valley CA MFHA Series A (Housing Revenue, FHLMC Insured) | | | 0.15 | | | | 07/01/2023 | | | | 9,000,000 | | | | 9,000,000 | |
Southern California Public Power Authority Magnolia Power Project Series 2009-1-A (Utilities Revenue, KBC Bank NV LOC) | | | 0.07 | | | | 07/01/2036 | | | | 20,120,000 | | | | 20,120,000 | |
Whittier CA Whittier College Series 2008 (Education Revenue, Bank of America NA LOC) | | | 0.08 | | | | 12/01/2038 | | | | 10,000,000 | | | | 10,000,000 | |
| | | | |
| | | | | | | | | | | | | | | 562,867,000 | |
| | | | | | | | | | | | | | | | |
| | | | |
Colorado: 0.43% | | | | | | | | | | | | | | | | |
| | | | |
| Variable Rate Demand Notes§: 0.43% | | | | | | | | | | | | | | | | |
Colorado HFA Class 1 Series B-2 (Housing Revenue, GO of Authority Insured) | | | 0.17 | | | | 10/01/2038 | | | | 12,661,000 | | | | 12,661,000 | |
Colorado HFA Taxable MFHR Project Series B-2 (Housing Revenue, FNMA Insured) | | | 0.16 | | | | 05/01/2050 | | | | 34,805,000 | | | | 34,805,000 | |
Colorado Springs CO Utility Improvement Bond Series A (Utilities Revenue) | | | 0.10 | | | | 11/01/2038 | | | | 4,000,000 | | | | 4,000,000 | |
Denver CO Public Schools Series A-4 (Education Revenue, Royal Bank of Canada LOC, AGM Insured) | | | 0.11 | | | | 12/15/2037 | | | | 16,000,000 | | | | 16,000,000 | |
| | | | |
| | | | | | | | | | | | | | | 67,466,000 | |
| | | | | | | | | | | | | | | | |
| | | | |
Connecticut: 0.14% | | | | | | | | | | | | | | | | |
| | | | |
| Variable Rate Demand Note§: 0.14% | | | | | | | | | | | | | | | | |
City of New Britain CT Taxable Pension Series C (Tax Revenue, JPMorgan Chase Bank LOC) | | | 0.26 | | | | 02/01/2026 | | | | 21,800,000 | | | | 21,800,000 | |
| | | | | | | | | | | | | | | | |
| | | | |
| 16 | | Wells Fargo Advantage Cash Investment Money Market Fund | | Portfolio of Investments—July 31, 2011 (Unaudited) |
| | | | | | | | | | | | | | | | |
| Security Name | | Interest Rate | | | Maturity Date | | | Principal | | | Value | |
| | | | | | | | | | | | | | | | |
| | | | |
Delaware: 0.17% | | | | | | | | | | | | | | | | |
| | | | |
| Variable Rate Demand Notes§: 0.17% | | | | | | | | | | | | | | | | |
Delaware State EDA Clean Power Project Series 1997-D (Resource Recovery Revenue) | | | 0.21 | % | | | 08/01/2029 | | | $ | 7,000,000 | | | $ | 7,000,000 | |
Delaware State EDA Series B (Resource Recovery Revenue) | | | 0.28 | | | | 08/01/2029 | | | | 19,700,000 | | | | 19,700,000 | |
| | | | |
| | | | | | | | | | | | | | | 26,700,000 | |
| | | | | | | | | | | | | | | | |
| | | | |
District of Columbia: 0.36% | | | | | | | | | | | | | | | | |
| | | | |
| Other Municipal Debt: 0.09% | | | | | | | | | | | | | | | | |
District of Columbia (Miscellaneous Revenue, GO-State) | | | 0.26 | | | | 08/01/2011 | | | | 14,000,000 | | | | 14,000,000 | |
| | | | | | | | | | | | | | | | |
| | | | |
| Variable Rate Demand Note§: 0.27% | | | | | | | | | | | | | | | | |
District of Columbia The American University Series A (Education Revenue, PNC Bank NA LOC) | | | 0.06 | | | | 04/01/2038 | | | | 42,400,000 | | | | 42,400,000 | |
| | | | | | | | | | | | | | | | |
| | | | |
Florida: 0.22% | | | | | | | | | | | | | | | | |
| | | | |
| Other Municipal Debt: 0.13% | | | | | | | | | | | | | | | | |
Hillsborough County FL (Miscellaneous Revenue) | | | 0.26 | | | | 08/11/2011 | | | | 20,000,000 | | | | 20,000,000 | |
| | | | | | | | | | | | | | | | |
| | | | |
| Variable Rate Demand Note§: 0.09% | | | | | | | | | | | | | | | | |
Palm Beach County FL Pine Crest Preparatory (Education Revenue, Bank of America NA LOC) | | | 0.13 | | | | 06/01/2032 | | | | 14,260,000 | | | | 14,260,000 | |
| | | | | | | | | | | | | | | | |
| | | | |
Georgia: 0.13% | | | | | | | | | | | | | | | | |
| | | | |
| Variable Rate Demand Note§: 0.13% | | | | | | | | | | | | | | | | |
Columbus GA Housing Development Authority PFOTER (Housing Revenue, ACA Insured)†† | | | 0.34 | | | | 10/01/2039 | | | | 20,490,000 | | | | 20,490,000 | |
| | | | | | | | | | | | | | | | |
| | | | |
Illinois: 0.48% | | | | | | | | | | | | | | | | |
| | | | |
| Variable Rate Demand Notes§: 0.48% | | | | | | | | | | | | | | | | |
Cook County IL GO Series D-1 (GO-Local) | | | 0.19 | | | | 11/01/2030 | | | | 46,600,000 | | | | 46,600,000 | |
Cook County IL GO Series D-2 (GO-Local) | | | 0.19 | | | | 11/01/2030 | | | | 17,400,000 | | | | 17,400,000 | |
Illinois State Toll Highway Authority (Transportation Revenue, PNC Bank NA LOC) | | | 0.08 | | | | 07/01/2030 | | | | 4,000,000 | | | | 4,000,000 | |
Illinois State Toll Highway Authority (Transportation Revenue, CitiBank NA LOC) | | | 0.09 | | | | 07/01/2030 | | | | 7,000,000 | | | | 7,000,000 | |
| | | | |
| | | | | | | | | | | | | | | 75,000,000 | |
| | | | | | | | | | | | | | | | |
| | | | |
Indiana: 0.07% | | | | | | | | | | | | | | | | |
| | | | |
| Variable Rate Demand Notes§: 0.07% | | | | | | | | | | | | | | | | |
Richmond IN Reid Hospital & Health Care Services Incorporated (Hospital Revenue, AGM Insured) | | | 0.20 | | | | 01/01/2040 | | | | 5,865,000 | | | | 5,865,000 | |
Indiana State Financing Authority (Resource Recovery Revenue, Bank of America NA LOC) | | | 0.07 | | | | 12/01/2039 | | | | 5,000,000 | | | | 5,000,000 | |
| | | | |
| | | | | | | | | | | | | | | 10,865,000 | |
| | | | | | | | | | | | | | | | |
| | | | |
Iowa: 0.06% | | | | | | | | | | | | | | | | |
| | | | |
| Variable Rate Demand Note§: 0.06% | | | | | | | | | | | | | | | | |
Iowa Finance Authority Student Housing Des Moines LLC Project A (Housing Revenue, CitiBank NA LOC) | | | 0.09 | | | | 06/01/2039 | | | | 10,000,000 | | | | 10,000,000 | |
| | | | | | | | | | | | | | | | |
| | | | | | |
| Portfolio of Investments—July 31, 2011 (Unaudited) | | Wells Fargo Advantage Cash Investment Money Market Fund | | | 17 | |
| | | | | | | | | | | | | | | | |
| Security Name | | Interest Rate | | | Maturity Date | | | Principal | | | Value | |
| | | | | | | | | | | | | | | | |
| | | | |
Louisiana: 0.14% | | | | | | | | | | | | | | | | |
| | | | |
| Other Municipal Debt: 0.05% | | | | | | | | | | | | | | | | |
Louisiana Department of Airport (Airport Revenue) | | | 0.25 | % | | | 08/05/2011 | | | $ | 7,000,000 | | | $ | 7,000,000 | |
| | | | | | | | | | | | | | | | |
| | | | |
| Variable Rate Demand Notes§: 0.09% | | | | | | | | | | | | | | | | |
Louisiana Public Facilities Authority (Health Revenue, JPMorgan Chase Bank LOC) | | | 0.07 | | | | 08/01/2023 | | | | 2,985,000 | | | | 2,985,000 | |
Parish of St. James LA Series A-1 (Energy Revenue) | | | 0.08 | | | | 11/01/2040 | | | | 6,500,000 | | | | 6,500,000 | |
Parish of St. James LA Series B-1 (Energy Revenue) | | | 0.10 | | | | 11/01/2040 | | | | 5,000,000 | | | | 5,000,000 | |
| | | | |
| | | | | | | | | | | | | | | 14,485,000 | |
| | | | | | | | | | | | | | | | |
| | | | |
Maryland: 0.13% | | | | | | | | | | | | | | | | |
| | | | |
| Variable Rate Demand Notes§: 0.13% | | | | | | | | | | | | | | | | |
Maryland CDA Department of Housing & Community Development Series 2007-J (Housing Revenue) | | | 0.11 | | | | 09/01/2031 | | | | 6,910,000 | | | | 6,910,000 | |
Maryland CDA Series 2006-G (Housing Revenue) | | | 0.15 | | | | 09/01/2040 | | | | 13,700,000 | | | | 13,700,000 | |
| | | | |
| | | | | | | | | | | | | | | 20,610,000 | |
| | | | | | | | | | | | | | | | |
| | | | |
Massachusetts: 0.19% | | | | | | | | | | | | | | | | |
| | | | |
| Variable Rate Demand Notes§: 0.19% | | | | | | | | | | | | | | | | |
Massachusetts State Development Finance Agency Babson College B (Education Revenue, Citizens Bank LOC) | | | 0.13 | | | | 10/01/2031 | | | | 25,130,000 | | | | 25,130,000 | |
Massachusetts State HEFA Series N-3 (Health Revenue, JPMorgan Chase Bank LOC) | | | 0.04 | | | | 10/01/2038 | | | | 4,000,000 | | | | 4,000,000 | |
| | | | |
| | | | | | | | | | | | | | | 29,130,000 | |
| | | | | | | | | | | | | | | | |
| | | | |
Michigan: 0.05% | | | | | | | | | | | | | | | | |
| | | | |
| Variable Rate Demand Notes§: 0.05% | | | | | | | | | | | | | | | | |
Michigan State Housing Development Authority Series A (Housing Revenue, GO of Authority Insured) | | | 0.21 | | | | 10/01/2037 | | | | 3,970,000 | | | | 3,970,000 | |
Wayne County MI IDA (IDR, Bank of America NA LOC) | | | 0.14 | | | | 05/01/2020 | | | | 3,000,000 | | | | 3,000,000 | |
| | | | |
| | | | | | | | | | | | | | | 6,970,000 | |
| | | | | | | | | | | | | | | | |
| | | | |
Minnesota: 0.17% | | | | | | | | | | | | | | | | |
| | | | |
| Variable Rate Demand Notes§: 0.17% | | | | | | | | | | | | | | | | |
Bloomington Associates MN (Housing Revenue, LaSalle Bank NA LOC) | | | 0.23 | | | | 08/01/2037 | | | | 20,500,000 | | | | 20,500,000 | |
Ramsey County MN Housing & Redevelopment MFHR Gateway Apartments LP Series A (Housing Revenue, LaSalle Bank NA LOC) | | | 0.15 | | | | 10/01/2038 | | | | 6,000,000 | | | | 6,000,000 | |
| | | | |
| | | | | | | | | | | | | | | 26,500,000 | |
| | | | | | | | | | | | | | | | |
| | | | |
Mississippi: 0.21% | | | | | | | | | | | | | | | | |
| | | | |
| Variable Rate Demand Note§: 0.21% | | | | | | | | | | | | | | | | |
Mississippi State GO Bonds Nissan North America Incorporated Project Series 2003A (Tax Revenue, GO of Commonwealth Insured) | | | 0.13 | | | | 11/01/2028 | | | | 31,875,000 | | | | 31,873,734 | |
| | | | | | | | | | | | | | | | |
| | | | |
Missouri: 0.06% | | | | | | | | | | | | | | | | |
| | | | |
| Variable Rate Demand Note§: 0.06% | | | | | | | | | | | | | | | | |
Kansas City MO IDA Revenue Ewing Marion Kauffman Foundation (IDR) | | | 0.33 | | | | 04/01/2027 | | | | 10,000,000 | | | | 10,000,000 | |
| | | | | | | | | | | | | | | | |
| | | | |
| 18 | | Wells Fargo Advantage Cash Investment Money Market Fund | | Portfolio of Investments—July 31, 2011 (Unaudited) |
| | | | | | | | | | | | | | | | |
| Security Name | | Interest Rate | | | Maturity Date | | | Principal | | | Value | |
| | | | | | | | | | | | | | | | |
| | | | |
Nebraska: 0.22% | | | | | | | | | | | | | | | | |
| | | | |
| Variable Rate Demand Note§: 0.22% | | | | | | | | | | | | | | | | |
Central Plains NE Nebraska Gas Project #2 Series 2009 (Utilities Revenue) | | | 0.08 | % | | | 08/01/2039 | | | $ | 34,695,000 | | | $ | 34,695,000 | |
| | | | | | | | | | | | | | | | |
| | | | |
Nevada: 0.22% | | | | | | | | | | | | | | | | |
| | | | |
| Variable Rate Demand Notes§: 0.22% | | | | | | | | | | | | | | | | |
Las Vegas NV EDFA Andre Agassi Foundation Project (Education Revenue, Bank of America NA LOC) | | | 0.09 | | | | 10/01/2035 | | | | 18,000,000 | | | | 18,000,000 | |
Las Vegas NV EDFA Keep Memory Alive Project (Miscellaneous Revenue, PNC Bank NA LOC) | | | 0.06 | | | | 05/01/2037 | | | | 15,800,000 | | | | 15,800,000 | |
| | | | |
| | | | | | | | | | | | | | | 33,800,000 | |
| | | | | | | | | | | | | | | | |
| | | | |
New Jersey: 0.58% | | | | | | | | | | | | | | | | |
| | | | |
| Variable Rate Demand Notes§: 0.58% | | | | | | | | | | | | | | | | |
New Jersey EDA NUI Corporation Project Series A (Energy Revenue, JPMorgan Chase Bank LOC) | | | 0.20 | | | | 06/01/2026 | | | | 7,000,000 | | | | 7,000,000 | |
New Jersey EDA Pivotal Utility Holdings Incorporated Project Series 2007 (Energy Revenue, JPMorgan Chase Bank LOC) | | | 0.20 | | | | 06/01/2032 | | | | 9,000,000 | | | | 9,000,000 | |
New Jersey HFFA Princeton Healthcare Series A (Hospital Revenue, Bank of America NA LOC) | | | 0.10 | | | | 07/01/2041 | | | | 2,000,000 | | | | 2,000,000 | |
New Jersey State Housing & Mortgage Finance Agency Series B (Housing Revenue, Bank of America NA LOC) | | | 0.10 | | | | 05/01/2048 | | | | 34,755,000 | | | | 34,755,000 | |
New Jersey State Turnpike Authority Series C (Miscellaneous Revenue, JPMorgan Chase Bank LOC) | | | 0.06 | | | | 06/15/2032 | | | | 13,000,000 | | | | 13,000,000 | |
New Jersey State Turnpike Authority Series D (Miscellaneous Revenue, Societe Generale LOC, NATL-RE FGIC Insured) | | | 0.19 | | | | 01/01/2018 | | | | 21,000,000 | | | | 21,000,000 | |
Salem County NJ PCFA Atlantic City Electric Company Project Series A (Utilities Revenue, JPMorgan Chase Bank LOC) | | | 0.08 | | | | 04/15/2014 | | | | 4,000,000 | | | | 4,000,000 | |
| | | | |
| | | | | | | | | | | | | | | 90,755,000 | |
| | | | | | | | | | | | | | | | |
| | | | |
New York: 0.69% | | | | | | | | | | | | | | | | |
| | | | |
| Other Municipal Debt: 0.10% | | | | | | | | | | | | | | | | |
New York Metropolitan Transportation Authority (Transportation Revenue) | | | 0.19 | | | | 08/03/2011 | | | | 5,000,000 | | | | 5,000,000 | |
New York Metropolitan Transportation Authority (Transportation Revenue) | | | 0.27 | | | | 08/02/2011 | | | | 11,000,000 | | | | 11,000,000 | |
| | | | |
| | | | | | | | | | | | | | | 16,000,000 | |
| | | | | | | | | | | | | | | | |
| | | | |
| Variable Rate Demand Notes§: 0.59% | | | | | | | | | | | | | | | | |
New York City NY Housing Development Corporation Multifamily Rental Housing The Balton Project Series A (Housing Revenue, Bank of America NA LOC, FHLMC Insured) | | | 0.06 | | | | 09/01/2049 | | | | 10,875,000 | | | | 10,875,000 | |
New York City NY Municipal Water Finance Authority (Water & Sewer Revenue)†† | | | 0.24 | | | | 06/15/2044 | | | | 8,000,000 | | | | 8,000,000 | |
New York City NY Municipal Water Finance Authority Subseries B-1 (Water & Sewer Revenue) | | | 0.05 | | | | 06/15/2024 | | | | 6,998,000 | | | | 6,998,000 | |
New York City NY Subseries B (GO-Local, TD Bank NA LOC) | | | 0.05 | | | | 09/01/2027 | | | | 9,000,000 | | | | 9,000,000 | |
New York City NY Subseries C-4 (GO-Local, Bank of Tokyo-Mitsubishi UFJ LOC) | | | 0.16 | | | | 08/01/2020 | | | | 2,000,000 | | | | 2,000,000 | |
New York City NY Transitional Financing Authority Class A (Miscellaneous Revenue, FSA-CR FGIC State Aid Withholding Insured) | | | 0.12 | | | | 07/15/2036 | | | | 30,500,000 | | | | 30,500,000 | |
New York HFA Victory Housing Project Series 2000-A (Housing Revenue, FHLMC Insured) | | | 0.05 | | | | 11/01/2033 | | | | 4,500,000 | | | | 4,500,000 | |
| | | | | | |
| Portfolio of Investments—July 31, 2011 (Unaudited) | | Wells Fargo Advantage Cash Investment Money Market Fund | | | 19 | |
| | | | | | | | | | | | | | | | |
| Security Name | | Interest Rate | | | Maturity Date | | | Principal | | | Value | |
| | | | | | | | | | | | | | | | |
| | | | |
| Variable Rate Demand Notes§ (continued) | | | | | | | | | | | | | | | | |
New York Metropolitan Transportation Authority ROC RR 11 R-11645 (Transportation Revenue, FSA Insured)†† | | | 0.23 | % | | | 11/15/2025 | | | $ | 805,000 | | | $ | 805,000 | |
New York PFOTER (Miscellaneous Revenue)†† | | | 0.34 | | | | 06/15/2050 | | | | 9,000,000 | | | | 9,000,000 | |
New York State Housing Finance Agency Series A (Housing Revenue, FNMA Insured) | | | 0.18 | | | | 05/01/2029 | | | | 5,000,000 | | | | 5,000,000 | |
New York State Housing Finance Agency Taxable 600 West 42nd B (Housing Revenue, Bank of New York LOC) | | | 0.28 | | | | 11/01/2041 | | | | 4,260,000 | | | | 4,260,000 | |
| | | | |
| | | | | | | | | | | | | | | 90,938,000 | |
| | | | | | | | | | | | | | | | |
| | | | |
North Carolina: 0.09% | | | | | | | | | | | | | | | | |
| | | | |
| Variable Rate Demand Note§: 0.09% | | | | | | | | | | | | | | | | |
North Carolina Education Care Community Health Care Facilities University Health Systems of Eastern Carolina Series 2008-B-2 (Hospital Revenue, Branch Banking & Trust LOC) | | | 0.07 | | | | 12/01/2036 | | | | 14,405,000 | | | | 14,405,000 | |
| | | | | | | | | | | | | | | | |
| | | | |
Ohio: 0.22% | | | | | | | | | | | | | | | | |
| | | | |
| Variable Rate Demand Notes§: 0.22% | | | | | | | | | | | | | | | | |
Cleveland-Cuyahoga County OH Port Authority Carnagie 89th Garage & Service Center LLC Project Series 2007 (Health Revenue, JPMorgan Chase Bank LOC) | | | 0.10 | | | | 01/01/2037 | | | | 4,700,000 | | | | 4,700,000 | |
Lake County OH Hospital Facilities Series A (Health Revenue, JPMorgan Chase Bank LOC) | | | 0.07 | | | | 08/15/2041 | | | | 3,980,000 | | | | 3,980,000 | |
Ohio State HFA Residential Management Taxable Series I (Housing Revenue, GNMA/FNMA Insured) | | | 0.19 | | | | 09/01/2039 | | | | 24,707,000 | | | | 24,707,000 | |
| | | | |
| | | | | | | | | | | | | | | 33,387,000 | |
| | | | | | | | | | | | | | | | |
| | | | |
Oregon: 0.08% | | | | | | | | | | | | | | | | |
| | | | |
| Variable Rate Demand Notes§: 0.08% | | | | | | | | | | | | | | | | |
Forest City OR Residential Management Incorporated PFOTER (Miscellaneous Revenue)†† | | | 0.34 | | | | 07/26/2012 | | | | 6,000,000 | | | | 6,000,000 | |
Oregon Housing & Community Services Department Series E (Housing Revenue) | | | 0.19 | | | | 07/01/2038 | | | | 7,000,000 | | | | 7,000,000 | |
| | | | |
| | | | | | | | | | | | | | | 13,000,000 | |
| | | | | | | | | | | | | | | | |
| | | | |
Pennsylvania: 0.20% | | | | | | | | | | | | | | | | |
| | | | |
| Variable Rate Demand Notes§: 0.20% | | | | | | | | | | | | | | | | |
Delaware River Port Authority Series B (Transportation Revenue, Bank of America NA LOC) | | | 0.09 | | | | 01/01/2026 | | | | 10,000,000 | | | | 10,000,000 | |
Doylestown PA Hospital Authority Series B (Health Revenue, PNC Bank NA LOC) | | | 0.06 | | | | 07/01/2037 | | | | 20,400,000 | | | | 20,400,000 | |
| | | | |
| | | | | | | | | | | | | | | 30,400,000 | |
| | | | | | | | | | | | | | | | |
| | | | |
South Carolina: 0.20% | | | | | | | | | | | | | | | | |
| | | | |
| Other Municipal Debt: 0.05% | | | | | | | | | | | | | | | | |
South Carolina Public Service Authority (Miscellaneous Revenue) | | | 0.18 | | | | 08/16/2011 | | | | 8,500,000 | | | | 8,500,000 | |
| | | | | | | | | | | | | | | | |
| | | | |
| Variable Rate Demand Notes§: 0.15% | | | | | | | | | | | | | | | | |
South Carolina Public Service Authority (Miscellaneous Revenue) | | | 0.18 | | | | 08/17/2011 | | | | 8,000,000 | | | | 8,000,000 | |
South Carolina Public Service Authority (Miscellaneous Revenue)†† | | | 0.24 | | | | 01/01/2050 | | | | 15,000,000 | | | | 15,000,000 | |
| | | | |
| | | | | | | | | | | | | | | 23,000,000 | |
| | | | | | | | | | | | | | | | |
| | | | |
| 20 | | Wells Fargo Advantage Cash Investment Money Market Fund | | Portfolio of Investments—July 31, 2011 (Unaudited) |
| | | | | | | | | | | | | | | | |
| Security Name | | Interest Rate | | | Maturity Date | | | Principal | | | Value | |
| | | | | | | | | | | | | | | | |
| | | | |
South Dakota: 0.03% | | | | | | | | | | | | | | | | |
| | | | |
| Variable Rate Demand Note§: 0.03% | | | | | | | | | | | | | | | | |
South Dakota Housing Development Authority Series C (Housing Revenue, FNMA Insured) | | | 0.17 | % | | | 05/01/2037 | | | $ | 5,000,000 | | | $ | 5,000,000 | |
| | | | | | | | | | | | | | | | |
| | | | |
Tennessee: 0.20% | | | | | | | | | | | | | | | | |
| | | | |
| Other Municipal Debt: 0.02% | | | | | | | | | | | | | | | | |
Montgomery County TN (GO-Local) | | | 0.24 | | | | 08/01/2011 | | | | 3,000,000 | | | | 3,000,000 | |
| | | | | | | | | | | | | | | | |
| | | | |
| Variable Rate Demand Notes§: 0.18% | | | | | | | | | | | | | | | | |
Metropolitan Government Nashville & Davidson County TN Stewarts Ferry Apartments (Housing Revenue, FHLMC Insured) | | | 0.11 | | | | 01/01/2034 | | | | 5,000,000 | | | | 5,000,000 | |
Metropolitan Government Nashville & Davidson County TN Weatherly Ridge Apartments Series A (Housing Revenue, U.S. Bank NA LOC) | | | 0.21 | | | | 12/01/2041 | | | | 3,000,000 | | | | 3,000,000 | |
Montgomery County TN Public Building Authority Pooled Financing Revenue (Miscellaneous Revenue, Bank of America NA LOC) | | | 0.24 | | | | 07/01/2034 | | | | 15,065,000 | | | | 15,065,000 | |
Montgomery County TN Public Building Authority Pooled Financing Revenue (Miscellaneous Revenue, Bank of America NA LOC) | | | 0.24 | | | | 02/01/2036 | | | | 5,130,000 | | | | 5,130,000 | |
| | | | |
| | | | | | | | | | | | | | | 28,195,000 | |
| | | | | | | | | | | | | | | | |
| | | | |
Texas: 1.31% | | | | | | | | | | | | | | | | |
| | | | |
| Other Municipal Debt: 0.10% | | | | | | | | | | | | | | | | |
Texas Municipal Power Agency (Utilities Revenue) | | | 0.30 | | | | 08/09/2011 | | | | 16,000,000 | | | | 16,000,000 | |
| | | | | | | | | | | | | | | | |
| | | | |
| Variable Rate Demand Notes§: 1.21% | | | | | | | | | | | | | | | | |
Austin TX Airport System Series A (Airport Revenue, State Street Bank & Trust Company LOC) | | | 0.08 | | | | 11/15/2017 | | | | 7,000,000 | | | | 7,000,000 | |
Bexar County TX Health Facilities (Health Revenue, JPMorgan Chase Bank LOC) | | | 0.10 | | | | 12/01/2032 | | | | 2,450,000 | | | | 2,450,000 | |
Harris County TX Cultural Education Facilities Finance Corporation Hermann Health Series A (Miscellaneous Revenue, JPMorgan Chase Bank LOC) | | | 0.20 | | | | 06/01/2038 | | | | 10,000,000 | | | | 10,000,000 | |
Harris County TX Cultural Education Facilities Finance Corporation Hermann Health Series D1 (Hospital Revenue, JPMorgan Chase Bank LOC) | | | 0.07 | | | | 06/01/2029 | | | | 7,000,000 | | | | 7,000,000 | |
Harris County TX Cultural Education Facilities Finance Corporation Hermann Health Series D2 (Health Revenue, JPMorgan Chase & Company LOC) | | | 0.07 | | | | 06/01/2029 | | | | 16,500,000 | | | | 16,500,000 | |
JPMorgan Chase PUTTER/DRIVER Trust Series 3812 (Miscellaneous Revenue)†† | | | 0.21 | | | | 08/31/2011 | | | | 100,000,000 | | | | 100,000,000 | |
Midlothian TX Industrial Development Corporation (IDR, UBS AG LOC) | | | 0.05 | | | | 08/01/2034 | | | | 15,700,000 | | | | 15,700,000 | |
Mission TX Economic Development Corporation (Miscellaneous Revenue, Bank of America NA LOC) | | | 0.13 | | | | 04/01/2022 | | | | 6,000,000 | | | | 6,000,000 | |
Pasadena TX Independent School District Series B (Education Revenue, AGM Insured) | | | 0.16 | | | | 02/01/2035 | | | | 2,000,000 | | | | 2,000,000 | |
Texas State Taxable Product Development Program Series A (Miscellaneous Revenue) | | | 0.15 | | | | 06/01/2045 | | | | 13,500,000 | | | | 13,500,000 | |
Tyler TX Health Facilities Development Corporation Mother Frances Hospital Series B (Hospital Revenue, Bank of America NA LOC) | | | 0.18 | | | | 07/01/2020 | | | | 8,500,000 | | | | 8,500,000 | |
| | | | |
| | | | | | | | | | | | | | | 188,650,000 | |
| | | | | | | | | | | | | | | | |
| | | | | | |
| Portfolio of Investments—July 31, 2011 (Unaudited) | | Wells Fargo Advantage Cash Investment Money Market Fund | | | 21 | |
| | | | | | | | | | | | | | | | |
| Security Name | | Interest Rate | | | Maturity Date | | | Principal | | | Value | |
| | | | | | | | | | | | | | | | |
| | | | |
Vermont: 0.21% | | | | | | | | | | | | | | | | |
| | | | |
| Variable Rate Demand Note§: 0.21% | | | | | | | | | | | | | | | | |
Vermont State Student Assistance Corporation (Education Revenue, Lloyds Bank LOC) | | | 0.08 | % | | | 12/15/2040 | | | $ | 32,645,000 | | | $ | 32,645,000 | |
| | | | | | | | | | | | | | | | |
| | | | |
Virginia: 0.13% | | | | | | | | | | | | | | | | |
| | | | |
| Variable Rate Demand Notes§: 0.13% | | | | | | | | | | | | | | | | |
Harrisonburg VA Redevelopment & Housing Authority (Housing Revenue, Bank of America NA LOC) | | | 0.15 | | | | 05/01/2026 | | | | 6,110,000 | | | | 6,110,000 | |
Norfolk VA Redevelopment & Housing Authority Old Dominion University Project (Housing Revenue, Bank of America NA LOC) | | | 0.26 | | | | 08/01/2033 | | | | 13,815,000 | | | | 13,815,000 | |
| | | | |
| | | | | | | | | | | | | | | 19,925,000 | |
| | | | | | | | | | | | | | | | |
| | | | |
Washington: 0.06% | | | | | | | | | | | | | | | | |
| | | | |
| Other Municipal Debt: 0.06% | | | | | | | | | | | | | | | | |
Providence WA Health and Services (Miscellaneous Revenue, Bank of America NA LOC) | | | 0.26 | | | | 08/01/2011 | | | | 10,000,000 | | | | 10,000,000 | |
| | | | | | | | | | | | | | | | |
| | | | |
West Virginia: 0.06% | | | | | | | | | | | | | | | | |
| | | | |
| Variable Rate Demand Note§: 0.06% | | | | | | | | | | | | | | | | |
Cabell County WV University Facilities (Education Revenue, Bank of America NA LOC) | | | 0.11 | | | | 07/01/2039 | | | | 8,995,000 | | | | 8,995,000 | |
| | | | | | | | | | | | | | | | |
| | | | |
Wisconsin: 0.04% | | | | | | | | | | | | | | | | |
| | | | |
| Variable Rate Demand Notes§: 0.04% | | | | | | | | | | | | | | | | |
Wisconsin Housing & EDA (Housing Revenue, FNMA LOC, GO of Authority Insured) | | | 0.08 | | | | 09/01/2035 | | | | 4,335,000 | | | | 4,335,000 | |
Wisconsin State HEFA (Education Revenue, U.S. Bank NA LOC) | | | 0.04 | | | | 12/01/2033 | | | | 2,000,000 | | | | 2,000,000 | |
| | | | |
| | | | | | | | | | | | | | | 6,335,000 | |
| | | | | | | | | | | | | | | | |
| | | | |
Wyoming: 0.21% | | | | | | | | | | | | | | | | |
| | | | |
| Variable Rate Demand Notes§: 0.21% | | | | | | | | | | | | | | | | |
Sweetwater County WY Pacific Corporation Project Series A (Utilities Revenue, Barclays Bank plc LOC) | | | 0.06 | | | | 07/01/2015 | | | | 31,400,000 | | | | 31,400,000 | |
Wyoming Student Loan Corporation Series A-1 (Education Revenue, Royal Bank of Canada LOC) | | | 0.08 | | | | 06/01/2035 | | | | 1,660,000 | | | | 1,660,000 | |
| | | | |
| | | | | | | | | | | | | | | 33,060,000 | |
| | | | | | | | | | | | | | | | |
| | | | |
Total Municipal Bonds and Notes (Cost $1,990,601,734) | | | | | | | | | | | | | | | 1,990,601,734 | |
| | | | | | | | | | | | | | | | |
| | | | |
| Other Instruments: 1.11% | | | | | | | | | | | | | | | | |
Alaska Housing Finance Corporation Municipal Commercial Paper^ | | | 0.20 | | | | 08/16/2011 | | | | 4,000,000 | | | | 3,999,650 | |
Bank of America Bankers Acceptance Note^ | | | 0.20 | | | | 08/31/2011 | | | | 34,367,957 | | | | 34,361,942 | |
GBG LLC Custody Receipts††§ | | | 0.33 | | | | 09/01/2027 | | | | 12,292,000 | | | | 12,292,000 | |
Illinois Educational Facilities Authority Series 1990 Variable Rate Demand Obligation Commercial Paper | | | 0.18 | | | | 08/04/2011 | | | | 10,000,000 | | | | 10,000,000 | |
ING Bank NV Floating Rate Note††± | | | 0.78 | | | | 02/10/2012 | | | | 40,000,000 | | | | 40,000,000 | |
ING Bank NV Floating Rate Note††± | | | 0.78 | | | | 02/02/2012 | | | | 42,000,000 | | | | 42,000,000 | |
St. Joseph County IN Municipal Commercial Paper^ | | | 0.16 | | | | 08/18/2011 | | | | 28,053,000 | | | | 28,050,748 | |
St. Joseph County IN Municipal Commercial Paper^ | | | 0.19 | | | | 08/04/2011 | | | | 2,000,000 | | | | 1,999,958 | |
| | | | |
Total Other Instruments (Cost $172,704,298) | | | | | | | | | | | | | | | 172,704,298 | |
| | | | | | | | | | | | | | | | |
| | | | |
| 22 | | Wells Fargo Advantage Cash Investment Money Market Fund | | Portfolio of Investments—July 31, 2011 (Unaudited) |
| | | | | | | | | | | | | | | | |
| Security Name | | Interest Rate | | | Maturity Date | | | Principal | | | Value | |
| | | | | | | | | | | | | | | | |
| | | | |
Other Notes: 3.13% | | | | | | | | | | | | | | | | |
| | | | |
| Corporate Bonds and Notes: 2.92% | | | | | | | | | | | | | | | | |
ACTS Retirement Life Communities Incorporated§ | | | 0.21 | % | | | 11/15/2029 | | | $ | 12,335,000 | | | $ | 12,335,000 | |
Bank of America Corporation± | | | 1.07 | | | | 12/02/2011 | | | | 240,390,000 | | | | 241,101,671 | |
Bear Stearns & Companies Incorporated± | | | 0.47 | | | | 08/15/2011 | | | | 19,175,000 | | | | 19,176,227 | |
Citigroup Funding Incorporated± | | | 0.23 | | | | 11/15/2011 | | | | 3,000,000 | | | | 2,999,437 | |
General Electric Capital Corporation± | | | 0.45 | | | | 03/12/2012 | | | | 25,000,000 | | | | 25,037,795 | |
General Electric Capital Corporation± | | | 1.18 | | | | 12/09/2011 | | | | 76,773,000 | | | | 77,045,247 | |
JPMorgan Chase & Company± | | | 0.48 | | | | 06/15/2012 | | | | 15,000,000 | | | | 15,035,989 | |
LTF Real Estate LLC††±§ | | | 0.23 | | | | 06/01/2033 | | | | 15,400,000 | | | | 15,400,000 | |
Morgan Stanley± | | | 1.10 | | | | 12/01/2011 | | | | 9,100,000 | | | | 9,127,671 | |
Seariver Maritime Incorporated(i)± | | | 0.35 | | | | 10/01/2011 | | | | 4,400,000 | | | | 4,400,000 | |
State Street Bank & Trust Company± | | | 0.45 | | | | 09/15/2011 | | | | 30,000,000 | | | | 30,009,472 | |
US Central Federal Credit Union± | | | 0.25 | | | | 10/19/2011 | | | | 3,000,000 | | | | 3,000,215 | |
| | | | |
| | | | | | | | | | | | | | | 454,668,724 | |
| | | | | | | | | | | | | | | | |
| | | | |
| Yankee Corporate Bonds and Notes: 0.21% | | | | | | | | | | | | | | | | |
Eksportfinans ASA± | | | 0.26 | | | | 09/22/2011 | | | | 33,000,000 | | | | 33,000,000 | |
| | | | | | | | | | | | | | | | |
| | | | |
Total Other Notes (Cost $487,668,724) | | | | | | | | | | | | | | | 487,668,724 | |
| | | | | | | | | | | | | | | | |
| | | | |
Repurchase Agreements(z): 0.72% | | | | | | | | | | | | | | | | |
Deutsche Bank Securities, dated 07/29/2011, maturity value $112,002,800(1) | | | 0.30 | | | | 08/01/2011 | | | | 112,000,000 | | | | 112,000,000 | |
| | | | |
Total Repurchase Agreements (Cost $112,000,000) | | | | | | | | | | | | | | | 112,000,000 | |
| | | | | | | | | | | | | | | | |
| | | | |
| | | Yield | | | | | | | | | | |
| | | | |
| Treasury Debt: 3.94% | | | | | | | | | | | | | | | | |
US Treasury Bill | | | 0.12 | | | | 10/06/2011 | | | | 208,000,000 | | | | 207,954,240 | |
US Treasury Bill | | | 0.15 | | | | 08/11/2011 | | | | 156,000,000 | | | | 155,992,711 | |
US Treasury Bill | | | 0.15 | | | | 08/25/2011 | | | | 130,000,000 | | | | 129,986,567 | |
US Treasury Bill | | | 0.16 | | | | 08/18/2011 | | | | 121,000,000 | | | | 120,990,572 | |
| | | | |
Total Treasury Debt (Cost $614,924,090) | | | | | | | | | | | | | | | 614,924,090 | |
| | | | | | | | | | | | | | | | |
| | | | | | | | |
| Total Investments in Securities | | | | | | | | |
| (Cost $14,556,086,450)* | | | 93.34 | % | | | 14,556,086,450 | |
Other Assets and Liabilities, Net | | | 6.66 | | | | 1,038,870,963 | |
| | | | | | | | |
| Total Net Assets | | | 100.00 | % | | $ | 15,594,957,413 | |
| | | | | | | | |
| †† | Security that may be resold to “qualified institutional buyers” under Rule 144A or securities offered pursuant to Section 4(2) of the Securities Act of 1933, as amended. |
| § | These securities are subject to a demand feature which reduces the effective maturity. |
| ± | Variable rate investments. |
| ^ | Zero coupon security. Rate represents yield to maturity. |
| | (1) | Commercial papers, 0.00%, 8/3/2011 to 10/20/2011, market value is $114,240,001. |
| * | Cost for federal income tax purposes is substantially the same as for financial reporting purposes. |
The accompanying notes are an integral part of these financial statements.
| | | | | | |
| Statement of Assets and Liabilities—July 31, 2011 (Unaudited) | | Wells Fargo Advantage Cash Investment Money Market Fund | | | 23 | |
| | | | |
| | | | |
| |
Assets | | | | |
Investments in unaffiliated securities, at amortized cost | | $ | 14,556,086,450 | |
Cash | | | 897,053,404 | |
Receivable for investments sold | | | 138,045,000 | |
Receivable for Fund shares sold | | | 5,638,615 | |
Receivable for interest | | | 2,431,801 | |
Prepaid expenses and other assets | | | 155,884 | |
| | | | |
Total assets | | | 15,599,411,154 | |
| | | | |
| |
Liabilities | | | | |
Dividends payable | | | 202,641 | |
Payable for Fund shares redeemed | | | 834,512 | |
Advisory fee payable | | | 317,401 | |
Due to other related parties | | | 1,611,633 | |
Shareholder report expenses payable | | | 378,496 | |
Custodian and accounting fees payable | | | 474,763 | |
Shareholder servicing fees payable | | | 544,331 | |
Accrued expenses and other liabilities | | | 89,964 | |
| | | | |
Total liabilities | | | 4,453,741 | |
| | | | |
Total net assets | | $ | 15,594,957,413 | |
| | | | |
| |
NET ASSETS CONSIST OF | | | | |
Paid-in capital | | $ | 15,598,713,252 | |
Overdistributed net investment income | | | (6,475 | ) |
Accumulated net realized losses on investments | | | (3,749,364 | ) |
| | | | |
Total net assets | | $ | 15,594,957,413 | |
| | | | |
| |
COMPUTATION OF NET ASSET VALUE PER SHARE1 | | | | |
Net assets – Administrator Class | | $ | 631,901,490 | |
Shares outstanding – Administrator Class | | | 631,910,941 | |
Net asset value per share – Administrator Class | | | $1.00 | |
Net assets – Institutional Class | | $ | 7,130,924,400 | |
Shares outstanding – Institutional Class | | | 7,131,215,629 | |
Net asset value per share – Institutional Class | | | $1.00 | |
Net assets – Select Class | | $ | 5,509,588,154 | |
Shares outstanding – Select Class | | | 5,509,765,491 | |
Net asset value per share – Select Class | | | $1.00 | |
Net assets – Service Class | | $ | 2,322,543,369 | |
Shares outstanding – Service Class | | | 2,322,593,626 | |
Net asset value per share – Service Class | | | $1.00 | |
| 1. | The Fund has an unlimited number of authorized shares. |
The accompanying notes are an integral part of these financial statements.
| | | | |
| 24 | | Wells Fargo Advantage Cash Investment Money Market Fund | | Statement of Operations—Six Months Ended July 31, 2011 (Unaudited) |
| | | | |
| | | | |
| |
Investment income | | | | |
Interest | | $ | 25,398,523 | |
| | | | |
| |
Expenses | | | | |
Advisory fee | | | 9,226,995 | |
Administration fees | | | | |
Fund level | | | 3,511,934 | |
Administrator Class | | | 358,263 | |
Institutional Class | | | 3,321,442 | |
Select Class | | | 1,440,727 | |
Service Class | | | 1,338,133 | |
Shareholder servicing fees | | | | |
Administrator Class | | | 355,473 | |
Service Class | | | 2,773,188 | |
Custody and accounting fees | | | 474,290 | |
Professional fees | | | 21,418 | |
Registration fees | | | 22,477 | |
Trustees’ fees and expenses | | | 5,245 | |
Shareholder report expense | | | 10,000 | |
Other fees and expenses | | | 148,771 | |
| | | | |
Total expenses | | | 23,008,356 | |
Less: Fee waivers and/or expense reimbursements | | | (6,129,146 | ) |
| | | | |
Net expenses | | | 16,879,210 | |
| | | | |
Net investment income | | | 8,519,313 | |
Net realized gains on investments | | | 173,775 | |
| | | | |
Net increase in net assets resulting from operations | | $ | 8,693,088 | |
| | | | |
The accompanying notes are an integral part of these financial statements.
| | | | | | |
| Statements of Changes in Net Assets | | Wells Fargo Advantage Cash Investment Money Market Fund | | | 25 | |
| | | | | | | | | | | | | | | | | | | | | | | | |
| | | Six Months Ended July 31, 2011 (Unaudited) | | | Year Ended January 31, 20111 | | | Year Ended February 28, 2010 | |
| | | | | | |
Operations | | | | | | | | | | | | | | | | | | | | | | | | |
Net investment income | | | | | | $ | 8,519,313 | | | | | | | $ | 23,412,743 | | | | | | | $ | 68,948,804 | |
Net realized gains on investments | | | | | | | 173,775 | | | | | | | | 3,948,898 | | | | | | | | 1,305,502 | |
| | | | | | | | | | | | | | | | | | | | | | | | |
Net increase in net assets resulting from operations | | | | | | | 8,693,088 | | | | | | | | 27,361,641 | | | | | | | | 70,254,306 | |
| | | | | | | | | | | | | | | | | | | | | | | | |
| | | | | |
Distributions to shareholders from | | | | | | | | | | | | | | | | | | | | | |
Net investment income | | | | | | | | | | | | | | | | | | | | | | | | |
Administrator Class | | | | | | | (35,827 | ) | | | | | | | (283,173 | ) | | | | | | | (3,197,134 | ) |
Institutional Class | | | | | | | (3,158,305 | ) | | | | | | | (12,418,004 | ) | | | | | | | (36,416,120 | ) |
Select Class | | | | | | | (5,213,667 | ) | | | | | | | (10,392,091 | ) | | | | | | | (21,381,205 | ) |
Service Class | | | | | | | (111,514 | ) | | | | | | | (319,475 | ) | | | | | | | (7,953,067 | ) |
Net realized gains | | | | | | | | | | | | | | | | | | | | | | | | |
Administrator Class | | | | | | | 0 | | | | | | | | (3,449 | ) | | | | | | | (17,127 | ) |
Institutional Class | | | | | | | 0 | | | | | | | | (39,822 | ) | | | | | | | (130,942 | ) |
Select Class | | | | | | | 0 | | | | | | | | (28,406 | ) | | | | | | | (64,816 | ) |
Service Class | | | | | | | 0 | | | | | | | | (13,653 | ) | | | | | | | (59,895 | ) |
| | | | | | | | | | | | | | | | | | | | | | | | |
Total distributions to shareholders | | | | | | | (8,519,313 | ) | | | | | | | (23,498,073 | ) | | | | | | | (69,220,306 | ) |
| | | | | | | | | | | | | | | | | | | | | | | | |
| | | | | | |
| | | Shares | | | | | | Shares | | | | | | Shares | | | | |
| | | | | | |
Capital share transactions | | | | | | | | | | | | | | | | | | | | | | | | |
Proceeds from shares sold | | | | | | | | | | | | | | | | | | | | | | | | |
Administrator Class | | | 1,317,783,123 | | | | 1,317,783,123 | | | | 5,107,054,074 | | | | 5,107,054,074 | | | | 2,254,684,919 | | | | 2,254,684,919 | |
Institutional Class | | | 18,664,072,325 | | | | 18,664,072,325 | | | | 45,806,193,396 | | | | 45,806,193,396 | | | | 52,907,799,957 | | | | 52,907,799,957 | |
Select Class | | | 21,541,019,120 | | | | 21,541,019,120 | | | | 52,309,085,388 | | | | 52,309,085,388 | | | | 32,433,686,427 | | | | 32,433,686,427 | |
Service Class | | | 6,473,259,770 | | | | 6,473,259,770 | | | | 33,567,738,393 | | | | 33,567,738,393 | | | | 45,102,274,340 | | | | 45,102,274,340 | |
| | | | | | | | | | | | | | | | | | | | | | | | |
| | | | | | | 47,996,134,338 | | | | | | | | 136,790,071,251 | | | | | | | | 132,698,445,643 | |
| | | | | | | | | | | | | | | | | | | | | | | | |
Reinvestment of distributions | | | | | | | | | | | | | | | | | | | | | | | | |
Administrator Class | | | 27,613 | | | | 27,613 | | | | 240,723 | | | | 240,723 | | | | 2,808,526 | | | | 2,808,526 | |
Institutional Class | | | 1,695,322 | | | | 1,695,322 | | | | 6,927,909 | | | | 6,927,909 | | | | 18,872,660 | | | | 18,872,660 | |
Select Class | | | 4,174,053 | | | | 4,174,053 | | | | 8,102,833 | | | | 8,102,833 | | | | 3,522,975 | | | | 3,522,975 | |
Service Class | | | 50,500 | | | | 50,500 | | | | 131,403 | | | | 131,403 | | | | 15,869,130 | | | | 15,869,130 | |
| | | | | | | | | | | | | | | | | | | | | | | | |
| | | | | | | 5,947,488 | | | | | | | | 15,402,868 | | | | | | | | 41,073,291 | |
| | | | | | | | | | | | | | | | | | | | | | | | |
Payment for shares redeemed | | | | | | | | | | | | | | | | | | | | | | | | |
Administrator Class | | | (1,450,511,786 | ) | | | (1,450,511,786 | ) | | | (5,355,821,692 | ) | | | (5,355,821,692 | ) | | | (2,659,762,118 | ) | | | (2,659,762,118 | ) |
Institutional Class | | | (19,803,154,046 | ) | | | (19,803,154,046 | ) | | | (49,008,978,375 | ) | | | (49,008,978,375 | ) | | | (54,171,372,667 | ) | | | (54,171,372,667 | ) |
Select Class | | | (23,629,523,727 | ) | | | (23,629,523,727 | ) | | | (49,620,548,019 | ) | | | (49,620,548,019 | ) | | | (34,780,768,334 | ) | | | (34,780,768,334 | ) |
Service Class | | | (6,435,391,802 | ) | | | (6,435,391,802 | ) | | | (35,299,088,279 | ) | | | (35,299,088,279 | ) | | | (43,954,038,008 | ) | | | (43,954,038,008 | ) |
| | | | | | | | | | | | | | | | | | | | | | | | |
| | | | | | | (51,318,581,361 | ) | | | | | | | (139,284,436,365 | ) | | | | | | | (135,565,941,127 | ) |
| | | | | | | | | | | | | | | | | | | | | | | | |
Net asset value of shares issued in acquisition | | | | | | | | | | | | | | | | | | | | | | | | |
Institutional Class | | | 0 | | | | 0 | | | | 2,576,607,084 | | | | 2,572,517,911 | | | | 0 | | | | 0 | |
| | | | | | | | | | | | | | | | | | | | | | | | |
Net increase (decrease) in net assets resulting from capital share transactions | | | | | | | (3,316,499,535 | ) | | | | | | | 93,555,665 | | | | | | | | (2,826,422,193 | ) |
| | | | | | | | | | | | | | | | | | | | | | | | |
Total increase (decrease) in net assets | | | | | | | (3,316,325,760 | ) | | | | | | | 97,419,233 | | | | | | | | (2,825,388,193 | ) |
| | | | | | | | | | | | | | | | | | | | | | | | |
| | | | | | |
Net assets | | | | | | | | | | | | | | | | | | | | | | | | |
Beginning of period | | | | | | | 18,911,283,173 | | | | | | | | 18,813,863,940 | | | | | | | | 21,639,252,133 | |
| | | | | | | | | | | | | | | | | | | | | | | | |
End of period | | | | | | $ | 15,594,957,413 | | | | | | | $ | 18,911,283,173 | | | | | | | $ | 18,813,863,940 | |
| | | | | | | | | | | | | | | | | | | | | | | | |
Overdistributed net investment income | | | | | | $ | (6,475 | ) | | | | | | $ | (6,475 | ) | | | | | | $ | (6,470 | ) |
| | | | | | | | | | | | | | | | | | | | | | | | |
| 1. | For the eleven months ended January 31, 2011. The Fund changed its fiscal year end from February 28 to January 31, effective January 31, 2011. |
The accompanying notes are an integral part of these financial statements.
| | | | |
| 26 | | Wells Fargo Advantage Cash Investment Money Market Fund | | Financial Highlights |
(For a share outstanding throughout each period)
| | | | | | | | | | | | | | | | | | | | | | | | | | | | |
| | | Six Months Ended
July 31, 2011
(Unaudited) | | | Year Ended
January 31,
20111 | | | Year Ended February 28, | |
| Administrator Class | | | | 2010 | | | 2009 | | | 2008 | | | 2007 | | | 20062 | |
Net asset value, beginning of period | | $ | 1.00 | | | $ | 1.00 | | | $ | 1.00 | | | $ | 1.00 | | | $ | 1.00 | | | $ | 1.00 | | | $ | 1.00 | |
Net investment income | | | 0.00 | 3 | | | 0.00 | 3 | | | 0.00 | 3 | | | 0.02 | | | | 0.05 | | | | 0.05 | | | | 0.03 | |
Net realized gains (losses) on investments | | | 0.00 | | | | 0.00 | 3 | | | 0.00 | | | | 0.00 | | | | 0.00 | | | | 0.00 | | | | 0.00 | |
| | | | | | | | | | | | | | | | | | | | | | | | | | | | |
Total from investment operations | | | 0.00 | 3 | | | 0.00 | 3 | | | 0.00 | 3 | | | 0.02 | | | | 0.05 | | | | 0.05 | | | | 0.03 | |
Distributions to shareholders from | | | | | | | | | | | | | | | | | | | | | | | | | | | | |
Net investment income | | | (0.00 | )3 | | | (0.00 | )3 | | | (0.00 | )3 | | | (0.02 | ) | | | (0.05 | ) | | | (0.05 | ) | | | (0.03 | ) |
Net realized gains | | | 0.00 | | | | (0.00 | )3 | | | (0.00 | )3 | | | 0.00 | | | | 0.00 | | | | 0.00 | | | | 0.00 | |
| | | | | | | | | | | | | | | | | | | | | | | | | | | | |
Total distributions to shareholders | | | (0.00 | )3 | | | (0.00 | )3 | | | (0.00 | )3 | | | (0.02 | ) | | | (0.05 | ) | | | (0.05 | ) | | | (0.03 | ) |
Net asset value, end of period | | | $1.00 | | | | $1.00 | | | | $1.00 | | | | $1.00 | | | | $1.00 | | | | $1.00 | | | | $1.00 | |
Total return4 | | | 0.00 | % | | | 0.03 | % | | | 0.24 | % | | | 2.19 | % | | | 4.92 | % | | | 4.96 | % | | | 3.06 | % |
Ratios to average net assets (annualized) | | | | | | | | | | | | | | | | | | | | | | | | | | | | |
Gross expenses | | | 0.34 | % | | | 0.35 | % | | | 0.38 | % | | | 0.38 | % | | | 0.37 | % | | | 0.37 | % | | | 0.37 | % |
Net expenses | | | 0.27 | % | | | 0.32 | % | | | 0.34 | % | | | 0.34 | % | | | 0.33 | % | | | 0.35 | % | | | 0.35 | % |
Net investment income | | | 0.01 | % | | | 0.04 | % | | | 0.25 | % | | | 2.23 | % | | | 4.77 | % | | | 4.87 | % | | | 3.37 | % |
Supplemental data | | | | | | | | | | | | | | | | | | | | | | | | | | | | |
Net assets, end of period (000’s omitted) | | | $631,901 | | | | $764,595 | | | | $1,013,058 | | | | $1,415,264 | | | | $2,249,470 | | | | $1,364,223 | | | | $1,150,617 | |
| 1. | For the eleven months ended January 31, 2011. The Fund changed its fiscal year end from February 28 to January 31, effective January 31, 2011. |
| 2. | For the eleven months ended February 28, 2006. The Fund changed its fiscal year end from March 31 to February 28, effective February 28, 2006. |
| 3. | Amount is less than $0.005. |
| 4. | Returns for periods less than one year are not annualized. |
The accompanying notes are an integral part of these financial statements.
| | | | | | |
| Financial Highlights | | Wells Fargo Advantage Cash Investment Money Market Fund | | | 27 | |
(For a share outstanding throughout each period)
| | | | | | | | | | | | | | | | | | | | | | | | | | | | |
| | | Six Months Ended
July 31, 2011
(Unaudited) | | | Year Ended
January 31,
20111 | | | Year Ended February 28, | |
| Institutional Class | | | | 2010 | | | 2009 | | | 2008 | | | 2007 | | | 20062 | |
Net asset value, beginning of period | | | $1.00 | | | | $1.00 | | | | $1.00 | | | | $1.00 | | | | $1.00 | | | | $1.00 | | | | $1.00 | |
Net investment income | | | 0.00 | 3 | | | 0.00 | 3 | | | 0.00 | 3 | | | 0.02 | | | | 0.05 | | | | 0.05 | | | | 0.03 | |
Net realized gains (losses) on investments | | | 0.00 | | | | 0.00 | 3 | | | 0.00 | | | | 0.00 | | | | 0.00 | | | | 0.00 | | | | 0.00 | |
| | | | | | | | | | | | | | | | | | | | | | | | | | | | |
Total from investment operations | | | 0.00 | 3 | | | 0.00 | 3 | | | 0.00 | 3 | | | 0.02 | | | | 0.05 | | | | 0.05 | | | | 0.03 | |
Distributions to shareholders from | | | | | | | | | | | | | | | | | | | | | | | | | | | | |
Net investment income | | | (0.00 | )3 | | | (0.00 | )3 | | | (0.00 | )3 | | | (0.02 | ) | | | (0.05 | ) | | | (0.05 | ) | | | (0.03 | ) |
Net realized gains | | | 0.00 | | | | (0.00 | )3 | | | (0.00 | )3 | | | 0.00 | | | | 0.00 | | | | 0.00 | | | | 0.00 | |
| | | | | | | | | | | | | | | | | | | | | | | | | | | | |
Total distributions to shareholders | | | (0.00 | )3 | | | (0.00 | )3 | | | (0.00 | )3 | | | (0.02 | ) | | | (0.05 | ) | | | (0.05 | ) | | | (0.03 | ) |
Net asset value, end of period | | $ | 1.00 | | | $ | 1.00 | | | $ | 1.00 | | | $ | 1.00 | | | $ | 1.00 | | | $ | 1.00 | | | $ | 1.00 | |
Total return4 | | | 0.04 | % | | | 0.15 | % | | | 0.36 | % | | | 2.32 | % | | | 5.06 | % | | | 5.12 | % | | | 3.21 | % |
Ratios to average net assets (annualized) | | | | | | | | | | | | | | | | | | | | | | | | | | | | |
Gross expenses | | | 0.23 | % | | | 0.23 | % | | | 0.26 | % | | | 0.26 | % | | | 0.25 | % | | | 0.25 | % | | | 0.25 | % |
Net expenses | | | 0.20 | % | | | 0.20 | % | | | 0.22 | % | | | 0.21 | % | | | 0.20 | % | | | 0.20 | % | | | 0.20 | % |
Net investment income | | | 0.08 | % | | | 0.16 | % | | | 0.37 | % | | | 2.28 | % | | | 4.94 | % | | | 5.01 | % | | | 3.50 | % |
Supplemental data | | | | | | | | | | | | | | | | | | | | | | | | | | | | |
Net assets, end of period (000’s omitted) | | | $7,130,924 | | | | $8,268,232 | | | | $8,887,844 | | | | $10,132,093 | | | | $9,194,540 | | | | $7,830,847 | | | | $6,497,267 | |
| 1. | For the eleven months ended January 31, 2011. The Fund changed its fiscal year end from February 28 to January 31, effective January 31, 2011. |
| 2. | For the eleven months ended February 28, 2006. The Fund changed its fiscal year end from March 31 to February 28, effective February 28, 2006. |
| 3. | Amount is less than $0.005. |
| 4. | Returns for periods less than one year are not annualized. |
The accompanying notes are an integral part of these financial statements.
| | | | |
| 28 | | Wells Fargo Advantage Cash Investment Money Market Fund | | Financial Highlights |
(For a share outstanding throughout each period)
| | | | | | | | | | | | | | | | | | | | |
| | | Six Months Ended
July 31, 2011
(Unaudited) | | | Year Ended
January 31,
20111 | | | Year Ended February 28, | |
| Select Class | | | | 2010 | | | 2009 | | | 20082 | |
Net asset value, beginning of period | | | $1.00 | | | | $1.00 | | | | $1.00 | | | | $1.00 | | | | $1.00 | |
Net investment income | | | 0.00 | 3 | | | 0.00 | 3 | | | 0.00 | 3 | | | 0.02 | | | | 0.03 | |
Net realized gains (losses) on investments | | | 0.00 | | | | 0.00 | 3 | | | 0.00 | | | | 0.00 | | | | 0.00 | |
| | | | | | | | | | | | | | | | | | | | |
Total from investment operations | | | 0.00 | 3 | | | 0.00 | 3 | | | 0.00 | 3 | | | 0.02 | | | | 0.03 | |
Distributions to shareholders from | | | | | | | | | | | | | | | | | | | | |
Net investment income | | | (0.00 | )3 | | | (0.00 | )3 | | | (0.00 | )3 | | | (0.02 | ) | | | (0.03 | ) |
Net realized gains | | | 0.00 | | | | (0.00 | )3 | | | (0.00 | )3 | | | 0.00 | | | | 0.00 | |
| | | | | | | | | | | | | | | | | | | | |
Total distributions to shareholders | | | (0.00 | )3 | | | (0.00 | )3 | | | (0.00 | )3 | | | (0.02 | ) | | | (0.03 | ) |
Net asset value, end of period | | $ | 1.00 | | | $ | 1.00 | | | $ | 1.00 | | | $ | 1.00 | | | $ | 1.00 | |
Total return4 | | | 0.07 | % | | | 0.21 | % | | | 0.43 | % | | | 2.40 | % | | | 3.31 | % |
Ratios to average net assets (annualized) | | | | | | | | | | | | | | | | | | | | |
Gross expenses | | | 0.19 | % | | | 0.19 | % | | | 0.22 | % | | | 0.23 | % | | | 0.20 | % |
Net expenses | | | 0.13 | % | | | 0.13 | % | | | 0.15 | % | | | 0.15 | % | | | 0.13 | % |
Net investment income | | | 0.14 | % | | | 0.22 | % | | | 0.41 | % | | | 2.29 | % | | | 4.81 | % |
Supplemental data | | | | | | | | | | | | | | | | | | | | |
Net assets, end of period (000’s omitted) | | | $5,509,588 | | | | $7,593,851 | | | | $4,897,725 | | | | $3,733,381 | | | | $3,025,485 | |
| 1. | For the eleven months ended January 31, 2011. The Fund changed its fiscal year end from February 28 to January 31, effective January 31, 2011. |
| 2. | For the period from June 29, 2007 (commencement of class operations) to February 28, 2008. |
| 3. | Amount is less than $0.005. |
| 4. | Returns for periods less than one year are not annualized. |
The accompanying notes are an integral part of these financial statements.
| | | | | | |
| Financial Highlights | | Wells Fargo Advantage Cash Investment Money Market Fund | | | 29 | |
(For a share outstanding throughout each period)
| | | | | | | | | | | | | | | | | | | | | | | | | | | | |
| | | Six Months Ended
July 31, 2011
(Unaudited) | | | Year Ended
January 31,
20111 | | | Year Ended February 28, | |
| Service Class | | | | 2010 | | | 2009 | | | 2008 | | | 2007 | | | 20062 | |
Net asset value, beginning of period | | $ | 1.00 | | | $ | 1.00 | | | $ | 1.00 | | | $ | 1.00 | | | $ | 1.00 | | | $ | 1.00 | | | $ | 1.00 | |
Net investment income | | | 0.00 | 3 | | | 0.00 | 3 | | | 0.00 | 3 | | | 0.02 | | | | 0.05 | | | | 0.05 | | | | 0.03 | |
Net realized gains (losses) on investments | | | 0.00 | | | | 0.00 | 3 | | | 0.00 | | | | 0.00 | | | | 0.00 | | | | 0.00 | | | | 0.00 | |
| | | | | | | | | | | | | | | | | | | | | | | | | | | | |
Total from investment operations | | | 0.00 | 3 | | | 0.00 | 3 | | | 0.00 | 3 | | | 0.02 | | | | 0.05 | | | | 0.05 | | | | 0.03 | |
Distributions to shareholders from | | | | | | | | | | | | | | | | | | | | | | | | | | | | |
Net investment income | | | (0.00 | )2 | | | (0.00 | )3 | | | (0.00 | )3 | | | (0.02 | ) | | | (0.05 | ) | | | (0.05 | ) | | | (0.03 | ) |
Net realized gains | | | 0.00 | | | | (0.00 | )3 | | | (0.00 | )3 | | | 0.00 | | | | 0.00 | | | | 0.00 | | | | 0.00 | |
| | | | | | | | | | | | | | | | | | | | | | | | | | | | |
Total distributions to shareholders | | | (0.00 | )3 | | | (0.00 | )3 | | | (0.00 | )3 | | | (0.02 | ) | | | (0.05 | ) | | | (0.05 | ) | | | (0.03 | ) |
Net asset value, end of period | | | $1.00 | | | | $1.00 | | | | $1.00 | | | | $1.00 | | | | $1.00 | | | | $1.00 | | | | $1.00 | |
Total return4 | | | 0.00 | % | | | 0.01 | % | | | 0.14 | % | | | 2.02 | % | | | 4.75 | % | | | 4.80 | % | | | 2.92 | % |
Ratios to average net assets (annualized) | | | | | | | | | | | | | | | | | | | | | | | | | | | | |
Gross expenses | | | 0.51 | % | | | 0.52 | % | | | 0.56 | % | | | 0.56 | % | | | 0.54 | % | | | 0.54 | % | | | 0.54 | % |
Net expenses | | | 0.26 | % | | | 0.35 | % | | | 0.46 | % | | | 0.52 | % | | | 0.50 | % | | | 0.50 | % | | | 0.50 | % |
Net investment income | | | 0.01 | % | | | 0.01 | % | | | 0.16 | % | | | 1.99 | % | | | 4.64 | % | | | 4.71 | % | | | 3.12 | % |
Supplemental data | | | | | | | | | | | | | | | | | | | | | | | | | | | | |
Net assets, end of period (000’s omitted) | | | $2,322,543 | | | | $2,284,605 | | | | $4,015,237 | | | | $6,358,514 | | | | $7,374,749 | | | | $6,328,867 | | | | $5,793,762 | |
| 1. | For the eleven months ended January 31, 2011. The Fund changed its fiscal year end from February 28 to January 31, effective January 31, 2011. |
| 2. | For the eleven months ended February 28, 2006. The Fund changed its fiscal year end from March 31 to February 28, effective February 28, 2006. |
| 3. | Amount is less than $0.005. |
| 4. | Returns for periods less than one year are not annualized. |
The accompanying notes are an integral part of these financial statements.
| | | | |
| 30 | | Wells Fargo Advantage Cash Investment Money Market Fund | | Notes to Financial Statements (Unaudited) |
1. ORGANIZATION
Wells Fargo Funds Trust (the “Trust”), a Delaware statutory trust organized on March 10, 1999, is an open-end management investment company registered under the Investment Company Act of 1940, as amended (the “1940 Act”). These financial statements report on Wells Fargo Advantage Cash Investment Money Market Fund (the “Fund”) which is a diversified series of the Trust.
2. SIGNIFICANT ACCOUNTING POLICIES
The following significant accounting policies, which are consistently followed in the preparation of the financial statements of the Fund, are in conformity with U.S. generally accepted accounting principles which require management to make estimates and assumptions that affect the reported amounts of assets and liabilities, disclosure of contingent assets and liabilities at the date of the financial statements, and the reported amounts of revenues and expenses during the reporting period. Actual results could differ from those estimates.
Securities valuation
As permitted under Rule 2a-7 of the 1940 Act, securities are valued at amortized cost, which approximates fair value.
The valuation techniques used by the Fund to measure fair value are consistent with the market approach, income approach and/or cost approach, where applicable, for each security type.
Repurchase agreements
The Fund may invest in repurchase agreements and may participate in pooled repurchase agreement transactions with other funds advised by Wells Fargo Funds Management, LLC. The repurchase agreements must be fully collateralized based on values that are marked-to- market daily. The collateral may be held by an agent bank under a tri-party agreement. It is the custodian’s responsibility to value collateral daily and to take action to obtain additional collateral as necessary to maintain market value equal to or greater than the resale price. The repurchase agreements are collateralized by instruments such as U.S. Treasury, federal agency, or high-grade corporate obligations. There could be potential loss to the Fund in the event that the Fund is delayed or prevented from exercising its rights to dispose of the collateral, including the risk of a possible decline in the value of the underlying obligations during the period in which the Fund seeks to assert its rights.
Security transactions and income recognition
Securities transactions are recorded on a trade date basis. Realized gains or losses are reported on the basis of identified cost of securities delivered.
Interest income is accrued daily and bond discounts are accreted and premiums are amortized daily based on the effective interest method. To the extent debt obligations are placed on non-accrual status, any related interest income may be reduced by writing off interest receivables when the collection of all or a portion of interest has become doubtful based on consistently applied procedures. If the issuer subsequently resumes interest payments or when the collectability of interest is reasonably assured, the debt obligation is removed from non-accrual status.
Distributions to shareholders
Distributions to shareholders from net investment income are accrued daily and paid monthly. Distributions from net realized gains, if any, are recorded on the ex-dividend date. Such distributions are determined in conformity with income tax regulations, which may differ from generally accepted accounting principles.
Federal and other taxes
The Fund intends to continue to qualify as a regulated investment company by distributing substantially all of its investment company taxable income and any net realized capital gains (after reduction for capital loss carryforwards) sufficient to relieve it from all, or substantially all, federal income taxes. Accordingly, no provision for federal income taxes was required.
The Fund’s income and federal excise tax returns and all financial records supporting those returns for the prior three fiscal years are subject to examination by the federal and Delaware revenue authorities.
As of January 31, 2011, the Fund had estimated net capital loss carryforwards, which were available to offset future net realized capital gains, in the amount of $3,975,892 expiring in 2018.
| | | | | | |
| Notes to Financial Statements (Unaudited) | | Wells Fargo Advantage Cash Investment Money Market Fund | | | 31 | |
Under the recently enacted Regulated Investment Company Modernization Act of 2010, the Fund will be permitted to carry forward capital losses incurred in taxable years beginning after December 22, 2010 for an unlimited period. However, any losses incurred during those future taxable years will be required to be utilized prior to the losses incurred in pre-enactment taxable years. As a result of this ordering rule, pre-enactment capital loss carryforwards may be more likely to expire unused. Additionally, post-enactment capital losses that are carried forward will retain their character as either short-term or long-term capital losses rather than being considered all short-term as under previous law.
Class allocations
The separate classes of shares offered by the Fund differ principally in shareholder servicing and administration fees. Shareholders of each class bear certain expenses that pertain to that particular class. All shareholders bear the common expenses of the Fund, earn income from the portfolio, and are allocated unrealized gains and losses pro rata based on the average daily net assets of each class, without distinction between share classes. Dividends are determined separately for each class based on income and expenses allocable to each class. Realized gains and losses are allocated to each class pro rata based upon the net assets of each class on the date realized. Differences in per share dividend rates generally result from the relative weightings of pro rata income and realized gain allocations and from differences in separate class expenses, including shareholder servicing and administration fees.
3. FAIR VALUATION MEASUREMENTS
Fair value measurements of investments are determined within a framework that has established a fair value hierarchy based upon the various data inputs utilized in determining the value of the Fund’s investments. The three-level hierarchy gives the highest priority to unadjusted quoted prices in active markets for identical assets or liabilities (Level 1) and the lowest priority to unobservable inputs (Level 3). The Fund’s investments are classified within the fair value hierarchy based on the lowest level of input that is significant to the fair value measurement. The inputs are summarized into three broad levels as follows:
| n | | Level 1 – quoted prices in active markets for identical securities |
| n | | Level 2 – other significant observable inputs (including quoted prices for similar securities, interest rates, prepayment speeds, credit risk, etc.) |
| n | | Level 3 – significant unobservable inputs (including the Fund’s own assumptions in determining the fair value of investments) |
The inputs or methodologies used for valuing securities are not necessarily an indication of the risk associated with investing in those securities.
At July 31, 2011, all of the Fund’s investments in securities carried at fair value were designated as Level 2 since the primary inputs include credit quality of the issuer and short-term interest rates which are observable.
Further details on the major security types can be found in the Fund’s Portfolio of Investments.
4. TRANSACTIONS WITH AFFILIATES AND OTHER EXPENSES
Advisory fee
The Trust has entered into an advisory contract with Wells Fargo Funds Management, LLC (“Funds Management”), an indirect wholly owned subsidiary of Wells Fargo & Company (“Wells Fargo”). The adviser is responsible for implementing investment policies and guidelines and for supervising the sub-adviser, who is responsible for day-to-day portfolio management of the Fund.
Pursuant to the contract, Funds Management is entitled to receive at an annual rate of 0.10% of the Fund’s average daily net assets.
Funds Management may retain the services of certain sub-advisers to provide daily portfolio management to the Fund. The fees related to sub-advisory services are borne directly by the adviser and do not increase the overall fees paid by the Fund to the adviser. Wells Capital Management Incorporated, an affiliate of Funds Management, is the sub-adviser to the Fund and is entitled to receive a fee from the adviser at an annual rate starting at 0.05% and declining to 0.01% as the average daily net assets of the Fund increase.
| | | | |
| 32 | | Wells Fargo Advantage Cash Investment Money Market Fund | | Notes to Financial Statements (Unaudited) |
Administration and transfer agent fees
The Trust has entered into an administration agreement with Funds Management. Under this agreement, for providing administrative services, which includes paying fees and expenses for services provided by the transfer agent, sub-transfer agents, omnibus account servicers and record-keepers, Funds Management is entitled to receive from the Fund an annual fund level administration fee starting at 0.05% and declining to 0.03% as the average daily net assets of the Fund increase and a class level administration fee which is calculated based on the average daily net assets of each class as follows:
| | | | |
| | | Class Level Administration Fee | |
Administrator Class | | | 0.10 | % |
Institutional Class | | | 0.08 | |
Select Class | | | 0.04 | |
Service Class | | | 0.12 | |
Funds Management and has contractually waived and/or reimbursed advisory and administration fees to the extent necessary to maintain certain net operating expense ratios for the Fund. Waiver of fees and/or reimbursement of expenses by Funds Management were made first from fund level expenses on a proportionate basis and then from class specific expenses.
Shareholder servicing fees
The Trust has entered into contracts with one or more shareholder servicing agents, whereby Service Class of the Fund is charged a fee at an annual rate of 0.25% of its average daily net assets. Administrator Class is charged a fee at an annual rate of 0.10% of its average daily net assets.
A portion of these total shareholder servicing fees were paid to affiliates of Wells Fargo.
5. ACQUISITION
After the close of business on November 5, 2010, the Fund acquired the net assets of Wells Fargo Advantage Money Market Trust. The purpose of the transaction was to combine two funds with similar investment objectives and strategies. Existing shareholders of Wells Fargo Advantage Money Market Trust received Institutional Class shares of the Fund in the reorganization. The acquisition was accomplished by a tax-free exchange of all of the shares of Wells Fargo Advantage Money Market Trust for 2,576,607,084 shares of the Fund valued at $2,572,517,911 at an exchange ratio of 1.00 for Institutional Class shares. The investment portfolio of Wells Fargo Advantage Money Market Trust with a fair value of $2,621,390,044 and amortized cost of $2,621,390,044 at November 5, 2010 were the principal assets acquired by the Fund. The aggregate net assets of Wells Fargo Advantage Money Market Trust and the Fund immediately prior to the acquisition were $2,572,517,911 and $16,493,176,644, respectively. The aggregate net assets of the Fund immediately after the acquisition were $19,065,694,555. For financial reporting purposes, assets received and shares issued by the Fund were recorded at fair value; however, the cost basis of the investments received from Wells Fargo Advantage Money Market Trust was carried forward to align ongoing reporting of the Fund’s realized and unrealized gains and losses with amounts distributable to shareholders for tax purposes.
Assuming the acquisition had been completed March 1, 2010, the beginning of the annual reporting period for the Fund, the pro forma results of operations for the period ended January 31, 2011 would have been:
| | | | |
Net investment income | | $ | 25,883,533 | |
Net realized losses on investments | | $ | (3,855,630 | ) |
Net increase in net assets resulting from operations | | $ | 22,027,903 | |
6. INDEMNIFICATION
Under the Trust’s organizational documents, the officers and directors are indemnified against certain liabilities that may arise out of performance of their duties to the Trust. Additionally, in the normal course of business, the Trust may enter
| | | | | | |
| Notes to Financial Statements (Unaudited) | | Wells Fargo Advantage Cash Investment Money Market Fund | | | 33 | |
into contracts with service providers that contain a variety of indemnification clauses. The Trust’s maximum exposure under these arrangements is dependent on future claims that may be made against the Fund and, therefore, cannot be estimated.
7. NEW ACCOUNTING PRONOUNCEMENTS
In May 2011, the Financial Accounting Standards Board (“FASB”) issued Accounting Standards Update (“ASU”) No. 2011-04 “Amendments to Achieve Common Fair Value Measurement and Disclosure Requirements in U.S. GAAP and IFRSs”. ASU No. 2011-04 amends FASB ASC Topic 820, Fair Value Measurements and Disclosures, to establish common requirements for measuring fair value and for disclosing information about fair value measurements in accordance with GAAP. The ASU is effective prospectively for interim and annual periods beginning after December 15, 2011.
In April 2011, FASB issued ASU No. 2011-03 “Reconsideration of Effective Control for Repurchase Agreements”. ASU No. 2011-03 amends FASB ASC Topic 860, Transfers and Servicing, specifically the criteria required to determine whether a repurchase agreement (repo) and similar agreements should be accounted for as sales of financial assets or secured borrowings with commitments. ASU No. 2011-03 changes the assessment of effective control by focusing on the transferor’s contractual rights and obligations and removing the criterion to assess its ability to exercise those rights or honor those obligations. This could result in changes to the way entities account for certain transactions including repurchase agreements, mortgage dollar rolls and reverse repurchase agreements. The ASU will become effective on a prospective basis for new transfers and modifications to existing transactions as of the beginning of the first interim or annual period beginning on or after December 15, 2011.
As of July 31, 2011, management of the Fund is currently assessing the potential impact, in addition to expanded financial statement disclosure, that may result from adopting these ASUs.
| | | | |
| 34 | | Wells Fargo Advantage Cash Investment Money Market Fund | | Other Information (Unaudited) |
PORTFOLIO HOLDINGS INFORMATION
The complete portfolio holdings for the Fund are publicly available on the Fund’s Web site
(www.wellsfargo.com/advantagefunds) on a monthly, seven-day delayed basis. The Fund files its complete schedule of portfolio holdings with the SEC for the first and third quarters of each fiscal year on Form N-Q, which is available without charge by visiting the SEC Web site at www.sec.gov. In addition, the Fund’s Form N-Q may be reviewed and copied at the SEC’s Public Reference Room in Washington, DC, and at regional offices in New York City, at 233 Broadway, and in Chicago, at 175 West Jackson Boulevard, Suite 900. Information about the Public Reference Room may be obtained by calling 1-800-SEC-0330.
PROXY VOTING INFORMATION
A description of the policies and procedures that the Fund uses to determine how to vote proxies relating to portfolio securities is available without charge, upon request, by calling 1-800-222-8222, visiting our Web site at www.wellsfargo.com/advantagefunds, or visiting the SEC Web site at www.sec.gov. Information regarding how the Fund voted proxies relating to portfolio securities during the most recent 12-month period ended June 30 is available without charge on the Fund’s Web site at www.wellsfargo.com/advantagefunds or by visiting the SEC Web site at www.sec.gov.
| | | | | | |
| Other Information (Unaudited) | | Wells Fargo Advantage Cash Investment Money Market Fund | | | 35 | |
BOARD OF TRUSTEES
The following table provides basic information about the Board of Trustees (the “Trustees”) of the Trust and Officers of the Trust. This table should be read in conjunction with the Prospectus and the Statement of Additional Information1 of the Fund. Each of the Trustees and Officers listed below acts in identical capacities for the Wells Fargo Advantage family of funds, which consists of 144 funds comprising the Wells Fargo Funds Trust, Wells Fargo Variable Trust, Wells Fargo Master Trust and four closed-end funds (collectively the “Fund Complex”). All of the Trustees are also Members of the Audit and Governance Committees of each Trust in the Fund Complex. The mailing address of each Trustee and Officer is 525 Market Street, 12th Floor, San Francisco, CA 94105. Each Trustee and Officer serves an indefinite term, however, each Trustee serves such term until reaching the mandatory retirement age established by the Trustees.
Independent Trustees
| | | | | | |
Name and Year of Birth | | Position Held and Length of Service | | Principal Occupations During Past Five Years | | Other Directorships During
Past Five Years |
Peter G. Gordon
(Born 1942) | | Trustee, since 1998; Chairman, since 2005 | | Co-Founder, Chairman, President and CEO of Crystal Geyser. Water Company. Trustee Emeritus, Colby College | | Asset Allocation Trust |
Isaiah Harris, Jr.
(Born 1952) | | Trustee, since 2009 | | Retired. Prior thereto, President and CEO of BellSouth Advertising and Publishing Corp. from 2005 to 2007, President and CEO of BellSouth Enterprises from 2004 to 2005 and President of BellSouth Consumer Services from 2000 to 2003. Emeritus member of the Iowa State University Foundation Board of Governors. Emeritus Member of the Advisory Board of Iowa State University School of Business. Mr. Harris is a certified public accountant. | | CIGNA Corporation; Deluxe Corporation; Asset Allocation Trust |
Judith M. Johnson
(Born 1949) | | Trustee, since 2008 | | Retired. Prior thereto, Chief Executive Officer and Chief Investment Officer of Minneapolis Employees Retirement Fund from 1996 to 2008. Ms. Johnson is an attorney, certified public accountant and a certified managerial accountant. | | Asset Allocation Trust |
Leroy Keith, Jr.
(Born 1939) | | Trustee, since 2010 | | Chairman, Bloc Global Services (development and construction), Trustee of the Evergreen Funds from 1983 to 2010. Former Managing Director, Almanac Capital Management (commodities firm), former Partner, Stonington Partners, Inc. (private equity fund), former Director, Obagi Medical Products Co. and former Director, Lincoln Educational Services. | | Trustee, Virtus Fund Complex (consisting of 45 portfolios as of 12/31/10); Director, Diversapack Co. (packaging company); Asset Allocation Trust |
David F. Larcker
(Born 1950) | | Trustee, since 2009 | | James Irvin Miller Professor of Accounting at the Graduate School of Business, Stanford University, Director of Corporate Governance Research Program and Co-Director of The Rock Center for Corporate Governance since 2006. From 2005 to 2008, Professor of Accounting at the Graduate School of Business, Stanford University. Prior thereto, Ernst & Young Professor of Accounting at The Wharton School, University of Pennsylvania from 1985 to 2005. | | Asset Allocation Trust |
Olivia S. Mitchell
(Born 1953) | | Trustee, since 2006 | | International Foundation of Employee Benefit Plans Professor and Chair of the Department of Insurance and Risk Management, Wharton School of the University of Pennsylvania since 1993. Director of Wharton’s Pension Research Council and Boettner Center on Pensions & Retirement Research, and Research Associate at the National Bureau of Economic Research. Previously, Cornell University Professor from 1978 to 1993. | | Asset Allocation Trust |
| | | | |
| 36 | | Wells Fargo Advantage Cash Investment Money Market Fund | | Other Information (Unaudited) |
| | | | | | |
Name and Year of Birth | | Position Held and Length of Service | | Principal Occupations During Past Five Years | | Other Directorships During
Past Five Years |
Timothy J. Penny
(Born 1951) | | Trustee, since 1996 | | President and CEO of Southern Minnesota Initiative Foundation, a non-profit organization, since 2007 and Senior Fellow at the Humphrey Institute Policy Forum at the University of Minnesota since 1995. Member of the Board of Trustees of NorthStar Education Finance, Inc., a non-profit organization, since 2007. | | Asset Allocation Trust |
Michael S. Scofield
(Born 1943) | | Trustee, since 2010 | | Currently serves on the Investment Company Institute’s Board of Governors and Executive Committee as well the In dependent Director’s Counsel Board of Governors and Executive Committee. Former Chairman of the Independent Directors Counsel. Trustee of the Evergreen Funds from 1984 to 2010. Retired Attorney, Law Offices of Michael S. Scofield and former Director and Chairman, Branded Media Corporation (multi-media branding company). | | Asset Allocation Trust |
Donald C. Willeke
(Born 1940) | | Trustee, since 1996 | | Principal of the law firm of Willeke & Daniels. General Counsel of the Minneapolis Employees Retirement Fund from 1984 until its consolidation into the Minnesota Public Employees Retirement Association on June 30, 2010. | | Asset Allocation Trust |
Officers
| | | | | | |
Name and Year of Birth | | Position Held and
Length of Service | | Principal Occupations During Past Five Years | | |
Karla M. Rabusch
(Born 1959) | | President, since 2003 | | Executive Vice President of Wells Fargo Bank, N.A. and President of Wells Fargo Funds Management, LLC since 2003. Senior Vice President and Chief Administrative Officer of Wells Fargo Funds Management, LLC from 2001 to 2003. | | |
C. David Messman
(Born 1960) | | Secretary, since 2000; Chief Legal Counsel, since 2003 | | Senior Vice President and Secretary of Wells Fargo Funds Management, LLC since 2001. Vice President and Managing Counsel of Wells Fargo Bank, N.A. since 1996. | | |
Kasey Phillips
(Born 1970) | | Treasurer, since 2008 | | Senior Vice President of Wells Fargo Funds Management, LLC since 2009. Senior Vice President of Evergreen Investment Management Company, LLC from 2006 to 2010. Treasurer of the Evergreen Funds from 2005 to 2010. Vice President and Assistant Vice President of Evergreen Investment Services, Inc. from 1999 to 2006. | | |
David Berardi
(Born 1975) | | Assistant Treasurer, since 2009 | | Vice President of Wells Fargo Funds Management, LLC since 2009 . Vice President of Evergreen Investment Management Company, LLC from 2008 to 2010. Assistant Vice President of Evergreen Investment Services, Inc. from 2004 to 2008. Manager of Fund Reporting and Control for Evergreen Investment Management Company, LLC from 2004 to 2010. | | |
Jeremy DePalma
(Born 1974) | | Assistant Treasurer, since 2009 | | Senior Vice President of Wells Fargo Funds Management, LLC since 2009. Senior Vice President of Evergreen Investment Management Company, LLC from 2008 to 2010. Vice President, Evergreen Investment Services, Inc. from 2004 to 2007. Assistant Vice President, Evergreen Investment Services, Inc. from 2000 to 2004 and the head of the Fund Reporting and Control Team within Fund Administration from 2005 to 2010. | | |
Debra Ann Early
(Born 1964) | | Chief Compliance Officer, since 2007 | | Chief Compliance Officer of Wells Fargo Funds Management, LLC since 2007. Chief Compliance Officer of Parnassus Investments from 2005 to 2007. Chief Financial Officer of Parnassus Investments from 2004 to 2007 and Senior Audit Manager of PricewaterhouseCoopers LLP from 1998 to 2004. | | |
| 1. | The Statement of Additional Information includes additional information about the Fund’s Trustees and is available, without charge, upon request, by calling 1-800-222-8222 or by visiting the Fund’s Web site at www.wellsfargo.com/advantagefunds. |
| | | | | | |
| Other Information (Unaudited) | | Wells Fargo Advantage Cash Investment Money Market Fund | | | 37 | |
BOARD CONSIDERATION OF INVESTMENT ADVISORY AND SUB-ADVISORY AGREEMENTS:
100% Treasury Money Market Fund, Cash Investment Money Market Fund, Government Money Market Fund, Heritage Money Market Fund, Money Market Fund, Prime Investment Money Market Fund and Treasury Plus Money Market Fund
(Not all of the funds described in this Board considerations section are part of this shareholder report. This shareholder report only relates to Cash Investment Money Market Fund.)
Each year, as required by Section 15 of the Investment Company Act of 1940 (the “1940 Act”), the Board of Trustees (the “Board”) of Wells Fargo Funds Trust (the “Trust”), all the members of which have no direct or indirect interest in the investment advisory and sub-advisory agreements and are not “interested persons” of the Trust, as defined in the 1940 Act (the “Independent Trustees”), determines whether to approve the continuation of the Trust’s investment advisory and sub-advisory agreements. In this regard, at an in person meeting held on March 24-25, 2011 (the “Meeting”), the Board reviewed and re-approved: (i) an investment advisory agreement with Wells Fargo Funds Management, LLC (“Funds Management”) for each of the 100% Treasury Money Market Fund, Cash Investment Money Market Fund, Government Money Market Fund, Heritage Money Market Fund, Money Market Fund, Prime Investment Money Market Fund and Treasury Plus Money Market Fund (collectively, the “Funds”); and (ii) an investment sub-advisory agreement with Wells Capital Management Incorporated (“Wells Capital Management”) for each of the Funds. The investment advisory agreements with Funds Management and the investment sub-advisory agreements with Wells Capital Management are collectively referred to as the “Advisory Agreements.”
At the Meeting, the Board considered the factors and reached the conclusions described below relating to the selection of Funds Management and Wells Capital Management and continuation of the Advisory Agreements. Prior to the Meeting, the Trustees conferred extensively among themselves and with representatives of Funds Management about these matters. The Board also met throughout the year and received information that was useful to them in considering the continuation of the Advisory Agreements. The Independent Trustees were assisted in their evaluation of the Advisory Agreements by independent legal counsel, from whom they received separate legal advice and with whom they met separately from Funds Management.
Nature, extent and quality of services
The Board received and considered various information regarding the nature, extent and quality of services provided to the Funds by Funds Management and Wells Capital Management under the Advisory Agreements. The Board also received and considered information provided in response to a detailed set of requests submitted by the Independent Trustees’ independent legal counsel on their behalf. The Board received and considered, among other things, information about the background and experience of senior management of Funds Management, and the qualifications, backgrounds, tenures and responsibilities of the portfolio managers primarily responsible for the day-to-day portfolio management of the Funds.
The Board evaluated the ability of Funds Management and Wells Capital Management, based on their respective financial condition, resources, reputation and other attributes, to attract and retain qualified investment professionals, including research, advisory, and supervisory personnel. The Board further considered the compliance programs and compliance records of Funds Management and Wells Capital Management. In addition, the Board took into account the administrative services provided to the Funds by Funds Management and its affiliates.
The Board’s decision to approve the continuation of the Advisory Agreements was based on a comprehensive evaluation of all of the information provided to it. In approving the continuation of the Advisory Agreements, the Board did not identify any particular information or consideration that was all-important or controlling, and each Trustee attributed different weights to various factors. The Board evaluated information provided to it both in terms of the funds generally and with respect to each Fund specifically as it considered appropriate. Although the Board considered the continuation of the Advisory Agreements for each of the Funds as part of the larger process of considering the continuation of the advisory agreements for all of the funds, its decision to continue the Advisory Agreements for each of the Funds was ultimately made on a fund-by-fund basis.
In considering these matters, the Board considered not only the specific information presented in connection with the Meeting, but also the knowledge gained over time through interaction with Funds Management and Wells Capital
| | | | |
| 38 | | Wells Fargo Advantage Cash Investment Money Market Fund | | Other Information (Unaudited) |
Management about various topics, including Funds Management’s oversight of service providers. The above factors, together with those referenced below, are some of the most important, but not necessarily all, factors considered by the Board in concluding that it was satisfied with the nature, extent and quality of the investment advisory services provided to each Fund by Funds Management and Wells Capital Management.
Fund performance and expenses
The Board considered the performance results for each of the Funds over various time periods ended December 31, 2010. The Board also considered these results in comparison to the median performance of a universe of relevant funds (the “Universe”) that were determined by Lipper Inc. (“Lipper”) to be similar to the Funds, and in comparison to each Fund’s benchmark index and to other comparative data. Lipper is an independent provider of investment company data. The Board received a description of the methodology used by Lipper to select the mutual funds in the Universe.
The Board noted that the performance of each of the Funds was higher than or in range of the median performance of the Universe for the periods under review, except for the Money Market Fund (Class B).
The Board received and considered information regarding each Fund’s contractual advisory fee and net operating expense ratios and their various components, including actual management fees (which reflect fee waivers, if any), transfer agent, custodian and other non-management fees, Rule 12b-1 and non-Rule 12b-1 fees, service fees and fee waiver and expense reimbursement arrangements. The Board also considered these ratios in comparison to the median ratios of an expense Universe and a narrower expense group of mutual funds (each, an “Expense Group”) that was determined by Lipper to be similar to each Fund. The Board received a description of the methodology used by Lipper to select the mutual funds in a Fund’s Expense Group. The Board noted that the net operating expense ratios of the Service Class, Administrator Class, Institutional Class and Select Class of each of the Funds were in range of each Fund’s respective Expense Group’s median net operating expense ratio, except for the 100% Treasury Money Market Fund (Service Class). The Board also noted that the net operating expense ratios of the Class A and Sweep Class of each of the Funds, the Money Market Fund (A, B, C, Daily and Investor Classes) were higher than each Fund’s respective Expense Group’s median net operating expense ratio.
Based on the above-referenced considerations and other factors, the Board concluded that the overall performance and expense structure of the Funds supported the re-approval of the Advisory Agreements for the Funds.
Investment advisory and sub-advisory fee rates
The Board reviewed and considered the contractual investment advisory fee rates that are payable by the Funds to Funds Management for investment advisory services (the “Advisory Agreement Rates”), both on a stand-alone basis and on a combined basis with the Funds’ administration fee rates. The Board took into account the separate administrative and other services covered by the administration fee rates. The Board also reviewed and considered the contractual investment sub-advisory fee rates that are payable by Funds Management to Wells Capital Management for investment sub-advisory services (the “Sub-Advisory Agreement Rates”). In addition, the Board reviewed and considered the existing fee waiver/cap arrangements applicable to the Advisory Agreement Rates and considered the Advisory Agreement Rates after taking the waivers/caps into account (the “Net Advisory Rates”).
The Board received and considered information comparing the Advisory Agreement Rates and Net Advisory Rates with those of other funds in each Fund’s Expense Group median. The Board noted that the Advisory Agreement Rates for the Class A, Service Class, Administrator Class, Institutional Class and Select Class of each of the Funds were in range of each Fund’s respective Expense Group, except for the 100% Treasury Money Market Fund (Administrator Class). The Board noted that the Advisory Agreement Rates for the Sweep Class of each of the Funds was not appreciably higher than the median rate of each Fund’s Expense Group, except for the 100% Treasury Money Market Fund. The Board also noted that the Advisory Agreement Rates for the Money Market Fund (Class B, Class C, Daily Class and Investor Class) were higher than the median rate of the Expense Group. The Board noted that the Net Advisory Rates for the Service Class, Administrator Class, Institutional Class and Select Class of each of the Funds were in range of each Fund’s respective Expense Group. The Board also noted that the Net Advisory Rates for the Class A and Sweep Class of each of the Funds and the Money Market Fund (Class B, Class C, Daily Class and Investor Class) were higher than each Fund’s respective Expense Group. The Board further noted that Funds Management had agreed to continue and, in certain instances, reduce contractual fee cap arrangements for the Funds designed to lower the Funds’ expenses.
| | | | | | |
| Other Information (Unaudited) | | Wells Fargo Advantage Cash Investment Money Market Fund | | | 39 | |
The Board also received and considered information about the nature and extent of services offered and fee rates charged by Funds Management and Wells Capital Management to other types of clients. In this regard, the Board received information about differences between the services, and the compliance, reporting, and other legal burdens and risks of providing investment advice to mutual funds and those associated with providing advice to non-mutual fund clients such as collective funds or institutional separate accounts.
In each case, the Board determined that the Advisory Agreement Rates for the Funds, both with and without administration fee rates and before and after waivers, were acceptable in light of the Funds’ Expense Group information, the net expense ratio commitments, the services covered by the Advisory Agreements and other information provided. The Board also reviewed and considered the Sub-Advisory Agreement Rates and concluded that the Sub-Advisory Agreement Rates were acceptable in light of the services covered by the Sub-Advisory Agreement and other information provided.
Profitability
The Board received and considered a profitability analysis of Funds Management, as well as an analysis of the profitability to the collective Wells Fargo businesses that provide services to the Funds. It considered that the information provided to it was necessarily estimated, and that the profitability information provided to it, especially on a fund-by-fund basis, did not necessarily provide a precise tool for evaluating the appropriateness of each Fund’s Advisory Agreement Rates in isolation. It noted that the levels of profitability of the Funds to Funds Management varied widely, depending on, among other things, the size and type of fund. The Board concluded that the profitability to Funds Management of the services provided to any of the Funds, individually or in the aggregate, was not unreasonable.
The Board did not consider separate profitability information with respect to Wells Capital Management, because, as an affiliate of Funds Management, its profitability information was subsumed in the collective Wells Fargo profitability analysis provided by Funds Management.
Economies of scale
With respect to possible economies of scale, the Board reviewed the breakpoints in each Fund’s advisory fee structure, which operate generally to reduce the effective Advisory Agreement Rates of the Funds (as a percentage of Fund assets) as the Funds grow in size. It considered that, as a fund shrinks in size, breakpoints conversely result in increasing fee levels. The Board noted that it would continue to review the appropriate levels of breakpoints in the future, and concluded that the breakpoints as implemented appeared to be a reasonable step toward sharing economies of scale with the Funds. However, the Board acknowledged the inherent limitations of any analysis of an investment adviser’s economies of scale and of any attempt to correlate breakpoints with such economies, stemming largely from the Board’s understanding that economies of scale are realized, if at all, by an investment adviser across a variety of products and services, not just with respect to a single fund.
Other benefits to Funds Management and Wells Capital Management
The Board received and considered information regarding potential “fall-out” or ancillary benefits received by Funds Management and its affiliates, including Wells Capital Management, as a result of their relationship with the Funds. Ancillary benefits could include, among others, benefits directly attributable to the relationship of Funds Management and Wells Capital Management with the Funds and benefits potentially derived from an increase in Funds Management’s and Wells Capital Management’s business as a result of their relationship with the Funds (such as the ability to market to shareholders other financial products offered by Funds Management and its affiliates, including Wells Capital Management).
The Board considered that Wells Fargo Funds Distributor, LLC, an affiliate of Funds Management, serves as distributor to the Funds and receives certain compensation for those services. The Board noted that the Funds pay sub-transfer agency fees to various financial institutions, including affiliates of Funds Management that hold fund shares in omnibus accounts. It also considered that these entities may receive distribution-related fees and shareholder servicing payments (including amounts derived from payments under the funds’ Rule 12b-1 plans) in respect of shares sold or held through them.
The Board also reviewed information about whether and to what extent soft dollar credits are sought and how any such credits are utilized and any benefits that may be realized by using an affiliated broker.
| | | | |
| 40 | | Wells Fargo Advantage Cash Investment Money Market Fund | | Other Information (Unaudited) |
Other factors and broader review
The Board also considered the markets for distribution of the Funds’ shares, including the multiple channels through which the Funds’ shares are offered and sold. The Board noted that the Funds are part of one of the few fund families that have both direct-to-fund and intermediary distribution channels. As discussed above, the Board reviews detailed materials received from Funds Management and Wells Capital Management annually as part of the re-approval process under Section 15 of the 1940 Act and also reviews and assesses information about the quality of the services that the Funds receive throughout the year. In this regard, the Board has reviewed reports of Funds Management at each of its quarterly meetings, which include, among other things, portfolio reviews and performance reports. In addition, the Board confers with portfolio managers at various times throughout the year.
Conclusion
After considering the above-described factors and based on its deliberations and its evaluation of the information described above, the Board concluded that approval of the continuation of the Advisory Agreements for the Funds was in the best interest of the Funds and their shareholders. Accordingly, the Board unanimously approved the continuation of the Advisory Agreements for an additional one-year period.
| | | | | | |
| List of Abbreviations | | Wells Fargo Advantage Cash Investment Money Market Fund | | | 41 | |
The following is a list of common abbreviations for terms and entities which may have appeared in this report.
| ABAG | — Association of Bay Area Governments |
| ACB | — Agricultural Credit Bank |
| ADR | — American Depositary Receipt |
| ADS | — American Depository Shares |
| AGC-ICC | — Assured Guaranty Corporation - Insured Custody Certificates |
| AGM | — Assured Guaranty Municipal |
| AMBAC | — American Municipal Bond Assurance Corporation |
| AMT | — Alternative Minimum Tax |
| ARM | — Adjustable Rate Mortgages |
| BAN | — Bond Anticipation Notes |
| BART | — Bay Area Rapid Transit |
| BHAC | — Berkshire Hathaway Assurance Corporation |
| CCAB | — Convertible Capital Appreciation Bond |
| CDA | — Community Development Authority |
| CDO | — Collateralized Debt Obligation |
| CDSC | — Contingent Deferred Sales Charge |
| CGIC | — Capital Guaranty Insurance Company |
| CGY | — Capital Guaranty Corporation |
| CIFG | — CDC (Caisse des Dépôts et Consignations) IX IS Financial Guarantee |
| COP | — Certificate of Participation |
| DRIVER | — Derivative Inverse Tax-Exempt Receipts |
| DW&P | — Department of Water & Power |
| DWR | — Department of Water Resources |
| ECFA | — Educational & Cultural Facilities Authority |
| EDA | — Economic Development Authority |
| EDFA | — Economic Development Finance Authority |
| ETET | — Eagle Tax-Exempt Trust |
| ETF | — Exchange-Traded Fund |
| FFCB | — Federal Farm Credit Bank |
| FGIC | — Financial Guaranty Insurance Corporation |
| FHA | — Federal Housing Authority |
| FHAG | — Federal Housing Agency |
| FHLB | — Federal Home Loan Bank |
| FHLMC | — Federal Home Loan Mortgage Corporation |
| FNMA | — Federal National Mortgage Association |
| GDR | — Global Depositary Receipt |
| GNMA | — Government National Mortgage Association |
| HCFR | — Healthcare Facilities Revenue |
| HEFA | — Health & Educational Facilities Authority |
| HEFAR | — Higher Education Facilities Authority Revenue |
| HFA | — Housing Finance Authority |
| HFFA | — Health Facilities Financing Authority |
| HUD | — Housing & Urban Development |
| IBC | — Insured Bond Certificate |
| IDA | — Industrial Development Authority |
| IDAG | — Industrial Development Agency |
| IDR | — Industrial Development Revenue |
| KRW | — Republic of Korea Won |
| LIBOR | — London Interbank Offered Rate |
| LLC | — Limited Liability Company |
| LLP | — Limited Liability Partnership |
| MBIA | — Municipal Bond Insurance Association |
| MFHR | — Multi-Family Housing Revenue |
| MFMR | — Multi-Family Mortgage Revenue |
| MMD | — Municipal Market Data |
| MSTR | — Municipal Securities Trust Receipts |
| MUD | — Municipal Utility District |
| NATL-RE | — National Public Finance Guarantee Corporation |
| PCFA | — Pollution Control Finance Authority |
| PCR | — Pollution Control Revenue |
| PFA | — Public Finance Authority |
| PFFA | — Public Facilities Financing Authority |
| PFOTER | — Puttable Floating Option Tax-Exempt Receipts |
| plc | — Public Limited Company |
| PSFG | — Public School Fund Guaranty |
| PUTTER | — Puttable Tax-Exempt Receipts |
| R&D | — Research & Development |
| RDA | — Redevelopment Authority |
| RDFA | — Redevelopment Finance Authority |
| REIT | — Real Estate Investment Trust |
| RIB | — Residual Interest Bond |
| ROC | — Reset Option Certificates |
| SAVRS | — Select Auction Variable Rate Securities |
| SFHR | — Single Family Housing Revenue |
| SFMR | — Single Family Mortgage Revenue |
| SLMA | — Student Loan Marketing Association |
| SPDR | — Standard & Poor’s Depositary Receipts |
| STIT | — Short-Term Investment Trust |
| TAN | — Tax Anticipation Notes |
| TIPS | — Treasury Inflation-Protected Securities |
| TRAN | — Tax Revenue Anticipation Notes |
| TCR | — Transferable Custody Receipts |
| TTFA | — Transportation Trust Fund Authority |
| USD | — Unified School District |
| XLCA | — XL Capital Assurance |
This page is intentionally left blank.


FOR MORE INFORMATION
More information about Wells Fargo Advantage Funds is available free upon request. To obtain literature, please write, e-mail, visit the Funds’ Web site, or call:
Wells Fargo Advantage Funds
P.O. Box 8266
Boston, MA 02266-8266
E-mail: wfaf@wellsfargo.com
Web site: www.wellsfargo.com/advantagefunds
Individual investors: 1-800-222-8222
Retail investment professionals: 1-888-877-9275
Institutional investment professionals: 1-866-765-0778
This report and the financial statements contained herein are submitted for the general information of the shareholders of Wells Fargo Advantage Funds. If this report is used for promotional purposes, distribution of the report must be accompanied or preceded by a current prospectus. For a prospectus containing more complete information, including charges and expenses, call 1-800-222-8222 or visit the Funds’ Web site at www.wellsfargo.com/advantagefunds. Please consider the investment objectives, risks, charges, and expenses of the investment carefully before investing. This and other information about Wells Fargo Advantage Funds can be found in the current prospectus. Read the prospectus carefully before you invest or send money.
Wells Fargo Funds Management, LLC, a wholly owned subsidiary of Wells Fargo & Company, provides investment advisory and administrative services for Wells Fargo Advantage Funds. Other affiliates of Wells Fargo & Company provide subadvisory and other services for the Funds. The Funds are distributed by Wells Fargo Funds Distributor, LLC, Member FINRA/SIPC, an affiliate of Wells Fargo & Company.
NOT FDIC INSURED ¡ NO BANK GUARANTEE ¡ MAY LOSE VALUE
© 2011 Wells Fargo Funds Management, LLC. All rights reserved.
| | |
 | | 204798 09-11 SA302/SAR302 7-11 |

Wells Fargo Advantage
Government Money Market Fund

Semi-Annual Report
July 31, 2011

Reduce clutter. Save trees.
Sign up for electronic delivery of prospectuses and shareholder reports at www.wellsfargo.com/advantagedelivery
Contents
The views expressed and any forward-looking statements are as of July 31, 2011, unless otherwise noted and are those of the Fund managers and/or Wells Fargo Funds Management, LLC. Discussions of individual securities, or the markets generally, or any Wells Fargo Advantage Fund are not intended as individual recommendations. Future events or results may vary significantly from those expressed in any forward-looking statements; the views expressed are subject to change at any time in response to changing circumstances in the market. Wells Fargo Funds Management, LLC, disclaims any obligation to publicly update or revise any views expressed or forward-looking statements.
NOT FDIC INSURED ¡ NO BANK GUARANTEE ¡ MAY LOSE VALUE

WELLS FARGO INVESTMENT HISTORY
| | |
| |
| 1932 | | Keystone creates one of the first mutual fund families. |
| |
| 1971 | | Wells Fargo & Company introduces one of the first institutional index funds. |
| |
| 1978 | | Wells Fargo applies Markowitz and Sharpe’s research on Modern Portfolio Theory to introduce one of the industry’s first Tactical Asset Allocation (TAA) models in institutional separately managed accounts. |
| |
| 1984 | | Wells Fargo Stagecoach Funds launches its first asset allocation fund. |
| |
| 1989 | | The Tactical Asset Allocation (TAA) Model is first applied to Wells Fargo’s asset allocation mutual funds. |
| |
| 1994 | | Wells Fargo introduces the LifePath Funds, one of the first suites of target date funds (now the Wells Fargo Advantage Dow Jones Target Date FundsSM ). |
| |
| 1996 | | Evergreen Investments and Keystone Funds merge. |
| |
| 1997 | | Wells Fargo launches Wells Fargo Advantage WealthBuilder PortfoliosSM, a fund-of-funds suite of products that includes the use of quantitative models to shift assets among investment styles. |
| |
| 1999 | | Norwest Advantage Funds and Stagecoach Funds are reorganized into Wells Fargo Funds after the merger of Norwest and Wells Fargo. |
| |
| 2002 | | Evergreen Retail and Evergreen Institutional companies form the umbrella asset management company, Evergreen Investments. |
| |
| 2005 | | The integration of Strong Funds with Wells Fargo Funds creates Wells Fargo Advantage Funds, resulting in one of the top 20 mutual fund companies in the United States. |
| |
| 2006 | | Wells Fargo Advantage Funds relaunches the target date product line as Wells Fargo Advantage Dow Jones Target Date Funds. |
| |
| 2010 | | The mergers and reorganizations of Evergreen and Wells Fargo Advantage mutual funds are completed, unifying the families under the brand of Wells Fargo Advantage Funds. |
Wells Fargo Advantage Funds®
Wells Fargo Advantage Funds skillfully guides institutions, financial advisors, and individuals through the investment terrain to help them reach their financial objectives. Everything we do on behalf of investors is backed by our unique combination of qualifications.
Strength
Our organization is built on the standards of integrity and service established by our parent company—Wells Fargo & Company—more than 150 years ago. And, because we’re part of a highly diversified financial enterprise, we offer the depth of resources to help investors succeed.
Expertise
Our multi-boutique model offers investors access to the independent thinking of premier investment managers that have been chosen for their time-tested strategies. While each team specializes in a specific investment strategy, collectively they provide investors a wide choice of distinct investment styles. Our dedication to investment excellence doesn’t end with our expertise in manager selection—risk management, analysis, and rigorous ongoing review seek to ensure each manager’s investment process remains consistent.
Partnership
Our collaborative approach is built around understanding the needs and goals of our clients. By adhering to core principles of sound judgment and steady guidance, we support you through every stage of the investment decision process.
Carefully consider the investment objectives, risks, charges, and expenses before investing. For a current prospectus for Wells Fargo Advantage Funds containing this and other information, visit wellsfargo.com/advantagefunds. Read it carefully before investing.
Wells Fargo Funds Management, LLC, a wholly owned subsidiary of Wells Fargo & Company, provides investment advisory and administrative services for Wells Fargo Advantage Funds®. Other affiliates of Wells Fargo & Company provide subadvisory and other services for the Funds. The Funds are distributed by Wells Fargo Funds Distributor, LLC, Member FINRA/SIPC, an affiliate of Wells Fargo & Company.
The “Dow Jones Target Date Indexes” are a product of Dow Jones Indexes, a licensed trademark of CME Group Index Services LLC (“CME”). “Dow Jones” and “Dow Jones Target Date Indexes” are service marks of Dow Jones Trademark Holdings, LLC, and have been licensed for use for certain purposes by CME and sublicensed for use by Global Index Advisors, Inc., and Wells Fargo Funds Management, LLC. The Dow Jones Target Date Indexes are based in part on the Barclays Capital Bond Indexes, which are published by Barclays Capital Inc. The Wells Fargo Advantage Dow Jones Target Date Funds, based on the Dow Jones Target Date Indexes, are not sponsored, endorsed, sold, or promoted by Dow Jones, CME or Barclays Capital or any of their respective affiliates, and neither Dow Jones, CME nor Barclays Capital nor any of their respective affiliates makes any representation regarding the advisability of investing in such product(s) and/or about the quality, accuracy, and/or completeness of the Dow Jones Target Date Indexes or the Barclays Capital Bond Indexes. IN NO EVENT SHALL DOW JONES, CME, BARCLAYS CAPITAL, OR ANY OF THEIR LICENSORS HAVE ANY LIABILITY IN CONNECTION WITH THE Wells Fargo Advantage Dow Jones Target Date Funds INCLUDING, WITHOUT LIMITATION, FOR ANY SPECIAL, PUNITIVE, IN DIRECT, OR CONSEQUENTIAL DAMAGES (INCLUDING LOST PROFITS), EVEN IF NOTIFIED OF THE POSSIBILITY OF SUCH DAMAGES.
NOT FDIC INSURED ¡ NO BANK GUARANTEE ¡ MAY LOSE VALUE
Not part of the semi-annual report.
Wells Fargo Advantage Funds offers more than 110 mutual funds across a wide range of asset classes, representing over $221 billion in assets under management, as of July 31, 2011.
| | | | |
| Equity Funds | | | | |
Asia Pacific Fund | | Global Opportunities Fund | | Premier Large Company Growth Fund |
C&B Large Cap Value Fund | | Growth Fund | | Small Cap Opportunities Fund |
C&B Mid Cap Value Fund | | Health Care Fund | | Small Cap Value Fund |
Capital Growth Fund | | Index Fund | | Small Company Growth Fund |
Common Stock Fund | | International Equity Fund | | Small Company Value Fund |
Disciplined U.S. Core Fund | | International Value Fund | | Small/Mid Cap Core Fund |
Discovery Fund† | | Intrinsic Small Cap Value Fund | | Small/Mid Cap Value Fund |
Diversified Equity Fund | | Intrinsic Value Fund | | Social Sustainability Fund† |
Diversified International Fund | | Intrinsic World Equity Fund | | Special Mid Cap Value Fund |
Diversified Small Cap Fund | | Large Cap Core Fund | | Special Small Cap Value Fund |
Emerging Growth Fund | | Large Cap Growth Fund | | Specialized Technology Fund |
Emerging Markets Equity Fund | | Large Company Value Fund | | Strategic Large Cap Growth Fund |
Endeavor Select Fund† | | Omega Growth Fund | | Traditional Small Cap Growth Fund |
Enterprise Fund† | | Opportunity Fund† | | Utility and Telecommunications Fund |
Equity Value Fund | | Precious Metals Fund | | |
| Bond Funds | | | | |
Adjustable Rate Government Fund | | Inflation-Protected Bond Fund | | Short-Term Bond Fund |
California Limited-Term Tax-Free Fund | | Intermediate Tax/AMT-Free Fund | | Short-Term High Yield Bond Fund |
California Tax-Free Fund | | International Bond Fund | | Short-Term Municipal Bond Fund |
Colorado Tax-Free Fund | | Minnesota Tax-Free Fund | | Strategic Municipal Bond Fund |
Government Securities Fund | | Municipal Bond Fund | | Total Return Bond Fund |
High Income Fund | | North Carolina Tax-Free Fund | | Ultra Short-Term Income Fund |
High Yield Bond Fund | | Pennsylvania Tax-Free Fund | | Ultra Short-Term Municipal Income Fund |
Income Plus Fund | | Short Duration Government Bond Fund | | Wisconsin Tax-Free Fund |
| Asset Allocation Funds | | | | |
Asset Allocation Fund | | WealthBuilder Equity Portfolio† | | Target 2020 Fund† |
Conservative Allocation Fund | | WealthBuilder Growth Allocation Portfolio† | | Target 2025 Fund† |
Diversified Capital Builder Fund | | WealthBuilder Growth Balanced Portfolio† | | Target 2030 Fund† |
Diversified Income Builder Fund | | WealthBuilder Moderate Balanced Portfolio† | | Target 2035 Fund† |
Growth Balanced Fund | | WealthBuilder Tactical Equity Portfolio† | | Target 2040 Fund† |
Index Asset Allocation Fund | | Target Today Fund† | | Target 2045 Fund† |
Moderate Balanced Fund | | Target 2010 Fund† | | Target 2050 Fund† |
WealthBuilder Conservative Allocation Portfolio† | | Target 2015 Fund† | | Target 2055 Fund† |
| Money Market Funds | | | | |
100% Treasury Money Market Fund | | Minnesota Money Market Fund | | New Jersey Municipal Money Market Fund |
California Municipal Money Market Fund | | Money Market Fund | | New York Municipal Money Market Fund |
Cash Investment Money Market Fund | | Municipal Cash Management Money Market Fund | | Pennsylvania Municipal Money Market Fund |
Government Money Market Fund | | Municipal Money Market Fund | | Prime Investment Money Market Fund |
Heritage Money Market Fund† | | National Tax-Free Money Market Fund | | Treasury Plus Money Market Fund |
| Variable Trust Funds1 | | | | |
VT Discovery Fund† | | VT Intrinsic Value Fund | | VT Small Cap Growth Fund |
VT Index Asset Allocation Fund | | VT Omega Growth Fund | | VT Small Cap Value Fund |
VT International Equity Fund | | VT Opportunity Fund† | | VT Total Return Bond Fund |
An investment in a money market fund is not insured or guaranteed by the Federal Deposit Insurance Corporation or any other government agency. Although the Wells Fargo Advantage Money Market Funds seek to preserve the value of your investment at $1.00 per share, it is possible to lose money by investing in a money market fund.
| 1. | The Variable Trust Funds are generally available only through insurance company variable contracts. |
| † | In this report, the Wells Fargo Advantage Discovery FundSM, Wells Fargo Advantage Endeavor Select FundSM, Wells Fargo Advantage Enterprise FundSM, Wells Fargo Advantage Opportunity FundSM, Wells Fargo Advantage Social Sustainability FundSM, Wells Fargo Advantage WealthBuilder Conservative Allocation PortfolioSM, Wells Fargo Advantage WealthBuilder Equity PortfolioSM, Wells Fargo Advantage WealthBuilder Growth Allocation PortfolioSM, Wells Fargo Advantage WealthBuilder Growth Balanced PortfolioSM, Wells Fargo Advantage WealthBuilder Moderate Balanced PortfolioSM, Wells Fargo Advantage WealthBuilder Tactical Equity PortfolioSM, Wells Fargo Advantage Dow Jones Target Today FundSM, Wells Fargo Advantage Dow Jones Target 2010 FundSM, Wells Fargo Advantage Dow Jones Target 2015 FundSM, Wells Fargo Advantage Dow Jones Target 2020 FundSM, Wells Fargo Advantage Dow Jones Target 2025 FundSM, Wells Fargo Advantage Dow Jones Target 2030 FundSM, Wells Fargo Advantage Dow Jones Target 2035 FundSM, Wells Fargo Advantage Dow Jones Target 2040 FundSM, Wells Fargo Advantage Dow Jones Target 2045 FundSM, Wells Fargo Advantage Dow Jones Target 2050 FundSM, Wells Fargo Advantage Dow Jones Target 2055 FundSM, Wells Fargo Advantage Heritage Money Market FundSM, Wells Fargo Advantage VT Discovery FundSM, and Wells Fargo Advantage VT Opportunity FundSM are referred to as the Discovery Fund, Endeavor Select Fund, Enterprise Fund, Opportunity Fund, Social Sustainability Fund, WealthBuilder Conservative Allocation Portfolio, WealthBuilder Equity Portfolio, WealthBuilder Growth Allocation Portfolio, WealthBuilder Growth Balanced Portfolio, WealthBuilder Moderate Balanced Portfolio, WealthBuilder Tactical Equity Portfolio, Target Today Fund, Target 2010 Fund, Target 2015 Fund, Target 2020 Fund, Target 2025 Fund, Target 2030 Fund, Target 2035 Fund, Target 2040 Fund, Target 2045 Fund, Target 2050 Fund, Target 2055 Fund, Heritage Money Market Fund, VT Discovery Fund, and VT Opportunity Fund, respectively. |
Not part of the semi-annual report.
| | | | |
| 2 | | Wells Fargo Advantage Government Money Market Fund | | Letter to Shareholders |

Karla M. Rabusch,
President
Wells Fargo Advantage Funds
While the FOMC explained that it “expects the pace of recovery to pick up over coming quarters,” it indicated that the federal funds rate will remain at an exceptionally low level for as long as necessary to ensure a sustainable recovery and expansion.
Dear Valued Shareholder,
We’re pleased to offer you this semi-annual report for the Wells Fargo Advantage Government Money Market Fund for the six-month period that ended July 31, 2011. Upon reviewing the report, you may notice a few changes from past reports, the most significant of which is the change from a multi-fund report to a single-fund report. We believe this change will give you more convenient access to your fund data.
The period began modestly as improving economic optimism generally shifted investors toward equities and riskier assets and away from U.S. Treasuries and lower-yielding fixed-income securities. Returns from fixed income were modest in the opening months of 2011 but were generally still positive as U.S. Treasury yields incrementally climbed higher. But after the slow start, bond prices once again strongly improved, sparked by a sharp decline in U.S. Treasury prices in April that carried into May. Late in the period, lower-rated bonds declined in price more than the higher credit-quality tiers but not enough to outweigh the stronger performance from lower-rated securities during the period. Lower-quality and longer-maturity fixed-income securities generally outperformed higher-quality and shorter-maturity securities over the full period.
The activity within the broader bond market also resonated with money market participants. As the economic and credit environment reverberated from the ongoing sovereign debt concerns and softening economic data, many participants continued to balance a need for stability and desire for higher yields. The result has been good demand for domestic commercial paper and certificate of deposits. Also, in spite of all the discussion about sovereign debt, many money market participants continue to maintain some exposures to foreign banks based on the quality of their fundamentals. By focusing more on the fundamentals and taking a more selective approach to the short-term security market helped the markets avoid the severe yield volatility or significant flight-to-quality experienced during the spring of 2010, when the Greek sovereign debt crisis first emerged.
The global economic “recovery” hit a snag, but the end of 2011 could regain momentum.
The U.S. economic recovery that began in mid-2009 and gained further momentum throughout 2010, particularly during the fourth quarter, has failed to maintain that level of growth through the first seven months of 2011. For example, gross domestic product (GDP), the broadest measure of economic activity, grew at an annualized rate of 3.1% in the fourth quarter of 2010, only to slow dramatically during the first quarter of 2011. The latest revision to first-quarter GDP data during the period indicated that the economy grew at an annualized rate of 0.4% during the first quarter of 2011. While still positive, it’s a much slower pace of growth than experienced in the second half of 2010 and notably lower than consensus forecasts. Nevertheless, the advance estimate of second-quarter 2011 GDP, which was released on July 29, 2011, was 1.3%, suggesting that the U.S. economy continues to expand, though at a slow and uneven pace.
Jobs and housing remained troublesome.
The July 2011 unemployment rate in the U.S. was reported at 9.1%, down from 9.5% a year earlier but still notably higher than historical averages. Unfortunately, the drop may be more attributable to a decline in the labor force than to a
| | | | | | |
| Letter to Shareholders | | Wells Fargo Advantage Government Money Market Fund | | | 3 | |
meaningful uptick in hiring. The level of job creation in 2011 has been trending below historical averages, suggesting that the improving economy has yet to translate into widespread hiring. Meanwhile, the beleaguered housing market was an ongoing source of concern, despite some tentative late-year signs of stabilization. That said, persistent weakness in the labor and housing markets bears close watching in the months ahead.
Other economic data in the U.S. has been more encouraging, reflecting greater confidence in the sustainability of the expansion on the part of both consumers and businesses. Retail sales came in strong at certain points during the period and industrial production and new orders have picked up. Although still reluctant to hire, businesses have gradually increased spending in other areas, such as equipment and information technology. Core inflation, which excludes volatile food and energy prices, remained benign.
The Federal Reserve believes the economic recovery will accelerate in future quarters.
With inflation subdued, the Federal Open Market Committee (FOMC) held its target range for the federal funds rate—a proxy for short-term interest rates—steady at 0.00% to 0.25%. On June 22, 2011, in its final statement of the six-month period, the Fed reiterated that the economic recovery “is proceeding at a moderate pace,” but that “recent labor market indicators have been weaker than anticipated.” It described the recent increase in inflation as temporary, suggesting that inflation pressures will ease going forward. While the FOMC explained that it “expects the pace of recovery to pick up over coming quarters,” it indicated that the federal funds rate will remain at an exceptionally low level for as long as necessary to ensure a sustainable recovery and expansion.
As recent headwinds subside, it is reasonable to expect markets to regain focus.
Now that it appears the debt ceiling has been increased and a U.S. default will be averted, money market participants and the broader bond market can get back to more fundamental and lasting concerns-chiefly, the economy. After avoiding short-term Treasuries in late July 2011, ahead of pending U.S. debt ceiling deadline, money market participants have returned to the U.S. short-term markets1. Economic indicators released in the second half of 2011 might not be as soft as those reported during the first half of the year. While that would not mean that the economy is robust, it might remind the markets that the first half of the slowdown was transitory. Most indicators still point toward real GDP growth in the 2% to 3% range in the second half of 2011. While that is not enough to produce big employment gains, it might be sufficient to cause Treasury yields to retrace some of the late-July declines.
Don’t let short-term uncertainty derail long-term investment goals.
While periods of uncertainty can present challenges, experience has taught us that maintaining a long-term investment strategy based on individual goals and risk tolerance can be an effective way to plan for the future. As a whole, Wells Fargo Advantage Funds represents investments across a broad range of asset classes and investment styles with more than 110 mutual funds, giving you an opportunity to create a diversified investment portfolio. While diversification may
| 1. | Comments expressed that do not fall within the reporting period are as of August 2, 2011. |
Economic indicators released in the second half of 2011 might not be as soft as those reported during the first half of the year. While that would not mean that the economy is robust, it might remind the markets that the first half of the slowdown was transitory.
| | | | |
| 4 | | Wells Fargo Advantage Government Money Market Fund | | Letter to Shareholders |
not prevent losses in a downturn, it may help to reduce them and provide you with one way of managing risk.
In our opinion, diligent and earnest assessment of the fundamental characteristics of money market eligible securities will be a key differentiating factor between which investment strategies meet client expectations and which do not. At Wells Fargo Advantage Funds, we intend to continue the emphasis of principal preservation and high liquidity across our lineup of Wells Fargo Advantage Money Market Funds. In changing markets, we believe it is particularly important to have diligent investment analysts in charge of investor assets.
Thank you for choosing Wells Fargo Advantage Funds. We appreciate your confidence in us and are committed to helping you meet your financial needs. If you have any questions about your investments, please contact your investment professional, call us at 1-800-222-8222, or visit www.wellsfargo.com/advantagefunds.
Sincerely,

Karla M. Rabusch
President
Wells Fargo Advantage Funds
| | | | | | |
| Performance Highlights (Unaudited) | | Wells Fargo Advantage Government Money Market Fund | | | 5 | |
INVESTMENT OBJECTIVE
The Fund seeks current income, while preserving capital and liquidity.
ADVISER
Wells Fargo Funds Management, LLC
SUB-ADVISER
Wells Capital Management Incorporated
PORTFOLIO MANAGERS
David D. Sylvester
Laurie White
FUND INCEPTION
November 16, 1987
| | |
PORTFOLIO COMPOSITION1 (AS OF JULY 31, 2011) |
 |
|
EFFECTIVE MATURITY DISTRIBUTION1
(AS OF JULY 31, 2011) |
 |
| | |
WEIGHTED AVERAGE MATURITY2
(AS OF JULY 31, 2011) |
| 26 Days |
| | |
WEIGHTED AVERAGE FINAL MATURITY3
(AS OF JULY 31, 2011) |
| 40 Days |
| 1. | Portfolio composition and effective maturity distribution are subject to change and are calculated based on the total investments of the Fund. Effective maturity distribution is based on the weighted average maturity of each security. |
| 2. | Weighted Average Maturity (WAM): WAM calculates an average time to maturity of all of the securities held in the portfolio, weighted by each security’s percentage of net assets. The calculation takes into account the final maturity of a fixed-income security and the interest rate reset date for floating-rate securities held in the portfolio. This is a way to measure a fund’s sensitivity to potential interest rate changes. |
| 3. | Weighted Average Final Maturity (WAFM): WAFM calculates a fund’s average time to maturity for all of the securities held in the portfolio, weighted to their percentage of assets in the Fund. In contrast to WAM, the WAFM calculation takes into account the final maturity date for each security held in the portfolio. This is a way to measure a fund’s potential sensitivity to credit spread changes. |
| | | | |
| 6 | | Wells Fargo Advantage Government Money Market Fund | | Performance Highlights (Unaudited) |
AVERAGE ANNUAL TOTAL RETURN4 (%) (AS OF JULY 31, 2011)
| | | | | | | | | | | | | | | | | | | | | | | | | | | | |
| | | | | | | | | | | | | | | | | | Expense Ratios5 | |
| | | Inception Date | | | 6 Months* | | | 1 Year | | | 5 Year | | | 10 Year | | | Gross | | | Net6 | |
Class A (WFGXX) | | | 11/08/1999 | | | | 0.00 | | | | 0.01 | | | | 1.66 | | | | 1.68 | | | | 0.62% | | | | 0.62% | |
Administrator Class (WGAXX) | | | 07/31/2003 | | | | 0.00 | | | | 0.01 | | | | 1.81 | | | | 1.90 | | | | 0.35% | | | | 0.35% | |
Institutional Class (GVIXX) | | | 07/28/2003 | | | | 0.01 | | | | 0.02 | | | | 1.91 | | | | 1.99 | | | | 0.23% | | | | 0.20% | |
Service Class (NWGXX) | | | 11/16/1987 | | | | 0.00 | | | | 0.01 | | | | 1.73 | | | | 1.81 | | | | 0.52% | | | | 0.50% | |
Sweep Class | | | 06/30/2010 | | | | 0.00 | | | | 0.01 | | | | 1.73 | | | | 1.81 | | | | 0.97% | | | | 0.97% | |
| * | Returns for periods of less than one year are not annualized. |
| | | | | | | | | | | | | | | | | | | | |
FUND YIELD SUMMARY6
(AS OF JULY 31, 2011) | | Class A | | | Administrator
Class | | | Institutional
Class | | | Service
Class | | | Sweep
Class | |
7-Day Current Yield | | | 0.01% | | | | 0.01% | | | | 0.01% | | | | 0.01% | | | | 0.01% | |
7-Day Compound Yield | | | 0.01% | | | | 0.01% | | | | 0.01% | | | | 0.01% | | | | 0.01% | |
30-Day Simple Yield | | | 0.01% | | | | 0.01% | | | | 0.01% | | | | 0.01% | | | | 0.01% | |
30-Day Compound Yield | | | 0.01% | | | | 0.01% | | | | 0.01% | | | | 0.01% | | | | 0.01% | |
Figures quoted represent past performance, which is no guarantee of future results and do not reflect the deduction of taxes that a shareholder may pay on fund distributions or the redemption of fund shares. Investment returns will fluctuate. The Fund’s yield figures more closely reflect the current earnings of the Fund than the total return figures. Current performance may be lower or higher than the performance data quoted. Current month-end performance is available at the Fund’s Web site – www.wellsfargo.com/advantagefunds.
Each class is sold without a front-end sales charge or contingent deferred sales charge. Other fees and expenses apply to an investment in the Fund and are described in the Fund’s current prospectus.
An investment in a money market fund is not insured or guaranteed by the Federal Deposit Insurance Corporation or any other government agency. Although the Fund seeks to preserve the value of your investment at $1.00 per share, it is possible to lose money by investing in a money market fund. The U.S. Government guarantee applies to certain of the underlying securities held by the Fund and not to shares of the Fund itself.
| 4. | Historical performance shown for the Administrator Class and Institutional Class shares prior to their inception reflects the performance of the Service Class shares, and includes the higher expenses applicable to the Service Class shares. If these expenses had not been included, returns would be higher. Historical performance shown for the Sweep Class shares prior to their inception reflects the performance of the Service Class shares, and has not been adjusted to reflect the higher expenses applicable to the Sweep Class shares. If these expenses had been adjusted, returns would be lower. |
| 5. | Reflects the expense ratios as stated in the most recent prospectuses. |
| 6. | The Adviser has committed through July 11, 2013 to waive fees and/or reimburse expenses to the extent necessary to cap the Fund’s Total Annual Fund Operating Expenses After Fee Waiver, excluding certain expenses, at 0.65% for Class A, 0.35% for Administrator Class, 0.20% for Institutional Class, 0.50% for Service Class, and 1.05% for Sweep Class shares. Without this cap, the Fund’s returns would have been lower. Without waived fees and/or reimbursed expenses, the Fund’s 7-day current yield would have been (0.49)%, (0.22)%, (0.10)%, (0.39)% and (0.84)% for Class A, Administrator Class, Institutional Class, Service Class and Sweep Class, respectively. |
| | | | | | |
| Fund Expenses | | Wells Fargo Advantage Government Money Market Fund | | | 7 | |
As a shareholder of the Fund, you incur two types of costs: (1) transaction costs, including contingent deferred sales charges (if any) and (2) ongoing costs, including management fees; distribution (12b-1) and/or shareholder service fees; and other Fund expenses. This example is intended to help you understand your ongoing costs (in dollars) of investing in the Fund and to compare these costs with the ongoing costs of investing in other mutual funds.
The example is based on an investment of $1,000 invested at the beginning of the six-month period and held for the entire period from February 1, 2011 to July 31, 2011.
Actual Expenses
The “Actual” line of the table below provides information about actual account values and actual expenses. You may use the information in this line, together with the amount you invested, to estimate the expenses that you paid over the period. Simply divide your account value by $1,000 (for example, an $8,600 account value divided by $1,000 = 8.6), then multiply the result by the number in the “Actual” line under the heading entitled “Expenses Paid During Period” for your applicable class of shares to estimate the expenses you paid on your account during this period.
Hypothetical Example for Comparison Purposes
The “Hypothetical” line of the table below provides information about hypothetical account values and hypothetical expenses based on the Fund’s actual expense ratio and an assumed rate of return of 5% per year before expenses, which is not the Fund’s actual return. The hypothetical account values and expenses may not be used to estimate the actual ending account balance or expenses you paid for the period. You may use this information to compare the ongoing costs of investing in the Fund and other funds. To do so, compare this 5% hypothetical example with the 5% hypothetical examples that appear in the shareholder reports of the other funds.
Please note that the expenses shown in the table are meant to highlight your ongoing costs only and do not reflect any transactional costs, such as any contingent deferred sales charges. Therefore, the “Hypothetical” line of the table is useful in comparing ongoing costs only, and will not help you determine the relative total costs of owning different funds. In addition, if these transactional costs were included, your costs would have been higher.
| | | | | | | | | | | | | | | | |
| | | Beginning
Account Value
02-01-2011 | | | Ending
Account Value
07-31-2011 | | | Expenses
Paid During
the Period¹ | | | Net Annual
Expense Ratio | |
Class A | | | | | | | | | | | | | | | | |
Actual | | $ | 1,000.00 | | | $ | 1,000.05 | | | $ | 0.69 | | | | 0.14 | % |
Hypothetical (5% return before expenses) | | $ | 1,000.00 | | | $ | 1,024.10 | | | $ | 0.70 | | | | 0.14 | % |
Administrator Class | | | | | | | | | | | | | | | | |
Actual | | $ | 1,000.00 | | | $ | 1,000.05 | | | $ | 0.69 | | | | 0.14 | % |
Hypothetical (5% return before expenses) | | $ | 1,000.00 | | | $ | 1,024.10 | | | $ | 0.70 | | | | 0.14 | % |
Institutional Class | | | | | | | | | | | | | | | | |
Actual | | $ | 1,000.00 | | | $ | 1,000.05 | | | $ | 0.69 | | | | 0.14 | % |
Hypothetical (5% return before expenses) | | $ | 1,000.00 | | | $ | 1,024.10 | | | $ | 0.70 | | | | 0.14 | % |
Service Class | | | | | | | | | | | | | | | | |
Actual | | $ | 1,000.00 | | | $ | 1,000.05 | | | $ | 0.69 | | | | 0.14 | % |
Hypothetical (5% return before expenses) | | $ | 1,000.00 | | | $ | 1,024.10 | | | $ | 0.70 | | | | 0.14 | % |
Sweep Class | | | | | | | | | | | | | | | | |
Actual | | $ | 1,000.00 | | | $ | 1,000.05 | | | $ | 0.69 | | | | 0.14 | % |
Hypothetical (5% return before expenses) | | $ | 1,000.00 | | | $ | 1,024.10 | | | $ | 0.70 | | | | 0.14 | % |
| 1. | Expenses paid is equal to the annualized expense ratio of each class multiplied by the average account value over the period, multiplied by the number of days in the most recent fiscal half-year divided by the number of days in the fiscal year (to reflect the one-half year period). |
| | | | |
| 8 | | Wells Fargo Advantage Government Money Market Fund | | Portfolio of Investments—July 31, 2011 (Unaudited) |
| | | | | | | | | | | | | | | | |
| Security Name | | Interest Rate | | | Maturity Date | | | Principal | | | Value | |
| | | | | | | | | | | | | | | | |
| | | | |
Commercial Paper: 3.85% | | | | | | | | | | | | | | | | |
| | | | |
| Asset-Backed Commercial Paper: 3.85% | | | | | | | | | | | | | | | | |
Straight-A Funding LLC††^ | | | 0.16 | % | | | 09/26/2011 | | | $ | 30,510,000 | | | $ | 30,502,406 | |
Straight-A Funding LLC††^ | | | 0.13 | | | | 09/19/2011 | | | | 40,013,000 | | | | 40,005,920 | |
Straight-A Funding LLC††^ | | | 0.16 | | | | 10/13/2011 | | | | 22,747,000 | | | | 22,739,620 | |
Straight-A Funding LLC††^ | | | 0.16 | | | | 09/27/2011 | | | | 32,207,000 | | | | 32,198,841 | |
Straight-A Funding LLC††^ | | | 0.16 | | | | 10/05/2011 | | | | 88,000,000 | | | | 87,974,578 | |
Straight-A Funding LLC††^ | | | 0.13 | | | | 09/20/2011 | | | | 45,328,000 | | | | 45,319,816 | |
Straight-A Funding LLC††^ | | | 0.16 | | | | 10/06/2011 | | | | 104,996,000 | | | | 104,965,201 | |
Straight-A Funding LLC††^ | | | 0.15 | | | | 10/04/2011 | | | | 120,106,000 | | | | 120,073,972 | |
Straight-A Funding LLC††^ | | | 0.16 | | | | 10/19/2011 | | | | 100,070,000 | | | | 100,034,864 | |
Straight-A Funding LLC††^ | | | 0.15 | | | | 10/03/2011 | | | | 110,116,000 | | | | 110,087,095 | |
Straight-A Funding LLC††^ | | | 0.16 | | | | 10/05/2011 | | | | 115,058,000 | | | | 115,024,761 | |
Straight-A Funding LLC††^ | | | 0.16 | | | | 10/14/2011 | | | | 115,753,000 | | | | 115,714,930 | |
Straight-A Funding LLC††^ | | | 0.16 | | | | 10/17/2011 | | | | 85,000,000 | | | | 84,970,911 | |
Straight-A Funding LLC††^ | | | 0.15 | | | | 09/21/2011 | | | | 36,024,000 | | | | 36,016,345 | |
| | | | |
Total Commercial Paper (Cost $1,045,629,260) | | | | | | | | | | | | | | | 1,045,629,260 | |
| | | | | | | | | | | | | | | | |
| | | | |
| Government Agency Debt: 40.46% | | | | | | | | | | | | | | | | |
FFCB± | | | 0.08 | | | | 02/22/2012 | | | | 26,500,000 | | | | 26,483,645 | |
FFCB^ | | | 0.10 | | | | 10/27/2011 | | | | 25,000,000 | | | | 24,993,958 | |
FFCB± | | | 0.11 | | | | 01/25/2012 | | | | 145,000,000 | | | | 144,944,118 | |
FFCB± | | | 0.13 | | | | 06/18/2012 | | | | 50,000,000 | | | | 49,995,964 | |
FFCB^ | | | 0.15 | | | | 10/12/2011 | | | | 25,000,000 | | | | 24,992,500 | |
FFCB^ | | | 0.16 | | | | 08/23/2011 | | | | 25,000,000 | | | | 24,997,403 | |
FFCB± | | | 0.17 | | | | 03/14/2012 | | | | 200,000,000 | | | | 199,980,747 | |
FFCB± | | | 0.19 | | | | 10/07/2011 | | | | 200,000,000 | | | | 200,007,684 | |
FFCB^ | | | 0.19 | | | | 08/11/2011 | | | | 25,000,000 | | | | 24,998,542 | |
FFCB± | | | 0.20 | | | | 02/13/2012 | | | | 50,000,000 | | | | 50,002,685 | |
FFCB^ | | | 0.20 | | | | 08/09/2011 | | | | 100,000,000 | | | | 99,995,111 | |
FFCB^ | | | 0.20 | | | | 08/24/2011 | | | | 50,000,000 | | | | 49,993,292 | |
FFCB | | | 0.55 | | | | 09/30/2011 | | | | 24,110,000 | | | | 24,126,833 | |
FFCB | | | 0.68 | | | | 09/01/2011 | | | | 6,000,000 | | | | 6,002,736 | |
FFCB | | | 1.13 | | | | 10/03/2011 | | | | 30,500,000 | | | | 30,549,226 | |
FFCB | | | 3.50 | | | | 10/03/2011 | | | | 60,200,000 | | | | 60,547,607 | |
FHLB^ | | | 0.04 | | | | 09/02/2011 | | | | 100,000,000 | | | | 99,996,000 | |
FHLB^ | | | 0.06 | | | | 09/23/2011 | | | | 250,000,000 | | | | 249,974,052 | |
FHLB^ | | | 0.07 | | | | 08/17/2011 | | | | 226,050,000 | | | | 226,042,767 | |
FHLB^ | | | 0.07 | | | | 08/19/2011 | | | | 236,000,000 | | | | 235,991,240 | |
FHLB^ | | | 0.07 | | | | 08/24/2011 | | | | 50,000,000 | | | | 49,997,604 | |
FHLB^ | | | 0.07 | | | | 08/26/2011 | | | | 300,000,000 | | | | 299,983,611 | |
FHLB^ | | | 0.08 | | | | 09/09/2011 | | | | 249,000,000 | | | | 248,977,071 | |
FHLB^ | | | 0.09 | | | | 08/31/2011 | | | | 136,000,000 | | | | 135,990,027 | |
FHLB^ | | | 0.09 | | | | 09/06/2011 | | | | 150,000,000 | | | | 149,986,500 | |
FHLB± | | | 0.10 | | | | 08/12/2011 | | | | 150,000,000 | | | | 149,998,177 | |
FHLB± | | | 0.14 | | | | 02/28/2012 | | | | 250,000,000 | | | | 249,949,883 | |
FHLB^ | | | 0.15 | | | | 10/07/2011 | | | | 100,000,000 | | | | 99,972,083 | |
FHLB | | | 0.20 | | | | 08/03/2011 | | | | 50,000,000 | | | | 50,000,080 | |
FHLB | | | 0.21 | | | | 08/10/2011 | | | | 83,265,000 | | | | 83,264,588 | |
FHLB± | | | 0.22 | | | | 10/13/2011 | | | | 251,400,000 | | | | 251,418,303 | |
FHLB± | | | 0.22 | | | | 11/07/2011 | | | | 150,000,000 | | | | 149,983,667 | |
FHLB | | | 0.26 | | | | 11/29/2011 | | | | 100,000,000 | | | | 100,038,175 | |
| | | | | | |
| Portfolio of Investments—July 31, 2011 (Unaudited) | | Wells Fargo Advantage Government Money Market Fund | | | 9 | |
| | | | | | | | | | | | | | | | |
| Security Name | | Interest Rate | | | Maturity Date | | | Principal | | | Value | |
| | | | | | | | | | | | | | | | |
| | | | |
| Government Agency Debt (continued) | | | | | | | | | | | | | | | | |
FHLB | | | 0.79 | % | | | 11/25/2011 | | | $ | 150,000,000 | | | $ | 150,303,497 | |
FHLB | | | 3.75 | | | | 09/09/2011 | | | | 15,565,000 | | | | 15,624,745 | |
FHLB | | | 4.88 | | | | 10/05/2011 | | | | 50,000,000 | | | | 50,419,565 | |
FHLMC^ | | | 0.00 | | | | 08/01/2011 | | | | 250,000,000 | | | | 250,000,000 | |
FHLMC^ | | | 0.02 | | | | 09/14/2011 | | | | 250,000,000 | | | | 249,993,889 | |
FHLMC^ | | | 0.04 | | | | 09/20/2011 | | | | 100,000,000 | | | | 99,994,444 | |
FHLMC^ | | | 0.05 | | | | 09/16/2011 | | | | 125,000,000 | | | | 124,992,014 | |
FHLMC^ | | | 0.05 | | | | 10/06/2011 | | | | 250,000,000 | | | | 249,977,083 | |
FHLMC^ | | | 0.06 | | | | 11/10/2011 | | | | 250,000,000 | | | | 249,957,917 | |
FHLMC^ | | | 0.07 | | | | 08/15/2011 | | | | 222,144,000 | | | | 222,133,953 | |
FHLMC^ | | | 0.08 | | | | 08/29/2011 | | | | 262,770,000 | | | | 262,753,650 | |
FHLMC^ | | | 0.09 | | | | 08/12/2011 | | | | 100,000,000 | | | | 99,996,944 | |
FHLMC^ | | | 0.09 | | | | 09/12/2011 | | | | 256,050,000 | | | | 256,018,144 | |
FHLMC^ | | | 0.09 | | | | 09/27/2011 | | | | 31,100,000 | | | | 31,095,568 | |
FHLMC^ | | | 0.10 | | | | 09/01/2011 | | | | 87,000,000 | | | | 86,992,508 | |
FHLMC^ | | | 0.10 | | | | 09/06/2011 | | | | 50,000,000 | | | | 49,995,000 | |
FHLMC^ | | | 0.10 | | | | 09/21/2011 | | | | 125,000,000 | | | | 124,982,292 | |
FHLMC± | | | 0.11 | | | | 02/02/2012 | | | | 23,007,000 | | | | 22,997,602 | |
FHLMC^ | | | 0.11 | | | | 11/08/2011 | | | | 50,000,000 | | | | 49,984,875 | |
FHLMC^ | | | 0.11 | | | | 11/14/2011 | | | | 30,000,000 | | | | 29,990,375 | |
FHLMC^ | | | 0.12 | | | | 10/31/2011 | | | | 100,000,000 | | | | 99,969,667 | |
FHLMC^ | | | 0.14 | | | | 12/12/2011 | | | | 55,187,000 | | | | 55,158,456 | |
FHLMC^ | | | 0.15 | | | | 08/16/2011 | | | | 113,429,000 | | | | 113,421,438 | |
FHLMC^ | | | 0.15 | | | | 10/04/2011 | | | | 25,500,000 | | | | 25,493,200 | |
FHLMC± | | | 0.16 | | | | 09/26/2011 | | | | 50,000,000 | | | | 49,999,604 | |
FHLMC^ | | | 0.16 | | | | 08/09/2011 | | | | 96,031,000 | | | | 96,027,159 | |
FHLMC± | | | 0.17 | | | | 05/11/2012 | | | | 150,000,000 | | | | 149,941,667 | |
FHLMC^ | | | 0.17 | | | | 08/08/2011 | | | | 113,429,000 | | | | 113,424,809 | |
FHLMC^ | | | 0.17 | | | | 08/22/2011 | | | | 94,000,000 | | | | 93,990,130 | |
FHLMC^ | | | 0.17 | | | | 09/19/2011 | | | | 50,000,000 | | | | 49,988,090 | |
FHLMC^ | | | 0.18 | | | | 09/26/2011 | | | | 179,334,000 | | | | 179,283,786 | |
FHLMC | | | 3.63 | | | | 09/16/2011 | | | | 125,675,000 | | | | 126,227,340 | |
FHLMC | | | 5.50 | | | | 09/15/2011 | | | | 6,010,000 | | | | 6,049,179 | |
FNMA^ | | | 0.05 | | | | 10/11/2011 | | | | 225,000,000 | | | | 224,965,486 | |
FNMA^ | | | 0.06 | | | | 11/07/2011 | | | | 50,000,000 | | | | 49,991,833 | |
FNMA^ | | | 0.06 | | | | 11/08/2011 | | | | 200,000,000 | | | | 199,967,000 | |
FNMA^ | | | 0.06 | | | | 11/28/2011 | | | | 100,000,000 | | | | 99,980,167 | |
FNMA^ | | | 0.08 | | | | 08/08/2011 | | | | 125,000,000 | | | | 124,997,424 | |
FNMA^ | | | 0.08 | | | | 09/07/2011 | | | | 76,454,000 | | | | 76,446,619 | |
FNMA^ | | | 0.08 | | | | 10/12/2011 | | | | 240,780,000 | | | | 240,736,989 | |
FNMA^ | | | 0.09 | | | | 10/05/2011 | | | | 122,360,000 | | | | 122,332,245 | |
FNMA± | | | 0.10 | | | | 08/11/2011 | | | | 150,000,000 | | | | 149,997,931 | |
FNMA^ | | | 0.11 | | | | 08/22/2011 | | | | 150,000,000 | | | | 149,987,750 | |
FNMA^ | | | 0.11 | | | | 08/23/2011 | | | | 200,000,000 | | | | 199,985,333 | |
FNMA^ | | | 0.11 | | | | 09/22/2011 | | | | 50,000,000 | | | | 49,992,056 | |
FNMA^ | | | 0.11 | | | | 11/01/2011 | | | | 195,000,000 | | | | 194,945,183 | |
FNMA^ | | | 0.11 | | | | 11/02/2011 | | | | 50,000,000 | | | | 49,985,792 | |
FNMA^ | | | 0.11 | | | | 11/09/2011 | | | | 31,230,000 | | | | 31,220,458 | |
FNMA^ | | | 0.11 | | | | 11/14/2011 | | | | 35,000,000 | | | | 34,988,771 | |
FNMA^ | | | 0.11 | | | | 12/12/2011 | | | | 55,000,000 | | | | 54,977,649 | |
FNMA^ | | | 0.12 | | | | 08/03/2011 | | | | 200,000,000 | | | | 199,997,944 | |
| | | | |
| 10 | | Wells Fargo Advantage Government Money Market Fund | | Portfolio of Investments—July 31, 2011 (Unaudited) |
| | | | | | | | | | | | | | | | |
| Security Name | | Interest Rate | | | Maturity Date | | | Principal | | | Value | |
| | | | | | | | | | | | | | | | |
| | | | |
| Government Agency Debt (continued) | | | | | | | | | | | | | | | | |
FNMA^ | | | 0.12 | % | | | 09/26/2011 | | | $ | 54,800,000 | | | $ | 54,789,771 | |
FNMA^ | | | 0.13 | | | | 09/27/2011 | | | | 82,200,000 | | | | 82,183,081 | |
FNMA^ | | | 0.14 | | | | 08/25/2011 | | | | 225,000,000 | | | | 224,977,500 | |
FNMA^ | | | 0.14 | | | | 10/19/2011 | | | | 150,000,000 | | | | 149,952,271 | |
FNMA^ | | | 0.17 | | | | 08/17/2011 | | | | 21,582,000 | | | | 21,580,273 | |
FNMA^ | | | 0.17 | | | | 08/24/2011 | | | | 150,000,000 | | | | 149,982,750 | |
FNMA^ | | | 0.17 | | | | 09/21/2011 | | | | 88,000,000 | | | | 87,978,807 | |
FNMA^ | | | 0.17 | | | | 09/28/2011 | | | | 204,840,000 | | | | 204,780,943 | |
FNMA | | | 1.16 | | | | 09/08/2011 | | | | 10,000,000 | | | | 10,009,963 | |
FNMA | | | 3.63 | | | | 08/15/2011 | | | | 25,988,000 | | | | 26,022,620 | |
| | | | |
Total Government Agency Debt (Cost $10,979,109,078) | | | | | | | | | | | | | | | 10,979,109,078 | |
| | | | | | | | | | | | | | | | |
| | | | |
Other Notes: 4.92% | | | | | | | | | | | | | | | | |
| | | | |
| Corporate Bonds and Notes: 4.92% | | | | | | | | | | | | | | | | |
American Express Bank FSB± | | | 1.17 | | | | 12/09/2011 | | | | 50,000,000 | | | | 50,175,619 | |
Bank of America Corporation± | | | 0.55 | | | | 04/30/2012 | | | | 146,835,000 | | | | 147,215,593 | |
Bank of America Corporation± | | | 1.07 | | | | 12/02/2011 | | | | 84,268,000 | | | | 84,516,830 | |
Citibank NA± | | | 0.30 | | | | 05/07/2012 | | | | 39,970,000 | | | | 39,992,036 | |
Citibank NA | | | 1.25 | | | | 09/22/2011 | | | | 35,367,000 | | | | 35,423,753 | |
Citibank NA | | | 1.38 | | | | 08/10/2011 | | | | 139,046,000 | | | | 139,084,666 | |
Citigroup Funding Incorporated± | | | 0.55 | | | | 03/30/2012 | | | | 12,315,000 | | | | 12,343,213 | |
Citigroup Funding Incorporated± | | | 0.58 | | | | 04/30/2012 | | | | 21,485,000 | | | | 21,545,151 | |
General Electric Capital Corporation± | | | 0.22 | | | | 05/08/2012 | | | | 60,045,000 | | | | 60,057,255 | |
General Electric Capital Corporation± | | | 0.32 | | | | 04/24/2012 | | | | 5,000,000 | | | | 65,053,621 | |
General Electric Capital Corporation± | | | 0.42 | | | | 06/01/2012 | | | | 96,100,000 | | | | 96,296,659 | |
General Electric Capital Corporation± | | | 0.45 | | | | 03/12/2012 | | | | 50,000,000 | | | | 50,075,591 | |
General Electric Capital Corporation± | | | 1.18 | | | | 12/09/2011 | | | | 50,000,000 | | | | 50,174,937 | |
Goldman Sachs Group Incorporated± | | | 0.52 | | | | 11/09/2011 | | | | 146,705,000 | | | | 146,833,590 | |
HSBC USA Incorporated | | | 3.13 | | | | 12/16/2011 | | | | 156,980,000 | | | | 158,725,102 | |
JPMorgan Chase & Company± | | | 0.48 | | | | 06/15/2012 | | | | 125,000,000 | | | | 125,300,368 | |
JPMorgan Chase & Company | | | 3.13 | | | | 12/01/2011 | | | | 9,535,000 | | | | 9,628,648 | |
Morgan Stanley± | | | 0.55 | | | | 02/10/2012 | | | | 10,000,000 | | | | 10,017,187 | |
Morgan Stanley | | | 2.00 | | | | 09/22/2011 | | | | 30,925,000 | | | | 31,007,695 | |
| | | | |
Total Other Notes (Cost $1,333,467,514) | | | | | | | | | | | | | | | 1,333,467,514 | |
| | | | | | | | | | | | | | | | |
| | | | |
| Repurchase Agreements(z): 39.25% | | | | | | | | | | | | | | | | |
Bank of America NA, dated 07/29//2011, maturity value $1,000,012,500(1) | | | 0.15 | | | | 08/01/2011 | | | | 1,000,000,000 | | | | 1,000,000,000 | |
Barclays Capital Incorporated, dated 07/29/2011, maturity value $1,045,014,804(2) | | | 0.17 | | | | 08/01/2011 | | | | 1,045,000,000 | | | | 1,045,000,000 | |
BNP Paribas Securities, dated 07/29/2011, maturity value $1,750,029,167(3) | | | 0.20 | | | | 08/01/2011 | | | | 1,750,000,000 | | | | 1,750,000,000 | |
Citibank NA, dated 07/29/2011, maturity value $100,018,333(4) | | | 0.22 | | | | 08/01/2011 | | | | 1,000,000,000 | | | | 1,000,000,000 | |
Citigroup Global Markets, dated 07/29/2011, maturity value $500,009,167(5) | | | 0.22 | | | | 08/01/2011 | | | | 500,000,000 | | | | 500,000,000 | |
Deutsche Bank Securities, dated 07/29/2011, maturity value $1,254,420,907(6) | | | 0.20 | | | | 08/01/2011 | | | | 1,254,400,000 | | | | 1,254,400,000 | |
Goldman Sachs & Company, dated 07/29/2011, maturity value $650,010,833(7) | | | 0.20 | | | | 08/01/2011 | | | | 650,000,000 | | | | 650,000,000 | |
HSBC Securities, dated 07/29/2011, maturity value $538,406,730(8) | | | 0.15 | | | | 08/01/2011 | | | | 538,400,000 | | | | 538,400,000 | |
| | | | | | |
| Portfolio of Investments—July 31, 2011 (Unaudited) | | Wells Fargo Advantage Government Money Market Fund | | | 11 | |
| | | | | | | | | | | | | | | | |
| Security Name | | Interest Rate | | | Maturity Date | | | Principal | | | Value | |
| | | | | | | | | | | | | | | | |
| | | | |
| Repurchase Agreements (continued) | | | | | | | | | | | | | | | | |
JPMorgan Securities, dated 07/29/2011, maturity value $500,008,333(9) | | | 0.20 | % | | | 08/01/2011 | | | $ | 500,000,000 | | | $ | 500,000,000 | |
Merrill Lynch Pierce Fenner & Smith Incorporated, dated 07/29/2011, maturity value $100,001,417(10) | | | 0.17 | | | | 08/01/2011 | | | | 100,000,000 | | | | 100,000,000 | |
Morgan Stanley & Company, dated 07/29/2011, maturity value $100,001,667(11) | | | 0.20 | | | | 08/01/2011 | | | | 100,000,000 | | | | 100,000,000 | |
RBC Capital Markets, dated 07/29/2011, maturity value $150,002,500(12) | | | 0.20 | | | | 08/01/2011 | | | | 150,000,000 | | | | 150,000,000 | |
RBS Securities Incorporated, dated 07/29/2011, maturity value $1,000,016,667(13) | | | 0.20 | | | | 08/01/2011 | | | | 1,000,000,000 | | | | 1,000,000,000 | |
Societe Generale, dated 07/29/2011, maturity value $750,012,500(14) | | | 0.20 | | | | 08/01/2011 | | | | 750,000,000 | | | | 750,000,000 | |
UBS Securities LLC, dated 07/29/2011, maturity value $314,455,503(15) | | | 0.21 | | | | 08/01/2011 | | | | 314,450,000 | | | | 314,450,000 | |
| | | | |
Total Repurchase Agreements (Cost $10,652,250,000) | | | | | | | | | | | | | | | 10,652,250,000 | |
| | | | | | | | | | | | | | | | |
| | | | |
| | | Yield | | | | | | | | | | |
| | | | |
Treasury Debt: 0.92% | | | | | | | | | | | | | | | | |
US Treasury Bill | | | 0.05 | | | | 08/04/2011 | | | | 250,000,000 | | | | 249,998,750 | |
| | | | |
Total Treasury Debt (Cost $249,998,750) | | | | | | | | | | | | | | | 249,998,750 | |
| | | | | | | | | | | | | | | | |
| | | | | | | | |
| Total Investments in Securities | | | | | | | | |
| (Cost $24,260,454,602)* | | | 89.40 | % | | | 24,260,454,602 | |
Other Assets and Liabilities, Net | | | 10.60 | | | | 2,876,152,258 | |
| | | | | | | | |
| Total Net Assets | | | 100.00 | % | | $ | 27,136,606,860 | |
| | | | | | | | |
| | (1) | U.S. government securities, 2.72% to 6.50%, 4/1/2018 to 7/1/2039, market value including accrued interest is $1,030,000,000. |
| | (2) | U.S. government securities, 3.50% to 5.00%, 11/1/2025 to 7/1/2041, market value including accrued interest is $1,076,350,001. |
| | (3) | U.S. government securities, 0.00% to 6.50%, 8/1/2021 to 8/1/2041, market value including accrued interest is $1,802,500,000. |
| | (4) | U.S. government securities, 3.00% to 9.00%, 9/1/2011 to 11/1/2049, market value including accrued interest is $1,030,000,000. |
| | (5) | U.S. government securities, 2.375% to 6.50%, 12/1/2017 to 7/1/2041, market value including accrued interest is $515,000,000. |
| | (6) | U.S. government securities, 1.00% to 5.50%, 4/30/2012 to 8/1/2041, market value including accrued interest is $1,290,301,877. |
| | (7) | U.S. government securities, 2.96% to 6.00%, 8/1/2037 to 5/1/2041, market value including accrued interest is $669,500,001. |
| | (8) | U.S. government securities, 0.00% to 7.125%, 8/31/2011 to 2/15/2023, market value including accrued interest is $549,169,988. |
| | (9) | U.S. government securities, 4.00% to 7.00%, 2/1/2031 to 7/1/2041, market value including accrued interest is $515,004,373. |
| | (10) | U.S. government securities, 3.37% to 6.00%, 6/1/2036 to 5/1/2041, market value including accrued interest is $103,000,000. |
| | (11) | U.S. government securities, 4.50% to 6.00%, 9/1/2040 to 12/1/2048, market value including accrued interest is $103,000,000. |
| | (12) | U.S. government securities, 3.50% to 5.00%, 8/1/2026 to 6/20/2040, market value including accrued interest is $154,500,000. |
| | (13) | U.S. government securities, 3.00% to 6.50%, 9/1/2013 to 7/1/2041, market value including accrued interest is $1,030,003,962. |
| | (14) | U.S. government securities, 2.00% to 6.50%, 9/1/2013 to 2/1/2041, market value including accrued interest is $772,500,000. |
| | (15) | U.S. government securities, 3.50% to 5.50%, 9/1/2024 to 8/1/2041, market value including accrued interest is $323,883,501. |
| †† | Security that may be resold to “qualified institutional buyers” under Rule 144A or securities offered pursuant to Section 4(2) of the Securities Act of 1933, as amended. |
| ^ | Zero coupon security. Rate represents yield to maturity. |
| ± | Variable rate investments. |
| * | Cost for federal income tax purposes is substantially the same as for financial reporting purposes. |
The accompanying notes are an integral part of these financial statements.
| | | | |
| 12 | | Wells Fargo Advantage Government Money Market Fund | | Statement of Assets and Liabilities—July 31, 2011 (Unaudited) |
| | | | |
| | | | |
| |
Assets | | | | |
Investments | | | | |
Investments in unaffiliated securities, at amortized cost | | $ | 13,608,204,602 | |
Investments in repurchase agreements, at amortized cost | | | 10,652,250,000 | |
| | | | |
Total investments, at amortized cost | | | 24,260,454,602 | |
Cash | | | 2,871,904,038 | |
Receivable for Fund shares sold | | | 256,193 | |
Receivable for interest | | | 7,682,396 | |
Receivable from adviser | | | 2,607,622 | |
| | | | |
Total assets | | | 27,142,904,851 | |
| | | | |
| |
Liabilities | | | | |
Dividends payable | | | 138,098 | |
Payable for Fund shares redeemed | | | 289,445 | |
Distribution fees payable | | | 33,986 | |
Due to other related parties | | | 3,140,038 | |
Custodian and accounting fees payable | | | 602,669 | |
Shareholder report expenses payable | | | 338,717 | |
Shareholder servicing fees payable | | | 1,504,105 | |
Accrued expenses and other liabilities | | | 250,933 | |
| | | | |
Total liabilities | | | 6,297,991 | |
| | | | |
Total net assets | | $ | 27,136,606,860 | |
| | | | |
| |
NET ASSETS CONSIST OF | | | | |
Paid-in capital | | $ | 27,136,460,457 | |
Overdistributed net investment income | | | (27,043 | ) |
Accumulated net realized gains on investments | | | 173,446 | |
| | | | |
Total net assets | | $ | 27,136,606,860 | |
| | | | |
| |
COMPUTATION OF NET ASSET VALUE PER SHARE1 | | | | |
Net assets – Class A | | $ | 946,442,970 | |
Shares outstanding – Class A | | | 946,444,661 | |
Net asset value per share – Class A | | | $1.00 | |
Net assets – Administrator Class | | $ | 525,860,000 | |
Shares outstanding – Administrator Class | | | 525,858,356 | |
Net asset value per share – Administrator Class | | | $1.00 | |
Net assets – Institutional Class | | $ | 19,558,156,663 | |
Shares outstanding – Institutional Class | | | 19,558,143,267 | |
Net asset value per share – Institutional Class | | | $1.00 | |
Net assets – Service Class | | $ | 5,984,936,881 | |
Shares outstanding – Service Class | | | 5,984,868,103 | |
Net asset value per share – Service Class | | | $1.00 | |
Net assets – Sweep Class | | $ | 121,210,346 | |
Shares outstanding – Sweep Class | | | 121,209,288 | |
Net asset value per share – Sweep Class | | | $1.00 | |
| 1. | The Fund has an unlimited number of authorized shares. |
The accompanying notes are an integral part of these financial statements.
| | | | | | |
| Statement of Operations—Six Months Ended July 31, 2011 (Unaudited) | | Wells Fargo Advantage Government Money Market Fund | | | 13 | |
| | | | |
| | | | |
| |
Investment income | | | | |
Interest | | $ | 20,154,346 | |
| | | | |
| |
Expenses | | | | |
Advisory fee | | | 13,612,815 | |
Administration fees | | | | |
Fund level | | | 4,827,680 | |
Class A | | | 1,073,340 | |
Administrator Class | | | 257,930 | |
Institutional Class | | | 7,786,369 | |
Service Class | | | 3,687,747 | |
Sweep Class | | | 134,021 | |
Shareholder servicing fees | | | | |
Class A | | | 1,110,785 | |
Administrator Class | | | 257,698 | |
Service Class | | | 7,665,069 | |
Sweep Class | | | 152,296 | |
Distribution fees | | | | |
Sweep Class | | | 213,214 | |
Custody and accounting fees | | | 646,099 | |
Professional fees | | | 19,749 | |
Registration fees | | | 28,795 | |
Shareholder report expenses | | | 72,845 | |
Trustees’ fees and expenses | | | 6,252 | |
Other fees and expenses | | | 295,103 | |
| | | | |
Total expenses | | | 41,847,807 | |
Less: Fee waivers and/or expense reimbursements | | | (23,065,417 | ) |
| | | | |
Net expenses | | | 18,782,390 | |
| | | | |
Net investment income | | | 1,371,956 | |
Net realized gains on investments | | | 504,695 | |
| | | | |
Net increase in net assets resulting from operations | | $ | 1,876,651 | |
| | | | |
The accompanying notes are an integral part of these financial statements.
| | | | |
| 14 | | Wells Fargo Advantage Government Money Market Fund | | Statements of Changes in Net Assets |
| | | | | | | | | | | | | | | | | | | | | | | | |
| | | Six Months Ended July 31, 2011 (Unaudited) | | | Year Ended January 31, 20111 | | | Year Ended February 28, 2010 | |
| | | | | | |
Operations | | | | | | | | | | | | | | | | | | | | | | | | |
Net investment income | | | | | | $ | 1,371,956 | | | | | | | $ | 6,880,736 | | | | | | | $ | 27,921,421 | |
Net realized gains (losses) on investments | | | | | | | 504,695 | | | | | | | | (173,048 | ) | | | | | | | 43,897 | |
| | | | | | | | | | | | | | | | | | | | | | | | |
Net increase in net assets resulting from operations | | | | | | | 1,876,651 | | | | | | | | 6,707,688 | | | | | | | | 27,965,318 | |
| | | | | | | | | | | | | | | | | | | | | | | | |
| | | | | | |
Distributions to shareholders from | | | | | | | | | | | | | | | | | | | | | | | | |
Net investment income | | | | | | | | | | | | | | | | | | | | | | | | |
Class A | | | | | | | (48,790 | ) | | | | | | | (90,131 | ) | | | | | | | (91,755 | ) |
Administrator Class | | | | | | | (25,793 | ) | | | | | | | (57,540 | ) | | | | | | | (315,227 | ) |
Institutional Class | | | | | | | (983,968 | ) | | | | | | | (6,281,889 | ) | | | | | | | (26,978,458 | ) |
Service Class | | | | | | | (307,313 | ) | | | | | | | (441,454 | ) | | | | | | | (535,979 | ) |
Sweep Class | | | | | | | (6,092 | ) | | | | | | | (9,722 | )2 | | | | | | | NA | |
Net realized gains | | | | | | | | | | | | | | | | | | | | | | | | |
Class A | | | | | | | 0 | | | | | | | | (362 | ) | | | | | | | (1,173 | ) |
Administrator Class | | | | | | | 0 | | | | | | | | (185 | ) | | | | | | | (1,273 | ) |
Institutional Class | | | | | | | 0 | | | | | | | | (7,100 | ) | | | | | | | (25,269 | ) |
Service Class | | | | | | | 0 | | | | | | | | (1,640 | ) | | | | | | | (6,849 | ) |
Sweep Class | | | | | | | 0 | | | | | | | | (52 | )2 | | | | | | | NA | |
| | | | | | | | | | | | | | | | | | | | | | | | |
Total distributions to shareholders | | | | | | | (1,371,956 | ) | | | | | | | (6,890,075 | ) | | | | | | | (27,955,983 | ) |
| | | | | | | | | | | | | | | | | | | | | | | | |
| | | Shares | | | | | | Shares | | | | | | Shares | | | | |
| | | | | | |
Capital share transactions | | | | | | | | | | | | | | | | | | | | | | | | |
Proceeds from shares sold | | | | | | | | | | | | | | | | | | | | | | | | |
Class A | | | 1,038,005,199 | | | | 1,038,005,199 | | | | 1,799,814,679 | | | | 1,799,814,679 | | | | 372,562,738 | | | | 372,562,738 | |
Administrator Class | | | 2,652,748,122 | | | | 2,652,748,122 | | | | 7,166,336,947 | | | | 7,166,336,947 | | | | 6,962,786,773 | | | | 6,962,786,773 | |
Institutional Class | | | 71,937,749,329 | | | | 71,937,749,329 | | | | 149,069,477,734 | | | | 149,069,477,734 | | | | 151,931,715,902 | | | | 151,931,715,902 | |
Service Class | | | 19,153,416,589 | | | | 19,153,416,589 | | | | 35,059,498,304 | | | | 35,059,498,304 | | | | 31,167,330,727 | | | | 31,167,330,727 | |
Sweep Class | | | 334,716,411 | | | | 334,716,411 | | | | 347,512,112 | 2 | | | 347,512,112 | 2 | | | NA | | | | NA | |
| | | | | | | | | | | | | | | | | | | | | | | | |
| | | | | | | 95,116,635,650 | | | | | | | | 193,442,639,776 | | | | | | | | 190,434,396,140 | |
| | | | | | | | | | | | | | | | | | | | | | | | |
Reinvestment of distributions | | | | | | | | | | | | | | | | | | | | | | | | |
Class A | | | 47,569 | | | | 47,569 | | | | 88,954 | | | | 88,954 | | | | 91,388 | | | | 91,388 | |
Administrator Class | | | 10,992 | | | | 10,992 | | | | 26,226 | | | | 26,226 | | | | 168,503 | | | | 168,503 | |
Institutional Class | | | 436,422 | | | | 436,422 | | | | 2,809,820 | | | | 2,809,820 | | | | 13,377,226 | | | | 13,377,226 | |
Service Class | | | 18,839 | | | | 18,839 | | | | 36,315 | | | | 36,315 | | | | 65,367 | | | | 65,367 | |
Sweep Class | | | 6,092 | | | | 6,092 | | | | 9,774 | 2 | | | 9,774 | 2 | | | NA | | | | NA | |
| | | | | | | | | | | | | | | | | | | | | | | | |
| | | | | | | 519,914 | | | | | | | | 2,971,089 | | | | | | | | 13,702,484 | |
| | | | | | | | | | | | | | | | | | | | | | | | |
Payment for shares redeemed | | | | | | | | | | | | | | | | | | | | | | | | |
Class A | | | (1,170,499,558 | ) | | | (1,170,499,558 | ) | | | (2,006,438,358 | ) | | | (2,006,438,358 | ) | | | (697,095,949 | ) | | | (697,095,949 | ) |
Administrator Class | | | (2,674,186,191 | ) | | | (2,674,186,191 | ) | | | (7,407,543,227 | ) | | | (7,407,543,227 | ) | | | (7,954,771,554 | ) | | | (7,954,771,554 | ) |
Institutional Class | | | (72,140,705,949 | ) | | | (72,140,705,949 | ) | | | (151,297,225,953 | ) | | | (151,297,225,953 | ) | | | (173,677,551,165 | ) | | | (173,677,551,165 | ) |
Service Class | | | (18,989,290,978 | ) | | | (18,989,290,978 | ) | | | (33,933,581,717 | ) | | | (33,933,581,717 | ) | | | (32,914,867,678 | ) | | | (32,914,867,678 | ) |
Sweep Class | | | (341,305,607 | ) | | | (341,305,607 | ) | | | (389,336,456 | )2 | | | (389,336,456 | )2 | | | NA | | | | NA | |
| | | | | | | | | | | | | | | | | | | | | | | | |
| | | | | | | (95,315,988,283 | ) | | | | | | | (195,034,125,711 | ) | | | | | | | (215,244,286,346 | ) |
| | | | | | | | | | | | | | | | | | | | | | | | |
Net asset value of shares issued in acquisitions | | | | | | | | | | | | | | | | | | | | | | | | |
Class A | | | 0 | | | | 0 | | | | 507,981,859 | | | | 507,924,424 | | | | 0 | | | | 0 | |
Institutional Class | | | 0 | | | | 0 | | | | 1,324,050,351 | | | | 1,323,902,436 | | | | 0 | | | | 0 | |
Service Class | | | 0 | | | | 0 | | | | 99,516,216 | | | | 99,469,544 | | | | 0 | | | | 0 | |
Sweep Class | | | 0 | | | | 0 | | | | 169,606,962 | | | | 169,618,707 | | | | NA | | | | NA | |
| | | | | | | | | | | | | | | | | | | | | | | | |
| | | | | | | 0 | | | | | | | | 2,100,915,111 | | | | | | | | 0 | |
| | | | | | | | | | | | | | | | | | | | | | | | |
Net increase (decrease) in net assets resulting from capital share transactions | | | | | | | (198,832,719 | ) | | | | | | | 512,400,265 | | | | | | | | (24,796,187,722 | ) |
| | | | | | | | | | | | | | | | | | | | | | | | |
Total increase (decrease) in net assets | | | | | | | (198,328,024 | ) | | | | | | | 512,217,878 | | | | | | | | (24,796,178,387 | ) |
| | | | | | | | | | | | | | | | | | | | | | | | |
| | | | | | |
Net assets | | | | | | | | | | | | | | | | | | | | | | | | |
Beginning of period | | | | | | | 27,334,934,884 | | | | | | | | 26,822,717,006 | | | | | | | | 51,618,895,393 | |
| | | | | | | | | | | | | | | | | | | | | | | | |
End of period | | | | | | $ | 27,136,606,860 | | | | | | | $ | 27,334,934,884 | | | | | | | $ | 26,822,717,006 | |
| | | | | | | | | | | | | | | | | | | | | | | | |
Undistributed (overdistributed) net investment income | | | | | | $ | (27,043 | ) | | | | | | $ | (27,043 | ) | | | | | | $ | 31,023 | |
| | | | | | | | | | | | | | | | | | | | | | | | |
| 1. | For the eleven months ended January 31, 2011. The Fund changed its fiscal year end from February 28 to January 31, effective January 31, 2011. |
| 2. | Class commenced operations on June 30, 2010. |
The accompanying notes are an integral part of these financial statements.
| | | | | | |
| Financial Highlights | | Wells Fargo Advantage Government Money Market Fund | | | 15 | |
| | | | | | | | | | | | | | | | | | | | | | | | | | | | |
(For a share outstanding throughout each period) | | | | |
| | | |
| | | Six Months Ended
July 31, 2011
(Unaudited) | | | Year Ended
January 31,
20111 | | | Year Ended February 28, | |
| Class A | | | | 2010 | | | 2009 | | | 2008 | | | 2007 | | | 20062 | |
Net asset value, beginning of period | | $ | 1.00 | | | $ | 1.00 | | | $ | 1.00 | | | $ | 1.00 | | | $ | 1.00 | | | $ | 1.00 | | | $ | 1.00 | |
Net investment income (loss) | | | 0.00 | 3 | | | 0.00 | 3 | | | 0.00 | 3 | | | 0.01 | | | | 0.04 | | | | 0.05 | | | | 0.03 | |
Net realized gains (losses) on investments | | | 0.00 | 3 | | | (0.00 | )3 | | | 0.00 | 3 | | | 0.00 | | | | 0.00 | | | | 0.00 | | | | 0.00 | |
| | | | | | | | | | | | | | | | | | | | | | | | | | | | |
Total from investment operations | | | 0.00 | 3 | | | 0.00 | 3 | | | 0.00 | 3 | | | 0.01 | | | | 0.04 | | | | 0.05 | | | | 0.03 | |
Distributions to shareholders from | | | | | | | | | | | | | | | | | | | | | | | | | | | | |
Net investment income | | | (0.00 | )3 | | | (0.00 | )3 | | | (0.00 | )3 | | | (0.01 | ) | | | (0.04 | ) | | | (0.05 | ) | | | (0.03 | ) |
Net realized gains | | | 0.00 | | | | (0.00 | )3 | | | (0.00 | )3 | | | 0.00 | | | | 0.00 | | | | 0.00 | | | | 0.00 | |
| | | | | | | | | | | | | | | | | | | | | | | | | | | | |
Total distributions to shareholders | | | (0.00 | )3 | | | (0.00 | )3 | | | (0.00 | )3 | | | (0.01 | ) | | | (0.04 | ) | | | (0.05 | ) | | | (0.03 | ) |
Net asset value, end of period | | $ | 1.00 | | | $ | 1.00 | | | $ | 1.00 | | | $ | 1.00 | | | $ | 1.00 | | | $ | 1.00 | | | $ | 1.00 | |
Total return4 | | | 0.00 | % | | | 0.01 | % | | | 0.01 | % | | | 1.22 | % | | | 4.38 | % | | | 4.61 | % | | | 2.78 | % |
Ratios to average net assets (annualized) | | | | | | | | | | | | | | | | | | | | | | | | | | | | |
Gross expenses | | | 0.59 | % | | | 0.58 | % | | | 0.65 | % | | | 0.64 | % | | | 0.64 | % | | | 0.64 | % | | | 0.65 | % |
Net expenses | | | 0.14 | % | | | 0.22 | % | | | 0.28 | % | | | 0.64 | % | | | 0.64 | % | | | 0.64 | % | | | 0.65 | % |
Net investment income | | | 0.01 | % | | | 0.01 | % | | | 0.01 | % | | | 1.29 | % | | | 4.39 | % | | | 4.57 | % | | | 3.13 | % |
Supplemental data | | | | | | | | | | | | | | | | | | | | | | | | | | | | |
Net assets, end of period (000’s omitted) | | | $946,443 | | | | $1,078,873 | | | | $777,462 | | | | $1,101,904 | | | | $1,921,647 | | | | $2,866,700 | | | | $1,224,209 | |
| 1. | For the eleven months ended January 31, 2011. The Fund changed its fiscal year end from February 28 to January 31, effective January 31, 2011. |
| 2. | For the eleven months ended February 28, 2006. The Fund changed its fiscal year end from March 31 to February 28, effective February 28, 2006. |
| 3. | Amount represents less than $0.005. |
| 4. | Returns for periods of less than one year are not annualized. |
The accompanying notes are an integral part of these financial statements.
| | | | |
| 16 | | Wells Fargo Advantage Government Money Market Fund | | Financial Highlights |
| | | | | | | | | | | | | | | | | | | | | | | | | | | | |
(For a share outstanding throughout each period) | | | | |
| | | |
| | | Six Months Ended
July 31, 2011
(Unaudited) | | | Year Ended
January 31,
20111 | | | Year Ended February 28, | |
| Administrator Class | | | | 2010 | | | 2009 | | | 2008 | | | 2007 | | | 20062 | |
Net asset value, beginning of period | | $ | 1.00 | | | $ | 1.00 | | | $ | 1.00 | | | $ | 1.00 | | | $ | 1.00 | | | $ | 1.00 | | | $ | 1.00 | |
Net investment income | | | 0.00 | 3 | | | 0.00 | 3 | | | 0.00 | 3 | | | 0.01 | | | | 0.04 | | | | 0.05 | | | | 0.03 | |
Net realized gains (losses) on investments | | | 0.00 | 3 | | | (0.00 | )3 | | | 0.00 | 3 | | | 0.00 | | | | 0.00 | | | | 0.00 | | | | 0.00 | |
| | | | | | | | | | | | | | | | | | | | | | | | | | | | |
Total from investment operations | | | 0.00 | 3 | | | 0.00 | 3 | | | 0.00 | 3 | | | 0.01 | | | | 0.04 | | | | 0.05 | | | | 0.03 | |
Distributions to shareholders from | | | | | | | | | | | | | | | | | | | | | | | | | | | | |
Net investment income | | | (0.00 | )3 | | | (0.00 | )3 | | | (0.00 | )3 | | | (0.01 | ) | | | (0.04 | ) | | | (0.05 | ) | | | (0.03 | ) |
Net realized gains | | | 0.00 | | | | (0.00 | )3 | | | (0.00 | )3 | | | 0.00 | | | | 0.00 | | | | 0.00 | | | | 0.00 | |
| | | | | | | | | | | | | | | | | | | | | | | | | | | | |
Total distributions to shareholders | | | (0.00 | )3 | | | (0.00 | )3 | | | (0.00 | )3 | | | (0.01 | ) | | | (0.04 | ) | | | (0.05 | ) | | | (0.03 | ) |
Net asset value, end of period | | $ | 1.00 | | | $ | 1.00 | | | $ | 1.00 | | | $ | 1.00 | | | $ | 1.00 | | | $ | 1.00 | | | $ | 1.00 | |
Total return4 | | | 0.00 | % | | | 0.01 | % | | | 0.02 | % | | | 1.50 | % | | | 4.68 | % | | | 4.92 | % | | | 3.05 | % |
Ratios to average net assets (annualized) | | | | | | | | | | | | | | | | | | | | | | | | | | | | |
Gross expenses | | | 0.34 | % | | | 0.35 | % | | | 0.39 | % | | | 0.37 | % | | | 0.37 | % | | | 0.37 | % | | | 0.38 | % |
Net expenses | | | 0.14 | % | | | 0.21 | % | | | 0.28 | % | | | 0.36 | % | | | 0.35 | % | | | 0.35 | % | | | 0.35 | % |
Net investment income | | | 0.01 | % | | | 0.01 | % | | | 0.03 | % | | | 1.42 | % | | | 4.55 | % | | | 4.82 | % | | | 3.33 | % |
Supplemental data | | | | | | | | | | | | | | | | | | | | | | | | | | | | |
Net assets, end of period (000’s omitted) | | | $525,860 | | | | $547,278 | | | | $788,478 | | | | $1,780,294 | | | | $1,944,435 | | | | $1,179,768 | | | | $876,234 | |
| 1. | For the eleven months ended January 31, 2011. The Fund changed its fiscal year end from February 28 to January 31, effective January 31, 2011. |
| 2. | For the eleven months ended February 28, 2006. The Fund changed its fiscal year end from March 31 to February 28, effective February 28, 2006. |
| 3. | Amount represents less than $0.005. |
| 4. | Returns for periods less than one year are not annualized. |
The accompanying notes are an integral part of these financial statements.
| | | | | | |
| Financial Highlights | | Wells Fargo Advantage Government Money Market Fund | | | 17 | |
| | | | | | | | | | | | | | | | | | | | | | | | | | | | |
(For a share outstanding throughout each period) | | | | |
| | | |
| | | Six Months Ended
July 31, 2011
(Unaudited) | | | Year Ended
January 31,
20111 | | | Year Ended February 28, | |
| Institutional Class | | | | 2010 | | | 2009 | | | 2008 | | | 2007 | | | 20062 | |
Net asset value, beginning of period | | $ | 1.00 | | | $ | 1.00 | | | $ | 1.00 | | | $ | 1.00 | | | $ | 1.00 | | | $ | 1.00 | | | $ | 1.00 | |
Net investment income | | | 0.00 | 3 | | | 0.00 | 3 | | | 0.00 | 3 | | | 0.01 | | | | 0.04 | | | | 0.05 | | | | 0.03 | |
Net realized gains (losses) on investments | | | 0.00 | 3 | | | (0.00 | )3 | | | 0.00 | 3 | | | 0.00 | | | | 0.00 | | | | 0.00 | | | | 0.00 | |
| | | | | | | | | | | | | | | | | | | | | | | | | | | | |
Total from investment operations | | | 0.00 | 3 | | | 0.00 | 3 | | | 0.00 | 3 | | | 0.01 | | | | 0.04 | | | | 0.05 | | | | 0.03 | |
Distributions to shareholders | | | | | | | | | | | | | | | | | | | | | | | | | | | | |
Net investment income | | | (0.00 | )3 | | | (0.00 | )3 | | | (0.00 | )3 | | | (0.01 | ) | | | (0.04 | ) | | | (0.05 | ) | | | (0.03 | ) |
Net realized gains | | | 0.00 | | | | (0.00 | )3 | | | (0.00 | )3 | | | 0.00 | | | | 0.00 | | | | 0.00 | | | | 0.00 | |
| | | | | | | | | | | | | | | | | | | | | | | | | | | | |
Total distributions to shareholders | | | (0.00 | )3 | | | (0.00 | )3 | | | (0.00 | )3 | | | (0.01 | ) | | | (0.04 | ) | | | (0.05 | ) | | | (0.03 | ) |
Net asset value, end of period | | $ | 1.00 | | | $ | 1.00 | | | $ | 1.00 | | | $ | 1.00 | | | $ | 1.00 | | | $ | 1.00 | | | $ | 1.00 | |
Total return4 | | | 0.01 | % | | | 0.03 | % | | | 0.08 | % | | | 1.65 | % | | | 4.83 | % | | | 5.07 | % | | | 3.19 | % |
Ratios to average net assets (annualized) | | | | | | | | | | | | | | | | | | | | | | | | | | | | |
Gross expenses | | | 0.22 | % | | | 0.23 | % | | | 0.27 | % | | | 0.26 | % | | | 0.25 | % | | | 0.25 | % | | | 0.26 | % |
Net expenses | | | 0.14 | % | | | 0.20 | % | | | 0.21 | % | | | 0.22 | % | | | 0.20 | % | | | 0.20 | % | | | 0.20 | % |
Net investment income | | | 0.01 | % | | | 0.03 | % | | | 0.10 | % | | | 1.42 | % | | | 4.54 | % | | | 5.00 | % | | | 3.45 | % |
Supplemental data | | | | | | | | | | | | | | | | | | | | | | | | | | | | |
Net assets, end of period (000’s omitted) | | | $19,558,157 | | | | $19,760,296 | | | | $20,661,470 | | | | $42,393,921 | | | | $23,265,323 | | | | $7,766,684 | | | | $4,508,755 | |
| 1. | For the eleven months ended January 31, 2011. The Fund changed its fiscal year end from February 28 to January 31, effective January 31, 2011. |
| 2. | For the eleven months ended February 28, 2006. The Fund changed its fiscal year end from March 31 to February 28, effective February 28, 2006. |
| 3. | Amount represents less than $0.005. |
| 4. | Returns for periods of less than one year are not annualized. |
The accompanying notes are an integral part of these financial statements.
| | | | |
| 18 | | Wells Fargo Advantage Government Money Market Fund | | Financial Highlights |
| | | | | | | | | | | | | | | | | | | | | | | | | | | | |
(For a share outstanding throughout each period) | | | | |
| | | |
| | | Six Months Ended
July 31, 2011
(Unaudited) | | | Year Ended
January 31,
20111 | | | Year Ended February 28, | |
| Service Class | | | | 2010 | | | 2009 | | | 2008 | | | 2007 | | | 20062 | |
Net asset value, beginning of period | | $ | 1.00 | | | $ | 1.00 | | | $ | 1.00 | | | $ | 1.00 | | | $ | 1.00 | | | $ | 1.00 | | | $ | 1.00 | |
Net investment income | | | 0.00 | 3 | | | 0.00 | 3 | | | 0.00 | 3 | | | 0.01 | | | | 0.04 | | | | 0.05 | | | | 0.03 | |
Net realized gains (losses) on investments | | | 0.00 | 3 | | | (0.00 | )3 | | | 0.00 | 3 | | | 0.00 | | | | 0.00 | | | | 0.00 | | | | 0.00 | |
| | | | | | | | | | | | | | | | | | | | | | | | | | | | |
Total from investment operations | | | 0.00 | 3 | | | 0.00 | 3 | | | 0.00 | 3 | | | 0.01 | | | | 0.04 | | | | 0.05 | | | | 0.03 | |
Distributions to shareholders from | | | | | | | | | | | | | | | | | | | | | | | | | | | | |
Net investment income | | | (0.00 | )3 | | | (0.00 | )3 | | | (0.00 | )3 | | | (0.01 | ) | | | (0.04 | ) | | | (0.05 | ) | | | (0.03 | ) |
Net realized gains | | | 0.00 | | | | (0.00 | )3 | | | (0.00 | )3 | | | 0.00 | | | | 0.00 | | | | 0.00 | | | | 0.00 | |
| | | | | | | | | | | | | | | | | | | | | | | | | | | | |
Total distributions to shareholders | | | (0.00 | )3 | | | (0.00 | )3 | | | (0.00 | )3 | | | (0.01 | ) | | | (0.04 | ) | | | (0.05 | ) | | | (0.03 | ) |
Net asset value, end of period | | $ | 1.00 | | | $ | 1.00 | | | $ | 1.00 | | | $ | 1.00 | | | $ | 1.00 | | | $ | 1.00 | | | $ | 1.00 | |
Total return4 | | | 0.00 | % | | | 0.01 | % | | | 0.01 | % | | | 1.35 | % | | | 4.52 | % | | | 4.76 | % | | | 2.91 | % |
Ratios to average net assets (annualized) | | | | | | | | | | | | | | | | | | | | | | | | | | | | |
Gross expenses | | | 0.51 | % | | | 0.52 | % | | | 0.56 | % | | | 0.54 | % | | | 0.54 | % | | | 0.54 | % | | | 0.55 | % |
Net expenses | | | 0.14 | % | | | 0.22 | % | | | 0.28 | % | | | 0.51 | % | | | 0.50 | % | | | 0.50 | % | | | 0.50 | % |
Net investment income | | | 0.01 | % | | | 0.01 | % | | | 0.01 | % | | | 1.31 | % | | | 4.42 | % | | | 4.66 | % | | | 3.13 | % |
Supplemental data | | | | | | | | | | | | | | | | | | | | | | | | | | | | |
Net assets, end of period (000’s omitted) | | | $5,984,937 | | | | $5,820,697 | | | | $4,595,307 | | | | $6,342,777 | | | | $6,350,025 | | | | $5,656,867 | | | | $5,350,480 | |
| 1. | For the eleven months ended January 31, 2011. The Fund changed its fiscal year end from February 28 to January 31, effective January 31, 2011. |
| 2. | For the eleven months ended February 28, 2006. The Fund changed its fiscal year end from March 31 to February 28, effective February 28, 2006. |
| 3. | Amount represents less than $0.005. |
| 4. | Returns for periods of less than one year are not annualized. |
The accompanying notes are an integral part of these financial statements.
| | | | | | |
| Financial Highlights | | Wells Fargo Advantage Government Money Market Fund | | | 19 | |
| | | | | | | | |
(For a share outstanding throughout each period) | | | | |
| | |
Sweep Class | | Six Months Ended
July 31, 2011
(Unaudited) | | | Year Ended
January 31,
20111 | |
Net asset value, beginning of period | | $ | 1.00 | | | $ | 1.00 | |
Net investment income | | | 0.00 | 2 | | | 0.00 | 2 |
Net realized gains (losses) on investments | | | 0.00 | 2 | | | (0.00 | )2 |
| | | | | | | | |
Total from investment operations | | | 0.00 | 2 | | | 0.00 | 2 |
Distributions to shareholders from | | | | | | | | |
Net investment income | | | (0.00 | )2 | | | (0.00 | )2 |
Net realized gains | | | 0.00 | | | | (0.00 | )2 |
| | | | | | | | |
Total distributions to shareholders | | | (0.00 | )2 | | | (0.00 | )2 |
Net asset value, end of period | | $ | 1.00 | | | $ | 1.00 | |
Total return3 | | | 0.00 | % | | | 0.01 | % |
Ratios to average net assets (annualized) | | | | | | | | |
Gross expenses | | | 0.96 | % | | | 0.94 | % |
Net expenses | | | 0.14 | % | | | 0.22 | % |
Net investment income | | | 0.01 | % | | | 0.01 | % |
Supplemental data | | | | | | | | |
Net assets, end of period (000’s omitted) | | | $121,210 | | | | $127,791 | |
| 1. | For the period from June 30, 2010 (commencement of class operation) to January 31, 2011. |
| 2. | Amount represents less than $0.005. |
| 3. | Returns for periods less than one year are not annualized. |
The accompanying notes are an integral part of these financial statements.
| | | | |
| 20 | | Wells Fargo Advantage Government Money Market Fund | | Notes to Financial Statements (Unaudited) |
1. ORGANIZATION
Wells Fargo Funds Trust (the “Trust”), a Delaware statutory trust organized on March 10, 1999, is an open-end management investment company registered under the Investment Company Act of 1940, as amended (the “1940 Act”). These financial statements report on Wells Fargo Advantage Government Money Market Fund (the “Fund”) which is a diversified series of the Trust.
2. SIGNIFICANT ACCOUNTING POLICIES
The following significant accounting policies, which are consistently followed in the preparation of the financial statements of the Fund, are in conformity with U.S. generally accepted accounting principles which require management to make estimates and assumptions that affect the reported amounts of assets and liabilities, disclosure of contingent assets and liabilities at the date of the financial statements, and the reported amounts of revenues and expenses during the reporting period. Actual results could differ from those estimates.
Securities valuation
As permitted under Rule 2a-7 of the 1940 Act, securities are valued at amortized cost, which approximates fair value.
The valuation techniques used by the Fund to measure fair value are consistent with the market approach, income approach and/or cost approach, where applicable, for each security type.
Repurchase agreements
The Fund may invest in repurchase agreements and may participate in pooled repurchase agreement transactions with other funds advised by Wells Fargo Funds Management, LLC. The repurchase agreements must be fully collateralized based on values that are marked-to-market daily. The collateral may be held by an agent bank under a tri-party agreement. It is the custodian’s responsibility to value collateral daily and to take action to obtain additional collateral as necessary to maintain market value equal to or greater than the resale price. The repurchase agreements are collateralized by instruments such as U.S. Treasury, federal agency, or high-grade corporate obligations. There could be potential loss to the Fund in the event that the Fund is delayed or prevented from exercising its rights to dispose of the collateral, including the risk of a possible decline in the value of the underlying obligations during the period in which the Fund seeks to assert its rights.
Security transactions and income recognition
Securities transactions are recorded on a trade date basis. Realized gains or losses are reported on the basis of identified cost of securities delivered.
Interest income is accrued daily and bond discounts are accreted and premiums are amortized daily based on the effective interest method. To the extent debt obligations are placed on non-accrual status, any related interest income may be reduced by writing off interest receivables when the collection of all or a portion of interest has become doubtful based on consistently applied procedures. If the issuer subsequently resumes interest payments or when the collectability of interest is reasonably assured, the debt obligation is removed from non-accrual status.
Distributions to shareholders
Distributions to shareholders from net investment income are accrued daily and paid monthly. Distributions from net realized gains, if any, are recorded on the ex-dividend date. Such distributions are determined in conformity with income tax regulations, which may differ from generally accepted accounting principles.
Federal and other taxes
The Fund intends to continue to qualify as a regulated investment company by distributing substantially all of its investment company taxable and any net realized capital gains (after reduction for capital loss carryforwards) sufficient to relieve it from all, or substantially all, federal income taxes. Accordingly, no provision for federal income taxes was required.
The Fund’s income and federal excise tax returns and all financial records supporting those returns for the prior three fiscal years are subject to examination by the federal and Delaware revenue authorities.
As of January 31, 2011, the Fund had estimated net capital loss carryforwards, which were available to offset future net realized capital gains, in the amount of $329,732 with $10,880 expiring in 2016, $134,086 expiring in 2017 and $184,766 expiring in 2019.
| | | | | | |
| Notes to Financial Statements (Unaudited) | | Wells Fargo Advantage Government Money Market Fund | | | 21 | |
As of January 31, 2011, the Fund had $1,511 of current year deferred post-October capital losses, which would be treated as realized for tax purposes on the first day of the succeeding year.
Under the recently enacted Regulated Investment Company Modernization Act of 2010, the Fund will be permitted to carry forward capital losses incurred in taxable years beginning after December 22, 2010 for an unlimited period. However, any losses incurred during those future taxable years will be required to be utilized prior to the losses incurred in pre-enactment taxable years. As a result of this ordering rule, pre-enactment capital loss carryforwards may be more likely to expire unused. Additionally, post-enactment capital losses that are carried forward will retain their character as either short-term or long-term capital losses rather than being considered all short-term as under previous law.
Class allocations
The separate classes of shares offered by the Fund differ principally in distribution, shareholder servicing and administration fees. Shareholders of each class bear certain expenses that pertain to that particular class. All shareholders bear the common expenses of the Fund, earn income from the portfolio, and are allocated unrealized gains and losses pro rata based on the average daily net assets of each class, without distinction between share classes. Dividends are determined separately for each class based on income and expenses allocable to each class. Realized gains and losses are allocated to each class pro rata based upon the net assets of each class on the date realized. Differences in per share dividend rates generally result from the relative weightings of pro rata income and realized gain allocations and from differences in separate class expenses, including distribution, shareholder servicing and administration fees.
3. FAIR VALUATION MEASUREMENTS
Fair value measurements of investments are determined within a framework that has established a fair value hierarchy based upon the various data inputs utilized in determining the value of the Fund’s investments. The three-level hierarchy gives the highest priority to unadjusted quoted prices in active markets for identical assets or liabilities (Level 1) and the lowest priority to unobservable inputs (Level 3). The Fund’s investments are classified within the fair value hierarchy based on the lowest level of input that is significant to the fair value measurement. The inputs are summarized into three broad levels as follows:
| n | | Level 1 – quoted prices in active markets for identical securities |
| n | | Level 2 – other significant observable inputs (including quoted prices for similar securities, interest rates, prepayment speeds, credit risk, etc.) |
| n | | Level 3 – significant unobservable inputs (including the Fund’s own assumptions in determining the fair value of investments) |
The inputs or methodologies used for valuing securities are not necessarily an indication of the risk associated with investing in those securities.
At July 31, 2011, all of the Fund’s investments in securities carried at fair value were designated as Level 2 since the primary inputs include credit quality of the issuer and short-term interest rates which are observable.
Further details on the major security types can be found in the Fund’s Portfolio of Investments.
4. TRANSACTIONS WITH AFFILIATES AND OTHER EXPENSES
Advisory fee
The Trust has entered into an advisory contract with Wells Fargo Funds Management, LLC (“Funds Management”), an indirect wholly owned subsidiary of Wells Fargo & Company (“Wells Fargo”). The adviser is responsible for implementing investment policies and guidelines and for supervising the sub-adviser, who is responsible for day-to-day portfolio management of the Fund.
Pursuant to the contract, Funds Management is entitled to receive an annual advisory fee of 0.10% of the Fund’s average daily net assets.
Funds Management may retain the services of certain sub-advisers to provide daily portfolio management to the Fund. The fees related to sub-advisory services are borne directly by the adviser and do not increase the overall fees paid by the
| | | | |
| 22 | | Wells Fargo Advantage Government Money Market Fund | | Notes to Financial Statements (Unaudited) |
Fund to the adviser. Wells Capital Management Incorporated, an affiliate of Funds Management, is the sub-adviser to the Fund and is entitled to receive a fee from the adviser at an annual rate starting at 0.05% and declining to 0.01% as the average daily net assets of the Fund increase.
Administration and transfer agent fees
The Trust has entered into an administration agreement with Funds Management. Under this agreement, for providing administrative services, which includes paying fees and expenses for services provided by the transfer agent, sub-transfer agents, omnibus account servicers and record-keepers, Funds Management is entitled to receive from the Fund an annual fund level administration fee starting at 0.05% and declining to 0.03% as the average daily net assets of the Fund increase and a class level administration fee which is calculated based on the average daily net assets of each class as follows:
| | | | |
| | | Class Level Administration Fee | |
Class A, Sweep Class | | | 0.22 | % |
Administrator Class | | | 0.10 | |
Institutional Class | | | 0.08 | |
Service Class | | | 0.12 | |
Funds Management has contractually waived and/or reimbursed advisory and administration fees to the extent necessary to maintain certain net operating expense ratios for the Fund. Waiver of fees and/or reimbursement of expenses by Funds Management were made first from fund level expenses on a proportionate basis and then from class specific expenses.
Distribution fees
The Trust has adopted a Distribution Plan for Sweep Class shares of the Fund pursuant to Rule 12b-1 under the 1940 Act. Distribution fees are charged to the Sweep Class shares and paid to Wells Fargo Funds Distributor, LLC, the principal underwriter, at an annual rate of 0.35% of the average daily net assets for Sweep Class shares.
Shareholder servicing fees
The Trust has entered into contracts with one or more shareholder servicing agents, whereby Class A, Service Class and Sweep Class of the Fund is charged a fee at an annual rate of 0.25% of the respective average daily net assets of each class. Administrator Class is charged a fee at an annual rate of 0.10% of its average daily net assets.
A portion of these total shareholder servicing fees were paid to affiliates of Wells Fargo.
5. ACQUISITIONS
After the close of business on July 9, 2010, the Fund acquired the net assets of Evergreen U.S. Government Money Market Fund and Evergreen Institutional U.S. Government Money Market Fund. The purpose of the transactions was to combine three funds with similar investment objectives and strategies. The acquisitions were accomplished by a tax-free exchange of all of the shares of Evergreen U.S. Government Money Market Fund and Evergreen Institutional U.S. Government Money Market Fund at an exchange ratio of 1.00 for each class. Shareholders holding Class A and Class S shares of Evergreen U.S. Government Money Market Fund received Class A and Sweep Class shares, respectively, of the Fund in the reorganization. Shareholders holding Class IS, Class I, Class IN, and Class P shares of Evergreen Institutional U.S. Government Money Market Fund received Service Class, Institutional Class, Institutional Class and Service Class shares, respectively, of the Fund in the reorganization. The investment portfolio of Evergreen U.S. Government Money Market Fund and Evergreen Institutional U.S. Government Money Market Fund with fair values of $677,045,951 and $1,421,726,121, respectively, and amortized costs of $677,045,951and $1,421,726,121, respectively, at July 9, 2010, were the principal assets acquired by the Fund. For financial reporting purposes, assets received and shares issued by the Fund were recorded at fair value; however, the cost basis of the investments received from Evergreen U.S. Government Money Market Fund and Evergreen Institutional U.S. Government Money Market Fund were carried forward to align ongoing
| | | | | | |
| Notes to Financial Statements (Unaudited) | | Wells Fargo Advantage Government Money Market Fund | | | 23 | |
reporting of the Fund’s realized and unrealized gains and losses with amounts distributable to shareholders for tax purposes. The value of net assets acquired, and number of shares issued were as follows:
| | | | | | | | | | |
| Acquired Fund | | Value of Net
Assets Acquired | | | Number of Shares Issued |
Evergreen U.S. Government Money Market Fund | | $ | 677,543,131 | | | | 507,981,859 | | | Class A |
| | | | | | | | 169,606,962 | | | Sweep Class |
Evergreen Institutional U.S. Government Money Market Fund | | $ | 1,423,371,980 | | | | 99,516,216 | | | Service Class |
| | | | | | | 1,324,050,351 | | | Institutional Class |
The aggregate net assets of the Fund immediately before and after the acquisitions were $25,563,224,306 and $27,664,139,417, respectively. Assuming the acquisitions had been completed March 1, 2010, the beginning of the annual reporting period for the Fund, the pro forma results of operations for the period ended January 31, 2011 would have been:
| | | | |
Net investment income | | $ | 7,686,752 | |
Net realized losses on investments | | $ | (179,078 | ) |
Net increase in net assets resulting from operations | | $ | 7,507,674 | |
6. INDEMNIFICATION
Under the Trust’s organizational documents, the officers and directors are indemnified against certain liabilities that may arise out of performance of their duties to the Trust. Additionally, in the normal course of business, the Trust may enter into contracts with service providers that contain a variety of indemnification clauses. The Trust’s maximum exposure under these arrangements is dependent on future claims that may be made against the Fund and, therefore, cannot be estimated.
7. NEW ACCOUNTING PRONOUNCEMENTS
In May 2011, the Financial Accounting Standards Board (“FASB”) issued Accounting Standards Update (“ASU”) No. 2011-04 “Amendments to Achieve Common Fair Value Measurement and Disclosure Requirements in U.S. GAAP and IFRSs”. ASU No. 2011-04 amends FASB ASC Topic 820, Fair Value Measurements and Disclosures, to establish common requirements for measuring fair value and for disclosing information about fair value measurements in accordance with GAAP. The ASU is effective prospectively for interim and annual periods beginning after December 15, 2011.
In April 2011, FASB issued ASU No. 2011-03 “Reconsideration of Effective Control for Repurchase Agreements”. ASU No. 2011-03 amends FASB ASC Topic 860, Transfers and Servicing, specifically the criteria required to determine whether a repurchase agreement (repo) and similar agreements should be accounted for as sales of financial assets or secured borrowings with commitments. ASU No. 2011-03 changes the assessment of effective control by focusing on the transferor’s contractual rights and obligations and removing the criterion to assess its ability to exercise those rights or honor those obligations. This could result in changes to the way entities account for certain transactions including repurchase agreements, mortgage dollar rolls and reverse repurchase agreements. The ASU will become effective on a prospective basis for new transfers and modifications to existing transactions as of the beginning of the first interim or annual period beginning on or after December 15, 2011.
As of July 31, 2011, management of the Fund is currently assessing the potential impact, in addition to expanded financial statement disclosure, that may result from adopting these ASUs.
| | | | |
| 24 | | Wells Fargo Advantage Government Money Market Fund | | Other Information (Unaudited) |
PORTFOLIO HOLDINGS INFORMATION
The complete portfolio holdings for the Fund are publicly available on the Fund’s Web site (www.wellsfargo.com/advantagefunds) on a monthly, seven-day delayed basis. The Fund files its complete schedule of portfolio holdings with the SEC for the first and third quarters of each fiscal year on Form N-Q, which is available without charge by visiting the SEC Web site at www.sec.gov. In addition, the Fund’s Form N-Q may be reviewed and copied at the SEC’s Public Reference Room in Washington, DC, and at regional offices in New York City, at 233 Broadway, and in Chicago, at 175 West Jackson Boulevard, Suite 900. Information about the Public Reference Room may be obtained by calling 1-800-SEC-0330.
PROXY VOTING INFORMATION
A description of the policies and procedures that the Fund uses to determine how to vote proxies relating to portfolio securities is available without charge, upon request, by calling 1-800-222-8222, visiting our Web site at www.wellsfargo.com/advantagefunds, or visiting the SEC Web site at www.sec.gov. Information regarding how the Fund voted proxies relating to portfolio securities during the most recent 12-month period ended June 30 is available without charge on the Fund’s Web site at www.wellsfargo.com/advantagefunds or by visiting the SEC Web site at www.sec.gov.
| | | | | | |
| Other Information (Unaudited) | | Wells Fargo Advantage Government Money Market Fund | | | 25 | |
BOARD OF TRUSTEES
The following table provides basic information about the Board of Trustees (the “Trustees”) of the Trust and Officers of the Trust. This table should be read in conjunction with the Prospectus and the Statement of Additional Information1 of the Fund. Each of the Trustees and Officers listed below acts in identical capacities for the Wells Fargo Advantage family of funds, which consists of 144 funds comprising the Wells Fargo Funds Trust, Wells Fargo Variable Trust, Wells Fargo Master Trust and four closed-end funds (collectively the “Fund Complex”). All of the Trustees are also Members of the Audit and Governance Committees of each Trust in the Fund Complex. The mailing address of each Trustee and Officer is 525 Market Street, 12th Floor, San Francisco, CA 94105. Each Trustee and Officer serves an indefinite term, however, each Trustee serves such term until reaching the mandatory retirement age established by the Trustees.
Independent Trustees
| | | | | | |
Name and Year of Birth | | Position Held and Length of Service | | Principal Occupations During Past Five Years | | Other Directorships During
Past Five Years |
Peter G. Gordon
(Born 1942) | | Trustee, since 1998; Chairman, since 2005 | | Co-Founder, Chairman, President and CEO of Crystal Geyser. Water Company. Trustee Emeritus, Colby College | | Asset Allocation Trust |
Isaiah Harris, Jr.
(Born 1952) | | Trustee, since 2009 | | Retired. Prior thereto, President and CEO of BellSouth Advertising and Publishing Corp. from 2005 to 2007, President and CEO of BellSouth Enterprises from 2004 to 2005 and President of BellSouth Consumer Services from 2000 to 2003. Emeritus member of the Iowa State University Foundation Board of Governors. Emeritus Member of the Advisory Board of Iowa State University School of Business. Mr. Harris is a certified public accountant. | | CIGNA Corporation; Deluxe Corporation; Asset Allocation Trust |
Judith M. Johnson
(Born 1949) | | Trustee, since 2008 | | Retired. Prior thereto, Chief Executive Officer and Chief Investment Officer of Minneapolis Employees Retirement Fund from 1996 to 2008. Ms. Johnson is an attorney, certified public accountant and a certified managerial accountant. | | Asset Allocation Trust |
Leroy Keith, Jr.
(Born 1939) | | Trustee, since 2010 | | Chairman, Bloc Global Services (development and construction), Trustee of the Evergreen Funds from 1983 to 2010. Former Managing Director, Almanac Capital Management (commodities firm), former Partner, Stonington Partners, Inc. (private equity fund), former Director, Obagi Medical Products Co. and former Director, Lincoln Educational Services. | | Trustee, Virtus Fund Complex (consisting of 45 portfolios as of 12/31/10); Director, Diversapack Co. (packaging company); Asset Allocation Trust |
David F. Larcker
(Born 1950) | | Trustee, since 2009 | | James Irvin Miller Professor of Accounting at the Graduate School of Business, Stanford University, Director of Corporate Governance Research Program and Co-Director of The Rock Center for Corporate Governance since 2006. From 2005 to 2008, Professor of Accounting at the Graduate School of Business, Stanford University. Prior thereto, Ernst & Young Professor of Accounting at The Wharton School, University of Pennsylvania from 1985 to 2005. | | Asset Allocation Trust |
Olivia S. Mitchell
(Born 1953) | | Trustee, since 2006 | | International Foundation of Employee Benefit Plans Professor and Chair of the Department of Insurance and Risk Management, Wharton School of the University of Pennsylvania since 1993. Director of Wharton’s Pension Research Council and Boettner Center on Pensions & Retirement Research, and Research Associate at the National Bureau of Economic Research. Previously, Cornell University Professor from 1978 to 1993. | | Asset Allocation Trust |
| | | | |
| 26 | | Wells Fargo Advantage Government Money Market Fund | | Other Information (Unaudited) |
| | | | | | |
Name and Year of Birth | | Position Held and Length of Service | | Principal Occupations During Past Five Years | | Other Directorships During
Past Five Years |
Timothy J. Penny
(Born 1951) | | Trustee, since 1996 | | President and CEO of Southern Minnesota Initiative Foundation, a non-profit organization, since 2007 and Senior Fellow at the Humphrey Institute Policy Forum at the University of Minnesota since 1995. Member of the Board of Trustees of NorthStar Education Finance, Inc., a non-profit organization, since 2007. | | Asset Allocation Trust |
Michael S. Scofield
(Born 1943) | | Trustee, since 2010 | | Currently serves on the Investment Company Institute’s Board of Governors and Executive Committee as well the In dependent Director’s Counsel Board of Governors and Executive Committee. Former Chairman of the Independent Directors Counsel. Trustee of the Evergreen Funds from 1984 to 2010. Retired Attorney, Law Offices of Michael S. Scofield and former Director and Chairman, Branded Media Corporation (multi-media branding company). | | Asset Allocation Trust |
Donald C. Willeke
(Born 1940) | | Trustee, since 1996 | | Principal of the law firm of Willeke & Daniels. General Counsel of the Minneapolis Employees Retirement Fund from 1984 until its consolidation into the Minnesota Public Employees Retirement Association on June 30, 2010. | | Asset Allocation Trust |
Officers
| | | | | | |
Name and Year of Birth | | Position Held and
Length of Service | | Principal Occupations During Past Five Years | | |
Karla M. Rabusch
(Born 1959) | | President, since 2003 | | Executive Vice President of Wells Fargo Bank, N.A. and President of Wells Fargo Funds Management, LLC since 2003. Senior Vice President and Chief Administrative Officer of Wells Fargo Funds Management, LLC from 2001 to 2003. | | |
C. David Messman
(Born 1960) | | Secretary, since 2000; Chief Legal Counsel, since 2003 | | Senior Vice President and Secretary of Wells Fargo Funds Management, LLC since 2001. Vice President and Managing Counsel of Wells Fargo Bank, N.A. since 1996. | | |
Kasey Phillips
(Born 1970) | | Treasurer, since 2008 | | Senior Vice President of Wells Fargo Funds Management, LLC since 2009. Senior Vice President of Evergreen Investment Management Company, LLC from 2006 to 2010. Treasurer of the Evergreen Funds from 2005 to 2010. Vice President and Assistant Vice President of Evergreen Investment Services, Inc. from 1999 to 2006. | | |
David Berardi
(Born 1975) | | Assistant Treasurer, since 2009 | | Vice President of Wells Fargo Funds Management, LLC since 2009 . Vice President of Evergreen Investment Management Company, LLC from 2008 to 2010. Assistant Vice President of Evergreen Investment Services, Inc. from 2004 to 2008. Manager of Fund Reporting and Control for Evergreen Investment Management Company, LLC from 2004 to 2010. | | |
Jeremy DePalma
(Born 1974) | | Assistant Treasurer, since 2009 | | Senior Vice President of Wells Fargo Funds Management, LLC since 2009. Senior Vice President of Evergreen Investment Management Company, LLC from 2008 to 2010. Vice President, Evergreen Investment Services, Inc. from 2004 to 2007. Assistant Vice President, Evergreen Investment Services, Inc. from 2000 to 2004 and the head of the Fund Reporting and Control Team within Fund Administration from 2005 to 2010. | | |
Debra Ann Early
(Born 1964) | | Chief Compliance Officer, since 2007 | | Chief Compliance Officer of Wells Fargo Funds Management, LLC since 2007. Chief Compliance Officer of Parnassus Investments from 2005 to 2007. Chief Financial Officer of Parnassus Investments from 2004 to 2007 and Senior Audit Manager of PricewaterhouseCoopers LLP from 1998 to 2004. | | |
| 1. | The Statement of Additional Information includes additional information about the Fund’s Trustees and is available, without charge, upon request, by calling 1-800-222-8222 or by visiting the Fund’s Web site at www.wellsfargo.com/advantagefunds. |
| | | | | | |
| Other Information (Unaudited) | | Wells Fargo Advantage Government Money Market Fund | | | 27 | |
BOARD CONSIDERATION OF INVESTMENT ADVISORY AND SUB-ADVISORY AGREEMENTS:
100% Treasury Money Market Fund, Cash Investment Money Market Fund, Government Money Market Fund, Heritage Money Market Fund, Money Market Fund, Prime Investment Money Market Fund and Treasury Plus Money Market Fund
(Not all of the funds described in this Board considerations section are part of this shareholder report. This shareholder report only relates to Government Money Market Fund.)
Each year, as required by Section 15 of the Investment Company Act of 1940 (the “1940 Act”), the Board of Trustees (the “Board”) of Wells Fargo Funds Trust (the “Trust”), all the members of which have no direct or indirect interest in the investment advisory and sub-advisory agreements and are not “interested persons” of the Trust, as defined in the 1940 Act (the “Independent Trustees”), determines whether to approve the continuation of the Trust’s investment advisory and sub-advisory agreements. In this regard, at an in person meeting held on March 24-25, 2011 (the “Meeting”), the Board reviewed and re-approved: (i) an investment advisory agreement with Wells Fargo Funds Management, LLC (“Funds Management”) for each of the 100% Treasury Money Market Fund, Cash Investment Money Market Fund, Government Money Market Fund, Heritage Money Market Fund, Money Market Fund, Prime Investment Money Market Fund and Treasury Plus Money Market Fund (collectively, the “Funds”); and (ii) an investment sub-advisory agreement with Wells Capital Management Incorporated (“Wells Capital Management”) for each of the Funds. The investment advisory agreements with Funds Management and the investment sub-advisory agreements with Wells Capital Management are collectively referred to as the “Advisory Agreements.”
At the Meeting, the Board considered the factors and reached the conclusions described below relating to the selection of Funds Management and Wells Capital Management and continuation of the Advisory Agreements. Prior to the Meeting, the Trustees conferred extensively among themselves and with representatives of Funds Management about these matters. The Board also met throughout the year and received information that was useful to them in considering the continuation of the Advisory Agreements. The Independent Trustees were assisted in their evaluation of the Advisory Agreements by independent legal counsel, from whom they received separate legal advice and with whom they met separately from Funds Management.
Nature, extent and quality of services
The Board received and considered various information regarding the nature, extent and quality of services provided to the Funds by Funds Management and Wells Capital Management under the Advisory Agreements. The Board also received and considered information provided in response to a detailed set of requests submitted by the Independent Trustees’ independent legal counsel on their behalf. The Board received and considered, among other things, information about the background and experience of senior management of Funds Management, and the qualifications, backgrounds, tenures and responsibilities of the portfolio managers primarily responsible for the day-to-day portfolio management of the Funds.
The Board evaluated the ability of Funds Management and Wells Capital Management, based on their respective financial condition, resources, reputation and other attributes, to attract and retain qualified investment professionals, including research, advisory, and supervisory personnel. The Board further considered the compliance programs and compliance records of Funds Management and Wells Capital Management. In addition, the Board took into account the administrative services provided to the Funds by Funds Management and its affiliates.
The Board’s decision to approve the continuation of the Advisory Agreements was based on a comprehensive evaluation of all of the information provided to it. In approving the continuation of the Advisory Agreements, the Board did not identify any particular information or consideration that was all-important or controlling, and each Trustee attributed different weights to various factors. The Board evaluated information provided to it both in terms of the funds generally and with respect to each Fund specifically as it considered appropriate. Although the Board considered the continuation of the Advisory Agreements for each of the Funds as part of the larger process of considering the continuation of the advisory agreements for all of the funds, its decision to continue the Advisory Agreements for each of the Funds was ultimately made on a fund-by-fund basis.
In considering these matters, the Board considered not only the specific information presented in connection with the Meeting, but also the knowledge gained over time through interaction with Funds Management and Wells Capital
| | | | |
| 28 | | Wells Fargo Advantage Government Money Market Fund | | Other Information (Unaudited) |
Management about various topics, including Funds Management’s oversight of service providers. The above factors, together with those referenced below, are some of the most important, but not necessarily all, factors considered by the Board in concluding that it was satisfied with the nature, extent and quality of the investment advisory services provided to each Fund by Funds Management and Wells Capital Management.
Fund performance and expenses
The Board considered the performance results for each of the Funds over various time periods ended December 31, 2010. The Board also considered these results in comparison to the median performance of a universe of relevant funds (the “Universe”) that were determined by Lipper Inc. (“Lipper”) to be similar to the Funds, and in comparison to each Fund’s benchmark index and to other comparative data. Lipper is an independent provider of investment company data. The Board received a description of the methodology used by Lipper to select the mutual funds in the Universe.
The Board noted that the performance of each of the Funds was higher than or in range of the median performance of the Universe for the periods under review, except for the Money Market Fund (Class B).
The Board received and considered information regarding each Fund’s contractual advisory fee and net operating expense ratios and their various components, including actual management fees (which reflect fee waivers, if any), transfer agent, custodian and other non-management fees, Rule 12b-1 and non-Rule 12b-1 fees, service fees and fee waiver and expense reimbursement arrangements. The Board also considered these ratios in comparison to the median ratios of an expense Universe and a narrower expense group of mutual funds (each, an “Expense Group”) that was determined by Lipper to be similar to each Fund. The Board received a description of the methodology used by Lipper to select the mutual funds in a Fund’s Expense Group. The Board noted that the net operating expense ratios of the Service Class, Administrator Class, Institutional Class and Select Class of each of the Funds were in range of each Fund’s respective Expense Group’s median net operating expense ratio, except for the 100% Treasury Money Market Fund (Service Class). The Board also noted that the net operating expense ratios of the Class A and Sweep Class of each of the Funds, the Money Market Fund (A, B, C, Daily and Investor Classes) were higher than each Fund’s respective Expense Group’s median net operating expense ratio.
Based on the above-referenced considerations and other factors, the Board concluded that the overall performance and expense structure of the Funds supported the re-approval of the Advisory Agreements for the Funds.
Investment advisory and sub-advisory fee rates
The Board reviewed and considered the contractual investment advisory fee rates that are payable by the Funds to Funds Management for investment advisory services (the “Advisory Agreement Rates”), both on a stand-alone basis and on a combined basis with the Funds’ administration fee rates. The Board took into account the separate administrative and other services covered by the administration fee rates. The Board also reviewed and considered the contractual investment sub-advisory fee rates that are payable by Funds Management to Wells Capital Management for investment sub-advisory services (the “Sub-Advisory Agreement Rates”). In addition, the Board reviewed and considered the existing fee waiver/cap arrangements applicable to the Advisory Agreement Rates and considered the Advisory Agreement Rates after taking the waivers/caps into account (the “Net Advisory Rates”).
The Board received and considered information comparing the Advisory Agreement Rates and Net Advisory Rates with those of other funds in each Fund’s Expense Group median. The Board noted that the Advisory Agreement Rates for the Class A, Service Class, Administrator Class, Institutional Class and Select Class of each of the Funds were in range of each Fund’s respective Expense Group, except for the 100% Treasury Money Market Fund (Administrator Class). The Board noted that the Advisory Agreement Rates for the Sweep Class of each of the Funds was not appreciably higher than the median rate of each Fund’s Expense Group, except for the 100% Treasury Money Market Fund. The Board also noted that the Advisory Agreement Rates for the Money Market Fund (Class B, Class C, Daily Class and Investor Class) were higher than the median rate of the Expense Group. The Board noted that the Net Advisory Rates for the Service Class, Administrator Class, Institutional Class and Select Class of each of the Funds were in range of each Fund’s respective Expense Group. The Board also noted that the Net Advisory Rates for the Class A and Sweep Class of each of the Funds and the Money Market Fund (Class B, Class C, Daily Class and Investor Class) were higher than each Fund’s respective Expense Group. The Board further noted that Funds Management had agreed to continue and, in certain instances, reduce contractual fee cap arrangements for the Funds designed to lower the Funds’ expenses.
| | | | | | |
| Other Information (Unaudited) | | Wells Fargo Advantage Government Money Market Fund | | | 29 | |
The Board also received and considered information about the nature and extent of services offered and fee rates charged by Funds Management and Wells Capital Management to other types of clients. In this regard, the Board received information about differences between the services, and the compliance, reporting, and other legal burdens and risks of providing investment advice to mutual funds and those associated with providing advice to non-mutual fund clients such as collective funds or institutional separate accounts.
In each case, the Board determined that the Advisory Agreement Rates for the Funds, both with and without administration fee rates and before and after waivers, were acceptable in light of the Funds’ Expense Group information, the net expense ratio commitments, the services covered by the Advisory Agreements and other information provided. The Board also reviewed and considered the Sub-Advisory Agreement Rates and concluded that the Sub-Advisory Agreement Rates were acceptable in light of the services covered by the Sub-Advisory Agreement and other information provided.
Profitability
The Board received and considered a profitability analysis of Funds Management, as well as an analysis of the profitability to the collective Wells Fargo businesses that provide services to the Funds. It considered that the information provided to it was necessarily estimated, and that the profitability information provided to it, especially on a fund-by-fund basis, did not necessarily provide a precise tool for evaluating the appropriateness of each Fund’s Advisory Agreement Rates in isolation. It noted that the levels of profitability of the Funds to Funds Management varied widely, depending on, among other things, the size and type of fund. The Board concluded that the profitability to Funds Management of the services provided to any of the Funds, individually or in the aggregate, was not unreasonable.
The Board did not consider separate profitability information with respect to Wells Capital Management, because, as an affiliate of Funds Management, its profitability information was subsumed in the collective Wells Fargo profitability analysis provided by Funds Management.
Economies of scale
With respect to possible economies of scale, the Board reviewed the breakpoints in each Fund’s advisory fee structure, which operate generally to reduce the effective Advisory Agreement Rates of the Funds (as a percentage of Fund assets) as the Funds grow in size. It considered that, as a fund shrinks in size, breakpoints conversely result in increasing fee levels. The Board noted that it would continue to review the appropriate levels of breakpoints in the future, and concluded that the breakpoints as implemented appeared to be a reasonable step toward sharing economies of scale with the Funds. However, the Board acknowledged the inherent limitations of any analysis of an investment adviser’s economies of scale and of any attempt to correlate breakpoints with such economies, stemming largely from the Board’s understanding that economies of scale are realized, if at all, by an investment adviser across a variety of products and services, not just with respect to a single fund.
Other benefits to Funds Management and Wells Capital Management
The Board received and considered information regarding potential “fall-out” or ancillary benefits received by Funds Management and its affiliates, including Wells Capital Management, as a result of their relationship with the Funds. Ancillary benefits could include, among others, benefits directly attributable to the relationship of Funds Management and Wells Capital Management with the Funds and benefits potentially derived from an increase in Funds Management’s and Wells Capital Management’s business as a result of their relationship with the Funds (such as the ability to market to shareholders other financial products offered by Funds Management and its affiliates, including Wells Capital Management).
The Board considered that Wells Fargo Funds Distributor, LLC, an affiliate of Funds Management, serves as distributor to the Funds and receives certain compensation for those services. The Board noted that the Funds pay sub-transfer agency fees to various financial institutions, including affiliates of Funds Management that hold fund shares in omnibus accounts. It also considered that these entities may receive distribution-related fees and shareholder servicing payments (including amounts derived from payments under the funds’ Rule 12b-1 plans) in respect of shares sold or held through them.
The Board also reviewed information about whether and to what extent soft dollar credits are sought and how any such credits are utilized and any benefits that may be realized by using an affiliated broker.
Other factors and broader review
The Board also considered the markets for distribution of the Funds’ shares, including the multiple channels through which the Funds’ shares are offered and sold. The Board noted that the Funds are part of one of the few fund families that
| | | | |
| 30 | | Wells Fargo Advantage Government Money Market Fund | | Other Information (Unaudited) |
have both direct-to-fund and intermediary distribution channels. As discussed above, the Board reviews detailed materials received from Funds Management and Wells Capital Management annually as part of the re-approval process under Section 15 of the 1940 Act and also reviews and assesses information about the quality of the services that the Funds receive throughout the year. In this regard, the Board has reviewed reports of Funds Management at each of its quarterly meetings, which include, among other things, portfolio reviews and performance reports. In addition, the Board confers with portfolio managers at various times throughout the year.
Conclusion
After considering the above-described factors and based on its deliberations and its evaluation of the information described above, the Board concluded that approval of the continuation of the Advisory Agreements for the Funds was in the best interest of the Funds and their shareholders. Accordingly, the Board unanimously approved the continuation of the Advisory Agreements for an additional one-year period.
| | | | | | |
| List of Abbreviations | | Wells Fargo Advantage Government Money Market Fund | | | 31 | |
The following is a list of common abbreviations for terms and entities which may have appeared in this report.
| ABAG | — Association of Bay Area Governments |
| ACB | — Agricultural Credit Bank |
| ADR | — American Depositary Receipt |
| ADS | — American Depository Shares |
| AGC-ICC | — Assured Guaranty Corporation - Insured Custody Certificates |
| AGM | — Assured Guaranty Municipal |
| AMBAC | — American Municipal Bond Assurance Corporation |
| AMT | — Alternative Minimum Tax |
| ARM | — Adjustable Rate Mortgages |
| BAN | — Bond Anticipation Notes |
| BART | — Bay Area Rapid Transit |
| BHAC | — Berkshire Hathaway Assurance Corporation |
| CCAB | — Convertible Capital Appreciation Bond |
| CDA | — Community Development Authority |
| CDO | — Collateralized Debt Obligation |
| CDSC | — Contingent Deferred Sales Charge |
| CGIC | — Capital Guaranty Insurance Company |
| CGY | — Capital Guaranty Corporation |
| CIFG | — CDC (Caisse des Dépôts et Consignations) IX IS Financial Guarantee |
| COP | — Certificate of Participation |
| DRIVER | — Derivative Inverse Tax-Exempt Receipts |
| DW&P | — Department of Water & Power |
| DWR | — Department of Water Resources |
| ECFA | — Educational & Cultural Facilities Authority |
| EDFA | — Economic Development Finance Authority |
| ETET | — Eagle Tax-Exempt Trust |
| ETF | — Exchange-Traded Fund |
| FFCB | — Federal Farm Credit Bank |
| FGIC | — Financial Guaranty Insurance Corporation |
| FHA | — Federal Housing Authority |
| FHAG | — Federal Housing Agency |
| FHLB | — Federal Home Loan Bank |
| FHLMC | — Federal Home Loan Mortgage Corporation |
| FNMA | — Federal National Mortgage Association |
| GDR | — Global Depositary Receipt |
| GNMA | — Government National Mortgage Association |
| HCFR | — Healthcare Facilities Revenue |
| HEFA | — Health & Educational Facilities Authority |
| HEFAR | — Higher Education Facilities Authority Revenue |
| HFA | — Housing Finance Authority |
| HFFA | — Health Facilities Financing Authority |
| HUD | — Housing & Urban Development |
| IBC | — Insured Bond Certificate |
| IDA | — Industrial Development Authority |
| IDAG | — Industrial Development Agency |
| IDR | — Industrial Development Revenue |
| KRW | — Republic of Korea Won |
| LIBOR | — London Interbank Offered Rate |
| LLC | — Limited Liability Company |
| LLP | — Limited Liability Partnership |
| MBIA | — Municipal Bond Insurance Association |
| MFHR | — Multi-Family Housing Revenue |
| MFMR | — Multi-Family Mortgage Revenue |
| MMD | — Municipal Market Data |
| MSTR | — Municipal Securities Trust Receipts |
| MUD | — Municipal Utility District |
| NATL-RE | — National Public Finance Guarantee Corporation |
| PCFA | — Pollution Control Finance Authority |
| PCR | — Pollution Control Revenue |
| PFA | — Public Finance Authority |
| PFFA | — Public Facilities Financing Authority |
| PFOTER | — Puttable Floating Option Tax-Exempt Receipts |
| plc | — Public Limited Company |
| PSFG | — Public School Fund Guaranty |
| PUTTER | — Puttable Tax-Exempt Receipts |
| R&D | — Research & Development |
| RDA | — Redevelopment Authority |
| RDFA | — Redevelopment Finance Authority |
| REIT | — Real Estate Investment Trust |
| RIB | — Residual Interest Bond |
| ROC | — Reset Option Certificates |
| SAVRS | — Select Auction Variable Rate Securities |
| SFHR | — Single Family Housing Revenue |
| SFMR | — Single Family Mortgage Revenue |
| SLMA | — Student Loan Marketing Association |
| SPDR | — Standard & Poor’s Depositary Receipts |
| STIT | — Short-Term Investment Trust |
| TAN | — Tax Anticipation Notes |
| TIPS | — Treasury Inflation-Protected Securities |
| TRAN | — Tax Revenue Anticipation Notes |
| TCR | — Transferable Custody Receipts |
| TTFA | — Transportation Trust Fund Authority |
| USD | — Unified School District |
| XLCA | — XL Capital Assurance |
This page is intentionally left blank.
This page is intentionally left blank.
This page is intentionally left blank.


FOR MORE INFORMATION
More information about Wells Fargo Advantage Funds is available free upon request. To obtain literature, please write, e-mail, visit the Funds’ Web site, or call:
Wells Fargo Advantage Funds
P.O. Box 8266
Boston, MA 02266-8266
E-mail: wfaf@wellsfargo.com
Web site: www.wellsfargo.com/advantagefunds
Individual investors: 1-800-222-8222
Retail investment professionals: 1-888-877-9275
Institutional investment professionals: 1-866-765-0778
This report and the financial statements contained herein are submitted for the general information of the shareholders of Wells Fargo Advantage Funds. If this report is used for promotional purposes, distribution of the report must be accompanied or preceded by a current prospectus. For a prospectus containing more complete information, including charges and expenses, call 1-800-222-8222 or visit the Funds’ Web site at www.wellsfargo.com/advantagefunds. Please consider the investment objectives, risks, charges, and expenses of the investment carefully before investing. This and other information about Wells Fargo Advantage Funds can be found in the current prospectus. Read the prospectus carefully before you invest or send money.
Wells Fargo Funds Management, LLC, a wholly owned subsidiary of Wells Fargo & Company, provides investment advisory and administrative services for Wells Fargo Advantage Funds. Other affiliates of Wells Fargo & Company provide subadvisory and other services for the Funds. The Funds are distributed by Wells Fargo Funds Distributor, LLC, Member FINRA/SIPC, an affiliate of Wells Fargo & Company.
NOT FDIC INSURED ¡ NO BANK GUARANTEE ¡ MAY LOSE VALUE
© 2011 Wells Fargo Funds Management, LLC. All rights reserved.
| | |
 | | 204799 09-11 SA303/SAR303 7-11 |

Wells Fargo Advantage
Heritage Money Market Fund

Semi-Annual Report
July 31,2011

Reduce clutter. Save trees.
Sign up for electronic delivery of prospectuses and shareholder reports at www.wellsfargo.com/advantagedelivery
Contents
The views expressed and any forward-looking statements are as of July 31, 2011, unless otherwise noted and are those of the Fund managers and/or Wells Fargo Funds Management, LLC. Discussions of individual securities, or the markets generally, or any Wells Fargo Advantage Fund are not intended as individual recommendations. Future events or results may vary significantly from those expressed in any forward-looking statements; the views expressed are subject to change at any time in response to changing circumstances in the market. Wells Fargo Funds Management, LLC, disclaims any obligation to publicly update or revise any views expressed or forward-looking statements.
NOT FDIC INSURED ¡ NO BANK GUARANTEE ¡ MAY LOSE VALUE

WELLS FARGO INVESTMENT HISTORY
| | |
| |
| 1932 | | Keystone creates one of the first mutual fund families. |
| |
| 1971 | | Wells Fargo & Company introduces one of the first institutional index funds. |
| |
| 1978 | | Wells Fargo applies Markowitz and Sharpe’s research on Modern Portfolio Theory to introduce one of the industry’s first Tactical Asset Allocation (TAA) models in institutional separately managed accounts. |
| |
| 1984 | | Wells Fargo Stagecoach Funds launches its first asset allocation fund. |
| |
| 1989 | | The Tactical Asset Allocation (TAA) Model is first applied to Wells Fargo’s asset allocation mutual funds. |
| |
| 1994 | | Wells Fargo introduces the LifePath Funds, one of the first suites of target date funds (now the Wells Fargo Advantage Dow Jones Target Date FundsSM ). |
| |
| 1996 | | Evergreen Investments and Keystone Funds merge. |
| |
| 1997 | | Wells Fargo launches Wells Fargo Advantage WealthBuilder PortfoliosSM, a fund-of-funds suite of products that includes the use of quantitative models to shift assets among investment styles. |
| |
| 1999 | | Norwest Advantage Funds and Stagecoach Funds are reorganized into Wells Fargo Funds after the merger of Norwest and Wells Fargo. |
| |
| 2002 | | Evergreen Retail and Evergreen Institutional companies form the umbrella asset management company, Evergreen Investments. |
| |
| 2005 | | The integration of Strong Funds with Wells Fargo Funds creates Wells Fargo Advantage Funds, resulting in one of the top 20 mutual fund companies in the United States. |
| |
| 2006 | | Wells Fargo Advantage Funds relaunches the target date product line as Wells Fargo Advantage Dow Jones Target Date Funds. |
| |
| 2010 | | The mergers and reorganizations of Evergreen and Wells Fargo Advantage mutual funds are completed, unifying the families under the brand of Wells Fargo Advantage Funds. |
Wells Fargo Advantage Funds®
Wells Fargo Advantage Funds skillfully guides institutions, financial advisors, and individuals through the investment terrain to help them reach their financial objectives. Everything we do on behalf of investors is backed by our unique combination of qualifications.
Strength
Our organization is built on the standards of integrity and service established by our parent company—Wells Fargo & Company—more than 150 years ago. And, because we’re part of a highly diversified financial enterprise, we offer the depth of resources to help investors succeed.
Expertise
Our multi-boutique model offers investors access to the independent thinking of premier investment managers that have been chosen for their time-tested strategies. While each team specializes in a specific investment strategy, collectively they provide investors a wide choice of distinct investment styles. Our dedication to investment excellence doesn’t end with our expertise in manager selection—risk management, analysis, and rigorous ongoing review seek to ensure each manager’s investment process remains consistent.
Partnership
Our collaborative approach is built around understanding the needs and goals of our clients. By adhering to core principles of sound judgment and steady guidance, we support you through every stage of the investment decision process.
Carefully consider the investment objectives, risks, charges, and expenses before investing. For a current prospectus for Wells Fargo Advantage Funds containing this and other information, visit wellsfargo.com/advantagefunds. Read it carefully before investing.
Wells Fargo Funds Management, LLC, a wholly owned subsidiary of Wells Fargo & Company, provides investment advisory and administrative services for Wells Fargo Advantage Funds®. Other affiliates of Wells Fargo & Company provide subadvisory and other services for the Funds. The Funds are distributed by Wells Fargo Funds Distributor, LLC, Member FINRA/SIPC, an affiliate of Wells Fargo & Company.
The “Dow Jones Target Date Indexes” are a product of Dow Jones Indexes, a licensed trademark of CME Group Index Services LLC (“CME”). “Dow Jones” and “Dow Jones Target Date Indexes” are service marks of Dow Jones Trademark Holdings, LLC, and have been licensed for use for certain purposes by CME and sublicensed for use by Global Index Advisors, Inc., and Wells Fargo Funds Management, LLC. The Dow Jones Target Date Indexes are based in part on the Barclays Capital Bond Indexes, which are published by Barclays Capital Inc. The Wells Fargo Advantage Dow Jones Target Date Funds, based on the Dow Jones Target Date Indexes, are not sponsored, endorsed, sold, or promoted by Dow Jones, CME or Barclays Capital or any of their respective affiliates, and neither Dow Jones, CME nor Barclays Capital nor any of their respective affiliates makes any representation regarding the advisability of investing in such product(s) and/or about the quality, accuracy, and/or completeness of the Dow Jones Target Date Indexes or the Barclays Capital Bond Indexes. IN NO EVENT SHALL DOW JONES, CME, BARCLAYS CAPITAL, OR ANY OF THEIR LICENSORS HAVE ANY LIABILITY IN CONNECTION WITH THE Wells Fargo Advantage Dow Jones Target Date Funds INCLUDING, WITHOUT LIMITATION, FOR ANY SPECIAL, PUNITIVE, IN DIRECT, OR CONSEQUENTIAL DAMAGES (INCLUDING LOST PROFITS), EVEN IF NOTIFIED OF THE POSSIBILITY OF SUCH DAMAGES.
NOT FDIC INSURED ¡ NO BANK GUARANTEE ¡ MAY LOSE VALUE
Not part of the semi-annual report.
Wells Fargo Advantage Funds offers more than 110 mutual funds across a wide range of asset classes, representing over $221 billion in assets under management, as of July 31, 2011.
| | | | |
| Equity Funds | | | | |
Asia Pacific Fund | | Global Opportunities Fund | | Premier Large Company Growth Fund |
C&B Large Cap Value Fund | | Growth Fund | | Small Cap Opportunities Fund |
C&B Mid Cap Value Fund | | Health Care Fund | | Small Cap Value Fund |
Capital Growth Fund | | Index Fund | | Small Company Growth Fund |
Common Stock Fund | | International Equity Fund | | Small Company Value Fund |
Disciplined U.S. Core Fund | | International Value Fund | | Small/Mid Cap Core Fund |
Discovery Fund† | | Intrinsic Small Cap Value Fund | | Small/Mid Cap Value Fund |
Diversified Equity Fund | | Intrinsic Value Fund | | Social Sustainability Fund† |
Diversified International Fund | | Intrinsic World Equity Fund | | Special Mid Cap Value Fund |
Diversified Small Cap Fund | | Large Cap Core Fund | | Special Small Cap Value Fund |
Emerging Growth Fund | | Large Cap Growth Fund | | Specialized Technology Fund |
Emerging Markets Equity Fund | | Large Company Value Fund | | Strategic Large Cap Growth Fund |
Endeavor Select Fund† | | Omega Growth Fund | | Traditional Small Cap Growth Fund |
Enterprise Fund† | | Opportunity Fund† | | Utility and Telecommunications Fund |
Equity Value Fund | | Precious Metals Fund | | |
| Bond Funds | | | | |
Adjustable Rate Government Fund | | Inflation-Protected Bond Fund | | Short-Term Bond Fund |
California Limited-Term Tax-Free Fund | | Intermediate Tax/AMT-Free Fund | | Short-Term High Yield Bond Fund |
California Tax-Free Fund | | International Bond Fund | | Short-Term Municipal Bond Fund |
Colorado Tax-Free Fund | | Minnesota Tax-Free Fund | | Strategic Municipal Bond Fund |
Government Securities Fund | | Municipal Bond Fund | | Total Return Bond Fund |
High Income Fund | | North Carolina Tax-Free Fund | | Ultra Short-Term Income Fund |
High Yield Bond Fund | | Pennsylvania Tax-Free Fund | | Ultra Short-Term Municipal Income Fund |
Income Plus Fund | | Short Duration Government Bond Fund | | Wisconsin Tax-Free Fund |
| Asset Allocation Funds | | | | |
Asset Allocation Fund | | WealthBuilder Equity Portfolio† | | Target 2020 Fund† |
Conservative Allocation Fund | | WealthBuilder Growth Allocation Portfolio† | | Target 2025 Fund† |
Diversified Capital Builder Fund | | WealthBuilder Growth Balanced Portfolio† | | Target 2030 Fund† |
Diversified Income Builder Fund | | WealthBuilder Moderate Balanced Portfolio† | | Target 2035 Fund† |
Growth Balanced Fund | | WealthBuilder Tactical Equity Portfolio† | | Target 2040 Fund† |
Index Asset Allocation Fund | | Target Today Fund† | | Target 2045 Fund† |
Moderate Balanced Fund | | Target 2010 Fund† | | Target 2050 Fund† |
WealthBuilder Conservative Allocation Portfolio† | | Target 2015 Fund† | | Target 2055 Fund† |
| Money Market Funds | | | | |
100% Treasury Money Market Fund | | Minnesota Money Market Fund | | New Jersey Municipal Money Market Fund |
California Municipal Money Market Fund | | Money Market Fund | | New York Municipal Money Market Fund |
Cash Investment Money Market Fund | | Municipal Cash Management Money Market Fund | | Pennsylvania Municipal Money Market Fund |
Government Money Market Fund | | Municipal Money Market Fund | | Prime Investment Money Market Fund |
Heritage Money Market Fund† | | National Tax-Free Money Market Fund | | Treasury Plus Money Market Fund |
| Variable Trust Funds1 | | | | |
VT Discovery Fund† | | VT Intrinsic Value Fund | | VT Small Cap Growth Fund |
VT Index Asset Allocation Fund | | VT Omega Growth Fund | | VT Small Cap Value Fund |
VT International Equity Fund | | VT Opportunity Fund† | | VT Total Return Bond Fund |
An investment in a money market fund is not insured or guaranteed by the Federal Deposit Insurance Corporation or any other government agency. Although the Wells Fargo Advantage Money Market Funds seek to preserve the value of your investment at $1.00 per share, it is possible to lose money by investing in a money market fund.
| 1. | The Variable Trust Funds are generally available only through insurance company variable contracts. |
| † | In this report, the Wells Fargo Advantage Discovery FundSM, Wells Fargo Advantage Endeavor Select FundSM, Wells Fargo Advantage Enterprise FundSM, Wells Fargo Advantage Opportunity FundSM, Wells Fargo Advantage Social Sustainability FundSM, Wells Fargo Advantage WealthBuilder Conservative Allocation PortfolioSM, Wells Fargo Advantage WealthBuilder Equity PortfolioSM , Wells Fargo Advantage WealthBuilder Growth Allocation PortfolioSM, Wells Fargo Advantage WealthBuilder Growth Balanced PortfolioSM, Wells Fargo Advantage WealthBuilder Moderate Balanced PortfolioSM, Wells Fargo Advantage WealthBuilder Tactical Equity PortfolioSM , Wells Fargo Advantage Dow Jones Target Today FundSM, Wells Fargo Advantage Dow Jones Target 2010 FundSM, Wells Fargo Advantage Dow Jones Target 2015 FundSM, Wells Fargo Advantage Dow Jones Target 2020 FundSM, Wells Fargo Advantage Dow Jones Target 2025 FundSM, Wells Fargo Advantage Dow Jones Target 2030 FundSM , Wells Fargo Advantage Dow Jones Target 2035 FundSM, Wells Fargo Advantage Dow Jones Target 2040 FundSM, Wells Fargo Advantage Dow Jones Target 2045 FundSM, Wells Fargo Advantage Dow Jones Target 2050 FundSM, Wells Fargo Advantage Dow Jones Target 2055 FundSM, Wells Fargo Advantage Heritage Money Market FundSM, Wells Fargo Advantage VT Discovery FundSM, and Wells Fargo Advantage VT Opportunity FundSM are referred to as the Discovery Fund, Endeavor Select Fund, Enterprise Fund, Opportunity Fund, Social Sustainability Fund, WealthBuilder Conservative Allocation Portfolio, WealthBuilder Equity Portfolio, WealthBuilder Growth Allocation Portfolio, WealthBuilder Growth Balanced Portfolio, WealthBuilder Moderate Balanced Portfolio, WealthBuilder Tactical Equity Portfolio, Target Today Fund, Target 2010 Fund, Target 2015 Fund, Target 2020 Fund, Target 2025 Fund, Target 2030 Fund, Target 2035 Fund, Target 2040 Fund, Target 2045 Fund, Target 2050 Fund, Target 2055 Fund, Heritage Money Market Fund, VT Discovery Fund, and VT Opportunity Fund, respectively. |
Not part of the semi-annual report.
| | | | |
| 2 | | Wells Fargo Advantage Heritage Money Market Fund | | Letter to Shareholders |

Karla M. Rabusch,
President
Wells Fargo Advantage Funds
Dear Valued Shareholder,
We’re pleased to offer you this semi-annual report for the Wells Fargo Advantage Heritage Money Market Fund for the six-month period that ended July 31, 2011. Upon reviewing the report, you may notice a few changes from past reports, the most significant of which is the change from a multi-fund report to a single-fund report. We believe this change will give you more convenient access to your fund data.
The period began modestly as improving economic optimism generally shifted investors toward equities and riskier assets and away from U.S. Treasuries and lower-yielding fixed-income securities. Returns from fixed income were modest in the opening months of 2011 but were generally still positive as U.S. Treasury yields incrementally climbed higher. But after the slow start, bond prices once again strongly improved, sparked by a sharp decline in U.S. Treasury prices in April that carried into May. Late in the period, lower-rated bonds declined in price more than the higher credit-quality tiers but not enough to outweigh the stronger performance from lower-rated securities during the period. Lower-quality and longer-maturity fixed-income securities generally outperformed higher-quality and shorter-maturity securities over the full period.
The activity within the broader bond market also resonated with money market participants. As the economic and credit environment reverberated from the ongoing sovereign debt concerns and softening economic data, many participants continued to balance a need for stability and desire for higher yields. The result has been good demand for domestic commercial paper and certificate of deposits. Also, in spite of all the discussion about sovereign debt, many money market participants continue to maintain some exposures to foreign banks based on the quality of their fundamentals. By focusing more on the fundamentals and taking a more selective approach to the short-term security market helped the markets avoid the severe yield volatility or significant flight-to-quality experienced during the spring of 2010, when the Greek sovereign debt crisis first emerged.
The global economic “recovery” hit a snag, but the end of 2011 could regain momentum.
The U.S. economic recovery that began in mid-2009 and gained further momentum throughout 2010, particularly during the fourth quarter, has failed to maintain that level of growth through the first seven months of 2011. For example, gross domestic product (GDP), the broadest measure of economic activity, grew at an annualized rate of 3.1% in the fourth quarter of 2010, only to slow dramatically during the first quarter of 2011. The latest revision to first-quarter GDP data during the period indicated that the economy grew at an annualized rate of 0.4% during the first quarter of 2011. While still positive, it’s a much slower pace of growth than experienced in the second half of 2010 and notably lower than consensus forecasts. Nevertheless, the advance estimate of second-quarter 2011 GDP, which was released on July 29, 2011, was 1.3%, suggesting that the U.S. economy continues to expand, though at a slow and uneven pace.
Jobs and housing remained troublesome.
The July 2011 unemployment rate in the U.S. was reported at 9.1%, down from 9.5% a year earlier but still notably higher than historical averages. Unfortunately,
| | | | | | |
| Letter to Shareholders | | Wells Fargo Advantage Heritage Money Market Fund | | | 3 | |
the drop may be more attributable to a decline in the labor force than to a meaningful uptick in hiring. The level of job creation in 2011 has been trending below historical averages, suggesting that the improving economy has yet to translate into widespread hiring. Meanwhile, the beleaguered housing market was an ongoing source of concern, despite some tentative late-year signs of stabilization. That said, persistent weakness in the labor and housing markets bears close watching in the months ahead.
Other economic data in the U.S. has been more encouraging, reflecting greater confidence in the sustainability of the expansion on the part of both consumers and businesses. Retail sales came in strong at certain points during the period and industrial production and new orders have picked up. Although still reluctant to hire, businesses have gradually increased spending in other areas, such as equipment and information technology. Core inflation, which excludes volatile food and energy prices, remained benign.
The Federal Reserve believes the economic recovery will accelerate in future quarters.
With inflation subdued, the Federal Open Market Committee (FOMC) held its target range for the federal funds rate—a proxy for short-term interest rates—steady at 0.00% to 0.25%. On June 22, 2011, in its final statement of the six-month period, the Federal Reserve (Fed) reiterated that the economic recovery “is proceeding at a moderate pace,” but that “recent labor market indicators have been weaker than anticipated.” It described the recent increase in inflation as temporary, suggesting that inflation pressures will ease going forward. While the FOMC explained that it “expects the pace of recovery to pick up over coming quarters,” it indicated that the federal funds rate will remain at an exceptionally low level for as long as necessary to ensure a sustainable recovery and expansion.
As recent headwinds subside, it is reasonable to expect markets to regain focus.
Now that it appears the debt ceiling has been increased and a U.S. default will be averted, money market participants and the broader bond market can get back to more fundamental and lasting concerns-chiefly, the economy. After avoiding short-term Treasuries in late July 2011, ahead of pending U.S. debt ceiling deadline, money market participants have returned to the U.S. short-term markets.1 Economic indicators released in the second half of 2011 might not be as soft as those reported during the first half of the year. While that would not mean that the economy is robust, it might remind the markets that the first half of the slowdown was transitory. Most indicators still point toward real GDP growth in the 2% to 3% range in the second half of 2011. While that is not enough to produce big employment gains, it might be sufficient to cause Treasury yields to retrace some of the late-July declines.
Don’t let short-term uncertainty derail long-term investment goals.
While periods of uncertainty can present challenges, experience has taught us that maintaining a long-term investment strategy based on individual goals and risk tolerance can be an effective way to plan for the future. As a whole, Wells Fargo Advantage Funds represents investments across a broad range of asset
| 1. | Comments expressed that do not fall within the reporting period are as of August 2, 2011. |
While the FOMC explained that it “expects the pace of recovery to pick up over coming quarters,” it indicated that the federal funds rate will remain at an exceptionally low level for as long as necessary to ensure a sustainable recovery and expansion.
Economic indicators released in the second half of 2011 might not be as soft as those reported during the first half of the year. While that would not mean that the economy is robust, it might remind the markets that the first half of the slowdown was transitory.
| | | | |
| 4 | | Wells Fargo Advantage Heritage Money Market Fund | | Letter to Shareholders |
classes and investment styles with more than 110 mutual funds, giving you an opportunity to create a diversified investment portfolio. While diversification may not prevent losses in a downturn, it may help to reduce them and provide you with one way of managing risk.
In our opinion, diligent and earnest assessment of the fundamental characteristics of money market eligible securities will be a key differentiating factor between which investment strategies meet client expectations and which do not. At Wells Fargo Advantage Funds, we intend to continue the emphasis of principal preservation and high liquidity across our lineup of Wells Fargo Advantage Money Market Funds. In changing markets, we believe it is particularly important to have diligent investment analysts in charge of investor assets.
Thank you for choosing Wells Fargo Advantage Funds. We appreciate your confidence in us and are committed to helping you meet your financial needs. If you have any questions about your investments, please contact your investment professional, call us at 1-800-222-8222, or visit www.wellsfargo.com/advantagefunds.
Sincerely,

Karla M. Rabusch
President
Wells Fargo Advantage Funds
| | | | | | |
| Performance Highlights (Unaudited) | | Wells Fargo Advantage Heritage Money Market Fund | | | 5 | |
INVESTMENT OBJECTIVE
The Fund seeks current income, while preserving capital and liquidity.
ADVISER
Wells Fargo Funds Management, LLC
SUB-ADVISER
Wells Capital Management Incorporated
PORTFOLIO MANAGERS
David D. Sylvester
Laurie White
FUND INCEPTION
June 29, 1995
| | |
PORTFOLIO COMPOSITION1
(AS OF JULY 31, 2011) | | |
|
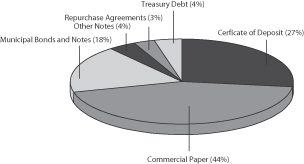 |
| | |
EFFECTIVE MATURITY DISTRIBUTION1
(AS OF JULY 31, 2011) |
|
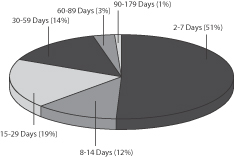 |
|
WEIGHTED AVERAGE MATURITY2 (AS OF JULY 31, 2011) |
16 Days |
|
WEIGHTED AVERAGE FINAL MATURITY3 (AS OF JULY 31, 2011) |
33 Days |
| 1. | Portfolio composition and effective maturity distribution are subject to change and are calculated based on the total investments of the Fund. Effective maturity distribution is based on the weighted average maturity of each security. |
| 2. | Weighted Average Maturity (WAM): WAM calculates an average time to maturity of all of the securities held in the portfolio, weighted by each security’s percentage of net assets. The calculation takes into account the final maturity of a fixed-income security and the interest rate reset date for floating-rate securities held in the portfolio. This is a way to measure a fund’s sensitivity to potential interest rate changes. |
| 3. | Weighted Average Final Maturity (WAFM): WAFM calculates a fund’s average time to maturity for all of the securities held in the portfolio, weighted to their percentage of assets in the Fund. In contrast to WAM, the WAFM calculation takes into account the final maturity date for each security held in the portfolio. This is a way to measure a fund’s potential sensitivity to credit spread changes. |
| | | | |
| 6 | | Wells Fargo Advantage Heritage Money Market Fund | | Performance Highlights (Unaudited) |
AVERAGE ANNUAL TOTAL RETURN4 (%) (AS OF JULY 31, 2011)
| | | | | | | | | | | | | | | | | | | | | | | | | | | | |
| | | | | | | | | Expense Ratios5 | |
| | | Inception Date | | | 6 Months* | | | 1 Year | | | 5 Year | | | 10 Year | | | Gross | | | Net6 | |
Administrator Class (SHMXX) | | | 06/29/1995 | | | | 0.00 | | | | 0.02 | | | | 2.03 | | | | 2.03 | | | | 0.34% | | | | 0.34% | |
Institutional Class (SHIXX) | | | 03/31/2000 | | | | 0.04 | | | | 0.11 | | | | 2.17 | | | | 2.20 | | | | 0.22% | | | | 0.20% | |
Select Class (WFJXX) | | | 06/29/2007 | | | | 0.07 | | | | 0.18 | | | | 2.22 | | | | 2.23 | | | | 0.18% | | | | 0.13% | |
Service Class (WHTXX)** | | | 06/30/2010 | | | | 0.00 | | | | 0.01 | | | | 2.03 | | | | 2.02 | | | | 0.51% | | | | 0.43% | |
| * | Returns for periods of less than one year are not annualized. |
| ** | Service Class shares are closed to new investors. |
| | | | | | | | | | | | | | | | |
FUND YIELD SUMMARY6 (AS OF JULY 31, 2011) | | Administrator
Class | | | Institutional
Class | | | Select
Class | | | Service
Class | |
7-Day Current Yield | | | 0.01% | | | | 0.01% | | | | 0.08% | | | | 0.01% | |
7-Day Compound Yield | | | 0.01% | | | | 0.01% | | | | 0.08% | | | | 0.01% | |
30-Day Simple Yield | | | 0.01% | | | | 0.01% | | | | 0.07% | | | | 0.01% | |
30-Day Compound Yield | | | 0.01% | | | | 0.01% | | | | 0.07% | | | | 0.01% | |
Figures quoted represent past performance, which is no guarantee of future results and do not reflect the deduction of taxes that a shareholder may pay on fund distributions or the redemption of fund shares. Investment returns will fluctuate. The Fund’s yield figures more closely reflect the current earnings of the Fund than the total return figures. Current performance may be lower or higher than the performance data quoted. Current month-end performance is available at the Fund’s Web site – www.wellsfargo.com/advantagefunds.
Each class is sold without a front-end sales charge or contingent deferred sales charge. Other fees and expenses apply to an investment in the Fund and are described in the Fund’s current prospectus.
An investment in a money market fund is not insured or guaranteed by the Federal Deposit Insurance Corporation or any other government agency. Although the Fund seeks to preserve the value of your investment at $1.00 per share, it is possible to lose money by investing in a money market fund.
| 4. | Historical performance shown for the Select Class shares prior to their inception reflects the performance of the Institutional Class shares, and includes the higher expenses applicable to Institutional Class shares. If these expenses had not been included, returns would be higher. Historical performance shown for the Service Class shares prior to their inception reflects the performance of the Administrator Class shares and includes the higher expenses that are applicable to Administrator Class shares. If these expenses had not been included, returns would be higher. |
| 5. | Reflects the expense ratios as stated in the most recent prospectuses. |
| 6. | The Adviser has committed through July 11, 2013 to waive fees and/or reimburse expenses to the extent necessary to cap the Fund’s Total Annual Fund Operating Expenses After Fee Waiver, excluding certain expenses, at 0.35% for Administrator Class, 0.20% for Institutional Class, 0.13% for Select Class and 0.43% for Service Class. Without this cap, the Fund’s returns would have been lower. Without waived fees and/or reimbursed expenses, the Fund’s 7-day current yield would have been (0.14)%, (0.02)%, 0.02% and (0.31)% for Administrator Class, Institutional Class, Select Class and Service Class, respectively. |
| | | | | | |
| Fund Expenses | | Wells Fargo Advantage Heritage Money Market Fund | | | 7 | |
As a shareholder of the Fund, you incur two types of costs: (1) transaction costs and (2) ongoing costs, including management fees; shareholder service fees; and other Fund expenses. This example is intended to help you understand your ongoing costs (in dollars) of investing in the Fund and to compare these costs with the ongoing costs of investing in other mutual funds.
The example is based on an investment of $1,000 invested at the beginning of the six-month period and held for the entire period from February 1, 2011 to July 31, 2011.
Actual Expenses
The “Actual” line of the table below provides information about actual account values and actual expenses. You may use the information in this line, together with the amount you invested, to estimate the expenses that you paid over the period. Simply divide your account value by $1,000 (for example, an $8,600 account value divided by $1,000 = 8.6), then multiply the result by the number in the “Actual” line under the heading entitled “Expenses Paid During Period” for your applicable class of shares to estimate the expenses you paid on your account during this period.
Hypothetical Example for Comparison Purposes
The “Hypothetical” line of the table below provides information about hypothetical account values and hypothetical expenses based on the Fund’s actual expense ratio and an assumed rate of return of 5% per year before expenses, which is not the Fund’s actual return. The hypothetical account values and expenses may not be used to estimate the actual ending account balance or expenses you paid for the period. You may use this information to compare the ongoing costs of investing in the Fund and other funds. To do so, compare this 5% hypothetical example with the 5% hypothetical examples that appear in the shareholder reports of the other funds.
Please note that the expenses shown in the table are meant to highlight your ongoing costs only and do not reflect any transactional costs. Therefore, the “Hypothetical” line of the table is useful in comparing ongoing costs only, and will not help you determine the relative total costs of owning different funds. In addition, if these transactional costs were included, your costs would have been higher.
| | | | | | | | | | | | | | | | |
| | | Beginning
Account Value
02-01-2011 | | | Ending
Account Value
07-31-2011 | | | Expenses
Paid During
the Period¹ | | | Net Annual
Expense Ratio | |
Administrator Class | | | | | | | | | | | | | | | | |
Actual | | $ | 1,000.00 | | | $ | 1,000.05 | | | $ | 1.29 | | | | 0.26 | % |
Hypothetical (5% return before expenses) | | $ | 1,000.00 | | | $ | 1,023.51 | | | $ | 1.30 | | | | 0.26 | % |
Institutional Class | | | | | | | | | | | | | | | | |
Actual | | $ | 1,000.00 | | | $ | 1,000.35 | | | $ | 0.99 | | | | 0.20 | % |
Hypothetical (5% return before expenses) | | $ | 1,000.00 | | | $ | 1,023.80 | | | $ | 1.00 | | | | 0.20 | % |
Select Class | | | | | | | | | | | | | | | | |
Actual | | $ | 1,000.00 | | | $ | 1,000.69 | | | $ | 0.64 | | | | 0.13 | % |
Hypothetical (5% return before expenses) | | $ | 1,000.00 | | | $ | 1,024.15 | | | $ | 0.65 | | | | 0.13 | % |
Service Class | | | | | | | | | | | | | | | | |
Actual | | $ | 1,000.00 | | | $ | 1,000.05 | | | $ | 1.29 | | | | 0.26 | % |
Hypothetical (5% return before expenses) | | $ | 1,000.00 | | | $ | 1,023.51 | | | $ | 1.30 | | | | 0.26 | % |
| 1. | Expenses paid is equal to the annualized expense ratio of each class multiplied by the average account value over the period, multiplied by the number of days in the most recent fiscal half-year divided by the number of days in the fiscal year (to reflect the one-half year period). |
| | | | |
| 8 | | Wells Fargo Advantage Heritage Money Market Fund | | Portfolio of Investments—July 31, 2011 (Unaudited) |
| | | | | | | | | | | | | | | | |
| Security Name | | Interest Rate | | | Maturity Date | | | Principal | | | Value | |
| | | | | | | | | | | | | | | | |
| | | | |
| Certificates of Deposit: 24.89% | | | | | | | | | | | | | | | | |
Banco Del Estado De Chile | | | 0.21 | % | | | 08/04/2011 | | | $ | 67,000,000 | | | $ | 67,000,000 | |
Bank of Montreal | | | 0.11 | | | | 08/23/2011 | | | | 146,000,000 | | | | 146,000,000 | |
Bank of Montreal | | | 0.12 | | | | 08/24/2011 | | | | 109,000,000 | | | | 109,000,000 | |
Bank of Montreal | | | 0.12 | | | | 08/26/2011 | | | | 71,000,000 | | | | 71,000,000 | |
Bank of Nova Scotia± | | | 0.22 | | | | 08/09/2011 | | | | 32,000,000 | | | | 32,000,000 | |
Barclays Bank plc (New York)± | | | 0.74 | | | | 08/12/2011 | | | | 173,000,000 | | | | 173,000,000 | |
Barclays Bank plc (New York)± | | | 0.59 | | | | 04/16/2012 | | | | 101,000,000 | | | | 101,000,000 | |
Barclays Bank plc (New York)± | | | 0.65 | | | | 01/17/2012 | | | | 262,000,000 | | | | 262,000,000 | |
Barclays Bank plc (New York)± | | | 0.69 | | | | 10/24/2011 | | | | 86,000,000 | | | | 86,000,000 | |
BNP Paribas | | | 0.13 | | | | 08/01/2011 | | | | 587,650,000 | | | | 587,650,000 | |
Commerzbank (London) | | | 0.15 | | | | 08/01/2011 | | | | 561,000,000 | | | | 561,000,000 | |
Credit Agricole | | | 0.16 | | | | 08/01/2011 | | | | 520,000,000 | | | | 520,000,000 | |
Credit Agricole | | | 0.23 | | | | 08/12/2011 | | | | 78,000,000 | | | | 78,000,000 | |
Credit Agricole | | | 0.23 | | | | 08/15/2011 | | | | 121,000,000 | | | | 121,000,000 | |
Credit Industriel et Commercial | | | 0.11 | | | | 08/01/2011 | | | | 203,000,000 | | | | 203,000,000 | |
Credit Suisse (New York)± | | | 0.25 | | | | 09/02/2011 | | | | 163,000,000 | | | | 163,001,252 | |
DG Bank (New York) | | | 0.23 | | | | 08/15/2011 | | | | 235,000,000 | | | | 235,000,000 | |
Groupe BPCE | | | 0.13 | | | | 08/01/2011 | | | | 561,000,000 | | | | 561,000,000 | |
KBC Bank NV Brussels | | | 0.15 | | | | 08/01/2011 | | | | 476,000,000 | | | | 476,000,000 | |
National Bank of Canada± | | | 0.35 | | | | 09/21/2011 | | | | 126,000,000 | | | | 126,000,000 | |
National Bank of Canada± | | | 0.36 | | | | 10/07/2011 | | | | 224,000,000 | | | | 224,000,000 | |
Natixis (New York)± | | | 0.34 | | | | 08/15/2011 | | | | 155,000,000 | | | | 155,001,857 | |
Natixis (New York)± | | | 0.50 | | | | 08/08/2011 | | | | 224,000,000 | | | | 224,000,000 | |
Nordea Bank Finland plc± | | | 0.55 | | | | 10/14/2011 | | | | 38,970,000 | | | | 38,993,666 | |
Nordea Bank Finland plc± | | | 0.55 | | | | 10/20/2011 | | | | 25,000,000 | | | | 25,020,757 | |
Nordea Bank Funding plc | | | 0.15 | | | | 09/14/2011 | | | | 111,000,000 | | | | 111,000,000 | |
Nordea Bank Funding plc | | | 0.15 | | | | 09/19/2011 | | | | 113,000,000 | | | | 113,000,000 | |
Norinchukin Bank | | | 0.15 | | | | 08/01/2011 | | | | 128,000,000 | | | | 128,000,000 | |
Norinchukin Bank | | | 0.15 | | | | 08/02/2011 | | | | 216,000,000 | | | | 216,000,000 | |
Rabobank Nederland NV± | | | 0.27 | | | | 12/06/2011 | | | | 131,000,000 | | | | 131,000,000 | |
Rabobank Nederland NV± | | | 0.27 | | | | 01/10/2012 | | | | 147,000,000 | | | | 147,000,000 | |
Rabobank Nederland NV | | | 0.27 | | | | 10/21/2011 | | | | 108,000,000 | | | | 108,000,000 | |
Rabobank Nederland NV | | | 0.28 | | | | 04/24/2012 | | | | 248,000,000 | | | | 247,990,792 | |
Rabobank Nederland NV± | | | 0.29 | | | | 08/08/2011 | | | | 100,000,000 | | | | 100,002,401 | |
Royal Bank of Scotland plc± | | | 0.44 | | | | 10/31/2011 | | | | 317,000,000 | | | | 317,000,000 | |
Royal Bank of Scotland plc± | | | 0.47 | | | | 09/13/2011 | | | | 251,000,000 | | | | 251,000,000 | |
Skandinaviska Enskilda Banken AB | | | 0.20 | | | | 09/15/2011 | | | | 122,000,000 | | | | 122,000,000 | |
Skandinaviska Enskilda Banken AB | | | 0.20 | | | | 09/19/2011 | | | | 56,000,000 | | | | 56,000,000 | |
Skandinaviska Enskilda Banken AB | | | 0.24 | | | | 09/01/2011 | | | | 228,000,000 | | | | 228,000,000 | |
Societe Generale (New York) | | | 0.51 | | | | 08/12/2011 | | | | 245,000,000 | | | | 245,000,000 | |
Sumitomo Trust & Banking Corporation | | | 0.14 | | | | 08/03/2011 | | | | 464,000,000 | | | | 464,000,000 | |
Sumitomo Trust & Banking Corporation | | | 0.15 | | | | 08/02/2011 | | | | 246,000,000 | | | | 246,000,000 | |
Sumitomo Trust & Banking Corporation | | | 0.15 | | | | 08/04/2011 | | | | 65,000,000 | | | | 65,000,000 | |
Svenska Handsbanken AB | | | 0.17 | | | | 08/04/2011 | | | | 75,000,000 | | | | 75,000,031 | |
Toronto-Dominion Bank | | | 0.12 | | | | 08/19/2011 | | | | 120,000,000 | | | | 120,000,000 | |
Toronto-Dominion Bank | | | 0.12 | | | | 08/22/2011 | | | | 102,000,000 | | | | 102,000,000 | |
Toronto-Dominion Bank | | | 0.17 | | | | 08/02/2011 | | | | 27,000,000 | | | | 27,000,045 | |
Toronto-Dominion Bank± | | | 0.27 | | | | 01/12/2012 | | | | 167,000,000 | | | | 167,000,000 | |
| | | | |
Total Certificates of Deposit (Cost $9,132,660,801) | | | | | | | | | | | | | | | 9,132,660,801 | |
| | | | | | | | | | | | | | | | |
| | | | | | |
| Portfolio of Investments—July 31, 2011 (Unaudited) | | Wells Fargo Advantage Heritage Money Market Fund | | | 9 | |
| | | | | | | | | | | | | | | | |
| Security Name | | Interest Rate | | | Maturity Date | | | Principal | | | Value | |
| | | | | | | | | | | | | | | | |
| | | | |
Commercial Paper: 40.93% | | | | | | | | | | | | | | | | |
| | | | |
| Asset-Backed Commercial Paper: 27.35% | | | | | | | | | | | | | | | | |
Alpine Securitzation Corporation††^ | | | 0.13 | % | | | 08/19/2011 | | | $ | 158,000,000 | | | $ | 157,988,940 | |
Alpine Securitzation Corporation††^ | | | 0.13 | | | | 08/23/2011 | | | | 25,000,000 | | | | 24,997,861 | |
Amsterdam Funding Corporation††^ | | | 0.15 | | | | 08/25/2011 | | | | 13,000,000 | | | | 12,998,613 | |
Amsterdam Funding Corporation††^ | | | 0.15 | | | | 08/30/2011 | | | | 53,000,000 | | | | 52,993,169 | |
Amsterdam Funding Corporation††^ | | | 0.22 | | | | 08/22/2011 | | | | 27,000,000 | | | | 26,996,378 | |
Antalis US Funding Corporation††^ | | | 0.00 | | | | 08/01/2011 | | | | 497,000,000 | | | | 497,000,000 | |
Arabella Finance LLC††^ | | | 0.38 | | | | 08/08/2011 | | | | 68,500,000 | | | | 68,494,272 | |
Argento Funding Companies Limited††^ | | | 0.17 | | | | 08/24/2011 | | | | 51,000,000 | | | | 50,993,675 | |
Argento Funding Companies Limited††^ | | | 0.19 | | | | 08/04/2011 | | | | 37,000,000 | | | | 36,999,229 | |
Argento Funding Companies Limited††^ | | | 0.21 | | | | 09/07/2011 | | | | 129,000,000 | | | | 128,970,830 | |
Argento Funding Companies Limited††^ | | | 0.21 | | | | 09/09/2011 | | | | 43,000,000 | | | | 42,989,751 | |
Argento Funding Companies Limited††^ | | | 0.22 | | | | 08/11/2011 | | | | 19,000,000 | | | | 18,998,733 | |
Argento Funding Companies Limited††^ | | | 0.23 | | | | 08/09/2011 | | | | 107,000,000 | | | | 106,993,817 | |
Argento Funding Companies Limited††^ | | | 0.23 | | | | 08/17/2011 | | | | 57,000,000 | | | | 56,993,920 | |
Argento Funding Companies Limited††^ | | | 0.29 | | | | 08/08/2011 | | | | 99,000,000 | | | | 98,993,647 | |
Argento Funding Companies Limited††^ | | | 0.19 | | | | 08/22/2011 | | | | 9,000,000 | | | | 8,998,950 | |
Aspen Funding Corporation††^ | | | 0.16 | | | | 08/11/2011 | | | | 19,000,000 | | | | 18,999,050 | |
Atlantic Asset Securitization Corporation††^ | | | 0.11 | | | | 08/02/2011 | | | | 91,000,000 | | | | 90,999,444 | |
Autobahn Funding Company LLC††^ | | | 0.00 | | | | 08/01/2011 | | | | 7,000,000 | | | | 7,000,000 | |
Autobahn Funding Company LLC††^ | | | 0.27 | | | | 08/15/2011 | | | | 29,000,000 | | | | 28,996,729 | |
Barton Capital Corporation††^ | | | 0.00 | | | | 08/01/2011 | | | | 634,652,000 | | | | 634,652,000 | |
Bryant Park Funding LLC††^ | | | 0.14 | | | | 08/22/2011 | | | | 136,813,000 | | | | 136,801,029 | |
CAFCO LLC††^ | | | 0.17 | | | | 09/20/2011 | | | | 7,000,000 | | | | 6,998,347 | |
Cancara Asset Securitization LLC††^ | | | 0.15 | | | | 08/10/2011 | | | | 20,000,000 | | | | 19,999,150 | |
Cancara Asset Securitization LLC††^ | | | 0.16 | | | | 08/24/2011 | | | | 60,000,000 | | | | 59,993,483 | |
Cancara Asset Securitization LLC††^ | | | 0.18 | | | | 08/30/2011 | | | | 93,000,000 | | | | 92,985,766 | |
Cancara Asset Securitization LLC††^ | | | 0.20 | | | | 09/07/2011 | | | | 35,100,000 | | | | 35,092,424 | |
Cancara Asset Securitization LLC††^ | | | 0.21 | | | | 08/08/2011 | | | | 84,000,000 | | | | 83,996,080 | |
Cancara Asset Securitization LLC††^ | | | 0.21 | | | | 08/12/2011 | | | | 44,000,000 | | | | 43,996,908 | |
Cancara Asset Securitization LLC††^ | | | 0.21 | | | | 09/20/2011 | | | | 96,000,000 | | | | 95,972,000 | |
Chariot Funding LLC††^ | | | 0.12 | | | | 08/15/2011 | | | | 206,227,000 | | | | 206,216,209 | |
Chariot Funding LLC††^ | | | 0.12 | | | | 08/17/2011 | | | | 7,000,000 | | | | 6,999,596 | |
Charta LLC††^ | | | 0.19 | | | | 09/09/2011 | | | | 23,000,000 | | | | 22,995,266 | |
Charta LLC††^ | | | 0.25 | | | | 10/06/2011 | | | | 13,000,000 | | | | 12,994,042 | |
Concord Minuteman Capital Company††^ | | | 0.36 | | | | 08/09/2011 | | | | 52,000,000 | | | | 51,995,378 | |
Concord Minuteman Capital Company††^ | | | 0.38 | | | | 08/16/2011 | | | | 32,000,000 | | | | 31,994,667 | |
Concord Minuteman Capital Company††^ | | | 0.38 | | | | 08/17/2011 | | | | 2,000,000 | | | | 1,999,644 | |
Concord Minuteman Capital Company††^ | | | 0.39 | | | | 08/26/2011 | | | | 53,000,000 | | | | 52,985,278 | |
Concord Minuteman Capital Company††^ | | | 0.39 | | | | 08/29/2011 | | | | 83,000,000 | | | | 82,974,178 | |
Concord Minutemen Capital Company††^ | | | 0.20 | | | | 08/02/2011 | | | | 175,000,000 | | | | 174,998,056 | |
CRC Funding LLC††^ | | | 0.16 | | | | 09/21/2011 | | | | 36,000,000 | | | | 35,991,840 | |
CRC Funding LLC††^ | | | 0.17 | | | | 09/19/2011 | | | | 4,000,000 | | | | 3,999,074 | |
Crown Point Capital Company††^ | | | 0.27 | | | | 08/03/2011 | | | | 121,000,000 | | | | 120,997,311 | |
Crown Point Capital Company††^ | | | 0.32 | | | | 08/05/2011 | | | | 71,000,000 | | | | 70,996,844 | |
Crown Point Capital Company††^ | | | 0.36 | | | | 08/10/2011 | | | | 48,000,000 | | | | 47,995,200 | |
Crown Point Capital Company††^ | | | 0.36 | | | | 08/11/2011 | | | | 49,000,000 | | | | 48,994,556 | |
Crown Point Capital Company††^ | | | 0.37 | | | | 08/12/2011 | | | | 39,000,000 | | | | 38,995,233 | |
Crown Point Capital Company††^ | | | 0.38 | | | | 08/17/2011 | | | | 38,000,000 | | | | 37,993,244 | |
Crown Point Capital Company††^ | | | 0.38 | | | | 08/18/2011 | | | | 70,000,000 | | | | 69,986,778 | |
Crown Point Capital Company††^ | | | 0.38 | | | | 08/19/2011 | | | | 22,000,000 | | | | 21,995,600 | |
| | | | |
| 10 | | Wells Fargo Advantage Heritage Money Market Fund | | Portfolio of Investments—July 31, 2011 (Unaudited) |
| | | | | | | | | | | | | | | | |
| Security Name | | Interest Rate | | | Maturity Date | | | Principal | | | Value | |
| | | | | | | | | | | | | | | | |
| | | | |
| Asset-Backed Commercial Paper (continued) | | | | | | | | | | | | | | | | |
Crown Point Capital Company††^ | | | 0.39 | % | | | 08/26/2011 | | | $ | 14,000,000 | | | $ | 13,996,111 | |
Falcon Asset Securitization Corporation LLC††^ | | | 0.10 | | | | 08/05/2011 | | | | 69,371,000 | | | | 69,369,998 | |
Falcon Asset Securitization Corporation LLC††^ | | | 0.13 | | | | 08/18/2011 | | | | 18,000,000 | | | | 17,998,810 | |
Gemini Securitization Corporation LLC††^ | | | 0.15 | | | | 08/03/2011 | | | | 98,036,000 | | | | 98,034,761 | |
Gemini Securitization Corporation LLC††^ | | | 0.16 | | | | 08/09/2011 | | | | 74,040,000 | | | | 74,037,038 | |
Gemini Securitization Corporation LLC††^ | | | 0.17 | | | | 08/04/2011 | | | | 13,000,000 | | | | 12,999,751 | |
Govco LLC††^ | | | 0.21 | | | | 08/22/2011 | | | | 25,000,000 | | | | 24,996,792 | |
Grampian Funding LLC††^ | | | 0.17 | | | | 08/16/2011 | | | | 98,000,000 | | | | 97,992,650 | |
Grampian Funding LLC††^ | | | 0.17 | | | | 08/17/2011 | | | | 85,000,000 | | | | 84,993,200 | |
Grampian Funding LLC††^ | | | 0.17 | | | | 08/25/2011 | | | | 75,000,000 | | | | 74,991,000 | |
Grampian Funding LLC††^ | | | 0.23 | | | | 08/15/2011 | | | | 111,000,000 | | | | 110,989,030 | |
Grampian Funding LLC††^ | | | 0.24 | | | | 08/10/2011 | | | | 87,000,000 | | | | 86,993,643 | |
Grampian Funding LLC††^ | | | 0.34 | | | | 09/02/2011 | | | | 91,000,000 | | | | 91,009,176 | |
Grampian Funding LLC††^ | | | 0.23 | | | | 08/11/2011 | | | | 104,000,000 | | | | 103,992,778 | |
Jupiter Securitization Company LLC††^ | | | 0.12 | | | | 08/15/2011 | | | | 66,227,000 | | | | 66,223,652 | |
Jupiter Securitization Company LLC††^ | | | 0.12 | | | | 08/17/2011 | | | | 7,000,000 | | | | 6,999,596 | |
Jupiter Securitization Company LLC††^ | | | 0.13 | | | | 08/12/2011 | | | | 10,134,000 | | | | 10,133,566 | |
Kells Funding LLC†† | | | 0.30 | | | | 12/16/2011 | | | | 117,000,000 | | | | 117,000,000 | |
Kells Funding LLC±†† | | | 0.33 | | | | 11/29/2011 | | | | 246,000,000 | | | | 246,000,000 | |
Kells Funding LLC±†† | | | 0.34 | | | | 02/21/2012 | | | | 229,000,000 | | | | 229,000,000 | |
Legacy Capital Company LLC††^ | | | 0.37 | | | | 08/12/2011 | | | | 64,000,000 | | | | 63,992,178 | |
Legacy Capital Company LLC††^ | | | 0.39 | | | | 08/26/2011 | | | | 26,000,000 | | | | 25,992,778 | |
Lexington Parker Capital Company LLC††^ | | | 0.35 | | | | 08/08/2011 | | | | 47,000,000 | | | | 46,996,344 | |
Lexington Parker Capital Company LLC††^ | | | 0.36 | | | | 08/11/2011 | | | | 47,000,000 | | | | 46,994,778 | |
Lexington Parker Capital Company LLC††^ | | | 0.38 | | | | 08/16/2011 | | | | 65,000,000 | | | | 64,989,167 | |
Lexington Parker Capital Company LLC††^ | | | 0.38 | | | | 08/19/2011 | | | | 54,000,000 | | | | 53,989,200 | |
Lexington Parker Capital Company LLC††^ | | | 0.38 | | | | 08/22/2011 | | | | 58,000,000 | | | | 57,986,467 | |
Lexington Parker Capital Company LLC††^ | | | 0.38 | | | | 08/23/2011 | | | | 77,000,000 | | | | 76,981,178 | |
LMA Americas LLC††^ | | | 0.00 | | | | 08/01/2011 | | | | 570,000,000 | | | | 570,000,000 | |
LMA Americas LLC††^ | | | 0.22 | | | | 08/16/2011 | | | | 51,000,000 | | | | 50,995,113 | |
LMA Americas LLC††^ | | | 0.22 | | | | 08/24/2011 | | | | 8,000,000 | | | | 7,998,824 | |
LMA Americas LLC††^ | | | 0.24 | | | | 08/30/2011 | | | | 30,100,000 | | | | 30,093,938 | |
Matchpoint Master Trust††^ | | | 0.00 | | | | 08/01/2011 | | | | 414,000,000 | | | | 414,000,000 | |
Metlife Short Term Funding LLC††^ | | | 0.14 | | | | 08/17/2011 | | | | 24,000,000 | | | | 23,998,400 | |
Metlife Short Term Funding LLC††^ | | | 0.14 | | | | 08/18/2011 | | | | 93,000,000 | | | | 92,993,413 | |
Metlife Short Term Funding LLC††^ | | | 0.14 | | | | 08/19/2011 | | | | 16,000,000 | | | | 15,998,800 | |
Metlife Short Term Funding LLC††^ | | | 0.20 | | | | 08/09/2011 | | | | 15,000,000 | | | | 14,999,233 | |
Metlife Short Term Funding LLC††^ | | | 0.21 | | | | 08/11/2011 | | | | 37,500,000 | | | | 37,497,604 | |
Metlife Short Term Funding LLC††^ | | | 0.21 | | | | 08/12/2011 | | | | 23,000,000 | | | | 22,998,384 | |
Metlife Short Term Funding LLC††^ | | | 0.21 | | | | 08/15/2011 | | | | 30,000,000 | | | | 29,997,317 | |
Mont Blanc Capital Corporation††^ | | | 0.19 | | | | 08/08/2011 | | | | 32,000,000 | | | | 31,998,631 | |
Mont Blanc Capital Corporation††^ | | | 0.20 | | | | 09/06/2011 | | | | 131,063,000 | | | | 131,035,477 | |
Mont Blanc Capital Corporation††^ | | | 0.20 | | | | 09/07/2011 | | | | 16,000,000 | | | | 15,996,547 | |
Mont Blanc Capital Corporation††^ | | | 0.20 | | | | 09/09/2011 | | | | 12,000,000 | | | | 11,997,270 | |
Nieuw Amsterdam Receivables Corporation††^ | | | 0.15 | | | | 08/03/2011 | | | | 26,000,000 | | | | 25,999,668 | |
Nieuw Amsterdam Receivables Corporation††^ | | | 0.15 | | | | 08/26/2011 | | | | 40,000,000 | | | | 39,995,556 | |
Nieuw Amsterdam Receivables Corporation††^ | | | 0.17 | | | | 08/04/2011 | | | | 46,000,000 | | | | 45,999,118 | |
Nieuw Amsterdam Receivables Corporation††^ | | | 0.18 | | | | 08/05/2011 | | | | 15,000,000 | | | | 14,999,633 | |
Nieuw Amsterdam Receivables Corporation††^ | | | 0.18 | | | | 08/16/2011 | | | | 57,000,000 | | | | 56,995,488 | |
Nieuw Amsterdam Receivables Corporation††^ | | | 0.18 | | | | 09/08/2011 | | | | 27,000,000 | | | | 26,994,870 | |
Nieuw Amsterdam Receivables Corporation††^ | | | 0.18 | | | | 09/22/2011 | | | | 30,000,000 | | | | 29,992,200 | |
| | | | | | |
| Portfolio of Investments—July 31, 2011 (Unaudited) | | Wells Fargo Advantage Heritage Money Market Fund | | | 11 | |
| | | | | | | | | | | | | | | | |
| Security Name | | Interest Rate | | | Maturity Date | | | Principal | | | Value | |
| | | | | | | | | | | | | | | | |
| | | | |
| Asset-Backed Commercial Paper (continued) | | | | | | | | | | | | | | | | |
Nieuw Amsterdam Receivables Corporation††^ | | | 0.20 | % | | | 08/09/2011 | | | $ | 37,000,000 | | | $ | 36,998,191 | |
Northern Pines Funding LLC††^ | | | 0.26 | | | | 08/08/2011 | | | | 49,000,000 | | | | 48,997,142 | |
Northern Pines Funding LLC††^ | | | 0.30 | | | | 08/23/2011 | | | | 101,000,000 | | | | 100,980,866 | |
Old Line Funding LLC††^ | | | 0.14 | | | | 08/29/2011 | | | | 32,000,000 | | | | 31,996,516 | |
Regency Markets #1 LLC††^ | | | 0.14 | | | | 08/11/2011 | | | | 23,000,000 | | | | 22,999,042 | |
Regency Markets #1 LLC††^ | | | 0.14 | | | | 08/15/2011 | | | | 114,275,000 | | | | 114,268,334 | |
Regency Markets #1 LLC††^ | | | 0.14 | | | | 08/17/2011 | | | | 62,000,000 | | | | 61,995,867 | |
Regency Markets #1 LLC††^ | | | 0.15 | | | | 08/25/2011 | | | | 127,000,000 | | | | 126,986,453 | |
Rhein-Main Security Limited††^ | | | 0.41 | | | | 09/13/2011 | | | | 29,159,000 | | | | 29,144,372 | |
Rheingold Securitization Limited††^ | | | 0.41 | | | | 09/06/2011 | | | | 64,218,000 | | | | 64,191,028 | |
Rheingold Securitization Limited††^ | | | 0.41 | | | | 09/16/2011 | | | | 76,900,000 | | | | 76,858,730 | |
Salisbury Receivables Company LLC††^ | | | 0.14 | | | | 08/24/2011 | | | | 7,000,000 | | | | 6,999,329 | |
Salisbury Receivables Company LLC††^ | | | 0.15 | | | | 08/12/2011 | | | | 14,750,000 | | | | 14,749,279 | |
Salisbury Receivables Company LLC††^ | | | 0.15 | | | | 08/15/2011 | | | | 7,000,000 | | | | 6,999,564 | |
Salisbury Receivables Company LLC††^ | | | 0.15 | | | | 08/19/2011 | | | | 20,000,000 | | | | 19,998,400 | |
Scaldis Capital LLC††^ | | | 0.00 | | | | 08/01/2011 | | | | 17,675,000 | | | | 17,675,000 | |
Scaldis Capital LLC††^ | | | 0.20 | | | | 08/09/2011 | | | | 28,000,000 | | | | 27,998,631 | |
Sheffield Receivables Corporation††^ | | | 0.17 | | | | 09/21/2011 | | | | 45,200,000 | | | | 45,189,114 | |
Sheffield Receivables Corporation††^ | | | 0.14 | | | | 08/25/2011 | | | | 9,000,000 | | | | 8,999,100 | |
Sheffield Receivables Corporation††^ | | | 0.15 | | | | 08/15/2011 | | | | 13,400,000 | | | | 13,399,166 | |
Sheffield Receivables Corporation††^ | | | 0.17 | | | | 09/23/2011 | | | | 3,000,000 | | | | 2,999,249 | |
Sheffield Receivables Corporation††^ | | | 0.17 | | | | 09/26/2011 | | | | 16,000,000 | | | | 15,995,769 | |
Sheffield Receivables Corporation††^ | | | 0.17 | | | | 09/27/2011 | | | | 55,000,000 | | | | 54,985,196 | |
Sheffield Receivables Corporation††^ | | | 0.18 | | | | 10/03/2011 | | | | 15,000,000 | | | | 14,995,275 | |
Solitaire Funding LLC††^ | | | 0.15 | | | | 08/16/2011 | | | | 25,000,000 | | | | 24,998,333 | |
Solitaire Funding LLC††^ | | | 0.15 | | | | 08/18/2011 | | | | 192,000,000 | | | | 191,985,493 | |
Solitaire Funding LLC††^ | | | 0.15 | | | | 08/22/2011 | | | | 15,000,000 | | | | 14,998,600 | |
Solitaire Funding LLC††^ | | | 0.15 | | | | 08/23/2011 | | | | 47,000,000 | | | | 46,995,404 | |
Solitaire Funding LLC††^ | | | 0.15 | | | | 08/24/2011 | | | | 19,000,000 | | | | 18,998,058 | |
Solitaire Funding LLC††^ | | | 0.15 | | | | 08/25/2011 | | | | 124,000,000 | | | | 123,986,774 | |
Solitaire Funding LLC††^ | | | 0.16 | | | | 08/30/2011 | | | | 38,000,000 | | | | 37,994,796 | |
Solitaire Funding LLC††^ | | | 0.20 | | | | 09/09/2011 | | | | 42,000,000 | | | | 41,990,445 | |
Solitaire Funding LLC††^ | | | 0.21 | | | | 08/09/2011 | | | | 62,000,000 | | | | 61,996,693 | |
Solitaire Funding LLC††^ | | | 0.21 | | | | 09/02/2011 | | | | 29,000,000 | | | | 28,994,329 | |
Solitaire Funding LLC††^ | | | 0.21 | | | | 09/12/2011 | | | | 14,000,000 | | | | 13,996,570 | |
Surrey Funding Corporation††^ | | | 0.14 | | | | 08/09/2011 | | | | 14,000,000 | | | | 13,999,502 | |
Surrey Funding Corporation††^ | | | 0.15 | | | | 08/30/2011 | | | | 8,000,000 | | | | 7,998,969 | |
Sydney Capital Corporation††^ | | | 0.30 | | | | 08/10/2011 | | | | 23,000,000 | | | | 22,998,103 | |
Sydney Capital Corporation††^ | | | 0.30 | | | | 08/16/2011 | | | | 13,000,000 | | | | 12,998,267 | |
Sydney Capital Corporation††^ | | | 0.34 | | | | 09/12/2011 | | | | 16,000,000 | | | | 15,993,467 | |
Tasman Funding Incorporated††^ | | | 0.16 | | | | 08/11/2011 | | | | 24,177,000 | | | | 24,175,791 | |
Tasman Funding Incorporated††^ | | | 0.18 | | | | 08/16/2011 | | | | 29,000,000 | | | | 28,997,704 | |
Tasman Funding Incorporated††^ | | | 0.18 | | | | 08/18/2011 | | | | 4,000,000 | | | | 3,999,641 | |
Tasman Funding Incorporated††^ | | | 0.18 | | | | 08/24/2011 | | | | 6,000,000 | | | | 5,999,272 | |
Tasman Funding Incorporated††^ | | | 0.20 | | | | 08/08/2011 | | | | 32,039,000 | | | | 32,037,567 | |
Tasman Funding Incorporated††^ | | | 0.23 | | | | 08/17/2011 | | | | 45,000,000 | | | | 44,995,200 | |
Thames Asset Global Securitization #1 Incorporated††^ | | | 0.14 | | | | 08/10/2011 | | | | 155,106,000 | | | | 155,099,318 | |
Thames Asset Global Securitization #1 Incorporated††^ | | | 0.15 | | | | 08/12/2011 | | | | 9,000,000 | | | | 8,999,560 | |
Thames Asset Global Securitization #1 Incorporated††^ | | | 0.15 | | | | 08/17/2011 | | | | 13,000,000 | | | | 12,999,076 | |
Thames Asset Global Securitization #1 Incorporated††^ | | | 0.15 | | | | 08/18/2011 | | | | 67,000,000 | | | | 66,994,706 | |
Thames Asset Global Securitization #1 Incorporated††^ | | | 0.16 | | | | 08/23/2011 | | | | 4,570,000 | | | | 4,569,525 | |
| | | | |
| 12 | | Wells Fargo Advantage Heritage Money Market Fund | | Portfolio of Investments—July 31, 2011 (Unaudited) |
| | | | | | | | | | | | | | | | |
| Security Name | | Interest Rate | | | Maturity Date | | | Principal | | | Value | |
| | | | | | | | | | | | | | | | |
| | | | |
| Asset-Backed Commercial Paper (continued) | | | | | | | | | | | | | | | | |
Thames Asset Global Securitization #1 Incorporated††^ | | | 0.16 | % | | | 08/25/2011 | | | $ | 9,000,000 | | | $ | 8,998,980 | |
Versailles CDS LLC††^ | | | 0.20 | | | | 08/05/2011 | | | | 118,000,000 | | | | 117,996,722 | |
Windmill Funding Corporation††^ | | | 0.11 | | | | 08/04/2011 | | | | 15,000,000 | | | | 14,999,813 | |
Windmill Funding Corporation††^ | | | 0.12 | | | | 08/03/2011 | | | | 8,050,000 | | | | 8,049,920 | |
Windmill Funding Corporation††^ | | | 0.15 | | | | 08/23/2011 | | | | 60,000,000 | | | | 59,994,133 | |
Windmill Funding Corporation††^ | | | 0.15 | | | | 08/30/2011 | | | | 10,000,000 | | | | 9,998,711 | |
Windmill Funding Corporation††^ | | | 0.22 | | | | 08/22/2011 | | | | 45,000,000 | | | | 44,993,963 | |
Working Capital Management Company††^ | | | 0.15 | | | | 08/03/2011 | | | | 24,000,000 | | | | 23,999,693 | |
| | | | |
| | | | | | | | | | | | | | | 10,037,454,026 | |
| | | | | | | | | | | | | | | | |
| | | | |
| Financial Company Commerical Paper: 10.25% | | | | | | | | | | | | | | | | |
ABN AMRO Funding USA LLC††^ | | | 0.18 | | | | 08/15/2011 | | | | 40,000,000 | | | | 39,997,044 | |
ABN AMRO Funding USA LLC††^ | | | 0.18 | | | | 08/17/2011 | | | | 87,000,000 | | | | 86,992,653 | |
ABN AMRO Funding USA LLC††^ | | | 0.18 | | | | 08/19/2011 | | | | 14,000,000 | | | | 13,998,670 | |
ABN AMRO Funding USA LLC††^ | | | 0.20 | | | | 08/05/2011 | | | | 49,000,000 | | | | 48,998,639 | |
ANZ National Limited±†† | | | 0.34 | | | | 09/13/2011 | | | | 120,000,000 | | | | 120,000,000 | |
ASB Finance Limited±†† | | | 0.35 | | | | 12/02/2011 | | | | 108,000,000 | | | | 108,000,000 | |
ASB Finance Limited±†† | | | 0.35 | | | | 12/05/2011 | | | | 107,000,000 | | | | 107,000,000 | |
ASB Finance Limited±†† | | | 0.35 | | | | 09/02/2011 | | | | 136,000,000 | | | | 136,000,000 | |
BNZ International Funding Limited†† | | | 0.15 | | | | 08/10/2011 | | | | 27,000,000 | | | | 26,998,853 | |
BNZ International Funding Limited±†† | | | 0.24 | | | | 09/20/2011 | | | | 17,500,000 | | | | 17,494,167 | |
BNZ International Funding Limited±†† | | | 0.34 | | | | 10/07/2011 | | | | 10,000,000 | | | | 9,999,994 | |
BNZ International Funding Limited±†† | | | 0.34 | | | | 10/12/2011 | | | | 44,000,000 | | | | 44,000,436 | |
BNZ International Funding Limited±†† | | | 0.35 | | | | 01/06/2012 | | | | 69,000,000 | | | | 69,000,000 | |
BNZ International Funding Limited±†† | | | 0.35 | | | | 09/01/2011 | | | | 104,000,000 | | | | 104,000,364 | |
Credit Suisse (New York)^ | | | 0.00 | | | | 08/01/2011 | | | | 146,000,000 | | | | 146,000,000 | |
Credit Suisse (New York)^ | | | 0.15 | | | | 09/07/2011 | | | | 68,000,000 | | | | 67,989,517 | |
ICICI Bank Limited^ | | | 0.64 | | | | 09/16/2011 | | | | 135,000,000 | | | | 134,887,875 | |
Nordea North America Incorporated^ | | | 0.15 | | | | 09/15/2011 | | | | 200,000,000 | | | | 199,962,500 | |
Nordea North America Incorporated^ | | | 0.15 | | | | 09/22/2011 | | | | 121,000,000 | | | | 120,973,783 | |
PB Financing Incorporated††^ | | | 0.00 | | | | 08/01/2011 | | | | 28,000,000 | | | | 28,000,000 | |
PB Financing Incorporated††^ | | | 0.33 | | | | 08/03/2011 | | | | 50,000,000 | | | | 49,998,611 | |
PB Financing Incorporated††^ | | | 0.45 | | | | 08/10/2011 | | | | 44,000,000 | | | | 43,994,500 | |
PB Financing Incorporated††^ | | | 0.47 | | | | 08/22/2011 | | | | 38,000,000 | | | | 37,989,138 | |
PB Financing Incorporated††^ | | | 0.47 | | | | 08/29/2011 | | | | 11,749,000 | | | | 11,744,522 | |
PB Financing Incorporated††^ | | | 0.49 | | | | 09/08/2011 | | | | 39,000,000 | | | | 38,979,417 | |
PB Financing Incorporated††^ | | | 0.49 | | | | 09/09/2011 | | | | 39,000,000 | | | | 38,978,875 | |
PB Financing Incorporated††^ | | | 0.50 | | | | 09/16/2011 | | | | 48,000,000 | | | | 47,968,720 | |
PB Financing Incorporated††^ | | | 0.50 | | | | 09/19/2011 | | | | 48,000,000 | | | | 47,966,680 | |
Prudential plc††^ | | | 0.20 | | | | 08/18/2011 | | | | 54,000,000 | | | | 53,994,645 | |
Prudential plc††^ | | | 0.21 | | | | 09/08/2011 | | | | 21,000,000 | | | | 20,995,123 | |
Prudential plc††^ | | | 0.23 | | | | 09/06/2011 | | | | 21,000,000 | | | | 20,994,960 | |
Prudential plc††^ | | | 0.23 | | | | 09/12/2011 | | | | 18,000,000 | | | | 17,994,960 | |
RBS Holdings USA Incorporated^ | | | 0.22 | | | | 08/11/2011 | | | | 135,000,000 | | | | 134,991,000 | |
Skandinaviska Enskilda Banken AB††^ | | | 0.23 | | | | 08/29/2011 | | | | 174,000,000 | | | | 173,967,520 | |
Skandinaviska Enskilda Banken AB††^ | | | 0.23 | | | | 09/08/2011 | | | | 144,000,000 | | | | 143,963,520 | |
Sumitomo Trust & Banking Corporation††^ | | | 0.00 | | | | 08/01/2011 | | | | 218,000,000 | | | | 218,000,000 | |
Suncorp-Metway Limited††^ | | | 0.26 | | | | 08/03/2011 | | | | 111,000,000 | | | | 110,997,626 | |
Suncorp-Metway Limited††^ | | | 0.36 | | | | 08/09/2011 | | | | 70,000,000 | | | | 69,993,778 | |
Suncorp-Metway Limited††^ | | | 0.39 | | | | 09/08/2011 | | | | 72,000,000 | | | | 71,969,600 | |
Suncorp-Metway Limited††^ | | | 0.39 | | | | 09/12/2011 | | | | 32,000,000 | | | | 31,985,067 | |
| | | | | | |
| Portfolio of Investments—July 31, 2011 (Unaudited) | | Wells Fargo Advantage Heritage Money Market Fund | | | 13 | |
| | | | | | | | | | | | | | | | |
| Security Name | | Interest Rate | | | Maturity Date | | | Principal | | | Value | |
| | | | | | | | | | | | | | | | |
| | | | |
| Financial Company Commerical Paper (continued) | | | | | | | | | | | | | | | | |
Swedbank AB^ | | | 0.11 | % | | | 08/02/2011 | | | $ | 57,450,000 | | | $ | 57,449,649 | |
Swedbank AB^ | | | 0.18 | | | | 08/03/2011 | | | | 44,000,000 | | | | 43,999,340 | |
Swedbank AB^ | | | 0.20 | | | | 08/04/2011 | | | | 44,000,000 | | | | 43,999,010 | |
Swedbank AB^ | | | 0.23 | | | | 08/08/2011 | | | | 138,000,000 | | | | 137,992,889 | |
Swedbank AB^ | | | 0.24 | | | | 08/09/2011 | | | | 97,000,000 | | | | 96,994,288 | |
Swedbank AB^ | | | 0.24 | | | | 08/10/2011 | | | | 139,000,000 | | | | 138,990,791 | |
Westpac Securities NZ Limited±†† | | | 0.33 | | | | 08/19/2011 | | | | 114,000,000 | | | | 114,000,000 | |
Westpac Securities NZ Limited±†† | | | 0.34 | | | | 10/13/2011 | | | | 110,000,000 | | | | 110,000,000 | |
| | | | |
| | | | | | | | | | | | | | | 3,761,188,724 | |
| | | | | | | | | | | | | | | | |
| | | | |
| Other Commercial Paper: 3.33% | | | | | | | | | | | | | | | | |
ACTS Retirement Life Communities Incorporated^ | | | 0.22 | | | | 09/15/2011 | | | | 6,000,000 | | | | 5,998,350 | |
Alaska Housing Finance Corporation^ | | | 0.20 | | | | 08/15/2011 | | | | 23,400,000 | | | | 23,397,956 | |
Caisse D’amortissement de la Dette Sociale††^ | | | 0.22 | | | | 09/28/2011 | | | | 128,000,000 | | | | 127,954,631 | |
Caisse D’amortissement de la Dette Sociale††^ | | | 0.22 | | | | 10/03/2011 | | | | 36,000,000 | | | | 35,986,140 | |
Caisse D’amortissement de la Dette Sociale††^ | | | 0.23 | | | | 10/11/2011 | | | | 214,000,000 | | | | 213,900,817 | |
EDF SA††^ | | | 0.12 | | | | 08/05/2011 | | | | 160,000,000 | | | | 159,997,333 | |
EDF SA††^ | | | 0.19 | | | | 09/06/2011 | | | | 96,000,000 | | | | 95,981,760 | |
EDF SA††^ | | | 0.19 | | | | 09/07/2011 | | | | 63,000,000 | | | | 62,987,698 | |
Erste Abwicklungsanstalt††^ | | | 0.19 | | | | 08/08/2011 | | | | 104,000,000 | | | | 103,995,551 | |
Erste Abwicklungsanstalt††^ | | | 0.25 | | | | 09/07/2011 | | | | 104,000,000 | | | | 103,972,209 | |
Erste Abwicklungsanstalt††^ | | | 0.25 | | | | 09/14/2011 | | | | 104,000,000 | | | | 103,966,951 | |
Louis Dreyfus Corporation^ | | | 0.00 | | | | 08/01/2011 | | | | 36,000,000 | | | | 36,000,000 | |
SBAB Bank AB††^ | | | 0.16 | | | | 08/02/2011 | | | | 23,000,000 | | | | 22,999,796 | |
SBAB Bank AB††^ | | | 0.20 | | | | 08/03/2011 | | | | 23,050,000 | | | | 23,049,616 | |
SBAB Bank AB††^ | | | 0.24 | | | | 08/04/2011 | | | | 25,000,000 | | | | 24,999,333 | |
SBAB Bank AB††^ | | | 0.27 | | | | 09/01/2011 | | | | 38,000,000 | | | | 37,990,838 | |
SBAB Bank AB††^ | | | 0.27 | | | | 09/09/2011 | | | | 40,000,000 | | | | 39,987,650 | |
| | | | |
| | | | | | | | | | | | | | | 1,223,166,629 | |
| | | | | | | | | | | | | | | | |
| | | | |
Total Commercial Paper (Cost $15,021,809,379) | | | | | | | | | | | | | | | 15,021,809,379 | |
| | | | | | | | | | | | | | | | |
| | | | |
Municipal Bonds and Notes: 16.62% | | | | | | | | | | | | | | | | |
| | | | |
Alabama: 0.90% | | | | | | | | | | | | | | | | |
| | | | |
| Variable Rate Demand Notes§: 0.90% | | | | | | | | | | | | | | | | |
Lower Alabama Gas District Supply Revenue Series A (Utilities Revenue, Societe Generale LOC) | | | 0.13 | | | | 11/01/2027 | | | | 85,500,000 | | | | 85,500,000 | |
Mobile AL Infirmary Health System Special Care Facilities Series A (Hospital Revenue, Bank of Nova Scotia LOC) | | | 0.07 | | | | 02/01/2040 | | | | 23,700,000 | | | | 23,700,000 | |
Southeast Alabama Gas District Alabama Supply Project Series 2007-A (Utilities Revenue) | | | 0.24 | | | | 08/01/2027 | | | | 211,751,000 | | | | 211,751,000 | |
Tuscaloosa County AL IDA Tax Exempt Gulf Opportunity Zone Hunt Refining Project Series 2008-A (Energy Revenue, JPMorgan Chase Bank LOC) | | | 0.08 | | | | 03/01/2027 | | | | 10,000,000 | | | | 10,000,000 | |
| | | | |
| | | | | | | | | | | | | | | 330,951,000 | |
| | | | | | | | | | | | | | | | |
| | | | |
Arizona: 0.02% | | | | | | | | | | | | | | | | |
| | | | |
| Variable Rate Demand Note§: 0.02% | | | | | | | | | | | | | | | | |
Glendale AZ IDA Thunderbird Garvin School Series A (IDR, JPMorgan Chase Bank LOC) | | | 0.10 | | | | 07/01/2035 | | | | 6,725,000 | | | | 6,725,000 | |
| | | | | | | | | | | | | | | | |
| | | | |
| 14 | | Wells Fargo Advantage Heritage Money Market Fund | | Portfolio of Investments—July 31, 2011 (Unaudited) |
| | | | | | | | | | | | | | | | |
| Security Name | | Interest Rate | | | Maturity Date | | | Principal | | | Value | |
| | | | | | | | | | | | | | | | |
| | | | |
California: 3.30% | | | | | | | | | | | | | | | | |
| | | | |
| Other Municipal Debt: 0.46% | | | | | | | | | | | | | | | | |
Los Angeles CA Department of Airport (Airport Revenue) | | | 0.25 | % | | | 08/05/2011 | | | $ | 25,000,000 | | | $ | 25,000,000 | |
San Francisco CA City and County Public Utilities Commission (Miscellaneous Revenue) | | | 0.19 | | | | 08/03/2011 | | | | 36,000,000 | | | | 36,000,000 | |
San Francisco CA City and County Public Utilities Commission (Miscellaneous Revenue) | | | 0.17 | | | | 09/12/2011 | | | | 9,000,000 | | | | 9,000,000 | |
San Francisco CA City and County Public Utilities Commission (Miscellaneous Revenue) | | | 0.17 | | | | 10/03/2011 | | | | 21,000,000 | | | | 21,000,000 | |
San Jose CA International Airport Series C-1 (Airport Revenue) | | | 0.22 | | | | 08/02/2011 | | | | 19,422,000 | | | | 19,422,000 | |
San Jose CA International Airport Series C-2 (Airport Revenue) | | | 0.22 | | | | 08/02/2011 | | | | 4,744,000 | | | | 4,744,000 | |
San Jose CA International Airport Series F (Airport Revenue) | | | 0.20 | | | | 08/02/2011 | | | | 53,600,000 | | | | 53,600,000 | |
| | | | |
| | | | | | | | | | | | | | | 168,766,000 | |
| | | | | | | | | | | | | | | | |
| | | | |
| Variable Rate Demand Notes§: 2.84% | | | | | | | | | | | | | | | | |
ABAG Finance Authority for Nonprofit Corporation CA Marin Country Day School (Education Revenue, U.S. Bank NA LOC) | | | 0.06 | | | | 07/01/2037 | | | | 18,175,000 | | | | 18,175,000 | |
Big Bear Lake CA Southwest Gas Corporation Project Series A (Utilities Revenue, KBC Bank NV LOC) | | | 0.09 | | | | 12/01/2028 | | | | 36,000,000 | | | | 36,000,000 | |
California Series B-2 (Miscellaneous Revenue, JPMorgan Chase Bank LOC) | | | 0.05 | | | | 05/01/2040 | | | | 45,000,000 | | | | 45,000,000 | |
California Educational Facilities Authority Saint Mary’s (Education Revenue, Bank of America NA LOC, NATL-RE Insured) | | | 0.07 | | | | 10/01/2043 | | | | 3,940,000 | | | | 3,940,000 | |
California HFA Home Mortgage Revenue Series M (Housing Revenue, FNMA LOC) | | | 0.07 | | | | 08/01/2034 | | | | 15,825,000 | | | | 15,825,000 | |
California HFA Program Series A (Housing Revenue, FNMA LOC) | | | 0.05 | | | | 08/01/2036 | | | | 10,500,000 | | | | 10,500,000 | |
California HFFA Catholic Healthcare West Series H (Health Revenue, Citibank NA LOC) | | | 0.06 | | | | 07/01/2033 | | | | 9,000,000 | | | | 9,000,000 | |
California HFFA Catholic Healthcare West Series H (Health Revenue, Bank of America NA LOC) | | | 0.06 | | | | 07/01/2035 | | | | 40,700,000 | | | | 40,700,000 | |
California Housing Finance Agency Series B (Housing Revenue, FNMA LOC) | | | 0.14 | | | | 08/01/2036 | | | | 6,450,000 | | | | 6,450,000 | |
California PCFA Pacific Gas & Electric Series B (Utilities Revenue, JPMorgan Chase Bank LOC) | | | 0.31 | | | | 11/01/2026 | | | | 26,200,000 | | | | 26,200,000 | |
California Series A Subseries C-2 (GO-State, Bank of Nova Scotia LOC) | | | 0.04 | | | | 05/01/2033 | | | | 8,000,000 | | | | 8,000,000 | |
California State Series B Subseries B1 (GO-State, Bank of America NA LOC) | | | 0.06 | | | | 05/01/2040 | | | | 47,000,000 | | | | 47,000,000 | |
California Statewide CDA Rady Children’s Hospital Series A (Hospital Revenue, U.S. Bank NA LOC) | | | 0.06 | | | | 08/15/2047 | | | | 63,845,000 | | | | 63,845,000 | |
California Statewide CDA Sweep Loan Program Series A (Hospital Revenue, Citibank NA LOC) | | | 0.06 | | | | 08/01/2035 | | | | 17,460,000 | | | | 17,460,000 | |
City of Newport Beach CA Memorial Hospital Series E (Health Revenue, Bank of America NA LOC) | | | 0.04 | | | | 12/01/2040 | | | | 35,000,000 | | | | 35,000,000 | |
El Dorado CA Irrigation District & El Dorado Water Agency Series A (Lease Revenue, Citibank NA LOC) | | | 0.06 | | | | 03/01/2036 | | | | 41,595,000 | | | | 41,595,000 | |
JPMorgan Chase PUTTER Trust Series 3931 (Tax Revenue) | | | 0.21 | | | | 08/12/2012 | | | | 35,745,000 | | | | 35,745,000 | |
JPMorgan Chase PUTTER Trust Series 3934 (Miscellaneous Revenue)†† | | | 0.20 | | | | 08/07/2012 | | | | 30,000,000 | | | | 30,000,000 | |
Loma Linda CA Loma Linda University Series B (Education Revenue, Bank of America NA LOC) | | | 0.06 | | | | 12/01/2037 | | | | 12,000,000 | | | | 12,000,000 | |
Los Angeles CA MFHR Series II-B (Housing Revenue, FNMA Insured) | | | 0.15 | | | | 03/15/2034 | | | | 32,615,000 | | | | 32,615,000 | |
Los Angeles CA Power System Subseries A5 (Utilities Revenue) | | | 0.05 | | | | 07/01/2035 | | | | 29,400,000 | | | | 29,400,000 | |
Los Angeles CA Wastewater Systems Sub-Series F-1 (Water & Sewer Revenue, Bank of America NA LOC) | | | 0.09 | | | | 06/01/2028 | | | | 21,925,000 | | | | 21,925,000 | |
| | | | | | |
| Portfolio of Investments—July 31, 2011 (Unaudited) | | Wells Fargo Advantage Heritage Money Market Fund | | | 15 | |
| | | | | | | | | | | | | | | | |
| Security Name | | Interest Rate | | | Maturity Date | | | Principal | | | Value | |
| | | | | | | | | | | | | | | | |
| | | | |
| Variable Rate Demand Notes§ (continued) | | | | | | | | | | | | | | | | |
Los Angeles CA Wastewater Systems Sub-Series F-2 (Water & Sewer Revenue, Bank of America NA LOC) | | | 0.09 | % | | | 06/01/2032 | | | $ | 20,000,000 | | | $ | 20,000,000 | |
Los Angeles CA USD COP Administration Building Project Series A (Lease Revenue, Bank of America NA LOC) | | | 0.06 | | | | 10/01/2024 | | | | 10,370,000 | | | | 10,370,000 | |
Metropolitan Water District of Southern California (Water & Sewer Revenue) | | | 0.05 | | | | 07/01/2027 | | | | 22,000,000 | | | | 22,000,000 | |
Metropolitan Water District of Southern California Series B-2 (Water & Sewer Revenue) | | | 0.08 | | | | 07/01/2035 | | | | 34,100,000 | | | | 34,100,000 | |
Morgan Hill CA RDA Tax Allocation Ojo de Agua Redevelopment Project A (Tax Revenue, Scotia Bank LOC) | | | 0.05 | | | | 09/01/2033 | | | | 15,000,000 | | | | 15,000,000 | |
Newport Beach CA Hoag Memorial Hospital Series F (Health Revenue, Bank of America NA LOC) | | | 0.06 | | | | 12/01/2040 | | | | 31,400,000 | | | | 31,400,000 | |
Riverside CA COP Riverside Renaissance Project Series 2008 (Lease Revenue, Bank of America NA LOC) | | | 0.09 | | | | 03/01/2037 | | | | 8,985,000 | | | | 8,985,000 | |
Sacramento County CA Musical Theatre Project Series 2002 (Miscellaneous Revenue, JPMorgan Chase Bank LOC) | | | 0.15 | | | | 07/01/2022 | | | | 60,000,000 | | | | 60,000,000 | |
Sacramento County CA Taxable Series B (Miscellaneous Revenue, JPMorgan Chase Bank LOC) | | | 0.15 | | | | 07/01/2020 | | | | 65,000,000 | | | | 65,000,000 | |
San Diego County CA Regional Transportation Community Limited Tax Series A (Tax Revenue) | | | 0.05 | | | | 04/01/2038 | | | | 44,695,000 | | | | 44,695,000 | |
San Diego County CA Regional Transportation Community Limited Tax Series B (Tax Revenue) | | | 0.07 | | | | 04/01/2038 | | | | 76,200,000 | | | | 76,200,000 | |
San Francisco CA City & County Cops Floater Series B001 (Lease Revenue)†† | | | 0.23 | | | | 11/01/2041 | | | | 4,000,000 | | | | 4,000,000 | |
San Francisco CA City & County Finance Corporation Moscone Center Project (Lease Revenue, Bank of America NA LOC) | | | 0.05 | | | | 04/01/2030 | | | | 20,765,000 | | | | 20,765,000 | |
San Jose CA Financing Authority Taxable Land Series F (Lease Revenue, Bank of America NA LOC) | | | 0.14 | | | | 06/01/2034 | | | | 10,000,000 | | | | 10,000,000 | |
Santa Clara County CA Financing Authority Multiple Facilities Projects Series M (Lease Revenue, Bank of America NA LOC) | | | 0.06 | | | | 05/15/2035 | | | | 10,725,000 | | | | 10,725,000 | |
Whittier CA Whittier College Series 2008 (Education Revenue, Bank of America NA LOC) | | | 0.08 | | | | 12/01/2038 | | | | 22,395,000 | | | | 22,395,000 | |
| | | | |
| | | | | | | | | | | | | | | 1,042,010,000 | |
| | | | | | | | | | | | | | | | |
| | | | |
Colorado: 0.97% | | | | | | | | | | | | | | | | |
| | | | |
| Variable Rate Demand Notes§: 0.97% | | | | | | | | | | | | | | | | |
Colorado HFA Class 1 Series B3 (Housing Revenue) | | | 0.13 | | | | 11/01/2036 | | | | 25,445,000 | | | | 25,445,000 | |
Colorado HFA Class I Series B1 (Housing Revenue, FNMA Insured) | | | 0.14 | | | | 05/01/2038 | | | | 25,280,000 | | | | 25,280,000 | |
Colorado HFA Class I Series B1 (Housing Revenue, GO of Authority Insured) | | | 0.17 | | | | 10/01/2038 | | | | 9,657,500 | | | | 9,657,500 | |
Colorado HFA Series A1 (Housing Revenue) | | | 0.20 | | | | 10/01/2033 | | | | 8,805,000 | | | | 8,805,000 | |
Colorado HFA Series A1 (Housing Revenue) | | | 0.20 | | | | 11/01/2036 | | | | 2,155,000 | | | | 2,155,000 | |
Colorado HFA Taxable MFHR Project B2 (Housing Revenue, FNMA Insured) | | | 0.16 | | | | 05/01/2050 | | | | 81,735,000 | | | | 81,735,000 | |
Colorado Springs CO Utility Improvement Bond Series A (Utilities Revenue) | | | 0.10 | | | | 11/01/2038 | | | | 21,375,000 | | | | 21,375,000 | |
Denver CO Public Schools Series A-4 (Education Revenue, JPMorgan Chase Bank LOC, AGM Insured) | | | 0.10 | | | | 12/15/2037 | | | | 15,300,000 | | | | 15,300,000 | |
Denver CO Public Schools Series A-4 (Education Revenue, Royal Bank of Canada LOC, AGM Insured) | | | 0.11 | | | | 12/15/2037 | | | | 46,000,000 | | | | 46,000,000 | |
Denver CO Public Schools Series A-4 (Education Revenue, JPMorgan Chase Bank LOC, AGM Insured) | | | 0.13 | | | | 12/15/2037 | | | | 14,845,000 | | | | 14,845,000 | |
| | | | |
| 16 | | Wells Fargo Advantage Heritage Money Market Fund | | Portfolio of Investments—July 31, 2011 (Unaudited) |
| | | | | | | | | | | | | | | | |
| Security Name | | Interest Rate | | | Maturity Date | | | Principal | | | Value | |
| | | | | | | | | | | | | | | | |
| | | | |
| Variable Rate Demand Notes§ (continued) | | | | | | | | | | | | | | | | |
Southern Ute Indian Tribe Reservation (Miscellaneous Revenue)†† | | | 0.11 | % | | | 04/01/2040 | | | $ | 62,735,000 | | | $ | 62,735,000 | |
University of Colorado Series B (Hospital Revenue, JPMorgan Chase Bank LOC) | | | 0.06 | | | | 11/15/2031 | | | | 41,000,000 | | | | 41,000,000 | |
| | | | |
| | | | | | | | | | | | | | | 354,332,500 | |
| | | | | | | | | | | | | | | | |
| | | | |
Delaware: 0.22% | | | | | | | | | | | | | | | | |
| | | | |
| Variable Rate Demand Notes§: 0.22% | | | | | | | | | | | | | | | | |
Delaware EDA Clean Power Project Series 1997-C (Resource Recovery Revenue) | | | 0.25 | | | | 08/01/2029 | | | | 26,700,000 | | | | 26,700,000 | |
Delaware EDA Clean Power Project Series 1997-D (Resource Recovery Revenue) | | | 0.21 | | | | 08/01/2029 | | | | 34,800,000 | | | | 34,800,000 | |
Delaware EDA Clean Power Project Series B (Resource Recovery Revenue) | | | 0.28 | | | | 08/01/2029 | | | | 17,600,000 | | | | 17,600,000 | |
| | | | |
| | | | | | | | | | | | | | | 79,100,000 | |
| | | | | | | | | | | | | | | | |
| | | | |
District of Columbia: 0.15% | | | | | | | | | | | | | | | | |
| | | | |
| Variable Rate Demand Notes§: 0.15% | | | | | | | | | | | | | | | | |
District of Columbia Georgetown University Series B2 (Education Revenue, JPMorgan Chase Bank LOC) | | | 0.05 | | | | 04/01/2041 | | | | 9,645,000 | | | | 9,645,000 | |
District of Columbia The American University Series A (Education Revenue, PNC Bank NA LOC) | | | 0.06 | | | | 04/01/2038 | | | | 28,000,000 | | | | 28,000,000 | |
Metropolitan Washington DC Airports Authority Subseries D-1 (Airport Revenue, Bank of America NA LOC) | | | 0.10 | | | | 10/01/2039 | | | | 16,715,000 | | | | 16,715,000 | |
| | | | |
| | | | | | | | | | | | | | | 54,360,000 | |
| | | | | | | | | | | | | | | | |
| | | | |
Florida: 0.25% | | | | | | | | | | | | | | | | |
| | | | |
| Other Municipal Debt: 0.12% | | | | | | | | | | | | | | | | |
Hillsborough County FL (Miscellaneous Revenue) | | | 0.26 | | | | 08/11/2011 | | | | 43,110,000 | | | | 43,110,000 | |
| | | | | | | | | | | | | | | | |
| | | | |
| Variable Rate Demand Note§: 0.13% | | | | | | | | | | | | | | | | |
Orlando FL Utilities Commision (Utilities Revenue) | | | 0.04 | | | | 10/01/2033 | | | | 47,000,000 | | | | 47,000,000 | |
| | | | | | | | | | | | | | | | |
| | | | |
Georgia: 0.12% | | | | | | | | | | | | | | | | |
| | | | |
| Variable Rate Demand Notes§: 0.12% | | | | | | | | | | | | | | | | |
Main Street Natural Gas Incorporated Georgia Gas Project Series A
(Utilities Revenue) | | | 0.08 | | | | 08/01/2040 | | | | 25,285,000 | | | | 25,285,000 | |
Savannah GA College of Art & Design Series 2004 BD (Education Revenue, Bank of America NA LOC) | | | 0.12 | | | | 04/01/2024 | | | | 11,400,000 | | | | 11,400,000 | |
Wayne County GA IDA Various Rayonier Project (IDR, Bank of America NA LOC) | | | 0.14 | | | | 05/01/2020 | | | | 8,000,000 | | | | 8,000,000 | |
| | | | |
| | | | | | | | | | | | | | | 44,685,000 | |
| | | | | | | | | | | | | | | | |
| | | | |
Illinois: 0.88% | | | | | | | | | | | | | | | | |
| | | | |
| Variable Rate Demand Notes§: 0.88% | | | | | | | | | | | | | | | | |
Chicago IL Midway Series A-2 (Airport Revenue, JPMorgan Chase Bank LOC) | | | 0.23 | | | | 01/01/2025 | | | | 5,500,000 | | | | 5,500,000 | |
Chicago IL Midway Series C-1 (Airport Revenue, Bank of Montreal LOC) | | | 0.12 | | | | 01/01/2035 | | | | 20,535,000 | | | | 20,535,000 | |
Cook County IL GO Series D-1 (GO-Local) | | | 0.19 | | | | 11/01/2030 | | | | 19,000,000 | | | | 19,000,000 | |
Cook County IL Series D-2 (GO-Local) | | | 0.19 | | | | 11/01/2030 | | | | 28,000,000 | | | | 28,000,000 | |
Illinois Finance Authority Resurrection Health Project Series 2005-B (Health Revenue, JPMorgan Chase Bank LOC) | | | 0.20 | | | | 05/15/2035 | | | | 14,785,000 | | | | 14,785,000 | |
| | | | | | |
| Portfolio of Investments—July 31, 2011 (Unaudited) | | Wells Fargo Advantage Heritage Money Market Fund | | | 17 | |
| | | | | | | | | | | | | | | | |
| Security Name | | Interest Rate | | | Maturity Date | | | Principal | | | Value | |
| | | | | | | | | | | | | | | | |
| | | | |
| Variable Rate Demand Notes§ (continued) | | | | | | | | | | | | | | | | |
Illinois Finance Authority Bradley University Series A (Education Revenue, PNC Bank NA LOC) | | | 0.06 | % | | | 04/01/2033 | | | $ | 24,635,000 | | | $ | 24,635,000 | |
Illinois Finance Authority Revenue University of Chicago (Education Revenue) | | | 0.05 | | | | 07/01/2038 | | | | 46,534,000 | | | | 46,534,000 | |
Illinois Finance Authority Revenue University of Chicago Medical Center Series A (Health Revenue, Bank of America NA LOC) | | | 0.22 | | | | 08/01/2044 | | | | 46,250,000 | | | | 46,250,000 | |
Illinois Finance Authority Spertus Institute (Education Revenue, Northern Trust Company LOC) | | | 0.09 | | | | 09/01/2035 | | | | 43,570,000 | | | | 43,570,000 | |
Illinois Finance Authority St. Ignatius College (Education Revenue, JPMorgan Chase Bank LOC) | | | 0.09 | | | | 12/01/2036 | | | | 13,000,000 | | | | 13,000,000 | |
Illinois Housing Development Authority Larkin Village Project Series A (Housing Revenue, JPMorgan Chase Bank LOC) | | | 0.18 | | | | 01/01/2027 | | | | 13,450,000 | | | | 13,450,000 | |
Illinois International Port District (Port Authority Revenue, U.S. Bank NA LOC) | | | 0.08 | | | | 01/01/2023 | | | | 8,000,000 | | | | 8,000,000 | |
Illinois State Toll Highway Authority (Transportation Revenue, PNC Bank NA LOC) | | | 0.08 | | | | 07/01/2030 | | | | 16,000,000 | | | | 16,000,000 | |
Illinois State Toll Highway Authority (Transportation Revenue, Citibank NA LOC) | | | 0.09 | | | | 07/01/2030 | | | | 25,000,000 | | | | 25,000,000 | |
| | | | |
| | | | | | | | | | | | | | | 324,259,000 | |
| | | | | | | | | | | | | | | | |
| | | | |
Indiana: 0.42% | | | | | | | | | | | | | | | | |
| | | | |
| Variable Rate Demand Notes§: 0.42% | | | | | | | | | | | | | | | | |
Indiana Finance Authority Series J (Hospital Revenue, JPMorgan Chase Bank LOC) | | | 0.13 | | | | 03/01/2033 | | | | 15,625,000 | | | | 15,625,000 | |
Indiana Finance Authority Series K (Hospital Revenue, JPMorgan Chase Bank LOC) | | | 0.22 | | | | 03/01/2033 | | | | 20,800,000 | | | | 20,800,000 | |
Richmond IN Reid Hospital & Health Care Services Incorporated (Hospital Revenue, AGM Insured) | | | 0.20 | | | | 01/01/2040 | | | | 50,630,000 | | | | 50,630,000 | |
Indiana State Financing Authority (Resource Recovery Revenue, Bank of America NA LOC) | | | 0.07 | | | | 12/01/2039 | | | | 54,125,000 | | | | 54,125,000 | |
Indiana Financing Authority (Hospital Revenue, Northern Trust Company LOC) | | | 0.06 | | | | 03/01/2033 | | | | 13,000,000 | | | | 13,000,000 | |
| | | | |
| | | | | | | | | | | | | | | 154,180,000 | |
| | | | | | | | | | | | | | | | |
| | | | |
Kentucky: 0.14% | | | | | | | | | | | | | | | | |
| | | | |
| Variable Rate Demand Notes§: 0.14% | | | | | | | | | | | | | | | | |
Carroll County KY Environmental Facility Revenue Series A (Utilities Revenue, Sumitomo Mitsui Banking LOC) | | | 0.08 | | | | 10/01/2034 | | | | 26,000,000 | | | | 26,000,000 | |
Kentucky Municipal Power Agency (Energy Revenue, Assured Guaranty Insured)†† | | | 0.23 | | | | 09/01/2037 | | | | 20,000,000 | | | | 20,000,000 | |
Logan County KY Solid Waste Disposal Waste Management LLC Project (Resource Recovery Revenue, PNC Bank NA LOC) | | | 0.09 | | | | 03/01/2021 | | | | 6,000,000 | | | | 6,000,000 | |
| | | | |
| | | | | | | | | | | | | | | 52,000,000 | |
| | | | | | | | | | | | | | | | |
| | | | |
Louisiana: 0.45% | | | | | | | | | | | | | | | | |
| | | | |
| Variable Rate Demand Notes§: 0.45% | | | | | | | | | | | | | | | | |
East Baton Rouge Parish LA Road & Street Improvement Project Series A (Transportation Revenue, JPMorgan Chase Bank LOC) | | | 0.07 | | | | 08/01/2030 | | | | 71,440,000 | | | | 71,440,000 | |
Louisiana Public Facilities Authority (Health Revenue, JPMorgan Chase Bank LOC) | | | 0.07 | | | | 08/01/2023 | | | | 11,845,000 | | | | 11,845,000 | |
Louisiana Stadium & Exposition PFOTER (Miscellaneous Revenue)†† | | | 0.34 | | | | 07/01/2036 | | | | 23,690,000 | | | | 23,690,000 | |
| | | | |
| 18 | | Wells Fargo Advantage Heritage Money Market Fund | | Portfolio of Investments—July 31, 2011 (Unaudited) |
| | | | | | | | | | | | | | | | |
| Security Name | | Interest Rate | | | Maturity Date | | | Principal | | | Value | |
| | | | | | | | | | | | | | | | |
| | | | |
| Variable Rate Demand Notes§ (continued) | | | | | | | | | | | | | | | | |
St. James Parish LA Series A-1 (Energy Revenue) | | | 0.08 | % | | | 11/01/2040 | | | $ | 39,200,000 | | | $ | 39,200,000 | |
St. James Parish LA Series B-1 (Energy Revenue) | | | 0.10 | | | | 11/01/2040 | | | | 18,700,000 | | | | 18,700,000 | |
| | | | |
| | | | | | | | | | | | | | | 164,875,000 | |
| | | | | | | | | | | | | | | | |
| | | | |
Maryland: 0.37% | | | | | | | | | | | | | | | | |
| | | | |
| Other Municipal Debt: 0.14% | | | | | | | | | | | | | | | | |
Maryland HEFA (Health Revenue) | | | 0.15 | | | | 09/08/2011 | | | | 37,600,000 | | | | 37,600,000 | |
Montgomery County MD Series 2009 A2 (GO-Local) | | | 0.24 | | | | 08/01/2011 | | | | 12,500,000 | | | | 12,500,000 | |
| | | | | | | | | | | | | | | 50,100,000 | |
| | | | | | | | | | | | | | | | |
| | | | |
| Variable Rate Demand Notes§: 0.23% | | | | | | | | | | | | | | | | |
Baltimore MD Package Systems Facilities (Transportation Revenue, Bank of America NA LOC) | | | 0.13 | | | | 07/01/2032 | | | | 45,910,000 | | | | 45,910,000 | |
Howard County MD MFHR (Housing Revenue, FNMA Insured) | | | 0.09 | | | | 07/15/2033 | | | | 8,910,000 | | | | 8,910,000 | |
Maryland CDA Department of Housing & Community Development Series 2007-J (Housing Revenue) | | | 0.11 | | | | 09/01/2031 | | | | 13,380,000 | | | | 13,380,000 | |
Maryland HEFA Suburban Hospital (Hospital Revenue, PNC Bank NA LOC) | | | 0.06 | | | | 07/01/2029 | | | | 7,890,000 | | | | 7,890,000 | |
Maryland State Economic Development Corporate Revenue (Education Revenue, Bank of America NA LOC) | | | 0.13 | | | | 07/01/2040 | | | | 10,465,000 | | | | 10,465,000 | |
| | | | |
| | | | | | | | | | | | | | | 86,555,000 | |
| | | | | | | | | | | | | | | | |
| | | | |
Massachusetts: 0.60% | | | | | | | | | | | | | | | | |
| | | | |
| Other Municipal Debt: 0.02% | | | | | | | | | | | | | | | | |
Massachusetts Water Resources Authority Series 99 (Water & Sewer Revenue) | | | 0.27 | | | | 08/10/2011 | | | | 8,000,000 | | | | 8,000,000 | |
| | | | | | | | | | | | | | | | |
| | | | |
| Variable Rate Demand Notes§: 0.58% | | | | | | | | | | | | | | | | |
Massachusetts Department of Transportation Series A6 (Transportation Revenue, GO of Commonwealth Insured) | | | 0.07 | | | | 01/01/2029 | | | | 15,000,000 | | | | 15,000,000 | |
Massachusetts HEFA (Education Revenue, Bank of America NA LOC) | | | 0.11 | | | | 10/01/2034 | | | | 41,590,000 | | | | 41,590,000 | |
Massachusetts HEFA Series N-3 (Health Revenue, JPMorgan Chase Bank LOC) | | | 0.04 | | | | 10/01/2038 | | | | 49,000,000 | | | | 49,000,000 | |
Massachusetts State Water Resources Authority Series A-1 (Water & Sewer Revenue, GO of Authority Insured) | | | 0.07 | | | | 08/01/2037 | | | | 19,675,000 | | | | 19,675,000 | |
Massachusetts State Water Resources Authority Series A-2 (Water & Sewer Revenue, GO of Authority Insured) | | | 0.06 | | | | 08/01/2037 | | | | 12,500,000 | | | | 12,500,000 | |
Massachusetts State Water Resources Authority Series C-1 (Water & Sewer Revenue, GO of Authority Insured) | | | 0.04 | | | | 11/01/2026 | | | | 20,900,000 | | | | 20,900,000 | |
Massachusetts State Water Resources Authority Series C-2 (Water & Sewer Revenue, GO of Authority Insured) | | | 0.04 | | | | 11/01/2026 | | | | 20,800,000 | | | | 20,800,000 | |
Massachusetts State Water Resources Authority Series E (Water & Sewer Revenue, GO of Authority Insured) | | | 0.08 | | | | 08/01/2037 | | | | 32,810,000 | | | | 32,810,000 | |
| | | | |
| | | | | | | | | | | | | | | 212,275,000 | |
| | | | | | | | | | | | | | | | |
| | | | |
Michigan: 0.69% | | | | | | | | | | | | | | | | |
| | | | |
| Variable Rate Demand Notes§: 0.69% | | | | | | | | | | | | | | | | |
Michigan Finance Authority Series A (Miscellaneous Revenue, Bank of America NA LOC) | | | 0.11 | | | | 09/01/2050 | | | | 50,000,000 | | | | 50,000,000 | |
Michigan Finance Authority Series B (Miscellaneous Revenue, PNC Bank NA LOC) | | | 0.13 | | | | 09/01/2050 | | | | 25,000,000 | | | | 25,000,000 | |
| | | | | | |
| Portfolio of Investments—July 31, 2011 (Unaudited) | | Wells Fargo Advantage Heritage Money Market Fund | | | 19 | |
| | | | | | | | | | | | | | | | |
| Security Name | | Interest Rate | | | Maturity Date | | | Principal | | | Value | |
| | | | | | | | | | | | | | | | |
| | | | |
| Variable Rate Demand Notes§ (continued) | | | | | | | | | | | | | | | | |
Michigan Finance Authority Series C (Miscellaneous Revenue, Bank of Montreal LOC) | | | 0.14 | % | | | 09/01/2050 | | | $ | 22,000,000 | | | $ | 22,000,000 | |
Michigan HEFAR Calvin College Project Series A (Education Revenue, JPMorgan Chase Bank LOC) | | | 0.09 | | | | 09/01/2037 | | | | 20,000,000 | | | | 20,000,000 | |
Michigan HEFAR Calvin College Project Series B (Education Revenue, JPMorgan Chase Bank LOC) | | | 0.09 | | | | 09/01/2037 | | | | 15,000,000 | | | | 15,000,000 | |
Michigan Housing Development Authority Series A (Housing Revenue, GO of Authority Insured) | | | 0.21 | | | | 10/01/2037 | | | | 58,105,000 | | | | 58,105,000 | |
Wayne County MI Airport Authority Series E-1 (Airport Revenue, JPMorgan Chase Bank LOC) | | | 0.10 | | | | 12/01/2028 | | | | 25,000,000 | | | | 25,000,000 | |
Wayne County MI Airport Authority Series F (Airport Revenue, JPMorgan Chase Bank LOC) | | | 0.08 | | | | 12/01/2033 | | | | 37,320,000 | | �� | | 37,320,000 | |
| | | | |
| | | | | | | | | | | | | | | 252,425,000 | |
| | | | | | | | | | | | | | | | |
| | | | |
Minnesota: 0.15% | | | | | | | | | | | | | | | | |
| | | | |
| Variable Rate Demand Notes§: 0.15% | | | | | | | | | | | | | | | | |
Minnesota State HFA Residential Housing Series E (Housing Revenue, GO of Agency Insured) | | | 0.18 | | | | 07/01/2038 | | | | 4,380,000 | | | | 4,380,000 | |
Minnesota State HFA Residential Housing Series T (Housing Revenue, GO of Agency Insured) | | | 0.21 | | | | 07/01/2048 | | | | 5,110,000 | | | | 5,110,000 | |
St. Anthony MN Landings Silver Lake Project Series A (Housing Revenue, LaSalle Bank NA LOC) | | | 0.15 | | | | 10/01/2037 | | | | 13,400,000 | | | | 13,400,000 | |
St. Cloud MN Cenracare Health Series A (Hospital Revenue, U.S. Bank NA LOC) | | | 0.10 | | | | 05/01/2042 | | | | 20,000,000 | | | | 20,000,000 | |
St. Paul MN Housing & RDA Bridgecreek Place Limited Project Series 2004-A (Housing Revenue, LaSalle Bank NA LOC) | | | 0.15 | | | | 06/15/2037 | | | | 10,750,000 | | | | 10,750,000 | |
| | | | |
| | | | | | | | | | | | | | | 53,640,000 | |
| | | | | | | | | | | | | | | | |
| | | | |
Mississippi: 0.10% | | | | | | | | | | | | | | | | |
| | | | |
| Variable Rate Demand Notes§: 0.10% | | | | | | | | | | | | | | | | |
Mississippi State Nissan Project Series A (GO-State, GO of Commonwealth Insured) | | | 0.13 | | | | 11/01/2028 | | | | 430,000 | | | | 430,000 | |
Mississippi State Nissan Project Series B (Tax Revenue) | | | 0.17 | | | | 11/01/2028 | | | | 37,995,000 | | | | 37,995,000 | |
| | | | |
| | | | | | | | | | | | | | | 38,425,000 | |
| | | | | | | | | | | | | | | | |
| | | | |
Missouri: 0.17% | | | | | | | | | | | | | | | | |
| | | | |
| Variable Rate Demand Notes§: 0.17% | | | | | | | | | | | | | | | | |
Missouri Development Finance Board Nelson Gallery Foundation (Miscellaneous Revenue) | | | 0.20 | | | | 12/01/2037 | | | | 35,400,000 | | | | 35,400,000 | |
Missouri State HEFA Sister Mercy Health Series C (Health Revenue) | | | 0.13 | | | | 06/01/2019 | | | | 27,195,000 | | | | 27,195,000 | |
| | | | |
| | | | | | | | | | | | | | | 62,595,000 | |
| | | | | | | | | | | | | | | | |
| | | | |
Nevada: 0.13% | | | | | | | | | | | | | | | | |
| | | | |
| Variable Rate Demand Notes§: 0.13% | | | | | | | | | | | | | | | | |
Clark County NV Southwest Gas Project Series A (IDR, JPMorgan Chase Bank LOC) | | | 0.09 | | | | 03/01/2038 | | | | 29,000,000 | | | | 29,000,000 | |
Las Vegas NV EDFA Keep Memory Alive Project (Miscellaneous Revenue, PNC Bank NA LOC) | | | 0.06 | | | | 05/01/2037 | | | | 20,300,000 | | | | 20,300,000 | |
| | | | |
| | | | | | | | | | | | | | | 49,300,000 | |
| | | | | | | | | | | | | | | | |
| | | | |
| 20 | | Wells Fargo Advantage Heritage Money Market Fund | | Portfolio of Investments—July 31, 2011 (Unaudited) |
| | | | | | | | | | | | | | | | |
| Security Name | | Interest Rate | | | Maturity Date | | | Principal | | | Value | |
| | | | | | | | | | | | | | | | |
| | | | |
New Hampshire: 0.07% | | | | | | | | | | | | | | | | |
| | | | |
| Variable Rate Demand Note§: 0.07% | | | | | | | | | | | | | | | | |
New Hampshire HEFA St. Anselm College Series 2008 (Education Revenue, RBS Citizens NA LOC) | | | 0.07 | % | | | 06/01/2038 | | | $ | 25,350,000 | | | $ | 25,350,000 | |
| | | | | | | | | | | | | | | | |
| | | | |
New Jersey: 0.37% | | | | | | | | | | | | | | | | |
| | | | |
| Variable Rate Demand Notes§: 0.37% | | | | | | | | | | | | | | | | |
New Jersey EDA NUI Corporation Project Series A (Energy Revenue, JPMorgan Chase Bank LOC) | | | 0.20 | | | | 06/01/2026 | | | | 16,000,000 | | | | 16,000,000 | |
New Jersey EDA Pivotal Utility Holdings Incorporated Project Series 2007 (Energy Revenue, JPMorgan Chase Bank LOC) | | | 0.20 | | | | 06/01/2032 | | | | 24,000,000 | | | | 24,000,000 | |
New Jersey HFFA Princeton Healthcare Series A (Hospital Revenue, Bank of America NA LOC) | | | 0.10 | | | | 07/01/2041 | | | | 59,500,000 | | | | 59,500,000 | |
New Jersey State Turnpike Authority Series C (Miscellaneous Revenue, JPMorgan Chase Bank LOC) | | | 0.06 | | | | 06/15/2032 | | | | 13,000,000 | | | | 13,000,000 | |
New Jersey State Turnpike Authority Series D (Miscellaneous Revenue, Societe Generale LOC, NATL-RE FGIC Insured) | | | 0.19 | | | | 01/01/2018 | | | | 22,000,000 | | | | 22,000,000 | |
| | | | |
| | | | | | | | | | | | | | | 134,500,000 | |
| | | | | | | | | | | | | | | | |
| | | | |
New Mexico: 0.05% | | | | | | | | | | | | | | | | |
| | | | |
| Variable Rate Demand Note§: 0.05% | | | | | | | | | | | | | | | | |
Merrill Lynch PFOTER (Education Revenue, Guaranteed Student Loans Insured)†† | | | 0.39 | | | | 04/01/2037 | | | | 18,000,000 | | | | 18,000,000 | |
| | | | | | | | | | | | | | | | |
| | | | |
New York: 1.65% | | | | | | | | | | | | | | | | |
| | | | |
| Other Municipal Debt: 0.17% | | | | | | | | | | | | | | | | |
New York Metropolitan Transportation Authority Series C (Transportation Revenue) | | | 0.19 | | | | 08/03/2011 | | | | 29,000,000 | | | | 29,000,000 | |
New York Metropolitan Transportation Authority Series D (Transportation Revenue) | | | 0.27 | | | | 08/02/2011 | | | | 36,000,000 | | | | 36,000,000 | |
| | | | |
| | | | | | | | | | | | | | | 65,000,000 | |
| | | | | | | | | | | | | | | | |
| | | | |
| Variable Rate Demand Notes§: 1.48% | | | | | | | | | | | | | | | | |
Abraham Joshua Hesehal School New York Series 2010 (Education Revenue, TD Bank NA LOC) | | | 0.19 | | | | 01/01/2040 | | | | 25,910,000 | | | | 25,910,000 | |
New York City NY Housing Development Corporation Mortgage Thessalonica Court Series A (Housing Revenue, Citibank NA LOC) | | | 0.10 | | | | 01/01/2036 | | | | 9,360,000 | | | | 9,360,000 | |
New York City NY Housing Development Corporation Series A (Housing Revenue, JPMorgan Chase Bank LOC) | | | 0.13 | | | | 01/01/2016 | | | | 7,000,000 | | | | 7,000,000 | |
New York City NY Municipal Water Finance Authority Subseries B-1 (Water & Sewer Revenue) | | | 0.05 | | | | 06/15/2024 | | | | 107,400,000 | | | | 107,400,000 | |
New York City NY Subseries B (GO-Local, TD Bank NA LOC) | | | 0.05 | | | | 09/01/2027 | | | | 17,170,000 | | | | 17,170,000 | |
New York City NY Subseries C-4 (GO-Local, Bank of Tokyo-Mitsubishi UFJ LOC) | | | 0.16 | | | | 08/01/2020 | | | | 11,000,000 | | | | 11,000,000 | |
New York City NY Subseries H-1 (Tax Revenue) | | | 0.19 | | | | 03/01/2034 | | | | 28,740,000 | | | | 28,740,000 | |
New York HFA Victory Housing Project Series 2000-A (Housing Revenue, FHLMC Insured) | | | 0.05 | | | | 11/01/2033 | | | | 8,000,000 | | | | 8,000,000 | |
New York Housing Finance Agency Series A (Housing Revenue, FNMA Insured) | | | 0.18 | | | | 05/01/2029 | | | | 74,505,000 | | | | 74,505,000 | |
New York Housing Finance Agency Victory Housing Series 2004-A (Housing Revenue, FHLMC Insured) | | | 0.05 | | | | 11/01/2033 | | | | 2,000,000 | | | | 2,000,000 | |
| | | | | | |
| Portfolio of Investments—July 31, 2011 (Unaudited) | | Wells Fargo Advantage Heritage Money Market Fund | | | 21 | |
| | | | | | | | | | | | | | | | |
| Security Name | | Interest Rate | | | Maturity Date | | | Principal | | | Value | |
| | | | | | | | | | | | | | | | |
| | | | |
| Variable Rate Demand Notes§ (continued) | | | | | | | | | | | | | | | | |
New York Metropolitan Transportation Authority ROC RR 11 R-11645 (Transportation Revenue, FSA Insured)†† | | | 0.23 | % | | | 11/15/2025 | | | $ | 16,100,000 | | | $ | 16,100,000 | |
New York PFOTER (Miscellaneous Revenue)†† | | | 0.34 | | | | 06/15/2053 | | | | 20,710,000 | | | | 20,710,000 | |
New York State Dormitory Authority St. John University Series B-1 (Education Revenue, Bank of America NA LOC) | | | 0.05 | | | | 07/01/2034 | | | | 19,525,000 | | | | 19,525,000 | |
New York State Housing Finance Agency Affordable Housing 8 East 102 2nd Street (Housing Revenue, Bank of America NA LOC) | | | 0.07 | | | | 05/01/2044 | | | | 35,000,000 | | | | 35,000,000 | |
New York State Housing Finance Agency Series A (Housing Revenue, FHLMC Insured) | | | 0.05 | | | | 11/01/2037 | | | | 10,000,000 | | | | 10,000,000 | |
New York State Housing Finance Agency Series A (Housing Revenue, Bank of America NA LOC) | | | 0.06 | | | | 11/01/2044 | | | | 32,500,000 | | | | 32,500,000 | |
New York State Urban Development Corporate Revenue Series A3D (Tax Revenue) | | | 0.08 | | | | 03/15/2033 | | | | 18,500,000 | | | | 18,500,000 | |
New York State Urban Development Corporate Revenue Series A3A (Tax Revenue) | | | 0.08 | | | | 03/15/2033 | | | | 24,150,000 | | | | 24,150,000 | |
New York State Urban Development Corporate Revenue Series A3B (Tax Revenue) | | | 0.15 | | | | 03/15/2033 | | | | 74,615,000 | | | | 74,615,000 | |
| | | | |
| | | | | | | | | | | | | | | 542,185,000 | |
| | | | | | | | | | | | | | | | |
| | | | |
Ohio: 0.63% | | | | | | | | | | | | | | | | |
| | | | |
| Variable Rate Demand Notes§: 0.63% | | | | | | | | | | | | | | | | |
Cleveland-Cuyahoga County OH Port Authority Carnagie 89th Garage & Service Center LLC Project Series 2007 (Health Revenue, JPMorgan Chase Bank LOC) | | | 0.10 | | | | 01/01/2037 | | | | 33,500,000 | | | | 33,500,000 | |
Cuyahoga County OH Housing Corporation Series A (Housing Revenue, PNC Bank NA LOC) | | | 0.06 | | | | 08/01/2042 | | | | 6,000,000 | | | | 6,000,000 | |
Franklin County OH Presbyterian Series A (Health Revenue, PNC Bank NA LOC) | | | 0.06 | | | | 07/01/2036 | | | | 11,450,000 | | | | 11,450,000 | |
Hamilton County OH Parking System (Miscellaneous Revenue, JPMorgan Chase & Company LOC) | | | 0.09 | | | | 12/01/2026 | | | | 12,400,000 | | | | 12,400,000 | |
Lake County OH Hospital Facilities Series A (Health Revenue, JPMorgan Chase Bank LOC) | | | 0.07 | | | | 08/15/2041 | | | | 9,945,000 | | | | 9,945,000 | |
Lancaster OH Port Authority Gas Series 2008 (Utilities Revenue) | | | 0.08 | | | | 05/01/2038 | | | | 19,000,000 | | | | 19,000,000 | |
Ohio HFA Residential Mortgage Project Series B (Housing Revenue) | | | 0.08 | | | | 09/01/2029 | | | | 56,435,000 | | | | 56,435,000 | |
Ohio HFA Residential Mortgage Project Series C (Housing Revenue) | | | 0.08 | | | | 03/01/2038 | | | | 21,185,000 | | | | 21,185,000 | |
Ohio State HEFR Ohio Dominican University Project (Education Revenue, JPMorgan Chase Bank LOC) | | | 0.08 | | | | 12/01/2037 | | | | 12,850,000 | | | | 12,850,000 | |
Ohio State University Hospitals Health System Incorporated Project Series 2008D (Education Revenue, JPMorgan Chase Bank LOC) | | | 0.06 | | | | 01/15/2035 | | | | 13,225,000 | | | | 13,225,000 | |
Wood County OH Hospital Facilities Wood County Hospital Association Project Series 2008 (Hospital Revenue, JPMorgan Chase Bank LOC) | | | 0.10 | | | | 03/01/2039 | | | | 34,100,000 | | | | 34,100,000 | |
| | | | |
| | | | | | | | | | | | | | | 230,090,000 | |
| | | | | | | | | | | | | | | | |
| | | | |
Oregon: 0.15% | | | | | | | | | | | | | | | | |
| | | | |
| Variable Rate Demand Notes§: 0.15% | | | | | | | | | | | | | | | | |
Forest City OR Residential Management Incorporated PFOTER (Miscellaneous Revenue)†† | | | 0.34 | | | | 07/26/2012 | | | | 26,075,000 | | | | 26,075,000 | |
Oregon Housing & Community Services Department Series E (Housing Revenue) | | | 0.19 | | | | 07/01/2038 | | | | 16,000,000 | | | | 16,000,000 | |
Oregon State Department PFOTER (Miscellaneous Revenue)†† | | | 0.34 | | | | 05/01/2035 | | | | 12,000,000 | | | | 12,000,000 | |
| | | | |
| | | | | | | | | | | | | | | 54,075,000 | |
| | | | | | | | | | | | | | | | |
| | | | |
| 22 | | Wells Fargo Advantage Heritage Money Market Fund | | Portfolio of Investments—July 31, 2011 (Unaudited) |
| | | | | | | | | | | | | | | | |
| Security Name | | Interest Rate | | | Maturity Date | | | Principal | | | Value | |
| | | | | | | | | | | | | | | | |
| | | | |
Pennsylvania: 0.65% | | | | | | | | | | | | | | | | |
| | | | |
| Variable Rate Demand Notes§: 0.65% | | | | | | | | | | | | | | | | |
Beaver County PA IDA FirstEnergy Nuclear Series B (IDR, Citibank NA LOC) | | | 0.06 | % | | | 12/01/2035 | | | $ | 25,105,000 | | | $ | 25,105,000 | |
Berks County PA Municipal Authority Reading Hospital & Education Center Project Series 2008A-1 (Hospital Revenue, Royal Bank of Canada LOC)†† | | | 0.08 | | | | 11/01/2011 | | | | 11,000,000 | | | | 11,000,000 | |
Delaware River Port Authority Series B (Transportation Revenue, Bank of America NA LOC) | | | 0.09 | | | | 01/01/2026 | | | | 114,000,000 | | | | 114,000,000 | |
Doylestown PA Hospital Authority Series B (Health Revenue, PNC Bank NA LOC) | | | 0.06 | | | | 07/01/2037 | | | | 17,700,000 | | | | 17,700,000 | |
Lancaster County PA Hospital Authority Health System Lancaster General Hospital (Hospital Revenue, Bank of America NA LOC) | | | 0.25 | | | | 07/01/2041 | | | | 11,510,000 | | | | 11,510,000 | |
Pennsylvania Housing Finance Agency Series 81C (Housing Revenue) | | | 0.06 | | | | 10/01/2034 | | | | 15,000,000 | | | | 15,000,000 | |
Pennsylvania Housing Finance Agency Series 85C (Housing Revenue, FNMA LOC) | | | 0.07 | | | | 10/01/2035 | | | | 10,000,000 | | | | 10,000,000 | |
Pennsylvania Housing Finance Agency Series C (Housing Revenue) | | | 0.07 | | | | 07/01/2020 | | | | 12,005,000 | | | | 12,005,000 | |
Philadelphia PA IDA Series B (Industrials, JPMorgan Chase Bank LOC) | | | 0.09 | | | | 10/01/2030 | | | | 21,500,000 | | | | 21,500,000 | |
| | | | |
| | | | | | | | | | | | | | | 237,820,000 | |
| | | | | | | | | | | | | | | | |
| | | | |
South Dakota: 0.14% | | | | | | | | | | | | | | | | |
| | | | |
| Variable Rate Demand Notes§: 0.14% | | | | | | | | | | | | | | | | |
South Dakota HEFA Sioux Valley Hospital & Health Systems Project Series 2001-C (Hospital Revenue, U.S. Bank NA LOC) | | | 0.09 | | | | 11/01/2019 | | | | 15,000,000 | | | | 15,000,000 | |
South Dakota Housing Development Authority Series C (Housing Revenue, FNMA Insured) | | | 0.17 | | | | 05/01/2037 | | | | 10,800,000 | | | | 10,800,000 | |
South Dakota State HEFA Avera Health Subseries A1 (Health Revenue, U.S. Bank NA LOC) | | | 0.08 | | | | 07/01/2038 | | | | 24,240,000 | | | | 24,240,000 | |
| | | | |
| | | | | | | | | | | | | | | 50,040,000 | |
| | | | | | | | | | | | | | | | |
| | | | |
Tennessee: 0.50% | | | | | | | | | | | | | | | | |
| | | | |
| Variable Rate Demand Notes§: 0.50% | | | | | | | | | | | | | | | | |
Johnson City TN Health & Educational Facilities Board (Health Revenue, U.S. Bank NA LOC) | | | 0.11 | | | | 07/01/2033 | | | | 8,955,000 | | | | 8,955,000 | |
Johnson City TN Health & Educational Facilities Board (Health Revenue, PNC Bank NA LOC) | | | 0.12 | | | | 07/01/2033 | | | | 7,585,000 | | | | 7,585,000 | |
Knox County TN Health Educational & Housing Facilities Board (Health Revenue, Bank of America NA LOC) | | | 0.09 | | | | 01/01/2033 | | | | 10,000,000 | | | | 10,000,000 | |
Metropolitan Government Nashville & Davidson County TN Stewarts Ferry Apartments (Housing Revenue, FHLMC Insured) | | | 0.11 | | | | 01/01/2034 | | | | 13,985,000 | | | | 13,985,000 | |
Montgomery County TN Public Building Authority Pooled Financing Revenue (Miscellaneous Revenue, Bank of America NA LOC) | | | 0.24 | | | | 07/01/2034 | | | | 33,895,000 | | | | 33,895,000 | |
Montgomery County TN Public Building Authority Pooled Financing Revenue (Miscellaneous Revenue, Bank of America NA LOC) | | | 0.24 | | | | 02/01/2036 | | | | 15,465,000 | | | | 15,465,000 | |
Sevier County TN Public Building Authority Local Government Public Improvement Series VI-L-1 (Miscellaneous Revenue, Guaranteed Student Loans Insured) | | | 0.11 | | | | 06/01/2020 | | | | 26,870,000 | | | | 26,870,000 | |
Sullivan County TN Health Educational & Housing Facilities Board Wellmont Health System Project (Health Revenue, JPMorgan Chase Bank LOC) | | | 0.10 | | | | 09/01/2032 | | | | 29,790,000 | | | | 29,790,000 | |
Tennessee Municipal Energy Acquisition Corporation (Utilities Revenue) | | | 0.17 | | | | 12/01/2016 | | | | 35,775,000 | | | | 35,775,000 | |
| | | | |
| | | | | | | | | | | | | | | 182,320,000 | |
| | | | | | | | | | | | | | | | |
| | | | | | |
| Portfolio of Investments—July 31, 2011 (Unaudited) | | Wells Fargo Advantage Heritage Money Market Fund | | | 23 | |
| | | | | | | | | | | | | | | | |
| Security Name | | Interest Rate | | | Maturity Date | | �� | Principal | | | Value | |
| | | | | | | | | | | | | | | | |
| | | | |
Texas: 1.67% | | | | | | | | | | | | | | | | |
| | | | |
| Variable Rate Demand Notes§: 1.67% | | | | | | | | | | | | | | | | |
Austin TX Airport System Series A (Airport Revenue, State Street Bank & Trust Company LOC) | | | 0.08 | % | | | 11/15/2017 | | | $ | 13,200,000 | | | $ | 13,200,000 | |
Gregg County TX Health Facilities Development Corporation (Hospital Revenue, JPMorgan Chase Bank LOC, Radian Insured) | | | 0.33 | | | | 10/01/2029 | | | | 21,200,000 | | | | 21,200,000 | |
Harris County TX Cultural Education Facilities Finance Corporation Hermann Health Series D2 (Health Revenue, JPMorgan Chase & Company LOC) | | | 0.07 | | | | 06/01/2029 | | | | 500,000 | | | | 500,000 | |
Harris County TX Cultural Education Facilities Finance Corporation Revenue YMCA Series A (Miscellaneous Revenue, JPMorgan Chase Bank LOC) | | | 0.20 | | | | 06/01/2038 | | | | 23,800,000 | | | | 23,800,000 | |
Harris County TX Cultural Education Facilities Finance Corporation Revenue YMCA Series B (Miscellaneous Revenue, Bank of America NA LOC) | | | 0.20 | | | | 06/01/2038 | | | | 25,000,000 | | | | 25,000,000 | |
Harris County TX Cultural Education Facilities Finance Corporation Revenue YMCA Series E (Miscellaneous Revenue, JPMorgan Chase Bank LOC) | | | 0.20 | | | | 06/01/2038 | | | | 25,000,000 | | | | 25,000,000 | |
Harris County TX Industrial Development Corporation Solid Waste Disposal Deer Park Refining Project Series A (Resource Recovery Revenue) | | | 0.24 | | | | 03/01/2023 | | | | 36,405,000 | | | | 36,405,000 | |
Houston TX Utilities System Series 2004B (Water & Sewer Revenue, State Street Bank & Trust Company LOC) | | | 0.05 | | | | 05/15/2034 | | | | 20,100,000 | | | | 20,100,000 | |
JPMorgan Chase PUTTER Trust Series 3812 (Miscellaneous Revenue)†† | | | 0.21 | | | | 08/31/2011 | | | | 260,700,000 | | | | 260,700,000 | |
Mission TX Economic Development Corporation (Miscellaneous Revenue, Bank of America NA LOC) | | | 0.13 | | | | 04/01/2022 | | | | 9,000,000 | | | | 9,000,000 | |
North Texas Higher Education Authority Incorporated (Education Revenue, Lloyds TSB Bank LOC, Guaranteed Student Loans Insured) | | | 0.07 | | | | 12/01/2032 | | | | 28,000,000 | | | | 28,000,000 | |
North Texas Higher Education Authority Incorporated Series B (Education Revenue, Bank of America NA LOC, Guaranteed Student Loans Insured) | | | 0.07 | | | | 12/01/2035 | | | | 10,000,000 | | | | 10,000,000 | |
North Texas Tollway Authority Revenue Series A (Transportation Revenue, Morgan Stanley Bank LOC) | | | 0.05 | | | | 01/01/2051 | | | | 12,500,000 | | | | 12,500,000 | |
North Texas Tollway Authority Revenue Series D (Transportation Revenue, JPMorgan Chase Bank LOC) | | | 0.05 | | | | 01/01/2049 | | | | 21,000,000 | | | | 21,000,000 | |
Pasadena TX Independent School District Series B (Education Revenue, AGM Insured) | | | 0.16 | | | | 02/01/2035 | | | | 63,095,000 | | | | 63,095,000 | |
Texas State Taxable Product Development Program Series A (Miscellaneous Revenue) | | | 0.15 | | | | 06/01/2045 | | | | 2,100,000 | | | | 2,100,000 | |
Texas State Veterans Housing Class ID (GO-Local) | | | 0.13 | | | | 06/01/2020 | | | | 4,585,000 | | | | 4,585,000 | |
Texas State Veterans Housing Class II Series E (GO-Local) | | | 0.13 | | | | 12/01/2026 | | | | 20,560,000 | | | | 20,560,000 | |
Tyler TX Health Facilities Development Corporation Mother Frances Hospital Series B (Hospital Revenue, Bank of America NA LOC) | | | 0.18 | | | | 07/01/2020 | | | | 18,000,000 | | | | 18,000,000 | |
| | | | |
| | | | | | | | | | | | | | | 614,745,000 | |
| | | | | | | | | | | | | | | | |
| | | | |
Vermont: 0.01% | | | | | | | | | | | | | | | | |
| | | | |
| Variable Rate Demand Note§: 0.01% | | | | | | | | | | | | | | | | |
Vermont Student Assistance Corporation (Education Revenue, Lloyds Bank LOC) | | | 0.08 | | | | 12/15/2040 | | | | 5,520,000 | | | | 5,520,000 | |
| | | | | | | | | | | | | | | | |
| | | | |
| 24 | | Wells Fargo Advantage Heritage Money Market Fund | | Portfolio of Investments—July 31, 2011 (Unaudited) |
| | | | | | | | | | | | | | | | |
| Security Name | | Interest Rate | | | Maturity Date | | | Principal | | | Value | |
| | | | | | | | | | | | | | | | |
| | | | |
Virginia: 0.07% | | | | | | | | | | | | | | | | |
| | | | |
| Variable Rate Demand Notes§: 0.07% | | | | | | | | | | | | | | | | |
Harrisonburg VA Redevelopment & Housing Authority (Housing Revenue, Bank of America NA LOC) | | | 0.15 | % | | | 05/01/2026 | | | $ | 6,000,000 | | | $ | 6,000,000 | |
Norfolk VA Redevelopment & Housing Authority Old Dominion University Project (Housing Revenue, Bank of America NA LOC) | | | 0.26 | | | | 08/01/2033 | | | | 19,550,000 | | | | 19,550,000 | |
| | | | |
| | | | | | | | | | | | | | | 25,550,000 | |
| | | | | | | | | | | | | | | | |
| | | | |
Washington: 0.28% | | | | | | | | | | | | | | | | |
| | | | |
| Other Municipal Debt: 0.07% | | | | | | | | | | | | | | | | |
Providence WA Health & Services Series 08-A (Miscellaneous Revenue, Bank of America NA LOC) | | | 0.26 | | | | 08/01/2011 | | | | 26,000,000 | | | | 26,000,000 | |
| | | | | | | | | | | | | | | | |
| | | | |
| Variable Rate Demand Notes§: 0.21% | | | | | | | | | | | | | | | | |
JPMorgan Chase PUTTER Trust (Utilities Revenue)†† | | | 0.23 | | | | 02/01/2040 | | | | 8,000,000 | | | | 8,000,000 | |
Port Tacoma WA Various Lien Series B (Port Authority Revenue, Bank of America NA LOC) | | | 0.22 | | | | 12/01/2044 | | | | 19,900,000 | | | | 19,900,000 | |
Washington State HEFAR University of Puget Sound Series B (Education Revenue, Bank of America NA LOC) | | | 0.11 | | | | 10/01/2036 | | | | 12,000,000 | | | | 12,000,000 | |
Washington State MFHR Merrill Gardens Kirkland Series A (Housing Revenue, Bank of America NA LOC) | | | 0.18 | | | | 04/15/2041 | | | | 29,240,000 | | | | 29,240,000 | |
Washington State MFHR Regency Park Project Series A (Housing Revenue, FHLMC Insured) | | | 0.20 | | | | 06/01/2027 | | | | 7,805,000 | | | | 7,805,000 | |
| | | | |
| | | | | | | | | | | | | | | 76,945,000 | |
| | | | | | | | | | | | | | | | |
| | | | |
West Virginia: 0.04% | | | | | | | | | | | | | | | | |
| | | | |
| Variable Rate Demand Note§: 0.04% | | | | | | | | | | | | | | | | |
Cabell County WV University Facilities (Education Revenue, Bank of America NA LOC) | | | 0.11 | | | | 07/01/2039 | | | | 15,995,000 | | | | 15,995,000 | |
| | | | | | | | | | | | | | | | |
| | | | |
Wisconsin: 0.13% | | | | | | | | | | | | | | | | |
| | | | |
| Variable Rate Demand Notes§: 0.13% | | | | | | | | | | | | | | | | |
Wisconsin Housing & EDA Home Ownership Series D (Housing Revenue, FNMA LOC, GO of Authority Insured) | | | 0.08 | | | | 09/01/2035 | | | | 7,515,000 | | | | 7,515,000 | |
Wisconsin Housing & EDA Series F (Housing Revenue, GO of Authority Insured) | | | 0.15 | | | | 05/01/2030 | | | | 8,320,000 | | | | 8,320,000 | |
Wisconsin Housing & EDA Series F (Housing Revenue, GO of Authority Insured) | | | 0.15 | | | | 11/01/2030 | | | | 14,520,000 | | | | 14,520,000 | |
Wisconsin State HEFAR Medical College Series B (Education Revenue, U.S. Bank NA LOC) | | | 0.04 | | | | 12/01/2033 | | | | 18,700,000 | | | | 18,700,000 | |
| | | | |
| | | | | | | | | | | | | | | 49,055,000 | |
| | | | | | | | | | | | | | | | |
| | | | |
Wyoming: 0.18% | | | | | | | | | | | | | | | | |
| | | | |
| Variable Rate Demand Notes§: 0.18% | | | | | | | | | | | | | | | | |
Wyoming Student Loan Corporation (Education Revenue, Royal Bank of Canada LOC) | | | 0.08 | | | | 12/01/2043 | | | | 36,150,000 | | | | 36,150,000 | |
Wyoming Student Loan Corporation Series A-1 (Education Revenue, Royal Bank of Canada LOC) | | | 0.08 | | | | 06/01/2035 | | | | 31,595,000 | | | | 31,595,000 | |
| | | | |
| | | | | | | | | | | | | | | 67,745,000 | |
| | | | | | | | | | | | | | | | |
| | | | |
Total Municipal Bonds and Notes (Cost $6,100,603,500) | | | | | | | | | | | | | | | 6,100,603,500 | |
| | | | | | | | | | | | | | | | |
| | | | | | |
| Portfolio of Investments—July 31, 2011 (Unaudited) | | Wells Fargo Advantage Heritage Money Market Fund | | | 25 | |
| | | | | | | | | | | | | | | | |
| Security Name | | Interest Rate | | | Maturity Date | | | Principal | | | Value | |
| | | | | | | | | | | | | | | | |
| | | | |
| Other Instruments: 1.09% | | | | | | | | | | | | | | | | |
Alaska Housing Finance Corporation Municipal Commercial Paper^ | | | 0.20 | % | | | 08/16/2011 | | | $ | 8,300,000 | | | $ | 8,299,274 | |
Bank of America Bankers Acceptance Note^ | | | 0.20 | | | | 08/31/2011 | | | | 34,000,000 | | | | 33,994,050 | |
ING Bank NV Floating Rate Note±†† | | | 0.78 | | | | 02/10/2012 | | | | 121,000,000 | | | | 121,000,000 | |
ING Bank NV Floating Rate Note±†† | | | 0.78 | | | | 02/02/2012 | | | | 154,000,000 | | | | 154,000,000 | |
Merrill Lynch PFOTER Floating Rate Note±††§ | | | 0.39 | | | | 04/01/2026 | | | | 23,075,000 | | | | 23,075,000 | |
SF Tarns LLC Floating Rate Note±§ | | | 0.18 | | | | 12/01/2025 | | | | 14,610,000 | | | | 14,610,000 | |
St. Joseph County IN Municipal Commercial Paper^ | | | 0.19 | | | | 08/04/2011 | | | | 5,007,000 | | | | 5,006,896 | |
Swedish Export Credit Floating Rate Note±†† | | | 0.37 | | | | 10/14/2011 | | | | 40,000,000 | | | | 40,009,532 | |
| | | | |
Total Other Instruments (Cost $399,994,752) | | | | | | | | | | | | | | | 399,994,752 | |
| | | | | | | | | | | | | | | | |
| | | | |
| Government Agency Debt: 0.31% | | | | | | | | | | | | | | | | |
FHLMC± | | | 0.11 | | | | 02/02/2012 | | | | 115,000,000 | | | | 114,953,082 | |
| | | | |
Total Government Agency Debt (Cost $114,953,082) | | | | | | | | | | | | | | | 114,953,082 | |
| | | | | | | | | | | | | | | | |
| | | | |
Other Notes: 3.33% | | | | | | | | | | | | | | | | |
| | | | |
| Corporate Bonds and Notes: 3.20% | | | | | | | | | | | | | | | | |
American Association of Retired Persons§ | | | 0.12 | | | | 05/01/2031 | | | | 10,000,000 | | | | 10,000,000 | |
American Express Bank FSB± | | | 1.17 | | | | 12/09/2011 | | | | 176,000,000 | | | | 176,625,302 | |
Bank of America Corporation± | | | 0.95 | | | | 12/02/2011 | | | | 89,000,000 | | | | 89,239,087 | |
Bank of America Corporation± | | | 1.07 | | | | 12/02/2011 | | | | 145,200,000 | | | | 145,626,426 | |
Baptist Hospital Incorporated±§ | | | 0.13 | | | | 02/01/2040 | | | | 15,575,000 | | | | 15,575,000 | |
Bear Stearns & Companies Incorporated± | | | 0.47 | | | | 08/15/2011 | | | | 28,085,000 | | | | 28,086,880 | |
Citigroup Funding Incorporated± | | | 0.58 | | | | 04/30/2012 | | | | 145,000,000 | | | | 145,423,408 | |
General Electric Capital Corporation± | | | 0.45 | | | | 03/12/2012 | | | | 96,000,000 | | | | 96,145,134 | |
General Electric Capital Corporation± | | | 1.18 | | | | 12/09/2011 | | | | 140,000,000 | | | | 140,489,824 | |
Independence Place Fort Campbell Patriots LLC±§ | | | 0.24 | | | | 01/01/2040 | | | | 8,480,000 | | | | 8,480,000 | |
JPMorgan Chase & Company± | | | 0.48 | | | | 06/15/2012 | | | | 52,000,000 | | | | 52,124,761 | |
JPMorgan Chase & Company± | | | 0.95 | | | | 12/02/2011 | | | | 135,000,000 | | | | 135,362,338 | |
Seariver Maritime Incorporated(i)± | | | 0.35 | | | | 10/01/2011 | | | | 2,650,000 | | | | 2,650,000 | |
UBS AG± | | | 1.36 | | | | 02/23/2012 | | | | 128,795,000 | | | | 129,417,798 | |
| | | | |
| | | | | | | | | | | | | | | 1,175,245,958 | |
| | | | | | | | | | | | | | | | |
| | | | |
| Yankee Corporate Bonds and Notes: 0.13% | | | | | | | | | | | | | | | | |
Eksportfinans ASA± | | | 0.26 | | | | 09/22/2011 | | | | 48,000,000 | | | | 48,000,000 | |
| | | | |
Total Other Notes (Cost $1,223,245,958) | | | | | | | | | | | | | | | 1,223,245,958 | |
| | | | | | | | | | | | | | | | |
| | | | |
| Repurchase Agreements(z): 2.51% | | | | | | | | | | | | | | | | |
Barclays Capital Incorporated, dated 07/29/2011, maturity value $435,727,703(1) | | | 0.17 | | | | 08/01/2011 | | | | 435,721,531 | | | | 435,721,531 | |
Citigroup Global Markets, dated 07/29/2011, maturity value $438,008,030(2) | | | 0.22 | | | | 08/01/2011 | | | | 438,000,000 | | | | 438,000,000 | |
Deutsche Bank Securities, dated 07/29/2011, maturity value $49,100,818(3) | | | 0.20 | | | | 08/01/2011 | | | | 49,100,000 | | | | 49,100,000 | |
| | | | |
Total Repurchase Agreements (Cost $922,821,531) | | | | | | | | | | | | | | | 922,821,531 | |
| | | | | | | | | | | | | | | | |
| | | | |
| | | Yield | | | | | | | | | | |
| | | | |
Treasury Debt: 3.48% | | | | | | | | | | | | | | | | |
US Treasury Bill | | | 0.12 | | | | 10/06/2011 | | | | 548,000,000 | | | | 547,879,440 | |
US Treasury Bill | | | 0.15 | | | | 08/25/2011 | | | | 294,000,000 | | | | 293,969,620 | |
| | | | |
| 26 | | Wells Fargo Advantage Heritage Money Market Fund | | Portfolio of Investments—July 31, 2011 (Unaudited) |
| | | | | | | | | | | | | | | | |
| Security Name | | Yield | | | Maturity Date | | | Principal | | | Value | |
| | | | | | | | | | | | | | | | |
| | | | |
| Treasury Debt (continued) | | | | | | | | | | | | | | | | |
US Treasury Bill | | | 0.16 | % | | | 08/11/2011 | | | $ | 146,000,000 | | | $ | 145,992,700 | |
US Treasury Bill | | | 0.16 | | | | 08/18/2011 | | | | 287,000,000 | | | | 286,977,638 | |
| | | | |
Total Treasury Debt (Cost $1,274,819,398) | | | | | | | | | | | | | | | 1,274,819,398 | |
| | | | | | | | | | | | | | | | |
| | | | | | | | |
| Total Investments in Securities | | | | | | | | |
| (Cost $34,190,908,401)* | | | 93.16 | % | | | 34,190,908,401 | |
Other Assets and Liabilities, Net | | | 6.84 | | | | 2,510,362,557 | |
| | | | | | | | |
| Total Net Assets | | | 100.00 | % | | $ | 36,701,270,958 | |
| | | | | | | | |
| ± | Variable rate investments. |
| †† | Security that may be resold to “qualified institutional buyers” under Rule 144A or securities offered pursuant to Section 4(2) of the Securities Act of 1933, as amended. |
| ^ | Zero coupon security. Rate represents yield to maturity. |
| § | These securities are subject to a demand feature which reduces the effective maturity. |
| | (1) | U.S. government securities, 3.50% to 5.00%, 11/1/2025 to 7/1/2041, market value including accrued interest is $448,793,177. |
| | (2) | U.S. government securities, 2.375% to 6.50%, 12/1/2017 to 7/1/2041, market value including accrued interest is $451,140,000. |
| | (3) | U.S. government securities, 1.00% to 5.50%, 4/30/2012 to 8/1/2041, market value including accrued interest is $50,505,279. |
| * | Cost for federal income tax purposes is substantially the same as for financial reporting purposes. |
The accompanying notes are an integral part of these financial statements.
| | | | | | |
| Statement of Assets and Liabilities—July 31, 2011 (Unaudited) | | Wells Fargo Advantage Heritage Money Market Fund | | | 27 | |
| | | | |
| | | | |
| |
Assets | | | | |
Investments in unaffiliated securities, at amortized cost | | $ | 34,190,908,401 | |
Cash | | | 2,137,521,054 | |
Receivable for investments sold | | | 369,374,161 | |
Receivable for Fund shares sold | | | 8,259,050 | |
Receivable for interest | | | 5,645,444 | |
Prepaid expenses and other assets | | | 581,740 | |
| | | | |
Total assets | | | 36,712,289,850 | |
| | | | |
| |
Liabilities | | | | |
Dividends payable | | | 794,769 | |
Payable for Fund shares redeemed | | | 3,618,999 | |
Advisory fee payable | | | 1,599,811 | |
Due to other related parties | | | 3,131,650 | |
Custodian and accounting fees payable | | | 710,171 | |
Trustees’ fees and expenses payable | | | 552,176 | |
Accrued expenses and other liabilities | | | 611,316 | |
| | | | |
Total liabilities | | | 11,018,892 | |
| | | | |
Total net assets | | $ | 36,701,270,958 | |
| | | | |
| |
NET ASSETS CONSIST OF | | | | |
Paid-in capital | | $ | 36,710,589,054 | |
Overdistributed net investment income | | | (519,010 | ) |
Accumulated net realized losses on investments | | | (8,799,086 | ) |
| | | | |
Total net assets | | $ | 36,701,270,958 | |
| | | | |
| |
COMPUTATION OF NET ASSET VALUE PER SHARE1 | | | | |
Net assets – Administrator Class | | $ | 954,565,610 | |
Shares outstanding – Administrator Class | | | 954,589,298 | |
Net asset value per share – Administrator Class | | | $1.00 | |
Net assets – Institutional Class | | $ | 13,555,818,636 | |
Shares outstanding – Institutional Class | | | 13,556,102,548 | |
Net asset value per share – Institutional Class | | | $1.00 | |
Net assets – Select Class | | $ | 21,179,060,389 | |
Shares outstanding – Select Class | | | 21,179,610,718 | |
Net asset value per share – Select Class | | | $1.00 | |
Net assets – Service Class | | $ | 1,011,826,323 | |
Shares outstanding – Service Class | | | 1,011,855,846 | |
Net asset value per share – Service Class | | | $1.00 | |
| 1. | The Fund has an unlimited number of authorized shares. |
The accompanying notes are an integral part of these financial statements.
| | | | |
| 28 | | Wells Fargo Advantage Heritage Money Market Fund | | Statement of Operations—Six Months Ended July 31, 2011 (Unaudited) |
| | | | |
| | | | |
| |
Investment income | | | | |
Interest | | $ | 61,648,888 | |
| | | | |
| |
Expenses | | | | |
Advisory fee | | | 22,798,647 | |
Administration fees | | | | |
Fund level | | | 7,583,430 | |
Administrator Class | | | 346,056 | |
Institutional Class | | | 6,032,720 | |
Select Class | | | 5,742,091 | |
Service Class | | | 667,756 | |
Shareholder servicing fees | | | | |
Administrator Class | | | 346,056 | |
Service Class | | | 1,369,819 | |
Custody and accounting fees | | | 1,132,888 | |
Professional fees | | | 19,009 | |
Registration fees | | | 84,461 | |
Shareholder report expenses | | | 7,410 | |
Trustees’ fees and expenses | | | 7,032 | |
Other fees and expenses | | | 434,214 | |
| | | | |
Total expenses | | | 46,571,589 | |
Less: Fee waivers and/or expense reimbursements | | | (10,595,632 | ) |
| | | | |
Net expenses | | | 35,975,957 | |
| | | | |
Net investment income | | | 25,672,931 | |
Net realized gains on investments | | | 366,753 | |
| | | | |
Net increase in net assets resulting from operations | | $ | 26,039,684 | |
| | | | |
The accompanying notes are an integral part of these financial statements.
| | | | | | |
| Statements of Changes in Net Assets | | Wells Fargo Advantage Heritage Money Market Fund | | | 29 | |
| | | | | | | | | | | | | | | | | | | | | | | | |
| | | Six Months Ended
July 31, 2011
(Unaudited) | | | Year Ended
January 31, 20111 | | | Year Ended
February 28, 2010 | |
| | | | | | |
Operations | | | | | | | | | | | | | | | | | | | | | | | | |
Net investment income | | | | | | $ | 25,672,931 | | | | | | | $ | 62,703,788 | | | | | | | $ | 70,206,954 | |
Net realized gains on investments | | | | | | | 366,753 | | | | | | | | 1,448,131 | | | | | | | | 344,536 | |
| | | | | | | | | | | | | | | | | | | | | | | | |
Net increase in net assets resulting from operations | | | | | | | 26,039,684 | | | | | | | | 64,151,919 | | | | | | | | 70,551,490 | |
| | | | | | | | | | | | | | | | | | | | | | | | |
| | | | | | |
Distributions to shareholders from | | | | | | | | | | | | | | | | | | | | | | | | |
Net investment income | | | | | | | | | | | | | | | | | | | | | | | | |
Administrator Class | | | | | | | (34,607 | ) | | | | | | | (292,223 | ) | | | | | | | (2,111,671 | ) |
Institutional Class | | | | | | | (5,438,240 | ) | | | | | | | (14,725,776 | ) | | | | | | | (26,527,153 | ) |
Select Class | | | | | | | (20,144,436 | ) | | | | | | | (47,598,524 | ) | | | | | | | (41,563,658 | ) |
Service Class | | | | | | | (55,648 | ) | | | | | | | (87,265 | )2 | | | | | | | NA | |
Net realized gains | | | | | | | | | | | | | | | | | | | | | | | | |
Administrator Class | | | | | | | 0 | | | | | | | | (2,865 | ) | | | | | | | (25,105 | ) |
Institutional Class | | | | | | | 0 | | | | | | | | (43,512 | ) | | | | | | | (140,895 | ) |
Select Class | | | | | | | 0 | | | | | | | | (80,550 | ) | | | | | | | (339,065 | ) |
Service Class | | | | | | | 0 | | | | | | | | (4,072 | )2 | | | | | | | NA | |
| | | | | | | | | | | | | | | | | | | | | | | | |
Total distributions to shareholders | | | | | | | (25,672,931 | ) | | | | | | | (62,834,787 | ) | | | | | | | (70,707,547 | ) |
| | | | | | | | | | | | | | | | | | | | | | | | |
| | | | | | |
| | | Shares | | | | | | Shares | | | | | | Shares | | | | |
| | | | | | |
Capital share transactions | | | | | | | | | | | | | | | | | | | | | | | | |
Proceeds from shares sold | | | | | | | | | | | | | | | | | | | | | | | | |
Administrator Class | | | 1,061,522,590 | | | | 1,061,522,590 | | | | 2,460,151,577 | | | | 2,460,151,577 | | | | 5,342,787,207 | | | | 5,342,787,207 | |
Institutional Class | | | 39,482,213,232 | | | | 39,482,213,232 | | | | 51,065,345,232 | | | | 51,065,345,232 | | | | 38,369,402,627 | | | | 38,369,402,627 | |
Select Class | | | 95,765,853,283 | | | | 95,765,853,283 | | | | 151,485,998,729 | | | | 151,485,998,729 | | | | 88,025,965,787 | | | | 88,025,965,787 | |
Service Class | | | 2,522,287,219 | | | | 2,522,287,219 | | | | 2,528,674,572 | 2 | | | 2,528,674,572 | 2 | | | NA | | | | NA | |
| | | | | | | | | | | | | | | | | | | | | | | | |
| | | | | | | 138,831,876,324 | | | | | | | | 207,540,170,110 | | | | | | | | 131,738,155,621 | |
| | | | | | | | | | | | | | | | | | | | | | | | |
Reinvestment of distributions | | | | | | | | | | | | | | | | | | | | | | | | |
Administrator Class | | | 13,161 | | | | 13,161 | | | | 100,779 | | | | 100,779 | | | | 1,025,956 | | | | 1,025,956 | |
Institutional Class | | | 1,274,723 | | | | 1,274,723 | | | | 4,562,596 | | | | 4,562,596 | | | | 12,573,701 | | | | 12,573,701 | |
Select Class | | | 11,169,352 | | | | 11,169,352 | | | | 28,303,847 | | | | 28,303,847 | | | | 25,785,354 | | | | 25,785,354 | |
Service Class | | | 12,055 | | | | 12,055 | | | | 21,311 | 2 | | | 21,311 | 2 | | | NA | | | | NA | |
| | | | | | | | | | | | | | | | | | | | | | | | |
| | | | | | | 12,469,291 | | | | | | | | 32,988,533 | | | | | | | | 39,385,011 | |
| | | | | | | | | | | | | | | | | | | | | | | | |
Payment for shares redeemed | | | | | | | | | | | | | | | | | | | | | | | | |
Administrator Class | | | (801,798,701 | ) | | | (801,798,701 | ) | | | (2,966,523,373 | ) | | | (2,966,523,373 | ) | | | (5,061,246,976 | ) | | | (5,061,246,976 | ) |
Institutional Class | | | (40,872,448,301 | ) | | | (40,872,448,301 | ) | | | (50,573,905,288 | ) | | | (50,573,905,288 | ) | | | (36,448,408,534 | ) | | | (36,448,408,534 | ) |
Select Class | | | (101,228,765,734 | ) | | | (101,228,765,734 | ) | | | (147,372,639,869 | ) | | | (147,372,639,869 | ) | | | (71,628,706,815 | ) | | | (71,628,706,815 | ) |
Service Class | | | (2,742,009,362 | ) | | | (2,742,009,362 | ) | | | (2,593,348,482 | )2 | | | (2,593,348,482 | )2 | | | NA | | | | NA | |
| | | | | | | | | | | | | | | | | | | | | | | | |
| | | | | | | (145,645,022,098 | ) | | | | | | | (203,506,417,012 | ) | | | | | | | (113,138,362,325 | ) |
| | | | | | | | | | | | | | | | | | | | | | | | |
Net asset value of shares issued in acquisitions | | | | | | | | | | | | | | | | | | | | | | | | |
Institutional Class | | | 0 | | | | 0 | | | | 6,653,453,383 | | | | 6,650,861,250 | | | | 0 | | | | 0 | |
Service Class | | | 0 | | | | 0 | | | | 1,296,218,533 | | | | 1,296,200,072 | | | | NA | | | | NA | |
| | | | | | | | | | | | | | | | | | | | | | | | |
| | | | | | | 0 | | | | | | | | 7,947,061,322 | | | | | | | | 0 | |
| | | | | | | | | | | | | | | | | | | | | | | | |
Net increase (decrease) in net assets resulting from capital share transactions | | | | | | | (6,800,676,483 | ) | | | | | | | 12,013,802,953 | | | | | | | | 18,639,178,307 | |
| | | | | | | | | | | | | | | | | | | | | | | | |
Total increase (decrease) in net assets | | | | | | | (6,800,309,730 | ) | | | | | | | 12,015,120,085 | | | | | | | | 18,639,022,250 | |
| | | | | | | | | | | | | | | | | | | | | | | | |
| | | | | | |
Net assets | | | | | | | | | | | | | | | | | | | | | | | | |
Beginning of period | | | | | | | 43,501,580,688 | | | | | | | | 31,486,460,603 | | | | | | | | 12,847,438,353 | |
| | | | | | | | | | | | | | | | | | | | | | | | |
End of period | | | | | | $ | 36,701,270,958 | | | | | | | $ | 43,501,580,688 | | | | | | | $ | 31,486,460,603 | |
| | | | | | | | | | | | | | | | | | | | | | | | |
Undistributed (overdistributed) net investment income | | | | | | $ | (519,010 | ) | | | | | | $ | (519,010 | ) | | | | | | $ | 4,473 | |
| | | | | | | | | | | | | | | | | | | | | | | | |
| 1. | For the eleven months ended January 31, 2011. The Fund changed its fiscal year end from February 28 to January 31, effective January 31, 2011. |
| 2. | Class commenced operations on June 30, 2010. |
The accompanying notes are an integral part of these financial statements.
| | | | |
| 30 | | Wells Fargo Advantage Heritage Money Market Fund | | Financial Highlights |
(For a share outstanding throughout each period)
| | | | | | | | | | | | | | | | | | | | | | | | | | | | |
| | | Six Months Ended
July 31, 2011
(Unaudited) | | | Year Ended
January 31,
20111 | | | Year Ended February 28, | |
| Administrator Class | | | | 2010 | | | 2009 | | | 2008 | | | 2007 | | | 20062 | |
Net asset value, beginning of period | | $ | 1.00 | | | $ | 1.00 | | | $ | 1.00 | | | $ | 1.00 | | | $ | 1.00 | | | $ | 1.00 | | | $ | 1.00 | |
Net investment income | | | 0.00 | 3 | | | 0.00 | 3 | | | 0.00 | 3 | | | 0.02 | | | | 0.05 | | | | 0.05 | | | | 0.01 | |
Net realized gains (losses) on investments | | | 0.00 | 3 | | | 0.00 | 3 | | | 0.00 | 3 | | | 0.00 | | | | 0.00 | | | | 0.00 | | | | 0.00 | |
| | | | | | | | | | | | | | | | | | | | | | | | | | | | |
Total from investment operations | | | 0.00 | 3 | | | 0.00 | 3 | | | 0.00 | 3 | | | 0.02 | | | | 0.05 | | | | 0.05 | | | | 0.01 | |
Distributions to shareholders from | | | | | | | | | | | | | | | | | | | | | | | | | | | | |
Net investment income | | | (0.00 | )3 | | | (0.00 | )3 | | | (0.00 | )3 | | | (0.02 | ) | | | (0.05 | ) | | | (0.05 | ) | | | (0.01 | ) |
Net realized gains | | | 0.00 | | | | (0.00 | )3 | | | (0.00 | )3 | | | (0.00 | )3 | | | 0.00 | | | | 0.00 | | | | 0.00 | |
| | | | | | | | | | | | | | | | | | | | | | | | | | | | |
Total distributions to shareholders | | | (0.00 | )3 | | | (0.00 | )3 | | | (0.00 | )3 | | | (0.02 | ) | | | (0.05 | ) | | | (0.05 | ) | | | (0.01 | ) |
Net asset value, end of period | | $ | 1.00 | | | $ | 1.00 | | | $ | 1.00 | | | $ | 1.00 | | | $ | 1.00 | | | $ | 1.00 | | | $ | 1.00 | |
Total return4 | | | 0.00 | % | | | 0.03 | % | | | 0.21 | % | | | 2.19 | % | | | 4.90 | % | | | 4.91 | % | | | 1.29 | % |
Ratios to average net assets (annualized) | | | | | | | | | | | | | | | | | | | | | | | | | | | | |
Gross expenses | | | 0.34 | % | | | 0.34 | % | | | 0.37 | % | | | 0.38 | % | | | 0.38 | % | | | 0.40 | % | | | 0.40 | % |
Net expenses | | | 0.26 | % | | | 0.31 | % | | | 0.33 | % | | | 0.34 | % | | | 0.34 | % | | | 0.38 | % | | | 0.38 | % |
Net investment income | | | 0.01 | % | | | 0.03 | % | | | 0.17 | % | | | 2.09 | % | | | 4.68 | % | | | 4.80 | % | | | 3.91 | % |
Supplemental data | | | | | | | | | | | | | | | | | | | | | | | | | | | | |
Net assets, end of period (000’s omitted) | | | $954,566 | | | | $694,823 | | | | $1,201,158 | | | | $918,595 | | | | $608,865 | | | | $287,293 | | | | $288,971 | |
| 1. | For the eleven months ended January 31, 2010. The Fund changed its fiscal year end from February 28 to January 31, effective January 31, 2011. |
| 2. | For the four months ended February 28, 2006. The Fund changed its fiscal year end from October 31 to February 28, effective February 28, 2006. |
| 3. | Amount is less than $0.005. |
| 4. | Returns for periods of less than one year are not annualized. |
The accompanying notes are an integral part of these financial statements.
| | | | | | |
| Financial Highlights | | Wells Fargo Advantage Heritage Money Market Fund | | | 31 | |
(For a share outstanding throughout each period)
| | | | | | | | | | | | | | | | | | | | | | | | | | | | |
| | | Six Months Ended
July 31, 2011
(Unaudited) | | | Year Ended
January 31,
20111 | | | Year Ended February 28, | |
| Institutional Class | | | | 2010 | | | 2009 | | | 2008 | | | 2007 | | | 20062 | |
Net asset value, beginning of period | | $ | 1.00 | | | $ | 1.00 | | | $ | 1.00 | | | $ | 1.00 | | | $ | 1.00 | | | $ | 1.00 | | | $ | 1.00 | |
Net investment income | | | 0.00 | 3 | | | 0.00 | 3 | | | 0.00 | 3 | | | 0.02 | | | | 0.05 | | | | 0.05 | | | | 0.01 | |
Net realized gains (losses) on investments | | | 0.00 | 3 | | | 0.00 | 3 | | | 0.00 | 3 | | | 0.00 | | | | 0.00 | | | | 0.00 | | | | 0.00 | |
| | | | | | | | | | | | | | | | | | | | | | | | | | | | |
Total from investment operations | | | 0.00 | 3 | | | 0.00 | 3 | | | 0.00 | 3 | | | 0.02 | | | | 0.05 | | | | 0.05 | | | | 0.01 | |
Distributions to shareholders from | | | | | | | | | | | | | | | | | | | | | | | | | | | | |
Net investment income | | | (0.00 | )3 | | | (0.00 | )3 | | | (0.00 | )3 | | | (0.02 | ) | | | (0.05 | ) | | | (0.05 | ) | | | (0.01 | ) |
Net realized gains | | | 0.00 | | | | (0.00 | )3 | | | (0.00 | )3 | | | (0.00 | )3 | | | 0.00 | | | | 0.00 | | | | 0.00 | |
| | | | | | | | | | | | | | | | | | | | | | | | | | | | |
Total distributions to shareholders | | | (0.00 | )3 | | | (0.00 | )3 | | | (0.00 | )3 | | | (0.02 | ) | | | (0.05 | ) | | | (0.05 | ) | | | (0.01 | ) |
Net asset value, end of period | | $ | 1.00 | | | $ | 1.00 | | | $ | 1.00 | | | $ | 1.00 | | | $ | 1.00 | | | $ | 1.00 | | | $ | 1.00 | |
Total return4 | | | 0.04 | % | | | 0.13 | % | | | 0.33 | % | | | 2.32 | % | | | 5.06 | % | | | 5.12 | % | | | 1.36 | % |
Ratios to average net assets (annualized) | | | | | | | | | | | | | | | | | | | | | | | | | | | | |
Gross expenses | | | 0.22 | % | | | 0.22 | % | | | 0.25 | % | | | 0.27 | % | | | 0.26 | % | | | 0.28 | % | | | 0.28 | % |
Net expenses | | | 0.20 | % | | | 0.20 | % | | | 0.21 | % | | | 0.22 | % | | | 0.20 | % | | | 0.18 | % | | | 0.18 | % |
Net investment income | | | 0.07 | % | | | 0.14 | % | | | 0.31 | % | | | 2.09 | % | | | 4.77 | % | | | 4.98 | % | | | 4.13 | % |
Supplemental data | | | | | | | | | | | | | | | | | | | | | | | | | | | | |
Net assets, end of period (000’s omitted) | | | $13,555,819 | | | | $14,944,657 | | | | $7,795,659 | | | | $5,862,075 | | | | $1,579,225 | | | | $353,755 | | | | $419,084 | |
| 1. | For the eleven months ended January 31, 2011. The Fund changed its fiscal year end from February 28 to January 31, effective January 31, 2011. |
| 2. | For the four months ended February 28, 2006. The Fund changed its fiscal year end from October 31 to February 28, effective February 28, 2006. |
| 3. | Amount is less than $0.005. |
| 4. | Returns for periods of less than one year are not annualized. |
The accompanying notes are an integral part of these financial statements.
| | | | |
| 32 | | Wells Fargo Advantage Heritage Money Market Fund | | Financial Highlights |
(For a share outstanding throughout each period)
| | | | | | | | | | | | | | | | | | | | |
| | | Six Months Ended
July 31, 2011
(Unaudited) | | | Year Ended
January 31,
20111 | | | Year Ended February 28, | |
| Select Class | | | | 2010 | | | 2009 | | | 20082 | |
Net asset value, beginning of period | | $ | 1.00 | | | $ | 1.00 | | | $ | 1.00 | | | $ | 1.00 | | | $ | 1.00 | |
Net investment income (loss) | | | 0.00 | 3 | | | 0.00 | 3 | | | 0.00 | 3 | | | 0.02 | | | | 0.03 | |
Net realized gains (losses) on investments | | | 0.00 | 3 | | | 0.00 | 3 | | | 0.00 | 3 | | | 0.00 | | | | 0.00 | |
| | | | | | | | | | | | | | | | | | | | |
Total from investment operations | | | 0.00 | 3 | | | 0.00 | 3 | | | 0.00 | 3 | | | 0.02 | | | | 0.03 | |
Distributions to shareholders from | | | | | | | | | | | | | | | | | | | | |
Net investment income | | | (0.00 | )3 | | | (0.00 | )3 | | | (0.00 | )3 | | | (0.02 | ) | | | (0.03 | ) |
Net realized gains | | | 0.00 | | | | (0.00 | )3 | | | (0.00 | )3 | | | 0.00 | | | | 0.00 | |
| | | | | | | | | | | | | | | | | | | | |
Total distributions to shareholders | | | (0.00 | )3 | | | (0.00 | )3 | | | (0.00 | )3 | | | (0.02 | ) | | | (0.03 | ) |
Net asset value, end of period | | $ | 1.00 | | | $ | 1.00 | | | $ | 1.00 | | | $ | 1.00 | | | $ | 1.00 | |
Total return4 | | | 0.07 | % | | | 0.19 | % | | | 0.40 | % | | | 2.40 | % | | | 3.30 | % |
Ratios to average net assets (annualized) | | | | | | | | | | | | | | | | | | | | |
Gross expenses | | | 0.18 | % | | | 0.18 | % | | | 0.20 | % | | | 0.23 | % | | | 0.22 | % |
Net expenses | | | 0.13 | % | | | 0.13 | % | | | 0.14 | % | | | 0.15 | % | | | 0.13 | % |
Net investment income | | | 0.14 | % | | | 0.21 | % | | | 0.30 | % | | | 2.14 | % | | | 4.58 | % |
Supplemental data | | | | | | | | | | | | | | | | | | | | |
Net assets, end of period (000’s omitted) | | | $21,179,060 | | | | $26,630,573 | | | | $22,489,644 | | | | $6,066,768 | | | | $1,368,330 | |
| 1. | For the eleven months ended January 31, 2011. The Fund changed its fiscal year end from February 28 to January 31, effective January 31, 2011. |
| 2. | For the period from June 29, 2007 (commencement of class operations) to February 28, 2008. |
| 3. | Amount is less than $0.005. |
| 4. | Returns for periods of less than one year are not annualized. |
The accompanying notes are an integral part of these financial statements.
| | | | | | |
| Financial Highlights | | Wells Fargo Advantage Heritage Money Market Fund | | | 33 | |
(For a share outstanding throughout each period)
| | | | | | | | |
Service Class | | Six Months Ended
July 31, 2011
(Unaudited) | | | Year Ended
January 31,
20111 | |
Net asset value, beginning of period | | $ | 1.00 | | | $ | 1.00 | |
Net investment income | | | 0.00 | 2 | | | 0.00 | 2 |
Net realized gains (losses) on investments | | | 0.00 | 2 | | | 0.00 | 2 |
| | | | | | | | |
Total from investment operations | | | 0.00 | 2 | | | 0.00 | 2 |
Net investment income | | | (0.00 | )2 | | | (0.00 | )2 |
Net realized gains | | | 0.00 | | | | (0.00 | )2 |
| | | | | | | | |
Total distributions to shareholders | | | (0.00 | )2 | | | (0.00 | )2 |
Net asset value, end of period | | $ | 1.00 | | | $ | 1.00 | |
Total return3 | | | 0.00 | % | | | 0.01 | % |
Ratios to average net assets (annualized) | | | | | | | | |
Gross expenses | | | 0.51 | % | | | 0.51 | % |
Net expenses | | | 0.26 | % | | | 0.34 | % |
Net investment income | | | 0.01 | % | | | 0.01 | % |
Supplemental data | | | | | | | | |
Net assets, end of period (000’s omitted) | | | $1,011,826 | | | | $1,231,527 | |
| 1. | For the period from June 30, 2010 (commencement of class operations) to January 31, 2011. |
| 2. | Amount is less than $0.005. |
| 3. | Returns for periods of less than one year are not annualized. |
The accompanying notes are an integral part of these financial statements.
| | | | |
| 34 | | Wells Fargo Advantage Heritage Money Market Fund | | Notes to Financial Statements (Unaudited) |
1. ORGANIZATION
Wells Fargo Funds Trust (the “Trust”), a Delaware statutory trust organized on March 10, 1999, is an open-end management investment company registered under the Investment Company Act of 1940, as amended (the “1940 Act”). These financial statements report on Wells Fargo Advantage Heritage Money Market Fund (the “Fund”) which is a diversified series of the Trust.
2. SIGNIFICANT ACCOUNTING POLICIES
The following significant accounting policies, which are consistently followed in the preparation of the financial statements of the Fund, are in conformity with U.S. generally accepted accounting principles which require management to make estimates and assumptions that affect the reported amounts of assets and liabilities, disclosure of contingent assets and liabilities at the date of the financial statements, and the reported amounts of revenues and expenses during the reporting period. Actual results could differ from those estimates.
Securities valuation
As permitted under Rule 2a-7 of the 1940 Act, securities are valued at amortized cost, which approximates fair value.
The valuation techniques used by the Fund to measure fair value are consistent with the market approach, income approach and/or cost approach, where applicable, for each security type.
Repurchase agreements
The Fund may invest in repurchase agreements and may participate in pooled repurchase agreement transactions with other funds advised by Wells Fargo Funds Management, LLC. The repurchase agreements must be fully collateralized based on values that are marked-to- market daily. The collateral may be held by an agent bank under a tri-party agreement. It is the custodian’s responsibility to value collateral daily and to take action to obtain additional collateral as necessary to maintain market value equal to or greater than the resale price. The repurchase agreements are collateralized by instruments such as U.S. Treasury, federal agency, or high-grade corporate obligations. There could be potential loss to the Fund in the event that the Fund is delayed or prevented from exercising its rights to dispose of the collateral, including the risk of a possible decline in the value of the underlying obligations during the period in which the Fund seeks to assert its rights.
Security transactions and income recognition
Securities transactions are recorded on a trade date basis. Realized gains or losses are reported on the basis of identified cost of securities delivered.
Interest income is accrued daily and bond discounts are accreted and premiums are amortized daily based on the effective interest method. To the extent debt obligations are placed on non-accrual status, any related interest income may be reduced by writing off interest receivables when the collection of all or a portion of interest has become doubtful based on consistently applied procedures. If the issuer subsequently resumes interest payments or when the collectability of interest is reasonably assured, the debt obligation is removed from non-accrual status.
Distributions to shareholders
Distributions to shareholders from net investment income are accrued daily and paid monthly. Distributions from net realized gains, if any, are recorded on the ex-dividend date. Such distributions are determined in conformity with income tax regulations, which may differ from generally accepted accounting principles.
Federal and other taxes
The Fund intends to continue to qualify as a regulated investment company by distributing substantially all of its investment company taxable income and any net realized capital gains (after reduction for capital loss carryforwards) sufficient to relieve it from all, or substantially all, federal income taxes. Accordingly, no provision for federal income taxes was required.
The Fund’s income and federal excise tax returns and all financial records supporting those returns for the prior three fiscal years are subject to examination by the federal and Delaware revenue authorities.
As of January 31, 2011, the Fund had estimated net capital loss carryforwards, which were available to offset future net realized capital gains, in the amount of $9,266,371 expiring in 2017.
| | | | | | |
| Notes to Financial Statements (Unaudited) | | Wells Fargo Advantage Heritage Money Market Fund | | | 35 | |
Under the recently enacted Regulated Investment Company Modernization Act of 2010, the Fund will be permitted to carry forward capital losses incurred in taxable years beginning after December 22, 2010 for an unlimited period. However, any losses incurred during those future taxable years will be required to be utilized prior to the losses incurred in pre-enactment taxable years. As a result of this ordering rule, pre-enactment capital loss carryforwards may be more likely to expire unused. Additionally, post-enactment capital losses that are carried forward will retain their character as either short-term or long-term capital losses rather than being considered all short-term as under previous law.
Class allocations
The separate classes of shares offered by the Fund differ principally in shareholder servicing and administration fees. Shareholders of each class bear certain expenses that pertain to that particular class. All shareholders bear the common expenses of the Fund, earn income from the portfolio, and are allocated unrealized gains and losses pro rata based on the average daily net assets of each class, without distinction between share classes. Dividends are determined separately for each class based on income and expenses allocable to each class. Realized gains and losses are allocated to each class pro rata based upon the net assets of each class on the date realized. Differences in per share dividend rates generally result from the relative weightings of pro rata income and realized gain allocations and from differences in separate class expenses, including shareholder servicing and administration fees.
3. FAIR VALUATION MEASUREMENTS
Fair value measurements of investments are determined within a framework that has established a fair value hierarchy based upon the various data inputs utilized in determining the value of the Fund’s investments. The three-level hierarchy gives the highest priority to unadjusted quoted prices in active markets for identical assets or liabilities (Level 1) and the lowest priority to unobservable inputs (Level 3). The Fund’s investments are classified within the fair value hierarchy based on the lowest level of input that is significant to the fair value measurement. The inputs are summarized into three broad levels as follows:
| n | | Level 1 – quoted prices in active markets for identical securities |
| n | | Level 2 – other significant observable inputs (including quoted prices for similar securities, interest rates, prepayment speeds, credit risk, etc.) |
| n | | Level 3 – significant unobservable inputs (including the Fund’s own assumptions in determining the fair value of investments) |
The inputs or methodologies used for valuing securities are not necessarily an indication of the risk associated with investing in those securities.
At July 31 2011, all of the Fund’s investments in securities carried at fair value were designated as Level 2 since the primary inputs include credit quality of the issuer and short-term interest rates which are observable.
Further details on the major security types can be found in the Fund’s Portfolio of Investments.
4. TRANSACTIONS WITH AFFILIATES AND OTHER EXPENSES
Advisory fee
The Trust has entered into an advisory contract with Wells Fargo Funds Management, LLC (“Funds Management”), an indirect wholly owned subsidiary of Wells Fargo & Company (“Wells Fargo”). The adviser is responsible for implementing investment policies and guidelines and for supervising the sub-adviser, who is responsible for day-to-day portfolio management of the Fund.
Pursuant to the contract, Funds Management is entitled to receive an annual advisory fee of 0.10% of the average daily net assets of the Fund.
Funds Management may retain the services of certain sub-advisers to provide daily portfolio management to the Fund. The fees related to sub-advisory services are borne directly by the adviser and do not increase the overall fees paid by the Fund to the adviser. Wells Capital Management Incorporated, an affiliate of Funds Management, is the sub-adviser to the Fund and is entitled to receive a fee from the adviser at an annual rate starting at 0.05% and declining to 0.01% as the average daily net assets of the Fund increase.
| | | | |
| 36 | | Wells Fargo Advantage Heritage Money Market Fund | | Notes to Financial Statements (Unaudited) |
Administration and transfer agent fees
The Trust has entered into an administration agreement with Funds Management. Under this agreement, for providing administrative services, which includes paying fees and expenses for services provided by the transfer agent, sub-transfer agents, omnibus account servicers and record-keepers, Funds Management is entitled to receive from the Fund an annual fund level administration fee starting at 0.05% and declining to 0.03% as the average daily net assets of the Fund increase and a class level administration fee which is calculated based on the average daily net assets of each class as follows:
| | | | |
| | | Class Level Administration Fee | |
Administrator Class | | | 0.10 | % |
Institutional Class | | | 0.08 | |
Select Class | | | 0.04 | |
Service Class | | | 0.12 | |
Funds Management has contractually waived and/or reimbursed advisory and administration fees to the extent necessary to maintain certain net operating expense ratios for the Fund. Waiver of fees and/or reimbursement of expenses by Funds Management were made first from fund level expenses on a proportionate basis and then from class specific expenses.
Shareholder servicing fees
The Trust has entered into contracts with one or more shareholder servicing agents, whereby Service Class of the Fund is charged a fee at an annual rate of 0.25% of its average daily net assets. Administrator Class is charged a fee at an annual rate of 0.10% of its average daily net assets.
A portion of these total shareholder servicing fees were paid to affiliates of Wells Fargo.
5. ACQUISITIONS
After the close of business on July 9, 2010, the Fund acquired the net assets of Evergreen Institutional Money Market Fund and Evergreen Prime Cash Management Money Market Fund. The purpose of the transactions was to combine three funds with similar investment objectives and strategies. The acquisitions were accomplished by a tax-free exchange of all of the shares of Evergreen Institutional Money Market Fund and Evergreen Prime Cash Management Money Market Fund at an exchange ratio of 1.00 for each class. Shareholders holding Class AD, Class I, Class IS, Class IN and Class P shares of Evergreen Institutional Money Market Fund and Evergreen Prime Cash Management Money Market Fund received Institutional Class, Institutional Class, Service Class, Institutional Class and Service Class shares, respectively, of the Fund in the reorganizations. The investment portfolio of Evergreen Institutional Money Market Fund and Evergreen Prime Cash Management Money Market Fund with fair values of $5,242,726,421 and $2,728,433,070, respectively, and amortized costs of $5,242,726,421 and $2,728,433,070, respectively, at July 9, 2010, were the principal assets acquired the Fund. For financial reporting purposes, assets received and shares issued by the Fund were recorded at fair value; however, the cost basis of the investments received from Evergreen Institutional Money Market Fund and Evergreen Prime Cash Management Money Market Fund were carried forward to align ongoing reporting of the Fund’s realized and unrealized gains and losses with amounts distributable to shareholders for tax purposes. The value of net assets acquired and number of shares issued were as follows:
| | | | | | | | | | | | |
| Acquired Fund | | Value of Net Assets Acquired | | | Number of Shares Issued | |
Evergreen Institutional
Money Market Fund | | $ | 5,222,659,584 | | | | 4,163,101,010 | | | | Institutional Class | |
| | | | | | | 1,059,054,086 | | | | Service Class | |
Evergreen Prime Cash Management
Money Market Fund | | | 2,724,401,738 | | | | 2,490,352,373 | | | | Institutional Class | |
| | | | | | | 237,164,447 | | | | Service Class | |
The aggregate net assets of the Fund immediately before and after the acquisitions were $34,308,360,606 and $42,255,421,928, respectively.
| | | | | | |
| Notes to Financial Statements (Unaudited) | | Wells Fargo Advantage Heritage Money Market Fund | | | 37 | |
Assuming the acquisitions had been completed March 1, 2010, the beginning of the annual reporting period for the Fund, the pro forma results of operations for the period ended January 31, 2011 would have been:
| | | | |
Net investment income | | $ | 64,213,256 | |
Net realized gain on investments | | $ | 1,591,210 | |
Net increase in net assets resulting from operations | | $ | 65,804,466 | |
6. INDEMNIFICATION
Under the Trust’s organizational documents, the officers and directors are indemnified against certain liabilities that may arise out of performance of their duties to the Trust. Additionally, in the normal course of business, the Trust may enter into contracts with service providers that contain a variety of indemnification clauses. The Trust’s maximum exposure under these arrangements is dependent on future claims that may be made against the Fund and, therefore, cannot be estimated.
7. NEW ACCOUNTING PRONOUNCEMENTS
In May 2011, the Financial Accounting Standards Board (“FASB”) issued Accounting Standards Update (“ASU”) No. 2011-04 “Amendments to Achieve Common Fair Value Measurement and Disclosure Requirements in U.S. GAAP and IFRSs”. ASU No. 2011-04 amends FASB ASC Topic 820, Fair Value Measurements and Disclosures, to establish common requirements for measuring fair value and for disclosing information about fair value measurements in accordance with GAAP. The ASU is effective prospectively for interim and annual periods beginning after December 15, 2011.
In April 2011, FASB issued ASU No. 2011-03 “Reconsideration of Effective Control for Repurchase Agreements”. ASU No. 2011-03 amends FASB ASC Topic 860, Transfers and Servicing, specifically the criteria required to determine whether a repurchase agreement (repo) and similar agreements should be accounted for as sales of financial assets or secured borrowings with commitments. ASU No. 2011-03 changes the assessment of effective control by focusing on the transferor’s contractual rights and obligations and removing the criterion to assess its ability to exercise those rights or honor those obligations. This could result in changes to the way entities account for certain transactions including repurchase agreements, mortgage dollar rolls and reverse repurchase agreements. The ASU will become effective on a prospective basis for new transfers and modifications to existing transactions as of the beginning of the first interim or annual period beginning on or after December 15, 2011.
As of July 31, 2011, management of the Fund is currently assessing the potential impact, in addition to expanded financial statement disclosure, that may result from adopting these ASUs.
| | | | |
| 38 | | Wells Fargo Advantage Heritage Money Market Fund | | Other Information (Unaudited) |
PORTFOLIO HOLDINGS INFORMATION
The complete portfolio holdings for the Fund are publicly available on the Fund’s Web site (www.wellsfargo.com/advantagefunds) on a monthly, seven-day delayed basis. The Fund files its complete schedule of portfolio holdings with the SEC for the first and third quarters of each fiscal year on Form N-Q, which is available without charge by visiting the SEC Web site at www.sec.gov. In addition, the Fund’s Form N-Q may be reviewed and copied at the SEC’s Public Reference Room in Washington, DC, and at regional offices in New York City, at 233 Broadway, and in Chicago, at 175 West Jackson Boulevard, Suite 900. Information about the Public Reference Room may be obtained by calling 1-800-SEC-0330.
PROXY VOTING INFORMATION
A description of the policies and procedures that the Fund uses to determine how to vote proxies relating to portfolio securities is available without charge, upon request, by calling 1-800-222-8222, visiting our Web site at www.wellsfargo.com/advantagefunds, or visiting the SEC Web site at www.sec.gov. Information regarding how the Fund voted proxies relating to portfolio securities during the most recent 12-month period ended June 30 is available without charge on the Fund’s Web site at www.wellsfargo.com/advantagefunds or by visiting the SEC Web site at www.sec.gov.
| | | | | | |
| Other Information (Unaudited) | | Wells Fargo Advantage Heritage Money Market Fund | | | 39 | |
BOARD OF TRUSTEES
The following table provides basic information about the Board of Trustees (the “Trustees”) of the Trust and Officers of the Trust. This table should be read in conjunction with the Prospectus and the Statement of Additional Information1 of the Fund. Each of the Trustees and Officers listed below acts in identical capacities for the Wells Fargo Advantage family of funds, which consists of 144 funds comprising the Wells Fargo Funds Trust, Wells Fargo Variable Trust, Wells Fargo Master Trust and four closed-end funds (collectively the “Fund Complex”). All of the Trustees are also Members of the Audit and Governance Committees of each Trust in the Fund Complex. The mailing address of each Trustee and Officer is 525 Market Street, 12th Floor, San Francisco, CA 94105. Each Trustee and Officer serves an indefinite term, however, each Trustee serves such term until reaching the mandatory retirement age established by the Trustees.
Independent Trustees
| | | | | | |
Name and Year of Birth | | Position Held and Length of Service | | Principal Occupations During Past Five Years | | Other Directorships During
Past Five Years |
Peter G. Gordon
(Born 1942) | | Trustee, since 1998; Chairman, since 2005 | | Co-Founder, Chairman, President and CEO of Crystal Geyser. Water Company. Trustee Emeritus, Colby College | | Asset Allocation Trust |
Isaiah Harris, Jr.
(Born 1952) | | Trustee, since 2009 | | Retired. Prior thereto, President and CEO of BellSouth Advertising and Publishing Corp. from 2005 to 2007, President and CEO of BellSouth Enterprises from 2004 to 2005 and President of BellSouth Consumer Services from 2000 to 2003. Emeritus member of the Iowa State University Foundation Board of Governors. Emeritus Member of the Advisory Board of Iowa State University School of Business. Mr. Harris is a certified public accountant. | | CIGNA Corporation; Deluxe Corporation; Asset Allocation Trust |
Judith M. Johnson
(Born 1949) | | Trustee, since 2008 | | Retired. Prior thereto, Chief Executive Officer and Chief Investment Officer of Minneapolis Employees Retirement Fund from 1996 to 2008. Ms. Johnson is an attorney, certified public accountant and a certified managerial accountant. | | Asset Allocation Trust |
Leroy Keith, Jr.
(Born 1939) | | Trustee, since 2010 | | Chairman, Bloc Global Services (development and construction), Trustee of the Evergreen Funds from 1983 to 2010. Former Managing Director, Almanac Capital Management (commodities firm), former Partner, Stonington Partners, Inc. (private equity fund), former Director, Obagi Medical Products Co. and former Director, Lincoln Educational Services. | | Trustee, Virtus Fund Complex (consisting of 45 portfolios as of 12/31/10); Director, Diversapack Co. (packaging company); Asset Allocation Trust |
David F. Larcker
(Born 1950) | | Trustee, since 2009 | | James Irvin Miller Professor of Accounting at the Graduate School of Business, Stanford University, Director of Corporate Governance Research Program and Co-Director of The Rock Center for Corporate Governance since 2006. From 2005 to 2008, Professor of Accounting at the Graduate School of Business, Stanford University. Prior thereto, Ernst & Young Professor of Accounting at The Wharton School, University of Pennsylvania from 1985 to 2005. | | Asset Allocation Trust |
Olivia S. Mitchell
(Born 1953) | | Trustee, since 2006 | | International Foundation of Employee Benefit Plans Professor and Chair of the Department of Insurance and Risk Management, Wharton School of the University of Pennsylvania since 1993. Director of Wharton’s Pension Research Council and Boettner Center on Pensions & Retirement Research, and Research Associate at the National Bureau of Economic Research. Previously, Cornell University Professor from 1978 to 1993. | | Asset Allocation Trust |
| | | | |
| 40 | | Wells Fargo Advantage Heritage Money Market Fund | | Other Information (Unaudited) |
| | | | | | |
Name and Year of Birth | | Position Held and Length of Service | | Principal Occupations During Past Five Years | | Other Directorships During
Past Five Years |
Timothy J. Penny
(Born 1951) | | Trustee, since 1996 | | President and CEO of Southern Minnesota Initiative Foundation, a non-profit organization, since 2007 and Senior Fellow at the Humphrey Institute Policy Forum at the University of Minnesota since 1995. Member of the Board of Trustees of NorthStar Education Finance, Inc., a non-profit organization, since 2007. | | Asset Allocation Trust |
Michael S. Scofield
(Born 1943) | | Trustee, since 2010 | | Currently serves on the Investment Company Institute’s Board of Governors and Executive Committee as well the In dependent Director’s Counsel Board of Governors and Executive Committee. Former Chairman of the Independent Directors Counsel. Trustee of the Evergreen Funds from 1984 to 2010. Retired Attorney, Law Offices of Michael S. Scofield and former Director and Chairman, Branded Media Corporation (multi-media branding company). | | Asset Allocation Trust |
Donald C. Willeke
(Born 1940) | | Trustee, since 1996 | | Principal of the law firm of Willeke & Daniels. General Counsel of the Minneapolis Employees Retirement Fund from 1984 until its consolidation into the Minnesota Public Employees Retirement Association on June 30, 2010. | | Asset Allocation Trust |
Officers
| | | | | | |
Name and Year of Birth | | Position Held and
Length of Service | | Principal Occupations During Past Five Years | | |
Karla M. Rabusch
(Born 1959) | | President, since 2003 | | Executive Vice President of Wells Fargo Bank, N.A. and President of Wells Fargo Funds Management, LLC since 2003. Senior Vice President and Chief Administrative Officer of Wells Fargo Funds Management, LLC from 2001 to 2003. | | |
C. David Messman
(Born 1960) | | Secretary, since 2000; Chief Legal Counsel, since 2003 | | Senior Vice President and Secretary of Wells Fargo Funds Management, LLC since 2001. Vice President and Managing Counsel of Wells Fargo Bank, N.A. since 1996. | | |
Kasey Phillips
(Born 1970) | | Treasurer, since 2008 | | Senior Vice President of Wells Fargo Funds Management, LLC since 2009. Senior Vice President of Evergreen Investment Management Company, LLC from 2006 to 2010. Treasurer of the Evergreen Funds from 2005 to 2010. Vice President and Assistant Vice President of Evergreen Investment Services, Inc. from 1999 to 2006. | | |
David Berardi
(Born 1975) | | Assistant Treasurer, since 2009 | | Vice President of Wells Fargo Funds Management, LLC since 2009 . Vice President of Evergreen Investment Management Company, LLC from 2008 to 2010. Assistant Vice President of Evergreen Investment Services, Inc. from 2004 to 2008. Manager of Fund Reporting and Control for Evergreen Investment Management Company, LLC from 2004 to 2010. | | |
Jeremy DePalma
(Born 1974) | | Assistant Treasurer, since 2009 | | Senior Vice President of Wells Fargo Funds Management, LLC since 2009. Senior Vice President of Evergreen Investment Management Company, LLC from 2008 to 2010. Vice President, Evergreen Investment Services, Inc. from 2004 to 2007. Assistant Vice President, Evergreen Investment Services, Inc. from 2000 to 2004 and the head of the Fund Reporting and Control Team within Fund Administration from 2005 to 2010. | | |
Debra Ann Early
(Born 1964) | | Chief Compliance Officer, since 2007 | | Chief Compliance Officer of Wells Fargo Funds Management, LLC since 2007. Chief Compliance Officer of Parnassus Investments from 2005 to 2007. Chief Financial Officer of Parnassus Investments from 2004 to 2007 and Senior Audit Manager of PricewaterhouseCoopers LLP from 1998 to 2004. | | |
| 1. | The Statement of Additional Information includes additional information about the Fund’s Trustees and is available, without charge, upon request, by calling 1-800-222-8222 or by visiting the Fund’s Web site at www.wellsfargo.com/advantagefunds. |
| | | | | | |
| Other Information (Unaudited) | | Wells Fargo Advantage Heritage Money Market Fund | | | 41 | |
BOARD CONSIDERATION OF INVESTMENT ADVISORY AND SUB-ADVISORY AGREEMENTS:
100% Treasury Money Market Fund, Cash Investment Money Market Fund, Government Money Market Fund, Heritage Money Market Fund, Money Market Fund, Prime Investment Money Market Fund and Treasury Plus Money Market Fund
(Not all of the funds described in this Board considerations section are part of this shareholder report. This shareholder report only relates to Heritage Money Market Fund.)
Each year, as required by Section 15 of the Investment Company Act of 1940 (the “1940 Act”), the Board of Trustees (the “Board”) of Wells Fargo Funds Trust (the “Trust”), all the members of which have no direct or indirect interest in the investment advisory and sub-advisory agreements and are not “interested persons” of the Trust, as defined in the 1940 Act (the “Independent Trustees”), determines whether to approve the continuation of the Trust’s investment advisory and sub-advisory agreements. In this regard, at an in person meeting held on March 24-25, 2011 (the “Meeting”), the Board reviewed and re-approved: (i) an investment advisory agreement with Wells Fargo Funds Management, LLC (“Funds Management”) for each of the 100% Treasury Money Market Fund, Cash Investment Money Market Fund, Government Money Market Fund, Heritage Money Market Fund, Money Market Fund, Prime Investment Money Market Fund and Treasury Plus Money Market Fund (collectively, the “Funds”); and (ii) an investment sub-advisory agreement with Wells Capital Management Incorporated (“Wells Capital Management”) for each of the Funds. The investment advisory agreements with Funds Management and the investment sub-advisory agreements with Wells Capital Management are collectively referred to as the “Advisory Agreements.”
At the Meeting, the Board considered the factors and reached the conclusions described below relating to the selection of Funds Management and Wells Capital Management and continuation of the Advisory Agreements. Prior to the Meeting, the Trustees conferred extensively among themselves and with representatives of Funds Management about these matters. The Board also met throughout the year and received information that was useful to them in considering the continuation of the Advisory Agreements. The Independent Trustees were assisted in their evaluation of the Advisory Agreements by independent legal counsel, from whom they received separate legal advice and with whom they met separately from Funds Management.
Nature, extent and quality of services
The Board received and considered various information regarding the nature, extent and quality of services provided to the Funds by Funds Management and Wells Capital Management under the Advisory Agreements. The Board also received and considered information provided in response to a detailed set of requests submitted by the Independent Trustees’ independent legal counsel on their behalf. The Board received and considered, among other things, information about the background and experience of senior management of Funds Management, and the qualifications, backgrounds, tenures and responsibilities of the portfolio managers primarily responsible for the day-to-day portfolio management of the Funds.
The Board evaluated the ability of Funds Management and Wells Capital Management, based on their respective financial condition, resources, reputation and other attributes, to attract and retain qualified investment professionals, including research, advisory, and supervisory personnel. The Board further considered the compliance programs and compliance records of Funds Management and Wells Capital Management. In addition, the Board took into account the administrative services provided to the Funds by Funds Management and its affiliates.
The Board’s decision to approve the continuation of the Advisory Agreements was based on a comprehensive evaluation of all of the information provided to it. In approving the continuation of the Advisory Agreements, the Board did not identify any particular information or consideration that was all-important or controlling, and each Trustee attributed different weights to various factors. The Board evaluated information provided to it both in terms of the funds generally and with respect to each Fund specifically as it considered appropriate. Although the Board considered the continuation of the Advisory Agreements for each of the Funds as part of the larger process of considering the continuation of the advisory agreements for all of the funds, its decision to continue the Advisory Agreements for each of the Funds was ultimately made on a fund-by-fund basis.
In considering these matters, the Board considered not only the specific information presented in connection with the Meeting, but also the knowledge gained over time through interaction with Funds Management and Wells Capital
| | | | |
| 42 | | Wells Fargo Advantage Heritage Money Market Fund | | Other Information (Unaudited) |
Management about various topics, including Funds Management’s oversight of service providers. The above factors, together with those referenced below, are some of the most important, but not necessarily all, factors considered by the Board in concluding that it was satisfied with the nature, extent and quality of the investment advisory services provided to each Fund by Funds Management and Wells Capital Management.
Fund performance and expenses
The Board considered the performance results for each of the Funds over various time periods ended December 31, 2010. The Board also considered these results in comparison to the median performance of a universe of relevant funds (the “Universe”) that were determined by Lipper Inc. (“Lipper”) to be similar to the Funds, and in comparison to each Fund’s benchmark index and to other comparative data. Lipper is an independent provider of investment company data. The Board received a description of the methodology used by Lipper to select the mutual funds in the Universe.
The Board noted that the performance of each of the Funds was higher than or in range of the median performance of the Universe for the periods under review, except for the Money Market Fund (Class B).
The Board received and considered information regarding each Fund’s contractual advisory fee and net operating expense ratios and their various components, including actual management fees (which reflect fee waivers, if any), transfer agent, custodian and other non-management fees, Rule 12b-1 and non-Rule 12b-1 fees, service fees and fee waiver and expense reimbursement arrangements. The Board also considered these ratios in comparison to the median ratios of an expense Universe and a narrower expense group of mutual funds (each, an “Expense Group”) that was determined by Lipper to be similar to each Fund. The Board received a description of the methodology used by Lipper to select the mutual funds in a Fund’s Expense Group. The Board noted that the net operating expense ratios of the Service Class, Administrator Class, Institutional Class and Select Class of each of the Funds were in range of each Fund’s respective Expense Group’s median net operating expense ratio, except for the 100% Treasury Money Market Fund (Service Class). The Board also noted that the net operating expense ratios of the Class A and Sweep Class of each of the Funds, the Money Market Fund (A, B, C, Daily and Investor Classes) were higher than each Fund’s respective Expense Group’s median net operating expense ratio.
Based on the above-referenced considerations and other factors, the Board concluded that the overall performance and expense structure of the Funds supported the re-approval of the Advisory Agreements for the Funds.
Investment advisory and sub-advisory fee rates
The Board reviewed and considered the contractual investment advisory fee rates that are payable by the Funds to Funds Management for investment advisory services (the “Advisory Agreement Rates”), both on a stand-alone basis and on a combined basis with the Funds’ administration fee rates. The Board took into account the separate administrative and other services covered by the administration fee rates. The Board also reviewed and considered the contractual investment sub-advisory fee rates that are payable by Funds Management to Wells Capital Management for investment sub-advisory services (the “Sub-Advisory Agreement Rates”). In addition, the Board reviewed and considered the existing fee waiver/cap arrangements applicable to the Advisory Agreement Rates and considered the Advisory Agreement Rates after taking the waivers/caps into account (the “Net Advisory Rates”).
The Board received and considered information comparing the Advisory Agreement Rates and Net Advisory Rates with those of other funds in each Fund’s Expense Group median. The Board noted that the Advisory Agreement Rates for the Class A, Service Class, Administrator Class, Institutional Class and Select Class of each of the Funds were in range of each Fund’s respective Expense Group, except for the 100% Treasury Money Market Fund (Administrator Class). The Board noted that the Advisory Agreement Rates for the Sweep Class of each of the Funds was not appreciably higher than the median rate of each Fund’s Expense Group, except for the 100% Treasury Money Market Fund. The Board also noted that the Advisory Agreement Rates for the Money Market Fund (Class B, Class C, Daily Class and Investor Class) were higher than the median rate of the Expense Group. The Board noted that the Net Advisory Rates for the Service Class, Administrator Class, Institutional Class and Select Class of each of the Funds were in range of each Fund’s respective Expense Group. The Board also noted that the Net Advisory Rates for the Class A and Sweep Class of each of the Funds and the Money Market Fund (Class B, Class C, Daily Class and Investor Class) were higher than each Fund’s respective Expense Group. The Board further noted that Funds Management had agreed to continue and, in certain instances, reduce contractual fee cap arrangements for the Funds designed to lower the Funds’ expenses.
| | | | | | |
| Other Information (Unaudited) | | Wells Fargo Advantage Heritage Money Market Fund | | | 43 | |
The Board also received and considered information about the nature and extent of services offered and fee rates charged by Funds Management and Wells Capital Management to other types of clients. In this regard, the Board received information about differences between the services, and the compliance, reporting, and other legal burdens and risks of providing investment advice to mutual funds and those associated with providing advice to non-mutual fund clients such as collective funds or institutional separate accounts.
In each case, the Board determined that the Advisory Agreement Rates for the Funds, both with and without administration fee rates and before and after waivers, were acceptable in light of the Funds’ Expense Group information, the net expense ratio commitments, the services covered by the Advisory Agreements and other information provided. The Board also reviewed and considered the Sub-Advisory Agreement Rates and concluded that the Sub-Advisory Agreement Rates were acceptable in light of the services covered by the Sub-Advisory Agreement and other information provided.
Profitability
The Board received and considered a profitability analysis of Funds Management, as well as an analysis of the profitability to the collective Wells Fargo businesses that provide services to the Funds. It considered that the information provided to it was necessarily estimated, and that the profitability information provided to it, especially on a fund-by-fund basis, did not necessarily provide a precise tool for evaluating the appropriateness of each Fund’s Advisory Agreement Rates in isolation. It noted that the levels of profitability of the Funds to Funds Management varied widely, depending on, among other things, the size and type of fund. The Board concluded that the profitability to Funds Management of the services provided to any of the Funds, individually or in the aggregate, was not unreasonable.
The Board did not consider separate profitability information with respect to Wells Capital Management, because, as an affiliate of Funds Management, its profitability information was subsumed in the collective Wells Fargo profitability analysis provided by Funds Management.
Economies of scale
With respect to possible economies of scale, the Board reviewed the breakpoints in each Fund’s advisory fee structure, which operate generally to reduce the effective Advisory Agreement Rates of the Funds (as a percentage of Fund assets) as the Funds grow in size. It considered that, as a fund shrinks in size, breakpoints conversely result in increasing fee levels. The Board noted that it would continue to review the appropriate levels of breakpoints in the future, and concluded that the breakpoints as implemented appeared to be a reasonable step toward sharing economies of scale with the Funds. However, the Board acknowledged the inherent limitations of any analysis of an investment adviser’s economies of scale and of any attempt to correlate breakpoints with such economies, stemming largely from the Board’s understanding that economies of scale are realized, if at all, by an investment adviser across a variety of products and services, not just with respect to a single fund.
Other benefits to Funds Management and Wells Capital Management
The Board received and considered information regarding potential “fall-out” or ancillary benefits received by Funds Management and its affiliates, including Wells Capital Management, as a result of their relationship with the Funds. Ancillary benefits could include, among others, benefits directly attributable to the relationship of Funds Management and Wells Capital Management with the Funds and benefits potentially derived from an increase in Funds Management’s and Wells Capital Management’s business as a result of their relationship with the Funds (such as the ability to market to shareholders other financial products offered by Funds Management and its affiliates, including Wells Capital Management).
The Board considered that Wells Fargo Funds Distributor, LLC, an affiliate of Funds Management, serves as distributor to the Funds and receives certain compensation for those services. The Board noted that the Funds pay sub-transfer agency fees to various financial institutions, including affiliates of Funds Management that hold fund shares in omnibus accounts. It also considered that these entities may receive distribution-related fees and shareholder servicing payments (including amounts derived from payments under the funds’ Rule 12b-1 plans) in respect of shares sold or held through them.
The Board also reviewed information about whether and to what extent soft dollar credits are sought and how any such credits are utilized and any benefits that may be realized by using an affiliated broker.
Other factors and broader review
The Board also considered the markets for distribution of the Funds’ shares, including the multiple channels through which the Funds’ shares are offered and sold. The Board noted that the Funds are part of one of the few fund families that
| | | | |
| 44 | | Wells Fargo Advantage Heritage Money Market Fund | | Other Information (Unaudited) |
have both direct-to-fund and intermediary distribution channels. As discussed above, the Board reviews detailed materials received from Funds Management and Wells Capital Management annually as part of the re-approval process under Section 15 of the 1940 Act and also reviews and assesses information about the quality of the services that the Funds receive throughout the year. In this regard, the Board has reviewed reports of Funds Management at each of its quarterly meetings, which include, among other things, portfolio reviews and performance reports. In addition, the Board confers with portfolio managers at various times throughout the year.
Conclusion
After considering the above-described factors and based on its deliberations and its evaluation of the information described above, the Board concluded that approval of the continuation of the Advisory Agreements for the Funds was in the best interest of the Funds and their shareholders. Accordingly, the Board unanimously approved the continuation of the Advisory Agreements for an additional one-year period.
| | | | | | |
| List of Abbreviations | | Wells Fargo Advantage Heritage Money Market Fund | | | 45 | |
The following is a list of common abbreviations for terms and entities which may have appeared in this report.
| ABAG | — Association of Bay Area Governments |
| ACB | — Agricultural Credit Bank |
| ADR | — American Depositary Receipt |
| ADS | — American Depository Shares |
| AGC-ICC | — Assured Guaranty Corporation - Insured Custody Certificates |
| AGM | — Assured Guaranty Municipal |
| AMBAC | — American Municipal Bond Assurance Corporation |
| AMT | — Alternative Minimum Tax |
| ARM | — Adjustable Rate Mortgages |
| BAN | — Bond Anticipation Notes |
| BART | — Bay Area Rapid Transit |
| BHAC | — Berkshire Hathaway Assurance Corporation |
| CCAB | — Convertible Capital Appreciation Bond |
| CDA | — Community Development Authority |
| CDO | — Collateralized Debt Obligation |
| CDSC | — Contingent Deferred Sales Charge |
| CGIC | — Capital Guaranty Insurance Company |
| CGY | — Capital Guaranty Corporation |
| CIFG | — CDC (Caisse des Dépôts et Consignations) IX IS Financial Guarantee |
| COP | — Certificate of Participation |
| DRIVER | — Derivative Inverse Tax-Exempt Receipts |
| DW&P | — Department of Water & Power |
| DWR | — Department of Water Resources |
| ECFA | — Educational & Cultural Facilities Authority |
| EDA | — Economic Development Authority |
| EDFA | — Economic Development Finance Authority |
| ETET | — Eagle Tax-Exempt Trust |
| ETF | — Exchange-Traded Fund |
| FFCB | — Federal Farm Credit Bank |
| FGIC | — Financial Guaranty Insurance Corporation |
| FHA | — Federal Housing Authority |
| FHAG | — Federal Housing Agency |
| FHLB | — Federal Home Loan Bank |
| FHLMC | — Federal Home Loan Mortgage Corporation |
| FNMA | — Federal National Mortgage Association |
| GDR | — Global Depositary Receipt |
| GNMA | — Government National Mortgage Association |
| HCFR | — Healthcare Facilities Revenue |
| HEFA | — Health & Educational Facilities Authority |
| HEFAR | — Higher Education Facilities Authority Revenue |
| HFA | — Housing Finance Authority |
| HFFA | — Health Facilities Financing Authority |
| HUD | — Housing & Urban Development |
| IBC | — Insured Bond Certificate |
| IDA | — Industrial Development Authority |
| IDAG | — Industrial Development Agency |
| IDR | — Industrial Development Revenue |
| KRW | — Republic of Korea Won |
| LIBOR | — London Interbank Offered Rate |
| LLC | — Limited Liability Company |
| LLP | — Limited Liability Partnership |
| MBIA | — Municipal Bond Insurance Association |
| MFHR | — Multi-Family Housing Revenue |
| MFMR | — Multi-Family Mortgage Revenue |
| MMD | — Municipal Market Data |
| MSTR | — Municipal Securities Trust Receipts |
| MUD | — Municipal Utility District |
| NATL-RE | — National Public Finance Guarantee Corporation |
| PCFA | — Pollution Control Finance Authority |
| PCR | — Pollution Control Revenue |
| PFA | — Public Finance Authority |
| PFFA | — Public Facilities Financing Authority |
| PFOTER | — Puttable Floating Option Tax-Exempt Receipts |
| plc | — Public Limited Company |
| PSFG | — Public School Fund Guaranty |
| PUTTER | — Puttable Tax-Exempt Receipts |
| R&D | — Research & Development |
| RDA | — Redevelopment Authority |
| RDFA | — Redevelopment Finance Authority |
| REIT | — Real Estate Investment Trust |
| RIB | — Residual Interest Bond |
| ROC | — Reset Option Certificates |
| SAVRS | — Select Auction Variable Rate Securities |
| SFHR | — Single Family Housing Revenue |
| SFMR | — Single Family Mortgage Revenue |
| SLMA | — Student Loan Marketing Association |
| SPDR | — Standard & Poor’s Depositary Receipts |
| STIT | — Short-Term Investment Trust |
| TAN | — Tax Anticipation Notes |
| TIPS | — Treasury Inflation-Protected Securities |
| TRAN | — Tax Revenue Anticipation Notes |
| TCR | — Transferable Custody Receipts |
| TTFA | — Transportation Trust Fund Authority |
| USD | — Unified School District |
| XLCA | — XL Capital Assurance |
This page is intentionally left blank.


FOR MORE INFORMATION
More information about Wells Fargo Advantage Funds is available free upon request. To obtain literature, please write, e-mail, visit the Funds’ Web site, or call:
Wells Fargo Advantage Funds
P.O. Box 8266
Boston, MA 02266-8266
E-mail: wfaf@wellsfargo.com
Web site: www.wellsfargo.com/advantagefunds
Individual investors: 1-800-222-8222
Retail investment professionals: 1-888-877-9275
Institutional investment professionals: 1-866-765-0778
This report and the financial statements contained herein are submitted for the general information of the shareholders of Wells Fargo Advantage Funds. If this report is used for promotional purposes, distribution of the report must be accompanied or preceded by a current prospectus. For a prospectus containing more complete information, including charges and expenses, call 1-800-222-8222 or visit the Funds’ Web site at www.wellsfargo.com/advantagefunds. Please consider the investment objectives, risks, charges, and expenses of the investment carefully before investing. This and other information about Wells Fargo Advantage Funds can be found in the current prospectus. Read the prospectus carefully before you invest or send money.
Wells Fargo Funds Management, LLC, a wholly owned subsidiary of Wells Fargo & Company, provides investment advisory and administrative services for Wells Fargo Advantage Funds. Other affiliates of Wells Fargo & Company provide subadvisory and other services for the Funds. The Funds are distributed by Wells Fargo Funds Distributor, LLC, Member FINRA/SIPC, an affiliate of Wells Fargo & Company.
NOT FDIC INSURED ¡ NO BANK GUARANTEE ¡ MAY LOSE VALUE
© 2011 Wells Fargo Funds Management, LLC. All rights reserved.
| | |
 | | 204800 09-11 SA304/SAR304 7-11 |

Wells Fargo Advantage
Minnesota Money Market Fund

Semi-Annual Report
July 31, 2011

Reduce clutter. Save trees.
Sign up for electronic delivery of prospectuses and shareholder reports at www.wellsfargo.com/advantagedelivery
Contents
The views expressed and any forward-looking statements are as of July 31, 2011, unless otherwise noted and are those of the Fund managers and/or Wells Fargo Funds Management, LLC. Discussions of individual securities, or the markets generally, or any Wells Fargo Advantage Fund are not intended as individual recommendations. Future events or results may vary significantly from those expressed in any forward-looking statements; the views expressed are subject to change at any time in response to changing circumstances in the market. Wells Fargo Funds Management, LLC, disclaims any obligation to publicly update or revise any views expressed or forward-looking statements.
NOT FDIC INSURED ¡ NO BANK GUARANTEE ¡ MAY LOSE VALUE

WELLS FARGO INVESTMENT HISTORY
| | |
| |
| 1932 | | Keystone creates one of the first mutual fund families. |
| |
| 1971 | | Wells Fargo & Company introduces one of the first institutional index funds. |
| |
| 1978 | | Wells Fargo applies Markowitz and Sharpe’s research on Modern Portfolio Theory to introduce one of the industry’s first Tactical Asset Allocation (TAA) models in institutional separately managed accounts. |
| |
| 1984 | | Wells Fargo Stagecoach Funds launches its first asset allocation fund. |
| |
| 1989 | | The Tactical Asset Allocation (TAA) Model is first applied to Wells Fargo’s asset allocation mutual funds. |
| |
| 1994 | | Wells Fargo introduces the LifePath Funds, one of the first suites of target date funds (now the Wells Fargo Advantage Dow Jones Target Date FundsSM ). |
| |
| 1996 | | Evergreen Investments and Keystone Funds merge. |
| |
| 1997 | | Wells Fargo launches Wells Fargo Advantage WealthBuilder PortfoliosSM, a fund-of-funds suite of products that includes the use of quantitative models to shift assets among investment styles. |
| |
| 1999 | | Norwest Advantage Funds and Stagecoach Funds are reorganized into Wells Fargo Funds after the merger of Norwest and Wells Fargo. |
| |
| 2002 | | Evergreen Retail and Evergreen Institutional companies form the umbrella asset management company, Evergreen Investments. |
| |
| 2005 | | The integration of Strong Funds with Wells Fargo Funds creates Wells Fargo Advantage Funds, resulting in one of the top 20 mutual fund companies in the United States. |
| |
| 2006 | | Wells Fargo Advantage Funds relaunches the target date product line as Wells Fargo Advantage Dow Jones Target Date Funds. |
| |
| 2010 | | The mergers and reorganizations of Evergreen and Wells Fargo Advantage mutual funds are completed, unifying the families under the brand of Wells Fargo Advantage Funds. |
Wells Fargo Advantage Funds®
Wells Fargo Advantage Funds skillfully guides institutions, financial advisors, and individuals through the investment terrain to help them reach their financial objectives. Everything we do on behalf of investors is backed by our unique combination of qualifications.
Strength
Our organization is built on the standards of integrity and service established by our parent company—Wells Fargo & Company—more than 150 years ago. And, because we’re part of a highly diversified financial enterprise, we offer the depth of resources to help investors succeed.
Expertise
Our multi-boutique model offers investors access to the independent thinking of premier investment managers that have been chosen for their time-tested strategies. While each team specializes in a specific investment strategy, collectively they provide investors a wide choice of distinct investment styles. Our dedication to investment excellence doesn’t end with our expertise in manager selection—risk management, analysis, and rigorous ongoing review seek to ensure each manager’s investment process remains consistent.
Partnership
Our collaborative approach is built around understanding the needs and goals of our clients. By adhering to core principles of sound judgment and steady guidance, we support you through every stage of the investment decision process.
Carefully consider the investment objectives, risks, charges, and expenses before investing. For a current prospectus for Wells Fargo Advantage Funds containing this and other information, visit wellsfargo.com/advantagefunds. Read it carefully before investing.
Wells Fargo Funds Management, LLC, a wholly owned subsidiary of Wells Fargo & Company, provides investment advisory and administrative services for Wells Fargo Advantage Funds®. Other affiliates of Wells Fargo & Company provide subadvisory and other services for the Funds. The Funds are distributed by Wells Fargo Funds Distributor, LLC, Member FINRA/SIPC, an affiliate of Wells Fargo & Company.
The “Dow Jones Target Date Indexes” are a product of Dow Jones Indexes, a licensed trademark of CME Group Index Services LLC (“CME”). “Dow Jones” and “Dow Jones Target Date Indexes” are service marks of Dow Jones Trademark Holdings, LLC, and have been licensed for use for certain purposes by CME and sublicensed for use by Global Index Advisors, Inc., and Wells Fargo Funds Management, LLC. The Dow Jones Target Date Indexes are based in part on the Barclays Capital Bond Indexes, which are published by Barclays Capital Inc. The Wells Fargo Advantage Dow Jones Target Date Funds, based on the Dow Jones Target Date Indexes, are not sponsored, endorsed, sold, or promoted by Dow Jones, CME or Barclays Capital or any of their respective affiliates, and neither Dow Jones, CME nor Barclays Capital nor any of their respective affiliates makes any representation regarding the advisability of investing in such product(s) and/or about the quality, accuracy, and/or completeness of the Dow Jones Target Date Indexes or the Barclays Capital Bond Indexes. IN NO EVENT SHALL DOW JONES, CME, BARCLAYS CAPITAL, OR ANY OF THEIR LICENSORS HAVE ANY LIABILITY IN CONNECTION WITH THE Wells Fargo Advantage Dow Jones Target Date Funds INCLUDING, WITHOUT LIMITATION, FOR ANY SPECIAL, PUNITIVE, IN DIRECT, OR CONSEQUENTIAL DAMAGES (INCLUDING LOST PROFITS), EVEN IF NOTIFIED OF THE POSSIBILITY OF SUCH DAMAGES.
NOT FDIC INSURED ¡ NO BANK GUARANTEE ¡ MAY LOSE VALUE
Not part of the semi-annual report.
Wells Fargo Advantage Funds offers more than 110 mutual funds across a wide range of asset classes, representing over $221 billion in assets under management, as of July 31, 2011.
| | | | |
| Equity Funds | | | | |
Asia Pacific Fund | | Global Opportunities Fund | | Premier Large Company Growth Fund |
C&B Large Cap Value Fund | | Growth Fund | | Small Cap Opportunities Fund |
C&B Mid Cap Value Fund | | Health Care Fund | | Small Cap Value Fund |
Capital Growth Fund | | Index Fund | | Small Company Growth Fund |
Common Stock Fund | | International Equity Fund | | Small Company Value Fund |
Disciplined U.S. Core Fund | | International Value Fund | | Small/Mid Cap Core Fund |
Discovery Fund† | | Intrinsic Small Cap Value Fund | | Small/Mid Cap Value Fund |
Diversified Equity Fund | | Intrinsic Value Fund | | Social Sustainability Fund† |
Diversified International Fund | | Intrinsic World Equity Fund | | Special Mid Cap Value Fund |
Diversified Small Cap Fund | | Large Cap Core Fund | | Special Small Cap Value Fund |
Emerging Growth Fund | | Large Cap Growth Fund | | Specialized Technology Fund |
Emerging Markets Equity Fund | | Large Company Value Fund | | Strategic Large Cap Growth Fund |
Endeavor Select Fund† | | Omega Growth Fund | | Traditional Small Cap Growth Fund |
Enterprise Fund† | | Opportunity Fund† | | Utility and Telecommunications Fund |
Equity Value Fund | | Precious Metals Fund | | |
| Bond Funds | | | | |
Adjustable Rate Government Fund | | Inflation-Protected Bond Fund | | Short-Term Bond Fund |
California Limited-Term Tax-Free Fund | | Intermediate Tax/AMT-Free Fund | | Short-Term High Yield Bond Fund |
California Tax-Free Fund | | International Bond Fund | | Short-Term Municipal Bond Fund |
Colorado Tax-Free Fund | | Minnesota Tax-Free Fund | | Strategic Municipal Bond Fund |
Government Securities Fund | | Municipal Bond Fund | | Total Return Bond Fund |
High Income Fund | | North Carolina Tax-Free Fund | | Ultra Short-Term Income Fund |
High Yield Bond Fund | | Pennsylvania Tax-Free Fund | | Ultra Short-Term Municipal Income Fund |
Income Plus Fund | | Short Duration Government Bond Fund | | Wisconsin Tax-Free Fund |
| Asset Allocation Funds | | | | |
Asset Allocation Fund | | WealthBuilder Equity Portfolio† | | Target 2020 Fund† |
Conservative Allocation Fund | | WealthBuilder Growth Allocation Portfolio† | | Target 2025 Fund† |
Diversified Capital Builder Fund | | WealthBuilder Growth Balanced Portfolio† | | Target 2030 Fund† |
Diversified Income Builder Fund | | WealthBuilder Moderate Balanced Portfolio† | | Target 2035 Fund† |
Growth Balanced Fund | | WealthBuilder Tactical Equity Portfolio† | | Target 2040 Fund† |
Index Asset Allocation Fund | | Target Today Fund† | | Target 2045 Fund† |
Moderate Balanced Fund | | Target 2010 Fund† | | Target 2050 Fund† |
WealthBuilder Conservative Allocation Portfolio† | | Target 2015 Fund† | | Target 2055 Fund† |
| Money Market Funds | | | | |
100% Treasury Money Market Fund | | Minnesota Money Market Fund | | New Jersey Municipal Money Market Fund |
California Municipal Money Market Fund | | Money Market Fund | | New York Municipal Money Market Fund |
Cash Investment Money Market Fund | | Municipal Cash Management Money Market Fund | | Pennsylvania Municipal Money Market Fund |
Government Money Market Fund | | Municipal Money Market Fund | | Prime Investment Money Market Fund |
Heritage Money Market Fund† | | National Tax-Free Money Market Fund | | Treasury Plus Money Market Fund |
| Variable Trust Funds1 | | | | |
VT Discovery Fund† | | VT Intrinsic Value Fund | | VT Small Cap Growth Fund |
VT Index Asset Allocation Fund | | VT Omega Growth Fund | | VT Small Cap Value Fund |
VT International Equity Fund | | VT Opportunity Fund† | | VT Total Return Bond Fund |
An investment in a money market fund is not insured or guaranteed by the Federal Deposit Insurance Corporation or any other government agency. Although the Wells Fargo Advantage Money Market Funds seek to preserve the value of your investment at $1.00 per share, it is possible to lose money by investing in a money market fund.
| 1. | The Variable Trust Funds are generally available only through insurance company variable contracts. |
| † | In this report, the Wells Fargo Advantage Discovery FundSM, Wells Fargo Advantage Endeavor Select FundSM, Wells Fargo Advantage Enterprise FundSM, Wells Fargo Advantage Opportunity FundSM, Wells Fargo Advantage Social Sustainability FundSM, Wells Fargo Advantage WealthBuilder Conservative Allocation PortfolioSM, Wells Fargo Advantage WealthBuilder Equity PortfolioSM, Wells Fargo Advantage WealthBuilder Growth Allocation PortfolioSM, Wells Fargo Advantage WealthBuilder Growth Balanced PortfolioSM, Wells Fargo Advantage WealthBuilder Moderate Balanced PortfolioSM, Wells Fargo Advantage WealthBuilder Tactical Equity PortfolioSM, Wells Fargo Advantage Dow Jones Target Today FundSM, Wells Fargo Advantage Dow Jones Target 2010 FundSM, Wells Fargo Advantage Dow Jones Target 2015 FundSM, Wells Fargo Advantage Dow Jones Target 2020 FundSM, Wells Fargo Advantage Dow Jones Target 2025 FundSM, Wells Fargo Advantage Dow Jones Target 2030 FundSM, Wells Fargo Advantage Dow Jones Target 2035 FundSM, Wells Fargo Advantage Dow Jones Target 2040 FundSM, Wells Fargo Advantage Dow Jones Target 2045 FundSM, Wells Fargo Advantage Dow Jones Target 2050 FundSM, Wells Fargo Advantage Dow Jones Target 2055 FundSM, Wells Fargo Advantage Heritage Money Market FundSM, Wells Fargo Advantage VT Discovery FundSM, and Wells Fargo Advantage VT Opportunity FundSM are referred to as the Discovery Fund, Endeavor Select Fund, Enterprise Fund, Opportunity Fund, Social Sustainability Fund, WealthBuilder Conservative Allocation Portfolio, WealthBuilder Equity Portfolio, WealthBuilder Growth Allocation Portfolio, WealthBuilder Growth Balanced Portfolio, WealthBuilder Moderate Balanced Portfolio, WealthBuilder Tactical Equity Portfolio, Target Today Fund, Target 2010 Fund, Target 2015 Fund, Target 2020 Fund, Target 2025 Fund, Target 2030 Fund, Target 2035 Fund, Target 2040 Fund, Target 2045 Fund, Target 2050 Fund, Target 2055 Fund, Heritage Money Market Fund, VT Discovery Fund, and VT Opportunity Fund, respectively. |
Not part of the semi-annual report.
| | | | |
| 2 | | Wells Fargo Advantage Minnesota Money Market Fund | | Letter to Shareholders |

Karla M. Rabusch,
President
Wells Fargo Advantage Funds
Dear Valued Shareholder,
We’re pleased to offer you this semi-annual report for the Wells Fargo Advantage Minnesota Money Market Fund for the six-month period that ended July 31, 2011. Upon reviewing the report, you may notice a few changes from past reports, the most significant of which is the change from a multi-fund report to a single-fund report. We believe this change will give you more convenient access to your fund data.
The period began modestly as improving economic optimism generally shifted investors toward equities and riskier assets and away from U.S. Treasuries and lower-yielding fixed-income securities. Returns from fixed income were modest in the opening months of 2011 but were generally still positive as U.S. Treasury yields incrementally climbed higher. But after the slow start, bond prices once again strongly improved, sparked by a sharp decline in U.S. Treasury prices in April that carried into May. Late in the period, lower-rated bonds declined in price more than the higher credit-quality tiers but not enough to outweigh the stronger performance from lower-rated securities during the period. Lower-quality and longer-maturity fixed-income securities generally outperformed higher-quality and shorter-maturity securities over the full period.
The activity within the broader bond market also resonated with money market participants. As the economic and credit environment reverberated from the ongoing sovereign debt concerns and softening economic data, many participants continued to balance a need for stability and desire for higher yields. The result has been good demand for domestic commercial paper and certificate of deposits. Also, in spite of all the discussion about sovereign debt, many money market participants continue to maintain some exposures to foreign banks based on the quality of their fundamentals. By focusing more on the fundamentals and taking a more selective approach to the short-term security market helped the markets avoid the severe yield volatility or significant flight-to-quality experienced during the spring of 2010, when the Greek sovereign debt crisis first emerged.
The global economic “recovery” hit a snag, but the end of 2011 could regain momentum.
The U.S. economic recovery that began in mid-2009 and gained further momentum throughout 2010, particularly during the fourth quarter, has failed to maintain that level of growth through the first seven months of 2011. For example, gross domestic product (GDP), the broadest measure of economic activity, grew at an annualized rate of 3.1% in the fourth quarter of 2010, only to slow dramatically during the first quarter of 2011. The latest revision to first-quarter GDP data during the period indicated that the economy grew at an annualized rate of 0.4% during the first quarter of 2011. While still positive, it’s a much slower pace of growth than experienced in the second half of 2010 and notably lower than consensus forecasts. Nevertheless, the advance estimate of second-quarter 2011 GDP, which was released on July 29, 2011, was 1.3%, suggesting that the U.S. economy continues to expand, though at a slow and uneven pace.
Jobs and housing remained troublesome.
The July 2011 unemployment rate in the U.S. was reported at 9.1%, down from 9.5% a year earlier but still notably higher than historical averages. Unfortunately, the drop may be more attributable to a decline in the labor force than to a
| | | | | | |
| Letter to Shareholders | | Wells Fargo Advantage Minnesota Money Market Fund | | | 3 | |
meaningful uptick in hiring. The level of job creation in 2011 has been trending below historical averages, suggesting that the improving economy has yet to translate into widespread hiring. Meanwhile, the beleaguered housing market was an ongoing source of concern, despite some tentative late-year signs of stabilization. That said, persistent weakness in the labor and housing markets bears close watching in the months ahead.
Other economic data in the U.S. has been more encouraging, reflecting greater confidence in the sustainability of the expansion on the part of both consumers and businesses. Retail sales came in strong at certain points during the period and industrial production and new orders have picked up. Although still reluctant to hire, businesses have gradually increased spending in other areas, such as equipment and information technology. Core inflation, which excludes volatile food and energy prices, remained benign.
The Federal Reserve believes the economic recovery will accelerate in future quarters.
With inflation subdued, the Federal Open Market Committee (FOMC) held its target range for the federal funds rate—a proxy for short-term interest rates—steady at 0.00% to 0.25%. On June 22, 2011, in its final statement of the six-month period, the Fed reiterated that the economic recovery “is proceeding at a moderate pace,” but that “recent labor market indicators have been weaker than anticipated.” It described the recent increase in inflation as temporary, suggesting that inflation pressures will ease going forward. While the FOMC explained that it “expects the pace of recovery to pick up over coming quarters,” it indicated that the federal funds rate will remain at an exceptionally low level for as long as necessary to ensure a sustainable recovery and expansion.
As recent headwinds subside, it is reasonable to expect markets to regain focus.
Now that it appears the debt ceiling has been increased and a U.S. default will be averted, money market participants and the broader bond market can get back to more fundamental and lasting concerns—chiefly, the economy. After avoiding short-term Treasuries in late July 2011, ahead of pending U.S. debt ceiling deadline, money market participants have returned to the U.S. short-term markets.1 Economic indicators released in the second half of 2011 might not be as soft as those reported during the first half of the year. While that would not mean that the economy is robust, it might remind the markets that the first half of the slowdown was transitory. Most indicators still point toward real GDP growth in the 2% to 3% range in the second half of 2011. While that is not enough to produce big employment gains, it might be sufficient to cause Treasury yields to retrace some of the late-July declines.
Don’t let short-term uncertainty derail long-term investment goals.
While periods of uncertainty can present challenges, experience has taught us that maintaining a long-term investment strategy based on individual goals and risk tolerance can be an effective way to plan for the future. As a whole, Wells Fargo Advantage Funds represents investments across a broad range of asset classes and investment styles with more than 110 mutual funds, giving you an opportunity to create a diversified investment portfolio. While diversification may not prevent losses in a downturn, it may help to reduce them and provide you with one way of managing risk.
| 1. | Comments expressed that do not fall within the reporting period are as of August 2, 2011. |
While the FOMC explained that it “expects the pace of recovery to pick up over coming quarters,” it indicated that the federal funds rate will remain at an exceptionally low level for as long as necessary to ensure a sustainable recovery and expansion.
Economic indicators released in the second half of 2011 might not be as soft as those reported during the first half of the year. While that would not mean that the economy is robust, it might remind the markets that the first half of the slowdown was transitory.
| | | | |
| 4 | | Wells Fargo Advantage Minnesota Money Market Fund | | Letter to Shareholders |
In our opinion, diligent and earnest assessment of the fundamental characteristics of money market eligible securities will be a key differentiating factor between which investment strategies meet client expectations and which do not. At
Fargo Advantage Funds, we intend to continue the emphasis of principal preservation and high liquidity across our lineup of Wells Fargo Advantage Money Market Funds. In changing markets, we believe it is particularly important to have diligent investment analysts in charge of investor assets.
Thank you for choosing Wells Fargo Advantage Funds. We appreciate your confidence in us and are committed to helping you meet your financial needs. If you have any questions about your investments, please contact your investment professional, call us at 1-800-222-8222, or visit www.wellsfargo.com/advantagefunds.
Sincerely,

Karla M. Rabusch
President
Wells Fargo Advantage Funds
| | | | | | |
| Performance Highlights | | Wells Fargo Advantage Minnesota Money Market Fund | | | 5 | |
INVESTMENT OBJECTIVE
The Fund seeks current income exempt from regular federal income tax and Minnesota individual income tax, while preserving capital and liquity.
ADVISER
Wells Fargo Funds Management, LLC
SUB-ADVISER
Wells Capital Management Incorporated
PORTFOLIO MANAGERS
David D. Sylvester
James Randazzo
FUND INCEPTION
August 14, 2000
| | |
SECTOR DISTRIBUTION1
(AS OF JULY 31, 2011) |
|
| | |
EFFECTIVE MATURITY DISTRIBUTION1
(AS OF JULY 31, 2011) |
|
| | |
WEIGHTED AVERAGE MATURITY2
(AS OF JULY 31, 2011) |
7 Days | | |
| | |
WEIGHTED AVERAGE FINAL MATURITY3
(AS OF JULY 31, 2011) |
7 Days | | |
| 1. | Sector distribution and effective maturity distribution are subject to change and are calculated based on the total investments of the Fund. Effective maturity distribution is based on the weighted average maturity of each security. |
| 2. | Weighted Average Maturity (WAM): WAM calculates an average time to maturity of all of the securities held in the portfolio, weighted by each security’s percentage of net assets. The calculation takes into account the final maturity of a fixed-income security and the interest rate reset date for floating-rate securities held in the portfolio. This is a way to measure a Fund’s sensitivity to potential interest rate changes. |
| 3. | Weighted Average Final Maturity (WAFM): WAFM calculates a Fund’s average time to maturity for all of the securities held in the portfolio, weighted to their percentage of assets in the Fund. In contrast to WAM, the WAFM calculation takes into account the final maturity date for each security held in the portfolio. This is a way to measure a Fund’s potential sensitivity to credit spread changes. |
| | | | |
| 6 | | Wells Fargo Advantage Minnesota Money Market Fund | | Performance Highlights |
AVERAGE ANNUAL TOTAL RETURN4 (%) (AS OF JULY 31, 2011)
| | | | | | | | | | | | | | | | | | | | | | | | | | | | |
| | | | | | | | | Expense Ratios5 | |
| | | Inception Date | | | 6 Months* | | | 1 Year | | | 5 Year | | | 10 Year | | | Gross | | | Net6 | |
Class A (WMNXX) | | | 08/14/2000 | | | | 0.00 | | | | 0.01 | | | | 1.14 | | | | 1.12 | | | | 0.89% | | | | 0.70% | |
Sweep Class | | | 06/30/2010 | | | | 0.01 | | | | 0.01 | | | | 1.14 | | | | 1.12 | | | | 1.24% | | | | 1.05% | |
| * | Returns for periods of less than one year are not annualized. |
| | | | | | | | |
FUND YIELD SUMMARY6
(AS OF JULY 31, 2011) | | Class A | | | Sweep Class | |
7-Day Current Yield | | | 0.01% | | | | 0.01% | |
7-Day Compound Yield | | | 0.01% | | | | 0.01% | |
30-Day Simple Yield | | | 0.01% | | | | 0.01% | |
30-Day Compound Yield | | | 0.01% | | | | 0.01% | |
Figures quoted represent past performance, which is no guarantee of future results and do not reflect the deduction of taxes that a shareholder may pay on fund distributions or the redemption of fund shares. Investment returns will fluctuate. The Fund’s yield figures more closely reflect the current earnings of the Fund than the total return figures. Current performance may be lower or higher than the performance data quoted. Current month-end performance is available at the Fund’s Web site – www.wellsfargo.com/advantagefunds.
Each class is sold without a front-end sales charge or contingent deferred sales charge. Other fees and expenses apply to an investment in the Fund and are described in the Fund’s current prospectus.
An investment in a money market fund is not insured or guaranteed by the Federal Deposit Insurance Corporation or any other government agency. Although the Fund seeks to preserve the value of your investment at $1.00 per share, it is possible to lose money by investing in a money market fund. A portion of the Fund’s income may be subject to federal, state and/or local income taxes or the alternative minimum tax (AMT).
| 4. | Historical performance shown for the Sweep Class shares prior to their inception reflects the performance of the Class A shares, and has not been adjusted to reflect the higher expenses applicable to the Sweep Class shares. If these expenses had been adjusted, returns would be lower. |
| 5. | Reflects the expense ratios as stated in the most recent prospectuses. |
| 6. | The Adviser has committed through May 31, 2012 to waive fees and/or reimburse expenses to the extent necessary to cap the Fund’s Total Annual Fund Operating Expenses After Fee Waiver, excluding certain expenses, at the amount shown above. Without this cap, the Fund’s returns would have been lower. Without waived fees and/or reimbursed expenses, the Fund’s 7-day current yield would have been (0.80)%, and (1.15)% for Class A, and Sweep Class, respectively. |
| | | | | | |
| Fund Expenses | | Wells Fargo Advantage Minnesota Money Market Fund | | | 7 | |
As a shareholder of the Fund, you incur two types of costs: (1) transaction costs, including contingent deferred sales charges (if any) and (2) ongoing costs, including management fees; distribution (12b-1) and/or shareholder service fees; and other Fund expenses. This example is intended to help you understand your ongoing costs (in dollars) of investing in the Fund and to compare these costs with the ongoing costs of investing in other mutual funds.
The example is based on an investment of $1,000 invested at the beginning of the six-month period and held for the entire period from February 1, 2011 to July 31, 2011.
Actual Expenses
The “Actual” line of the table below provides information about actual account values and actual expenses. You may use the information in this line, together with the amount you invested, to estimate the expenses that you paid over the period. Simply divide your account value by $1,000 (for example, an $8,600 account value divided by $1,000 = 8.6), then multiply the result by the number in the “Actual” line under the heading entitled “Expenses Paid During Period” for your applicable class of shares to estimate the expenses you paid on your account during this period.
Hypothetical Example for Comparison Purposes
The “Hypothetical” line of the table below provides information about hypothetical account values and hypothetical expenses based on the Fund’s actual expense ratio and an assumed rate of return of 5% per year before expenses, which is not the Fund’s actual return. The hypothetical account values and expenses may not be used to estimate the actual ending account balance or expenses you paid for the period. You may use this information to compare the ongoing costs of investing in the Fund and other funds. To do so, compare this 5% hypothetical example with the 5% hypothetical examples that appear in the shareholder reports of the other funds.
Please note that the expenses shown in the table are meant to highlight your ongoing costs only and do not reflect any transactional costs, such as any contingent deferred sales charges. Therefore, the “Hypothetical” line of the table is useful in comparing ongoing costs only, and will not help you determine the relative total costs of owning different funds. In addition, if these transactional costs were included, your costs would have been higher.
| | | | | | | | | | | | | | | | |
| | | Beginning
Account Value
02-01-2011 | | | Ending
Account Value
07-31-2011 | | | Expenses
Paid During
the Period¹ | | | Net Annual
Expense Ratio | |
Class A | | | | | | | | | | | | | | | | |
Actual | | $ | 1,000.00 | | | $ | 1,000.05 | | | $ | 1.09 | | | | 0.22 | % |
Hypothetical (5% return before expenses) | | $ | 1,000.00 | | | $ | 1,023.70 | | | $ | 1.10 | | | | 0.22 | % |
Sweep Class | | | | | | | | | | | | | | | | |
Actual | | $ | 1,000.00 | | | $ | 1,000.05 | | | $ | 0.99 | | | | 0.20 | % |
Hypothetical (5% return before expenses) | | $ | 1,000.00 | | | $ | 1,023.80 | | | $ | 1.00 | | | | 0.20 | % |
| 1. | Expenses paid is equal to the annualized expense ratio of each class multiplied by the average account value over the period, multiplied by the number of days in the most recent fiscal half-year divided by the number of days in the fiscal year (to reflect the one-half year period). |
| | | | |
| 8 | | Wells Fargo Advantage Minnesota Money Market Fund | | Portfolio of Investments—July 31, 2011 (Unaudited) |
| | | | | | | | | | | | | | | | |
| Security Name | | Interest Rate | | | Maturity Date | | | Principal | | | Value | |
| | | | | | | | | | | | | | | | |
| | | | |
Municipal Bonds and Notes: 93.41% | | | | | | | | | | | | | | | | |
| | | | |
Minnesota: 93.41% | | | | | | | | | | | | | | | | |
| | | | |
| Other Municipal Debt: 1.31% | | | | | | | | | | | | | | | | |
Regents of the University of Minnesota (Education Revenue) | | | 0.13 | % | | | 10/05/2011 | | | $ | 1,000,000 | | | $ | 1,000,000 | |
| | | | | | | | | | | | | | | | |
| | | | |
| Variable Rate Demand Notes§: 92.10% | | | | | | | | | | | | | | | | |
Andover MN Senior Housing Presbyterian Homes Incorporated Project (Housing Revenue, FNMA Insured) | | | 0.15 | | | | 11/15/2033 | | | | 1,840,000 | | | | 1,840,000 | |
Becker MN Plymouth Foam Project (IDR, U.S. Bank NA LOC) | | | 0.26 | | | | 05/01/2019 | | | | 1,560,000 | | | | 1,560,000 | |
Bloomington MN Norlan Partnership Series A-1 (Housing Revenue, FNMA Insured) | | | 0.17 | | | | 07/15/2032 | | | | 900,000 | | | | 900,000 | |
Bloomington MN Presbyterian Homes (Housing Revenue, FHLMC Insured) | | | 0.15 | | | | 07/01/2038 | | | | 1,250,000 | | | | 1,250,000 | |
Burnsville MN Bridgeway Apartments Project (Housing Revenue, FNMA Insured) | | | 0.15 | | | | 10/15/2033 | | | | 400,000 | | | | 400,000 | |
City of St. Cloud MN (Health Revenue, Assured Guaranty Insured) | | | 0.10 | | | | 05/01/2042 | | | | 1,950,000 | | | | 1,950,000 | |
Cohasset MN Power & Light Company Project A (IDR, LaSalle National Bank NA LOC) | | | 0.11 | | | | 06/01/2020 | | | | 900,000 | | | | 900,000 | |
Cohasset MN Power & Light Company Project B (IDR, LaSalle Bank NA LOC) | | | 0.13 | | | | 06/01/2013 | | | | 1,100,000 | | | | 1,100,000 | |
Cohasset MN Power & Light Company Project C (IDR, LaSalle Bank NA LOC) | | | 0.13 | | | | 06/01/2013 | | | | 1,250,000 | | | | 1,250,000 | |
Coon Rapids MN Drake Apartments Project A (Housing Revenue, FNMA Insured) | | | 0.17 | | | | 06/15/2038 | | | | 2,755,000 | | | | 2,755,000 | |
Dakota County MN CDA View Pointe Apartments Project Series 2007-A (Housing Revenue, FNMA Insured) | | | 0.17 | | | | 01/15/2038 | | | | 400,000 | | | | 400,000 | |
Dakota County MN RDA (Housing Revenue, FHLMC Insured) | | | 0.11 | | | | 06/01/2029 | | | | 915,000 | | | | 915,000 | |
Duluth MN Seaway Port Authority Saint Lawrence Cement Incorporated Project (IDR, Wells Fargo Bank NA LOC)(q) | | | 0.10 | | | | 03/01/2020 | | | | 3,000,000 | | | | 3,000,000 | |
East Grand Forks MN Solid Waste Disposal American Crystal Sugar Company Project (Miscellaneous Revenue, CoBank ACB LOC) | | | 0.09 | | | | 12/01/2021 | | | | 4,000,000 | | | | 4,000,000 | |
Edina MN Edina Park Plaza (Housing Revenue, FHLMC Insured) | | | 0.10 | | | | 12/01/2029 | | | | 560,000 | | | | 560,000 | |
Forest Lake MN Kilkenny Court Apartments Project (Housing Revenue, FNMA Insured) | | | 0.10 | | | | 08/15/2038 | | | | 400,000 | | | | 400,000 | |
Maplewood MN Educational Facilities Mounds Park Academy Project (Education Revenue, U.S. Bank NA LOC) | | | 0.10 | | | | 10/01/2023 | | | | 800,000 | | | | 800,000 | |
Minneapolis & St. Paul MN Housing & RDA Allina Health Systems Series B-1 (Hospital Revenue, JPMorgan Chase Bank LOC) | | | 0.31 | | | | 11/15/2035 | | | | 2,950,000 | | | | 2,950,000 | |
Minneapolis & St. Paul MN Housing & RDA Allina Health Systems Series B-2 (Hospital Revenue, JPMorgan Chase Bank LOC) | | | 0.20 | | | | 11/15/2035 | | | | 1,600,000 | | | | 1,600,000 | |
Minneapolis & St. Paul MN Metro Airports Commission Series A PUTTER DB-489 (Airport Revenue, AMBAC Insured) | | | 0.08 | | | | 01/01/2030 | | | | 3,265,000 | | | | 3,265,000 | |
Minneapolis MN MacPhail Center for Music Project (Miscellaneous Revenue, U.S. Bank NA LOC) | | | 0.33 | | | | 08/01/2036 | | | | 300,000 | | | | 300,000 | |
Minneapolis MN Minnehaha Academy Project (Education Revenue, U.S. Bank NA LOC) | | | 0.33 | | | | 05/01/2026 | | | | 1,736,000 | | | | 1,736,000 | |
Minneapolis MN People Serving People Project Series A (Miscellaneous Revenue, U.S. Bank NA LOC) | | | 0.33 | | | | 10/01/2021 | | | | 1,900,000 | | | | 1,900,000 | |
Minnesota Agriculture & EDA Como Partnership Project Series 1996 (IDR, U.S. Bank NA LOC) | | | 0.23 | | | | 05/01/2016 | | | | 690,000 | | | | 690,000 | |
Minnesota Bond Securitization Trust Series S1 (Housing Revenue, PNC Bank NA LOC) | | | 0.23 | | | | 02/01/2027 | | | | 1,480,000 | | | | 1,480,000 | |
Minnesota HFA Residential Housing Finance Project Series C (Housing Revenue, FHLB Insured) | | | 0.16 | | | | 07/01/2036 | | | | 1,900,000 | | | | 1,900,000 | |
Minnesota State Concordia University Series P1 (Education Revenue, U.S. Bank NA LOC) | | | 0.30 | | | | 04/01/2027 | | | | 1,300,000 | | | | 1,300,000 | |
Minnesota State HEFAR Carleton College Series 5G (Education Revenue, JPMorgan Chase Bank LOC) | | | 0.06 | | | | 11/01/2029 | | | | 400,000 | | | | 400,000 | |
| | | | | | |
| Portfolio of Investments—July 31, 2011 (Unaudited) | | Wells Fargo Advantage Minnesota Money Market Fund | | | 9 | |
| | | | | | | | | | | | | | | | |
| Security Name | | Interest Rate | | | Maturity Date | | | Principal | | | Value | |
| | | | | | | | | | | | | | | | |
| | | | |
| Variable Rate Demand Notes§ (continued) | | | | | | | | | | | | | | | | |
Minnesota State HEFAR Hamline University Series 6E1 (Education Revenue, Harris NA LOC) | | | 0.09 | % | | | 10/01/2016 | | | $ | 1,325,000 | | | $ | 1,325,000 | |
Minnesota State HEFAR Olaf College Five M2 (Education Revenue, Harris NA LOC) | | | 0.33 | | | | 10/01/2020 | | | | 1,745,000 | | | | 1,745,000 | |
Minnesota State HFA Residential Housing Series 1 (Housing Revenue, GO of Agency Insured) | | | 0.16 | | | | 01/01/2036 | | | | 155,000 | | | | 155,000 | |
Minnesota State Higher Education Facilities Authority Series 6-E2 (Education Revenue, Harris NA LOC) | | | 0.09 | | | | 10/01/2025 | | | | 3,450,000 | | | | 3,450,000 | |
Minnesota State University of St. Thomas Series 5C (Education Revenue, U.S. Bank NA LOC) | | | 0.07 | | | | 04/01/2025 | | | | 300,000 | | | | 300,000 | |
Minnetonka MN Housing Facilities Beacon Hill (Housing Revenue, FNMA Insured) | | | 0.15 | | | | 05/15/2034 | | | | 270,000 | | | | 270,000 | |
Oakdale MN Cottage Homesteads of Aspen (Housing Revenue, FHLMC Insured) | | | 0.20 | | | | 06/01/2045 | | | | 2,300,000 | | | | 2,300,000 | |
Plymouth MN at the Lake Apartments Project (Housing Revenue, FHLMC Insured) | | | 0.17 | | | | 08/01/2034 | | | | 1,900,000 | | | | 1,900,000 | |
Ramsey County MN Housing & Redevelopment Gateway Apartments LP Series A (Housing Revenue, LaSalle Bank NA LOC) | | | 0.15 | | | | 10/01/2038 | | | | 1,150,000 | | | | 1,150,000 | |
Rochester MN Health Care Facilities Mayo Foundation (Hospital Revenue, Bank of America NA LOC) | | | 0.04 | | | | 08/15/2032 | | | | 1,650,000 | | | | 1,650,000 | |
Rush City MN Plastech Corporation Project (IDR, U.S. Bank NA LOC) | | | 0.13 | | | | 09/01/2014 | | | | 975,000 | | | | 975,000 | |
St. Paul MN Housing & RDA Leased Housing Association Series A (Housing Revenue, LaSalle Bank NA LOC) | | | 0.19 | | | | 09/01/2035 | | | | 595,000 | | | | 595,000 | |
St. Paul MN Housing & RDA Science Museum of Minnesota Series A (Miscellaneous Revenue, U.S. Bank NA LOC) | | | 0.08 | | | | 05/01/2027 | | | | 300,000 | | | | 300,000 | |
St. Paul MN Port Authority District Heating Series 14-S (Utilities Revenue, Deutsche Bank AG LOC) | | | 0.05 | | | | 12/01/2028 | | | | 1,450,000 | | | | 1,450,000 | |
St. Paul MN Port Authority District Heating Series 7-Q (Utilities Revenue, Deutsche Bank AG LOC) | | | 0.05 | | | | 12/01/2028 | | | | 375,000 | | | | 375,000 | |
St. Paul MN Port Authority District Series 12EE (Utilities Revenue, Deutsche Bank AG LOC) | | | 0.10 | | | | 03/01/2029 | | | | 150,000 | | | | 150,000 | |
St. Paul MN Port Authority District Series 9BB (Utilities Revenue, Deutsche Bank AG LOC) | | | 0.05 | | | | 03/01/2029 | | | | 1,370,000 | | | | 1,370,000 | |
St. Paul MN Port Authority Tax Increment Westgate Office & Industrial Center Project (Tax Revenue, U.S. Bank NA LOC) | | | 0.05 | | | | 02/01/2015 | | | | 2,460,000 | | | | 2,460,000 | |
Stevens County MN Solid Waste Disposal Riverview Dairy Project Series 2007 (Miscellaneous Revenue, AgCountry Farm Credit LOC) | | | 0.19 | | | | 08/01/2032 | | | | 3,650,000 | | | | 3,650,000 | |
Swift County MN Solid Waste Disposal East Dublin Dairy LLP Project Series 2008 (Miscellaneous Revenue, AgCountry Farm Credit LOC) | | | 0.19 | | | | 04/01/2033 | | | | 3,250,000 | | | | 3,250,000 | |
| | | | |
| | | | | | | | | | | | | | | 70,321,000 | |
| | | | | | | | | | | | | | | | |
| | | | | | | | |
| Total Investments in Securities | | | | | | | | |
| (Cost $71,321,000)* | | | 93.41 | % | | | 71,321,000 | |
Other Assets and Liabilities, Net | | | 6.59 | | | | 5,032,824 | |
| | | | | | | | |
| Total Net Assets | | | 100.00 | % | | $ | 76,353,824 | |
| | | | | | | | |
| (q) | Credit enhancement is provided by an affiliate. |
| § | These securities are subject to a demand feature which reduces the effective maturity. |
| * | Cost for federal income tax purposes is substantially the same as for financial reporting purposes. |
The accompanying notes are an integral part of these financial statements.
| | | | |
| 10 | | Wells Fargo Advantage Minnesota Money Market Fund | | Statement of Assets and Liabilities—July 31, 2011 (Unaudited) |
| | | | |
| | | | |
| |
Assets | | | | |
Investments in unaffiliated securities, at amortized cost | | $ | 71,321,000 | |
Cash | | | 4,012,095 | |
Receivable for investments sold | | | 1,020,003 | |
Receivable for interest | | | 9,775 | |
Receivable from adviser | | | 41,423 | |
Prepaid expenses and other assets | | | 6,301 | |
| | | | |
Total assets | | | 76,410,597 | |
| | | | |
| |
Liabilities | | | | |
Distribution fees payable | | | 35 | |
Due to other related parties | | | 19,916 | |
Shareholder servicing fees payable | | | 18,270 | |
Professional fees payable | | | 14,724 | |
Shareholder report expenses payable | | | 3,828 | |
| | | | |
Total liabilities | | | 56,773 | |
| | | | |
Total net assets | | $ | 76,353,824 | |
| | | | |
| |
NET ASSETS CONSIST OF | | | | |
Paid-in capital | | $ | 76,347,061 | |
Accumulated net realized gains on investments | | | 6,763 | |
| | | | |
Total net assets | | $ | 76,353,824 | |
| | | | |
| |
COMPUTATION OF NET ASSET VALUE PER SHARE1 | | | | |
Net assets – Class A | | $ | 76,229,105 | |
Shares outstanding – Class A | | | 76,222,127 | |
Net asset value per share – Class A | | | $1.00 | |
Net assets – Sweep Class | | $ | 124,719 | |
Shares outstanding – Sweep Class | | | 124,707 | |
Net asset value per share – Sweep Class | | | $1.00 | |
| 1. | The Fund has an unlimited number of authorized shares. |
The accompanying notes are an integral part of these financial statements.
| | | | | | |
| Statement of Operations—Six Months Ended July 31, 2011 (Unaudited) | | Wells Fargo Advantage Minnesota Money Market Fund | | | 11 | |
| | | | |
| | | | |
| |
Investment income | | | | |
Interest | | $ | 104,942 | |
| | | | |
| |
Expenses | | | | |
Advisory fee | | | 138,863 | |
Administration fees | | | | |
Fund level | | | 23,144 | |
Class A | | | 101,704 | |
Sweep Class | | | 128 | |
Shareholder servicing fees | | | | |
Class A | | | 109,269 | |
Sweep Class | | | 146 | |
Distribution fees | | | | |
Sweep Class | | | 204 | |
Custody and accounting fees | | | 3,103 | |
Professional fees | | | 17,757 | |
Registration fees | | | 3,904 | |
Shareholder report expenses | | | 5,951 | |
Trustees’ fees and expenses | | | 5,245 | |
Other fees and expenses | | | 2,200 | |
| | | | |
Total expenses | | | 411,618 | |
Less: Fee waivers and/or expense reimbursements | | | (311,305 | ) |
| | | | |
Net expenses | | | 100,313 | |
| | | | |
Net investment income | | | 4,629 | |
Net realized gains on investments | | | 10,313 | |
| | | | |
Net increase in net assets resulting from operations | | $ | 14,942 | |
| | | | |
The accompanying notes are an integral part of these financial statements.
| | | | |
| 12 | | Wells Fargo Advantage Minnesota Money Market Fund | | Statements of Changes in Net Assets |
| | | | | | | | | | | | | | | | | | | | | | | | |
| | | Six Months Ended July 31, 2011 (Unaudited) | | | Year Ended January 31, 20111 | | | Year Ended February 28, 2010 | |
| | | | | | |
Operations | | | | | | | | | | | | | | | | | | | | | | | | |
Net investment income | | | | | | $ | 4,629 | | | | | | | $ | 10,367 | | | | | | | $ | 38,886 | |
Net realized gains (losses) on investments | | | | | | | 10,313 | | | | | | | | (3,544 | ) | | | | | | | 17,517 | |
| | | | | | | | | | | | | | | | | | | | | | | | |
Net increase in net assets resulting from operations | | | | | | | 14,942 | | | | | | | | 6,823 | | | | | | | | 56,403 | |
| | | | | | | | | | | | | | | | | | | | | | | | |
| | | | | | |
Distributions to shareholders from | | | | | | | | | | | | | | | | | | | | | | | | |
Net investment income | | | | | | | | | | | | | | | | | | | | | | | | |
Class A | | | | | | | (4,623 | ) | | | | | | | (10,361 | ) | | | | | | | (38,886 | ) |
Sweep Class | | | | | | | (6 | ) | | | | | | | (6 | )2 | | | | | | | NA | |
Net realized gains | | | | | | | | | | | | | | | | | | | | | | | | |
Class A | | | | | | | 0 | | | | | | | | 0 | | | | | | | | (63,082 | ) |
| | | | | | | | | | | | | | | | | | | | | | | | |
Total distributions to shareholders | | | | | | | (4,629 | ) | | | | | | | (10,367 | ) | | | | | | | (101,968 | ) |
| | | | | | | | | | | | | | | | | | | | | | | | |
| | | | | | |
| | | Shares | | | | | | Shares | | | | | | Shares | | | | |
| | | | | | |
Capital share transactions | | | | | | | | | | | | | | | | | | | | | | | | |
Proceeds from shares sold | | | | | | | | | | | | | | | | | | | | | | | | |
Class A | | | 153,944,736 | | | | 153,944,736 | | | | 329,576,575 | | | | 329,576,575 | | | | 308,250,015 | | | | 308,250,015 | |
Sweep Class | | | 162,182 | | | | 162,182 | | | | 101,418 | 2 | | | 101,418 | 2 | | | NA | | | | NA | |
| | | | | | | | | | | | | | | | | | | | | | | | |
| | | | | | | 154,106,918 | | | | | | | | 329,677,993 | | | | | | | | 308,250,015 | |
| | | | | | | | | | | | | | | | | | | | | | | | |
Reinvestment of distributions | | | | | | | | | | | | | | | | | | | | | | | | |
Class A | | | 4,313 | | | | 4,313 | | | | 10,094 | | | | 10,094 | | | | 97,395 | | | | 97,395 | |
Sweep Class | | | 6 | | | | 6 | | | | 6 | 2 | | | 6 | 2 | | | NA | | | | NA | |
| | | | | | | | | | | | | | | | | | | | | | | | |
| | | | | | | 4,319 | | | | | | | | 10,100 | | | | | | | | 97,395 | |
| | | | | | | | | | | | | | | | | | | | | | | | |
Payment for shares redeemed | | | | | | | | | | | | | | | | | | | | | | | | |
Class A | | | (175,319,472 | ) | | | (175,319,472 | ) | | | (367,527,065 | ) | | | (367,527,065 | ) | | | (352,458,754 | ) | | | (352,458,754 | ) |
Sweep Class | | | (138,905 | ) | | | (138,905 | ) | | | 0 | 2 | | | 0 | 2 | | | NA | | | | NA | |
| | | | | | | | | | | | | | | | | | | | | | | | |
| | | | | | | (175,458,377 | ) | | | | | | | (367,527,065 | ) | | | | | | | (352,458,754 | ) |
| | | | | | | | | | | | | | | | | | | | | | | | |
Net decrease in net assets resulting from capital share transactions | | | | | | | (21,347,140 | ) | | | | | | | (37,838,972 | ) | | | | | | | (44,111,344 | ) |
| | | | | | | | | | | | | | | | | | | | | | | | |
Total decrease in net assets | | | | | | | (21,336,827 | ) | | | | | | | (37,842,516 | ) | | | | | | | (44,156,909 | ) |
| | | | | | |
Net assets | | | | | | | | | | | | | | | | | | | | | | | | |
Beginning of period | | | | | | | 97,690,651 | | | | | | | | 135,533,167 | | | | | | | | 179,690,076 | |
| | | | | | | | | | | | | | | | | | | | | | | | |
End of period | | | | | | $ | 76,353,824 | | | | | | | $ | 97,690,651 | | | | | | | $ | 135,533,167 | |
| | | | | | | | | | | | | | | | | | | | | | | | |
| 1. | For the eleven months ended January 31, 2011. The Fund changed its fiscal year end from February 28 to January 31, effective January 31, 2011. |
| 2. | Class commenced operations on June 30, 2010. |
The accompanying notes are an integral part of these financial statements.
| | | | | | |
| Financial Highlights | | Wells Fargo Advantage Minnesota Money Market Fund | | | 13 | |
| | | | | | | | | | | | | | | | | | | | | | | | | | | | |
(For a share outstanding throughout each period) | | | | |
| | | |
| | | Six Months Ended
July 31, 2011
(Unaudited) | | | Year Ended
January 31, 20111 | | | Year Ended February 28, | |
| Class A | | | | 2010 | | | 2009 | | | 2008 | | | 2007 | | | 20062 | |
Net asset value, beginning of period | | $ | 1.00 | | | $ | 1.00 | | | $ | 1.00 | | | $ | 1.00 | | | $ | 1.00 | | | $ | 1.00 | | | $ | 1.00 | |
Net investment income | | | 0.00 | 3 | | | 0.00 | 3 | | | 0.00 | 3 | | | 0.01 | | | | 0.03 | | | | 0.03 | | | | 0.02 | |
Net realized gains (losses) on investments | | | 0.00 | 3 | | | (0.00 | )3 | | | 0.00 | | | | 0.00 | | | | 0.00 | | | | 0.00 | | | | 0.00 | |
| | | | | | | | | | | | | | | | | | | | | | | | | | | | |
Total from investment operations | | | 0.00 | 3 | | | 0.00 | 3 | | | 0.00 | 3 | | | 0.01 | | | | 0.03 | | | | 0.03 | | | | 0.02 | |
Distributions to shareholders from | | | | | | | | | | | | | | | | | | | | | | | | | | | | |
Net investment income | | | (0.00 | )3 | | | (0.00 | )3 | | | (0.00 | )3 | | | (0.01 | ) | | | (0.03 | ) | | | (0.03 | ) | | | (0.02 | ) |
Net realized gains | | | 0.00 | | | | 0.00 | | | | (0.00 | )3 | | | 0.00 | | | | 0.00 | | | | 0.00 | | | | 0.00 | |
| | | | | | | | | | | | | | | | | | | | | | | | | | | | |
Total distributions to shareholders | | | (0.00 | )3 | | | (0.00 | )3 | | | (0.00 | )3 | | | (0.01 | ) | | | (0.03 | ) | | | (0.03 | ) | | | (0.02 | ) |
Net asset value, end of period | | | $1.00 | | | | $1.00 | | | | $1.00 | | | | $1.00 | | | | $1.00 | | | | $1.00 | | | | $1.00 | |
Total return4 | | | 0.00 | % | | | 0.01 | % | | | 0.08 | % | | | 1.24 | % | | | 2.77 | % | | | 2.78 | % | | | 1.75 | % |
Ratios to average net assets (annualized) | | | | | | | | | | | | | | | | | | | | | | | | | | | | |
Gross expenses | | | 0.89 | % | | | 0.86 | % | | | 0.95 | % | | | 0.90 | % | | | 0.88 | % | | | 0.90 | % | | | 0.88 | % |
Net expenses | | | 0.22 | % | | | 0.33 | % | | | 0.49 | % | | | 0.82 | % | | | 0.80 | % | | | 0.80 | % | | | 0.80 | % |
Net investment income | | | 0.01 | % | | | 0.01 | % | | | 0.03 | % | | | 1.22 | % | | | 2.71 | % | | | 2.73 | % | | | 1.90 | % |
Supplemental data | | | | | | | | | | | | | | | | | | | | | | | | | | | | |
Net assets, end of period (000’s omitted) | | | $76,229 | | | | $97,589 | | | | $135,533 | | | | $179,690 | | | | $182,601 | | | | $118,011 | | | | $138,917 | |
| 1. | For the eleven months ended January 31, 2011. The Fund changed its fiscal year end from February 28 to January 31, effective January 31, 2011. |
| 2. | For the eleven months ended February 28, 2006. The Fund changed its fiscal year end from March 31 to February 28, effective February 28, 2006. |
| 3. | Amount is less than $0.005. |
| 4. | Returns for periods of less than one year are not annualized. |
The accompanying notes are an integral part of these financial statements.
| | | | |
| 14 | | Wells Fargo Advantage Minnesota Money Market Fund | | Financial Highlights |
| | | | | | | | |
(For a share outstanding throughout each period) | | | | |
Sweep Class | | Six Months Ended
July 31, 2011 (Unaudited) | | | Year Ended
January 31, 20111 | |
Net asset value, beginning of period | | $ | 1.00 | | | $ | 1.00 | |
Net investment income | | | 0.00 | 2 | | | 0.00 | 2 |
Net realized gains (losses) on investments | | | 0.00 | 2 | | | (0.00 | )2 |
| | | | | | | | |
Total from investment operations | | | 0.00 | 2 | | | 0.00 | 2 |
Distributions to shareholders from | | | | | | | | |
Net investment income | | | (0.00 | )2 | | | (0.00 | )2 |
Net asset value, end of period | | $ | 1.00 | | | $ | 1.00 | |
Total return3 | | | 0.01 | % | | | 0.01 | % |
Ratios to average net assets (annualized) | | | | | | | | |
Gross expenses | | | 1.26 | % | | | 1.23 | % |
Net expenses | | | 0.20 | % | | | 0.32 | % |
Net investment income | | | 0.01 | % | | | 0.01 | % |
Supplemental data | | | | | | | | |
Net assets, end of period (000’s omitted) | | | $125 | | | | $101 | |
| 1. | For the period from June 30, 2010 (commencement of class operations) to January 31, 2011. |
| 2. | Amount is less than $0.005. |
| 3. | Returns for periods of less than one year are not annualized. |
The accompanying notes are an integral part of these financial statements.
| | | | | | |
| Notes to Financial Statements (Unaudited) | | Wells Fargo Advantage Minnesota Money Market Fund | | | 15 | |
1. ORGANIZATION
Wells Fargo Funds Trust (the “Trust”), a Delaware statutory trust organized on March 10, 1999, is an open-end management investment company registered under the Investment Company Act of 1940, as amended (the “1940 Act”). These financial statements report on Wells Fargo Advantage Minnesota Municipal Money Market Fund (the “Fund”) which is a diversified series of the Trust.
2. SIGNIFICANT ACCOUNTING POLICIES
The following significant accounting policies, which are consistently followed in the preparation of the financial statements of the Fund, are in conformity with U.S. generally accepted accounting principles which require management to make estimates and assumptions that affect the reported amounts of assets and liabilities, disclosure of contingent assets and liabilities at the date of the financial statements, and the reported amounts of revenues and expenses during the reporting period. Actual results could differ from those estimates.
Securities valuation
As permitted under Rule 2a-7 of the 1940 Act, securities are valued at amortized cost, which approximates fair value.
The valuation techniques used by the Fund to measure fair value are consistent with the market approach, income approach and/or cost approach, where applicable, for each security type.
Security transactions and income recognition
Securities transactions are recorded on a trade date basis. Realized gains or losses are reported on the basis of identified cost of securities delivered.
Interest income is accrued daily and bond discounts are accreted and premiums are amortized daily based on the effective interest method. To the extent debt obligations are placed on non-accrual status, any related interest income may be reduced by writing off interest receivables when the collection of all or a portion of interest has become doubtful based on consistently applied procedures. If the issuer subsequently resumes interest payments or when the collectability of interest is reasonably assured, the debt obligation is removed from non-accrual status.
Distributions to shareholders
Distributions to shareholders from net investment income are accrued daily and paid monthly. Distributions from net realized gains, if any, are recorded on the ex-dividend date. Such distributions are determined in conformity with income tax regulations, which may differ from generally accepted accounting principles.
Federal and other taxes
The Fund intends to continue to qualify as a regulated investment company by distributing substantially all of its investment company taxable and tax-exempt income and any net realized capital gains (after reduction for capital loss carryforwards) sufficient to relieve it from all, or substantially all, federal income taxes. Accordingly, no provision for federal income taxes was required.
The Fund’s income and federal excise tax returns and all financial records supporting those returns for the prior three fiscal years are subject to examination by the federal and Delaware revenue authorities.
As of January 31, 2011, the Fund had estimated net capital loss carryforwards, which were available to offset future net realized capital gains, in the amount of $3,550 expiring in 2019.
Under the recently enacted Regulated Investment Company Modernization Act of 2010, the Fund will be permitted to carry forward capital losses incurred in taxable years beginning after December 22, 2010 for an unlimited period. However, any losses incurred during those future taxable years will be required to be utilized prior to the losses incurred in pre-enactment taxable years. As a result of this ordering rule, pre-enactment capital loss carryforwards may be more likely to expire unused. Additionally, post-enactment capital losses that are carried forward will retain their character as either short-term or long-term capital losses rather than being considered all short-term as under previous law.
Class allocations
The separate classes of shares offered by the Fund differ principally in distribution, shareholder servicing and administration fees. Shareholders of each class bear certain expenses that pertain to that particular class. All shareholders bear the common expenses of the Fund, earn income from the portfolio, and are allocated unrealized gains and losses
| | | | |
| 16 | | Wells Fargo Advantage Minnesota Money Market Fund | | Notes to Financial Statements (Unaudited) |
pro rata based on the average daily net assets of each class, without distinction between share classes. Dividends are determined separately for each class based on income and expenses allocable to each class. Realized gains and losses are allocated to each class pro rata based upon the net assets of each class on the date realized. Differences in per share dividend rates generally result from the relative weightings of pro rata income and realized gain allocations and from differences in separate class expenses, including distribution, shareholder servicing and administration fees.
3. FAIR VALUATION MEASUREMENTS
Fair value measurements of investments are determined within a framework that has established a fair value hierarchy based upon the various data inputs utilized in determining the value of the Fund’s investments. The three-level hierarchy gives the highest priority to unadjusted quoted prices in active markets for identical assets or liabilities (Level 1) and the lowest priority to unobservable inputs (Level 3). The Fund’s investments are classified within the fair value hierarchy based on the lowest level of input that is significant to the fair value measurement. The inputs are summarized into three broad levels as follows:
| n | | Level 1 – quoted prices in active markets for identical securities |
| n | | Level 2 – other significant observable inputs (including quoted prices for similar securities, interest rates, prepayment speeds, credit risk, etc.) |
| n | | Level 3 – significant unobservable inputs (including the Fund’s own assumptions in determining the fair value of investments) |
The inputs or methodologies used for valuing securities are not necessarily an indication of the risk associated with investing in those securities.
At July 31, 2011, all of the Fund’s investments in securities carried at fair value were designated as Level 2 since the primary inputs include credit quality of the issuer and short-term interest rates which are observable.
Further details on the major security types can be found in the Fund’s Portfolio of Investments.
4. TRANSACTIONS WITH AFFILIATES AND OTHER EXPENSES
Advisory fee
The Trust has entered into an advisory contract with Wells Fargo Funds Management, LLC (“Funds Management”), an indirect wholly owned subsidiary of Wells Fargo & Company (“Wells Fargo”). The adviser is responsible for implementing investment policies and guidelines and for supervising the sub-adviser, who is responsible for day-to-day portfolio management of the Fund.
Pursuant to the contract, Funds Management is entitled to receive an annual advisory fee starting at 0.30% and declining to 0.20% as the average daily net assets of the Fund increase. For the six months ended July 31, 2011, the advisory fee was equivalent to an annual rate of 0.30% of the Fund’s average daily net assets.
Funds Management may retain the services of certain sub-advisers to provide daily portfolio management to the Fund. The fees related to sub-advisory services are borne directly by the adviser and do not increase the overall fees paid by the Fund to the adviser. Wells Capital Management Incorporated, an affiliate of Funds Management, is the sub-adviser to the Fund and is entitled to receive a fee from the adviser at an annual rate starting at 0.05% and declining to 0.01% as the average daily net assets of the Fund increase.
Administration and transfer agent fees
The Trust has entered into an administration agreement with Funds Management. Under this agreement, for providing administrative services, which includes paying fees and expenses for services provided by the transfer agent, sub-transfer agents, omnibus account servicers and record-keepers, Funds Management is entitled to receive from the Fund an annual fund level administration fee starting at 0.05% and declining to 0.03% as the average daily net assets of the Fund increase and a class level administration fee of 0.22% of the average daily net assets of each class.
Funds Management has contractually waived and/or reimbursed advisory and administration fees to the extent necessary to maintain certain net operating expense ratios for the Fund. Waiver of fees and/or reimbursement of expenses by Funds Management were made first from fund level expenses on a proportionate basis and then from class specific expenses.
| | | | | | |
| Notes to Financial Statements (Unaudited) | | Wells Fargo Advantage Minnesota Money Market Fund | | | 17 | |
Distribution fees
The Trust has adopted a Distribution Plan for Sweep Class shares of the Fund pursuant to Rule 12b-1 under the 1940 Act. Distribution fees are charged to the Sweep Class shares and paid to Wells Fargo Funds Distributor, LLC, the principal underwriter of the Fund, at an annual rate of 0.35% of the average daily net assets of Sweep Class shares.
Shareholder servicing fees
The Trust has entered into contracts with one or more shareholder servicing agents, whereby Class A and Sweep Class of the Fund is charged a fee at an annual rate of 0.25% of the respective average daily net assets of each class.
A portion of these total shareholder servicing fees were paid to affiliates of Wells Fargo.
5. CONCENTRATION RISK
The Fund invests a substantial portion of its assets in issuers of municipal debt securities located in a single state, therefore, it may be more affected by economic and political developments in that state or region than would be a comparable general tax-exempt mutual fund.
6. INDEMNIFICATION
Under the Trust’s organizational documents, the officers and directors are indemnified against certain liabilities that may arise out of performance of their duties to the Trust. Additionally, in the normal course of business, the Trust may enter into contracts with service providers that contain a variety of indemnification clauses. The Trust’s maximum exposure under these arrangements is dependent on future claims that may be made against the Fund and, therefore, cannot be estimated.
7. NEW ACCOUNTING PRONOUNCEMENTS
In May 2011, the Financial Accounting Standards Board (“FASB”) issued Accounting Standards Update (“ASU”) No. 2011-04 “Amendments to Achieve Common Fair Value Measurement and Disclosure Requirements in U.S. GAAP and IFRSs”. ASU No. 2011-04 amends FASB ASC Topic 820, Fair Value Measurements and Disclosures, to establish common requirements for measuring fair value and for disclosing information about fair value measurements in accordance with GAAP. The ASU is effective prospectively for interim and annual periods beginning after December 15, 2011.
In April 2011, FASB issued ASU No. 2011-03 “Reconsideration of Effective Control for Repurchase Agreements”. ASU No. 2011-03 amends FASB ASC Topic 860, Transfers and Servicing, specifically the criteria required to determine whether a repurchase agreement (repo) and similar agreements should be accounted for as sales of financial assets or secured borrowings with commitments. ASU No. 2011-03 changes the assessment of effective control by focusing on the transferor’s contractual rights and obligations and removing the criterion to assess its ability to exercise those rights or honor those obligations. This could result in changes to the way entities account for certain transactions including repurchase agreements, mortgage dollar rolls and reverse repurchase agreements. The ASU will become effective on a prospective basis for new transfers and modifications to existing transactions as of the beginning of the first interim or annual period beginning on or after December 15, 2011.
As of July 31, 2011, management of the Fund is currently assessing the potential impact, in addition to expanded financial statement disclosure, that may result from adopting these ASUs.
| | | | |
| 18 | | Wells Fargo Advantage Minnesota Money Market Fund | | Other Information (Unaudited) |
PORTFOLIO HOLDINGS INFORMATION
The complete portfolio holdings for the Fund are publicly available on the Fund’s Web site (www.wellsfargo.com/advantagefunds) on a monthly, seven-day delayed basis. The Fund files its complete schedule of portfolio holdings with the SEC for the first and third quarters of each fiscal year on Form N-Q, which is available without charge by visiting the SEC Web site at www.sec.gov. In addition, the Fund’s Form N-Q may be reviewed and copied at the SEC’s Public Reference Room in Washington, DC, and at regional offices in New York City, at 233 Broadway, and in Chicago, at 175 West Jackson Boulevard, Suite 900. Information about the Public Reference Room may be obtained by calling 1-800-SEC-0330.
PROXY VOTING INFORMATION
A description of the policies and procedures that the Fund uses to determine how to vote proxies relating to portfolio securities is available without charge, upon request, by calling 1-800-222-8222, visiting our Web site at www.wellsfargo.com/advantagefunds, or visiting the SEC Web site at www.sec.gov. Information regarding how the Fund voted proxies relating to portfolio securities during the most recent 12-month period ended June 30 is available without charge on the Fund’s Web site at www.wellsfargo.com/advantagefunds or by visiting the SEC Web site at www.sec.gov.
| | | | | | |
| Other Information (Unaudited) | | Wells Fargo Advantage Minnesota Money Market Fund | | | 19 | |
BOARD OF TRUSTEES
The following table provides basic information about the Board of Trustees (the “Trustees”) of the Trust and Officers of the Trust. This table should be read in conjunction with the Prospectus and the Statement of Additional Information1 of the Fund. Each of the Trustees and Officers listed below acts in identical capacities for the Wells Fargo Advantage family of funds, which consists of 144 funds comprising the Wells Fargo Funds Trust, Wells Fargo Variable Trust, Wells Fargo Master Trust and four closed-end funds (collectively the “Fund Complex”). All of the Trustees are also Members of the Audit and Governance Committees of each Trust in the Fund Complex. The mailing address of each Trustee and Officer is 525 Market Street, 12th Floor, San Francisco, CA 94105. Each Trustee and Officer serves an indefinite term, however, each Trustee serves such term until reaching the mandatory retirement age established by the Trustees.
Independent Trustees
| | | | | | |
Name and Year of Birth | | Position Held and Length of Service | | Principal Occupations During Past Five Years | | Other Directorships During
Past Five Years |
Peter G. Gordon
(Born 1942) | | Trustee, since 1998; Chairman, since 2005 | | Co-Founder, Chairman, President and CEO of Crystal Geyser. Water Company. Trustee Emeritus, Colby College | | Asset Allocation Trust |
Isaiah Harris, Jr.
(Born 1952) | | Trustee, since 2009 | | Retired. Prior thereto, President and CEO of BellSouth Advertising and Publishing Corp. from 2005 to 2007, President and CEO of BellSouth Enterprises from 2004 to 2005 and President of BellSouth Consumer Services from 2000 to 2003. Emeritus member of the Iowa State University Foundation Board of Governors. Emeritus Member of the Advisory Board of Iowa State University School of Business. Mr. Harris is a certified public accountant. | | CIGNA Corporation; Deluxe Corporation; Asset Allocation Trust |
Judith M. Johnson
(Born 1949) | | Trustee, since 2008 | | Retired. Prior thereto, Chief Executive Officer and Chief Investment Officer of Minneapolis Employees Retirement Fund from 1996 to 2008. Ms. Johnson is an attorney, certified public accountant and a certified managerial accountant. | | Asset Allocation Trust |
Leroy Keith, Jr.
(Born 1939) | | Trustee, since 2010 | | Chairman, Bloc Global Services (development and construction), Trustee of the Evergreen Funds from 1983 to 2010. Former Managing Director, Almanac Capital Management (commodities firm), former Partner, Stonington Partners, Inc. (private equity fund), former Director, Obagi Medical Products Co. and former Director, Lincoln Educational Services. | | Trustee, Virtus Fund Complex (consisting of 45 portfolios as of 12/31/10); Director, Diversapack Co. (packaging company); Asset Allocation Trust |
David F. Larcker
(Born 1950) | | Trustee, since 2009 | | James Irvin Miller Professor of Accounting at the Graduate School of Business, Stanford University, Director of Corporate Governance Research Program and Co-Director of The Rock Center for Corporate Governance since 2006. From 2005 to 2008, Professor of Accounting at the Graduate School of Business, Stanford University. Prior thereto, Ernst & Young Professor of Accounting at The Wharton School, University of Pennsylvania from 1985 to 2005. | | Asset Allocation Trust |
Olivia S. Mitchell
(Born 1953) | | Trustee, since 2006 | | International Foundation of Employee Benefit Plans Professor and Chair of the Department of Insurance and Risk Management, Wharton School of the University of Pennsylvania since 1993. Director of Wharton’s Pension Research Council and Boettner Center on Pensions & Retirement Research, and Research Associate at the National Bureau of Economic Research. Previously, Cornell University Professor from 1978 to 1993. | | Asset Allocation Trust |
| | | | |
| 20 | | Wells Fargo Advantage Minnesota Money Market Fund | | Other Information (Unaudited) |
| | | | | | |
Name and Year of Birth | | Position Held and Length of Service | | Principal Occupations During Past Five Years | | Other Directorships During
Past Five Years |
Timothy J. Penny
(Born 1951) | | Trustee, since 1996 | | President and CEO of Southern Minnesota Initiative Foundation, a non-profit organization, since 2007 and Senior Fellow at the Humphrey Institute Policy Forum at the University of Minnesota since 1995. Member of the Board of Trustees of NorthStar Education Finance, Inc., a non-profit organization, since 2007. | | Asset Allocation Trust |
Michael S. Scofield
(Born 1943) | | Trustee, since 2010 | | Currently serves on the Investment Company Institute’s Board of Governors and Executive Committee as well the In dependent Director’s Counsel Board of Governors and Executive Committee. Former Chairman of the Independent Directors Counsel. Trustee of the Evergreen Funds from 1984 to 2010. Retired Attorney, Law Offices of Michael S. Scofield and former Director and Chairman, Branded Media Corporation (multi-media branding company). | | Asset Allocation Trust |
Donald C. Willeke
(Born 1940) | | Trustee, since 1996 | | Principal of the law firm of Willeke & Daniels. General Counsel of the Minneapolis Employees Retirement Fund from 1984 until its consolidation into the Minnesota Public Employees Retirement Association on June 30, 2010. | | Asset Allocation Trust |
Officers
| | | | | | |
Name and Year of Birth | | Position Held and
Length of Service | | Principal Occupations During Past Five Years | | |
Karla M. Rabusch
(Born 1959) | | President, since 2003 | | Executive Vice President of Wells Fargo Bank, N.A. and President of Wells Fargo Funds Management, LLC since 2003. Senior Vice President and Chief Administrative Officer of Wells Fargo Funds Management, LLC from 2001 to 2003. | | |
C. David Messman
(Born 1960) | | Secretary, since 2000; Chief Legal Counsel, since 2003 | | Senior Vice President and Secretary of Wells Fargo Funds Management, LLC since 2001. Vice President and Managing Counsel of Wells Fargo Bank, N.A. since 1996. | | |
Kasey Phillips
(Born 1970) | | Treasurer, since 2008 | | Senior Vice President of Wells Fargo Funds Management, LLC since 2009. Senior Vice President of Evergreen Investment Management Company, LLC from 2006 to 2010. Treasurer of the Evergreen Funds from 2005 to 2010. Vice President and Assistant Vice President of Evergreen Investment Services, Inc. from 1999 to 2006. | | |
David Berardi
(Born 1975) | | Assistant Treasurer, since 2009 | | Vice President of Wells Fargo Funds Management, LLC since 2009 . Vice President of Evergreen Investment Management Company, LLC from 2008 to 2010. Assistant Vice President of Evergreen Investment Services, Inc. from 2004 to 2008. Manager of Fund Reporting and Control for Evergreen Investment Management Company, LLC from 2004 to 2010. | | |
Jeremy DePalma
(Born 1974) | | Assistant Treasurer, since 2009 | | Senior Vice President of Wells Fargo Funds Management, LLC since 2009. Senior Vice President of Evergreen Investment Management Company, LLC from 2008 to 2010. Vice President, Evergreen Investment Services, Inc. from 2004 to 2007. Assistant Vice President, Evergreen Investment Services, Inc. from 2000 to 2004 and the head of the Fund Reporting and Control Team within Fund Administration from 2005 to 2010. | | |
Debra Ann Early
(Born 1964) | | Chief Compliance Officer, since 2007 | | Chief Compliance Officer of Wells Fargo Funds Management, LLC since 2007. Chief Compliance Officer of Parnassus Investments from 2005 to 2007. Chief Financial Officer of Parnassus Investments from 2004 to 2007 and Senior Audit Manager of PricewaterhouseCoopers LLP from 1998 to 2004. | | |
| 1. | The Statement of Additional Information includes additional information about the Fund’s Trustees and is available, without charge, upon request, by calling 1-800-222-8222 or by visiting the Fund’s Web site at www.wellsfargo.com/advantagefunds. |
| | | | | | |
| Other Information (Unaudited) | | Wells Fargo Advantage Minnesota Money Market Fund | | | 21 | |
BOARD CONSIDERATION OF INVESTMENT ADVISORY AND SUB-ADVISORY AGREEMENTS:
California Municipal Money Market Fund, Minnesota Money Market Fund, Municipal Money Market Fund, National Tax-Free Money Market Fund, New Jersey Municipal Money Market Fund, New York Municipal Money Market Fund and Pennsylvania Municipal Money Market Fund
(Not all of the funds described in this Board considerations section are part of this shareholder report. This shareholder report only relates to Minnesota Money Market Fund.)
Each year, as required by Section 15 of the Investment Company Act of 1940 (the “1940 Act”), the Board of Trustees (the “Board”) of Wells Fargo Funds Trust (the “Trust”), all the members of which have no direct or indirect interest in the investment advisory and sub-advisory agreements and are not “interested persons” of the Trust, as defined in the 1940 Act (the “Independent Trustees”), determines whether to approve the continuation of the Trust’s investment advisory and sub-advisory agreements. In this regard, at an in person meeting held on March 24-25, 2011 (the “Meeting”), the Board reviewed and re-approved: (i) an investment advisory agreement with Wells Fargo Funds Management, LLC (“Funds Management”) for each of the California Municipal Money Market Fund, Minnesota Money Market Fund, Municipal Money Market Fund, National Tax-Free Money Market Fund, New Jersey Municipal Money Market Fund, New York Municipal Money Market Fund and Pennsylvania Municipal Money Market Fund (collectively, the “Funds”); and (ii) an investment sub-advisory agreement with Wells Capital Management Incorporated (“Wells Capital Management”) for each of the Funds. The investment advisory agreements with Funds Management and the investment sub-advisory agreements with Wells Capital Management are collectively referred to as the “Advisory Agreements.”
At the Meeting, the Board considered the factors and reached the conclusions described below relating to the selection of Funds Management and Wells Capital Management and continuation of the Advisory Agreements. Prior to the Meeting, the Trustees conferred extensively among themselves and with representatives of Funds Management about these matters. The Board also met throughout the year and received information that was useful to them in considering the continuation of the Advisory Agreements. The Independent Trustees were assisted in their evaluation of the Advisory Agreements by independent legal counsel, from whom they received separate legal advice and with whom they met separately from Funds Management.
Nature, extent and quality of services
The Board received and considered various information regarding the nature, extent and quality of services provided to the Funds by Funds Management and Wells Capital Management under the Advisory Agreements. The Board also received and considered information provided in response to a detailed set of requests submitted by the Independent Trustees’ independent legal counsel on their behalf. The Board received and considered, among other things, information about the background and experience of senior management of Funds Management, and the qualifications, backgrounds, tenures and responsibilities of the portfolio managers primarily responsible for the day-to-day portfolio management of the Funds.
The Board evaluated the ability of Funds Management and Wells Capital Management, based on their respective financial condition, resources, reputation and other attributes, to attract and retain qualified investment professionals, including research, advisory, and supervisory personnel. The Board further considered the compliance programs and compliance records of Funds Management and Wells Capital Management. In addition, the Board took into account the administrative services provided to the Funds by Funds Management and its affiliates.
The Board’s decision to approve the continuation of the Advisory Agreements was based on a comprehensive evaluation of all of the information provided to it. In approving the continuation of the Advisory Agreements, the Board did not identify any particular information or consideration that was all-important or controlling, and each Trustee attributed different weights to various factors. The Board evaluated information provided to it both in terms of the funds generally and with respect to each Fund specifically as it considered appropriate. Although the Board considered the continuation of the Advisory Agreements for each of the Funds as part of the larger process of considering the continuation of the advisory agreements for all of the funds, its decision to continue the Advisory Agreements for each of the Funds was ultimately made on a fund-by-fund basis.
In considering these matters, the Board considered not only the specific information presented in connection with the Meeting, but also the knowledge gained over time through interaction with Funds Management and Wells Capital Management about various topics, including Funds Management’s oversight of service providers. The above factors,
| | | | |
| 22 | | Wells Fargo Advantage Minnesota Money Market Fund | | Other Information (Unaudited) |
together with those referenced below, are some of the most important, but not necessarily all, factors considered by the Board in concluding that it was satisfied with the nature, extent and quality of the investment advisory services provided to each Fund by Funds Management and Wells Capital Management.
Fund performance and expenses
The Board considered the performance results for each of the Funds over various time periods ended December 31, 2010. The Board also considered these results in comparison to the median performance of a universe of relevant funds (the “Universe”) that were determined by Lipper Inc. (“Lipper”) to be similar to the Funds, and in comparison to each Fund’s benchmark index and to other comparative data. Lipper is an independent provider of investment company data. The Board received a description of the methodology used by Lipper to select the mutual funds in the Universe.
The Board noted that the performance of each of the Funds was generally higher than or in range of the median performance of the Universe for the periods under review, except that the longer-term performance of the Minnesota Money Market Fund was lower than the median performance of the Universe.
The Board received and considered information regarding each Fund’s contractual advisory fee and net operating expense ratios and their various components, including actual management fees (which reflect fee waivers, if any), transfer agent, custodian and other non-management fees, Rule 12b-1 and non-Rule 12b-1 fees, service fees and fee waiver and expense reimbursement arrangements. The Board also considered these ratios in comparison to the median ratios of an expense Universe and a narrower expense group of mutual funds (each, an “Expense Group”) that was determined by Lipper to be similar to each Fund. The Board received a description of the methodology used by Lipper to select the mutual funds in a Fund’s Expense Group. The Board noted that the net operating expense ratios of the Service Class, Administrator Class and Institutional Class of each of the Funds were in range of each Fund’s respective Expense Group’s median net operating expense ratio. The Board also noted that the net operating expense ratios of the Class A and Sweep Class of each of the Funds were higher than each Fund’s respective Expense Group’s median net operating expense ratio and that the net operating expense ratio of the Municipal Money Market Fund (Investor Class) was not appreciably higher than the Expense Group’s median net operating expense ratio.
Based on the above-referenced considerations and other factors, the Board concluded that the overall performance and expense structure of the Funds supported the re-approval of the Advisory Agreements for the Funds.
Investment advisory and sub-advisory fee rates
The Board reviewed and considered the contractual investment advisory fee rates that are payable by the Funds to Funds Management for investment advisory services (the “Advisory Agreement Rates”), both on a stand-alone basis and on a combined basis with the Funds’ administration fee rates. The Board took into account the separate administrative and other services covered by the administration fee rates. The Board also reviewed and considered the contractual investment sub-advisory fee rates that are payable by Funds Management to Wells Capital Management for investment sub-advisory services (the “Sub-Advisory Agreement Rates”). In addition, the Board reviewed and considered the existing fee waiver/cap arrangements applicable to the Advisory Agreement Rates and considered the Advisory Agreement Rates after taking the waivers/caps into account (the “Net Advisory Rates”).
The Board received and considered information comparing the Advisory Agreement Rates and Net Advisory Rates with those of other funds in each Fund’s Expense Group median. The Board noted that the Advisory Agreement Rates for each of the Funds were in range of the median rate of each Fund’s Expense Group, except for the Municipal Money Market Fund and the New York Municipal Money Market Fund (Sweep Class). The Board noted that the Net Advisory Rates for the Service Class, Administrator Class and the Institutional Class of each of the Funds were lower than or in range of the median rate of each Fund’s Expense Group. The Board noted that the Net Advisory Rate for the Investor Class, Class A and Sweep Class of each of the Funds was not appreciably higher than the median rate for the Fund’s Expense, except for the Sweep Class of the Municipal Money Market Fund, New Jersey Municipal Money Market Fund and the New York Municipal Money Market Fund. The Board further noted that Funds Management had agreed to continue and, in certain instances, reduce contractual fee cap arrangements for the Funds designed to lower the Funds’ expenses.
The Board also received and considered information about the nature and extent of services offered and fee rates charged by Funds Management and Wells Capital Management to other types of clients. In this regard, the Board received information about differences between the services, and the compliance, reporting, and other legal burdens
| | | | | | |
| Other Information (Unaudited) | | Wells Fargo Advantage Minnesota Money Market Fund | | | 23 | |
and risks of providing investment advice to mutual funds and those associated with providing advice to non-mutual fund clients such as collective funds or institutional separate accounts.
In each case, the Board determined that the Advisory Agreement Rates for the Funds, both with and without administration fee rates and before and after waivers, were acceptable in light of the Funds’ Expense Group information, the net expense ratio commitments, the services covered by the Advisory Agreements and other information provided. The Board also reviewed and considered the Sub-Advisory Agreement Rates and concluded that the Sub-Advisory Agreement Rates were acceptable in light of the services covered by the Sub-Advisory Agreement and other information provided.
Profitability
The Board received and considered a profitability analysis of Funds Management, as well as an analysis of the profitability to the collective Wells Fargo businesses that provide services to the Funds. It considered that the information provided to it was necessarily estimated, and that the profitability information provided to it, especially on a fund-by-fund basis, did not necessarily provide a precise tool for evaluating the appropriateness of each Fund’s Advisory Agreement Rates in isolation. It noted that the levels of profitability of the Funds to Funds Management varied widely, depending on, among other things, the size and type of fund. The Board concluded that the profitability to Funds Management of the services provided to any of the Funds, individually or in the aggregate, was not unreasonable.
The Board did not consider separate profitability information with respect to Wells Capital Management, because, as an affiliate of Funds Management, its profitability information was subsumed in the collective Wells Fargo profitability analysis provided by Funds Management.
Economies of scale
With respect to possible economies of scale, the Board reviewed the breakpoints in each Fund’s advisory fee structure, which operate generally to reduce the effective Advisory Agreement Rates of the Funds (as a percentage of Fund assets) as the Funds grow in size. It considered that, as a fund shrinks in size, breakpoints conversely result in increasing fee levels. The Board noted that it would continue to review the appropriate levels of breakpoints in the future, and concluded that the breakpoints as implemented appeared to be a reasonable step toward sharing economies of scale with the Funds. However, the Board acknowledged the inherent limitations of any analysis of an investment adviser’s economies of scale and of any attempt to correlate breakpoints with such economies, stemming largely from the Board’s understanding that economies of scale are realized, if at all, by an investment adviser across a variety of products and services, not just with respect to a single fund.
Other benefits to Funds Management and Wells Capital Management
The Board received and considered information regarding potential “fall-out” or ancillary benefits received by Funds Management and its affiliates, including Wells Capital Management, as a result of their relationship with the Funds. Ancillary benefits could include, among others, benefits directly attributable to the relationship of Funds Management and Wells Capital Management with the Funds and benefits potentially derived from an increase in Funds Management’s and Wells Capital Management’s business as a result of their relationship with the Funds (such as the ability to market to shareholders other financial products offered by Funds Management and its affiliates, including Wells Capital Management).
The Board considered that Wells Fargo Funds Distributor, LLC, an affiliate of Funds Management, serves as distributor to the Funds and receives certain compensation for those services. The Board noted that the Funds pay sub-transfer agency fees to various financial institutions, including affiliates of Funds Management that hold fund shares in omnibus accounts. It also considered that these entities may receive distribution-related fees and shareholder servicing payments (including amounts derived from payments under the funds’ Rule 12b-1 plans) in respect of shares sold or held through them.
The Board also reviewed information about whether and to what extent soft dollar credits are sought and how any such credits are utilized and any benefits that may be realized by using an affiliated broker.
Other factors and broader review
The Board also considered the markets for distribution of the Funds’ shares, including the multiple channels through which the Funds’ shares are offered and sold. The Board noted that the Funds are part of one of the few fund families that have both direct-to-fund and intermediary distribution channels. As discussed above, the Board reviews detailed
| | | | |
| 24 | | Wells Fargo Advantage Minnesota Money Market Fund | | Other Information (Unaudited) |
materials received from Funds Management and Wells Capital Management annually as part of the re-approval process under Section 15 of the 1940 Act and also reviews and assesses information about the quality of the services that the Funds receive throughout the year. In this regard, the Board has reviewed reports of Funds Management at each of its quarterly meetings, which include, among other things, portfolio reviews and performance reports. In addition, the Board confers with portfolio managers at various times throughout the year.
Conclusion
After considering the above-described factors and based on its deliberations and its evaluation of the information described above, the Board concluded that approval of the continuation of the Advisory Agreements for the Funds was in the best interest of the Funds and their shareholders. Accordingly, the Board unanimously approved the continuation of the Advisory Agreements for an additional one-year period.
| | | | | | |
| List of Abbreviations | | Wells Fargo Advantage Minnesota Money Market Fund | | | 25 | |
The following is a list of common abbreviations for terms and entities which may have appeared in this report.
| ABAG | — Association of Bay Area Governments |
| ACB | — Agricultural Credit Bank |
| ADR | — American Depositary Receipt |
| ADS | — American Depository Shares |
| AGC-ICC | — Assured Guaranty Corporation - Insured Custody Certificates |
| AGM | — Assured Guaranty Municipal |
| AMBAC | — American Municipal Bond Assurance Corporation |
| AMT | — Alternative Minimum Tax |
| ARM | — Adjustable Rate Mortgages |
| BAN | — Bond Anticipation Notes |
| BART | — Bay Area Rapid Transit |
| BHAC | — Berkshire Hathaway Assurance Corporation |
| CCAB | — Convertible Capital Appreciation Bond |
| CDA | — Community Development Authority |
| CDO | — Collateralized Debt Obligation |
| CDSC | — Contingent Deferred Sales Charge |
| CGIC | — Capital Guaranty Insurance Company |
| CGY | — Capital Guaranty Corporation |
| CIFG | — CDC (Caisse des Dépôts et Consignations) IX IS Financial Guarantee |
| COP | — Certificate of Participation |
| DRIVER | — Derivative Inverse Tax-Exempt Receipts |
| DW&P | — Department of Water & Power |
| DWR | — Department of Water Resources |
| ECFA | — Educational & Cultural Facilities Authority |
| EDFA | — Economic Development Finance Authority |
| ETET | — Eagle Tax-Exempt Trust |
| ETF | — Exchange-Traded Fund |
| FFCB | — Federal Farm Credit Bank |
| FGIC | — Financial Guaranty Insurance Corporation |
| FHA | — Federal Housing Authority |
| FHAG | — Federal Housing Agency |
| FHLB | — Federal Home Loan Bank |
| FHLMC | — Federal Home Loan Mortgage Corporation |
| FNMA | — Federal National Mortgage Association |
| GDR | — Global Depositary Receipt |
| GNMA | — Government National Mortgage Association |
| HCFR | — Healthcare Facilities Revenue |
| HEFA | — Health & Educational Facilities Authority |
| HEFAR | — Higher Education Facilities Authority Revenue |
| HFA | — Housing Finance Authority |
| HFFA | — Health Facilities Financing Authority |
| HUD | — Housing & Urban Development |
| IBC | — Insured Bond Certificate |
| IDA | — Industrial Development Authority |
| IDAG | — Industrial Development Agency |
| IDR | — Industrial Development Revenue |
| KRW | — Republic of Korea Won |
| LIBOR | — London Interbank Offered Rate |
| LLC | — Limited Liability Company |
| LLP | — Limited Liability Partnership |
| MBIA | — Municipal Bond Insurance Association |
| MFHR | — Multi-Family Housing Revenue |
| MFMR | — Multi-Family Mortgage Revenue |
| MMD | — Municipal Market Data |
| MSTR | — Municipal Securities Trust Receipts |
| MUD | — Municipal Utility District |
| NATL-RE | — National Public Finance Guarantee Corporation |
| PCFA | — Pollution Control Finance Authority |
| PCR | — Pollution Control Revenue |
| PFA | — Public Finance Authority |
| PFFA | — Public Facilities Financing Authority |
| PFOTER | — Puttable Floating Option Tax-Exempt Receipts |
| plc | — Public Limited Company |
| PSFG | — Public School Fund Guaranty |
| PUTTER | — Puttable Tax-Exempt Receipts |
| R&D | — Research & Development |
| RDA | — Redevelopment Authority |
| RDFA | — Redevelopment Finance Authority |
| REIT | — Real Estate Investment Trust |
| RIB | — Residual Interest Bond |
| ROC | — Reset Option Certificates |
| SAVRS | — Select Auction Variable Rate Securities |
| SFHR | — Single Family Housing Revenue |
| SFMR | — Single Family Mortgage Revenue |
| SLMA | — Student Loan Marketing Association |
| SPDR | — Standard & Poor’s Depositary Receipts |
| STIT | — Short-Term Investment Trust |
| TAN | — Tax Anticipation Notes |
| TIPS | — Treasury Inflation-Protected Securities |
| TRAN | — Tax Revenue Anticipation Notes |
| TCR | — Transferable Custody Receipts |
| TTFA | — Transportation Trust Fund Authority |
| USD | — Unified School District |
| XLCA | — XL Capital Assurance |
This page is intentionally left blank.


FOR MORE INFORMATION
More information about Wells Fargo Advantage Funds is available free upon request. To obtain literature, please write, e-mail, visit the Funds’ Web site, or call:
Wells Fargo Advantage Funds
P.O. Box 8266
Boston, MA 02266-8266
E-mail: wfaf@wellsfargo.com
Web site: www.wellsfargo.com/advantagefunds
Individual investors: 1-800-222-8222
Retail investment professionals: 1-888-877-9275
Institutional investment professionals: 1-866-765-0778
This report and the financial statements contained herein are submitted for the general information of the shareholders of Wells Fargo Advantage Funds. If this report is used for promotional purposes, distribution of the report must be accompanied or preceded by a current prospectus. For a prospectus containing more complete information, including charges and expenses, call 1-800-222-8222 or visit the Funds’ Web site at www.wellsfargo.com/advantagefunds. Please consider the investment objectives, risks, charges, and expenses of the investment carefully before investing. This and other information about Wells Fargo Advantage Funds can be found in the current prospectus. Read the prospectus carefully before you invest or send money.
Wells Fargo Funds Management, LLC, a wholly owned subsidiary of Wells Fargo & Company, provides investment advisory and administrative services for Wells Fargo Advantage Funds. Other affiliates of Wells Fargo & Company provide subadvisory and other services for the Funds. The Funds are distributed by Wells Fargo Funds Distributor, LLC, Member FINRA/SIPC, an affiliate of Wells Fargo & Company.
NOT FDIC INSURED ¡ NO BANK GUARANTEE ¡ MAY LOSE VALUE
© 2011 Wells Fargo Funds Management, LLC. All rights reserved.
| | |
 | | 204801 09-11 SA305/SAR305 7-11 |

Wells Fargo Advantage Money Market Fund

Semi-Annual Report
July 31,2011

Reduce clutter. Save trees.
Sign up for electronic delivery of prospectuses and shareholder reports at www.wellsfargo.com/advantagedelivery
Contents
The views expressed and any forward-looking statements are as of July 31, 2011, unless otherwise noted and are those of the Fund managers and/or Wells Fargo Funds Management, LLC. Discussions of individual securities, or the markets generally, or any Wells Fargo Advantage Fund are not intended as individual recommendations. Future events or results may vary significantly from those expressed in any forward-looking statements; the views expressed are subject to change at any time in response to changing circumstances in the market. Wells Fargo Funds Management, LLC, disclaims any obligation to publicly update or revise any views expressed or forward-looking statements.
NOT FDIC INSURED ¡ NO BANK GUARANTEE ¡ MAY LOSE VALUE

WELLS FARGO INVESTMENT HISTORY
| | |
| |
| 1932 | | Keystone creates one of the first mutual fund families. |
| |
| 1971 | | Wells Fargo & Company introduces one of the first institutional index funds. |
| |
| 1978 | | Wells Fargo applies Markowitz and Sharpe’s research on Modern Portfolio Theory to introduce one of the industry’s first Tactical Asset Allocation (TAA) models in institutional separately managed accounts. |
| |
| 1984 | | Wells Fargo Stagecoach Funds launches its first asset allocation fund. |
| |
| 1989 | | The Tactical Asset Allocation (TAA) Model is first applied to Wells Fargo’s asset allocation mutual funds. |
| |
| 1994 | | Wells Fargo introduces the LifePath Funds, one of the first suites of target date funds (now the Wells Fargo Advantage Dow Jones Target Date FundsSM ). |
| |
| 1996 | | Evergreen Investments and Keystone Funds merge. |
| |
| 1997 | | Wells Fargo launches Wells Fargo Advantage WealthBuilder PortfoliosSM, a fund-of-funds suite of products that includes the use of quantitative models to shift assets among investment styles. |
| |
| 1999 | | Norwest Advantage Funds and Stagecoach Funds are reorganized into Wells Fargo Funds after the merger of Norwest and Wells Fargo. |
| |
| 2002 | | Evergreen Retail and Evergreen Institutional companies form the umbrella asset management company, Evergreen Investments. |
| |
| 2005 | | The integration of Strong Funds with Wells Fargo Funds creates Wells Fargo Advantage Funds, resulting in one of the top 20 mutual fund companies in the United States. |
| |
| 2006 | | Wells Fargo Advantage Funds relaunches the target date product line as Wells Fargo Advantage Dow Jones Target Date Funds. |
| |
| 2010 | | The mergers and reorganizations of Evergreen and Wells Fargo Advantage mutual funds are completed, unifying the families under the brand of Wells Fargo Advantage Funds. |
Wells Fargo Advantage Funds®
Wells Fargo Advantage Funds skillfully guides institutions, financial advisors, and individuals through the investment terrain to help them reach their financial objectives. Everything we do on behalf of investors is backed by our unique combination of qualifications.
Strength
Our organization is built on the standards of integrity and service established by our parent company—Wells Fargo & Company—more than 150 years ago. And, because we’re part of a highly diversified financial enterprise, we offer the depth of resources to help investors succeed.
Expertise
Our multi-boutique model offers investors access to the independent thinking of premier investment managers that have been chosen for their time-tested strategies. While each team specializes in a specific investment strategy, collectively they provide investors a wide choice of distinct investment styles. Our dedication to investment excellence doesn’t end with our expertise in manager selection—risk management, analysis, and rigorous ongoing review seek to ensure each manager’s investment process remains consistent.
Partnership
Our collaborative approach is built around understanding the needs and goals of our clients. By adhering to core principles of sound judgment and steady guidance, we support you through every stage of the investment decision process.
Carefully consider the investment objectives, risks, charges, and expenses before investing. For a current prospectus for Wells Fargo Advantage Funds containing this and other information, visit wellsfargo.com/advantagefunds. Read it carefully before investing.
Wells Fargo Funds Management, LLC, a wholly owned subsidiary of Wells Fargo & Company, provides investment advisory and administrative services for Wells Fargo Advantage Funds®. Other affiliates of Wells Fargo & Company provide subadvisory and other services for the Funds. The Funds are distributed by Wells Fargo Funds Distributor, LLC, Member FINRA/SIPC, an affiliate of Wells Fargo & Company.
The “Dow Jones Target Date Indexes” are a product of Dow Jones Indexes, a licensed trademark of CME Group Index Services LLC (“CME”). “Dow Jones” and “Dow Jones Target Date Indexes” are service marks of Dow Jones Trademark Holdings, LLC, and have been licensed for use for certain purposes by CME and sublicensed for use by Global Index Advisors, Inc., and Wells Fargo Funds Management, LLC. The Dow Jones Target Date Indexes are based in part on the Barclays Capital Bond Indexes, which are published by Barclays Capital Inc. The Wells Fargo Advantage Dow Jones Target Date Funds, based on the Dow Jones Target Date Indexes, are not sponsored, endorsed, sold, or promoted by Dow Jones, CME or Barclays Capital or any of their respective affiliates, and neither Dow Jones, CME nor Barclays Capital nor any of their respective affiliates makes any representation regarding the advisability of investing in such product(s) and/or about the quality, accuracy, and/or completeness of the Dow Jones Target Date Indexes or the Barclays Capital Bond Indexes. IN NO EVENT SHALL DOW JONES, CME, BARCLAYS CAPITAL, OR ANY OF THEIR LICENSORS HAVE ANY LIABILITY IN CONNECTION WITH THE Wells Fargo Advantage Dow Jones Target Date Funds INCLUDING, WITHOUT LIMITATION, FOR ANY SPECIAL, PUNITIVE, IN DIRECT, OR CONSEQUENTIAL DAMAGES (INCLUDING LOST PROFITS), EVEN IF NOTIFIED OF THE POSSIBILITY OF SUCH DAMAGES.
NOT FDIC INSURED ¡ NO BANK GUARANTEE ¡ MAY LOSE VALUE
Not part of the semi-annual report.
Wells Fargo Advantage Funds offers more than 110 mutual funds across a wide range of asset classes, representing over $221 billion in assets under management, as of July 31, 2011.
| | | | |
| Equity Funds | | | | |
Asia Pacific Fund | | Global Opportunities Fund | | Premier Large Company Growth Fund |
C&B Large Cap Value Fund | | Growth Fund | | Small Cap Opportunities Fund |
C&B Mid Cap Value Fund | | Health Care Fund | | Small Cap Value Fund |
Capital Growth Fund | | Index Fund | | Small Company Growth Fund |
Common Stock Fund | | International Equity Fund | | Small Company Value Fund |
Disciplined U.S. Core Fund | | International Value Fund | | Small/Mid Cap Core Fund |
Discovery Fund† | | Intrinsic Small Cap Value Fund | | Small/Mid Cap Value Fund |
Diversified Equity Fund | | Intrinsic Value Fund | | Social Sustainability Fund† |
Diversified International Fund | | Intrinsic World Equity Fund | | Special Mid Cap Value Fund |
Diversified Small Cap Fund | | Large Cap Core Fund | | Special Small Cap Value Fund |
Emerging Growth Fund | | Large Cap Growth Fund | | Specialized Technology Fund |
Emerging Markets Equity Fund | | Large Company Value Fund | | Strategic Large Cap Growth Fund |
Endeavor Select Fund† | | Omega Growth Fund | | Traditional Small Cap Growth Fund |
Enterprise Fund† | | Opportunity Fund† | | Utility and Telecommunications Fund |
Equity Value Fund | | Precious Metals Fund | | |
| Bond Funds | | | | |
Adjustable Rate Government Fund | | Inflation-Protected Bond Fund | | Short-Term Bond Fund |
California Limited-Term Tax-Free Fund | | Intermediate Tax/AMT-Free Fund | | Short-Term High Yield Bond Fund |
California Tax-Free Fund | | International Bond Fund | | Short-Term Municipal Bond Fund |
Colorado Tax-Free Fund | | Minnesota Tax-Free Fund | | Strategic Municipal Bond Fund |
Government Securities Fund | | Municipal Bond Fund | | Total Return Bond Fund |
High Income Fund | | North Carolina Tax-Free Fund | | Ultra Short-Term Income Fund |
High Yield Bond Fund | | Pennsylvania Tax-Free Fund | | Ultra Short-Term Municipal Income Fund |
Income Plus Fund | | Short Duration Government Bond Fund | | Wisconsin Tax-Free Fund |
| Asset Allocation Funds | | | | |
Asset Allocation Fund | | WealthBuilder Equity Portfolio† | | Target 2020 Fund† |
Conservative Allocation Fund | | WealthBuilder Growth Allocation Portfolio† | | Target 2025 Fund† |
Diversified Capital Builder Fund | | WealthBuilder Growth Balanced Portfolio† | | Target 2030 Fund† |
Diversified Income Builder Fund | | WealthBuilder Moderate Balanced Portfolio† | | Target 2035 Fund† |
Growth Balanced Fund | | WealthBuilder Tactical Equity Portfolio† | | Target 2040 Fund† |
Index Asset Allocation Fund | | Target Today Fund† | | Target 2045 Fund† |
Moderate Balanced Fund | | Target 2010 Fund† | | Target 2050 Fund† |
WealthBuilder Conservative Allocation Portfolio† | | Target 2015 Fund† | | Target 2055 Fund† |
| Money Market Funds | | | | |
100% Treasury Money Market Fund | | Minnesota Money Market Fund | | New Jersey Municipal Money Market Fund |
California Municipal Money Market Fund | | Money Market Fund | | New York Municipal Money Market Fund |
Cash Investment Money Market Fund | | Municipal Cash Management Money Market Fund | | Pennsylvania Municipal Money Market Fund |
Government Money Market Fund | | Municipal Money Market Fund | | Prime Investment Money Market Fund |
Heritage Money Market Fund† | | National Tax-Free Money Market Fund | | Treasury Plus Money Market Fund |
| Variable Trust Funds1 | | | | |
VT Discovery Fund† | | VT Intrinsic Value Fund | | VT Small Cap Growth Fund |
VT Index Asset Allocation Fund | | VT Omega Growth Fund | | VT Small Cap Value Fund |
VT International Equity Fund | | VT Opportunity Fund† | | VT Total Return Bond Fund |
An investment in a money market fund is not insured or guaranteed by the Federal Deposit Insurance Corporation or any other government agency. Although the Wells Fargo Advantage Money Market Funds seek to preserve the value of your investment at $1.00 per share, it is possible to lose money by investing in a money market fund.
| 1. | The Variable Trust Funds are generally available only through insurance company variable contracts. |
| † | In this report, the Wells Fargo Advantage Discovery FundSM, Wells Fargo Advantage Endeavor Select FundSM, Wells Fargo Advantage Enterprise FundSM, Wells Fargo Advantage Opportunity FundSM, Wells Fargo Advantage Social Sustainability FundSM, Wells Fargo Advantage WealthBuilder Conservative Allocation PortfolioSM, Wells Fargo Advantage WealthBuilder Equity PortfolioSM, Wells Fargo Advantage WealthBuilder Growth Allocation PortfolioSM, Wells Fargo Advantage WealthBuilder Growth Balanced PortfolioSM, Wells Fargo Advantage WealthBuilder Moderate Balanced PortfolioSM, Wells Fargo Advantage WealthBuilder Tactical Equity PortfolioSM, Wells Fargo Advantage Dow Jones Target Today FundSM, Wells Fargo Advantage Dow Jones Target 2010 FundSM, Wells Fargo Advantage Dow Jones Target 2015 FundSM, Wells Fargo Advantage Dow Jones Target 2020 FundSM, Wells Fargo Advantage Dow Jones Target 2025 FundSM, Wells Fargo Advantage Dow Jones Target 2030 FundSM, Wells Fargo Advantage Dow Jones Target 2035 FundSM, Wells Fargo Advantage Dow Jones Target 2040 FundSM, Wells Fargo Advantage Dow Jones Target 2045 FundSM, Wells Fargo Advantage Dow Jones Target 2050 FundSM, Wells Fargo Advantage Dow Jones Target 2055 FundSM, Wells Fargo Advantage Heritage Money Market FundSM, Wells Fargo Advantage VT Discovery FundSM, and Wells Fargo Advantage VT Opportunity FundSM are referred to as the Discovery Fund, Endeavor Select Fund, Enterprise Fund, Opportunity Fund, Social Sustainability Fund, WealthBuilder Conservative Allocation Portfolio, WealthBuilder Equity Portfolio, WealthBuilder Growth Allocation Portfolio, WealthBuilder Growth Balanced Portfolio, WealthBuilder Moderate Balanced Portfolio, WealthBuilder Tactical Equity Portfolio, Target Today Fund, Target 2010 Fund, Target 2015 Fund, Target 2020 Fund, Target 2025 Fund, Target 2030 Fund, Target 2035 Fund, Target 2040 Fund, Target 2045 Fund, Target 2050 Fund, Target 2055 Fund, Heritage Money Market Fund, VT Discovery Fund, and VT Opportunity Fund, respectively. |
Not part of the semi-annual report.
| | | | |
| 2 | | Wells Fargo Advantage Money Market Fund | | Letter to Shareholders |

Karla M. Rabusch,
President
Wells Fargo Advantage Funds
While the FOMC explained that it “expects the pace of recovery to pick up over coming quarters,” it indicated that the federal funds rate will remain at an exceptionally low level for as long as necessary to ensure a sustainable recovery and expansion.
Dear Valued Shareholder,
We’re pleased to offer you this semi-annual report for the Wells Fargo Advantage Money Market Fund for the six-month period that ended July 31, 2011. Upon reviewing the report, you may notice a few changes from past reports, the most significant of which is the change from a multi-fund report to a single-fund report. We believe this change will give you more convenient access to your fund data.
The period began modestly as improving economic optimism generally shifted investors toward equities and riskier assets and away from U.S. Treasuries and lower-yielding fixed-income securities. Returns from fixed income were modest in the opening months of 2011 but were generally still positive as U.S. Treasury yields incrementally climbed higher. But after the slow start, bond prices once again strongly improved, sparked by a sharp decline in U.S. Treasury prices in April that carried into May. Late in the period, lower-rated bonds declined in price more than the higher credit-quality tiers but not enough to outweigh the stronger performance from lower-rated securities during the period. Lower-quality and longer-maturity fixed-income securities generally outperformed higher-quality and shorter-maturity securities over the full period.
The activity within the broader bond market also resonated with money market participants. As the economic and credit environment reverberated from the ongoing sovereign debt concerns and softening economic data, many participants continued to balance a need for stability and desire for higher yields. The result has been good demand for domestic commercial paper and certificate of deposits. Also, in spite of all the discussion about sovereign debt, many money market participants continue to maintain some exposures to foreign banks based on the quality of their fundamentals. By focusing more on the fundamentals and taking a more selective approach to the short-term security market helped the markets avoid the severe yield volatility or significant flight-to-quality experienced during the spring of 2010, when the Greek sovereign debt crisis first emerged.
The global economic “recovery” hit a snag, but the end of 2011 could regain momentum.
The U.S. economic recovery that began in mid-2009 and gained further momentum throughout 2010, particularly during the fourth quarter, has failed to maintain that level of growth through the first seven months of 2011. For example, gross domestic product (GDP), the broadest measure of economic activity, grew at an annualized rate of 3.1% in the fourth quarter of 2010, only to slow dramatically during the first quarter of 2011. The latest revision to first-quarter GDP data during the period indicated that the economy grew at an annualized rate of 0.4% during the first quarter of 2011. While still positive, it’s a much slower pace of growth than experienced in the second half of 2010 and notably lower than consensus forecasts. Nevertheless, the advance estimate of second-quarter 2011 GDP, which was released on July 29, 2011, was 1.3%, suggesting that the U.S. economy continues to expand, though at a slow and uneven pace.
Jobs and housing remained troublesome.
The July 2011 unemployment rate in the U.S. was reported at 9.1%, down from 9.5% a year earlier but still notably higher than historical averages. Unfortunately,
| | | | | | |
| Letter to Shareholders | | Wells Fargo Advantage Money Market Fund | | | 3 | |
the drop may be more attributable to a decline in the labor force than to a meaningful uptick in hiring. The level of job creation in 2011 has been trending below historical averages, suggesting that the improving economy has yet to translate into widespread hiring. Meanwhile, the beleaguered housing market was an ongoing source of concern, despite some tentative late-year signs of stabilization. That said, persistent weakness in the labor and housing markets bears close watching in the months ahead.
Other economic data in the U.S. has been more encouraging, reflecting greater confidence in the sustainability of the expansion on the part of both consumers and businesses. Retail sales came in strong at certain points during the period and industrial production and new orders have picked up. Although still reluctant to hire, businesses have gradually increased spending in other areas, such as equipment and information technology. Core inflation, which excludes volatile food and energy prices, remained benign.
The Federal Reserve believes the economic recovery will accelerate in future quarters.
With inflation subdued, the Federal Open Market Committee (FOMC) held its target range for the federal funds rate—a proxy for short-term interest rates—steady at 0.00% to 0.25%. On June 22, 2011, in its final statement of the six-month period, the Fed reiterated that the economic recovery “is proceeding at a moderate pace,” but that “recent labor market indicators have been weaker than anticipated.” It described the recent increase in inflation as temporary, suggesting that inflation pressures will ease going forward. While the FOMC explained that it “expects the pace of recovery to pick up over coming quarters,” it indicated that the federal funds rate will remain at an exceptionally low level for as long as necessary to ensure a sustainable recovery and expansion.
As recent headwinds subside, it is reasonable to expect markets to regain focus.
Now that it appears the debt ceiling has been increased and a U.S. default will be averted, money market participants and the broader bond market can get back to more fundamental and lasting concerns-chiefly, the economy. After avoiding short-term Treasuries in late July 2011, ahead of pending U.S. debt ceiling deadline, money market participants have returned to the U.S. short-term markets.1 Economic indicators released in the second half of 2011 might not be as soft as those reported during the first half of the year. While that would not mean that the economy is robust, it might remind the markets that the first half of the slowdown was transitory. Most indicators still point toward real GDP growth in the 2% to 3% range in the second half of 2011. While that is not enough to produce big employment gains, it might be sufficient to cause Treasury yields to retrace some of the late-July declines.
Don’t let short-term uncertainty derail long-term investment goals.
While periods of uncertainty can present challenges, experience has taught us that maintaining a long-term investment strategy based on individual goals and risk tolerance can be an effective way to plan for the future. As a whole, Wells Fargo Advantage Funds represents investments across a broad range of asset
| 1. | Comments expressed that do not fall within the reporting period are as of August 2, 2011. |
Economic indicators released in the second half of 2011 might not be as soft as those reported during the first half of the year. While that would not mean that the economy is robust, it might remind the markets that the first half of the slowdown was transitory.
| | | | |
| 4 | | Wells Fargo Advantage Money Market Fund | | Letter to Shareholders |
classes and investment styles with more than 110 mutual funds, giving you an opportunity to create a diversified investment portfolio. While diversification may not prevent losses in a downturn, it may help to reduce them and provide you with one way of managing risk.
In our opinion, diligent and earnest assessment of the fundamental characteristics of money market eligible securities will be a key differentiating factor between which investment strategies meet client expectations and which do not. At Wells Fargo Advantage Funds, we intend to continue the emphasis of principal preservation and high liquidity across our lineup of Wells Fargo Advantage Money Market Funds. In changing markets, we believe it is particularly important to have diligent investment analysts in charge of investor assets.
Thank you for choosing Wells Fargo Advantage Funds. We appreciate your confidence in us and are committed to helping you meet your financial needs. If you have any questions about your investments, please contact your investment professional, call us at 1-800-222-8222, or visit www.wellsfargo.com/advantagefunds.
Sincerely,

Karla M. Rabusch
President
Wells Fargo Advantage Funds
| | | | | | |
| Performance Highlights (Unaudited) | | Wells Fargo Advantage Money Market Fund | | | 5 | |
INVESTMENT OBJECTIVE
The Fund seeks current income, while preserving capital and liquidity.
ADVISER
Wells Fargo Funds Management, LLC
SUB-ADVISER
Wells Capital Management Incorporated
PORTFOLIO MANAGERS
David D. Sylvester
Laurie White
FUND INCEPTION
July 1, 1992
| | |
PORTFOLIO COMPOSITION1 (AS OF JULY 31, 2011) | | |
|
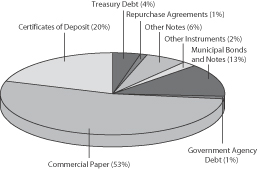 |
| | |
EFFECTIVE MATURITY DISTRIBUTION1 (AS OF JULY 31, 2011) | | |
|
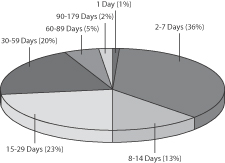 |
|
WEIGHTED AVERAGE MATURITY2 (AS OF JULY 31, 2011) |
22 Days |
|
WEIGHTED AVERAGE MATURITY3 (AS OF JULY 31, 2011) |
38 Days |
| 1. | Portfolio composition and effective maturity distribution are subject to change and are calculated based on the total investments of the Fund. Effective maturity distribution is based on the weighted average maturity of each security. |
| 2. | Weighted Average Maturity (WAM): WAM calculates an average time to maturity of all of the securities held in the portfolio, weighted by each security’s percentage of net assets. The calculation takes into account the final maturity of a fixed-income security and the interest rate reset date for floating-rate securities held in the portfolio. This is a way to measure a fund’s sensitivity to potential interest rate changes. |
| 3. | Weighted Average Final Maturity (WAFM): WAFM calculates a fund’s average time to maturity for all of the securities held in the portfolio, weighted to their percentage of assets in the Fund. In contrast to WAM, the WAFM calculation takes into account the final maturity date for each security held in the portfolio. This is a way to measure a fund’s potential sensitivity to credit spread changes. |
| | | | |
| 6 | | Wells Fargo Advantage Money Market Fund | | Performance Highlights (Unaudited) |
AVERAGE ANNUAL TOTAL RETURN4 (%) (AS OF JULY 31, 2011)
| | | | | | | | | | | | | | | | | | | | | | | | | | | | |
| | | | | | | | | | | | | | | | | | Expense Ratios5 | |
| | | Inception Date | | | 6 Months* | | | 1 Year | | | 5 Year | | | 10 Year | | | Gross | | | Net6 | |
Class A (STGXX) | | | 07/01/1992 | | | | 0.00 | | | | 0.01 | | | | 1.78 | | | | 1.71 | | | | 0.81% | | | | 0.70% | |
Class B** | | | 07/01/1992 | | | | | | | | | | | | | | | | | | | | 1.56% | | | | 1.45% | |
Without Sales Charge | | | | | | | 0.00 | | | | 0.01 | | | | 1.39 | | | | 1.25 | | | | | | | | | |
Including Sales Charge | | | | | | | (5.00 | ) | | | (4.99 | ) | | | 1.01 | | | | 1.25 | | | | | | | | | |
Class C | | | 06/30/2010 | | | | | | | | | | | | | | | | | | | | 1.56% | | | | 1.45% | |
Without Sales Charge | | | | | | | 0.00 | | | | 0.01 | | | | 1.39 | | | | 1.21 | | | | | | | | | |
Including Sales Charge | | | | | | | (1.00 | ) | | | (0.99 | ) | | | 1.39 | | | | 1.21 | | | | | | | | | |
Daily Class | | | 06/30/2010 | | | | 0.00 | | | | 0.01 | | | | 1.78 | | | | 1.71 | | | | 1.06% | | | | 1.03% | |
Investor Class (WMMXX) | | | 04/08/2005 | | | | 0.00 | | | | 0.01 | | | | 1.85 | | | | 1.76 | | | | 0.84% | | | | 0.65% | |
Service Class (WMOXX) | | | 06/30/2010 | | | | 0.00 | | | | 0.01 | | | | 1.85 | | | | 1.76 | | | | 0.71% | | | | 0.50% | |
| * | Returns for periods of less than one year are not annualized. |
| ** | Class B shares are closed to investment, except in connection with the reinvestment of any distributions and permitted exchanges, as well as for investment in connection with non-commission purchases. |
| | | | | | | | | | | | | | | | | | | | | | | | |
FUND YIELD SUMMARY6 (AS OF JULY 31, 2011) | | Class A | | | Class B | | | Class C | | | Daily class | | | Investor Class | | | Service Class | |
7-Day Current Yield | | | 0.01% | | | | 0.01% | | | | 0.01% | | | | 0.01% | | | | 0.01% | | | | 0.01% | |
7-Day Compound Yield | | | 0.01% | | | | 0.01% | | | | 0.01% | | | | 0.01% | | | | 0.01% | | | | 0.01% | |
30-Day Simple Yield | | | 0.01% | | | | 0.01% | | | | 0.01% | | | | 0.01% | | | | 0.01% | | | | 0.01% | |
30-Day Compound Yield | | | 0.01% | | | | 0.01% | | | | 0.01% | | | | 0.01% | | | | 0.01% | | | | 0.01% | |
Figures quoted represent past performance, which is no guarantee of future results and do not reflect the deduction of taxes that a shareholder may pay on fund distributions or the redemption of fund shares. Investment returns will fluctuate. The Fund’s yield figures more closely reflect the current earnings of the Fund than the total return figures. Current performance may be lower or higher than the performance data quoted. Performance shown without sales charges would be lower if sales charges were reflected. Current month-end performance is available at the Fund’s website, www.wellsfargo.com/advantagefunds.
Class A shares, Daily Class shares, Investor Class, and Service Class shares are sold without a front-end sales charge or contingent deferred sales charge. For Class B shares, the maximum contingent deferred sales charge (CDSC) is 5.00%. For Class C shares, the maximum CDSC is 1.00%. Performance including sales charge assumes the sales charge for the corresponding time period. Other fees and expenses apply to an investment in the Fund and are described in the Fund’s current prospectus.
An investment in a money market fund is not insured or guaranteed by the Federal Deposit Insurance Corporation or any other government agency. Although the Fund seeks to preserve the value of your investment at $1.00 per share, it is possible to lose money by investing in a money market fund.
| 4. | Historical performance shown for the Service Class shares prior to their inception reflects the performance of the Investor Class shares, and includes the higher expenses applicable to the Investor Class shares. If these expenses had not been included, returns would be higher. Historical performance shown for the Class C shares prior to their inception reflects the performance of the Class B shares. Class B and Class C shares have the same expenses. Historical performance shown for the Daily Class shares prior to their inception reflects the performance of the Class A shares, and has not been adjusted to reflect the higher expenses applicable to the Daily Class shares. If these expenses had been adjusted, returns would be lower. Historical performance shown for the Investor Class shares prior to their inception reflects the performance of the Class A shares, and includes the higher expenses applicable to the Class A shares. If these expenses had not been included, returns would be higher. |
| 5. | Reflects the expense ratios as stated in the most recent prospectuses. |
| 6. | The Adviser has committed through July 11, 2013 to waive fees and/or reimburse expenses to the extent necessary to cap the Fund’s Total Annual Fund Operating Expenses After Fee Waiver, excluding certain expenses, at the amount shown above. Without this cap, the Fund’s returns would have been lower. Without waived fees and/or reimbursed expenses, the Fund’s 7-day current yield would have been (0.58)%, (1.33)%, (1.33)%, (0.83)%, (0.61)% and (0.48)% for Class A, Class B, Class C, Daily Class, Investor Class and Service Class, respectively. |
| | | | | | |
| Fund Expenses | | Wells Fargo Advantage Money Market Fund | | | 7 | |
As a shareholder of the Fund, you incur two types of costs: (1) transaction costs, including contingent deferred sales charges (if any) and (2) ongoing costs, including management fees; distribution (12b-1) and/or shareholder service fees; and other Fund expenses. This example is intended to help you understand your ongoing costs (in dollars) of investing in the Fund and to compare these costs with the ongoing costs of investing in other mutual funds.
The example is based on an investment of $1,000 invested at the beginning of the six-month period and held for the entire period from February 1, 2011 to July 31, 2011.
Actual Expenses
The “Actual” line of the table below provides information about actual account values and actual expenses. You may use the information in this line, together with the amount you invested, to estimate the expenses that you paid over the period. Simply divide your account value by $1,000 (for example, an $8,600 account value divided by $1,000 = 8.6), then multiply the result by the number in the “Actual” line under the heading entitled “Expenses Paid During Period” for your applicable class of shares to estimate the expenses you paid on your account during this period.
Hypothetical Example for Comparison Purposes
The “Hypothetical” line of the table below provides information about hypothetical account values and hypothetical expenses based on the Fund’s actual expense ratio and an assumed rate of return of 5% per year before expenses, which is not the Fund’s actual return. The hypothetical account values and expenses may not be used to estimate the actual ending account balance or expenses you paid for the period. You may use this information to compare the ongoing costs of investing in the Fund and other funds. To do so, compare this 5% hypothetical example with the 5% hypothetical examples that appear in the shareholder reports of the other funds.
Please note that the expenses shown in the table are meant to highlight your ongoing costs only and do not reflect any transactional costs, such as any contingent deferred sales charges. Therefore, the “Hypothetical” line of the table is useful in comparing ongoing costs only, and will not help you determine the relative total costs of owning different funds. In addition, if these transactional costs were included, your costs would have been higher.
| | | | | | | | | | | | | | | | |
| | | Beginning
Account Value
02-01-2011 | | | Ending
Account Value
07-31-2011 | | | Expenses
Paid During
the Period¹ | | | Net Annual
Expense Ratio | |
Class A | | | | | | | | | | | | | | | | |
Actual | | $ | 1,000.00 | | | $ | 1,000.05 | | | $ | 1.34 | | | | 0.27 | % |
Hypothetical (5% return before expenses) | | $ | 1,000.00 | | | $ | 1,023.46 | | | $ | 1.35 | | | | 0.27 | % |
Class B | | | | | | | | | | | | | | | | |
Actual | | $ | 1,000.00 | | | $ | 1,000.05 | | | $ | 1.34 | | | | 0.27 | % |
Hypothetical (5% return before expenses) | | $ | 1,000.00 | | | $ | 1,023.46 | | | $ | 1.35 | | | | 0.27 | % |
Class C | | | | | | | | | | | | | | | | |
Actual | | $ | 1,000.00 | | | $ | 1,000.05 | | | $ | 1.34 | | | | 0.27 | % |
Hypothetical (5% return before expenses) | | $ | 1,000.00 | | | $ | 1,023.46 | | | $ | 1.35 | | | | 0.27 | % |
Daily Class | | | | | | | | | | | | | | | | |
Actual | | $ | 1,000.00 | | | $ | 1,000.05 | | | $ | 1.34 | | | | 0.27 | % |
Hypothetical (5% return before expenses) | | $ | 1,000.00 | | | $ | 1,023.46 | | | $ | 1.35 | | | | 0.27 | % |
Investor Class | | | | | | | | | | | | | | | | |
Actual | | $ | 1,000.00 | | | $ | 1,000.05 | | | $ | 1.34 | | | | 0.27 | % |
Hypothetical (5% return before expenses) | | $ | 1,000.00 | | | $ | 1,023.46 | | | $ | 1.35 | | | | 0.27 | % |
Service Class | | | | | | | | | | | | | | | | |
Actual | | $ | 1,000.00 | | | $ | 1,000.05 | | | $ | 1.34 | | | | 0.27 | % |
Hypothetical (5% return before expenses) | | $ | 1,000.00 | | | $ | 1,023.46 | | | $ | 1.35 | | | | 0.27 | % |
| 1. | Expenses paid is equal to the annualized expense ratio of each class multiplied by the average account value over the period, multiplied by the number of days in the most recent fiscal half-year divided by the number of days in the fiscal year (to reflect the one-half year period). |
| | | | |
| 8 | | Wells Fargo Advantage Money Market Fund | | Portfolio of Investments—July 31, 2011 (Unaudited) |
| | | | | | | | | | | | | | | | |
| Security Name | | Interest Rate | | | Maturity Date | | | Principal | | | Value | |
| | | | | | | | | | | | | | | | |
| | | | |
| Certificates of Deposit: 19.06% | | | | | | | | | | | | | | | | |
Banco Del Estado De Chile | | | 0.21 | % | | | 08/04/2011 | | | $ | 20,000,000 | | | $ | 20,000,000 | |
Bank of Montreal | | | 0.11 | | | | 08/23/2011 | | | | 22,000,000 | | | | 22,000,000 | |
Bank of Montreal | | | 0.12 | | | | 08/24/2011 | | | | 5,000,000 | | | | 5,000,000 | |
Bank of Montreal | | | 0.12 | | | | 08/26/2011 | | | | 43,000,000 | | | | 43,000,000 | |
Bank of Nova Scotia± | | | 0.22 | | | | 08/09/2011 | | | | 7,000,000 | | | | 7,000,000 | |
Barclays Bank plc (New York)± | | | 0.59 | | | | 04/16/2012 | | | | 17,000,000 | | | | 17,000,000 | |
Barclays Bank plc (New York)± | | | 0.65 | | | | 01/17/2012 | | | | 40,000,000 | | | | 40,000,000 | |
Barclays Bank plc (New York)± | | | 0.69 | | | | 10/24/2011 | | | | 22,000,000 | | | | 22,000,000 | |
Commerzbank (London) | | | 0.15 | | | | 08/01/2011 | | | | 35,000,000 | | | | 35,000,000 | |
Credit Agricole | | | 0.16 | | | | 08/01/2011 | | | | 45,000,000 | | | | 45,000,000 | |
Credit Agricole | | | 0.23 | | | | 08/12/2011 | | | | 25,000,000 | | | | 25,000,000 | |
Credit Agricole | | | 0.23 | | | | 08/15/2011 | | | | 40,000,000 | | | | 40,000,000 | |
Credit Industriel et Commercial | | | 0.11 | | | | 08/01/2011 | | | | 13,000,000 | | | | 13,000,000 | |
Credit Suisse (New York)± | | | 0.25 | | | | 09/02/2011 | | | | 45,000,000 | | | | 45,000,346 | |
DG Bank (New York) | | | 0.23 | | | | 08/15/2011 | | | | 48,000,000 | | | | 48,000,000 | |
Groupe BPCE | | | 0.13 | | | | 08/01/2011 | | | | 35,000,000 | | | | 35,000,000 | |
KBC Bank NV Brussels | | | 0.15 | | | | 08/01/2011 | | | | 29,000,000 | | | | 29,000,000 | |
National Bank of Canada± | | | 0.35 | | | | 09/21/2011 | | | | 10,000,000 | | | | 10,000,000 | |
National Bank of Canada± | | | 0.36 | | | | 10/07/2011 | | | | 35,000,000 | | | | 35,000,000 | |
Natixis Corporation± | | | 0.34 | | | | 08/15/2011 | | | | 15,000,000 | | | | 15,000,180 | |
Natixis NY Branch± | | | 0.50 | | | | 08/08/2011 | | | | 35,000,000 | | | | 35,000,000 | |
Nordea Bank Funding plc | | | 0.15 | | | | 09/14/2011 | | | | 32,000,000 | | | | 32,000,000 | |
Nordea Bank Funding plc | | | 0.15 | | | | 09/19/2011 | | | | 32,000,000 | | | | 32,000,000 | |
Norinchukin Bank | | | 0.15 | | | | 08/01/2011 | | | | 12,000,000 | | | | 12,000,000 | |
Norinchukin Bank | | | 0.15 | | | | 08/02/2011 | | | | 35,000,000 | | | | 35,000,000 | |
Rabobank Nederland NV± | | | 0.27 | | | | 12/06/2011 | | | | 30,000,000 | | | | 30,000,000 | |
Rabobank Nederland NV± | | | 0.27 | | | | 01/10/2012 | | | | 30,000,000 | | | | 30,000,000 | |
Rabobank Nederland NV | | | 0.27 | | | | 10/21/2011 | | | | 27,000,000 | | | | 27,000,000 | |
Rabobank Nederland NV | | | 0.28 | | | | 04/24/2012 | | | | 14,000,000 | | | | 13,999,480 | |
Rabobank Nederland NV± | | | 0.29 | | | | 08/08/2011 | | | | 25,000,000 | | | | 25,000,600 | |
Royal Bank of Scotland plc± | | | 0.44 | | | | 10/31/2011 | | | | 20,000,000 | | | | 20,000,000 | |
Royal Bank of Scotland plc± | | | 0.47 | | | | 09/13/2011 | | | | 45,000,000 | | | | 45,000,000 | |
Skandinaviska Enskilda Banken AB | | | 0.20 | | | | 09/15/2011 | | | | 25,000,000 | | | | 25,000,000 | |
Skandinaviska Enskilda Banken AB | | | 0.20 | | | | 09/19/2011 | | | | 17,000,000 | | | | 17,000,000 | |
Skandinaviska Enskilda Banken AB | | | 0.22 | | | | 09/14/2011 | | | | 35,250,000 | | | | 35,248,277 | |
Societe Generale (New York) | | | 0.51 | | | | 08/12/2011 | | | | 47,000,000 | | | | 47,000,000 | |
Sumitomo Trust & Banking Corporation | | | 0.14 | | | | 08/03/2011 | | | | 70,000,000 | | | | 70,000,000 | |
Sumitomo Trust & Banking Corporation | | | 0.15 | | | | 08/02/2011 | | | | 40,000,000 | | | | 40,000,000 | |
Sumitomo Trust & Banking Corporation | | | 0.15 | | | | 08/04/2011 | | | | 20,000,000 | | | | 20,000,000 | |
Svenska Handsbanken AB | | | 0.17 | | | | 08/04/2011 | | | | 20,000,000 | | | | 20,000,008 | |
Toronto-Dominion Bank | | | 0.12 | | | | 08/19/2011 | | | | 40,000,000 | | | | 40,000,000 | |
Toronto-Dominion Bank | | | 0.12 | | | | 08/22/2011 | | | | 30,000,000 | | | | 30,000,000 | |
Toronto-Dominion Bank | | | 0.17 | | | | 08/02/2011 | | | | 35,000,000 | | | | 35,000,058 | |
Toronto-Dominion Bank± | | | 0.27 | | | | 01/12/2012 | | | | 25,000,000 | | | | 25,000,000 | |
| | | | |
Total Certificates of Deposit (Cost $1,292,248,949) | | | | | | | | | | | | | | | 1,292,248,949 | |
| | | | | | | | | | | | | | | | |
| | | | |
Commercial Paper: 49.76% | | | | | | | | | | | | | | | | |
| | | | |
| Asset-Backed Commercial Paper: 34.72% | | | | | | | | | | | | | | | | |
Alpine Securitzation Corporation††^ | | | 0.13 | | | | 08/19/2011 | | | | 46,000,000 | | | | 45,996,780 | |
Alpine Securitzation Corporation††^ | | | 0.13 | | | | 08/23/2011 | | | | 7,000,000 | | | | 6,999,401 | |
Alpine Securitzation Corporation††^ | | | 0.13 | | | | 08/26/2011 | | | | 39,000,000 | | | | 38,996,208 | |
| | | | | | |
| Portfolio of Investments—July 31, 2011 (Unaudited) | | Wells Fargo Advantage Money Market Fund | | | 9 | |
| | | | | | | | | | | | | | | | |
| Security Name | | Interest Rate | | | Maturity Date | | | Principal | | | Value | |
| | | | | | | | | | | | | | | | |
| | | | |
| Asset-Backed Commercial Paper (continued) | | | | | | | | | | | | | | | | |
Amsterdam Funding Corporation††^ | | | 0.15 | % | | | 08/25/2011 | | | $ | 3,700,000 | | | $ | 3,699,605 | |
Amsterdam Funding Corporation††^ | | | 0.15 | | | | 08/30/2011 | | | | 12,000,000 | | | | 11,998,453 | |
Amsterdam Funding Corporation††^ | | | 0.22 | | | | 08/22/2011 | | | | 4,000,000 | | | | 3,999,463 | |
Antalis US Funding Corporation††^ | | | 0.00 | | | | 08/01/2011 | | | | 31,000,000 | | | | 31,000,000 | |
Arabella Finance LLC††^ | | | 0.38 | | | | 08/08/2011 | | | | 22,000,000 | | | | 21,998,161 | |
Argento Funding Companies Limited††^ | | | 0.17 | | | | 08/24/2011 | | | | 33,000,000 | | | | 32,996,103 | |
Argento Funding Companies Limited††^ | | | 0.19 | | | | 08/04/2011 | | | | 6,000,000 | | | | 5,999,875 | |
Argento Funding Companies Limited††^ | | | 0.19 | | | | 08/05/2011 | | | | 10,000,000 | | | | 9,999,733 | |
Argento Funding Companies Limited††^ | | | 0.21 | | | | 09/07/2011 | | | | 14,000,000 | | | | 13,996,835 | |
Argento Funding Companies Limited††^ | | | 0.21 | | | | 09/09/2011 | | | | 6,000,000 | | | | 5,998,570 | |
Argento Funding Companies Limited††^ | | | 0.23 | | | | 08/09/2011 | | | | 8,000,000 | | | | 7,999,538 | |
Argento Funding Companies Limited††^ | | | 0.25 | | | | 09/20/2011 | | | | 9,000,000 | | | | 8,996,875 | |
Argento Funding Companies Limited††^ | | | 0.29 | | | | 08/08/2011 | | | | 20,000,000 | | | | 19,998,717 | |
Aspen Funding Corporation††^ | | | 0.16 | | | | 08/11/2011 | | | | 15,000,000 | | | | 14,999,250 | |
Atlantic Asset Securitization Corporation††^ | | | 0.11 | | | | 08/02/2011 | | | | 10,000,000 | | | | 9,999,938 | |
Autobahn Funding Company LLC††^ | | | 0.00 | | | | 08/01/2011 | | | | 109,000,000 | | | | 109,000,000 | |
Barton Capital Corporation††^ | | | 0.00 | | | | 08/01/2011 | | | | 35,000,000 | | | | 35,000,000 | |
Bryant Park Funding LLC††^ | | | 0.14 | | | | 08/22/2011 | | | | 25,000,000 | | | | 24,997,813 | |
Bryant Park Funding LLC††^ | | | 0.14 | | | | 08/24/2011 | | | | 9,000,000 | | | | 8,999,138 | |
CAFCO LLC††^ | | | 0.17 | | | | 09/20/2011 | | | | 5,000,000 | | | | 4,998,819 | |
Cancara Asset Securitization LLC††^ | | | 0.15 | | | | 08/10/2011 | | | | 10,000,000 | | | | 9,999,575 | |
Cancara Asset Securitization LLC††^ | | | 0.18 | | | | 08/30/2011 | | | | 19,000,000 | | | | 18,997,092 | |
Cancara Asset Securitization LLC††^ | | | 0.20 | | | | 09/07/2011 | | | | 8,000,000 | | | | 7,998,273 | |
Cancara Asset Securitization LLC††^ | | | 0.20 | | | | 09/08/2011 | | | | 4,000,000 | | | | 3,999,113 | |
Cancara Asset Securitization LLC††^ | | | 0.21 | | | | 08/08/2011 | | | | 10,000,000 | | | | 9,999,533 | |
Cancara Asset Securitization LLC††^ | | | 0.21 | | | | 08/12/2011 | | | | 6,000,000 | | | | 5,999,578 | |
Cancara Asset Securitization LLC††^ | | | 0.21 | | | | 09/20/2011 | | | | 50,000,000 | | | | 49,985,417 | |
Cancara Asset Securitization LLC††^ | | | 0.25 | | | | 09/19/2011 | | | | 19,000,000 | | | | 18,993,535 | |
Chariot Funding LLC††^ | | | 0.12 | | | | 08/15/2011 | | | | 43,000,000 | | | | 42,997,748 | |
Chariot Funding LLC††^ | | | 0.12 | | | | 08/17/2011 | | | | 1,000,000 | | | | 999,942 | |
Chariot Funding LLC††^ | | | 0.14 | | | | 08/16/2011 | | | | 50,000,000 | | | | 49,996,875 | |
Charta LLC††^ | | | 0.19 | | | | 09/09/2011 | | | | 10,000,000 | | | | 9,997,942 | |
Charta LLC††^ | | | 0.24 | | | | 08/26/2011 | | | | 8,000,000 | | | | 7,998,611 | |
Charta LLC††^ | | | 0.24 | | | | 08/30/2011 | | | | 10,000,000 | | | | 9,997,986 | |
Charta LLC††^ | | | 0.25 | | | | 10/06/2011 | | | | 7,000,000 | | | | 6,996,792 | |
Ciesco LLC††^ | | | 0.19 | | | | 09/15/2011 | | | | 3,000,000 | | | | 2,999,275 | |
Concord Minuteman Capital Company††^ | | | 0.36 | | | | 08/09/2011 | | | | 12,000,000 | | | | 11,998,933 | |
Concord Minuteman Capital Company††^ | | | 0.38 | | | | 08/16/2011 | | | | 6,000,000 | | | | 5,999,000 | |
Concord Minuteman Capital Company††^ | | | 0.38 | | | | 08/17/2011 | | | | 15,000,000 | | | | 14,997,333 | |
Concord Minuteman Capital Company††^ | | | 0.39 | | | | 08/26/2011 | | | | 9,000,000 | | | | 8,997,500 | |
Concord Minuteman Capital Company††^ | | | 0.39 | | | | 08/29/2011 | | | | 25,000,000 | | | | 24,992,222 | |
Concord Minutemen Capital Company††^ | | | 0.20 | | | | 08/02/2011 | | | | 10,000,000 | | | | 9,999,889 | |
CRC Funding LLC††^ | | | 0.16 | | | | 09/21/2011 | | | | 15,000,000 | | | | 14,996,600 | |
CRC Funding LLC††^ | | | 0.17 | | | | 09/19/2011 | | | | 4,000,000 | | | | 3,999,074 | |
CRC Funding LLC††^ | | | 0.24 | | | | 08/26/2011 | | | | 10,000,000 | | | | 9,998,264 | |
Crown Point Capital Company††^ | | | 0.27 | | | | 08/03/2011 | | | | 22,000,000 | | | | 21,999,511 | |
Crown Point Capital Company††^ | | | 0.36 | | | | 08/10/2011 | | | | 16,000,000 | | | | 15,998,400 | |
Crown Point Capital Company††^ | | | 0.36 | | | | 08/11/2011 | | | | 8,000,000 | | | | 7,999,111 | |
Crown Point Capital Company††^ | | | 0.37 | | | | 08/12/2011 | | | | 6,000,000 | | | | 5,999,267 | |
Crown Point Capital Company††^ | | | 0.38 | | | | 08/17/2011 | | | | 15,000,000 | | | | 14,997,333 | |
Crown Point Capital Company††^ | | | 0.38 | | | | 08/18/2011 | | | | 10,000,000 | | | | 9,998,111 | |
| | | | |
| 10 | | Wells Fargo Advantage Money Market Fund | | Portfolio of Investments—July 31, 2011 (Unaudited) |
| | | | | | | | | | | | | | | | |
| Security Name | | Interest Rate | | | Maturity Date | | | Principal | | | Value | |
| | | | | | | | | | | | | | | | |
| | | | |
| Asset-Backed Commercial Paper (continued) | | | | | | | | | | | | | | | | |
Fairway Finance Corporation††^ | | | 0.21 | % | | | 09/06/2011 | | | $ | 15,000,000 | | | $ | 14,996,700 | |
Falcon Asset Securitization Corporation LLC††^ | | | 0.10 | | | | 08/05/2011 | | | | 21,000,000 | | | | 20,999,697 | |
Falcon Asset Securitization Corporation LLC††^ | | | 0.13 | | | | 08/18/2011 | | | | 20,000,000 | | | | 19,998,678 | |
Gemini Securitization Corporation LLC††^ | | | 0.15 | | | | 08/03/2011 | | | | 12,000,000 | | | | 11,999,849 | |
Gemini Securitization Corporation LLC††^ | | | 0.16 | | | | 08/09/2011 | | | | 23,000,000 | | | | 22,999,080 | |
Gemini Securitization Corporation LLC††^ | | | 0.17 | | | | 08/04/2011 | | | | 2,000,000 | | | | 1,999,962 | |
Gemini Securitization Corporation LLC††^ | | | 0.20 | | | | 09/14/2011 | | | | 4,000,000 | | | | 3,999,022 | |
Govco LLC††^ | | | 0.21 | | | | 08/22/2011 | | | | 25,000,000 | | | | 24,996,792 | |
Grampian Funding LLC††^ | | | 0.17 | | | | 08/16/2011 | | | | 32,000,000 | | | | 31,997,600 | |
Grampian Funding LLC††^ | | | 0.17 | | | | 08/17/2011 | | | | 15,000,000 | | | | 14,998,800 | |
Grampian Funding LLC††^ | | | 0.17 | | | | 08/25/2011 | | | | 10,000,000 | | | | 9,998,800 | |
Grampian Funding LLC††^ | | | 0.21 | | | | 09/08/2011 | | | | 5,000,000 | | | | 4,998,839 | |
Grampian Funding LLC††^ | | | 0.23 | | | | 08/15/2011 | | | | 14,000,000 | | | | 13,998,619 | |
Grampian Funding LLC††^ | | | 0.28 | | | | 08/10/2011 | | | | 5,000,000 | | | | 4,999,613 | |
Grampian Funding LLC††^ | | | 0.34 | | | | 09/02/2011 | | | | 20,000,000 | | | | 20,002,017 | |
Jupiter Securitization Company LLC††^ | | | 0.12 | | | | 08/15/2011 | | | | 15,000,000 | | | | 14,999,242 | |
Jupiter Securitization Company LLC††^ | | | 0.12 | | | | 08/17/2011 | | | | 1,000,000 | | | | 999,942 | |
Jupiter Securitization Company LLC††^ | | | 0.13 | | | | 08/12/2011 | | | | 5,000,000 | | | | 4,999,786 | |
Kells Funding LLC††± | | | 0.30 | | | | 12/16/2011 | | | | 10,000,000 | | | | 10,000,000 | |
Kells Funding LLC††± | | | 0.33 | | | | 11/29/2011 | | | | 51,000,000 | | | | 51,000,000 | |
Kells Funding LLC††± | | | 0.34 | | | | 02/21/2012 | | | | 15,000,000 | | | | 15,000,000 | |
Legacy Capital Company LLC††^ | | | 0.37 | | | | 08/12/2011 | | | | 11,000,000 | | | | 10,998,656 | |
Legacy Capital Company LLC††^ | | | 0.39 | | | | 08/26/2011 | | | | 6,000,000 | | | | 5,998,333 | |
Lexington Parker Capital Company LLC††^ | | | 0.30 | | | | 08/04/2011 | | | | 19,000,000 | | | | 18,999,367 | |
Lexington Parker Capital Company LLC††^ | | | 0.35 | | | | 08/08/2011 | | | | 15,000,000 | | | | 14,998,833 | |
Lexington Parker Capital Company LLC††^ | | | 0.36 | | | | 08/11/2011 | | | | 8,000,000 | | | | 7,999,111 | |
Lexington Parker Capital Company LLC††^ | | | 0.38 | | | | 08/16/2011 | | | | 11,000,000 | | | | 10,998,167 | |
Lexington Parker Capital Company LLC††^ | | | 0.38 | | | | 08/19/2011 | | | | 15,000,000 | | | | 14,997,000 | |
Lexington Parker Capital Company LLC††^ | | | 0.38 | | | | 08/23/2011 | | | | 12,000,000 | | | | 11,997,067 | |
Liberty Funding LLC††^ | | | 0.14 | | | | 08/25/2011 | | | | 37,000,000 | | | | 36,996,300 | |
LMA Americas LLC††^ | | | 0.00 | | | | 08/01/2011 | | | | 37,300,000 | | | | 37,300,000 | |
LMA Americas LLC††^ | | | 0.22 | | | | 08/16/2011 | | | | 10,000,000 | | | | 9,999,042 | |
LMA Americas LLC††^ | | | 0.22 | | | | 08/24/2011 | | | | 2,000,000 | | | | 1,999,706 | |
LMA Americas LLC††^ | | | 0.24 | | | | 08/30/2011 | | | | 4,500,000 | | | | 4,499,094 | |
Matchpoint Master Trust††^ | | | 0.00 | | | | 08/01/2011 | | | | 25,500,000 | | | | 25,500,000 | |
Metlife Short Term Funding LLC††^ | | | 0.14 | | | | 08/17/2011 | | | | 14,000,000 | | | | 13,999,067 | |
Metlife Short Term Funding LLC††^ | | | 0.14 | | | | 08/18/2011 | | | | 23,000,000 | | | | 22,998,371 | |
Metlife Short Term Funding LLC††^ | | | 0.21 | | | | 08/11/2011 | | | | 16,000,000 | | | | 15,998,978 | |
Metlife Short Term Funding LLC††^ | | | 0.21 | | | | 08/12/2011 | | | | 4,000,000 | | | | 3,999,719 | |
Mont Blanc Capital Corporation††^ | | | 0.20 | | | | 09/06/2011 | | | | 14,000,000 | | | | 13,997,060 | |
Mont Blanc Capital Corporation††^ | | | 0.20 | | | | 09/07/2011 | | | | 4,000,000 | | | | 3,999,137 | |
Mont Blanc Capital Corporation††^ | | | 0.20 | | | | 09/09/2011 | | | | 2,000,000 | | | | 1,999,545 | |
Mont Blanc Capital Corporation††^ | | | 0.20 | | | | 09/14/2011 | | | | 3,000,000 | | | | 2,999,267 | |
Newport Funding Corporation††^ | | | 0.16 | | | | 08/10/2011 | | | | 10,000,000 | | | | 9,999,550 | |
Nieuw Amsterdam Receivables Corporation††^ | | | 0.00 | | | | 08/01/2011 | | | | 7,000,000 | | | | 7,000,000 | |
Nieuw Amsterdam Receivables Corporation††^ | | | 0.15 | | | | 08/03/2011 | | | | 3,000,000 | | | | 2,999,962 | |
Nieuw Amsterdam Receivables Corporation††^ | | | 0.15 | | | | 08/26/2011 | | | | 15,000,000 | | | | 14,998,333 | |
Nieuw Amsterdam Receivables Corporation††^ | | | 0.17 | | | | 08/04/2011 | | | | 5,000,000 | | | | 4,999,904 | |
Nieuw Amsterdam Receivables Corporation††^ | | | 0.18 | | | | 08/05/2011 | | | | 2,000,000 | | | | 1,999,951 | |
Nieuw Amsterdam Receivables Corporation††^ | | | 0.18 | | | | 08/16/2011 | | | | 7,000,000 | | | | 6,999,446 | |
Nieuw Amsterdam Receivables Corporation††^ | | | 0.18 | | | | 09/08/2011 | | | | 8,000,000 | | | | 7,998,480 | |
| | | | | | |
| Portfolio of Investments—July 31, 2011 (Unaudited) | | Wells Fargo Advantage Money Market Fund | | | 11 | |
| | | | | | | | | | | | | | | | |
| Security Name | | Interest Rate | | | Maturity Date | | | Principal | | | Value | |
| | | | | | | | | | | | | | | | |
| | | | |
| Asset-Backed Commercial Paper (continued) | | | | | | | | | | | | | | | | |
Nieuw Amsterdam Receivables Corporation††^ | | | 0.20 | % | | | 08/09/2011 | | | $ | 5,000,000 | | | $ | 4,999,756 | |
Nieuw Amsterdam Receivables Corporation††^ | | | 0.20 | | | | 09/19/2011 | | | | 5,000,000 | | | | 4,998,639 | |
Nieuw Amsterdam Receivables Corporation††^ | | | 0.25 | | | | 09/22/2011 | | | | 26,000,000 | | | | 25,990,611 | |
Northern Pines Funding LLC††^ | | | 0.15 | | | | 08/11/2011 | | | | 9,000,000 | | | | 8,999,600 | |
Northern Pines Funding LLC††^ | | | 0.26 | | | | 08/08/2011 | | | | 6,000,000 | | | | 5,999,650 | |
Northern Pines Funding LLC††^ | | | 0.30 | | | | 08/23/2011 | | | | 12,000,000 | | | | 11,997,727 | |
Old Line Funding LLC††^ | | | 0.14 | | | | 08/29/2011 | | | | 8,000,000 | | | | 7,999,129 | |
Regency Markets #1 LLC††^ | | | 0.14 | | | | 08/11/2011 | | | | 10,000,000 | | | | 9,999,583 | |
Regency Markets #1 LLC††^ | | | 0.14 | | | | 08/15/2011 | | | | 20,000,000 | | | | 19,998,833 | |
Regency Markets #1 LLC††^ | | | 0.14 | | | | 08/17/2011 | | | | 20,000,000 | | | | 19,998,667 | |
Regency Markets #1 LLC††^ | | | 0.15 | | | | 08/25/2011 | | | | 15,000,000 | | | | 14,998,400 | |
Rhein-Main Security Limited††^ | | | 0.41 | | | | 09/13/2011 | | | | 12,000,000 | | | | 11,993,980 | |
Rhein-Main Security Limited††^ | | | 0.42 | | | | 09/06/2011 | | | | 6,000,000 | | | | 5,997,420 | |
Rhein-Main Security Limited††^ | | | 0.42 | | | | 09/23/2011 | | | | 4,000,000 | | | | 3,997,468 | |
Rheingold Securitization Limited††^ | | | 0.41 | | | | 09/06/2011 | | | | 14,000,000 | | | | 13,994,070 | |
Rheingold Securitization Limited††^ | | | 0.41 | | | | 09/16/2011 | | | | 39,000,000 | | | | 38,979,070 | |
Rheingold Securitization Limited††^ | | | 0.42 | | | | 09/20/2011 | | | | 19,470,000 | | | | 19,458,372 | |
Salisbury Receivables Company LLC††^ | | | 0.14 | | | | 08/22/2011 | | | | 2,000,000 | | | | 1,999,825 | |
Salisbury Receivables Company LLC††^ | | | 0.14 | | | | 08/24/2011 | | | | 4,000,000 | | | | 3,999,617 | |
Salisbury Receivables Company LLC††^ | | | 0.15 | | | | 08/12/2011 | | | | 4,000,000 | | | | 3,999,804 | |
Salisbury Receivables Company LLC††^ | | | 0.15 | | | | 08/15/2011 | | | | 2,000,000 | | | | 1,999,876 | |
Salisbury Receivables Company LLC††^ | | | 0.15 | | | | 08/18/2011 | | | | 9,000,000 | | | | 8,999,320 | |
Salisbury Receivables Company LLC††^ | | | 0.15 | | | | 08/29/2011 | | | | 5,000,000 | | | | 4,999,378 | |
Scaldis Capital LLC††^ | | | 0.00 | | | | 08/01/2011 | | | | 5,000,000 | | | | 5,000,000 | |
Scaldis Capital LLC††^ | | | 0.20 | | | | 08/09/2011 | | | | 9,000,000 | | | | 8,999,560 | |
Sheffield Receivables Corporation††^ | | | 0.14 | | | | 08/25/2011 | | | | 6,000,000 | | | | 5,999,400 | |
Sheffield Receivables Corporation††^ | | | 0.15 | | | | 08/15/2011 | | | | 4,000,000 | | | | 3,999,751 | |
Sheffield Receivables Corporation††^ | | | 0.17 | | | | 09/23/2011 | | | | 4,000,000 | | | | 3,998,999 | |
Sheffield Receivables Corporation††^ | | | 0.17 | | | | 09/26/2011 | | | | 10,000,000 | | | | 9,997,356 | |
Sheffield Receivables Corporation††^ | | | 0.17 | | | | 09/27/2011 | | | | 10,000,000 | | | | 9,997,308 | |
Sheffield Receivables Corporation††^ | | | 0.18 | | | | 10/03/2011 | | | | 10,000,000 | | | | 9,996,850 | |
Solitaire Funding LLC††^ | | | 0.15 | | | | 08/16/2011 | | | | 6,000,000 | | | | 5,999,600 | |
Solitaire Funding LLC††^ | | | 0.15 | | | | 08/18/2011 | | | | 7,000,000 | | | | 6,999,471 | |
Solitaire Funding LLC††^ | | | 0.15 | | | | 08/22/2011 | | | | 5,000,000 | | | | 4,999,533 | |
Solitaire Funding LLC††^ | | | 0.15 | | | | 08/25/2011 | | | | 30,000,000 | | | | 29,996,800 | |
Solitaire Funding LLC††^ | | | 0.16 | | | | 08/30/2011 | | | | 7,000,000 | | | | 6,999,041 | |
Solitaire Funding LLC††^ | | | 0.20 | | | | 09/09/2011 | | | | 15,000,000 | | | | 14,996,588 | |
Solitaire Funding LLC††^ | | | 0.21 | | | | 08/09/2011 | | | | 5,000,000 | | | | 4,999,733 | |
Solitaire Funding LLC††^ | | | 0.21 | | | | 09/02/2011 | | | | 15,000,000 | | | | 14,997,067 | |
Solitaire Funding LLC††^ | | | 0.21 | | | | 09/12/2011 | | | | 10,000,000 | | | | 9,997,550 | |
Straight-A Funding LLC††^ | | | 0.74 | | | | 10/27/2011 | | | | 138,000,000 | | | | 137,749,875 | |
Surrey Funding Corporation††^ | | | 0.14 | | | | 08/09/2011 | | | | 7,000,000 | | | | 6,999,751 | |
Surrey Funding Corporation††^ | | | 0.15 | | | | 08/30/2011 | | | | 5,000,000 | | | | 4,999,356 | |
Surrey Funding Corporation††^ | | | 0.19 | | | | 09/07/2011 | | | | 2,000,000 | | | | 1,999,589 | |
Sydney Capital Corporation††^ | | | 0.30 | | | | 08/10/2011 | | | | 3,000,000 | | | | 2,999,753 | |
Sydney Capital Corporation††^ | | | 0.34 | | | | 09/12/2011 | | | | 6,000,000 | | | | 5,997,550 | |
Sydney Capital Corporation††^ | | | 0.34 | | | | 09/14/2011 | | | | 2,000,000 | | | | 1,999,144 | |
Tasman Funding Incorporated††^ | | | 0.16 | | | | 08/11/2011 | | | | 5,000,000 | | | | 4,999,750 | |
Tasman Funding Incorporated††^ | | | 0.18 | | | | 08/16/2011 | | | | 7,000,000 | | | | 6,999,446 | |
Tasman Funding Incorporated††^ | | | 0.18 | | | | 08/18/2011 | | | | 4,000,000 | | | | 3,999,641 | |
Tasman Funding Incorporated††^ | | | 0.18 | | | | 08/24/2011 | | | | 2,000,000 | | | | 1,999,757 | |
| | | | |
| 12 | | Wells Fargo Advantage Money Market Fund | | Portfolio of Investments—July 31, 2011 (Unaudited) |
| | | | | | | | | | | | | | | | |
| Security Name | | Interest Rate | | | Maturity Date | | | Principal | | | Value | |
| | | | | | | | | | | | | | | | |
| | | | |
| Asset-Backed Commercial Paper (continued) | | | | | | | | | | | | | | | | |
Tasman Funding Incorporated††^ | | | 0.23 | % | | | 08/17/2011 | | | $ | 6,000,000 | | | $ | 5,999,360 | |
Thames Asset Global Securitization #1 Incorporated††^ | | | 0.14 | | | | 08/10/2011 | | | | 54,000,000 | | | | 53,997,580 | |
Thames Asset Global Securitization #1 Incorporated††^ | | | 0.15 | | | | 08/12/2011 | | | | 5,000,000 | | | | 4,999,756 | |
Thames Asset Global Securitization #1 Incorporated††^ | | | 0.15 | | | | 08/17/2011 | | | | 2,000,000 | | | | 1,999,858 | |
Thames Asset Global Securitization #1 Incorporated††^ | | | 0.15 | | | | 08/18/2011 | | | | 17,000,000 | | | | 16,998,649 | |
Thames Asset Global Securitization #1 Incorporated††^ | | | 0.16 | | | | 08/23/2011 | | | | 2,000,000 | | | | 1,999,792 | |
Thames Asset Global Securitization #1 Incorporated††^ | | | 0.16 | | | | 08/25/2011 | | | | 11,000,000 | | | | 10,998,753 | |
Versailles CDS LLC††^ | | | 0.20 | | | | 08/05/2011 | | | | 31,000,000 | | | | 30,999,139 | |
Windmill Funding Corporation††^ | | | 0.12 | | | | 08/03/2011 | | | | 2,000,000 | | | | 1,999,980 | |
Windmill Funding Corporation††^ | | | 0.15 | | | | 08/23/2011 | | | | 12,000,000 | | | | 11,998,827 | |
Windmill Funding Corporation††^ | | | 0.15 | | | | 08/30/2011 | | | | 14,000,000 | | | | 13,998,196 | |
Windmill Funding Corporation††^ | | | 0.22 | | | | 08/22/2011 | | | | 7,000,000 | | | | 6,999,061 | |
Working Capital Management Company††^ | | | 0.15 | | | | 08/03/2011 | | | | 6,000,000 | | | | 5,999,923 | |
| | | | |
| | | | | | | | | | | | | | | 2,353,953,482 | |
| | | | | | | | | | | | | | | | |
| | | | |
| Financial Company Commerical Paper: 10.99% | | | | | | | | | | | | | | | | |
ABN AMRO Funding USA LLC††^ | | | 0.18 | | | | 08/15/2011 | | | | 9,000,000 | | | | 8,999,335 | |
ABN AMRO Funding USA LLC††^ | | | 0.18 | | | | 08/17/2011 | | | | 22,000,000 | | | | 21,998,142 | |
ABN AMRO Funding USA LLC††^ | | | 0.18 | | | | 08/19/2011 | | | | 3,000,000 | | | | 2,999,715 | |
ABN AMRO Funding USA LLC††^ | | | 0.20 | | | | 08/05/2011 | | | | 9,000,000 | | | | 8,999,750 | |
ANZ National Limited††± | | | 0.34 | | | | 09/13/2011 | | | | 10,000,000 | | | | 10,000,000 | |
ASB Finance Limited††± | | | 0.35 | | | | 12/02/2011 | | | | 7,000,000 | | | | 7,000,000 | |
ASB Finance Limited††± | | | 0.35 | | | | 12/05/2011 | | | | 7,000,000 | | | | 7,000,000 | |
BNZ International Funding Limited††^ | | | 0.15 | | | | 08/10/2011 | | | | 8,000,000 | | | | 7,999,660 | |
BNZ International Funding Limited††^ | | | 0.24 | | | | 09/20/2011 | | | | 4,000,000 | | | | 3,998,667 | |
BNZ International Funding Limited††± | | | 0.34 | | | | 10/07/2011 | | | | 2,000,000 | | | | 1,999,999 | |
BNZ International Funding Limited††± | | | 0.34 | | | | 10/12/2011 | | | | 10,000,000 | | | | 10,000,099 | |
BNZ International Funding Limited††± | | | 0.35 | | | | 01/06/2012 | | | | 10,000,000 | | | | 10,000,000 | |
BNZ International Funding Limited††± | | | 0.35 | | | | 09/01/2011 | �� | | | 10,000,000 | | | | 10,000,035 | |
Commonwealth Bank of Australia†† | | | 0.30 | | | | 09/02/2011 | | | | 31,000,000 | | | | 31,002,525 | |
Credit Suisse (New York)^ | | | 0.15 | | | | 09/07/2011 | | | | 25,000,000 | | | | 24,996,146 | |
Credit Suisse (New York)^ | | | 0.00 | | | | 08/01/2011 | | | | 25,000,000 | | | | 25,000,000 | |
ICICI Bank Limited^ | | | 0.64 | | | | 09/16/2011 | | | | 23,000,000 | | | | 22,980,897 | |
Macquarie Bank Limited††^ | | | 0.33 | | | | 09/06/2011 | | | | 39,000,000 | | | | 38,986,740 | |
Macquarie Bank Limited††^ | | | 0.36 | | | | 09/28/2011 | | | | 26,000,000 | | | | 25,984,501 | |
Nordea North America Incorporated^ | | | 0.15 | | | | 09/15/2011 | | | | 46,000,000 | | | | 45,991,375 | |
Nordea North America Incorporated^ | | | 0.15 | | | | 09/22/2011 | | | | 15,000,000 | | | | 14,996,750 | |
PB Financing Incorporated††^ | | | 0.45 | | | | 08/10/2011 | | | | 6,000,000 | | | | 5,999,250 | |
PB Financing Incorporated††^ | | | 0.47 | | | | 08/22/2011 | | | | 5,000,000 | | | | 4,998,571 | |
PB Financing Incorporated††^ | | | 0.49 | | | | 09/08/2011 | | | | 9,000,000 | | | | 8,995,250 | |
PB Financing Incorporated††^ | | | 0.49 | | | | 09/09/2011 | | | | 9,000,000 | | | | 8,995,125 | |
PB Financing Incorporated††^ | | | 0.50 | | | | 09/16/2011 | | | | 6,000,000 | | | | 5,996,090 | |
PB Financing Incorporated††^ | | | 0.50 | | | | 09/19/2011 | | | | 6,000,000 | | | | 5,995,835 | |
Prudential plc††^ | | | 0.20 | | | | 08/18/2011 | | | | 16,000,000 | | | | 15,998,413 | |
Prudential plc††^ | | | 0.21 | | | | 09/08/2011 | | | | 3,000,000 | | | | 2,999,303 | |
Prudential plc††^ | | | 0.22 | | | | 09/13/2011 | | | | 2,000,000 | | | | 1,999,474 | |
Prudential plc††^ | | | 0.23 | | | | 09/06/2011 | | | | 3,000,000 | | | | 2,999,280 | |
Prudential plc††^ | | | 0.23 | | | | 09/12/2011 | | | | 4,000,000 | | | | 3,998,880 | |
RBS Holdings USA Incorporated^ | | | 0.22 | | | | 08/11/2011 | | | | 29,000,000 | | | | 28,998,067 | |
Skandinaviska Enskilda Banken AB††^ | | | 0.23 | | | | 09/08/2011 | | | | 15,000,000 | | | | 14,996,200 | |
Sumitomo Trust & Banking Corporation††^ | | | 0.00 | | | | 08/01/2011 | | | | 37,000,000 | | | | 37,000,000 | |
| | | | | | |
| Portfolio of Investments—July 31, 2011 (Unaudited) | | Wells Fargo Advantage Money Market Fund | | | 13 | |
| | | | | | | | | | | | | | | | |
| Security Name | | Interest Rate | | | Maturity Date | | | Principal | | | Value | |
| | | | | | | | | | | | | | | | |
| | | | |
| Financial Company Commerical Paper (continued) | | | | | | | | | | | | | | | | |
Suncorp-Metway Limited††^ | | | 0.26 | % | | | 08/03/2011 | | | $ | 19,000,000 | | | $ | 18,999,594 | |
Suncorp-Metway Limited††^ | | | 0.36 | | | | 08/09/2011 | | | | 10,000,000 | | | | 9,999,111 | |
Suncorp-Metway Limited††^ | | | 0.39 | | | | 09/08/2011 | | | | 15,000,000 | | | | 14,993,667 | |
Suncorp-Metway Limited††^ | | | 0.39 | | | | 09/12/2011 | | | | 8,000,000 | | | | 7,996,267 | |
Swedbank AB^ | | | 0.11 | | | | 08/02/2011 | | | | 10,000,000 | | | | 9,999,939 | |
Swedbank AB^ | | | 0.18 | | | | 08/03/2011 | | | | 1,000,000 | | | | 999,985 | |
Swedbank AB^ | | | 0.20 | | | | 08/04/2011 | | | | 1,000,000 | | | | 999,978 | |
Swedbank AB^ | | | 0.23 | | | | 08/08/2011 | | | | 16,000,000 | | | | 15,999,176 | |
Swedbank AB^ | | | 0.24 | | | | 08/09/2011 | | | | 11,000,000 | | | | 10,999,352 | |
Swedbank AB^ | | | 0.24 | | | | 08/10/2011 | | | | 16,000,000 | | | | 15,998,940 | |
Swedbank AB^ | | | 0.26 | | | | 09/29/2011 | | | | 39,000,000 | | | | 38,983,062 | |
Westpac Securities NZ Limited††^ | | | 0.17 | | | | 08/24/2011 | | | | 63,000,000 | | | | 62,992,956 | |
Westpac Securities NZ Limited††± | | | 0.33 | | | | 08/19/2011 | | | | 25,000,000 | | | | 25,000,000 | |
Westpac Securities NZ Limited††± | | | 0.34 | | | | 10/13/2011 | | | | 20,000,000 | | | | 20,000,000 | |
| | | | |
| | | | | | | | | | | | | | | 744,866,101 | |
| | | | | | | | | | | | | | | | |
| | | | |
| Other Commercial Paper: 4.05% | | | | | | | | | | | | | | | | |
ACTS Retirement Life Communities Incorporated^ | | | 0.22 | | | | 09/15/2011 | | | | 16,000,000 | | | | 15,995,600 | |
Alaska Housing Finance Corporation^ | | | 0.21 | | | | 08/15/2011 | | | | 2,000,000 | | | | 1,999,821 | |
Caisse D’amortissement de la Dette Sociale††^ | | | 0.22 | | | | 09/28/2011 | | | | 15,000,000 | | | | 14,994,683 | |
Caisse D’amortissement de la Dette Sociale††^ | | | 0.22 | | | | 10/03/2011 | | | | 7,000,000 | | | | 6,997,305 | |
Caisse D’amortissement de la Dette Sociale††^ | | | 0.22 | | | | 10/24/2011 | | | | 7,000,000 | | | | 6,996,407 | |
Caisse D’amortissement de la Dette Sociale††^ | | | 0.23 | | | | 10/11/2011 | | | | 33,000,000 | | | | 32,984,705 | |
EDF SA††^ | | | 0.12 | | | | 08/05/2011 | | | | 19,000,000 | | | | 18,999,683 | |
EDF SA††^ | | | 0.19 | | | | 09/06/2011 | | | | 11,000,000 | | | | 10,997,910 | |
EDF SA††^ | | | 0.19 | | | | 09/07/2011 | | | | 8,000,000 | | | | 7,998,438 | |
Erste Abwicklungsanstalt††^ | | | 0.19 | | | | 08/08/2011 | | | | 15,000,000 | | | | 14,999,358 | |
Erste Abwicklungsanstalt††^ | | | 0.24 | | | | 09/28/2011 | | | | 45,000,000 | | | | 44,982,600 | |
Erste Abwicklungsanstalt††^ | | | 0.24 | | | | 09/29/2011 | | | | 16,000,000 | | | | 15,993,707 | |
Erste Abwicklungsanstalt††^ | | | 0.25 | | | | 09/07/2011 | | | | 15,000,000 | | | | 14,995,992 | |
Erste Abwicklungsanstalt††^ | | | 0.25 | | | | 09/14/2011 | | | | 15,000,000 | | | | 14,995,233 | |
Louis Dreyfus Corporation^ | | | 0.00 | | | | 08/01/2011 | | | | 2,000,000 | | | | 2,000,000 | |
SBAB Bank AB††^ | | | 0.16 | | | | 08/02/2011 | | | | 3,000,000 | | | | 2,999,973 | |
SBAB Bank AB††^ | | | 0.20 | | | | 08/03/2011 | | | | 4,000,000 | | | | 3,999,933 | |
SBAB Bank AB††^ | | | 0.24 | | | | 08/04/2011 | | | | 2,000,000 | | | | 1,999,947 | |
SBAB Bank AB††^ | | | 0.27 | | | | 09/01/2011 | | | | 9,000,000 | | | | 8,997,830 | |
SBAB Bank AB††^ | | | 0.27 | | | | 09/09/2011 | | | | 19,000,000 | | | | 18,994,085 | |
Trinity Health Corporation^ | | | 0.15 | | | | 08/16/2011 | | | | 5,000,000 | | | | 4,999,667 | |
Trinity Health Corporation^ | | | 0.00 | | | | 08/01/2011 | | | | 7,000,000 | | | | 7,000,000 | |
| | | | |
| | | | | | | | | | | | | | | 274,922,877 | |
| | | | | | | | | | | | | | | | |
| | | | |
Total Commercial Paper (Cost $3,373,742,460) | | | | | | | | | | | | | | | 3,373,742,460 | |
| | | | | | | | | | | | | | | | |
| | | | |
| Government Agency Debt: 0.43% | | | | | | | | | | | | | | | | |
FHLMC± | | | 0.11 | | | | 02/02/2012 | | | | 29,000,000 | | | | 28,988,164 | |
| | | | |
Total Government Agency Debt (Cost $28,988,164) | | | | | | | | | | | | | | | 28,988,164 | |
| | | | | | | | | | | | | | | | |
| | | | |
| 14 | | Wells Fargo Advantage Money Market Fund | | Portfolio of Investments—July 31, 2011 (Unaudited) |
| | | | | | | | | | | | | | | | |
| Security Name | | Interest Rate | | | Maturity Date | | | Principal | | | Value | |
| | | | | | | | | | | | | | | | |
| | | | |
Municipal Bonds and Notes: 11.84% | | | | | | | | | | | | | | | | |
| | | | |
Alabama: 0.67% | | | | | | | | | | | | | | | | |
| | | | |
| Variable Rate Demand Notes§: 0.67% | | | | | | | | | | | | | | | | |
Lower Alabama Gas District Supply Revenue Series A (Utilities Revenue, Societe Generale LOC) | | | 0.13 | % | | | 11/01/2027 | | | $ | 14,000,000 | | | $ | 14,000,000 | |
Southeast Alabama Gas District Alabama Supply Project Series 2007-A (Utilities Revenue) | | | 0.24 | | | | 08/01/2027 | | | | 31,763,000 | | | | 31,763,000 | |
| | | | |
| | | | | | | | | | | | | | | 45,763,000 | |
| | | | | | | | | | | | | | | | |
| | | | |
California: 3.11% | | | | | | | | | | | | | | | | |
| | | | |
| Other Municipal Debt: 0.53% | | | | | | | | | | | | | | | | |
San Francisco CA (Miscellaneous Revenue) | | | 0.17 | | | | 09/12/2011 | | | | 2,000,000 | | | | 2,000,000 | |
San Francisco CA (Miscellaneous Revenue) | | | 0.17 | | | | 10/03/2011 | | | | 4,000,000 | | | | 4,000,000 | |
San Francisco CA (Miscellaneous Revenue) | | | 0.18 | | | | 09/12/2011 | | | | 2,000,000 | | | | 2,000,000 | |
San Francisco CA (Miscellaneous Revenue) | | | 0.18 | | | | 09/12/2011 | | | | 2,000,000 | | | | 2,000,000 | |
San Francisco CA (Miscellaneous Revenue) | | | 0.19 | | | | 08/03/2011 | | | | 3,000,000 | | | | 3,000,000 | |
San Jose CA International Airport (Airport Revenue) | | | 0.22 | | | | 08/02/2011 | | | | 8,000,000 | | | | 8,000,000 | |
San Jose CA International Airport Series C-2 (Airport Revenue) | | | 0.22 | | | | 08/02/2011 | | | | 2,000,000 | | | | 2,000,000 | |
San Jose CA International Airport Series F (Airport Revenue) | | | 0.20 | | | | 08/02/2011 | | | | 6,000,000 | | | | 6,000,000 | |
Turlock Irrigation District CA (Miscellaneous Revenue) | | | 0.24 | | | | 10/03/2011 | | | | 7,000,000 | | | | 7,000,000 | |
| | | | |
| | | | | | | | | | | | | | | 36,000,000 | |
| | | | | | | | | | | | | | | | |
| | | | |
| Variable Rate Demand Notes§: 2.58% | | | | | | | | | | | | | | | | |
ABAG Finance Authority for Nonprofit Corporations CA MFHR Geneva Pointe Apartments Series A (Housing Revenue, FNMA Insured) | | | 0.17 | | | | 03/15/2037 | | | | 11,145,000 | | | | 11,145,000 | |
California Educational Facilities Authority (Education Revenue, Bank of America NA LOC, NATL-RE Insured) | | | 0.07 | | | | 10/01/2043 | | | | 8,320,000 | | | | 8,320,000 | |
California HFA Program Series A (Housing Revenue, FNMA LOC) | | | 0.05 | | | | 08/01/2036 | | | | 2,000,000 | | | | 2,000,000 | |
California HFFA Catholic Healthcare Series C (Health Revenue, JPMorgan Chase Bank LOC, NATL-RE Insured) | | | 0.05 | | | | 07/01/2020 | | | | 2,000,000 | | | | 2,000,000 | |
California HFFA Catholic West Series H (Health Revenue, Bank of America NA LOC) | | | 0.06 | | | | 07/01/2035 | | | | 200,000 | | | | 200,000 | |
California Series A Subseries C-2 (GO-State, Bank of Nova Scotia LOC) | | | 0.04 | | | | 05/01/2033 | | | | 4,000,000 | | | | 4,000,000 | |
California Statewide CDA Oakmont Senior Living Series Y (Housing Revenue, FNMA Insured) | | | 0.18 | | | | 08/01/2031 | | | | 3,500,000 | | | | 3,500,000 | |
California Statewide CDA Pravillions Apartments Series M (Housing Revenue, FNMA Insured) | | | 0.18 | | | | 08/15/2034 | | | | 3,500,000 | | | | 3,500,000 | |
Camarillo CA Hacienda de Camarillo Project (Housing Revenue, FNMA Insured) | | | 0.17 | | | | 10/15/2026 | | | | 5,065,000 | | | | 5,065,000 | |
Contra Costa County CA Creekview Apartments Series B (Housing Revenue, FHLMC Insured) | | | 0.17 | | | | 07/01/2036 | | | | 4,000,000 | | | | 4,000,000 | |
Los Angeles CA Beverly Park Apartments Series A (Housing Revenue, FHLMC Insured) | | | 0.06 | | | | 08/01/2018 | | | | 6,500,000 | | | | 6,500,000 | |
Los Angeles CA Community RDA Academy Village Apartments (Housing Revenue, FHLMC Insured) | | | 0.15 | | | | 10/01/2019 | | | | 500,000 | | | | 500,000 | |
Los Angeles CA Sub Series C (Water & Sewer Revenue, JPMorgan Chase Bank LOC) | | | 0.06 | | | | 06/01/2028 | | | | 16,505,000 | | | | 16,504,340 | |
Metropolitan Water District of Southern California Series B (Water & Sewer Revenue) | | | 0.05 | | | | 07/01/2027 | | | | 5,000,000 | | | | 5,000,000 | |
Metropolitan Water District of Southern California Series B-2 (Water & Sewer Revenue) | | | 0.08 | | | | 07/01/2035 | | | | 5,000,000 | | | | 5,000,000 | |
| | | | | | |
| Portfolio of Investments—July 31, 2011 (Unaudited) | | Wells Fargo Advantage Money Market Fund | | | 15 | |
| | | | | | | | | | | | | | | | |
| Security Name | | Interest Rate | | | Maturity Date | | | Principal | | | Value | |
| | | | | | | | | | | | | | | | |
| | | | |
| Variable Rate Demand Notes§ (continued) | | | | | | | | | | | | | | | | |
Pasadena CA COP Series A (Lease Revenue, Bank of America NA LOC) | | | 0.09 | % | | | 02/01/2035 | | | $ | 21,000,000 | | | $ | 21,000,000 | |
Riverside CA COP Riverside Renaissance Project Series 2008 (Lease Revenue, Bank of America NA LOC) | | | 0.09 | | | | 03/01/2037 | | | | 16,515,000 | | | | 16,515,000 | |
Riverside CA Series C (Lease Revenue, Bank of America NA LOC) | | | 0.06 | | | | 10/01/2035 | | | | 7,320,000 | | | | 7,320,000 | |
Sacramento County CA Housing Authority Shadowood Apartments Project Issue A (Housing Revenue, FHLMC Insured) | | | 0.08 | | | | 12/01/2022 | | | | 4,000,000 | | | | 4,000,000 | |
San Diego CA HFA MFHR Stratton Apartments Project Series A (Housing Revenue, FNMA Insured) | | | 0.17 | | | | 01/15/2033 | | | | 3,500,000 | | | | 3,500,000 | |
San Diego CA Housing Authority MFHR Hillside Garden Apartments Series B (Housing Revenue, FNMA Insured) | | | 0.19 | | | | 01/15/2035 | | | | 3,500,000 | | | | 3,500,000 | |
San Francisco CA City & County Finance Corporation Moscone Center Project (Lease Revenue, Bank of America NA LOC) | | | 0.05 | | | | 04/01/2030 | | | | 1,940,000 | | | | 1,940,000 | |
San Francisco CA City & County Redevelopment Agency 3rd Mission C (Tax Revenue, FNMA Insured) | | | 0.18 | | | | 06/15/2034 | | | | 5,000,000 | | | | 5,000,000 | |
San Francisco CA City & County Redevelopment Agency Community Facilities District # 4 (Tax Revenue, Bank of America NA LOC) | | | 0.07 | | | | 08/01/2032 | | | | 5,000,000 | | | | 5,000,000 | |
San Leandro CA Carlton Plaza Series A (Housing Revenue, FNMA Insured) | | | 0.14 | | | | 09/15/2032 | | | | 1,800,000 | | | | 1,800,000 | |
Simi Valley CA MFHA Series A (Housing Revenue, FHLMC Insured) | | | 0.15 | | | | 07/01/2023 | | | | 8,000,000 | | | | 8,000,000 | |
Southern California Public Power Authority Magnolia Power Project Series 2009-1-A (Utilities Revenue, KBC Bank NV LOC) | | | 0.07 | | | | 07/01/2036 | | | | 14,965,000 | | | | 14,965,000 | |
Whittier CA Whittier College Series 2008 (Education Revenue, Bank of America NA LOC) | | | 0.08 | | | | 12/01/2038 | | | | 5,000,000 | | | | 5,000,000 | |
| | | | |
| | | | | | | | | | | | | | | 174,774,340 | |
| | | | | | | | | | | | | | | | |
| | | | |
Colorado: 0.40% | | | | | | | | | | | | | | | | |
| | | | |
| Variable Rate Demand Notes§: 0.40% | | | | | | | | | | | | | | | | |
Colorado HFA Class I Series B 1 (Housing Revenue, GO of Authority Insured) | | | 0.17 | | | | 10/01/2038 | | | | 4,828,500 | | | | 4,828,500 | |
Colorado HFA Taxable MFHR Project B 2 (Housing Revenue, FNMA Insured) | | | 0.16 | | | | 05/01/2050 | | | | 15,600,000 | | | | 15,600,000 | |
Denver CO Public Schools Series A-4 (Education Revenue, Royal Bank of Canada LOC, AGM Insured) | | | 0.11 | | | | 12/15/2037 | | | | 7,000,000 | | | | 7,000,000 | |
| | | | |
| | | | | | | | | | | | | | | 27,428,500 | |
| | | | | | | | | | | | | | | | |
| | | | |
Connecticut: 0.07% | | | | | | | | | | | | | | | | |
| | | | |
| Variable Rate Demand Note§: 0.07% | | | | | | | | | | | | | | | | |
New Britain CT Taxable Pension Series C (Tax Revenue, JPMorgan Chase Bank LOC) | | | 0.26 | | | | 02/01/2026 | | | | 5,000,000 | | | | 5,000,000 | |
| | | | | | | | | | | | | | | | |
| | | | |
Delaware: 0.10% | | | | | | | | | | | | | | | | |
| | | | |
| Variable Rate Demand Notes§: 0.10% | | | | | | | | | | | | | | | | |
Delaware EDA Clean Power Project Series 1997-D (Resource Recovery Revenue) | | | 0.21 | | | | 08/01/2029 | | | | 4,000,000 | | | | 4,000,000 | |
Delaware EDA Series B (Resource Recovery Revenue) | | | 0.28 | | | | 08/01/2029 | | | | 3,000,000 | | | | 3,000,000 | |
| | | | |
| | | | | | | | | | | | | | | 7,000,000 | |
| | | | | | | | | | | | | | | | |
| | | | |
District of Columbia: 0.24% | | | | | | | | | | | | | | | | |
| | | | |
| Other Municipal Debt: 0.11% | | | | | | | | | | | | | | | | |
District of Columbia Water & Sewer Authority Series C (Water & Sewer Revenue) | | | 0.20 | | | | 09/26/2011 | | | | 7,000,000 | | | | 7,000,000 | |
| | | | | | | | | | | | | | | | |
| | | | |
| 16 | | Wells Fargo Advantage Money Market Fund | | Portfolio of Investments—July 31, 2011 (Unaudited) |
| | | | | | | | | | | | | | | | |
| Security Name | | Interest Rate | | | Maturity Date | | | Principal | | | Value | |
| | | | | | | | | | | | | | | | |
| | | | |
| Variable Rate Demand Note§: 0.13% | | | | | | | | | | | | | | | | |
District of Columbia The American University Series A (Education Revenue, PNC Bank NA LOC) | | | 0.06 | % | | | 04/01/2038 | | | $ | 9,000,000 | | | $ | 9,000,000 | |
| | | | | | | | | | | | | | | | |
| | | | |
Florida: 0.19% | | | | | | | | | | | | | | | | |
| | | | |
| Other Municipal Debt: 0.10% | | | | | | | | | | | | | | | | |
Hillsborough County FL (Miscellaneous Revenue) | | | 0.17 | | | | 09/01/2011 | | | | 2,000,000 | | | | 2,000,000 | |
Hillsborough County FL (Miscellaneous Revenue) | | | 0.26 | | | | 08/11/2011 | | | | 5,000,000 | | | | 5,000,000 | |
| | | | |
| | | | | | | | | | | | | | | 7,000,000 | |
| | | | | | | | | | | | | | | | |
| | | | |
| Variable Rate Demand Note§: 0.09% | | | | | | | | | | | | | | | | |
Palm Beach County FL Pine Crest Preparatory (Education Revenue, Bank of America NA LOC) | | | 0.13 | | | | 06/01/2032 | | | | 6,015,000 | | | | 6,015,000 | |
| | | | | | | | | | | | | | | | |
| | | | |
Georgia: 0.06% | | | | | | | | | | | | | | | | |
| | | | |
| Variable Rate Demand Note§: 0.06% | | | | | | | | | | | | | | | | |
Columbus GA Housing Development Authority PFOTER (Housing Revenue, ACA Insured)†† | | | 0.34 | | | | 10/01/2039 | | | | 4,000,000 | | | | 4,000,000 | |
| | | | | | | | | | | | | | | | |
| | | | |
Illinois: 0.12% | | | | | | | | | | | | | | | | |
| | | | |
| Variable Rate Demand Notes§: 0.12% | | | | | | | | | | | | | | | | |
Chicago IL Midway Airport Series A2 (Airport Revenue, JPMorgan Chase Bank LOC) | | | 0.23 | | | | 01/01/2025 | | | | 1,000,000 | | | | 1,000,000 | |
Cook County IL Series D-2 (GO-Local) | | | 0.19 | | | | 11/01/2030 | | | | 1,000,000 | | | | 1,000,000 | |
Illinois Finance Authority Resurrection Health Project Series 2005-B (Health Revenue, JPMorgan Chase Bank LOC) | | | 0.20 | | | | 05/15/2035 | | | | 6,000,000 | | | | 6,000,000 | |
| | | | |
| | | | | | | | | | | | | | | 8,000,000 | |
| | | | | | | | | | | | | | | | |
| | | | |
Iowa: 0.10% | | | | | | | | | | | | | | | | |
| | | | |
| Variable Rate Demand Note§: 0.10% | | | | | | | | | | | | | | | | |
Iowa Finance Authority Student Housing Des Moines LLC Project A (Housing Revenue, Citibank NA LOC) | | | 0.09 | | | | 06/01/2039 | | | | 7,000,000 | | | | 7,000,000 | |
| | | | | | | | | | | | | | | | |
| | | | |
Kentucky: 0.08% | | | | | | | | | | | | | | | | |
| | | | |
| Variable Rate Demand Note§: 0.08% | | | | | | | | | | | | | | | | |
Warren County KY IDA (IDR, Bank of America NA LOC) | | | 0.28 | | | | 12/01/2018 | | | | 5,200,000 | | | | 5,200,000 | |
| | | | | | | | | | | | | | | | |
| | | | |
Louisiana: 0.21% | | | | | | | | | | | | | | | | |
| | | | |
| Other Municipal Debt: 0.05% | | | | | | | | | | | | | | | | |
Louisiana Department of Airport (Airport Revenue) | | | 0.25 | | | | 08/05/2011 | | | | 3,000,000 | | | | 3,000,000 | |
| | | | | | | | | | | | | | | | |
| | | | |
| Variable Rate Demand Notes§: 0.16% | | | | | | | | | | | | | | | | |
Parish of St. James LA Series A-1 (Energy Revenue) | | | 0.08 | | | | 11/01/2040 | | | | 7,000,000 | | | | 7,000,000 | |
Parish of St. James LA Series B-1 (Energy Revenue) | | | 0.10 | | | | 11/01/2040 | | | | 4,000,000 | | | | 4,000,000 | |
| | | | |
| | | | | | | | | | | | | | | 11,000,000 | |
| | | | | | | | | | | | | | | | |
| | | | |
Maryland: 0.15% | | | | | | | | | | | | | | | | |
| | | | |
| Variable Rate Demand Notes§: 0.15% | | | | | | | | | | | | | | | | |
Howard County MD MFHR (Housing Revenue, FNMA Insured) | | | 0.09 | | | | 07/15/2033 | | | | 3,000,000 | | | | 3,000,000 | |
Maryland CDA Department of Housing & Community Development Series 2007-J (Housing Revenue) | | | 0.11 | | | | 09/01/2031 | | | | 2,960,000 | | | | 2,960,000 | |
| | | | | | |
| Portfolio of Investments—July 31, 2011 (Unaudited) | | Wells Fargo Advantage Money Market Fund | | | 17 | |
| | | | | | | | | | | | | | | | |
| Security Name | | Interest Rate | | | Maturity Date | | | Principal | | | Value | |
| | | | | | | | | | | | | | | | |
| | | | |
| Variable Rate Demand Notes§ (continued) | | | | | | | | | | | | | | | | |
Maryland CDA Series 2006-G (Housing Revenue) | | | 0.15 | % | | | 09/01/2040 | | | $ | 4,000,000 | | | $ | 4,000,000 | |
| | | | |
| | | | | | | | | | | | | | | 9,960,000 | |
| | | | | | | | | | | | | | | | |
| | | | |
Massachusetts: 0.21% | | | | | | | | | | | | | | | | |
| | | | |
| Other Municipal Debt: 0.06% | | | | | | | | | | | | | | | | |
Massachusetts Water Resources Authority Series 99 (Water & Sewer Revenue) | | | 0.27 | | | | 08/10/2011 | | | | 4,000,000 | | | | 4,000,000 | |
| | | | | | | | | | | | | | | | |
| | | | |
| Variable Rate Demand Notes§: 0.15% | | | | | | | | | | | | | | | | |
Massachusetts Department of Transportation Series A6 (Transportation Revenue, GO of Commonwealth Insured) | | | 0.07 | | | | 01/01/2029 | | | | 2,000,000 | | | | 2,000,000 | |
Massachusetts Development Finance Agency Babson College B (Education Revenue, Citizens Bank LOC) | | | 0.13 | | | | 10/01/2031 | | | | 2,385,000 | | | | 2,385,000 | |
Massachusetts HEFA (Education Revenue, Bank of America NA LOC) | | | 0.11 | | | | 10/01/2034 | | | | 1,990,000 | | | | 1,990,000 | |
Massachusetts HEFA Series N-3 (Health Revenue, JPMorgan Chase Bank LOC) | | | 0.04 | | | | 10/01/2038 | | | | 1,000,000 | | | | 1,000,000 | |
Massachusetts Water Resources Authority Series E (Water & Sewer Revenue, GO of Authority Insured) | | | 0.08 | | | | 08/01/2037 | | | | 2,810,000 | | | | 2,810,000 | |
| | | | |
| | | | | | | | | | | | | | | 10,185,000 | |
| | | | | | | | | | | | | | | | |
| | | | |
Michigan: 0.18% | | | | | | | | | | | | | | | | |
| | | | |
| Variable Rate Demand Notes§: 0.18% | | | | | | | | | | | | | | | | |
Michigan HEFAR Calvin College Project Series 2007A (Education Revenue, JPMorgan Chase Bank LOC) | | | 0.09 | | | | 09/01/2037 | | | | 7,000,000 | | | | 7,000,000 | |
Michigan Housing Development Authority Series A (Housing Revenue, GO of Authority Insured) | | | 0.21 | | | | 10/01/2037 | | | | 2,980,000 | | | | 2,980,000 | |
Wayne County MI IDA Rayonier Project Series 2000 (IDR, Bank of America NA LOC) | | | 0.14 | | | | 05/01/2020 | | | | 2,000,000 | | | | 2,000,000 | |
| | | | |
| | | | | | | | | | | | | | | 11,980,000 | |
| | | | | | | | | | | | | | | | |
| | | | |
Minnesota: 0.06% | | | | | | | | | | | | | | | | |
| | | | |
| Variable Rate Demand Note§: 0.06% | | | | | | | | | | | | | | | | |
Ramsey County MN Housing & Redevelopment MFHR Gateway Apartments LP Series A (Housing Revenue, LaSalle Bank NA LOC) | | | 0.15 | | | | 10/01/2038 | | | | 4,100,000 | | | | 4,100,000 | |
| | | | | | | | | | | | | | | | |
| | | | |
Mississippi: 0.39% | | | | | | | | | | | | | | | | |
| | | | |
| Variable Rate Demand Note§: 0.39% | | | | | | | | | | | | | | | | |
Mississippi GO Bonds Nissan North America Incorporated Project Series 2003A (GO-State, GO of Commonwealth Insured) | | | 0.13 | | | | 11/01/2028 | | | | 26,385,000 | | | | 26,383,952 | |
| | | | | | | | | | | | | | | | |
| | | | |
Missouri: 0.04% | | | | | | | | | | | | | | | | |
| | | | |
| Variable Rate Demand Note§: 0.04% | | | | | | | | | | | | | | | | |
Kansas City MO IDA Revenue Ewing Marion Kauffman Foundation (IDR) | | | 0.33 | | | | 04/01/2027 | | | | 3,000,000 | | | | 3,000,000 | |
| | | | | | | | | | | | | | | | |
| | | | |
Nebraska: 0.07% | | | | | | | | | | | | | | | | |
| | | | |
| Variable Rate Demand Note§: 0.07% | | | | | | | | | | | | | | | | |
Central Plains NE Nebraska Gas Project #2 Series 2009 (Utilities Revenue) | | | 0.08 | | | | 08/01/2039 | | | | 4,950,000 | | | | 4,950,000 | |
| | | | | | | | | | | | | | | | |
| | | | |
| 18 | | Wells Fargo Advantage Money Market Fund | | Portfolio of Investments—July 31, 2011 (Unaudited) |
| | | | | | | | | | | | | | | | |
| Security Name | | Interest Rate | | | Maturity Date | | | Principal | | | Value | |
| | | | | | | | | | | | | | | | |
| | | | |
Nevada: 0.27% | | | | | | | | | | | | | | | | |
| | | | |
| Variable Rate Demand Notes§: 0.27% | | | | | | | | | | | | | | | | |
Clark County NV IDA (IDR, JPMorgan Chase Bank LOC) | | | 0.09 | % | | | 03/01/2038 | | | $ | 6,000,000 | | | $ | 6,000,000 | |
Las Vegas NV EDFA Andre Agassi Foundation Project (Education Revenue, Bank of America NA LOC) | | | 0.09 | | | | 10/01/2035 | | | | 8,000,000 | | | | 8,000,000 | |
Las Vegas NV EDFA Keep Memory Alive Project (Miscellaneous Revenue, PNC Bank NA LOC) | | | 0.06 | | | | 05/01/2037 | | | | 4,000,000 | | | | 4,000,000 | |
| | | | |
| | | | | | | | | | | | | | | 18,000,000 | |
| | | | | | | | | | | | | | | | |
| | | | |
New Hampshire: 0.06% | | | | | | | | | | | | | | | | |
| | | | |
| Variable Rate Demand Note§: 0.06% | | | | | | | | | | | | | | | | |
New Hampshire HEFA St. Anselm College Series 2008 (Education Revenue, RBS Citizens NA LOC) | | | 0.07 | | | | 06/01/2038 | | | | 3,920,000 | | | | 3,920,000 | |
| | | | | | | | | | | | | | | | |
| | | | |
New Jersey: 0.55% | | | | | | | | | | | | | | | | |
| | | | |
| Variable Rate Demand Notes§: 0.55% | | | | | | | | | | | | | | | | |
New Jersey EDA NUI Corporation Project Series A (Energy Revenue, JPMorgan Chase Bank LOC) | | | 0.20 | | | | 06/01/2026 | | | | 5,000,000 | | | | 5,000,000 | |
New Jersey EDA Pivotal Utility Holdings Incorporated Project Series 2007 (Energy Revenue, JPMorgan Chase Bank LOC) | | | 0.20 | | | | 06/01/2032 | | | | 6,000,000 | | | | 6,000,000 | |
New Jersey HFFA Princeton Healthcare Series A (Hospital Revenue, Bank of America NA LOC) | | | 0.10 | | | | 07/01/2041 | | | | 1,000,000 | | | | 1,000,000 | |
New Jersey State Housing & Mortgage Finance Agency Series B (Housing Revenue, Bank of America NA LOC) | | | 0.10 | | | | 05/01/2048 | | | | 1,990,000 | | | | 1,990,000 | |
New Jersey State Turnpike Authority Series D (Miscellaneous Revenue, Societe Generale LOC, NATL-RE FGIC Insured) | | | 0.19 | | | | 01/01/2018 | | | | 10,000,000 | | | | 10,000,000 | |
Salem County NJ PCFA Atlantic City Electric Company Project Series A (Utilities Revenue, JPMorgan Chase Bank LOC) | | | 0.08 | | | | 04/15/2014 | | | | 13,200,000 | | | | 13,200,000 | |
| | | | |
| | | | | | | | | | | | | | | 37,190,000 | |
| | | | | | | | | | | | | | | | |
| | | | |
New York: 1.38% | | | | | | | | | | | | | | | | |
| | | | |
| Other Municipal Debt: 0.24% | | | | | | | | | | | | | | | | |
New York Metropolitan Transportation Authority (Transportation Revenue) | | | 0.19 | | | | 08/03/2011 | | | | 3,000,000 | | | | 3,000,000 | |
New York Metropolitan Transportation Authority (Transportation Revenue) | | | 0.19 | | | | 08/15/2011 | | | | 9,000,000 | | | | 9,000,000 | |
New York Metropolitan Transportation Authority (Transportation Revenue) | | | 0.27 | | | | 08/02/2011 | | | | 4,000,000 | | | | 4,000,000 | |
| | | | |
| | | | | | | | | | | | | | | 16,000,000 | |
| | | | | | | | | | | | | | | | |
| | | | |
| Variable Rate Demand Notes§: 1.14% | | | | | | | | | | | | | | | | |
Abraham Joshua Hesehal School NY Series 2010 (Education Revenue, TD Bank NA LOC) | | | 0.19 | | | | 01/01/2040 | | | | 3,710,000 | | | | 3,710,000 | |
Merrill Lynch PFOTER (Miscellaneous Revenue)†† | | | 0.34 | | | | 07/26/2012 | | | | 1,000,000 | | | | 1,000,000 | |
New York City NY Housing Development Corporation Multifamily Rental Housing The Balton Project Series A (Housing Revenue, Bank of America NA LOC, FHLMC Insured) | | | 0.06 | | | | 09/01/2049 | | | | 4,000,000 | | | | 4,000,000 | |
New York City NY Housing Development Corporation Series A (Housing Revenue, JPMorgan Chase Bank LOC) | | | 0.13 | | | | 01/01/2016 | | | | 1,600,000 | | | | 1,600,000 | |
New York City NY Subseries C-4 (GO-Local, Bank of Tokyo-Mitsubishi UFJ LOC) | | | 0.16 | | | | 08/01/2020 | | | | 12,000,000 | | | | 12,000,000 | |
New York City NY Transitional Financing Authority Class A (Miscellaneous Revenue, FSA-CR FGIC State Aid Withholding Insured) | | | 0.12 | | | | 07/15/2036 | | | | 13,300,000 | | | | 13,300,000 | |
New York HFA Victory Housing Project Series 2000-A (Housing Revenue, FHLMC Insured) | | | 0.05 | | | | 11/01/2033 | | | | 2,000,000 | | | | 2,000,000 | |
| | | | | | |
| Portfolio of Investments—July 31, 2011 (Unaudited) | | Wells Fargo Advantage Money Market Fund | | | 19 | |
| | | | | | | | | | | | | | | | |
| Security Name | | Interest Rate | | | Maturity Date | | | Principal | | | Value | |
| | | | | | | | | | | | | | | | |
| | | | |
| Variable Rate Demand Notes§ (continued) | | | | | | | | | | | | | | | | |
New York Housing Finance Agency Series A (Housing Revenue, FHLMC Insured) | | | 0.05 | % | | | 11/01/2037 | | | $ | 3,000,000 | | | $ | 3,000,000 | |
New York Housing Finance Agency Series A (Housing Revenue, FNMA Insured) | | | 0.18 | | | | 05/01/2029 | | | | 2,000,000 | | | | 2,000,000 | |
New York Housing Finance Agency Taxable 600 West 42nd B (Housing Revenue, Bank of New York LOC) | | | 0.28 | | | | 11/01/2041 | | | | 2,575,000 | | | | 2,575,000 | |
New York Housing Finance Agency Victory Housing Series 2004-A (Housing Revenue, FHLMC Insured) | | | 0.05 | | | | 11/01/2033 | | | | 10,400,000 | | | | 10,400,000 | |
New York Metropolitan Transportation Authority ROC RR 11 R-11645 (Transportation Revenue, FSA Insured)†† | | | 0.23 | | | | 11/15/2025 | | | | 4,830,000 | | | | 4,830,000 | |
New York NY Subseries B (GO-Local, TD Bank NA LOC) | | | 0.05 | | | | 09/01/2027 | | | | 2,000,000 | | | | 2,000,000 | |
New York PFOTER (Miscellaneous Revenue)†† | | | 0.34 | | | | 06/15/2053 | | | | 15,000,000 | | | | 15,000,000 | |
| | | | |
| | | | | | | | | | | | | | | 77,415,000 | |
| | | | | | | | | | | | | | | | |
| | | | |
Ohio: 0.24% | | | | | | | | | | | | | | | | |
| | | | |
| Variable Rate Demand Notes§: 0.24% | | | | | | | | | | | | | | | | |
Lake County OH Hospital Facilities Series A (Health Revenue, JPMorgan Chase Bank LOC) | | | 0.07 | | | | 08/15/2041 | | | | 4,975,000 | | | | 4,975,000 | |
Ohio HFA Residential Management Taxable Series I (Housing Revenue, GNMA/FNMA Insured) | | | 0.19 | | | | 09/01/2039 | | | | 7,239,000 | | | | 7,239,000 | |
Ohio State University Hospitals Health System Incorporated Project Series 2008D (Education Revenue, JPMorgan Chase Bank LOC) | | | 0.06 | | | | 01/15/2035 | | | | 4,000,000 | | | | 4,000,000 | |
| | | | |
| | | | | | | | | | | | | | | 16,214,000 | |
| | | | | | | | | | | | | | | | |
| | | | |
Oregon: 0.04% | | | | | | | | | | | | | | | | |
| | | | |
| Variable Rate Demand Note§: 0.04% | | | | | | | | | | | | | | | | |
Oregon Housing & Community Services Department Series E (Housing Revenue) | | | 0.19 | | | | 07/01/2038 | | | | 3,000,000 | | | | 3,000,000 | |
| | | | | | | | | | | | | | | | |
| | | | |
Pennsylvania: 0.27% | | | | | | | | | | | | | | | | |
| | | | |
| Variable Rate Demand Notes§: 0.27% | | | | | | | | | | | | | | | | |
Beaver County PA IDA FirstEnergy Nuclear Series B (IDR, Citibank NA LOC) | | | 0.06 | | | | 12/01/2035 | | | | 4,000,000 | | | | 4,000,000 | |
Doylestown PA Hospital Authority Series B (Health Revenue, PNC Bank NA LOC) | | | 0.06 | | | | 07/01/2037 | | | | 14,000,000 | | | | 14,000,000 | |
| | | | |
| | | | | | | | | | | | | | | 18,000,000 | |
| | | | | | | | | | | | | | | | |
| | | | |
South Carolina: 0.13% | | | | | | | | | | | | | | | | |
| | | | |
| Other Municipal Debt: 0.13% | | | | | | | | | | | | | | | | |
South Carolina Public Service Authority (Miscellaneous Revenue) | | | 0.18 | | | | 08/16/2011 | | | | 1,000,000 | | | | 1,000,000 | |
South Carolina Public Service Authority (Miscellaneous Revenue) | | | 0.23 | | | | 10/03/2011 | | | | 8,000,000 | | | | 8,000,000 | |
| | | | |
| | | | | | | | | | | | | | | 9,000,000 | |
| | | | | | | | | | | | | | | | |
| | | | |
South Dakota: 0.03% | | | | | | | | | | | | | | | | |
| | | | |
| Variable Rate Demand Note§: 0.03% | | | | | | | | | | | | | | | | |
South Dakota Housing Development Authority Series C (Housing Revenue, FNMA Insured) | | | 0.17 | | | | 05/01/2037 | | | | 2,000,000 | | | | 2,000,000 | |
| | | | | | | | | | | | | | | | |
| | | | |
Tennessee: 0.35% | | | | | | | | | | | | | | | | |
| | | | |
| Other Municipal Debt: 0.03% | | | | | | | | | | | | | | | | |
Montgomery County TN (GO-Local) | | | 0.24 | | | | 08/01/2011 | | | | 2,000,000 | | | | 2,000,000 | |
| | | | | | | | | | | | | | | | |
| | | | |
| 20 | | Wells Fargo Advantage Money Market Fund | | Portfolio of Investments—July 31, 2011 (Unaudited) |
| | | | | | | | | | | | | | | | |
| Security Name | | Interest Rate | | | Maturity Date | | | Principal | | | Value | |
| | | | | | | | | | | | | | | | |
| | | | |
| Variable Rate Demand Notes§: 0.32% | | | | | | | | | | | | | | | | |
Metropolitan Government Nashville & Davidson County TN Stewarts Ferry Apartments (Housing Revenue, FHLMC Insured) | | | 0.11 | % | | | 01/01/2034 | | | $ | 1,000,000 | | | $ | 1,000,000 | |
Metropolitan Government Nashville & Davidson County TN Weatherly Ridge Apartments Series A (Housing Revenue, U.S. Bank NA LOC) | | | 0.21 | | | | 12/01/2041 | | | | 2,000,000 | | | | 2,000,000 | |
Montgomery County TN Public Building Authority Pooled Financing Revenue (Miscellaneous Revenue, Bank of America NA LOC) | | | 0.24 | | | | 07/01/2034 | | | | 6,590,000 | | | | 6,590,000 | |
Montgomery County TN Public Building Authority Pooled Financing Revenue (Miscellaneous Revenue, Bank of America NA LOC) | | | 0.24 | | | | 02/01/2036 | | | | 3,420,000 | | | | 3,420,000 | |
Tennessee Municipal Energy Acquisition Corporation (Utilities Revenue) | | | 0.17 | | | | 12/01/2016 | | | | 9,065,000 | | | | 9,065,000 | |
| | | | |
| | | | | | | | | | | | | | | 22,075,000 | |
| | | | | | | | | | | | | | | | |
| | | | |
Texas: 1.55% | | | | | | | | | | | | | | | | |
| | | | |
| Other Municipal Debt: 0.04% | | | | | | | | | | | | | | | | |
Texas Municipal Power Agency (Utilities Revenue) | | | 0.30 | | | | 08/09/2011 | | | | 3,000,000 | | | | 3,000,000 | |
| | | | | | | | | | | | | | | | |
| | | | |
| Variable Rate Demand Notes§: 1.51% | | | | | | | | | | | | | | | | |
Austin TX Airport System Series A (Airport Revenue, State Street Bank & Trust Company LOC) | | | 0.08 | | | | 11/15/2017 | | | | 3,000,000 | | | | 3,000,000 | |
Bexar County TX Health Facilities (Health Revenue, JPMorgan Chase Bank LOC) | | | 0.10 | | | | 12/01/2032 | | | | 10,050,000 | | | | 10,050,000 | |
Harris County TX Cultural Education Facilities Finance Corporation Hermann Health Series A (Miscellaneous Revenue, JPMorgan Chase Bank LOC) | | | 0.20 | | | | 06/01/2038 | | | | 5,000,000 | | | | 5,000,000 | |
Harris County TX Cultural Education Facilities Finance Corporation Hermann Health Series D1 (Hospital Revenue, JPMorgan Chase Bank LOC) | | | 0.07 | | | | 06/01/2029 | | | | 7,000,000 | | | | 7,000,000 | |
Harris County TX Cultural Education Facilities Finance Corporation Hermann Health Series D2 (Health Revenue, JPMorgan Chase & Company LOC) | | | 0.07 | | | | 06/01/2029 | | | | 5,000,000 | | | | 5,000,000 | |
Houston TX Utilities System Series 2004B (Water & Sewer Revenue, State Street Bank & Trust Company LOC) | | | 0.05 | | | | 05/15/2034 | | | | 6,000,000 | | | | 6,000,000 | |
JPMorgan Chase PUTTER Trust Series 3812 (Miscellaneous Revenue)†† | | | 0.21 | | | | 08/31/2011 | | | | 40,000,000 | | | | 40,000,000 | |
Midlothian TX Industrial Development Corporation (IDR, UBS AG LOC) | | | 0.05 | | | | 08/01/2034 | | | | 10,000,000 | | | | 10,000,000 | |
Mission TX Economic Development Corporation (Miscellaneous Revenue, Bank of America NA LOC) | | | 0.13 | | | | 04/01/2022 | | | | 2,000,000 | | | | 2,000,000 | |
North Texas Higher Education Authority Series B (Education Revenue, Bank of America NA LOC, Guaranteed Student Loans Insured) | | | 0.07 | | | | 12/01/2035 | | | | 6,000,000 | | | | 6,000,000 | |
Texas State Taxable Product Development Program Series A (Miscellaneous Revenue) | | | 0.15 | | | | 06/01/2045 | | | | 4,480,000 | | | | 4,480,000 | |
Tyler TX Health Facilities Development Corporation Mother Frances Hospital Series B (Hospital Revenue, Bank of America NA LOC) | | | 0.18 | | | | 07/01/2020 | | | | 3,500,000 | | | | 3,500,000 | |
| | | | |
| | | | | | | | | | | | | | | 102,030,000 | |
| | | | | | | | | | | | | | | | |
| | | | |
Vermont: 0.19% | | | | | | | | | | | | | | | | |
| | | | |
| Variable Rate Demand Note§: 0.19% | | | | | | | | | | | | | | | | |
Vermont Student Assistance Corporation (Education Revenue, Lloyds Bank LOC) | | | 0.08 | | | | 12/15/2040 | | | | 12,875,000 | | | | 12,875,000 | |
| | | | | | | | | | | | | | | | |
| | | | | | |
| Portfolio of Investments—July 31, 2011 (Unaudited) | | Wells Fargo Advantage Money Market Fund | | | 21 | |
| | | | | | | | | | | | | | | | |
| Security Name | | Interest Rate | | | Maturity Date | | | Principal | | | Value | |
| | | | | | | | | | | | | | | | |
| | | | |
Virginia: 0.07% | | | | | | | | | | | | | | | | |
| | | | |
| Variable Rate Demand Notes§: 0.07% | | | | | | | | | | | | | | | | |
Harrisonburg VA Redevelopment & Housing Authority (Housing Revenue, Bank of America NA LOC) | | | 0.15 | % | | | 05/01/2026 | | | $ | 1,000,000 | | | $ | 1,000,000 | |
Norfolk VA Redevelopment & Housing Authority Old Dominion University Project (Housing Revenue, Bank of America NA LOC) | | | 0.26 | | | | 08/01/2033 | | | | 3,945,000 | | | | 3,945,000 | |
| | | | |
| | | | | | | | | | | | | | | 4,945,000 | |
| | | | | | | | | | | | | | | | |
| | | | |
Washington: 0.07% | | | | | | | | | | | | | | | | |
| | | | |
| Variable Rate Demand Note§: 0.07% | | | | | | | | | | | | | | | | |
Washington Housing Finance Commission Whisperwood Apartments Project Series A (Housing Revenue, FNMA Insured) | | | 0.11 | | | | 05/15/2035 | | | | 4,650,000 | | | | 4,650,000 | |
| | | | | | | | | | | | | | | | |
| | | | |
Wisconsin: 0.03% | | | | | | | | | | | | | | | | |
| | | | |
| Variable Rate Demand Note§: 0.03% | | | | | | | | | | | | | | | | |
Wisconsin Housing & EDA (Housing Revenue, FNMA LOC, GO of Authority Insured) | | | 0.08 | | | | 09/01/2035 | | | | 1,735,000 | | | | 1,735,000 | |
| | | | | | | | | | | | | | | | |
| | | | |
Wyoming: 0.16% | | | | | | | | | | | | | | | | |
| | | | |
| Variable Rate Demand Note§: 0.16% | | | | | | | | | | | | | | | | |
Sweetwater County WY Pacific Corporation Project Series A (Utilities Revenue, Barclays Bank plc LOC) | | | 0.06 | | | | 07/01/2015 | | | | 11,000,000 | | | | 11,000,000 | |
| | | | | | | | | | | | | | | | |
| | | | |
Total Municipal Bonds and Notes (Cost $802,788,792) | | | | | | | | | | | | | | | 802,788,792 | |
| | | | | | | | | | | | | | | | |
| | | | |
| Other Instruments: 1.56% | | | | | | | | | | | | | | | | |
Alaska Housing Finance Corporation Municipal Commercial Paper^ | | | 0.20 | | | | 08/16/2011 | | | | 1,000,000 | | | | 999,913 | |
Bank of America Bankers Acceptance Note^ | | | 0.20 | | | | 08/31/2011 | | | | 7,000,000 | | | | 6,998,775 | |
District of Columbia Varible Rate Demand Obligation Commercial Paper±§ | | | 0.26 | | | | 08/01/2011 | | | | 27,000,000 | | | | 27,000,000 | |
GBG LLC Custody Receipts††±§ | | | 0.33 | | | | 09/01/2027 | | | | 10,119,000 | | | | 10,119,000 | |
Illinois Educational Facilities Authority Series 1990 Varible Rate Demand Obligation Commercial Paper±§ | | | 0.18 | | | | 08/04/2011 | | | | 3,000,000 | | | | 3,000,000 | |
ING Bank NV Floating Rate Note††± | | | 0.78 | | | | 02/10/2012 | | | | 30,000,000 | | | | 30,000,000 | |
ING Bank NV Floating Rate Note††± | | | 0.78 | | | | 02/02/2012 | | | | 20,000,000 | | | | 20,000,000 | |
St. Joseph County IN Municipal Commercial Paper^ | | | 0.16 | | | | 08/18/2011 | | | | 4,000,000 | | | | 3,999,679 | |
St. Joseph County IN Municipal Commercial Paper^ | | | 0.16 | | | | 09/01/2011 | | | | 1,000,000 | | | | 999,854 | |
Trinity Health Corporation Municipal Commercial Paper^ | | | 0.21 | | | | 09/16/2011 | | | | 3,000,000 | | | | 2,999,195 | |
| | | | |
Total Other Instruments (Cost $106,116,416) | | | | | | | | | | | | | | | 106,116,416 | |
| | | | | | | | | | | | | | | | |
| | | | |
Other Notes: 5.72% | | | | | | | | | | | | | | | | |
| | | | |
| Corporate Bonds and Notes: 5.65% | | | | | | | | | | | | | | | | |
ACTS Retirement Life Communities Incorporated±§ | | | 0.21 | | | | 11/15/2029 | | | | 2,858,000 | | | | 2,858,000 | |
American Express Bank FSB± | | | 1.17 | | | | 12/09/2011 | | | | 45,000,000 | | | | 45,161,619 | |
Bank of America Corporation± | | | 0.95 | | | | 12/02/2011 | | | | 45,000,000 | | | | 45,120,889 | |
Bank of America Corporation± | | | 1.07 | | | | 12/02/2011 | | | | 100,000,000 | | | | 100,295,774 | |
Baptist Hospital Incorporated±§ | | | 0.13 | | | | 02/01/2040 | | | | 4,380,000 | | | | 4,380,000 | |
Bear Stearns & Companies Incorporated± | | | 0.47 | | | | 08/15/2011 | | | | 7,000,000 | | | | 7,000,407 | |
Citigroup Funding Incorporated± | | | 0.23 | | | | 11/15/2011 | | | | 1,000,000 | | | | 999,812 | |
Citigroup Funding Incorporated± | | | 0.58 | | | | 04/30/2012 | | | | 17,000,000 | | | | 17,049,641 | |
General Electric Capital Corporation± | | | 0.45 | | | | 03/12/2012 | | | | 18,000,000 | | | | 18,027,213 | |
General Electric Capital Corporation± | | | 1.18 | | | | 12/09/2011 | | | | 35,000,000 | | | | 35,123,618 | |
| | | | |
| 22 | | Wells Fargo Advantage Money Market Fund | | Portfolio of Investments—July 31, 2011 (Unaudited) |
| | | | | | | | | | | | | | | | |
| Security Name | | Interest Rate | | | Maturity Date | | | Principal | | | Value | |
| | | | | | | | | | | | | | | | |
| | | | |
| Corporate Bonds and Notes (continued) | | | | | | | | | | | | | | | | |
Independence Place Fort Campbell Patriots LLC§ | | | 0.24 | % | | | 01/01/2040 | | | $ | 2,355,000 | | | $ | 2,355,000 | |
JPMorgan Chase & Company± | | | 0.48 | | | | 06/15/2012 | | | | 6,000,000 | | | | 6,014,395 | |
JPMorgan Chase & Company± | | | 0.95 | | | | 12/02/2011 | | | | 50,000,000 | | | | 50,134,199 | |
LTF Real Estate LLC††§ | | | 0.23 | | | | 06/01/2033 | | | | 15,245,000 | | | | 15,245,000 | |
Morgan Stanley± | | | 1.10 | | | | 12/01/2011 | | | | 2,000,000 | | | | 2,006,081 | |
Seariver Maritime Incorporated(i)± | | | 0.35 | | | | 10/01/2011 | | | | 1,900,000 | | | | 1,900,000 | |
State Street Bank & Trust Company± | | | 0.45 | | | | 09/15/2011 | | | | 11,000,000 | | | | 11,003,473 | |
UBS AG± | | | 1.36 | | | | 02/23/2012 | | | | 16,000,000 | | | | 16,077,369 | |
US Central Federal Credit Union± | | | 0.25 | | | | 10/19/2011 | | | | 2,000,000 | | | | 2,000,144 | |
| | | | |
| | | | | | | | | | | | | | | 382,752,634 | |
| | | | | | | | | | | | | | | | |
| | | | |
| Yankee Corporate Bonds and Notes: 0.07% | | | | | | | | | | | | | | | | |
Eksportfinans ASA± | | | 0.26 | | | | 09/22/2011 | | | | 5,000,000 | | | | 5,000,000 | |
| | | | | | | | | | | | | | | | |
| | | | |
Total Other Notes (Cost $387,752,634) | | | | | | | | | | | | | | | 387,752,634 | |
| | | | | | | | | | | | | | | | |
| | | | |
| Repurchase Agreements(z): 1.39% | | | | | | | | | | | | | | | | |
Barclays Capital Incorporated, dated 07/29/2011, maturity value $25,976,348(1) | | | 0.17 | | | | 08/01/2011 | | | | 25,975,980 | | | | 25,975,980 | |
Citigroup Global Markets, dated 07/29/2011, maturity value $23,000,422(2) | | | 0.22 | | | | 08/01/2011 | | | | 23,000,000 | | | | 23,000,000 | |
Deutsche Bank Securities, dated 07/29/2011, maturity value $45,001,125(3) | | | 0.30 | | | | 08/01/2011 | | | | 45,000,000 | | | | 45,000,000 | |
| | | | |
Total Repurchase Agreements (Cost $93,975,980) | | | | | | | | | | | | | | | 93,975,980 | |
| | | | | | | | | | | | | | | | |
| | | | |
| | | Yield | | | | | | | | | | |
| | | | |
| Treasury Debt: 3.96% | | | | | | | | | | | | | | | | |
US Treasury Bill | | | 0.12 | | | | 10/06/2011 | | | | 91,000,000 | | | | 90,979,980 | |
US Treasury Bill | | | 0.15 | | | | 08/11/2011 | | | | 67,000,000 | | | | 66,996,856 | |
US Treasury Bill | | | 0.15 | | | | 08/25/2011 | | | | 55,000,000 | | | | 54,994,317 | |
US Treasury Bill | | | 0.16 | | | | 08/18/2011 | | | | 56,000,000 | | | | 55,995,637 | |
| | | | |
Total Treasury Debt (Cost $268,966,790) | | | | | | | | | | | | | | | 268,966,790 | |
| | | | | | | | | | | | | | | | |
| | | | | | | | |
| Total Investments in Securities | | | | | | | | |
| (Cost $6,354,580,185)* | | | 93.72 | % | | | 6,354,580,185 | |
Other Assets and Liabilities, Net | | | 6.28 | | | | 425,875,071 | |
| | | | | | | | |
| Total Net Assets | | | 100.00 | % | | $ | 6,780,455,256 | |
| | | | | | | | |
| †† | Security that may be resold to “qualified institutional buyers” under Rule 144A or securities offered pursuant to Section 4(2) of the Securities Act of 1933, as amended. |
| § | These securities are subject to a demand feature which reduces the effective maturity. |
| ± | Variable rate investments. |
| ^ | Zero coupon security. Rate represents yield to maturity. |
| | (1) | U.S. government securities, 3.50% to 5.00%, 11/1/2025 to 7/1/2041, market value including accrued interest is $26,755,259. |
| | (2) | U.S. government securities, 2.375% to 6.50%, 12/1/2017 to 7/1/2041, market value including accrued interest is $23,690,000. |
| | (3) | Commercial papers, 0.00%, 8/3/2011 to 10/20/2011, market value is $45,900,000. |
| * | Cost for federal income tax purposes is substantially the same as for financial reporting purposes. |
The accompanying notes are an integral part of these financial statements.
| | | | | | |
| Statement of Assets and Liabilities—July 31, 2011 (Unaudited) | | Wells Fargo Advantage Money Market Fund | | | 23 | |
| | | | |
| | | | |
| |
Assets | | | | |
Investments in unaffiliated securities, at amortized cost | | $ | 6,354,580,185 | |
Cash | | | 349,943,998 | |
Receivable for investments sold | | | 73,647,004 | |
Receivable for Fund shares sold | | | 6,234,062 | |
Receivable for interest | | | 1,158,001 | |
Receivable from adviser | | | 2,517,871 | |
Prepaid expenses and other assets | | | 200,797 | |
| | | | |
Total assets | | | 6,788,281,918 | |
| | | | |
| |
Liabilities | | | | |
Dividends payable | | | 29,296 | |
Payable for Fund shares redeemed | | | 2,386,070 | |
Distribution fees payable | | | 642,539 | |
Due to other related parties | | | 1,453,527 | |
Shareholder report expenses payable | | | 526,657 | |
Shareholder servicing fees payable | | | 1,440,423 | |
Trustees’ fees and expenses payable | | | 490,739 | |
Accrued expenses and other liabilities | | | 857,411 | |
| | | | |
Total liabilities | | | 7,826,662 | |
| | | | |
Total net assets | | $ | 6,780,455,256 | |
| | | | |
| |
NET ASSETS CONSIST OF | | | | |
Paid-in capital | | $ | 6,785,306,553 | |
Overdistributed net investment income | | | (482,582 | ) |
Accumulated net realized losses on investments | | | (4,368,715 | ) |
| | | | |
Total net assets | | $ | 6,780,455,256 | |
| | | | |
| |
COMPUTATION OF NET ASSET VALUE PRICE PER SHARE1 | | | | |
Net assets – Class A | | $ | 3,612,633,722 | |
Shares outstanding – Class A | | | 3,612,791,491 | |
Net asset value per share – Class A | | | $1.00 | |
Net assets – Class B | | $ | 457,613,499 | |
Shares outstanding – Class B | | | 457,629,036 | |
Net asset value per share – Class B | | | $1.00 | |
Net assets – Class C | | $ | 18,554,440 | |
Shares outstanding – Class C | | | 18,555,083 | |
Net asset value per share – Class C | | | $1.00 | |
Net assets – Daily Class | | $ | 1,517,528,434 | |
Shares outstanding – Daily Class | | | 1,517,589,168 | �� |
Net asset value per share – Daily Class | | | $1.00 | |
Net assets – Investor Class | | $ | 646,861,724 | |
Shares outstanding – Investor Class | | | 646,881,174 | |
Net asset value per share – Investor Class | | | $1.00 | |
Net assets – Service Class | | $ | 527,263,437 | |
Shares outstanding – Service Class | | | 527,282,208 | |
Net asset value per share – Service Class | | | $1.00 | |
| 1. | The Fund has an unlimited number of authorized shares. |
The accompanying notes are an integral part of these financial statements.
| | | | |
| 24 | | Wells Fargo Advantage Money Market Fund | | Statement of Operations—Six Months Ended July 31, 2011 (Unaudited) |
| | | | |
| | | | |
| |
Investment income | | | | |
Interest | | $ | 10,791,624 | |
| | | | |
| |
Expenses | | | | |
Advisory fee | | | 10,300,573 | |
Administration fees | | | | |
Fund level | | | 1,777,023 | |
Class A | | | 4,528,289 | |
Class B | | | 530,946 | |
Class C | | | 19,299 | |
Daily Class | | | 2,045,785 | |
Investor Class | | | 813,868 | |
Service Class | | | 310,585 | |
Shareholder servicing fees | | | | |
Class A | | | 4,965,286 | |
Class B | | | 588,471 | |
Class C | | | 14,553 | |
Daily Class | | | 2,324,756 | |
Investor Class | | | 809,039 | |
Service Class | | | 647,052 | |
Distribution fees | | | | |
Class B | | | 1,810,042 | |
Class C | | | 65,791 | |
Daily Class | | | 2,324,756 | |
Custody and accounting fees | | | 226,460 | |
Professional fees | | | 6,541 | |
Registration fees | | | 43,962 | |
Shareholder report expenses | | | 374,350 | |
Trustees’ fees and expenses | | | 7,075 | |
Other fees and expenses | | | 78,573 | |
| | | | |
Total expenses | | | 34,613,075 | |
Less: Fee waivers and/or expense reimbursements | | | (24,203,736 | ) |
| | | | |
Net expenses | | | 10,409,339 | |
| | | | |
Net investment income | | | 382,285 | |
Net realized gains on investments | | | 79,351 | |
| | | | |
Net increase in net assets resulting from operations | | $ | 461,636 | |
| | | | |
The accompanying notes are an integral part of these financial statements.
| | | | | | |
| Statements of Changes in Net Assets | | Wells Fargo Advantage Money Market Fund | | | 25 | |
| | | | | | | | | | | | | | | | | | | | | | | | |
| | | Six Months Ended January 31, 2011
(Unaudited) | | | Year Ended January 31, 20111 | | | Year Ended February 28, 2010 | |
| | | | | | |
Operations | | | | | | | | | | | | | | | | | | | | | | | | |
Net investment income | | | | | | $ | 382,285 | | | | | | | $ | 776,319 | | | | | | | $ | 4,175,816 | |
Net realized gains (losses) on investments | | | | | | | 79,351 | | | | | | | | (408,292 | ) | | | | | | | 207,089 | |
Net change in unrealized gains (losses) on investments | | | | | | | 0 | | | | | | | | 15,379,410 | | | | | | | | 19,484,069 | |
| | | | | | | | | | | | | | | | | | | | | | | | |
Net increase in net assets resulting from operations | | | | | | | 461,636 | | | | | | | | 15,747,437 | | | | | | | | 23,866,974 | |
| | | | | | | | | | | | | | | | | | | | | | | | |
| | | | | | |
Distributions to shareholders from | | | | | | | | | | | | | | | | | | | | | | | | |
Net investment income | | | | | | | | | | | | | | | | | | | | | | | | |
Class A | | | | | | | (205,840 | ) | | | | | | | (467,318 | ) | | | | | | | (3,393,805 | ) |
Class B | | | | | | | (24,135 | ) | | | | | | | (50,035 | ) | | | | | | | (80,042 | ) |
Class C | | | | | | | (877 | ) | | | | | | | (1,645 | )2 | | | | | | | NA | |
Daily Class | | | | | | | (92,994 | ) | | | | | | | (152,204 | )2 | | | | | | | NA | |
Investor Class | | | | | | | (32,556 | ) | | | | | | | (63,394 | ) | | | | | | | (701,288 | ) |
Service Class | | | | | | | (25,883 | ) | | | | | | | (41,723 | )2 | | | | | | | NA | |
| | | | | | | | | | | | | | | | | | | | | | | | |
Total distributions to shareholders | | | | | | | (382,285 | ) | | | | | | | (776,319 | ) | | | | | | | (4,175,135 | ) |
| | | | | | | | | | | | | | | | | | | | | | | | |
| | | Shares | | | | | | Shares | | | | | | Shares | | | | |
| | | | | | |
Capital share transactions | | | | | | | | | | | | | | | | | | | | | | | | |
Proceeds from shares sold | | | | | | | | | | | | | | | | | | | | | | | | |
Class A | | | 2,745,625,259 | | | | 2,745,625,259 | | | | 3,802,546,469 | | | | 3,802,546,469 | | | | 2,932,633,470 | | | | 2,932,633,470 | |
Class B | | | 307,446,989 | | | | 307,446,989 | | | | 824,615,875 | | | | 824,615,875 | | | | 928,457,413 | | | | 928,457,413 | |
Class C | | | 6,637,523 | | | | 6,637,523 | | | | 5,009,393 | 2 | | | 5,009,393 | 2 | | | NA | | | | NA | |
Daily Class | | | 3,672,463,294 | | | | 3,672,463,294 | | | | 8,494,124,953 | 2 | | | 8,494,124,953 | 2 | | | NA | | | | NA | |
Investor Class | | | 145,139,219 | | | | 145,139,219 | | | | 288,916,090 | | | | 288,916,090 | | | | 380,245,373 | | | | 380,245,373 | |
Service Class | | | 1,252,971,663 | | | | 1,252,971,663 | | | | 1,504,488,495 | 2 | | | 1,504,488,495 | 2 | | | NA | | | | NA | |
| | | | | | | | | | | | | | | | | | | | | | | | |
| | | | | | | 8,130,283,947 | | | | | | | | 14,919,701,275 | | | | | | | | 4,241,336,256 | |
| | | | | | | | | | | | | | | | | | | | | | | | |
Reinvestment of distributions | | | | | | | | | | | | | | | | | | | | | | | | |
Class A | | | 200,071 | | | | 200,071 | | | | 465,402 | | | | 465,402 | | | | 3,413,309 | | | | 3,413,309 | |
Class B | | | 23,850 | | | | 23,850 | | | | 50,825 | | | | 50,825 | | | | 81,382 | | | | 81,382 | |
Class C | | | 764 | | | | 764 | | | | 1,135 | 2 | | | 1,135 | 2 | | | NA | | | | NA | |
Daily Class | | | 61,510 | | | | 61,510 | | | | 87,251 | 2 | | | 87,251 | 2 | | | NA | | | | NA | |
Investor Class | | | 26,296 | | | | 26,296 | | | | 51,978 | | | | 51,978 | | | | 684,872 | | | | 684,872 | |
Service Class | | | 2,058 | | | | 2,058 | | | | 2,075 | 2 | | | 2,075 | 2 | | | NA | | | | NA | |
| | | | | | | | | | | | | | | | | | | | | | | | |
| | | | | | | 314,549 | | | | | | | | 658,666 | | | | | | | | 4,179,563 | |
| | | | | | | | | | | | | | | | | | | | | | | | |
Payment for shares redeemed | | | | | | | | | | | | | | | | | | | | | | | | |
Class A | | | (4,041,975,229 | ) | | | (4,041,975,229 | ) | | | (4,972,609,447 | ) | | | (4,972,609,447 | ) | | | (6,635,071,816 | ) | | | (6,635,071,816 | ) |
Class B | | | (392,557,259 | ) | | | (392,557,259 | ) | | | (953,063,137 | ) | | | (953,063,137 | ) | | | (1,537,359,752 | ) | | | (1,537,359,752 | ) |
Class C | | | (8,068,291 | ) | | | (8,068,291 | ) | | | (13,078,915 | )2 | | | (13,078,915 | )2 | | | NA | | | | NA | |
Daily Class | | | (4,253,006,092 | ) | | | (4,253,006,092 | ) | | | (8,686,289,762 | )2 | | | (8,686,289,762 | )2 | | | NA | | | | NA | |
Investor Class | | | (167,203,807 | ) | | | (167,203,807 | ) | | | (353,707,978 | ) | | | (353,707,978 | ) | | | (568,956,833 | ) | | | (568,956,833 | ) |
Service Class | | | (1,302,429,492 | ) | | | (1,302,429,492 | ) | | | (1,477,823,038 | )2 | | | (1,477,823,038 | )2 | | | NA | | | | NA | |
| | | | | | | | | | | | | | | | | | | | | | | | |
| | | | | | | (10,165,240,170 | ) | | | | | | | (16,456,572,277 | ) | | | | | | | (8,741,388,401 | ) |
| | | | | | | | | | | | | | | | | | | | | | | | |
Net asset value of shares issued in acquisitions | | | | | | | | | | | | | | | | | | | | | | | | |
Class A | | | 0 | | | | 0 | | | | 847,570,175 | | | | 847,772,251 | | | | 0 | | | | 0 | |
Class B | | | 0 | | | | 0 | | | | 41,175,793 | | | | 41,185,718 | | | | 0 | | | | 0 | |
Class C | | | 0 | | | | 0 | | | | 28,053,474 | | | | 28,057,477 | | | | NA | | | | NA | |
Daily Class | | | 0 | | | | 0 | | | | 2,290,148,014 | | | | 2,290,021,972 | | | | NA | | | | NA | |
Service Class | | | 0 | | | | 0 | | | | 550,070,447 | | | | 550,243,434 | | | | NA | | | | NA | |
| | | | | | | | | | | | | | | | | | | | | | | | |
| | | | | | | 0 | | | | | | | | 3,757,280,852 | | | | | | | | 0 | |
| | | | | | | | | | | | | | | | | | | | | | | | |
Net increase (decrease) in net assets resulting from capital share transactions | | | | | | | (2,034,641,674 | ) | | | | | | | 2,221,068,516 | | | | | | | | (4,495,872,582 | ) |
| | | | | | | | | | | | | | | | | | | | | | | | |
Total increase (decrease) in net assets | | | | | | | (2,034,562,323 | ) | | | | | | | 2,236,039,634 | | | | | | | | (4,476,180,743 | ) |
| | | | | | | | | | | | | | | | | | | | | | | | |
| | | | | | |
Net assets | | | | | | | | | | | | | | | | | | | | | | | | |
Beginning of period | | | | | | | 8,815,017,579 | | | | | | | | 6,578,977,945 | | | | | | | | 11,055,158,688 | |
| | | | | | | | | | | | | | | | | | | | | | | | |
End of period | | | | | | $ | 6,780,455,256 | | | | | | | $ | 8,815,017,579 | | | | | | | $ | 6,578,977,945 | |
| | | | | | | | | | | | | | | | | | | | | | | | |
Undistributed (overdistributed) net investment income | | | | | | $ | (482,582 | ) | | | | | | $ | (482,582 | ) | | | | | | $ | 680 | |
| | | | | | | | | | | | | | | | | | | | | | | | |
| 1. | For the eleven months ended January 31, 2011. The Fund changed its fiscal year end from February 28 to January 31, effective January 31, 2011. |
| 2. | Class commenced operations on June 30, 2010. |
The accompanying notes are an integral part of these financial statements.
| | | | |
| 26 | | Wells Fargo Advantage Money Market Fund | | Financial Highlights |
(For a share outstanding throughout each period)
| | | | | | | | | | | | | | | | | | | | | | | | | | | | |
| | | Six Months Ended
July 31, 2011
(Unaudited) | | | Year Ended
January 31,
20111 | | | Year Ended February 28, | |
| Class A | | | | 2010 | | | 2009 | | | 2008 | | | 2007 | | | 20062 | |
Net asset value, beginning of period | | $ | 1.00 | | | $ | 1.00 | | | $ | 1.00 | | | $ | 1.00 | | | $ | 1.00 | | | $ | 1.00 | | | $ | 1.00 | |
Net investment income | | | 0.00 | 3 | | | 0.00 | 3 | | | 0.00 | 3 | | | 0.02 | | | | 0.04 | | | | 0.04 | | | | 0.03 | |
Net realized and unrealized gains (losses)
on investments | | | 0.00 | 3 | | | 0.00 | 3 | | | 0.00 | 3 | | | 0.00 | | | | 0.00 | | | | 0.00 | | | | 0.00 | |
| | | | | | | | | | | | | | | | | | | | | | | | | | | | |
Total from investment operations | | | 0.00 | 3 | | | 0.00 | 3 | | | 0.00 | 3 | | | 0.02 | | | | 0.04 | | | | 0.04 | | | | 0.03 | |
Distributions to shareholders from | | | | | | | | | | | | | | | | | | | | | | | | | | | | |
Net investment income | | | (0.00 | )3 | | | (0.00 | )3 | | | (0.00 | )3 | | | (0.02 | ) | | | (0.04 | ) | | | (0.04 | ) | | | (0.03 | ) |
Net realized gains | | | 0.00 | | | | 0.00 | | | | 0.00 | | | | (0.00 | )3 | | | 0.00 | | | | 0.00 | | | | 0.00 | |
| | | | | | | | | | | | | | | | | | | | | | | | | | | | |
Total distributions to shareholders | | | (0.00 | )3 | | | (0.00 | )3 | | | (0.00 | )3 | | | (0.02 | ) | | | (0.04 | ) | | | (0.04 | ) | | | (0.03 | ) |
Net asset value, end of period | | $ | 1.00 | | | $ | 1.00 | | | $ | 1.00 | | | $ | 1.00 | | | $ | 1.00 | | | $ | 1.00 | | | $ | 1.00 | |
Total return4 | | | 0.00 | % | | | 0.01 | % | | | 0.04 | % | | | 1.74 | % | | | 4.48 | % | | | 4.54 | % | | | 2.69 | % |
Ratios to average net assets (annualized) | | | | | | | | | | | | | | | | | | | | | | | | | | | | |
Gross expenses | | | 0.80 | % | | | 0.79 | % | | | 0.88 | % | | | 0.83 | % | | | 0.81 | % | | | 0.82 | % | | | 0.83 | % |
Net expenses | | | 0.27 | % | | | 0.35 | % | | | 0.58 | % | | | 0.79 | % | | | 0.76 | % | | | 0.76 | % | | | 0.76 | % |
Net investment income | | | 0.01 | % | | | 0.01 | % | | | 0.05 | % | | | 1.75 | % | | | 4.37 | % | | | 4.46 | % | | | 2.96 | % |
Supplemental data | | | | | | | | | | | | | | | | | | | | | | | | | | | | |
Net assets, end of period (000’s omitted) | | | $3,612,634 | | | | $4,908,741 | | | | $5,218,601 | | | | $8,894,795 | | | | $11,659,129 | | | | $8,430,922 | | | | $6,580,685 | |
| 1. | For the eleven months ended January 31, 2011. The Fund changed its fiscal year end from February 28 to January 31, effective January 31, 2011. |
| 2. | For the eleven months ended February 28, 2006. The Fund changed its fiscal year end from March 31 to February 28, effective February 28, 2006. |
| 3. | Amount is less than $0.005. |
| 4. | Returns for periods of less than one year are not annualized. |
The accompanying notes are an integral part of these financial statements.
| | | | | | |
| Financial Highlights | | Wells Fargo Advantage Money Market Fund | | | 27 | |
(For a share outstanding throughout each period)
| | | | | | | | | | | | | | | | | | | | | | | | | | | | |
| | | Six Months Ended
July 31, 2011
(Unaudited) | | | Year Ended
January 31,
20111 | | | Year Ended February 28, | |
| Class B | | | | 2010 | | | 2009 | | | 2008 | | | 2007 | | | 20062 | |
Net asset value, beginning of period | | $ | 1.00 | | | $ | 1.00 | | | $ | 1.00 | | | $ | 1.00 | | | $ | 1.00 | | | $ | 1.00 | | | $ | 1.00 | |
Net investment income | | | 0.00 | 3 | | | 0.00 | 3 | | | 0.00 | 3 | | | 0.01 | | | | 0.04 | | | | 0.04 | | | | 0.02 | |
Net realized and unrealized gains (losses)
on investments | | | 0.00 | 3 | | | 0.00 | 3 | | | 0.00 | 3 | | | 0.00 | | | | 0.00 | | | | 0.00 | | | | 0.00 | |
| | | | | | | | | | | | | | | | | | | | | | | | | | | | |
Total from investment operations | | | 0.00 | 3 | | | 0.00 | 3 | | | 0.00 | 3 | | | 0.01 | | | | 0.04 | | | | 0.04 | | | | 0.02 | |
Distributions to shareholders from | | | | | | | | | | | | | | | | | | | | | | | | | | | | |
Net investment income | | | (0.00 | )3 | | | (0.00 | )3 | | | (0.00 | )3 | | | (0.01 | ) | | | (0.04 | ) | | | (0.04 | ) | | | (0.02 | ) |
Net realized gains | | | 0.00 | | | | 0.00 | | | | 0.00 | | | | (0.00 | )3 | | | 0.00 | | | | 0.00 | | | | 0.00 | |
| | | | | | | | | | | | | | | | | | | | | | | | | | | | |
Total distributions to shareholders | | | (0.00 | )3 | | | (0.00 | )3 | | | (0.00 | )3 | | | (0.01 | ) | | | (0.04 | ) | | | (0.04 | ) | | | (0.02 | ) |
Net asset value, end of period | | $ | 1.00 | | | $ | 1.00 | | | $ | 1.00 | | | $ | 1.00 | | | $ | 1.00 | | | $ | 1.00 | | | $ | 1.00 | |
Total return4 | | | 0.00 | % | | | 0.01 | % | | | 0.01 | % | | | 1.03 | % | | | 3.71 | % | | | 3.76 | % | | | 1.99 | % |
Ratios to average net assets (annualized) | | | | | | | | | | | | | | | | | | | | | | | | | | | | |
Gross expenses | | | 1.55 | % | | | 1.56 | % | | | 1.62 | % | | | 1.58 | % | | | 1.57 | % | | | 1.57 | % | | | 1.58 | % |
Net expenses | | | 0.27 | % | | | 0.35 | % | | | 0.62 | % | | | 1.49 | % | | | 1.51 | % | | | 1.51 | % | | | 1.51 | % |
Net investment income | | | 0.01 | % | | | 0.01 | % | | | 0.01 | % | | | 1.04 | % | | | 3.66 | % | | | 3.70 | % | | | 2.16 | % |
Supplemental data | | | | | | | | | | | | | | | | | | | | | | | | | | | | |
Net assets, end of period (000’s omitted) | | | $457,613 | | | | $542,695 | | | | $628,445 | | | | $1,238,714 | | | | $1,438,346 | | | | $1,431,103 | | | | $1,264,470 | |
| 1. | For the eleven months ended January 31, 2011. The Fund changed its fiscal year end from February 28 to January 31, effective January 31, 2011. |
| 2. | For the eleven months ended February 28, 2006. The Fund changed its fiscal year end from March 31 to February 28, effective February 28, 2006. |
| 3. | Amount is less than $0.005. |
| 4. | Total return calculations do not include any sales charges. Returns for periods of less than one year are not annualized. |
The accompanying notes are an integral part of these financial statements.
| | | | |
| 28 | | Wells Fargo Advantage Money Market Fund | | Financial Highlights |
(For a share outstanding throughout each period)
| | | | | | | | |
Class C | | Six Months Ended
July 31, 2011
(Unaudited) | | | Year Ended
January 31,
20111 | |
Net asset value, beginning of period | | $ | 1.00 | | | $ | 1.00 | |
Net investment income | | | 0.00 | 2 | | | 0.00 | 2 |
Net realized and unrealized gains (losses) on investments | | | 0.00 | 2 | | | 0.00 | 2 |
| | | | | | | | |
Total from investment operations | | | 0.00 | 2 | | | 0.00 | 2 |
Distributions to shareholders from | | | | | | | | |
Net investment income | | | (0.00 | )2 | | | (0.00 | )2 |
Net asset value, end of period | | $ | 1.00 | | | $ | 1.00 | |
Total return3 | | | 0.00 | % | | | 0.01 | % |
Ratios to average net assets (annualized) | | | | | | | | |
Gross expenses | | | 1.47 | % | | | 1.52 | % |
Net expenses | | | 0.27 | % | | | 0.36 | % |
Net investment income | | | 0.01 | % | | | 0.01 | % |
Supplemental data | | | | | | | | |
Net assets, end of period (000’s omitted) | | | $18,554 | | | | $19,984 | |
| 1. | For the period from June 30, 2010 (commencement of class operations) to January 31, 2011. |
| 2. | Amount is less than $0.005. |
| 3. | Total return calculations do not include any sales charges. Returns for periods of less than one year are not annualized. |
The accompanying notes are an integral part of these financial statements.
| | | | | | |
| Financial Highlights | | Wells Fargo Advantage Money Market Fund | | | 29 | |
(For a share outstanding throughout each period)
| | | | | | | | |
| Daily Class | | Six Months Ended
July 31, 2011
(Unaudited) | | | Year Ended
January 31,
20111 | |
Net asset value, beginning of period | | $ | 1.00 | | | $ | 1.00 | |
Net investment income | | | 0.00 | 2 | | | 0.00 | 2 |
Net realized and unrealized gains (losses) on investments | | | 0.00 | 2 | | | 0.00 | 2 |
| | | | | | | | |
Total from investment operations | | | 0.00 | 2 | | | 0.00 | 2 |
Distributions to shareholders from | | | | | | | | |
Net investment income | | | (0.00 | )2 | | | (0.00 | )2 |
Net asset value, end of period | | $ | 1.00 | | | $ | 1.00 | |
Total return3 | | | 0.00 | % | | | 0.01 | % |
Ratios to average net assets (annualized) | | | | | | | | |
Gross expenses | | | 1.06 | % | | | 1.04 | % |
Net expenses | | | 0.27 | % | | | 0.36 | % |
Net investment income | | | 0.01 | % | | | 0.01 | % |
Supplemental data | | | | | | | | |
Net assets, end of period (000’s omitted) | | | $1,517,528 | | | | $2,097,990 | |
| 1. | For the period from June 30, 2010 (commencement of class operations) to January 31, 2011. |
| 2. | Amount is less than $0.005. |
| 3. | Returns for periods of less than one year are not annualized. |
The accompanying notes are an integral part of these financial statements.
| | | | |
| 30 | | Wells Fargo Advantage Money Market Fund | | Financial Highlights |
(For a share outstanding throughout each period)
| | | | | | | | | | | | | | | | | | | | | | | | | | | | |
| | | Six Months Ended
July 31, 2011
(Unaudited) | | | Year Ended
January 31,
20111 | | | Year Ended February 28, | |
| Investor Class | | | | 2010 | | | 2009 | | | 2008 | | | 2007 | | | 20062 | |
Net asset value, beginning of period | | $ | 1.00 | | | $ | 1.00 | | | $ | 1.00 | | | $ | 1.00 | | | $ | 1.00 | | | $ | 1.00 | | | $ | 1.00 | |
Net investment income | | | 0.00 | 3 | | | 0.00 | 3 | | | 0.00 | 3 | | | 0.02 | | | | 0.05 | | | | 0.05 | | | | 0.03 | |
Net realized and unrealized gains (losses)
on investments | | | 0.00 | 3 | | | 0.00 | 3 | | | 0.00 | 3 | | | 0.00 | 3 | | | 0.00 | | | | 0.00 | | | | 0.00 | |
| | | | | | | | | | | | | | | | | | | | | | | | | | | | |
Total from investment operations | | | 0.00 | 3 | | | 0.00 | 3 | | | 0.00 | 3 | | | 0.02 | | | | 0.05 | | | | 0.05 | | | | 0.03 | |
Distributions to shareholders from | | | | | | | | | | | | | | | | | | | | | | | | | | | | |
Net investment income | | | (0.00 | )3 | | | (0.00 | )3 | | | (0.00 | )3 | | | (0.02 | ) | | | (0.05 | ) | | | (0.05 | ) | | | (0.03 | ) |
Net realized gains | | | 0.00 | | | | 0.00 | | | | 0.00 | | | | (0.00 | )3 | | | 0.00 | | | | 0.00 | | | | 0.00 | |
| | | | | | | | | | | | | | | | | | | | | | | | | | | | |
Total distributions to shareholders | | | (0.00 | )3 | | | (0.00 | )3 | | | (0.00 | )3 | | | (0.02 | ) | | | (0.05 | ) | | | (0.05 | ) | | | (0.03 | ) |
Net asset value, end of period | | $ | 1.00 | | | $ | 1.00 | | | $ | 1.00 | | | $ | 1.00 | | | $ | 1.00 | | | $ | 1.00 | | | $ | 1.00 | |
Total return4 | | | 0.00 | % | | | 0.01 | % | | | 0.08 | % | | | 1.85 | % | | | 4.60 | % | | | 4.65 | % | | | 2.74 | % |
Ratios to average net assets (annualized) | | | | | | | | | | | | | | | | | | | | | | | | | | | | |
Gross expenses | | | 0.83 | % | | | 0.84 | % | | | 0.92 | % | | | 0.90 | % | | | 0.94 | % | | | 0.99 | % | | | 1.00 | % |
Net expenses | | | 0.27 | % | | | 0.35 | % | | | 0.52 | % | | | 0.68 | % | | | 0.65 | % | | | 0.65 | % | | | 0.65 | % |
Net investment income | | | 0.01 | % | | | 0.01 | % | | | 0.08 | % | | | 1.82 | % | | | 4.50 | % | | | 4.56 | % | | | 3.02 | % |
Supplemental data | | | | | | | | | | | | | | | | | | | | | | | | | | | | |
Net assets, end of period (000’s omitted) | | | $646,862 | | | | $668,894 | | | | $731,932 | | | | $921,649 | | | | $926,851 | | | | $764,268 | | | | $700,278 | |
| 1. | For the eleven months ended January 31, 2011. The Fund changed its fiscal year end from February 28 to January 31, effective January 31, 2011. |
| 2. | For the eleven months ended February 28, 2006. The Fund changed its fiscal year end from March 31 to February 28, effective February 28, 2006. |
| 3. | Amount is less than $0.005. |
| 4. | Returns for periods of less than one year are not annualized. |
The accompanying notes are an integral part of these financial statements.
| | | | | | |
| Financial Highlights | | Wells Fargo Advantage Money Market Fund | | | 31 | |
(For a share outstanding throughout each period)
| | | | | | | | |
| Service class | | Six Months Ended
July 31, 2011
(Unaudited) | | | Year Ended
January 31,
20111 | |
Net asset value, beginning of period | | $ | 1.00 | | | $ | 1.00 | |
Net investment income | | | 0.00 | 2 | | | 0.00 | 2 |
Net realized and unrealized gains (losses) on investments | | | 0.00 | 2 | | | 0.00 | 2 |
| | | | | | | | |
Total from investment operations | | | 0.00 | 2 | | | 0.00 | 2 |
Distributions to shareholders from | | | | | | | | |
Net investment income | | | (0.00 | )2 | | | (0.00 | )2 |
Net asset value, end of period | | $ | 1.00 | | | $ | 1.00 | |
Total return3 | | | 0.00 | % | | | 0.01 | % |
Ratios to average net assets (annualized) | | | | | | | | |
Gross expenses | | | 0.71 | % | | | 0.69 | % |
Net expenses | | | 0.27 | % | | | 0.35 | % |
Net investment income | | | 0.01 | % | | | 0.01 | % |
Supplemental data | | | | | | | | |
Net assets, end of period (000’s omitted) | | | $527,263 | | | | $576,714 | |
| 1. | For the period from June 30, 2010 (commencement of class operations) to January 31, 2011. |
| 2. | Amount is less than $0.005. |
| 3. | Returns for periods of less than one year are not annualized. |
The accompanying notes are an integral part of these financial statements.
| | | | |
| 32 | | Wells Fargo Advantage Money Market Fund | | Notes to Financial Statements (Unaudited) |
1. ORGANIZATION
Wells Fargo Funds Trust (the “Trust”), a Delaware statutory trust organized on March 10, 1999, is an open-end management investment company registered under the Investment Company Act of 1940, as amended (the “1940 Act”). These financial statements report on Wells Fargo Advantage Money Market Fund (the “Fund”) which is a diversified series of the Trust.
2. SIGNIFICANT ACCOUNTING POLICIES
The following significant accounting policies, which are consistently followed in the preparation of the financial statements of the Fund, are in conformity with U.S. generally accepted accounting principles which require management to make estimates and assumptions that affect the reported amounts of assets and liabilities, disclosure of contingent assets and liabilities at the date of the financial statements, and the reported amounts of revenues and expenses during the reporting period. Actual results could differ from those estimates.
Securities valuation
As permitted under Rule 2a-7 of the 1940 Act, securities are valued at amortized cost, which approximates fair value.
The valuation techniques used by the Fund to measure fair value are consistent with the market approach, income approach and/or cost approach, where applicable, for each security type.
Repurchase agreements
The Fund may invest in repurchase agreements and may participate in pooled repurchase agreement transactions with other funds advised by Wells Fargo Funds Management, LLC. The repurchase agreements must be fully collateralized based on values that are marked-to-market daily. The collateral may be held by an agent bank under a tri-party agreement. It is the custodian’s responsibility to value collateral daily and to take action to obtain additional collateral as necessary to maintain market value equal to or greater than the resale price. The repurchase agreements are collateralized by instruments such as U.S. Treasury, federal agency, or high-grade corporate obligations. There could be potential loss to the Fund in the event that the Fund is delayed or prevented from exercising its rights to dispose of the collateral, including the risk of a possible decline in the value of the underlying obligations during the period in which the Fund seeks to assert its rights.
Security transactions and income recognition
Securities transactions are recorded on a trade date basis. Realized gains or losses are reported on the basis of identified cost of securities delivered.
Interest income is accrued daily and bond discounts are accreted and premiums are amortized daily based on the effective interest method. To the extent debt obligations are placed on non-accrual status, any related interest income may be reduced by writing off interest receivables when the collection of all or a portion of interest has become doubtful based on consistently applied procedures. If the issuer subsequently resumes interest payments or when the collectability of interest is reasonably assured, the debt obligation is removed from non-accrual status.
Distributions to shareholders
Distributions to shareholders from net investment income are accrued daily and paid monthly. Distributions from net realized gains, if any, are recorded on the ex-dividend date. Such distributions are determined in conformity with income tax regulations, which may differ from generally accepted accounting principles.
Federal and other taxes
The Fund intends to continue to qualify as a regulated investment company by distributing substantially all of its investment company taxable income and any net realized capital gains (after reduction for capital loss carryforwards) sufficient to relieve it from all, or substantially all, federal income taxes. Accordingly, no provision for federal income taxes was required.
The Fund’s income and federal excise tax returns and all financial records supporting those returns for the prior three fiscal years are subject to examination by the federal and Delaware revenue authorities.
As of January 31, 2011 the Fund had estimated net capital loss carryforwards, which were available to offset future net realized capital gains, in the amount of $4,448,060 with $4,039,774 expiring in 2017 and $408,286 expiring in 2019.
Under the recently enacted Regulated Investment Company Modernization Act of 2010, the Fund will be permitted to carry forward capital losses incurred in taxable years beginning after December 22, 2010 for an unlimited period. However, any
| | | | | | |
| Notes to Financial Statements (Unaudited) | | Wells Fargo Advantage Money Market Fund | | | 33 | |
losses incurred during those future taxable years will be required to be utilized prior to the losses incurred in pre-enactment taxable years. As a result of this ordering rule, pre-enactment capital loss carryforwards may be more likely to expire unused. Additionally, post-enactment capital losses that are carried forward will retain their character as either short-term or long-term capital losses rather than being considered all short-term as under previous law.
Class allocations
The separate classes of shares offered by the Fund differ principally in applicable sales charges, distribution, shareholder servicing and administration fees. Shareholders of each class bear certain expenses that pertain to that particular class. All shareholders bear the common expenses of the Fund, earn income from the portfolio, and are allocated unrealized gains and losses pro rata based on the average daily net assets of each class, without distinction between share classes. Dividends are determined separately for each class based on income and expenses allocable to each class. Realized gains and losses are allocated to each class pro rata based upon the net assets of each class on the date realized. Differences in per share dividend rates generally result from the relative weightings of pro rata income and realized gain allocations and from differences in separate class expenses, including distribution, shareholder servicing and administration fees.
3. FAIR VALUATION MEASUREMENTS
Fair value measurements of investments are determined within a framework that has established a fair value hierarchy based upon the various data inputs utilized in determining the value of the Fund’s investments. The three-level hierarchy gives the highest priority to unadjusted quoted prices in active markets for identical assets or liabilities (Level 1) and the lowest priority to unobservable inputs (Level 3). The Fund’s investments are classified within the fair value hierarchy based on the lowest level of input that is significant to the fair value measurement. The inputs are summarized into three broad levels as follows:
| n | | Level 1 – quoted prices in active markets for identical securities |
| n | | Level 2 – other significant observable inputs (including quoted prices for similar securities, interest rates, prepayment speeds, credit risk, etc.) |
| n | | Level 3 – significant unobservable inputs (including the Fund’s own assumptions in determining the fair value of investments) |
The inputs or methodologies used for valuing securities are not necessarily an indication of the risk associated with investing in those securities.
At July 31, 2011, all of the Fund’s investments in securities carried at fair value were designated as Level 2 since the primary inputs include credit quality of the issuer and short-term interest rates which are observable.
Further details on the major security types can be found in the Fund’s Portfolio of Investments.
4. TRANSACTIONS WITH AFFILIATES AND OTHER EXPENSES
Advisory fee
The Trust has entered into an advisory contract with Wells Fargo Funds Management, LLC (“Funds Management”), an indirect wholly owned subsidiary of Wells Fargo & Company (“Wells Fargo”). The adviser is responsible for implementing investment policies and guidelines and for supervising the sub-adviser, who is responsible for day-to-day portfolio management of the Fund.
Pursuant to the contract, Funds Management is entitled to receive an annual advisory fee starting at 0.30% and declining to 0.20% as the average daily net assets of the Fund increase. For the six months ended July 31, 2011, the advisory fee was equivalent to an annual rate of 0.27% of the Fund’s average daily net assets.
Funds Management may retain the services of certain sub-advisers to provide daily portfolio management to the Fund. The fees related to sub-advisory services are borne directly by the adviser and do not increase the overall fees paid by the Fund to the adviser. Wells Capital Management Incorporated, an affiliate of Funds Management, is the sub-adviser to the Fund and is entitled to receive a fee from the adviser at an annual rate starting at 0.05% and declining to 0.01% as the average daily net assets of the Fund increase.
Administration and transfer agent fees
The Trust has entered into an administration agreement with Funds Management. Under this agreement, for providing administrative services, which includes paying fees and expenses for services provided by the transfer agent, sub-transfer
| | | | |
| 34 | | Wells Fargo Advantage Money Market Fund | | Notes to Financial Statements (Unaudited) |
agents, omnibus account servicers and record-keepers, Funds Management is entitled to receive from the Fund an annual fund level administration fee starting at 0.05% and declining to 0.03% as the average daily net assets of the Fund increase and a class level administration fee which is calculated based on the average daily net assets of each class as follows:
| | | | |
| | | Class Level Administration Fee | |
Class A, Class B, Class C, Daily Class | | | 0.22 | % |
Investor Class | | | 0.25 | |
Service Class | | | 0.12 | |
Funds Management has contractually waived and/or reimbursed advisory and administration fees to the extent necessary to maintain certain net operating expense ratios for the Fund. Waiver of fees and/or reimbursement of expenses by Funds Management were made first from fund level expenses on a proportionate basis and then from class specific expenses.
Distribution fees
The Trust has adopted a Distribution Plan for Class B, Class C and Daily Class shares of the Fund pursuant to Rule 12b-1 under the 1940 Act. Distribution fees are charged to the Class B, Class C and Daily Class shares and paid to Wells Fargo Funds Distributor, LLC, the principal underwriter, at an annual rate of 0.75% of the average daily net assets of Class B and Class C shares and 0.25% of the average daily net assets of Daily Class shares.
For the six months ended July 31, 2011, Wells Fargo Funds Distributor, LLC received $5,313, $37,082 and $1,288 in contingent deferred sales charges from redemptions of Class A, Class B and Class C shares, respectively.
Shareholder servicing fees
The Trust has entered into contracts with one or more shareholder servicing agents, whereby each class of the Fund is charged a fee at an annual rate of 0.25% of the respective average daily net assets of each class.
A portion of these total shareholder servicing fees were paid to affiliates of Wells Fargo.
5. ACQUISITION
After the close of business on July 9, 2010, the Fund acquired the net assets of Evergreen Money Market Fund and Wells Fargo Advantage Overland Express Sweep Fund. The purpose of the transactions was to combine three funds with similar investment objectives and strategies. The acquisitions were accomplished by a tax-free exchange of all of the shares of Evergreen Money Market Fund and Wells Fargo Advantage Overland Express Sweep Fund at an exchange ratio of 1.00 for each class. Shareholders holding Class A, Class B, Class C, Class I and Class S shares of Evergreen Money Market Fund received Class A, Class B, Class C, Service Class and Daily Class shares, respectively, of the Fund in the reorganization. Existing shareholders of Wells Fargo Advantage Overland Express Sweep Fund received Daily Class shares of the Fund in the reorganization. The investment portfolio of Evergreen Money Market Fund and Wells Fargo Advantage Overland Express Sweep Fund with fair values of $2,358,958,301 and $1,410,238,573, respectively, and amortized costs of $2,358,958,301 and $1,410,238,573, respectively, at July 9, 2010, were the principal assets acquired by the Fund. For financial reporting purposes, assets received and shares issued by the Fund were recorded at fair value; however, the cost basis of the investments received from Evergreen Money Market Fund and Wells Fargo Advantage Overland Express Sweep Fund were carried forward to align ongoing reporting of the Fund’s realized and unrealized gains and losses with amounts distributable to shareholders for tax purposes. The value of net assets acquired and number of shares issued were as follows:
| | | | | | | | | | | | |
| Acquired Fund | | Value of Net
Assets Acquired | | | Number of Shares Issued | |
Evergreen Money Market Fund | | $ | 2,351,836,661 | | | | 847,570,175 | | | | Class A | |
| | | | | | | 41,175,793 | | | | Class B | |
| | | | | | | 28,053,474 | | | | Class C | |
| | | | | | | 884,677,740 | | | | Daily Class | |
| | | | | | | | 550,070,447 | | | | Service Class | |
Wells Fargo Advantage Overland Express Sweep Fund | | $ | 1,405,444,191 | | | | 1,405,470,274 | | | | Daily Class | |
| | | | | | |
| Notes to Financial Statements (Unaudited) | | Wells Fargo Advantage Money Market Fund | | | 35 | |
The aggregate net assets of the Fund immediately before and after the acquisitions were $5,906,118,088 and $9,663,398,940, respectively.
Assuming the acquisitions had been completed March 1, 2010, the beginning of the annual reporting period for the Fund, the pro forma results of operations for the period ended January 31, 2011 would have been:
| | | | |
Net investment income | | $ | 1,129,808 | |
Net realized gains on investments | | $ | 15,040,859 | |
Net increase in net assets resulting from operations | | $ | 16,170,667 | |
6. INDEMNIFICATION
Under the Trust’s organizational documents, the officers and directors are indemnified against certain liabilities that may arise out of performance of their duties to the Trust. Additionally, in the normal course of business, the Trust may enter into contracts with service providers that contain a variety of indemnification clauses. The Trust’s maximum exposure under these arrangements is dependent on future claims that may be made against the Fund and, therefore, cannot be estimated.
7. NEW ACCOUNTING PRONOUNCEMENTS
In May 2011, the Financial Accounting Standards Board (“FASB”) issued Accounting Standards Update (“ASU”) No. 2011-04 “Amendments to Achieve Common Fair Value Measurement and Disclosure Requirements in U.S. GAAP and IFRSs”. ASU No. 2011-04 amends FASB ASC Topic 820, Fair Value Measurements and Disclosures, to establish common requirements for measuring fair value and for disclosing information about fair value measurements in accordance with GAAP. The ASU is effective prospectively for interim and annual periods beginning after December 15, 2011.
In April 2011, FASB issued ASU No. 2011-03 “Reconsideration of Effective Control for Repurchase Agreements”. ASU No. 2011-03 amends FASB ASC Topic 860, Transfers and Servicing, specifically the criteria required to determine whether a repurchase agreement (repo) and similar agreements should be accounted for as sales of financial assets or secured borrowings with commitments. ASU No. 2011-03 changes the assessment of effective control by focusing on the transferor’s contractual rights and obligations and removing the criterion to assess its ability to exercise those rights or honor those obligations. This could result in changes to the way entities account for certain transactions including repurchase agreements, mortgage dollar rolls and reverse repurchase agreements. The ASU will become effective on a prospective basis for new transfers and modifications to existing transactions as of the beginning of the first interim or annual period beginning on or after December 15, 2011.
As of July 31, 2011, management of the Fund is currently assessing the potential impact, in addition to expanded financial statement disclosure, that may result from adopting these ASUs.
| | | | |
| 36 | | Wells Fargo Advantage Money Market Fund | | Other Information (Unaudited) |
PORTFOLIO HOLDINGS INFORMATION
The complete portfolio holdings for the Fund are publicly available on the Fund’s Web site (www.wellsfargo.com/advantagefunds) on a monthly, seven-day delayed basis. The Fund files its complete schedule of portfolio holdings with the SEC for the first and third quarters of each fiscal year on Form N-Q, which is available without charge by visiting the SEC Web site at www.sec.gov. In addition, the Fund’s Form N-Q may be reviewed and copied at the SEC’s Public Reference Room in Washington, DC, and at regional offices in New York City, at 233 Broadway, and in Chicago, at 175 West Jackson Boulevard, Suite 900. Information about the Public Reference Room may be obtained by calling 1-800-SEC-0330.
PROXY VOTING INFORMATION
A description of the policies and procedures that the Fund uses to determine how to vote proxies relating to portfolio securities is available without charge, upon request, by calling 1-800-222-8222, visiting our Web site at www.wellsfargo.com/advantagefunds, or visiting the SEC Web site at www.sec.gov. Information regarding how the Fund voted proxies relating to portfolio securities during the most recent 12-month period ended June 30 is available without charge on the Fund’s Web site at www.wellsfargo.com/advantagefunds or by visiting the SEC Web site at www.sec.gov.
| | | | | | |
| Other Information (Unaudited) | | Wells Fargo Advantage Money Market Fund | | | 37 | |
BOARD OF TRUSTEES
The following table provides basic information about the Board of Trustees (the “Trustees”) of the Trust and Officers of the Trust. This table should be read in conjunction with the Prospectus and the Statement of Additional Information1 of the Fund. Each of the Trustees and Officers listed below acts in identical capacities for the Wells Fargo Advantage family of funds, which consists of 144 funds comprising the Wells Fargo Funds Trust, Wells Fargo Variable Trust, Wells Fargo Master Trust and four closed-end funds (collectively the “Fund Complex”). All of the Trustees are also Members of the Audit and Governance Committees of each Trust in the Fund Complex. The mailing address of each Trustee and Officer is 525 Market Street, 12th Floor, San Francisco, CA 94105. Each Trustee and Officer serves an indefinite term, however, each Trustee serves such term until reaching the mandatory retirement age established by the Trustees.
Independent Trustees
| | | | | | |
Name and Year of Birth | | Position Held and Length of Service | | Principal Occupations During Past Five Years | | Other Directorships During
Past Five Years |
Peter G. Gordon
(Born 1942) | | Trustee, since 1998; Chairman, since 2005 | | Co-Founder, Chairman, President and CEO of Crystal Geyser. Water Company. Trustee Emeritus, Colby College | | Asset Allocation Trust |
Isaiah Harris, Jr.
(Born 1952) | | Trustee, since 2009 | | Retired. Prior thereto, President and CEO of BellSouth Advertising and Publishing Corp. from 2005 to 2007, President and CEO of BellSouth Enterprises from 2004 to 2005 and President of BellSouth Consumer Services from 2000 to 2003. Emeritus member of the Iowa State University Foundation Board of Governors. Emeritus Member of the Advisory Board of Iowa State University School of Business. Mr. Harris is a certified public accountant. | | CIGNA Corporation; Deluxe Corporation; Asset Allocation Trust |
Judith M. Johnson
(Born 1949) | | Trustee, since 2008 | | Retired. Prior thereto, Chief Executive Officer and Chief Investment Officer of Minneapolis Employees Retirement Fund from 1996 to 2008. Ms. Johnson is an attorney, certified public accountant and a certified managerial accountant. | | Asset Allocation Trust |
Leroy Keith, Jr.
(Born 1939) | | Trustee, since 2010 | | Chairman, Bloc Global Services (development and construction), Trustee of the Evergreen Funds from 1983 to 2010. Former Managing Director, Almanac Capital Management (commodities firm), former Partner, Stonington Partners, Inc. (private equity fund), former Director, Obagi Medical Products Co. and former Director, Lincoln Educational Services. | | Trustee, Virtus Fund Complex (consisting of 45 portfolios as of 12/31/10); Director, Diversapack Co. (packaging company); Asset Allocation Trust |
David F. Larcker
(Born 1950) | | Trustee, since 2009 | | James Irvin Miller Professor of Accounting at the Graduate School of Business, Stanford University, Director of Corporate Governance Research Program and Co-Director of The Rock Center for Corporate Governance since 2006. From 2005 to 2008, Professor of Accounting at the Graduate School of Business, Stanford University. Prior thereto, Ernst & Young Professor of Accounting at The Wharton School, University of Pennsylvania from 1985 to 2005. | | Asset Allocation Trust |
Olivia S. Mitchell
(Born 1953) | | Trustee, since 2006 | | International Foundation of Employee Benefit Plans Professor and Chair of the Department of Insurance and Risk Management, Wharton School of the University of Pennsylvania since 1993. Director of Wharton’s Pension Research Council and Boettner Center on Pensions & Retirement Research, and Research Associate at the National Bureau of Economic Research. Previously, Cornell University Professor from 1978 to 1993. | | Asset Allocation Trust |
| | | | |
| 38 | | Wells Fargo Advantage Money Market Fund | | Other Information (Unaudited) |
| | | | | | |
Name and Year of Birth | | Position Held and Length of Service | | Principal Occupations During Past Five Years | | Other Directorships During
Past Five Years |
Timothy J. Penny
(Born 1951) | | Trustee, since 1996 | | President and CEO of Southern Minnesota Initiative Foundation, a non-profit organization, since 2007 and Senior Fellow at the Humphrey Institute Policy Forum at the University of Minnesota since 1995. Member of the Board of Trustees of NorthStar Education Finance, Inc., a non-profit organization, since 2007. | | Asset Allocation Trust |
Michael S. Scofield
(Born 1943) | | Trustee, since 2010 | | Currently serves on the Investment Company Institute’s Board of Governors and Executive Committee as well the In dependent Director’s Counsel Board of Governors and Executive Committee. Former Chairman of the Independent Directors Counsel. Trustee of the Evergreen Funds from 1984 to 2010. Retired Attorney, Law Offices of Michael S. Scofield and former Director and Chairman, Branded Media Corporation (multi-media branding company). | | Asset Allocation Trust |
Donald C. Willeke
(Born 1940) | | Trustee, since 1996 | | Principal of the law firm of Willeke & Daniels. General Counsel of the Minneapolis Employees Retirement Fund from 1984 until its consolidation into the Minnesota Public Employees Retirement Association on June 30, 2010. | | Asset Allocation Trust |
Officers
| | | | | | |
Name and Year of Birth | | Position Held and
Length of Service | | Principal Occupations During Past Five Years | | |
Karla M. Rabusch
(Born 1959) | | President, since 2003 | | Executive Vice President of Wells Fargo Bank, N.A. and President of Wells Fargo Funds Management, LLC since 2003. Senior Vice President and Chief Administrative Officer of Wells Fargo Funds Management, LLC from 2001 to 2003. | | |
C. David Messman
(Born 1960) | | Secretary, since 2000; Chief Legal Counsel, since 2003 | | Senior Vice President and Secretary of Wells Fargo Funds Management, LLC since 2001. Vice President and Managing Counsel of Wells Fargo Bank, N.A. since 1996. | | |
Kasey Phillips
(Born 1970) | | Treasurer, since 2008 | | Senior Vice President of Wells Fargo Funds Management, LLC since 2009. Senior Vice President of Evergreen Investment Management Company, LLC from 2006 to 2010. Treasurer of the Evergreen Funds from 2005 to 2010. Vice President and Assistant Vice President of Evergreen Investment Services, Inc. from 1999 to 2006. | | |
David Berardi
(Born 1975) | | Assistant Treasurer, since 2009 | | Vice President of Wells Fargo Funds Management, LLC since 2009 . Vice President of Evergreen Investment Management Company, LLC from 2008 to 2010. Assistant Vice President of Evergreen Investment Services, Inc. from 2004 to 2008. Manager of Fund Reporting and Control for Evergreen Investment Management Company, LLC from 2004 to 2010. | | |
Jeremy DePalma
(Born 1974) | | Assistant Treasurer, since 2009 | | Senior Vice President of Wells Fargo Funds Management, LLC since 2009. Senior Vice President of Evergreen Investment Management Company, LLC from 2008 to 2010. Vice President, Evergreen Investment Services, Inc. from 2004 to 2007. Assistant Vice President, Evergreen Investment Services, Inc. from 2000 to 2004 and the head of the Fund Reporting and Control Team within Fund Administration from 2005 to 2010. | | |
Debra Ann Early
(Born 1964) | | Chief Compliance Officer, since 2007 | | Chief Compliance Officer of Wells Fargo Funds Management, LLC since 2007. Chief Compliance Officer of Parnassus Investments from 2005 to 2007. Chief Financial Officer of Parnassus Investments from 2004 to 2007 and Senior Audit Manager of PricewaterhouseCoopers LLP from 1998 to 2004. | | |
| 1. | The Statement of Additional Information includes additional information about the Fund’s Trustees and is available, without charge, upon request, by calling 1-800-222-8222 or by visiting the Fund’s Web site at www.wellsfargo.com/advantagefunds. |
| | | | | | |
| Other Information (Unaudited) | | Wells Fargo Advantage Money Market Fund | | | 39 | |
BOARD CONSIDERATION OF INVESTMENT ADVISORY AND SUB-ADVISORY AGREEMENTS:
100% Treasury Money Market Fund, Cash Investment Money Market Fund, Government Money Market Fund, Heritage Money Market Fund, Money Market Fund, Prime Investment Money Market Fund and Treasury Plus Money Market Fund
(Not all of the funds described in this Board considerations section are part of this shareholder report. This shareholder report only relates to Money Market Fund.)
Each year, as required by Section 15 of the Investment Company Act of 1940 (the “1940 Act”), the Board of Trustees (the “Board”) of Wells Fargo Funds Trust (the “Trust”), all the members of which have no direct or indirect interest in the investment advisory and sub-advisory agreements and are not “interested persons” of the Trust, as defined in the 1940 Act (the “Independent Trustees”), determines whether to approve the continuation of the Trust’s investment advisory and sub-advisory agreements. In this regard, at an in person meeting held on March 24-25, 2011 (the “Meeting”), the Board reviewed and re-approved: (i) an investment advisory agreement with Wells Fargo Funds Management, LLC (“Funds Management”) for each of the 100% Treasury Money Market Fund, Cash Investment Money Market Fund, Government Money Market Fund, Heritage Money Market Fund, Money Market Fund, Prime Investment Money Market Fund and Treasury Plus Money Market Fund (collectively, the “Funds”); and (ii) an investment sub-advisory agreement with Wells Capital Management Incorporated (“Wells Capital Management”) for each of the Funds. The investment advisory agreements with Funds Management and the investment sub-advisory agreements with Wells Capital Management are collectively referred to as the “Advisory Agreements.”
At the Meeting, the Board considered the factors and reached the conclusions described below relating to the selection of Funds Management and Wells Capital Management and continuation of the Advisory Agreements. Prior to the Meeting, the Trustees conferred extensively among themselves and with representatives of Funds Management about these matters. The Board also met throughout the year and received information that was useful to them in considering the continuation of the Advisory Agreements. The Independent Trustees were assisted in their evaluation of the Advisory Agreements by independent legal counsel, from whom they received separate legal advice and with whom they met separately from Funds Management.
Nature, extent and quality of services
The Board received and considered various information regarding the nature, extent and quality of services provided to the Funds by Funds Management and Wells Capital Management under the Advisory Agreements. The Board also received and considered information provided in response to a detailed set of requests submitted by the Independent Trustees’ independent legal counsel on their behalf. The Board received and considered, among other things, information about the background and experience of senior management of Funds Management, and the qualifications, backgrounds, tenures and responsibilities of the portfolio managers primarily responsible for the day-to-day portfolio management of the Funds.
The Board evaluated the ability of Funds Management and Wells Capital Management, based on their respective financial condition, resources, reputation and other attributes, to attract and retain qualified investment professionals, including research, advisory, and supervisory personnel. The Board further considered the compliance programs and compliance records of Funds Management and Wells Capital Management. In addition, the Board took into account the administrative services provided to the Funds by Funds Management and its affiliates.
The Board’s decision to approve the continuation of the Advisory Agreements was based on a comprehensive evaluation of all of the information provided to it. In approving the continuation of the Advisory Agreements, the Board did not identify any particular information or consideration that was all-important or controlling, and each Trustee attributed different weights to various factors. The Board evaluated information provided to it both in terms of the funds generally and with respect to each Fund specifically as it considered appropriate. Although the Board considered the continuation of the Advisory Agreements for each of the Funds as part of the larger process of considering the continuation of the advisory agreements for all of the funds, its decision to continue the Advisory Agreements for each of the Funds was ultimately made on a fund-by-fund basis.
In considering these matters, the Board considered not only the specific information presented in connection with the Meeting, but also the knowledge gained over time through interaction with Funds Management and Wells Capital Management about various topics, including Funds Management’s oversight of service providers. The above factors,
| | | | |
| 40 | | Wells Fargo Advantage Money Market Fund | | Other Information (Unaudited) |
together with those referenced below, are some of the most important, but not necessarily all, factors considered by the Board in concluding that it was satisfied with the nature, extent and quality of the investment advisory services provided to each Fund by Funds Management and Wells Capital Management.
Fund performance and expenses
The Board considered the performance results for each of the Funds over various time periods ended December 31, 2010. The Board also considered these results in comparison to the median performance of a universe of relevant funds (the “Universe”) that were determined by Lipper Inc. (“Lipper”) to be similar to the Funds, and in comparison to each Fund’s benchmark index and to other comparative data. Lipper is an independent provider of investment company data. The Board received a description of the methodology used by Lipper to select the mutual funds in the Universe.
The Board noted that the performance of each of the Funds was higher than or in range of the median performance of the Universe for the periods under review, except for the Money Market Fund (Class B).
The Board received and considered information regarding each Fund’s contractual advisory fee and net operating expense ratios and their various components, including actual management fees (which reflect fee waivers, if any), transfer agent, custodian and other non-management fees, Rule 12b-1 and non-Rule 12b-1 fees, service fees and fee waiver and expense reimbursement arrangements. The Board also considered these ratios in comparison to the median ratios of an expense Universe and a narrower expense group of mutual funds (each, an “Expense Group”) that was determined by Lipper to be similar to each Fund. The Board received a description of the methodology used by Lipper to select the mutual funds in a Fund’s Expense Group. The Board noted that the net operating expense ratios of the Service Class, Administrator Class, Institutional Class and Select Class of each of the Funds were in range of each Fund’s respective Expense Group’s median net operating expense ratio, except for the 100% Treasury Money Market Fund (Service Class). The Board also noted that the net operating expense ratios of the Class A and Sweep Class of each of the Funds, the Money Market Fund (A, B, C, Daily and Investor Classes) were higher than each Fund’s respective Expense Group’s median net operating expense ratio.
Based on the above-referenced considerations and other factors, the Board concluded that the overall performance and expense structure of the Funds supported the re-approval of the Advisory Agreements for the Funds.
Investment advisory and sub-advisory fee rates
The Board reviewed and considered the contractual investment advisory fee rates that are payable by the Funds to Funds Management for investment advisory services (the “Advisory Agreement Rates”), both on a stand-alone basis and on a combined basis with the Funds’ administration fee rates. The Board took into account the separate administrative and other services covered by the administration fee rates. The Board also reviewed and considered the contractual investment sub-advisory fee rates that are payable by Funds Management to Wells Capital Management for investment sub-advisory services (the “Sub-Advisory Agreement Rates”). In addition, the Board reviewed and considered the existing fee waiver/cap arrangements applicable to the Advisory Agreement Rates and considered the Advisory Agreement Rates after taking the waivers/caps into account (the “Net Advisory Rates”).
The Board received and considered information comparing the Advisory Agreement Rates and Net Advisory Rates with those of other funds in each Fund’s Expense Group median. The Board noted that the Advisory Agreement Rates for the Class A, Service Class, Administrator Class, Institutional Class and Select Class of each of the Funds were in range of each Fund’s respective Expense Group, except for the 100% Treasury Money Market Fund (Administrator Class). The Board noted that the Advisory Agreement Rates for the Sweep Class of each of the Funds was not appreciably higher than the median rate of each Fund’s Expense Group, except for the 100% Treasury Money Market Fund. The Board also noted that the Advisory Agreement Rates for the Money Market Fund (Class B, Class C, Daily Class and Investor Class) were higher than the median rate of the Expense Group. The Board noted that the Net Advisory Rates for the Service Class, Administrator Class, Institutional Class and Select Class of each of the Funds were in range of each Fund’s respective Expense Group. The Board also noted that the Net Advisory Rates for the Class A and Sweep Class of each of the Funds and the Money Market Fund (Class B, Class C, Daily Class and Investor Class) were higher than each Fund’s respective Expense Group. The Board further noted that Funds Management had agreed to continue and, in certain instances, reduce contractual fee cap arrangements for the Funds designed to lower the Funds’ expenses.
The Board also received and considered information about the nature and extent of services offered and fee rates charged by Funds Management and Wells Capital Management to other types of clients. In this regard, the Board
| | | | | | |
| Other Information (Unaudited) | | Wells Fargo Advantage Money Market Fund | | | 41 | |
received information about differences between the services, and the compliance, reporting, and other legal burdens and risks of providing investment advice to mutual funds and those associated with providing advice to non-mutual fund clients such as collective funds or institutional separate accounts.
In each case, the Board determined that the Advisory Agreement Rates for the Funds, both with and without administration fee rates and before and after waivers, were acceptable in light of the Funds’ Expense Group information, the net expense ratio commitments, the services covered by the Advisory Agreements and other information provided. The Board also reviewed and considered the Sub-Advisory Agreement Rates and concluded that the Sub-Advisory Agreement Rates were acceptable in light of the services covered by the Sub-Advisory Agreement and other information provided.
Profitability
The Board received and considered a profitability analysis of Funds Management, as well as an analysis of the profitability to the collective Wells Fargo businesses that provide services to the Funds. It considered that the information provided to it was necessarily estimated, and that the profitability information provided to it, especially on a fund-by-fund basis, did not necessarily provide a precise tool for evaluating the appropriateness of each Fund’s Advisory Agreement Rates in isolation. It noted that the levels of profitability of the Funds to Funds Management varied widely, depending on, among other things, the size and type of fund. The Board concluded that the profitability to Funds Management of the services provided to any of the Funds, individually or in the aggregate, was not unreasonable.
The Board did not consider separate profitability information with respect to Wells Capital Management, because, as an affiliate of Funds Management, its profitability information was subsumed in the collective Wells Fargo profitability analysis provided by Funds Management.
Economies of scale
With respect to possible economies of scale, the Board reviewed the breakpoints in each Fund’s advisory fee structure, which operate generally to reduce the effective Advisory Agreement Rates of the Funds (as a percentage of Fund assets) as the Funds grow in size. It considered that, as a fund shrinks in size, breakpoints conversely result in increasing fee levels. The Board noted that it would continue to review the appropriate levels of breakpoints in the future, and concluded that the breakpoints as implemented appeared to be a reasonable step toward sharing economies of scale with the Funds. However, the Board acknowledged the inherent limitations of any analysis of an investment adviser’s economies of scale and of any attempt to correlate breakpoints with such economies, stemming largely from the Board’s understanding that economies of scale are realized, if at all, by an investment adviser across a variety of products and services, not just with respect to a single fund.
Other benefits to Funds Management and Wells Capital Management
The Board received and considered information regarding potential “fall-out” or ancillary benefits received by Funds Management and its affiliates, including Wells Capital Management, as a result of their relationship with the Funds. Ancillary benefits could include, among others, benefits directly attributable to the relationship of Funds Management and Wells Capital Management with the Funds and benefits potentially derived from an increase in Funds Management’s and Wells Capital Management’s business as a result of their relationship with the Funds (such as the ability to market to shareholders other financial products offered by Funds Management and its affiliates, including Wells Capital Management).
The Board considered that Wells Fargo Funds Distributor, LLC, an affiliate of Funds Management, serves as distributor to the Funds and receives certain compensation for those services. The Board noted that the Funds pay sub-transfer agency fees to various financial institutions, including affiliates of Funds Management that hold fund shares in omnibus accounts. It also considered that these entities may receive distribution-related fees and shareholder servicing payments (including amounts derived from payments under the funds’ Rule 12b-1 plans) in respect of shares sold or held through them.
The Board also reviewed information about whether and to what extent soft dollar credits are sought and how any such credits are utilized and any benefits that may be realized by using an affiliated broker.
| | | | |
| 42 | | Wells Fargo Advantage Money Market Fund | | Other Information (Unaudited) |
Other factors and broader review
The Board also considered the markets for distribution of the Funds’ shares, including the multiple channels through which the Funds’ shares are offered and sold. The Board noted that the Funds are part of one of the few fund families that have both direct-to-fund and intermediary distribution channels. As discussed above, the Board reviews detailed materials received from Funds Management and Wells Capital Management annually as part of the re-approval process under Section 15 of the 1940 Act and also reviews and assesses information about the quality of the services that the Funds receive throughout the year. In this regard, the Board has reviewed reports of Funds Management at each of its quarterly meetings, which include, among other things, portfolio reviews and performance reports. In addition, the Board confers with portfolio managers at various times throughout the year.
Conclusion
After considering the above-described factors and based on its deliberations and its evaluation of the information described above, the Board concluded that approval of the continuation of the Advisory Agreements for the Funds was in the best interest of the Funds and their shareholders. Accordingly, the Board unanimously approved the continuation of the Advisory Agreements for an additional one-year period.
| | | | | | |
| List of Abbreviations | | Wells Fargo Advantage Money Market Fund | | | 43 | |
The following is a list of common abbreviations for terms and entities which may have appeared in this report.
| ABAG | — Association of Bay Area Governments |
| ACB | — Agricultural Credit Bank |
| ADR | — American Depositary Receipt |
| ADS | — American Depository Shares |
| AGC-ICC | — Assured Guaranty Corporation - Insured Custody Certificates |
| AGM | — Assured Guaranty Municipal |
| AMBAC | — American Municipal Bond Assurance Corporation |
| AMT | — Alternative Minimum Tax |
| ARM | — Adjustable Rate Mortgages |
| BAN | — Bond Anticipation Notes |
| BART | — Bay Area Rapid Transit |
| BHAC | — Berkshire Hathaway Assurance Corporation |
| CCAB | — Convertible Capital Appreciation Bond |
| CDA | — Community Development Authority |
| CDO | — Collateralized Debt Obligation |
| CDSC | — Contingent Deferred Sales Charge |
| CGIC | — Capital Guaranty Insurance Company |
| CGY | — Capital Guaranty Corporation |
| CIFG | — CDC (Caisse des Dépôts et Consignations) IX IS Financial Guarantee |
| COP | — Certificate of Participation |
| DRIVER | — Derivative Inverse Tax-Exempt Receipts |
| DW&P | — Department of Water & Power |
| DWR | — Department of Water Resources |
| ECFA | — Educational & Cultural Facilities Authority |
| EDA | — Economic Development Authority |
| EDFA | — Economic Development Finance Authority |
| ETET | — Eagle Tax-Exempt Trust |
| ETF | — Exchange-Traded Fund |
| FFCB | — Federal Farm Credit Bank |
| FGIC | — Financial Guaranty Insurance Corporation |
| FHA | — Federal Housing Authority |
| FHAG | — Federal Housing Agency |
| FHLB | — Federal Home Loan Bank |
| FHLMC | — Federal Home Loan Mortgage Corporation |
| FNMA | — Federal National Mortgage Association |
| GDR | — Global Depositary Receipt |
| GNMA | — Government National Mortgage Association |
| HCFR | — Healthcare Facilities Revenue |
| HEFA | — Health & Educational Facilities Authority |
| HEFAR | — Higher Education Facilities Authority Revenue |
| HFA | — Housing Finance Authority |
| HFFA | — Health Facilities Financing Authority |
| HUD | — Housing & Urban Development |
| IBC | — Insured Bond Certificate |
| IDA | — Industrial Development Authority |
| IDAG | — Industrial Development Agency |
| IDR | — Industrial Development Revenue |
| KRW | — Republic of Korea Won |
| LIBOR | — London Interbank Offered Rate |
| LLC | — Limited Liability Company |
| LLP | — Limited Liability Partnership |
| MBIA | — Municipal Bond Insurance Association |
| MFHR | — Multi-Family Housing Revenue |
| MFMR | — Multi-Family Mortgage Revenue |
| MMD | — Municipal Market Data |
| MSTR | — Municipal Securities Trust Receipts |
| MUD | — Municipal Utility District |
| NATL-RE | — National Public Finance Guarantee Corporation |
| PCFA | — Pollution Control Finance Authority |
| PCR | — Pollution Control Revenue |
| PFA | — Public Finance Authority |
| PFFA | — Public Facilities Financing Authority |
| PFOTER | — Puttable Floating Option Tax-Exempt Receipts |
| plc | — Public Limited Company |
| PSFG | — Public School Fund Guaranty |
| PUTTER | — Puttable Tax-Exempt Receipts |
| R&D | — Research & Development |
| RDA | — Redevelopment Authority |
| RDFA | — Redevelopment Finance Authority |
| REIT | — Real Estate Investment Trust |
| RIB | — Residual Interest Bond |
| ROC | — Reset Option Certificates |
| SAVRS | — Select Auction Variable Rate Securities |
| SFHR | — Single Family Housing Revenue |
| SFMR | — Single Family Mortgage Revenue |
| SLMA | — Student Loan Marketing Association |
| SPDR | — Standard & Poor’s Depositary Receipts |
| STIT | — Short-Term Investment Trust |
| TAN | — Tax Anticipation Notes |
| TIPS | — Treasury Inflation-Protected Securities |
| TRAN | — Tax Revenue Anticipation Notes |
| TCR | — Transferable Custody Receipts |
| TTFA | — Transportation Trust Fund Authority |
| USD | — Unified School District |
| XLCA | — XL Capital Assurance |
This page is intentionally left blank.
This page is intentionally left blank.
This page is intentionally left blank.


FOR MORE INFORMATION
More information about Wells Fargo Advantage Funds is available free upon request. To obtain literature, please write, e-mail, visit the Funds’ Web site, or call:
Wells Fargo Advantage Funds
P.O. Box 8266
Boston, MA 02266-8266
E-mail: wfaf@wellsfargo.com
Web site: www.wellsfargo.com/advantagefunds
Individual investors: 1-800-222-8222
Retail investment professionals: 1-888-877-9275
Institutional investment professionals: 1-866-765-0778
This report and the financial statements contained herein are submitted for the general information of the shareholders of Wells Fargo Advantage Funds. If this report is used for promotional purposes, distribution of the report must be accompanied or preceded by a current prospectus. For a prospectus containing more complete information, including charges and expenses, call 1-800-222-8222 or visit the Funds’ Web site at www.wellsfargo.com/advantagefunds. Please consider the investment objectives, risks, charges, and expenses of the investment carefully before investing. This and other information about Wells Fargo Advantage Funds can be found in the current prospectus. Read the prospectus carefully before you invest or send money.
Wells Fargo Funds Management, LLC, a wholly owned subsidiary of Wells Fargo & Company, provides investment advisory and administrative services for Wells Fargo Advantage Funds. Other affiliates of Wells Fargo & Company provide subadvisory and other services for the Funds. The Funds are distributed by Wells Fargo Funds Distributor, LLC, Member FINRA/SIPC, an affiliate of Wells Fargo & Company.
NOT FDIC INSURED ¡ NO BANK GUARANTEE ¡ MAY LOSE VALUE
© 2011 Wells Fargo Funds Management, LLC. All rights reserved.
| | |
 | | 204802 09-11 SA306/SAR306 7-11 |

Wells Fargo Advantage
Municipal Cash Management Money Market Fund

Semi-Annual Report
July 31, 2011

Reduce clutter. Save trees.
Sign up for electronic delivery of prospectuses and shareholder reports at www.wellsfargo.com/advantagedelivery
Contents
The views expressed and any forward-looking statements are as of July 31, 2011, unless otherwise noted and are those of the Fund managers and/or Wells Fargo Funds Management, LLC. Discussions of individual securities, or the markets generally, or any Wells Fargo Advantage Fund are not intended as individual recommendations. Future events or results may vary significantly from those expressed in any forward-looking statements; the views expressed are subject to change at any time in response to changing circumstances in the market. Wells Fargo Funds Management, LLC, disclaims any obligation to publicly update or revise any views expressed or forward-looking statements.
NOT FDIC INSURED ¡ NO BANK GUARANTEE ¡ MAY LOSE VALUE

WELLS FARGO INVESTMENT HISTORY
| | |
| |
| 1932 | | Keystone creates one of the first mutual fund families. |
| |
| 1971 | | Wells Fargo & Company introduces one of the first institutional index funds. |
| |
| 1978 | | Wells Fargo applies Markowitz and Sharpe’s research on Modern Portfolio Theory to introduce one of the industry’s first Tactical Asset Allocation (TAA) models in institutional separately managed accounts. |
| |
| 1984 | | Wells Fargo Stagecoach Funds launches its first asset allocation fund. |
| |
| 1989 | | The Tactical Asset Allocation (TAA) Model is first applied to Wells Fargo’s asset allocation mutual funds. |
| |
| 1994 | | Wells Fargo introduces the LifePath Funds, one of the first suites of target date funds (now the Wells Fargo Advantage Dow Jones Target Date FundsSM ). |
| |
| 1996 | | Evergreen Investments and Keystone Funds merge. |
| |
| 1997 | | Wells Fargo launches Wells Fargo Advantage WealthBuilder PortfoliosSM, a fund-of-funds suite of products that includes the use of quantitative models to shift assets among investment styles. |
| |
| 1999 | | Norwest Advantage Funds and Stagecoach Funds are reorganized into Wells Fargo Funds after the merger of Norwest and Wells Fargo. |
| |
| 2002 | | Evergreen Retail and Evergreen Institutional companies form the umbrella asset management company, Evergreen Investments. |
| |
| 2005 | | The integration of Strong Funds with Wells Fargo Funds creates Wells Fargo Advantage Funds, resulting in one of the top 20 mutual fund companies in the United States. |
| |
| 2006 | | Wells Fargo Advantage Funds relaunches the target date product line as Wells Fargo Advantage Dow Jones Target Date Funds. |
| |
| 2010 | | The mergers and reorganizations of Evergreen and Wells Fargo Advantage mutual funds are completed, unifying the families under the brand of Wells Fargo Advantage Funds. |
Wells Fargo Advantage Funds®
Wells Fargo Advantage Funds skillfully guides institutions, financial advisors, and individuals through the investment terrain to help them reach their financial objectives. Everything we do on behalf of investors is backed by our unique combination of qualifications.
Strength
Our organization is built on the standards of integrity and service established by our parent company—Wells Fargo & Company—more than 150 years ago. And, because we’re part of a highly diversified financial enterprise, we offer the depth of resources to help investors succeed.
Expertise
Our multi-boutique model offers investors access to the independent thinking of premier investment managers that have been chosen for their time-tested strategies. While each team specializes in a specific investment strategy, collectively they provide investors a wide choice of distinct investment styles. Our dedication to investment excellence doesn’t end with our expertise in manager selection—risk management, analysis, and rigorous ongoing review seek to ensure each manager’s investment process remains consistent.
Partnership
Our collaborative approach is built around understanding the needs and goals of our clients. By adhering to core principles of sound judgment and steady guidance, we support you through every stage of the investment decision process.
Carefully consider the investment objectives, risks, charges, and expenses before investing. For a current prospectus for Wells Fargo Advantage Funds containing this and other information, visit wellsfargo.com/advantagefunds. Read it carefully before investing.
Wells Fargo Funds Management, LLC, a wholly owned subsidiary of Wells Fargo & Company, provides investment advisory and administrative services for Wells Fargo Advantage Funds®. Other affiliates of Wells Fargo & Company provide subadvisory and other services for the Funds. The Funds are distributed by Wells Fargo Funds Distributor, LLC, Member FINRA/SIPC, an affiliate of Wells Fargo & Company.
The “Dow Jones Target Date Indexes” are a product of Dow Jones Indexes, a licensed trademark of CME Group Index Services LLC (“CME”). “Dow Jones” and “Dow Jones Target Date Indexes” are service marks of Dow Jones Trademark Holdings, LLC, and have been licensed for use for certain purposes by CME and sublicensed for use by Global Index Advisors, Inc., and Wells Fargo Funds Management, LLC. The Dow Jones Target Date Indexes are based in part on the Barclays Capital Bond Indexes, which are published by Barclays Capital Inc. The Wells Fargo Advantage Dow Jones Target Date Funds, based on the Dow Jones Target Date Indexes, are not sponsored, endorsed, sold, or promoted by Dow Jones, CME or Barclays Capital or any of their respective affiliates, and neither Dow Jones, CME nor Barclays Capital nor any of their respective affiliates makes any representation regarding the advisability of investing in such product(s) and/or about the quality, accuracy, and/or completeness of the Dow Jones Target Date Indexes or the Barclays Capital Bond Indexes. IN NO EVENT SHALL DOW JONES, CME, BARCLAYS CAPITAL, OR ANY OF THEIR LICENSORS HAVE ANY LIABILITY IN CONNECTION WITH THE Wells Fargo Advantage Dow Jones Target Date Funds INCLUDING, WITHOUT LIMITATION, FOR ANY SPECIAL, PUNITIVE, IN DIRECT, OR CONSEQUENTIAL DAMAGES (INCLUDING LOST PROFITS), EVEN IF NOTIFIED OF THE POSSIBILITY OF SUCH DAMAGES.
NOT FDIC INSURED ¡ NO BANK GUARANTEE ¡ MAY LOSE VALUE
Not part of the semi-annual report.
Wells Fargo Advantage Funds offers more than 110 mutual funds across a wide range of asset classes, representing over $221 billion in assets under management, as of July 31, 2011.
| | | | |
| Equity Funds | | | | |
Asia Pacific Fund | | Global Opportunities Fund | | Premier Large Company Growth Fund |
C&B Large Cap Value Fund | | Growth Fund | | Small Cap Opportunities Fund |
C&B Mid Cap Value Fund | | Health Care Fund | | Small Cap Value Fund |
Capital Growth Fund | | Index Fund | | Small Company Growth Fund |
Common Stock Fund | | International Equity Fund | | Small Company Value Fund |
Disciplined U.S. Core Fund | | International Value Fund | | Small/Mid Cap Core Fund |
Discovery Fund† | | Intrinsic Small Cap Value Fund | | Small/Mid Cap Value Fund |
Diversified Equity Fund | | Intrinsic Value Fund | | Social Sustainability Fund† |
Diversified International Fund | | Intrinsic World Equity Fund | | Special Mid Cap Value Fund |
Diversified Small Cap Fund | | Large Cap Core Fund | | Special Small Cap Value Fund |
Emerging Growth Fund | | Large Cap Growth Fund | | Specialized Technology Fund |
Emerging Markets Equity Fund | | Large Company Value Fund | | Strategic Large Cap Growth Fund |
Endeavor Select Fund† | | Omega Growth Fund | | Traditional Small Cap Growth Fund |
Enterprise Fund† | | Opportunity Fund† | | Utility and Telecommunications Fund |
Equity Value Fund | | Precious Metals Fund | | |
| Bond Funds | | | | |
Adjustable Rate Government Fund | | Inflation-Protected Bond Fund | | Short-Term Bond Fund |
California Limited-Term Tax-Free Fund | | Intermediate Tax/AMT-Free Fund | | Short-Term High Yield Bond Fund |
California Tax-Free Fund | | International Bond Fund | | Short-Term Municipal Bond Fund |
Colorado Tax-Free Fund | | Minnesota Tax-Free Fund | | Strategic Municipal Bond Fund |
Government Securities Fund | | Municipal Bond Fund | | Total Return Bond Fund |
High Income Fund | | North Carolina Tax-Free Fund | | Ultra Short-Term Income Fund |
High Yield Bond Fund | | Pennsylvania Tax-Free Fund | | Ultra Short-Term Municipal Income Fund |
Income Plus Fund | | Short Duration Government Bond Fund | | Wisconsin Tax-Free Fund |
| Asset Allocation Funds | | | | |
Asset Allocation Fund | | WealthBuilder Equity Portfolio† | | Target 2020 Fund† |
Conservative Allocation Fund | | WealthBuilder Growth Allocation Portfolio† | | Target 2025 Fund† |
Diversified Capital Builder Fund | | WealthBuilder Growth Balanced Portfolio† | | Target 2030 Fund† |
Diversified Income Builder Fund | | WealthBuilder Moderate Balanced Portfolio† | | Target 2035 Fund† |
Growth Balanced Fund | | WealthBuilder Tactical Equity Portfolio† | | Target 2040 Fund† |
Index Asset Allocation Fund | | Target Today Fund† | | Target 2045 Fund† |
Moderate Balanced Fund | | Target 2010 Fund† | | Target 2050 Fund† |
WealthBuilder Conservative Allocation Portfolio† | | Target 2015 Fund† | | Target 2055 Fund† |
| Money Market Funds | | | | |
100% Treasury Money Market Fund | | Minnesota Money Market Fund | | New Jersey Municipal Money Market Fund |
California Municipal Money Market Fund | | Money Market Fund | | New York Municipal Money Market Fund |
Cash Investment Money Market Fund | | Municipal Cash Management Money Market Fund | | Pennsylvania Municipal Money Market Fund |
Government Money Market Fund | | Municipal Money Market Fund | | Prime Investment Money Market Fund |
Heritage Money Market Fund† | | National Tax-Free Money Market Fund | | Treasury Plus Money Market Fund |
| Variable Trust Funds1 | | | | |
VT Discovery Fund† | | VT Intrinsic Value Fund | | VT Small Cap Growth Fund |
VT Index Asset Allocation Fund | | VT Omega Growth Fund | | VT Small Cap Value Fund |
VT International Equity Fund | | VT Opportunity Fund† | | VT Total Return Bond Fund |
An investment in a money market fund is not insured or guaranteed by the Federal Deposit Insurance Corporation or any other government agency. Although the Wells Fargo Advantage Money Market Funds seek to preserve the value of your investment at $1.00 per share, it is possible to lose money by investing in a money market fund.
| 1. | The Variable Trust Funds are generally available only through insurance company variable contracts. |
| † | In this report, the Wells Fargo Advantage Discovery FundSM, Wells Fargo Advantage Endeavor Select FundSM, Wells Fargo Advantage Enterprise FundSM, Wells Fargo Advantage Opportunity FundSM, Wells Fargo Advantage Social Sustainability FundSM, Wells Fargo Advantage WealthBuilder Conservative Allocation PortfolioSM, Wells Fargo Advantage WealthBuilder Equity PortfolioSM, Wells Fargo Advantage WealthBuilder Growth Allocation PortfolioSM, Wells Fargo Advantage WealthBuilder Growth Balanced PortfolioSM, Wells Fargo Advantage WealthBuilder Moderate Balanced PortfolioSM, Wells Fargo Advantage WealthBuilder Tactical Equity PortfolioSM, Wells Fargo Advantage Dow Jones Target Today FundSM, Wells Fargo Advantage Dow Jones Target 2010 FundSM, Wells Fargo Advantage Dow Jones Target 2015 FundSM, Wells Fargo Advantage Dow Jones Target 2020 FundSM, Wells Fargo Advantage Dow Jones Target 2025 FundSM, Wells Fargo Advantage Dow Jones Target 2030 FundSM, Wells Fargo Advantage Dow Jones Target 2035 FundSM, Wells Fargo Advantage Dow Jones Target 2040 FundSM, Wells Fargo Advantage Dow Jones Target 2045 FundSM, Wells Fargo Advantage Dow Jones Target 2050 FundSM, Wells Fargo Advantage Dow Jones Target 2055 FundSM, Wells Fargo Advantage Heritage Money Market FundSM, Wells Fargo Advantage VT Discovery FundSM, and Wells Fargo Advantage VT Opportunity FundSM are referred to as the Discovery Fund, Endeavor Select Fund, Enterprise Fund, Opportunity Fund, Social Sustainability Fund, WealthBuilder Conservative Allocation Portfolio, WealthBuilder Equity Portfolio, WealthBuilder Growth Allocation Portfolio, WealthBuilder Growth Balanced Portfolio, WealthBuilder Moderate Balanced Portfolio, WealthBuilder Tactical Equity Portfolio, Target Today Fund, Target 2010 Fund, Target 2015 Fund, Target 2020 Fund, Target 2025 Fund, Target 2030 Fund, Target 2035 Fund, Target 2040 Fund, Target 2045 Fund, Target 2050 Fund, Target 2055 Fund, Heritage Money Market Fund, VT Discovery Fund, and VT Opportunity Fund, respectively. |
Not part of the semi-annual report.
| | | | |
| 2 | | Wells Fargo Advantage Municipal Cash Management Money Market Fund | | Letter to Shareholders |

Karla M. Rabusch,
President
Wells Fargo Advantage Funds
Dear Valued Shareholder,
We’re pleased to offer you this semi-annual report for the Wells Fargo Municipal Cash Management Money Market Fund for the six-month period that ended July 31, 2011. Upon reviewing the report, you may notice a few changes from past reports, the most significant of which is the change from a multi-fund report to a single-fund report. We believe this change will give you more convenient access to your fund data.
The period began modestly as improving economic optimism generally shifted investors toward equities and riskier assets and away from U.S. Treasuries and lower-yielding fixed-income securities. Returns from fixed income were modest in the opening months of 2011 but were generally still positive as U.S. Treasury yields incrementally climbed higher. But after the slow start, bond prices once again strongly improved, sparked by a sharp decline in U.S. Treasury prices in April that carried into May. Late in the period, lower-rated bonds declined in price more than the higher credit-quality tiers but not enough to outweigh the stronger performance from lower-rated securities during the period. Lower-quality and longer-maturity fixed-income securities generally outperformed higher-quality and shorter-maturity securities over the full period.
The activity within the broader bond market also resonated with money market participants. As the economic and credit environment reverberated from the ongoing sovereign debt concerns and softening economic data, many participants continued to balance a need for stability and desire for higher yields. The result has been good demand for domestic commercial paper and certificate of deposits. Also, in spite of all the discussion about sovereign debt, many money market participants continue to maintain some exposures to foreign banks based on the quality of their fundamentals. By focusing more on the fundamentals and taking a more selective approach to the short-term security market helped the markets avoid the severe yield volatility or significant flight-to-quality experienced during the spring of 2010, when the Greek sovereign debt crisis first emerged.
The global economic “recovery” hit a snag, but the end of 2011 could regain momentum.
The U.S. economic recovery that began in mid-2009 and gained further momentum throughout 2010, particularly during the fourth quarter, has failed to maintain that level of growth through the first seven months of 2011. For example, gross domestic product (GDP), the broadest measure of economic activity, grew at an annualized rate of 3.1% in the fourth quarter of 2010, only to slow dramatically during the first quarter of 2011. The latest revision to first-quarter GDP data during the period indicated that the economy grew at an annualized rate of 0.4% during the first quarter of 2011. While still positive, it’s a much slower pace of growth than experienced in the second half of 2010 and notably lower than consensus forecasts. Nevertheless, the advance estimate of second-quarter 2011 GDP, which was released on July 29, 2011, was 1.3%, suggesting that the U.S. economy continues to expand, though at a slow and uneven pace.
Jobs and housing remained troublesome.
The July 2011 unemployment rate in the U.S. was reported at 9.1%, down from 9.5% a year earlier but still notably higher than historical averages. Unfortunately,
| | | | | | |
| Letter to Shareholders | | Wells Fargo Advantage Municipal Cash Management Money Market Fund | | | 3 | |
the drop may be more attributable to a decline in the labor force than to a meaningful uptick in hiring. The level of job creation in 2011 has been trending below historical averages, suggesting that the improving economy has yet to translate into widespread hiring. Meanwhile, the beleaguered housing market was an ongoing source of concern, despite some tentative late-year signs of stabilization. That said, persistent weakness in the labor and housing markets bears close watching in the months ahead.
Other economic data in the U.S. has been more encouraging, reflecting greater confidence in the sustainability of the expansion on the part of both consumers and businesses. Retail sales came in strong at certain points during the period and industrial production and new orders have picked up. Although still reluctant to hire, businesses have gradually increased spending in other areas, such as equipment and information technology. Core inflation, which excludes volatile food and energy prices, remained benign.
The Federal Reserve believes the economic recovery will accelerate in future quarters.
With inflation subdued, the Federal Open Market Committee (FOMC) held its target range for the federal funds rate—a proxy for short-term interest rates—steady at 0.00% to 0.25%. On June 22, 2011, in its final statement of the six-month period, the Fed reiterated that the economic recovery “is proceeding at a moderate pace,” but that “recent labor market indicators have been weaker than anticipated.” It described the recent increase in inflation as temporary, suggesting that inflation pressures will ease going forward. While the FOMC explained that it “expects the pace of recovery to pick up over coming quarters,” it indicated that the federal funds rate will remain at an exceptionally low level for as long as necessary to ensure a sustainable recovery and expansion.
As recent headwinds subside, it is reasonable to expect markets to regain focus.
Now that it appears the debt ceiling has been increased and a U.S. default will be averted, money market participants and the broader bond market can get back to more fundamental and lasting concerns-chiefly, the economy. After avoiding short-term Treasuries in late July 2011, ahead of pending U.S. debt ceiling deadline, money market participants have returned to the U.S. short-term markets1. Economic indicators released in the second half of 2011 might not be as soft as those reported during the first half of the year. While that would not mean that the economy is robust, it might remind the markets that the first half of the slowdown was transitory. Most indicators still point toward real GDP growth in the 2% to 3% range in the second half of 2011. While that is not enough to produce big employment gains, it might be sufficient to cause Treasury yields to retrace some of the late-July declines.
Don’t let short-term uncertainty derail long-term investment goals.
While periods of uncertainty can present challenges, experience has taught us that maintaining a long-term investment strategy based on individual goals and risk tolerance can be an effective way to plan for the future. As a whole, Wells Fargo Advantage Funds represents investments across a broad range of asset classes and investment styles with more than 110 mutual funds, giving you an
| 1. | Comments expressed that do not fall within the reporting period are as of August 2, 2011. |
While the FOMC explained that it “expects the pace of recovery to pick up over coming quarters,” it indicated that the federal funds rate will remain at an exceptionally low level for as long as necessary to ensure a sustainable recovery and expansion.
Economic indicators released in the second half of 2011 might not be as soft as those reported during the first half of the year. While that would not mean that the economy is robust, it might remind the markets that the first half of the slowdown was transitory.
| | | | |
| 4 | | Wells Fargo Advantage Municipal Cash Management Money Market Fund | | Letter to Shareholders |
opportunity to create a diversified investment portfolio. While diversification may not prevent losses in a downturn, it may help to reduce them and provide you with one way of managing risk.
In our opinion, diligent and earnest assessment of the fundamental characteristics of money market eligible securities will be a key differentiating factor between which investment strategies meet client expectations and which do not. At Wells Fargo Advantage Funds, we intend to continue the emphasis of principal preservation and high liquidity across our lineup of Wells Fargo Advantage Money Market Funds. In changing markets, we believe it is particularly important to have diligent investment analysts in charge of investor assets.
Thank you for choosing Wells Fargo Advantage Funds. We appreciate your confidence in us and are committed to helping you meet your financial needs. If you have any questions about your investments, please contact your investment professional, call us at 1-800-222-8222, or visit www.wellsfargo.com/advantagefunds.
Sincerely,

Karla M. Rabusch
President
Wells Fargo Advantage Funds
| | | | | | |
| Performance Highlights | | Wells Fargo Advantage Municipal Cash Management Money Market Fund | | | 5 | |
INVESTMENT OBJECTIVE
The Fund seeks current income exempt from regular federal income tax, while preserving capital and liquity.
ADVISER
Wells Fargo Funds Management, LLC
SUB-ADVISER
Wells Capital Management Incorporated
PORTFOLIO MANAGERS
David D. Sylvester
James Randazzo
FUND INCEPTION
November 20, 1996
| | |
SECTOR DISTRIBUTION1 (AS OF JULY 31, 2011) |
|
 |
| | |
EFFECTIVE MATURITY DISTRIBUTION1 (AS OF JULY 31, 2011) |
|
 |
| | | | |
WEIGHTED AVERAGE MATURITY2 (AS OF JULY 31, 2011) |
14 Days | | | | |
| | |
WEIGHTED AVERAGE FINAL MATURITY3 (AS OF JULY 31, 2011) |
| 14 Days | | |
| 1. | Sector distribution and effective maturity distribution are subject to change and are calculated based on the total investments of the Fund. Effective maturity distribution is based on the weighted average maturity of each security. |
| 2. | Weighted Average Maturity (WAM): WAM calculates an average time to maturity of all of the securities held in the portfolio, weighted by each security’s percentage of net assets. The calculation takes into account the final maturity of a fixed-income security and the interest rate reset date for floating-rate securities held in the portfolio. This is a way to measure a Fund’s sensitivity to potential interest rate changes. |
| 3. | Weighted Average Final Maturity (WAFM): WAFM calculates a Fund’s average time to maturity for all of the securities held in the portfolio, weighted to their percentage of assets in the Fund. In contrast to WAM, the WAFM calculation takes into account the final maturity date for each security held in the portfolio. This is a way to measure a Fund’s potential sensitivity to credit spread changes. |
| | | | |
| 6 | | Wells Fargo Advantage Municipal Cash Management Money Market Fund | | Performance Highlights |
AVERAGE ANNUAL TOTAL RETURN4 (%) (AS OF JULY 31, 2011)
| | | | | | | | | | | | | | | | | | | | | | | | | | | | |
| | | | | | | | | Expense Ratios5 | |
| | | Inception Date | | | 6 Months* | | | 1 Year | | | 5 Year | | | 10 Year | | | Gross | | | Net6 | |
Administrator Class (WUCXX) | | | 07/09/2010 | | | | 0.01 | | | | 0.04 | | | | 1.64 | | | | 1.71 | | | | 0.38% | | | | 0.30% | |
Institutional Class (EMMXX) | | | 11/20/1996 | | | | 0.04 | | | | 0.12 | | | | 1.66 | | | | 1.72 | | | | 0.26% | | | | 0.20% | |
Service Class (EISXX) | | | 11/20/1996 | | | | 0.00 | | | | 0.01 | | | | 1.45 | | | | 1.49 | | | | 0.55% | | | | 0.45% | |
| * | Returns for periods of less than one year are not annualized. |
| | | | | | | | | | | | |
FUND YIELD SUMMARY6 (AS OF JULY 31, 2011) | | Administrator Class | | | Institutional Class | | | Service Class | |
7-Day Current Yield | | | 0.01% | | | | 0.01% | | | | 0.01% | |
7-Day Compound Yield | | | 0.01% | | | | 0.01% | | | | 0.01% | |
30-Day Simple Yield | | | 0.01% | | | | 0.01% | | | | 0.01% | |
30-Day Compound Yield | | | 0.01% | | | | 0.01% | | | | 0.01% | |
Figures quoted represent past performance, which is no guarantee of future results and do not reflect the deduction of taxes that a shareholder may pay on fund distributions or the redemption of fund shares. Investment returns will fluctuate. The Fund’s yield figures more closely reflect the current earnings of the Fund than the total return figures. Current performance may be lower or higher than the performance data quoted. Current month-end performance is available at the Fund’s Web site – www.wellsfargo.com/advantagefunds.
Each class is sold without a front-end sales charge or contingent deferred sales charge. Other fees and expenses apply to an investment in the Fund and are described in the Fund’s current prospectus.
An investment in a money market fund is not insured or guaranteed by the Federal Deposit Insurance Corporation or any other government agency. Although the Fund seeks to preserve the value of your investment at $1.00 per share, it is possible to lose money by investing in a money market fund. A portion of the Fund’s income may be subject to federal, state and/or local income taxes or the alternative minimum tax (AMT).
| 4. | Historical performance shown for the Administrator Class shares prior to their inception reflects the performance of the Institutional Class shares, and has not been adjusted to include the higher expenses applicable to the Administrator Class shares. If these expenses had been adjusted, returns would be lower. Historical performance shown for all classes of the Fund prior to July 12, 2010 is based on the performance of the Fund’s predecessor, Evergreen Institutional Municipal Money Market Fund. |
| 5. | Reflects the expense ratios as stated in the most recent prospectuses. |
| 6. | The Adviser has committed through July 11, 2013 to waive fees and/or reimburse expenses to the extent necessary to cap the Fund’s Total Annual Fund Operating Expenses After Fee Waiver, excluding certain expenses, at the amount shown above. Without this cap, the Fund’s returns would have been lower. Without waived fees and/or reimbursed expenses, the Fund’s 7-day current yield would have been (0.19)%, (0.07)%, and (0.36)% for Administrator Class, Institutional Class and Service Class, respectively. |
| | | | | | |
| Fund Expenses | | Wells Fargo Advantage Municipal Cash Management Money Market Fund | | | 7 | |
As a shareholder of the Fund, you incur two types of costs: (1) transaction costs and (2) ongoing costs, including management fees; shareholder service fees; and other Fund expenses. This example is intended to help you understand your ongoing costs (in dollars) of investing in the Fund and to compare these costs with the ongoing costs of investing in other mutual funds.
The example is based on an investment of $1,000 invested at the beginning of the six-month period and held for the entire period from February 1, 2011 to July 31, 2011.
Actual Expenses
The “Actual” line of the table below provides information about actual account values and actual expenses. You may use the information in this line, together with the amount you invested, to estimate the expenses that you paid over the period. Simply divide your account value by $1,000 (for example, an $8,600 account value divided by $1,000 = 8.6), then multiply the result by the number in the “Actual” line under the heading entitled “Expenses Paid During Period” for your applicable class of shares to estimate the expenses you paid on your account during this period.
Hypothetical Example for Comparison Purposes
The “Hypothetical” line of the table below provides information about hypothetical account values and hypothetical expenses based on the Fund’s actual expense ratio and an assumed rate of return of 5% per year before expenses, which is not the Fund’s actual return. The hypothetical account values and expenses may not be used to estimate the actual ending account balance or expenses you paid for the period. You may use this information to compare the ongoing costs of investing in the Fund and other funds. To do so, compare this 5% hypothetical example with the 5% hypothetical examples that appear in the shareholder reports of the other funds.
Please note that the expenses shown in the table are meant to highlight your ongoing costs only and do not reflect any transactional costs. Therefore, the “Hypothetical” line of the table is useful in comparing ongoing costs only, and will not help you determine the relative total costs of owning different funds. In addition, if these transactional costs were included, your costs would have been higher.
| | | | | | | | | | | | | | | | |
| | | Beginning
Account Value
02-01-2011 | | | Ending
Account Value
07-31-2011 | | | Expenses
Paid During
the Period¹ | | | Net Annual
Expense Ratio | |
Administrator Class | | | | | | | | | | | | | | | | |
Actual | | $ | 1,000.00 | | | $ | 1,000.10 | | | $ | 1.29 | | | | 0.26 | % |
Hypothetical (5% return before expenses) | | $ | 1,000.00 | | | $ | 1,023.51 | | | $ | 1.30 | | | | 0.26 | % |
Institutional Class | | | | | | | | | | | | | | | | |
Actual | | $ | 1,000.00 | | | $ | 1,000.41 | | | $ | 0.94 | | | | 0.19 | % |
Hypothetical (5% return before expenses) | | $ | 1,000.00 | | | $ | 1,023.85 | | | $ | 0.95 | | | | 0.19 | % |
Service Class | | | | | | | | | | | | | | | | |
Actual | | $ | 1,000.00 | | | $ | 1,000.05 | | | $ | 1.34 | | | | 0.27 | % |
Hypothetical (5% return before expenses) | | $ | 1,000.00 | | | $ | 1,023.46 | | | $ | 1.35 | | | | 0.27 | % |
| 1. | Expenses paid is equal to the annualized expense ratio of each class multiplied by the average account value over the period, multiplied by the number of days in the most recent fiscal half-year divided by the number of days in the fiscal year (to reflect the one-half year period). |
| | | | |
| 8 | | Wells Fargo Advantage Municipal Cash Management Money Market Fund | | Portfolio of Investments—July 31, 2011 (Unaudited) |
| | | | | | | | | | | | | | | | |
| Security Name | | Interest Rate | | | Maturity Date | | | Principal | | | Value | |
| | | | | | | | | | | | | | | | |
| | | | |
Municipal Bonds and Notes: 92.48% | | | | | | | | | | | | | | | | |
| | | | |
Alabama: 3.22% | | | | | | | | | | | | | | | | |
| | | | |
| Variable Rate Demand Notes§: 3.22% | | | | | | | | | | | | | | | | |
Homewood AL Educational Building Authority (Education Revenue, Branch Banking & Trust LOC) | | | 0.08 | % | | | 12/01/2043 | | | $ | 10,000,000 | | | $ | 10,000,000 | |
Mobile County AL IDA Mobile Development Project (Energy Revenue, Svenska HandelsBanken LOC) | | | 0.07 | | | | 07/01/2040 | | | | 30,000,000 | | | | 30,000,000 | |
Pell City AL Special Care Facilities Authority Noland Health Services Incorporated Project Series 2009A (Health Revenue, U.S. Bank NA LOC) | | | 0.09 | | | | 12/01/2039 | | | | 4,000,000 | | | | 4,000,000 | |
Southeast Alabama Gas District Alabama Supply Project Series 2007-A (Utilities Revenue) | | | 0.24 | | | | 08/01/2027 | | | | 46,537,000 | | | | 46,537,000 | |
Tuscaloosa County AL IDA Series A (Miscellaneous Revenue) | | | 0.10 | | | | 09/01/2020 | | | | 6,700,000 | | | | 6,700,000 | |
| | | | |
| | | | | | | | | | | | | | | 97,237,000 | |
| | | | | | | | | | | | | | | | |
| | | | |
Arizona: 0.83% | | | | | | | | | | | | | | | | |
| | | | |
| Variable Rate Demand Notes§: 0.83% | | | | | | | | | | | | | | | | |
Maricopa County AZ Desert Eagles Estate Project Series 2003A-1 (Housing Revenue, FHLMC Insured) | | | 0.18 | | | | 07/01/2036 | | | | 9,380,000 | | | | 9,380,000 | |
Mesa AZ Utility Systems ROC RR-II-R 11032 (Utilities Revenue, FSA Insured) | | | 0.12 | | | | 07/01/2026 | | | | 15,600,000 | | | | 15,600,000 | |
| | | | |
| | | | | | | | | | | | | | | 24,980,000 | |
| | | | | | | | | | | | | | | | |
| | | | |
Arkansas: 0.03% | | | | | | | | | | | | | | | | |
| | | | |
| Variable Rate Demand Note§: 0.03% | | | | | | | | | | | | | | | | |
Arkansas Development Finance Authority Stratton Seed Company Project (IDR, Bank of America NA LOC) | | | 0.40 | | | | 03/01/2014 | | | | 900,000 | | | | 900,000 | |
| | | | | | | | | | | | | | | | |
| | | | |
California: 10.10% | | | | | | | | | | | | | | | | |
| | | | |
| Other Municipal Debt: 0.35% | | | | | | | | | | | | | | | | |
San Diego CA County & School District Notes Series B-1 (Miscellaneous Revenue, GO of Participants Insured) | | | 2.00 | | | | 01/31/2012 | | | | 3,500,000 | | | | 3,526,638 | |
San Joaquin County CA Transportation Authority Series A (Tax Revenue) | | | 0.09 | | | | 08/09/2011 | | | | 7,000,000 | | | | 7,000,000 | |
| | | | |
| | | | | | | | | | | | | | | 10,526,638 | |
| | | | | | | | | | | | | | | | |
| | | | |
| Variable Rate Demand Notes§: 9.75% | | | | | | | | | | | | | | | | |
ABAG Finance Authority for Non-Profit Corporations CA Hills Apartments Series A (GO - Local, FNMA Insured) | | | 0.12 | | | | 12/15/2032 | | | | 6,000,000 | | | | 6,000,000 | |
California CDA PUTTER Series 2680 (Housing Revenue, JPMorgan Chase Bank LOC) | | | 0.22 | | | | 05/15/2018 | | | | 23,000,000 | | | | 23,000,000 | |
California CDA PUTTER Series 2681 (Housing Revenue, JPMorgan Chase Bank LOC) | | | 0.32 | | | | 05/15/2018 | | | | 7,300,000 | | | | 7,300,000 | |
California CDA PUTTER Series 3931 (Housing Revenue, JPMorgan Chase Bank LOC) | | | 0.21 | | | | 08/12/2012 | | | | 5,000,000 | | | | 5,000,000 | |
California CDA PUTTER Series 3934 (Housing Revenue, JPMorgan Chase Bank LOC)†† | | | 0.20 | | | | 08/07/2012 | | | | 15,000,000 | | | | 15,000,000 | |
California PCFA Pacific Gas & Electric Project Series 97-B (Utilities Revenue, JPMorgan Chase Bank LOC) | | | 0.31 | | | | 11/01/2026 | | | | 150,000 | | | | 150,000 | |
California Statewide CDA Gas Supply Project Series 2010 (Utilities Revenue) | | | 0.07 | | | | 11/01/2040 | | | | 45,325,000 | | | | 45,325,000 | |
California Statewide CDA Olympus Park Apartments Series Y (Housing Revenue, FNMA Insured) | | | 0.18 | | | | 10/15/2030 | | | | 2,200,000 | | | | 2,200,000 | |
FHLMC Series M001 Class A (Housing Revenue) | | | 0.18 | | | | 08/15/2045 | | | | 30,096,327 | | | | 30,096,327 | |
FHLMC Series M002 Class A (Housing Revenue) | | | 0.18 | | | | 01/15/2047 | | | | 4,365,504 | | | | 4,365,504 | |
| | | | | | |
| Portfolio of Investments—July 31, 2011 (Unaudited) | | Wells Fargo Advantage Municipal Cash Management Money Market Fund | | | 9 | |
| | | | | | | | | | | | | | | | |
| Security Name | | Interest Rate | | | Maturity Date | | | Principal | | | Value | |
| | | | | | | | | | | | | | | | |
| | | | |
| Variable Rate Demand Notes§ (continued) | | | | | | | | | | | | | | | | |
FHLMC Series M008 Class A (Housing Revenue) | | | 0.18 | % | | | 02/15/2035 | | | $ | 20,015,199 | | | $ | 20,015,199 | |
Grossmont CA High School District California School Deutsche Bank Spears Trust Series DBE-637 (GO - Local) | | | 0.08 | | | | 08/01/2047 | | | | 4,200,000 | | | | 4,200,000 | |
Oakland CA Redevelopment Agency (Housing Revenue, FHLMC Insured) | | | 0.18 | | | | 10/01/2050 | | | | 49,400,000 | | | | 49,400,000 | |
San Jose CA Airport Deutsche Bank Spears/Lifers Trust Series DB-479 (Airport Revenue, FSA-CR AMBAC Insured) | | | 0.08 | | | | 03/01/2037 | | | | 35,155,000 | | | | 35,155,000 | |
Southern CA Metropolitan Water District Series A-1 (Water & Sewer Revenue) | | | 0.10 | | | | 07/01/2036 | | | | 6,500,000 | | | | 6,500,000 | |
Ukiah CA Union School District Deutsche Bank Spears Trust Series DB-382 (GO - Local, NATL-RE Insured) | | | 0.08 | | | | 08/01/2030 | | | | 20,795,000 | | | | 20,795,000 | |
Victorville CA Joint Powers Finance Authority Project A (Utilities Revenue, BNP Paribas LOC) | | | 1.35 | | | | 05/01/2040 | | | | 20,120,000 | | | | 20,120,000 | |
| | | | |
| | | | | | | | | | | | | | | 294,622,030 | |
| | | | | | | | | | | | | | | | |
| | | | |
Colorado: 0.66% | | | | | | | | | | | | | | | | |
| | | | |
| Variable Rate Demand Notes§: 0.66% | | | | | | | | | | | | | | | | |
Arapahoe County CO Cottrell Printing Project (IDR, KeyBank NA LOC) | | | 0.28 | | | | 10/01/2019 | | | | 2,000,000 | | | | 2,000,000 | |
Aurora CO Centretech Metropolitan District Series 1998-C (GO - Local, U.S. Bank NA LOC) | | | 0.13 | | | | 12/01/2028 | | | | 3,065,000 | | | | 3,065,000 | |
Colorado ECFA National Jewish Federation Project (Health Revenue, U.S. Bank NA LOC) | | | 0.20 | | | | 02/01/2039 | | | | 950,000 | | | | 950,000 | |
Colorado ECFA Vail Valley Foundation Project Series 2007 (Miscellaneous Revenue, U.S. Bank NA LOC) | | | 0.08 | | | | 12/01/2037 | | | | 5,700,000 | | | | 5,700,000 | |
Denver CO City & County Refunding MFHR Garden Court Community Project Series 2008 (Housing Revenue, FNMA Insured) | | | 0.21 | | | | 12/15/2038 | | | | 8,150,000 | | | | 8,150,000 | |
| | | | |
| | | | | | | | | | | | | | | 19,865,000 | |
| | | | | | | | | | | | | | | | |
| | | | |
Delaware: 8.33% | | | | | | | | | | | | | | | | |
| | | | |
| Variable Rate Demand Notes§: 8.33% | | | | | | | | | | | | | | | | |
Branch Bank & Trust Municipal Trust Series 5000 (Lease Revenue, RaboBank International LOC)†† | | | 0.17 | | | | 10/01/2028 | | | | 15,498,065 | | | | 15,498,065 | |
Branch Bank & Trust Municipal Trust Series 5003 (Lease Revenue, RaboBank International LOC)†† | | | 0.32 | | | | 05/01/2027 | | | | 28,313,998 | | | | 28,313,998 | |
Clipper Tax-Exempt Certified Trust Series 2004-10 (Housing Revenue) | | | 0.23 | | | | 12/01/2035 | | | | 3,502,000 | | | | 3,502,000 | |
Clipper Tax-Exempt Certified Trust Series 2005-30 (Housing Revenue) | | | 0.23 | | | | 06/01/2038 | | | | 13,895,000 | | | | 13,895,000 | |
Clipper Tax-Exempt Certified Trust Series 2005-31 (Housing Revenue) | | | 0.23 | | | | 01/01/2036 | | | | 12,405,000 | | | | 12,405,000 | |
Clipper Tax-Exempt Certified Trust Series 2006-02 (Housing Revenue) | | | 0.23 | | | | 10/01/2036 | | | | 14,690,000 | | | | 14,690,000 | |
Clipper Tax-Exempt Certified Trust Series 2006-06 (Housing Revenue) | | | 0.23 | | | | 07/01/2037 | | | | 10,597,000 | | | | 10,597,000 | |
Clipper Tax-Exempt Certified Trust Series 2006-10 (Housing Revenue) | | | 0.23 | | | | 09/01/2013 | | | | 1,345,000 | | | | 1,345,000 | |
Clipper Tax-Exempt Certified Trust Series 2007-26 (Housing Revenue) | | | 0.13 | | | | 05/01/2017 | | | | 93,374,000 | | | | 93,374,000 | |
Clipper Tax-Exempt Certified Trust Series 2007-40 (Housing Revenue) | | | 0.23 | | | | 02/01/2013 | | | | 9,212,000 | | | | 9,212,000 | |
Delaware Economic Development Authority (Miscellaneous Revenue) | | | 0.21 | | | | 08/01/2029 | | | | 19,300,000 | | | | 19,300,000 | |
Delaware Economic Development Authority IDR Delaware Clean Power Project Series 1997-B (Miscellaneous Revenue) | | | 0.28 | | | | 08/01/2029 | | | | 25,150,000 | | | | 25,150,000 | |
Delaware EDFA Delaware Clean Power Project Series A (Energy Revenue) | | | 0.21 | | | | 08/01/2029 | | | | 2,000,000 | | | | 2,000,000 | |
Delaware Health Facilities Authority Series B (Hospital Revenue, PNC Bank NA LOC) | | | 0.06 | | | | 07/01/2039 | | | | 2,375,000 | | | | 2,375,000 | |
| | | | |
| | | | | | | | | | | | | | | 251,657,063 | |
| | | | | | | | | | | | | | | | |
| | | | |
| 10 | | Wells Fargo Advantage Municipal Cash Management Money Market Fund | | Portfolio of Investments—July 31, 2011 (Unaudited) |
| | | | | | | | | | | | | | | | |
| Security Name | | Interest Rate | | | Maturity Date | | | Principal | | | Value | |
| | | | | | | | | | | | | | | | |
| | | | |
District of Columbia: 1.04% | | | | | | | | | | | | | | | | |
| | | | |
| Other Municipal Debt: 0.66% | | | | | | | | | | | | | | | | |
District of Columbia TRAN (GO - State) | | | 2.00 | % | | | 09/30/2011 | | | $ | 20,000,000 | | | $ | 20,054,356 | |
| | | | | | | | | | | | | | | | |
| | | | |
| Variable Rate Demand Notes§: 0.38% | | | | | | | | | | | | | | | | |
District of Columbia HFA PFOTER Carver Senior Apartments Project Series 4566 (Housing Revenue, FHLMC Insured) | | | 0.18 | | | | 10/01/2049 | | | | 7,170,000 | | | | 7,170,000 | |
District of Columbia HFA PFOTER Galen Terrace Project Series 4568 (Housing Revenue, FHLMC Insured) | | | 0.18 | | | | 02/01/2049 | | | | 4,320,000 | | | | 4,320,000 | |
| | | | |
| | | | | | | | | | | | | | | 11,490,000 | |
| | | | | | | | | | | | | | | | |
| | | | |
Florida: 6.24% | | | | | | | | | | | | | | | | |
| | | | |
| Variable Rate Demand Notes§: 6.24% | | | | | | | | | | | | | | | | |
Alachua County FL HFA MFHR Santa Fe Apartments Project Series 2008 (Housing Revenue, FNMA LOC) | | | 0.09 | | | | 04/15/2041 | | | | 7,400,000 | | | | 7,400,000 | |
Bay County FL Sales Tax Solar Eclipse Project Series 2006-0103 (Tax Revenue, U.S. Bank NA LOC) | | | 0.07 | | | | 03/01/2014 | | | | 2,970,000 | | | | 2,970,000 | |
Brevard County FL HFA Shore View Apartments Project Series 1995 (Housing Revenue, Harris Trust & Savings Bank LOC) | | | 0.11 | | | | 02/01/2015 | | | | 800,000 | | | | 800,000 | |
Duval County FL Camri Green Apartments (Housing Revenue, FNMA Insured) | | | 0.12 | | | | 11/15/2036 | | | | 6,800,000 | | | | 6,800,000 | |
Florida HFA Vizcaya Villas Project Series 1996-M (Housing Revenue)†† | | | 0.15 | | | | 07/25/2015 | | | | 5,625,000 | | | | 5,625,000 | |
Florida Housing Finance Corporation Brook Haven Apartments Multi-Family Mortgage Project Series 2006-H (Housing Revenue, FNMA Insured) | | | 0.11 | | | | 04/15/2039 | | | | 6,295,000 | | | | 6,295,000 | |
Greater Orlando FL Aviation Authority Flight Safety Project Series A (Airport Revenue) | | | 0.04 | | | | 10/01/2023 | | | | 6,400,000 | | | | 6,400,000 | |
JEA Florida Electric Systems Series A (Utilities Revenue, Bank of Montreal LOC) | | | 0.07 | | | | 10/01/2035 | | | | 2,225,000 | | | | 2,225,000 | |
Marion County FL HFA Paddock Apartments Project (Housing Revenue, FNMA Insured) | | | 0.09 | | | | 10/15/2032 | | | | 4,000,000 | | | | 4,000,000 | |
Miami-Dade County FL Expressway Authority Series 1339 (Transportation Revenue, AGC-ICC FGIC Insured) | | | 0.22 | | | | 07/01/2012 | | | | 10,090,000 | | | | 10,090,000 | |
Miami-Dade County FL International Airport Aviation Series 2008-1139X (Airport Revenue, Assured Guaranty Insured) | | | 0.21 | | | | 04/01/2028 | | | | 7,500,000 | | | | 7,500,000 | |
Miami-Dade County FL Series DBE-538 (Tax Revenue, AMBAC Insured) | | | 0.08 | | | | 04/01/2027 | | | | 2,200,000 | | | | 2,200,000 | |
Orange County FL Health Facilities Authority Adventist Health Systems Project Series 237 (Hospital Revenue, AMBAC Insured) | | | 0.21 | | | | 11/15/2025 | | | | 101,000,000 | | | | 101,000,000 | |
Orange County FL HFA Landings on Millenia Boulevard Apartments Project Series 2002-A (Housing Revenue, FNMA LOC) | | | 0.12 | | | | 08/15/2035 | | | | 7,060,000 | | | | 7,060,000 | |
Orlando FL Utilities Commission Series A (Utilities Revenue) | | | 0.19 | | | | 10/01/2027 | | | | 6,745,000 | | | | 6,745,000 | |
Palm Beach County FL Finance Authority DRIVER Trust Series 3419 (Resource Recovery Revenue, BHAC Insured)†† | | | 0.12 | | | | 04/01/2017 | | | | 2,275,000 | | | | 2,275,000 | |
Palm Beach County FL Jewish Community Campus Corporation Project (Miscellaneous Revenue, Northern Trust Company LOC, AMBAC Insured) | | | 0.11 | | | | 03/01/2027 | | | | 4,000,000 | | | | 4,000,000 | |
South Broward FL Hospital District Solar Eclipse Project Series 2006-0043 (Hospital Revenue, U.S. Bank NA LOC)†† | | | 0.07 | | | | 11/01/2013 | | | | 5,000,000 | | | | 5,000,000 | |
| | | | |
| | | | | | | | | | | | | | | 188,385,000 | |
| | | | | | | | | | | | | | | | |
| | | | |
Georgia: 0.93% | | | | | | | | | | | | | | | | |
| | | | |
| Variable Rate Demand Notes§: 0.93% | | | | | | | | | | | | | | | | |
Atlanta GA Development Authority Multi-Modal Zone Facility Perkins & Will Incorporated Project (Miscellaneous Revenue, Harris NA LOC) | | | 0.10 | | | | 11/01/2030 | | | | 6,420,000 | | | | 6,420,000 | |
| | | | | | |
| Portfolio of Investments—July 31, 2011 (Unaudited) | | Wells Fargo Advantage Municipal Cash Management Money Market Fund | | | 11 | |
| | | | | | | | | | | | | | | | |
| Security Name | | Interest Rate | | | Maturity Date | | | Principal | | | Value | |
| | | | | | | | | | | | | | | | |
| | | | |
| Variable Rate Demand Notes§ (continued) | | | | | | | | | | | | | | | | |
Atlanta GA Housing Authority Villages at Carver Project (Housing Revenue, FNMA Insured) | | | 0.10 | % | | | 12/15/2039 | | | $ | 3,425,000 | | | $ | 3,425,000 | |
Fulton County GA Development Authority Shepherd Center Project (Hospital Revenue, FHLB LOC) | | | 0.07 | | | | 09/01/2035 | | | | 1,620,000 | | | | 1,620,000 | |
George L Smith II GA World Congress Center (Miscellaneous Revenue, BHAC-CR NATL-RE Insured)†† | | | 0.18 | | | | 01/01/2018 | | | | 14,825,000 | | | | 14,825,000 | |
Gwinnet County GA Development Authority Ole Mexican Foods Incorporated Project (IDR, Branch Banking & Trust LOC) | | | 0.18 | | | | 05/01/2031 | | | | 1,765,000 | | | | 1,765,000 | |
| | | | |
| | | | | | | | | | | | | | | 28,055,000 | |
| | | | | | | | | | | | | | | | |
| | | | |
Hawaii: 0.33% | | | | | | | | | | | | | | | | |
| | | | |
| Variable Rate Demand Note§: 0.33% | | | | | | | | | | | | | | | | |
Clipper Tax-Exempt Certified Trust Series 2007-34 (GO - State) | | | 0.13 | | | | 05/01/2015 | | | | 9,995,000 | | | | 9,995,000 | |
| | | | | | | | | | | | | | | | |
| | | | |
Idaho: 0.33% | | | | | | | | | | | | | | | | |
| | | | |
| Variable Rate Demand Notes§: 0.33% | | | | | | | | | | | | | | | | |
Gooding County ID Southfield Dairy Project (Miscellaneous Revenue, Wells Fargo Bank NA LOC)(q) | | | 0.18 | | | | 04/01/2022 | | | | 3,630,000 | | | | 3,630,000 | |
Jerome County ID Economic Development Corporation Davisco Foods International Project Series 2009 (Miscellaneous Revenue, Bank of Montreal LOC) | | | 0.07 | | | | 12/01/2029 | | | | 6,200,000 | | | | 6,200,000 | |
| | | | |
| | | | | | | | | | | | | | | 9,830,000 | |
| | | | | | | | | | | | | | | | |
| | | | |
Illinois: 7.08% | | | | | | | | | | | | | | | | |
| | | | |
| Variable Rate Demand Notes§: 7.08% | | | | | | | | | | | | | | | | |
Branch Bank & Trust Municipal Trust Series 5001 (Lease Revenue, RaboBank International LOC)†† | | | 0.17 | | | | 06/01/2020 | | | | 22,560,849 | | | | 22,560,849 | |
Chicago IL Series ZC-1 (GO - Local, FGIC Insured) | | | 0.14 | | | | 01/01/2023 | | | | 36,403,000 | | | | 36,403,000 | |
Chicago IL Wastewater Transmission (Water & Sewer Revenue, FSA-CR FGIC Insured) | | | 0.15 | | | | 01/01/2015 | | | | 6,975,000 | | | | 6,975,000 | |
Chicago IL Deutsche Bank Spears-Lifers Trust (Water & Sewer Revenue, NATL-RE Insured) | | | 0.08 | | | | 01/01/2027 | | | | 15,555,000 | | | | 15,555,000 | |
Chicago IL Eclipse Funding Trust Solar Eclipse Project Series 2006-0003 (GO - Local, U.S. Bank NA LOC, FSA Insured) | | | 0.07 | | | | 07/01/2013 | | | | 9,185,000 | | | | 9,185,000 | |
Chicago IL Education Marine Project Series 1984 (Port, Airport, & Marina Authority Revenue, FHLB LOC) | | | 0.10 | | | | 07/01/2023 | | | | 4,200,000 | | | | 4,200,000 | |
Chicago IL Enterprise Center Project Series IX (IDR, LaSalle Bank NA LOC) | | | 0.26 | | | | 06/01/2022 | | | | 3,146,000 | | | | 3,146,000 | |
Chicago IL Enterprise Center Project Series X (IDR, LaSalle Bank NA LOC) | | | 0.26 | | | | 06/01/2022 | | | | 4,300,000 | | | | 4,300,000 | |
Chicago IL Midway Airport 2nd Lien Series C-1 (Port, Airport, & Marina Authority Revenue, Bank of Montreal LOC) | | | 0.12 | | | | 01/01/2035 | | | | 20,000,000 | | | | 20,000,000 | |
Chicago IL O’Hare International Airport ROC RR-II-R-605PB (Airport Revenue, FSA-CR FGIC Insured) | | | 0.23 | | | | 01/01/2014 | | | | 9,740,000 | | | | 9,740,000 | |
Chicago IL P S Greetings Incorporated Project (IDR, JPMorgan Chase & Company LOC) | | | 0.16 | | | | 05/01/2024 | | | | 1,135,000 | | | | 1,135,000 | |
Chicago IL Water Eclipse Funding Trust Series 2006-0106 (Water & Sewer Revenue, U.S. Bank NA LOC) | | | 0.07 | | | | 05/01/2014 | | | | 4,035,000 | | | | 4,035,000 | |
Greenville IL Greenville College Project (Education Revenue, PNC Bank NA LOC)(i) | | | 0.60 | | | | 11/01/2036 | | | | 2,200,000 | | | | 2,200,000 | |
Illinois Educational Facilities Authority Newberry Library Project (Miscellaneous Revenue, Northern Trust Company LOC) | | | 0.08 | | | | 03/01/2028 | | | | 1,950,000 | | | | 1,950,000 | |
Illinois Finance Authority DRIVER Trust Series 3302 (Education Revenue)†† | | | 0.21 | | | | 06/01/2014 | | | | 4,950,000 | | | | 4,950,000 | |
| | | | |
| 12 | | Wells Fargo Advantage Municipal Cash Management Money Market Fund | | Portfolio of Investments—July 31, 2011 (Unaudited) |
| | | | | | | | | | | | | | | | |
| Security Name | | Interest Rate | | | Maturity Date | | | Principal | | | Value | |
| | | | | | | | | | | | | | | | |
| | | | |
| Variable Rate Demand Notes§ (continued) | | | | | | | | | | | | | | | | |
Illinois Finance Authority Rush University Education Center Obligation Group Series 2008-A (Hospital Revenue, Northern Trust Company LOC) | | | 0.06 | % | | | 11/01/2045 | | | $ | 3,500,000 | | | $ | 3,500,000 | |
Illinois Housing Development Authority Florida House Project Series C (Housing Revenue, JPMorgan Chase & Company LOC, GO of Authority Insured) | | | 0.18 | | | | 01/01/2027 | | | | 5,310,000 | | | | 5,310,000 | |
Illinois Housing Development Authority Homeowner Mortgage A3 (Housing Revenue) | | | 0.08 | | | | 08/01/2035 | | | | 10,400,000 | | | | 10,400,000 | |
Illinois Metropolitan Pier & Exposition Authority Series 3219 (Tax Revenue)†† | | | 0.08 | | | | 06/15/2050 | | | | 30,000,000 | | | | 30,000,000 | |
Southwestern Illinois IDA Mattingly Lumber Project Series 2005-A (IDR, First Bank LOC) | | | 0.24 | | | | 12/01/2035 | | | | 3,080,000 | | | | 3,080,000 | |
Vernon Hills IL Hawthorn Lakes Project (Housing Revenue, Societe Generale LOC, FSA Insured) | | | 0.14 | | | | 01/01/2016 | | | | 15,210,000 | | | | 15,210,000 | |
| | | | |
| | | | | | | | | | | | | | | 213,834,849 | |
| | | | | | | | | | | | | | | | |
| | | | |
Indiana: 0.94% | | | | | | | | | | | | | | | | |
| | | | |
| Variable Rate Demand Notes§: 0.94% | | | | | | | | | | | | | | | | |
Eclipse Funding Trust IN Solar Eclipse (Miscellaneous Revenue, U.S. Bank NA LOC, FSA Insured) | | | 0.18 | | | | 07/15/2026 | | | | 12,285,000 | | | | 12,285,000 | |
Gary IN Grant Street Project (IDR, JPMorgan Chase Bank LOC) | | | 0.18 | | | | 07/01/2034 | | | | 5,555,000 | | | | 5,555,000 | |
Indiana HFFA Revenue Fayette Memorial Hospital Association Series A (Hospital Revenue, U.S. Bank NA LOC) | | | 0.33 | | | | 10/01/2032 | | | | 4,585,000 | | | | 4,585,000 | |
Richmond IN Reid Hospital & Health Care Services Incorporated Hospital Authority Series A (Hospital Revenue, Bank of New York LOC) | | | 0.04 | | | | 12/01/2016 | | | | 1,075,000 | | | | 1,075,000 | |
Royal Bank of Canada Municipal Products Incorporated Trust Indiana University Hospital Series E-23 (Hospital Revenue, Royal Bank of Canada LOC)†† | | | 0.08 | | | | 03/01/2036 | | | | 5,000,000 | | | | 5,000,000 | |
| | | | |
| | | | | | | | | | | | | | | 28,500,000 | |
| | | | | | | | | | | | | | | | |
| | | | |
Iowa: 0.31% | | | | | | | | | | | | | | | | |
| | | | |
| Variable Rate Demand Notes§: 0.31% | | | | | | | | | | | | | | | | |
Alton IA Northwest Iowa Agronomy Project (IDR, Bank of America NA LOC) | | | 0.40 | | | | 10/01/2024 | | | | 1,780,000 | | | | 1,780,000 | |
Iowa HFA SFHR Series N (Housing Revenue, GNMA/FNMA Insured) | | | 0.16 | | | | 01/01/2039 | | | | 7,040,000 | | | | 7,040,000 | |
Scott County IA Nichols Aluminum Recycling Project (IDR, U.S. Bank NA LOC) | | | 0.39 | | | | 06/01/2014 | | | | 600,000 | | | | 600,000 | |
| | | | |
| | | | | | | | | | | | | | | 9,420,000 | |
| | | | | | | | | | | | | | | | |
| | | | |
Kansas: 0.21% | | | | | | | | | | | | | | | | |
| | | | |
| Variable Rate Demand Notes§: 0.21% | | | | | | | | | | | | | | | | |
Kansas State Development Finance Authority Adventist Health C (Hospital Revenue, Royal Bank of Canada LOC) | | | 0.06 | | | | 11/15/2034 | | | | 3,000,000 | | | | 3,000,000 | |
Liberal KS Farmland National Beef Packing Project (IDR, RaboBank International LOC) | | | 0.13 | | | | 02/01/2029 | | | | 1,000,000 | | | | 1,000,000 | |
Nemaha County KS Midwest AG Services LLC Project (IDR, CoBank ACB LOC) | | | 0.18 | | | | 11/01/2020 | | | | 2,450,000 | | | | 2,450,000 | |
| | | | |
| | | | | | | | | | | | | | | 6,450,000 | |
| | | | | | | | | | | | | | | | |
| | | | | | |
| Portfolio of Investments—July 31, 2011 (Unaudited) | | Wells Fargo Advantage Municipal Cash Management Money Market Fund | | | 13 | |
| | | | | | | | | | | | | | | | |
| Security Name | | Interest Rate | | | Maturity Date | | | Principal | | | Value | |
| | | | | | | | | | | | | | | | |
| | | | |
Kentucky: 1.69% | | | | | | | | | | | | | | | | |
| | | | |
| Other Municipal Debt: 0.33% | | | | | | | | | | | | | | | | |
Kentucky Rural Water Finance Corporation Series E (Water & Sewer Revenue) | | | 1.50 | % | | | 12/01/2011 | | | $ | 10,000,000 | | | $ | 10,028,262 | |
| | | | | | | | | | | | | | | | |
| | | | |
| Variable Rate Demand Notes§: 1.36% | | | | | | | | | | | | | | | | |
Christian County KY Association of County Leasing Series B (Lease Revenue, U.S. Bank NA LOC) | | | 0.20 | | | | 08/01/2037 | | | | 2,715,000 | | | | 2,715,000 | |
Hopkins County KY Industrial Building Lok Corporation Project Series 2007 (IDR, PNC Bank NA LOC) | | | 0.09 | | | | 10/01/2017 | | | | 6,250,000 | | | | 6,250,000 | |
Jefferson County KY Industrial Zeochem LLC Project (IDR, UBS AG LOC) | | | 0.10 | | | | 08/01/2021 | | | | 2,625,000 | | | | 2,625,000 | |
Louisville KY Regional Airport Authority (Airport Revenue) | | | 0.22 | | | | 11/01/2036 | | | | 29,500,000 | | | | 29,500,000 | |
| | | | |
| | | | | | | | | | | | | | | 41,090,000 | |
| | | | | | | | | | | | | | | | |
| | | | |
Louisiana: 0.59% | | | | | | | | | | | | | | | | |
| | | | |
| Variable Rate Demand Notes§: 0.59% | | | | | | | | | | | | | | | | |
Ascension Parish LA BASF Corporation Project (Miscellaneous Revenue) | | | 0.24 | | | | 03/01/2025 | | | | 7,900,000 | | | | 7,900,000 | |
Louisiana Public Facilities Authority Christus Health Project Series B-3 (Hospital Revenue, Bank of New York LOC) | | | 0.06 | | | | 07/01/2047 | | | | 3,000,000 | | | | 3,000,000 | |
Louisiana Public Facilities Authority PC Allied Signal Incorporated Project (Miscellaneous Revenue) | | | 0.18 | | | | 08/01/2017 | | | | 6,815,000 | | | | 6,815,000 | |
| | | | |
| | | | | | | | | | | | | | | 17,715,000 | |
| | | | | | | | | | | | | | | | |
| | | | |
Maryland: 0.93% | | | | | | | | | | | | | | | | |
| | | | |
| Other Municipal Debt: 0.50% | | | | | | | | | | | | | | | | |
Montgomery County MD Series 10-A (Miscellaneous Revenue, Barclay’s Bank plc LOC) | | | 0.08 | | | | 08/09/2011 | | | | 10,000,000 | | | | 10,000,000 | |
Montgomery County MD Series 10-B (Miscellaneous Revenue, Barclays Bank plc LOC) | | | 0.09 | | | | 08/09/2011 | | | | 5,000,000 | | | | 5,000,000 | |
| | | | |
| | | | | | | | | | | | | | | 15,000,000 | |
| | | | | | | | | | | | | | | | |
| | | | |
| Variable Rate Demand Notes§: 0.43% | | | | | | | | | | | | | | | | |
Baltimore County MD Cross Creek Apartments Project Series 2008 (Housing Revenue, PNC Bank NA LOC) | | | 0.16 | | | | 11/01/2033 | | | | 4,465,000 | | | | 4,465,000 | |
Maryland Industrial Development Finance Authority Foodswing Project Series 2008 (IDR, Bank of America NA LOC) | | | 0.27 | | | | 04/01/2023 | | | | 8,500,000 | | | | 8,500,000 | |
| | | | |
| | | | | | | | | | | | | | | 12,965,000 | |
| | | | | | | | | | | | | | | | |
| | | | |
Massachusetts: 0.42% | | | | | | | | | | | | | | | | |
| | | | |
| Variable Rate Demand Notes§: 0.42% | | | | | | | | | | | | | | | | |
Massachusetts Series 2648 (GO - State, FSA Insured) | | | 0.12 | | | | 08/01/2015 | | | | 3,700,000 | | | | 3,700,000 | |
Massachusetts State Industrial Finance Agency Constitution Project (Miscellaneous Revenue, TD Bank NA LOC) | | | 0.27 | | | | 06/01/2018 | | | | 2,000,000 | | | | 2,000,000 | |
University of Massachusetts Building Authority (GO - State, State Guaranteed Insured) | | | 0.17 | | | | 11/01/2034 | | | | 7,100,000 | | | | 7,100,000 | |
| | | | |
| | | | | | | | | | | | | | | 12,800,000 | |
| | | | | | | | | | | | | | | | |
| | | | |
Michigan: 3.97% | | | | | | | | | | | | | | | | |
| | | | |
| Other Municipal Debt: 1.75% | | | | | | | | | | | | | | | | |
Michigan Finance Authority Series D-1 (Miscellaneous Revenue) | | | 2.00 | | | | 08/19/2011 | | | | 5,000,000 | | | | 5,002,935 | |
| | | | |
| 14 | | Wells Fargo Advantage Municipal Cash Management Money Market Fund | | Portfolio of Investments—July 31, 2011 (Unaudited) |
| | | | | | | | | | | | | | | | |
| Security Name | | Interest Rate | | | Maturity Date | | | Principal | | | Value | |
| | | | | | | | | | | | | | | | |
| | | | |
| Other Municipal Debt (continued) | | | | | | | | | | | | | | | | |
Michigan Finance Authority Series D-2 (Miscellaneous Revenue, JPMorgan Chase Bank LOC) | | | 2.00 | % | | | 08/22/2011 | | | $ | 7,000,000 | | | $ | 7,006,425 | |
Michigan Finance Authority Series D-3 (Miscellaneous Revenue, Scotia Bank LOC) | | | 2.00 | | | | 08/22/2011 | | | | 7,000,000 | | | | 7,006,425 | |
Michigan Hospital Finance Authority Series 08-C (Health Revenue) | | | 0.14 | | | | 10/11/2011 | | | | 18,840,000 | | | | 18,840,000 | |
Michigan Hospital Finance Authority Series 08-C (Health Revenue) | | | 0.15 | | | | 08/03/2011 | | | | 10,000,000 | | | | 10,000,000 | |
Michigan State Series A (GO - State) | | | 2.00 | | | | 09/30/2011 | | | | 5,000,000 | | | | 5,012,873 | |
| | | | |
| | | | | | | | | | | | | | | 52,868,658 | |
| | | | | | | | | | | | | | | | |
| | | | |
| Variable Rate Demand Notes§: 2.22% | | | | | | | | | | | | | | | | |
Michigan Housing Development Authority Rental Housing Project Series 2006-A (Housing Revenue, AGM GO of Authority Insured) | | | 0.30 | | | | 10/01/2040 | | | | 27,905,000 | | | | 27,905,000 | |
Michigan Housing Development Authority Rental Housing Project Series 2006-C (Housing Revenue, AGM GO of Authority Insured) | | | 0.30 | | | | 04/01/2041 | | | | 7,290,000 | | | | 7,290,000 | |
Michigan Housing Development Authority Rental Housing Project Series 2010-F (Hospital Revenue) | | | 0.17 | | | | 11/15/2049 | | | | 6,500,000 | | | | 6,500,000 | |
Michigan Solid Waste Disposal L’Anse Warden Company Project Series 2008 (Resource Recovery Revenue) | | | 0.19 | | | | 02/01/2028 | | | | 19,215,000 | | | | 19,215,000 | |
Michigan State Hospital Finance Authority Ascension Health Senior Credit (Hospital Revenue) | | | 0.17 | | | | 11/15/2049 | | | | 6,000,000 | | | | 6,000,000 | |
| | | | |
| | | | | | | | | | | | | | | 66,910,000 | |
| | | | | | | | | | | | | | | | |
| | | | |
Minnesota: 1.59% | | | | | | | | | | | | | | | | |
| | | | |
| Other Municipal Debt: 0.18% | | | | | | | | | | | | | | | | |
Minnesota Rural Water Finance Authority (Water & Sewer Revenue) | | | 1.25 | | | | 04/01/2012 | | | | 2,000,000 | | | | 2,007,938 | |
Minnesota Trunk Highway Project Series B (GO - State) | | | 4.00 | | | | 08/01/2011 | | | | 3,625,000 | | | | 3,625,000 | |
| | | | |
| | | | | | | | | | | | | | | 5,632,938 | |
| | | | | | | | | | | | | | | | |
| | | | |
| Variable Rate Demand Notes§: 1.41% | | | | | | | | | | | | | | | | |
Bloomington MN Norlan Partners Series B (Housing Revenue, LaSalle Bank NA LOC) | | | 0.19 | | | | 07/15/2032 | | | | 1,000,000 | | | | 1,000,000 | |
Dakota County MN CDA View Pointe Apartments Project Series 2007-A (Housing Revenue, FNMA Insured) | | | 0.17 | | | | 01/15/2038 | | | | 6,600,000 | | | | 6,600,000 | |
Forest Lake MN Kilkenny Court Apartments Project (Housing Revenue, FNMA Insured) | | | 0.10 | | | | 08/15/2038 | | | | 750,000 | | | | 750,000 | |
Maplewood MN Educational Facilities Authority Mounds Park Academy Project (Education Revenue, U.S. Bank NA LOC) | | | 0.10 | | | | 10/01/2023 | | | | 1,200,000 | | | | 1,200,000 | |
Maplewood MN Educational Facilities Mounds Park Academy Project (Education Revenue, U.S. Bank NA LOC) | | | 0.10 | | | | 10/01/2031 | | | | 2,735,000 | | | | 2,735,000 | |
Minneapolis & St. Paul MN Housing & RDA Allina Health Systems Project Series B2 (Hospital Revenue, JPMorgan Chase Bank LOC) | | | 0.20 | | | | 11/15/2035 | | | | 4,315,000 | | | | 4,315,000 | |
Minneapolis & St. Paul MN Housing & RDA Allina Health Systems Series B-1 (Hospital Revenue, JPMorgan Chase Bank LOC) | | | 0.31 | | | | 11/15/2035 | | | | 200,000 | | | | 200,000 | |
Minneapolis & St. Paul MN Housing & RDA HCFR Series A (Hospital Revenue, AGM Insured) | | | 0.33 | | | | 08/15/2034 | | | | 150,000 | | | | 150,000 | |
Minneapolis MN MFHR Driftwood Apartments Project Series A (Housing Revenue, U.S. Bank NA LOC) | | | 0.15 | | | | 10/01/2024 | | | | 235,000 | | | | 235,000 | |
Minneapolis MN People Serving People Project Series A (Miscellaneous Revenue, U.S. Bank NA LOC) | | | 0.33 | | | | 10/01/2021 | | | | 955,000 | | | | 955,000 | |
Minnesota Bond Securitization Trust Certificate Carleton Lofts Project Class A (Housing Revenue, LaSalle Bank NA LOC) | | | 0.23 | | | | 12/01/2048 | | | | 300,000 | | | | 300,000 | |
| | | | | | |
| Portfolio of Investments—July 31, 2011 (Unaudited) | | Wells Fargo Advantage Municipal Cash Management Money Market Fund | | | 15 | |
| | | | | | | | | | | | | | | | |
| Security Name | | Interest Rate | | | Maturity Date | | | Principal | | | Value | |
| | | | | | | | | | | | | | | | |
| | | | |
| Variable Rate Demand Notes§ (continued) | | | | | | | | | | | | | | | | |
Minnesota Bond Securitization Trust Series S1 (Housing Revenue, PNC Bank NA LOC) | | | 0.23 | % | | | 02/01/2027 | | | $ | 1,530,000 | | | $ | 1,530,000 | |
Minnesota Bond Securitization Trust Series S2 (Housing Revenue, PNC Bank NA LOC) | | | 0.23 | | | | 11/01/2028 | | | | 3,090,000 | | | | 3,090,000 | |
Minnesota HFA Residential Housing Finance Project Series C (Housing Revenue) | | | 0.16 | | | | 07/01/2036 | | | | 6,100,000 | | | | 6,100,000 | |
Minnesota HFA Series C (Housing Revenue, GO of Agency Insured) | | | 0.16 | | | | 07/01/2048 | | | | 6,000,000 | | | | 6,000,000 | |
Minnesota State HEFAR MacAlester College Series 5-Q (Education Revenue) | | | 0.13 | | | | 03/01/2033 | | | | 2,200,000 | | | | 2,200,000 | |
Minnesota State HEFAR Trustees Hamline University Series 6E3 (Education Revenue, Harris NA LOC) | | | 0.09 | | | | 10/01/2016 | | | | 1,165,000 | | | | 1,165,000 | |
Minnesota State HFA Residential Housing Series 1 (Housing Revenue, GO of Agency Insured) | | | 0.16 | | | | 01/01/2036 | | | | 300,000 | | | | 300,000 | |
Ramsey County MN Housing & Redevelopment MFHR Gateway Apartments LP Series A (Housing Revenue, LaSalle Bank NA LOC) | | | 0.15 | | | | 10/01/2038 | | | | 500,000 | | | | 500,000 | |
St. Paul MN Housing & RDA Hampden Square Apartments Series A (Housing Revenue, FNMA Insured) | | | 0.17 | | | | 06/01/2032 | | | | 700,000 | | | | 700,000 | |
St. Paul MN Port Authority District 12EE (Utilities Revenue, Deutsche Bank AG LOC) | | | 0.10 | | | | 03/01/2029 | | | | 500,000 | | | | 500,000 | |
St. Paul MN Port Authority District Series 9BB (Utilities Revenue, Deutsche Bank AG LOC) | | | 0.05 | | | | 03/01/2029 | | | | 400,000 | | | | 400,000 | |
Stevens County MN Riverview Dairy Project Series 2007 (Miscellaneous Revenue, AgCountry Farm Credit LOC) | | | 0.19 | | | | 08/01/2032 | | | | 600,000 | | | | 600,000 | |
Swift County MN East Dublin Dairy LLP Project Series 2008 (Resource Recovery Revenue, AgCountry Farm Credit LOC) | | | 0.19 | | | | 04/01/2033 | | | | 1,000,000 | | | | 1,000,000 | |
| | | | |
| | | | | | | | | | | | | | | 42,525,000 | |
| | | | | | | | | | | | | | | | |
| | | | |
Mississippi: 0.25% | | | | | | | | | | | | | | | | |
| | | | |
| Variable Rate Demand Note§: 0.25% | | | | | | | | | | | | | | | | |
Mississippi Development Bank Special Obligation Solar Eclipse Project Series 2006-0153 (GO - State, U.S. Bank NA LOC) | | | 0.10 | | | | 03/01/2014 | | | | 7,455,000 | | | | 7,455,000 | |
| | | | | | | | | | | | | | | | |
| | | | |
Missouri: 1.08% | | | | | | | | | | | | | | | | |
| | | | |
| Other Municipal Debt: 0.33% | | | | | | | | | | | | | | | | |
St. Louis County MO TRAN (Miscellaneous Revenue) | | | 0.45 | | | | 08/01/2011 | | | | 10,000,000 | | | | 10,000,000 | |
| | | | | | | | | | | | | | | | |
| | | | |
| Variable Rate Demand Notes§: 0.75% | | | | | | | | | | | | | | | | |
Clipper Tax-Exempt Certificate Trust Series 2005-14 (Housing Revenue) | | | 0.23 | | | | 03/01/2038 | | | | 7,818,000 | | | | 7,818,000 | |
Greene County MO Stasbourg Estates Project (Housing Revenue, U.S. Bank NA LOC) | | | 0.16 | | | | 08/01/2038 | | | | 2,160,000 | | | | 2,160,000 | |
Kansas City MO IDA Revenue Ewing Marion Kauffman Foundation (Miscellaneous Revenue) | | | 0.33 | | | | 04/01/2027 | | | | 4,700,000 | | | | 4,700,000 | |
Missouri HEFA Washington University Project Series B (Education Revenue) | | | 0.23 | | | | 02/15/2033 | | | | 500,000 | | | | 500,000 | |
Missouri State Development Finance Board Ewing Marion Kauffman Project Series A (Miscellaneous Revenue) | | | 0.33 | | | | 06/01/2037 | | | | 3,475,000 | | | | 3,475,000 | |
St. Charles County MO United Handicap Services (Health Revenue, U.S. Bank NA LOC) | | | 0.23 | | | | 07/01/2023 | | | | 3,900,000 | | | | 3,900,000 | |
| | | | |
| | | | | | | | | | | | | | | 22,553,000 | |
| | | | | | | | | | | | | | | | |
| | | | |
| 16 | | Wells Fargo Advantage Municipal Cash Management Money Market Fund | | Portfolio of Investments—July 31, 2011 (Unaudited) |
| | | | | | | | | | | | | | | | |
| Security Name | | Interest Rate | | | Maturity Date | | | Principal | | | Value | |
| | | | | | | | | | | | | | | | |
| | | | |
Nebraska: 0.20% | | | | | | | | | | | | | | | | |
| | | | |
| Variable Rate Demand Note§: 0.20% | | | | | | | | | | | | | | | | |
Nebraska Investment Finance Authority Apple Creek Associates Project Series 1985-A (Housing Revenue, Northern Trust Company LOC) | | | 0.21 | % | | | 09/01/2031 | | | $ | 6,190,000 | | | $ | 6,190,000 | |
| | | | | | | | | | | | | | | | |
| | | | |
Nevada: 1.19% | | | | | | | | | | | | | | | | |
| | | | |
| Variable Rate Demand Note§: 1.19% | | | | | | | | | | | | | | | | |
Reno NV Refunding Senior Lien Reno Transportation Rail Access Corridor Project (Tax Revenue, Bank of New York LOC) | | | 0.20 | | | | 06/01/2042 | | | | 36,000,000 | | | | 36,000,000 | |
| | | | | | | | | | | | | | | | |
| | | | |
New Hampshire: 1.24% | | | | | | | | | | | | | | | | |
| | | | |
| Variable Rate Demand Notes§: 1.24% | | | | | | | | | | | | | | | | |
Clipper Tax-Exempt Certified Trust Series 2005-03 (Housing Revenue) | | | 0.20 | | | | 02/01/2013 | | | | 28,140,000 | | | | 28,140,000 | |
New Hampshire Health & Educational Facilities Authority Dartmouth College Project Series 3069 (Education Revenue)†† | | | 0.08 | | | | 06/01/2039 | | | | 6,330,000 | | | | 6,330,000 | |
New Hampshire HEFA Frisbie Memorial Hospital (Hospital Revenue, TD Bank NA LOC) | | | 0.07 | | | | 10/01/2036 | | | | 3,005,000 | | | | 3,005,000 | |
| | | | |
| | | | | | | | | | | | | | | 37,475,000 | |
| | | | | | | | | | | | | | | | |
| | | | |
New Jersey: 1.78% | | | | | | | | | | | | | | | | |
| | | | |
| Other Municipal Debt: 0.50% | | | | | | | | | | | | | | | | |
North Brunswick Township NJ BAN (GO - Local) | | | 1.25 | | | | 08/11/2011 | | | | 15,000,000 | | | | 15,003,684 | |
| | | | | | | | | | | | | | | | |
| | | | |
| Variable Rate Demand Notes§: 1.28% | | | | | | | | | | | | | | | | |
New Jersey Building Authority Subseries A-3 (Lease Revenue, Barclays Bank plc LOC) | | | 0.05 | | | | 06/15/2023 | | | | 500,000 | | | | 500,000 | |
New Jersey Clipper Tax-Exempt Certified Trust Series A-2006 (Miscellaneous Revenue) | | | 0.08 | | | | 12/15/2023 | | | | 3,025,000 | | | | 3,025,000 | |
New Jersey EDA The Peddie School Project Series B (Education Revenue) | | | 0.06 | | | | 02/01/2029 | | | | 4,700,000 | | | | 4,700,000 | |
New Jersey HFFA Princeton Healthcare Series B (Hospital Revenue, TD Bank NA LOC) | | | 0.06 | | | | 07/01/2041 | | | | 2,500,000 | | | | 2,500,000 | |
New Jersey Higher Education Assistance Authority Student Loan ROC-RR-II-R-11571 (Education Revenue, Assured Guaranty Insured) | | | 0.23 | | | | 06/01/2016 | | | | 10,000,000 | | | | 10,000,000 | |
New Jersey Higher Education Assistance Authority Student Loan ROC-RR-II-R-11853 (Education Revenue, Assured Guaranty Insured)†† | | | 0.23 | | | | 06/01/2016 | | | | 17,745,000 | | | | 17,745,000 | |
New Jersey Series 038 (Miscellaneous Revenue, AMBAC Insured) | | | 0.08 | | | | 12/15/2026 | | | | 250,000 | | | | 250,000 | |
| | | | |
| | | | | | | | | | | | | | | 38,720,000 | |
| | | | | | | | | | | | | | | | |
| | | | |
New Mexico: 1.26% | | | | | | | | | | | | | | | | |
| | | | |
| Variable Rate Demand Notes§: 1.26% | | | | | | | | | | | | | | | | |
New Mexico Educational Assistance Foundation Series A-1 (Education Revenue, Royal Bank of Canada LOC, Guaranteed Student Loans Insured) | | | 0.11 | | | | 04/01/2034 | | | | 6,375,000 | | | | 6,375,000 | |
New Mexico Educational Assistance Foundation Series A-2 (Education Revenue, Royal Bank of Canada LOC, Guaranteed Student Loans Insured) | | | 0.11 | | | | 04/01/2034 | | | | 6,405,000 | | | | 6,405,000 | |
New Mexico Educational Authority PFOTER Series 637 (Education Revenue, Guaranteed Student Loans Insured) | | | 0.18 | | | | 04/01/2037 | | | | 21,110,000 | | | | 21,110,000 | |
New Mexico Municipal Energy Acquisition Authority Gas Supply Series 2009 (Utilities Revenue) | | | 0.08 | | | | 11/01/2039 | | | | 4,300,000 | | | | 4,300,000 | |
| | | | |
| | | | | | | | | | | | | | | 38,190,000 | |
| | | | | | | | | | | | | | | | |
| | | | | | |
| Portfolio of Investments—July 31, 2011 (Unaudited) | | Wells Fargo Advantage Municipal Cash Management Money Market Fund | | | 17 | |
| | | | | | | | | | | | | | | | |
| Security Name | | Interest Rate | | | Maturity Date | | | Principal | | | Value | |
| | | | | | | | | | | | | | | | |
| | | | |
New York: 3.60% | | | | | | | | | | | | | | | | |
| | | | |
| Other Municipal Debt: 1.04% | | | | | | | | | | | | | | | | |
New York Metropolitan Transportation Authority Series A (Transportation Revenue) | | | 0.23 | % | | | 10/06/2011 | | | $ | 5,000,000 | | | $ | 5,000,000 | |
Oyster Bay NY BAN Series B (GO - Local) | | | 1.25 | | | | 08/12/2011 | | | | 19,000,000 | | | | 19,005,422 | |
Tarrytown NY USD BAN (GO - Local, State Aid Withholding Insured) | | | 1.50 | | | | 08/12/2011 | | | | 7,500,000 | | | | 7,502,565 | |
| | | | |
| | | | | | | | | | | | | | | 31,507,987 | |
| | | | | | | | | | | | | | | | |
| | | | |
| Variable Rate Demand Notes§: 2.56% | | | | | | | | | | | | | | | | |
Clipper Tax-Exempt Certified Trust Series 2009-85 (Housing Revenue)†† | | | 0.23 | | | | 09/01/2034 | | | | 17,420,000 | | | | 17,420,000 | |
New York HFA ROC RR-II-R 11700 Series B (Housing Revenue)†† | | | 0.17 | | | | 05/01/2038 | | | | 6,810,000 | | | | 6,810,000 | |
New York Mortgage Agency Homeowner ROC RR-II-R 11703 (Housing Revenue)†† | | | 0.16 | | | | 10/01/2031 | | | | 9,850,000 | | | | 9,850,000 | |
New York NY City Housing Development Corporation Series J-1 (Housing Revenue) | | | 0.48 | | | | 05/01/2046 | | | | 8,345,000 | | | | 8,345,000 | |
New York NY City Municipal Water Finance Authority (Water & Sewer Revenue) | | | 0.15 | | | | 06/15/2043 | | | | 5,100,000 | | | | 5,100,000 | |
New York NY DRIVER Trust Series 3381 (Housing Revenue)†† | | | 0.23 | | | | 10/01/2023 | | | | 2,970,000 | | | | 2,970,000 | |
New York NY DRIVER Trust Series 3477 (Water & Sewer Revenue)†† | | | 0.12 | | | | 06/15/2017 | | | | 4,000,000 | | | | 4,000,000 | |
New York NY Housing Development Corporation MFHR Series 2008 M (Housing Revenue) | | | 0.48 | | | | 11/01/2013 | | | | 5,000,000 | | | | 5,000,000 | |
New York NY Housing Development Corporation Series 143 ROC RR-II-R 11699 (Housing Revenue)†† | | | 0.17 | | | | 11/01/2040 | | | | 6,170,000 | | | | 6,170,000 | |
New York NY Housing Finance Agency Series 2004-A (GO - Local, FHLMC Insured) | | | 0.05 | | | | 11/01/2033 | | | | 200,000 | | | | 200,000 | |
New York State Dormitory Authority NY Law School (Education Revenue, TD Bank NA LOC) | | | 0.04 | | | | 07/01/2038 | | | | 4,500,000 | | | | 4,500,000 | |
New York State Power Authority (GO - State) | | | 0.32 | | | | 03/01/2016 | | | | 6,000,000 | | | | 6,000,000 | |
New York State Power Authority (GO - State) | | | 0.32 | | | | 03/01/2020 | | | | 1,000,000 | | | | 1,000,000 | |
| | | | |
| | | | | | | | | | | | | | | 77,365,000 | |
| | | | | | | | | | | | | | | | |
| | | | |
North Carolina: 0.78% | | | | | | | | | | | | | | | | |
| | | | |
| Variable Rate Demand Notes§: 0.78% | | | | | | | | | | | | | | | | |
Charlotte NC Charlotte Mecklenburg Hospital Authority (Hospital Revenue, U.S. Bank NA LOC) | | | 0.24 | | | | 01/15/2026 | | | | 1,175,000 | | | | 1,175,000 | |
North Carolina Capital Finance Agency Wake Forest University Project Series 3070 (Education Revenue)†† | | | 0.09 | | | | 01/01/2038 | | | | 5,000,000 | | | | 5,000,000 | |
North Carolina Educational Facilities Authority Hill Center Project (Education Revenue, Branch Banking & Trust LOC) | | | 0.08 | | | | 07/01/2028 | | | | 4,530,000 | | | | 4,530,000 | |
North Carolina Healthcare Facilities Authority Hospice Alamance Project (Health Revenue, Branch Banking & Trust LOC) | | | 0.08 | | | | 12/01/2033 | | | | 4,900,000 | | | | 4,900,000 | |
Piedmont NC Triad Airport Authority Series A (Airport Revenue, Branch Banking & Trust LOC) | | | 0.09 | | | | 07/01/2032 | | | | 3,455,000 | | | | 3,455,000 | |
Piedmont NC Triad Airport Authority Series B (Airport Revenue, Branch Banking & Trust LOC) | | | 0.11 | | | | 07/01/2029 | | | | 4,470,000 | | | | 4,470,000 | |
| | | | |
| | | | | | | | | | | | | | | 23,530,000 | |
| | | | | | | | | | | | | | | | |
| | | | |
North Dakota: 1.98% | | | | | | | | | | | | | | | | |
| | | | |
| Other Municipal Debt: 1.49% | | | | | | | | | | | | | | | | |
Mercer County ND Series 09-2 (Utilities Revenue, JPMorgan Chase Bank LOC) | | | 0.23 | | | | 08/17/2011 | | | | 35,000,000 | | | | 35,000,000 | |
| | | | |
| 18 | | Wells Fargo Advantage Municipal Cash Management Money Market Fund | | Portfolio of Investments—July 31, 2011 (Unaudited) |
| | | | | | | | | | | | | | | | |
| Security Name | | Interest Rate | | | Maturity Date | | | Principal | | | Value | |
| | | | | | | | | | | | | | | | |
| | | | |
| Other Municipal Debt (continued) | | | | | | | | | | | | | | | | |
North Dakota Rural Water Finance Corporation Public Project Construction Notes Series A-4 (Water & Sewer Revenue) | | | 1.50 | % | | | 09/01/2011 | | | $ | 10,000,000 | | | $ | 10,006,739 | |
| | | | |
| | | | | | | | | | | | | | | 45,006,739 | |
| | | | | | | | | | | | | | | | |
| | | | |
| Variable Rate Demand Notes§: 0.49% | | | | | | | | | | | | | | | | |
Fargo ND IDA Cass Clay Creamery Incorporated Project (IDR, CoBank ACB LOC) | | | 0.18 | | | | 12/01/2012 | | | | 700,000 | | | | 700,000 | |
Mandan ND IDA Cloverdale Foods Company Project (IDR, BNC National Bank LOC) | | | 0.30 | | | | 12/01/2022 | | | | 2,560,000 | | | | 2,560,000 | |
North Dakota Housing Finance Agency (Miscellaneous Revenue, Citibank NA LOC) | | | 0.43 | | | | 01/01/2022 | | | | 1,320,000 | | | | 1,320,000 | |
North Dakota State HFA Home Mortgage Program Series A (Housing Revenue, GO of Agency Insured) | | | 0.11 | | | | 07/01/2037 | | | | 7,210,000 | | | | 7,210,000 | |
Richland County ND Recovery Zone Facility Minnesota-Dakota Farmers Cooperative Project Series 2010C (Miscellaneous Revenue, CoBank ACB LOC) | | | 0.09 | | | | 11/01/2028 | | | | 3,000,000 | | | | 3,000,000 | |
| | | | |
| | | | | | | | | | | | | | | 14,790,000 | |
| | | | | | | | | | | | | | | | |
| | | | |
Ohio: 2.33% | | | | | | | | | | | | | | | | |
| | | | |
| Variable Rate Demand Notes§: 2.33% | | | | | | | | | | | | | | | | |
Ohio Air Quality Development Authority Exempt Facilities Andersons Marathon Ethanol LLC Project Series 2007 (Energy Revenue, CoBank ACB LOC) | | | 0.19 | | | | 09/01/2037 | | | | 49,500,000 | | | | 49,500,000 | |
Ohio State Water Development Authority First Energy General Corporation Series A (Utilities Revenue, UBS AG LOC) | | | 0.23 | | | | 05/15/2019 | | | | 9,200,000 | | | | 9,200,000 | |
Ohio State Water Development Authority Pollution Control First Energy Series C (Utilities Revenue, UBS AG LOC) | | | 0.23 | | | | 06/01/2033 | | | | 11,625,000 | | | | 11,625,000 | |
| | | | |
| | | | | | | | | | | | | | | 70,325,000 | |
| | | | | | | | | | | | | | | | |
| | | | |
Oregon: 0.34% | | | | | | | | | | | | | | | | |
| | | | |
| Variable Rate Demand Notes§: 0.34% | | | | | | | | | | | | | | | | |
Oregon Beef Northwest Feeders Project (IDR, Northwest Farm Credit LOC) | | | 0.23 | | | | 01/01/2016 | | | | 825,000 | | | | 825,000 | |
Oregon Beef Northwest Feeders Project Series 207 (IDR, Northwest Farm Credit LOC) | | | 0.23 | | | | 01/01/2019 | | | | 815,000 | | | | 815,000 | |
Oregon Behlen Manufacturing Company Project (IDR, Bank of America NA LOC) | | | 0.20 | | | | 06/01/2017 | | | | 5,500,000 | | | | 5,500,000 | |
Oregon Health & Science University Series B-2 (Education Revenue, U.S. Bank NA LOC) | | | 0.06 | | | | 07/01/2027 | | | | 3,130,000 | | | | 3,130,000 | |
| | | | |
| | | | | | | | | | | | | | | 10,270,000 | |
| | | | | | | | | | | | | | | | |
| | | | |
Other: 2.96% | | | | | | | | | | | | | | | | |
| | | | |
| Variable Rate Demand Notes§: 2.96% | | | | | | | | | | | | | | | | |
Clipper Tax-Exempt Certified Trust Series 2006-04 (GO - Local, U.S. Bank NA LOC) | | | 0.11 | | | | 05/01/2013 | | | | 4,420,000 | | | | 4,420,000 | |
Clipper Tax-Exempt Certified Trust Series 2007-14 (Miscellaneous Revenue, FHLMC Insured) | | | 0.23 | | | | 03/01/2012 | | | | 11,890,000 | | | | 11,890,000 | |
Clipper Tax-Exempt Certified Trust Series 2009-4 (Miscellaneous Revenue) | | | 0.23 | | | | 10/01/2033 | | | | 1,966,945 | | | | 1,966,945 | |
Merrill Lynch PFOTER Class A (Housing Revenue) | | | 0.18 | | | | 05/01/2032 | | | | 14,425,000 | | | | 14,425,000 | |
Merrill Lynch PFOTER Class A (Housing Revenue) | | | 0.18 | | | | 05/15/2035 | | | | 56,740,000 | | | | 56,740,000 | |
| | | | |
| | | | | | | | | | | | | | | 89,441,945 | |
| | | | | | | | | | | | | | | | |
| | | | | | |
| Portfolio of Investments—July 31, 2011 (Unaudited) | | Wells Fargo Advantage Municipal Cash Management Money Market Fund | | | 19 | |
| | | | | | | | | | | | | | | | |
| Security Name | | Interest Rate | | | Maturity Date | | | Principal | | | Value | |
| | | | | | | | | | | | | | | | |
| | | | |
Pennsylvania: 2.27% | | | | | | | | | | | | | | | | |
| | | | |
| Variable Rate Demand Notes§: 2.27% | | | | | | | | | | | | | | | | |
Allegheny County PA Hospital Development Authority University of Pittsburgh Education Center Project Series 2007-A (Hospital Revenue)†† | | | 0.14 | % | | | 02/01/2031 | | | $ | 2,790,000 | | | $ | 2,790,000 | |
Allegheny County PA Hospital Development Authority University of Pittsburgh Education Center Project Series 2007-B-2 (Hospital Revenue, Royal Bank of Canada LOC)†† | | | 0.08 | | | | 04/15/2039 | | | | 16,000,000 | | | | 16,000,000 | |
Allegheny County PA Hospital Development Authority UPMC Senior Living Corporation Project (Health Revenue, FNMA Insured) | | | 0.09 | | | | 07/15/2028 | | | | 3,500,000 | | | | 3,500,000 | |
Allegheny County PA IDA United Jewish Federation Project Series A (Miscellaneous Revenue, PNC Bank NA LOC) | | | 0.08 | | | | 10/01/2026 | | | | 3,342,000 | | | | 3,342,000 | |
Bethlehem PA Municipal Products Incorporated Bethlehem Area School District Series E-12 (GO - Local, Royal Bank of Canada LOC)†† | | | 0.08 | | | | 01/05/2012 | | | | 4,000,000 | | | | 4,000,000 | |
Chester County PA IDA Archdiocese of Philadelphia (Miscellaneous Revenue, PNC Bank NA LOC) | | | 0.06 | | | | 07/01/2031 | | | | 6,000,000 | | | | 6,000,000 | |
Lehigh County PA PFOTER (Miscellaneous Revenue, Bank of America NA LOC) | | | 0.31 | | | | 08/15/2042 | | | | 5,300,000 | | | | 5,300,000 | |
Merrill Lynch PFOTER Series PT-4653 (Housing Revenue)†† | | | 0.11 | | | | 10/01/2039 | | | | 3,835,000 | | | | 3,835,000 | |
Montmery County PA ID ROC RR-II-R 11867 (Hospital Revenue, FHA Insured)†† | | | 0.11 | | | | 08/01/2030 | | | | 6,200,000 | | | | 6,200,000 | |
Pennsylvania Housing Finance Agency Series 82-B (Miscellaneous Revenue) | | | 0.06 | | | | 04/01/2034 | | | | 8,965,000 | | | | 8,965,000 | |
Pennsylvania State University Project Series B (Education Revenue) | | | 0.30 | | | | 06/01/2031 | | | | 6,400,000 | | | | 6,400,000 | |
Philadelphia PA School District GO Series 2007-A (GO - Local, Branch Banking & Trust LOC) | | | 0.11 | | | | 01/04/2029 | | | | 2,235,000 | | | | 2,235,000 | |
| | | | |
| | | | | | | | | | | | | | | 68,567,000 | |
| | | | | | | | | | | | | | | | |
| | | | |
Puerto Rico: 2.67% | | | | | | | | | | | | | | | | |
| | | | |
| Variable Rate Demand Notes§: 2.67% | | | | | | | | | | | | | | | | |
Puerto Rico Aqueduct & Sewer Authority Series 2601 (Water & Sewer Revenue, Assured Guaranty Insured) | | | 0.13 | | | | 07/01/2047 | | | | 6,000,000 | | | | 6,000,000 | |
Puerto Rico Commonwealth Aqueduct & Sewer Authority Series 2574 (Water & Sewer Revenue, Assured Guaranty Insured) | | | 0.13 | | | | 07/01/2047 | | | | 5,000,000 | | | | 5,000,000 | |
Puerto Rico Commonwealth Various Refunding Public Improvements (Miscellaneous Revenue, Barclays Bank plc LOC, AGM Insured) | | | 0.04 | | | | 07/01/2020 | | | | 500,000 | | | | 500,000 | |
Puerto Rico PUTTER DRIVER Series 3920 (GO-State, JPMorgan Chase Bank LOC)†† | | | 0.21 | | | | 05/01/2013 | | | | 20,000,000 | | | | 20,000,000 | |
Puerto Rico Sales Tax Finance Corporation Series 3033 (Tax Revenue)†† | | | 0.13 | | | | 08/01/2050 | | | | 23,330,000 | | | | 23,330,000 | |
Puerto Rico Sales Tax Finance Corporation Series 3036 (Tax Revenue) | | | 0.13 | | | | 08/01/2050 | | | | 25,830,000 | | | | 25,830,000 | |
| | | | |
| | | | | | | | | | | | | | | 80,660,000 | |
| | | | | | | | | | | | | | | | |
| | | | |
South Carolina: 0.79% | | | | | | | | | | | | | | | | |
| | | | |
| Variable Rate Demand Notes§: 0.79% | | | | | | | | | | | | | | | | |
South Carolina Economic Development Authority Anmed Health Project Series C (Hospital Revenue, Branch Banking & Trust LOC) | | | 0.08 | | | | 02/01/2033 | | | | 4,980,000 | | | | 4,980,000 | |
South Carolina Housing Finance & Development Authority PFOTER Wyndham Pointe Apartments Project (Housing Revenue, FHLMC Insured) | | | 0.18 | | | | 03/21/2019 | | | | 9,395,000 | | | | 9,395,000 | |
South Carolina Transportation Infrastructure Series 1283 (Tax Revenue, BHAC-CR AMBAC Insured) | | | 0.16 | | | | 04/01/2012 | | | | 9,550,000 | | | | 9,550,000 | |
| | | | |
| | | | | | | | | | | | | | | 23,925,000 | |
| | | | | | | | | | | | | | | | |
| | | | |
| 20 | | Wells Fargo Advantage Municipal Cash Management Money Market Fund | | Portfolio of Investments—July 31, 2011 (Unaudited) |
| | | | | | | | | | | | | | | | |
| Security Name | | Interest Rate | | | Maturity Date | | | Principal | | | Value | |
| | | | | | | | | | | | | | | | |
| | | | |
Tennessee: 1.58% | | | | | | | | | | | | | | | | |
| | | | |
| Other Municipal Debt: 0.12% | | | | | | | | | | | | | | | | |
Sevier County TN Public Building Authority (Miscellaneous Revenue) | | | 1.25 | % | | | 05/01/2012 | | | $ | 3,500,000 | | | $ | 3,515,628 | |
| | | | | | | | | | | | | | | | |
| | | | |
| Variable Rate Demand Notes§: 1.46% | | | | | | | | | | | | | | | | |
Franklin County TN Health & Educational Facilities Board University of the South Project Series 1998B (Education Revenue) | | | 0.12 | | | | 09/01/2018 | | | | 6,430,000 | | | | 6,430,000 | |
Municipal Energy Acquisition Corporation PFOTER Tennessee Gas Project Series 1578 (Utilities Revenue) | | | 0.17 | | | | 12/01/2016 | | | | 31,840,000 | | | | 31,840,000 | |
Nashville & Davidson Counties TN HEFA Lipscomb University Project (Education Revenue, FHLB LOC) | | | 0.07 | | | | 11/01/2028 | | | | 1,150,000 | | | | 1,150,000 | |
Sevier County TN Public Building Authority Public Improvement Project Series B-1 (Water & Sewer Revenue, Branch Banking & Trust LOC) | | | 0.08 | | | | 06/01/2035 | | | | 4,735,000 | | | | 4,735,000 | |
| | | | |
| | | | | | | | | | | | | | | 44,155,000 | |
| | | | | | | | | | | | | | | | |
| | | | |
Texas: 10.22% | | | | | | | | | | | | | | | | |
| | | | |
| Other Municipal Debt: 0.06% | | | | | | | | | | | | | | | | |
Texas TRAN (Tax Revenue) | | | 2.00 | | | | 08/31/2011 | | | | 1,690,000 | | | | 1,692,284 | |
| | | | | | | | | | | | | | | | |
| | | | |
| Variable Rate Demand Notes§: 10.16% | | | | | | | | | | | | | | | | |
Clipper Tax-Exempt Certified Trust COP Series 2007-23 (Water & Sewer Revenue) | | | 0.13 | | | | 10/01/2018 | | | | 1,460,000 | | | | 1,460,000 | |
Dallam County TX Industrial Development Corporation Hilmar Cheese Company Incorporated Project (Miscellaneous Revenue, Bank of the West LOC) | | | 0.07 | | | | 08/01/2035 | | | | 10,000,000 | | | | 10,000,000 | |
Dallam County TX Industrial Development Corporation Hilmar Cheese Company Incorporated Project Series 2009 (Miscellaneous Revenue, Bank of the West LOC) | | | 0.07 | | | | 07/01/2032 | | | | 12,250,000 | | | | 12,250,000 | |
Gregg County TX Health Facilities Development Corporation (Hospital Revenue, JPMorgan Chase Bank LOC, Radian Insured) | | | 0.33 | | | | 10/01/2029 | | | | 900,000 | | | | 900,000 | |
Harris County TX Industrial Development Corporation Solid Waste Disposal Deer Park Refining Project (Energy Revenue) | | | 0.21 | | | | 03/01/2023 | | | | 10,800,000 | | | | 10,800,000 | |
Harris County TX Industrial Development Corporation Solid Waste Disposal Deer Park Refining Project Series A (Energy Revenue) | | | 0.24 | | | | 03/01/2023 | | | | 31,895,000 | | | | 31,895,000 | |
Houston TX Housing Finance Corporation PFOTER Kensington Place Apartments Series 2004 (Housing Revenue, FHLMC Insured) | | | 0.18 | | | | 02/01/2048 | | | | 12,065,000 | | | | 12,065,000 | |
Houston TX Housing Finance Corporation PFOTER Sterlingshire Apartments Project Series 2003 A-1 (Housing Revenue, FHLMC Insured) | | | 0.18 | | | | 04/01/2040 | | | | 3,570,000 | | | | 3,570,000 | |
Jewett Economic Development Corporation Nucor Corporation Project (IDR) | | | 0.10 | | | | 08/01/2038 | | | | 6,200,000 | | | | 6,200,000 | |
Port Arthur TX Navigation District Environmental Facilities BASF Corporation Project (Miscellaneous Revenue) | | | 0.24 | | | | 05/01/2033 | | | | 12,900,000 | | | | 12,900,000 | |
Port Arthur TX Navigation District Environmental Facilities BASF Corporation Project Class A (Miscellaneous Revenue) | | | 0.25 | | | | 04/01/2037 | | | | 15,000,000 | | | | 15,000,000 | |
Port Arthur TX Navigation District Environmental Facilities Motiva Enterprises LLC Project Series 2002 (Energy Revenue) | | | 0.11 | | | | 12/01/2027 | | | | 22,035,000 | | | | 22,035,000 | |
Port Arthur TX Navigation District Environmental Facilities Motiva Enterprises Project Series B (Energy Revenue) | | | 0.26 | | | | 12/01/2039 | | | | 1,600,000 | | | | 1,600,000 | |
Port Corpus Christi TX Solid Waste Disposal Flint Hills Resources Project Series 2002-A (Energy Revenue) | | | 0.13 | | | | 07/01/2029 | | | | 18,500,000 | | | | 18,500,000 | |
Port Corpus Christi TX Solid Waste Disposal Flint Hills Resources Project Series 2005 (Energy Revenue) | | | 0.13 | | | | 01/01/2030 | | | | 20,000,000 | | | | 20,000,000 | |
Nueces County TX Port Corpus Christi Authority Solid Waste Disposal Flint Hills Resources Project Series 2006 (Resource Recovery Revenue, Flint Hills Resources Guaranteed) | | | 0.13 | | | | 01/01/2030 | | | | 15,950,000 | | | | 15,950,000 | |
| | | | | | |
| Portfolio of Investments—July 31, 2011 (Unaudited) | | Wells Fargo Advantage Municipal Cash Management Money Market Fund | | | 21 | |
| | | | | | | | | | | | | | | | |
| Security Name | | Interest Rate | | | Maturity Date | | | Principal | | | Value | |
| | | | | | | | | | | | | | | | |
| | | | |
| Variable Rate Demand Notes§ (continued) | | | | | | | | | | | | | | | | |
Nueces County TX Port Corpus Christi Authority Solid Waste Disposal Flint Hills Resources Project Series 2007 (Resource Recovery Revenue, Flint Hills Resources Guaranteed) | | | 0.13 | % | | | 01/01/2032 | | | $ | 7,825,000 | | | $ | 7,825,000 | |
Port Corpus Christi TX Solid Waste Disposal Flint Hills Resources Project Series A (Energy Revenue) | | | 0.13 | | | | 04/01/2028 | | | | 8,000,000 | | | | 8,000,000 | |
San Antonio TX Electric & Gas Deutsche Bank Spears Trust Series 2007 (Utilities Revenue) | | | 0.08 | | | | 02/01/2032 | | | | 7,970,000 | | | | 7,970,000 | |
San Antonio TX Housing Finance Corporation PFOTER Rosemont at Pleasanton Apartments Project Series 2005 (Housing Revenue, FHLMC Insured) | | | 0.18 | | | | 03/30/2019 | | | | 780,000 | | | | 780,000 | |
Texas Department of Housing & Community Affairs SFHR Series A (Housing Revenue, GNMA/FNMA Insured) | | | 0.13 | | | | 09/01/2038 | | | | 7,755,000 | | | | 7,755,000 | |
Texas Municipal Gas Acquisition & Supply Corporation Series 2848 (Utilities Revenue) | | | 0.13 | | | | 12/15/2026 | | | | 58,000,000 | | | | 58,000,000 | |
Texas Municipal Gas Acquisition & Supply Corporation Series 2849 (Utilities Revenue) | | | 0.13 | | | | 12/15/2026 | | | | 11,578,948 | | | | 11,578,948 | |
Texas State Department Deutsche Bank Spears Lifers Trust Series DBE-1003 (Miscellaneous Revenue, Deutsche Bank LOC)†† | | | 0.09 | | | | 10/01/2046 | | | | 10,000,000 | | | | 10,000,000 | |
| | | | |
| | | | | | | | | | | | | | | 307,033,948 | |
| | | | | | | | | | | | | | | | |
| | | | |
Virginia: 2.20% | | | | | | | | | | | | | | | | |
| | | | |
| Variable Rate Demand Notes§: 2.20% | | | | | | | | | | | | | | | | |
Alexandria VA Redevelopment & Housing PFOTER Series C-2 (Housing Revenue, Royal Bank of Canada LOC) | | | 0.18 | | | | 01/01/2014 | | | | 17,250,000 | | | | 17,250,000 | |
Fairfax County VA IDA Inova Health Project Series A-1 (Hospital Revenue) | | | 0.20 | | | | 05/15/2039 | | | | 7,000,000 | | | | 7,000,000 | |
FHLMC Series M020 Class A (Housing Revenue, FHLMC Insured) | | | 0.13 | | | | 11/15/2036 | | | | 24,922,000 | | | | 24,922,000 | |
Norfolk VA Economic Development Authority Sentra Healthcare Project (Hospital Revenue) | | | 0.20 | | | | 11/01/2034 | | | | 5,905,000 | | | | 5,905,000 | |
Stafford County VA Eclipse Funding Trust Project (Miscellaneous Revenue, U.S. Bank NA LOC) | | | 0.07 | | | | 08/01/2015 | | | | 11,385,000 | | | | 11,385,000 | |
| | | | |
| | | | | | | | | | | | | | | 66,462,000 | |
| | | | | | | | | | | | | | | | |
| | | | |
Washington: 0.62% | | | | | | | | | | | | | | | | |
| | | | |
| Variable Rate Demand Notes§: 0.62% | | | | | | | | | | | | | | | | |
King County WA Series 3090 (Water & Sewer Revenue, FSA Insured)†† | | | 0.08 | | | | 01/01/2039 | | | | 4,790,000 | | | | 4,790,000 | |
Pierce County WA Economic Development Corporation Truss Company Project (IDR, U.S. Bank NA LOC) | | | 0.13 | | | | 01/01/2020 | | | | 2,475,000 | | | | 2,475,000 | |
Port Tacoma WA ROC-RR-II-R 12056 (Port, Airport, & Marina Authority Revenue, FSA-CR FGIC Insured) | | | 0.17 | | | | 06/26/2014 | | | | 9,900,000 | | | | 9,900,000 | |
Washington Series 2650-Z (GO - State, FSA Insured) | | | 0.21 | | | | 07/01/2013 | | | | 1,000,000 | | | | 1,000,000 | |
Yakima County WA Public Corporation Macro Plastics Incorporated Project Series 1996 (IDR, Bank of the West LOC) | | | 0.25 | | | | 12/01/2026 | | | | 620,000 | | | | 620,000 | |
| | | | |
| | | | | | | | | | | | | | | 18,785,000 | |
| | | | | | | | | | | | | | | | |
| | | | |
West Virginia: 0.23% | | | | | | | | | | | | | | | | |
| | | | |
| Variable Rate Demand Note§: 0.23% | | | | | | | | | | | | | | | | |
West Virginia Economic Development Authority Appalachian Power Company Series B (Resource Recovery Revenue, Mizuho Corporate Bank LOC) | | | 0.11 | | | | 02/01/2036 | | | | 7,000,000 | | | | 7,000,000 | |
| | | | |
| | | | | | | | | | | | | | | 7,000,000 | |
| | | | | | | | | | | | | | | | |
| | | | |
| 22 | | Wells Fargo Advantage Municipal Cash Management Money Market Fund | | Portfolio of Investments—July 31, 2011 (Unaudited) |
| | | | | | | | | | | | | | | | |
| Security Name | | Interest Rate | | | Maturity Date | | | Principal | | | Value | |
| | | | | | | | | | | | | | | | |
| | | | |
Wisconsin: 2.82% | | | | | | | | | | | | | | | | |
| | | | |
| Other Municipal Debt: 0.61% | | | | | | | | | | | | | | | | |
Wisconsin Rural Water Construction Loan Program Commission Series 2010 (Water & Sewer Revenue) | | | 1.50 | % | | | 11/01/2011 | | | $ | 4,550,000 | | | $ | 4,560,246 | |
Wisconsin State Health & Educational Facilities (Hospital Revenue, Branch Banking & Trust LOC) | | | 0.42 | | | | 09/01/2011 | | | | 7,000,000 | | | | 7,000,000 | |
Wisconsin State HEFA (Hospital Revenue) | | | 0.42 | | | | 09/01/2011 | | | | 7,000,000 | | | | 7,000,000 | |
| | | | |
| | | | | | | | | | | | | | | 18,560,246 | |
| | | | | | | | | | | | | | | | |
| | | | |
| Variable Rate Demand Notes§: 2.21% | | | | | | | | | | | | | | | | |
Brodhead WI ID Stoughton Trailers Incorporated Project (IDR, Bank One NA LOC) | | | 0.18 | | | | 08/01/2020 | | | | 6,800,000 | | | | 6,800,000 | |
Menomonee Falls WI ID Mero Structures Incorporated Project (IDR, U.S. Bank NA LOC) | | | 0.10 | | | | 09/01/2021 | | | | 1,545,000 | | | | 1,545,000 | |
West Bend WI ID Bestech Tool Corporation Project Series A (IDR, U.S. Bank NA LOC) | | | 0.39 | | | | 09/01/2019 | | | | 810,000 | | | | 810,000 | |
Wisconsin Housing & Economic Development Authority Series A (Housing Revenue, GO of Authority Insured) | | | 0.18 | | | | 05/01/2035 | | | | 4,620,000 | | | | 4,620,000 | |
Wisconsin Housing & Economic Development Authority Series C (Housing Revenue, GO of Authority Insured) | | | 0.08 | | | | 03/01/2028 | | | | 10,005,000 | | | | 10,005,000 | |
Wisconsin Housing & Economic Development Authority Series E (Housing Revenue, GO of Authority Insured) | | | 0.15 | | | | 09/01/2038 | | | | 16,000,000 | | | | 16,000,000 | |
Wisconsin Public Power PUTTER Series 1232 (Utilities Revenue, BHAC-CR AMBAC Insured) | | | 0.16 | | | | 07/01/2013 | | | | 8,970,000 | | | | 8,970,000 | |
Wisconsin State HEFA Aurora Health Care Series A (Hospital Revenue, Bank of Montreal LOC) | | | 0.24 | | | | 04/01/2028 | | | | 17,900,000 | | | | 17,900,000 | |
| | | | |
| | | | | | | | | | | | | | | 66,650,000 | |
| | | | | | | | | | | | | | | | |
| | | | |
Wyoming: 0.32% | | | | | | | | | | | | | | | | |
| | | | |
| Variable Rate Demand Note§: 0.32% | | | | | | | | | | | | | | | | |
Wyoming CDA Series 1424-R (Housing Revenue) | | | 0.18 | | | | 06/01/2014 | | | | 9,535,000 | | | | 9,535,000 | |
| | | | | | | | | | | | | | | | |
| | | | | | | | |
Total Investments in Securities
(Cost $2,793,701,255)* | | | 92.48 | % | | | 2,793,701,255 | |
Other Assets and Liabilities, Net | | | 7.52 | | | | 227,188,283 | |
| | | | | | | | |
| Total Net Assets | | | 100.00 | % | | $ | 3,020,889,538 | |
| | | | | | | | |
| § | These securities are subject to a demand feature which reduces the effective maturity. |
| †† | Security that may be resold to “qualified institutional buyers” under Rule 144A or securities offered pursuant to Section 4(2) of the Securities Act of 1933, as amended. |
| (q) | Credit enhancement is provided by an affiliate. |
| * | Cost for federal income tax purposes is substantially the same as for financial reporting purposes. |
The accompanying notes are an integral part of these financial statements.
| | | | | | |
| Statement of Assets and Liabilities—July 31, 2011 (Unaudited) | | Wells Fargo Advantage Municipal Cash Management Money Market Fund | | | 23 | |
| | | | |
| | | | |
| |
Assets | | | | |
Investments in unaffiliated securities, at amortized cost | | $ | 2,793,701,255 | |
Cash | | | 142,994,413 | |
Receivable for investments sold | | | 83,054,127 | |
Receivable for interest | | | 2,330,318 | |
Receivable from adviser | | | 136,781 | |
Prepaid expenses and other assets | | | 67,752 | |
| | | | |
Total assets | | | 3,022,284,646 | |
| | | | |
| |
Liabilities | | | | |
Dividends payable | | | 20,714 | |
Payable for Fund shares redeemed | | | 239,653 | |
Due to other related parties | | | 384,099 | |
Shareholder servicing fees payable | | | 71,365 | |
Trustees’ fees and expenses payable | | | 297,623 | |
Custodian and accounting fees payable | | | 199,689 | |
Accrued expenses and other liabilities | | | 181,965 | |
| | | | |
Total liabilities | | | 1,395,108 | |
| | | | |
Total net assets | | $ | 3,020,889,538 | |
| | | | |
| |
NET ASSETS CONSIST OF | | | | |
Paid-in capital | | $ | 3,020,910,578 | |
Undistributed net investment income | | | 83,316 | |
Accumulated net realized losses on investments | | | (104,356 | ) |
| | | | |
Total net assets | | $ | 3,020,889,538 | |
| | | | |
| |
COMPUTATION OF NET ASSET VALUE PER SHARE | | | | |
Net assets – Administrator Class | | $ | 3,532,514 | |
Shares outstanding – Administrator Class | | | 3,532,376 | |
Net asset value per share – Administrator Class | | | $1.00 | |
Net assets – Institutional Class | | $ | 2,666,276,323 | |
Shares outstanding – Institutional Class | | | 2,666,293,039 | |
Net asset value per share – Institutional Class | | | $1.00 | |
Net assets – Service Class | | $ | 351,080,701 | |
Shares outstanding – Service Class | | | 351,082,155 | |
Net asset value per share – Service Class | | | $1.00 | |
| 1. | The Fund has an unlimited number of authorized shares. |
The accompanying notes are an integral part of these financial statements.
| | | | |
| 24 | | Wells Fargo Advantage Municipal Cash Management Money Market Fund | | Statement of Operations—Six Months Ended July 31, 2011 (Unaudited) |
| | | | |
| | | | |
| |
Investment income | | | | |
Interest | | $ | 5,361,002 | |
| | | | |
| |
Expenses | | | | |
Advisory fee | | | 1,913,547 | |
Administration fees | | | | |
Fund level | | | 956,773 | |
Administrator Class | | | 2,236 | |
Institutional Class | | | 1,403,940 | |
Service Class | | | 187,663 | |
Shareholder servicing fees | | | | |
Administrator Class | | | 2,236 | |
Service Class | | | 356,400 | |
Custody and accounting fees | | | 117,320 | |
Professional fees | | | 11,770 | |
Registration fees | | | 88,886 | |
Shareholder report expenses | | | 3,314 | |
Trustees’ fees and expenses | | | 17,794 | |
Other fees and expenses | | | 44,617 | |
| | | | |
Total expenses | | | 5,106,496 | |
Less: Fee waivers and/or expense reimbursements | | | (1,309,088 | ) |
| | | | |
Net expenses | | | 3,797,408 | |
| | | | |
Net investment income | | | 1,563,594 | |
Net realized gains on investments | | | 39,744 | |
| | | | |
Net increase in net assets resulting from operations | | $ | 1,603,338 | |
| | | | |
The accompanying notes are an integral part of these financial statements.
| | | | | | |
| Statements of Changes in Net Assets | | Wells Fargo Advantage Municipal Cash Management Money Market Fund | | | 25 | |
| | | | | | | | | | | | | | | | | | | | | | | | |
| | | Six Months Ended
July 31, 2011 (Unaudited) | | | Year Ended
January 31, 20111,2 | | | Year Ended
February 28, 20101 | |
| | | | | | |
Operations | | | | | | | | | | | | | | | | | | | | | | | | |
Net investment income | | | | | | $ | 1,563,594 | | | | | | | $ | 7,347,096 | | | | | | | $ | 27,544,592 | |
Net realized gains (losses) on investments | | | | | | | 39,744 | | | | | | | | 593,145 | | | | | | | | (85,931 | ) |
| | | | | | | | | | | | | | | | | | | | | | | | |
Net increase in net assets resulting from operations | | | | | | | 1,603,338 | | | | | | | | 7,940,241 | | | | | | | | 27,458,661 | |
| | | | | | | | | | | | | | | | | | | | | | | | |
| | | | | | |
Distributions to shareholders from | | | | | | | | | | | | | | | | | | | | | | | | |
Net investment income | | | | | | | | | | | | | | | | | | | | | | | | |
Administrator Class | | | | | | | (545 | ) | | | | | | | (904 | )3 | | | | | | | NA | |
Institutional Class | | | | | | | (1,547,444 | ) | | | | | | | (7,308,872 | )4 | | | | | | | (26,535,443 | )4 |
Service Class | | | | | | | (15,639 | ) | | | | | | | (37,325 | )5 | | | | | | | (1,625,517 | )5 |
| | | | | | | | | | | | | | | | | | | | | | | | |
Total distributions to shareholders | | | | | | | (1,563,628 | ) | | | | | | | (7,347,101 | ) | | | | | | | (28,160,960 | ) |
| | | | | | | | | | | | | | | | | | | | | | | | |
| | | | | | |
Capital share transactions | | | | | | | | | | | | | | | | | | | | | | | | |
Proceeds from shares sold | | | | | | | | | | | | | | | | | | | | | | | | |
Administrator Class | | | 0 | | | | 0 | | | | 9,625,910 | 3 | | | 9,625,910 | 3 | | | NA | | | | NA | |
Institutional Class | | | 5,176,385,415 | | | | 5,176,385,415 | | | | 14,257,502,953 | 4 | | | 14,257,502,953 | 4 | | | 19,649,803,982 | 4 | | | 19,649,803,982 | 4 |
Service Class | | | 583,087,328 | | | | 583,087,328 | | | | 1,392,635,202 | 5 | | | 1,392,635,202 | 5 | | | 1,225,199,778 | 5 | | | 1,225,199,778 | 5 |
| | | | | | | | | | | | | | | | | | | | | | | | |
| | | | | | | 5,759,472,743 | | | | | | | | 15,659,764,065 | | | | | | | | 20,875,003,760 | |
| | | | | | | | | | | | | | | | | | | | | | | | |
Reinvestment of distributions | | | | | | | | | | | | | | | | | | | | | | | | |
Administrator Class | | | 538 | | | | 538 | | | | 904 | 3 | | | 904 | 3 | | | NA | | | | NA | |
Institutional Class | | | 496,161 | | | | 496,161 | | | | 2,354,719 | 4 | | | 2,354,719 | 4 | | | 9,620,692 | 4 | | | 9,620,692 | 4 |
Service Class | | | 4,516 | | | | 4,516 | | | | 14,614 | 5 | | | 14,614 | 5 | | | 1,057,889 | 5 | | | 1,057,889 | 5 |
| | | | | | | | | | | | | | | | | | | | | | | | |
| | | | | | | 501,215 | | | | | | | | 2,370,237 | | | | | | | | 10,678,581 | |
| | | | | | | | | | | | | | | | | | | | | | | | |
Payment for shares redeemed | | | | | | | | | | | | | | | | | | | | | | | | |
Administrator Class | | | (6,094,976 | ) | | | (6,094,976 | ) | | | 0 | 3 | | | 0 | 3 | | | NA | | | | NA | |
Institutional Class | | | (6,625,834,546 | ) | | | (6,625,834,546 | ) | | | (14,868,373,142 | )4 | | | (14,868,373,142 | )4 | | | (21,230,923,159 | )4 | | | (21,230,923,159 | )4 |
Service Class | | | (544,684,670 | ) | | | (544,684,670 | ) | | | (1,647,501,899 | )5 | | | (1,647,501,899 | )5 | | | (1,492,774,645 | )5 | | | (1,492,774,645 | )5 |
| | | | | | | | | | | | | | | | | | | | | | | | |
| | | | | | | (7,176,614,192 | ) | | | | | | | (16,515,875,041 | ) | | | | | | | (22,723,697,804 | ) |
| | | | | | | | | | | | | | | | | | | | | | | | |
Net decrease in net assets resulting
from capital share transactions | | | | | | | (1,416,640,234 | ) | | | | | | | (853,740,739 | ) | | | | | | | (1,838,015,463 | ) |
| | | | | | | | | | | | | | | | | | | | | | | | |
Total decrease in net assets | | | | | | | (1,416,600,524 | ) | | | | | | | (853,147,599 | ) | | | | | | | (1,838,717,762 | ) |
| | | | | | | | | | | | | | | | | | | | | | | | |
| | | | | | |
Net assets | | | | | | | | | | | | | | | | | | | | | | | | |
Beginning of period | | | | | | | 4,437,490,062 | | | | | | | | 5,290,637,661 | | | | | | | | 7,129,355,423 | |
| | | | | | | | | | | | | | | | | | | | | | | | |
End of period | | | | | | $ | 3,020,889,538 | | | | | | | $ | 4,437,490,062 | | | | | | | $ | 5,290,637,661 | |
| | | | | | | | | | | | | | | | | | | | | | | | |
Undistributed net investment income | | | | | | $ | 83,316 | | | | | | | $ | 83,350 | | | | | | | $ | 83,355 | |
| | | | | | | | | | | | | | | | | | | | | | | | |
| 1. | After the close of business on July 9, 2010, the Fund acquired the net assets of Evergreen Institutional Municipal Money Market Fund which became the accounting and performance survivor in the transaction. The information for the periods prior to July 12, 2010 is that of Evergreen Institutional Municipal Money Market Fund. |
| 2. | For the eleven months ended January 31, 2011. The Fund changed its fiscal year end from February 28 to January 31, effective January 31, 2011. |
| 3. | Class commenced operations on July 9, 2010. |
| 4. | Class I, Class AD and Class IN shares of Evergreen Institutional Municipal Money Market Fund became Institutional Class shares on July 12, 2010. |
| 5. | Class IS and Class P shares of Evergreen Institutional Municipal Money Market Fund became Service Class shares on July 12, 2010. |
The accompanying notes are an integral part of these financial statements.
| | | | |
| 26 | | Wells Fargo Advantage Municipal Cash Management Money Market Fund | | Financial Highlights |
(For a share outstanding throughout each period)
| | | | | | | | |
| Administrator Class | | Six Months Ended
July 31, 2011 (Unaudited) | | | Year Ended
January 31, 20111 | |
Net asset value, beginning of period | | $ | 1.00 | | | $ | 1.00 | |
Net investment income | | | 0.00 | 2 | | | 0.00 | 2 |
Net realized gains (losses) on investments | | | 0.00 | 2 | | | 0.00 | 2 |
| | | | | | | | |
Total from investment operations | | | 0.00 | 2 | | | 0.00 | 2 |
Distributions to shareholders from | | | | | | | | |
Net investment income | | | (0.00 | )2 | | | (0.00 | )2 |
Net asset value, end of period | | $ | 1.00 | | | $ | 1.00 | |
Total return3 | | | 0.01 | % | | | 0.03 | % |
Ratios to average net assets (annualized) | | | | | | | | |
Gross expenses | | | 0.37 | % | | | 0.38 | % |
Net expenses | | | 0.26 | % | | | 0.30 | % |
Net investment income | | | 0.02 | % | | | 0.07 | % |
Supplemental data | | | | | | | | |
Net assets, end of period (000’s omitted) | | | $3,533 | | | | $9,627 | |
| 1. | For the period from July 9, 2010 (commencement of class operations) to January 31, 2011. |
| 2. | Amount is less than $0.005. |
| 3. | Returns for periods of less than one year are not annualized. |
The accompanying notes are an integral part of these financial statements.
| | | | | | |
| Financial Highlights | | Wells Fargo Advantage Municipal Cash Management Money Market Fund | | | 27 | |
(For a share outstanding throughout each period)
| | | | | | | | | | | | | | | | | | | | | | | | | | | | |
| | | Six Months Ended
July 31, 2011
(Unaudited) | | | Year Ended
January 31,
20111,2 | | | Year Ended February 28, | |
| Institutional Class | | | | 20101 | | | 20091 | | | 20081 | | | 20071 | | | 20061 | |
Net asset value, beginning of period | | | $1.00 | | | | $1.00 | | | | $1.00 | | | | $1.00 | | | | $1.00 | | | | $1.00 | | | | $1.00 | |
Net investment income | | | 0.00 | 3 | | | 0.00 | 3 | | | 0.00 | 3 | | | 0.02 | | | | 0.03 | | | | 0.03 | | | | 0.03 | |
Net realized gains (losses) on investments | | | 0.00 | 3 | | | 0.00 | 3 | | | 0.00 | | | | 0.00 | | | | 0.00 | | | | 0.00 | | | | 0.00 | |
| | | | | | | | | | | | | | | | | | | | | | | | | | | | |
Total from investment operations | | | 0.00 | 3 | | | 0.00 | 3 | | | 0.00 | 3 | | | 0.02 | | | | 0.03 | | | | 0.03 | | | | 0.03 | |
Distributions to shareholders from | | | | | | | | | | | | | | | | | | | | | | | | | | | | |
Net investment income | | | (0.00 | )3 | | | (0.00 | )3 | | | (0.00 | )3 | | | (0.02 | ) | | | (0.03 | ) | | | (0.03 | ) | | | (0.03 | ) |
Net asset value, end of period | | | $1.00 | | | | $1.00 | | | | $1.00 | | | | $1.00 | | | | $1.00 | | | | $1.00 | | | | $1.00 | |
Total return4 | | | 0.04 | % | | | 0.16 | % | | | 0.40 | % | | | 2.20 | % | | | 3.49 | % | | | 3.47 | % | | | 2.56 | % |
Ratios to average net assets (annualized) | | | | | | | | | | | | | | | | | | | | | | | | | | | | |
Gross expenses | | | 0.24 | % | | | 0.24 | % | | | 0.23 | % | | | 0.22 | % | | | 0.21 | % | | | 0.22 | % | | | 0.22 | % |
Net expenses | | | 0.19 | % | | | 0.21 | % | | | 0.23 | % | | | 0.22 | % | | | 0.21 | % | | | 0.22 | % | | | 0.22 | % |
Net investment income | | | 0.09 | % | | | 0.16 | % | | | 0.40 | % | | | 2.20 | % | | | 3.49 | % | | | 3.47 | % | | | 2.56 | % |
Supplemental data | | | | | | | | | | | | | | | | | | | | | | | | | | | | |
Net assets, end of period (000’s omitted) | | $ | 2,666,276 | | | $ | 4,115,192 | | | $ | 4,580,024 | | | $ | 6,154,387 | | | $ | 5,671,591 | | | $ | 7,122,239 | | | $ | 6,721,625 | |
| 1. | After the close of business on July 9, 2010, the Fund acquired the net assets of Evergreen Institutional Municipal Money Market Fund which became the accounting and performance survivor in the transaction. The information for the periods prior to July 12, 2010 is that of Class I of Evergreen Institutional Municipal Money Market Fund. |
| 2. | For the eleven months ended January 31, 2011. The Fund changed its fiscal year end from February 28 to January 31, effective January 31, 2011. |
| 3. | Amount is less than $0.005. |
| 4. | Returns for periods of less than one year are not annualized. |
The accompanying notes are an integral part of these financial statements.
| | | | |
| 28 | | Wells Fargo Advantage Municipal Cash Management Money Market Fund | | Financial Highlights |
(For a share outstanding throughout each period)
| | | | | | | | | | | | | | | | | | | | | | | | | | | | |
| | | Six Months Ended
July 31, 2011
(Unaudited) | | | Year Ended
January 31,
20111,2 | | | Year Ended February 28, | |
| Service Class | | | | 20101 | | | 20091 | | | 20081 | | | 20071 | | | 20061 | |
Net asset value, beginning of period | | | $1.00 | | | | $1.00 | | | | $1.00 | | | | $1.00 | | | | $1.00 | | | | $1.00 | | | | $1.00 | |
Net investment income | | | 0.00 | 3 | | | 0.00 | 3 | | | 0.00 | 3 | | | 0.02 | | | | 0.03 | | | | 0.03 | | | | 0.02 | |
Net realized gains (losses) on investments | | | 0.00 | 3 | | | 0.00 | 3 | | | 0.00 | | | | 0.00 | | | | 0.00 | | | | 0.00 | | | | 0.00 | |
| | | | | | | | | | | | | | | | | | | | | | | | | | | | |
Total from investment operations | | | 0.00 | 3 | | | 0.00 | 3 | | | 0.00 | 3 | | | 0.02 | | | | 0.03 | | | | 0.03 | | | | 0.02 | |
Distributions to shareholders from | | | | | | | | | | | | | | | | | | | | | | | | | | | | |
Net investment income | | | (0.00 | )3 | | | (0.00 | )3 | | | (0.00 | )3 | | | (0.02 | ) | | | (0.03 | ) | | | (0.03 | ) | | | (0.02 | ) |
Net asset value, end of period | | | $1.00 | | | | $1.00 | | | | $1.00 | | | | $1.00 | | | | $1.00 | | | | $1.00 | | | | $1.00 | |
Total return4 | | | 0.00 | % | | | 0.01 | % | | | 0.20 | % | | | 1.95 | % | | | 3.23 | % | | | 3.21 | % | | | 2.31 | % |
Ratios to average net assets (annualized) | | | | | | | | | | | | | | | | | | | | | | | | | | | | |
Gross expenses | | | 0.51 | % | | | 0.50 | % | | | 0.48 | % | | | 0.47 | % | | | 0.46 | % | | | 0.47 | % | | | 0.47 | % |
Net expenses | | | 0.27 | % | | | 0.37 | % | | | 0.44 | % | | | 0.47 | % | | | 0.46 | % | | | 0.47 | % | | | 0.47 | % |
Net investment income | | | 0.01 | % | | | 0.01 | % | | | 0.21 | % | | | 1.85 | % | | | 3.16 | % | | | 3.15 | % | | | 2.24 | % |
Supplemental data | | | | | | | | | | | | | | | | | | | | | | | | | | | | |
Net assets, end of period (000’s omitted) | | $ | 351,081 | | | $ | 312,671 | | | $ | 564,325 | | | $ | 830,779 | | | $ | 732,031 | | | $ | 676,614 | | | $ | 688,734 | |
| 1. | After the close of business on July 9, 2010, the Fund acquired the net assets of Evergreen Institutional Municipal Money Market Fund which became the accounting and performance survivor in the transaction. The information for the periods prior to July 12, 2010 is that of Class IS of Evergreen Institutional Municipal Money Market Fund. |
| 2. | For the eleven months ended January 31, 2011. The Fund changed its fiscal year end from February 28 to January 31, effective January 31, 2011. |
| 3. | Amount is less than $0.005. |
| 4. | Returns for periods of less than one year are not annualized. |
The accompanying notes are an integral part of these financial statements.
| | | | | | |
| Notes to Financial Statements (Unaudited) | | Wells Fargo Advantage Municipal Cash Management Money Market Fund | | | 29 | |
1. ORGANIZATION
Wells Fargo Funds Trust (the “Trust”), a Delaware statutory trust organized on March 10, 1999, is an open-end management investment company registered under the Investment Company Act of 1940, as amended (the “1940 Act”). These financial statements report on Wells Fargo Advantage Municipal Cash Management Money Market Fund (the “Fund”) which is a diversified series of the Trust.
2. SIGNIFICANT ACCOUNTING POLICIES
The following significant accounting policies, which are consistently followed in the preparation of the financial statements of the Fund, are in conformity with U.S. generally accepted accounting principles which require management to make estimates and assumptions that affect the reported amounts of assets and liabilities, disclosure of contingent assets and liabilities at the date of the financial statements, and the reported amounts of revenues and expenses during the reporting period. Actual results could differ from those estimates.
Securities valuation
As permitted under Rule 2a-7 of the 1940 Act, securities are valued at amortized cost, which approximates fair value.
The valuation techniques used by the Fund to measure fair value are consistent with the market approach, income approach and/or cost approach, where applicable, for each security type.
Security transactions and income recognition
Securities transactions are recorded on a trade date basis. Realized gains or losses are reported on the basis of identified cost of securities delivered.
Interest income is accrued daily and bond discounts are accreted and premiums are amortized daily based on the effective interest method. To the extent debt obligations are placed on non-accrual status, any related interest income may be reduced by writing off interest receivables when the collection of all or a portion of interest has become doubtful based on consistently applied procedures. If the issuer subsequently resumes interest payments or when the collectability of interest is reasonably assured, the debt obligation is removed from non-accrual status.
Distributions to shareholders
Distributions to shareholders from net investment income are accrued daily and paid monthly. Distributions from net realized gains, if any, are recorded on the ex-dividend date. Such distributions are determined in conformity with income tax regulations, which may differ from generally accepted accounting principles.
Federal and other taxes
The Fund intends to continue to qualify as a regulated investment company by distributing substantially all of its investment company taxable and tax-exempt income and any net realized capital gains (after reduction for capital loss carryforwards) sufficient to relieve it from all, or substantially all, federal income taxes. Accordingly, no provision for federal income taxes was required.
The Fund’s income and federal excise tax returns and all financial records supporting those returns for the prior three fiscal years are subject to examination by the federal and Delaware revenue authorities.
As of January 31, 2011, the Fund had estimated net capital loss carryforwards, which were available to offset future net realized capital gains, in the amount of $144,100 expiring in 2019.
Under the recently enacted Regulated Investment Company Modernization Act of 2010, the Fund will be permitted to carry forward capital losses incurred in taxable years beginning after December 22, 2010 for an unlimited period. However, any losses incurred during those future taxable years will be required to be utilized prior to the losses incurred in pre-enactment taxable years. As a result of this ordering rule, pre-enactment capital loss carryforwards may be more likely to expire unused. Additionally, post-enactment capital losses that are carried forward will retain their character as either short-term or long-term capital losses rather than being considered all short-term as under previous law.
Class allocations
The separate classes of shares offered by the Fund differ principally in shareholder servicing and administration fees. Shareholders of each class bear certain expenses that pertain to that particular class. All shareholders bear the common expenses of the Fund, earn income from the portfolio, and are allocated unrealized gains and losses pro rata based on the
| | | | |
| 30 | | Wells Fargo Advantage Municipal Cash Management Money Market Fund | | Notes to Financial Statements (Unaudited) |
average daily net assets of each class, without distinction between share classes. Dividends are determined separately for each class based on income and expenses allocable to each class. Realized gains and losses are allocated to each class pro rata based upon the net assets of each class on the date realized. Differences in per share dividend rates generally result from the relative weightings of pro rata income and realized gain allocations and from differences in separate class expenses, including shareholder servicing and administration fees.
3. FAIR VALUATION MEASUREMENTS
Fair value measurements of investments are determined within a framework that has established a fair value hierarchy based upon the various data inputs utilized in determining the value of the Fund’s investments. The three-level hierarchy gives the highest priority to unadjusted quoted prices in active markets for identical assets or liabilities (Level 1) and the lowest priority to unobservable inputs (Level 3). The Fund’s investments are classified within the fair value hierarchy based on the lowest level of input that is significant to the fair value measurement. The inputs are summarized into three broad levels as follows:
| n | | Level 1 – quoted prices in active markets for identical securities |
| n | | Level 2 – other significant observable inputs (including quoted prices for similar securities, interest rates, prepayment speeds, credit risk, etc.) |
| n | | Level 3 – significant unobservable inputs (including the Fund’s own assumptions in determining the fair value of investments) |
The inputs or methodologies used for valuing securities are not necessarily an indication of the risk associated with investing in those securities.
At July 31, 2011, all of the Fund’s investments in securities carried at fair value were designated as Level 2 since the primary inputs include credit quality of the issuer and short-term interest rates which are observable.
Further details on the major security types can be found in the Fund’s Portfolio of Investments.
4. TRANSACTIONS WITH AFFILIATES AND OTHER EXPENSES
Advisory fee
The Trust has entered into an advisory contract with Wells Fargo Funds Management, LLC (“Funds Management”), an indirect wholly owned subsidiary of Wells Fargo & Company (“Wells Fargo”). The adviser is responsible for implementing investment policies and guidelines and for supervising the sub-adviser, who is responsible for day-to-day portfolio management of the Fund.
Pursuant to the contract, Funds Management is entitled to receive an annual advisory fee of 0.10% of the average daily net assets of the Fund.
Funds Management may retain the services of certain sub-advisers to provide daily portfolio management to the Fund. The fees related to sub-advisory services are borne directly by the adviser and do not increase the overall fees paid by the Fund to the adviser. Wells Capital Management Incorporated, an affiliate of Funds Management, is the sub-adviser to the Fund and is entitled to receive a fee from the adviser at an annual rate starting at 0.05% and declining to 0.01% as the average daily net assets of the Fund increase.
| | | | | | |
| Notes to Financial Statements (Unaudited) | | Wells Fargo Advantage Municipal Cash Management Money Market Fund | | | 31 | |
Administration and transfer agent fees
The Trust has entered into an administration agreement with Funds Management. Under this agreement, for providing administrative services, which includes paying fees and expenses for services provided by the transfer agent, sub-transfer agents, omnibus account servicers and record-keepers, Funds Management is entitled to receive from the Fund an annual fund level administration fee starting at 0.05% and declining to 0.03% as the average daily net assets of the Fund increase and a class level administration fee which is calculated based on the average daily net assets of each class as follows:
| | | | |
| | | Class Level
Administration Fee | |
Administrator Class | | | 0.10 | % |
Institutional Class | | | 0.08 | |
Service Class | | | 0.12 | |
Funds Management has contractually waived and/or reimbursed advisory and administration fees to the extent necessary to maintain certain net operating expense ratios for the Fund. Waiver of fees and/or reimbursement of expenses by Funds Management were made first from fund level expenses on a proportionate basis and then from class specific expenses.
Shareholder servicing fees
The Trust has entered into contracts with one or more shareholder servicing agents, whereby Service Class of the Fund is charged a fee at an annual rate of 0.25% of its average daily net assets. Administrator Class is charged a fee at an annual rate of 0.10% of its average daily net assets.
A portion of these total shareholder servicing fees were paid to affiliates of Wells Fargo.
5. INDEMNIFICATION
Under the Trust’s organizational documents, the officers and directors are indemnified against certain liabilities that may arise out of performance of their duties to the Trust. Additionally, in the normal course of business, the Trust may enter into contracts with service providers that contain a variety of indemnification clauses. The Trust’s maximum exposure under these arrangements is dependent on future claims that may be made against the Fund and, therefore, cannot be estimated.
6. NEW ACCOUNTING PRONOUNCEMENTS
In May 2011, the Financial Accounting Standards Board (“FASB”) issued Accounting Standards Update (“ASU”) No. 2011-04 “Amendments to Achieve Common Fair Value Measurement and Disclosure Requirements in U.S. GAAP and IFRSs”. ASU No. 2011-04 amends FASB ASC Topic 820, Fair Value Measurements and Disclosures, to establish common requirements for measuring fair value and for disclosing information about fair value measurements in accordance with GAAP. The ASU is effective prospectively for interim and annual periods beginning after December 15, 2011.
In April 2011, FASB issued ASU No. 2011-03 “Reconsideration of Effective Control for Repurchase Agreements”. ASU No. 2011-03 amends FASB ASC Topic 860, Transfers and Servicing, specifically the criteria required to determine whether a repurchase agreement (repo) and similar agreements should be accounted for as sales of financial assets or secured borrowings with commitments. ASU No. 2011-03 changes the assessment of effective control by focusing on the transferor’s contractual rights and obligations and removing the criterion to assess its ability to exercise those rights or honor those obligations. This could result in changes to the way entities account for certain transactions including repurchase agreements, mortgage dollar rolls and reverse repurchase agreements. The ASU will become effective on a prospective basis for new transfers and modifications to existing transactions as of the beginning of the first interim or annual period beginning on or after December 15, 2011.
As of July 31, 2011, management of the Fund is currently assessing the potential impact, in addition to expanded financial statement disclosure, that may result from adopting these ASUs.
| | | | |
| 32 | | Wells Fargo Advantage Municipal Cash Management Money Market Fund | | Other Information (Unaudited) |
PORTFOLIO HOLDINGS INFORMATION
The complete portfolio holdings for the Fund are publicly available on the Fund’s Web site
(www.wellsfargo.com/advantagefunds) on a monthly, seven-day delayed basis. The Fund files its complete schedule of portfolio holdings with the SEC for the first and third quarters of each fiscal year on Form N-Q, which is available without charge by visiting the SEC Web site at www.sec.gov. In addition, the Fund’s Form N-Q may be reviewed and copied at the SEC’s Public Reference Room in Washington, DC, and at regional offices in New York City, at 233 Broadway, and in Chicago, at 175 West Jackson Boulevard, Suite 900. Information about the Public Reference Room may be obtained by calling 1-800-SEC-0330.
PROXY VOTING INFORMATION
A description of the policies and procedures that the Fund uses to determine how to vote proxies relating to portfolio securities is available without charge, upon request, by calling 1-800-222-8222, visiting our Web site at www.wellsfargo.com/advantagefunds, or visiting the SEC Web site at www.sec.gov. Information regarding how the Fund voted proxies relating to portfolio securities during the most recent 12-month period ended June 30 is available without charge on the Fund’s Web site at www.wellsfargo.com/advantagefunds or by visiting the SEC Web site at www.sec.gov.
| | | | | | |
| Other Information (Unaudited) | | Wells Fargo Advantage Municipal Cash Management Money Market Fund | | | 33 | |
BOARD OF TRUSTEES
The following table provides basic information about the Board of Trustees (the “Trustees”) of the Trust and Officers of the Trust. This table should be read in conjunction with the Prospectus and the Statement of Additional Information1 of the Fund. Each of the Trustees and Officers listed below acts in identical capacities for the Wells Fargo Advantage family of funds, which consists of 144 funds comprising the Wells Fargo Funds Trust, Wells Fargo Variable Trust, Wells Fargo Master Trust and four closed-end funds (collectively the “Fund Complex”). All of the Trustees are also Members of the Audit and Governance Committees of each Trust in the Fund Complex. The mailing address of each Trustee and Officer is 525 Market Street, 12th Floor, San Francisco, CA 94105. Each Trustee and Officer serves an indefinite term, however, each Trustee serves such term until reaching the mandatory retirement age established by the Trustees.
Independent Trustees
| | | | | | |
Name and Year of Birth | | Position Held and Length of Service | | Principal Occupations During Past Five Years | | Other Directorships During
Past Five Years |
Peter G. Gordon
(Born 1942) | | Trustee, since 1998; Chairman, since 2005 | | Co-Founder, Chairman, President and CEO of Crystal Geyser. Water Company. Trustee Emeritus, Colby College | | Asset Allocation Trust |
Isaiah Harris, Jr.
(Born 1952) | | Trustee, since 2009 | | Retired. Prior thereto, President and CEO of BellSouth Advertising and Publishing Corp. from 2005 to 2007, President and CEO of BellSouth Enterprises from 2004 to 2005 and President of BellSouth Consumer Services from 2000 to 2003. Emeritus member of the Iowa State University Foundation Board of Governors. Emeritus Member of the Advisory Board of Iowa State University School of Business. Mr. Harris is a certified public accountant. | | CIGNA Corporation; Deluxe Corporation; Asset Allocation Trust |
Judith M. Johnson
(Born 1949) | | Trustee, since 2008 | | Retired. Prior thereto, Chief Executive Officer and Chief Investment Officer of Minneapolis Employees Retirement Fund from 1996 to 2008. Ms. Johnson is an attorney, certified public accountant and a certified managerial accountant. | | Asset Allocation Trust |
Leroy Keith, Jr.
(Born 1939) | | Trustee, since 2010 | | Chairman, Bloc Global Services (development and construction), Trustee of the Evergreen Funds from 1983 to 2010. Former Managing Director, Almanac Capital Management (commodities firm), former Partner, Stonington Partners, Inc. (private equity fund), former Director, Obagi Medical Products Co. and former Director, Lincoln Educational Services. | | Trustee, Virtus Fund Complex (consisting of 45 portfolios as of 12/31/10); Director, Diversapack Co. (packaging company); Asset Allocation Trust |
David F. Larcker
(Born 1950) | | Trustee, since 2009 | | James Irvin Miller Professor of Accounting at the Graduate School of Business, Stanford University, Director of Corporate Governance Research Program and Co-Director of The Rock Center for Corporate Governance since 2006. From 2005 to 2008, Professor of Accounting at the Graduate School of Business, Stanford University. Prior thereto, Ernst & Young Professor of Accounting at The Wharton School, University of Pennsylvania from 1985 to 2005. | | Asset Allocation Trust |
Olivia S. Mitchell
(Born 1953) | | Trustee, since 2006 | | International Foundation of Employee Benefit Plans Professor and Chair of the Department of Insurance and Risk Management, Wharton School of the University of Pennsylvania since 1993. Director of Wharton’s Pension Research Council and Boettner Center on Pensions & Retirement Research, and Research Associate at the National Bureau of Economic Research. Previously, Cornell University Professor from 1978 to 1993. | | Asset Allocation Trust |
| | | | |
| 34 | | Wells Fargo Advantage Municipal Cash Management Money Market Fund | | Other Information (Unaudited) |
| | | | | | |
Name and Year of Birth | | Position Held and Length of Service | | Principal Occupations During Past Five Years | | Other Directorships During
Past Five Years |
Timothy J. Penny
(Born 1951) | | Trustee, since 1996 | | President and CEO of Southern Minnesota Initiative Foundation, a non-profit organization, since 2007 and Senior Fellow at the Humphrey Institute Policy Forum at the University of Minnesota since 1995. Member of the Board of Trustees of NorthStar Education Finance, Inc., a non-profit organization, since 2007. | | Asset Allocation Trust |
Michael S. Scofield
(Born 1943) | | Trustee, since 2010 | | Currently serves on the Investment Company Institute’s Board of Governors and Executive Committee as well the In dependent Director’s Counsel Board of Governors and Executive Committee. Former Chairman of the Independent Directors Counsel. Trustee of the Evergreen Funds from 1984 to 2010. Retired Attorney, Law Offices of Michael S. Scofield and former Director and Chairman, Branded Media Corporation (multi-media branding company). | | Asset Allocation Trust |
Donald C. Willeke
(Born 1940) | | Trustee, since 1996 | | Principal of the law firm of Willeke & Daniels. General Counsel of the Minneapolis Employees Retirement Fund from 1984 until its consolidation into the Minnesota Public Employees Retirement Association on June 30, 2010. | | Asset Allocation Trust |
Officers
| | | | | | |
Name and Year of Birth | | Position Held and
Length of Service | | Principal Occupations During Past Five Years | | |
Karla M. Rabusch
(Born 1959) | | President, since 2003 | | Executive Vice President of Wells Fargo Bank, N.A. and President of Wells Fargo Funds Management, LLC since 2003. Senior Vice President and Chief Administrative Officer of Wells Fargo Funds Management, LLC from 2001 to 2003. | | |
C. David Messman
(Born 1960) | | Secretary, since 2000; Chief Legal Counsel, since 2003 | | Senior Vice President and Secretary of Wells Fargo Funds Management, LLC since 2001. Vice President and Managing Counsel of Wells Fargo Bank, N.A. since 1996. | | |
Kasey Phillips
(Born 1970) | | Treasurer, since 2008 | | Senior Vice President of Wells Fargo Funds Management, LLC since 2009. Senior Vice President of Evergreen Investment Management Company, LLC from 2006 to 2010. Treasurer of the Evergreen Funds from 2005 to 2010. Vice President and Assistant Vice President of Evergreen Investment Services, Inc. from 1999 to 2006. | | |
David Berardi
(Born 1975) | | Assistant Treasurer, since 2009 | | Vice President of Wells Fargo Funds Management, LLC since 2009 . Vice President of Evergreen Investment Management Company, LLC from 2008 to 2010. Assistant Vice President of Evergreen Investment Services, Inc. from 2004 to 2008. Manager of Fund Reporting and Control for Evergreen Investment Management Company, LLC from 2004 to 2010. | | |
Jeremy DePalma
(Born 1974) | | Assistant Treasurer, since 2009 | | Senior Vice President of Wells Fargo Funds Management, LLC since 2009. Senior Vice President of Evergreen Investment Management Company, LLC from 2008 to 2010. Vice President, Evergreen Investment Services, Inc. from 2004 to 2007. Assistant Vice President, Evergreen Investment Services, Inc. from 2000 to 2004 and the head of the Fund Reporting and Control Team within Fund Administration from 2005 to 2010. | | |
Debra Ann Early
(Born 1964) | | Chief Compliance Officer, since 2007 | | Chief Compliance Officer of Wells Fargo Funds Management, LLC since 2007. Chief Compliance Officer of Parnassus Investments from 2005 to 2007. Chief Financial Officer of Parnassus Investments from 2004 to 2007 and Senior Audit Manager of PricewaterhouseCoopers LLP from 1998 to 2004. | | |
| 1. | The Statement of Additional Information includes additional information about the Fund’s Trustees and is available, without charge, upon request, by calling 1-800-222-8222 or by visiting the Fund’s Web site at www.wellsfargo.com/advantagefunds. |
| | | | | | |
| Other Information (Unaudited) | | Wells Fargo Advantage Municipal Cash Management Money Market Fund | | | 35 | |
BOARD CONSIDERATION OF INVESTMENT ADVISORY AND SUB-ADVISORY AGREEMENTS:
California Municipal Money Market Fund, Municipal Cash Management Money Market Fund, Municipal Money Market Fund, National Tax-Free Money Market Fund, New Jersey Municipal Money Market Fund, New York Municipal Money Market Fund and Pennsylvania Municipal Money Market Fund
(Not all of the funds described in this Board considerations section are part of this shareholder report. This shareholder report only relates to Municipal Cash Management Money Market Fund.)
Each year, as required by Section 15 of the Investment Company Act of 1940 (the “1940 Act”), the Board of Trustees (the “Board”) of Wells Fargo Funds Trust (the “Trust”), all the members of which have no direct or indirect interest in the investment advisory and sub-advisory agreements and are not “interested persons” of the Trust, as defined in the 1940 Act (the “Independent Trustees”), determines whether to approve the continuation of the Trust’s investment advisory and sub-advisory agreements. In this regard, at an in person meeting held on March 24-25, 2011 (the “Meeting”), the Board reviewed and re-approved: (i) an investment advisory agreement with Wells Fargo Funds Management, LLC (“Funds Management”) for each of the California Municipal Money Market Fund, Municipal Cash Management Money Market Fund, Municipal Money Market Fund, National Tax-Free Money Market Fund, New Jersey Municipal Money Market Fund, New York Municipal Money Market Fund and Pennsylvania Municipal Money Market Fund (collectively, the “Funds”); and (ii) an investment sub-advisory agreement with Wells Capital Management Incorporated (“Wells Capital Management”) for each of the Funds. The investment advisory agreements with Funds Management and the investment sub-advisory agreements with Wells Capital Management are collectively referred to as the “Advisory Agreements.”
At the Meeting, the Board considered the factors and reached the conclusions described below relating to the selection of Funds Management and Wells Capital Management and continuation of the Advisory Agreements. Prior to the Meeting, the Trustees conferred extensively among themselves and with representatives of Funds Management about these matters. The Board also met throughout the year and received information that was useful to them in considering the continuation of the Advisory Agreements. The Independent Trustees were assisted in their evaluation of the Advisory Agreements by independent legal counsel, from whom they received separate legal advice and with whom they met separately from Funds Management.
Nature, extent and quality of services
The Board received and considered various information regarding the nature, extent and quality of services provided to the Funds by Funds Management and Wells Capital Management under the Advisory Agreements. The Board also received and considered information provided in response to a detailed set of requests submitted by the Independent Trustees’ independent legal counsel on their behalf. The Board received and considered, among other things, information about the background and experience of senior management of Funds Management, and the qualifications, backgrounds, tenures and responsibilities of the portfolio managers primarily responsible for the day-to-day portfolio management of the Funds.
The Board evaluated the ability of Funds Management and Wells Capital Management, based on their respective financial condition, resources, reputation and other attributes, to attract and retain qualified investment professionals, including research, advisory, and supervisory personnel. The Board further considered the compliance programs and compliance records of Funds Management and Wells Capital Management. In addition, the Board took into account the administrative services provided to the Funds by Funds Management and its affiliates.
The Board’s decision to approve the continuation of the Advisory Agreements was based on a comprehensive evaluation of all of the information provided to it. In approving the continuation of the Advisory Agreements, the Board did not identify any particular information or consideration that was all-important or controlling, and each Trustee attributed different weights to various factors. The Board evaluated information provided to it both in terms of the funds generally and with respect to each Fund specifically as it considered appropriate. Although the Board considered the continuation of the Advisory Agreements for each of the Funds as part of the larger process of considering the continuation of the advisory agreements for all of the funds, its decision to continue the Advisory Agreements for each of the Funds was ultimately made on a fund-by-fund basis.
In considering these matters, the Board considered not only the specific information presented in connection with the Meeting, but also the knowledge gained over time through interaction with Funds Management and Wells Capital Management about various topics, including Funds Management’s oversight of service providers. The above factors,
| | | | |
| 36 | | Wells Fargo Advantage Municipal Cash Management Money Market Fund | | Other Information (Unaudited) |
together with those referenced below, are some of the most important, but not necessarily all, factors considered by the Board in concluding that it was satisfied with the nature, extent and quality of the investment advisory services provided to each Fund by Funds Management and Wells Capital Management.
Fund performance and expenses
The Board considered the performance results for each of the Funds over various time periods ended December 31, 2010. The Board also considered these results in comparison to the median performance of a universe of relevant funds (the “Universe”) that were determined by Lipper Inc. (“Lipper”) to be similar to the Funds, and in comparison to each Fund’s benchmark index and to other comparative data. Lipper is an independent provider of investment company data. The Board received a description of the methodology used by Lipper to select the mutual funds in the Universe.
The Board noted that the performance of each of the Funds was generally higher than or in range of the median performance of the Universe for the periods under review.
The Board received and considered information regarding each Fund’s contractual advisory fee and net operating expense ratios and their various components, including actual management fees (which reflect fee waivers, if any), transfer agent, custodian and other non-management fees, Rule 12b-1 and non-Rule 12b-1 fees, service fees and fee waiver and expense reimbursement arrangements. The Board also considered these ratios in comparison to the median ratios of an expense Universe and a narrower expense group of mutual funds (each, an “Expense Group”) that was determined by Lipper to be similar to each Fund. The Board received a description of the methodology used by Lipper to select the mutual funds in a Fund’s Expense Group. The Board noted that the net operating expense ratios of the Service Class, Administrator Class and Institutional Class of each of the Funds were in range of each Fund’s respective Expense Group’s median net operating expense ratio. The Board also noted that the net operating expense ratios of the Class A and Sweep Class of each of the Funds were higher than each Fund’s respective Expense Group’s median net operating expense ratio and that the net operating expense ratio of the Municipal Money Market Fund (Investor Class) was not appreciably higher than the Expense Group’s median net operating expense ratio.
Based on the above-referenced considerations and other factors, the Board concluded that the overall performance and expense structure of the Funds supported the re-approval of the Advisory Agreements for the Funds.
Investment advisory and sub-advisory fee rates
The Board reviewed and considered the contractual investment advisory fee rates that are payable by the Funds to Funds Management for investment advisory services (the “Advisory Agreement Rates”), both on a stand-alone basis and on a combined basis with the Funds’ administration fee rates. The Board took into account the separate administrative and other services covered by the administration fee rates. The Board also reviewed and considered the contractual investment sub-advisory fee rates that are payable by Funds Management to Wells Capital Management for investment sub-advisory services (the “Sub-Advisory Agreement Rates”). In addition, the Board reviewed and considered the existing fee waiver/cap arrangements applicable to the Advisory Agreement Rates and considered the Advisory Agreement Rates after taking the waivers/caps into account (the “Net Advisory Rates”).
The Board received and considered information comparing the Advisory Agreement Rates and Net Advisory Rates with those of other funds in each Fund’s Expense Group median. The Board noted that the Advisory Agreement Rates for each of the Funds were in range of the median rate of each Fund’s Expense Group, except for the Municipal Money Market Fund and the New York Municipal Money Market Fund (Sweep Class). The Board noted that the Net Advisory Rates for the Service Class, Administrator Class and the Institutional Class of each of the Funds were lower than or in range of the median rate of each Fund’s Expense Group. The Board noted that the Net Advisory Rate for the Investor Class, Class A and Sweep Class of each of the Funds was not appreciably higher than the median rate for the Fund’s Expense, except for the Sweep Class of the Municipal Money Market Fund, New Jersey Municipal Money Market Fund and the New York Municipal Money Market Fund. The Board further noted that Funds Management had agreed to continue and, in certain instances, reduce contractual fee cap arrangements for the Funds designed to lower the Funds’ expenses.
The Board also received and considered information about the nature and extent of services offered and fee rates charged by Funds Management and Wells Capital Management to other types of clients. In this regard, the Board received information about differences between the services, and the compliance, reporting, and other legal burdens and risks of providing investment advice to mutual funds and those associated with providing advice to non-mutual fund clients such as collective funds or institutional separate accounts.
| | | | | | |
| Other Information (Unaudited) | | Wells Fargo Advantage Municipal Cash Management Money Market Fund | | | 37 | |
In each case, the Board determined that the Advisory Agreement Rates for the Funds, both with and without administration fee rates and before and after waivers, were acceptable in light of the Funds’ Expense Group information, the net expense ratio commitments, the services covered by the Advisory Agreements and other information provided. The Board also reviewed and considered the Sub-Advisory Agreement Rates and concluded that the Sub-Advisory Agreement Rates were acceptable in light of the services covered by the Sub-Advisory Agreement and other information provided.
Profitability
The Board received and considered a profitability analysis of Funds Management, as well as an analysis of the profitability to the collective Wells Fargo businesses that provide services to the Funds. It considered that the information provided to it was necessarily estimated, and that the profitability information provided to it, especially on a fund-by-fund basis, did not necessarily provide a precise tool for evaluating the appropriateness of each Fund’s Advisory Agreement Rates in isolation. It noted that the levels of profitability of the Funds to Funds Management varied widely, depending on, among other things, the size and type of fund. The Board concluded that the profitability to Funds Management of the services provided to any of the Funds, individually or in the aggregate, was not unreasonable.
The Board did not consider separate profitability information with respect to Wells Capital Management, because, as an affiliate of Funds Management, its profitability information was subsumed in the collective Wells Fargo profitability analysis provided by Funds Management.
Economies of scale
With respect to possible economies of scale, the Board reviewed the breakpoints in each Fund’s advisory fee structure, which operate generally to reduce the effective Advisory Agreement Rates of the Funds (as a percentage of Fund assets) as the Funds grow in size. It considered that, as a fund shrinks in size, breakpoints conversely result in increasing fee levels. The Board noted that it would continue to review the appropriate levels of breakpoints in the future, and concluded that the breakpoints as implemented appeared to be a reasonable step toward sharing economies of scale with the Funds. However, the Board acknowledged the inherent limitations of any analysis of an investment adviser’s economies of scale and of any attempt to correlate breakpoints with such economies, stemming largely from the Board’s understanding that economies of scale are realized, if at all, by an investment adviser across a variety of products and services, not just with respect to a single fund.
Other benefits to Funds Management and Wells Capital Management
The Board received and considered information regarding potential “fall-out” or ancillary benefits received by Funds Management and its affiliates, including Wells Capital Management, as a result of their relationship with the Funds. Ancillary benefits could include, among others, benefits directly attributable to the relationship of Funds Management and Wells Capital Management with the Funds and benefits potentially derived from an increase in Funds Management’s and Wells Capital Management’s business as a result of their relationship with the Funds (such as the ability to market to shareholders other financial products offered by Funds Management and its affiliates, including Wells Capital Management).
The Board considered that Wells Fargo Funds Distributor, LLC, an affiliate of Funds Management, serves as distributor to the Funds and receives certain compensation for those services. The Board noted that the Funds pay sub-transfer agency fees to various financial institutions, including affiliates of Funds Management that hold fund shares in omnibus accounts. It also considered that these entities may receive distribution-related fees and shareholder servicing payments (including amounts derived from payments under the funds’ Rule 12b-1 plans) in respect of shares sold or held through them.
The Board also reviewed information about whether and to what extent soft dollar credits are sought and how any such credits are utilized and any benefits that may be realized by using an affiliated broker.
Other factors and broader review
The Board also considered the markets for distribution of the Funds’ shares, including the multiple channels through which the Funds’ shares are offered and sold. The Board noted that the Funds are part of one of the few fund families that have both direct-to-fund and intermediary distribution channels. As discussed above, the Board reviews detailed materials received from Funds Management and Wells Capital Management annually as part of the re-approval process under Section 15 of the 1940 Act and also reviews and assesses information about the quality of the services that the Funds receive throughout the year. In this regard, the Board has reviewed reports of Funds Management at each of its quarterly meetings, which include, among other things, portfolio reviews and performance reports. In addition, the Board confers with portfolio managers at various times throughout the year.
| | | | |
| 38 | | Wells Fargo Advantage Municipal Cash Management Money Market Fund | | Other Information (Unaudited) |
Conclusion
After considering the above-described factors and based on its deliberations and its evaluation of the information described above, the Board concluded that approval of the continuation of the Advisory Agreements for the Funds was in the best interest of the Funds and their shareholders. Accordingly, the Board unanimously approved the continuation of the Advisory Agreements for an additional one-year period.
| | | | | | |
| List of Abbreviations | | Wells Fargo Advantage Municipal Cash Management Money Market Fund | | | 39 | |
The following is a list of common abbreviations for terms and entities which may have appeared in this report.
| ABAG | — Association of Bay Area Governments |
| ACB | — Agricultural Credit Bank |
| ADR | — American Depositary Receipt |
| ADS | — American Depository Shares |
| AGC-ICC | — Assured Guaranty Corporation - Insured Custody Certificates |
| AGM | — Assured Guaranty Municipal |
| AMBAC | — American Municipal Bond Assurance Corporation |
| AMT | — Alternative Minimum Tax |
| ARM | — Adjustable Rate Mortgages |
| BAN | — Bond Anticipation Notes |
| BART | — Bay Area Rapid Transit |
| BHAC | — Berkshire Hathaway Assurance Corporation |
| CCAB | — Convertible Capital Appreciation Bond |
| CDA | — Community Development Authority |
| CDO | — Collateralized Debt Obligation |
| CDSC | — Contingent Deferred Sales Charge |
| CGIC | — Capital Guaranty Insurance Company |
| CGY | — Capital Guaranty Corporation |
| CIFG | — CDC (Caisse des Dépôts et Consignations) IX IS Financial
Guarantee |
| COP | — Certificate of Participation |
| DRIVER | — Derivative Inverse Tax-Exempt Receipts |
| DW&P | — Department of Water & Power |
| DWR | — Department of Water Resources |
| ECFA | — Educational & Cultural Facilities Authority |
| EDFA | — Economic Development Finance Authority |
| ETET | — Eagle Tax-Exempt Trust |
| ETF | — Exchange-Traded Fund |
| FFCB | — Federal Farm Credit Bank |
| FGIC | — Financial Guaranty Insurance Corporation |
| FHA | — Federal Housing Authority |
| FHAG | — Federal Housing Agency |
| FHLB | — Federal Home Loan Bank |
| FHLMC | — Federal Home Loan Mortgage Corporation |
| FNMA | — Federal National Mortgage Association |
| GDR | — Global Depositary Receipt |
| GNMA | — Government National Mortgage Association |
| HCFR | — Healthcare Facilities Revenue |
| HEFA | — Health & Educational Facilities Authority |
| HEFAR | — Higher Education Facilities Authority Revenue |
| HFA | — Housing Finance Authority |
| HFFA | — Health Facilities Financing Authority |
| HUD | — Housing & Urban Development |
| IBC | — Insured Bond Certificate |
| IDA | — Industrial Development Authority |
| IDAG | — Industrial Development Agency |
| IDR | — Industrial Development Revenue |
| KRW | — Republic of Korea Won |
| LIBOR | — London Interbank Offered Rate |
| LLC | — Limited Liability Company |
| LLP | — Limited Liability Partnership |
| MBIA | — Municipal Bond Insurance Association |
| MFHR | — Multi-Family Housing Revenue |
| MFMR | — Multi-Family Mortgage Revenue |
| MMD | — Municipal Market Data |
| MSTR | — Municipal Securities Trust Receipts |
| MUD | — Municipal Utility District |
| NATL-RE | — National Public Finance Guarantee Corporation |
| PCFA | — Pollution Control Finance Authority |
| PCR | — Pollution Control Revenue |
| PFA | — Public Finance Authority |
| PFFA | — Public Facilities Financing Authority |
| PFOTER | — Puttable Floating Option Tax-Exempt Receipts |
| plc | — Public Limited Company |
| PSFG | — Public School Fund Guaranty |
| PUTTER | — Puttable Tax-Exempt Receipts |
| R&D | — Research & Development |
| RDA | — Redevelopment Authority |
| RDFA | — Redevelopment Finance Authority |
| REIT | — Real Estate Investment Trust |
| RIB | — Residual Interest Bond |
| ROC | — Reset Option Certificates |
| SAVRS | — Select Auction Variable Rate Securities |
| SFHR | — Single Family Housing Revenue |
| SFMR | — Single Family Mortgage Revenue |
| SLMA | — Student Loan Marketing Association |
| SPDR | — Standard & Poor’s Depositary Receipts |
| STIT | — Short-Term Investment Trust |
| TAN | — Tax Anticipation Notes |
| TIPS | — Treasury Inflation-Protected Securities |
| TRAN | — Tax Revenue Anticipation Notes |
| TCR | — Transferable Custody Receipts |
| TTFA | — Transportation Trust Fund Authority |
| USD | — Unified School District |
| XLCA | — XL Capital Assurance |
This page is intentionally left blank.
This page is intentionally left blank.
This page is intentionally left blank.


FOR MORE INFORMATION
More information about Wells Fargo Advantage Funds is available free upon request. To obtain literature, please write, e-mail, visit the Funds’ Web site, or call:
Wells Fargo Advantage Funds
P.O. Box 8266
Boston, MA 02266-8266
E-mail: wfaf@wellsfargo.com
Web site: www.wellsfargo.com/advantagefunds
Individual investors: 1-800-222-8222
Retail investment professionals: 1-888-877-9275
Institutional investment professionals: 1-866-765-0778
This report and the financial statements contained herein are submitted for the general information of the shareholders of Wells Fargo Advantage Funds. If this report is used for promotional purposes, distribution of the report must be accompanied or preceded by a current prospectus. For a prospectus containing more complete information, including charges and expenses, call 1-800-222-8222 or visit the Funds’ Web site at www.wellsfargo.com/advantagefunds. Please consider the investment objectives, risks, charges, and expenses of the investment carefully before investing. This and other information about Wells Fargo Advantage Funds can be found in the current prospectus. Read the prospectus carefully before you invest or send money.
Wells Fargo Funds Management, LLC, a wholly owned subsidiary of Wells Fargo & Company, provides investment advisory and administrative services for Wells Fargo Advantage Funds. Other affiliates of Wells Fargo & Company provide subadvisory and other services for the Funds. The Funds are distributed by Wells Fargo Funds Distributor, LLC, Member FINRA/SIPC, an affiliate of Wells Fargo & Company.
NOT FDIC INSURED ¡ NO BANK GUARANTEE ¡ MAY LOSE VALUE
© 2011 Wells Fargo Funds Management, LLC. All rights reserved.
| | |
 | | 204803 09-11 SA307/SAR307 7-11 |

Wells Fargo Advantage
Municipal Money Market Fund

Semi-Annual Report
July 31, 2011

Reduce clutter. Save trees.
Sign up for electronic delivery of prospectuses and shareholder reports at www.wellsfargo.com/advantagedelivery
Contents
The views expressed and any forward-looking statements are as of July 31, 2011, unless otherwise noted and are those of the Fund managers and/or Wells Fargo Funds Management, LLC. Discussions of individual securities, or the markets generally, or any Wells Fargo Advantage Fund are not intended as individual recommendations. Future events or results may vary significantly from those expressed in any forward-looking statements; the views expressed are subject to change at any time in response to changing circumstances in the market. Wells Fargo Funds Management, LLC, disclaims any obligation to publicly update or revise any views expressed or forward-looking statements.
NOT FDIC INSURED ¡ NO BANK GUARANTEE ¡ MAY LOSE VALUE

WELLS FARGO INVESTMENT HISTORY
| | |
| |
| 1932 | | Keystone creates one of the first mutual fund families. |
| |
| 1971 | | Wells Fargo & Company introduces one of the first institutional index funds. |
| |
| 1978 | | Wells Fargo applies Markowitz and Sharpe’s research on Modern Portfolio Theory to introduce one of the industry’s first Tactical Asset Allocation (TAA) models in institutional separately managed accounts. |
| |
| 1984 | | Wells Fargo Stagecoach Funds launches its first asset allocation fund. |
| |
| 1989 | | The Tactical Asset Allocation (TAA) Model is first applied to Wells Fargo’s asset allocation mutual funds. |
| |
| 1994 | | Wells Fargo introduces the LifePath Funds, one of the first suites of target date funds (now the Wells Fargo Advantage Dow Jones Target Date FundsSM ). |
| |
| 1996 | | Evergreen Investments and Keystone Funds merge. |
| |
| 1997 | | Wells Fargo launches Wells Fargo Advantage WealthBuilder PortfoliosSM, a fund-of-funds suite of products that includes the use of quantitative models to shift assets among investment styles. |
| |
| 1999 | | Norwest Advantage Funds and Stagecoach Funds are reorganized into Wells Fargo Funds after the merger of Norwest and Wells Fargo. |
| |
| 2002 | | Evergreen Retail and Evergreen Institutional companies form the umbrella asset management company, Evergreen Investments. |
| |
| 2005 | | The integration of Strong Funds with Wells Fargo Funds creates Wells Fargo Advantage Funds, resulting in one of the top 20 mutual fund companies in the United States. |
| |
| 2006 | | Wells Fargo Advantage Funds relaunches the target date product line as Wells Fargo Advantage Dow Jones Target Date Funds. |
| |
| 2010 | | The mergers and reorganizations of Evergreen and Wells Fargo Advantage mutual funds are completed, unifying the families under the brand of Wells Fargo Advantage Funds. |
Wells Fargo Advantage Funds®
Wells Fargo Advantage Funds skillfully guides institutions, financial advisors, and individuals through the investment terrain to help them reach their financial objectives. Everything we do on behalf of investors is backed by our unique combination of qualifications.
Strength
Our organization is built on the standards of integrity and service established by our parent company—Wells Fargo & Company—more than 150 years ago. And, because we’re part of a highly diversified financial enterprise, we offer the depth of resources to help investors succeed.
Expertise
Our multi-boutique model offers investors access to the independent thinking of premier investment managers that have been chosen for their time-tested strategies. While each team specializes in a specific investment strategy, collectively they provide investors a wide choice of distinct investment styles. Our dedication to investment excellence doesn’t end with our expertise in manager selection—risk management, analysis, and rigorous ongoing review seek to ensure each manager’s investment process remains consistent.
Partnership
Our collaborative approach is built around understanding the needs and goals of our clients. By adhering to core principles of sound judgment and steady guidance, we support you through every stage of the investment decision process.
Carefully consider the investment objectives, risks, charges, and expenses before investing. For a current prospectus for Wells Fargo Advantage Funds containing this and other information, visit wellsfargo.com/advantagefunds. Read it carefully before investing.
Wells Fargo Funds Management, LLC, a wholly owned subsidiary of Wells Fargo & Company, provides investment advisory and administrative services for Wells Fargo Advantage Funds®. Other affiliates of Wells Fargo & Company provide subadvisory and other services for the Funds. The Funds are distributed by Wells Fargo Funds Distributor, LLC, Member FINRA/SIPC, an affiliate of Wells Fargo & Company.
The “Dow Jones Target Date Indexes” are a product of Dow Jones Indexes, a licensed trademark of CME Group Index Services LLC (“CME”). “Dow Jones” and “Dow Jones Target Date Indexes” are service marks of Dow Jones Trademark Holdings, LLC, and have been licensed for use for certain purposes by CME and sublicensed for use by Global Index Advisors, Inc., and Wells Fargo Funds Management, LLC. The Dow Jones Target Date Indexes are based in part on the Barclays Capital Bond Indexes, which are published by Barclays Capital Inc. The Wells Fargo Advantage Dow Jones Target Date Funds, based on the Dow Jones Target Date Indexes, are not sponsored, endorsed, sold, or promoted by Dow Jones, CME or Barclays Capital or any of their respective affiliates, and neither Dow Jones, CME nor Barclays Capital nor any of their respective affiliates makes any representation regarding the advisability of investing in such product(s) and/or about the quality, accuracy, and/or completeness of the Dow Jones Target Date Indexes or the Barclays Capital Bond Indexes. IN NO EVENT SHALL DOW JONES, CME, BARCLAYS CAPITAL, OR ANY OF THEIR LICENSORS HAVE ANY LIABILITY IN CONNECTION WITH THE Wells Fargo Advantage Dow Jones Target Date Funds INCLUDING, WITHOUT LIMITATION, FOR ANY SPECIAL, PUNITIVE, IN DIRECT, OR CONSEQUENTIAL DAMAGES (INCLUDING LOST PROFITS), EVEN IF NOTIFIED OF THE POSSIBILITY OF SUCH DAMAGES.
NOT FDIC INSURED ¡ NO BANK GUARANTEE ¡ MAY LOSE VALUE
Not part of the semi-annual report.
Wells Fargo Advantage Funds offers more than 110 mutual funds across a wide range of asset classes, representing over $221 billion in assets under management, as of July 31, 2011.
| | | | |
| Equity Funds | | | | |
Asia Pacific Fund | | Global Opportunities Fund | | Premier Large Company Growth Fund |
C&B Large Cap Value Fund | | Growth Fund | | Small Cap Opportunities Fund |
C&B Mid Cap Value Fund | | Health Care Fund | | Small Cap Value Fund |
Capital Growth Fund | | Index Fund | | Small Company Growth Fund |
Common Stock Fund | | International Equity Fund | | Small Company Value Fund |
Disciplined U.S. Core Fund | | International Value Fund | | Small/Mid Cap Core Fund |
Discovery Fund† | | Intrinsic Small Cap Value Fund | | Small/Mid Cap Value Fund |
Diversified Equity Fund | | Intrinsic Value Fund | | Social Sustainability Fund† |
Diversified International Fund | | Intrinsic World Equity Fund | | Special Mid Cap Value Fund |
Diversified Small Cap Fund | | Large Cap Core Fund | | Special Small Cap Value Fund |
Emerging Growth Fund | | Large Cap Growth Fund | | Specialized Technology Fund |
Emerging Markets Equity Fund | | Large Company Value Fund | | Strategic Large Cap Growth Fund |
Endeavor Select Fund† | | Omega Growth Fund | | Traditional Small Cap Growth Fund |
Enterprise Fund† | | Opportunity Fund† | | Utility and Telecommunications Fund |
Equity Value Fund | | Precious Metals Fund | | |
| Bond Funds | | | | |
Adjustable Rate Government Fund | | Inflation-Protected Bond Fund | | Short-Term Bond Fund |
California Limited-Term Tax-Free Fund | | Intermediate Tax/AMT-Free Fund | | Short-Term High Yield Bond Fund |
California Tax-Free Fund | | International Bond Fund | | Short-Term Municipal Bond Fund |
Colorado Tax-Free Fund | | Minnesota Tax-Free Fund | | Strategic Municipal Bond Fund |
Government Securities Fund | | Municipal Bond Fund | | Total Return Bond Fund |
High Income Fund | | North Carolina Tax-Free Fund | | Ultra Short-Term Income Fund |
High Yield Bond Fund | | Pennsylvania Tax-Free Fund | | Ultra Short-Term Municipal Income Fund |
Income Plus Fund | | Short Duration Government Bond Fund | | Wisconsin Tax-Free Fund |
| Asset Allocation Funds | | | | |
Asset Allocation Fund | | WealthBuilder Equity Portfolio† | | Target 2020 Fund† |
Conservative Allocation Fund | | WealthBuilder Growth Allocation Portfolio† | | Target 2025 Fund† |
Diversified Capital Builder Fund | | WealthBuilder Growth Balanced Portfolio† | | Target 2030 Fund† |
Diversified Income Builder Fund | | WealthBuilder Moderate Balanced Portfolio† | | Target 2035 Fund† |
Growth Balanced Fund | | WealthBuilder Tactical Equity Portfolio† | | Target 2040 Fund† |
Index Asset Allocation Fund | | Target Today Fund† | | Target 2045 Fund† |
Moderate Balanced Fund | | Target 2010 Fund† | | Target 2050 Fund† |
WealthBuilder Conservative Allocation Portfolio† | | Target 2015 Fund† | | Target 2055 Fund† |
| Money Market Funds | | | | |
100% Treasury Money Market Fund | | Minnesota Money Market Fund | | New Jersey Municipal Money Market Fund |
California Municipal Money Market Fund | | Money Market Fund | | New York Municipal Money Market Fund |
Cash Investment Money Market Fund | | Municipal Cash Management Money Market Fund | | Pennsylvania Municipal Money Market Fund |
Government Money Market Fund | | Municipal Money Market Fund | | Prime Investment Money Market Fund |
Heritage Money Market Fund† | | National Tax-Free Money Market Fund | | Treasury Plus Money Market Fund |
| Variable Trust Funds1 | | | | |
VT Discovery Fund† | | VT Intrinsic Value Fund | | VT Small Cap Growth Fund |
VT Index Asset Allocation Fund | | VT Omega Growth Fund | | VT Small Cap Value Fund |
VT International Equity Fund | | VT Opportunity Fund† | | VT Total Return Bond Fund |
An investment in a money market fund is not insured or guaranteed by the Federal Deposit Insurance Corporation or any other government agency. Although the Wells Fargo Advantage Money Market Funds seek to preserve the value of your investment at $1.00 per share, it is possible to lose money by investing in a money market fund.
| 1. | The Variable Trust Funds are generally available only through insurance company variable contracts. |
| † | In this report, the Wells Fargo Advantage Discovery FundSM, Wells Fargo Advantage Endeavor Select FundSM, Wells Fargo Advantage Enterprise FundSM, Wells Fargo Advantage Opportunity FundSM, Wells Fargo Advantage Social Sustainability FundSM, Wells Fargo Advantage WealthBuilder Conservative Allocation PortfolioSM, Wells Fargo Advantage WealthBuilder Equity PortfolioSM, Wells Fargo Advantage WealthBuilder Growth Allocation PortfolioSM, Wells Fargo Advantage WealthBuilder Growth Balanced PortfolioSM, Wells Fargo Advantage WealthBuilder Moderate Balanced PortfolioSM, Wells Fargo Advantage WealthBuilder Tactical Equity PortfolioSM, Wells Fargo Advantage Dow Jones Target Today FundSM, Wells Fargo Advantage Dow Jones Target 2010 FundSM, Wells Fargo Advantage Dow Jones Target 2015 FundSM, Wells Fargo Advantage Dow Jones Target 2020 FundSM, Wells Fargo Advantage Dow Jones Target 2025 FundSM, Wells Fargo Advantage Dow Jones Target 2030 FundSM, Wells Fargo Advantage Dow Jones Target 2035 FundSM, Wells Fargo Advantage Dow Jones Target 2040 FundSM, Wells Fargo Advantage Dow Jones Target 2045 FundSM, Wells Fargo Advantage Dow Jones Target 2050 FundSM, Wells Fargo Advantage Dow Jones Target 2055 FundSM, Wells Fargo Advantage Heritage Money Market FundSM, Wells Fargo Advantage VT Discovery FundSM, and Wells Fargo Advantage VT Opportunity FundSM are referred to as the Discovery Fund, Endeavor Select Fund, Enterprise Fund, Opportunity Fund, Social Sustainability Fund, WealthBuilder Conservative Allocation Portfolio, WealthBuilder Equity Portfolio, WealthBuilder Growth Allocation Portfolio, WealthBuilder Growth Balanced Portfolio, WealthBuilder Moderate Balanced Portfolio, WealthBuilder Tactical Equity Portfolio, Target Today Fund, Target 2010 Fund, Target 2015 Fund, Target 2020 Fund, Target 2025 Fund, Target 2030 Fund, Target 2035 Fund, Target 2040 Fund, Target 2045 Fund, Target 2050 Fund, Target 2055 Fund, Heritage Money Market Fund, VT Discovery Fund, and VT Opportunity Fund, respectively. |
Not part of the semi-annual report.
| | | | |
| 2 | | Wells Fargo Advantage Municipal Money Market Fund | | Letter to Shareholders |

Karla M. Rabusch,
President
Wells Fargo Advantage Funds
Dear Valued Shareholder,
We’re pleased to offer you this semi-annual report for the Wells Fargo Advantage Municipal Money Market Fund for the six-month period that ended July 31, 2011. Upon reviewing the report, you may notice a few changes from past reports, the most significant of which is the change from a multi-fund report to a single-fund report. We believe this change will give you more convenient access to your fund data.
The period began modestly as improving economic optimism generally shifted investors toward equities and riskier assets and away from U.S. Treasuries and lower-yielding fixed-income securities. Returns from fixed income were modest in the opening months of 2011 but were generally still positive as U.S. Treasury yields incrementally climbed higher. But after the slow start, bond prices once again strongly improved, sparked by a sharp decline in U.S. Treasury prices in April that carried into May. Late in the period, lower-rated bonds declined in price more than the higher credit-quality tiers but not enough to outweigh the stronger performance from lower-rated securities during the period. Lower-quality and longer-maturity fixed-income securities generally outperformed higher-quality and shorter-maturity securities over the full period.
The activity within the broader bond market also resonated with money market participants. As the economic and credit environment reverberated from the ongoing sovereign debt concerns and softening economic data, many participants continued to balance a need for stability and desire for higher yields. The result has been good demand for domestic commercial paper and certificate of deposits. Also, in spite of all the discussion about sovereign debt, many money market participants continue to maintain some exposures to foreign banks based on the quality of their fundamentals. By focusing more on the fundamentals and taking a more selective approach to the short-term security market helped the markets avoid the severe yield volatility or significant flight-to-quality experienced during the spring of 2010, when the Greek sovereign debt crisis first emerged.
The global economic “recovery” hit a snag, but the end of 2011 could regain momentum.
The U.S. economic recovery that began in mid-2009 and gained further momentum throughout 2010, particularly during the fourth quarter, has failed to maintain that level of growth through the first seven months of 2011. For example, gross domestic product (GDP), the broadest measure of economic activity, grew at an annualized rate of 3.1% in the fourth quarter of 2010, only to slow dramatically during the first quarter of 2011. The latest revision to first-quarter GDP data during the period indicated that the economy grew at an annualized rate of 0.4% during the first quarter of 2011. While still positive, it’s a much slower pace of growth than experienced in the second half of 2010 and notably lower than consensus forecasts. Nevertheless, the advance estimate of second-quarter 2011 GDP, which was released on July 29, 2011, was 1.3%, suggesting that the U.S. economy continues to expand, though at a slow and uneven pace.
Jobs and housing remained troublesome.
The July 2011 unemployment rate in the U.S. was reported at 9.1%, down from 9.5% a year earlier but still notably higher than historical averages. Unfortunately,
| | | | | | |
| Letter to Shareholders | | Wells Fargo Advantage Municipal Money Market Fund | | | 3 | |
the drop may be more attributable to a decline in the labor force than to a meaningful uptick in hiring. The level of job creation in 2011 has been trending below historical averages, suggesting that the improving economy has yet to translate into widespread hiring. Meanwhile, the beleaguered housing market was an ongoing source of concern, despite some tentative late-year signs of stabilization. That said, persistent weakness in the labor and housing markets bears close watching in the months ahead.
Other economic data in the U.S. has been more encouraging, reflecting greater confidence in the sustainability of the expansion on the part of both consumers and businesses. Retail sales came in strong at certain points during the period and industrial production and new orders have picked up. Although still reluctant to hire, businesses have gradually increased spending in other areas, such as equipment and information technology. Core inflation, which excludes volatile food and energy prices, remained benign.
The Federal Reserve believes the economic recovery will accelerate in future quarters.
With inflation subdued, the Federal Open Market Committee (FOMC) held its target range for the federal funds rate—a proxy for short-term interest rates—steady at 0.00% to 0.25%. On June 22, 2011, in its final statement of the six-month period, the Fed reiterated that the economic recovery “is proceeding at a moderate pace,” but that “recent labor market indicators have been weaker than anticipated.” It described the recent increase in inflation as temporary, suggesting that inflation pressures will ease going forward. While the FOMC explained that it “expects the pace of recovery to pick up over coming quarters,” it indicated that the federal funds rate will remain at an exceptionally low level for as long as necessary to ensure a sustainable recovery and expansion.
As recent headwinds subside, it is reasonable to expect markets to regain focus.
Now that it appears the debt ceiling has been increased and a U.S. default will be averted, money market participants and the broader bond market can get back to more fundamental and lasting concerns—chiefly, the economy. After avoiding short-term Treasuries in late July, ahead of pending U.S. debt ceiling deadline, money market participants have returned to the U.S. short-term markets.1 Economic indicators released in the second half of 2011 might not be as soft as those reported during the first half of the year. While that would not mean that the economy is robust, it might remind the markets that the first half of the slowdown was transitory. Most indicators still point toward real GDP growth in the 2% to 3% range in the second half of 2011. While that is not enough to produce big employment gains, it might be sufficient to cause Treasury yields to retrace some of the late-July declines.
Don’t let short-term uncertainty derail long-term investment goals.
While periods of uncertainty can present challenges, experience has taught us that maintaining a long-term investment strategy based on individual goals and risk tolerance can be an effective way to plan for the future. As a whole, Wells Fargo Advantage Funds represents investments across a broad range of asset classes and investment styles with more than 110 mutual funds, giving you an opportunity to create a diversified investment portfolio. While diversification may
| 1. | Comments expressed that do not fall within the reporting period are as of August 2, 2011. |
While the FOMC explained that it “expects the pace of recovery to pick up over coming quarters,” it indicated that the federal funds rate will remain at an exceptionally low level for as long as necessary to ensure a sustainable recovery and expansion.
Economic indicators released in the second half of 2011 might not be as soft as those reported during the first half of the year. While that would not mean that the economy is robust, it might remind the markets that the first half of the slowdown was transitory.
| | | | |
| 4 | | Wells Fargo Advantage Municipal Money Market Fund | | Letter to Shareholders |
not prevent losses in a downturn, it may help to reduce them and provide you with one way of managing risk.
In our opinion, diligent and earnest assessment of the fundamental characteristics of money market eligible securities will be a key differentiating factor between which investment strategies meet client expectations and which do not. At Wells Fargo Advantage Funds, we intend to continue the emphasis of principal preservation and high liquidity across our lineup of Wells Fargo Advantage Money Market Funds. In changing markets, we believe it is particularly important to have diligent investment analysts in charge of investor assets.
Thank you for choosing Wells Fargo Advantage Funds. We appreciate your confidence in us and are committed to helping you meet your financial needs. If you have any questions about your investments, please contact your investment professional, call us at 1-800-222-8222, or visit www.wellsfargo.com/advantagefunds.
Sincerely,

Karla M. Rabusch
President
Wells Fargo Advantage Funds
| | | | | | |
| Performance Highlights (Unaudited) | | Wells Fargo Advantage Municipal Money Market Fund | | | 5 | |
INVESTMENT OBJECTIVE
The Fund seeks current income exempt from regular federal income tax, while preserving capital and liquidity.
ADVISER
Wells Fargo Funds Management, LLC
SUB-ADVISER
Wells Capital Management Incorporated
PORTFOLIO MANAGERS
David D. Sylvester
James Randazzo
FUND INCEPTION
November 2, 1988
|
SECTOR DISTRIBUTION1 (AS OF JULY 31, 2011) |
|
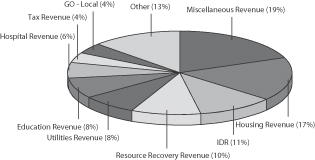 |
|
EFFECTIVE MATURITY DISTRIBUTION1 (AS OF JULY 31, 2011) |
|
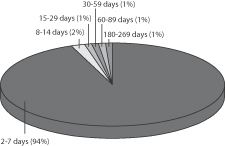 |
| | |
WEIGHTED AVERAGE MATURITY2 (AS OF JULY 31, 2011) | | |
10 Days |
| | |
WEIGHTED AVERAGE FINAL MATURITY3 (AS OF JULY 31, 2011) | | |
10 Days |
| 1. | Sector distribution and effective maturity distribution are subject to change and are calculated based on the total investments of the Fund. Effective maturity distribution is based on the weighted average maturity of each security. |
| 2. | Weighted Average Maturity (WAM): WAM calculates an average time to maturity of all of the securities held in the portfolio, weighted by each security’s percentage of net assets. The calculation takes into account the final maturity of a fixed-income security and the interest rate reset date for floating-rate securities held in the portfolio. This is a way to measure a fund’s sensitivity to potential interest rate changes. |
| 3. | Weighted Average Final Maturity (WAFM): WAFM calculates a fund’s average time to maturity for all of the securities held in the portfolio, weighted to their percentage of assets in the Fund. In contrast to WAM, the WAFM calculation takes into account the final maturity date for each security held in the portfolio. This is a way to measure a fund’s potential sensitivity to credit spread changes. |
| | | | |
| 6 | | Wells Fargo Advantage Municipal Money Market Fund | | Performance Highlights (Unaudited) |
AVERAGE ANNUAL TOTAL RETURN4 (%) (AS OF JULY 31, 2011)
| | | | | | | | | | | | | | | | | | | | | | | | | | | | |
| | | | | | | | | Expense Ratios5 | |
| | | Inception Date | | | 6 Months* | | | 1 Year | | | 5 Year | | | 10 Year | | | Gross | | | Net6 | |
Class A (WMUXX) | | | 01/05/1995 | | | | 0.00 | | | | 0.01 | | | | 1.23 | | | | 1.22 | | | | 0.84% | | | | 0.65% | |
Institutional Class (WMTXX)** | | | 07/09/2010 | | | | 0.03 | | | | 0.11 | | | | 1.43 | | | | 1.47 | | | | 0.45% | | | | 0.20% | |
Investor Class (WMVXX) | | | 07/09/2010 | | | | 0.00 | | | | 0.01 | | | | 1.40 | | | | 1.46 | | | | 0.87% | | | | 0.64% | |
Service Class (WMSXX) | | | 11/02/1988 | | | | 0.00 | | | | 0.01 | | | | 1.40 | | | | 1.46 | | | | 0.74% | | | | 0.45% | |
Sweep Class | | | 06/30/2000 | | | | 0.00 | | | | 0.01 | | | | 1.07 | | | | 0.99 | | | | 1.19% | | | | 1.05% | |
| * | Returns for periods of less than one year are not annualized. |
| ** | Institutional Class shares are closed to new investors. |
| | | | | | | | | | | | | | | | | | | | |
FUND YIELD SUMMARY6 (AS OF JULY 31, 2011) | | Class A | | | Institutional Class | | | Investor Class | | | Service Class | | | Sweep Class | |
7-Day Current Yield | | | 0.01% | | | | 0.01% | | | | 0.01% | | | | 0.01% | | | | 0.01% | |
7-Day Compound Yield | | | 0.01% | | | | 0.01% | | | | 0.01% | | | | 0.01% | | | | 0.01% | |
30-Day Simple Yield | | | 0.01% | | | | 0.01% | | | | 0.01% | | | | 0.01% | | | | 0.01% | |
30-Day Compound Yield | | | 0.01% | | | | 0.01% | | | | 0.01% | | | | 0.01% | | | | 0.01% | |
Figures quoted represent past performance, which is no guarantee of future results and do not reflect the deduction of taxes that a shareholder may pay on fund distributions or the redemption of fund shares. Investment returns will fluctuate. The Fund’s yield figures more closely reflect the current earnings of the Fund than the total return figures. Current performance may be lower or higher than the performance data quoted. Current month-end performance is available at the Fund’s Web site – www.wellsfargo.com/advantagefunds.
Each class is sold without a front-end sales charge or contingent deferred sales charge. Other fees and expenses apply to an investment in the Fund and are described in the Fund’s current prospectus.
An investment in a money market fund is not insured or guaranteed by the Federal Deposit Insurance Corporation or any other government agency. Although the Fund seeks to preserve the value of your investment at $1.00 per share, it is possible to lose money by investing in a money market fund. A portion of the Fund’s income may be subject to federal, state and/or local income taxes or the alternative minimum tax (AMT).
| 4. | Historical performance shown for the Institutional Class shares prior to their inception reflects the performance of the Service Class shares, and includes the higher expenses applicable to the Service Class shares. If these expenses had not been included, returns would be higher. Historical performance shown for the Investor Class shares prior to their inception reflects the performance of the Service Class shares, and has not been adjusted to include the higher expenses applicable to the Investor Class shares. If these expenses had been adjusted, returns would be lower. Historical performance shown for all classes of the Fund prior to July 12, 2010 is based on the performance of the Fund’s predecessor, Evergreen Municipal Money Market Fund. |
| 5. | Reflects the expense ratios as stated in the most recent prospectuses. |
| 6. | The Adviser has committed through July 11, 2013 to waive fees and/or reimburse expenses to the extent necessary to cap the Fund’s Total Annual Fund Operating Expenses After Fee Waiver, excluding certain expenses, at the amount shown above. Without this cap, the Fund’s returns would have been lower. Without waived fees and/or reimbursed expenses, the Fund’s 7-day current yield would have been (0.67)%, (0.28)%, (0.70)%, (0.57)% and (1.02)% for Class A, Institutional Class, Investor Class, Service Class and Sweep Class, respectively. |
| | | | | | |
| Fund Expenses | | Wells Fargo Advantage Municipal Money Market Fund | | | 7 | |
As a shareholder of the Fund, you incur two types of costs: (1) transaction costs, including contingent deferred sales charges (if any) and (2) ongoing costs, including management fees; distribution (12b-1) and/or shareholder service fees; and other Fund expenses. This example is intended to help you understand your ongoing costs (in dollars) of investing in the Fund and to compare these costs with the ongoing costs of investing in other mutual funds.
The example is based on an investment of $1,000 invested at the beginning of the six-month period and held for the entire period from February 1, 2011 to July 31, 2011.
Actual Expenses
The “Actual” line of the table below provides information about actual account values and actual expenses. You may use the information in this line, together with the amount you invested, to estimate the expenses that you paid over the period. Simply divide your account value by $1,000 (for example, an $8,600 account value divided by $1,000 = 8.6), then multiply the result by the number in the “Actual” line under the heading entitled “Expenses Paid During Period” for your applicable class of shares to estimate the expenses you paid on your account during this period.
Hypothetical Example for Comparison Purposes
The “Hypothetical” line of the table below provides information about hypothetical account values and hypothetical expenses based on the Fund’s actual expense ratio and an assumed rate of return of 5% per year before expenses, which is not the Fund’s actual return. The hypothetical account values and expenses may not be used to estimate the actual ending account balance or expenses you paid for the period. You may use this information to compare the ongoing costs of investing in the Fund and other funds. To do so, compare this 5% hypothetical example with the 5% hypothetical examples that appear in the shareholder reports of the other funds.
Please note that the expenses shown in the table are meant to highlight your ongoing costs only and do not reflect any transactional costs, such as any contingent deferred sales charges. Therefore, the “Hypothetical” line of the table is useful in comparing ongoing costs only, and will not help you determine the relative total costs of owning different funds. In addition, if these transactional costs were included, your costs would have been higher.
| | | | | | | | | | | | | | | | |
| | | Beginning
Account Value
02-01-2011 | | | Ending
Account Value
07-31-2011 | | | Expenses
Paid During
the Period¹ | | | Net Annual
Expense Ratio | |
Class A | | | | | | | | | | | | | | | | |
Actual | | $ | 1,000.00 | | | $ | 1,000.05 | | | $ | 1.19 | | | | 0.24 | % |
Hypothetical (5% return before expenses) | | $ | 1,000.00 | | | $ | 1,023.60 | | | $ | 1.20 | | | | 0.24 | % |
Institutional Class | | | | | | | | | | | | | | | | |
Actual | | $ | 1,000.00 | | | $ | 1,000.33 | | | $ | 0.94 | | | | 0.19 | % |
Hypothetical (5% return before expenses) | | $ | 1,000.00 | | | $ | 1,023.85 | | | $ | 0.95 | | | | 0.19 | % |
Investor Class | | | | | | | | | | | | | | | | |
Actual | | $ | 1,000.00 | | | $ | 1,000.05 | | | $ | 1.19 | | | | 0.24 | % |
Hypothetical (5% return before expenses) | | $ | 1,000.00 | | | $ | 1,023.60 | | | $ | 1.20 | | | | 0.24 | % |
Service Class | | | | | | | | | | | | | | | | |
Actual | | $ | 1,000.00 | | | $ | 1,000.05 | | | $ | 1.19 | | | | 0.24 | % |
Hypothetical (5% return before expenses) | | $ | 1,000.00 | | | $ | 1,023.60 | | | $ | 1.20 | | | | 0.24 | % |
Sweep Class | | | | | | | | | | | | | | | | |
Actual | | $ | 1,000.00 | | | $ | 1,000.05 | | | $ | 1.24 | | | | 0.25 | % |
Hypothetical (5% return before expenses) | | $ | 1,000.00 | | | $ | 1,023.55 | | | $ | 1.25 | | | | 0.25 | % |
| 1. | Expenses paid is equal to the annualized expense ratio of each class multiplied by the average account value over the period, multiplied by the number of days in the most recent fiscal half-year divided by the number of days in the fiscal year (to reflect the one-half year period). |
| | | | |
| 8 | | Wells Fargo Advantage Municipal Money Market Fund | | Portfolio of Investments—July 31, 2011 (Unaudited) |
| | | | | | | | | | | | | | | | |
| Security Name | | Interest Rate | | | Maturity Date | | | Principal | | | Value | |
| | | | | | | | | | | | | | | | |
| | | | |
Municipal Bonds and Notes: 91.30% | | | | | | | | | | | | | | | | |
| | | | |
Alabama: 5.05% | | | | | | | | | | | | | | | | |
| | | | |
| Variable Rate Demand Notes§: 5.05% | | | | | | | | | | | | | | | | |
Birmingham AL Special Care Facilities Finance Authority Ascension Health Series 2006-C (Hospital Revenue)†† | | | 0.08 | % | | | 05/15/2015 | | | $ | 23,625,000 | | | $ | 23,625,000 | |
Calhoun County AL Economic Development Council Southern BAG Expansion Project Series 1998 (IDR, Bank of America NA LOC) | | | 0.36 | | | | 03/01/2013 | | | | 1,150,000 | | | | 1,150,000 | |
Homewood AL Educational Building Authority (Education Revenue, Branch Banking & Trust LOC) | | | 0.08 | | | | 12/01/2043 | | | | 5,000,000 | | | | 5,000,000 | |
Lower Alabama Gas District Supply Revenue Series A (Utilities Revenue, Societe Generale LOC) | | | 0.13 | | | | 11/01/2027 | | | | 8,000,000 | | | | 8,000,000 | |
Mobile AL Downtown Redevelopment Authority Gulf Opportunity Zone Austal USA LLC Project Series A (IDR, National Australia Bank LOC) | | | 0.07 | | | | 05/01/2041 | | | | 4,300,000 | | | | 4,300,000 | |
Mobile AL Downtown Redevelopment Authority Gulf Opportunity Zone Austal USA LLC Project Series B (IDR) | | | 0.07 | | | | 05/01/2041 | | | | 4,070,000 | | | | 4,070,000 | |
Mobile AL Industrial Development Board Project Series 2006 (IDR) | | | 0.11 | | | | 08/01/2031 | | | | 6,000,000 | | | | 6,000,000 | |
Mobile County AL IDA Series B (Energy Revenue, Svenska HandelsBanken LOC) | | | 0.07 | | | | 07/01/2040 | | | | 22,500,000 | | | | 22,500,000 | |
Southeast Alabama Gas District Alabama Supply Project Series 2007-A (Utilities Revenue) | | | 0.24 | | | | 08/01/2027 | | | | 53,130,000 | | | | 53,130,000 | |
Sylacauga AL Harrells Fertilizer Incorporated (IDR, Bank of America NA LOC) | | | 0.40 | | | | 04/01/2021 | | | | 2,000,000 | | | | 2,000,000 | |
| | | | |
| | | | | | | | | | | | | | | 129,775,000 | |
| | | | | | | | | | | | | | | | |
| | | | |
Arizona: 0.94% | | | | | | | | | | | | | | | | |
| | | | |
| Variable Rate Demand Notes§: 0.94% | | | | | | | | | | | | | | | | |
Maricopa County AZ IDA Trans-Matic Manufacturing Production Project (IDR, PNC Bank NA LOC) | | | 0.12 | | | | 10/01/2026 | | | | 3,225,000 | | | | 3,225,000 | |
Arizona Health Facilities Authority Hospital System 2007-008 (Hospital Revenue) | | | 0.18 | | | | 02/01/2042 | | | | 12,385,000 | | | | 12,385,000 | |
Maricopa County AZ IDA Solid Waste Disposal Series 2006 (Resource Recovery Revenue, Farm Credit Services America LOC) | | | 0.18 | | | | 08/01/2026 | | | | 2,500,000 | | | | 2,500,000 | |
Maricopa County AZ IDA Solid Waste Disposal Ambian Dairy LLC Project Series 2008 (Resource Recovery Revenue, Farm Credit Services America LOC) | | | 0.23 | | | | 11/01/2033 | | | | 3,600,000 | | | | 3,600,000 | |
Pinal County AZ IDA Solid Waste Disposal Sorio Bravo Dairy Farm LLC Series 2002 (IDR, Farm Credit Services America LOC) | | | 0.18 | | | | 05/01/2027 | | | | 1,250,000 | | | | 1,250,000 | |
Pinal County AZ IDA Solid Waste Disposal Feenstra Investments LLC Project Series 2002 (Resource Recovery Revenue, Farm Credit Services America LOC) | | | 0.18 | | | | 08/01/2027 | | | | 1,250,000 | | | | 1,250,000 | |
| | | | |
| | | | | | | | | | | | | | | 24,210,000 | |
| | | | | | | | | | | | | | | | |
| | | | |
California: 1.74% | | | | | | | | | | | | | | | | |
| | | | |
| Variable Rate Demand Notes§: 1.74% | | | | | | | | | | | | | | | | |
California CDA Pennsylvania Valley Apartment Authority Project Series 2001 (Housing Revenue, FHLMC Insured) | | | 0.18 | | | | 08/01/2033 | | | | 1,685,000 | | | | 1,685,000 | |
California CDA Refunding MFHR PUTTER Series 2680 (Housing Revenue, JPMorgan Chase Bank LOC) | | | 0.22 | | | | 05/15/2018 | | | | 900,000 | | | | 900,000 | |
California Refunding GO Branch Banking & Trust Company Municipal Trust Series 2000 (GO-State, Branch Banking & Trust LOC, FSA Insured) | | | 0.15 | | | | 07/10/2027 | | | | 1,560,000 | | | | 1,560,000 | |
JP Morgan Chase PUTTER Trust Series 3931 (Tax Revenue) | | | 0.21 | | | | 08/12/2012 | | | | 5,000,000 | | | | 5,000,000 | |
JPMorgan Chase PUTTER Trust Series 3934 (Miscellaneous Revenue)†† | | | 0.20 | | | | 08/07/2012 | | | | 4,995,000 | | | | 4,995,000 | |
Los Angeles CA Airport PUTTER Series 2000-A (Airport Revenue)†† | | | 0.18 | | | | 11/15/2025 | | | | 8,000,000 | | | | 8,000,000 | |
| | | | | | |
| Portfolio of Investments—July 31, 2011 (Unaudited) | | Wells Fargo Advantage Municipal Money Market Fund | | | 9 | |
| | | | | | | | | | | | | | | | |
| Security Name | | Interest Rate | | | Maturity Date | | | Principal | | | Value | |
| | | | | | | | | | | | | | | | |
| | | | |
| Variable Rate Demand Notes§ (continued) | | | | | | | | | | | | | | | | |
Oakland CA Redevelopment Authority MFHR (Housing Revenue, FHLMC Insured) | | | 0.18 | % | | | 10/01/2050 | | | $ | 10,400,000 | | | $ | 10,400,000 | |
Sacramento County CA Housing Authority Arlington Creek Apartment Series I (Housing Revenue, FNMA Insured) | | | 0.18 | | | | 05/15/2034 | | | | 1,650,000 | | | | 1,650,000 | |
San Leandro CA Carlton Plaza Series A (Housing Revenue, FNMA Insured) | | | 0.14 | | | | 09/15/2032 | | | | 2,500,000 | | | | 2,500,000 | |
Victorville CA Joint Powers Finance Authority Project A (Utilities Revenue, BNP Paribas LOC) | | | 1.35 | | | | 05/01/2040 | | | | 7,970,000 | | | | 7,970,000 | |
| | | | |
| | | | | | | | | | | | | | | 44,660,000 | |
| | | | | | | | | | | | | | | | |
| | | | |
Colorado: 0.71% | | | | | | | | | | | | | | | | |
| | | | |
| Variable Rate Demand Notes§: 0.71% | | | | | | | | | | | | | | | | |
Colorado Agriculture Development Authority Garrett & Carla Devries Project Series 2006 (Miscellaneous Revenue, Bank of the West LOC) | | | 0.23 | | | | 06/01/2031 | | | | 3,300,000 | | | | 3,300,000 | |
Colorado HFA Ready Foods Incorporated Project Series A (IDR, U.S. Bank NA LOC) | | | 0.13 | | | | 01/01/2032 | | | | 3,660,000 | | | | 3,660,000 | |
Colorado HFA Worldwest LLP Project Series 1999-A (IDR, Mercantile Bank LOC)†† | | | 0.42 | | | | 09/01/2023 | | | | 3,365,000 | | | | 3,365,000 | |
Commerce City CO Northern Infrastructure General Improvement District (GO-Local, U.S. Bank NA LOC) | | | 0.13 | | | | 12/01/2028 | | | | 1,500,000 | | | | 1,500,000 | |
Denver CO City & County Western Stock Show Project (Miscellaneous Revenue, U.S. Bank NA LOC) | | | 0.15 | | | | 07/01/2029 | | | | 1,770,000 | | | | 1,770,000 | |
Harvest Junction CO Metropolitan District GO Series 2006 (GO-Local, U.S. Bank NA LOC) | | | 0.15 | | | | 12/01/2036 | | | | 3,360,000 | | | | 3,360,000 | |
Town of Hudson CO Series A (IDR, U.S. Bank NA LOC) | | | 0.23 | | | | 11/01/2020 | | | | 1,250,000 | | | | 1,250,000 | |
| | | | |
| | | | | | | | | | | | | | | 18,205,000 | |
| | | | | | | | | | | | | | | | |
| | | | |
Delaware: 2.19% | | | | | | | | | | | | | | | | |
| | | | |
| Variable Rate Demand Notes§: 2.19% | | | | | | | | | | | | | | | | |
Delaware State EDA Delaware Clean Power Project Series 1997-C (Resource Recovery Revenue) | | | 0.25 | | | | 08/01/2029 | | | | 24,600,000 | | | | 24,600,000 | |
Delaware State EDA Delaware Clean Power Project Series 1997-D (Resource Recovery Revenue) | | | 0.21 | | | | 08/01/2029 | | | | 14,300,000 | | | | 14,300,000 | |
Delaware State EDA Delaware Clean Power Project Series A (Resource Recovery Revenue) | | | 0.21 | | | | 08/01/2029 | | | | 17,500,000 | | | | 17,500,000 | |
| | | | |
| | | | | | | | | | | | | | | 56,400,000 | |
| | | | | | | | | | | | | | | | |
| | | | |
District of Columbia: 0.41% | | | | | | | | | | | | | | | | |
| | | | |
| Other Municipal Debt: 0.19% | | | | | | | | | | | | | | | | |
District of Columbia TRAN (Tax Revenue) | | | 2.00 | | | | 09/30/2011 | | | | 5,000,000 | | | | 5,013,262 | |
| | | | | | | | | | | | | | | | |
| | | | |
| Variable Rate Demand Notes§: 0.22% | | | | | | | | | | | | | | | | |
District of Columbia Enterprise Zone 14th & Irving (Miscellaneous Revenue, Bank of America NA LOC) | | | 0.42 | | | | 05/01/2022 | | | | 1,795,000 | | | | 1,795,000 | |
Metropolitan Washington DC Airport Authority Series 2855 (Airport Revenue, FSA-CR FGIC Insured) | | | 0.22 | | | | 10/01/2014 | | | | 3,755,000 | | | | 3,755,000 | |
| | | | |
| | | | | | | | | | | | | | | 5,550,000 | |
| | | | | | | | | | | | | | | | |
| | | | |
Florida: 4.92% | | | | | | | | | | | | | | | | |
| | | | |
| Other Municipal Debt: 0.16% | | | | | | | | | | | | | | | | |
Hillsborough County FL School Board COP Master Lease Series A (Lease Revenue, Wells Fargo Bank NA LOC, NATL-RE Insured)(q) | | | 0.18 | | | | 08/25/2011 | | | | 4,000,000 | | | | 4,000,000 | |
| | | | | | | | | | | | | | | | |
| | | | |
| 10 | | Wells Fargo Advantage Municipal Money Market Fund | | Portfolio of Investments—July 31, 2011 (Unaudited) |
| | | | | | | | | | | | | | | | |
| Security Name | | Interest Rate | | | Maturity Date | | | Principal | | | Value | |
| | | | | | | | | | | | | | | | |
| | | | |
| Variable Rate Demand Notes§: 4.76% | | | | | | | | | | | | | | | | |
Alachua County FL Florida Rock Project (IDR, Bank of America NA LOC) | | | 0.27 | % | | | 11/01/2022 | | | $ | 1,850,000 | | | $ | 1,850,000 | |
Alachua County FL HFA MFHR University Cove Apartments Project (Housing Revenue, FNMA Insured) | | | 0.12 | | | | 06/15/2034 | | | | 4,230,000 | | | | 4,230,000 | |
Brevard County FL HFA MFHR Shore View Apartments Project Series 1995 (Housing Revenue, Harris Trust & Savings Bank LOC) | | | 0.11 | | | | 02/01/2015 | | | | 2,200,000 | | | | 2,200,000 | |
Escambia County FL Daw’s Manufacturing Company Incorporated Project (IDR, Bank of America NA LOC) | | | 0.15 | | | | 02/01/2017 | | | | 1,905,000 | | | | 1,905,000 | |
Florida Housing Finance Corporation Brentwood Club Apartments Series A-1 (Housing Revenue, FNMA LOC) | | | 0.12 | | | | 01/15/2035 | | | | 4,545,000 | | | | 4,545,000 | |
Florida Housing Finance Corporation MFHR Mariner’s Cay Apartments Series 2008-M (Housing Revenue, FNMA Insured) | | | 0.09 | | | | 12/15/2041 | | | | 1,860,000 | | | | 1,860,000 | |
Florida Housing Finance Corporation Pinewood Pointe Series C (Housing Revenue) | | | 0.36 | | | | 06/01/2044 | | | | 9,515,000 | | | | 9,515,000 | |
Greater Orlando FL Aviation Authority Flight Safety Project Series B (Airport Revenue) | | | 0.04 | | | | 10/01/2035 | | | | 6,900,000 | | | | 6,900,000 | |
Hillsborough County FL Aviation Authority Tampa International Airport PUTTER Series 2008-A (Airport Revenue, Assured Guaranty Insured)†† | | | 0.22 | | | | 10/01/2032 | | | | 8,645,000 | | | | 8,645,000 | |
Jacksonville FL HFA MFHR Christine Cove Apartments (Housing Revenue, California Bank & Trust LOC) | | | 0.12 | | | | 09/15/2038 | | | | 1,230,000 | | | | 1,230,000 | |
Jacksonville FL HFA MFHR St. Augustine Apartments Project Series 2006 (Housing Revenue, FNMA Insured) | | | 0.09 | | | | 07/15/2033 | | | | 3,300,000 | | | | 3,300,000 | |
Jacksonville FL HFFA Hospital Series A (Hospital Revenue, Bank of America NA LOC) | | | 0.26 | | | | 08/15/2033 | | | | 4,440,000 | | | | 4,440,000 | |
Lake County FL Capital Improvement Deutsche Bank Spears Trust Series 2007 (Tax Revenue, AMBAC Insured) | | | 0.08 | | | | 06/01/2037 | | | | 6,880,000 | | | | 6,880,000 | |
Lee County FL HFA SFHR Series 2908Z (Housing Revenue, GNMA/FNMA Insured) | | | 0.22 | | | | 09/01/2015 | | | | 3,555,000 | | | | 3,555,000 | |
Lee County FL HFA SFHR Series 2909Z (Housing Revenue, GNMA/FNMA Insured) | | | 0.22 | | | | 09/01/2015 | | | | 3,560,000 | | | | 3,560,000 | |
Miami-Dade County FL Educational Facilities Authority Carlos Albizu University Project Series 2000 (Education Revenue, Bank of America NA LOC) | | | 0.15 | | | | 12/01/2025 | | | | 5,700,000 | | | | 5,700,000 | |
Miami-Dade County FL Educational Facilities Authority Eagle-20070043 Class A (Education Revenue, BHAC-CR AMBAC Insured) | | | 0.12 | | | | 04/01/2037 | | | | 9,900,000 | | | | 9,900,000 | |
Miami-Dade County FL IDA Reflectone Incorporated Project Series 2000-A (IDR, Royal Bank of Canada LOC) | | | 0.11 | | | | 03/01/2024 | | | | 11,000,000 | | | | 11,000,000 | |
Orange County FL Health Facilities Authority Adventist Health System (Health Revenue) | | | 0.06 | | | | 11/15/2026 | | | | 5,000,000 | | | | 5,000,000 | |
Orange County FL HFA MFHR Lakeside Pointe Apartments Series B (Housing Revenue, FNMA Insured) | | | 0.12 | | | | 05/15/2038 | | | | 6,930,000 | | | | 6,930,000 | |
Orange County FL HFA MFHR Marbella Pointe Series 2007-A (Housing Revenue, FHLB LOC) | | | 0.11 | | | | 04/15/2040 | | | | 7,650,000 | | | | 7,650,000 | |
Pasco County FL PAC-MED Incorporated Project (IDR, Bank of America NA LOC) | | | 0.34 | | | | 08/01/2017 | | | | 900,000 | | | | 900,000 | |
Pinellas County FL IDR Neighborly Care Network Project Series 2008 (Miscellaneous Revenue, Branch Banking & Trust LOC) | | | 0.08 | | | | 08/01/2028 | | | | 4,755,000 | | | | 4,755,000 | |
Polk County FL IDA Sun Orchard Florida Incorporated Project Series 1999 (IDR, U.S. Bank NA LOC) | | | 0.58 | | | | 01/01/2019 | | | | 720,000 | | | | 720,000 | |
RBC Municipal Products Incorporated Trust Series E2 (Housing Revenue, Royal Bank of Canada LOC) | | | 0.15 | | | | 01/01/2034 | | | | 1,575,000 | | | | 1,575,000 | |
Sarasota County FL Planned Parenthood Incorporated Project (Miscellaneous Revenue, Harris NA LOC) | | | 0.11 | | | | 10/01/2041 | | | | 1,700,000 | | | | 1,700,000 | |
Tallahassee FL Rose Printing Company Incorporated Project Series A (IDR, Branch Banking & Trust LOC) | | | 0.15 | | | | 10/01/2015 | | | | 1,975,000 | | | | 1,975,000 | |
| | | | |
| | | | | | | | | | | | | �� | | 122,420,000 | |
| | | | | | | | | | | | | | | | |
| | | | | | |
| Portfolio of Investments—July 31, 2011 (Unaudited) | | Wells Fargo Advantage Municipal Money Market Fund | | | 11 | |
| | | | | | | | | | | | | | | | |
| Security Name | | Interest Rate | | | Maturity Date | | | Principal | | | Value | |
| | | | | | | | | | | | | | | | |
| | | | |
Georgia: 1.67% | | | | | | | | | | | | | | | | |
| | | | |
| Variable Rate Demand Notes§: 1.67% | | | | | | | | | | | | | | | | |
Atkinson & Coffee Counties GA Joint Development Authority Solid Waste Langboard Incorporated Project Series 2008 (Resource Recovery Revenue, CoBank ACB LOC) | | | 0.18 | % | | | 11/01/2033 | | | $ | 16,800,000 | | | $ | 16,800,000 | |
Carroll County GA Development Authority Royal Metal Products Incorporated Project Series 2007 (IDR, Branch Banking & Trust LOC) | | | 0.15 | | | | 01/18/2027 | | | | 2,455,000 | | | | 2,455,000 | |
Cobb County GA IDA Standex International Corporation Project (IDR, Bank of America NA LOC) | | | 0.42 | | | | 01/01/2018 | | | | 3,300,000 | | | | 3,300,000 | |
Georgia State Port Authority (Port Authority Revenue, Branch Banking & Trust LOC) | | | 0.16 | | | | 06/01/2022 | | | | 3,300,000 | | | | 3,300,000 | |
Georgia State Port Authority (Port Authority Revenue, Branch Banking & Trust LOC) | | | 0.16 | | | | 10/01/2023 | | | | 3,660,000 | | | | 3,660,000 | |
Main Street Natural Gas Incorporated Gas Project Series A (Utilities Revenue) | | | 0.08 | | | | 08/01/2040 | | | | 5,995,000 | | | | 5,995,000 | |
Private Colleges & Universities Authority of Georgia Mercer University Project Series 2003 (Education Revenue, Branch Banking & Trust LOC) | | | 0.08 | | | | 10/01/2032 | | | | 1,855,000 | | | | 1,855,000 | |
Private Colleges & Universities Authority of Georgia Mercer University Project Series 2006-A (Education Revenue, Branch Banking & Trust LOC) | | | 0.08 | | | | 10/01/2036 | | | | 5,500,000 | | | | 5,500,000 | |
| | | | |
| | | | | | | | | | | | | | | 42,865,000 | |
| | | | | | | | | | | | | | | | |
| | | | |
Idaho: 0.48% | | | | | | | | | | | | | | | | |
| | | | |
| Variable Rate Demand Notes§: 0.48% | | | | | | | | | | | | | | | | |
Cassia County ID Industrial Development Corporation East Valley Cattle LLC Project Series 2006 (Miscellaneous Revenue) | | | 0.13 | | | | 08/01/2026 | | | | 7,000,000 | | | | 7,000,000 | |
Cassia County ID Industrial Development Corporation Vance Dairy Construction Project Series 2007 (Miscellaneous Revenue, Northwest Farm Credit LOC) | | | 0.23 | | | | 06/01/2027 | | | | 2,000,000 | | | | 2,000,000 | |
Jerome County ID Economic Development Corporation Davisco Foods International Project Series 2009 (Miscellaneous Revenue, Bank of Montreal LOC) | | | 0.07 | | | | 12/01/2029 | | | | 3,220,000 | | | | 3,220,000 | |
| | | | |
| | | | | | | | | | | | | | | 12,220,000 | |
| | | | | | | | | | | | | | | | |
| | | | |
Illinois: 2.58% | | | | | | | | | | | | | | | | |
| | | | |
| Variable Rate Demand Notes§: 2.58% | | | | | | | | | | | | | | | | |
Austin IL Trust Various States Various Certificates Bank of America Series 2008-1098 (Hospital Revenue, Assured Guaranty Insured) | | | 0.14 | | | | 08/15/2047 | | | | 3,178,000 | | | | 3,178,000 | |
Chicago IL Enterprise Zone Gardner Gibson Project (IDR, Harris Trust & Savings Bank LOC) | | | 0.16 | | | | 07/01/2033 | | | | 2,810,000 | | | | 2,810,000 | |
Chicago IL ROC RR II R-11940 (Tax Revenue)†† | | �� | 0.13 | | | | 07/01/2028 | | | | 1,400,000 | | | | 1,400,000 | |
Chicago IL Series 3190 (GO-Local)†† | | | 0.08 | | | | 01/01/2034 | | | | 4,000,000 | | | | 4,000,000 | |
Chicago IL Tax Increment Stockyards Industrial Commercial Redevelopment Project Series A (Tax Revenue, Northern Trust Company LOC) | | | 0.11 | | | | 12/01/2011 | | | | 1,560,000 | | | | 1,560,000 | |
Chicago IL Tax Increment Stockyards Industrial Commercial Redevelopment Project Series B (Tax Revenue, Northern Trust Company LOC) | | | 0.11 | | | | 12/01/2014 | | | | 1,975,000 | | | | 1,975,000 | |
Chicago IL Wastewater Transmission ROC RR II R-720PB (Water & Sewer Revenue, FSA & FGIC Insured) | | | 0.15 | | | | 01/01/2015 | | | | 3,915,000 | | | | 3,915,000 | |
Cook County IL PUTTER Series 559 (Tax Revenue, NATL-RE Insured) | | | 0.14 | | | | 05/15/2012 | | | | 2,665,000 | | | | 2,665,000 | |
East Peoria IL Commercial Development Kroger Company Project Series 2003 (IDR, Bank of Nova Scotia LOC) | | | 0.15 | | | | 12/01/2013 | | | | 3,125,000 | | | | 3,125,000 | |
| | | | |
| 12 | | Wells Fargo Advantage Municipal Money Market Fund | | Portfolio of Investments—July 31, 2011 (Unaudited) |
| | | | | | | | | | | | | | | | |
| Security Name | | Interest Rate | | | Maturity Date | | | Principal | | | Value | |
| | | | | | | | | | | | | | | | |
| | | | |
| Variable Rate Demand Notes§ (continued) | | | | | | | | | | | | | | | | |
Illinois Development Finance Authority Glenwood School for Boys Series 1998 (Education Revenue, Harris Trust & Savings Bank LOC) | | | 0.10 | % | | | 02/01/2033 | | | $ | 650,000 | | | $ | 650,000 | |
Illinois Development Finance Authority MCL Incorporated Project (IDR) | | | 0.38 | | | | 06/01/2017 | | | | 2,055,000 | | | | 2,055,000 | |
Illinois Development Finance Authority PCR A.E. Staley Manufacturing Company Project Series 1985 (IDR, RaboBank International LOC) | | | 0.08 | | | | 12/01/2016 | | | | 7,500,000 | | | | 7,500,000 | |
Illinois Finance Authority Easter Seals Metro Chicago Incorporated Project Series 2007 (Miscellaneous Revenue, Harris NA LOC) | | | 0.11 | | | | 04/01/2037 | | | | 1,300,000 | | | | 1,300,000 | |
Illinois Finance Authority Elmhurst Memorial Healthcare Series D (Hospital Revenue, Northern Trust Company LOC) | | | 0.06 | | | | 01/01/2048 | | | | 3,000,000 | | | | 3,000,000 | |
Illinois Finance Authority International Ink Company (IDR, JPMorgan Chase Bank LOC) | | | 0.18 | | | | 01/01/2034 | | | | 830,000 | | | | 830,000 | |
Illinois Finance Authority Merug LLC Series B (IDR, JPMorgan Chase Bank LOC) | | | 0.38 | | | | 12/01/2018 | | | | 645,000 | | | | 645,000 | |
Illinois Housing Development Authority Homeowner Mortgage (Housing Revenue) | | | 0.08 | | | | 08/01/2035 | | | | 8,600,000 | | | | 8,600,000 | |
Illinois State Toll Highway Authority Priority RMKT-A- 2A (Transportation Revenue, Bank of Tokyo-Mitsubishi UFJ LOC) | | | 0.10 | | | | 07/01/2030 | | | | 5,500,000 | | | | 5,500,000 | |
Lake County IL Brown Paper Goods Project (IDR, Bank One NA LOC) | | | 0.38 | | | | 10/01/2021 | | | | 1,240,000 | | | | 1,240,000 | |
Lake County IL Northpoint Association (IDR, Northern Trust Company LOC) | | | 0.13 | | | | 07/01/2029 | | | | 2,600,000 | | | | 2,600,000 | |
Schaumburg IL GO ROC-RR-II-R-11698 (GO-Local, BHAC-CR FGIC Insured)†† | | | 0.11 | | | | 12/01/2032 | | | | 5,200,000 | | | | 5,200,000 | |
Skokie IL Economic Development Revenue Skokie Fashion Square Project Series 1984 (IDR, Bank of America NA LOC) | | | 0.46 | | | | 12/01/2014 | | | | 1,850,000 | | | | 1,850,000 | |
West Frankfort IL Kroger Company Series 2004 (IDR, U.S. Bank NA LOC) | | | 0.15 | | | | 11/01/2012 | | | | 800,000 | | | | 800,000 | |
| | | | |
| | | | | | | | | | | | | | | 66,398,000 | |
| | | | | | | | | | | | | | | | |
| | | | |
Indiana: 1.76% | | | | | | | | | | | | | | | | |
| | | | |
| Variable Rate Demand Notes§: 1.76% | | | | | | | | | | | | | | | | |
Greensburg IN MFHR Community Partners Village II Project Series 2002 (Housing Revenue, FHLB LOC) | | | 0.11 | | | | 09/01/2029 | | | | 2,540,000 | | | | 2,540,000 | |
Noblesville IN Greystone Apartments Project Series B (Housing Revenue, FHLB LOC) | | | 0.11 | | | | 03/01/2041 | | | | 1,490,000 | | | | 1,490,000 | |
Indiana State Development Finance Authority Shelby Gravel Incorporated Project (IDR) | | | 0.15 | | | | 10/01/2017 | | | | 1,680,000 | | | | 1,680,000 | |
St. Joseph County IN Midcorr Land Development LLC Project (IDR, National City Bank LOC) | | | 0.15 | | | | 10/01/2023 | | | | 2,510,000 | | | | 2,510,000 | |
City of Crawfordsville IN Economic Development Performance Master LLC Project (IDR, Bank of America NA LOC) | | | 0.13 | | | | 10/01/2018 | | | | 1,400,000 | | | | 1,400,000 | |
Indiana Development Finance Authority Goodwill Industries Central Project Series 1996 (IDR, JPMorgan Chase Bank LOC) | | | 0.15 | | | | 06/01/2016 | | | | 685,000 | | | | 685,000 | |
Lafayette IN Solid Water Disposal Tate & Lyle Ingredients Project Series 2006 (Miscellaneous Revenue) | | | 0.13 | | | | 09/01/2028 | | | | 24,200,000 | | | | 24,200,000 | |
Indiana HFFA Revenue Fayette Memorial Hospital Association Series A (Hospital Revenue, U.S. Bank NA LOC) | | | 0.33 | | | | 10/01/2032 | | | | 970,000 | | | | 970,000 | |
Indiana Finance Authority Health Systems Sisters of St. Francis Health Services Incorporated Project Series 2009-A (Hospital Revenue)†† | | | 0.11 | | | | 11/01/2033 | | | | 5,000,000 | | | | 5,000,000 | |
St. Joseph County IN Economic Development Revenue Hannah & Friends Project Series 2007 (Miscellaneous Revenue, LaSalle Bank Midwest LOC) | | | 0.27 | | | | 11/01/2035 | | | | 2,075,000 | | | | 2,075,000 | |
Wabash IN Economic Development Revenue Martin Yale Industries Project Series 1998 (IDR, JPMorgan Chase Bank LOC) | | | 0.38 | | | | 09/01/2028 | | | | 2,700,000 | | | | 2,700,000 | |
| | | | |
| | | | | | | | | | | | | | | 45,250,000 | |
| | | | | | | | | | | | | | | | |
| | | | | | |
| Portfolio of Investments—July 31, 2011 (Unaudited) | | Wells Fargo Advantage Municipal Money Market Fund | | | 13 | |
| | | | | | | | | | | | | | | | |
| Security Name | | Interest Rate | | | Maturity Date | | | Principal | | | Value | |
| | | | | | | | | | | | | | | | |
| | | | |
Iowa: 1.36% | | | | | | | | | | | | | | | | |
| | | | |
| Variable Rate Demand Notes§: 1.36% | | | | | | | | | | | | | | | | |
Iowa Higher Education Loan Authority Private Colleges Ambrose (Education Revenue, Northern Trust Company LOC) | | | 0.33 | % | | | 04/01/2033 | | | $ | 2,700,000 | | | $ | 2,700,000 | |
Des Moines IA Elliot Aviation Project (Airport Revenue, U.S. Bank NA LOC) | | | 0.16 | | | | 08/01/2027 | | | | 5,145,000 | | | | 5,145,000 | |
Iowa Finance Authority Industrial Development (IDR, Bank of America NA LOC) | | | 0.29 | | | | 06/01/2028 | | | | 1,435,000 | | | | 1,435,000 | |
Iowa Finance Authority Solid Waste Disposal Real Estate Iowa One Project Series 2006 (Resource Recovery Revenue) | | | 0.11 | | | | 10/01/2031 | | | | 7,700,000 | | | | 7,700,000 | |
Iowa Higher Education Loan Authority University of Dubuque (Education Revenue, Northern Trust Company LOC) | | | 0.33 | | | | 04/01/2035 | | | | 600,000 | | | | 600,000 | |
Iowa Finance Authority Interwest Project Series 2001 (IDR, CoBank ACB LOC) | | | 0.18 | | | | 11/01/2016 | | | | 2,030,000 | | | | 2,030,000 | |
Iowa Finance Authority Randy & Ronnie Hunt Partnership Project Series 2009 (Miscellaneous Revenue, Farm Credit Services America LOC) | | | 0.08 | | | | 02/01/2027 | | | | 3,250,000 | | | | 3,250,000 | |
Iowa Finance Authority SFHR Series 2006-F (Housing Revenue, GNMA/FNMA Insured) | | | 0.14 | | | | 07/01/2036 | | | | 12,000,000 | | | | 12,000,000 | |
| | | | |
| | | | | | | | | | | | | | | 34,860,000 | |
| | | | | | | | | | | | | | | | |
| | | | |
Kansas: 0.35% | | | | | | | | | | | | | | | | |
| | | | |
| Variable Rate Demand Notes§: 0.35% | | | | | | | | | | | | | | | | |
Dodge City KS Farmland National Beef Project Series 1999 (IDR) | | | 0.13 | | | | 02/01/2029 | | | | 1,000,000 | | | | 1,000,000 | |
Kansas State Development Finance Authority Adventist Health Sunbelt Series C (Health Revenue, Royal Bank of Canada LOC) | | | 0.06 | | | | 11/15/2034 | | | | 2,000,000 | | | | 2,000,000 | |
Olathe KS Diamant Boart Series A (IDR, Svenska HandelsBanken LOC) | | | 0.20 | | | | 03/01/2027 | | | | 1,000,000 | | | | 1,000,000 | |
Olathe KS Insulite Project Series 2000 (IDR, FirStar Bank NA LOC) | | | 0.18 | | | | 06/01/2020 | | | | 910,000 | | | | 910,000 | |
Olathe KS ISL LLC Project (IDR, U.S. Bank NA LOC) | | | 0.18 | | | | 08/01/2027 | | | | 3,965,000 | | | | 3,965,000 | |
| | | | |
| | | | | | | | | | | | | | | 8,875,000 | |
| | | | | | | | | | | | | | | | |
| | | | |
Kentucky: 1.54% | | | | | | | | | | | | | | | | |
| | | | |
| Other Municipal Debt: 0.29% | | | | | | | | | | | | | | | | |
Kentucky Rural Water Finance Corporation Public Project Series C-1 (Water & Sewer Revenue) | | | 1.50 | | | | 12/01/2011 | | | | 7,500,000 | | | | 7,521,196 | |
| | | | | | | | | | | | | | | | |
| | | | |
| Variable Rate Demand Notes§: 1.25% | | | | | | | | | | | | | | | | |
Bardstown KY Industrial Building Linpac Materials Handling Project (IDR, U.S. Bank NA LOC) | | | 0.22 | | | | 10/01/2019 | | | | 3,100,000 | | | | 3,100,000 | |
Hancock County KY Solid Waste Disposal Facilities NSA Limited Project Series 1998 (Resource Recovery Revenue, Wells Fargo Bank NA LOC)(q) | | | 0.38 | | | | 04/01/2028 | | | | 7,815,000 | | | | 7,815,000 | |
Jefferson County KY Industrial Building Dant Growth LLC Project Series 2002 (IDR) | | | 0.15 | | | | 09/01/2022 | | | | 2,650,000 | | | | 2,650,000 | |
Kentucky EDFA Goodwill Industries Kentucky Incorporated Project Series 2007 (Miscellaneous Revenue, PNC Bank NA LOC) | | | 0.10 | | | | 12/01/2037 | | | | 9,750,000 | | | | 9,750,000 | |
Kentucky EDFA Madonna Manor Incorporated Project PUTTER Series P-Floats-MT-636 (Health Revenue)†† | | | 0.11 | | | | 12/01/2039 | | | | 2,500,000 | | | | 2,500,000 | |
Logan County KY Solid Waste Disposal Waste Management LLC Project (Resource Recovery Revenue, PNC Bank NA LOC) | | | 0.09 | | | | 03/01/2021 | | | | 1,450,000 | | | | 1,450,000 | |
Montgomery County KY Industrial Building Facilities Fineblanking Corporation Project Series 1996 (IDR, Bank of America NA LOC) | | | 0.29 | | | | 08/01/2015 | | | | 1,185,000 | | | | 1,185,000 | |
Williamstown KY League of Cities Funding Trust Lease Series 2008-A (Lease Revenue, U.S. Bank NA LOC) | | | 0.09 | | | | 07/01/2038 | | | | 3,520,000 | | | | 3,520,000 | |
| | | | |
| | | | | | | | | | | | | | | 31,970,000 | |
| | | | | | | | | | | | | | | | |
| | | | |
| 14 | | Wells Fargo Advantage Municipal Money Market Fund | | Portfolio of Investments—July 31, 2011 (Unaudited) |
| | | | | | | | | | | | | | | | |
| Security Name | | Interest Rate | | | Maturity Date | | | Principal | | | Value | |
| | | | | | | | | | | | | | | | |
| | | | |
Louisiana: 1.77% | | | | | | | | | | | | | | | | |
| | | | |
| Variable Rate Demand Notes§: 1.77% | | | | | | | | | | | | | | | | |
Louisiana HFA Arbor Place Apartments Project Series 2008 (Housing Revenue, FHLMC Insured) | | | 0.20 | % | | | 03/01/2043 | | | $ | 8,125,000 | | | $ | 8,125,000 | |
Louisiana Local Government Environmental Facilities CDA Honeywell International Incorporated Project (Miscellaneous Revenue) | | | 0.28 | | | | 12/01/2036 | | | | 4,000,000 | | | | 4,000,000 | |
Louisiana Public Facilities Authority Christus Health Series 2009-B-1 (Hospital Revenue, Bank of New York LOC) | | | 0.05 | | | | 07/01/2047 | | | | 2,000,000 | | | | 2,000,000 | |
Louisiana Public Facilities Authority Dynamic Fuels LLC Project Series 2008 (IDR, JPMorgan Chase Bank LOC) | | | 0.26 | | | | 10/01/2033 | | | | 8,000,000 | | | | 8,000,000 | |
Parish of St. James LA Nucor Steel LLC Series A-1 (IDR) | | | 0.08 | | | | 11/01/2040 | | | | 15,300,000 | | | | 15,300,000 | |
Parish of St. James LA Nucor Steel LLC Series B-1 (IDR) | | | 0.10 | | | | 11/01/2040 | | | | 8,000,000 | | | | 8,000,000 | |
| | | | |
| | | | | | | | | | | | | | | 45,425,000 | |
| | | | | | | | | | | | | | | | |
| | | | |
Maine: 0.15% | | | | | | | | | | | | | | | | |
| | | | |
| Variable Rate Demand Note§: 0.15% | | | | | | | | | | | | | | | | |
Maine State Housing Authority Mortgage Purchase Program Series 2004 D-3 (Housing Revenue) | | | 0.17 | | | | 11/15/2039 | | | | 3,900,000 | | | | 3,900,000 | |
| | | | | | | | | | | | | | | | |
| | | | |
Maryland: 1.41% | | | | | | | | | | | | | | | | |
| | | | |
| Other Municipal Debt: 1.13% | | | | | | | | | | | | | | | | |
Montgomery County MD Series 10-A (Tax Revenue) | | | 0.08 | | | | 08/09/2011 | | | | 14,200,000 | | | | 14,200,000 | |
Montgomery County MD Series 10-B (Tax Revenue) | | | 0.09 | | | | 08/09/2011 | | | | 15,000,000 | | | | 15,000,000 | |
| | | | |
| | | | | | | | | | | | | | | 29,200,000 | |
| | | | | | | | | | | | | | | | |
| | | | |
| Variable Rate Demand Notes§: 0.28% | | | | | | | | | | | | | | | | |
Maryland Economic Development Corporation YMCA Central Maryland Incorporated Project Series 2003 (Miscellaneous Revenue, Branch Banking & Trust LOC) | | | 0.08 | | | | 04/01/2028 | | | | 2,200,000 | | | | 2,200,000 | |
Montgomery County MD Housing Opportunities Community MFHR (Housing Revenue, FHLMC Insured) | | | 0.18 | | | | 02/01/2040 | | | | 2,000,000 | | | | 2,000,000 | |
University System of Maryland COP College Business School Project Series 2000 (Miscellaneous Revenue, Bank of America NA LOC) | | | 0.13 | | | | 06/01/2015 | | | | 2,920,000 | | | | 2,920,000 | |
| | | | |
| | | | | | | | | | | | | | | 7,120,000 | |
| | | | | | | | | | | | | | | | |
| | | | |
Massachusetts: 0.15% | | | | | | | | | | | | | | | | |
| | | | |
| Variable Rate Demand Note§: 0.15% | | | | | | | | | | | | | | | | |
Massachusetts Development Finance Agency Georgetown Village Apartments Series A (Housing Revenue, FNMA Insured) | | | 0.08 | | | | 07/15/2036 | | | | 3,800,000 | | | | 3,800,000 | |
| | | | | | | | | | | | | | | | |
| | | | |
Michigan: 4.48% | | | | | | | | | | | | | | | | |
| | | | |
| Other Municipal Debt: 1.63% | | | | | | | | | | | | | | | | |
Michigan Finance Authority Short Aid Notes Series D-1 (Miscellaneous Revenue) | | | 2.00 | | | | 08/19/2011 | | | | 5,000,000 | | | | 5,002,935 | |
Michigan Finance Authority Short Aid Notes Series D-2 (Miscellaneous Revenue, JPMorgan Chase Bank LOC) | | | 2.00 | | | | 08/22/2011 | | | | 6,000,000 | | | | 6,005,507 | |
Michigan Finance Authority Short Aid Notes Series D-3 (Miscellaneous Revenue, Scotia Bank LOC) | | | 2.00 | | | | 08/22/2011 | | | | 6,000,000 | | | | 6,005,507 | |
Michigan State Hospital Finance Authority (Health Revenue) | | | 0.14 | | | | 10/11/2011 | | | | 10,000,000 | | | | 10,000,000 | |
Michigan State Hospital Finance Authority Series 08-C (Health Revenue) | | | 0.15 | | | | 08/03/2011 | | | | 10,000,000 | | | | 10,000,000 | |
Michigan State Series A (Tax Revenue) | | | 2.00 | | | | 09/30/2011 | | | | 5,000,000 | | | | 5,012,873 | |
| | | | |
| | | | | | | | | | | | | | | 42,026,822 | |
| | | | | | | | | | | | | | | | |
| | | | | | |
| Portfolio of Investments—July 31, 2011 (Unaudited) | | Wells Fargo Advantage Municipal Money Market Fund | | | 15 | |
| | | | | | | | | | | | | | | | |
| Security Name | | Interest Rate | | | Maturity Date | | | Principal | | | Value | |
| | | | | | | | | | | | | | | | |
| | | | |
| Variable Rate Demand Notes§: 2.85% | | | | | | | | | | | | | | | | |
Green Lake Township MI Economic Development Corporation (Education Revenue, Harris NA LOC) | | | 0.20 | % | | | 06/01/2034 | | | $ | 800,000 | | | $ | 800,000 | |
Michigan HDA Rental Housing Project Series 2006-A (Housing Revenue, AGM GO of Authority Insured) | | | 0.30 | | | | 10/01/2040 | | | | 14,405,000 | | | | 14,405,000 | |
Michigan Higher Education Authority Student Loan RBC Municipal Products Trust Incorporated Certificate Series L-33 (Education Revenue, Royal Bank of Canada LOC) | | | 0.11 | | | | 09/01/2026 | | | | 40,495,000 | | | | 40,495,000 | |
Michigan Hospital Finance Authority Ascension Health Group Series 2010-8 (Hospital Revenue) | | | 0.17 | | | | 11/15/2049 | | | | 7,100,000 | | | | 7,100,000 | |
Michigan State Housing Development Authority Series A (Housing Revenue, GO of Authority Insured) | | | 0.21 | | | | 10/01/2037 | | | | 9,525,000 | | | | 9,525,000 | |
Michigan State Strategic Fund Fitz Land LLC Project (IDR, PNC Bank NA LOC) | | | 0.15 | | | | 08/01/2025 | | | | 800,000 | | | | 800,000 | |
Michigan Strategic Fund Limited Methodist Childrens Home Project Series 1995 (Miscellaneous Revenue, Bank One Michigan LOC) | | | 0.23 | | | | 08/01/2015 | | | | 200,000 | | | | 200,000 | |
| | | | |
| | | | | | | | | | | | | | | 73,325,000 | |
| | | | | | | | | | | | | | | | |
| | | | |
Minnesota: 3.16% | | | | | | | | | | | | | | | | |
| | | | |
| Other Municipal Debt: 0.08% | | | | | | | | | | | | | | | | |
Minnesota Rural Water Finance Authority Public Projects Construction (Water & Sewer Revenue) | | | 1.25 | | | | 04/01/2012 | | | | 2,000,000 | | | | 2,007,938 | |
| | | | | | | | | | | | | | | | |
| | | | |
| Variable Rate Demand Notes§: 3.08% | | | | | | | | | | | | | | | | |
Bloomington MN Bristol Village (Housing Revenue, FNMA Insured) | | | 0.17 | | | | 11/15/2032 | | | | 5,005,000 | | | | 5,005,000 | |
Bloomington MN Norlan Partners Series B (Housing Revenue, LaSalle Bank NA LOC) | | | 0.19 | | | | 07/15/2032 | | | | 1,410,000 | | | | 1,410,000 | |
Bloomington MN Refunding MFHR Norlan Partnership Series A-1 (Housing Revenue, FNMA Insured) | | | 0.17 | | | | 07/15/2032 | | | | 4,190,000 | | | | 4,190,000 | |
Dakota County MN CDA Catholic Finance Corporation (Education Revenue, U.S. Bank NA LOC) | | | 0.20 | | | | 01/01/2012 | | | | 965,000 | | | | 965,000 | |
Dakota County MN CDA View Pointe Apartments Project Series 2007-A (Housing Revenue, FNMA Insured) | | | 0.17 | | | | 01/15/2038 | | | | 1,000,000 | | | | 1,000,000 | |
Eden Prairie MN Refunding MFHR Park At City West Apartments Project Series 2001 (Housing Revenue, FHLMC Insured) | | | 0.09 | | | | 09/01/2031 | | | | 300,000 | | | | 300,000 | |
Hennepin County MN Housing & RDA Stone Arch Apartments Project (Housing Revenue, FNMA Insured) | | | 0.20 | | | | 04/15/2035 | | | | 2,800,000 | | | | 2,800,000 | |
Mahtomedi MN Housing Revenue Briarcliff Manor Apartments Series A (Housing Revenue, FNMA Insured) | | | 0.17 | | | | 06/15/2038 | | | | 3,645,000 | | | | 3,645,000 | |
Maplewood MN Educational Facilities Mounds Park Academy Project (Education Revenue, U.S. Bank NA LOC) | | | 0.10 | | | | 10/01/2031 | | | | 2,340,000 | | | | 2,340,000 | |
Minneapolis & St. Paul MN Housing & RDA Allina Health Systems Series B-2 (Hospital Revenue, JPMorgan Chase Bank LOC) | | | 0.20 | | | | 11/15/2035 | | | | 4,050,000 | | | | 4,050,000 | |
Minneapolis MN CDA C&G Partners Project (Housing Revenue, U.S. Bank NA LOC) | | | 0.10 | | | | 12/01/2015 | | | | 160,000 | | | | 160,000 | |
Minneapolis MN Driftwood Apartments Project A (Housing Revenue, U.S. Bank NA LOC) | | | 0.15 | | | | 10/01/2024 | | | | 4,240,000 | | | | 4,240,000 | |
Minneapolis MN MFHR Stone Arch Apartments (Housing Revenue, FNMA Insured) | | | 0.20 | | | | 04/15/2035 | | | | 3,600,000 | | | | 3,600,000 | |
Minneapolis MN People Serving People Project Series A (Miscellaneous Revenue, U.S. Bank NA LOC) | | | 0.33 | | | | 10/01/2021 | | | | 140,000 | | | | 140,000 | |
Minnesota Bond Securitization Trust Certificate Carleton Lofts Project Class A (Housing Revenue, LaSalle Bank NA LOC) | | | 0.23 | | | | 12/01/2048 | | | | 7,945,000 | | | | 7,945,000 | |
| | | | |
| 16 | | Wells Fargo Advantage Municipal Money Market Fund | | Portfolio of Investments—July 31, 2011 (Unaudited) |
| | | | | | | | | | | | | | | | |
| Security Name | | Interest Rate | | | Maturity Date | | | Principal | | | Value | |
| | | | | | | | | | | | | | | | |
| | | | |
| Variable Rate Demand Notes§ (continued) | | | | | | | | | | | | | | | | |
Minnesota State HEFAR MacAlester College Series 5-Q (Education Revenue) | | | 0.13 | % | | | 03/01/2033 | | | $ | 360,000 | | | $ | 360,000 | |
Minnesota State Residential Housing Series G (Housing Revenue) | | | 0.10 | | | | 01/01/2032 | | | | 265,000 | | | | 265,000 | |
Minnesota State University of St. Thomas Series 4O (Education Revenue, U.S. Bank NA LOC) | | | 0.09 | | | | 10/01/2021 | | | | 3,310,000 | | | | 3,310,000 | |
Moorhead MN Solid Waste Disposal American Crystal Sugar Project Series 1997 (Resource Recovery Revenue, Wells Fargo Bank NA LOC)(q) | | | 0.18 | | | | 04/01/2012 | | | | 5,500,000 | | | | 5,500,000 | |
Ramsey County MN Housing & Redevelopment MFHR Gateway Apartments LP Series A (Housing Revenue, LaSalle Bank NA LOC) | | | 0.15 | | | | 10/01/2038 | | | | 1,250,000 | | | | 1,250,000 | |
St. Anthony MN Landings Silver Lake Project Series 2007 (Housing Revenue, LaSalle Bank NA LOC) | | | 0.19 | | | | 10/01/2037 | | | | 1,400,000 | | | | 1,400,000 | |
St. Anthony MN Landings Silver Lake Project Series A (Housing Revenue, LaSalle Bank NA LOC) | | | 0.15 | | | | 10/01/2037 | | | | 3,600,000 | | | | 3,600,000 | |
St. Louis Park MN Refunding MFHR Newport on Seven Apartments Project Series 2001 (Housing Revenue, FNMA Insured) | | | 0.17 | | | | 09/15/2031 | | | | 8,620,000 | | | | 8,620,000 | |
St. Paul MN Housing & RDA Hampden Square Apartments Series A (Housing Revenue, FNMA Insured) | | | 0.17 | | | | 06/01/2032 | | | | 2,140,000 | | | | 2,140,000 | |
St. Paul MN Housing & RDA Leased Housing Association Series A (Housing Revenue, LaSalle Bank NA LOC) | | | 0.19 | | | | 09/01/2035 | | | | 2,000,000 | | | | 2,000,000 | |
St. Paul MN Port Authority District Cooling AMT Series 12-EE (IDR, Deutsche Bank AG LOC) | | | 0.10 | | | | 03/01/2029 | | | | 450,000 | | | | 450,000 | |
St. Paul MN Port Authority District Heating AMT Series 8-R (IDR, Deutsche Bank AG LOC) | | | 0.10 | | | | 12/01/2028 | | | | 1,000,000 | | | | 1,000,000 | |
Stevens County MN Solid Waste Disposal Riverview Dairy Project Series 2007 (Resource Recovery Revenue, AgCountry Farm Credit LOC) | | | 0.19 | | | | 08/01/2032 | | | | 1,750,000 | | | | 1,750,000 | |
Swift County MN Solid Waste Disposal East Dublin Dairy LLP Project Series 2008 (Resource Recovery Revenue, AgCountry Farm Credit LOC) | | | 0.19 | | | | 04/01/2033 | | | | 5,750,000 | | | | 5,750,000 | |
| | | | |
| | | | | | | | | | | | | | | 79,185,000 | |
| | | | | | | | | | | | | | | | |
| | | | |
Mississippi: 1.36% | | | | | | | | | | | | | | | | |
| | | | |
| Variable Rate Demand Notes§: 1.36% | | | | | | | | | | | | | | | | |
Clipper Tax-Exempt Certificate Trust Series 2007-32 (GO-State) | | | 0.13 | | | | 02/01/2016 | | | | 14,500,000 | | | | 14,500,000 | |
Merrill Lynch PFOTER Series MT-659 (Education Revenue, Guaranteed Student Loans Insured)†† | | | 0.13 | | | | 09/01/2035 | | | | 14,180,000 | | | | 14,180,000 | |
Mississippi Business Finance Corporation Chevron USA Incorporated Project Series B (Energy Revenue) | | | 0.21 | | | | 12/01/2030 | | | | 6,300,000 | | | | 6,300,000 | |
| | | | |
| | | | | | | | | | | | | | | 34,980,000 | |
| | | | | | | | | | | | | | | | |
| | | | |
Missouri: 1.57% | | | | | | | | | | | | | | | | |
| | | | |
| Other Municipal Debt: 0.28% | | | | | | | | | | | | | | | | |
St. Louis County MO Special Obligation TRAN (Miscellaneous Revenue) | | | 0.45 | | | | 08/01/2011 | | | | 7,105,000 | | | | 7,105,000 | |
| | | | | | | | | | | | | | | | |
| | | | |
| Variable Rate Demand Notes§: 1.29% | | | | | | | | | | | | | | | | |
Clipper Tax-Exempt Certificate Trust Series 2009-12 (Housing Revenue) | | | 0.23 | | | | 03/01/2038 | | | | 1,149,000 | | | | 1,149,000 | |
Kansas City MO IDA Revenue Ewing Marion Kauffman Foundation Series A (Miscellaneous Revenue) | | | 0.33 | | | | 04/01/2027 | | | | 2,495,000 | | | | 2,495,000 | |
Missouri Development Finance Board Kauffman Center For The Performing Arts Series A (Miscellaneous Revenue) | | | 0.23 | | | | 06/01/2037 | | | | 20,000,000 | | | | 20,000,000 | |
Missouri State HEFA Ascension Health Series C3 (Health Revenue) | | | 0.06 | | | | 11/15/2039 | | | | 3,000,000 | | | | 3,000,000 | |
St. Charles County MO IDA Craftsmen Industries Project Series 1998-A (IDR, U.S. Bank NA LOC) | | | 0.21 | | | | 12/01/2019 | | | | 4,770,000 | | | | 4,770,000 | |
| | | | | | |
| Portfolio of Investments—July 31, 2011 (Unaudited) | | Wells Fargo Advantage Municipal Money Market Fund | | | 17 | |
| | | | | | | | | | | | | | | | |
| Security Name | | Interest Rate | | | Maturity Date | | | Principal | | | Value | |
| | | | | | | | | | | | | | | | |
| | | | |
| Variable Rate Demand Notes§ (continued) | | | | | | | | | | | | | | | | |
St. Charles County MO IDA Kuenz Heating & Sheet Metal Series 2001 (IDR, U.S. Bank NA LOC) | | | 0.26 | % | | | 04/01/2026 | | | $ | 1,910,000 | | | $ | 1,910,000 | |
| | | | |
| | | | | | | | | | | | | | | 33,324,000 | |
| | | | | | | | | | | | | | | | |
| | | | |
Nebraska: 0.44% | | | | | | | | | | | | | | | | |
| | | | |
| Variable Rate Demand Notes§: 0.44% | | | | | | | | | | | | | | | | |
Douglas County NE James Skinner Company Project Series 1999 (IDR, U.S. Bank NA LOC) | | | 0.18 | | | | 01/12/2012 | | | | 570,000 | | | | 570,000 | |
Nebraska Investment Finance Authority MFHR Apple Creek Associates Project Series 1985-A (Housing Revenue, Northern Trust Company LOC) | | | 0.21 | | | | 09/01/2031 | | | | 4,310,000 | | | | 4,310,000 | |
Nebraska Invitational Finance Authority Solid Waste Disposal Butler County Dairy LLC Series 2009 (Resource Recovery Revenue, Farm Credit Services America LOC) | | | 0.08 | | | | 12/01/2037 | | | | 6,500,000 | | | | 6,500,000 | |
| | | | |
| | | | | | | | | | | | | | | 11,380,000 | |
| | | | | | | | | | | | | | | | |
| | | | |
Nevada: 1.05% | | | | | | | | | | | | | | | | |
| | | | |
| Variable Rate Demand Notes§: 1.05% | | | | | | | | | | | | | | | | |
Clark County NV Passenger Facility Las Vegas (Airport Revenue, Union Bank NA LOC) | | | 0.10 | | | | 07/01/2022 | | | | 4,800,000 | | | | 4,800,000 | |
Eclipse Funding Trust 2006-0146 Solar Eclipse Clark (Tax Revenue, U.S. Bank NA LOC) | | | 0.07 | | | | 11/01/2032 | | | | 6,970,000 | | | | 6,972,688 | |
Reno NV Senior Lien Transportation Rail Access Corridor Project Series 2008A (Tax Revenue, Bank of New York LOC) | | | 0.20 | | | | 06/01/2042 | | | | 6,900,000 | | | | 6,900,000 | |
Washoe County NV Eclipse Funding Trust Series 2006-0142 (GO-Local, U.S. Bank NA LOC) | | | 0.07 | | | | 09/01/2014 | | | | 8,365,000 | | | | 8,377,745 | |
| | | | |
| | | | | | | | | | | | | | | 27,050,433 | |
| | | | | | | | | | | | | | | | |
| | | | |
New Jersey: 2.65% | | | | | | | | | | | | | | | | |
| | | | |
| Other Municipal Debt: 0.39% | | | | | | | | | | | | | | | | |
North Brunswick NJ BAN (GO-Local) | | | 1.25 | | | | 08/11/2011 | | | | 10,000,000 | | | | 10,002,456 | |
| | | | | | | | | | | | | | | | |
| | | | |
| Variable Rate Demand Notes§: 2.26% | | | | | | | | | | | | | | | | |
Camden County NJ Improvement Authority Health Care Redevelopment The Cooper Health Systems Project Series 2004-B (Hospital Revenue, TD Bank NA LOC) | | | 0.04 | | | | 08/01/2032 | | | | 7,265,000 | | | | 7,265,000 | |
Clipper Tax Exempt Series 2009-32 (Miscellaneous Revenue, State Street Bank & Trust Insured) | | | 0.13 | | | | 01/01/2018 | | | | 4,300,000 | | | | 4,300,000 | |
Deutsche Bank Spears Lifers Trust (Transportation Revenue, FSA Insured) | | | 0.08 | | | | 12/15/2033 | | | | 8,000,000 | | | | 8,000,000 | |
New Jersey Higher Education Assistance Authority Student Loan ROC-RR-II-R-11853 (Education Revenue, Assured Guaranty Insured)†† | | | 0.23 | | | | 06/01/2016 | | | | �� 14,350,000 | | | | 14,350,000 | |
New Jersey State TTFA PUTTER Series 2009-70 (Miscellaneous Revenue) | | | 0.08 | | | | 12/15/2023 | | | | 21,500,000 | | | | 21,500,000 | |
New Jersey State TTFA PUTTER Series 2005-D (Miscellaneous Revenue, FSA Insured)†† | | | 0.22 | | | | 12/15/2013 | | | | 2,780,000 | | | | 2,780,000 | |
| | | | |
| | | | | | | | | | | | | | | 58,195,000 | |
| | | | | | | | | | | | | | | | |
| | | | |
New Mexico: 0.38% | | | | | | | | | | | | | | | | |
| | | | |
| Variable Rate Demand Notes§: 0.38% | | | | | | | | | | | | | | | | |
New Mexico Educational Assistance Foundation (Education Revenue, Royal Bank of Canada LOC, Guaranteed Student Loans Insured) | | | 0.11 | | | | 04/01/2034 | | | | 4,100,000 | | | | 4,100,000 | |
New Mexico Municipal Energy Acquisition Authority Gas Supply Series 2009 (Utilities Revenue) | | | 0.08 | | | | 11/01/2039 | | | | 5,660,000 | | | | 5,660,000 | |
| | | | |
| | | | | | | | | | | | | | | 9,760,000 | |
| | | | | | | | | | | | | | | | |
| | | | |
| 18 | | Wells Fargo Advantage Municipal Money Market Fund | | Portfolio of Investments—July 31, 2011 (Unaudited) |
| | | | | | | | | | | | | | | | |
| Security Name | | Interest Rate | | | Maturity Date | | | Principal | | | Value | |
| | | | | | | | | | | | | | | | |
| | | | |
New York: 7.38% | | | | | | | | | | | | | | | | |
| | | | |
| Other Municipal Debt: 0.92% | | | | | | | | | | | | | | | | |
Metropolitan Transportation Authority NY Series A (Transportation Revenue) | | | 0.23 | % | | | 10/06/2011 | | | $ | 4,000,000 | | | $ | 4,000,000 | |
Oyster Bay NY BAN (GO-Local) | | | 1.25 | | | | 08/12/2011 | | | | 14,000,000 | | | | 14,003,995 | |
Tarrytowns NY Union Free School District BAN (Tax Revenue, State Aid Withholding Insured) | | | 1.50 | | | | 08/12/2011 | | | | 5,630,000 | | | | 5,631,926 | |
| | | | |
| | | | | | | | | | | | | | | 23,635,921 | |
| | | | | | | | | | | | | | | | |
| | | | |
| Variable Rate Demand Notes§: 6.46% | | | | | | | | | | | | | | | | |
Monroe County NY IDA Civic Facilities Monroe Community College Project Series A (Education Revenue, JPMorgan Chase Bank LOC) | | | 0.06 | | | | 06/01/2036 | | | | 3,475,000 | | | | 3,475,000 | |
New York City NY Subseries B (GO-Local, TD Bank NA LOC) | | | 0.05 | | | | 09/01/2027 | | | | 1,500,000 | | | | 1,500,000 | |
New York Dormitory Authority Tax Exempt Certificate St. John’s University Series 2007 (Education Revenue) | | | 0.08 | | | | 07/01/2025 | | | | 20,420,000 | | | | 20,420,000 | |
New York Housing Finance Agency West 23rd Street Series 2002-A (Housing Revenue, FNMA Insured) | | | 0.08 | | | | 05/15/2033 | | | | 13,900,000 | | | | 13,900,000 | |
New York Metropolitan Transportation Authority Series 2005-A ROC-RR-II-R-594PB (Transportation Revenue, AGC-ICC AMBAC Insured) | | | 0.23 | | | | 11/15/2013 | | | | 21,165,000 | | | | 21,165,000 | |
New York Metropolitan Transportation Authority Series 2006-B ROC-RR-II-R-11711 (Transportation Revenue, FSA Insured)†† | | | 0.23 | | | | 11/15/2027 | | | | 13,650,000 | | | | 13,650,000 | |
New York Mortgage Agency Homeowner ROC-RR-II-R-11704 (Housing Revenue)†† | | | 0.17 | | | | 10/01/2031 | | | | 5,660,000 | | | | 5,660,000 | |
New York Mortgage Agency Homeowner Series 161 ROC-RR-II-R-11713 (Housing Revenue)†† | | | 0.11 | | | | 10/01/2016 | | | | 4,385,000 | | | | 4,385,000 | |
New York Mortgage Agency Homeowner Series 71 ROC-RR-II-R-11706 (Housing Revenue)†† | | | 0.17 | | | | 10/01/2024 | | | | 4,000,000 | | | | 4,000,000 | |
New York Mortgage Agency Series 106 ROC-RR-II-R-11708 (Housing Revenue)†† | | | 0.16 | | | | 04/01/2034 | | | | 3,000,000 | | | | 3,000,000 | |
New York Mortgage Agency Series 73-A ROC-RR-II-R-11707 (Housing Revenue)†† | | | 0.17 | | | | 10/01/2024 | | | | 9,700,000 | | | | 9,700,000 | |
New York NY Housing Development Corporation Series 143 (Housing Revenue)†† | | | 0.17 | | | | 11/01/2040 | | | | 1,285,000 | | | | 1,285,000 | |
New York NY Housing Development Corporation Series 2009-C1 (Housing Revenue)†† | | | 0.12 | | | | 05/01/2029 | | | | 6,620,000 | | | | 6,620,000 | |
New York NY Housing Development Corporation Series A (Housing Revenue, CitiBank NA LOC) | | | 0.09 | | | | 06/01/2037 | | | | 1,000,000 | | | | 1,000,000 | |
New York NY Housing Development Corporation Series C-4 (Housing Revenue) | | | 0.05 | | | | 05/01/2015 | | | | 7,100,000 | | | | 7,100,000 | |
New York NY Housing Development Corporation Series J-1 (Housing Revenue) | | | 0.48 | | | | 05/01/2046 | | | | 7,120,000 | | | | 7,120,000 | |
New York NY Municipal Water & Sewer Finance Authority PUTTER Series 1263 (Water & Sewer Revenue, FSA Insured) | | | 0.12 | | | | 06/15/2013 | | | | 7,055,000 | | | | 7,055,000 | |
New York NY Municipal Water & Sewer Finance Authority ROC-RR-II R-11697 (Water & Sewer Revenue, BHAC-CR Insured)†† | | | 0.11 | | | | 06/15/2016 | | | | 4,200,000 | | | | 4,200,000 | |
New York NY Municipal Water & Sewer Finance Authority Subseries B2 (Water & Sewer Revenue, Lloyds Bank LOC) | | | 0.05 | | | | 06/15/2024 | | | | 6,000,000 | | | | 6,000,000 | |
New York NY TFA Building Fiscal Year 2007 Series S-1 ROC-RR-II-R-809PB (Miscellaneous Revenue, AGC-ICC FGIC State Aid Withholding Insured) | | | 0.12 | | | | 01/15/2015 | | | | 10,410,000 | | | | 10,410,000 | |
New York State Housing Finance Agency Weyant Green Apartments Series A (Housing Revenue, FNMA Insured) | | | 0.05 | | | | 05/15/2037 | | | | 3,000,000 | | | | 3,000,000 | |
New York State Power Authority Revenue & General Purpose Consented (GO-State) | | | 0.32 | | | | 03/01/2016 | | | | 4,585,000 | | | | 4,585,000 | |
| | | | | | |
| Portfolio of Investments—July 31, 2011 (Unaudited) | | Wells Fargo Advantage Municipal Money Market Fund | | | 19 | |
| | | | | | | | | | | | | | | | |
| Security Name | | Interest Rate | | | Maturity Date | | | Principal | | | Value | |
| | | | | | | | | | | | | | | | |
| | | | |
| Variable Rate Demand Notes§ (continued) | | | | | | | | | | | | | | | | |
New York State Power Authority Revenue & General Purpose (GO-State) | | | 0.32 | % | | | 03/01/2020 | | | $ | 1,000,000 | | | $ | 1,000,000 | |
New York Urban Development Corporation ROC-II-R-11710 (Miscellaneous Revenue)†† | | | 0.11 | | | | 03/01/2028 | | | | 5,000,000 | | | | 5,000,000 | |
PFOTER PT-4564 (Housing Revenue, FHLMC Insured) | | | 0.18 | | | | 02/01/2046 | | | | 1,075,000 | | | | 1,075,000 | |
| | | | |
| | | | | | | | | | | | | | | 166,305,000 | |
| | | | | | | | | | | | | | | | |
| | | | |
North Carolina: 0.93% | | | | | | | | | | | | | | | | |
| | | | |
| Variable Rate Demand Notes§: 0.93% | | | | | | | | | | | | | | | | |
North Carolina Capital Facilities Finance Agency Educational Guilford College Project Series 2008 (Education Revenue, Branch Banking & Trust LOC) | | | 0.08 | | | | 05/01/2024 | | | | 3,405,000 | | | | 3,405,000 | |
North Carolina Capital Facilities Finance Agency Educational High Point University Project Series 2008 (Education Revenue, Branch Banking & Trust LOC) | | | 0.08 | | | | 05/01/2030 | | | | 3,875,000 | | | | 3,875,000 | |
North Carolina HFA Homeownership ROC-RR-II-R-11858 (Housing Revenue)†† | | | 0.17 | | | | 01/01/2033 | | | | 3,965,000 | | | | 3,965,000 | |
North Carolina Port Authority Facilities Series 2008 (Miscellaneous Revenue, Branch Banking & Trust LOC) | | | 0.08 | | | | 06/01/2036 | | | | 3,500,000 | | | | 3,500,000 | |
Rockingham County NC Industrial Facilities & PCFA Innofa USA Project Series 2007 (IDR, Branch Banking & Trust LOC) | | | 0.15 | | | | 12/01/2026 | | | | 3,350,000 | | | | 3,350,000 | |
Stanly County NC Industrial Facilities & PCFA Chicago Tube Company (IDR, JPMorgan Chase Bank LOC) | | | 0.18 | | | | 04/01/2018 | | | | 5,880,000 | | | | 5,880,000 | |
| | | | |
| | | | | | | | | | | | | | | 23,975,000 | |
| | | | | | | | | | | | | | | | |
| | | | |
North Dakota: 1.46% | | | | | | | | | | | | | | | | |
| | | | |
| Other Municipal Debt: 0.14% | | | | | | | | | | | | | | | | |
North Dakota Rural Water Finance Corporation Public Project Construction Notes A-4 (Water & Sewer Revenue) | | | 1.50 | | | | 09/01/2011 | | | | 3,500,000 | | | | 3,502,359 | |
| | | | | | | | | | | | | | | | |
| | | | |
| Variable Rate Demand Notes§: 1.32% | | | | | | | | | | | | | | | | |
North Dakota State HFA Home Mortgage Program Series A (Housing Revenue, GO of Agency Insured) | | | 0.11 | | | | 07/01/2037 | | | | 3,000,000 | | | | 3,000,000 | |
North Dakota State HFA Home Mortgage Financing (Housing Revenue) | | | 0.10 | | | | 01/01/2030 | | | | 1,430,000 | | | | 1,430,000 | |
Richland County ND Recovery Zone (Miscellaneous Revenue, CoBank ACB LOC) | | | 0.09 | | | | 11/01/2028 | | | | 2,315,000 | | | | 2,315,000 | |
Traill County ND IDR American Crystal Project (Resource Recovery Revenue, CoBank ACB LOC) | | | 0.15 | | | | 09/01/2017 | | | | 27,330,000 | | | | 27,330,000 | |
| | | | |
| | | | | | | | | | | | | | | 34,075,000 | |
| | | | | | | | | | | | | | | | |
| | | | |
Ohio: 0.82% | | | | | | | | | | | | | | | | |
| | | | |
| Variable Rate Demand Notes§: 0.82% | | | | | | | | | | | | | | | | |
Butler County OH Capital Funding CCAO Low Cost Capital Series 2005-A (Miscellaneous Revenue, U.S. Bank NA LOC) | | | 0.09 | | | | 06/01/2035 | | | | 2,440,000 | | | | 2,440,000 | |
Columbus OH Regional Airport Authority Ohio Municipal Pooled Financing Program Series 2004-A (Airport Revenue, U.S. Bank NA LOC) | | | 0.09 | | | | 01/01/2030 | | | | 3,420,000 | | | | 3,420,000 | |
Franklin County OH Lifeline Shelter Systems Project (IDR, Bank One NA LOC) | | | 0.33 | | | | 10/01/2021 | | | | 1,050,000 | | | | 1,050,000 | |
Hamilton County OH Health Care Life Enriching Community Project Series 2006-B (Health Revenue, PNC Bank NA LOC) | | | 0.09 | | | | 01/01/2037 | | | | 960,000 | | | | 960,000 | |
| | | | |
| 20 | | Wells Fargo Advantage Municipal Money Market Fund | | Portfolio of Investments—July 31, 2011 (Unaudited) |
| | | | | | | | | | | | | | | | |
| Security Name | | Interest Rate | | | Maturity Date | | | Principal | | | Value | |
| | | | | | | | | | | | | | | | |
| | | | |
| Variable Rate Demand Notes§ (continued) | | | | | | | | | | | | | | | | |
Madeira OH Economic Development Kroger Company Series 2004 (IDR, Bank of Nova Scotia LOC) | | | 0.15 | % | | | 11/01/2012 | | | $ | 2,050,000 | | | $ | 2,050,000 | |
Montgomery County OH Cambridge Commons Apartments A (Housing Revenue, FHLB LOC) | | | 0.20 | | | | 04/01/2038 | | | | 1,145,000 | | | | 1,145,000 | |
Pike County OH HCFR Traditions Health Care Obligation Group Series 2007 (Health Revenue, U.S. Bank NA LOC) | | | 0.10 | | | | 06/01/2033 | | | | 2,100,000 | | | | 2,100,000 | |
Stark County OH Kroger Company Series 2004 (IDR, Bank of Nova Scotia LOC) | | | 0.15 | | | | 09/01/2012 | | | | 3,100,000 | | | | 3,100,000 | |
Tuscarawas County OH Port Authority Plymouth Foam Incorporated Project Series 2008 (IDR, U.S. Bank NA LOC) | | | 0.16 | | | | 08/01/2038 | | | | 4,890,000 | | | | 4,890,000 | |
| | | | |
| | | | | | | | | | | | | | | 21,155,000 | |
| | | | | | | | | | | | | | | | |
| | | | |
Oklahoma: 0.05% | | | | | | | | | | | | | | | | |
| | | | |
| Variable Rate Demand Note§: 0.05% | | | | | | | | | | | | | | | | |
Oklahoma Development Finance Authority Industrial Development Tracker Marine Project (IDR, Bank of America NA LOC) | | | 0.42 | | | | 03/01/2018 | | | | 1,200,000 | | | | 1,200,000 | |
| | | | | | | | | | | | | | | | |
| | | | |
Oregon: 0.03% | | | | | | | | | | | | | | | | |
| | | | |
| Variable Rate Demand Note§: 0.03% | | | | | | | | | | | | | | | | |
Oregon State Beef Northwest Feeders Incorporated Series 1999 (Miscellaneous Revenue, Northwest Farm Credit LOC) | | | 0.23 | | | | 01/01/2016 | | | | 875,000 | | | | 875,000 | |
| | | | | | | | | | | | | | | | |
| | | | |
Other: 8.14% | | | | | | | | | | | | | | | | |
| | | | |
| Other Municipal Debt: 0.44% | | | | | | | | | | | | | | | | |
FHLMC Multiclass Mortgage Certificates (Housing Revenue)§ | | | 0.18 | | | | 08/15/2045 | | | | 11,286,123 | | | | 11,286,123 | |
| | | | | | | | | | | | | | | | |
| | | | |
| Variable Rate Demand Notes§: 7.70% | | | | | | | | | | | | | | | | |
SunAmerica Trust Various States Class A Certificates Series 2 (Miscellaneous Revenue, FHLMC LOC, FHLMC Insured) | | | 0.15 | | | | 07/01/2041 | | | | 30,700,000 | | | | 30,700,000 | |
Branch Banking & Trust Company Municipal Trust Series 5003 (Lease Revenue, RaboBank International LOC)†† | | | 0.32 | | | | 05/01/2027 | | | | 16,436,002 | | | | 16,436,002 | |
Clipper Tax-Exempt Certificate Trust Series 2009-4 (Miscellaneous Revenue) | | | 0.23 | | | | 10/01/2033 | | | | 483,055 | | | | 483,055 | |
Clipper Tax-Exempt Certificate Trust Series 2009-10 (Miscellaneous Revenue) | | | 0.23 | | | | 12/01/2035 | | | | 2,648,000 | | | | 2,648,000 | |
Clipper Tax-Exempt Certificate Trust Series 2009-26 (Miscellaneous Revenue) | | | 0.23 | | | | 07/01/2037 | | | | 1,733,000 | | | | 1,733,000 | |
Clipper Tax-Exempt Certificate Trust Series 2007-19 (Miscellaneous Revenue) | | | 0.23 | | | | 09/01/2039 | | | | 10,091,000 | | | | 10,091,000 | |
Clipper Tax-Exempt Certificate Trust Series 2009-54 (Miscellaneous Revenue) | | | 0.13 | | | | 05/01/2017 | | | | 28,601,000 | | | | 28,601,000 | |
FHLMC MFHR Series M019 (Housing Revenue, FHLMC Insured) | | | 0.13 | | | | 05/01/2017 | | | | 18,862,000 | | | | 18,862,000 | |
FHLMC MFHR Series M021 (Housing Revenue, FHLMC Insured) | | | 0.13 | | | | 06/15/2036 | | | | 33,555,000 | | | | 33,555,000 | |
PFOTER PPT 1005 Term A (Miscellaneous Revenue, FHLMC Insured) | | | 0.18 | | | | 05/15/2035 | | | | 54,970,000 | | | | 54,970,000 | |
| | | | |
| | | | | | | | | | | | | | | 198,079,057 | |
| | | | | | | | | | | | | | | | |
| | | | |
Pennsylvania: 5.11% | | | | | | | | | | | | | | | | |
| | | | |
| Variable Rate Demand Notes§: 5.11% | | | | | | | | | | | | | | | | |
Allegheny County PA Hospital Development Authority University of Pittsburgh Medical Center PUTTER MT-636 (Hospital Revenue)†† | | | 0.14 | | | | 02/01/2031 | | | | 2,770,000 | | | | 2,770,000 | |
Allegheny County PA Hospital Development Authority UPMC Senior Living Corporation (Hospital Revenue, FNMA Insured) | | | 0.09 | | | | 07/15/2028 | | | | 1,000,000 | | | | 1,000,000 | |
| | | | | | |
| Portfolio of Investments—July 31, 2011 (Unaudited) | | Wells Fargo Advantage Municipal Money Market Fund | | | 21 | |
| | | | | | | | | | | | | | | | |
| Security Name | | Interest Rate | | | Maturity Date | | | Principal | | | Value | |
| | | | | | | | | | | | | | | | |
| | | | |
| Variable Rate Demand Notes§ (continued) | | | | | | | | | | | | | | | | |
Allegheny County PA IDA United Jewish Federation Project Series A (Miscellaneous Revenue, PNC Bank NA LOC) | | | 0.08 | % | | | 10/01/2026 | | | $ | 1,403,000 | | | $ | 1,403,000 | |
Beaver County PA IDA Daily Corporation Project (IDR) | | | 0.24 | | | | 09/01/2032 | | | | 6,300,000 | | | | 6,300,000 | |
Berks County PA Municipal Authority Reading Hospital & Education Center Project Series 2009-A-1 (Hospital Revenue)†† | | | 0.09 | | | | 02/01/2012 | | | | 12,845,000 | | | | 12,845,000 | |
Butler County PA General Authority New Castle Area School District Project Series 2010 (GO-Local, PNC Bank NA LOC, GO of District Insured) | | | 0.08 | | | | 03/01/2030 | | | | 2,315,000 | | | | 2,315,000 | |
Emmaus PA General Authority Subseries D27 (Miscellaneous Revenue, U.S. Bank NA LOC, State Aid Withholding Insured) | | | 0.08 | | | | 03/01/2024 | | | | 1,500,000 | | | | 1,500,000 | |
Geisinger Authority PA Health System Series B (Health Revenue) | | | 0.18 | | | | 08/01/2022 | | | | 700,000 | | | | 700,000 | |
Lancaster County PA Hospital Authority Health System Lancaster General Hospital (Hospital Revenue, Bank of America NA LOC) | | | 0.25 | | | | 07/01/2041 | | | | 3,385,000 | | | | 3,385,000 | |
Lancaster PA IDA Purple Crow Partners LLC Project (IDR, U.S. Bank NA LOC) | | | 0.12 | | | | 09/01/2026 | | | | 3,110,000 | | | | 3,110,000 | |
Lehigh County PA General Purpose Authority St. Lukes Hospital Bethlehem PFOTER (Hospital Revenue) | | | 0.18 | | | | 08/15/2042 | | | | 2,500,000 | | | | 2,500,000 | |
Montgomery County PA Higher Education & Health Authority William Penn Charter School Series 2001 (Education Revenue, PNC Bank NA LOC) | | | 0.08 | | | | 09/15/2031 | | | | 4,925,000 | | | | 4,925,000 | |
Montgomery County PA IDA New Regional Medical Center PFOTER (Hospital Revenue, FHA Insured)†† | | | 0.11 | | | | 08/01/2038 | | | | 14,000,000 | | | | 14,000,000 | |
Montgomery County PA IDR Series 3238 (Health Revenue, FHA Insured)†† | | | 0.11 | | | | 08/01/2030 | | | | 5,300,000 | | | | 5,300,000 | |
Montgomery County PA Lower Merion School District GO Series 2009-A (Tax Revenue, State Street Bank & Trust Company LOC, State Aid Withholding Insured) | | | 0.06 | | | | 04/01/2027 | | | | 3,380,000 | | | | 3,380,000 | |
Moon PA IDA Community Facilities YMCA Greater Pittsburgh Project Series 2005 (Miscellaneous Revenue, PNC Bank NA LOC) | | | 0.08 | | | | 06/01/2025 | | | | 1,405,000 | | | | 1,405,000 | |
Pennsylvania EDFA Series D7 (IDR, PNC Bank NA LOC) | | | 0.12 | | | | 08/01/2022 | | | | 1,300,000 | | | | 1,300,000 | |
Pennsylvania HEFA Association of Independent Colleges & University of Pennsylvania Finance Program Keystone College Project Series 2002 (Education Revenue, PNC Bank NA LOC) | | | 0.08 | | | | 05/01/2027 | | | | 1,600,000 | | | | 1,600,000 | |
Pennsylvania HEFA Association of Independent Colleges & University of Pennsylvania Finance Program University of Scranton Project Series 1999-E3 (Education Revenue, PNC Bank NA LOC) | | | 0.08 | | | | 11/01/2014 | | | | 1,550,000 | | | | 1,550,000 | |
Pennsylvania HFA SFHR Series 3297 (Housing Revenue)†† | | | 0.23 | | | | 10/01/2019 | | | | 2,095,000 | | | | 2,095,000 | |
Pennsylvania HFA SFMR Series 74A (Housing Revenue, GO of Agency Insured) | | | 0.05 | | | | 10/01/2032 | | | | 4,300,000 | | | | 4,300,000 | |
Pennsylvania Public School Building Authority School District of Philadelphia Project Series 2006-B (Lease Revenue, FSA State Aid Withholding Insured)†† | | | 0.22 | | | | 06/01/2015 | | | | 1,990,000 | | | | 1,990,000 | |
Pennsylvania State Public School Building Authority ROC-RR-II-R-11396 (Lease Revenue, FSA State Aid Withholding Insured) | | | 0.19 | | | | 12/01/2023 | | | | 2,900,000 | | | | 2,900,000 | |
Pennsylvania State Turnpike Commission (Transportation Revenue, AGM Insured)†† | | | 0.20 | | | | 07/15/2026 | | | | 5,100,000 | | | | 5,100,000 | |
Pennsylvania State University Project Series B (Education Revenue) | | | 0.30 | | | | 06/01/2031 | | | | 5,000,000 | | | | 5,000,000 | |
PFOTER MT 566 (Miscellaneous Revenue) | | | 0.31 | | | | 08/15/2042 | | | | 15,415,000 | | | | 15,415,000 | |
Philadelphia PA School District GO Series 2007-A (GO-Local, Branch Banking & Trust LOC) | | | 0.11 | | | | 01/04/2029 | | | | 8,790,000 | | | | 8,790,000 | |
Philadelphia PA School District GO Series F (GO-Local, Barclays Bank plc LOC, State Aid Withholding Insured)± | | | 0.04 | | | | 09/01/2030 | | | | 1,000,000 | | | | 1,000,000 | |
Quakertown PA General Authority Pooled Financing Program Series A (Miscellaneous Revenue, PNC Bank NA LOC) | | | 0.08 | | | | 07/01/2026 | | | | 5,555,000 | | | | 5,555,000 | |
Southeastern PA Transportation Authority (Tax Revenue, PNC Bank NA LOC) | | | 0.17 | | | | 03/01/2022 | | | | 2,000,000 | | | | 2,000,000 | |
Washington County PA Hospital Authority Monongahela VY Hospital Project A (Hospital Revenue, PNC Bank NA LOC) | | | 0.06 | | | | 06/01/2041 | | | | 2,540,000 | | | | 2,540,000 | |
| | | | |
| 22 | | Wells Fargo Advantage Municipal Money Market Fund | | Portfolio of Investments—July 31, 2011 (Unaudited) |
| | | | | | | | | | | | | | | | |
| Security Name | | Interest Rate | | | Maturity Date | | | Principal | | | Value | |
| | | | | | | | | | | | | | | | |
| | | | |
| Variable Rate Demand Notes§ (continued) | | | | | | | | | | | | | | | | |
Washington County PA Hospital Authority Monongahela VY Hospital Project B (Hospital Revenue, PNC Bank NA LOC) | | | 0.06 | % | | | 06/01/2041 | | | $ | 3,390,000 | | | $ | 3,390,000 | |
| | | | |
| | | | | | | | | | | | | | | 131,363,000 | |
| | | | | | | | | | | | | | | | |
| | | | |
Puerto Rico: 0.88% | | | | | | | | | | | | | | | | |
| | | | |
| Variable Rate Demand Notes§: 0.88% | | | | | | | | | | | | | | | | |
JPMorgan Chase PUTTER Trust Series 3920 (Miscellaneous Revenue, JPMorgan Chase Bank LOC)†† | | | 0.21 | | | | 05/01/2013 | | | | 15,000,000 | | | | 15,000,000 | |
Puerto Rico Sales Tax Finance Corporation Deutsche Bank Spears Trust Series DBE-627A (Tax Revenue, AMBAC Insured) | | | 0.08 | | | | 08/01/2050 | | | | 800,000 | | | | 800,000 | |
Puerto Rico Sales Tax Corporate Financing ROC-RR-II-R-11779 (Tax Revenue)†† | | | 0.11 | | | | 12/01/2047 | | | | 3,300,000 | | | | 3,300,000 | |
Puerto Rico Sales Tax Corporate Financing ROC-RR-II-R-11761 (Tax Revenue)†† | | | 0.11 | | | | 12/01/2047 | | | | 1,600,000 | | | | 1,600,000 | |
Puerto Rico Sales Tax Corporate Financing ROC-RR-II-R-11778 (Tax Revenue)†† | | | 0.11 | | | | 08/01/2047 | | | | 2,000,000 | | | | 2,000,000 | |
| | | | |
| | | | | | | | | | | | | | | 22,700,000 | |
| | | | | | | | | | | | | | | | |
| | | | |
Rhode Island: 0.22% | | | | | | | | | | | | | | | | |
| | | | |
| Variable Rate Demand Note§: 0.22% | | | | | | | | | | | | | | | | |
Rhode Island State Student Loan Series 3235 (Education Revenue, Guaranteed Student Loans Insured)†† | | | 0.23 | | | | 12/01/2023 | | | | 5,730,000 | | | | 5,730,000 | |
| | | | | | | | | | | | | | | | |
| | | | |
South Carolina: 0.56% | | | | | | | | | | | | | | | | |
| | | | |
| Variable Rate Demand Notes§: 0.56% | | | | | | | | | | | | | | | | |
South Carolina Jobs Economic Development Authority (Utilities Revenue, Branch Banking & Trust LOC) | | | 0.12 | | | | 12/01/2038 | | | | 4,600,000 | | | | 4,600,000 | |
South Carolina Educational Facilities Authority For Private Non-profit Institutions Higher Learning Educational Facilities Spartanburg Methodist Series 2005 (Education Revenue, Branch Banking & Trust LOC) | | | 0.10 | | | | 08/01/2025 | | | | 1,515,000 | | | | 1,515,000 | |
South Carolina Educational Facilities Authority Newbury College Series 2008 (Education Revenue, Branch Banking & Trust LOC) | | | 0.08 | | | | 06/01/2035 | | | | 2,275,000 | | | | 2,275,000 | |
South Carolina Jobs EDA Blue Ridge Log Cabins LLC Series 2007 (IDR, Branch Banking & Trust LOC) | | | 0.15 | | | | 03/01/2032 | | | | 6,110,000 | | | | 6,110,000 | |
| | | | |
| | | | | | | | | | | | | | | 14,500,000 | |
| | | | | | | | | | | | | | | | |
| | | | |
South Dakota: 0.19% | | | | | | | | | | | | | | | | |
| | | | |
| Variable Rate Demand Note§: 0.19% | | | | | | | | | | | | | | | | |
South Dakota HDA Homeownership Mortgage Series 2009-A (Housing Revenue) | | | 0.15 | | | | 05/01/2039 | | | | 4,840,000 | | | | 4,840,000 | |
| | | | | | | | | | | | | | | | |
| | | | |
Tennessee: 0.92% | | | | | | | | | | | | | | | | |
| | | | |
| Variable Rate Demand Notes§: 0.92% | | | | | | | | | | | | | | | | |
Alcoa Maryville Blount County TN Industrial Development Board Series A (Miscellaneous Revenue, Branch Banking & Trust LOC) | | | 0.08 | | | | 06/01/2036 | | | | 2,080,000 | | | | 2,080,000 | |
Blount County TN Public Building Authority GO Series E-5-B (GO-Local, Branch Banking & Trust LOC) | | | 0.08 | | | | 06/01/2042 | | | | 4,760,000 | | | | 4,760,000 | |
Franklin County TN Health & Educational Facilities Board University of the South Project Series 1994 (Education Revenue) | | | 0.12 | | | | 01/01/2013 | | | | 2,900,000 | | | | 2,900,000 | |
Huntingdon TN Industrial Development Board Behlen Manufacturing Company Project (IDR, LaSalle Bank NA LOC) | | | 0.20 | | | | 05/01/2020 | | | | 8,000,000 | | | | 8,000,000 | |
| | | | | | |
| Portfolio of Investments—July 31, 2011 (Unaudited) | | Wells Fargo Advantage Municipal Money Market Fund | | | 23 | |
| | | | | | | | | | | | | | | | |
| Security Name | | Interest Rate | | | Maturity Date | | | Principal | | | Value | |
| | | | | | | | | | | | | | | | |
| | | | |
| Variable Rate Demand Notes§ (continued) | | | | | | | | | | | | | | | | |
Pulaski & Giles County TN Lomar Development Company Project (IDR, U.S. Bank NA LOC) | | | 0.18 | % | | | 01/01/2017 | | | $ | 1,445,000 | | | $ | 1,445,000 | |
Springfield TN Industrial Development Board Kroger Company Series 2004 (IDR, Bank of Nova Scotia LOC) | | | 0.15 | | | | 02/01/2012 | | | | 4,500,000 | | | | 4,500,000 | |
| | | | |
| | | | | | | | | | | | | | | 23,685,000 | |
| | | | | | | | | | | | | | | | |
| | | | |
Texas: 13.03% | | | | | | | | | | | | | | | | |
| | | | |
| Other Municipal Debt: 0.05% | | | | | | | | | | | | | | | | |
Texas State TAN (Tax Revenue) | | | 2.00 | | | | 08/31/2011 | | | | 1,420,000 | | | | 1,421,918 | |
| | | | | | | | | | | | | | | | |
| | | | |
| Variable Rate Demand Notes§: 12.98% | | | | | | | | | | | | | | | | |
Beaumont TX Independent School District Building GO Series 2008 (GO-Local, PSF Insured) | | | 0.08 | | | | 02/15/2033 | | | | 6,680,000 | | | | 6,680,000 | |
Bexar County TX Housing Finance Corporation Multifamily Apartments Project Series A PFOTER (Miscellaneous Revenue) | | | 0.18 | | | | 05/01/2032 | | | | 17,735,000 | | | | 17,735,000 | |
Brazos River TX Harbor Naval District Brazoria County BASF Corporation Project Series 2001 (Miscellaneous Revenue) | | | 0.22 | | | | 07/01/2022 | | | | 4,900,000 | | | | 4,900,000 | |
Brazos River TX Harbor Naval District Brazoria County BASF Corporation Project Series 2001 (Miscellaneous Revenue) | | | 0.25 | | | | 05/01/2036 | | | | 500,000 | | | | 500,000 | |
Collin County TX Housing Finance Corporation Huntington Apartments Project Series 1996 (Housing Revenue, Northern Trust Company LOC) | | | 0.09 | | | | 12/01/2015 | | | | 12,305,000 | | | | 12,305,000 | |
Dallam County TX Industrial Development Corporation (Miscellaneous Revenue, Bank of the West LOC) | | | 0.07 | | | | 08/01/2035 | | | | 5,000,000 | | | | 5,000,000 | |
Dallam County TX Industrial Development Corporation Economic Development Revenue Dallhart Jersey Ranch Incorporated Series 2008 (Miscellaneous Revenue) | | | 0.18 | | | | 08/01/2039 | | | | 1,700,000 | | | | 1,700,000 | |
Dallam County TX Industrial Development Corporation Economic Development Revenue Hilmar Cheese Company Incorporated Project Series 2009 (Miscellaneous Revenue, Bank of the West LOC) | | | 0.07 | | | | 07/01/2032 | | | | 12,250,000 | | | | 12,250,000 | |
Dallas TX Waterworks & Sewer Systems Series 2845 (Water & Sewer Revenue, AMBAC Insured) | | | 0.14 | | | | 10/01/2015 | | | | 1,570,000 | | | | 1,570,000 | |
Del Valle TX GO Independent School District Building PUTTER Series 1946 (GO-Local, PSF Insured) | | | 0.15 | | | | 08/15/2014 | | | | 2,965,000 | | | | 2,965,000 | |
First Rio Grande Regional Water Authority Economic Development Corporation Rio Grande Valley Sugar (Miscellaneous Revenue, CoBank ACB LOC) | | | 0.08 | | | | 03/01/2032 | | | | 14,660,000 | | | | 14,660,000 | |
Fort Bend County TX GO PFOTER Series 1326 (GO-Local, FGIC Insured) | | | 0.14 | | | | 09/01/2012 | | | | 2,730,000 | | | | 2,730,000 | |
Harris County TX Industrial Development Corporation Solid Waste Disposal Deer Park (Resource Recovery Revenue) | | | 0.21 | | | | 03/01/2023 | | | | 7,500,000 | | | | 7,500,000 | |
Harris County TX Industrial Development Corporation Solid Waste Disposal Deer Park Refining Project Series A (Resource Recovery Revenue) | | | 0.24 | | | | 03/01/2023 | | | | 26,200,000 | | | | 26,200,000 | |
Houston TX Utilities Systems Authority Series 2010-B (Water & Sewer Revenue, Royal Bank of Canada LOC)†† | | | 0.08 | | | | 05/15/2034 | | | | 4,900,000 | | | | 4,900,000 | |
Lamar TX Independent School District Construction Refunding GO Series 2008 (GO-Local, PSF Insured) | | | 0.08 | | | | 02/15/2038 | | | | 6,435,000 | | | | 6,435,000 | |
Lovejoy TX Independent School District Building GO Deutsche Bank Spears Trust Series 2008 (GO-Local, PSF Insured) | | | 0.08 | | | | 02/15/2038 | | | | 3,270,000 | | | | 3,270,000 | |
Port Arthur Texas Navigation District Total Petrochemicals USA (IDR) | | | 0.09 | | | | 06/01/2041 | | | | 5,000,000 | | | | 5,000,000 | |
Port Arthur TX Naval District Environmental Facilities Motiva Enterprises Project Series A (Energy Revenue) | | | 0.19 | | | | 11/01/2040 | | | | 1,700,000 | | | | 1,700,000 | |
Port Arthur TX Naval District Environmental Facilities Motiva Enterprises Project Series C (Energy Revenue) | | | 0.09 | | | | 04/01/2027 | | | | 1,000,000 | | | | 1,000,000 | |
| | | | |
| 24 | | Wells Fargo Advantage Municipal Money Market Fund | | Portfolio of Investments—July 31, 2011 (Unaudited) |
| | | | | | | | | | | | | | | | |
| Security Name | | Interest Rate | | | Maturity Date | | | Principal | | | Value | |
| | | | | | | | | | | | | | | | |
| | | | |
| Variable Rate Demand Notes§ (continued) | | | | | | | | | | | | | | | | |
Port Corpus Christi TX Solid Waste Disposal Flint Hills Resources Project Series 2002-A (Resource Recovery Revenue) | | | 0.13 | % | | | 07/01/2029 | | | $ | 10,000,000 | | | $ | 10,000,000 | |
Port Corpus Christi TX Solid Waste Disposal Flint Hills Resources Project Series 2006 (Resource Recovery Revenue) | | | 0.13 | | | | 01/01/2030 | | | | 25,500,000 | | | | 25,500,000 | |
Port Corpus Christi TX Solid Waste Disposal Flint Hills Resources Project Series 2007 (Resource Recovery Revenue) | | | 0.13 | | | | 01/01/2032 | | | | 13,300,000 | | | | 13,300,000 | |
Port Corpus Christi TX Solid Waste Disposal Flint Hills Resources Project Series A (Resource Recovery Revenue) | | | 0.13 | | | | 04/01/2028 | | | | 11,500,000 | | | | 11,500,000 | |
Rockwall TX Columbia Extrusion Corporation Project Series 1989 (IDR, Bank of America NA LOC) | | | 0.12 | | | | 07/01/2014 | | | | 1,700,000 | | | | 1,700,000 | |
San Antonio TX Electric & Gas Deutsche Bank Spears Trust Series 2007 (Utilities Revenue) | | | 0.08 | | | | 02/01/2032 | | | | 8,250,000 | | | | 8,250,000 | |
San Antonio TX Housing Finance Corporation PFOTER Rosemont at Pleasanton Apartments Project Series 2005 (Housing Revenue, FHLMC Insured) | | | 0.18 | | | | 07/01/2048 | | | | 12,045,000 | | | | 12,045,000 | |
San Marcos TX Industrial Development Corporation Butler Manufacturing Company Project (IDR, Bank of America NA LOC) | | | 0.32 | | | | 04/01/2015 | | | | 6,250,000 | | | | 6,250,000 | |
Spring TX Independent School District Refunding GO Deutsche Bank Spears Trust Series 2008-A (GO-Local, PSF Insured) | | | 0.08 | | | | 08/15/2033 | | | | 3,785,000 | | | | 3,785,000 | |
Tarant County TX Housing Finance Corporation PFOTER Evergreen at Keller Apartments Project (Housing Revenue, FHLMC Insured) | | | 0.18 | | | | 02/01/2049 | | | | 12,920,000 | | | | 12,920,000 | |
Texas Department of Housing Providence at Rush Creek II Apartments Series 2004 (Housing Revenue, FHLMC Insured) | | | 0.18 | | | | 01/01/2044 | | | | 8,610,000 | | | | 8,610,000 | |
Texas Municipal Gas Acquisition & Supply Corporation Series 2848 (Utilities Revenue) | | | 0.13 | | | | 12/15/2026 | | | | 71,130,000 | | | | 71,130,000 | |
Texas Municipal Gas Acquisition & Supply Corporation Series 2849 (Utilities Revenue) | | | 0.13 | | | | 12/15/2026 | | | | 9,842,105 | | | | 9,842,105 | |
| | | | |
| | | | | | | | | | | | | | | 333,832,105 | |
| | | | | | | | | | | | | | | | |
| | | | |
Utah: 0.19% | | | | | | | | | | | | | | | | |
| | | | |
| Variable Rate Demand Notes§: 0.19% | | | | | | | | | | | | | | | | |
Juab County UT Intermountain Farmers Association Project (IDR, CoBank ACB LOC) | | | 0.18 | | | | 08/01/2012 | | | | 500,000 | | | | 500,000 | |
Juab County UT Intermountain Farmers Association Project (IDR, CoBank ACB LOC) | | | 0.18 | | | | 10/01/2021 | | | | 2,400,000 | | | | 2,400,000 | |
South Valley Sewer District UT ROC-RR-II-R-11919 (Water & Sewer Revenue, BHAC Insured)†† | | | 0.11 | | | | 07/01/2016 | | | | 2,080,000 | | | | 2,080,000 | |
| | | | |
| | | | | | | | | | | | | | | 4,980,000 | |
| | | | | | | | | | | | | | | | |
| | | | |
Vermont: 0.17% | | | | | | | | | | | | | | | | |
| | | | |
| Variable Rate Demand Notes§: 0.17% | | | | | | | | | | | | | | | | |
Vermont Educational & Health Buildings Financing Agency Various Norwich University Project (Education Revenue, TD Bank NA LOC) | | | 0.05 | | | | 09/01/2038 | | | | 3,250,000 | | | | 3,250,000 | |
Vermont Educational & Health Buildings North County Hospital Project A (Health Revenue, TD Bank NA LOC) | | | 0.24 | | | | 10/01/2034 | | | | 1,125,000 | | | | 1,125,000 | |
| | | | |
| | | | | | | | | | | | | | | 4,375,000 | |
| | | | | | | | | | | | | | | | |
| | | | |
Virginia: 0.91% | | | | | | | | | | | | | | | | |
| | | | |
| Variable Rate Demand Notes§: 0.91% | | | | | | | | | | | | | | | | |
Chesterfield County VA Health Center Community Residential Care Facilities Lucy Corr Village Series 2008-B (Miscellaneous Revenue, Branch Banking & Trust LOC) | | | 0.08 | | | | 12/01/2012 | | | | 105,000 | | | | 105,000 | |
| | | | | | |
| Portfolio of Investments—July 31, 2011 (Unaudited) | | Wells Fargo Advantage Municipal Money Market Fund | | | 25 | |
| | | | | | | | | | | | | | | | |
| Security Name | | Interest Rate | | | Maturity Date | | | Principal | | | Value | |
| | | | | | | | | | | | | | | | |
| | | | |
| Variable Rate Demand Notes§ (continued) | | | | | | | | | | | | | | | | |
Henrico County VA EDA Residential Care Facilities Westminster-Cantebury Richmond Series 2008 (Miscellaneous Revenue, Branch Banking & Trust LOC) | | | 0.11 | % | | | 10/01/2037 | | | $ | 2,680,000 | | | $ | 2,680,000 | |
Norfolk VA Economic Development Authority Hospital Facilities Sentra Healthcare Series C (Hospital Revenue) | | | 0.20 | | | | 11/01/2034 | | | | 9,250,000 | | | | 9,250,000 | |
Salem VA IDA MFHR Oak Park Apartments Project Series 2008 (Housing Revenue, FNMA Insured) | | | 0.10 | | | | 08/15/2043 | | | | 2,745,000 | | | | 2,745,000 | |
Virginia Commonwealth University Health System Authority Series B (Hospital Revenue, Branch Banking & Trust LOC) | | | 0.27 | | | | 07/01/2037 | | | | 7,310,000 | | | | 7,310,000 | |
Virginia Small Business Financing Authority (IDR, Branch Banking & Trust LOC) | | | 0.15 | | | | 07/01/2024 | | | | 1,290,000 | | | | 1,290,000 | |
| | | | |
| | | | | | | | | | | | | | | 23,380,000 | |
| | | | | | | | | | | | | | | | |
| | | | |
Washington: 1.95% | | | | | | | | | | | | | | | | |
| | | | |
| Variable Rate Demand Notes§: 1.95% | | | | | | | | | | | | | | | | |
King County WA Housing Authority Summerfield Apartments Project for YWCA of Seattle-King County Series 2005 (Housing Revenue, U.S. Bank NA LOC) | | | 0.15 | | | | 09/01/2035 | | | | 1,675,000 | | | | 1,675,000 | |
King County WA Sewer Series 3090 (Water & Sewer Revenue, FSA Insured)†† | | | 0.08 | | | | 01/01/2039 | | | | 1,100,000 | | | | 1,100,000 | |
Seattle WA Water & Sewer Systems Eclipse Funding Trust Series 2006-0002 (Water & Sewer Revenue, U.S. Bank NA LOC) | | | 0.07 | | | | 09/01/2029 | | | | 6,670,000 | | | | 6,682,861 | |
Washington Finance Authority Smith Brothers Farms Incorporated Series 2001 (Miscellaneous Revenue, Northwest Farm Credit LOC) | | | 0.23 | | | | 09/01/2021 | | | | 3,300,000 | | | | 3,300,000 | |
Washington GO Austin Trust Variable Certificate Series 2007-A (GO-State, FSA Insured)†† | | | 0.11 | | | | 07/01/2014 | | | | 4,640,000 | | | | 4,640,000 | |
Washington GO PUTTER Series 2640 (GO-State) | | | 0.12 | | | | 01/01/2016 | | | | 9,995,000 | | | | 9,995,000 | |
Washington GO Series 2005-C (GO-State) | | | 0.08 | | | | 06/01/2027 | | | | 6,655,000 | | | | 6,655,000 | |
Washington Housing Finance Commission Gonzaga Preparatory School (Education Revenue, Bank of America NA LOC) | | | 0.14 | | | | 09/01/2033 | | | | 1,655,000 | | | | 1,655,000 | |
Washington Housing Finance Commission Nonprofit Tacoma Art Museum Project (Miscellaneous Revenue, Northern Trust Company LOC) | | | 0.09 | | | | 06/01/2032 | | | | 5,775,000 | | | | 5,775,000 | |
Washington Housing Finance Commission Whisperwood Apartments Project Series A (Housing Revenue, FNMA Insured) | | | 0.11 | | | | 05/15/2035 | | | | 1,590,000 | | | | 1,590,000 | |
Yakima County WA Public Corporation Macro Plastics Incorporated Project Series 1996 (IDR, Bank of the West LOC) | | | 0.25 | | | | 12/01/2026 | | | | 2,880,000 | | | | 2,880,000 | |
Yakima County WA Public Corporation Revenue Valley Processing Project Bank of America (IDR, Bank of America NA LOC) | | | 0.42 | | | | 02/01/2015 | | | | 1,700,000 | | | | 1,700,000 | |
Yakima County WA Solid Waste Disposal George Deruyter & Son Project Series 2006 (Resource Recovery Revenue, Northwest Farm Credit LOC) | | | 0.23 | | | | 08/01/2026 | | | | 2,500,000 | | | | 2,500,000 | |
| | | | |
| | | | | | | | | | | | | | | 50,147,861 | |
| | | | | | | | | | | | | | | | |
| | | | |
West Virginia: 0.75% | | | | | | | | | | | | | | | | |
| | | | |
| Variable Rate Demand Notes§: 0.75% | | | | | | | | | | | | | | | | |
Kanawha County WV Kroger Company Series 2004-A (IDR, Bank of Nova Scotia LOC) | | | 0.15 | | | | 02/01/2012 | | | | 4,500,000 | | | | 4,500,000 | |
Kanawha County WV Kroger Company Series 2004-B (IDR, U.S. Bank NA LOC) | | | 0.15 | | | | 04/01/2013 | | | | 6,850,000 | | | | 6,850,000 | |
Marmet WV Commercial Development Kroger Company Series 2004 (IDR, Bank of Nova Scotia LOC) | | | 0.15 | | | | 11/01/2012 | | | | 3,100,000 | | | | 3,100,000 | |
West Virginia EDA Solid Waste Disposal Appalachian Power Company (Resource Recovery Revenue, Mizuho Corporate Bank LOC) | | | 0.11 | | | | 02/01/2036 | | | | 3,000,000 | | | | 3,000,000 | |
West Virginia EDA Coastal Lumber Products Project Series A (IDR, Branch Banking & Trust LOC) | | | 0.25 | | | | 09/01/2015 | | | | 1,160,000 | | | | 1,160,000 | |
| | | | |
| 26 | | Wells Fargo Advantage Municipal Money Market Fund | | Portfolio of Investments—July 31, 2011 (Unaudited) |
| | | | | | | | | | | | | | | | |
| Security Name | | Interest Rate | | | Maturity Date | | | Principal | | | Value | |
| | | | | | | | | | | | | | | | |
| | | | |
| Variable Rate Demand Notes§ (continued) | | | | | | | | | | | | | | | | |
West Virginia EDA Coastal Lumber Products Project Series B (IDR, Branch Banking & Trust LOC) | | | 0.25 | % | | | 09/01/2015 | | | $ | 700,000 | | | $ | 700,000 | |
| | | | |
| | | | | | | | | | | | | | | 19,310,000 | |
| | | | | | | | | | | | | | | | |
| | | | |
Wisconsin: 3.19% | | | | | | | | | | | | | | | | |
| | | | |
| Other Municipal Debt: 0.47% | | | | | | | | | | | | | | | | |
Wisconsin State HEFA (Hospital Revenue, PNC Bank NA LOC) | | | 0.42 | | | | 09/01/2011 | | | | 6,000,000 | | | | 6,000,000 | |
Wisconsin State HEFA (Hospital Revenue, State Street Bank & Trust Company LOC) | | | 0.42 | | | | 09/01/2011 | | | | 6,000,000 | | | | 6,000,000 | |
| | | | |
| | | | | | | | | | | | | | | 12,000,000 | |
| | | | | | | | | | | | | | | | |
| | | | |
| Variable Rate Demand Notes§: 2.72% | | | | | | | | | | | | | | | | |
Appleton WI Recovery Zone Facilities Foremost Farms USA (Miscellaneous Revenue, CoBank ACB LOC) | | | 0.08 | | | | 05/01/2037 | | | | 26,000,000 | | | | 26,000,000 | |
Belgium WI Trimen Industries Incorporated Project Series 2006 (IDR, U.S. Bank NA LOC) | | | 0.21 | | | | 02/01/2026 | | | | 3,610,000 | | | | 3,610,000 | |
Hull WI Welcome Dairy Incorporated Project Series 2010-A (IDR, Associated Bank NA LOC) | | | 0.15 | | | | 01/01/2027 | | | | 740,000 | | | | 740,000 | |
Hull WI Welcome Dairy Incorporated Project Series 2010-B (IDR, Associated Bank NA LOC) | | | 0.11 | | | | 01/01/2027 | | | | 3,435,000 | | | | 3,435,000 | |
Manitowoc WI CDA Regency House Project (Housing Revenue, Bank First National LOC) | | | 0.37 | | | | 11/01/2020 | | | | 1,435,000 | | | | 1,435,000 | |
Newton WI Stecker Machine Company Incorporated Project Series 2001 (IDR, FHLB LOC) | | | 0.17 | | | | 09/01/2021 | | | | 2,090,000 | | | | 2,090,000 | |
Oneida Tribe Of Indians of Wisconsin (Health Revenue, Bank of America NA LOC) | | | 0.18 | | | | 07/01/2016 | | | | 6,380,000 | | | | 6,380,000 | |
Sheboygan WI Alaark Manufacturing Corporation Project Series 2000 (IDR, U.S. Bank NA LOC) | | | 0.17 | | | | 12/01/2021 | | | | 1,615,000 | | | | 1,615,000 | |
Sheboygan WI Vortex Liquid Color Project (IDR, Bank First National LOC) | | | 0.13 | | | | 11/01/2020 | | | | 1,340,000 | | | | 1,340,000 | |
Two Rivers WI Riverside Foods Incorporated Project (IDR, Bank First National LOC) | | | 0.14 | | | | 12/01/2022 | | | | 2,100,000 | | | | 2,100,000 | |
Wisconsin HEFA St. Camillus Health Center Project Series 2005 (Health Revenue, U.S. Bank NA LOC) | | | 0.08 | | | | 02/01/2035 | | | | 2,275,000 | | | | 2,275,000 | |
Wisconsin Housing & EDFA Series 2879 (Housing Revenue, GO of Authority Insured) | | | 0.25 | | | | 03/01/2015 | | | | 2,070,000 | | | | 2,070,000 | |
Wisconsin Housing & EDFA Zero Zone Incorporated Project Series 1999 (IDR, U.S. Bank NA LOC) | | | 0.24 | | | | 08/01/2019 | | | | 3,420,000 | | | | 3,420,000 | |
Wisconsin Public Power PUTTER Series 1232 (Utilities Revenue, BHAC-CR AMBAC Insured) | | | 0.16 | | | | 07/01/2013 | | | | 10,290,000 | | | | 10,290,000 | |
Wisconsin State HEFA Aurora Health Care Series A (Hospital Revenue, Bank of Montreal LOC) | | | 0.24 | | | | 04/01/2028 | | | | 3,300,000 | | | | 3,300,000 | |
| | | | |
| | | | | | | | | | | | | | | 70,100,000 | |
| | | | | | | | | | | | | | | | |
| | | | |
Wyoming: 0.15% | | | | | | | | | | | | | | | | |
| | | | |
| Variable Rate Demand Note§: 0.15% | | | | | | | | | | | | | | | | |
Wyoming Student Loan Corporation (Education Revenue, Royal Bank of Canada LOC) | | | 0.08 | | | | 12/01/2043 | | | | 3,850,000 | | | | 3,850,000 | |
| | | | | | | | | | | | | | | | |
| | | | | | | | |
| Total Investments in Securities | | | | | | | | |
| (Cost $2,348,282,451)* | | | 91.30 | % | | | 2,348,282,451 | |
Other Assets and Liabilities, Net | | | 8.70 | | | | 223,832,336 | |
| | | | | | | | |
| Total Net Assets | | | 100.00 | % | | $ | 2,572,114,787 | |
| | | | | | | | |
| | | | | | |
| Portfolio of Investments—July 31, 2011 (Unaudited) | | Wells Fargo Advantage Municipal Money Market Fund | | | 27 | |
| § | These securities are subject to a demand feature which reduces the effective maturity. |
| †† | Security that may be resold to “qualified institutional buyers” under Rule 144A or securities offered pursuant to Section 4(2) of the Securities Act of 1933, as amended. |
| (q) | Credit enhancement is provided by an affiliate. |
| * | Cost for federal income tax purposes is substantially the same as for financial reporting purposes. |
The accompanying notes are an integral part of these financial statements.
| | | | |
| 28 | | Wells Fargo Advantage Municipal Money Market Fund | | Statement of Assets and Liabilities—July 31, 2011 (Unaudited) |
| | | | |
| | | | |
| |
Assets | | | | |
Investments in unaffiliated securities, at amortized cost | | $ | 2,348,282,451 | |
Cash | | | 133,636,004 | |
Receivable for investments sold | | | 88,747,448 | |
Receivable for Fund shares sold | | | 1,198,491 | |
Receivable for interest | | | 1,545,056 | |
Receivable from adviser | | | 1,605,594 | |
Prepaid expenses and other assets | | | 379,457 | |
| | | | |
Total assets | | | 2,575,394,501 | |
| | | | |
| |
Liabilities | | | | |
Dividends payable | | | 3,614 | |
Payable for Fund shares redeemed | | | 443,147 | |
Distribution fees payable | | | 687,358 | |
Due to other related parties | | | 551,648 | |
Trustees’ fees and expenses payable | | | 200,918 | |
Shareholder reporting expense | | | 135,584 | |
Shareholder servicing fees payable | | | 577,861 | |
Accrued expenses and other liabilities | | | 679,584 | |
| | | | |
Total liabilities | | | 3,279,714 | |
| | | | |
Total net assets | | $ | 2,572,114,787 | |
| | | | |
| |
NET ASSETS CONSIST OF | | | | |
Paid-in capital | | $ | 2,572,135,896 | |
Overdistributed net investment income | | | (123,932 | ) |
Accumulated net realized gains on investments | | | 102,823 | |
| | | | |
Total net assets | | $ | 2,572,114,787 | |
| | | | |
| |
COMPUTATION OF NET ASSET VALUE PER SHARE1 | | | | |
Net assets – Class A | | $ | 114,831,940 | |
Shares outstanding – Class A | | | 114,834,030 | |
Net asset value per share – Class A | | | $1.00 | |
Net assets – Institutional Class | | $ | 52,998,068 | |
Shares outstanding – Institutional Class | | | 53,000,063 | |
Net asset value per share – Institutional Class | | | $1.00 | |
Net assets – Investor Class | | $ | 190,364,500 | |
Shares outstanding – Investor Class | | | 190,366,868 | |
Net asset value per share – Investor Class | | | $1.00 | |
Net assets – Service Class | | $ | 108,548,455 | |
Shares outstanding – Service Class | | | 108,550,260 | |
Net asset value per share – Service Class | | | $1.00 | |
Net assets – Sweep Class | | $ | 2,105,371,824 | |
Shares outstanding – Sweep Class | | | 2,105,415,049 | |
Net asset value per share – Sweep Class | | | $1.00 | |
| 1. | The Fund has an unlimited number of authorized shares. |
The accompanying notes are an integral part of these financial statements.
| | | | | | |
| Statement of Operations—Six Months Ended July 31, 2011 (Unaudited) | | Wells Fargo Advantage Municipal Money Market Fund | | | 29 | |
| | | | |
| | | | |
| |
Investment income | | | | |
Interest | | $ | 4,394,446 | |
| | | | |
| |
Expenses | | | | |
Advisory fee | | | 4,842,120 | |
Administration fees | | | | |
Fund level | | | 857,845 | |
Class A | | | 130,021 | |
Institutional Class | | | 27,523 | |
Investor Class | | | 247,666 | |
Service Class | | | 62,819 | |
Sweep Class | | | 3,235,712 | |
Shareholder servicing fees | | | | |
Class A | | | 146,207 | |
Investor Class | | | 246,704 | |
Service Class | | | 130,151 | |
Sweep Class | | | 3,676,946 | |
Distribution fees | | | | |
Sweep Class | | | 5,147,724 | |
Custody and accounting fees | | | 96,461 | |
Professional fees | | | 21,970 | |
Registration fees | | | 5,000 | |
Shareholder report expenses | | | 77,862 | |
Trustees’ fees and expenses | | | 49,018 | |
Other fees and expenses | | | 134,706 | |
| | | | |
Total expenses | | | 19,136,455 | |
Less: Fee waivers and/or expense reimbursements | | | (14,936,673 | ) |
| | | | |
Net expenses | | | 4,199,782 | |
| | | | |
Net investment income | | | 194,664 | |
Net realized gains on investments | | | 69,297 | |
| | | | |
Net increase in net assets resulting from operations | | $ | 263,961 | |
| | | | |
The accompanying notes are an integral part of these financial statements.
| | | | |
| 30 | | Wells Fargo Advantage Municipal Money Market Fund | | Statements of Changes in Net Assets |
| | | | | | | | | | | | | | | | |
| | | Six Months Ended July 31, 2011 (Unaudited) | | | Year Ended January 31, 20111 | |
| | | | |
Operations | | | | | | | | | | | | | | | | |
Net investment income | | | | | | $ | 194,664 | | | | | | | $ | 323,526 | |
Net realized gains on investments | | | | | | | 69,297 | | | | | | | | 193,881 | |
| | | | | | | | | | | | | | | | |
Net increase in net assets resulting from operations | | | | | | | 263,961 | | | | | | | | 517,407 | |
| | | | | | | | | | | | | | | | |
| | | | |
Distributions to shareholders from | | | | | | | | | | | | | | | | |
Net investment income | | | | | | | | | | | | | | | | |
Class A | | | | | | | (5,910 | ) | | | | | | | (12,772 | ) |
Institutional Class | | | | | | | (26,530 | ) | | | | | | | (113,677 | )2 |
Investor Class | | | | | | | (9,907 | ) | | | | | | | (10,247 | )2 |
Service Class | | | | | | | (5,236 | ) | | | | | | | (14,309 | )3 |
Sweep Class | | | | | | | (147,081 | ) | | | | | | | (356,908 | )4 |
Net realized gains | | | | | | | | | | | | | | | | |
Class A | | | | | | | 0 | | | | | | | | (2,337 | ) |
Institutional Class | | | | | | | 0 | | | | | | | | (1,998 | )2 |
Investor Class | | | | | | | 0 | | | | | | | | (3,868 | )2 |
Service Class | | | | | | | 0 | | | | | | | | (2,281 | )3 |
Sweep Class | | | | | | | 0 | | | | | | | | (60,742 | )4 |
| | | | | | | | | | | | | | | | |
Total distributions to shareholders | | | | | | | (194,664 | ) | | | | | | | (579,139 | ) |
| | | | | | | | | | | | | | | | |
| | | | |
| | | Shares | | | | | | Shares | | | | |
| | | | |
Capital share transactions | | | | | | | | | | | | | | | | |
Proceeds from shares sold | | | | | | | | | | | | | | | | |
Class A | | | 155,615,075 | | | | 155,615,075 | | | | 338,694,969 | | | | 338,694,969 | |
Institutional Class | | | 61,039,661 | | | | 61,039,661 | | | | 435,018,169 | 2 | | | 435,018,169 | 2 |
Investor Class | | | 30,248,360 | | | | 30,248,360 | | | | 45,678,331 | 2 | | | 45,678,331 | 2 |
Service Class | | | 85,785,342 | | | | 85,785,342 | | | | 91,720,582 | 3 | | | 91,720,582 | 3 |
Sweep Class | | | 4,256,399,195 | | | | 4,256,399,195 | | | | 12,432,288,193 | 4 | | | 12,432,288,193 | 4 |
| | | | | | | | | | | | | | | | |
| | | | | | | 4,589,087,633 | | | | | | | | 13,343,400,244 | |
| | | | | | | | | | | | | | | | |
Reinvestment of distributions | | | | | | | | | | | | | | | | |
Class A | | | 5,504 | | | | 5,504 | | | | 16,511 | | | | 16,511 | |
Institutional Class | | | 26,493 | | | | 26,493 | | | | 120,970 | 2 | | | 120,970 | 2 |
Investor Class | | | 9,334 | | | | 9,334 | | | | 15,747 | 2 | | | 15,747 | 2 |
Service Class | | | 2,390 | | | | 2,390 | | | | 8,208 | 3 | | | 8,208 | 3 |
Sweep Class | | | 147,081 | | | | 147,081 | | | | 416,642 | 4 | | | 416,642 | 4 |
| | | | | | | | | | | | | | | | |
| | | | | | | 190,802 | | | | | | | | 578,078 | |
| | | | | | | | | | | | | | | | |
Payment for shares redeemed | | | | | | | | | | | | | | | | |
Class A | | | (171,330,076 | ) | | | (171,330,076 | ) | | | (357,429,599 | ) | | | (357,429,599 | ) |
Institutional Class | | | (114,255,605 | ) | | | (114,255,605 | ) | | | (448,541,602 | )2 | | | (448,541,602 | )2 |
Investor Class | | | (48,937,986 | ) | | | (48,937,986 | ) | | | (62,794,956 | )2 | | | (62,794,956 | )2 |
Service Class | | | (73,581,856 | ) | | | (73,581,856 | ) | | | (149,853,701 | )3 | | | (149,853,701 | )3 |
Sweep Class | | | (5,384,765,600 | ) | | | (5,384,765,600 | ) | | | (12,726,232,651 | )4 | | | (12,726,232,651 | )4 |
| | | | | | | | | | | | | | | | |
| | | | | | | (5,792,871,123 | ) | | | | | | | (13,744,852,509 | ) |
| | | | | | | | | | | | | | | | |
| 1. | After the close of business on July 9, 2010, the Fund acquired the net assets of Evergreen Municipal Money Market Fund which became the accounting and performance survivor in this transaction. The information for the period prior to July 12, 2010 is that of Evergreen Municipal Money Market Fund. |
| 2. | Class commenced operations on July 9, 2010. |
| 3. | Class I shares of Evergreen Municipal Money Market Fund became Service Class shares on July 12, 2010. |
| 4. | Class S shares of Evergreen Municipal Money Market Fund became Sweep Class shares on July 12, 2010. |
The accompanying notes are an integral part of these financial statements.
| | | | | | |
| Statements of Changes in Net Assets | | Wells Fargo Advantage Municipal Money Market Fund | | | 31 | |
| | | | | | | | | | | | |
| | | Six Months Ended July 31, 2011 (Unaudited) | | | Year Ended January 31, 20111 | |
| | | | |
| | | | | | | | | | | |
| | | | |
Capital share transactions (continued) | | | | | | | | | | | | |
Net asset value of shares issued in acquisition | | | | | | | | | | | | |
Class A | | | | $ | 0 | | | | | $ | 100,000 | |
Institutional Class | | | | | 0 | | | | | | 119,591,229 | |
Investor Class | | | | | 0 | | | | | | 226,146,551 | |
Service Class | | | | | 0 | | | | | | 100,000 | |
Sweep Class | | | | | 0 | | | | | | 100,000 | |
| | | | | | | | | | | | |
| | | | | 0 | | | | | | 346,037,780 | |
| | | | | | | | | | | | |
Net decrease in net assets resulting
from capital share transactions | | | | | (1,203,592,688 | ) | | | | | (54,836,407 | ) |
| | | | | | | | | | | | |
Total decrease in net assets | | | | | (1,203,523,391 | ) | | | | | (54,898,139 | ) |
| | | | | | | | | | | | |
| | | | |
Net assets | | | | | | | | | | | | |
Beginning of period | | | | | 3,775,638,178 | | | | | | 3,830,536,317 | |
| | | | | | | | | | | | |
End of period | | | | $ | 2,572,114,787 | | | | | $ | 3,775,638,178 | |
| | | | | | | | | | | | |
Overdistributed net investment income | | | | $ | (123,932 | ) | | | | $ | (123,932 | ) |
| | | | | | | | | | | | |
The accompanying notes are an integral part of these financial statements.
| | | | |
| 32 | | Wells Fargo Advantage Municipal Money Market Fund | | Financial Highlights |
(For a share outstanding throughout each period)
| | | | | | | | | | | | | | | | | | | | | | | | |
| | | Six Months Ended
July 31, 2011
(Unaudited) | | | Year Ended January 31, | |
| Class A | | | 20111 | | | 20101 | | | 20091 | | | 20081 | | | 20071 | |
Net asset value, beginning of period | | $ | 1.00 | | | $ | 1.00 | | | $ | 1.00 | | | $ | 1.00 | | | $ | 1.00 | | | $ | 1.00 | |
Net investment income | | | 0.00 | 2 | | | 0.00 | 2 | | | 0.00 | 2 | | | 0.02 | | | | 0.03 | | | | 0.03 | |
Net realized gains on investments | | | 0.00 | 2 | | | 0.00 | 2 | | | 0.00 | | | | 0.00 | | | | 0.00 | | | | 0.00 | |
| | | | | | | | | | | | | | | | | | | | | | | | |
Total from investment operations | | | 0.00 | 2 | | | 0.00 | 2 | | | 0.00 | 2 | | | 0.02 | | | | 0.03 | | | | 0.03 | |
Distributions to shareholders from | | | | | | | | | | | | | | | | | | | | | | | | |
Net investment income | | | (0.00 | )2 | | | (0.00 | )2 | | | (0.00 | )2 | | | (0.02 | ) | | | (0.03 | ) | | | (0.03 | ) |
Net realized gains | | | 0.00 | | | | (0.00 | )2 | | | 0.00 | | | | 0.00 | | | | 0.00 | | | | 0.00 | |
| | | | | | | | | | | | | | | | | | | | | | | | |
Total distributions to shareholders | | | (0.00 | )2 | | | (0.00 | )2 | | | (0.00 | )2 | | | (0.02 | ) | | | (0.03 | ) | | | (0.03 | ) |
Net asset value, end of period | | $ | 1.00 | | | $ | 1.00 | | | $ | 1.00 | | | $ | 1.00 | | | $ | 1.00 | | | $ | 1.00 | |
Total return3 | | | 0.00 | % | | | 0.01 | % | | | 0.08 | % | | | 1.63 | % | | | 2.97 | % | | | 2.80 | % |
Ratios to average net assets (annualized) | | | | | | | | | | | | | | | | | | | | | | | | |
Gross expenses | | | 0.82 | % | | | 0.84 | % | | | 0.86 | % | | | 0.84 | % | | | 0.85 | % | | | 0.86 | % |
Net expenses | | | 0.24 | % | | | 0.35 | % | | | 0.61 | % | | | 0.81 | % | | | 0.82 | % | | | 0.83 | % |
Net investment income | | | 0.01 | % | | | 0.01 | % | | | 0.09 | % | | | 1.58 | % | | | 2.92 | % | | | 2.75 | % |
Supplemental data | | | | | | | | | | | | | | | | | | | | | | | | |
Net assets, end of period (000’s omitted) | | | $114,832 | | | | $130,539 | | | | $149,162 | | | | $329,511 | | | | $391,651 | | | | $401,369 | |
| 1. | After the close of business on July 9, 2010, the Fund acquired the net assets of Evergreen Municipal Money Market Fund which became the accounting and performance survivor in the transaction. The information for the periods prior to July 12, 2010 is that of Class A of Evergreen Municipal Money Market Fund. |
| 2. | Amount is less than $0.005. |
| 3. | Returns for periods less than one year are not annualized. |
The accompanying notes are an integral part of these financial statements.
| | | | | | |
| Financial Highlights | | Wells Fargo Advantage Municipal Money Market Fund | | | 33 | |
(For a share outstanding throughout each period)
| | | | | | | | |
| Institutional Class | | Six Months Ended
July 31, 2011
(Unaudited) | | | Year Ended
January 31,
20111 | |
Net asset value, beginning of period | | $ | 1.00 | | | $ | 1.00 | |
Net investment income | | | 0.00 | 2 | | | 0.00 | 2 |
Net realized gains on investments | | | 0.00 | 2 | | | 0.00 | 2 |
| | | | | | | | |
Total from investment operations | | | 0.00 | 2 | | | 0.00 | 2 |
Distributions to shareholders from | | | | | | | | |
Net investment income | | | (0.00 | )2 | | | (0.00 | )2 |
Net realized gains | | | 0.00 | | | | (0.00 | )2 |
| | | | | | | | |
Total distributions to shareholders | | | (0.00 | )2 | | | (0.00 | )2 |
Net asset value, end of period | | $ | 1.00 | | | $ | 1.00 | |
Total return3 | | | 0.03 | % | | | 0.09 | % |
Ratios to average net assets (annualized) | | | | | | | | |
Gross expenses | | | 0.44 | % | | | 0.45 | % |
Net expenses | | | 0.19 | % | | | 0.20 | % |
Net investment income | | | 0.08 | % | | | 0.16 | % |
Supplemental data | | | | | | | | |
Net assets, end of period (000’s omitted) | | | $52,998 | | | | $106,186 | |
| 1. | For the period from July 9, 2010 (commencement of class operations) to January 31, 2011. |
| 2. | Amount is less than $0.005. |
| 3. | Returns for periods less than one year are not annualized. |
The accompanying notes are an integral part of these financial statements.
| | | | |
| 34 | | Wells Fargo Advantage Municipal Money Market Fund | | Financial Highlights |
(For a share outstanding throughout each period)
| | | | | | | | |
| Investor Class | | Six Months Ended
July 31, 2011
(Unaudited) | | | Year Ended
January 31,
20111 | |
Net asset value, beginning of period | | $ | 1.00 | | | $ | 1.00 | |
Net investment income | | | 0.00 | 2 | | | 0.00 | 2 |
Net realized gains on investments | | | 0.00 | 2 | | | 0.00 | 2 |
| | | | | | | | |
Total from investment operations | | | 0.00 | 2 | | | 0.00 | 2 |
Distributions to shareholders from | | | | | | | | |
Net investment income | | | (0.00 | )2 | | | (0.00 | )2 |
Net realized gains | | | 0.00 | | | | (0.00 | )2 |
| | | | | | | | |
Total distributions to shareholders | | | (0.00 | )2 | | | (0.00 | )2 |
Net asset value, end of period | | $ | 1.00 | | | $ | 1.00 | |
Total return3 | | | 0.00 | % | | | 0.01 | % |
Ratios to average net assets (annualized) | | | | | | | | |
Gross expenses | | | 0.85 | % | | | 0.89 | % |
Net expenses | | | 0.24 | % | | | 0.35 | % |
Net investment income | | | 0.01 | % | | | 0.01 | % |
Supplemental data | | | | | | | | |
Net assets, end of period (000’s omitted) | | | $190,365 | | | | $209,041 | |
| 1. | For the period from July 9, 2010 (commencement of class operations) to January 31, 2011. |
| 2. | Amount is less than $0.005. |
| 3. | Returns for periods less than one year are not annualized. |
The accompanying notes are an integral part of these financial statements.
| | | | | | |
| Financial Highlights | | Wells Fargo Advantage Municipal Money Market Fund | | | 35 | |
(For a share outstanding throughout each period)
| | | | | | | | | | | | | | | | | | | | | | | | |
| | | Six Months Ended
July 31, 2011
(Unaudited) | | | Year Ended January 31, | |
| Service Class | | | 20111 | | | 20101 | | | 20091 | | | 20081 | | | 20071 | |
Net asset value, beginning of period | | $ | 1.00 | | | $ | 1.00 | | | $ | 1.00 | | | $ | 1.00 | | | $ | 1.00 | | | $ | 1.00 | |
Net investment income | | | 0.00 | 2 | | | 0.00 | 2 | | | 0.00 | 2 | | | 0.02 | | | | 0.03 | | | | 0.03 | |
Net realized gains on investments | | | 0.00 | 2 | | | 0.00 | 2 | | | 0.00 | | | | 0.00 | | | | 0.00 | | | | 0.00 | |
| | | | | | | | | | | | | | | | | | | | | | | | |
Total from investment operations | | | 0.00 | 2 | | | 0.00 | 2 | | | 0.00 | 2 | | | 0.02 | | | | 0.03 | | | | 0.03 | |
Distributions to shareholders from | | | | | | | | | | | | | | | | | | | | | | | | |
Net investment income | | | (0.00 | )2 | | | (0.00 | )2 | | | (0.00 | )2 | | | (0.02 | ) | | | (0.03 | ) | | | (0.03 | ) |
Net realized gains | | | 0.00 | | | | (0.00 | )2 | | | 0.00 | | | | 0.00 | | | | 0.00 | | | | 0.00 | |
| | | | | | | | | | | | | | | | | | | | | | | | |
Total distributions to shareholders | | | (0.00 | )2 | | | (0.00 | )2 | | | (0.00 | )2 | | | (0.02 | ) | | | (0.03 | ) | | | (0.03 | ) |
Net asset value, end of period | | $ | 1.00 | | | $ | 1.00 | | | $ | 1.00 | | | $ | 1.00 | | | $ | 1.00 | | | $ | 1.00 | |
Total return3 | | | 0.00 | % | | | 0.01 | % | | | 0.20 | % | | | 1.94 | % | | | 3.28 | % | | | 3.11 | % |
Ratios to average net assets (annualized) | | | | | | | | | | | | | | | | | | | | | | | | |
Gross expenses | | | 0.72 | % | | | 0.64 | % | | | 0.56 | % | | | 0.54 | % | | | 0.55 | % | | | 0.56 | % |
Net expenses | | | 0.24 | % | | | 0.35 | % | | | 0.46 | % | | | 0.51 | % | | | 0.52 | % | | | 0.53 | % |
Net investment income | | | 0.01 | % | | | 0.01 | % | | | 0.23 | % | | | 1.88 | % | | | 3.22 | % | | | 3.06 | % |
Supplemental data | | | | | | | | | | | | | | | | | | | | | | | | |
Net assets, end of period (000’s omitted) | | | $108,548 | | | | $96,341 | | | | $154,410 | | | | $265,743 | | | | $363,542 | | | | $375,326 | |
| 1. | After the close of business on July 9, 2010, the Fund acquired the net assets of Evergreen Municipal Money Market Fund which became the accounting and performance survivor in the transaction. The information for the periods prior to July 12, 2010 is that of Class I of Evergreen Municipal Money Market Fund. |
| 2. | Amount is less than $0.005. |
| 3. | Returns for periods less than one year are not annualized. |
The accompanying notes are an integral part of these financial statements.
| | | | |
| 36 | | Wells Fargo Advantage Municipal Money Market Fund | | Financial Highlights |
(For a share outstanding throughout each period)
| | | | | | | | | | | | | | | | | | | | | | | | |
| | | Six Months Ended
July 31, 2011
(Unaudited) | | | Year Ended January 31, | |
| Sweep Class | | | 20111 | | | 20101 | | | 20091 | | | 20081 | | | 20071 | |
Net asset value, beginning of period | | $ | 1.00 | | | $ | 1.00 | | | $ | 1.00 | | | $ | 1.00 | | | $ | 1.00 | | | $ | 1.00 | |
Net investment income | | | 0.00 | 2 | | | 0.00 | 2 | | | 0.00 | 2 | | | 0.01 | | | | 0.03 | | | | 0.02 | |
Net realized gains on investments | | | 0.00 | 2 | | | 0.00 | 2 | | | 0.00 | | | | 0.00 | | | | 0.00 | | | | 0.00 | |
| | | | | | | | | | | | | | | | | | | | | | | | |
Total from investment operations | | | 0.00 | 2 | | | 0.00 | 2 | | | 0.00 | 2 | | | 0.01 | | | | 0.03 | | | | 0.02 | |
Distributions to shareholders from | | | | | | | | | | | | | | | | | | | | | | | | |
Net investment income | | | (0.00 | )2 | | | (0.00 | )2 | | | (0.00 | )2 | | | (0.01 | ) | | | (0.03 | ) | | | (0.02 | ) |
Net realized gains | | | 0.00 | | | | (0.00 | )2 | | | 0.00 | | | | 0.00 | | | | 0.00 | | | | 0.00 | |
| | | | | | | | | | | | | | | | | | | | | | | | |
Total distributions to shareholders | | | (0.00 | )2 | | | (0.00 | )2 | | | (0.00 | )2 | | | (0.01 | ) | | | (0.03 | ) | | | (0.02 | ) |
Net asset value, end of period | | $ | 1.00 | | | $ | 1.00 | | | $ | 1.00 | | | $ | 1.00 | | | $ | 1.00 | | | $ | 1.00 | |
Total return3 | | | 0.00 | % | | | 0.01 | % | | | 0.03 | % | | | 1.34 | % | | | 2.67 | % | | | 2.50 | % |
Ratios to average net assets (annualized) | | | | | | | | | | | | | | | | | | | | | | | | |
Gross expenses | | | 1.17 | % | | | 1.17 | % | | | 1.15 | % | | | 1.15 | % | | | 1.15 | % | | | 1.16 | % |
Net expenses | | | 0.25 | % | | | 0.35 | % | | | 0.63 | % | | | 1.11 | % | | | 1.12 | % | | | 1.13 | % |
Net investment income | | | 0.01 | % | | | 0.01 | % | | | 0.03 | % | | | 1.29 | % | | | 2.50 | % | | | 2.46 | % |
Supplemental data | | | | | | | | | | | | | | | | | | | | | | | | |
Net assets, end of period (000’s omitted) | | | $2,105,372 | | | | $3,233,532 | | | | $3,527,022 | | | | $2,485,601 | | | | $1,731,950 | | | | $337,019 | |
| 1. | After the close of business on July 9, 2010, the Fund acquired the net assets of Evergreen Municipal Money Market Fund which became the accounting and performance survivor in the transaction. The information for the periods prior to July 12, 2010 is that of Class S of Evergreen Municipal Money Market Fund. |
| 2. | Amount is less than $0.005. |
| 3. | Returns for periods less than one year are not annualized. |
The accompanying notes are an integral part of these financial statements.
| | | | | | |
| Notes to Financial Statements (Unaudited) | | Wells Fargo Advantage Municipal Money Market Fund | | | 37 | |
1. ORGANIZATION
Wells Fargo Funds Trust (the “Trust”), a Delaware statutory trust organized on March 10, 1999, is an open-end management investment company registered under the Investment Company Act of 1940, as amended (the “1940 Act”). These financial statements report on Wells Fargo Advantage Municipal Money Market Fund (the “Fund”) which is a diversified series of the Trust.
2. SIGNIFICANT ACCOUNTING POLICIES
The following significant accounting policies, which are consistently followed in the preparation of the financial statements of the Fund, are in conformity with U.S. generally accepted accounting principles which require management to make estimates and assumptions that affect the reported amounts of assets and liabilities, disclosure of contingent assets and liabilities at the date of the financial statements, and the reported amounts of revenues and expenses during the reporting period. Actual results could differ from those estimates.
Securities valuation
As permitted under Rule 2a-7 of the 1940 Act, securities are valued at amortized cost, which approximates fair value.
The valuation techniques used by the Fund to measure fair value are consistent with the market approach, income approach and/or cost approach, where applicable, for each security type.
Security transactions and income recognition
Securities transactions are recorded on a trade date basis. Realized gains or losses are reported on the basis of identified cost of securities delivered.
Interest income is accrued daily and bond discounts are accreted and premiums are amortized daily based on the effective interest method. To the extent debt obligations are placed on non-accrual status, any related interest income may be reduced by writing off interest receivables when the collection of all or a portion of interest has become doubtful based on consistently applied procedures. If the issuer subsequently resumes interest payments or when the collectability of interest is reasonably assured, the debt obligation is removed from non-accrual status.
Distributions to shareholders
Distributions to shareholders from net investment income are accrued daily and paid monthly. Distributions from net realized gains, if any, are recorded on the ex-dividend date. Such distributions are determined in conformity with income tax regulations, which may differ from generally accepted accounting principles.
Federal and other taxes
The Fund intends to continue to qualify as a regulated investment company by distributing substantially all of its investment company taxable and tax-exempt income and any net realized capital gains (after reduction for capital loss carryforwards) sufficient to relieve it from all, or substantially all, federal income taxes. Accordingly, no provision for federal income taxes was required.
The Fund’s income and federal excise tax returns and all financial records supporting those returns for the prior three fiscal years are subject to examination by the federal and Delaware revenue authorities.
Under the recently enacted Regulated Investment Company Modernization Act of 2010, the Fund will be permitted to carry forward capital losses incurred in taxable years beginning after December 22, 2010 for an unlimited period. However, any losses incurred during those future taxable years will be required to be utilized prior to the losses incurred in pre-enactment taxable years. As a result of this ordering rule, pre-enactment capital loss carryforwards may be more likely to expire unused. Additionally, post-enactment capital losses that are carried forward will retain their character as either short-term or long-term capital losses rather than being considered all short-term as under previous law.
Class allocations
The separate classes of shares offered by the Fund differ principally in distribution, shareholder servicing and administration fees. Shareholders of each class bear certain expenses that pertain to that particular class. All shareholders bear the common expenses of the Fund, earn income from the portfolio, and are allocated unrealized gains and losses pro rata based on the average daily net assets of each class, without distinction between share classes. Dividends are determined separately for each class based on income and expenses allocable to each class. Realized gains and losses are allocated to each class pro rata based upon the net assets of each class on the date realized. Differences in per share
| | | | |
| 38 | | Wells Fargo Advantage Municipal Money Market Fund | | Notes to Financial Statements (Unaudited) |
dividend rates generally result from the relative weightings of pro rata income and realized gain allocations and from differences in separate class expenses, including distribution, shareholder servicing and administration fees.
3. FAIR VALUATION MEASUREMENTS
Fair value measurements of investments are determined within a framework that has established a fair value hierarchy based upon the various data inputs utilized in determining the value of the Fund’s investments. The three-level hierarchy gives the highest priority to unadjusted quoted prices in active markets for identical assets or liabilities (Level 1) and the lowest priority to unobservable inputs (Level 3). The Fund’s investments are classified within the fair value hierarchy based on the lowest level of input that is significant to the fair value measurement. The inputs are summarized into three broad levels as follows:
| n | | Level 1 – quoted prices in active markets for identical securities |
| n | | Level 2 – other significant observable inputs (including quoted prices for similar securities, interest rates, prepayment speeds, credit risk, etc.) |
| n | | Level 3 – significant unobservable inputs (including the Fund’s own assumptions in determining the fair value of investments) |
The inputs or methodologies used for valuing securities are not necessarily an indication of the risk associated with investing in those securities.
At July 31, 2011, all of the Fund’s investments in securities carried at fair value were designated as Level 2 since the primary inputs include credit quality of the issuer and short-term interest rates which are observable.
Further details on the major security types can be found in the Fund’s Portfolio of Investments.
4. TRANSACTIONS WITH AFFILIATES AND OTHER EXPENSES
Advisory fee
The Trust has entered into an advisory contract with Wells Fargo Funds Management, LLC (“Funds Management”), an indirect wholly owned subsidiary of Wells Fargo & Company (“Wells Fargo”). The adviser is responsible for implementing investment policies and guidelines and for supervising the sub-adviser, who is responsible for day-to-day portfolio management of the Fund.
Pursuant to the contract, Funds Management is entitled to receive an annual advisory fee starting at 0.30% and declining to 0.20% as the average daily net assets of the Fund increase. For the six months ended July 31, 2011, the advisory fee was equivalent to an annual rate of 0.28% of the Fund’s average daily net assets.
Funds Management may retain the services of certain sub-advisers to provide daily portfolio management to the Fund. The fees related to sub-advisory services are borne directly by the adviser and do not increase the overall fees paid by the Fund to the adviser. Wells Capital Management Incorporated, an affiliate of Funds Management, is the sub-adviser to the Fund and is entitled to receive a fee from the adviser at an annual rate starting at 0.05% and declining to 0.01% as the average daily net assets of the Fund increase.
Administration and transfer agent fees
The Trust has entered into an administration agreement with Funds Management. Under this agreement, for providing administrative services, which includes paying fees and expenses for services provided by the transfer agent, sub-transfer agents, omnibus account servicers and record-keepers, Funds Management is entitled to receive from the Fund an annual fund level administration fee starting at 0.05% and declining to 0.03% as the average daily net assets of the Fund increase and a class level administration fee which is calculated based on the average daily net assets of each class as follows:
| | | | |
| | | Class Level Administration Fee | |
Class A, Sweep Class | | | 0.22 | % |
Institutional Class | | | 0.08 | |
Investor Class | | | 0.25 | |
Service Class | | | 0.12 | |
| | | | | | |
| Notes to Financial Statements (Unaudited) | | Wells Fargo Advantage Municipal Money Market Fund | | | 39 | |
Funds Management has contractually waived and/or reimbursed advisory and administration fees to the extent necessary to maintain certain net operating expense ratios for the Fund. Waiver of fees and/or reimbursement of expenses by Funds Management were made first from fund level expenses on a proportionate basis and then from class specific expenses.
Distribution fees
The Trust has adopted a Distribution Plan for Sweep Class shares of the Fund pursuant to Rule 12b-1 under the 1940 Act. Distribution fees are charged to the Sweep Class shares and paid to Wells Fargo Funds Distributor, LLC, the principal underwriter, at an annual rate of 0.35% of the average daily net assets of Sweep Class shares.
Shareholder servicing fees
The Trust has entered into contracts with one or more shareholder servicing agents, whereby Class A, Investor Class, Service Class and Sweep Class of each applicable Fund is charged a fee at an annual rate of 0.25% of the respective average daily net assets of each class.
A portion of these total shareholder servicing fees were paid to affiliates of Wells Fargo.
5. ACQUISITION
After the close of business on July 9, 2010, the Fund, which is the legal survivor, acquired the net assets of Evergreen Municipal Money Market Fund, the accounting and performance survivor. The purpose of the transaction was to combine two funds with similar investment objectives and strategies. The acquisition was accomplished by a tax-free exchange of all of the shares of Evergreen Municipal Money Market Fund. Shareholders holding Class A, Class S and Class I shares of Evergreen Municipal Money Market Fund received Class A, Sweep Class and Service Class, respectively, of the Fund in the reorganization. The exchange ratio and number of shares issued to the Evergreen Municipal Money Market Fund were as follows:
| | | | | | | | | | | | | | |
| Acquired Fund | | Exchange
Ratio | | | Number of Shares Issued |
Evergreen Municipal Money Market Fund | | | | | | | 1.00 | | | | 133,242,290 | | | Class A |
| | | | | | | 1.00 | | | | 3,408,031,308 | | | Sweep Class |
| | | | | | | 1.00 | | | | 128,556,109 | | | Service Class |
The investment portfolio of the Fund with a fair value of $345,316,204 and amortized cost of $345,316,204 at July 9, 2010 were the principal assets acquired by the accounting and performance survivor. The shares and net assets of the Fund immediately prior to the acquisition were 346,040,015 shares and $346,037,780. The aggregate net assets of Evergreen Municipal Money Market Fund immediately prior to the acquisition were $3,669,614,294. The aggregate net assets of the Fund immediately after the acquisition were $4,015,652,074. For financial reporting purposes, assets received and shares issued by the Fund were recorded at fair value; however, the cost basis of the investments received from the Fund was carried forward to align ongoing reporting the Fund’s realized and unrealized gains and losses with amounts distributable to shareholders for tax purposes.
Assuming the acquisition had been completed February 1, 2010, the beginning of the annual reporting period for the Fund, the pro forma results of operations for the year ended January 31, 2011 would have been:
| | | | |
Net investment income | | $ | 535,222 | |
Net realized gains on investments | | $ | 191,695 | |
Net increase in net assets resulting from operations | | $ | 726,917 | |
6. INDEMNIFICATION
Under the Trust’s organizational documents, the officers and directors are indemnified against certain liabilities that may arise out of performance of their duties to the Trust. Additionally, in the normal course of business, the Trust may enter into contracts with service providers that contain a variety of indemnification clauses. The Trust’s maximum exposure under these arrangements is dependent on future claims that may be made against the Fund and, therefore, cannot be estimated.
| | | | |
| 40 | | Wells Fargo Advantage Municipal Money Market Fund | | Notes to Financial Statements (Unaudited) |
7. NEW ACCOUNTING PRONOUNCEMENTS
In May 2011, the Financial Accounting Standards Board (“FASB”) issued Accounting Standards Update (“ASU”) No. 2011-04 “Amendments to Achieve Common Fair Value Measurement and Disclosure Requirements in U.S. GAAP and IFRSs”. ASU No. 2011-04 amends FASB ASC Topic 820, Fair Value Measurements and Disclosures, to establish common requirements for measuring fair value and for disclosing information about fair value measurements in accordance with GAAP. The ASU is effective prospectively for interim and annual periods beginning after December 15, 2011.
In April 2011, FASB issued ASU No. 2011-03 “Reconsideration of Effective Control for Repurchase Agreements”. ASU No. 2011-03 amends FASB ASC Topic 860, Transfers and Servicing, specifically the criteria required to determine whether a repurchase agreement (repo) and similar agreements should be accounted for as sales of financial assets or secured borrowings with commitments. ASU No. 2011-03 changes the assessment of effective control by focusing on the transferor’s contractual rights and obligations and removing the criterion to assess its ability to exercise those rights or honor those obligations. This could result in changes to the way entities account for certain transactions including repurchase agreements, mortgage dollar rolls and reverse repurchase agreements. The ASU will become effective on a prospective basis for new transfers and modifications to existing transactions as of the beginning of the first interim or annual period beginning on or after December 15, 2011.
As of July 31, 2011, management of the Fund is currently assessing the potential impact, in addition to expanded financial statement disclosure, that may result from adopting these ASUs.
| | | | | | |
| Other Information (Unaudited) | | Wells Fargo Advantage Municipal Money Market Fund | | | 41 | |
PORTFOLIO HOLDINGS INFORMATION
The complete portfolio holdings for the Fund are publicly available on the Fund’s Web site
(www.wellsfargo.com/advantagefunds) on a monthly, seven-day delayed basis. The Fund files its complete schedule of portfolio holdings with the SEC for the first and third quarters of each fiscal year on Form N-Q, which is available without charge by visiting the SEC Web site at www.sec.gov. In addition, the Fund’s Form N-Q may be reviewed and copied at the SEC’s Public Reference Room in Washington, DC, and at regional offices in New York City, at 233 Broadway, and in Chicago, at 175 West Jackson Boulevard, Suite 900. Information about the Public Reference Room may be obtained by calling 1-800-SEC-0330.
PROXY VOTING INFORMATION
A description of the policies and procedures that the Fund uses to determine how to vote proxies relating to portfolio securities is available without charge, upon request, by calling 1-800-222-8222, visiting our Web site at www.wellsfargo.com/advantagefunds, or visiting the SEC Web site at www.sec.gov. Information regarding how the Fund voted proxies relating to portfolio securities during the most recent 12-month period ended June 30 is available without charge on the Fund’s Web site at www.wellsfargo.com/advantagefunds or by visiting the SEC Web site at www.sec.gov.
| | | | |
| 42 | | Wells Fargo Advantage Municipal Money Market Fund | | Other Information (Unaudited) |
BOARD OF TRUSTEES
The following table provides basic information about the Board of Trustees (the “Trustees”) of the Trust and Officers of the Trust. This table should be read in conjunction with the Prospectus and the Statement of Additional Information1 of the Fund. Each of the Trustees and Officers listed below acts in identical capacities for the Wells Fargo Advantage family of funds, which consists of 144 funds comprising the Wells Fargo Funds Trust, Wells Fargo Variable Trust, Wells Fargo Master Trust and four closed-end funds (collectively the “Fund Complex”). All of the Trustees are also Members of the Audit and Governance Committees of each Trust in the Fund Complex. The mailing address of each Trustee and Officer is 525 Market Street, 12th Floor, San Francisco, CA 94105. Each Trustee and Officer serves an indefinite term, however, each Trustee serves such term until reaching the mandatory retirement age established by the Trustees.
Independent Trustees
| | | | | | |
Name and Year of Birth | | Position Held and Length of Service | | Principal Occupations During Past Five Years | | Other Directorships During
Past Five Years |
Peter G. Gordon
(Born 1942) | | Trustee, since 1998; Chairman, since 2005 | | Co-Founder, Chairman, President and CEO of Crystal Geyser. Water Company. Trustee Emeritus, Colby College | | Asset Allocation Trust |
Isaiah Harris, Jr.
(Born 1952) | | Trustee, since 2009 | | Retired. Prior thereto, President and CEO of BellSouth Advertising and Publishing Corp. from 2005 to 2007, President and CEO of BellSouth Enterprises from 2004 to 2005 and President of BellSouth Consumer Services from 2000 to 2003. Emeritus member of the Iowa State University Foundation Board of Governors. Emeritus Member of the Advisory Board of Iowa State University School of Business. Mr. Harris is a certified public accountant. | | CIGNA Corporation; Deluxe Corporation; Asset Allocation Trust |
Judith M. Johnson
(Born 1949) | | Trustee, since 2008 | | Retired. Prior thereto, Chief Executive Officer and Chief Investment Officer of Minneapolis Employees Retirement Fund from 1996 to 2008. Ms. Johnson is an attorney, certified public accountant and a certified managerial accountant. | | Asset Allocation Trust |
Leroy Keith, Jr.
(Born 1939) | | Trustee, since 2010 | | Chairman, Bloc Global Services (development and construction), Trustee of the Evergreen Funds from 1983 to 2010. Former Managing Director, Almanac Capital Management (commodities firm), former Partner, Stonington Partners, Inc. (private equity fund), former Director, Obagi Medical Products Co. and former Director, Lincoln Educational Services. | | Trustee, Virtus Fund Complex (consisting of 45 portfolios as of 12/31/10); Director, Diversapack Co. (packaging company); Asset Allocation Trust |
David F. Larcker
(Born 1950) | | Trustee, since 2009 | | James Irvin Miller Professor of Accounting at the Graduate School of Business, Stanford University, Director of Corporate Governance Research Program and Co-Director of The Rock Center for Corporate Governance since 2006. From 2005 to 2008, Professor of Accounting at the Graduate School of Business, Stanford University. Prior thereto, Ernst & Young Professor of Accounting at The Wharton School, University of Pennsylvania from 1985 to 2005. | | Asset Allocation Trust |
Olivia S. Mitchell
(Born 1953) | | Trustee, since 2006 | | International Foundation of Employee Benefit Plans Professor and Chair of the Department of Insurance and Risk Management, Wharton School of the University of Pennsylvania since 1993. Director of Wharton’s Pension Research Council and Boettner Center on Pensions & Retirement Research, and Research Associate at the National Bureau of Economic Research. Previously, Cornell University Professor from 1978 to 1993. | | Asset Allocation Trust |
| | | | | | |
| Other Information (Unaudited) | | Wells Fargo Advantage Municipal Money Market Fund | | | 43 | |
| | | | | | |
Name and Year of Birth | | Position Held and Length of Service | | Principal Occupations During Past Five Years | | Other Directorships During
Past Five Years |
Timothy J. Penny
(Born 1951) | | Trustee, since 1996 | | President and CEO of Southern Minnesota Initiative Foundation, a non-profit organization, since 2007 and Senior Fellow at the Humphrey Institute Policy Forum at the University of Minnesota since 1995. Member of the Board of Trustees of NorthStar Education Finance, Inc., a non-profit organization, since 2007. | | Asset Allocation Trust |
Michael S. Scofield
(Born 1943) | | Trustee, since 2010 | | Currently serves on the Investment Company Institute’s Board of Governors and Executive Committee as well the In dependent Director’s Counsel Board of Governors and Executive Committee. Former Chairman of the Independent Directors Counsel. Trustee of the Evergreen Funds from 1984 to 2010. Retired Attorney, Law Offices of Michael S. Scofield and former Director and Chairman, Branded Media Corporation (multi-media branding company). | | Asset Allocation Trust |
Donald C. Willeke
(Born 1940) | | Trustee, since 1996 | | Principal of the law firm of Willeke & Daniels. General Counsel of the Minneapolis Employees Retirement Fund from 1984 until its consolidation into the Minnesota Public Employees Retirement Association on June 30, 2010. | | Asset Allocation Trust |
Officers
| | | | | | |
Name and Year of Birth | | Position Held and
Length of Service | | Principal Occupations During Past Five Years | | |
Karla M. Rabusch
(Born 1959) | | President, since 2003 | | Executive Vice President of Wells Fargo Bank, N.A. and President of Wells Fargo Funds Management, LLC since 2003. Senior Vice President and Chief Administrative Officer of Wells Fargo Funds Management, LLC from 2001 to 2003. | | |
C. David Messman
(Born 1960) | | Secretary, since 2000; Chief Legal Counsel, since 2003 | | Senior Vice President and Secretary of Wells Fargo Funds Management, LLC since 2001. Vice President and Managing Counsel of Wells Fargo Bank, N.A. since 1996. | | |
Kasey Phillips
(Born 1970) | | Treasurer, since 2008 | | Senior Vice President of Wells Fargo Funds Management, LLC since 2009. Senior Vice President of Evergreen Investment Management Company, LLC from 2006 to 2010. Treasurer of the Evergreen Funds from 2005 to 2010. Vice President and Assistant Vice President of Evergreen Investment Services, Inc. from 1999 to 2006. | | |
David Berardi
(Born 1975) | | Assistant Treasurer, since 2009 | | Vice President of Wells Fargo Funds Management, LLC since 2009 . Vice President of Evergreen Investment Management Company, LLC from 2008 to 2010. Assistant Vice President of Evergreen Investment Services, Inc. from 2004 to 2008. Manager of Fund Reporting and Control for Evergreen Investment Management Company, LLC from 2004 to 2010. | | |
Jeremy DePalma
(Born 1974) | | Assistant Treasurer, since 2009 | | Senior Vice President of Wells Fargo Funds Management, LLC since 2009. Senior Vice President of Evergreen Investment Management Company, LLC from 2008 to 2010. Vice President, Evergreen Investment Services, Inc. from 2004 to 2007. Assistant Vice President, Evergreen Investment Services, Inc. from 2000 to 2004 and the head of the Fund Reporting and Control Team within Fund Administration from 2005 to 2010. | | |
Debra Ann Early
(Born 1964) | | Chief Compliance Officer, since 2007 | | Chief Compliance Officer of Wells Fargo Funds Management, LLC since 2007. Chief Compliance Officer of Parnassus Investments from 2005 to 2007. Chief Financial Officer of Parnassus Investments from 2004 to 2007 and Senior Audit Manager of PricewaterhouseCoopers LLP from 1998 to 2004. | | |
| 1. | The Statement of Additional Information includes additional information about the Fund’s Trustees and is available, without charge, upon request, by calling 1-800-222-8222 or by visiting the Fund’s Web site at www.wellsfargo.com/advantagefunds. |
| | | | |
| 44 | | Wells Fargo Advantage Municipal Money Market Fund | | Other Information (Unaudited) |
BOARD CONSIDERATION OF INVESTMENT ADVISORY AND SUB-ADVISORY AGREEMENTS:
California Municipal Money Market Fund, Municipal Cash Management Money Market Fund, Municipal Money Market Fund, National Tax-Free Money Market Fund, New Jersey Municipal Money Market Fund, New York Municipal Money Market Fund and Pennsylvania Municipal Money Market Fund
(Not all of the funds described in this Board considerations section are part of this shareholder report. This shareholder report only relates to Municipal Money Market Fund.)
Each year, as required by Section 15 of the Investment Company Act of 1940 (the “1940 Act”), the Board of Trustees (the “Board”) of Wells Fargo Funds Trust (the “Trust”), all the members of which have no direct or indirect interest in the investment advisory and sub-advisory agreements and are not “interested persons” of the Trust, as defined in the 1940 Act (the “Independent Trustees”), determines whether to approve the continuation of the Trust’s investment advisory and sub-advisory agreements. In this regard, at an in person meeting held on March 24-25, 2011 (the “Meeting”), the Board reviewed and re-approved: (i) an investment advisory agreement with Wells Fargo Funds Management, LLC (“Funds Management”) for each of the California Municipal Money Market Fund, Municipal Cash Management Money Market Fund, Municipal Money Market Fund, National Tax-Free Money Market Fund, New Jersey Municipal Money Market Fund, New York Municipal Money Market Fund and Pennsylvania Municipal Money Market Fund (collectively, the “Funds”); and (ii) an investment sub-advisory agreement with Wells Capital Management Incorporated (“Wells Capital Management”) for each of the Funds. The investment advisory agreements with Funds Management and the investment sub-advisory agreements with Wells Capital Management are collectively referred to as the “Advisory Agreements.”
At the Meeting, the Board considered the factors and reached the conclusions described below relating to the selection of Funds Management and Wells Capital Management and continuation of the Advisory Agreements. Prior to the Meeting, the Trustees conferred extensively among themselves and with representatives of Funds Management about these matters. The Board also met throughout the year and received information that was useful to them in considering the continuation of the Advisory Agreements. The Independent Trustees were assisted in their evaluation of the Advisory Agreements by independent legal counsel, from whom they received separate legal advice and with whom they met separately from Funds Management.
Nature, extent and quality of services
The Board received and considered various information regarding the nature, extent and quality of services provided to the Funds by Funds Management and Wells Capital Management under the Advisory Agreements. The Board also received and considered information provided in response to a detailed set of requests submitted by the Independent Trustees’ independent legal counsel on their behalf. The Board received and considered, among other things, information about the background and experience of senior management of Funds Management, and the qualifications, backgrounds, tenures and responsibilities of the portfolio managers primarily responsible for the day-to-day portfolio management of the Funds.
The Board evaluated the ability of Funds Management and Wells Capital Management, based on their respective financial condition, resources, reputation and other attributes, to attract and retain qualified investment professionals, including research, advisory, and supervisory personnel. The Board further considered the compliance programs and compliance records of Funds Management and Wells Capital Management. In addition, the Board took into account the administrative services provided to the Funds by Funds Management and its affiliates.
The Board’s decision to approve the continuation of the Advisory Agreements was based on a comprehensive evaluation of all of the information provided to it. In approving the continuation of the Advisory Agreements, the Board did not identify any particular information or consideration that was all-important or controlling, and each Trustee attributed different weights to various factors. The Board evaluated information provided to it both in terms of the funds generally and with respect to each Fund specifically as it considered appropriate. Although the Board considered the continuation of the Advisory Agreements for each of the Funds as part of the larger process of considering the continuation of the advisory agreements for all of the funds, its decision to continue the Advisory Agreements for each of the Funds was ultimately made on a fund-by-fund basis.
In considering these matters, the Board considered not only the specific information presented in connection with the Meeting, but also the knowledge gained over time through interaction with Funds Management and Wells Capital Management about various topics, including Funds Management’s oversight of service providers. The above factors,
| | | | | | |
| Other Information (Unaudited) | | Wells Fargo Advantage Municipal Money Market Fund | | | 45 | |
together with those referenced below, are some of the most important, but not necessarily all, factors considered by the Board in concluding that it was satisfied with the nature, extent and quality of the investment advisory services provided to each Fund by Funds Management and Wells Capital Management.
Fund performance and expenses
The Board considered the performance results for each of the Funds over various time periods ended December 31, 2010. The Board also considered these results in comparison to the median performance of a universe of relevant funds (the “Universe”) that were determined by Lipper Inc. (“Lipper”) to be similar to the Funds, and in comparison to each Fund’s benchmark index and to other comparative data. Lipper is an independent provider of investment company data. The Board received a description of the methodology used by Lipper to select the mutual funds in the Universe.
The Board noted that the performance of each of the Funds was generally higher than or in range of the median performance of the Universe for the periods under review.
The Board received and considered information regarding each Fund’s contractual advisory fee and net operating expense ratios and their various components, including actual management fees (which reflect fee waivers, if any), transfer agent, custodian and other non-management fees, Rule 12b-1 and non-Rule 12b-1 fees, service fees and fee waiver and expense reimbursement arrangements. The Board also considered these ratios in comparison to the median ratios of an expense Universe and a narrower expense group of mutual funds (each, an “Expense Group”) that was determined by Lipper to be similar to each Fund. The Board received a description of the methodology used by Lipper to select the mutual funds in a Fund’s Expense Group. The Board noted that the net operating expense ratios of the Service Class, Administrator Class and Institutional Class of each of the Funds were in range of each Fund’s respective Expense Group’s median net operating expense ratio. The Board also noted that the net operating expense ratios of the Class A and Sweep Class of each of the Funds were higher than each Fund’s respective Expense Group’s median net operating expense ratio and that the net operating expense ratio of the Municipal Money Market Fund (Investor Class) was not appreciably higher than the Expense Group’s median net operating expense ratio.
Based on the above-referenced considerations and other factors, the Board concluded that the overall performance and expense structure of the Funds supported the re-approval of the Advisory Agreements for the Funds.
Investment advisory and sub-advisory fee rates
The Board reviewed and considered the contractual investment advisory fee rates that are payable by the Funds to Funds Management for investment advisory services (the “Advisory Agreement Rates”), both on a stand-alone basis and on a combined basis with the Funds’ administration fee rates. The Board took into account the separate administrative and other services covered by the administration fee rates. The Board also reviewed and considered the contractual investment sub-advisory fee rates that are payable by Funds Management to Wells Capital Management for investment sub-advisory services (the “Sub-Advisory Agreement Rates”). In addition, the Board reviewed and considered the existing fee waiver/cap arrangements applicable to the Advisory Agreement Rates and considered the Advisory Agreement Rates after taking the waivers/caps into account (the “Net Advisory Rates”).
The Board received and considered information comparing the Advisory Agreement Rates and Net Advisory Rates with those of other funds in each Fund’s Expense Group median. The Board noted that the Advisory Agreement Rates for each of the Funds were in range of the median rate of each Fund’s Expense Group, except for the Municipal Money Market Fund and the New York Municipal Money Market Fund (Sweep Class). The Board noted that the Net Advisory Rates for the Service Class, Administrator Class and the Institutional Class of each of the Funds were lower than or in range of the median rate of each Fund’s Expense Group. The Board noted that the Net Advisory Rate for the Investor Class, Class A and Sweep Class of each of the Funds was not appreciably higher than the median rate for the Fund’s Expense, except for the Sweep Class of the Municipal Money Market Fund, New Jersey Municipal Money Market Fund and the New York Municipal Money Market Fund. The Board further noted that Funds Management had agreed to continue and, in certain instances, reduce contractual fee cap arrangements for the Funds designed to lower the Funds’ expenses.
The Board also received and considered information about the nature and extent of services offered and fee rates charged by Funds Management and Wells Capital Management to other types of clients. In this regard, the Board received information about differences between the services, and the compliance, reporting, and other legal burdens and risks of providing investment advice to mutual funds and those associated with providing advice to non-mutual fund clients such as collective funds or institutional separate accounts.
| | | | |
| 46 | | Wells Fargo Advantage Municipal Money Market Fund | | Other Information (Unaudited) |
In each case, the Board determined that the Advisory Agreement Rates for the Funds, both with and without administration fee rates and before and after waivers, were acceptable in light of the Funds’ Expense Group information, the net expense ratio commitments, the services covered by the Advisory Agreements and other information provided. The Board also reviewed and considered the Sub-Advisory Agreement Rates and concluded that the Sub-Advisory Agreement Rates were acceptable in light of the services covered by the Sub-Advisory Agreement and other information provided.
Profitability
The Board received and considered a profitability analysis of Funds Management, as well as an analysis of the profitability to the collective Wells Fargo businesses that provide services to the Funds. It considered that the information provided to it was necessarily estimated, and that the profitability information provided to it, especially on a fund-by-fund basis, did not necessarily provide a precise tool for evaluating the appropriateness of each Fund’s Advisory Agreement Rates in isolation. It noted that the levels of profitability of the Funds to Funds Management varied widely, depending on, among other things, the size and type of fund. The Board concluded that the profitability to Funds Management of the services provided to any of the Funds, individually or in the aggregate, was not unreasonable.
The Board did not consider separate profitability information with respect to Wells Capital Management, because, as an affiliate of Funds Management, its profitability information was subsumed in the collective Wells Fargo profitability analysis provided by Funds Management.
Economies of scale
With respect to possible economies of scale, the Board reviewed the breakpoints in each Fund’s advisory fee structure, which operate generally to reduce the effective Advisory Agreement Rates of the Funds (as a percentage of Fund assets) as the Funds grow in size. It considered that, as a fund shrinks in size, breakpoints conversely result in increasing fee levels. The Board noted that it would continue to review the appropriate levels of breakpoints in the future, and concluded that the breakpoints as implemented appeared to be a reasonable step toward sharing economies of scale with the Funds. However, the Board acknowledged the inherent limitations of any analysis of an investment adviser’s economies of scale and of any attempt to correlate breakpoints with such economies, stemming largely from the Board’s understanding that economies of scale are realized, if at all, by an investment adviser across a variety of products and services, not just with respect to a single fund.
Other benefits to Funds Management and Wells Capital Management
The Board received and considered information regarding potential “fall-out” or ancillary benefits received by Funds Management and its affiliates, including Wells Capital Management, as a result of their relationship with the Funds. Ancillary benefits could include, among others, benefits directly attributable to the relationship of Funds Management and Wells Capital Management with the Funds and benefits potentially derived from an increase in Funds Management’s and Wells Capital Management’s business as a result of their relationship with the Funds (such as the ability to market to shareholders other financial products offered by Funds Management and its affiliates, including Wells Capital Management).
The Board considered that Wells Fargo Funds Distributor, LLC, an affiliate of Funds Management, serves as distributor to the Funds and receives certain compensation for those services. The Board noted that the Funds pay sub-transfer agency fees to various financial institutions, including affiliates of Funds Management that hold fund shares in omnibus accounts. It also considered that these entities may receive distribution-related fees and shareholder servicing payments (including amounts derived from payments under the funds’ Rule 12b-1 plans) in respect of shares sold or held through them.
The Board also reviewed information about whether and to what extent soft dollar credits are sought and how any such credits are utilized and any benefits that may be realized by using an affiliated broker.
Other factors and broader review
The Board also considered the markets for distribution of the Funds’ shares, including the multiple channels through which the Funds’ shares are offered and sold. The Board noted that the Funds are part of one of the few fund families that have both direct-to-fund and intermediary distribution channels. As discussed above, the Board reviews detailed materials received from Funds Management and Wells Capital Management annually as part of the re-approval process under Section 15 of the 1940 Act and also reviews and assesses information about the quality of the services that the Funds receive throughout the year. In this regard, the Board has reviewed reports of Funds Management at each of its quarterly meetings, which include, among other things, portfolio reviews and performance reports. In addition, the Board confers with portfolio managers at various times throughout the year.
| | | | | | |
| Other Information (Unaudited) | | Wells Fargo Advantage Municipal Money Market Fund | | | 47 | |
Conclusion
After considering the above-described factors and based on its deliberations and its evaluation of the information described above, the Board concluded that approval of the continuation of the Advisory Agreements for the Funds was in the best interest of the Funds and their shareholders. Accordingly, the Board unanimously approved the continuation of the Advisory Agreements for an additional one-year period.
| | | | |
| 48 | | Wells Fargo Advantage Municipal Money Market Fund | | List of Abbreviations |
The following is a list of common abbreviations for terms and entities which may have appeared in this report.
| ABAG | — Association of Bay Area Governments |
| ACB | — Agricultural Credit Bank |
| ADR | — American Depositary Receipt |
| ADS | — American Depository Shares |
| AGC-ICC | — Assured Guaranty Corporation - Insured Custody Certificates |
| AGM | — Assured Guaranty Municipal |
| AMBAC | — American Municipal Bond Assurance Corporation |
| AMT | — Alternative Minimum Tax |
| ARM | — Adjustable Rate Mortgages |
| BAN | — Bond Anticipation Notes |
| BART | — Bay Area Rapid Transit |
| BHAC | — Berkshire Hathaway Assurance Corporation |
| CCAB | — Convertible Capital Appreciation Bond |
| CDA | — Community Development Authority |
| CDO | — Collateralized Debt Obligation |
| CDSC | — Contingent Deferred Sales Charge |
| CGIC | — Capital Guaranty Insurance Company |
| CGY | — Capital Guaranty Corporation |
| CIFG | — CDC (Caisse des Dépôts et Consignations) IX IS Financial Guarantee |
| COP | — Certificate of Participation |
| DRIVER | — Derivative Inverse Tax-Exempt Receipts |
| DW&P | — Department of Water & Power |
| DWR | — Department of Water Resources |
| ECFA | — Educational & Cultural Facilities Authority |
| EDFA | — Economic Development Finance Authority |
| ETET | — Eagle Tax-Exempt Trust |
| ETF | — Exchange-Traded Fund |
| FFCB | — Federal Farm Credit Bank |
| FGIC | — Financial Guaranty Insurance Corporation |
| FHA | — Federal Housing Authority |
| FHAG | — Federal Housing Agency |
| FHLB | — Federal Home Loan Bank |
| FHLMC | — Federal Home Loan Mortgage Corporation |
| FNMA | — Federal National Mortgage Association |
| GDR | — Global Depositary Receipt |
| GNMA | — Government National Mortgage Association |
| HCFR | — Healthcare Facilities Revenue |
| HEFA | — Health & Educational Facilities Authority |
| HEFAR | — Higher Education Facilities Authority Revenue |
| HFA | — Housing Finance Authority |
| HFFA | — Health Facilities Financing Authority |
| HUD | — Housing & Urban Development |
| IBC | — Insured Bond Certificate |
| IDA | — Industrial Development Authority |
| IDAG | — Industrial Development Agency |
| IDR | — Industrial Development Revenue |
| KRW | — Republic of Korea Won |
| LIBOR | — London Interbank Offered Rate |
| LLC | — Limited Liability Company |
| LLP | — Limited Liability Partnership |
| MBIA | — Municipal Bond Insurance Association |
| MFHR | — Multi-Family Housing Revenue |
| MFMR | — Multi-Family Mortgage Revenue |
| MMD | — Municipal Market Data |
| MSTR | — Municipal Securities Trust Receipts |
| MUD | — Municipal Utility District |
| NATL-RE | — National Public Finance Guarantee Corporation |
| PCFA | — Pollution Control Finance Authority |
| PCR | — Pollution Control Revenue |
| PFA | — Public Finance Authority |
| PFFA | — Public Facilities Financing Authority |
| PFOTER | — Puttable Floating Option Tax-Exempt Receipts |
| plc | — Public Limited Company |
| PSFG | — Public School Fund Guaranty |
| PUTTER | — Puttable Tax-Exempt Receipts |
| R&D | — Research & Development |
| RDA | — Redevelopment Authority |
| RDFA | — Redevelopment Finance Authority |
| REIT | — Real Estate Investment Trust |
| RIB | — Residual Interest Bond |
| ROC | — Reset Option Certificates |
| SAVRS | — Select Auction Variable Rate Securities |
| SFHR | — Single Family Housing Revenue |
| SFMR | — Single Family Mortgage Revenue |
| SLMA | — Student Loan Marketing Association |
| SPDR | — Standard & Poor’s Depositary Receipts |
| STIT | — Short-Term Investment Trust |
| TAN | — Tax Anticipation Notes |
| TIPS | — Treasury Inflation-Protected Securities |
| TRAN | — Tax Revenue Anticipation Notes |
| TCR | — Transferable Custody Receipts |
| TTFA | — Transportation Trust Fund Authority |
| USD | — Unified School District |
| XLCA | — XL Capital Assurance |
This page is intentionally left blank.
This page is intentionally left blank.


FOR MORE INFORMATION
More information about Wells Fargo Advantage Funds is available free upon request. To obtain literature, please write, e-mail, visit the Funds’ Web site, or call:
Wells Fargo Advantage Funds
P.O. Box 8266
Boston, MA 02266-8266
E-mail: wfaf@wellsfargo.com
Web site: www.wellsfargo.com/advantagefunds
Individual investors: 1-800-222-8222
Retail investment professionals: 1-888-877-9275
Institutional investment professionals: 1-866-765-0778
This report and the financial statements contained herein are submitted for the general information of the shareholders of Wells Fargo Advantage Funds. If this report is used for promotional purposes, distribution of the report must be accompanied or preceded by a current prospectus. For a prospectus containing more complete information, including charges and expenses, call 1-800-222-8222 or visit the Funds’ Web site at www.wellsfargo.com/advantagefunds. Please consider the investment objectives, risks, charges, and expenses of the investment carefully before investing. This and other information about Wells Fargo Advantage Funds can be found in the current prospectus. Read the prospectus carefully before you invest or send money.
Wells Fargo Funds Management, LLC, a wholly owned subsidiary of Wells Fargo & Company, provides investment advisory and administrative services for Wells Fargo Advantage Funds. Other affiliates of Wells Fargo & Company provide subadvisory and other services for the Funds. The Funds are distributed by Wells Fargo Funds Distributor, LLC, Member FINRA/SIPC, an affiliate of Wells Fargo & Company.
NOT FDIC INSURED ¡ NO BANK GUARANTEE ¡ MAY LOSE VALUE
© 2011 Wells Fargo Funds Management, LLC. All rights reserved.
| | |
 | | 204804 09-11 SA308/SAR308 7-11 |

Wells Fargo Advantage
National Tax-Free Money Market Fund

Semi-Annual Report
July 31, 2011

Reduce clutter. Save trees.
Sign up for electronic delivery of prospectuses and shareholder reports at www.wellsfargo.com/advantagedelivery
Contents
The views expressed and any forward-looking statements are as of July 31, 2011, unless otherwise noted and are those of the Fund managers and/or Wells Fargo Funds Management, LLC. Discussions of individual securities, or the markets generally, or any Wells Fargo Advantage Fund are not intended as individual recommendations. Future events or results may vary significantly from those expressed in any forward-looking statements; the views expressed are subject to change at any time in response to changing circumstances in the market. Wells Fargo Funds Management, LLC, disclaims any obligation to publicly update or revise any views expressed or forward-looking statements.
NOT FDIC INSURED ¡ NO BANK GUARANTEE ¡ MAY LOSE VALUE

WELLS FARGO INVESTMENT HISTORY
| | |
| |
| 1932 | | Keystone creates one of the first mutual fund families. |
| |
| 1971 | | Wells Fargo & Company introduces one of the first institutional index funds. |
| |
| 1978 | | Wells Fargo applies Markowitz and Sharpe’s research on Modern Portfolio Theory to introduce one of the industry’s first Tactical Asset Allocation (TAA) models in institutional separately managed accounts. |
| |
| 1984 | | Wells Fargo Stagecoach Funds launches its first asset allocation fund. |
| |
| 1989 | | The Tactical Asset Allocation (TAA) Model is first applied to Wells Fargo’s asset allocation mutual funds. |
| |
| 1994 | | Wells Fargo introduces the LifePath Funds, one of the first suites of target date funds (now the Wells Fargo Advantage Dow Jones Target Date FundsSM ). |
| |
| 1996 | | Evergreen Investments and Keystone Funds merge. |
| |
| 1997 | | Wells Fargo launches Wells Fargo Advantage WealthBuilder PortfoliosSM, a fund-of-funds suite of products that includes the use of quantitative models to shift assets among investment styles. |
| |
| 1999 | | Norwest Advantage Funds and Stagecoach Funds are reorganized into Wells Fargo Funds after the merger of Norwest and Wells Fargo. |
| |
| 2002 | | Evergreen Retail and Evergreen Institutional companies form the umbrella asset management company, Evergreen Investments. |
| |
| 2005 | | The integration of Strong Funds with Wells Fargo Funds creates Wells Fargo Advantage Funds, resulting in one of the top 20 mutual fund companies in the United States. |
| |
| 2006 | | Wells Fargo Advantage Funds relaunches the target date product line as Wells Fargo Advantage Dow Jones Target Date Funds. |
| |
| 2010 | | The mergers and reorganizations of Evergreen and Wells Fargo Advantage mutual funds are completed, unifying the families under the brand of Wells Fargo Advantage Funds. |
Wells Fargo Advantage Funds®
Wells Fargo Advantage Funds skillfully guides institutions, financial advisors, and individuals through the investment terrain to help them reach their financial objectives. Everything we do on behalf of investors is backed by our unique combination of qualifications.
Strength
Our organization is built on the standards of integrity and service established by our parent company—Wells Fargo & Company—more than 150 years ago. And, because we’re part of a highly diversified financial enterprise, we offer the depth of resources to help investors succeed.
Expertise
Our multi-boutique model offers investors access to the independent thinking of premier investment managers that have been chosen for their time-tested strategies. While each team specializes in a specific investment strategy, collectively they provide investors a wide choice of distinct investment styles. Our dedication to investment excellence doesn’t end with our expertise in manager selection—risk management, analysis, and rigorous ongoing review seek to ensure each manager’s investment process remains consistent.
Partnership
Our collaborative approach is built around understanding the needs and goals of our clients. By adhering to core principles of sound judgment and steady guidance, we support you through every stage of the investment decision process.
Carefully consider the investment objectives, risks, charges, and expenses before investing. For a current prospectus for Wells Fargo Advantage Funds containing this and other information, visit wellsfargo.com/advantagefunds. Read it carefully before investing.
Wells Fargo Funds Management, LLC, a wholly owned subsidiary of Wells Fargo & Company, provides investment advisory and administrative services for Wells Fargo Advantage Funds®. Other affiliates of Wells Fargo & Company provide subadvisory and other services for the Funds. The Funds are distributed by Wells Fargo Funds Distributor, LLC, Member FINRA/SIPC, an affiliate of Wells Fargo & Company.
The “Dow Jones Target Date Indexes” are a product of Dow Jones Indexes, a licensed trademark of CME Group Index Services LLC (“CME”). “Dow Jones” and “Dow Jones Target Date Indexes” are service marks of Dow Jones Trademark Holdings, LLC, and have been licensed for use for certain purposes by CME and sublicensed for use by Global Index Advisors, Inc., and Wells Fargo Funds Management, LLC. The Dow Jones Target Date Indexes are based in part on the Barclays Capital Bond Indexes, which are published by Barclays Capital Inc. The Wells Fargo Advantage Dow Jones Target Date Funds, based on the Dow Jones Target Date Indexes, are not sponsored, endorsed, sold, or promoted by Dow Jones, CME or Barclays Capital or any of their respective affiliates, and neither Dow Jones, CME nor Barclays Capital nor any of their respective affiliates makes any representation regarding the advisability of investing in such product(s) and/or about the quality, accuracy, and/or completeness of the Dow Jones Target Date Indexes or the Barclays Capital Bond Indexes. IN NO EVENT SHALL DOW JONES, CME, BARCLAYS CAPITAL, OR ANY OF THEIR LICENSORS HAVE ANY LIABILITY IN CONNECTION WITH THE Wells Fargo Advantage Dow Jones Target Date Funds INCLUDING, WITHOUT LIMITATION, FOR ANY SPECIAL, PUNITIVE, IN DIRECT, OR CONSEQUENTIAL DAMAGES (INCLUDING LOST PROFITS), EVEN IF NOTIFIED OF THE POSSIBILITY OF SUCH DAMAGES.
NOT FDIC INSURED ¡ NO BANK GUARANTEE ¡ MAY LOSE VALUE
Not part of the semi-annual report.
Wells Fargo Advantage Funds offers more than 110 mutual funds across a wide range of asset classes, representing over $221 billion in assets under management, as of July 31, 2011.
| | | | |
| Equity Funds | | | | |
Asia Pacific Fund | | Global Opportunities Fund | | Premier Large Company Growth Fund |
C&B Large Cap Value Fund | | Growth Fund | | Small Cap Opportunities Fund |
C&B Mid Cap Value Fund | | Health Care Fund | | Small Cap Value Fund |
Capital Growth Fund | | Index Fund | | Small Company Growth Fund |
Common Stock Fund | | International Equity Fund | | Small Company Value Fund |
Disciplined U.S. Core Fund | | International Value Fund | | Small/Mid Cap Core Fund |
Discovery Fund† | | Intrinsic Small Cap Value Fund | | Small/Mid Cap Value Fund |
Diversified Equity Fund | | Intrinsic Value Fund | | Social Sustainability Fund† |
Diversified International Fund | | Intrinsic World Equity Fund | | Special Mid Cap Value Fund |
Diversified Small Cap Fund | | Large Cap Core Fund | | Special Small Cap Value Fund |
Emerging Growth Fund | | Large Cap Growth Fund | | Specialized Technology Fund |
Emerging Markets Equity Fund | | Large Company Value Fund | | Strategic Large Cap Growth Fund |
Endeavor Select Fund† | | Omega Growth Fund | | Traditional Small Cap Growth Fund |
Enterprise Fund† | | Opportunity Fund† | | Utility and Telecommunications Fund |
Equity Value Fund | | Precious Metals Fund | | |
| Bond Funds | | | | |
Adjustable Rate Government Fund | | Inflation-Protected Bond Fund | | Short-Term Bond Fund |
California Limited-Term Tax-Free Fund | | Intermediate Tax/AMT-Free Fund | | Short-Term High Yield Bond Fund |
California Tax-Free Fund | | International Bond Fund | | Short-Term Municipal Bond Fund |
Colorado Tax-Free Fund | | Minnesota Tax-Free Fund | | Strategic Municipal Bond Fund |
Government Securities Fund | | Municipal Bond Fund | | Total Return Bond Fund |
High Income Fund | | North Carolina Tax-Free Fund | | Ultra Short-Term Income Fund |
High Yield Bond Fund | | Pennsylvania Tax-Free Fund | | Ultra Short-Term Municipal Income Fund |
Income Plus Fund | | Short Duration Government Bond Fund | | Wisconsin Tax-Free Fund |
| Asset Allocation Funds | | | | |
Asset Allocation Fund | | WealthBuilder Equity Portfolio† | | Target 2020 Fund† |
Conservative Allocation Fund | | WealthBuilder Growth Allocation Portfolio† | | Target 2025 Fund† |
Diversified Capital Builder Fund | | WealthBuilder Growth Balanced Portfolio† | | Target 2030 Fund† |
Diversified Income Builder Fund | | WealthBuilder Moderate Balanced Portfolio† | | Target 2035 Fund† |
Growth Balanced Fund | | WealthBuilder Tactical Equity Portfolio† | | Target 2040 Fund† |
Index Asset Allocation Fund | | Target Today Fund† | | Target 2045 Fund† |
Moderate Balanced Fund | | Target 2010 Fund† | | Target 2050 Fund† |
WealthBuilder Conservative Allocation Portfolio† | | Target 2015 Fund† | | Target 2055 Fund† |
| Money Market Funds | | | | |
100% Treasury Money Market Fund | | Minnesota Money Market Fund | | New Jersey Municipal Money Market Fund |
California Municipal Money Market Fund | | Money Market Fund | | New York Municipal Money Market Fund |
Cash Investment Money Market Fund | | Municipal Cash Management Money Market Fund | | Pennsylvania Municipal Money Market Fund |
Government Money Market Fund | | Municipal Money Market Fund | | Prime Investment Money Market Fund |
Heritage Money Market Fund† | | National Tax-Free Money Market Fund | | Treasury Plus Money Market Fund |
| Variable Trust Funds1 | | | | |
VT Discovery Fund† | | VT Intrinsic Value Fund | | VT Small Cap Growth Fund |
VT Index Asset Allocation Fund | | VT Omega Growth Fund | | VT Small Cap Value Fund |
VT International Equity Fund | | VT Opportunity Fund† | | VT Total Return Bond Fund |
An investment in a money market fund is not insured or guaranteed by the Federal Deposit Insurance Corporation or any other government agency. Although the Wells Fargo Advantage Money Market Funds seek to preserve the value of your investment at $1.00 per share, it is possible to lose money by investing in a money market fund.
| 1. | The Variable Trust Funds are generally available only through insurance company variable contracts. |
| † | In this report, the Wells Fargo Advantage Discovery FundSM, Wells Fargo Advantage Endeavor Select FundSM, Wells Fargo Advantage Enterprise FundSM, Wells Fargo Advantage Opportunity FundSM, Wells Fargo Advantage Social Sustainability FundSM, Wells Fargo Advantage WealthBuilder Conservative Allocation PortfolioSM, Wells Fargo Advantage WealthBuilder Equity PortfolioSM, Wells Fargo Advantage WealthBuilder Growth Allocation PortfolioSM, Wells Fargo Advantage WealthBuilder Growth Balanced PortfolioSM, Wells Fargo Advantage WealthBuilder Moderate Balanced PortfolioSM, Wells Fargo Advantage WealthBuilder Tactical Equity PortfolioSM, Wells Fargo Advantage Dow Jones Target Today FundSM, Wells Fargo Advantage Dow Jones Target 2010 FundSM, Wells Fargo Advantage Dow Jones Target 2015 FundSM, Wells Fargo Advantage Dow Jones Target 2020 FundSM, Wells Fargo Advantage Dow Jones Target 2025 FundSM, Wells Fargo Advantage Dow Jones Target 2030 FundSM, Wells Fargo Advantage Dow Jones Target 2035 FundSM, Wells Fargo Advantage Dow Jones Target 2040 FundSM, Wells Fargo Advantage Dow Jones Target 2045 FundSM, Wells Fargo Advantage Dow Jones Target 2050 FundSM, Wells Fargo Advantage Dow Jones Target 2055 FundSM, Wells Fargo Advantage Heritage Money Market FundSM, Wells Fargo Advantage VT Discovery FundSM, and Wells Fargo Advantage VT Opportunity FundSM are referred to as the Discovery Fund, Endeavor Select Fund, Enterprise Fund, Opportunity Fund, Social Sustainability Fund, WealthBuilder Conservative Allocation Portfolio, WealthBuilder Equity Portfolio, WealthBuilder Growth Allocation Portfolio, WealthBuilder Growth Balanced Portfolio, WealthBuilder Moderate Balanced Portfolio, WealthBuilder Tactical Equity Portfolio, Target Today Fund, Target 2010 Fund, Target 2015 Fund, Target 2020 Fund, Target 2025 Fund, Target 2030 Fund, Target 2035 Fund, Target 2040 Fund, Target 2045 Fund, Target 2050 Fund, Target 2055 Fund, Heritage Money Market Fund, VT Discovery Fund, and VT Opportunity Fund, respectively. |
Not part of the semi-annual report.
| | | | |
| 2 | | Wells Fargo Advantage National Tax-Free Money Market Fund | | Letter to Shareholders |

Karla M. Rabusch,
President
Wells Fargo Advantage Funds
While the FOMC explained that it “expects the pace of recovery to pick up over coming quarters,” it indicated that the federal funds rate will remain at an exceptionally low level for as long as necessary to ensure a sustainable recovery and expansion.
Dear Valued Shareholder,
We’re pleased to offer you this semi-annual report for the Wells Fargo Advantage National Tax-Free Money Market Fund for the six-month period that ended July 31, 2011. Upon reviewing the report, you may notice a few changes from past reports, the most significant of which is the change from a multi-fund report to a single-fund report. We believe this change will give you more convenient access to your fund data.
The period began modestly as improving economic optimism generally shifted investors toward equities and riskier assets and away from U.S. Treasuries and lower-yielding fixed-income securities. Returns from fixed income were modest in the opening months of 2011 but were generally still positive as U.S. Treasury yields incrementally climbed higher. But after the slow start, bond prices once again strongly improved, sparked by a sharp decline in U.S. Treasury prices in April that carried into May. Late in the period, lower-rated bonds declined in price more than the higher credit-quality tiers but not enough to outweigh the stronger performance from lower-rated securities during the period. Lower-quality and longer-maturity fixed-income securities generally outperformed higher-quality and shorter-maturity securities over the full period.
The activity within the broader bond market also resonated with money market participants. As the economic and credit environment reverberated from the ongoing sovereign debt concerns and softening economic data, many participants continued to balance a need for stability and desire for higher yields. The result has been good demand for domestic commercial paper and certificate of deposits. Also, in spite of all the discussion about sovereign debt, many money market participants continue to maintain some exposures to foreign banks based on the quality of their fundamentals. By focusing more on the fundamentals and taking a more selective approach to the short-term security market helped the markets avoid the severe yield volatility or significant flight-to-quality experienced during the spring of 2010, when the Greek sovereign debt crisis first emerged.
The global economic “recovery” hit a snag, but the end of 2011 could regain momentum.
The U.S. economic recovery that began in mid-2009 and gained further momentum throughout 2010, particularly during the fourth quarter, has failed to maintain that level of growth through the first seven months of 2011. For example, gross domestic product (GDP), the broadest measure of economic activity, grew at an annualized rate of 3.1% in the fourth quarter of 2010, only to slow dramatically during the first quarter of 2011. The latest revision to first-quarter GDP data during the period indicated that the economy grew at an annualized rate of 0.4% during the first quarter of 2011. While still positive, it’s a much slower pace of growth than experienced in the second half of 2010 and notably lower than consensus forecasts. Nevertheless, the advance estimate of second-quarter 2011 GDP, which was released on July 29, 2011, was 1.3%, suggesting that the U.S. economy continues to expand, though at a slow and uneven pace.
Jobs and housing remained troublesome.
The July 2011 unemployment rate in the U.S. was reported at 9.1%, down from 9.5% a year earlier but still notably higher than historical averages. Unfortunately,
| | | | | | |
| Letter to Shareholders | | Wells Fargo Advantage National Tax-Free Money Market Fund | | | 3 | |
the drop may be more attributable to a decline in the labor force than to a meaningful uptick in hiring. The level of job creation in 2011 has been trending below historical averages, suggesting that the improving economy has yet to translate into widespread hiring. Meanwhile, the beleaguered housing market was an ongoing source of concern, despite some tentative late-year signs of stabilization. That said, persistent weakness in the labor and housing markets bears close watching in the months ahead.
Other economic data in the U.S. has been more encouraging, reflecting greater confidence in the sustainability of the expansion on the part of both consumers and businesses. Retail sales came in strong at certain points during the period and industrial production and new orders have picked up. Although still reluctant to hire, businesses have gradually increased spending in other areas, such as equipment and information technology. Core inflation, which excludes volatile food and energy prices, remained benign.
The Federal Reserve believes the economic recovery will accelerate in future quarters.
With inflation subdued, the Federal Open Market Committee (FOMC) held its target range for the federal funds rate—a proxy for short-term interest rates—steady at 0.00% to 0.25%. On June 22, 2011, in its final statement of the six-month period, the Fed reiterated that the economic recovery “is proceeding at a moderate pace,” but that “recent labor market indicators have been weaker than anticipated.” It described the recent increase in inflation as temporary, suggesting that inflation pressures will ease going forward. While the FOMC explained that it “expects the pace of recovery to pick up over coming quarters,” it indicated that the federal funds rate will remain at an exceptionally low level for as long as necessary to ensure a sustainable recovery and expansion.
As recent headwinds subside, it is reasonable to expect markets to regain focus.
Now that it appears the debt ceiling has been increased and a U.S. default will be averted, money market participants and the broader bond market can get back to more fundamental and lasting concerns-chiefly, the economy. After avoiding short-term Treasuries in late July 2011, ahead of pending U.S. debt ceiling deadline, money market participants have returned to the U.S. short-term markets1. Economic indicators released in the second half of 2011 might not be as soft as those reported during the first half of the year. While that would not mean that the economy is robust, it might remind the markets that the first half of the slowdown was transitory. Most indicators still point toward real GDP growth in the 2% to 3% range in the second half of 2011. While that is not enough to produce big employment gains, it might be sufficient to cause Treasury yields to retrace some of the late-July declines.
Don’t let short-term uncertainty derail long-term investment goals.
While periods of uncertainty can present challenges, experience has taught us that maintaining a long-term investment strategy based on individual goals and risk tolerance can be an effective way to plan for the future. As a whole, Wells Fargo Advantage Funds represents investments across a broad range of asset
| 1. | Comments expressed that do not fall within the reporting period are as of August 2, 2011. |
Economic indicators released in the second half of 2011 might not be as soft as those reported during the first half of the year. While that would not mean that the economy is robust, it might remind the markets that the first half of the slowdown was transitory.
| | | | |
| 4 | | Wells Fargo Advantage National Tax-Free Money Market Fund | | Letter to Shareholders |
classes and investment styles with more than 110 mutual funds, giving you an opportunity to create a diversified investment portfolio. While diversification may not prevent losses in a downturn, it may help to reduce them and provide you with one way of managing risk.
In our opinion, diligent and earnest assessment of the fundamental characteristics of money market eligible securities will be a key differentiating factor between which investment strategies meet client expectations and which do not. At Wells Fargo Advantage Funds, we intend to continue the emphasis of principal preservation and high liquidity across our lineup of Wells Fargo Advantage Money Market Funds. In changing markets, we believe it is particularly important to have diligent investment analysts in charge of investor assets.
Thank you for choosing Wells Fargo Advantage Funds. We appreciate your confidence in us and are committed to helping you meet your financial needs. If you have any questions about your investments, please contact your investment professional, call us at 1-800-222-8222, or visit www.wellsfargo.com/advantagefunds.
Sincerely,

Karla M. Rabusch
President
Wells Fargo Advantage Funds
| | | | | | |
| Performance Highlights (Unaudited) | | Wells Fargo Advantage National Tax-Free Money Market Fund | | | 5 | |
INVESTMENT OBJECTIVE
The Fund seeks current income exempt from federal income tax, while preserving capital and liquidity.
ADVISER
Wells Fargo Funds Management, LLC
SUB-ADVISER
Wells Capital Management Incorporated
PORTFOLIO MANAGERS
David D. Sylvester
James Randazzo
FUND INCEPTION
January 7, 1988
|
SECTOR DISTRIBUTION1 (AS OF JULY 31, 2011) |
|
 |
|
EFFECTIVE MATURITY DISTRIBUTION1 (AS OF JULY 31, 2011) |
|
 |
| | |
WEIGHTED AVERAGE MATURITY2
(AS OF JULY 31, 2011) |
11 Days |
| | |
WEIGHTED AVERAGE FINAL MATURITY3
(AS OF JULY 31, 2011) |
11 Days |
| 1. | Sector distribution and effective maturity distribution are subject to change and are calculated based on the total investments of the Fund. Effective maturity distribution is based on the weighted average maturity of each security. |
| 2. | Weighted Average Maturity (WAM): WAM calculates an average time to maturity of all of the securities held in the portfolio, weighted by each security’s percentage of net assets. The calculation takes into account the final maturity of a fixed-income security and the interest rate reset date for floating-rate securities held in the portfolio. This is a way to measure a fund’s sensitivity to potential interest rate changes. |
| 3. | Weighted Average Final Maturity (WAFM): WAFM calculates a fund’s average time to maturity for all of the securities held in the portfolio, weighted to their percentage of assets in the Fund. In contrast to WAM, the WAFM calculation takes into account the final maturity date for each security held in the portfolio. This is a way to measure a fund’s potential sensitivity to credit spread changes. |
| | | | |
| 6 | | Wells Fargo Advantage National Tax-Free Money Market Fund | | Performance Highlights (Unaudited) |
AVERAGE ANNUAL TOTAL RETURN4 (%) (AS OF JULY 31, 2011)
| | | | | | | | | | | | | | | | | | | | | | | | | | | | |
| | | | | | | | | Expense Ratios5 | |
| | | Inception Date | | | 6 Months* | | | 1 Year | | | 5 Year | | | 10 Year | | | Gross | | | Net6 | |
Class A (NWMXX) | | | 07/28/2003 | | | | 0.00 | | | | 0.01 | | | | 1.20 | | | | 1.21 | | | | 0.64% | | | | 0.64% | |
Administrator Class (WNTXX) | | | 04/11/2005 | | | | 0.01 | | | | 0.02 | | | | 1.41 | | | | 1.44 | | | | 0.37% | | | | 0.30% | |
Institutional Class (WFNXX) | | | 11/08/1999 | | | | 0.03 | | | | 0.09 | | | | 1.50 | | | | 1.57 | | | | 0.25% | | | | 0.20% | |
Service Class (MMIXX) | | | 08/03/1993 | | | | 0.00 | | | | 0.01 | | | | 1.31 | | | | 1.37 | | | | 0.54% | | | | 0.45% | |
Sweep Class | | | 06/30/2010 | | | | 0.00 | | | | 0.01 | | | | 1.20 | | | | 1.25 | | | | 0.99% | | | | 0.99% | |
| * | Returns for periods of less than one year are not annualized. |
| | | | | | | | | | | | | | | | | | | | |
FUND YIELD SUMMARY6
(AS OF JULY 31, 2011) | | Class A | | | Administrator
Class | | | Institutional
Class | | | Service
Class | | | Sweep
Class | |
7-Day Current Yield | | | 0.01% | | | | 0.01% | | | | 0.01% | | | | 0.01% | | | | 0.01% | |
7-Day Compound Yield | | | 0.01% | | | | 0.01% | | | | 0.01% | | | | 0.01% | | | | 0.01% | |
30-Day Simple Yield | | | 0.01% | | | | 0.01% | | | | 0.01% | | | | 0.01% | | | | 0.01% | |
30-Day Compound Yield | | | 0.01% | | | | 0.01% | | | | 0.01% | | | | 0.01% | | | | 0.01% | |
Figures quoted represent past performance, which is no guarantee of future results and do not reflect the deduction of taxes that a shareholder may pay on fund distributions or the redemption of fund shares. Investment returns will fluctuate. The Fund’s yield figures more closely reflect the current earnings of the Fund than the total return figures. Current performance may be lower or higher than the performance data quoted. Current month-end performance is available at the Fund’s Web site – www.wellsfargo.com/advantagefunds.
Each class is sold without a front-end sales charge or contingent deferred sales charge. Other fees and expenses apply to an investment in the Fund and are described in the Fund’s current prospectus.
An investment in a money market fund is not insured or guaranteed by the Federal Deposit Insurance Corporation or any other government agency. Although the Fund seeks to preserve the value of your investment at $1.00 per share, it is possible to lose money by investing in a money market fund. A portion of the Fund’s income may be subject to federal, state and/or local income taxes or the alternative minimum tax (AMT).
| 4. | Historical performance shown for the Administrator Class shares prior to their inception reflects the performance of the Service Class shares, and includes the higher expenses applicable to the Service Class shares. If these expenses had not been included, returns would be higher. Historical performance shown for the Sweep Class shares prior to their inception reflects the performance of the Class A shares, and has not been adjusted to include the higher expenses applicable to the Sweep Class shares. If these expenses had been adjusted, returns would be lower. Historical performance shown for Class A shares prior to their inception reflects the performance of the Service Class shares, and is adjusted to reflect the higher expenses applicable to Class A shares. |
| 5. | Reflects the expense ratios as stated in the most recent prospectuses. |
| 6. | The Adviser has committed through May 31, 2012 to waive fees and/or reimburse expenses to the extent necessary to cap the Fund’s Total Annual Fund Operating Expenses After Fee Waiver, excluding certain expenses, at 0.65% for Class A, 0.30% for Administrator Class, 0.20% for Institutional Class, 0.45% for Service Class and 1.05% for Sweep Class. Without this cap, the Fund’s returns would have been lower. Without waived fees and/or reimbursed expenses, the Fund’s 7-day current yield would have been (0.52)%, (0.25)%, (0.13)%, (0.42)% and (0.87)% for Class A, Administrator Class, Institutional Class, Service Class and Sweep Class, respectively. |
| | | | | | |
| Fund Expenses | | Wells Fargo Advantage National Tax-Free Money Market Fund | | | 7 | |
As a shareholder of the Fund, you incur two types of costs: (1) transaction costs, including contingent deferred sales charges (if any) and (2) ongoing costs, including management fees; distribution (12b-1) and/or shareholder service fees; and other Fund expenses. This example is intended to help you understand your ongoing costs (in dollars) of investing in the Fund and to compare these costs with the ongoing costs of investing in other mutual funds.
The example is based on an investment of $1,000 invested at the beginning of the six-month period and held for the entire period from February 1, 2011 to July 31, 2011.
Actual Expenses
The “Actual” line of the table below provides information about actual account values and actual expenses. You may use the information in this line, together with the amount you invested, to estimate the expenses that you paid over the period. Simply divide your account value by $1,000 (for example, an $8,600 account value divided by $1,000 = 8.6), then multiply the result by the number in the “Actual” line under the heading entitled “Expenses Paid During Period” for your applicable class of shares to estimate the expenses you paid on your account during this period.
Hypothetical Example for Comparison Purposes
The “Hypothetical” line of the table below provides information about hypothetical account values and hypothetical expenses based on the Fund’s actual expense ratio and an assumed rate of return of 5% per year before expenses, which is not the Fund’s actual return. The hypothetical account values and expenses may not be used to estimate the actual ending account balance or expenses you paid for the period. You may use this information to compare the ongoing costs of investing in the Fund and other funds. To do so, compare this 5% hypothetical example with the 5% hypothetical examples that appear in the shareholder reports of the other funds.
Please note that the expenses shown in the table are meant to highlight your ongoing costs only and do not reflect any transactional costs, such as any contingent deferred sales charges. Therefore, the “Hypothetical” line of the table is useful in comparing ongoing costs only, and will not help you determine the relative total costs of owning different funds. In addition, if these transactional costs were included, your costs would have been higher.
| | | | | | | | | | | | | | | | |
| | | Beginning
Account Value
02-01-2011 | | | Ending
Account Value
07-31-2011 | | | Expenses
Paid During
the Period¹ | | | Net Annual
Expense Ratio | |
Class A | | | | | | | | | | | | | | | | |
Actual | | $ | 1,000.00 | | | $ | 1,000.05 | | | $ | 1.09 | | | | 0.22 | % |
Hypothetical (5% return before expenses) | | $ | 1,000.00 | | | $ | 1,023.70 | | | $ | 1.10 | | | | 0.22 | % |
Administrator Class | | | | | | | | | | | | | | | | |
Actual | | $ | 1,000.00 | | | $ | 1,000.05 | | | $ | 1.09 | | | | 0.22 | % |
Hypothetical (5% return before expenses) | | $ | 1,000.00 | | | $ | 1,023.70 | | | $ | 1.10 | | | | 0.22 | % |
Institutional Class | | | | | | | | | | | | | | | | |
Actual | | $ | 1,000.00 | | | $ | 1,000.27 | | | $ | 0.84 | | | | 0.17 | % |
Hypothetical (5% return before expenses) | | $ | 1,000.00 | | | $ | 1,023.95 | | | $ | 0.85 | | | | 0.17 | % |
Service Class | | | | | | | | | | | | | | | | |
Actual | | $ | 1,000.00 | | | $ | 1,000.05 | | | $ | 1.09 | | | | 0.22 | % |
Hypothetical (5% return before expenses) | | $ | 1,000.00 | | | $ | 1,023.70 | | | $ | 1.10 | | | | 0.22 | % |
Sweep Class | | | | | | | | | | | | | | | | |
Actual | | $ | 1,000.00 | | | $ | 1,000.05 | | | $ | 0.64 | | | | 0.13 | % |
Hypothetical (5% return before expenses) | | $ | 1,000.00 | | | $ | 1,024.15 | | | $ | 0.65 | | | | 0.13 | % |
| 1. | Expenses paid is equal to the annualized expense ratio of each class multiplied by the average account value over the period, multiplied by the number of days in the most recent fiscal half-year divided by the number of days in the fiscal year (to reflect the one-half year period). |
| | | | |
| 8 | | Wells Fargo Advantage National Tax-Free Money Market Fund | | Portfolio of Investments—July 31, 2011 (Unaudited) |
| | | | | | | | | | | | | | | | |
| Security Name | | Interest Rate | | | Maturity Date | | | Principal | | | Value | |
| | | | | | | | | | | | | | | | |
| | | | |
Municipal Bonds and Notes: 91.80% | | | | | | | | | | | | | | | | |
| | | | |
Alabama: 3.69% | | | | | | | | | | | | | | | | |
| | | | |
| Variable Rate Demand Notes§: 3.69% | | | | | | | | | | | | | | | | |
Homewood AL Educational Building Authority (Education Revenue, Branch Banking & Trust LOC) | | | 0.08 | % | | | 12/01/2043 | | | $ | 10,000,000 | | | $ | 10,000,000 | |
Lower Alabama Gas District Supply Revenue Series A (Utilities Revenue, Societe Generale LOC) | | | 0.13 | | | | 11/01/2027 | | | | 55,000,000 | | | | 55,000,000 | |
Mobile AL Downtown RDA Gulf Opportunity Zone Austal USA LLC Project Series A (IDR, National Australia Bank LOC) | | | 0.07 | | | | 05/01/2041 | | | | 12,200,000 | | | | 12,200,000 | |
Mobile AL Downtown RDA Gulf Opportunity Zone Austal USA LLC Project Series B (IDR) | | | 0.07 | | | | 05/01/2041 | | | | 12,000,000 | | | | 12,000,000 | |
Mobile AL Industrial Development Board Alabama Power Company Project Series C (Utilities Revenue) | | | 0.05 | | | | 08/01/2017 | | | | 12,000,000 | | | | 12,000,000 | |
Mobile AL Infirmary Health System Special Care Facilities Series A (Hospital Revenue, Bank of Nova Scotia LOC) | | | 0.07 | | | | 02/01/2040 | | | | 6,300,000 | | | | 6,300,000 | |
Mobile County AL IDA Series B (Energy Revenue, Svenska HandelsBanken LOC) | | | 0.07 | | | | 07/01/2040 | | | | 22,500,000 | | | | 22,500,000 | |
Southeast Alabama Gas District Alabama Supply Project Series 2007-A (Utilities Revenue) | | | 0.24 | | | | 08/01/2027 | | | | 30,463,000 | | | | 30,463,000 | |
Tuscaloosa County AL IDA Tax Exempt Gulf Opportunity Zone Hunt Refining Project Series 2008-C (Energy Revenue, JPMorgan Chase Bank LOC) | | | 0.08 | | | | 12/01/2027 | | | | 10,000,000 | | | | 10,000,000 | |
| | | | |
| | | | | | | | | | | | | | | 170,463,000 | |
| | | | | | | | | | | | | | | | |
| | | | |
Alaska: 0.84% | | | | | | | | | | | | | | | | |
| | | | |
| Variable Rate Demand Notes§: 0.84% | | | | | | | | | | | | | | | | |
Alaska Housing Finance Corporation Series 2006-0022 (Housing Revenue, U.S. Bank NA LOC) | | | 0.07 | | | | 12/01/2030 | | | | 14,825,000 | | | | 14,825,000 | |
Alaska State Housing Finance Corporation PUTTER Series DB-507 (Housing Revenue, FGIC GO of Corporation Insured) | | | 0.08 | | | | 12/01/2034 | | | | 8,455,000 | | | | 8,455,000 | |
Alaska State Housing Finance Corporation PUTTER Series DB-532 (Housing Revenue, NATL-RE GO of Corporation Insured) | | | 0.08 | | | | 12/01/2041 | | | | 15,625,000 | | | | 15,625,000 | |
| | | | |
| | | | | | | | | | | | | | | 38,905,000 | |
| | | | | | | | | | | | | | | | |
| | | | |
Arizona: 1.09% | | | | | | | | | | | | | | | | |
| | | | |
| Variable Rate Demand Notes§: 1.09% | | | | | | | | | | | | | | | | |
Maricopa County AZ IDA Gran Victoria Housing LLC Project A (Housing Revenue, FNMA Insured) | | | 0.08 | | | | 04/15/2030 | | | | 10,400,000 | | | | 10,400,000 | |
Mesa AZ Utility System PUTTER (Utilities Revenue, State Street Bank LOC) | | | 0.08 | | | | 07/01/2024 | | | | 35,055,000 | | | | 35,055,000 | |
Pima County AZ IDA Charter School Delaware Military Academy Project Series 2008 (Education Revenue, PNC Bank NA LOC) | | | 0.14 | | | | 09/01/2038 | | | | 4,900,000 | | | | 4,900,000 | |
| | | | |
| | | | | | | | | | | | | | | 50,355,000 | |
| | | | | | | | | | | | | | | | |
| | | | |
California: 4.17% | | | | | | | | | | | | | | | | |
| | | | |
| Other Municipal Debt: 0.29% | | | | | | | | | | | | | | | | |
San Diego County CA School District TRAN Series B-1 (Tax Revenue, GO of Participants Insured) | | | 2.00 | | | | 01/31/2012 | | | | 3,500,000 | | | | 3,526,637 | |
San Joaquin County CA COP Series A (Miscellaneous Revenue) | | | 0.09 | | | | 08/09/2011 | | | | 10,000,000 | | | | 10,000,000 | |
| | | | |
| | | | | | | | | | | | | | | 13,526,637 | |
| | | | | | | | | | | | | | | | |
| | | | | | |
| Portfolio of Investments—July 31, 2011 (Unaudited) | | Wells Fargo Advantage National Tax-Free Money Market Fund | | | 9 | |
| | | | | | | | | | | | | | | | |
| Security Name | | Interest Rate | | | Maturity Date | | | Principal | | | Value | |
| | | | | | | | | | | | | | | | |
| | | | |
| Variable Rate Demand Notes§: 3.88% | | | | | | | | | | | | | | | | |
California Infrastructure & Economic Development Bank Pacific Gas & Electric Series C (Electric Utilities, Sumitomo Mitsui Banking LOC) | | | 0.23 | % | | | 12/01/2016 | | | $ | 8,400,000 | | | $ | 8,400,000 | |
California Infrastructure & Economic Development Bank ROC RR II R-11527 (Transportation Revenue, AMBAC Insured) | | | 0.11 | | | | 07/01/2030 | | | | 3,145,000 | | | | 3,145,000 | |
California PCFA Hilmar Cheese Company Project Series 20 (Miscellaneous Revenue, Bank of the West LOC) | | | 0.07 | | | | 11/01/2034 | | | | 9,695,000 | | | | 9,695,000 | |
California State Series A3 (GO-State, Bank of Montreal LOC) | | | 0.21 | | | | 05/01/2033 | | | | 1,550,000 | | | | 1,550,000 | |
California Statewide CDA Gas Supply (Energy Revenue, Royal Bank of Canada SPA) | | | 0.07 | | | | 11/01/2040 | | | | 100,000 | | | | 100,000 | |
Campton CA USD 2002 Election Series D PUTTER DB-362 (GO-Local, AMBAC Insured) | | | 0.08 | | | | 06/01/2022 | | | | 18,020,000 | | | | 18,020,000 | |
Deutsche Bank Spears Lifers Trust Series 445 (GO-Local, FSA Insured) | | | 0.08 | | | | 08/01/2032 | | | | 11,570,000 | | | | 11,570,000 | |
Deutsche Bank Spears Lifers Trust Series DB-477 (GO-Local, FSA FGIC AMBAC Insured) | | | 0.08 | | | | 12/01/2024 | | | | 10,000,000 | | | | 10,000,000 | |
Deutsche Bank Spears Lifers Trust Series DBE-247 (Tax Revenue, FGIC Insured) | | | 0.08 | | | | 12/01/2030 | | | | 26,355,000 | | | | 26,355,000 | |
Golden State CA Tobacco Securitization Corporation Tobacco Settlement ROC RR II R-11442 (Tobacco Revenue, AGC-ICC Insured) | | | 0.28 | | | | 06/01/2035 | | | | 3,055,000 | | | | 3,055,000 | |
JP Morgan Chase PUTTER/DRIVER Trust Series 3931 (Tax Revenue) | | | 0.21 | | | | 08/12/2012 | | | | 6,250,000 | | | | 6,250,000 | |
JPMorgan Chase PUTTER Series 3934 (Miscellaneous Revenue)†† | | | 0.20 | | | | 08/07/2012 | | | | 15,000,000 | | | | 15,000,000 | |
Kings County CA Housing Authority Edgewater Apartments Series A (Housing Revenue, FNMA Insured) | | | 0.08 | | | | 02/15/2031 | | | | 7,310,000 | | | | 7,310,000 | |
Metropolitan Water District Southern California Series A-1 (Water & Sewer Revenue) | | | 0.10 | | | | 07/01/2036 | | | | 6,500,000 | | | | 6,500,000 | |
Orange County CA Apartment Development Revenue Series D Harbor Point Project (Housing Revenue, FHLMC Insured) | | | 0.16 | | | | 12/01/2022 | | | | 4,000,000 | | | | 4,000,000 | |
Sacramento County CA River Pointe Housing Authority Apartments Series B (Housing Revenue, FNMA LOC, FNMA Insured) | | | 0.10 | | | | 08/15/2027 | | | | 10,000,000 | | | | 10,000,000 | |
San Francisco CA City & County RDA Fillmore Center Series B1 (Housing Revenue, FHLMC Insured) | | | 0.10 | | | | 12/01/2017 | | | | 8,600,000 | | | | 8,600,000 | |
Sweetwater CA Union High School District ROC RR II-11484 (GO-Local, FSA Insured) | | | 0.20 | | | | 02/01/2013 | | | | 1,880,000 | | | | 1,880,000 | |
Vacaville CA MFHR Quail Run Project Series A (Housing Revenue, FNMA Insured) | | | 0.09 | | | | 07/15/2018 | | | | 7,300,000 | | | | 7,300,000 | |
Victorville CA Joint Powers Finance Authority Project A (Utilities Revenue, BNP Paribas LOC) | | | 1.35 | | | | 05/01/2040 | | | | 20,490,000 | | | | 20,490,000 | |
| | | | |
| | | | | | | | | | | | | | | 179,220,000 | |
| | | | | | | | | | | | | | | | |
| | | | |
Colorado: 1.43% | | | | | | | | | | | | | | | | |
| | | | |
| Variable Rate Demand Notes§: 1.43% | | | | | | | | | | | | | | | | |
Aurora CO Centretech Metropolitan District Remarketing Series A (GO-Local, U.S. Bank NA LOC) | | | 0.13 | | | | 12/01/2028 | | | | 2,995,000 | | | | 2,995,000 | |
Aurora CO Centretech Metropolitan District Remarketing Series B (GO-Local, U.S. Bank NA LOC) | | | 0.13 | | | | 12/01/2017 | | | | 2,765,000 | | | | 2,765,000 | |
Colorado ECFA National Jewish Program F-2 (Miscellaneous Revenue, Northern Trust Company LOC) | | | 0.20 | | | | 07/01/2041 | | | | 2,080,000 | | | | 2,080,000 | |
Colorado Health Facilities Authority Crossroads Maranatha Projects (Health Revenue, U.S. Bank NA LOC) | | | 0.06 | | | | 12/01/2043 | | | | 5,800,000 | | | | 5,800,000 | |
Commerce City CO Northern Infrastructure General Improvement District (GO-Local, U.S. Bank NA LOC) | | | 0.13 | | | | 12/01/2028 | | | | 5,000,000 | | | | 5,000,000 | |
Commerce City CO Northern Infrastructure General Improvement District (GO-Local, U.S. Bank NA LOC) | | | 0.13 | | | | 12/01/2038 | | | | 8,625,000 | | | | 8,625,000 | |
Cornerstone CO Metropolitan District #2 (Tax Revenue, Bank of America NA LOC) | | | 0.14 | | | | 12/01/2046 | | | | 6,090,000 | | | | 6,090,000 | |
| | | | |
| 10 | | Wells Fargo Advantage National Tax-Free Money Market Fund | | Portfolio of Investments—July 31, 2011 (Unaudited) |
| | | | | | | | | | | | | | | | |
| Security Name | | Interest Rate | | | Maturity Date | | | Principal | | | Value | |
| | | | | | | | | | | | | | | | |
| | | | |
| Variable Rate Demand Notes§ (continued) | | | | | | | | | | | | | | | | |
Denver CO City & County Cottonwood Creek Series A (Housing Revenue, FHLMC Insured) | | | 0.08 | % | | | 04/15/2014 | | | $ | 6,850,000 | | | $ | 6,850,000 | |
Meridian Ranch CO Metropolitan District GO Series 2009 (GO-Local, U.S. Bank NA LOC) | | | 0.13 | | | | 12/01/2038 | | | | 4,270,000 | | | | 4,270,000 | |
Mountain Village CO Housing Authority Facilities Remarketing Project (Housing Revenue, U.S. Bank NA LOC) | | | 0.13 | | | | 11/01/2040 | | | | 6,440,000 | | | | 6,440,000 | |
South Glenn CO Metropolitan District (Tax Revenue, BNP Paribas LOC) | | | 0.14 | | | | 12/01/2030 | | | | 11,010,000 | | | | 11,010,000 | |
Southeast CO Public Improvement Metropolitan District (GO-Local, U.S. Bank NA LOC) | | | 0.13 | | | | 11/15/2034 | | | | 4,030,000 | | | | 4,030,000 | |
| | | | |
| | | | | | | | | | | | | | | 65,955,000 | |
| | | | | | | | | | | | | | | | |
| | | | |
Delaware: 0.44% | | | | | | | | | | | | | | | | |
| | | | |
| Variable Rate Demand Notes§: 0.44% | | | | | | | | | | | | | | | | |
Delaware State EDA YMCA Delaware Projects (Miscellaneous Revenue, PNC Bank NA LOC) | | | 0.14 | | | | 05/01/2036 | | | | 3,900,000 | | | | 3,900,000 | |
Delaware State Health Facilities Authority Series B (Hospital Revenue, PNC Bank NA LOC) | | | 0.06 | | | | 07/01/2039 | | | | 9,730,000 | | | | 9,730,000 | |
University of Delaware (Education Revenue) | | | 0.26 | | | | 11/01/2035 | | | | 6,550,000 | | | | 6,550,000 | |
| | | | |
| | | | | | | | | | | | | | | 20,180,000 | |
| | | | | | | | | | | | | | | | |
| | | | |
District of Columbia: 0.65% | | | | | | | | | | | | | | | | |
| | | | |
| Other Municipal Debt: 0.54% | | | | | | | | | | | | | | | | |
District of Columbia TRAN (GO-State) | | | 2.00 | | | | 09/30/2011 | | | | 25,000,000 | | | | 25,068,273 | |
| | | | | | | | | | | | | | | | |
| | | | |
| Variable Rate Demand Note§: 0.11% | | | | | | | | | | | | | | | | |
District of Columbia Wesley Theological Seminary Issue Series 2008-A (Education Revenue, PNC Bank NA LOC) | | | 0.08 | | | | 12/01/2048 | | | | 4,815,000 | | | | 4,815,000 | |
| | | | | | | | | | | | | | | | |
| | | | |
Florida: 3.42% | | | | | | | | | | | | | | | | |
| | | | |
| Other Municipal Debt: 0.09% | | | | | | | | | | | | | | | | |
Hillsborough County FL School Board COP Master Lease Series A (Lease Revenue, Wells Fargo Bank NA LOC, NATL-RE Insured)(q) | | | 0.18 | | | | 08/25/2011 | | | | 4,000,000 | | | | 4,000,000 | |
| | | | | | | | | | | | | | | | |
| | | | |
| Variable Rate Demand Notes§: 3.33% | | | | | | | | | | | | | | | | |
Clay County FL DRIVER Trust Series 3439 (Water & Sewer Revenue, FSA-CR XLCA Insured)†† | | | 0.22 | | | | 11/01/2015 | | | | 3,700,000 | | | | 3,700,000 | |
Eclipse Funding Trust 2006-0002-Solar Eclipse (Tax Revenue, U.S. Bank NA LOC) | | | 0.07 | | | | 03/01/2014 | | | | 9,975,000 | | | | 9,975,000 | |
Florida Gulf Coast University Finance Corporation Parking Project Series A (Miscellaneous Revenue, Harris NA LOC) | | | 0.08 | | | | 02/01/2039 | | | | 7,835,000 | | | | 7,835,000 | |
Florida HEFAR Ringling College (Education Revenue, PNC Bank NA LOC) | | | 0.06 | | | | 03/01/2038 | | | | 6,895,000 | | | | 6,895,000 | |
Florida HFA (Housing Revenue, FHLMC Insured) | | | 0.10 | | | | 12/01/2013 | | | | 7,100,000 | | | | 7,100,000 | |
Highlands County FL HFFA Hospital Adventist Health Systems Project Series 2003-C (Hospital Revenue) | | | 0.05 | | | | 11/15/2021 | | | | 12,095,000 | | | | 12,095,000 | |
Highlands County Health Facilities Authority (Hospital Revenue, PNC Bank NA LOC) | | | 0.06 | | | | 11/15/2012 | | | | 3,865,000 | | | | 3,865,000 | |
Hillsborough County FL School Board COP Series C (Lease Revenue, Wells Fargo Bank NA LOC, NATL-RE Insured)(q) | | | 0.24 | | | | 07/01/2030 | | | | 590,000 | | | | 590,000 | |
Jea FL Electrical System Revenue (Utilities Revenue, Bank of Montreal LOC) | | | 0.07 | | | | 10/01/2035 | | | | 16,000,000 | | | | 16,000,000 | |
Lee Memorial Health Services Florida Project Series 3088 (Hospital Revenue)†† | | | 0.08 | | | | 04/01/2037 | | | | 20,035,000 | | | | 20,035,000 | |
| | | | | | |
| Portfolio of Investments—July 31, 2011 (Unaudited) | | Wells Fargo Advantage National Tax-Free Money Market Fund | | | 11 | |
| | | | | | | | | | | | | | | | |
| Security Name | | Interest Rate | | | Maturity Date | | | Principal | | | Value | |
| | | | | | | | | | | | | | | | |
| | | | |
| Variable Rate Demand Notes§ (continued) | | | | | | | | | | | | | | | | |
Miami-Dade County FL COP Series 2008-1119X (Housing Revenue, Assured Guaranty Insured) | | | 0.11 | % | | | 05/01/2033 | | | $ | 5,000,000 | | | $ | 5,000,000 | |
Miami-Dade County FL Special Obligation Capital Asset Acquisition Series A PUTTER DBE-538 (Tax Revenue, AMBAC Insured) | | | 0.08 | | | | 04/01/2027 | | | | 4,475,000 | | | | 4,475,000 | |
Orange County FL HFFA Adventist Health System (Health Revenue) | | | 0.06 | | | | 11/15/2026 | | | | 15,000,000 | | | | 15,000,000 | |
Orange County FL School Board COP Series E (Lease Revenue, Wells Fargo Bank NA LOC)(q) | | | 0.24 | | | | 08/01/2022 | | | | 2,000,000 | | | | 2,000,000 | |
Orlando FL Utilities Commission Series A (Utilities Revenue) | | | 0.19 | | | | 10/01/2027 | | | | 6,745,000 | | | | 6,745,000 | |
Palm Beach County FL Children’s Home Project (Miscellaneous Revenue, Bank of America NA LOC) | | | 0.18 | | | | 05/01/2038 | | | | 4,025,000 | | | | 4,025,000 | |
Palm Beach County FL Jupiter Medical Center Incorporated Series B (Hospital Revenue, TD Bank NA LOC) | | | 0.08 | | | | 08/01/2020 | | | | 6,015,000 | | | | 6,015,000 | |
Palm Beach County FL Norton Gallery Incorporated (Miscellaneous Revenue, Northern Trust Company LOC, GO of Institution Insured) | | | 0.11 | | | | 05/01/2025 | | | | 1,465,000 | | | | 1,465,000 | |
Palm Beach County FL Zoological Society Incorporated Project (Miscellaneous Revenue, Northern Trust Company LOC) | | | 0.08 | | | | 05/01/2031 | | | | 2,500,000 | | | | 2,500,000 | |
Polk County FL IDA HCFR Winter Haven Hospital Series B (Hospital Revenue, PNC Bank NA LOC) | | | 0.06 | | | | 09/01/2034 | | | | 5,400,000 | | | | 5,400,000 | |
Polk County FL IDA HCFR Winter Haven Hospital Series C (Hospital Revenue, PNC Bank NA LOC) | | | 0.06 | | | | 09/01/2036 | | | | 4,570,000 | | | | 4,570,000 | |
PFOTER 4703 (Health Revenue)†† | | | 0.11 | | | | 11/15/2036 | | | | 4,300,000 | | | | 4,300,000 | |
Sarasota County FL Planned Parenthood Incorporated Project (Miscellaneous Revenue, Harris NA LOC) | | | 0.11 | | | | 10/01/2041 | | | | 4,290,000 | | | | 4,290,000 | |
| | | | |
| | | | | | | | | | | | | | | 153,875,000 | |
| | | | | | | | | | | | | | | | |
| | | | |
Georgia: 2.39% | | | | | | | | | | | | | | | | |
| | | | |
| Variable Rate Demand Notes§: 2.39% | | | | | | | | | | | | | | | | |
Atlanta GA Airport Passenger Facility Charge (Airport Revenue, FSA Insured) | | | 0.23 | | | | 01/01/2013 | | | | 12,650,000 | | | | 12,650,000 | |
Atlanta GA Development Authority Perkins Will Incorporated Project (Miscellaneous Revenue, Harris NA LOC) | | | 0.10 | | | | 11/01/2030 | | | | 3,580,000 | | | | 3,580,000 | |
Clipper Tax-Exempt Certified Trust Series 2007-10 (Housing Revenue) | | | 0.11 | | | | 01/01/2016 | | | | 8,795,000 | | | | 8,795,000 | |
Fulton County GA Development Authority Shepherd Center (Hospital Revenue, FHLB LOC) | | | 0.07 | | | | 09/01/2035 | | | | 13,055,000 | | | | 13,055,000 | |
Fulton County GA Development Authority The Lovett School Project Series 2008 (Education Revenue, FHLB LOC) | | | 0.07 | | | | 04/01/2033 | | | | 11,700,000 | | | | 11,700,000 | |
Gwinnett County GA Development Authority Goodwill North GA Incorporated Project (Miscellaneous Revenue, Branch Banking & Trust LOC) | | | 0.09 | | | | 10/01/2033 | | | | 5,000,000 | | | | 5,000,000 | |
Gwinnett County GA Hospital Authority Series A (Hospital Revenue, FHLB LOC) | | | 0.07 | | | | 07/01/2036 | | | | 9,690,000 | | | | 9,690,000 | |
Gwinnett County GA School District PUTTER Series 2007-1011 (Housing Revenue, GO of Authority Insured) | | | 0.11 | | | | 07/01/2041 | | | | 2,830,000 | | | | 2,830,000 | |
Macon-Bibb County GA Hospital Authority Anticipation Note Medical Center Series B (Hospital Revenue, Branch Banking & Trust LOC) | | | 0.08 | | | | 07/01/2028 | | | | 5,450,000 | | | | 5,450,000 | |
Main Street Natural Gas Incorporated Gas Project Series A (Utilities Revenue) | | | 0.08 | | | | 08/01/2040 | | | | 23,685,000 | | | | 23,685,000 | |
Private Colleges & Universities Authority of Georgia Mercer University Project Series 2003 (Education Revenue, Branch Banking & Trust LOC) | | | 0.08 | | | | 10/01/2032 | | | | 8,630,000 | | | | 8,630,000 | |
Private Colleges & Universities Authority of Georgia Mercer University Project Series 2006-A (Education Revenue, Branch Banking & Trust LOC) | | | 0.08 | | | | 10/01/2036 | | | | 5,500,000 | | | | 5,500,000 | |
| | | | |
| | | | | | | | | | | | | | | 110,565,000 | |
| | | | | | | | | | | | | | | | |
| | | | |
| 12 | | Wells Fargo Advantage National Tax-Free Money Market Fund | | Portfolio of Investments—July 31, 2011 (Unaudited) |
| | | | | | | | | | | | | | | | |
| Security Name | | Interest Rate | | | Maturity Date | | | Principal | | | Value | |
| | | | | | | | | | | | | | | | |
| | | | |
Idaho: 0.22% | | | | | | | | | | | | | | | | |
| | | | |
| Variable Rate Demand Note§: 0.22% | | | | | | | | | | | | | | | | |
Jerome County ID Economic Development Corporation Davisco Foods International Project Series 2009 (Miscellaneous Revenue, Bank of Montreal LOC) | | | 0.07 | % | | | 12/01/2029 | | | $ | 10,000,000 | | | $ | 10,000,000 | |
| | | | | | | | | | | | | | | | |
| | | | |
Illinois: 10.58% | | | | | | | | | | | | | | | | |
| | | | |
| Variable Rate Demand Notes§: 10.58% | | | | | | | | | | | | | | | | |
Aurora IL Economic Development Aurora University (Education Revenue, Harris Trust & Savings Bank LOC) | | | 0.10 | | | | 03/01/2035 | | | | 4,225,000 | | | | 4,225,000 | |
Austin Trust Series 2008-1098 (Hospital Revenue, Assured Guaranty Insured) | | | 0.14 | | | | 08/15/2047 | | | | 16,682,000 | | | | 16,682,000 | |
Branch Bank & Trust Municipal Trust Series 5001 (Lease Revenue, RaboBank International LOC) †† | | | 0.17 | | | | 06/01/2020 | | | | 7,125,000 | | | | 7,125,000 | |
Chicago IL Series ZC-1 (GO-Local, FGIC Insured) | | | 0.14 | | | | 01/01/2023 | | | | 28,100,000 | | | | 28,100,000 | |
Chicago IL ROC RR II R-11940 (Tax Revenue)†† | | | 0.13 | | | | 07/01/2028 | | | | 4,000,000 | | | | 4,000,000 | |
Chicago IL ROC RR II R-720PB (Water & Sewer Revenue, FSA-CR FGIC Insured) | | | 0.15 | | | | 01/01/2015 | | | | 8,970,000 | | | | 8,970,000 | |
Chicago IL Series 3190 (GO-Local)†† | | | 0.08 | | | | 01/01/2034 | | | | 5,000,000 | | | | 5,000,000 | |
Chicago IL Subseries 04-3 (Water & Sewer Revenue, State Street Bank & Trust Company LOC) | | | 0.06 | | | | 11/01/2031 | | | | 3,180,000 | | | | 3,180,000 | |
Chicago IL Various Neighborhoods Alive 21-B-3 (GO-Local, Bank of America NA LOC) | | | 0.26 | | | | 01/01/2037 | | | | 8,000,000 | | | | 8,000,000 | |
Cook County IL (GO-Local, FSA-CR AMBAC Insured)†† | | | 0.11 | | | | 11/15/2011 | | | | 49,500,000 | | | | 49,500,000 | |
Deutsche Bank Spears/Lifers Trust Series DB-483 (Miscellaneous Revenue, NATL-RE Insured) | | | 0.08 | | | | 01/01/2037 | | | | 13,100,000 | | | | 13,100,000 | |
Deutsche Bank Spears/Lifers Trust Series DB-494 (Miscellaneous Revenue, FGIC Insured) | | | 0.08 | | | | 01/01/2029 | | | | 14,960,000 | | | | 14,960,000 | |
Deutsche Bank Spears/Lifers Trust Series DB-601 (Miscellaneous Revenue) | | | 0.08 | | | | 07/01/2046 | | | | 8,000,000 | | | | 8,000,000 | |
Eagle Tax Exempt Trust (Tax Revenue, FSA GO of Authority Insured)†† | | | 0.12 | | | | 06/01/2025 | | | | 9,900,000 | | | | 9,900,000 | |
Eclipse Funding Trust (Water & Sewer Revenue, U.S. Bank NA LOC) | | | 0.07 | | | | 05/01/2014 | | | | 29,815,000 | | | | 29,815,000 | |
Eclipse Funding Trust (Water & Sewer Revenue, U.S. Bank NA LOC) | | | 0.07 | | | | 01/01/2030 | | | | 11,260,000 | | | | 11,260,000 | |
Illinois Development Finance Authority (Miscellaneous Revenue, Bank of America NA LOC) | | | 0.22 | | | | 01/01/2029 | | | | 3,803,000 | | | | 3,803,000 | |
Illinois Development Finance Authority Aurora Central Catholic High School (Education Revenue, JPMorgan Chase Bank LOC) | | | 0.09 | | | | 04/01/2024 | | | | 4,045,000 | | | | 4,045,000 | |
Illinois Development Finance Authority Chicago Academy of Sciences (Miscellaneous Revenue, JPMorgan Chase Bank LOC) | | | 0.09 | | | | 01/01/2033 | | | | 5,480,000 | | | | 5,480,000 | |
Illinois Development Finance Authority Cook Communications Project (Miscellaneous Revenue, Bank of America NA LOC) | | | 0.27 | | | | 03/01/2017 | | | | 4,500,000 | | | | 4,500,000 | |
Illinois Development Finance Authority Lake Forest Academy (Education Revenue, Northern Trust Company LOC) | | | 0.09 | | | | 12/01/2024 | | | | 1,000,000 | | | | 1,000,000 | |
Illinois Development Finance Authority McCormick Theological Project B (Education Revenue, Northern Trust Company LOC) | | | 0.08 | | | | 06/01/2035 | | | | 22,435,000 | | | | 22,435,000 | |
Illinois Development Finance Authority Presbyterian Homes Project (Health Revenue, Northern Trust Company LOC) | | | 0.09 | | | | 04/01/2035 | | | | 9,000,000 | | | | 9,000,000 | |
Illinois Development Finance Authority St. Ignatius College (Education Revenue, Northern Trust Company LOC) | | | 0.09 | | | | 06/01/2024 | | | | 10,000,000 | | | | 10,000,000 | |
Illinois Development Finance Authority YMCA Metropolitan Chicago Project (Miscellaneous Revenue, Harris Trust & Savings Bank LOC) | | | 0.08 | | | | 06/01/2029 | | | | 23,700,000 | | | | 23,700,000 | |
Illinois Educational Facilities Authority Chicago Zoological Society Series B (Miscellaneous Revenue) | | | 0.09 | | | | 12/15/2025 | | | | 5,000,000 | | | | 5,000,000 | |
Illinois Educational Facilities Authority Newberry Library Project (Miscellaneous Revenue, Northern Trust Company LOC) | | | 0.08 | | | | 03/01/2028 | | | | 250,000 | | | | 250,000 | |
| | | | | | |
| Portfolio of Investments—July 31, 2011 (Unaudited) | | Wells Fargo Advantage National Tax-Free Money Market Fund | | | 13 | |
| | | | | | | | | | | | | | | | |
| Security Name | | Interest Rate | | | Maturity Date | | | Principal | | | Value | |
| | | | | | | | | | | | | | | | |
| | | | |
| Variable Rate Demand Notes§ (continued) | | | | | | | | | | | | | | | | |
Illinois Finance Authority Children’s Museum (Miscellaneous Revenue, Northern Trust Company LOC) | | | 0.09 | % | | | 07/01/2034 | | | $ | 1,970,000 | | | $ | 1,970,000 | |
Illinois Finance Authority DRIVER Trust Series 3420 (Tax Revenue, Assured Guaranty Insured)†† | | | 0.12 | | | | 01/01/2016 | | | | 3,300,000 | | | | 3,300,000 | |
Illinois Finance Authority Elmhurst Memorial Healthcare Series D (Hospital Revenue, Northern Trust Company LOC) | | | 0.06 | | | | 01/01/2048 | | | | 8,600,000 | | | | 8,600,000 | |
Illinois Finance Authority Lake Forest Country Day School Project (Education Revenue, Northern Trust Company LOC) | | | 0.09 | | | | 07/01/2035 | | | | 12,750,000 | | | | 12,750,000 | |
Illinois Finance Authority Loyola Academy (Education Revenue, JPMorgan Chase Bank LOC) | | | 0.09 | | | | 10/01/2037 | | | | 11,500,000 | | | | 11,500,000 | |
Illinois Finance Authority Presbyterian Homes (Health Revenue, Northern Trust Company LOC) | | | 0.09 | | | | 09/01/2024 | | | | 22,605,000 | | | | 22,605,000 | |
Illinois Finance Authority Richard H. Driehaus Museum (Miscellaneous Revenue, Northern Trust Company LOC) | | | 0.09 | | | | 02/01/2035 | | | | 10,100,000 | | | | 10,100,000 | |
Illinois Finance Authority Southern Illinois Healthcare (Hospital Revenue, Bank of Nova Scotia LOC) | | | 0.06 | | | | 03/01/2038 | | | | 9,020,000 | | | | 9,020,000 | |
Illinois Finance Authority The Catherine Cook School Project (Education Revenue, Northern Trust Company LOC) | | | 0.09 | | | | 01/01/2037 | | | | 5,820,000 | | | | 5,820,000 | |
Illinois Metropolitan Pier & Exposition Authority Series 3217 (Tax Revenue) | | | 0.08 | | | | 06/15/2050 | | | | 7,500,000 | | | | 7,500,000 | |
Illinois Metropolitan Pier & Exposition Authority Series 3220 (Tax Revenue)†† | | | 0.08 | | | | 06/15/2050 | | | | 27,900,000 | | | | 27,900,000 | |
Illinois Metropolitan Pier & Exposition Authority Series 3221 (Tax Revenue)†† | | | 0.08 | | | | 06/15/2050 | | | | 12,500,000 | | | | 12,500,000 | |
Illinois State Toll Highway Authority A 2A (Transportation Revenue, Bank of Tokyo-Mitsubishi UFJ LOC) | | | 0.10 | | | | 07/01/2030 | | | | 9,000,000 | | | | 9,000,000 | |
Schaumburg IL GO ROC RR II R-11698 (GO-Local, BHAC-CR FGIC Insured)†† | | | 0.11 | | | | 12/01/2032 | | | | 400,000 | | | | 400,000 | |
Springfield IL PUTTER Series 1314 (Utilities Revenue, BHAC-CR MBIA Insured) | | | 0.12 | | | | 03/01/2014 | | | | 13,575,000 | | | | 13,575,000 | |
Warren County IL Monmouth College Project (Education Revenue, PNC Bank NA LOC) | | | 0.08 | | | | 12/01/2032 | | | | 9,145,000 | | | | 9,145,000 | |
Will County IL Deutsche Bank Spears-Lifers Trust (Education Revenue, FSA Insured) | | | 0.08 | | | | 11/01/2023 | | | | 12,155,000 | | | | 12,155,000 | |
| | | | |
| | | | | | | | | | | | | | | 488,870,000 | |
| | | | | | | | | | | | | | | | |
| | | | |
Indiana: 2.51% | | | | | | | | | | | | | | | | |
| | | | |
| Variable Rate Demand Notes§: 2.51% | | | | | | | | | | | | | | | | |
Clipper Tax-Exempt Certified Trust Series 2007-02 (Lease Revenue) | | | 0.11 | | | | 07/01/2023 | | | | 26,140,000 | | | | 26,140,000 | |
Indiana Finance Authority Community Health Network Project 8 (Hospital Revenue, PNC Bank NA LOC) | | | 0.06 | | | | 07/01/2039 | | | | 8,800,000 | | | | 8,800,000 | |
Indiana Finance Authority Hospital Indiana University Health Series G (Hospital Revenue, Bank of Mellon LOC) | | | 0.04 | | | | 03/01/2021 | | | | 10,000,000 | | | | 10,000,000 | |
Indiana Finance Authority Northshore Health Center Project (Health Revenue, Harris NA LOC) | | | 0.11 | | | | 07/01/2038 | | | | 5,205,000 | | | | 5,205,000 | |
Indiana Finance Authority Parkview Health System Obligation C (Hospital Revenue, PNC Bank NA LOC) | | | 0.05 | | | | 11/01/2039 | | | | 5,250,000 | | | | 5,250,000 | |
Indianapolis IN Canal Square Apartments (Housing Revenue, FHLMC Insured) | | | 0.09 | | | | 04/01/2033 | | | | 11,905,000 | | | | 11,905,000 | |
Indianapolis IN Industrial MFHR Washington Pointe Project A (Housing Revenue, Fleet National Bank LOC) | | | 0.11 | | | | 04/15/2039 | | | | 8,430,000 | | | | 8,430,000 | |
Indianapolis Local Public Improvement Bond Bank ROC RR 11 R-1179 (Water & Sewer Revenue, Assured Guaranty Insured)†† | | | 0.20 | | | | 01/01/2017 | | | | 24,825,000 | | | | 24,825,000 | |
RBC Municipal Products Incorporated Trust Series E-23 (Miscellaneous Revenue, Royal Bank of Canada LOC)†† | | | 0.08 | | | | 03/01/2036 | | | | 5,000,000 | | | | 5,000,000 | |
Valparaiso IN Economic Development Pines Village Retirement Community Project Series 2008 (Health Revenue, Centier Bank LOC) | | | 0.11 | | | | 05/01/2038 | | | | 10,395,000 | | | | 10,395,000 | |
| | | | |
| | | | | | | | | | | | | | | 115,950,000 | |
| | | | | | | | | | | | | | | | |
| | | | |
| 14 | | Wells Fargo Advantage National Tax-Free Money Market Fund | | Portfolio of Investments—July 31, 2011 (Unaudited) |
| | | | | | | | | | | | | | | | |
| Security Name | | Interest Rate | | | Maturity Date | | | Principal | | | Value | |
| | | | | | | | | | | | | | | | |
| | | | |
Iowa: 0.78% | | | | | | | | | | | | | | | | |
| | | | |
| Variable Rate Demand Notes§: 0.78% | | | | | | | | | | | | | | | | |
Iowa Finance Authority Cedarwood Hills Project Series A (Housing Revenue) | | | 0.15 | % | | | 05/01/2031 | | | $ | 2,960,000 | | | $ | 2,960,000 | |
Iowa Higher Education Loan Authority Private College Dubuque Project (Education Revenue, Northern Trust Company LOC) | | | 0.33 | | | | 05/01/2029 | | | | 6,370,000 | | | | 6,370,000 | |
Iowa Higher Education Loan Authority Private College Project (Education Revenue, JPMorgan Chase Bank LOC) | | | 0.33 | | | | 10/01/2038 | | | | 3,695,000 | | | | 3,695,000 | |
Iowa Higher Education Loan Authority Private Colleges Ambrose (Education Revenue, Northern Trust Company LOC) | | | 0.33 | | | | 04/01/2033 | | | | 11,540,000 | | | | 11,540,000 | |
Iowa Higher Education Loan Authority University of Dubuque (Education Revenue, Northern Trust Company LOC) | | | 0.33 | | | | 04/01/2035 | | | | 11,265,000 | | | | 11,265,000 | |
| | | | |
| | | | | | | | | | | | | | | 35,830,000 | |
| | | | | | | | | | | | | | | | |
| | | | |
Kansas: 0.07% | | | | | | | | | | | | | | | | |
| | | | |
| Variable Rate Demand Note§: 0.07% | | | | | | | | | | | | | | | | |
Kansas State Development Finance Authority Adventist Health Sunbelt Series C (Health Revenue, Royal Bank of Canada LOC) | | | 0.06 | | | | 11/15/2034 | | | | 3,000,000 | | | | 3,000,000 | |
| | | | | | | | | | | | | | | | |
| | | | |
Kentucky: 0.95% | | | | | | | | | | | | | | | | |
| | | | |
| Other Municipal Debt: 0.23% | | | | | | | | | | | | | | | | |
Kentucky Rural Water Finance Corporation Public Project Series C-1 (Water & Sewer Revenue) | | | 1.50 | | | | 12/01/2011 | | | | 10,500,000 | | | | 10,529,675 | |
| | | | | | | | | | | | | | | | |
| | | | |
| Variable Rate Demand Notes§: 0.72% | | | | | | | | | | | | | | | | |
Fort Mitchell KY League of Cities Funding Trust Program Series A (Lease Revenue, U.S. Bank NA LOC) | | | 0.09 | | | | 10/01/2032 | | | | 7,635,000 | | | | 7,635,000 | |
Kentucky EDFA Hospital Ashland Hospital Corporation Series B (Hospital Revenue, Branch Banking & Trust LOC) | | | 0.09 | | | | 01/01/2038 | | | | 15,000,000 | | | | 15,000,000 | |
Williamstown KY League of Cities Funding Trust Lease Series 2008-A (Lease Revenue, U.S. Bank NA LOC) | | | 0.09 | | | | 07/01/2038 | | | | 4,500,000 | | | | 4,500,000 | |
Williamstown KY League of Cities Funding Trust Series B (Lease Revenue, U.S. Bank NA LOC) | | | 0.09 | | | | 12/01/2038 | | | | 6,395,000 | | | | 6,395,000 | |
| | | | |
| | | | | | | | | | | | | | | 33,530,000 | |
| | | | | | | | | | | | | | | | |
| | | | |
Louisiana: 2.04% | | | | | | | | | | | | | | | | |
| | | | |
| Variable Rate Demand Notes§: 2.04% | | | | | | | | | | | | | | | | |
Louisiana HFA (Housing Revenue, FHLMC LOC, FHLMC Insured) | | | 0.10 | | | | 07/01/2040 | | | | 4,095,000 | | | | 4,095,000 | |
Louisiana HFA Woodward (Housing Revenue, FHLMC Insured) | | | 0.08 | | | | 09/01/2033 | | | | 8,955,000 | | | | 8,955,000 | |
Louisiana State Gas & Fuel Series RR-II-R 661 (Tax Revenue, FSA Insured) | | | 0.11 | | | | 05/01/2014 | | | | 18,365,000 | | | | 18,365,000 | |
Parish of St. James LA Series A-1 (Energy Revenue) | | | 0.08 | | | | 11/01/2040 | | | | 41,000,000 | | | | 41,000,000 | |
Parish of St. James LA Series B-1 (Energy Revenue) | | | 0.10 | | | | 11/01/2040 | | | | 22,000,000 | | | | 22,000,000 | |
| | | | |
| | | | | | | | | | | | | | | 94,415,000 | |
| | | | | | | | | | | | | | | | |
| | | | |
Maine: 0.26% | | | | | | | | | | | | | | | | |
| | | | |
| Variable Rate Demand Note§: 0.26% | | | | | | | | | | | | | | | | |
Maine Finance Authority Foxcroft Academy (Education Revenue, TD Bank NA LOC) | | | 0.08 | | | | 06/01/2038 | | | | 12,000,000 | | | | 12,000,000 | |
| | | | | | | | | | | | | | | | |
| | | | |
Maryland: 1.77% | | | | | | | | | | | | | | | | |
| | | | |
| Other Municipal Debt: 0.99% | | | | | | | | | | | | | | | | |
Montgomery County MD Series 10-A (Tax Revenue) | | | 0.08 | | | | 08/09/2011 | | | | 24,750,000 | | | | 24,750,000 | |
| | | | | | |
| Portfolio of Investments—July 31, 2011 (Unaudited) | | Wells Fargo Advantage National Tax-Free Money Market Fund | | | 15 | |
| | | | | | | | | | | | | | | | |
| Security Name | | Interest Rate | | | Maturity Date | | | Principal | | | Value | |
| | | | | | | | | | | | | | | | |
| | | | |
| Other Municipal Debt (continued) | | | | | | | | | | | | | | | | |
Montgomery County MD Series 10-B (Tax Revenue) | | | 0.09 | % | | | 08/09/2011 | | | $ | 15,000,000 | | | $ | 15,000,000 | |
Montgomery County MD Series 10-B (Tax Revenue) | | | 0.10 | | | | 08/09/2011 | | | | 6,000,000 | | | | 6,000,000 | |
| | | | |
| | | | | | | | | | | | | | | 45,750,000 | |
| | | | | | | | | | | | | | | | |
| | | | |
| Variable Rate Demand Notes§: 0.78% | | | | | | | | | | | | | | | | |
Maryland CDA MFHR Hopkins Village Apartments Series 2008-F (Housing Revenue, FHLMC Insured) | | | 0.09 | | | | 11/01/2038 | | | | 3,000,000 | | | | 3,000,000 | |
Maryland HEFA Johns Hopkins University Project Series 1003 (Education Revenue) | | | 0.11 | | | | 07/01/2033 | | | | 6,665,000 | | | | 6,665,000 | |
Maryland HEFA Suburban Hospital (Hospital Revenue, PNC Bank NA LOC) | | | 0.06 | | | | 07/01/2029 | | | | 5,790,000 | | | | 5,790,000 | |
Maryland HEFA University of Maryland Medical System Series E (Hospital Revenue, Bank of Montreal LOC) | | | 0.08 | | | | 07/01/2041 | | | | 7,500,000 | | | | 7,500,000 | |
Maryland HEFA University of Maryland Medicine System Series D (Hospital Revenue, TD Bank NA LOC) | | | 0.21 | | | | 07/01/2041 | | | | 8,000,000 | | | | 8,000,000 | |
Montgomery County MD Housing Opportunities Series 2002-C (Housing Revenue, FNMA LOC, GO of Commonwealth Insured) | | | 0.08 | | | | 11/01/2032 | | | | 5,000,000 | | | | 5,000,000 | |
| | | | |
| | | | | | | | | | | | | | | 35,955,000 | |
| | | | | | | | | | | | | | | | |
| | | | |
Massachusetts: 1.08% | | | | | | | | | | | | | | | | |
| | | | |
| Variable Rate Demand Notes§: 1.08% | | | | | | | | | | | | | | | | |
Massachusetts Development Finance Agency Boston University Series U-6E (Education Revenue, Bank of Nova Scotia LOC) | | | 0.04 | | | | 10/01/2042 | | | | 13,670,000 | | | | 13,670,000 | |
Massachusetts Development Finance Agency Cushing Academy Issue (Education Revenue, TD Bank NA LOC) | | | 0.08 | | | | 03/01/2034 | | | | 12,045,000 | | | | 12,045,000 | |
Massachusetts State College Building Authority Series 2 (Education Revenue, State Guaranteed) | | | 0.17 | | | | 11/01/2034 | | | | 7,100,000 | | | | 7,100,000 | |
Massachusetts State Development Finance Agency Fay School Issue Series 2008 (Education Revenue, TD Bank NA LOC) | | | 0.08 | | | | 04/01/2038 | | | | 5,000,000 | | | | 5,000,000 | |
Massachusetts State Development Finance Agency Shady Hill School (Education Revenue, TD Bank NA LOC) | | | 0.08 | | | | 06/01/2038 | | | | 9,645,000 | | | | 9,645,000 | |
Massachusetts State Series A PUTTER (GO-State, NATL-RE FGIC Insured)†† | | | 0.14 | | | | 05/01/2037 | | | | 2,520,000 | | | | 2,520,000 | |
| | | | |
| | | | | | | | | | | | | | | 49,980,000 | |
| | | | | | | | | | | | | | | | |
| | | | |
Michigan: 2.60% | | | | | | | | | | | | | | | | |
| | | | |
| Other Municipal Debt: 1.25% | | | | | | | | | | | | | | | | |
Michigan Finance Authority Short Aid Notes Series D-1 (Miscellaneous Revenue) | | | 2.00 | | | | 08/19/2011 | | | | 5,000,000 | | | | 5,002,935 | |
Michigan Finance Authority Short Aid Notes Series D-2 (Miscellaneous Revenue, JPMorgan Chase Bank LOC) | | | 2.00 | | | | 08/22/2011 | | | | 7,000,000 | | | | 7,006,425 | |
Michigan Finance Authority Short Aid Notes Series D-3 (Miscellaneous Revenue, Scotia Bank LOC) | | | 2.00 | | | | 08/22/2011 | | | | 7,000,000 | | | | 7,006,425 | |
Michigan State Hospital Finance Authority Series 08-C (Health Revenue) | | | 0.14 | | | | 10/11/2011 | | | | 20,000,000 | | | | 20,000,000 | |
Michigan State Hospital Finance Authority Series 08-C (Health Revenue) | | | 0.15 | | | | 08/03/2011 | | | | 13,400,000 | | | | 13,400,000 | |
Michigan State Series A (GO-State) | | | 2.00 | | | | 09/30/2011 | | | | 5,000,000 | | | | 5,012,873 | |
| | | | |
| | | | | | | | | | | | | | | 57,428,658 | |
| | | | | | | | | | | | | | | | |
| | | | |
| Variable Rate Demand Notes§: 1.35% | | | | | | | | | | | | | | | | |
Detroit MI ROC RR II R-11941 (Water & Sewer Revenue, AGM Insured)†† | | | 0.23 | | | | 01/03/2028 | | | | 20,980,000 | | | | 20,980,000 | |
Green Lake Township MI Economic Development Corporation (Education Revenue, Harris NA LOC) | | | 0.20 | | | | 06/01/2034 | | | | 2,000,000 | | | | 2,000,000 | |
| | | | |
| 16 | | Wells Fargo Advantage National Tax-Free Money Market Fund | | Portfolio of Investments—July 31, 2011 (Unaudited) |
| | | | | | | | | | | | | | | | |
| Security Name | | Interest Rate | | | Maturity Date | | | Principal | | | Value | |
| | | | | | | | | | | | | | | | |
| | | | |
| Variable Rate Demand Notes§ (continued) | | | | | | | | | | | | | | | | |
Michigan State Hospital Finance Authority Ascension Health Senior Bonds (Hospital Revenue) | | | 0.17 | % | | | 11/15/2049 | | | $ | 4,000,000 | | | $ | 4,000,000 | |
Michigan State Hospital Finance Authority Ascension Health Senior Bonds (Hospital Revenue) | | | 0.17 | | | | 11/15/2049 | | | | 4,200,000 | | | | 4,200,000 | |
Royal Oak MI Hospital Finance Authority PUTTER DBE-711 (Hospital Revenue)†† | | | 0.08 | | | | 11/01/2035 | | | | 31,275,000 | | | | 31,275,000 | |
| | | | |
| | | | | | | | | | | | | | | 62,455,000 | |
| | | | | | | | | | | | | | | | |
| | | | |
Minnesota: 4.37% | | | | | | | | | | | | | | | | |
| | | | |
| Other Municipal Debt: 0.36% | | | | | | | | | | | | | | | | |
Minnesota Rural Water Finance Authority Public Projects Construction (Water & Sewer Revenue) | | | 1.25 | | | | 04/01/2012 | | | | 2,800,000 | | | | 2,811,113 | |
Minnesota State Trunk Highway Series B (GO-State) | | | 4.00 | | | | 08/01/2011 | | | | 2,000,000 | | | | 2,000,000 | |
University of Minnesota Series 05-A (Education Revenue) | | | 0.13 | | | | 10/05/2011 | | | | 11,660,000 | | | | 11,660,000 | |
| | | | |
| | | | | | | | | | | | | | | 16,471,113 | |
| | | | | | | | | | | | | | | | |
| | | | |
| Variable Rate Demand Notes§: 4.01% | | | | | | | | | | | | | | | | |
Andover MN Senior Housing Presbyterian Homes Incorporated Project (Housing Revenue, FNMA Insured) | | | 0.15 | | | | 11/15/2033 | | | | 7,805,000 | | | | 7,805,000 | |
Bloomington MN Bristol Village (Housing Revenue, FNMA Insured) | | | 0.17 | | | | 11/15/2032 | | | | 3,125,000 | | | | 3,125,000 | |
Bloomington MN Presbyterian Homes (Housing Revenue, FHLMC Insured) | | | 0.15 | | | | 07/01/2038 | | | | 4,475,000 | | | | 4,475,000 | |
Brooklyn Center MN Brookdale Corporation II Project (Miscellaneous Revenue, U.S. Bank NA LOC) | | | 0.33 | | | | 12/01/2014 | | | | 500,000 | | | | 500,000 | |
Burnsville MN Berkshire Project Series A (Housing Revenue, FNMA Insured) | | | 0.15 | | | | 07/15/2030 | | | | 4,145,000 | | | | 4,145,000 | |
Cohasset MN Power & Light Company Project A (IDR, LaSalle Bank NA LOC) | | | 0.11 | | | | 06/01/2020 | | | | 100,000 | | | | 100,000 | |
Crystal MN MFHR Crystal Apartments Project (Housing Revenue, FHLMC Insured) | | | 0.10 | | | | 05/01/2027 | | | | 3,250,000 | | | | 3,250,000 | |
Dakota County MN CDA Catholic Finance Corporation (Education Revenue, U.S. Bank NA LOC) | | | 0.20 | | | | 01/01/2012 | | | | 3,475,000 | | | | 3,475,000 | |
Dakota County MN RDA (Housing Revenue, FHLMC Insured) | | | 0.11 | | | | 06/01/2029 | | | | 3,685,000 | | | | 3,685,000 | |
East Grand Forks MN Solid Waste Disposal American Crystal Sugar Company Project (Miscellaneous Revenue, CoBank ACB LOC) | | | 0.09 | | | | 12/01/2021 | | | | 1,000,000 | | | | 1,000,000 | |
Eden Prairie MN Eden Glen Apartments Project (Housing Revenue, FNMA Insured) | | | 0.15 | | | | 02/15/2031 | | | | 990,000 | | | | 990,000 | |
Edina MN Edina Park Plaza (Housing Revenue, FHLMC Insured) | | | 0.10 | | | | 12/01/2029 | | | | 3,380,000 | | | | 3,380,000 | |
Forest Lake MN Kilkenny Court Apartments Project (Housing Revenue, FNMA Insured) | | | 0.10 | | | | 08/15/2038 | | | | 4,100,000 | | | | 4,100,000 | |
Inver Grove Heights MN Inver Grove Incorporated Project (Housing Revenue, FNMA Insured) | | | 0.15 | | | | 05/15/2035 | | | | 10,220,000 | | | | 10,220,000 | |
Maple Grove MN MFHR Basswood Trails Project (Housing Revenue, FHLMC Insured) | | | 0.15 | | | | 03/01/2029 | | | | 1,620,000 | | | | 1,620,000 | |
Minneapolis & St. Paul MN Housing & RDA Allina Health Systems Series B-1 (Hospital Revenue, JPMorgan Chase Bank LOC) | | | 0.31 | | | | 11/15/2035 | | | | 3,675,000 | | | | 3,675,000 | |
Minneapolis & St. Paul MN Housing & RDA Allina Health Systems Series B-2 (Hospital Revenue, JPMorgan Chase Bank LOC) | | | 0.20 | | | | 11/15/2035 | | | | 10,900,000 | | | | 10,900,000 | |
Minneapolis & St. Paul MN Housing & RDA Health Care Facilities Series A (Hospital Revenue, AGM Insured) | | | 0.33 | | | | 08/15/2034 | | | | 600,000 | | | | 600,000 | |
Minneapolis & St. Paul MN Metro Airports Commission Series A PUTTER DB-489 (Airport Revenue, AMBAC Insured) | | | 0.08 | | | | 01/01/2030 | | | | 6,920,000 | | | | 6,920,000 | |
Minneapolis MN Housing Development Symphony Place Project (Housing Revenue, FHLMC Insured) | | | 0.18 | | | | 12/01/2014 | | | | 500,000 | | | | 500,000 | |
| | | | | | |
| Portfolio of Investments—July 31, 2011 (Unaudited) | | Wells Fargo Advantage National Tax-Free Money Market Fund | | | 17 | |
| | | | | | | | | | | | | | | | |
| Security Name | | Interest Rate | | | Maturity Date | | | Principal | | | Value | |
| | | | | | | | | | | | | | | | |
| | | | |
| Variable Rate Demand Notes§ (continued) | | | | | | | | | | | | | | | | |
Minneapolis MN MacPhail Center for Music Project (Miscellaneous Revenue, U.S. Bank NA LOC) | | | 0.33 | % | | | 08/01/2036 | | | $ | 665,000 | | | $ | 665,000 | |
Minnesota State Concordia University Series P1 (Education Revenue, U.S. Bank NA LOC) | | | 0.30 | | | | 04/01/2027 | | | | 955,000 | | | | 955,000 | |
Minnesota State HEFAR Carleton College Series 5G (Education Revenue, JPMorgan Chase Bank LOC) | | | 0.06 | | | | 11/01/2029 | | | | 4,610,000 | | | | 4,610,000 | |
Minnesota State HEFAR Hamline University Series 6E1 (Education Revenue, Harris NA LOC) | | | 0.09 | | | | 10/01/2016 | | | | 850,000 | | | | 850,000 | |
Minnesota State HEFAR MacAlester College Series 3-Z (Education Revenue, GO of Institution Insured) | | | 0.13 | | | | 03/01/2024 | | | | 300,000 | | | | 300,000 | |
Minnesota State HEFAR MacAlester College Series 5-Q (Education Revenue) | | | 0.13 | | | | 03/01/2033 | | | | 1,400,000 | | | | 1,400,000 | |
Minnesota State University of St. Thomas Series 4O (Education Revenue, U.S. Bank NA LOC) | | | 0.07 | | | | 10/01/2021 | | | | 5,195,000 | | | | 5,195,000 | |
Minnesota State University of St. Thomas Series 5C (Education Revenue, U.S. Bank NA LOC) | | | 0.07 | | | | 04/01/2025 | | | | 7,570,000 | | | | 7,570,000 | |
Minnesota State University of St. Thomas Series 6H (Education Revenue, U.S. Bank NA LOC) | | | 0.08 | | | | 10/01/2032 | | | | 8,200,000 | | | | 8,200,000 | |
Minnetonka MN Housing Facilities Beacon Hill (Housing Revenue, FNMA Insured) | | | 0.15 | | | | 05/15/2034 | | | | 5,850,000 | | | | 5,850,000 | |
Minnetonka MN Minnetonka Hills Apartments (Housing Revenue, FNMA Insured) | | | 0.15 | | | | 11/15/2031 | | | | 2,665,000 | | | | 2,665,000 | |
Oak Park Heights MN Boutwells Landing Project (Housing Revenue, FHLMC Insured) | | | 0.15 | | | | 11/01/2035 | | | | 9,300,000 | | | | 9,300,000 | |
Pine City MN State Senior Housing Agency Lakeview Project (Housing Revenue, FNMA Insured) | | | 0.15 | | | | 04/15/2036 | | | | 5,700,000 | | | | 5,700,000 | |
Plymouth MN Lancaster Village Apartments Project (Housing Revenue, FNMA Insured) | | | 0.15 | | | | 09/15/2031 | | | | 2,865,000 | | | | 2,865,000 | |
Rochester MN Health Care Facilities Mayo Foundation (Hospital Revenue) | | | 0.04 | | | | 08/15/2032 | | | | 9,750,000 | | | | 9,750,000 | |
Spring Lake Park MN Senior Housing Oak Crest Apartments Project (Housing Revenue, FNMA Insured) | | | 0.15 | | | | 02/15/2033 | | | | 1,115,000 | | | | 1,115,000 | |
St. Anthony MN Autumn Woods Housing Project (Housing Revenue, FNMA Insured) | | | 0.15 | | | | 05/15/2032 | | | | 2,550,000 | | | | 2,550,000 | |
St. Cloud MN Cenracare Health Series A (Hospital Revenue, U.S. Bank NA LOC) | | | 0.10 | | | | 05/01/2042 | | | | 7,200,000 | | | | 7,200,000 | |
St. Louis Park MN Knollwood Place (Housing Revenue, FHLMC Insured) | | | 0.15 | | | | 10/01/2035 | | | | 11,300,000 | | | | 11,300,000 | |
St. Louis Park MN MFHR Parkshore Project (Housing Revenue, FHLMC Insured) | | | 0.15 | | | | 08/01/2034 | | | | 1,045,000 | | | | 1,045,000 | |
St. Paul MN Housing & RDA Highland Ridge Project (Housing Revenue, FHLMC Insured) | | | 0.15 | | | | 10/01/2033 | | | | 1,000,000 | | | | 1,000,000 | |
St. Paul MN Port Authority District Cooling Series 13-FF (IDR, Deutsche Bank AG LOC) | | | 0.05 | | | | 03/01/2029 | | | | 4,080,000 | | | | 4,080,000 | |
St. Paul MN Port Authority District Heating Series 14-S ( IDR, Deutsche Bank AG LOC) | | | 0.05 | | | | 12/01/2028 | | | | 3,215,000 | | | | 3,215,000 | |
St. Paul MN Port Authority District Heating Series 7-Q (IDR, Deutsche Bank AG LOC) | | | 0.05 | | | | 12/01/2028 | | | | 625,000 | | | | 625,000 | |
St. Paul MN Port Authority District Series 11Dd (IDR, Deutsche Bank AG LOC) | | | 0.05 | | | | 03/01/2029 | | | | 1,000,000 | | | | 1,000,000 | |
St. Paul MN Port Authority District Series 9BB (IDR, Deutsche Bank AG LOC) | | | 0.05 | | | | 03/01/2029 | | | | 1,300,000 | | | | 1,300,000 | |
St. Paul MN Port Authority MFHR (Housing Revenue, FHLMC Insured) | | | 0.15 | | | | 02/01/2034 | | | | 5,680,000 | | | | 5,680,000 | |
St. Paul MN Port Authority Tax Increment Westgate Office & Industrial Center Project (Tax Revenue, U.S. Bank NA LOC) | | | 0.05 | | | | 02/01/2015 | | | | 4,750,000 | | | | 4,750,000 | |
| | | | |
| | | | | | | | | | | | | | | 185,200,000 | |
| | | | | | | | | | | | | | | | |
| | | | |
| 18 | | Wells Fargo Advantage National Tax-Free Money Market Fund | | Portfolio of Investments—July 31, 2011 (Unaudited) |
| | | | | | | | | | | | | | | | |
| Security Name | | Interest Rate | | | Maturity Date | | | Principal | | | Value | |
| | | | | | | | | | | | | | | | |
| | | | |
Mississippi: 0.41% | | | | | | | | | | | | | | | | |
| | | | |
| Variable Rate Demand Note§: 0.41% | | | | | | | | | | | | | | | | |
Clipper Tax-Exempt Certificate Trust Series 2007-32 (GO-State) | | | 0.13 | % | | | 11/01/2018 | | | $ | 18,960,000 | | | $ | 18,960,000 | |
| | | | | | | | | | | | | | | | |
| | | | |
Missouri: 2.25% | | | | | | | | | | | | | | | | |
| | | | |
| Other Municipal Debt: 0.24% | | | | | | | | | | | | | | | | |
St. Louis County MO Special Obligation TRAN (Miscellaneous Revenue) | | | 0.45 | | | | 08/01/2011 | | | | 11,000,000 | | | | 11,000,000 | |
| | | | | | | | | | | | | | | | |
| | | | |
| Variable Rate Demand Notes§: 2.01% | | | | | | | | | | | | | | | | |
Eclipse Funding Trust (Utilities Revenue, U.S. Bank NA LOC) | | | 0.07 | | | | 01/01/2032 | | | | 12,055,000 | | | | 12,055,000 | |
Independence MO IDA The Mansions Project (Housing Revenue, FHLMC Insured) | | | 0.09 | | | | 08/01/2035 | | | | 5,110,000 | | | | 5,110,000 | |
Kansas City IDA Multi Family Housing PUTTER Series DBE-712 (Housing Revenue)†† | | | 0.07 | | | | 06/01/2012 | | | | 9,175,000 | | | | 9,175,000 | |
Kansas City MO IDA Revenue Ewing Marion Kauffman Foundation (IDR) | | | 0.33 | | | | 04/01/2027 | | | | 250,000 | | | | 250,000 | |
Kansas City MO IDA Revenue Ewing Marion Kauffman Foundation Series A (Miscellaneous Revenue) | | | 0.33 | | | | 04/01/2027 | | | | 1,905,000 | | | | 1,905,000 | |
Missouri HEFA Washington University Project Series B (Education Revenue) | | | 0.23 | | | | 02/15/2033 | | | | 4,000,000 | | | | 4,000,000 | |
Missouri State Development Finance Board Association of Municipal Utilities (Utilities Revenue, U.S. Bank NA LOC) | | | 0.33 | | | | 06/01/2033 | | | | 7,440,000 | | | | 7,440,000 | |
Missouri State Development Finance Board Ewing Marion Kauffman Project Series A (Miscellaneous Revenue) | | | 0.33 | | | | 06/01/2037 | | | | 9,525,000 | | | | 9,525,000 | |
Missouri State HEFA Ascension Health Series C-3 (Health Revenue) | | | 0.06 | | | | 11/15/2039 | | | | 18,000,000 | | | | 18,000,000 | |
Missouri State HEFA Ranken Technical College (Education Revenue, Northern Trust Company LOC) | | | 0.33 | | | | 11/15/2031 | | | | 5,250,000 | | | | 5,250,000 | |
Missouri State HEFA Southwest Baptist University Project (Education Revenue, Bank of America NA LOC) | | | 0.33 | | | | 10/01/2033 | | | | 330,000 | | | | 330,000 | |
St. Louis County MO IDA Heatherbrook Gardens (Housing Revenue, U.S. Bank NA LOC) | | | 0.28 | | | | 03/01/2022 | | | | 1,765,000 | | | | 1,765,000 | |
St. Louis County MO IDA Pelican Cove Project (Housing Revenue, FNMA Insured) | | | 0.09 | | | | 03/15/2034 | | | | 18,000,000 | | | | 18,000,000 | |
| | | | |
| | | | | | | | | | | | | | | 92,805,000 | |
| | | | | | | | | | | | | | | | |
| | | | |
Nebraska: 0.75% | | | | | | | | | | | | | | | | |
| | | | |
| Variable Rate Demand Note§: 0.75% | | | | | | | | | | | | | | | | |
Central Plains NE Nebraska Gas Project #2 Series 2009 (Utilities Revenue) | | | 0.08 | | | | 08/01/2039 | | | | 34,690,000 | | | | 34,690,000 | |
| | | | | | | | | | | | | | | | |
| | | | |
Nevada: 0.38% | | | | | | | | | | | | | | | | |
| | | | |
| Variable Rate Demand Notes§: 0.38% | | | | | | | | | | | | | | | | |
Las Vegas NV EDA Andre Agassi Foundation Project (Education Revenue, Bank of America NA LOC) | | | 0.09 | | | | 10/01/2035 | | | | 1,705,000 | | | | 1,705,000 | |
Las Vegas NV Economic Development Keep Memory Alive Project (Miscellaneous Revenue, PNC Bank NA LOC) | | | 0.06 | | | | 05/01/2037 | | | | 8,000,000 | | | | 8,000,000 | |
Reno NV Senior Lien Transportation Rail Access Corridor Project Series 2008A (Tax Revenue, Bank of New York LOC) | | | 0.20 | | | | 06/01/2042 | | | | 7,865,000 | | | | 7,865,000 | |
| | | | |
| | | | | | | | | | | | | | | 17,570,000 | |
| | | | | | | | | | | | | | | | |
| | | | |
New Hampshire: 0.38% | | | | | | | | | | | | | | | | |
| | | | |
| Variable Rate Demand Notes§: 0.38% | | | | | | | | | | | | | | | | |
New Hampshire HEFA Frisbie Memorial Hospital (Hospital Revenue, TD Bank NA LOC) | | | 0.07 | | | | 10/01/2036 | | | | 9,550,000 | | | | 9,550,000 | |
| | | | | | |
| Portfolio of Investments—July 31, 2011 (Unaudited) | | Wells Fargo Advantage National Tax-Free Money Market Fund | | | 19 | |
| | | | | | | | | | | | | | | | |
| Security Name | | Interest Rate | | | Maturity Date | | | Principal | | | Value | |
| | | | | | | | | | | | | | | | |
| | | | |
| Variable Rate Demand Notes§ (continued) | | | | | | | | | | | | | | | | |
New Hampshire HEFA Tilton School (Education Revenue, TD Bank NA LOC) | | | 0.10 | % | | | 02/01/2036 | | | $ | 8,000,000 | | | $ | 8,000,000 | |
| | | | |
| | | | | | | | | | | | | | | 17,550,000 | |
| | | | | | | | | | | | | | | | |
| | | | |
New Jersey: 2.76% | | | | | | | | | | | | | | | | |
| | | | |
| Other Municipal Debt: 0.23% | | | | | | | | | | | | | | | | |
North Brunswick NJ BAN (GO-Local) | | | 1.25 | | | | 08/11/2011 | | | | 10,500,000 | | | | 10,502,579 | |
| | | | | | | | | | | | | | | | |
| | | | |
| Variable Rate Demand Notes§: 2.53% | | | | | | | | | | | | | | | | |
Austin Trust Varous States Series 2008-3302 (Miscellaneous Revenue, FSA Insured) | | | 0.11 | | | | 09/01/2032 | | | | 5,800,000 | | | | 5,800,000 | |
Camden County NJ Improvement Authority Health Care Redevelopment The Cooper Health Systems Project Series 2004-B (Hospital Revenue, TD Bank NA LOC) | | | 0.04 | | | | 08/01/2032 | | | | 11,880,000 | | | | 11,880,000 | |
Deutsche Bank Spears Lifers Trust Series DB-317 (Transportation Revenue, FSA Insured) | | | 0.08 | | | | 12/15/2033 | | | | 1,000,000 | | | | 1,000,000 | |
Deutsche Bank Spears Trust Series Series DB-449 (Miscellaneous Revenue, FSA Insured) | | | 0.08 | | | | 12/15/2034 | | | | 1,850,000 | | | | 1,850,000 | |
New Jersey EDA Gas Facility (Utilities Revenue, Bank of Tokyo-Mitsubishi UFJ LOC) | | | 0.23 | | | | 10/01/2022 | | | | 18,300,000 | | | | 18,300,000 | |
New Jersey EDA Princeton School Project (Miscellaneous Revenue, PNC Bank NA LOC) | | | 0.05 | | | | 11/01/2034 | | | | 4,800,000 | | | | 4,800,000 | |
New Jersey EDA The Peddie School Project Series B (Education Revenue) | | | 0.06 | | | | 02/01/2029 | | | | 1,700,000 | | | | 1,700,000 | |
New Jersey HFFA Princeton Healthcare Series A (Hospital Revenue, Bank of America NA LOC) | | | 0.10 | | | | 07/01/2041 | | | | 2,000,000 | | | | 2,000,000 | |
New Jersey HFFA Princeton Healthcare Series B (Hospital Revenue, TD Bank NA LOC) | | | 0.06 | | | | 07/01/2041 | | | | 1,800,000 | | | | 1,800,000 | |
New Jersey HFFA Series A1 (Hospital Revenue, TD Bank NA LOC) | | | 0.10 | | | | 07/01/2014 | | | | 1,000,000 | | | | 1,000,000 | |
New Jersey HFFA Various Somerset Medical Center (Hospital Revenue, TD Bank NA LOC) | | | 0.06 | | | | 07/01/2024 | | | | 1,700,000 | | | | 1,700,000 | |
New Jersey Higher Education Assistance Foundation Series 1A PUTTER MT-638 (Education Revenue)†† | | | 0.11 | | | | 12/01/2024 | | | | 16,795,000 | | | | 16,795,000 | |
New Jersey State Transportation Trust Fund Authority PUTTER 2009-70 (Miscellaneous Revenue) | | | 0.08 | | | | 12/15/2023 | | | | 43,000,000 | | | | 43,000,000 | |
Newark NJ Housing Authority Port Marine Newark Redevelopment Project PUTTER Series DBE-511 (Port Revenue, NATL-RE Insured) | | | 0.08 | | | | 01/01/2032 | | | | 5,380,000 | | | | 5,380,000 | |
| | | | |
| | | | | | | | | | | | | | | 117,005,000 | |
| | | | | | | | | | | | | | | | |
| | | | |
New Mexico: 1.70% | | | | | | | | | | | | | | | | |
| | | | |
| Variable Rate Demand Notes§: 1.70% | | | | | | | | | | | | | | | | |
New Mexico Educational Assistance Foundation Series 2 A-2 PUTTER (Education Revenue, Guaranteed Student Loans Insured)†† | | | 0.12 | | | | 12/01/2038 | | | | 23,595,000 | | | | 23,595,000 | |
New Mexico Finance Authority State Subseries A1 (Tax Revenue, State Street Bank & Trust Company LOC) | | | 0.04 | | | | 06/15/2024 | | | | 5,000,000 | | | | 5,000,000 | |
New Mexico Municipal Energy Acquisition Authority Gas Supply Series 2009 (Utilities Revenue) | | | 0.08 | | | | 11/01/2039 | | | | 49,925,000 | | | | 49,925,000 | |
| | | | |
| | | | | | | | | | | | | | | 78,520,000 | |
| | | | | | | | | | | | | | | | |
| | | | |
New York: 3.65% | | | | | | | | | | | | | | | | |
| | | | |
| Other Municipal Debt: 0.66% | | | | | | | | | | | | | | | | |
Metropolitan Transportation Authority NY Series A (Transportation Revenue) | | | 0.23 | | | | 10/06/2011 | | | | 5,000,000 | | | | 5,000,000 | |
Oyster Bay NY BAN (GO-Local) | | | 1.25 | | | | 08/12/2011 | | | | 19,000,000 | | | | 19,005,422 | |
| | | | |
| 20 | | Wells Fargo Advantage National Tax-Free Money Market Fund | | Portfolio of Investments—July 31, 2011 (Unaudited) |
| | | | | | | | | | | | | | | | |
| Security Name | | Interest Rate | | | Maturity Date | | | Principal | | | Value | |
| | | | | | | | | | | | | | | | |
| | | | |
| Other Municipal Debt (continued) | | | | | | | | | | | | | | | | |
Tarrytown NY USD BAN (GO-Local, State Aid Withholding Insured) | | | 1.50 | % | | | 08/12/2011 | | | $ | 6,500,000 | | | $ | 6,502,223 | |
| | | | |
| | | | | | | | | | | | | | | 30,507,645 | |
| | | | | | | | | | | | | | | | |
| | | | |
| Variable Rate Demand Notes§: 2.99% | | | | | | | | | | | | | | | | |
JPMorgan Chase PUTTER/DRIVER Trust Series 3899 (Water & Sewer Revenue)†† | | | 0.21 | | | | 05/02/2013 | | | | 5,050,000 | | | | 5,050,000 | |
Monroe County NY IDA Civic Facilities Monroe Community College Project Series A (Education Revenue, JPMorgan Chase Bank LOC) | | | 0.06 | | | | 06/01/2036 | | | | 3,965,000 | | | | 3,965,000 | |
New York NY City Subseries B (GO-Local, TD Bank NA LOC) | | | 0.05 | | | | 09/01/2027 | | | | 2,470,000 | | | | 2,470,000 | |
New York Convention Center Development Corporation New York Hotel Unit Fee Secured Series 3095 (Tax Revenue, BHAC-CR AMBAC Insured)†† | | | 0.08 | | | | 11/15/2044 | | | | 26,135,000 | | | | 26,135,000 | |
New York Metropolitan Transportation Authority ROC RR 11 R-11645 (Transportation Revenue, FSA Insured)†† | | | 0.23 | | | | 11/15/2025 | | | | 7,280,000 | | | | 7,280,000 | |
New York NY City Housing Development Corporation (Housing Revenue) | | | 0.48 | | | | 05/01/2046 | | | | 9,085,000 | | | | 9,085,000 | |
New York NY City Housing Development Corporation Series M (Housing Revenue) | | | 0.48 | | | | 11/01/2013 | | | | 5,000,000 | | | | 5,000,000 | |
New York NY City Transitional Finance Authority Building Aid Class A (Miscellaneous Revenue, FSA-CR, FGIC, State Aid Withholding Insured) | | | 0.12 | | | | 01/15/2037 | | | | 14,800,000 | | | | 14,800,000 | |
New York NY City Trust for Cultural Resources (Education Revenue)†† | | | 0.11 | | | | 01/01/2033 | | | | 2,600,000 | | | | 2,600,000 | |
New York NY Municipal Water & Sewer Finance Authority Fiscal Year 2009 Series 3484 (Water & Sewer Revenue)†† | | | 0.21 | | | | 06/15/2033 | | | | 39,870,000 | | | | 39,870,000 | |
New York NY Subseries F-4 (GO-Local, Sumitomo Mitsui Banking LOC) | | | 0.08 | | | | 09/01/2035 | | | | 2,100,000 | | | | 2,100,000 | |
New York State Dormitory Authority Northern Westchester Association (Hospital Revenue, TD Bank NA LOC) | | | 0.06 | | | | 11/01/2034 | | | | 3,000,000 | | | | 3,000,000 | |
New York State Power Authority & General Purpose (Miscellaneous Revenue) | | | 0.32 | | | | 03/01/2016 | | | | 6,300,000 | | | | 6,300,000 | |
New York State Power Authority & General Purpose (Miscellaneous Revenue) | | | 0.32 | | | | 03/01/2020 | | | | 1,000,000 | | | | 1,000,000 | |
New York State Thruway Authority PUTTER Series 3600-Z (Transportation Revenue, FGIC Insured)†† | | | 0.22 | | | | 01/01/2016 | | | | 4,645,000 | | | | 4,645,000 | |
Oneida County NY IDA (Hospital Revenue, HSBC Bank USA NA LOC) | | | 0.06 | | | | 06/01/2026 | | | | 2,750,000 | | | | 2,750,000 | |
PFOTER 4705 (Water & Sewer Revenue)†† | | | 0.11 | | | | 06/15/2031 | | | | 2,000,000 | | | | 2,000,000 | |
| | | | |
| | | | | | | | | | | | | | | 138,050,000 | |
| | | | | | | | | | | | | | | | |
| | | | |
North Carolina: 1.35% | | | | | | | | | | | | | | | | |
| | | | |
| Variable Rate Demand Notes§: 1.35% | | | | | | | | | | | | | | | | |
Durham County NC COP (Miscellaneous Revenue, FHLB LOC) | | | 0.07 | | | | 06/01/2034 | | | | 23,000,000 | | | | 23,000,000 | |
North Carolina Capital Facilities Finance Agency (Miscellaneous Revenue, Branch Banking & Trust LOC) | | | 0.07 | | | | 03/01/2031 | | | | 10,610,000 | | | | 10,610,000 | |
North Carolina Capital Facilities Finance Agency Campbell University (Education Revenue, Branch Banking & Trust LOC) | | | 0.08 | | | | 10/01/2034 | | | | 5,920,000 | | | | 5,920,000 | |
North Carolina Education Care Community Health Care Facilities University Health Systems of Eastern Carolina Series 2008-B-1 (Health Revenue, Branch Banking & Trust LOC) | | | 0.08 | | | | 12/01/2036 | | | | 9,410,000 | | | | 9,410,000 | |
North Carolina Education Care Community Health Care Facilities University Health Systems of Eastern Carolina Series 2008-B-2 (Hospital Revenue, Branch Banking & Trust LOC) | | | 0.07 | | | | 12/01/2036 | | | | 5,040,000 | | | | 5,040,000 | |
North Carolina Medical Care Commission Wayne Memorial Hospital (Hospital Revenue, Branch Banking & Trust LOC) | | | 0.06 | | | | 10/01/2036 | | | | 4,680,000 | | | | 4,680,000 | |
Piedmont Triad NC Airport Authority Series A (Airport Revenue, Branch Banking & Trust LOC) | | | 0.09 | | | | 07/01/2032 | | | | 3,500,000 | | | | 3,500,000 | |
| | | | |
| | | | | | | | | | | | | | | 62,160,000 | |
| | | | | | | | | | | | | | | | |
| | | | | | |
| Portfolio of Investments—July 31, 2011 (Unaudited) | | Wells Fargo Advantage National Tax-Free Money Market Fund | | | 21 | |
| | | | | | | | | | | | | | | | |
| Security Name | | Interest Rate | | | Maturity Date | | | Principal | | | Value | |
| | | | | | | | | | | | | | | | |
| | | | |
North Dakota: 0.94% | | | | | | | | | | | | | | | | |
| | | | |
| Other Municipal Debt: 0.87% | | | | | | | | | | | | | | | | |
Mercer County ND Pollution Control Authority Series 09-2 (Miscellaneous Revenue) | | | 0.23 | % | | | 08/17/2011 | | | $ | 30,000,000 | | | $ | 30,000,000 | |
North Dakota Rural Water Finance Corporation Public Project Construction Notes A-4 (Water & Sewer Revenue) | | | 1.50 | | | | 09/01/2011 | | | | 10,000,000 | | | | 10,006,739 | |
| | | | |
| | | | | | | | | | | | | | | 40,006,739 | |
| | | | | | | | | | | | | | | | |
| | | | |
| Variable Rate Demand Note§: 0.07% | | | | | | | | | | | | | | | | |
Richland County ND Recovery Zone (IDR, CoBank ACB LOC) | | | 0.09 | | | | 11/01/2028 | | | | 3,500,000 | | | | 3,500,000 | |
| | | | | | | | | | | | | | | | |
| | | | |
Ohio: 1.73% | | | | | | | | | | | | | | | | |
| | | | |
| Variable Rate Demand Notes§: 1.73% | | | | | | | | | | | | | | | | |
Lancaster OH Port Authority Gas Series 2008 (Utilities Revenue) | | | 0.08 | | | | 05/01/2038 | | | | 27,155,000 | | | | 27,155,000 | |
Ohio State HEFA Western Reserve B-1 (Education Revenue, U.S. Bank NA LOC) | | | 0.26 | | | | 12/01/2044 | | | | 6,500,000 | | | | 6,500,000 | |
Ohio State Water Development Authority First Energy General Corporation Series A (IDR, UBS AG LOC) | | | 0.23 | | | | 05/15/2019 | | | | 5,800,000 | | | | 5,800,000 | |
Ohio State Water Development Authority Pollution Control First Energy Series C (Utilities Revenue, UBS AG LOC) | | | 0.23 | | | | 06/01/2033 | | | | 11,625,000 | | | | 11,625,000 | |
Parma OH Community General Hospital Association Series 2006A (Health Revenue, PNC Bank NA LOC) | | | 0.06 | | | | 11/01/2029 | | | | 11,250,000 | | | | 11,250,000 | |
Portage County OH Robinson Memorial Hospital (Hospital Revenue, JPMorgan Chase Bank LOC)± | | | 0.21 | | | | 09/01/2033 | | | | 300,000 | | | | 300,000 | |
Warren County OH Cincinnati Electricity Corporation Project (IDR, Scotia Bank LOC) | | | 0.28 | | | | 09/01/2015 | | | | 2,810,000 | | | | 2,810,308 | |
Warren County OH Health Care Facilities Otterbein Homes Series B (Health Revenue, U.S. Bank NA LOC) | | | 0.08 | | | | 07/01/2023 | | | | 14,430,000 | | | | 14,430,000 | |
| | | | |
| | | | | | | | | | | | | | | 79,870,308 | |
| | | | | | | | | | | | | | | | |
| | | | |
Oklahoma: 0.42% | | | | | | | | | | | | | | | | |
| | | | |
| Variable Rate Demand Notes§: 0.42% | | | | | | | | | | | | | | | | |
Oklahoma State Municipal Power Authority Series 1880 (Utilities Revenue, AGC-ICC FGIC Insured) | | | 0.22 | | | | 01/01/2015 | | | | 10,090,000 | | | | 10,090,000 | |
Oklahoma State Turnpike Authority Second SR Series D (Transportation Revenue) | | | 0.07 | | | | 01/01/2028 | | | | 9,300,000 | | | | 9,300,000 | |
| | | | |
| | | | | | | | | | | | | | | 19,390,000 | |
| | | | | | | | | | | | | | | | |
| | | | |
Other: 2.28% | | | | | | | | | | | | | | | | |
| | | | |
| Variable Rate Demand Notes§: 2.28% | | | | | | | | | | | | | | | | |
Clipper Tax-Exempt Certified Trust Series 2004-05 (GO-State, FHLMC Insured) | | | 0.13 | | | | 05/01/2014 | | | | 14,500,000 | | | | 14,500,000 | |
Puttable Floating Option Tax-Exempt Receipts Class C PPT 10011 (Housing Revenue, FHLMC Insured) | | | 0.11 | | | | 03/01/2040 | | | | 90,780,000 | | | | 90,780,000 | |
| | | | |
| | | | | | | | | | | | | | | 105,280,000 | |
| | | | | | | | | | | | | | | | |
| | | | |
Pennsylvania: 4.05% | | | | | | | | | | | | | | | | |
| | | | |
| Variable Rate Demand Notes§: 4.05% | | | | | | | | | | | | | | | | |
Allegheny County PA Hospital Development Authority University of Pittsburgh Education Center Project Series 2007-B-2 (Hospital Revenue, Royal Bank of Canada LOC)†† | | | 0.08 | | | | 04/15/2039 | | | | 9,500,000 | | | | 9,500,000 | |
| | | | |
| 22 | | Wells Fargo Advantage National Tax-Free Money Market Fund | | Portfolio of Investments—July 31, 2011 (Unaudited) |
| | | | | | | | | | | | | | | | |
| Security Name | | Interest Rate | | | Maturity Date | | | Principal | | | Value | |
| | | | | | | | | | | | | | | | |
| | | | |
| Variable Rate Demand Notes§ (continued) | | | | | | | | | | | | | | | | |
Allegheny County PA Hospital Development Authority University of Pittsburgh Medical Center PUTTER MT-636 (Hospital Revenue)†† | | | 0.14 | % | | | 02/01/2031 | | | $ | 2,360,000 | | | $ | 2,360,000 | |
Allegheny County PA IDA Watson Institute Friendship Academy (Education Revenue, PNC Bank NA LOC) | | | 0.08 | | | | 08/01/2040 | | | | 3,750,000 | | | | 3,750,000 | |
Beaver County PA IDA Electric Company Project Series A (Utilities Revenue, Bank of Nova Scotia LOC) | | | 0.07 | | | | 11/01/2020 | | | | 10,000,000 | | | | 10,000,000 | |
Beaver County PA IDA Met Edison Company Project Series A (Utilities Revenue, Bank of Nova Scotia LOC) | | | 0.07 | | | | 07/15/2021 | | | | 10,000,000 | | | | 10,000,000 | |
Berks County PA Municipal Authority Reading Hospital & Education Center Project Series 2008A-1 (Hospital Revenue, Royal Bank of Canada LOC)†† | | | 0.08 | | | | 11/01/2011 | | | | 11,000,000 | | | | 11,000,000 | |
Chester County PA IDA Archdiocese (Miscellaneous Revenue, PNC Bank NA LOC) | | | 0.06 | | | | 07/01/2031 | | | | 6,675,000 | | | | 6,675,000 | |
Delaware County PA IDA United Parcel Service Project (IDR) | | | 0.22 | | | | 12/01/2015 | | | | 200,000 | | | | 200,000 | |
Emmaus PA General Authority (GO-Local, U.S. Bank NA LOC) | | | 0.08 | | | | 03/01/2024 | | | | 6,400,000 | | | | 6,400,000 | |
Emmaus PA General Authority Subseries D27 (Miscellaneous Revenue, U.S. Bank NA LOC, State Aid Withholding Insured) | | | 0.08 | | | | 03/01/2024 | | | | 1,500,000 | | | | 1,500,000 | |
Geisinger Authority PA Health System Series B (Health Revenue) | | | 0.18 | | | | 08/01/2022 | | | | 3,300,000 | | | | 3,300,000 | |
Geisinger Authority PA Health System Series C (Health Revenue) | | | 0.21 | | | | 08/01/2028 | | | | 7,260,000 | | | | 7,260,000 | |
Lehigh County PA General Purpose Authority St. Lukes Hospital Bethlehem PFOTER (Hospital Revenue) | | | 0.18 | | | | 08/15/2042 | | | | 15,640,000 | | | | 15,640,000 | |
Montgomery County PA IDA LaSalle College High School Series 2007-A (Education Revenue, PNC Bank NA LOC) | | | 0.14 | | | | 11/01/2037 | | | | 5,000,000 | | | | 5,000,000 | |
Montgomery County PA IDR Series 3238 (Hospital Revenue, FHA Insured)†† | | | 0.11 | | | | 08/01/2030 | | | | 4,700,000 | | | | 4,700,000 | |
Montgomery County PA Lower Merion School District GO Series 2009-A (Tax Revenue, State Street Bank & Trust Company LOC, State Aid Withholding Insured) | | | 0.06 | | | | 04/01/2027 | | | | 4,100,000 | | | | 4,100,000 | |
Montgomery County PA IDA ROC R II R-11856 (Hospital Revenue, FHA Insured)†† | | | 0.12 | | | | 02/01/2018 | | | | 10,425,000 | | | | 10,425,000 | |
Pennsylvania HEFA Association of Independent Colleges & University of Pennsylvania Finance Program University of Scranton Project Series 1999-E3 (Education Revenue, PNC Bank NA LOC) | | | 0.08 | | | | 11/01/2014 | | | | 5,000,000 | | | | 5,000,000 | |
Pennsylvania Housing Finance 4653 (Housing Revenue)†† | | | 0.11 | | | | 10/01/2039 | | | | 9,900,000 | | | | 9,900,000 | |
Pennsylvania State University Project Series B (Education Revenue) | | | 0.30 | | | | 06/01/2031 | | | | 6,450,000 | | | | 6,450,000 | |
Pennsylvania Turnpike Commission ROC RR II R-12259 (Tax Revenue, BHAC-CR AMBAC Insured)†† | | | 0.12 | | | | 10/01/2013 | | | | 12,850,000 | | | | 12,850,000 | |
RBC Municipal Products Incorporated Trust Series E-22 (Miscellaneous Revenue, Royal Bank of Canada LOC)†† | | | 0.08 | | | | 12/01/2038 | | | | 17,000,000 | | | | 17,000,000 | |
Southeastern PA Transportation Authority (Tax Revenue, PNC Bank NA LOC) | | | 0.17 | | | | 03/01/2022 | | | | 18,940,000 | | | | 18,940,000 | |
Westmoreland County PA Excella Health Project Series B (Hospital Revenue, PNC Bank NA LOC) | | | 0.08 | | | | 07/01/2030 | | | | 5,300,000 | | | | 5,300,000 | |
| | | | |
| | | | | | | | | | | | | | | 187,250,000 | |
| | | | | | | | | | | | | | | | |
| | | | |
Puerto Rico: 3.00% | | | | | | | | | | | | | | | | |
| | | | |
| Variable Rate Demand Notes§: 3.00% | | | | | | | | | | | | | | | | |
JPMorgan Chase PUTTER/DRIVER Trust Series 3920 (Miscellaneous Revenue, JPMorgan Chase Bank LOC)†† | | | 0.21 | | | | 05/01/2013 | | | | 27,750,000 | | | | 27,750,000 | |
Puerto Rico Commonwealth Aqueduct & Sewer Authority Floaters Series 2601 (Water & Sewer Revenue, Assured Guaranty Insured) | | | 0.13 | | | | 07/01/2047 | | | | 9,000,000 | | | | 9,000,000 | |
Puerto Rico Commonwealth Highway & Transportation Authority Series A (Tax Revenue, Scotia Bank LOC) | | | 0.04 | | | | 07/01/2028 | | | | 7,395,000 | | | | 7,395,000 | |
Puerto Rico Commonwealth Public Improvement C-5-2 (Miscellaneous Revenue, Barclays Bank LOC)± | | | 0.14 | | | | 07/01/2020 | | | | 13,300,000 | | | | 13,300,000 | |
| | | | | | |
| Portfolio of Investments—July 31, 2011 (Unaudited) | | Wells Fargo Advantage National Tax-Free Money Market Fund | | | 23 | |
| | | | | | | | | | | | | | | | |
| Security Name | | Interest Rate | | | Maturity Date | | | Principal | | | Value | |
| | | | | | | | | | | | | | | | |
| | | | |
| Variable Rate Demand Notes§ (continued) | | | | | | | | | | | | | | | | |
Puerto Rico HFA Series 2984 (Housing Revenue, HUD Loan Insured) | | | 0.12 | % | | | 06/01/2012 | | | $ | 2,400,000 | | | $ | 2,400,000 | |
Puerto Rico Sales Tax Finance Corporation ROC RR II R-11851 (Tax Revenue, BHAC-CR FGIC Insured)†† | | | 0.11 | | | | 02/01/2016 | | | | 7,500,000 | | | | 7,500,000 | |
Puerto Rico Sales Tax Financing Corporation ROC RR II R-11760 (Tax Revenue, Citibank NA Insured)†† | | | 0.11 | | | | 12/01/2047 | | | | 2,200,000 | | | | 2,200,000 | |
Puerto Rico Sales Tax Financing Corporation Series 11829 (Tax Revenue, AGM Insured)†† | | | 0.20 | | | | 02/01/2034 | | | | 3,100,000 | | | | 3,100,000 | |
Puerto Rico Sales Tax Financing Corporation Series 3036 (Tax Revenue) | | | 0.13 | | | | 08/01/2057 | | | | 66,100,000 | | | | 66,100,000 | |
| | | | |
| | | | | | | | | | | | | | | 138,745,000 | |
| | | | | | | | | | | | | | | | |
| | | | |
South Carolina: 0.91% | | | | | | | | | | | | | | | | |
| | | | |
| Variable Rate Demand Notes§: 0.91% | | | | | | | | | | | | | | | | |
Eclipse Funding Trust 2007-0009-Solar Eclipse South (Transportation Revenue, U.S. Bank NA LOC) | | | 0.07 | | | | 10/01/2032 | | | | 25,055,000 | | | | 25,055,000 | |
Piedmont Municipal Power Agency Series C (Utilities Revenue, TD Bank NA LOC) | | | 0.04 | | | | 01/01/2034 | | | | 5,000,000 | | | | 5,000,000 | |
South Carolina Housing Finance & Development Authority MFHR Brookside Crossing Apartments Series 2008 (Housing Revenue, FHLMC Insured) | | | 0.09 | | | | 06/01/2046 | | | | 4,900,000 | | | | 4,900,000 | |
South Carolina Jobs EDA Columbia Jewish Community Center (Miscellaneous Revenue, Wells Fargo Bank NA LOC)(q) | | | 0.20 | | | | 12/01/2024 | | | | 2,620,000 | | | | 2,620,000 | |
South Carolina Jobs EDA Institutional Business & Home Project (IDR, Branch Banking & Trust LOC) | | | 0.08 | | | | 11/01/2034 | | | | 4,500,000 | | | | 4,500,000 | |
| | | | |
| | | | | | | | | | | | | | | 42,075,000 | |
| | | | | | | | | | | | | | | | |
| | | | |
South Dakota: 0.41% | | | | | | | | | | | | | | | | |
| | | | |
| Variable Rate Demand Notes§: 0.41% | | | | | | | | | | | | | | | | |
South Dakota Housing Development Authority (Housing Revenue, FNMA Insured) | | | 0.10 | | | | 02/15/2031 | | | | 6,495,000 | | | | 6,495,000 | |
South Dakota State HEFA Regional Health (Hospital Revenue, U.S. Bank NA LOC) | | | 0.33 | | | | 09/01/2027 | | | | 7,950,000 | | | | 7,950,000 | |
South Dakota State HEFA Sioux Valley Series B (Hospital Revenue, U.S. Bank NA LOC) | | | 0.09 | | | | 11/01/2034 | | | | 4,700,000 | | | | 4,700,000 | |
| | | | |
| | | | | | | | | | | | | | | 19,145,000 | |
| | | | | | | | | | | | | | | | |
| | | | |
Tennessee: 1.11% | | | | | | | | | | | | | | | | |
| | | | |
| Other Municipal Debt: 0.08% | | | | | | | | | | | | | | | | |
Sevier County TN Public Building Authority Public Projects Construction Notes Series B-3 (Miscellaneous Revenue) | | | 1.25 | | | | 05/01/2012 | | | | 3,500,000 | | | | 3,515,628 | |
| | | | | | | | | | | | | | | | |
| | | | |
| Variable Rate Demand Notes§: 1.03% | | | | | | | | | | | | | | | | |
Alcoa Maryville Blount County TN Industrial Development Board Series A (Miscellaneous Revenue, Branch Banking & Trust LOC) | | | 0.08 | | | | 06/01/2036 | | | | 820,000 | | | | 820,000 | |
Blount County TN Public Building Authority Local Government Public Import E1 Series A (GO-Local, Branch Banking & Trust LOC, County Guaranty Insured) | | | 0.08 | | | | 06/01/2037 | | | | 6,450,000 | | | | 6,450,000 | |
Clarksville TN Public Building Authority Metropolitan Government Nashville & Davidson (Miscellaneous Revenue, Bank of America NA LOC) | | | 0.24 | | | | 07/01/2026 | | | | 200,000 | | | | 200,000 | |
Clarksville TN Public Building Authority Metropolitan Government Nashville & Davidson County HEFA Lipscomb University Project (Education Revenue, FHLB LOC) | | | 0.07 | | | | 11/01/2028 | | | | 12,950,000 | | | | 12,950,000 | |
| | | | |
| 24 | | Wells Fargo Advantage National Tax-Free Money Market Fund | | Portfolio of Investments—July 31, 2011 (Unaudited) |
| | | | | | | | | | | | | | | | |
| Security Name | | Interest Rate | | | Maturity Date | | | Principal | | | Value | |
| | | | | | | | | | | | | | | | |
| | | | |
| Variable Rate Demand Notes§ (continued) | | | | | | | | | | | | | | | | |
Tennessee Municipal Energy Acquisition Corporation (Utilities Revenue) | | | 0.17 | % | | | 12/01/2016 | | | $ | 27,190,000 | | | $ | 27,190,000 | |
| | | | |
| | | | | | | | | | | | | | | 47,610,000 | |
| | | | | | | | | | | | | | | | |
| | | | |
Texas: 10.74% | | | | | | | | | | | | | | | | |
| | | | |
| Other Municipal Debt: 0.04% | | | | | | | | | | | | | | | | |
Texas State TAN (Tax Revenue) | | | 2.00 | | | | 08/31/2011 | | | | 1,890,000 | | | | 1,892,554 | |
| | | | | | | | | | | | | | | | |
| | | | |
| Variable Rate Demand Notes§: 10.70% | | | | | | | | | | | | | | | | |
Bexar County TX Housing Finance Corporation Palisades Park Apartments Project (Housing Revenue, FHLMC Insured) | | | 0.15 | | | | 09/01/2039 | | | | 4,000,000 | | | | 4,000,000 | |
Bexar County TX Housing Finance Corporation Vista Meadows Fredricksburg Place Apartments Project Series 2006 (Housing Revenue, FHLMC Insured) | | | 0.15 | | | | 09/01/2036 | | | | 12,435,000 | | | | 12,435,000 | |
Brazos County TX Health Facilities Development Corporation Franciscan Services PUTTER MT-636 (Hospital Revenue, NATL-RE Insured)†† | | | 0.16 | | | | 01/01/2028 | | | | 30,860,000 | | | | 30,860,000 | |
Clipper Tax-Exempt Certified Trust Series 2007-44 (Miscellaneous Revenue) | | | 0.13 | | | | 09/01/2014 | | | | 28,780,000 | | | | 28,780,000 | |
Dallam County TX Industrial Development Corporation (Miscellaneous Revenue, Bank of the West LOC) | | | 0.07 | | | | 08/01/2035 | | | | 5,000,000 | | | | 5,000,000 | |
Dallas TX Waterworks & Sewer System PUTTER (Water & Sewer Revenue) | | | 0.13 | | | | 10/01/2018 | | | | 15,000,000 | | | | 15,000,000 | |
Del Valle TX GO Independent School District Building PUTTER Series 1946 (GO-Local, PSF-GTD Insured) | | | 0.15 | | | | 08/15/2014 | | | | 6,140,000 | | | | 6,140,000 | |
Deutsche Bank Spears/Lifers Trust Goldman Sachs DB-597 (Tax Revenue, PSF-GTD Insured) | | | 0.08 | | | | 02/15/2028 | | | | 11,425,000 | | | | 11,425,000 | |
Dickinson TX Independent School District Series SGA 94 (GO-Local, PSF-GTD Insured) | | | 0.23 | | | | 02/15/2028 | | | | 10,600,000 | | | | 10,600,000 | |
Fort Bend TX Independent School District Series 2852 (GO-Local, PSF-GTD Insured)†† | | | 0.12 | | | | 02/15/2016 | | | | 1,800,000 | | | | 1,800,000 | |
Galveston County TX Housing Finance Corporation Village By The Sea Apartments Project (Housing Revenue, FNMA Insured) | | | 0.10 | | | | 02/15/2032 | | | | 5,090,000 | | | | 5,090,000 | |
Gregg County TX Health Facilities Development Corporation (Hospital Revenue, JPMorgan Chase Bank LOC, Radian Insured) | | | 0.33 | | | | 10/01/2029 | | | | 4,800,000 | | | | 4,800,000 | |
Harris County TX Industrial Development Corporation Solid Waste Disposal Deer Park Refining Project Series A (Solid Waste Revenue) | | | 0.24 | | | | 03/01/2023 | | | | 21,100,000 | | | | 21,100,000 | |
Houston TX Airport System Sub Lien Series B PUTTER DBE-526 (Airport Revenue, FGIC Insured) | | | 0.08 | | | | 07/01/2026 | | | | 9,320,000 | | | | 9,320,000 | |
Houston TX Utilities Systems Authority Series 2010-B (Water & Sewer Revenue, Royal Bank of Canada LOC)†† | | | 0.08 | | | | 05/15/2034 | | | | 20,100,000 | | | | 20,100,000 | |
Lovejoy TX Independent School District PUTTER DB-514 (GO-Local, PSF-GTD Insured) | | | 0.08 | | | | 02/15/2038 | | | | 3,270,000 | | | | 3,270,000 | |
Medina Valley TX Independent School District ROC RR II R-11969 (Tax Revenue, PSF-GTD Insured)†† | | | 0.11 | | | | 08/15/2015 | | | | 2,960,000 | | | | 2,960,000 | |
Northwest TX Independent School District ROC RR II-11539PB (Tax Revenue, PSF-GTD Insured) | | | 0.14 | | | | 02/15/2015 | | | | 5,555,000 | | | | 5,555,000 | |
Panhandle TX Regional Housing Finance Corporation Jason Avenue Residential Apartments (Housing Revenue, FHLMC LOC) | | | 0.09 | | | | 08/01/2041 | | | | 7,500,000 | | | | 7,500,000 | |
Port Arthur TX Navigation District Industrial Development Corporation (IDR) | | | 0.09 | | | | 06/01/2041 | | | | 45,000,000 | | | | 45,000,000 | |
Port Arthur TX Naval District Environmental Facilities Motiva Enterprises Project Series A (IDR) | | | 0.19 | | | | 04/01/2040 | | | | 43,375,000 | | | | 43,375,000 | |
Port Arthur TX Naval District Environmental Facilities Motiva Enterprises Project Series B (Resource Recovery Revenue) | | | 0.19 | | | | 12/01/2039 | | | | 5,950,000 | | | | 5,950,000 | |
Port Arthur TX Naval District Environmental Facilities Motiva Enterprises Project Series B (Resource Recovery Revenue) | | | 0.26 | | | | 12/01/2039 | | | | 15,700,000 | | | | 15,700,000 | |
| | | | | | |
| Portfolio of Investments—July 31, 2011 (Unaudited) | | Wells Fargo Advantage National Tax-Free Money Market Fund | | | 25 | |
| | | | | | | | | | | | | | | | |
| Security Name | | Interest Rate | | | Maturity Date | | | Principal | | | Value | |
| | | | | | | | | | | | | | | | |
| | | | |
| Variable Rate Demand Notes§ (continued) | | | | | | | | | | | | | | | | |
Port Arthur TX Naval District Environmental Facilities Motiva Enterprises Project Series C (Resource Recovery Revenue) | | | 0.26 | % | | | 12/01/2039 | | | $ | 10,600,000 | | | $ | 10,600,000 | |
Port Arthur TX Navigation District Environmental Facilities Motiva Enterprises Series B (IDR) | | | 0.19 | | | | 04/01/2040 | | | | 8,350,000 | | | | 8,350,000 | |
Port Arthur TX Navigation District of Jefferson County Multi Mode ATOFINA Chemicals, Incorporated Project (Miscellaneous Revenue) | | | 0.09 | | | | 04/01/2027 | | | | 2,000,000 | | | | 2,000,000 | |
Port Corpus Christi TX Solid Waste Disposal Flint Hills Resources Project Series B (Resource Recovery Revenue) | | | 0.12 | | | | 07/01/2029 | | | | 11,700,000 | | | | 11,700,000 | |
RBC Municipal Products Incorporate Trust Floater Certificates Series E-18 (Hospital Revenue, Royal Bank of Canada LOC)†† | | | 0.08 | | | | 06/01/2032 | | | | 17,395,000 | | | | 17,395,000 | |
San Antonio TX Electric & Gas Deutsche Bank Spears Trust Series 2007 (Utilities Revenue) | | | 0.08 | | | | 02/01/2032 | | | | 8,650,000 | | | | 8,650,000 | |
Texas Municipal Gas Acquisition & Supply Corporation Series 2848 (Utilities Revenue) | | | 0.13 | | | | 12/15/2026 | | | | 92,000,000 | | | | 92,000,000 | |
Texas Municipal Gas Acquisition & Supply Corporation Series 2849 (Utilities Revenue) | | | 0.13 | | | | 12/15/2026 | | | | 11,578,947 | | | | 11,578,947 | |
Texas State Department of Housing & Community Affairs Costa Ibiza Apartments (Housing Revenue, FHLMC Insured) | | | 0.09 | | | | 08/01/2041 | | | | 13,550,000 | | | | 13,550,000 | |
Tyler TX Health Facilities Development Corporation Mother Frances Hospital Series B (Hospital Revenue, Bank of America NA LOC) | | | 0.18 | | | | 07/01/2020 | | | | 2,800,000 | | | | 2,800,000 | |
| | | | |
| | | | | | | | | | | | | | | 494,383,947 | |
| | | | | | | | | | | | | | | | |
| | | | |
Utah: 0.72% | | | | | | | | | | | | | | | | |
| | | | |
| Variable Rate Demand Notes§: 0.72% | | | | | | | | | | | | | | | | |
PFOTER Series P-Floats-PPT-1008- CL-A (Housing Revenue, FHLMC Insured) | | | 0.11 | | | | 01/01/2032 | | | | 19,405,000 | | | | 19,405,000 | |
South Valley Sewer District ROC RR II R-11919 (Water & Sewer Revenue, BHAC Insured)†† | | | 0.11 | | | | 07/01/2016 | | | | 3,995,000 | | | | 3,995,000 | |
West Jordan UT Multifamily Housing Broadmoor Village Apartments (Housing Revenue, FHLMC Insured) | | | 0.10 | | | | 12/01/2034 | | | | 9,675,000 | | | | 9,675,000 | |
| | | | |
| | | | | | | | | | | | | | | 33,075,000 | |
| | | | | | | | | | | | | | | | |
| | | | |
Vermont: 0.73% | | | | | | | | | | | | | | | | |
| | | | |
| Variable Rate Demand Notes§: 0.73% | | | | | | | | | | | | | | | | |
Vermont Educational & Health Buildings Financing Agency Brattleboro Memorial Hospital Project A (Hospital Revenue, TD Bank NA LOC) | | | 0.24 | | | | 10/01/2028 | | | | 2,135,000 | | | | 2,135,000 | |
Vermont Educational & Health Buildings Financing Agency Landmark College Project Series A (Education Revenue, TD Bank NA LOC) | | | 0.24 | | | | 07/01/2033 | | | | 3,140,000 | | | | 3,140,000 | |
Vermont Educational & Health Buildings Financing Agency North County Hospital Project A (Health Revenue, TD Bank NA LOC) | | | 0.24 | | | | 10/01/2034 | | | | 10,295,000 | | | | 10,295,000 | |
Vermont Educational & Health Buildings Financing Agency Northeastern Vermont Regional Hospital Series A (Health Revenue, TD Bank NA LOC) | | | 0.24 | | | | 10/01/2029 | | | | 2,065,000 | | | | 2,065,000 | |
Vermont Educational & Health Buildings Financing Agency Various Norwich University Project (Education Revenue, TD Bank NA LOC) | | | 0.05 | | | | 09/01/2038 | | | | 16,005,000 | | | | 16,005,000 | |
| | | | |
| | | | | | | | | | | | | | | 33,640,000 | |
| | | | | | | | | | | | | | | | |
| | | | |
Virginia: 1.00% | | | | | | | | | | | | | | | | |
| | | | |
| Variable Rate Demand Notes§: 1.00% | | | | | | | | | | | | | | | | |
Arlington County VA IDA Refunding MFHR Woodbury Park Apartments Project Series 2005-A (Housing Revenue, FHLMC Insured) | | | 0.09 | | | | 03/01/2035 | | | | 800,000 | | | | 800,000 | |
Fairfax County VA IDA Inova Health Care (Hospital Revenue) | | | 0.20 | | | | 05/15/2039 | | | | 5,000,000 | | | | 5,000,000 | |
| | | | |
| 26 | | Wells Fargo Advantage National Tax-Free Money Market Fund | | Portfolio of Investments—July 31, 2011 (Unaudited) |
| | | | | | | | | | | | | | | | |
| Security Name | | Interest Rate | | | Maturity Date | | | Principal | | | Value | |
| | | | | | | | | | | | | | | | |
| | | | |
| Variable Rate Demand Notes§ (continued) | | | | | | | | | | | | | | | | |
Fauquier County VA IDA Highland School Project Series 2008 (Education Revenue, Branch Banking & Trust LOC) | | | 0.08 | % | | | 12/01/2033 | | | $ | 4,250,000 | | | $ | 4,250,000 | |
James City County VA IDA Chambrel Project (Housing Revenue, FNMA Insured) | | | 0.09 | | | | 11/15/2032 | | | | 12,715,000 | | | | 12,715,000 | |
Norfolk VA EDA Inova Health Systems (Health Revenue) | | | 0.20 | | | | 11/01/2034 | | | | 5,000,000 | | | | 5,000,000 | |
Virginia Commonwealth University Health System Authority Series A (Hospital Revenue, Branch Banking & Trust LOC) | | | 0.22 | | | | 07/01/2037 | | | | 110,000 | | | | 110,000 | |
Virginia Small Business Financing Authority Carilion Clinic Obligation Series B (Hospital Revenue, PNC Bank NA LOC) | | | 0.17 | | | | 07/01/2042 | | | | 18,330,000 | | | | 18,330,000 | |
| | | | |
| | | | | | | | | | | | | | | 46,205,000 | |
| | | | | | | | | | | | | | | | |
| | | | |
Washington: 1.25% | | | | | | | | | | | | | | | | |
| | | | |
| Variable Rate Demand Notes§: 1.25% | | | | | | | | | | | | | | | | |
Bellevue WA ROC RR 11 R-12315 (GO-Local, AGM-CR NATL-RE Insured)†† | | | 0.11 | | | | 12/01/2013 | | | | 7,870,000 | | | | 7,870,000 | |
King City WA Public Hospital District #1 (Hospital Revenue, Assured Guaranty Insured) | | | 0.20 | | | | 12/01/2015 | | | | 6,930,000 | | | | 6,930,000 | |
King County WA Sewer Series 3090 (Water & Sewer Revenue, FSA Insured)†† | | | 0.08 | | | | 01/01/2039 | | | | 12,000,000 | | | | 12,000,000 | |
Seattle WA Water & Sewer Systems Eclipse Funding Trust Series 2006-0002 (Water & Sewer Revenue, U.S. Bank NA LOC) | | | 0.07 | | | | 09/01/2029 | | | | 9,685,000 | | | | 9,685,000 | |
Washington State HEFAR University Puget Sound Project A Puttable (Education Revenue, Bank of America NA LOC) | | | 0.11 | | | | 10/01/2030 | | | | 6,505,000 | | | | 6,505,000 | |
Washington State Housing Finance Commission (Housing Revenue, FHLMC Insured) | | | 0.09 | | | | 07/01/2044 | | | | 3,250,000 | | | | 3,250,000 | |
Washington State ROC RR II R-12285 (GO-State, FSA-CR FGIC Insured)†† | | | 0.11 | | | | 01/01/2031 | | | | 11,625,000 | | | | 11,625,000 | |
| | | | |
| | | | | | | | | | | | | | | 57,865,000 | |
| | | | | | | | | | | | | | | | |
| | | | |
West Virginia: 0.66% | | | | | | | | | | | | | | | | |
| | | | |
| Variable Rate Demand Notes§: 0.66% | | | | | | | | | | | | | | | | |
Monongalia County WV Building Commission Series A (Health Revenue, JPMorgan Chase Bank LOC) | | | 0.12 | | | | 07/01/2040 | | | | 11,655,000 | | | | 11,655,000 | |
Weirton WV Municipal Hospital Building Commission Weirton Medical Center Incorporated (Hospital Revenue, PNC Bank NA LOC) | | | 0.08 | | | | 12/01/2031 | | | | 8,985,000 | | | | 8,985,000 | |
West Virginia State Hospital Finance Authority Cabell Hospital Series A (Hospital Revenue, Branch Banking & Trust LOC) | | | 0.08 | | | | 01/01/2034 | | | | 10,000,000 | | | | 10,000,000 | |
| | | | |
| | | | | | | | | | | | | | | 30,640,000 | |
| | | | | | | | | | | | | | | | |
| | | | |
Wisconsin: 2.87% | | | | | | | | | | | | | | | | |
| | | | |
| Other Municipal Debt: 0.30% | | | | | | | | | | | | | | | | |
Wisconsin State HEFA Series 08-A (Hospital Revenue) | | | 0.42 | | | | 09/01/2011 | | | | 7,000,000 | | | | 7,000,000 | |
Wisconsin State HEFA Series 08-B (Hospital Revenue) | | | 0.42 | | | | 09/01/2011 | | | | 7,000,000 | | | | 7,000,000 | |
| | | | |
| | | | | | | | | | | | | | | 14,000,000 | |
| | | | | | | | | | | | | | | | |
| | | | |
| Variable Rate Demand Notes§: 2.57% | | | | | | | | | | | | | | | | |
Appleton WI Recovery Zone Facilities Foremost Farms USA (Miscellaneous Revenue, CoBank ACB LOC) | | | 0.08 | | | | 05/01/2037 | | | | 4,000,000 | | | | 4,000,000 | |
Milwaukee WI RDA University of Wisconsin Kenilworth Project (Education Revenue, U.S. Bank NA LOC) | | | 0.08 | | | | 09/01/2040 | | | | 7,725,000 | | | | 7,725,000 | |
Wisconsin HEFA Ministry Healthcare Incorporated Project Series B (Health Revenue) | | | 0.07 | | | | 08/01/2022 | | | | 15,485,000 | | | | 15,485,000 | |
| | | | | | |
| Portfolio of Investments—July 31, 2011 (Unaudited) | | Wells Fargo Advantage National Tax-Free Money Market Fund | | | 27 | |
| | | | | | | | | | | | | | | | |
| Security Name | | Interest Rate | | | Maturity Date | | | Principal | | | Value | |
| | | | | | | | | | | | | | | | |
| | | | |
| Variable Rate Demand Notes§ (continued) | | | | | | | | | | | | | | | | |
Wisconsin HEFA ProHealth Care Incorporated Series A (Hospital Revenue, U.S. Bank NA LOC) | | | 0.33 | % | | | 08/01/2030 | | | $ | 5,875,000 | | | $ | 5,875,000 | |
Wisconsin HEFA St. Norbert College Incorporated (Education Revenue, JPMorgan Chase & Company LOC) | | | 0.09 | | | | 02/01/2038 | | | | 9,935,000 | | | | 9,935,000 | |
Wisconsin State HEFA Fort Healthcare Incorporated Series A (Hospital Revenue, JPMorgan Chase Bank LOC) | | | 0.33 | | | | 05/01/2037 | | | | 6,185,000 | | | | 6,185,000 | |
Wisconsin State HEFA Hess Memorial Hospital Incorporated (Hospital Revenue, U.S. Bank NA LOC) | | | 0.08 | | | | 05/01/2024 | | | | 11,390,000 | | | | 11,390,000 | |
Wisconsin State HEFA Meriter Retirement Services Series B (Health Revenue, U.S. Bank NA LOC) | | | 0.10 | | | | 03/01/2038 | | | | 6,150,000 | | | | 6,150,000 | |
Wisconsin State Series 1 PUTTER 2009-36 (GO-State) | | | 0.13 | | | | 05/01/2020 | | | | 26,755,000 | | | | 26,755,000 | |
Wisconsin State Series 1 PUTTER 2009-6 (GO-State) | | | 0.13 | | | | 05/01/2013 | | | | 25,000,000 | | | | 25,000,000 | |
| | | | |
| | | | | | | | | | | | | | | 118,500,000 | |
| | | | | | | | | | | | | | | | |
| | | | | | | | |
| Total Investments in Securities | | | | | | | | |
| (Cost $4,240,201,756)* | | | 91.80 | % | | | 4,240,201,756 | |
Other Assets and Liabilities, Net | | | 8.20 | | | | 378,525,471 | |
| | | | | | | | |
| Total Net Assets | | | 100.00 | % | | $ | 4,618,727,227 | |
| | | | | | | | |
| § | These securities are subject to a demand feature which reduces the effective maturity. |
| †† | Security that may be resold to “qualified institutional buyers” under Rule 144A or securities offered pursuant to Section 4(2) of the Securities Act of 1933, as amended. |
| (q) | Credit enhancement is provided by an affiliate. |
| * | Cost for federal income tax purposes is substantially the same as for financial reporting purposes. |
The accompanying notes are an integral part of these financial statements.
| | | | |
| 28 | | Wells Fargo Advantage National Tax-Free Money Market Fund | | Statement of Assets and Liabilities—July 31, 2011 (Unaudited) |
| | | | |
| | | | |
| |
Assets | | | | |
Investments in unaffiliated securities, at amortized cost | | $ | 4,240,201,756 | |
Cash | | | 260,079,224 | |
Receivable for investments sold | | | 117,155,067 | |
Receivable for Fund shares sold | | | 119,648 | |
Receivable for interest | | | 2,246,932 | |
Receivable from adviser | | | 914,612 | |
Prepaid expenses and other assets | | | 89,032 | |
| | | | |
Total assets | | | 4,620,806,271 | |
| | | | |
| |
Liabilities | | | | |
Dividends payable | | | 23,850 | |
Payable for Fund shares redeemed | | | 487,688 | |
Distribution fees payable | | | 135,705 | |
Due to other related parties | | | 730,051 | |
Shareholder report expenses payable | | | 146,043 | |
Custodian and accounting fees payable | | | 124,884 | |
Shareholder servicing fees payable | | | 402,014 | |
Accrued expenses and other liabilities | | | 28,809 | |
| | | | |
Total liabilities | | | 2,079,044 | |
| | | | |
Total net assets | | $ | 4,618,727,227 | |
| | | | |
| |
NET ASSETS CONSIST OF | | | | |
Paid-in capital | | $ | 4,618,478,420 | |
Undistributed net investment income | | | 18 | |
Accumulated net realized gains on investments | | | 248,789 | |
| | | | |
Total net assets | | $ | 4,618,727,227 | |
| | | | |
| |
COMPUTATION OF NET ASSET VALUE PER SHARE1 | | | | |
Net assets – Class A | | $ | 701,862,978 | |
Shares outstanding – Class A | | | 701,785,371 | |
Net asset value per share – Class A | | | $1.00 | |
Net assets – Administrator Class | | $ | 313,601,653 | |
Shares outstanding – Administrator Class | | | 313,569,572 | |
Net asset value per share – Administrator Class | | | $1.00 | |
Net assets – Institutional Class | | $ | 2,563,938,910 | |
Shares outstanding – Institutional Class | | | 2,563,667,189 | |
Net asset value per share – Institutional Class | | | $1.00 | |
Net assets – Service Class | | $ | 587,019,756 | |
Shares outstanding – Service Class | | | 586,960,898 | |
Net asset value per share – Service Class | | | $1.00 | |
Net assets – Sweep Class | | $ | 452,303,930 | |
Shares outstanding – Sweep Class | | | 452,287,830 | |
Net asset value per share – Sweep Class | | | $1.00 | |
| 1. | The Fund has an unlimited number of authorized shares. |
The accompanying notes are an integral part of these financial statements.
| | | | | | |
| Statement of Operations—Six Months Ended July 31, 2011 (Unaudited) | | Wells Fargo Advantage National Tax-Free Money Market Fund | | | 29 | |
| | | | |
| | | | |
| |
Investment income | | | | |
Interest | | $ | 5,355,007 | |
| | | | |
| |
Expenses | | | | |
Advisory fee | | | 2,385,112 | |
Administration fees | | | | |
Fund level | | | 1,190,014 | |
Class A | | | 937,845 | |
Administrator Class | | | 167,460 | |
Institutional Class | | | 1,122,702 | |
Service Class | | | 376,582 | |
Sweep Class | | | 163,160 | |
Shareholder servicing fees | | | | |
Class A | | | 1,002,220 | |
Administrator Class | | | 165,744 | |
Service Class | | | 777,698 | |
Sweep Class | | | 185,409 | |
Distribution fees | | | | |
Sweep Class | | | 259,572 | |
Custody and accounting fees | | | 123,250 | |
Professional fees | | | 17,882 | |
Registration fees | | | 10,356 | |
Shareholder report expenses | | | 28,778 | |
Trustees’ fees and expenses | | | 5,245 | |
Other fees and expenses | | | 57,089 | |
| | | | |
Total expenses | | | 8,976,118 | |
Less: Fee waivers and/or expense reimbursements | | | (4,478,904 | ) |
| | | | |
Net expenses | | | 4,497,214 | |
| | | | |
Net investment income | | | 857,793 | |
Net realized gains on investments | | | 209,641 | |
| | | | |
Net increase in net assets resulting from operations | | $ | 1,067,434 | |
| | | | |
The accompanying notes are an integral part of these financial statements.
| | | | |
| 30 | | Wells Fargo Advantage National Tax-Free Money Market Fund | | Statements of Changes in Net Assets |
| | | | | | | | | | | | | | | | | | | | | | | | |
| | | Six Months Ended July 31, 2011 (Unaudited) | | | Year Ended January 31, 20111 | | | Year Ended February 28, 2010 | |
| | | | | | |
Operations | | | | | | | | | | | | | | | | | | | | | | | | |
Net investment income | | | | | | $ | 857,793 | | | | | | | $ | 3,147,350 | | | | | | | $ | 9,561,850 | |
Net realized gains on investments | | | | | | | 209,641 | | | | | | | | 133,587 | | | | | | | | 329,201 | |
| | | | | | | | | | | | | | | | | | | | | | | | |
Net increase in net assets resulting from operations | | | | | | | 1,067,434 | | | | | | | | 3,280,937 | | | | | | | | 9,891,051 | |
| | | | | | | | | | | | | | | | | | | | | | | | |
| | | | | | |
Distributions to shareholders from | | | | | | | | | | | | | | | | | | | | | | | | |
Net investment income | | | | | | | | | | | | | | | | | | | | | | | | |
Class A | | | | | | | (42,627 | ) | | | | | | | (89,245 | ) | | | | | | | (556,154 | ) |
Administrator Class | | | | | | | (16,965 | ) | | | | | | | (135,401 | ) | | | | | | | (910,229 | ) |
Institutional Class | | | | | | | (759,405 | ) | | | | | | | (2,832,178 | ) | | | | | | | (6,501,763 | ) |
Service Class | | | | | | | (31,380 | ) | | | | | | | (90,345 | ) | | | | | | | (1,593,687 | ) |
Sweep Class | | | | | | | (7,416 | ) | | | | | | | (178 | )2 | | | | | | | NA | |
Net realized gains | | | | | | | | | | | | | | | | | | | | | | | | |
Class A | | | | | | | 0 | | | | | | | | (22,813 | ) | | | | | | | (84,941 | ) |
Administrator Class | | | | | | | 0 | | | | | | | | (8,587 | ) | | | | | | | (38,014 | ) |
Institutional Class | | | | | | | 0 | | | | | | | | (65,322 | ) | | | | | | | (169,665 | ) |
Service Class | | | | | | | 0 | | | | | | | | (21,744 | ) | | | | | | | (90,859 | ) |
Sweep Class | | | | | | | 0 | | | | | | | | (262 | )2 | | | | | | | NA | |
| | | | | | | | | | | | | | | | | | | | | | | | |
Total distributions to shareholders | | | | | | | (857,793 | ) | | | | | | | (3,266,075 | ) | | | | | | | (9,945,312 | ) |
| | | | | | | | | | | | | | | | | | | | | | | | |
| | | | | | |
| | | Shares | | | | | | Shares | | | | | | Shares | | | | |
| | | | | | |
Capital share transactions | | | | | | | | | | | | | | | | | | | | | | | | |
Proceeds from shares sold | | | | | | | | | | | | | | | | | | | | | | | | |
Class A | | | 990,919,198 | | | | 990,919,198 | | | | 1,395,771,868 | | | | 1,395,771,868 | | | | 1,205,818,801 | | | | 1,205,818,801 | |
Administrator Class | | | 122,437,373 | | | | 122,437,373 | | | | 296,173,817 | | | | 296,173,817 | | | | 470,840,097 | | | | 470,840,097 | |
Institutional Class | | | 5,894,964,344 | | | | 5,894,964,344 | | | | 12,910,627,926 | | | | 12,910,627,926 | | | | 8,019,262,600 | | | | 8,019,262,600 | |
Service Class | | | 507,125,626 | | | | 507,125,626 | | | | 1,294,037,180 | | | | 1,294,037,180 | | | | 1,614,119,092 | | | | 1,614,119,092 | |
Sweep Class | | | 751,663,077 | | | | 751,663,077 | | | | 14,993,156 | 2 | | | 14,993,156 | 2 | | | NA | | | | NA | |
| | | | | | | | | | | | | | | | | | | | | | | | |
| | | | | | | 8,267,109,618 | | | | | | | | 15,911,603,947 | | | | | | | | 11,310,040,590 | |
| | | | | | | | | | | | | | | | | | | | | | | | |
Reinvestment of distributions | | | | | | | | | | | | | | | | | | | | | | | | |
Class A | | | 41,891 | | | | 41,891 | | | | 110,580 | | | | 110,580 | | | | 644,234 | | | | 644,234 | |
Administrator Class | | | 14,464 | | | | 14,464 | | | | 127,177 | | | | 127,177 | | | | 916,869 | | | | 916,869 | |
Institutional Class | | | 233,621 | | | | 233,621 | | | | 1,410,010 | | | | 1,410,010 | | | | 3,701,725 | | | | 3,701,725 | |
Service Class | | | 5,279 | | | | 5,279 | | | | 13,322 | | | | 13,322 | | | | 248,690 | | | | 248,690 | |
Sweep Class | | | 7,416 | | | | 7,416 | | | | 440 | 2 | | | 440 | 2 | | | NA | | | | NA | |
| | | | | | | | | | | | | | | | | | | | | | | | |
| | | | | | | 302,671 | | | | | | | | 1,661,529 | | | | | | | | 5,511,518 | |
| | | | | | | | | | | | | | | | | | | | | | | | |
Payment for shares redeemed | | | | | | | | | | | | | | | | | | | | | | | | |
Class A | | | (1,235,046,786 | ) | | | (1,235,046,786 | ) | | | (1,468,465,692 | ) | | | (1,468,465,692 | ) | | | (1,756,338,646 | ) | | | (1,756,338,646 | ) |
Administrator Class | | | (170,598,763 | ) | | | (170,598,763 | ) | | | (354,495,225 | ) | | | (354,495,225 | ) | | | (569,314,030 | ) | | | (569,314,030 | ) |
Institutional Class | | | (6,219,924,770 | ) | | | (6,219,924,770 | ) | | | (12,180,378,396 | ) | | | (12,180,378,396 | ) | | | (8,355,250,035 | ) | | | (8,355,250,035 | ) |
Service Class | | | (572,120,946 | ) | | | (572,120,946 | ) | | | (1,697,327,637 | ) | | | (1,697,327,637 | ) | | | (2,433,961,093 | ) | | | 2,433,961,093 | |
Sweep Class | | | (304,374,241 | ) | | | (304,374,241 | ) | | | (10,002,018 | )2 | | | (10,002,018 | )2 | | | NA | | | | NA | |
| | | | | | | | | | | | | | | | | | | | | | | | |
| | | | | | | (8,502,065,506 | ) | | | | | | | (15,710,668,968 | ) | | | | | | | (13,114,863,804 | ) |
| | | | | | | | | | | | | | | | | | | | | | | | |
Net asset value of shares issued in acquisition | | | | | | | | | | | | | | | | | | | | | | | | |
Institutional Class | | | 0 | | | | 0 | | | | 107,938,955 | | | | 107,942,643 | | | | 0 | | | | 0 | |
| | | | | | | | | | | | | | | | | | | | | | | | |
Net increase (decrease) in net assets resulting from capital share transactions | | | | | | | (234,653,217 | ) | | | | | | | 310,539,151 | | | | | | | | (1,799,311,696 | ) |
| | | | | | | | | | | | | | | | | | | | | | | | |
Total increase (decrease) in net assets | | | | | | | (234,443,576 | ) | | | | | | | 310,554,013 | | | | | | | | (1,799,365,957 | ) |
| | | | | | | | | | | | | | | | | | | | | | | | |
| | | | | | |
Net assets | | | | | | | | | | | | | | | | | | | | | | | | |
Beginning of period | | | | | | | 4,853,170,803 | | | | | | | | 4,542,616,790 | | | | | | | | 6,341,982,747 | |
| | | | | | | | | | | | | | | | | | | | | | | | |
End of period | | | | | | $ | 4,618,727,227 | | | | | | | $ | 4,853,170,803 | | | | | | | $ | 4,542,616,790 | |
| | | | | | | | | | | | | | | | | | | | | | | | |
Undistributed net investment income | | | | | | $ | 18 | | | | | | | $ | 18 | | | | | | | $ | 15 | |
| | | | | | | | | | | | | | | | | | | | | | | | |
| 1. | For the eleven months ended January 31, 2011. The Fund changed its fiscal year end from February 28 to January 31, effective January 31, 2011. |
| 2. | Class commenced operations on July 30, 2010. |
The accompanying notes are an integral part of these financial statements.
| | | | | | |
| Financial Highlights | | Wells Fargo Advantage National Tax-Free Money Market Fund | | | 31 | |
| | | | | | | | | | | | | | | | | | | | | | | | | | | | |
(For a share outstanding throughout each period) | | | | |
| | | |
| | | Six Months Ended
July 31, 2011
(Unaudited) | | | Year Ended
January 31,
20111 | | | Year Ended February 28, | |
| Class A | | | | 2010 | | | 2009 | | | 2008 | | | 2007 | | | 20062 | |
Net asset value, beginning of period | | $ | 1.00 | | | $ | 1.00 | | | $ | 1.00 | | | $ | 1.00 | | | $ | 1.00 | | | $ | 1.00 | | | $ | 1.00 | |
Net investment income | | | 0.00 | 3 | | | 0.00 | 3 | | | 0.00 | 3 | | | 0.01 | | | | 0.03 | | | | 0.03 | | | | 0.02 | |
Net realized gains on investments | | | 0.00 | 3 | | | 0.00 | 3 | | | 0.00 | | | | 0.00 | | | | 0.00 | | | | 0.00 | | | | 0.00 | |
| | | | | | | | | | | | | | | | | | | | | | | | | | | | |
Total from investment operations | | | 0.00 | 3 | | | 0.00 | 3 | | | 0.00 | 3 | | | 0.01 | | | | 0.03 | | | | 0.03 | | | | 0.02 | |
Distributions to shareholders from | | | | | | | | | | | | | | | | | | | | | | | | | | | | |
Net investment income | | | (0.00 | )3 | | | (0.00 | )3 | | | (0.00 | )3 | | | (0.01 | ) | | | (0.03 | ) | | | (0.03 | ) | | | (0.02 | ) |
Net realized gains | | | 0.00 | | | | (0.00 | )3 | | | (0.00 | )3 | | | 0.00 | | | | 0.00 | | | | 0.00 | | | | 0.00 | |
| | | | | | | | | | | | | | | | | | | | | | | | | | | | |
Total distributions to shareholders | | | (0.00 | )3 | | | (0.00 | )3 | | | (0.00 | )3 | | | (0.01 | ) | | | (0.03 | ) | | | (0.03 | ) | | | (0.02 | ) |
Net asset value, end of period | | $ | 1.00 | | | $ | 1.00 | | | $ | 1.00 | | | $ | 1.00 | | | $ | 1.00 | | | $ | 1.00 | | | $ | 1.00 | |
Total return4 | | | 0.00 | % | | | 0.01 | % | | | 0.05 | % | | | 1.32 | % | | | 2.91 | % | | | 2.92 | % | | | 1.89 | % |
Ratios to average net assets (annualized) | | | | | | | | | | | | | | | | | | | | | | | | | | | | |
Gross expenses | | | 0.62 | % | | | 0.61 | % | | | 0.67 | % | | | 0.67 | % | | | 0.65 | % | | | 0.65 | % | | | 0.66 | % |
Net expenses | | | 0.22 | % | | | 0.32 | % | | | 0.46 | % | | | 0.67 | % | | | 0.65 | % | | | 0.65 | % | | | 0.65 | % |
Net investment income | | | 0.01 | % | | | 0.01 | % | | | 0.05 | % | | | 1.27 | % | | | 2.86 | % | | | 2.89 | % | | | 2.07 | % |
Supplemental data | | | | | | | | | | | | | | | | | | | | | | | | | | | | |
Net assets, end of period (000’s omitted) | | | $701,863 | | | | $945,917 | | | | $1,018,470 | | | | $1,568,362 | | | | $1,562,483 | | | | $1,164,801 | | | | $1,001,084 | |
| 1. | For the eleven months ended January 31, 2011. The Fund changed its fiscal year end from February 28 to January 31, effective January 31, 2011. |
| 2. | For the eleven months ended February 28, 2006. The Fund changed its fiscal year end from March 31 to February 28, effective February 28, 2006. |
| 3. | Amount is less than $0.005. |
| 4. | Returns for periods of less than one year are not annualized. |
The accompanying notes are an integral part of these financial statements.
| | | | |
| 32 | | Wells Fargo Advantage National Tax-Free Money Market Fund | | Financial Highlights |
| | | | | | | | | | | | | | | | | | | | | | | | | | | | |
(For a share outstanding throughout each period) | | | | |
| | | |
| | | Six Months Ended
July 31, 2011
(Unaudited) | | | Year Ended
January 31,
20111 | | | Year Ended February 28, | |
| Administrator Class | | | | 2010 | | | 2009 | | | 2008 | | | 2007 | | | 20062 | |
Net asset value, beginning of period | | $ | 1.00 | | | $ | 1.00 | | | $ | 1.00 | | | $ | 1.00 | | | $ | 1.00 | | | $ | 1.00 | | | $ | 1.00 | |
Net investment income | | | 0.00 | 3 | | | 0.00 | 3 | | | 0.00 | 3 | | | 0.02 | | | | 0.03 | | | | 0.03 | | | | 0.02 | |
Net realized gains on investments | | | 0.00 | 3 | | | 0.00 | 3 | | | 0.00 | | | | 0.00 | | | | 0.00 | | | | 0.00 | | | | 0.00 | |
| | | | | | | | | | | | | | | | | | | | | | | | | | | | |
Total from investment operations | | | 0.00 | 3 | | | 0.00 | 3 | | | 0.00 | 3 | | | 0.02 | | | | 0.03 | | | | 0.03 | | | | 0.02 | |
Distributions to shareholders from | | | | | | | | | | | | | | | | | | | | | | | | | | | | |
Net investment income | | | (0.00 | )3 | | | (0.00 | )3 | | | (0.00 | )3 | | | (0.02 | ) | | | (0.03 | ) | | | (0.03 | ) | | | (0.02 | ) |
Net realized gains | | | 0.00 | | | | (0.00 | )3 | | | (0.00 | )3 | | | (0.00 | )3 | | | 0.00 | | | | 0.00 | | | | 0.00 | |
| | | | | | | | | | | | | | | | | | | | | | | | | | | | |
Total distributions to shareholders | | | (0.00 | )3 | | | (0.00 | )3 | | | (0.00 | )3 | | | (0.02 | ) | | | (0.03 | ) | | | (0.03 | ) | | | (0.02 | ) |
Net asset value, end of period | | $ | 1.00 | | | $ | 1.00 | | | $ | 1.00 | | | $ | 1.00 | | | $ | 1.00 | | | $ | 1.00 | | | $ | 1.00 | |
Total return4 | | | 0.01 | % | | | 0.04 | % | | | 0.18 | % | | | 1.68 | % | | | 3.27 | % | | | 3.28 | % | | | 2.21 | % |
Ratios to average net assets (annualized) | | | | | | | | | | | | | | | | | | | | | | | | | | | | |
Gross expenses | | | 0.36 | % | | | 0.36 | % | | | 040 | % | | | 0.40 | % | | | 0.38 | % | | | 0.38 | % | | | 0.39 | % |
Net expenses | | | 0.22 | % | | | 0.29 | % | | | 0.31 | % | | | 0.32 | % | | | 0.30 | % | | | 0.30 | % | | | 0.30 | % |
Net investment income | | | 0.01 | % | | | 0.04 | % | | | 0.18 | % | | | 1.63 | % | | | 3.24 | % | | | 3.23 | % | | | 2.39 | % |
Supplemental data | | | | | | | | | | | | | | | | | | | | | | | | | | | | |
Net assets, end of period (000’s omitted) | | | $313,602 | | | | $361,735 | | | | $419,954 | | | | $517,520 | | | | $517,666 | | | | $541,840 | | | | $561,788 | |
| 1. | For the eleven months ended January 31, 2011. The Fund changed its fiscal year end from February 28 to January 31, effective January 31, 2011. |
| 2. | For the eleven months ended February 28, 2006. The Fund changed its fiscal year end from March 31 to February 28, effective February 28, 2006. |
| 3. | Amount is less than $0.005. |
| 4. | Returns for periods of less than one year are not annualized. |
The accompanying notes are an integral part of these financial statements.
| | | | | | |
| Financial Highlights | | Wells Fargo Advantage National Tax-Free Money Market Fund | | | 33 | |
| | | | | | | | | | | | | | | | | | | | | | | | | | | | |
(For a share outstanding throughout each period) | | | | |
| | | |
| | | Six Months Ended
July 31, 2011
(Unaudited) | | | Year Ended
January 31,
20111 | | | Year Ended February 28, | |
| Institutional Class | | | | 2010 | | | 2009 | | | 2008 | | | 2007 | | | 20062 | |
Net asset value, beginning of period | | $ | 1.00 | | | $ | 1.00 | | | $ | 1.00 | | | $ | 1.00 | | | $ | 1.00 | | | $ | 1.00 | | | $ | 1.00 | |
Net investment income | | | 0.00 | 3 | | | 0.00 | 3 | | | 0.00 | 3 | | | 0.02 | | | | 0.03 | | | | 0.03 | | | | 0.02 | |
Net realized gains on investments | | | 0.00 | 3 | | | 0.00 | 3 | | | 0.00 | | | | 0.00 | | | | 0.00 | | | | 0.00 | | | | 0.00 | |
| | | | | | | | | | | | | | | | | | | | | | | | | | | | |
Total from investment operations | | | 0.00 | 3 | | | 0.00 | 3 | | | 0.00 | 3 | | | 0.02 | | | | 0.03 | | | | 0.03 | | | | 0.02 | |
Distributions to shareholders from | | | | | | | | | | | | | | | | | | | | | | | | | | | | |
Net investment income | | | (0.00 | )3 | | | (0.00 | )3 | | | (0.00 | )3 | | | (0.02 | ) | | | (0.03 | ) | | | (0.03 | ) | | | (0.02 | ) |
Net realized gains | | | 0.00 | | | | (0.00 | )3 | | | (0.00 | )3 | | | (0.00 | )3 | | | 0.00 | | | | 0.00 | | | | 0.00 | |
| | | | | | | | | | | | | | | | | | | | | | | | | | | | |
Total distributions to shareholders | | | (0.00 | )3 | | | (0.00 | )3 | | | (0.00 | )3 | | | (0.02 | ) | | | (0.03 | ) | | | (0.03 | ) | | | (0.02 | ) |
Net asset value, end of period | | $ | 1.00 | | | $ | 1.00 | | | $ | 1.00 | | | $ | 1.00 | | | $ | 1.00 | | | $ | 1.00 | | | $ | 1.00 | |
Total return4 | | | 0.03 | % | | | 0.12 | % | | | 0.27 | % | | | 1.78 | % | | | 3.37 | % | | | 3.39 | % | | | 2.31 | % |
Ratios to average net assets (annualized) | | | | | | | | | | | | | | | | | | | | | | | | | | | | |
Gross expenses | | | 0.24 | % | | | 0.25 | % | | | 0.29 | % | | | 0.28 | % | | | 0.26 | % | | | 0.26 | % | | | 0.27 | % |
Net expenses | | | 0.17 | % | | | 0.20 | % | | | 0.23 | % | | | 0.22 | % | | | 0.20 | % | | | 0.20 | % | | | 0.20 | % |
Net investment income | | | 0.05 | % | | | 0.13 | % | | | 0.28 | % | | | 1.77 | % | | | 3.31 | % | | | 3.35 | % | | | 2.46 | % |
Supplemental data | | | | | | | | | | | | | | | | | | | | | | | | | | | | |
Net assets, end of period (000’s omitted) | | | $2,563,939 | | | | $2,888,542 | | | | $2,048,774 | | | | $2,381,083 | | | | $1,403,838 | | | | $1,146,902 | | | | $700,534 | |
| 1. | For the eleven months ended January 31, 2011. The Fund changed its fiscal year end from February 28 to January 31, effective January 31, 2011. |
| 2. | For the eleven months ended February 28, 2006. The Fund changed its fiscal year end from March 31 to February 28, effective February 28, 2006. |
| 3. | Amount is less than $0.005. |
| 4. | Returns for periods of less than one year are not annualized. |
The accompanying notes are an integral part of these financial statements.
| | | | |
| 34 | | Wells Fargo Advantage National Tax-Free Money Market Fund | | Financial Highlights |
| | | | | | | | | | | | | | | | | | | | | | | | | | | | |
(For a share outstanding throughout each period) | | | | |
| | | |
| | | Six Months Ended
July 31, 2011
(Unaudited) | | | Year Ended
January 31,
20111 | | | Year Ended February 28, | |
| Service Class | | | | 2010 | | | 2009 | | | 2008 | | | 2007 | | | 20062 | |
Net asset value, beginning of period | | $ | 1.00 | | | $ | 1.00 | | | $ | 1.00 | | | $ | 1.00 | | | $ | 1.00 | | | $ | 1.00 | | | $ | 1.00 | |
Net investment income | | | 0.00 | 3 | | | 0.00 | 3 | | | 0.00 | 3 | | | 0.01 | | | | 0.03 | | | | 0.03 | | | | 0.02 | |
Net realized gains on investments | | | 0.00 | 3 | | | 0.00 | 3 | | | 0.00 | | | | 0.00 | | | | 0.00 | | | | 0.00 | | | | 0.00 | |
| | | | | | | | | | | | | | | | | | | | | | | | | | | | |
Total from investment operations | | | 0.00 | 3 | | | 0.00 | 3 | | | 0.00 | 3 | | | 0.01 | | | | 0.03 | | | | 0.03 | | | | 0.02 | |
Distributions to shareholders from | | | | | | | | | | | | | | | | | | | | | | | | | | | | |
Net investment income | | | (0.00 | )3 | | | (0.00 | )3 | | | (0.00 | )3 | | | (0.01 | ) | | | (0.03 | ) | | | (0.03 | ) | | | (0.02 | ) |
Net realized gains | | | 0.00 | | | | (0.00 | )3 | | | (0.00 | )3 | | | (0.00 | )3 | | | 0.00 | | | | 0.00 | | | | 0.00 | |
| | | | | | | | | | | | | | | | | | | | | | | | | | | | |
Total distributions to shareholders | | | (0.00 | )3 | | | (0.00 | )3 | | | (0.00 | )3 | | | (0.01 | ) | | | (0.03 | ) | | | (0.03 | ) | | | (0.02 | ) |
Net asset value, end of period | | $ | 1.00 | | | $ | 1.00 | | | $ | 1.00 | | | $ | 1.00 | | | $ | 1.00 | | | $ | 1.00 | | | $ | 1.00 | |
Total return4 | | | 0.00 | % | | | 0.01 | % | | | 0.10 | % | | | 1.52 | % | | | 3.12 | % | | | 3.13 | % | | | 2.08 | % |
Ratios to average net assets (annualized) | | | | | | | | | | | | | | | | | | | | | | | | | | | | |
Gross expenses | | | 0.53 | % | | | 0.53 | % | | | 0.58 | % | | | 0.57 | % | | | 0.55 | % | | | 0.55 | % | | | 0.56 | % |
Net expenses | | | 0.22 | % | | | 0.32 | % | | | 0.40 | % | | | 0.47 | % | | | 0.45 | % | | | 0.45 | % | | | 0.45 | % |
Net investment income | | | 0.01 | % | | | 0.01 | % | | | 0.12 | % | | | 1.47 | % | | | 3.07 | % | | | 3.09 | % | | | 2.23 | % |
Supplemental data | | | | | | | | | | | | | | | | | | | | | | | | | | | | |
Net assets, end of period (000’s omitted) | | | $587,020 | | | | $651,984 | | | | $1,055,420 | | | | $1,875,018 | | | | $1,674,047 | | | | $1,303,728 | | | | $1,160,594 | |
| 1. | For the eleven months ended January 31, 2011. The Fund changed its fiscal year end from February 28 to January 31, effective January 31, 2011. |
| 2. | For the eleven months ended February 28, 2006. The Fund changed its fiscal year end from March 31 to February 28, effective February 28, 2006. |
| 3. | Amount is less than $0.005. |
| 4. | Returns for periods of less than one year are not annualized. |
The accompanying notes are an integral part of these financial statements.
| | | | | | |
| Financial Highlights | | Wells Fargo Advantage National Tax-Free Money Market Fund | | | 35 | |
| | | | | | | | |
(For a share outstanding throughout each period) | | | | |
| | |
| Sweep Class | | Six Month Ended
July 31, 2011 (Unaudited) | | | Year Ended
January 31,
20111 | |
Net asset value, beginning of period | | $ | 1.00 | | | $ | 1.00 | |
Net investment income | | | 0.00 | 2 | | | 0.00 | 2 |
Net realized gains on investments | | | 0.00 | 2 | | | 0.00 | 2 |
| | | | | | | | |
Total from investment operations | | | 0.00 | 2 | | | 0.00 | 2 |
Distributions to shareholders from | | | | | | | | |
Net investment income | | | (0.00 | )2 | | | (0.00 | )2 |
Net realized gains | | | 0.00 | | | | (0.00 | )2 |
| | | | | | | | |
Total distributions to shareholders | | | (0.00 | )2 | | | (0.00 | )2 |
Net asset value, end of period | | $ | 1.00 | | | $ | 1.00 | |
Total return3 | | | 0.00 | % | | | 0.01 | % |
Ratios to average net assets (annualized) | | | | | | | | |
Gross expenses | | | 0.98 | % | | | 0.98 | % |
Net expenses | | | 0.13 | % | | | 0.32 | % |
Net investment income | | | 0.01 | % | | | 0.01 | % |
Supplemental data | | | | | | | | |
Net assets, end of period (000’s omitted) | | | $452,304 | | | | $4,992 | |
| 1. | For the period from July 30, 2010 (commencement of class operations) to January 31, 2011. |
| 2. | Amount is less than $0.005. |
| 3. | Returns for periods of less than one year are not annualized. |
The accompanying notes are an integral part of these financial statements.
| | | | |
| 36 | | Wells Fargo Advantage National Tax-Free Money Market Fund | | Notes to Financial Statements (Unaudited) |
1. ORGANIZATION
Wells Fargo Funds Trust (the “Trust”), a Delaware statutory trust organized on March 10, 1999, is an open-end management investment company registered under the Investment Company Act of 1940, as amended (the “1940 Act”). These financial statements report on Wells Fargo Advantage National Tax-Free Money Market Fund (the “Fund”) which is a diversified series of the Trust.
2. SIGNIFICANT ACCOUNTING POLICIES
The following significant accounting policies, which are consistently followed in the preparation of the financial statements of the Fund, are in conformity with U.S. generally accepted accounting principles which require management to make estimates and assumptions that affect the reported amounts of assets and liabilities, disclosure of contingent assets and liabilities at the date of the financial statements, and the reported amounts of revenues and expenses during the reporting period. Actual results could differ from those estimates.
Securities valuation
As permitted under Rule 2a-7 of the 1940 Act, securities are valued at amortized cost, which approximates fair value.
The valuation techniques used by the Fund to measure fair value are consistent with the market approach, income approach and/or cost approach, where applicable, for each security type.
Security transactions and income recognition
Securities transactions are recorded on a trade date basis. Realized gains or losses are reported on the basis of identified cost of securities delivered.
Interest income is accrued daily and bond discounts are accreted and premiums are amortized daily based on the effective interest method. To the extent debt obligations are placed on non-accrual status, any related interest income may be reduced by writing off interest receivables when the collection of all or a portion of interest has become doubtful based on consistently applied procedures. If the issuer subsequently resumes interest payments or when the collectability of interest is reasonably assured, the debt obligation is removed from non-accrual status.
Distributions to shareholders
Distributions to shareholders from net investment income are accrued daily and paid monthly. Distributions from net realized gains, if any, are recorded on the ex-dividend date. Such distributions are determined in conformity with income tax regulations, which may differ from generally accepted accounting principles.
Federal and other taxes
The Fund intends to continue to qualify as a regulated investment company by distributing substantially all of its investment company taxable and tax-exempt income and any net realized capital gains (after reduction for capital loss carryforwards) sufficient to relieve it from all, or substantially all, federal income taxes. Accordingly, no provision for federal income taxes was required.
The Fund’s income and federal excise tax returns and all financial records supporting those returns for the prior three fiscal years are subject to examination by the federal and Delaware revenue authorities.
Under the recently enacted Regulated Investment Company Modernization Act of 2010, the Fund will be permitted to carry forward capital losses incurred in taxable years beginning after December 22, 2010 for an unlimited period. However, any losses incurred during those future taxable years will be required to be utilized prior to the losses incurred in pre-enactment taxable years. As a result of this ordering rule, pre-enactment capital loss carryforwards may be more likely to expire unused. Additionally, post-enactment capital losses that are carried forward will retain their character as either short-term or long-term capital losses rather than being considered all short-term as under previous law.
Class allocations
The separate classes of shares offered by the Fund differ principally in distribution, shareholder servicing and administration fees. Shareholders of each class bear certain expenses that pertain to that particular class. All shareholders bear the common expenses of the Fund, earn income from the portfolio, and are allocated unrealized gains and losses pro rata based on the average daily net assets of each class, without distinction between share classes. Dividends are determined separately for each class based on income and expenses allocable to each class. Realized gains and losses are allocated to each class pro rata based upon the net assets of each class on the date realized. Differences in per share
| | | | | | |
| Notes to Financial Statements (Unaudited) | | Wells Fargo Advantage National Tax-Free Money Market Fund | | | 37 | |
dividend rates generally result from the relative weightings of pro rata income and realized gain allocations and from differences in separate class expenses, including distribution, shareholder servicing and administration fees.
3. FAIR VALUATION MEASUREMENTS
Fair value measurements of investments are determined within a framework that has established a fair value hierarchy based upon the various data inputs utilized in determining the value of the Fund’s investments. The three-level hierarchy gives the highest priority to unadjusted quoted prices in active markets for identical assets or liabilities (Level 1) and the lowest priority to unobservable inputs (Level 3). The Fund’s investments are classified within the fair value hierarchy based on the lowest level of input that is significant to the fair value measurement. The inputs are summarized into three broad levels as follows:
| n | | Level 1 – quoted prices in active markets for identical securities |
| n | | Level 2 – other significant observable inputs (including quoted prices for similar securities, interest rates, prepayment speeds, credit risk, etc.) |
| n | | Level 3 – significant unobservable inputs (including the Fund’s own assumptions in determining the fair value of investments) |
The inputs or methodologies used for valuing securities are not necessarily an indication of the risk associated with investing in those securities.
At July 31, 2011, all of the Fund’s investments in securities carried at fair value were designated as Level 2 since the primary inputs include credit quality of the issuer and short-term interest rates which are observable.
Further details on the major security types can be found in the Fund’s Portfolio of Investments.
4. TRANSACTIONS WITH AFFILIATES AND OTHER EXPENSES
Advisory fee
The Trust has entered into an advisory contract with Wells Fargo Funds Management, LLC (“Funds Management”), an indirect wholly owned subsidiary of Wells Fargo & Company (“Wells Fargo”). The adviser is responsible for implementing investment policies and guidelines and for supervising the sub-adviser, who is responsible for day-to-day portfolio management of the Fund.
Pursuant to the contract, Funds Management is entitled to receive an annual advisory fee of 0.10% of the average daily net assets of the Fund.
Funds Management may retain the services of certain sub-advisers to provide daily portfolio management to the Fund. The fees related to sub-advisory services are borne directly by the adviser and do not increase the overall fees paid by the Fund to the adviser. Wells Capital Management Incorporated, an affiliate of Funds Management, is the sub-adviser to the Fund and is entitled to receive a fee from the adviser at an annual rate starting at 0.05% and declining to 0.01% as the average daily net assets of the Fund increase.
Administration and transfer agent fees
The Trust has entered into an administration agreement with Funds Management. Under this agreement, for providing administrative services, which includes paying fees and expenses for services provided by the transfer agent, sub-transfer agents, omnibus account servicers and record-keepers, Funds Management is entitled to receive from the Fund an annual fund level administration fee starting at 0.05% and declining to 0.03% as the average daily net assets of the Fund increase and a class level administration fee which is calculated based on the average daily net assets of each class as follows:
| | | | |
| | | Class Level Administration Fee | |
Class A, Sweep Class | | | 0.22 | % |
Administrator Class | | | 0.10 | |
Institutional Class | | | 0.08 | |
Service Class | | | 0.12 | |
| | | | |
| 38 | | Wells Fargo Advantage National Tax-Free Money Market Fund | | Notes to Financial Statements (Unaudited) |
Funds Management has contractually waived and/or reimbursed advisory and administration fees to the extent necessary to maintain certain net operating expense ratios for the Fund. Waiver of fees and/or reimbursement of expenses by Funds Management were made first from fund level expenses on a proportionate basis and then from class specific expenses.
Distribution fees
The Trust has adopted a Distribution Plan for Sweep Class shares of the Fund pursuant to Rule 12b-1 under the 1940 Act. Distribution fees are charged to the Sweep Class shares and paid to Wells Fargo Funds Distributor, LLC, the principal underwriter, at an annual rate of 0.35% of the average daily net assets of Sweep Class.
Shareholder servicing
The Trust has entered into contracts with one or more shareholder servicing agents, whereby Class A, Service Class and Sweep Class of the Fund is charged a fee at an annual rate of 0.25% of the average daily net assets of each class. Administrator Class is charged a fee at an annual rate of 0.10% of its average daily net assets.
A portion of these total shareholder servicing fees were paid to affiliates of Wells Fargo.
5. ACQUISITION
After the close of business on November 5, 2010, the Fund acquired the net assets of Wells Fargo Advantage National Tax-Free Money Market Trust. The purpose of the transaction was to combine two funds with similar investment objectives and strategies. Existing shareholders of Wells Fargo Advantage National Tax-Free Money Market Trust received Institutional Class shares of the Fund in the reorganization. The acquisition was accomplished by a tax-free exchange of all of the shares of Wells Fargo Advantage National Tax-Free Money Market Trust for 107,938,955 shares of the Fund valued at $107,942,643 at an exchange ratio of 1.00 for Institutional Class shares. The investment portfolio of Wells Fargo Advantage National Tax-Free Money Market Trust with a fair value of $107,514,791 and amortized cost of $107,514,791 at November 5, 2010 were the principal assets acquired by the Fund. The aggregate net assets of Wells Fargo Advantage National Tax-Free Money Market Trust and the Fund immediately prior to the acquisition were $107,942,643 and $4,602,060,727, respectively. The aggregate net assets of the Fund immediately after the acquisition were $4,710,003,370. For financial reporting purposes, assets received and shares issued by the Fund were recorded at fair value; however, the cost basis of the investments received from Wells Fargo Advantage National Tax-Free Money Market Trust was carried forward to align ongoing reporting of the Fund’s realized and unrealized gains and losses with amounts distributable to shareholders for tax purposes.
Assuming the acquisition had been completed March 1, 2010, the beginning of the annual reporting period for the Fund, the pro forma results of operations for the period ended January 31, 2011 would have been:
| | | | |
Net investment income | | $ | 3,264,021 | |
Net realized and unrealized gains on investments | | $ | 131,645 | |
Net increase in net assets resulting from operations | | $ | 3,395,666 | |
6. INDEMNIFICATION
Under the Trust’s organizational documents, the officers and directors are indemnified against certain liabilities that may arise out of performance of their duties to the Trust. Additionally, in the normal course of business, the Trust may enter into contracts with service providers that contain a variety of indemnification clauses. The Trust’s maximum exposure under these arrangements is dependent on future claims that may be made against the Fund and, therefore, cannot be estimated.
7. NEW ACCOUNTING PRONOUNCEMENTS
In May 2011, the Financial Accounting Standards Board (“FASB”) issued Accounting Standards Update (“ASU”) No. 2011-04 “Amendments to Achieve Common Fair Value Measurement and Disclosure Requirements in U.S. GAAP and IFRSs”. ASU No. 2011-04 amends FASB ASC Topic 820, Fair Value Measurements and Disclosures, to establish common requirements for measuring fair value and for disclosing information about fair value measurements in accordance with GAAP. The ASU is effective prospectively for interim and annual periods beginning after December 15, 2011.
| | | | | | |
| Notes to Financial Statements (Unaudited) | | Wells Fargo Advantage National Tax-Free Money Market Fund | | | 39 | |
In April 2011, FASB issued ASU No. 2011-03 “Reconsideration of Effective Control for Repurchase Agreements”. ASU No. 2011-03 amends FASB ASC Topic 860, Transfers and Servicing, specifically the criteria required to determine whether a repurchase agreement (repo) and similar agreements should be accounted for as sales of financial assets or secured borrowings with commitments. ASU No. 2011-03 changes the assessment of effective control by focusing on the transferor’s contractual rights and obligations and removing the criterion to assess its ability to exercise those rights or honor those obligations. This could result in changes to the way entities account for certain transactions including repurchase agreements, mortgage dollar rolls and reverse repurchase agreements. The ASU will become effective on a prospective basis for new transfers and modifications to existing transactions as of the beginning of the first interim or annual period beginning on or after December 15, 2011.
As of July 31, 2011, management of the Fund is currently assessing the potential impact, in addition to expanded financial statement disclosure, that may result from adopting these ASUs.
| | | | |
| 40 | | Wells Fargo Advantage National Tax-Free Money Market Fund | | Other Information (Unaudited) |
PORTFOLIO HOLDINGS INFORMATION
The complete portfolio holdings for the Fund are publicly available on the Fund’s Web site
(www.wellsfargo.com/advantagefunds) on a monthly, seven-day delayed basis. The Fund files its complete schedule of portfolio holdings with the SEC for the first and third quarters of each fiscal year on Form N-Q, which is available without charge by visiting the SEC Web site at www.sec.gov. In addition, the Fund’s Form N-Q may be reviewed and copied at the SEC’s Public Reference Room in Washington, DC, and at regional offices in New York City, at 233 Broadway, and in Chicago, at 175 West Jackson Boulevard, Suite 900. Information about the Public Reference Room may be obtained by calling 1-800-SEC-0330.
PROXY VOTING INFORMATION
A description of the policies and procedures that the Fund uses to determine how to vote proxies relating to portfolio securities is available without charge, upon request, by calling 1-800-222-8222, visiting our Web site at www.wellsfargo.com/advantagefunds, or visiting the SEC Web site at www.sec.gov. Information regarding how the Fund voted proxies relating to portfolio securities during the most recent 12-month period ended June 30 is available without charge on the Fund’s Web site at www.wellsfargo.com/advantagefunds or by visiting the SEC Web site at www.sec.gov.
| | | | | | |
| Other Information (Unaudited) | | Wells Fargo Advantage National Tax-Free Money Market Fund | | | 41 | |
BOARD OF TRUSTEES
The following table provides basic information about the Board of Trustees (the “Trustees”) of the Trust and Officers of the Trust. This table should be read in conjunction with the Prospectus and the Statement of Additional Information1 of the Fund. Each of the Trustees and Officers listed below acts in identical capacities for the Wells Fargo Advantage family of funds, which consists of 144 funds comprising the Wells Fargo Funds Trust, Wells Fargo Variable Trust, Wells Fargo Master Trust and four closed-end funds (collectively the “Fund Complex”). All of the Trustees are also Members of the Audit and Governance Committees of each Trust in the Fund Complex. The mailing address of each Trustee and Officer is 525 Market Street, 12th Floor, San Francisco, CA 94105. Each Trustee and Officer serves an indefinite term, however, each Trustee serves such term until reaching the mandatory retirement age established by the Trustees.
Independent Trustees
| | | | | | |
Name and Year of Birth | | Position Held and Length of Service | | Principal Occupations During Past Five Years | | Other Directorships During
Past Five Years |
Peter G. Gordon
(Born 1942) | | Trustee, since 1998; Chairman, since 2005 | | Co-Founder, Chairman, President and CEO of Crystal Geyser. Water Company. Trustee Emeritus, Colby College | | Asset Allocation Trust |
Isaiah Harris, Jr.
(Born 1952) | | Trustee, since 2009 | | Retired. Prior thereto, President and CEO of BellSouth Advertising and Publishing Corp. from 2005 to 2007, President and CEO of BellSouth Enterprises from 2004 to 2005 and President of BellSouth Consumer Services from 2000 to 2003. Emeritus member of the Iowa State University Foundation Board of Governors. Emeritus Member of the Advisory Board of Iowa State University School of Business. Mr. Harris is a certified public accountant. | | CIGNA Corporation; Deluxe Corporation; Asset Allocation Trust |
Judith M. Johnson
(Born 1949) | | Trustee, since 2008 | | Retired. Prior thereto, Chief Executive Officer and Chief Investment Officer of Minneapolis Employees Retirement Fund from 1996 to 2008. Ms. Johnson is an attorney, certified public accountant and a certified managerial accountant. | | Asset Allocation Trust |
Leroy Keith, Jr.
(Born 1939) | | Trustee, since 2010 | | Chairman, Bloc Global Services (development and construction), Trustee of the Evergreen Funds from 1983 to 2010. Former Managing Director, Almanac Capital Management (commodities firm), former Partner, Stonington Partners, Inc. (private equity fund), former Director, Obagi Medical Products Co. and former Director, Lincoln Educational Services. | | Trustee, Virtus Fund Complex (consisting of 45 portfolios as of 12/31/10); Director, Diversapack Co. (packaging company); Asset Allocation Trust |
David F. Larcker
(Born 1950) | | Trustee, since 2009 | | James Irvin Miller Professor of Accounting at the Graduate School of Business, Stanford University, Director of Corporate Governance Research Program and Co-Director of The Rock Center for Corporate Governance since 2006. From 2005 to 2008, Professor of Accounting at the Graduate School of Business, Stanford University. Prior thereto, Ernst & Young Professor of Accounting at The Wharton School, University of Pennsylvania from 1985 to 2005. | | Asset Allocation Trust |
Olivia S. Mitchell
(Born 1953) | | Trustee, since 2006 | | International Foundation of Employee Benefit Plans Professor and Chair of the Department of Insurance and Risk Management, Wharton School of the University of Pennsylvania since 1993. Director of Wharton’s Pension Research Council and Boettner Center on Pensions & Retirement Research, and Research Associate at the National Bureau of Economic Research. Previously, Cornell University Professor from 1978 to 1993. | | Asset Allocation Trust |
| | | | |
| 42 | | Wells Fargo Advantage National Tax-Free Money Market Fund | | Other Information (Unaudited) |
| | | | | | |
Name and Year of Birth | | Position Held and Length of Service | | Principal Occupations During Past Five Years | | Other Directorships During
Past Five Years |
Timothy J. Penny
(Born 1951) | | Trustee, since 1996 | | President and CEO of Southern Minnesota Initiative Foundation, a non-profit organization, since 2007 and Senior Fellow at the Humphrey Institute Policy Forum at the University of Minnesota since 1995. Member of the Board of Trustees of NorthStar Education Finance, Inc., a non-profit organization, since 2007. | | Asset Allocation Trust |
Michael S. Scofield
(Born 1943) | | Trustee, since 2010 | | Currently serves on the Investment Company Institute’s Board of Governors and Executive Committee as well the In dependent Director’s Counsel Board of Governors and Executive Committee. Former Chairman of the Independent Directors Counsel. Trustee of the Evergreen Funds from 1984 to 2010. Retired Attorney, Law Offices of Michael S. Scofield and former Director and Chairman, Branded Media Corporation (multi-media branding company). | | Asset Allocation Trust |
Donald C. Willeke
(Born 1940) | | Trustee, since 1996 | | Principal of the law firm of Willeke & Daniels. General Counsel of the Minneapolis Employees Retirement Fund from 1984 until its consolidation into the Minnesota Public Employees Retirement Association on June 30, 2010. | | Asset Allocation Trust |
Officers
| | | | | | |
Name and Year of Birth | | Position Held and
Length of Service | | Principal Occupations During Past Five Years | | |
Karla M. Rabusch
(Born 1959) | | President, since 2003 | | Executive Vice President of Wells Fargo Bank, N.A. and President of Wells Fargo Funds Management, LLC since 2003. Senior Vice President and Chief Administrative Officer of Wells Fargo Funds Management, LLC from 2001 to 2003. | | |
C. David Messman
(Born 1960) | | Secretary, since 2000; Chief Legal Counsel, since 2003 | | Senior Vice President and Secretary of Wells Fargo Funds Management, LLC since 2001. Vice President and Managing Counsel of Wells Fargo Bank, N.A. since 1996. | | |
Kasey Phillips
(Born 1970) | | Treasurer, since 2008 | | Senior Vice President of Wells Fargo Funds Management, LLC since 2009. Senior Vice President of Evergreen Investment Management Company, LLC from 2006 to 2010. Treasurer of the Evergreen Funds from 2005 to 2010. Vice President and Assistant Vice President of Evergreen Investment Services, Inc. from 1999 to 2006. | | |
David Berardi
(Born 1975) | | Assistant Treasurer, since 2009 | | Vice President of Wells Fargo Funds Management, LLC since 2009 . Vice President of Evergreen Investment Management Company, LLC from 2008 to 2010. Assistant Vice President of Evergreen Investment Services, Inc. from 2004 to 2008. Manager of Fund Reporting and Control for Evergreen Investment Management Company, LLC from 2004 to 2010. | | |
Jeremy DePalma
(Born 1974) | | Assistant Treasurer, since 2009 | | Senior Vice President of Wells Fargo Funds Management, LLC since 2009. Senior Vice President of Evergreen Investment Management Company, LLC from 2008 to 2010. Vice President, Evergreen Investment Services, Inc. from 2004 to 2007. Assistant Vice President, Evergreen Investment Services, Inc. from 2000 to 2004 and the head of the Fund Reporting and Control Team within Fund Administration from 2005 to 2010. | | |
Debra Ann Early
(Born 1964) | | Chief Compliance Officer, since 2007 | | Chief Compliance Officer of Wells Fargo Funds Management, LLC since 2007. Chief Compliance Officer of Parnassus Investments from 2005 to 2007. Chief Financial Officer of Parnassus Investments from 2004 to 2007 and Senior Audit Manager of PricewaterhouseCoopers LLP from 1998 to 2004. | | |
| 1. | The Statement of Additional Information includes additional information about the Fund’s Trustees and is available, without charge, upon request, by calling 1-800-222-8222 or by visiting the Fund’s Web site at www.wellsfargo.com/advantagefunds. |
| | | | | | |
| Other Information (Unaudited) | | Wells Fargo Advantage National Tax-Free Money Market Fund | | | 43 | |
BOARD CONSIDERATION OF INVESTMENT ADVISORY AND SUB-ADVISORY AGREEMENTS:
California Municipal Money Market Fund, Municipal Cash Management Money Market Fund, Municipal Money Market Fund, National Tax-Free Money Market Fund, New Jersey Municipal Money Market Fund, New York Municipal Money Market Fund and Pennsylvania Municipal Money Market Fund
(Not all of the funds described in this Board considerations section are part of this shareholder report. This shareholder report only relates to National Tax-Free Money Market Fund.)
Each year, as required by Section 15 of the Investment Company Act of 1940 (the “1940 Act”), the Board of Trustees (the “Board”) of Wells Fargo Funds Trust (the “Trust”), all the members of which have no direct or indirect interest in the investment advisory and sub-advisory agreements and are not “interested persons” of the Trust, as defined in the 1940 Act (the “Independent Trustees”), determines whether to approve the continuation of the Trust’s investment advisory and sub-advisory agreements. In this regard, at an in person meeting held on March 24-25, 2011 (the “Meeting”), the Board reviewed and re-approved: (i) an investment advisory agreement with Wells Fargo Funds Management, LLC (“Funds Management”) for each of the California Municipal Money Market Fund, Municipal Cash Management Money Market Fund, Municipal Money Market Fund, National Tax-Free Money Market Fund, New Jersey Municipal Money Market Fund, New York Municipal Money Market Fund and Pennsylvania Municipal Money Market Fund (collectively, the “Funds”); and (ii) an investment sub-advisory agreement with Wells Capital Management Incorporated (“Wells Capital Management”) for each of the Funds. The investment advisory agreements with Funds Management and the investment sub-advisory agreements with Wells Capital Management are collectively referred to as the “Advisory Agreements.”
At the Meeting, the Board considered the factors and reached the conclusions described below relating to the selection of Funds Management and Wells Capital Management and continuation of the Advisory Agreements. Prior to the Meeting, the Trustees conferred extensively among themselves and with representatives of Funds Management about these matters. The Board also met throughout the year and received information that was useful to them in considering the continuation of the Advisory Agreements. The Independent Trustees were assisted in their evaluation of the Advisory Agreements by independent legal counsel, from whom they received separate legal advice and with whom they met separately from Funds Management.
Nature, extent and quality of services
The Board received and considered various information regarding the nature, extent and quality of services provided to the Funds by Funds Management and Wells Capital Management under the Advisory Agreements. The Board also received and considered information provided in response to a detailed set of requests submitted by the Independent Trustees’ independent legal counsel on their behalf. The Board received and considered, among other things, information about the background and experience of senior management of Funds Management, and the qualifications, backgrounds, tenures and responsibilities of the portfolio managers primarily responsible for the day-to-day portfolio management of the Funds.
The Board evaluated the ability of Funds Management and Wells Capital Management, based on their respective financial condition, resources, reputation and other attributes, to attract and retain qualified investment professionals, including research, advisory, and supervisory personnel. The Board further considered the compliance programs and compliance records of Funds Management and Wells Capital Management. In addition, the Board took into account the administrative services provided to the Funds by Funds Management and its affiliates.
The Board’s decision to approve the continuation of the Advisory Agreements was based on a comprehensive evaluation of all of the information provided to it. In approving the continuation of the Advisory Agreements, the Board did not identify any particular information or consideration that was all-important or controlling, and each Trustee attributed different weights to various factors. The Board evaluated information provided to it both in terms of the funds generally and with respect to each Fund specifically as it considered appropriate. Although the Board considered the continuation of the Advisory Agreements for each of the Funds as part of the larger process of considering the continuation of the advisory agreements for all of the funds, its decision to continue the Advisory Agreements for each of the Funds was ultimately made on a fund-by-fund basis.
In considering these matters, the Board considered not only the specific information presented in connection with the Meeting, but also the knowledge gained over time through interaction with Funds Management and Wells Capital
| | | | |
| 44 | | Wells Fargo Advantage National Tax-Free Money Market Fund | | Other Information (Unaudited) |
Management about various topics, including Funds Management’s oversight of service providers. The above factors, together with those referenced below, are some of the most important, but not necessarily all, factors considered by the Board in concluding that it was satisfied with the nature, extent and quality of the investment advisory services provided to each Fund by Funds Management and Wells Capital Management.
Fund performance and expenses
The Board considered the performance results for each of the Funds over various time periods ended December 31, 2010. The Board also considered these results in comparison to the median performance of a universe of relevant funds (the “Universe”) that were determined by Lipper Inc. (“Lipper”) to be similar to the Funds, and in comparison to each Fund’s benchmark index and to other comparative data. Lipper is an independent provider of investment company data. The Board received a description of the methodology used by Lipper to select the mutual funds in the Universe.
The Board noted that the performance of each of the Funds was generally higher than or in range of the median performance of the Universe for the periods under review.
The Board received and considered information regarding each Fund’s contractual advisory fee and net operating expense ratios and their various components, including actual management fees (which reflect fee waivers, if any), transfer agent, custodian and other non-management fees, Rule 12b-1 and non-Rule 12b-1 fees, service fees and fee waiver and expense reimbursement arrangements. The Board also considered these ratios in comparison to the median ratios of an expense Universe and a narrower expense group of mutual funds (each, an “Expense Group”) that was determined by Lipper to be similar to each Fund. The Board received a description of the methodology used by Lipper to select the mutual funds in a Fund’s Expense Group. The Board noted that the net operating expense ratios of the Service Class, Administrator Class and Institutional Class of each of the Funds were in range of each Fund’s respective Expense Group’s median net operating expense ratio. The Board also noted that the net operating expense ratios of the Class A and Sweep Class of each of the Funds were higher than each Fund’s respective Expense Group’s median net operating expense ratio and that the net operating expense ratio of the Municipal Money Market Fund (Investor Class) was not appreciably higher than the Expense Group’s median net operating expense ratio.
Based on the above-referenced considerations and other factors, the Board concluded that the overall performance and expense structure of the Funds supported the re-approval of the Advisory Agreements for the Funds.
Investment advisory and sub-advisory fee rates
The Board reviewed and considered the contractual investment advisory fee rates that are payable by the Funds to Funds Management for investment advisory services (the “Advisory Agreement Rates”), both on a stand-alone basis and on a combined basis with the Funds’ administration fee rates. The Board took into account the separate administrative and other services covered by the administration fee rates. The Board also reviewed and considered the contractual investment sub-advisory fee rates that are payable by Funds Management to Wells Capital Management for investment sub-advisory services (the “Sub-Advisory Agreement Rates”). In addition, the Board reviewed and considered the existing fee waiver/cap arrangements applicable to the Advisory Agreement Rates and considered the Advisory Agreement Rates after taking the waivers/caps into account (the “Net Advisory Rates”).
The Board received and considered information comparing the Advisory Agreement Rates and Net Advisory Rates with those of other funds in each Fund’s Expense Group median. The Board noted that the Advisory Agreement Rates for each of the Funds were in range of the median rate of each Fund’s Expense Group, except for the Municipal Money Market Fund and the New York Municipal Money Market Fund (Sweep Class). The Board noted that the Net Advisory Rates for the Service Class, Administrator Class and the Institutional Class of each of the Funds were lower than or in range of the median rate of each Fund’s Expense Group. The Board noted that the Net Advisory Rate for the Investor Class, Class A and Sweep Class of each of the Funds was not appreciably higher than the median rate for the Fund’s Expense, except for the Sweep Class of the Municipal Money Market Fund, New Jersey Municipal Money Market Fund and the New York Municipal Money Market Fund. The Board further noted that Funds Management had agreed to continue and, in certain instances, reduce contractual fee cap arrangements for the Funds designed to lower the Funds’ expenses.
The Board also received and considered information about the nature and extent of services offered and fee rates charged by Funds Management and Wells Capital Management to other types of clients. In this regard, the Board received information about differences between the services, and the compliance, reporting, and other legal burdens
| | | | | | |
| Other Information (Unaudited) | | Wells Fargo Advantage National Tax-Free Money Market Fund | | | 45 | |
and risks of providing investment advice to mutual funds and those associated with providing advice to non-mutual fund clients such as collective funds or institutional separate accounts.
In each case, the Board determined that the Advisory Agreement Rates for the Funds, both with and without administration fee rates and before and after waivers, were acceptable in light of the Funds’ Expense Group information, the net expense ratio commitments, the services covered by the Advisory Agreements and other information provided. The Board also reviewed and considered the Sub-Advisory Agreement Rates and concluded that the Sub-Advisory Agreement Rates were acceptable in light of the services covered by the Sub-Advisory Agreement and other information provided.
Profitability
The Board received and considered a profitability analysis of Funds Management, as well as an analysis of the profitability to the collective Wells Fargo businesses that provide services to the Funds. It considered that the information provided to it was necessarily estimated, and that the profitability information provided to it, especially on a fund-by-fund basis, did not necessarily provide a precise tool for evaluating the appropriateness of each Fund’s Advisory Agreement Rates in isolation. It noted that the levels of profitability of the Funds to Funds Management varied widely, depending on, among other things, the size and type of fund. The Board concluded that the profitability to Funds Management of the services provided to any of the Funds, individually or in the aggregate, was not unreasonable.
The Board did not consider separate profitability information with respect to Wells Capital Management, because, as an affiliate of Funds Management, its profitability information was subsumed in the collective Wells Fargo profitability analysis provided by Funds Management.
Economies of scale
With respect to possible economies of scale, the Board reviewed the breakpoints in each Fund’s advisory fee structure, which operate generally to reduce the effective Advisory Agreement Rates of the Funds (as a percentage of Fund assets) as the Funds grow in size. It considered that, as a fund shrinks in size, breakpoints conversely result in increasing fee levels. The Board noted that it would continue to review the appropriate levels of breakpoints in the future, and concluded that the breakpoints as implemented appeared to be a reasonable step toward sharing economies of scale with the Funds. However, the Board acknowledged the inherent limitations of any analysis of an investment adviser’s economies of scale and of any attempt to correlate breakpoints with such economies, stemming largely from the Board’s understanding that economies of scale are realized, if at all, by an investment adviser across a variety of products and services, not just with respect to a single fund.
Other benefits to Funds Management and Wells Capital Management
The Board received and considered information regarding potential “fall-out” or ancillary benefits received by Funds Management and its affiliates, including Wells Capital Management, as a result of their relationship with the Funds. Ancillary benefits could include, among others, benefits directly attributable to the relationship of Funds Management and Wells Capital Management with the Funds and benefits potentially derived from an increase in Funds Management’s and Wells Capital Management’s business as a result of their relationship with the Funds (such as the ability to market to shareholders other financial products offered by Funds Management and its affiliates, including Wells Capital Management).
The Board considered that Wells Fargo Funds Distributor, LLC, an affiliate of Funds Management, serves as distributor to the Funds and receives certain compensation for those services. The Board noted that the Funds pay sub-transfer agency fees to various financial institutions, including affiliates of Funds Management that hold fund shares in omnibus accounts. It also considered that these entities may receive distribution-related fees and shareholder servicing payments (including amounts derived from payments under the funds’ Rule 12b-1 plans) in respect of shares sold or held through them.
The Board also reviewed information about whether and to what extent soft dollar credits are sought and how any such credits are utilized and any benefits that may be realized by using an affiliated broker.
Other factors and broader review
The Board also considered the markets for distribution of the Funds’ shares, including the multiple channels through which the Funds’ shares are offered and sold. The Board noted that the Funds are part of one of the few fund families that
| | | | |
| 46 | | Wells Fargo Advantage National Tax-Free Money Market Fund | | Other Information (Unaudited) |
have both direct-to-fund and intermediary distribution channels. As discussed above, the Board reviews detailed materials received from Funds Management and Wells Capital Management annually as part of the re-approval process under Section 15 of the 1940 Act and also reviews and assesses information about the quality of the services that the Funds receive throughout the year. In this regard, the Board has reviewed reports of Funds Management at each of its quarterly meetings, which include, among other things, portfolio reviews and performance reports. In addition, the Board confers with portfolio managers at various times throughout the year.
Conclusion
After considering the above-described factors and based on its deliberations and its evaluation of the information described above, the Board concluded that approval of the continuation of the Advisory Agreements for the Funds was in the best interest of the Funds and their shareholders. Accordingly, the Board unanimously approved the continuation of the Advisory Agreements for an additional one-year period.
| | | | | | |
| List of Abbreviations | | Wells Fargo Advantage National Tax-Free Money Market Fund | | | 47 | |
The following is a list of common abbreviations for terms and entities which may have appeared in this report.
| ABAG | — Association of Bay Area Governments |
| ACB | — Agricultural Credit Bank |
| ADR | — American Depositary Receipt |
| ADS | — American Depository Shares |
| AGC-ICC | — Assured Guaranty Corporation - Insured Custody Certificates |
| AGM | — Assured Guaranty Municipal |
| AMBAC | — American Municipal Bond Assurance Corporation |
| AMT | — Alternative Minimum Tax |
| ARM | — Adjustable Rate Mortgages |
| BAN | — Bond Anticipation Notes |
| BART | — Bay Area Rapid Transit |
| BHAC | — Berkshire Hathaway Assurance Corporation |
| CCAB | — Convertible Capital Appreciation Bond |
| CDA | — Community Development Authority |
| CDO | — Collateralized Debt Obligation |
| CDSC | — Contingent Deferred Sales Charge |
| CGIC | — Capital Guaranty Insurance Company |
| CGY | — Capital Guaranty Corporation |
| CIFG | — CDC (Caisse des Dépôts et Consignations) IX IS Financial Guarantee |
| COP | — Certificate of Participation |
| DRIVER | — Derivative Inverse Tax-Exempt Receipts |
| DW&P | — Department of Water & Power |
| DWR | — Department of Water Resources |
| ECFA | — Educational & Cultural Facilities Authority |
| EDFA | — Economic Development Finance Authority |
| ETET | — Eagle Tax-Exempt Trust |
| ETF | — Exchange-Traded Fund |
| FFCB | — Federal Farm Credit Bank |
| FGIC | — Financial Guaranty Insurance Corporation |
| FHA | — Federal Housing Authority |
| FHAG | — Federal Housing Agency |
| FHLB | — Federal Home Loan Bank |
| FHLMC | — Federal Home Loan Mortgage Corporation |
| FNMA | — Federal National Mortgage Association |
| GDR | — Global Depositary Receipt |
| GNMA | — Government National Mortgage Association |
| HCFR | — Healthcare Facilities Revenue |
| HEFA | — Health & Educational Facilities Authority |
| HEFAR | — Higher Education Facilities Authority Revenue |
| HFA | — Housing Finance Authority |
| HFFA | — Health Facilities Financing Authority |
| HUD | — Housing & Urban Development |
| IBC | — Insured Bond Certificate |
| IDA | — Industrial Development Authority |
| IDAG | — Industrial Development Agency |
| IDR | — Industrial Development Revenue |
| KRW | — Republic of Korea Won |
| LIBOR | — London Interbank Offered Rate |
| LLC | — Limited Liability Company |
| LLP | — Limited Liability Partnership |
| MBIA | — Municipal Bond Insurance Association |
| MFHR | — Multi-Family Housing Revenue |
| MFMR | — Multi-Family Mortgage Revenue |
| MMD | — Municipal Market Data |
| MSTR | — Municipal Securities Trust Receipts |
| MUD | — Municipal Utility District |
| NATL-RE | — National Public Finance Guarantee Corporation |
| PCFA | — Pollution Control Finance Authority |
| PCR | — Pollution Control Revenue |
| PFA | — Public Finance Authority |
| PFFA | — Public Facilities Financing Authority |
| PFOTER | — Puttable Floating Option Tax-Exempt Receipts |
| plc | — Public Limited Company |
| PSFG | — Public School Fund Guaranty |
| PUTTER | — Puttable Tax-Exempt Receipts |
| R&D | — Research & Development |
| RDA | — Redevelopment Authority |
| RDFA | — Redevelopment Finance Authority |
| REIT | — Real Estate Investment Trust |
| RIB | — Residual Interest Bond |
| ROC | — Reset Option Certificates |
| SAVRS | — Select Auction Variable Rate Securities |
| SFHR | — Single Family Housing Revenue |
| SFMR | — Single Family Mortgage Revenue |
| SLMA | — Student Loan Marketing Association |
| SPDR | — Standard & Poor’s Depositary Receipts |
| STIT | — Short-Term Investment Trust |
| TAN | — Tax Anticipation Notes |
| TIPS | — Treasury Inflation-Protected Securities |
| TRAN | — Tax Revenue Anticipation Notes |
| TCR | — Transferable Custody Receipts |
| TTFA | — Transportation Trust Fund Authority |
| USD | — Unified School District |
| XLCA | — XL Capital Assurance |
This page is intentionally left blank.
This page is intentionally left blank.
This page is intentionally left blank.


FOR MORE INFORMATION
More information about Wells Fargo Advantage Funds is available free upon request. To obtain literature, please write, e-mail, visit the Funds’ Web site, or call:
Wells Fargo Advantage Funds
P.O. Box 8266
Boston, MA 02266-8266
E-mail: wfaf@wellsfargo.com
Web site: www.wellsfargo.com/advantagefunds
Individual investors: 1-800-222-8222
Retail investment professionals: 1-888-877-9275
Institutional investment professionals: 1-866-765-0778
This report and the financial statements contained herein are submitted for the general information of the shareholders of Wells Fargo Advantage Funds. If this report is used for promotional purposes, distribution of the report must be accompanied or preceded by a current prospectus. For a prospectus containing more complete information, including charges and expenses, call 1-800-222-8222 or visit the Funds’ Web site at www.wellsfargo.com/advantagefunds. Please consider the investment objectives, risks, charges, and expenses of the investment carefully before investing. This and other information about Wells Fargo Advantage Funds can be found in the current prospectus. Read the prospectus carefully before you invest or send money.
Wells Fargo Funds Management, LLC, a wholly owned subsidiary of Wells Fargo & Company, provides investment advisory and administrative services for Wells Fargo Advantage Funds. Other affiliates of Wells Fargo & Company provide subadvisory and other services for the Funds. The Funds are distributed by Wells Fargo Funds Distributor, LLC, Member FINRA/SIPC, an affiliate of Wells Fargo & Company.
NOT FDIC INSURED ¡ NO BANK GUARANTEE ¡ MAY LOSE VALUE
© 2011 Wells Fargo Funds Management, LLC. All rights reserved.
| | |
 | | 204805 09-11 SA309/SAR309 7-11 |

Wells Fargo Advantage
New Jersey Municipal Money Market Fund

Semi-Annual Report
July 31, 2011

Reduce clutter. Save trees.
Sign up for electronic delivery of prospectuses and shareholder reports at www.wellsfargo.com/advantagedelivery
Contents
The views expressed and any forward-looking statements are as of July 31, 2011, unless otherwise noted and are those of the Fund managers and/or Wells Fargo Funds Management, LLC. Discussions of individual securities, or the markets generally, or any Wells Fargo Advantage Fund are not intended as individual recommendations. Future events or results may vary significantly from those expressed in any forward-looking statements; the views expressed are subject to change at any time in response to changing circumstances in the market. Wells Fargo Funds Management, LLC, disclaims any obligation to publicly update or revise any views expressed or forward-looking statements.
NOT FDIC INSURED ¡ NO BANK GUARANTEE ¡ MAY LOSE VALUE

WELLS FARGO INVESTMENT HISTORY
| | |
| |
| 1932 | | Keystone creates one of the first mutual fund families. |
| |
| 1971 | | Wells Fargo & Company introduces one of the first institutional index funds. |
| |
| 1978 | | Wells Fargo applies Markowitz and Sharpe’s research on Modern Portfolio Theory to introduce one of the industry’s first Tactical Asset Allocation (TAA) models in institutional separately managed accounts. |
| |
| 1984 | | Wells Fargo Stagecoach Funds launches its first asset allocation fund. |
| |
| 1989 | | The Tactical Asset Allocation (TAA) Model is first applied to Wells Fargo’s asset allocation mutual funds. |
| |
| 1994 | | Wells Fargo introduces the LifePath Funds, one of the first suites of target date funds (now the Wells Fargo Advantage Dow Jones Target Date FundsSM ). |
| |
| 1996 | | Evergreen Investments and Keystone Funds merge. |
| |
| 1997 | | Wells Fargo launches Wells Fargo Advantage WealthBuilder PortfoliosSM, a fund-of-funds suite of products that includes the use of quantitative models to shift assets among investment styles. |
| |
| 1999 | | Norwest Advantage Funds and Stagecoach Funds are reorganized into Wells Fargo Funds after the merger of Norwest and Wells Fargo. |
| |
| 2002 | | Evergreen Retail and Evergreen Institutional companies form the umbrella asset management company, Evergreen Investments. |
| |
| 2005 | | The integration of Strong Funds with Wells Fargo Funds creates Wells Fargo Advantage Funds, resulting in one of the top 20 mutual fund companies in the United States. |
| |
| 2006 | | Wells Fargo Advantage Funds relaunches the target date product line as Wells Fargo Advantage Dow Jones Target Date Funds. |
| |
| 2010 | | The mergers and reorganizations of Evergreen and Wells Fargo Advantage mutual funds are completed, unifying the families under the brand of Wells Fargo Advantage Funds. |
Wells Fargo Advantage Funds®
Wells Fargo Advantage Funds skillfully guides institutions, financial advisors, and individuals through the investment terrain to help them reach their financial objectives. Everything we do on behalf of investors is backed by our unique combination of qualifications.
Strength
Our organization is built on the standards of integrity and service established by our parent company—Wells Fargo & Company—more than 150 years ago. And, because we’re part of a highly diversified financial enterprise, we offer the depth of resources to help investors succeed.
Expertise
Our multi-boutique model offers investors access to the independent thinking of premier investment managers that have been chosen for their time-tested strategies. While each team specializes in a specific investment strategy, collectively they provide investors a wide choice of distinct investment styles. Our dedication to investment excellence doesn’t end with our expertise in manager selection—risk management, analysis, and rigorous ongoing review seek to ensure each manager’s investment process remains consistent.
Partnership
Our collaborative approach is built around understanding the needs and goals of our clients. By adhering to core principles of sound judgment and steady guidance, we support you through every stage of the investment decision process.
Carefully consider the investment objectives, risks, charges, and expenses before investing. For a current prospectus for Wells Fargo Advantage Funds containing this and other information, visit wellsfargo.com/advantagefunds. Read it carefully before investing.
Wells Fargo Funds Management, LLC, a wholly owned subsidiary of Wells Fargo & Company, provides investment advisory and administrative services for Wells Fargo Advantage Funds®. Other affiliates of Wells Fargo & Company provide subadvisory and other services for the Funds. The Funds are distributed by Wells Fargo Funds Distributor, LLC, Member FINRA/SIPC, an affiliate of Wells Fargo & Company.
The “Dow Jones Target Date Indexes” are a product of Dow Jones Indexes, a licensed trademark of CME Group Index Services LLC (“CME”). “Dow Jones” and “Dow Jones Target Date Indexes” are service marks of Dow Jones Trademark Holdings, LLC, and have been licensed for use for certain purposes by CME and sublicensed for use by Global Index Advisors, Inc., and Wells Fargo Funds Management, LLC. The Dow Jones Target Date Indexes are based in part on the Barclays Capital Bond Indexes, which are published by Barclays Capital Inc. The Wells Fargo Advantage Dow Jones Target Date Funds, based on the Dow Jones Target Date Indexes, are not sponsored, endorsed, sold, or promoted by Dow Jones, CME or Barclays Capital or any of their respective affiliates, and neither Dow Jones, CME nor Barclays Capital nor any of their respective affiliates makes any representation regarding the advisability of investing in such product(s) and/or about the quality, accuracy, and/or completeness of the Dow Jones Target Date Indexes or the Barclays Capital Bond Indexes. IN NO EVENT SHALL DOW JONES, CME, BARCLAYS CAPITAL, OR ANY OF THEIR LICENSORS HAVE ANY LIABILITY IN CONNECTION WITH THE Wells Fargo Advantage Dow Jones Target Date Funds INCLUDING, WITHOUT LIMITATION, FOR ANY SPECIAL, PUNITIVE, IN DIRECT, OR CONSEQUENTIAL DAMAGES (INCLUDING LOST PROFITS), EVEN IF NOTIFIED OF THE POSSIBILITY OF SUCH DAMAGES.
NOT FDIC INSURED ¡ NO BANK GUARANTEE ¡ MAY LOSE VALUE
Not part of the semi-annual report.
Wells Fargo Advantage Funds offers more than 110 mutual funds across a wide range of asset classes, representing over $221 billion in assets under management, as of July 31, 2011.
| | | | |
| Equity Funds | | | | |
Asia Pacific Fund | | Global Opportunities Fund | | Premier Large Company Growth Fund |
C&B Large Cap Value Fund | | Growth Fund | | Small Cap Opportunities Fund |
C&B Mid Cap Value Fund | | Health Care Fund | | Small Cap Value Fund |
Capital Growth Fund | | Index Fund | | Small Company Growth Fund |
Common Stock Fund | | International Equity Fund | | Small Company Value Fund |
Disciplined U.S. Core Fund | | International Value Fund | | Small/Mid Cap Core Fund |
Discovery Fund† | | Intrinsic Small Cap Value Fund | | Small/Mid Cap Value Fund |
Diversified Equity Fund | | Intrinsic Value Fund | | Social Sustainability Fund† |
Diversified International Fund | | Intrinsic World Equity Fund | | Special Mid Cap Value Fund |
Diversified Small Cap Fund | | Large Cap Core Fund | | Special Small Cap Value Fund |
Emerging Growth Fund | | Large Cap Growth Fund | | Specialized Technology Fund |
Emerging Markets Equity Fund | | Large Company Value Fund | | Strategic Large Cap Growth Fund |
Endeavor Select Fund† | | Omega Growth Fund | | Traditional Small Cap Growth Fund |
Enterprise Fund† | | Opportunity Fund† | | Utility and Telecommunications Fund |
Equity Value Fund | | Precious Metals Fund | | |
| Bond Funds | | | | |
Adjustable Rate Government Fund | | Inflation-Protected Bond Fund | | Short-Term Bond Fund |
California Limited-Term Tax-Free Fund | | Intermediate Tax/AMT-Free Fund | | Short-Term High Yield Bond Fund |
California Tax-Free Fund | | International Bond Fund | | Short-Term Municipal Bond Fund |
Colorado Tax-Free Fund | | Minnesota Tax-Free Fund | | Strategic Municipal Bond Fund |
Government Securities Fund | | Municipal Bond Fund | | Total Return Bond Fund |
High Income Fund | | North Carolina Tax-Free Fund | | Ultra Short-Term Income Fund |
High Yield Bond Fund | | Pennsylvania Tax-Free Fund | | Ultra Short-Term Municipal Income Fund |
Income Plus Fund | | Short Duration Government Bond Fund | | Wisconsin Tax-Free Fund |
| Asset Allocation Funds | | | | |
Asset Allocation Fund | | WealthBuilder Equity Portfolio† | | Target 2020 Fund† |
Conservative Allocation Fund | | WealthBuilder Growth Allocation Portfolio† | | Target 2025 Fund† |
Diversified Capital Builder Fund | | WealthBuilder Growth Balanced Portfolio† | | Target 2030 Fund† |
Diversified Income Builder Fund | | WealthBuilder Moderate Balanced Portfolio† | | Target 2035 Fund† |
Growth Balanced Fund | | WealthBuilder Tactical Equity Portfolio† | | Target 2040 Fund† |
Index Asset Allocation Fund | | Target Today Fund† | | Target 2045 Fund† |
Moderate Balanced Fund | | Target 2010 Fund† | | Target 2050 Fund† |
WealthBuilder Conservative Allocation Portfolio† | | Target 2015 Fund† | | Target 2055 Fund† |
| Money Market Funds | | | | |
100% Treasury Money Market Fund | | Minnesota Money Market Fund | | New Jersey Municipal Money Market Fund |
California Municipal Money Market Fund | | Money Market Fund | | New York Municipal Money Market Fund |
Cash Investment Money Market Fund | | Municipal Cash Management Money Market Fund | | Pennsylvania Municipal Money Market Fund |
Government Money Market Fund | | Municipal Money Market Fund | | Prime Investment Money Market Fund |
Heritage Money Market Fund† | | National Tax-Free Money Market Fund | | Treasury Plus Money Market Fund |
| Variable Trust Funds1 | | | | |
VT Discovery Fund† | | VT Intrinsic Value Fund | | VT Small Cap Growth Fund |
VT Index Asset Allocation Fund | | VT Omega Growth Fund | | VT Small Cap Value Fund |
VT International Equity Fund | | VT Opportunity Fund† | | VT Total Return Bond Fund |
An investment in a money market fund is not insured or guaranteed by the Federal Deposit Insurance Corporation or any other government agency. Although the Wells Fargo Advantage Money Market Funds seek to preserve the value of your investment at $1.00 per share, it is possible to lose money by investing in a money market fund.
| 1. | The Variable Trust Funds are generally available only through insurance company variable contracts. |
| † | In this report, the Wells Fargo Advantage Discovery FundSM, Wells Fargo Advantage Endeavor Select FundSM, Wells Fargo Advantage Enterprise FundSM, Wells Fargo Advantage Opportunity FundSM, Wells Fargo Advantage Social Sustainability FundSM, Wells Fargo Advantage WealthBuilder Conservative Allocation PortfolioSM, Wells Fargo Advantage WealthBuilder Equity PortfolioSM, Wells Fargo Advantage WealthBuilder Growth Allocation PortfolioSM, Wells Fargo Advantage WealthBuilder Growth Balanced PortfolioSM, Wells Fargo Advantage WealthBuilder Moderate Balanced PortfolioSM, Wells Fargo Advantage WealthBuilder Tactical Equity PortfolioSM, Wells Fargo Advantage Dow Jones Target Today FundSM, Wells Fargo Advantage Dow Jones Target 2010 FundSM, Wells Fargo Advantage Dow Jones Target 2015 FundSM, Wells Fargo Advantage Dow Jones Target 2020 FundSM, Wells Fargo Advantage Dow Jones Target 2025 FundSM, Wells Fargo Advantage Dow Jones Target 2030 FundSM, Wells Fargo Advantage Dow Jones Target 2035 FundSM, Wells Fargo Advantage Dow Jones Target 2040 FundSM, Wells Fargo Advantage Dow Jones Target 2045 FundSM, Wells Fargo Advantage Dow Jones Target 2050 FundSM, Wells Fargo Advantage Dow Jones Target 2055 FundSM, Wells Fargo Advantage Heritage Money Market FundSM, Wells Fargo Advantage VT Discovery FundSM, and Wells Fargo Advantage VT Opportunity FundSM are referred to as the Discovery Fund, Endeavor Select Fund, Enterprise Fund, Opportunity Fund, Social Sustainability Fund, WealthBuilder Conservative Allocation Portfolio, WealthBuilder Equity Portfolio, WealthBuilder Growth Allocation Portfolio, WealthBuilder Growth Balanced Portfolio, WealthBuilder Moderate Balanced Portfolio, WealthBuilder Tactical Equity Portfolio, Target Today Fund, Target 2010 Fund, Target 2015 Fund, Target 2020 Fund, Target 2025 Fund, Target 2030 Fund, Target 2035 Fund, Target 2040 Fund, Target 2045 Fund, Target 2050 Fund, Target 2055 Fund, Heritage Money Market Fund, VT Discovery Fund, and VT Opportunity Fund, respectively. |
Not part of the semi-annual report.
| | | | |
| 2 | | Wells Fargo Advantage New Jersey Municipal Money Market Fund | | Letter to Shareholders |

Karla M. Rabusch,
President
Wells Fargo Advantage Funds
Dear Valued Shareholder,
We’re pleased to offer you this semi-annual report for the Wells Fargo Advantage New Jersey Municipal Money Market Fund for the six-month period that ended July 31, 2011. Upon reviewing the report, you may notice a few changes from past reports, the most significant of which is the change from a multi-fund report to a single-fund report. We believe this change will give you more convenient access to your fund data.
The period began modestly as improving economic optimism generally shifted investors toward equities and riskier assets and away from U.S. Treasuries and lower-yielding fixed-income securities. Returns from fixed income were modest in the opening months of 2011 but were generally still positive as U.S. Treasury yields incrementally climbed higher. But after the slow start, bond prices once again strongly improved, sparked by a sharp decline in U.S. Treasury prices in April that carried into May. Late in the period, lower-rated bonds declined in price more than the higher credit-quality tiers but not enough to outweigh the stronger performance from lower-rated securities during the period. Lower-quality and longer-maturity fixed-income securities generally outperformed higher-quality and shorter-maturity securities over the full period.
The activity within the broader bond market also resonated with money market participants. As the economic and credit environment reverberated from the ongoing sovereign debt concerns and softening economic data, many participants continued to balance a need for stability and desire for higher yields. The result has been good demand for domestic commercial paper and certificate of deposits. Also, in spite of all the discussion about sovereign debt, many money market participants continue to maintain some exposures to foreign banks based on the quality of their fundamentals. By focusing more on the fundamentals and taking a more selective approach to the short-term security market helped the markets avoid the severe yield volatility or significant flight-to-quality experienced during the spring of 2010, when the Greek sovereign debt crisis first emerged.
The global economic “recovery” hit a snag, but the end of 2011 could regain momentum.
The U.S. economic recovery that began in mid-2009 and gained further momentum throughout 2010, particularly during the fourth quarter, has failed to maintain that level of growth through the first seven months of 2011. For example, gross domestic product (GDP), the broadest measure of economic activity, grew at an annualized rate of 3.1% in the fourth quarter of 2010, only to slow dramatically during the first quarter of 2011. The latest revision to first-quarter GDP data during the period indicated that the economy grew at an annualized rate of 0.4% during the first quarter of 2011. While still positive, it’s a much slower pace of growth than experienced in the second half of 2010 and notably lower than consensus forecasts. Nevertheless, the advance estimate of second-quarter 2011 GDP, which was released on July 29, 2011, was 1.3%, suggesting that the U.S. economy continues to expand, though at a slow and uneven pace.
Jobs and housing remained troublesome.
The July 2011 unemployment rate in the U.S. was reported at 9.1%, down from 9.5% a year earlier but still notably higher than historical averages. Unfortunately, the drop may be more attributable to a decline in the labor force than to a meaningful uptick in hiring. The level of job creation in 2011 has been trending
| | | | | | |
| Letter to Shareholders | | Wells Fargo Advantage New Jersey Municipal Money Market Fund | | | 3 | |
below historical averages, suggesting that the improving economy has yet to translate into widespread hiring. Meanwhile, the beleaguered housing market was an ongoing source of concern, despite some tentative late-year signs of stabilization. That said, persistent weakness in the labor and housing markets bears close watching in the months ahead.
Other economic data in the U.S. has been more encouraging, reflecting greater confidence in the sustainability of the expansion on the part of both consumers and businesses. Retail sales came in strong at certain points during the period and industrial production and new orders have picked up. Although still reluctant to hire, businesses have gradually increased spending in other areas, such as equipment and information technology. Core inflation, which excludes volatile food and energy prices, remained benign.
The Federal Reserve believes the economic recovery will accelerate in future quarters.
With inflation subdued, the Federal Open Market Committee (FOMC) held its target range for the federal funds rate—a proxy for short-term interest rates—steady at 0.00% to 0.25%. On June 22, 2011, in its final statement of the six-month period, the Fed reiterated that the economic recovery “is proceeding at a moderate pace,” but that “recent labor market indicators have been weaker than anticipated.” It described the recent increase in inflation as temporary, suggesting that inflation pressures will ease going forward. While the FOMC explained that it “expects the pace of recovery to pick up over coming quarters,” it indicated that the federal funds rate will remain at an exceptionally low level for as long as necessary to ensure a sustainable recovery and expansion.
As recent headwinds subside, it is reasonable to expect markets to regain focus.
Now that it appears the debt ceiling has been increased and a U.S. default will be averted, money market participants and the broader bond market can get back to more fundamental and lasting concerns-chiefly, the economy. After avoiding short-term Treasuries in late July 2011, ahead of pending U.S. debt ceiling deadline, money market participants have returned to the U.S. short-term markets1. Economic indicators released in the second half of 2011 might not be as soft as those reported during the first half of the year. While that would not mean that the economy is robust, it might remind the markets that the first half of the slowdown was transitory. Most indicators still point toward real GDP growth in the 2% to 3% range in the second half of 2011. While that is not enough to produce big employment gains, it might be sufficient to cause Treasury yields to retrace some of the late-July declines.
Don’t let short-term uncertainty derail long-term investment goals.
While periods of uncertainty can present challenges, experience has taught us that maintaining a long-term investment strategy based on individual goals and risk tolerance can be an effective way to plan for the future. As a whole, Wells Fargo Advantage Funds represents investments across a broad range of asset classes and investment styles with more than 110 mutual funds, giving you an opportunity to create a diversified investment portfolio. While diversification may not prevent losses in a downturn, it may help to reduce them and provide you with one way of managing risk.
| 1. | Comments expressed that do not fall within the reporting period are as of August 2, 2011. |
While the FOMC explained that it “expects the pace of recovery to pick up over coming quarters,” it indicated that the federal funds rate will remain at an exceptionally low level for as long as necessary to ensure a sustainable recovery and expansion.
Economic indicators released in the second half of 2011 might not be as soft as those reported during the first half of the year. While that would not mean that the economy is robust, it might remind the markets that the first half of the slowdown was transitory.
| | | | |
| 4 | | Wells Fargo Advantage New Jersey Municipal Money Market Fund | | Letter to Shareholders |
In our opinion, diligent and earnest assessment of the fundamental characteristics of money market eligible securities will be a key differentiating factor between which investment strategies meet client expectations and which do not. At Wells Fargo Advantage Funds, we intend to continue the emphasis of principal preservation and high liquidity across our lineup of Wells Fargo Advantage Money Market Funds. In changing markets, we believe it is particularly important to have diligent investment analysts in charge of investor assets.
Thank you for choosing Wells Fargo Advantage Funds. We appreciate your confidence in us and are committed to helping you meet your financial needs. If you have any questions about your investments, please contact your investment professional, call us at 1-800-222-8222, or visit www.wellsfargo.com/advantagefunds.
Sincerely,

Karla M. Rabusch
President
Wells Fargo Advantage Funds
| | | | | | |
| Performance Highlights (Unaudited) | | Wells Fargo Advantage New Jersey Municipal Money Market Fund | | | 5 | |
INVESTMENT OBJECTIVE
The Fund seeks current income exempt from regular federal income tax and New Jersey individual income tax, while preserving capital and liquity.
ADVISER
Wells Fargo Funds Management, LLC
SUB-ADVISER
Wells Capital Management Incorporated
PORTFOLIO MANAGERS
David D. Sylvester
James Randazzo
FUND INCEPTION
October 26, 1998
| | |
SECTOR DISTRIBUTION1
(AS OF JULY 31, 2011) | | |
|
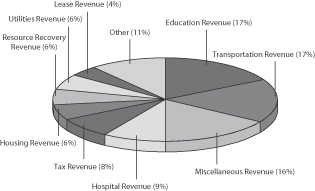 |
| | |
EFFECTIVE MATURITY DISTRIBUTION1
(AS OF JULY 31, 2011) |
|
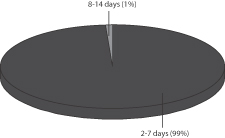 |
| | |
WEIGHTED AVERAGE MATURITY2
(AS OF JULY 31, 2011) |
6 Days |
| | |
WEIGHTED AVERAGE FINAL MATURITY3
(AS OF JULY 31, 2011) |
6 Days |
| 1. | Sector distribution and effective maturity distribution are subject to change and are calculated based on the total investments of the Fund. Effective maturity distribution is based on the weighted average maturity of each security. |
| 2. | Weighted Average Maturity (WAM): WAM calculates an average time to maturity of all of the securities held in the portfolio, weighted by each security’s percentage of net assets. The calculation takes into account the final maturity of a fixed-income security and the interest rate reset date for floating-rate securities held in the portfolio. This is a way to measure a fund’s sensitivity to potential interest rate changes. |
| 3. | Weighted Average Final Maturity (WAFM): WAFM calculates a fund’s average time to maturity for all of the securities held in the portfolio, weighted to their percentage of assets in the Fund. In contrast to WAM, the WAFM calculation takes into account the final maturity date for each security held in the portfolio. This is a way to measure a fund’s potential sensitivity to credit spread changes. |
| | | | |
| 6 | | Wells Fargo Advantage New Jersey Municipal Money Market Fund | | Performance Highlights (Unaudited) |
AVERAGE ANNUAL TOTAL RETURN4 (%) (AS OF JULY 31, 2011)
| | | | | | | | | | | | | | | | | | | | | | | | | | | | |
| | | | | | | | | Expense Ratios5 | |
| | | Inception Date | | | 6 Months* | | | 1 Year | | | 5 Year | | | 10 Year | | | Gross | | | Net6 | |
Class A (ENJXX) | | | 10/26/1998 | | | | 0.00 | | | | 0.01 | | | | 1.17 | | | | 1.18 | | | | 0.89% | | | | 0.70% | |
Service Class (EJMXX) | | | 04/05/1999 | | | | 0.00 | | | | 0.01 | | | | 1.35 | | | | 1.42 | | | | 0.79% | | | | 0.45% | |
Sweep Class | | | 06/30/2000 | | | | 0.00 | | | | 0.01 | | | | 1.01 | | | | 0.95 | | | | 1.24% | | | | 1.05% | |
| * | Returns for periods of less than one year are not annualized. |
| | | | | | | | | | | | |
FUND YIELD SUMMARY6
(AS OF JULY 31, 2011) | | Class A | | | Service Class | | | Sweep Class | |
7-Day Current Yield | | | 0.01% | | | | 0.01% | | | | 0.01% | |
7-Day Compound Yield | | | 0.01% | | | | 0.01% | | | | 0.01% | |
30-Day Simple Yield | | | 0.01% | | | | 0.01% | | | | 0.01% | |
30-Day Compound Yield | | | 0.01% | | | | 0.01% | | | | 0.01% | |
Figures quoted represent past performance, which is no guarantee of future results and do not reflect the deduction of taxes that a shareholder may pay on fund distributions or the redemption of fund shares. Investment returns will fluctuate. The Fund’s yield figures more closely reflect the current earnings of the Fund than the total return figures. Current performance may be lower or higher than the performance data quoted. Current month-end performance is available at the Fund’s Web site – www.wellsfargo.com/advantagefunds.
Each class is sold without a front-end sales charge or contingent deferred sales charge. Other fees and expenses apply to an investment in the Fund and are described in the Fund’s current prospectus.
An investment in a money market fund is not insured or guaranteed by the Federal Deposit Insurance Corporation or any other government agency. Although the Fund seeks to preserve the value of your investment at $1.00 per share, it is possible to lose money by investing in a money market fund. A portion of the Fund’s income may be subject to federal, state and/or local income taxes or the alternative minimum tax (AMT).
| 4. | Historical performance shown for all classes of the Fund prior to July 12, 2010 is based on the performance of the Fund’s predecessor, Evergreen New Jersey Municipal Money Market Fund. |
| 5. | Reflects the expense ratios as stated in the most recent prospectuses. |
| 6. | The Adviser has committed through July 11, 2013 to waive fees and/or reimburse expenses to the extent necessary to cap the Fund’s Total Annual Fund Operating Expenses After Fee Waiver, excluding certain expenses, at the amount shown above. Without this cap, the Fund’s returns would have been lower. Without waived fees and/or reimbursed expenses, the Fund’s 7-day current yield would have been (0.83)%, (0.73)%, and (1.18)% for Class A, Service Class and Sweep Class, respectively. |
| | | | | | |
| Fund Expenses | | Wells Fargo Advantage New Jersey Municipal Money Market Fund | | | 7 | |
As a shareholder of the Fund, you incur two types of costs: (1) transaction costs, including contingent deferred sales charges (if any) and (2) ongoing costs, including management fees; distribution (12b-1) and/or shareholder service fees; and other Fund expenses. This example is intended to help you understand your ongoing costs (in dollars) of investing in the Fund and to compare these costs with the ongoing costs of investing in other mutual funds.
The example is based on an investment of $1,000 invested at the beginning of the six-month period and held for the entire period from February 1, 2011 to July 31, 2011.
Actual Expenses
The “Actual” line of the table below provides information about actual account values and actual expenses. You may use the information in this line, together with the amount you invested, to estimate the expenses that you paid over the period. Simply divide your account value by $1,000 (for example, an $8,600 account value divided by $1,000 = 8.6), then multiply the result by the number in the “Actual” line under the heading entitled “Expenses Paid During Period” for your applicable class of shares to estimate the expenses you paid on your account during this period.
Hypothetical Example for Comparison Purposes
The “Hypothetical” line of the table below provides information about hypothetical account values and hypothetical expenses based on the Fund’s actual expense ratio and an assumed rate of return of 5% per year before expenses, which is not the Fund’s actual return. The hypothetical account values and expenses may not be used to estimate the actual ending account balance or expenses you paid for the period. You may use this information to compare the ongoing costs of investing in the Fund and other funds. To do so, compare this 5% hypothetical example with the 5% hypothetical examples that appear in the shareholder reports of the other funds.
Please note that the expenses shown in the table are meant to highlight your ongoing costs only and do not reflect any transactional costs, such as any contingent deferred sales charges. Therefore, the “Hypothetical” line of the table is useful in comparing ongoing costs only, and will not help you determine the relative total costs of owning different funds. In addition, if these transactional costs were included, your costs would have been higher.
| | | | | | | | | | | | | | | | |
| | | Beginning
Account Value
02-01-2011 | | | Ending
Account Value
07-31-2011 | | | Expenses
Paid During
the Period¹ | | | Net Annual
Expense Ratio | |
Class A | | | | | | | | | | | | | | | | |
Actual | | $ | 1,000.00 | | | $ | 1,000.05 | | | $ | 0.94 | | | | 0.19 | % |
Hypothetical (5% return before expenses) | | $ | 1,000.00 | | | $ | 1,023.85 | | | $ | 0.95 | | | | 0.19 | % |
Service Class | | | | | | | | | | | | | | | | |
Actual | | $ | 1,000.00 | | | $ | 1,000.05 | | | $ | 0.89 | | | | 0.18 | % |
Hypothetical (5% return before expenses) | | $ | 1,000.00 | | | $ | 1,023.90 | | | $ | 0.90 | | | | 0.18 | % |
Sweep Class | | | | | | | | | | | | | | | | |
Actual | | $ | 1,000.00 | | | $ | 1,000.05 | | | $ | 0.99 | | | | 0.20 | % |
Hypothetical (5% return before expenses) | | $ | 1,000.00 | | | $ | 1,023.80 | | | $ | 1.00 | | | | 0.20 | % |
| 1. | Expenses paid is equal to the annualized expense ratio of each class multiplied by the average account value over the period, multiplied by the number of days in the most recent fiscal half-year divided by the number of days in the fiscal year (to reflect the one-half year period). |
| | | | |
| 8 | | Wells Fargo Advantage New Jersey Municipal Money Market Fund | | Portfolio of Investments—July 31, 2011 (Unaudited) |
| | | | | | | | | | | | | | | | |
| Security Name | | Interest Rate | | | Maturity Date | | | Principal | | | Value | |
| | | | | | | | | | | | | | | | |
| | | | |
Municipal Bonds and Notes: 94.54% | | | | | | | | | | | | | | | | |
| | | | |
Arizona: 0.43% | | | | | | | | | | | | | | | | |
| | | | |
| Variable Rate Demand Note§: 0.43% | | | | | | | | | | | | | | | | |
Maricopa County, AZ IDA Valley of the Sun YMCA Project (IDR, U.S. Bank NA LOC) | | | 0.10 | % | | | 12/01/2037 | | | $ | 600,000 | | | $ | 600,000 | |
| | | | | | | | | | | | | | | | |
| | | | |
California: 0.21% | | | | | | | | | | | | | | | | |
| | | | |
| Variable Rate Demand Note§: 0.21% | | | | | | | | | | | | | | | | |
California State Series A3 (GO-State, Bank of Montreal LOC) | | | 0.21 | | | | 05/01/2033 | | | | 300,000 | | | | 300,000 | |
| | | | | | | | | | | | | | | | |
| | | | |
Delaware: 3.33% | | | | | | | | | | | | | | | | |
| | | | |
| Variable Rate Demand Notes§: 3.33% | | | | | | | | | | | | | | | | |
Delaware River & Bay Authority (Transportation Revenue, TD Bank NA LOC) | | | 0.05 | | | | 01/01/2030 | | | | 3,800,000 | | | | 3,800,000 | |
Delaware State Economic Development Authority IDR Clean Power Project Series A (Energy Revenue) | | | 0.21 | | | | 08/01/2029 | | | | 500,000 | | | | 500,000 | |
Delaware State Economic Development Authority IDR Clean Power Project Series D (Energy Revenue) | | | 0.21 | | | | 08/01/2029 | | | | 350,000 | | | | 350,000 | |
| | | | |
| | | | | | | | | | | | | | | 4,650,000 | |
| | | | | | | | | | | | | | | | |
| | | | |
Florida: 0.36% | | | | | | | | | | | | | | | | |
| | | | |
| Variable Rate Demand Note§: 0.36% | | | | | | | | | | | | | | | | |
Palm Beach County FL Pine Crest Preparatory (Education Revenue, Bank of America NA LOC) | | | 0.13 | | | | 06/01/2032 | | | | 500,000 | | | | 500,000 | |
| | | | | | | | | | | | | | | | |
| | | | |
Maryland: 0.72% | | | | | | | | | | | | | | | | |
| | | | |
| Other Municipal Debt: 0.72% | | | | | | | | | | | | | | | | |
Montgomery County MD BAN 2010 Series B (Miscellaneous Revenue, State Street Bank & Trust Insured) | | | 0.09 | | | | 08/09/2011 | | | | 1,000,000 | | | | 1,000,000 | |
| | | | | | | | | | | | | | | | |
| | | | |
New Jersey: 67.94% | | | | | | | | | | | | | | | | |
| | | | |
| Variable Rate Demand Notes§: 67.94% | | | | | | | | | | | | | | | | |
Burlington County NJ Bridge Lutheran Home Project Series A (Health Revenue, Commerce Bank NA LOC) | | | 0.10 | | | | 12/01/2025 | | | | 965,000 | | | | 965,000 | |
Camden County NJ Import Authority Cooper Health System (Hospital Revenue, TD Bank NA LOC) | | | 0.04 | | | | 08/01/2032 | | | | 4,595,000 | | | | 4,595,000 | |
Garden State Preservation Trust New Jersey Open Space & Farmland 2005 Series A (Tax Revenue, FSA Insured) | | | 0.12 | | | | 05/01/2024 | | | | 4,185,000 | | | | 4,185,000 | |
Gloucester County NJ Industrial PCFA Exxon Mobil (Resource Recovery Revenue, Mobil Corporation Guarantee Agreement) | | | 0.10 | | | | 01/01/2022 | | | | 2,700,000 | | | | 2,700,000 | |
Mercer County NJ Import Authority Atlantic Funding Project (Education Revenue, Bank of America NA LOC) | | | 0.25 | | | | 09/01/2028 | | | | 3,785,000 | | | | 3,785,000 | |
New Jersey Economic Development Authority (Tax Revenue, BHAC-CR NATL-RE Insured) | | | 0.11 | | | | 07/01/2022 | | | | 2,190,000 | | | | 2,190,000 | |
New Jersey Economic Development Authority Gas Facility (Utilities Revenue, Bank of Tokyo-Mitsubishi UFJ LOC) | | | 0.23 | | | | 10/01/2022 | | | | 4,200,000 | | | | 4,200,000 | |
New Jersey Economic Development Authority Lawrenceville School Project (Education Revenue) | | | 0.22 | | | | 07/01/2031 | | | | 400,000 | | | | 400,000 | |
New Jersey Economic Development Authority Presbyterian Homes Assistance Project Series B (Health Revenue, Commerce Bank NA LOC) | | | 0.06 | | | | 04/01/2016 | | | | 1,340,000 | | | | 1,340,000 | |
New Jersey Economic Development Authority Princeton Day School Project (Education Revenue, U.S. Bank NA LOC) | | | 0.06 | | | | 08/01/2035 | | | | 5,000,000 | | | | 5,000,000 | |
| | | | | | |
| Portfolio of Investments—July 31, 2011 (Unaudited) | | Wells Fargo Advantage New Jersey Municipal Money Market Fund | | | 9 | |
| | | | | | | | | | | | | | | | |
| Security Name | | Interest Rate | | | Maturity Date | | | Principal | | | Value | |
| | | | | | | | | | | | | | | | |
| | | | |
| Variable Rate Demand Notes§ (continued) | | | | | | | | | | | | | | | | |
New Jersey Economic Development Authority The Hun School of Princeton Project (Miscellaneous Revenue, PNC Bank NA LOC) | | | 0.05 | % | | | 11/01/2034 | | | $ | 5,000,000 | | | $ | 5,000,000 | |
New Jersey Economic Development Authority The Peddie School Project Series 1996 (Education Revenue, U.S. Bank NA Insured) | | | 0.06 | | | | 02/01/2026 | | | | 2,250,000 | | | | 2,250,000 | |
New Jersey Economic Development Authority Various Paddock Realty LLC Project (IDR, Wells Fargo Bank NA LOC)(q) | | | 0.25 | | | | 05/01/2031 | | | | 915,000 | | | | 915,000 | |
New Jersey Economic Development Authority Various Peddie School Project Series B (Education Revenue, U.S. Bank NA Insured) | | | 0.06 | | | | 02/01/2019 | | | | 995,000 | | | | 995,000 | |
New Jersey Economic Development Authority Various Peddie School Project Series B (Education Revenue, U.S. Bank NA Insured) | | | 0.06 | | | | 02/01/2029 | | | | 705,000 | | | | 705,000 | |
New Jersey Educational Facilities Authority Various Institute Defense Analyses Series D (Miscellaneous Revenue, Branch Banking & Trust LOC, AMBAC Insured) | | | 0.08 | | | | 10/01/2030 | | | | 4,500,000 | | | | 4,500,000 | |
New Jersey Health Care Facilities Financing Authority Various Virtua Health Service Series C (Health Revenue, JPMorgan Chase Bank LOC) | | | 0.25 | | | | 07/01/2043 | | | | 250,000 | | | | 250,000 | |
New Jersey HFFA Princeton Healthcare Series B (Hospital Revenue, TD Bank NA LOC) | | | 0.06 | | | | 07/01/2041 | | | | 700,000 | | | | 700,000 | |
New Jersey HFFA Series A1 (Hospital Revenue, TD Bank NA LOC) | | | 0.10 | | | | 07/01/2014 | | | | 1,645,000 | | | | 1,645,000 | |
New Jersey HFFA Various Princeton Healthcare Series A (Hospital Revenue, Bank of America NA LOC) | | | 0.10 | | | | 07/01/2041 | | | | 2,000,000 | | | | 2,000,000 | |
New Jersey HFFA Various Somerset Medical Center (Hospital Revenue, TD Bank NA LOC) | | | 0.06 | | | | 07/01/2024 | | | | 1,565,000 | | | | 1,565,000 | |
New Jersey Higher Education Assistance Authority Student Loan Series ROC-RR-II-R-11853 (Education Revenue, Assured Guaranty Insured)†† | | | 0.23 | | | | 06/01/2016 | | | | 4,400,000 | | | | 4,400,000 | |
New Jersey Housing & Mortgage Finance Agency Series A (Housing Revenue, FSA Insured)†† | | | 0.11 | | | | 05/01/2027 | | | | 1,310,000 | | | | 1,310,000 | |
New Jersey State Building Authority Sub Series A-3 (Lease Revenue, Barclays Bank plc LOC) | | | 0.05 | | | | 06/15/2023 | | | | 5,415,000 | | | | 5,415,000 | |
New Jersey State Higher Education Assistance Student Loan Revenue (Education Revenue, Assured Guaranty Insured) | | | 0.23 | | | | 06/01/2016 | | | | 5,000,000 | | | | 5,000,000 | |
New Jersey State Transportation Trust Fund Authority PUTTER DB-297 (Miscellaneous Revenue, NATL-RE FGIC Insured) | | | 0.08 | | | | 12/15/2031 | | | | 4,910,000 | | | | 4,910,000 | |
New Jersey State Transportation Trust Fund Capital Appreciation Transportation System Series C (Transportation Revenue, FSA Insured) | | | 0.08 | | | | 12/15/2033 | | | | 4,590,000 | | | | 4,590,000 | |
New Jersey State Turnpike Authority Refunding Various Series B (Transportation Revenue, PNC Bank NA LOC) | | | 0.14 | | | | 01/01/2024 | | | | 5,000,000 | | | | 5,000,000 | |
New Jersey State Turnpike Authority Refunding Various Series C (Transportation Revenue, Scotia Bank LOC) | | | 0.04 | | | | 01/01/2024 | | | | 4,950,000 | | | | 4,950,000 | |
New Jersey State Turnpike Authority Refunding Various Series D (Transportation Revenue, Scotia Bank LOC) | | | 0.14 | | | | 01/01/2024 | | | | 4,200,000 | | | | 4,200,000 | |
New Jersey Transportation Trust Fund Series 31 (Miscellaneous Revenue, State Street Bank & Trust Insured)†† | | | 0.08 | | | | 12/15/2023 | | | | 5,200,000 | | | | 5,200,000 | |
| | | | |
| | | | | | | | | | | | | | | 94,860,000 | |
| | | | | | | | | | | | | | | | |
| | | | |
New York: 2.55% | | | | | | | | | | | | | | | | |
| | | | |
| Variable Rate Demand Notes§: 2.55% | | | | | | | | | | | | | | | | |
Austin Trust Various States Series 2008-1067 (Port, Airport, & Marina Authority Revenue, GO of Authority Insured) | | | 0.18 | | | | 10/01/2025 | | | | 1,415,000 | | | | 1,415,000 | |
Port Authority of New York & New Jersey (Port, Airport, & Marina Authority Revenue, Barclays Bank plc Insured)†† | | | 0.06 | | | | 01/15/2041 | | | | 2,150,000 | | | | 2,150,000 | |
| | | | |
| | | | | | | | | | | | | | | 3,565,000 | |
| | | | | | | | | | | | | | | | |
| | | | |
| 10 | | Wells Fargo Advantage New Jersey Municipal Money Market Fund | | Portfolio of Investments—July 31, 2011 (Unaudited) |
| | | | | | | | | | | | | | | | |
| Security Name | | Interest Rate | | | Maturity Date | | | Principal | | | Value | |
| | | | | | | | | | | | | | | | |
| | | | |
Pennsylvania: 1.77% | | | | | | | | | | | | | | | | |
| | | | |
| Variable Rate Demand Notes§: 1.77% | | | | | | | | | | | | | | | | |
Allegheny County PA Airport Authority Series 4 (Airport Revenue, State Street Bank & Trust Insured)†† | | | 0.13 | % | | | 01/01/2018 | | | $ | 900,000 | | | $ | 900,000 | |
Allegheny County PA Hospital Development Authority UPMC Senior Living Corporation (Health Revenue, FNMA Insured) | | | 0.09 | | | | 07/15/2028 | | | | 1,275,000 | | | | 1,275,000 | |
Emmaus PA General Authority Subseries D27 (Miscellaneous Revenue, U.S. Bank NA LOC, State Aid Withholding Insured) | | | 0.08 | | | | 03/01/2024 | | | | 300,000 | | | | 300,000 | |
| | | | |
| | | | | | | | | | | | | | | 2,475,000 | |
| | | | | | | | | | | | | | | | |
| | | | |
Puerto Rico: 11.08% | | | | | | | | | | | | | | | | |
| | | | |
| Variable Rate Demand Notes§: 11.08% | | | | | | | | | | | | | | | | |
Puerto Rico Commonwealth Various Refunding Public Improvement Series C-5-2-RMKT (GO-State, Barclays Bank plc LOC, AGM Insured) | | | 0.04 | | | | 07/01/2020 | | | | 2,200,000 | | | | 2,200,000 | |
Deutsche Bank Spears Lifers Trust Series DBE-627A (Tax Revenue, AMBAC Insured) | | | 0.08 | | | | 08/01/2050 | | | | 2,490,000 | | | | 2,490,000 | |
Puerto Rico HFA PUTTER Series 2984 (Housing Revenue, HUD Loan Insured) | | | 0.12 | | | | 06/01/2012 | | | | 5,780,000 | | | | 5,780,000 | |
Puerto Rico Electric Power Authority Municipal Securities Trust Receipts Sgc 57 Class A (Utilities Revenue, Societe Generale LOC, FSA Insured) | | | 0.11 | | | | 07/01/2029 | | | | 3,200,000 | | | | 3,200,000 | |
Puerto Rico Sales Tax Financing Corporation ROC-RR-II-R-11760 (Tax Revenue, Citibank NA Insured)†† | | | 0.11 | | | | 12/01/2047 | | | | 1,800,000 | | | | 1,800,000 | |
| | | | |
| | | | | | | | | | | | | | | 15,470,000 | |
| | | | | | | | | | | | | | | | |
| | | | |
Texas: 3.62% | | | | | | | | | | | | | | | | |
| | | | |
| Variable Rate Demand Notes§: 3.62% | | | | | | | | | | | | | | | | |
Nueces County TX Port Corpus Christi Authority Solid Waste Disposal Flint Hills Resources Project Series 2007 (Resource Recovery Revenue, Flint Hills Resources Guaranteed) | | | 0.13 | | | | 01/01/2032 | | | | 4,500,000 | | | | 4,500,000 | |
Nueces County TX Port Corpus Christi Authority Solid Waste Disposal Flint Hills Resources Project Series 2006 (Resource Recovery Revenue, Flint Hills Resources Guaranteed) | | | 0.13 | | | | 01/01/2030 | | | | 550,000 | | | | 550,000 | |
| | | | |
| | | | | | | | | | | | | | | 5,050,000 | |
| | | | | | | | | | | | | | | | |
| | | | |
Utah: 1.04% | | | | | | | | | | | | | | | | |
| | | | |
| Variable Rate Demand Note§: 1.04% | | | | | | | | | | | | | | | | |
Logan City UT Scientific Technology Incorporation (IDR, Bank of the West LOC) | | | 0.16 | | | | 08/01/2031 | | | | 1,450,000 | | | | 1,450,000 | |
| | | | | | | | | | | | | | | | |
| | | | |
Virginia: 0.77% | | | | | | | | | | | | | | | | |
| | | | |
| Variable Rate Demand Note§: 0.77% | | | | | | | | | | | | | | | | |
Virginia Commonwealth University Health System Authority Series B (Hospital Revenue, Branch Banking & Trust LOC) | | | 0.27 | | | | 07/01/2037 | | | | 1,075,000 | | | | 1,075,000 | |
| | | | | | | | | | | | | | | | |
| | | | |
Washington: 0.72% | | | | | | | | | | | | | | | | |
| | | | |
| Variable Rate Demand Note§: 0.72% | | | | | | | | | | | | | | | | |
Washington State Housing Finance Commission (Housing Revenue, FHLMC Insured) | | | 0.09 | | | | 07/01/2044 | | | | 1,000,000 | | | | 1,000,000 | |
| | | | | | | | | | | | | | | | |
| | | | | | | | |
| Total Investments in Securities | | | | | | | | |
| (Cost $131,995,000)* | | | 94.54 | % | | | 131,995,000 | |
Other Assets and Liabilities, Net | | | 5.46 | | | | 7,628,461 | |
| | | | | | | | |
| Total Net Assets | | | 100.00 | % | | $ | 139,623,461 | |
| | | | | | | | |
| § | These securities are subject to a demand feature which reduces the effective maturity. |
| †† | Security that may be resold to “qualified institutional buyers” under Rule 144A or securities offered pursuant to Section 4(2) of the Securities Act of 1933, as amended. |
| (q) | Credit enhancement is provided by an affiliate. |
| * | Cost for federal income tax purposes is substantially the same as for financial reporting purposes. |
The accompanying notes are an integral part of these financial statements.
| | | | | | |
| Statement of Assets and Liabilities—July 31, 2011 (Unaudited) | | Wells Fargo Advantage New Jersey Municipal Money Market Fund | | | 11 | |
| | | | |
| | | | |
| |
Assets | | | | |
Investments in unaffiliated securities, at amortized cost | | $ | 131,995,000 | |
Cash | | | 7,397,891 | |
Receivable for investments sold | | | 240,000 | |
Receivable for Fund shares sold | | | 1,918 | |
Receivable for interest | | | 20,236 | |
Receivable from adviser | | | 104,550 | |
Prepaid expenses and other assets | | | 25,557 | |
| | | | |
Total assets | | | 139,785,152 | |
| | | | |
| |
Liabilities | | | | |
Distribution fees payable | | | 40,593 | |
Due to other related parties | | | 34,888 | |
Shareholder report expenses payable | | | 28,929 | |
Custodian and accounting fees payable | | | 10,860 | |
Shareholder servicing fees payable | | | 34,161 | |
Accrued expenses and other liabilities | | | 12,260 | |
| | | | |
Total liabilities | | | 161,691 | |
| | | | |
Total net assets | | $ | 139,623,461 | |
| | | | |
| |
NET ASSETS CONSIST OF | | | | |
Paid-in capital | | $ | 139,547,410 | |
Undistributed net investment income | | | 72,896 | |
Accumulated net realized gains on investments | | | 3,155 | |
| | | | |
Total net assets | | $ | 139,623,461 | |
| | | | |
| |
COMPUTATION OF NET ASSET VALUE PER SHARE1 | | | | |
Net assets – Class A | | $ | 14,609,541 | |
Shares outstanding – Class A | | | 14,593,911 | |
Net asset value per share – Class A | | | $1.00 | |
Net assets – Service Class | | $ | 10,820,427 | |
Shares outstanding – Service Class | | | 10,812,655 | |
Net asset value per share – Service Class | | | $1.00 | |
Net assets – Sweep Class | | $ | 114,193,493 | |
Shares outstanding – Sweep Class | | | 114,002,684 | |
Net asset value per share – Sweep Class | | | $1.00 | |
| 1. | The Fund has an unlimited number of authorized shares. |
The accompanying notes are an integral part of these financial statements.
| | | | |
| 12 | | Wells Fargo Advantage New Jersey Municipal Money Market Fund | | Statement of Operations—Six Months Ended July 31, 2011 (Unaudited) |
| | | | |
| | | | |
| |
Investment income | | | | |
Interest | | $ | 193,432 | |
| | | | |
| |
Expenses | | | | |
Advisory fee | | | 281,740 | |
Administration fees | | | | |
Fund level | | | 46,957 | |
Class A | | | 16,379 | |
Service Class | | | 5,745 | |
Sweep Class | | | 179,698 | |
Shareholder servicing fees | | | | |
Class A | | | 17,159 | |
Service Class | | | 11,502 | |
Sweep Class | | | 203,970 | |
Distribution fees | | | | |
Sweep Class | | | 285,883 | |
Custody and accounting fees | | | 7,970 | |
Professional fees | | | 13,789 | |
Registration fees | | | 19,727 | |
Shareholder report expenses | | | 15,968 | |
Trustees’ fees and expenses | | | 5,951 | |
Other fees and expenses | | | 5,158 | |
| | | | |
Total expenses | | | 1,117,596 | |
Less: Fee waivers and/or expense reimbursements | | | (933,545 | ) |
| | | | |
Net expenses | | | 184,051 | |
| | | | |
Net investment income | | | 9,381 | |
Net realized gains on investments | | | 3,157 | |
| | | | |
Net increase in net assets resulting from operations | | $ | 12,538 | |
| | | | |
The accompanying notes are an integral part of these financial statements.
| | | | | | |
| Statements of Changes in Net Assets | | Wells Fargo Advantage New Jersey Municipal Money Market Fund | | | 13 | |
| | | | | | | | | | | | | | | | |
| | | Six Months Ended July 31, 2011 (Unaudited) | | | Year Ended January 31, 20111 | |
| | | | |
Operations | | | | | | | | | | | | | | | | |
Net investment income | | | | | | $ | 9,381 | | | | | | | $ | 22,388 | |
Net realized gains on investments | | | | | | | 3,157 | | | | | | | | 3,817 | |
| | | | | | | | | | | | | | | | |
Net increase in net assets resulting from operations | | | | | | | 12,538 | | | | | | | | 26,205 | |
| | | | | | | | | | | | | | | | |
| | | | |
Distributions to shareholders from | | | | | | | | | | | | | | | | |
Net investment income | | | | | | | | | | | | | | | | |
Class A | | | | | | | (744 | ) | | | | | | | (1,760 | ) |
Service Class | | | | | | | (478 | ) | | | | | | | (1,142 | )2 |
Sweep Class | | | | | | | (8,159 | ) | | | | | | | (19,486 | )3 |
Net realized gains | | | | | | | | | | | | | | | | |
Class A | | | | | | | 0 | | | | | | | | (260 | ) |
Service Class | | | | | | | 0 | | | | | | | | (138 | )2 |
Sweep Class | | | | | | | 0 | | | | | | | | (2,939 | )3 |
| | | | | | | | | | | | | | | | |
Total distributions to shareholders | | | | | | | (9,381 | ) | | | | | | | (25,725 | ) |
| | | | | | | | | | | | | | | | |
| | | | |
| | | Shares | | | | | | Shares | | | | |
| | | | |
Capital share transactions | | | | | | | | | | | | | | | | |
Proceeds from shares sold | | | | | | | | | | | | | | | | |
Class A | | | 4,054,918 | | | | 4,054,918 | | | | 17,056,974 | | | | 17,056,974 | |
Service Class | | | 9,260,793 | | | | 9,260,793 | | | | 17,077,270 | 2 | | | 17,077,270 | 2 |
Sweep Class | | | 240,633,382 | | | | 240,633,382 | | | | 1,077,592,170 | 3 | | | 1,077,592,170 | 3 |
| | | | | | | | | | | | | | | | |
| | | | | | | 253,949,093 | | | | | | | | 1,111,726,414 | |
| | | | | | | | | | | | | | | | |
Reinvestment of distributions | | | | | | | | | | | | | | | | |
Class A | | | 721 | | | | 721 | | | | 1,841 | | | | 1,841 | |
Service Class | | | 101 | | | | 101 | | | | 371 | 2 | | | 371 | 2 |
Sweep Class | | | 8,159 | | | | 8,159 | | | | 22,425 | 3 | | | 22,425 | 3 |
| | | | | | | | | | | | | | | | |
| | | | | | | 8,981 | | | | | | | | 24,637 | |
| | | | | | | | | | | | | | | | |
Payment for shares redeemed | | | | | | | | | | | | | | | | |
Class A | | | (4,884,229 | ) | | | (4,884,229 | ) | | | (21,483,188 | ) | | | (21,483,188 | ) |
Service Class | | | (7,274,634 | ) | | | (7,274,634 | ) | | | (18,926,791 | )2 | | | (18,926,791 | )2 |
Sweep Class | | | (318,360,708 | ) | | | (318,360,708 | ) | | | (1,099,058,988 | )3 | | | (1,099,058,988 | )3 |
| | | | | | | | | | | | | | | | |
| | | | | | | (330,519,571 | ) | | | | | | | (1,139,468,967 | ) |
| | | | | | | | | | | | | | | | |
Net decrease in net assets resulting
from capital share transactions | | | | | | | (76,561,497 | ) | | | | | | | (27,717,916 | ) |
| | | | | | | | | | | | | | | | |
Total decrease in net assets | | | | | | | (76,558,340 | ) | | | | | | | (27,717,436 | ) |
| | | | | | | | | | | | | | | | |
| | | | |
Net assets | | | | | | | | | | | | | | | | |
Beginning of period | | | | | | | 216,181,801 | | | | | | | | 243,899,237 | |
| | | | | | | | | | | | | | | | |
End of period | | | | | | $ | 139,623,461 | | | | | | | $ | 216,181,801 | |
| | | | | | | | | | | | | | | | |
Undistributed net investment income | | | | | | $ | 72,896 | | | | | | | $ | 72,896 | |
| | | | | | | | | | | | | | | | |
| 1. | After the close of business on July 9, 2010, the Fund acquired the net assets of Evergreen New Jersey Municipal Money Market Fund which became the accounting and performance survivor in the transaction. The information for the period prior to July 12, 2010 is that of Evergreen New Jersey Municipal Money Market Fund. |
| 2. | Class I shares of Evergreen New Jersey Municipal Money Market Fund became Service Class shares on July 12, 2010. |
| 3. | Class S shares of Evergreen New Jersey Municipal Money Market Fund became Sweep Class shares on July 12, 2010. |
The accompanying notes are an integral part of these financial statements.
| | | | |
| 14 | | Wells Fargo Advantage New Jersey Municipal Money Market Fund | | Financial Highlights |
(For a share outstanding throughout each period)
| | | | | | | | | | | | | | | | | | | | | | | | |
| | | Six Months Ended
July 31, 2011
(Unaudited) | | | Year Ended January 31, | |
| Class A | | | 20111 | | | 20101 | | | 20091 | | | 20081 | | | 20071 | |
Net asset value, beginning of period | | $ | 1.00 | | | $ | 1.00 | | | $ | 1.00 | | | $ | 1.00 | | | $ | 1.00 | | | $ | 1.00 | |
Net investment income | | | 0.00 | 2 | | | 0.00 | 2 | | | 0.00 | 2 | | | 0.01 | | | | 0.03 | | | | 0.03 | |
Net realized gains (losses) on investments | | | 0.00 | 2 | | | 0.00 | 2 | | | 0.00 | | | | 0.00 | | | | 0.00 | | | | 0.00 | |
| | | | | | | | | | | | | | | | | | | | | | | | |
Total from investment operations | | | 0.00 | 2 | | | 0.00 | 2 | | | 0.00 | 2 | | | 0.01 | | | | 0.03 | | | | 0.03 | |
Distributions to shareholders from | | | | | | | | | | | | | | | | | | | | | | | | |
Net investment income | | | (0.00 | )2 | | | (0.00 | )2 | | | (0.00 | )2 | | | (0.01 | ) | | | (0.03 | ) | | | (0.03 | ) |
Net realized gains | | | 0.00 | | | | (0.00 | )2 | | | 0.00 | | | | 0.00 | | | | 0.00 | | | | 0.00 | |
| | | | | | | | | | | | | | | | | | | | | | | | |
Total distributions to shareholders | | | (0.00 | )2 | | | (0.00 | )2 | | | (0.00 | )2 | | | (0.01 | ) | | | (0.03 | ) | | | (0.03 | ) |
Net asset value, end of period | | $ | 1.00 | | | $ | 1.00 | | | $ | 1.00 | | | $ | 1.00 | | | $ | 1.00 | | | $ | 1.00 | |
Total return3 | | | 0.00 | % | | | 0.01 | % | | | 0.09 | % | | | 1.33 | % | | | 3.04 | % | | | 2.77 | % |
Ratios to average net assets (annualized) | | | | | | | | | | | | | | | | | | | | | | | | |
Gross expenses | | | 0.87 | % | | | 0.87 | % | | | 0.90 | % | | | 0.87 | % | | | 0.87 | % | | | 0.87 | % |
Net expenses | | | 0.19 | % | | | 0.32 | % | | | 0.58 | % | | | 0.87 | % | | | 0.87 | % | | | 0.87 | % |
Net investment income | | | 0.01 | % | | | 0.01 | % | | | 0.10 | % | | | 1.30 | % | | | 2.77 | % | | | 2.74 | % |
Supplemental data | | | | | | | | | | | | | | | | | | | | | | | | |
Net assets, end of period (000’s omitted) | | | $14,610 | | | | $15,438 | | | | $19,885 | | | | $35,927 | | | | $36,121 | | | | $22,145 | |
| 1. | After the close of business on July 9, 2010, the Fund acquired the net assets of Evergreen New Jersey Municipal Money Market Fund which became the accounting and performance survivor in the transaction. The information for the periods prior to July 12, 2010 is that of Class A of Evergreen New Jersey Municipal Money Market Fund. |
| 2. | Amount is less than $0.005. |
| 3. | Returns for periods of less than one year are not annualized. |
The accompanying notes are an integral part of these financial statements.
| | | | | | |
| Financial Highlights | | Wells Fargo Advantage New Jersey Municipal Money Market Fund | | | 15 | |
(For a share outstanding throughout each period)
| | | | | | | | | | | | | | | | | | | | | | | | |
| | | Six Months Ended
July 31, 2011
(Unaudited) | | | Year Ended January 31, | |
| Service Class | | | 20111 | | | 20101 | | | 20091 | | | 20081 | | | 20071 | |
Net asset value, beginning of period | | $ | 1.00 | | | $ | 1.00 | | | $ | 1.00 | | | $ | 1.00 | | | $ | 1.00 | | | $ | 1.00 | |
Net investment income | | | 0.00 | 2 | | | 0.00 | 2 | | | 0.00 | 2 | | | 0.02 | | | | 0.03 | | | | 0.03 | |
Net realized gains (losses) on investments | | | 0.00 | 2 | | | 0.00 | 2 | | | 0.00 | | | | 0.00 | | | | 0.00 | | | | 0.00 | |
| | | | | | | | | | | | | | | | | | | | | | | | |
Total from investment operations | | | 0.00 | 2 | | | 0.00 | 2 | | | 0.00 | 2 | | | 0.02 | | | | 0.03 | | | | 0.03 | |
Distributions to shareholders from | | | | | | | | | | | | | | | | | | | | | | | | |
Net investment income | | | (0.00 | )2 | | | (0.00 | )2 | | | (0.00 | )2 | | | (0.02 | ) | | | (0.03 | ) | | | (0.03 | ) |
Net realized gains | | | 0.00 | | | | (0.00 | )2 | | | 0.00 | | | | 0.00 | | | | 0.00 | | | | 0.00 | |
| | | | | | | | | | | | | | | | | | | | | | | | |
Total distributions to shareholders | | | (0.00 | )2 | | | (0.00 | )2 | | | (0.00 | )2 | | | (0.02 | ) | | | (0.03 | ) | | | (0.03 | ) |
Net asset value, end of period | | $ | 1.00 | | | $ | 1.00 | | | $ | 1.00 | | | $ | 1.00 | | | $ | 1.00 | | | $ | 1.00 | |
Total return3 | | | 0.00 | % | | | 0.01 | % | | | 0.20 | % | | | 1.63 | % | | | 3.35 | % | | | 3.07 | % |
Ratios to average net assets (annualized) | | | | | | | | | | | | | | | | | | | | | | | | |
Gross expenses | | | 0.78 | % | | | 0.68 | % | | | 0.60 | % | | | 0.58 | % | | | 0.57 | % | | | 0.57 | % |
Net expenses | | | 0.18 | % | | | 0.32 | % | | | 0.46 | % | | | 0.58 | % | | | 0.57 | % | | | 0.57 | % |
Net investment income | | | 0.01 | % | | | 0.01 | % | | | 0.21 | % | | | 1.60 | % | | | 3.07 | % | | | 3.02 | % |
Supplemental data | | | | | | | | | | | | | | | | | | | | | | | | |
Net assets, end of period (000’s omitted) | | | $10,820 | | | | $8,834 | | | | $10,684 | | | | $19,115 | | | | $21,147 | | | | $15,313 | |
| 1. | After the close of business on July 9, 2010, the Fund acquired the net assets of Evergreen New Jersey Municipal Money Market Fund which became the accounting and performance survivor in the transaction. The information for the periods prior to July 12, 2010 is that of Class I of Evergreen New Jersey Municipal Money Market Fund. |
| 2. | Amount is less than $0.005. |
| 3. | Returns for periods of less than one year are not annualized. |
The accompanying notes are an integral part of these financial statements.
| | | | |
| 16 | | Wells Fargo Advantage New Jersey Municipal Money Market Fund | | Financial Highlights |
(For a share outstanding throughout each period)
| | | | | | | | | | | | | | | | | | | | | | | | |
| | | Six Months Ended
July 31, 2011
(Unaudited) | | | Year Ended January 31, | |
| Sweep Class | | | 20111 | | | 20101 | | | 20091 | | | 20081 | | | 20071 | |
Net asset value, beginning of period | | $ | 1.00 | | | $ | 1.00 | | | $ | 1.00 | | | $ | 1.00 | | | $ | 1.00 | | | $ | 1.00 | |
Net investment income | | | 0.00 | 2 | | | 0.00 | 2 | | | 0.00 | 2 | | | 0.01 | | | | 0.03 | | | | 0.02 | |
Net realized gains (losses) on investments | | | 0.00 | 2 | | | 0.00 | 2 | | | 0.00 | | | | 0.00 | | | | 0.00 | | | | 0.00 | |
| | | | | | | | | | | | | | | | | | | | | | | | |
Total from investment operations | | | 0.00 | 2 | | | 0.00 | 2 | | | 0.00 | 2 | | | 0.01 | | | | 0.03 | | | | 0.02 | |
Distributions to shareholders from | | | | | | | | | | | | | | | | | | | | | | | | |
Net investment income | | | (0.00 | )2 | | | (0.00 | )2 | | | (0.00 | )2 | | | (0.01 | ) | | | (0.03 | ) | | | (0.02 | ) |
Net realized gains | | | 0.00 | | | | (0.00 | )2 | | | 0.00 | | | | 0.00 | | | | 0.00 | | | | 0.00 | |
| | | | | | | | | | | | | | | | | | | | | | | | |
Total distributions to shareholders | | | (0.00 | )2 | | | (0.00 | )2 | | | (0.00 | )2 | | | (0.01 | ) | | | (0.03 | ) | | | (0.02 | ) |
Net asset value, end of period | | $ | 1.00 | | | $ | 1.00 | | | $ | 1.00 | | | $ | 1.00 | | | $ | 1.00 | | | $ | 1.00 | |
Total return3 | | | 0.00 | % | | | 0.01 | % | | | 0.03 | % | | | 1.03 | % | | | 2.73 | % | | | 2.46 | % |
Ratios to average net assets (annualized) | | | | | | | | | | | | | | | | | | | | | | | | |
Gross expenses | | | 1.24 | % | | | 1.19 | % | | | 1.19 | % | | | 1.18 | % | | | 1.17 | % | | | 1.17 | % |
Net expenses | | | 0.20 | % | | | 0.32 | % | | | 0.63 | % | | | 1.17 | % | | | 1.17 | % | | | 1.17 | % |
Net investment income | | | 0.01 | % | | | 0.01 | % | | | 0.03 | % | | | 1.00 | % | | | 2.48 | % | | | 2.42 | % |
Supplemental data | | | | | | | | | | | | | | | | | | | | | | | | |
Net assets, end of period (000’s omitted) | | | $114,193 | | | | $191,910 | | | | $213,330 | | | | $225,386 | | | | $210,726 | | | | $168,806 | |
| 1. | After the close of business on July 9, 2010, the Fund acquired the net assets of Evergreen New Jersey Municipal Money Market Fund which became the accounting and performance survivor in the transaction. The information for the periods prior to July 12, 2010 is that of Class S of Evergreen New Jersey Municipal Money Market Fund. |
| 2. | Amount is less than $0.005. |
| 3. | Returns for periods of less than one year are not annualized. |
The accompanying notes are an integral part of these financial statements.
| | | | | | |
| Notes to Financial Statements (Unaudited) | | Wells Fargo Advantage New Jersey Municipal Money Market Fund | | | 17 | |
1. ORGANIZATION
Wells Fargo Funds Trust (the “Trust”), a Delaware statutory trust organized on March 10, 1999, is an open-end management investment company registered under the Investment Company Act of 1940, as amended (the “1940 Act”). These financial statements report on Wells Fargo Advantage New Jersey Municipal Money Market Fund (the “Fund”) which is a diversified series of the Trust.
2. SIGNIFICANT ACCOUNTING POLICIES
The following significant accounting policies, which are consistently followed in the preparation of the financial statements of the Fund, are in conformity with U.S. generally accepted accounting principles which require management to make estimates and assumptions that affect the reported amounts of assets and liabilities, disclosure of contingent assets and liabilities at the date of the financial statements, and the reported amounts of revenues and expenses during the reporting period. Actual results could differ from those estimates.
Securities valuation
As permitted under Rule 2a-7 of the 1940 Act, securities are valued at amortized cost, which approximates fair value.
The valuation techniques used by the Fund to measure fair value are consistent with the market approach, income approach and/or cost approach, where applicable, for each security type.
Security transactions and income recognition
Securities transactions are recorded on a trade date basis. Realized gains or losses are reported on the basis of identified cost of securities delivered.
Interest income is accrued daily and bond discounts are accreted and premiums are amortized daily based on the effective interest method. To the extent debt obligations are placed on non-accrual status, any related interest income may be reduced by writing off interest receivables when the collection of all or a portion of interest has become doubtful based on consistently applied procedures. If the issuer subsequently resumes interest payments or when the collectability of interest is reasonably assured, the debt obligation is removed from non-accrual status.
Distributions to shareholders
Distributions to shareholders from net investment income are accrued daily and paid monthly. Distributions from net realized gains, if any, are recorded on the ex-dividend date. Such distributions are determined in conformity with income tax regulations, which may differ from generally accepted accounting principles.
Federal and other taxes
The Fund intends to continue to qualify as a regulated investment company by distributing substantially all of its investment company taxable and tax-exempt income and any net realized capital gains (after reduction for capital loss carryforwards) sufficient to relieve it from all, or substantially all, federal income taxes. Accordingly, no provision for federal income taxes was required.
The Fund’s income and federal excise tax returns and all financial records supporting those returns for the prior three fiscal years are subject to examination by the federal and Delaware revenue authorities.
Under the recently enacted Regulated Investment Company Modernization Act of 2010, the Fund will be permitted to carry forward capital losses incurred in taxable years beginning after December 22, 2010 for an unlimited period. However, any losses incurred during those future taxable years will be required to be utilized prior to the losses incurred in pre-enactment taxable years. As a result of this ordering rule, pre-enactment capital loss carryforwards may be more likely to expire unused. Additionally, post-enactment capital losses that are carried forward will retain their character as either short-term or long-term capital losses rather than being considered all short-term as under previous law.
Class allocations
The separate classes of shares offered by the Fund differ principally in distribution, shareholder servicing and administration fees. Shareholders of each class bear certain expenses that pertain to that particular class. All shareholders bear the common expenses of the Fund, earn income from the portfolio, and are allocated unrealized gains and losses pro rata based on the average daily net assets of each class, without distinction between share classes. Dividends are determined separately for each class based on income and expenses allocable to each class. Realized gains and losses are
| | | | |
| 18 | | Wells Fargo Advantage New Jersey Municipal Money Market Fund | | Notes to Financial Statements (Unaudited) |
allocated to each class pro rata based upon the net assets of each class on the date realized. Differences in per share dividend rates generally result from the relative weightings of pro rata income and realized gain allocations and from differences in separate class expenses, including distribution, shareholder servicing and administration fees.
3. FAIR VALUATION MEASUREMENTS
Fair value measurements of investments are determined within a framework that has established a fair value hierarchy based upon the various data inputs utilized in determining the value of the Fund’s investments. The three-level hierarchy gives the highest priority to unadjusted quoted prices in active markets for identical assets or liabilities (Level 1) and the lowest priority to unobservable inputs (Level 3). The Fund’s investments are classified within the fair value hierarchy based on the lowest level of input that is significant to the fair value measurement. The inputs are summarized into three broad levels as follows:
| n | | Level 1 – quoted prices in active markets for identical securities |
| n | | Level 2 – other significant observable inputs (including quoted prices for similar securities, interest rates, prepayment speeds, credit risk, etc.) |
| n | | Level 3 – significant unobservable inputs (including the Fund’s own assumptions in determining the fair value of investments) |
The inputs or methodologies used for valuing securities are not necessarily an indication of the risk associated with investing in those securities.
At July 31, 2011, all of the Fund’s investments in securities carried at fair value were designated as Level 2 since the primary inputs include credit quality of the issuer and short-term interest rates which are observable.
Further details on the major security types can be found in the Fund’s Portfolio of Investments.
4. TRANSACTIONS WITH AFFILIATES AND OTHER EXPENSES
Advisory fee
The Trust has entered into an advisory contract with Wells Fargo Funds Management, LLC (“Funds Management”), an indirect wholly owned subsidiary of Wells Fargo & Company (“Wells Fargo”). The adviser is responsible for implementing investment policies and guidelines and for supervising the sub-adviser, who is responsible for day-to-day portfolio management of the Fund.
Pursuant to the contract, Funds Management is entitled to receive an annual advisory fee starting at 0.30% and declining to 0.20% as the average daily net assets of the Fund increase. For the six months ended July 31, 2011, the advisory fee was equivalent to an annual rate of 0.30% of the Fund’s average daily net assets.
Funds Management may retain the services of certain sub-advisers to provide daily portfolio management to the Fund. The fees related to sub-advisory services are borne directly by the adviser and do not increase the overall fees paid by the Fund to the adviser. Wells Capital Management Incorporated, an affiliate of Funds Management, is the sub-adviser to the Fund and is entitled to receive a fee from the adviser at an annual rate starting at 0.05% and declining to 0.01% as the average daily net assets of the Fund increase.
Administration and transfer agent fees
The Trust has entered into an administration agreement with Funds Management. Under this agreement, for providing administrative services, which includes paying fees and expenses for services provided by the transfer agent, sub-transfer agents, omnibus account servicers and record-keepers, Funds Management is entitled to receive from the Fund an annual fund level administration fee starting at 0.05% and declining to 0.03% as the average daily net assets of the Fund increase and a class level administration fee which is calculated based on the average daily net assets of each class as follows:
| | | | |
| | | Class Level Administration Fee | |
Class A, Sweep Class | | | 0.22 | % |
Service Class | | | 0.12 | |
| | | | | | |
| Notes to Financial Statements (Unaudited) | | Wells Fargo Advantage New Jersey Municipal Money Market Fund | | | 19 | |
Distribution fees
The Trust has adopted a Distribution Plan for Sweep Class shares of the Fund pursuant to Rule 12b-1 under the 1940 Act. Distribution fees are charged to the Sweep Class shares and paid to Wells Fargo Funds Distributor, LLC, the principal underwriter, at an annual rate of 0.35% of the average daily net assets of Sweep Class.
Shareholder servicing fees
The Trust has entered into contracts with one or more shareholder servicing agents, whereby Class A, Service Class and Sweep Class of the Fund is charged a fee at an annual rate of 0.25% of the respective average daily net assets of each class.
A portion of these total shareholder servicing fees were paid to affiliates of Wells Fargo.
5. CONCENTRATION RISK
The Fund invests a substantial portion of its assets in issuers of municipal debt securities located in a single state, therefore, it may be more affected by economic and political developments in that state or region than would be a comparable general tax-exempt mutual fund.
6. INDEMNIFICATION
Under the Trust’s organizational documents, the officers and directors are indemnified against certain liabilities that may arise out of performance of their duties to the Trust. Additionally, in the normal course of business, the Trust may enter into contracts with service providers that contain a variety of indemnification clauses. The Trust’s maximum exposure under these arrangements is dependent on future claims that may be made against the Fund and, therefore, cannot be estimated.
7. NEW ACCOUNTING PRONOUNCEMENTS
In May 2011, the Financial Accounting Standards Board (“FASB”) issued Accounting Standards Update (“ASU”) No. 2011-04 “Amendments to Achieve Common Fair Value Measurement and Disclosure Requirements in U.S. GAAP and IFRSs”. ASU No. 2011-04 amends FASB ASC Topic 820, Fair Value Measurements and Disclosures, to establish common requirements for measuring fair value and for disclosing information about fair value measurements in accordance with GAAP. The ASU is effective prospectively for interim and annual periods beginning after December 15, 2011.
In April 2011, FASB issued ASU No. 2011-03 “Reconsideration of Effective Control for Repurchase Agreements”. ASU No. 2011-03 amends FASB ASC Topic 860, Transfers and Servicing, specifically the criteria required to determine whether a repurchase agreement (repo) and similar agreements should be accounted for as sales of financial assets or secured borrowings with commitments. ASU No. 2011-03 changes the assessment of effective control by focusing on the transferor’s contractual rights and obligations and removing the criterion to assess its ability to exercise those rights or honor those obligations. This could result in changes to the way entities account for certain transactions including repurchase agreements, mortgage dollar rolls and reverse repurchase agreements. The ASU will become effective on a prospective basis for new transfers and modifications to existing transactions as of the beginning of the first interim or annual period beginning on or after December 15, 2011.
As of July 31, 2011, management of the Fund is currently assessing the potential impact, in addition to expanded financial statement disclosure, that may result from adopting these ASUs.
| | | | |
| 20 | | Wells Fargo Advantage New Jersey Municipal Money Market Fund | | Other Information (Unaudited) |
PORTFOLIO HOLDINGS INFORMATION
The complete portfolio holdings for the Fund are publicly available on the Fund’s Web site
(www.wellsfargo.com/advantagefunds) on a monthly, seven-day delayed basis. The Fund files its complete schedule of portfolio holdings with the SEC for the first and third quarters of each fiscal year on Form N-Q, which is available without charge by visiting the SEC Web site at www.sec.gov. In addition, the Fund’s Form N-Q may be reviewed and copied at the SEC’s Public Reference Room in Washington, DC, and at regional offices in New York City, at 233 Broadway, and in Chicago, at 175 West Jackson Boulevard, Suite 900. Information about the Public Reference Room may be obtained by calling 1-800-SEC-0330.
PROXY VOTING INFORMATION
A description of the policies and procedures that the Fund uses to determine how to vote proxies relating to portfolio securities is available without charge, upon request, by calling 1-800-222-8222, visiting our Web site at www.wellsfargo.com/advantagefunds, or visiting the SEC Web site at www.sec.gov. Information regarding how the Fund voted proxies relating to portfolio securities during the most recent 12-month period ended June 30 is available without charge on the Fund’s Web site at www.wellsfargo.com/advantagefunds or by visiting the SEC Web site at www.sec.gov.
| | | | | | |
| Other Information (Unaudited) | | Wells Fargo Advantage New Jersey Municipal Money Market Fund | | | 21 | |
BOARD OF TRUSTEES
The following table provides basic information about the Board of Trustees (the “Trustees”) of the Trust and Officers of the Trust. This table should be read in conjunction with the Prospectus and the Statement of Additional Information1 of the Fund. Each of the Trustees and Officers listed below acts in identical capacities for the Wells Fargo Advantage family of funds, which consists of 144 funds comprising the Wells Fargo Funds Trust, Wells Fargo Variable Trust, Wells Fargo Master Trust and four closed-end funds (collectively the “Fund Complex”). All of the Trustees are also Members of the Audit and Governance Committees of each Trust in the Fund Complex. The mailing address of each Trustee and Officer is 525 Market Street, 12th Floor, San Francisco, CA 94105. Each Trustee and Officer serves an indefinite term, however, each Trustee serves such term until reaching the mandatory retirement age established by the Trustees.
Independent Trustees
| | | | | | |
Name and Year of Birth | | Position Held and Length of Service | | Principal Occupations During Past Five Years | | Other Directorships During
Past Five Years |
Peter G. Gordon
(Born 1942) | | Trustee, since 1998; Chairman, since 2005 | | Co-Founder, Chairman, President and CEO of Crystal Geyser. Water Company. Trustee Emeritus, Colby College | | Asset Allocation Trust |
Isaiah Harris, Jr.
(Born 1952) | | Trustee, since 2009 | | Retired. Prior thereto, President and CEO of BellSouth Advertising and Publishing Corp. from 2005 to 2007, President and CEO of BellSouth Enterprises from 2004 to 2005 and President of BellSouth Consumer Services from 2000 to 2003. Emeritus member of the Iowa State University Foundation Board of Governors. Emeritus Member of the Advisory Board of Iowa State University School of Business. Mr. Harris is a certified public accountant. | | CIGNA Corporation; Deluxe Corporation; Asset Allocation Trust |
Judith M. Johnson
(Born 1949) | | Trustee, since 2008 | | Retired. Prior thereto, Chief Executive Officer and Chief Investment Officer of Minneapolis Employees Retirement Fund from 1996 to 2008. Ms. Johnson is an attorney, certified public accountant and a certified managerial accountant. | | Asset Allocation Trust |
Leroy Keith, Jr.
(Born 1939) | | Trustee, since 2010 | | Chairman, Bloc Global Services (development and construction), Trustee of the Evergreen Funds from 1983 to 2010. Former Managing Director, Almanac Capital Management (commodities firm), former Partner, Stonington Partners, Inc. (private equity fund), former Director, Obagi Medical Products Co. and former Director, Lincoln Educational Services. | | Trustee, Virtus Fund Complex (consisting of 45 portfolios as of 12/31/10); Director, Diversapack Co. (packaging company); Asset Allocation Trust |
David F. Larcker
(Born 1950) | | Trustee, since 2009 | | James Irvin Miller Professor of Accounting at the Graduate School of Business, Stanford University, Director of Corporate Governance Research Program and Co-Director of The Rock Center for Corporate Governance since 2006. From 2005 to 2008, Professor of Accounting at the Graduate School of Business, Stanford University. Prior thereto, Ernst & Young Professor of Accounting at The Wharton School, University of Pennsylvania from 1985 to 2005. | | Asset Allocation Trust |
Olivia S. Mitchell
(Born 1953) | | Trustee, since 2006 | | International Foundation of Employee Benefit Plans Professor and Chair of the Department of Insurance and Risk Management, Wharton School of the University of Pennsylvania since 1993. Director of Wharton’s Pension Research Council and Boettner Center on Pensions & Retirement Research, and Research Associate at the National Bureau of Economic Research. Previously, Cornell University Professor from 1978 to 1993. | | Asset Allocation Trust |
| | | | |
| 22 | | Wells Fargo Advantage New Jersey Municipal Money Market Fund | | Other Information (Unaudited) |
| | | | | | |
Name and Year of Birth | | Position Held and Length of Service | | Principal Occupations During Past Five Years | | Other Directorships During
Past Five Years |
Timothy J. Penny
(Born 1951) | | Trustee, since 1996 | | President and CEO of Southern Minnesota Initiative Foundation, a non-profit organization, since 2007 and Senior Fellow at the Humphrey Institute Policy Forum at the University of Minnesota since 1995. Member of the Board of Trustees of NorthStar Education Finance, Inc., a non-profit organization, since 2007. | | Asset Allocation Trust |
Michael S. Scofield
(Born 1943) | | Trustee, since 2010 | | Currently serves on the Investment Company Institute’s Board of Governors and Executive Committee as well the In dependent Director’s Counsel Board of Governors and Executive Committee. Former Chairman of the Independent Directors Counsel. Trustee of the Evergreen Funds from 1984 to 2010. Retired Attorney, Law Offices of Michael S. Scofield and former Director and Chairman, Branded Media Corporation (multi-media branding company). | | Asset Allocation Trust |
Donald C. Willeke
(Born 1940) | | Trustee, since 1996 | | Principal of the law firm of Willeke & Daniels. General Counsel of the Minneapolis Employees Retirement Fund from 1984 until its consolidation into the Minnesota Public Employees Retirement Association on June 30, 2010. | | Asset Allocation Trust |
Officers
| | | | | | |
Name and Year of Birth | | Position Held and
Length of Service | | Principal Occupations During Past Five Years | | |
Karla M. Rabusch
(Born 1959) | | President, since 2003 | | Executive Vice President of Wells Fargo Bank, N.A. and President of Wells Fargo Funds Management, LLC since 2003. Senior Vice President and Chief Administrative Officer of Wells Fargo Funds Management, LLC from 2001 to 2003. | | |
C. David Messman
(Born 1960) | | Secretary, since 2000; Chief Legal Counsel, since 2003 | | Senior Vice President and Secretary of Wells Fargo Funds Management, LLC since 2001. Vice President and Managing Counsel of Wells Fargo Bank, N.A. since 1996. | | |
Kasey Phillips
(Born 1970) | | Treasurer, since 2008 | | Senior Vice President of Wells Fargo Funds Management, LLC since 2009. Senior Vice President of Evergreen Investment Management Company, LLC from 2006 to 2010. Treasurer of the Evergreen Funds from 2005 to 2010. Vice President and Assistant Vice President of Evergreen Investment Services, Inc. from 1999 to 2006. | | |
David Berardi
(Born 1975) | | Assistant Treasurer, since 2009 | | Vice President of Wells Fargo Funds Management, LLC since 2009 . Vice President of Evergreen Investment Management Company, LLC from 2008 to 2010. Assistant Vice President of Evergreen Investment Services, Inc. from 2004 to 2008. Manager of Fund Reporting and Control for Evergreen Investment Management Company, LLC from 2004 to 2010. | | |
Jeremy DePalma
(Born 1974) | | Assistant Treasurer, since 2009 | | Senior Vice President of Wells Fargo Funds Management, LLC since 2009. Senior Vice President of Evergreen Investment Management Company, LLC from 2008 to 2010. Vice President, Evergreen Investment Services, Inc. from 2004 to 2007. Assistant Vice President, Evergreen Investment Services, Inc. from 2000 to 2004 and the head of the Fund Reporting and Control Team within Fund Administration from 2005 to 2010. | | |
Debra Ann Early
(Born 1964) | | Chief Compliance Officer, since 2007 | | Chief Compliance Officer of Wells Fargo Funds Management, LLC since 2007. Chief Compliance Officer of Parnassus Investments from 2005 to 2007. Chief Financial Officer of Parnassus Investments from 2004 to 2007 and Senior Audit Manager of PricewaterhouseCoopers LLP from 1998 to 2004. | | |
| 1. | The Statement of Additional Information includes additional information about the Fund’s Trustees and is available, without charge, upon request, by calling 1-800-222-8222 or by visiting the Fund’s Web site at www.wellsfargo.com/advantagefunds. |
| | | | | | |
| Other Information (Unaudited) | | Wells Fargo Advantage New Jersey Municipal Money Market Fund | | | 23 | |
BOARD CONSIDERATION OF INVESTMENT ADVISORY AND SUB-ADVISORY AGREEMENTS:
California Municipal Money Market Fund, Municipal Cash Management Money Market Fund, Municipal Money Market Fund, National Tax-Free Money Market Fund, New Jersey Municipal Money Market Fund, New York Municipal Money Market Fund and Pennsylvania Municipal Money Market Fund
(Not all of the funds described in this Board considerations section are part of this shareholder report. This shareholder report only relates to New Jersey Municipal Money Market Fund.)
Each year, as required by Section 15 of the Investment Company Act of 1940 (the “1940 Act”), the Board of Trustees (the “Board”) of Wells Fargo Funds Trust (the “Trust”), all the members of which have no direct or indirect interest in the investment advisory and sub-advisory agreements and are not “interested persons” of the Trust, as defined in the 1940 Act (the “Independent Trustees”), determines whether to approve the continuation of the Trust’s investment advisory and sub-advisory agreements. In this regard, at an in person meeting held on March 24-25, 2011 (the “Meeting”), the Board reviewed and re-approved: (i) an investment advisory agreement with Wells Fargo Funds Management, LLC (“Funds Management”) for each of the California Municipal Money Market Fund, Municipal Cash Management Money Market Fund, Municipal Money Market Fund, National Tax-Free Money Market Fund, New Jersey Municipal Money Market Fund, New York Municipal Money Market Fund and Pennsylvania Municipal Money Market Fund (collectively, the “Funds”); and (ii) an investment sub-advisory agreement with Wells Capital Management Incorporated (“Wells Capital Management”) for each of the Funds. The investment advisory agreements with Funds Management and the investment sub-advisory agreements with Wells Capital Management are collectively referred to as the “Advisory Agreements.”
At the Meeting, the Board considered the factors and reached the conclusions described below relating to the selection of Funds Management and Wells Capital Management and continuation of the Advisory Agreements. Prior to the Meeting, the Trustees conferred extensively among themselves and with representatives of Funds Management about these matters. The Board also met throughout the year and received information that was useful to them in considering the continuation of the Advisory Agreements. The Independent Trustees were assisted in their evaluation of the Advisory Agreements by independent legal counsel, from whom they received separate legal advice and with whom they met separately from Funds Management.
Nature, extent and quality of services
The Board received and considered various information regarding the nature, extent and quality of services provided to the Funds by Funds Management and Wells Capital Management under the Advisory Agreements. The Board also received and considered information provided in response to a detailed set of requests submitted by the Independent Trustees’ independent legal counsel on their behalf. The Board received and considered, among other things, information about the background and experience of senior management of Funds Management, and the qualifications, backgrounds, tenures and responsibilities of the portfolio managers primarily responsible for the day-to-day portfolio management of the Funds.
The Board evaluated the ability of Funds Management and Wells Capital Management, based on their respective financial condition, resources, reputation and other attributes, to attract and retain qualified investment professionals, including research, advisory, and supervisory personnel. The Board further considered the compliance programs and compliance records of Funds Management and Wells Capital Management. In addition, the Board took into account the administrative services provided to the Funds by Funds Management and its affiliates.
The Board’s decision to approve the continuation of the Advisory Agreements was based on a comprehensive evaluation of all of the information provided to it. In approving the continuation of the Advisory Agreements, the Board did not identify any particular information or consideration that was all-important or controlling, and each Trustee attributed different weights to various factors. The Board evaluated information provided to it both in terms of the funds generally and with respect to each Fund specifically as it considered appropriate. Although the Board considered the continuation of the Advisory Agreements for each of the Funds as part of the larger process of considering the continuation of the advisory agreements for all of the funds, its decision to continue the Advisory Agreements for each of the Funds was ultimately made on a fund-by-fund basis.
In considering these matters, the Board considered not only the specific information presented in connection with the Meeting, but also the knowledge gained over time through interaction with Funds Management and Wells Capital
| | | | |
| 24 | | Wells Fargo Advantage New Jersey Municipal Money Market Fund | | Other Information (Unaudited) |
Management about various topics, including Funds Management’s oversight of service providers. The above factors, together with those referenced below, are some of the most important, but not necessarily all, factors considered by the Board in concluding that it was satisfied with the nature, extent and quality of the investment advisory services provided to each Fund by Funds Management and Wells Capital Management.
Fund performance and expenses
The Board considered the performance results for each of the Funds over various time periods ended December 31, 2010. The Board also considered these results in comparison to the median performance of a universe of relevant funds (the “Universe”) that were determined by Lipper Inc. (“Lipper”) to be similar to the Funds, and in comparison to each Fund’s benchmark index and to other comparative data. Lipper is an independent provider of investment company data. The Board received a description of the methodology used by Lipper to select the mutual funds in the Universe.
The Board noted that the performance of each of the Funds was generally higher than or in range of the median performance of the Universe for the periods under review.
The Board received and considered information regarding each Fund’s contractual advisory fee and net operating expense ratios and their various components, including actual management fees (which reflect fee waivers, if any), transfer agent, custodian and other non-management fees, Rule 12b-1 and non-Rule 12b-1 fees, service fees and fee waiver and expense reimbursement arrangements. The Board also considered these ratios in comparison to the median ratios of an expense Universe and a narrower expense group of mutual funds (each, an “Expense Group”) that was determined by Lipper to be similar to each Fund. The Board received a description of the methodology used by Lipper to select the mutual funds in a Fund’s Expense Group. The Board noted that the net operating expense ratios of the Service Class, Administrator Class and Institutional Class of each of the Funds were in range of each Fund’s respective Expense Group’s median net operating expense ratio. The Board also noted that the net operating expense ratios of the Class A and Sweep Class of each of the Funds were higher than each Fund’s respective Expense Group’s median net operating expense ratio and that the net operating expense ratio of the Municipal Money Market Fund (Investor Class) was not appreciably higher than the Expense Group’s median net operating expense ratio.
Based on the above-referenced considerations and other factors, the Board concluded that the overall performance and expense structure of the Funds supported the re-approval of the Advisory Agreements for the Funds.
Investment advisory and sub-advisory fee rates
The Board reviewed and considered the contractual investment advisory fee rates that are payable by the Funds to Funds Management for investment advisory services (the “Advisory Agreement Rates”), both on a stand-alone basis and on a combined basis with the Funds’ administration fee rates. The Board took into account the separate administrative and other services covered by the administration fee rates. The Board also reviewed and considered the contractual investment sub-advisory fee rates that are payable by Funds Management to Wells Capital Management for investment sub-advisory services (the “Sub-Advisory Agreement Rates”). In addition, the Board reviewed and considered the existing fee waiver/cap arrangements applicable to the Advisory Agreement Rates and considered the Advisory Agreement Rates after taking the waivers/caps into account (the “Net Advisory Rates”).
The Board received and considered information comparing the Advisory Agreement Rates and Net Advisory Rates with those of other funds in each Fund’s Expense Group median. The Board noted that the Advisory Agreement Rates for each of the Funds were in range of the median rate of each Fund’s Expense Group, except for the Municipal Money Market Fund and the New York Municipal Money Market Fund (Sweep Class). The Board noted that the Net Advisory Rates for the Service Class, Administrator Class and the Institutional Class of each of the Funds were lower than or in range of the median rate of each Fund’s Expense Group. The Board noted that the Net Advisory Rate for the Investor Class, Class A and Sweep Class of each of the Funds was not appreciably higher than the median rate for the Fund’s Expense, except for the Sweep Class of the Municipal Money Market Fund, New Jersey Municipal Money Market Fund and the New York Municipal Money Market Fund. The Board further noted that Funds Management had agreed to continue and, in certain instances, reduce contractual fee cap arrangements for the Funds designed to lower the Funds’ expenses.
The Board also received and considered information about the nature and extent of services offered and fee rates charged by Funds Management and Wells Capital Management to other types of clients. In this regard, the Board received information about differences between the services, and the compliance, reporting, and other legal burdens
| | | | | | |
| Other Information (Unaudited) | | Wells Fargo Advantage New Jersey Municipal Money Market Fund | | | 25 | |
and risks of providing investment advice to mutual funds and those associated with providing advice to non-mutual fund clients such as collective funds or institutional separate accounts.
In each case, the Board determined that the Advisory Agreement Rates for the Funds, both with and without administration fee rates and before and after waivers, were acceptable in light of the Funds’ Expense Group information, the net expense ratio commitments, the services covered by the Advisory Agreements and other information provided. The Board also reviewed and considered the Sub-Advisory Agreement Rates and concluded that the Sub-Advisory Agreement Rates were acceptable in light of the services covered by the Sub-Advisory Agreement and other information provided.
Profitability
The Board received and considered a profitability analysis of Funds Management, as well as an analysis of the profitability to the collective Wells Fargo businesses that provide services to the Funds. It considered that the information provided to it was necessarily estimated, and that the profitability information provided to it, especially on a fund-by-fund basis, did not necessarily provide a precise tool for evaluating the appropriateness of each Fund’s Advisory Agreement Rates in isolation. It noted that the levels of profitability of the Funds to Funds Management varied widely, depending on, among other things, the size and type of fund. The Board concluded that the profitability to Funds Management of the services provided to any of the Funds, individually or in the aggregate, was not unreasonable.
The Board did not consider separate profitability information with respect to Wells Capital Management, because, as an affiliate of Funds Management, its profitability information was subsumed in the collective Wells Fargo profitability analysis provided by Funds Management.
Economies of scale
With respect to possible economies of scale, the Board reviewed the breakpoints in each Fund’s advisory fee structure, which operate generally to reduce the effective Advisory Agreement Rates of the Funds (as a percentage of Fund assets) as the Funds grow in size. It considered that, as a fund shrinks in size, breakpoints conversely result in increasing fee levels. The Board noted that it would continue to review the appropriate levels of breakpoints in the future, and concluded that the breakpoints as implemented appeared to be a reasonable step toward sharing economies of scale with the Funds. However, the Board acknowledged the inherent limitations of any analysis of an investment adviser’s economies of scale and of any attempt to correlate breakpoints with such economies, stemming largely from the Board’s understanding that economies of scale are realized, if at all, by an investment adviser across a variety of products and services, not just with respect to a single fund.
Other benefits to Funds Management and Wells Capital Management
The Board received and considered information regarding potential “fall-out” or ancillary benefits received by Funds Management and its affiliates, including Wells Capital Management, as a result of their relationship with the Funds. Ancillary benefits could include, among others, benefits directly attributable to the relationship of Funds Management and Wells Capital Management with the Funds and benefits potentially derived from an increase in Funds Management’s and Wells Capital Management’s business as a result of their relationship with the Funds (such as the ability to market to shareholders other financial products offered by Funds Management and its affiliates, including Wells Capital Management).
The Board considered that Wells Fargo Funds Distributor, LLC, an affiliate of Funds Management, serves as distributor to the Funds and receives certain compensation for those services. The Board noted that the Funds pay sub-transfer agency fees to various financial institutions, including affiliates of Funds Management that hold fund shares in omnibus accounts. It also considered that these entities may receive distribution-related fees and shareholder servicing payments (including amounts derived from payments under the funds’ Rule 12b-1 plans) in respect of shares sold or held through them.
The Board also reviewed information about whether and to what extent soft dollar credits are sought and how any such credits are utilized and any benefits that may be realized by using an affiliated broker.
Other factors and broader review
The Board also considered the markets for distribution of the Funds’ shares, including the multiple channels through which the Funds’ shares are offered and sold. The Board noted that the Funds are part of one of the few fund families that have both direct-to-fund and intermediary distribution channels. As discussed above, the Board reviews detailed materials received from Funds Management and Wells Capital Management annually as part of the re-approval process
| | | | |
| 26 | | Wells Fargo Advantage New Jersey Municipal Money Market Fund | | Other Information (Unaudited) |
under Section 15 of the 1940 Act and also reviews and assesses information about the quality of the services that the Funds receive throughout the year. In this regard, the Board has reviewed reports of Funds Management at each of its quarterly meetings, which include, among other things, portfolio reviews and performance reports. In addition, the Board confers with portfolio managers at various times throughout the year.
Conclusion
After considering the above-described factors and based on its deliberations and its evaluation of the information described above, the Board concluded that approval of the continuation of the Advisory Agreements for the Funds was in the best interest of the Funds and their shareholders. Accordingly, the Board unanimously approved the continuation of the Advisory Agreements for an additional one-year period.
| | | | | | |
| List of Abbreviations | | Wells Fargo Advantage New Jersey Municipal Money Market Fund | | | 27 | |
The following is a list of common abbreviations for terms and entities which may have appeared in this report.
| ABAG | — Association of Bay Area Governments |
| ACB | — Agricultural Credit Bank |
| ADR | — American Depositary Receipt |
| ADS | — American Depository Shares |
| AGC-ICC | — Assured Guaranty Corporation - Insured Custody Certificates |
| AGM | — Assured Guaranty Municipal |
| AMBAC | — American Municipal Bond Assurance Corporation |
| AMT | — Alternative Minimum Tax |
| ARM | — Adjustable Rate Mortgages |
| BAN | — Bond Anticipation Notes |
| BART | — Bay Area Rapid Transit |
| BHAC | — Berkshire Hathaway Assurance Corporation |
| CCAB | — Convertible Capital Appreciation Bond |
| CDA | — Community Development Authority |
| CDO | — Collateralized Debt Obligation |
| CDSC | — Contingent Deferred Sales Charge |
| CGIC | — Capital Guaranty Insurance Company |
| CGY | — Capital Guaranty Corporation |
| CIFG | — CDC (Caisse des Dépôts et Consignations) IX IS Financial Guarantee |
| COP | — Certificate of Participation |
| DRIVER | — Derivative Inverse Tax-Exempt Receipts |
| DW&P | — Department of Water & Power |
| DWR | — Department of Water Resources |
| ECFA | — Educational & Cultural Facilities Authority |
| EDFA | — Economic Development Finance Authority |
| ETET | — Eagle Tax-Exempt Trust |
| ETF | — Exchange-Traded Fund |
| FFCB | — Federal Farm Credit Bank |
| FGIC | — Financial Guaranty Insurance Corporation |
| FHA | — Federal Housing Authority |
| FHAG | — Federal Housing Agency |
| FHLB | — Federal Home Loan Bank |
| FHLMC | — Federal Home Loan Mortgage Corporation |
| FNMA | — Federal National Mortgage Association |
| GDR | — Global Depositary Receipt |
| GNMA | — Government National Mortgage Association |
| HCFR | — Healthcare Facilities Revenue |
| HEFA | — Health & Educational Facilities Authority |
| HEFAR | — Higher Education Facilities Authority Revenue |
| HFA | — Housing Finance Authority |
| HFFA | — Health Facilities Financing Authority |
| HUD | — Housing & Urban Development |
| IBC | — Insured Bond Certificate |
| IDA | — Industrial Development Authority |
| IDAG | — Industrial Development Agency |
| IDR | — Industrial Development Revenue |
| KRW | — Republic of Korea Won |
| LIBOR | — London Interbank Offered Rate |
| LLC | — Limited Liability Company |
| LLP | — Limited Liability Partnership |
| MBIA | — Municipal Bond Insurance Association |
| MFHR | — Multi-Family Housing Revenue |
| MFMR | — Multi-Family Mortgage Revenue |
| MMD | — Municipal Market Data |
| MSTR | — Municipal Securities Trust Receipts |
| MUD | — Municipal Utility District |
| NATL-RE | — National Public Finance Guarantee Corporation |
| PCFA | — Pollution Control Finance Authority |
| PCR | — Pollution Control Revenue |
| PFA | — Public Finance Authority |
| PFFA | — Public Facilities Financing Authority |
| PFOTER | — Puttable Floating Option Tax-Exempt Receipts |
| plc | — Public Limited Company |
| PSFG | — Public School Fund Guaranty |
| PUTTER | — Puttable Tax-Exempt Receipts |
| R&D | — Research & Development |
| RDA | — Redevelopment Authority |
| RDFA | — Redevelopment Finance Authority |
| REIT | — Real Estate Investment Trust |
| RIB | — Residual Interest Bond |
| ROC | — Reset Option Certificates |
| SAVRS | — Select Auction Variable Rate Securities |
| SFHR | — Single Family Housing Revenue |
| SFMR | — Single Family Mortgage Revenue |
| SLMA | — Student Loan Marketing Association |
| SPDR | — Standard & Poor’s Depositary Receipts |
| STIT | — Short-Term Investment Trust |
| TAN | — Tax Anticipation Notes |
| TIPS | — Treasury Inflation-Protected Securities |
| TRAN | — Tax Revenue Anticipation Notes |
| TCR | — Transferable Custody Receipts |
| TTFA | — Transportation Trust Fund Authority |
| USD | — Unified School District |
| XLCA | — XL Capital Assurance |
This page is intentionally left blank.
This page is intentionally left blank.
This page is intentionally left blank.


FOR MORE INFORMATION
More information about Wells Fargo Advantage Funds is available free upon request. To obtain literature, please write, e-mail, visit the Funds’ Web site, or call:
Wells Fargo Advantage Funds
P.O. Box 8266
Boston, MA 02266-8266
E-mail: wfaf@wellsfargo.com
Web site: www.wellsfargo.com/advantagefunds
Individual investors: 1-800-222-8222
Retail investment professionals: 1-888-877-9275
Institutional investment professionals: 1-866-765-0778
This report and the financial statements contained herein are submitted for the general information of the shareholders of Wells Fargo Advantage Funds. If this report is used for promotional purposes, distribution of the report must be accompanied or preceded by a current prospectus. For a prospectus containing more complete information, including charges and expenses, call 1-800-222-8222 or visit the Funds’ Web site at www.wellsfargo.com/advantagefunds. Please consider the investment objectives, risks, charges, and expenses of the investment carefully before investing. This and other information about Wells Fargo Advantage Funds can be found in the current prospectus. Read the prospectus carefully before you invest or send money.
Wells Fargo Funds Management, LLC, a wholly owned subsidiary of Wells Fargo & Company, provides investment advisory and administrative services for Wells Fargo Advantage Funds. Other affiliates of Wells Fargo & Company provide subadvisory and other services for the Funds. The Funds are distributed by Wells Fargo Funds Distributor, LLC, Member FINRA/SIPC, an affiliate of Wells Fargo & Company.
NOT FDIC INSURED ¡ NO BANK GUARANTEE ¡ MAY LOSE VALUE
© 2011 Wells Fargo Funds Management, LLC. All rights reserved.
| | |
 | | 204806 09-11 SA310/SAR310 7-11 |

Wells Fargo Advantage
New York Municipal Money Market Fund

Semi-Annual Report
July 31, 2011

Reduce clutter. Save trees.
Sign up for electronic delivery of prospectuses and shareholder reports at www.wellsfargo.com/advantagedelivery
Contents
The views expressed and any forward-looking statements are as of July 31, 2011, unless otherwise noted and are those of the Fund managers and/or Wells Fargo Funds Management, LLC. Discussions of individual securities, or the markets generally, or any Wells Fargo Advantage Fund are not intended as individual recommendations. Future events or results may vary significantly from those expressed in any forward-looking statements; the views expressed are subject to change at any time in response to changing circumstances in the market. Wells Fargo Funds Management, LLC, disclaims any obligation to publicly update or revise any views expressed or forward-looking statements.
NOT FDIC INSURED ¡ NO BANK GUARANTEE ¡ MAY LOSE VALUE

WELLS FARGO INVESTMENT HISTORY
| | |
| |
| 1932 | | Keystone creates one of the first mutual fund families. |
| |
| 1971 | | Wells Fargo & Company introduces one of the first institutional index funds. |
| |
| 1978 | | Wells Fargo applies Markowitz and Sharpe’s research on Modern Portfolio Theory to introduce one of the industry’s first Tactical Asset Allocation (TAA) models in institutional separately managed accounts. |
| |
| 1984 | | Wells Fargo Stagecoach Funds launches its first asset allocation fund. |
| |
| 1989 | | The Tactical Asset Allocation (TAA) Model is first applied to Wells Fargo’s asset allocation mutual funds. |
| |
| 1994 | | Wells Fargo introduces the LifePath Funds, one of the first suites of target date funds (now the Wells Fargo Advantage Dow Jones Target Date FundsSM ). |
| |
| 1996 | | Evergreen Investments and Keystone Funds merge. |
| |
| 1997 | | Wells Fargo launches Wells Fargo Advantage WealthBuilder PortfoliosSM, a fund-of-funds suite of products that includes the use of quantitative models to shift assets among investment styles. |
| |
| 1999 | | Norwest Advantage Funds and Stagecoach Funds are reorganized into Wells Fargo Funds after the merger of Norwest and Wells Fargo. |
| |
| 2002 | | Evergreen Retail and Evergreen Institutional companies form the umbrella asset management company, Evergreen Investments. |
| |
| 2005 | | The integration of Strong Funds with Wells Fargo Funds creates Wells Fargo Advantage Funds, resulting in one of the top 20 mutual fund companies in the United States. |
| |
| 2006 | | Wells Fargo Advantage Funds relaunches the target date product line as Wells Fargo Advantage Dow Jones Target Date Funds. |
| |
| 2010 | | The mergers and reorganizations of Evergreen and Wells Fargo Advantage mutual funds are completed, unifying the families under the brand of Wells Fargo Advantage Funds. |
Wells Fargo Advantage Funds®
Wells Fargo Advantage Funds skillfully guides institutions, financial advisors, and individuals through the investment terrain to help them reach their financial objectives. Everything we do on behalf of investors is backed by our unique combination of qualifications.
Strength
Our organization is built on the standards of integrity and service established by our parent company—Wells Fargo & Company—more than 150 years ago. And, because we’re part of a highly diversified financial enterprise, we offer the depth of resources to help investors succeed.
Expertise
Our multi-boutique model offers investors access to the independent thinking of premier investment managers that have been chosen for their time-tested strategies. While each team specializes in a specific investment strategy, collectively they provide investors a wide choice of distinct investment styles. Our dedication to investment excellence doesn’t end with our expertise in manager selection—risk management, analysis, and rigorous ongoing review seek to ensure each manager’s investment process remains consistent.
Partnership
Our collaborative approach is built around understanding the needs and goals of our clients. By adhering to core principles of sound judgment and steady guidance, we support you through every stage of the investment decision process.
Carefully consider the investment objectives, risks, charges, and expenses before investing. For a current prospectus for Wells Fargo Advantage Funds containing this and other information, visit wellsfargo.com/advantagefunds. Read it carefully before investing.
Wells Fargo Funds Management, LLC, a wholly owned subsidiary of Wells Fargo & Company, provides investment advisory and administrative services for Wells Fargo Advantage Funds®. Other affiliates of Wells Fargo & Company provide subadvisory and other services for the Funds. The Funds are distributed by Wells Fargo Funds Distributor, LLC, Member FINRA/SIPC, an affiliate of Wells Fargo & Company.
The “Dow Jones Target Date Indexes” are a product of Dow Jones Indexes, a licensed trademark of CME Group Index Services LLC (“CME”). “Dow Jones” and “Dow Jones Target Date Indexes” are service marks of Dow Jones Trademark Holdings, LLC, and have been licensed for use for certain purposes by CME and sublicensed for use by Global Index Advisors, Inc., and Wells Fargo Funds Management, LLC. The Dow Jones Target Date Indexes are based in part on the Barclays Capital Bond Indexes, which are published by Barclays Capital Inc. The Wells Fargo Advantage Dow Jones Target Date Funds, based on the Dow Jones Target Date Indexes, are not sponsored, endorsed, sold, or promoted by Dow Jones, CME or Barclays Capital or any of their respective affiliates, and neither Dow Jones, CME nor Barclays Capital nor any of their respective affiliates makes any representation regarding the advisability of investing in such product(s) and/or about the quality, accuracy, and/or completeness of the Dow Jones Target Date Indexes or the Barclays Capital Bond Indexes. IN NO EVENT SHALL DOW JONES, CME, BARCLAYS CAPITAL, OR ANY OF THEIR LICENSORS HAVE ANY LIABILITY IN CONNECTION WITH THE Wells Fargo Advantage Dow Jones Target Date Funds INCLUDING, WITHOUT LIMITATION, FOR ANY SPECIAL, PUNITIVE, IN DIRECT, OR CONSEQUENTIAL DAMAGES (INCLUDING LOST PROFITS), EVEN IF NOTIFIED OF THE POSSIBILITY OF SUCH DAMAGES.
NOT FDIC INSURED ¡ NO BANK GUARANTEE ¡ MAY LOSE VALUE
Not part of the semi-annual report.
Wells Fargo Advantage Funds offers more than 110 mutual funds across a wide range of asset classes, representing over $221 billion in assets under management, as of July 31, 2011.
| | | | |
| Equity Funds | | | | |
Asia Pacific Fund | | Global Opportunities Fund | | Premier Large Company Growth Fund |
C&B Large Cap Value Fund | | Growth Fund | | Small Cap Opportunities Fund |
C&B Mid Cap Value Fund | | Health Care Fund | | Small Cap Value Fund |
Capital Growth Fund | | Index Fund | | Small Company Growth Fund |
Common Stock Fund | | International Equity Fund | | Small Company Value Fund |
Disciplined U.S. Core Fund | | International Value Fund | | Small/Mid Cap Core Fund |
Discovery Fund† | | Intrinsic Small Cap Value Fund | | Small/Mid Cap Value Fund |
Diversified Equity Fund | | Intrinsic Value Fund | | Social Sustainability Fund† |
Diversified International Fund | | Intrinsic World Equity Fund | | Special Mid Cap Value Fund |
Diversified Small Cap Fund | | Large Cap Core Fund | | Special Small Cap Value Fund |
Emerging Growth Fund | | Large Cap Growth Fund | | Specialized Technology Fund |
Emerging Markets Equity Fund | | Large Company Value Fund | | Strategic Large Cap Growth Fund |
Endeavor Select Fund† | | Omega Growth Fund | | Traditional Small Cap Growth Fund |
Enterprise Fund† | | Opportunity Fund† | | Utility and Telecommunications Fund |
Equity Value Fund | | Precious Metals Fund | | |
| Bond Funds | | | | |
Adjustable Rate Government Fund | | Inflation-Protected Bond Fund | | Short-Term Bond Fund |
California Limited-Term Tax-Free Fund | | Intermediate Tax/AMT-Free Fund | | Short-Term High Yield Bond Fund |
California Tax-Free Fund | | International Bond Fund | | Short-Term Municipal Bond Fund |
Colorado Tax-Free Fund | | Minnesota Tax-Free Fund | | Strategic Municipal Bond Fund |
Government Securities Fund | | Municipal Bond Fund | | Total Return Bond Fund |
High Income Fund | | North Carolina Tax-Free Fund | | Ultra Short-Term Income Fund |
High Yield Bond Fund | | Pennsylvania Tax-Free Fund | | Ultra Short-Term Municipal Income Fund |
Income Plus Fund | | Short Duration Government Bond Fund | | Wisconsin Tax-Free Fund |
| Asset Allocation Funds | | | | |
Asset Allocation Fund | | WealthBuilder Equity Portfolio† | | Target 2020 Fund† |
Conservative Allocation Fund | | WealthBuilder Growth Allocation Portfolio† | | Target 2025 Fund† |
Diversified Capital Builder Fund | | WealthBuilder Growth Balanced Portfolio† | | Target 2030 Fund† |
Diversified Income Builder Fund | | WealthBuilder Moderate Balanced Portfolio† | | Target 2035 Fund† |
Growth Balanced Fund | | WealthBuilder Tactical Equity Portfolio† | | Target 2040 Fund† |
Index Asset Allocation Fund | | Target Today Fund† | | Target 2045 Fund† |
Moderate Balanced Fund | | Target 2010 Fund† | | Target 2050 Fund† |
WealthBuilder Conservative Allocation Portfolio† | | Target 2015 Fund† | | Target 2055 Fund† |
| Money Market Funds | | | | |
100% Treasury Money Market Fund | | Minnesota Money Market Fund | | New Jersey Municipal Money Market Fund |
California Municipal Money Market Fund | | Money Market Fund | | New York Municipal Money Market Fund |
Cash Investment Money Market Fund | | Municipal Cash Management Money Market Fund | | Pennsylvania Municipal Money Market Fund |
Government Money Market Fund | | Municipal Money Market Fund | | Prime Investment Money Market Fund |
Heritage Money Market Fund† | | National Tax-Free Money Market Fund | | Treasury Plus Money Market Fund |
| Variable Trust Funds1 | | | | |
VT Discovery Fund† | | VT Intrinsic Value Fund | | VT Small Cap Growth Fund |
VT Index Asset Allocation Fund | | VT Omega Growth Fund | | VT Small Cap Value Fund |
VT International Equity Fund | | VT Opportunity Fund† | | VT Total Return Bond Fund |
An investment in a money market fund is not insured or guaranteed by the Federal Deposit Insurance Corporation or any other government agency. Although the Wells Fargo Advantage Money Market Funds seek to preserve the value of your investment at $1.00 per share, it is possible to lose money by investing in a money market fund.
| 1. | The Variable Trust Funds are generally available only through insurance company variable contracts. |
| † | In this report, the Wells Fargo Advantage Discovery FundSM, Wells Fargo Advantage Endeavor Select FundSM, Wells Fargo Advantage Enterprise FundSM, Wells Fargo Advantage Opportunity FundSM, Wells Fargo Advantage Social Sustainability FundSM, Wells Fargo Advantage WealthBuilder Conservative Allocation PortfolioSM, Wells Fargo Advantage WealthBuilder Equity PortfolioSM, Wells Fargo Advantage WealthBuilder Growth Allocation PortfolioSM, Wells Fargo Advantage WealthBuilder Growth Balanced PortfolioSM, Wells Fargo Advantage WealthBuilder Moderate Balanced PortfolioSM, Wells Fargo Advantage WealthBuilder Tactical Equity PortfolioSM, Wells Fargo Advantage Dow Jones Target Today FundSM, Wells Fargo Advantage Dow Jones Target 2010 FundSM, Wells Fargo Advantage Dow Jones Target 2015 FundSM, Wells Fargo Advantage Dow Jones Target 2020 FundSM, Wells Fargo Advantage Dow Jones Target 2025 FundSM, Wells Fargo Advantage Dow Jones Target 2030 FundSM, Wells Fargo Advantage Dow Jones Target 2035 FundSM, Wells Fargo Advantage Dow Jones Target 2040 FundSM, Wells Fargo Advantage Dow Jones Target 2045 FundSM, Wells Fargo Advantage Dow Jones Target 2050 FundSM, Wells Fargo Advantage Dow Jones Target 2055 FundSM, Wells Fargo Advantage Heritage Money Market FundSM, Wells Fargo Advantage VT Discovery FundSM, and Wells Fargo Advantage VT Opportunity FundSM are referred to as the Discovery Fund, Endeavor Select Fund, Enterprise Fund, Opportunity Fund, Social Sustainability Fund, WealthBuilder Conservative Allocation Portfolio, WealthBuilder Equity Portfolio, WealthBuilder Growth Allocation Portfolio, WealthBuilder Growth Balanced Portfolio, WealthBuilder Moderate Balanced Portfolio, WealthBuilder Tactical Equity Portfolio, Target Today Fund, Target 2010 Fund, Target 2015 Fund, Target 2020 Fund, Target 2025 Fund, Target 2030 Fund, Target 2035 Fund, Target 2040 Fund, Target 2045 Fund, Target 2050 Fund, Target 2055 Fund, Heritage Money Market Fund, VT Discovery Fund, and VT Opportunity Fund, respectively. |
Not part of the semi-annual report.
| | | | |
| 2 | | Wells Fargo Advantage New York Municipal Money Market Fund | | Letter to Shareholders |

Karla M. Rabusch,
President
Wells Fargo Advantage Funds
While the FOMC explained that it “expects the pace of recovery to pick up over coming quarters,” it indicated that the federal funds rate will remain at an exceptionally low level for as long as necessary to ensure a sustainable recovery and expansion.
Dear Valued Shareholder,
We’re pleased to offer you this semi-annual report for the Wells Fargo Advantage New York Municipal Money Market Fund for the six-month period that ended July 31, 2011. Upon reviewing the report, you may notice a few changes from past reports, the most significant of which is the change from a multi-fund report to a single-fund report. We believe this change will give you more convenient access to your fund data.
The period began modestly as improving economic optimism generally shifted investors toward equities and riskier assets and away from U.S. Treasuries and lower-yielding fixed-income securities. Returns from fixed income were modest in the opening months of 2011 but were generally still positive as U.S. Treasury yields incrementally climbed higher. But after the slow start, bond prices once again strongly improved, sparked by a sharp decline in U.S. Treasury prices in April that carried into May. Late in the period, lower-rated bonds declined in price more than the higher credit-quality tiers but not enough to outweigh the stronger performance from lower-rated securities during the period. Lower-quality and longer-maturity fixed-income securities generally outperformed higher-quality and shorter-maturity securities over the full period.
The activity within the broader bond market also resonated with money market participants. As the economic and credit environment reverberated from the ongoing sovereign debt concerns and softening economic data, many participants continued to balance a need for stability and desire for higher yields. The result has been good demand for domestic commercial paper and certificate of deposits. Also, in spite of all the discussion about sovereign debt, many money market participants continue to maintain some exposures to foreign banks based on the quality of their fundamentals. By focusing more on the fundamentals and taking a more selective approach to the short-term security market helped the markets avoid the severe yield volatility or significant flight-to-quality experienced during the spring of 2010, when the Greek sovereign debt crisis first emerged.
The global economic “recovery” hit a snag, but the end of 2011 could regain momentum.
The U.S. economic recovery that began in mid-2009 and gained further momentum throughout 2010, particularly during the fourth quarter, has failed to maintain that level of growth through the first seven months of 2011. For example, gross domestic product (GDP), the broadest measure of economic activity, grew at an annualized rate of 3.1% in the fourth quarter of 2010, only to slow dramatically during the first quarter of 2011. The latest revision to first-quarter GDP data during the period indicated that the economy grew at an annualized rate of 0.4% during the first quarter of 2011. While still positive, it’s a much slower pace of growth than experienced in the second half of 2010 and notably lower than consensus forecasts. Nevertheless, the advance estimate of second-quarter 2011 GDP, which was released on July 29, 2011, was 1.3%, suggesting that the U.S. economy continues to expand, though at a slow and uneven pace.
Jobs and housing remained troublesome.
The July 2011 unemployment rate in the U.S. was reported at 9.1%, down from 9.5% a year earlier but still notably higher than historical averages. Unfortunately,
| | | | | | |
| Letter to Shareholders | | Wells Fargo Advantage New York Municipal Money Market Fund | | | 3 | |
the drop may be more attributable to a decline in the labor force than to a meaningful uptick in hiring. The level of job creation in 2011 has been trending below historical averages, suggesting that the improving economy has yet to translate into widespread hiring. Meanwhile, the beleaguered housing market was an ongoing source of concern, despite some tentative late-year signs of stabilization. That said, persistent weakness in the labor and housing markets bears close watching in the months ahead.
Other economic data in the U.S. has been more encouraging, reflecting greater confidence in the sustainability of the expansion on the part of both consumers and businesses. Retail sales came in strong at certain points during the period and industrial production and new orders have picked up. Although still reluctant to hire, businesses have gradually increased spending in other areas, such as equipment and information technology. Core inflation, which excludes volatile food and energy prices, remained benign.
The Federal Reserve believes the economic recovery will accelerate in future quarters.
With inflation subdued, the Federal Open Market Committee (FOMC) held its target range for the federal funds rate—a proxy for short-term interest rates—steady at 0.00% to 0.25%. On June 22, 2011, in its final statement of the six-month period, the Fed reiterated that the economic recovery “is proceeding at a moderate pace,” but that “recent labor market indicators have been weaker than anticipated.” It described the recent increase in inflation as temporary, suggesting that inflation pressures will ease going forward. While the FOMC explained that it “expects the pace of recovery to pick up over coming quarters,” it indicated that the federal funds rate will remain at an exceptionally low level for as long as necessary to ensure a sustainable recovery and expansion.
As recent headwinds subside, it is reasonable to expect markets to regain focus.
Now that it appears the debt ceiling has been increased and a U.S. default will be averted, money market participants and the broader bond market can get back to more fundamental and lasting concerns-chiefly, the economy. After avoiding short-term Treasuries in late July 2011, ahead of pending U.S. debt ceiling deadline, money market participants have returned to the U.S. short-term markets1. Economic indicators released in the second half of 2011 might not be as soft as those reported during the first half of the year. While that would not mean that the economy is robust, it might remind the markets that the first half of the slowdown was transitory. Most indicators still point toward real GDP growth in the 2% to 3% range in the second half of 2011. While that is not enough to produce big employment gains, it might be sufficient to cause Treasury yields to retrace some of the late-July declines.
Don’t let short-term uncertainty derail long-term investment goals.
While periods of uncertainty can present challenges, experience has taught us that maintaining a long-term investment strategy based on individual goals and risk tolerance can be an effective way to plan for the future. As a whole, Wells Fargo Advantage Funds represents investments across a broad range of asset classes and investment styles with more than 110 mutual funds, giving you an
| 1. | Comments expressed that do not fall within the reporting period are as of August 2, 2011. |
Economic indicators released in the second half of 2011 might not be as soft as those reported during the first half of the year. While that would not mean that the economy is robust, it might remind the markets that the first half of the slowdown was transitory.
| | | | |
| 4 | | Wells Fargo Advantage New York Municipal Money Market Fund | | Letter to Shareholders |
opportunity to create a diversified investment portfolio. While diversification may not prevent losses in a downturn, it may help to reduce them and provide you with one way of managing risk.
In our opinion, diligent and earnest assessment of the fundamental characteristics of money market eligible securities will be a key differentiating factor between which investment strategies meet client expectations and which do not. At Wells Fargo Advantage Funds, we intend to continue the emphasis of principal preservation and high liquidity across our lineup of Wells Fargo Advantage Money Market Funds. In changing markets, we believe it is particularly important to have diligent investment analysts in charge of investor assets.
Thank you for choosing Wells Fargo Advantage Funds. We appreciate your confidence in us and are committed to helping you meet your financial needs. If you have any questions about your investments, please contact your investment professional, call us at 1-800-222-8222, or visit www.wellsfargo.com/advantagefunds.
Sincerely,

Karla M. Rabusch
President
Wells Fargo Advantage Funds
| | | | | | |
| Performance Highlights | | Wells Fargo Advantage New York Municipal Money Market Fund | | | 5 | |
INVESTMENT OBJECTIVE
The Fund seeks current income exempt from regular federal income tax and New York individual income tax, while preserving capital and liquity.
ADVISER
Wells Fargo Funds Management, LLC
SUB-ADVISER
Wells Capital Management Incorporated
PORTFOLIO MANAGERS
David D. Sylvester
James Randazzo
FUND INCEPTION
September 24, 2001
|
SECTOR DISTRIBUTION1 (AS OF JULY 31, 2011) |
|
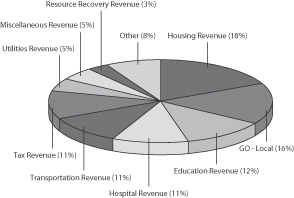 |
|
EFFECTIVE MATURITY DISTRIBUTION1 (AS OF JULY 31, 2011) |
|
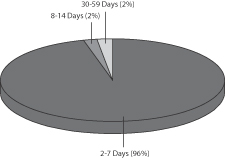 |
| | |
WEIGHTED AVERAGE MATURITY2 (AS OF JULY 31, 2011) | | |
7 Days | | |
| | |
WEIGHTED AVERAGE FINAL MATURITY3 (AS OF JULY 31, 2011) | | |
7 Days | | |
| 1. | Sector distribution and effective maturity distribution are subject to change and are calculated based on the total investments of the Fund. Effective maturity distribution is based on the weighted average maturity of each security. |
| 2. | Weighted Average Maturity (WAM): WAM calculates an average time to maturity of all of the securities held in the portfolio, weighted by each security’s percentage of net assets. The calculation takes into account the final maturity of a fixed-income security and the interest rate reset date for floating-rate securities held in the portfolio. This is a way to measure a Fund’s sensitivity to potential interest rate changes. |
| 3. | Weighted Average Final Maturity (WAFM): WAFM calculates a Fund’s average time to maturity for all of the securities held in the portfolio, weighted to their percentage of assets in the Fund. In contrast to WAM, the WAFM calculation takes into account the final maturity date for each security held in the portfolio. This is a way to measure a Fund’s potential sensitivity to credit spread changes. |
| | | | |
| 6 | | Wells Fargo Advantage New York Municipal Money Market Fund | | Performance Highlights |
AVERAGE ANNUAL TOTAL RETURN4 (%) (AS OF JULY 31, 2011)
| | | | | | | | | | | | | | | | | | | | | | | | | | | | |
| | | | | | | | | Expense Ratios5 | |
| | | Inception Date | | | 6 Months* | | | 1 Year | | | 5 Year | | | Life of Fund | | | Gross | | | Net6 | |
Class A (ENYXX) | | | 09/24/2001 | | | | 0.00 | | | | 0.01 | | | | 1.17 | | | | 1.14 | | | | 0.87% | | | | 0.70% | |
Service Class (ENIXX) | | | 09/24/2001 | | | | 0.00 | | | | 0.01 | | | | 1.34 | | | | 1.38 | | | | 0.77% | | | | 0.45% | |
Sweep Class | | | 09/24/2001 | | | | 0.00 | | | | 0.01 | | | | 1.02 | | | | 0.92 | | | | 1.22% | | | | 1.05% | |
| * | Returns for periods of less than one year are not annualized. |
| | | | | | | | | | | | |
FUND YIELD SUMMARY6 (AS OF JULY 31, 2011) | | Class A | | | Service Class | | | Sweep Class | |
7-Day Current Yield | | | 0.01% | | | | 0.01% | | | | 0.01% | |
7-Day Compound Yield | | | 0.01% | | | | 0.01% | | | | 0.01% | |
30-Day Simple Yield | | | 0.01% | | | | 0.01% | | | | 0.01% | |
30-Day Compound Yield | | | 0.01% | | | | 0.01% | | | | 0.01% | |
Figures quoted represent past performance, which is no guarantee of future results and do not reflect the deduction of taxes that a shareholder may pay on fund distributions or the redemption of fund shares. Investment returns will fluctuate. The Fund’s yield figures more closely reflect the current earnings of the Fund than the total return figures. Current performance may be lower or higher than the performance data quoted. Current month-end performance is available at the Fund’s Web site – www.wellsfargo.com/advantagefunds.
Each class is sold without a front-end sales charge or contingent deferred sales charge. Other fees and expenses apply to an investment in the Fund and are described in the Fund’s current prospectus.
An investment in a money market fund is not insured or guaranteed by the Federal Deposit Insurance Corporation or any other government agency. Although the Fund seeks to preserve the value of your investment at $1.00 per share, it is possible to lose money by investing in a money market fund. A portion of the Fund’s income may be subject to federal, state and/or local income taxes or the alternative minimum tax (AMT).
| 4. | Historical performance shown for all classes of the Fund prior to July 12, 2010 is based on the performance of the Fund’s predecessor, Evergreen New York Municipal Money Market Fund. |
| 5. | Reflects the expense ratios as stated in the most recent prospectuses. |
| 6. | The Adviser has committed through July 11, 2013 to waive fees and/or reimburse expenses to the extent necessary to cap the Fund’s Total Annual Fund Operating Expenses After Fee Waiver, excluding certain expenses, at the amount shown above. Without this cap, the Fund’s returns would have been lower. Without waived fees and/or reimbursed expenses, the Fund’s 7-day current yield would have been (0.76)%, (0.66)%, and (1.11)% for Class A, Service Class and Sweep Class, respectively. |
| | | | | | |
| Fund Expenses | | Wells Fargo Advantage New York Municipal Money Market Fund | | | 7 | |
As a shareholder of the Fund, you incur two types of costs: (1) transaction costs, including contingent deferred sales charges (if any) and (2) ongoing costs, including management fees; distribution (12b-1) and/or shareholder service fees; and other Fund expenses. This example is intended to help you understand your ongoing costs (in dollars) of investing in the Fund and to compare these costs with the ongoing costs of investing in other mutual funds.
The example is based on an investment of $1,000 invested at the beginning of the six-month period and held for the entire period from February 1, 2011 to July 31, 2011.
Actual Expenses
The “Actual” line of the table below provides information about actual account values and actual expenses. You may use the information in this line, together with the amount you invested, to estimate the expenses that you paid over the period. Simply divide your account value by $1,000 (for example, an $8,600 account value divided by $1,000 = 8.6), then multiply the result by the number in the “Actual” line under the heading entitled “Expenses Paid During Period” for your applicable class of shares to estimate the expenses you paid on your account during this period.
Hypothetical Example for Comparison Purposes
The “Hypothetical” line of the table below provides information about hypothetical account values and hypothetical expenses based on the Fund’s actual expense ratio and an assumed rate of return of 5% per year before expenses, which is not the Fund’s actual return. The hypothetical account values and expenses may not be used to estimate the actual ending account balance or expenses you paid for the period. You may use this information to compare the ongoing costs of investing in the Fund and other funds. To do so, compare this 5% hypothetical example with the 5% hypothetical examples that appear in the shareholder reports of the other funds.
Please note that the expenses shown in the table are meant to highlight your ongoing costs only and do not reflect any transactional costs, such as any contingent deferred sales charges. Therefore, the “Hypothetical” line of the table is useful in comparing ongoing costs only, and will not help you determine the relative total costs of owning different funds. In addition, if these transactional costs were included, your costs would have been higher.
| | | | | | | | | | | | | | | | |
| | | Beginning
Account Value
02-01-2011 | | | Ending
Account Value
07-31-2011 | | | Expenses
Paid During
the Period¹ | | | Net Annual
Expense Ratio | |
| | | | |
Class A | | | | | | | | | | | | | | | | |
Actual | | $ | 1,000.00 | | | $ | 1,000.05 | | | $ | 0.94 | | | | 0.19 | % |
Hypothetical (5% return before expenses) | | $ | 1,000.00 | | | $ | 1,023.85 | | | $ | 0.95 | | | | 0.19 | % |
Service Class | | | | | | | | | | | | | | | | |
Actual | | $ | 1,000.00 | | | $ | 1,000.05 | | | $ | 0.94 | | | | 0.19 | % |
Hypothetical (5% return before expenses) | | $ | 1,000.00 | | | $ | 1,023.85 | | | $ | 0.95 | | | | 0.19 | % |
Sweep Class | | | | | | | | | | | | | | | | |
Actual | | $ | 1,000.00 | | | $ | 1,000.05 | | | $ | 0.99 | | | | 0.20 | % |
Hypothetical (5% return before expenses) | | $ | 1,000.00 | | | $ | 1,023.80 | | | $ | 1.00 | | | | 0.20 | % |
| 1. | Expenses paid is equal to the annualized expense ratio of each class multiplied by the average account value over the period, multiplied by the number of days in the most recent fiscal half-year divided by the number of days in the fiscal year (to reflect the one-half year period). |
| | | | |
| 8 | | Wells Fargo Advantage New York Municipal Money Market Fund | | Portfolio of Investments—July 31, 2011 (Unaudited) |
| | | | | | | | | | | | | | | | |
| Security Name | | Interest Rate | | | Maturity Date | | | Principal | | | Value | |
| | | | | | | | | | | | | | | | |
| | | | |
Municipal Bonds and Notes: 94.78% | | | | | | | | | | | | | | | | |
| | | | |
California: 0.16% | | | | | | | | | | | | | | | | |
| | | | |
| Variable Rate Demand Note§: 0.16% | | | | | | | | | | | | | | | | |
California Housing Finance Agency PUTTER Series 3484 (Water & Sewer Revenue)†† | | | 0.21 | % | | | 06/15/2033 | | | $ | 450,000 | | | $ | 450,000 | |
| | | | | | | | | | | | | | | | |
| | | | |
Delaware: 0.44% | | | | | | | | | | | | | | | | |
| | | | |
| Variable Rate Demand Note§: 0.44% | | | | | | | | | | | | | | | | |
Delaware State Economic Development Authority Delaware Clean Power Project Series 1997-C (Resource Recovery Revenue) | | | 0.25 | | | | 08/01/2029 | | | | 1,200,000 | | | | 1,200,000 | |
| | | | | | | | | | | | | | | | |
| | | | |
Maryland: 0.72% | | | | | | | | | | | | | | | | |
| | | | |
| Other Municipal Debt: 0.72% | | | | | | | | | | | | | | | | |
Montgomery County MD (GO – Local, State Street Corporation LOC) | | | 0.09 | | | | 08/09/2011 | | | | 2,000,000 | | | | 2,000,000 | |
| | | | | | | | | | | | | | | | |
| | | | |
Minnesota: 0.91% | | | | | | | | | | | | | | | | |
| | | | |
| Variable Rate Demand Note§: 0.91% | | | | | | | | | | | | | | | | |
Sherburne County MN Housing & Redevelopment Authority Apperts Incorporated Project (Housing Revenue, Bremer Bank LOC) | | | 0.33 | | | | 12/01/2021 | | | | 2,515,000 | | | | 2,515,000 | |
| | | | | | | | | | | | | | | | |
| | | | |
Mississippi: 0.40% | | | | | | | | | | | | | | | | |
| | | | |
| Variable Rate Demand Note§: 0.40% | | | | | | | | | | | | | | | | |
Mississippi Business Finance Corporation Chevron USA Incorporated Project Series B (Energy Revenue) | | | 0.21 | | | | 12/01/2030 | | | | 1,100,000 | | | | 1,100,000 | |
| | | | | | | | | | | | | | | | |
| | | | |
Nevada: 0.43% | | | | | | | | | | | | | | | | |
| | | | |
| Variable Rate Demand Note§: 0.43% | | | | | | | | | | | | | | | | |
Sparks NV Economic Development RIX Industries Project (IDR, Wells Fargo Bank NA LOC)(q) | | | 0.30 | | | | 07/01/2027 | | | | 1,195,000 | | | | 1,195,000 | |
| | | | | | | | | | | | | | | | |
| | | | |
New York: 81.63% | | | | | | | | | | | | | | | | |
| | | | |
| Other Municipal Debt: 1.40% | | | | | | | | | | | | | | | | |
New York Metropolitan Transportation Authority (Transportation Revenue, TD Bank NA LOC) | | | 0.23 | | | | 10/06/2011 | | | | 1,000,000 | | | | 1,000,000 | |
Oyster Bay NY BAN (GO-Local) | | | 1.25 | | | | 08/12/2011 | | | | 2,880,000 | | | | 2,880,822 | |
| | | | |
| | | | | | | | | | | | | | | 3,880,822 | |
| | | | | | | | | | | | | | | | |
| | | | |
| Variable Rate Demand Notes§: 80.23% | | | | | | | | | | | | | | | | |
Albany NY IDA (Hospital Revenue, Bank of America Corporation LOC) | | | 0.11 | | | | 05/01/2027 | | | | 2,605,000 | | | | 2,605,000 | |
City of New York NY (GO-Local, TD Bank NA LOC) | | | 0.05 | | | | 09/01/2027 | | | | 4,200,000 | | | | 4,200,000 | |
Dutchess County NY IDA (Education Revenue, JPMorgan Chase Bank LOC) | | | 0.06 | | | | 07/01/2028 | | | | 3,890,000 | | | | 3,890,000 | |
Erie County NY IDA School Facilities Series 2946 (Education Revenue, FSA Insured) | | | 0.13 | | | | 11/01/2012 | | | | 3,050,000 | | | | 3,050,000 | |
JPMorgan Chase PUTTER (Water & Sewer Revenue)†† | | | 0.21 | | | | 05/02/2013 | | | | 3,700,000 | | | | 3,700,000 | |
Long Island Power Authority NY Electric System Subseries 1-B (Utilities Revenue, State Street Corporation LOC) | | | 0.19 | | | | 05/01/2033 | | | | 7,275,000 | | | | 7,275,000 | |
Nassau County NY Interim Finance Authority Series D-1 (Tax Revenue) | | | 0.14 | | | | 11/15/2017 | | | | 2,185,000 | | | | 2,185,000 | |
Nassau Health Care Corporation Series B-2 (Hospital Revenue, TD Bank NA LOC, County Guaranty Insured) | | | 0.07 | | | | 08/01/2029 | | | | 9,500,000 | | | | 9,500,000 | |
New York City NY Capital Resource Corporation Loan Enhanced Assistance Series A (Hospital Revenue, Bank of America Corporation LOC) | | | 0.13 | | | | 01/01/2026 | | | | 3,720,000 | | | | 3,720,000 | |
| | | | | | |
| Portfolio of Investments—July 31, 2011 (Unaudited) | | Wells Fargo Advantage New York Municipal Money Market Fund | | | 9 | |
| | | | | | | | | | | | | | | | |
| Security Name | | Interest Rate | | | Maturity Date | | | Principal | | | Value | |
| | | | | | | | | | | | | | | | |
| | | | |
| Variable Rate Demand Notes§ (continued) | | | | | | | | | | | | | | | | |
New York City NY Capital Resource Corporation Loan Enhanced Assistance Series A (Education Revenue, Bank of America Corporation LOC) | | | 0.13 | % | | | 05/01/2037 | | | $ | 3,600,000 | | | $ | 3,600,000 | |
New York Convention Center Development Corporation New York Hotel Unit Fee Secured Series 3095 (Tax Revenue, BHAC-CR AMBAC Insured)†† | | | 0.08 | | | | 11/15/2044 | | | | 9,200,000 | | | | 9,200,000 | |
New York Metropolitan Transportation Authority (Transportation Revenue, Bank of Nova Scotia LOC) | | | 0.07 | | | | 11/01/2026 | | | | 9,000,000 | | | | 9,000,000 | |
New York Metropolitan Transportation Authority ROC-RR-II-R-11711 (Transportation Revenue, FSA Insured)†† | | | 0.23 | | | | 11/15/2027 | | | | 9,650,000 | | | | 9,650,000 | |
New York Metropolitan Transportation Authority ROC-RR-II-R-594PB (Transportation Revenue, AGC-ICC AMBAC Insured) | | | 0.23 | | | | 11/15/2013 | | | | 1,000,000 | | | | 1,000,000 | |
New York NY City Housing Development Corporation 1904 Vyse Avenue Apartments Series A (Housing Revenue, FNMA Insured) | | | 0.07 | | | | 01/15/2038 | | | | 4,035,000 | | | | 4,035,000 | |
New York NY City Housing Development Corporation Ogden Avenue Apartments II Series A (Housing Revenue, FHLMC Insured) | | | 0.18 | | | | 03/01/2038 | | | | 2,500,000 | | | | 2,500,000 | |
New York NY City Housing Development Corporation Series C-4 (Housing Revenue) | | | 0.05 | | | | 05/01/2015 | | | | 1,945,000 | | | | 1,945,000 | |
New York NY City Housing Development Corporation Series J-1 (Housing Revenue) | | | 0.48 | | | | 05/01/2046 | | | | 2,000,000 | | | | 2,000,000 | |
New York NY City Housing Development Corporation West End Towers Series A (Housing Revenue, FNMA Insured) | | | 0.18 | | | | 05/15/2034 | | | | 5,500,000 | | | | 5,500,000 | |
New York NY City Series F-4 (Tax Revenue, Union Bank NA LOC) | | | 0.08 | | | | 09/01/2035 | | | | 3,000,000 | | | | 3,000,000 | |
New York NY City Transitional Finance Authority Series 3 Subseries 3H (Tax Revenue) | | | 0.22 | | | | 11/01/2022 | | | | 2,500,000 | | | | 2,500,000 | |
New York NY City Transitional Finance Authority Subseries F-5 (Tax Revenue, Sumitomo Mitsui Banking LOC) | | | 0.05 | | | | 02/01/2035 | | | | 2,200,000 | | | | 2,200,000 | |
New York NY City Trust Cultural Research Lincoln Center For the Arts Series B-1 (Miscellaneous Revenue, U.S. Bank NA LOC) | | | 0.05 | | | | 11/01/2038 | | | | 3,750,000 | | | | 3,750,000 | |
New York NY Series E-2 (GO-Local, Bank of America Corporation LOC) | | | 0.23 | | | | 08/01/2034 | | | | 2,600,000 | | | | 2,600,000 | |
New York NY Subseries A-5 (GO-Local, Bank of Nova Scotia LOC) | | | 0.04 | | | | 08/01/2031 | | | | 4,205,000 | | | | 4,205,000 | |
New York NY Subseries C-4 (GO-Local, Bank of Tokyo-Mitsubishi UFJ LOC) | | | 0.16 | | | | 08/01/2020 | | | | 7,000,000 | | | | 7,000,000 | |
New York NY Subseries C-5 (GO-Local, Bank of New York LOC) | | | 0.05 | | | | 08/01/2020 | | | | 8,000,000 | | | | 8,000,000 | |
New York NY Subseries F-4 (GO-Local, Sumitomo Mitsui Banking LOC) | | | 0.08 | | | | 09/01/2035 | | | | 9,900,000 | | | | 9,900,000 | |
New York NY Subseries I-7 (GO-Local, Bank of America Corporation LOC) | | | 0.10 | | | | 04/01/2036 | | | | 2,700,000 | | | | 2,700,000 | |
New York NY Transitional Finance Authority Series 3F (Tax Revenue) | | | 0.19 | | | | 11/01/2022 | | | | 3,300,000 | | | | 3,300,000 | |
New York NY Triborough Bridge & Tunnel Authority Sub Series CD (Transportation Revenue, AGM Insured) | | | 0.09 | | | | 01/01/2019 | | | | 3,500,000 | | | | 3,500,000 | |
New York State Dormitory Authority Eclipse Funding Trust 2006-0029 Solar Eclipse (Miscellaneous Revenue, U.S. Bank NA LOC) | | | 0.07 | | | | 02/15/2012 | | | | 3,150,000 | | | | 3,150,000 | |
New York State Dormitory Authority North Shore LI Jewish Series B (Hospital Revenue, TD Bank NA LOC) | | | 0.05 | | | | 07/01/2039 | | | | 9,000,000 | | | | 9,000,000 | |
New York State Dormitory Authority PUTTER 2009-35 (Miscellaneous Revenue, State Street Corporation LOC) | | | 0.08 | | | | 11/01/2020 | | | | 5,000,000 | | | | 5,000,000 | |
New York State Dormitory Authority PUTTER 2009-45 (Education Revenue, State Street Corporation LOC) | | | 0.08 | | | | 07/01/2025 | | | | 5,600,000 | | | | 5,600,000 | |
New York State Dormitory Authority Rockefeller University Series B (Education Revenue) | | | 0.07 | | | | 07/01/2039 | | | | 7,500,000 | | | | 7,500,000 | |
New York State Housing Finance Agency Avalon Bowery Place Series II-A (Housing Revenue, Bank of America Corporation LOC) | | | 0.12 | | | | 11/01/2039 | | | | 1,500,000 | | | | 1,500,000 | |
New York State Housing Finance Agency Rip Van Winkle House Series A (Housing Revenue, FHLMC Insured) | | | 0.11 | | | | 11/01/2034 | | | | 3,300,000 | | | | 3,300,000 | |
New York State Housing Finance Agency Victory Housing Series 2004-A (Housing Revenue, FHLMC Insured) | | | 0.05 | | | | 11/01/2033 | | | | 2,500,000 | | | | 2,500,000 | |
| | | | |
| 10 | | Wells Fargo Advantage New York Municipal Money Market Fund | | Portfolio of Investments—July 31, 2011 (Unaudited) |
| | | | | | | | | | | | | | | | |
| Security Name | | Interest Rate | | | Maturity Date | | | Principal | | | Value | |
| | | | | | | | | | | | | | | | |
| | | | |
| Variable Rate Demand Notes§ (continued) | | | | | | | | | | | | | | | | |
New York State Housing Finance Agency West 23rd Street Series A (Housing Revenue, FNMA Insured) | | | 0.08 | % | | | 05/15/2033 | | | $ | 8,200,000 | | | $ | 8,200,000 | |
New York State Housing Finance Agency Weyant Green Apartments Series A (Housing Revenue, FNMA Insured) | | | 0.05 | | | | 05/15/2037 | | | | 700,000 | | | | 700,000 | |
New York State Mortgage Agency ROC-RR-II-R-11706 (Housing Revenue)†† | | | 0.17 | | | | 10/01/2024 | | | | 2,700,000 | | | | 2,700,000 | |
New York State Power Authority (GO-State) | | | 0.32 | | | | 03/01/2016 | | | | 1,000,000 | | | | 1,000,000 | |
New York State Power Authority (GO-State) | | | 0.32 | | | | 03/01/2020 | | | | 1,700,000 | | | | 1,700,000 | |
New York State Thruway Authority PUTTER Series 3600-Z (Transportation Revenue, FGIC Insured)†† | | | 0.22 | | | | 01/01/2016 | | | | 4,600,000 | | | | 4,600,000 | |
Niagara County NY IDA Niagara University Project Series B (Education Revenue, HSBC Bank USA NA LOC, Radian Insured) | | | 0.06 | | | | 11/01/2031 | | | | 5,000,000 | | | | 5,000,000 | |
Oneida County NY IDA (Hospital Revenue, HSBC Bank USA NA LOC) | | | 0.06 | | | | 06/01/2026 | | | | 3,600,000 | | | | 3,600,000 | |
PFOTER PT-4564 (Housing Revenue, FHLMC Insured) | | | 0.18 | | | | 02/01/2046 | | | | 11,100,000 | | | | 11,100,000 | |
Southeast NY IDA Dairy Conveyor Corporation Project (IDR, Chase Manhattan Bank LOC) | | | 0.07 | | | | 11/01/2015 | | | | 800,000 | | | | 800,000 | |
Syracuse NY IDA (Education Revenue, JPMorgan Chase Bank LOC) | | | 0.28 | | | | 12/01/2037 | | | | 3,865,000 | | | | 3,865,000 | |
| | | | |
| | | | | | | | | | | | | | | 222,025,000 | |
| | | | | | | | | | | | | | | | |
| | | | |
Puerto Rico: 5.74% | | | | | | | | | | | | | | | | |
| | | | |
| Variable Rate Demand Notes§: 5.74% | | | | | | | | | | | | | | | | |
Puerto Rico Commonwealth ROC-II-R-185 (GO – State, FGIC Insured)†† | | | 0.11 | | | | 07/01/2012 | | | | 3,715,000 | | | | 3,715,000 | |
Puerto Rico Electric Power Authority MSTR SGC-57 Class A (Utilities Revenue, Societe Generale LOC, FSA Insured) | | | 0.11 | | | | 07/01/2029 | | | | 6,180,000 | | | | 6,180,000 | |
Puerto Rico Sales Tax Corporate Financing ROC-RR-II-R-11778 (Tax Revenue)†† | | | 0.11 | | | | 08/01/2047 | | | | 2,875,000 | | | | 2,875,000 | |
Puerto Rico Sales Tax Corporate Financing ROC-RR-II-R-11779 (Tax Revenue)†† | | | 0.11 | | | | 12/01/2047 | | | | 2,700,000 | | | | 2,700,000 | |
Puerto Rico Sales Tax Financing Corporation PUTTER Series DBE-627A (Tax Revenue, AMBAC Insured) | | | 0.08 | | | | 08/01/2050 | | | | 400,000 | | | | 400,000 | |
| | | | |
| | | | | | | | | | | | | | | 15,870,000 | |
| | | | | | | | | | | | | | | | |
| | | | |
Texas: 4.08% | | | | | | | | | | | | | | | | |
| | | | |
| Variable Rate Demand Notes§: 4.08% | | | | | | | | | | | | | | | | |
Nueces County TX Port Corpus Christi Authority Solid Waste Disposal Flint Hills Resources Project Series 2007 (Resource Recovery Revenue, Flint Hills Resources Guaranteed) | | | 0.13 | | | | 01/01/2032 | | | | 6,975,000 | | | | 6,975,000 | |
Port Arthur TX Naval District Environmental Facilities Motiva Enterprises Project Series A (Energy Revenue) | | | 0.19 | | | | 11/01/2040 | | | | 1,925,000 | | | | 1,925,000 | |
Port Arthur TX Naval District Environmental Facilities Motiva Enterprises Project Series C (Energy Revenue) | | | 0.26 | | | | 04/01/2040 | | | | 2,400,000 | | | | 2,400,000 | |
| | | | |
| | | | | | | | | | | | | | | 11,300,000 | |
| | | | | | | | | | | | | | | | |
| | | | |
Wisconsin: 0.27% | | | | | | | | | | | | | | | | |
| | | | |
| Variable Rate Demand Note§: 0.27% | | | | | | | | | | | | | | | | |
Wisconsin State HEFA Aurora Health Care Series A (Hospital Revenue, Bank of Montreal LOC) | | | 0.24 | | | | 04/01/2028 | | | | 750,000 | | | | 750,000 | |
| | | | | | | | | | | | | | | | |
| | | | | | | | |
| Total Investments in Securities | | | | | | | | |
| (Cost $262,285,822)* | | | 94.78 | % | | | 262,285,822 | |
Other Assets and Liabilities, Net | | | 5.22 | | | | 14,458,355 | |
| | | | | | | | |
| Total Net Assets | | | 100.00 | % | | $ | 276,744,177 | |
| | | | | | | | |
| | | | | | |
| Portfolio of Investments—July 31, 2011 (Unaudited) | | Wells Fargo Advantage New York Municipal Money Market Fund | | | 11 | |
| †† | Security that may be resold to “qualified institutional buyers” under Rule 144A or securities offered pursuant to Section 4(2) of the Securities Act of 1933, as amended. |
| § | These securities are subject to a demand feature which reduces the effective maturity. |
| (q) | Credit enhancement is provided by an affiliate. |
| * | Cost for federal income tax purposes is substantially the same as for financial reporting purposes. |
The accompanying notes are an integral part of these financial statements.
| | | | |
| 12 | | Wells Fargo Advantage New York Municipal Money Market Fund | | Statement of Assets and Liabilities—July 31, 2011 (Unaudited) |
| | | | |
| | | | |
| |
Assets | | | | |
Investments in unaffiliated securities, at amortized cost | | $ | 262,285,822 | |
Cash | | | 14,443,857 | |
Receivable for interest | | | 75,000 | |
Receivable from adviser | | | 206,417 | |
Prepaid expenses and other assets | | | 24,586 | |
| | | | |
Total assets | | | 277,035,682 | |
| | | | |
| |
Liabilities | | | | |
Distribution fees payable | | | 89,176 | |
Due to other related parties | | | 69,949 | |
Shareholder servicing fees payable | | | 68,850 | |
Accrued expenses and other liabilities | | | 63,530 | |
| | | | |
Total liabilities | | | 291,505 | |
| | | | |
Total net assets | | $ | 276,744,177 | |
| | | | |
| |
NET ASSETS CONSIST OF | | | | |
Paid-in capital | | $ | 276,741,855 | |
Undistributed net investment income | | | 1,251 | |
Accumulated net realized gains on investments | | | 1,071 | |
| | | | |
Total net assets | | $ | 276,744,177 | |
| | | | |
| |
COMPUTATION OF NET ASSET VALUE PER SHARE1 | | | | |
Net assets – Class A | | $ | 10,765,496 | |
Shares outstanding – Class A | | | 10,765,598 | |
Net asset value per share – Class A | | | $1.00 | |
Net assets – Service Class | | $ | 11,034,887 | |
Shares outstanding – Service Class | | | 11,035,004 | |
Net asset value per share – Service Class | | | $1.00 | |
Net assets – Sweep Class | | $ | 254,943,794 | |
Shares outstanding – Sweep Class | | | 254,954,335 | |
Net asset value per share – Sweep Class | | | $1.00 | |
| 1. | The Fund has an unlimited number of authorized shares. |
The accompanying notes are an integral part of these financial statements.
| | | | | | |
| Statement of Operations—Six Months Ended July 31, 2011 (Unaudited) | | Wells Fargo Advantage New York Municipal Money Market Fund | | | 13 | |
| | | | |
| | | | |
| |
Investment income | | | | |
Interest | | $ | 394,531 | |
| | | | |
| |
Expenses | | | | |
Advisory fee | | | 563,529 | |
Administration fees | | | | |
Fund level | | | 93,921 | |
Class A | | | 12,392 | |
Service Class | | | 7,157 | |
Sweep Class | | | 387,740 | |
Shareholder servicing fees | | | | |
Class A | | | 13,867 | |
Service Class | | | 14,112 | |
Sweep Class | | | 440,614 | |
Distribution fees | | | | |
Sweep Class | | | 616,859 | |
Custody and accounting fees | | | 10,850 | |
Professional fees | | | 14,380 | |
Registration fees | | | 18,718 | |
Shareholder report expenses | | | 2,083 | |
Trustees’ fees and expenses | | | 5,951 | |
Other fees and expenses | | | 9,077 | |
| | | | |
Total expenses | | | 2,211,250 | |
Less: Fee waivers and/or expense reimbursements | | | (1,835,504 | ) |
| | | | |
Net expenses | | | 375,746 | |
| | | | |
Net investment income | | | 18,785 | |
Net realized gains on investments | | | 804 | |
| | | | |
| |
Net increase in net assets resulting from operations | | $ | 19,589 | |
| | | | |
The accompanying notes are an integral part of these financial statements.
| | | | |
| 14 | | Wells Fargo Advantage New York Municipal Money Market Fund | | Statements of Changes in Net Assets |
| | | | | | | | | | | | | | | | |
| | | Six Months Ended July 31, 2011 (Unaudited) | | | Year Ended January 31, 20111 | |
| | | | |
Operations | | | | | | | | | | | | | | | | |
Net investment income | | | | | | $ | 18,785 | | | | | | | $ | 19,575 | |
Net realized gains on investments | | | | | | | 804 | | | | | | | | 1,809 | |
| | | | | | | | | | | | | | | | |
Net increase in net assets resulting from operations | | | | | | | 19,589 | | | | | | | | 21,384 | |
| | | | | | | | | | | | | | | | |
| | | | |
Distributions to shareholders from | | | | | | | | | | | | | | | | |
Net investment income | | | | | | | | | | | | | | | | |
Class A | | | | | | | (563 | ) | | | | | | | (1,936 | ) |
Service Class | | | | | | | (595 | ) | | | | | | | (1,769 | )2 |
Sweep Class | | | | | | | (17,627 | ) | | | | | | | (42,340 | )3 |
| | | | | | | | | | | | | | | | |
Total distributions to shareholders | | | | | | | (18,785 | ) | | | | | | | (46,045 | ) |
| | | | | | | | | | | | | | | | |
| | | | |
| | | Shares | | | | | | Shares | | | | |
| | | | |
Capital share transactions | | | | | | | | | | | | | | | | |
Proceeds from shares sold | | | | | | | | | | | | | | | | |
Class A | | | 9,920,270 | | | | 9,920,270 | | | | 40,186,012 | | | | 40,186,012 | |
Service Class | | | 26,706,743 | | | | 26,706,743 | | | | 79,156,755 | 2 | | | 79,156,755 | 2 |
Sweep Class | | | 491,117,886 | | | | 491,117,886 | | | | 1,237,044,799 | 3 | | | 1,237,044,799 | 3 |
| | | | | | | | | | | | | | | | |
| | | | | | | 527,744,899 | | | | | | | | 1,356,387,566 | |
| | | | | | | | | | | | | | | | |
Reinvestment of distributions | | | | | | | | | | | | | | | | |
Class A | | | 459 | | | | 459 | | | | 1,387 | | | | 1,387 | |
Service Class | | | 79 | | | | 79 | | | | 216 | 2 | | | 216 | 2 |
Sweep Class | | | 17,627 | | | | 17,627 | | | | 42,340 | 3 | | | 42,340 | 3 |
| | | | | | | | | | | | | | | | |
| | | | | | | 18,165 | | | | | | | | 43,943 | |
| | | | | | | | | | | | | | | | |
Payment for shares redeemed | | | | | | | | | | | | | | | | |
Class A | | | (10,622,220 | ) | | | (10,622,220 | ) | | | (46,935,972 | ) | | | (46,935,972 | ) |
Service Class | | | (27,600,630 | ) | | | (27,600,630 | ) | | | (77,001,001 | )2 | | | (77,001,001 | )2 |
Sweep Class | | | (627,526,185 | ) | | | (627,526,185 | ) | | | (1,249,894,067 | )3 | | | (1,249,894,067 | )3 |
| | | | | | | | | | | | | | | | |
| | | | | | | (665,749,035 | ) | | | | | | | (1,373,831,040 | ) |
| | | | | | | | | | | | | | | | |
Net decrease in net assets resulting from
capital share transactions | | | | | | | (137,985,971 | ) | | | | | | | (17,399,531 | ) |
| | | | | | | | | | | | | | | | |
Total decrease in net assets | | | | | | | (137,985,167 | ) | | | | | | | (17,424,192 | ) |
| | | | | | | | | | | | | | | | |
| | | | |
Net assets | | | | | | | | | | | | | | | | |
Beginning of period | | | | | | | 414,729,344 | | | | | | | | 432,153,536 | |
| | | | | | | | | | | | | | | | |
End of period | | | | | | $ | 276,744,177 | | | | | | | $ | 414,729,344 | |
| | | | | | | | | | | | | | | | |
Undistributed net investment income | | | | | | $ | 1,251 | | | | | | | $ | 1,251 | |
| | | | | | | | | | | | | | | | |
| 1. | After the close of business on July 9, 2010, the Fund acquired the net assets of Evergreen New York Municipal Money Market Fund which became the accounting and performance survivor in the transaction. The information for the period prior to July 12, 2010 is that of Evergreen New York Municipal Money Market Fund. |
| 2. | Class I shares of Evergreen New York Municipal Money Market Fund became Service Class shares on July 12, 2010. |
| 3. | Class S shares of Evergreen New York Municipal Money Market Fund became Sweep Class shares on July 12, 2010. |
The accompanying notes are an integral part of these financial statements.
| | | | | | |
| Financial Highlights | | Wells Fargo Advantage New York Municipal Money Market Fund | | | 15 | |
| | | | | | | | | | | | | | | | | | | | | | | | |
| | | Six Months Ended
July 31, 2011
(Unaudited) | | | Year Ended January 31, | |
| Class A | | | 20111 | | | 20101 | | | 20091 | | | 20081 | | | 20071 | |
Net asset value, beginning of period | | $ | 1.00 | | | $ | 1.00 | | | $ | 1.00 | | | $ | 1.00 | | | $ | 1.00 | | | $ | 1.00 | |
Net investment income | | | 0.00 | 2 | | | 0.00 | 2 | | | 0.00 | 2 | | | 0.01 | | | | 0.03 | | | | 0.03 | |
Net realized gains (losses) on investments | | | 0.00 | 2 | | | (0.00 | )2 | | | 0.00 | | | | 0.00 | | | | 0.00 | | | | 0.00 | |
| | | | | | | | | | | | | | | | | | | | | | | | |
Total from investment operations | | | 0.00 | 2 | | | 0.00 | 2 | | | 0.00 | 2 | | | 0.01 | | | | 0.03 | | | | 0.03 | |
Distributions to shareholders from | | | | | | | | | | | | | | | | | | | | | | | | |
Net investment income | | | (0.00 | )2 | | | (0.00 | )2 | | | (0.00 | )2 | | | (0.01 | ) | | | (0.03 | ) | | | (0.03 | ) |
Net asset value, end of period | | | $1.00 | | | | $1.00 | | | | $1.00 | | | | $1.00 | | | | $1.00 | | | | $1.00 | |
Total return3 | | | 0.00 | % | | | 0.01 | % | | | 0.04 | % | | | 1.41 | % | | | 2.92 | % | | | 2.88 | % |
Ratios to average net assets (annualized) | | | | | | | | | | | | | | | | | | | | | | | | |
Gross expenses | | | 0.85 | % | | | 0.84 | % | | | 0.88 | % | | | 0.85 | % | | | 0.86 | % | | | 0.86 | % |
Net expenses | | | 0.19 | % | | | 0.31 | % | | | 0.55 | % | | | 0.85 | % | | | 0.86 | % | | | 0.86 | % |
Net investment income | | | 0.01 | % | | | 0.01 | % | | | 0.04 | % | | | 1.36 | % | | | 2.84 | % | | | 2.72 | % |
Supplemental data | | | | | | | | | | | | | | | | | | | | | | | | |
Net assets, end of period (000’s omitted) | | | $10,765 | | | | $11,467 | | | | $18,245 | | | | $25,597 | | | | $51,071 | | | | $47,842 | |
| 1. | After the close of business on July 9, 2010, the Fund acquired the net assets of Evergreen New York Municipal Money Market Fund which became the accounting and performance survivor in the transaction. The information for the periods prior to July 12, 2010 is that of Class A of Evergreen New York Municipal Money Market Fund. |
| 2. | Amount represents less than $0.005. |
| 3. | Returns for periods of less than one year are not annualized. |
The accompanying notes are an integral part of these financial statements.
| | | | |
| 16 | | Wells Fargo Advantage New York Municipal Money Market Fund | | Financial Highlights |
| | | | | | | | | | | | | | | | | | | | | | | | |
| | | Six Months Ended
July 31, 2011
(Unaudited) | | | Year Ended January 31, | |
| Service Class | | | 20111 | | | 20101 | | | 20091 | | | 20081 | | | 20071 | |
Net asset value, beginning of period | | $ | 1.00 | | | $ | 1.00 | | | $ | 1.00 | | | $ | 1.00 | | | $ | 1.00 | | | $ | 1.00 | |
Net investment income | | | 0.00 | 2 | | | 0.00 | 2 | | | 0.00 | 2 | | | 0.02 | | | | 0.03 | | | | 0.03 | |
Net realized gains (losses) on investments | | | 0.00 | 2 | | | 0.00 | 2 | | | 0.00 | | | | 0.00 | | | | 0.00 | | | | 0.00 | |
| | | | | | | | | | | | | | | | | | | | | | | | |
Total from investment operations | | | 0.00 | 2 | | | 0.00 | 2 | | | 0.00 | 2 | | | 0.02 | | | | 0.03 | | | | 0.03 | |
Distributions to shareholders from | | | | | | | | | | | | | | | | | | | | | | | | |
Net investment income | | | (0.00 | )2 | | | (0.00 | )2 | | | (0.00 | )2 | | | (0.02 | ) | | | (0.03 | ) | | | (0.03 | ) |
Net asset value, end of period | | | $1.00 | | | | $1.00 | | | | $1.00 | | | | $1.00 | | | | $1.00 | | | | $1.00 | |
Total return3 | | | 0.00 | % | | | 0.01 | % | | | 0.14 | % | | | 1.71 | % | | | 3.23 | % | | | 3.18 | % |
Ratios to average net assets (annualized) | | | | | | | | | | | | | | | | | | | | | | | | |
Gross expenses | | | 0.74 | % | | | 0.66 | % | | | 0.58 | % | | | 0.55 | % | | | 0.56 | % | | | 0.56 | % |
Net expenses | | | 0.19 | % | | | 0.30 | % | | | 0.44 | % | | | 0.55 | % | | | 0.56 | % | | | 0.56 | % |
Net investment income | | | 0.01 | % | | | 0.01 | % | | | 0.15 | % | | | 1.69 | % | | | 3.13 | % | | | 2.98 | % |
Supplemental data | | | | | | | | | | | | | | | | | | | | | | | | |
Net assets, end of period (000’s omitted) | | | $11,035 | | | | $11,929 | | | | $9,766 | | | | $12,241 | | | | $18,163 | | | | $60,677 | |
| 1. | After the close of business on July 9, 2010, the Fund acquired the net assets of Evergreen New York Municipal Money Market Fund which became the accounting and performance survivor in the transaction. The information for the periods prior to July 12, 2010 is that of Class I of Evergreen New York Municipal Money Market Fund. |
| 2. | Amount represents less than $0.005. |
| 3. | Returns for periods of less than one year are not annualized. |
The accompanying notes are an integral part of these financial statements.
| | | | | | |
| Financial Highlights | | Wells Fargo Advantage New York Municipal Money Market Fund | | | 17 | |
| | | | | | | | | | | | | | | | | | | | | | | | |
| | | Six Months Ended
July 31, 2011
(Unaudited) | | | Year Ended January 31, | |
| Sweep Class | | | 20111 | | | 20101 | | | 20091 | | | 20081 | | | 20071 | |
Net asset value, beginning of period | | $ | 1.00 | | | $ | 1.00 | | | $ | 1.00 | | | $ | 1.00 | | | $ | 1.00 | | | $ | 1.00 | |
Net investment income | | | 0.00 | 2 | | | 0.00 | 2 | | | 0.00 | 2 | | | 0.01 | | | | 0.03 | | | | 0.03 | |
Net realized gains (losses) on investments | | | 0.00 | 2 | | | (0.00 | )2 | | | 0.00 | | | | 0.00 | | | | 0.00 | | | | 0.00 | |
| | | | | | | | | | | | | | | | | | | | | | | | |
Total from investment operations | | | 0.00 | 2 | | | 0.00 | 2 | | | 0.00 | 2 | | | 0.01 | | | | 0.03 | | | | 0.03 | |
Distributions to shareholders from | | | | | | | | | | | | | | | | | | | | | | | | |
Net investment income | | | (0.00 | )2 | | | (0.00 | )2 | | | (0.00 | )2 | | | (0.01 | ) | | | (0.03 | ) | | | (0.03 | ) |
Net asset value, end of period | | | $1.00 | | | | $1.00 | | | | $1.00 | | | | $1.00 | | | | $1.00 | | | | $1.00 | |
Total return3 | | | 0.00 | % | | | 0.01 | % | | | 0.03 | % | | | 1.12 | % | | | 2.61 | % | | | 2.57 | % |
Ratios to average net assets (annualized) | | | | | | | | | | | | | | | | | | | | | | | | |
Gross expenses | | | 1.20 | % | | | 1.17 | % | | | 1.17 | % | | | 1.16 | % | | | 1.16 | % | | | 1.16 | % |
Net expenses | | | 0.20 | % | | | 0.31 | % | | | 0.53 | % | | | 1.14 | % | | | 1.16 | % | | | 1.16 | % |
Net investment income | | | 0.01 | % | | | 0.01 | % | | | 0.03 | % | | | 1.06 | % | | | 2.54 | % | | | 2.41 | % |
Supplemental data | | | | | | | | | | | | | | | | | | | | | | | | |
Net assets, end of period (000’s omitted) | | | $254,944 | | | | $391,334 | | | | $404,142 | | | | $357,605 | | | | $273,501 | | | | $249,845 | |
| 1. | After the close of business on July 9, 2010, the Fund acquired the net assets of Evergreen New York Municipal Money Market Fund which became the accounting and performance survivor in the transaction. The information for the periods prior to July 12, 2010 is that of Class S of Evergreen New York Municipal Money Market Fund. |
| 2. | Amount represents less than $0.005. |
| 3. | Returns for periods of less than one year are not annualized. |
The accompanying notes are an integral part of these financial statements.
| | | | |
| 18 | | Wells Fargo Advantage New York Municipal Money Market Fund | | Notes to Financial Statements (Unaudited) |
1. ORGANIZATION
Wells Fargo Funds Trust (the “Trust”), a Delaware statutory trust organized on March 10, 1999, is an open-end management investment company registered under the Investment Company Act of 1940, as amended (the “1940 Act”). These financial statements report on Wells Fargo Advantage New York Municipal Money Market Fund (the “Fund”) which is a diversified series of the Trust.
2. SIGNIFICANT ACCOUNTING POLICIES
The following significant accounting policies, which are consistently followed in the preparation of the financial statements of the Fund, are in conformity with U.S. generally accepted accounting principles which require management to make estimates and assumptions that affect the reported amounts of assets and liabilities, disclosure of contingent assets and liabilities at the date of the financial statements, and the reported amounts of revenues and expenses during the reporting period. Actual results could differ from those estimates.
Securities valuation
As permitted under Rule 2a-7 of the 1940 Act, securities are valued at amortized cost, which approximates fair value.
The valuation techniques used by the Fund to measure fair value are consistent with the market approach, income approach and/or cost approach, where applicable, for each security type.
Security transactions and income recognition
Securities transactions are recorded on a trade date basis. Realized gains or losses are reported on the basis of identified cost of securities delivered.
Interest income is accrued daily and bond discounts are accreted and premiums are amortized daily based on the effective interest method. To the extent debt obligations are placed on non-accrual status, any related interest income may be reduced by writing off interest receivables when the collection of all or a portion of interest has become doubtful based on consistently applied procedures. If the issuer subsequently resumes interest payments or when the collectability of interest is reasonably assured, the debt obligation is removed from non-accrual status.
Distributions to shareholders
Distributions to shareholders from net investment income are accrued daily and paid monthly. Distributions from net realized gains, if any, are recorded on the ex-dividend date. Such distributions are determined in conformity with income tax regulations, which may differ from generally accepted accounting principles.
Federal and other taxes
The Fund intends to continue to qualify as a regulated investment company by distributing substantially all of its investment company taxable and tax-exempt income and any net realized capital gains (after reduction for capital loss carryforwards) sufficient to relieve it from all, or substantially all, federal income taxes. Accordingly, no provision for federal income taxes was required.
The Fund’s income and federal excise tax returns and all financial records supporting those returns for the prior three fiscal years are subject to examination by the federal and Delaware revenue authorities.
Under the recently enacted Regulated Investment Company Modernization Act of 2010, the Fund will be permitted to carry forward capital losses incurred in taxable years beginning after December 22, 2010 for an unlimited period. However, any losses incurred during those future taxable years will be required to be utilized prior to the losses incurred in pre-enactment taxable years. As a result of this ordering rule, pre-enactment capital loss carryforwards may be more likely to expire unused. Additionally, post-enactment capital losses that are carried forward will retain their character as either short-term or long-term capital losses rather than being considered all short-term as under previous law.
Class allocations
The separate classes of shares offered by the Fund differ principally in distribution, shareholder servicing and administration fees. Shareholders of each class bear certain expenses that pertain to that particular class. All shareholders bear the common expenses of the Fund, earn income from the portfolio, and are allocated unrealized gains and losses pro rata based on the average daily net assets of each class, without distinction between share classes. Dividends are determined separately for each class based on income and expenses allocable to each class. Realized gains and losses are allocated to each class pro rata based upon the net assets of each class on the date realized. Differences in per share
| | | | | | |
| Notes to Financial Statements (Unaudited) | | Wells Fargo Advantage New York Municipal Money Market Fund | | | 19 | |
dividend rates generally result from the relative weightings of pro rata income and realized gain allocations and from differences in separate class expenses, including distribution, shareholder servicing and administration fees.
3. FAIR VALUATION MEASUREMENTS
Fair value measurements of investments are determined within a framework that has established a fair value hierarchy based upon the various data inputs utilized in determining the value of the Fund’s investments. The three-level hierarchy gives the highest priority to unadjusted quoted prices in active markets for identical assets or liabilities (Level 1) and the lowest priority to unobservable inputs (Level 3). The Fund’s investments are classified within the fair value hierarchy based on the lowest level of input that is significant to the fair value measurement. The inputs are summarized into three broad levels as follows:
| n | | Level 1 – quoted prices in active markets for identical securities |
| n | | Level 2 – other significant observable inputs (including quoted prices for similar securities, interest rates, prepayment speeds, credit risk, etc.) |
| n | | Level 3 – significant unobservable inputs (including the Fund’s own assumptions in determining the fair value of investments) |
The inputs or methodologies used for valuing securities are not necessarily an indication of the risk associated with investing in those securities.
At July 31, 2011, all of the Fund’s investments in securities carried at fair value were designated as Level 2 since the primary inputs include credit quality of the issuer and short-term interest rates which are observable.
Further details on the major security types can be found in the Fund’s Portfolio of Investments.
4. TRANSACTIONS WITH AFFILIATES AND OTHER EXPENSES
Advisory fee
The Trust has entered into an advisory contract with Wells Fargo Funds Management, LLC (“Funds Management”), an indirect wholly owned subsidiary of Wells Fargo & Company (“Wells Fargo”). The adviser is responsible for implementing investment policies and guidelines and for supervising the sub-adviser, who is responsible for day-to-day portfolio management of the Fund.
Pursuant to the contract, Funds Management is entitled to receive an annual advisory fee starting at 0.30% and declining to 0.20% as the average daily net assets of the Fund increase. For the six months ended July 31, 2011, the advisory fee was equivalent to an annual rate of 0.30% of the Fund’s average daily net assets.
Funds Management may retain the services of certain sub-advisers to provide daily portfolio management to the Fund. The fees related to sub-advisory services are borne directly by the adviser and do not increase the overall fees paid by the Fund to the adviser. Wells Capital Management Incorporated, an affiliate of Funds Management, is the sub-adviser to the Fund and is entitled to receive a fee from the adviser at an annual rate starting at 0.05% and declining to 0.01% as the average daily net assets of the Fund increase.
Administration and transfer agent fees
The Trust has entered into an administration agreement with Funds Management. Under this agreement, for providing administrative services, which includes paying fees and expenses for services provided by the transfer agent, sub-transfer agents, omnibus account servicers and record-keepers, Funds Management is entitled to receive from the Fund an annual fund level administration fee starting at 0.05% and declining to 0.03% as the average daily net assets of the Fund increase and a class level administration fee which is calculated based on the average daily net assets of each class as follows:
| | | | |
| | | Class Level Administration Fee | |
Class A, Sweep Class | | | 0.22 | % |
Service Class | | | 0.12 | |
| | | | |
| 20 | | Wells Fargo Advantage New York Municipal Money Market Fund | | Notes to Financial Statements (Unaudited) |
Funds Management has contractually waived and/or reimbursed advisory and administration fees to the extent necessary to maintain certain net operating expense ratios for the Fund. Waiver of fees and/or reimbursement of expenses by Funds Management were made first from fund level expenses on a proportionate basis and then from class specific expenses.
Distribution fees
The Trust has adopted a Distribution Plan for Sweep Class shares of the Fund pursuant to Rule 12b-1 under the 1940 Act. Distribution fees are charged to the Sweep Class shares and paid to Wells Fargo Funds Distributor, LLC, the principal underwriter, at an annual rate of 0.35% of the average daily net assets of Sweep Class.
Shareholder servicing fees
The Trust has entered into contracts with one or more shareholder servicing agents, whereby Class A, Service Class and Sweep Class of the Fund is charged a fee at an annual rate of 0.25% of the respective average daily net assets of each class.
A portion of these total shareholder servicing fees were paid to affiliates of Wells Fargo.
5. CONCENTRATION RISK
The Fund invests a substantial portion of its assets in issuers of municipal debt securities located in a single state, therefore, it may be more affected by economic and political developments in that state or region than would be a comparable general tax-exempt mutual fund.
6. INDEMNIFICATION
Under the Trust’s organizational documents, the officers and directors are indemnified against certain liabilities that may arise out of performance of their duties to the Trust. Additionally, in the normal course of business, the Trust may enter into contracts with service providers that contain a variety of indemnification clauses. The Trust’s maximum exposure under these arrangements is dependent on future claims that may be made against the Fund and, therefore, cannot be estimated.
7. NEW ACCOUNTING PRONOUNCEMENTS
In May 2011, the Financial Accounting Standards Board (“FASB”) issued Accounting Standards Update (“ASU”) No. 2011-04 “Amendments to Achieve Common Fair Value Measurement and Disclosure Requirements in U.S. GAAP and IFRSs”. ASU No. 2011-04 amends FASB ASC Topic 820, Fair Value Measurements and Disclosures, to establish common requirements for measuring fair value and for disclosing information about fair value measurements in accordance with GAAP. The ASU is effective prospectively for interim and annual periods beginning after December 15, 2011.
In April 2011, FASB issued ASU No. 2011-03 “Reconsideration of Effective Control for Repurchase Agreements”. ASU No. 2011-03 amends FASB ASC Topic 860, Transfers and Servicing, specifically the criteria required to determine whether a repurchase agreement (repo) and similar agreements should be accounted for as sales of financial assets or secured borrowings with commitments. ASU No. 2011-03 changes the assessment of effective control by focusing on the transferor’s contractual rights and obligations and removing the criterion to assess its ability to exercise those rights or honor those obligations. This could result in changes to the way entities account for certain transactions including repurchase agreements, mortgage dollar rolls and reverse repurchase agreements. The ASU will become effective on a prospective basis for new transfers and modifications to existing transactions as of the beginning of the first interim or annual period beginning on or after December 15, 2011.
As of July 31, 2011, management of the Fund is currently assessing the potential impact, in addition to expanded financial statement disclosure, that may result from adopting these ASUs.
| | | | | | |
| Other Information (Unaudited) | | Wells Fargo Advantage New York Municipal Money Market Fund | | | 21 | |
PORTFOLIO HOLDINGS INFORMATION
The complete portfolio holdings for the Fund are publicly available on the Fund’s Web site
(www.wellsfargo.com/advantagefunds) on a monthly, seven-day delayed basis. The Fund files its complete schedule of portfolio holdings with the SEC for the first and third quarters of each fiscal year on Form N-Q, which is available without charge by visiting the SEC Web site at www.sec.gov. In addition, the Fund’s Form N-Q may be reviewed and copied at the SEC’s Public Reference Room in Washington, DC, and at regional offices in New York City, at 233 Broadway, and in Chicago, at 175 West Jackson Boulevard, Suite 900. Information about the Public Reference Room may be obtained by calling 1-800-SEC-0330.
PROXY VOTING INFORMATION
A description of the policies and procedures that the Fund uses to determine how to vote proxies relating to portfolio securities is available without charge, upon request, by calling 1-800-222-8222, visiting our Web site at www.wellsfargo.com/advantagefunds, or visiting the SEC Web site at www.sec.gov. Information regarding how the Fund voted proxies relating to portfolio securities during the most recent 12-month period ended June 30 is available without charge on the Fund’s Web site at www.wellsfargo.com/advantagefunds or by visiting the SEC Web site at www.sec.gov.
| | | | |
| 22 | | Wells Fargo Advantage New York Municipal Money Market Fund | | Other Information (Unaudited) |
BOARD OF TRUSTEES
The following table provides basic information about the Board of Trustees (the “Trustees”) of the Trust and Officers of the Trust. This table should be read in conjunction with the Prospectus and the Statement of Additional Information1 of the Fund. Each of the Trustees and Officers listed below acts in identical capacities for the Wells Fargo Advantage family of funds, which consists of 144 funds comprising the Wells Fargo Funds Trust, Wells Fargo Variable Trust, Wells Fargo Master Trust and four closed-end funds (collectively the “Fund Complex”). All of the Trustees are also Members of the Audit and Governance Committees of each Trust in the Fund Complex. The mailing address of each Trustee and Officer is 525 Market Street, 12th Floor, San Francisco, CA 94105. Each Trustee and Officer serves an indefinite term, however, each Trustee serves such term until reaching the mandatory retirement age established by the Trustees.
Independent Trustees
| | | | | | |
Name and Year of Birth | | Position Held and Length of Service | | Principal Occupations During Past Five Years | | Other Directorships During
Past Five Years |
Peter G. Gordon
(Born 1942) | | Trustee, since 1998; Chairman, since 2005 | | Co-Founder, Chairman, President and CEO of Crystal Geyser. Water Company. Trustee Emeritus, Colby College | | Asset Allocation Trust |
Isaiah Harris, Jr.
(Born 1952) | | Trustee, since 2009 | | Retired. Prior thereto, President and CEO of BellSouth Advertising and Publishing Corp. from 2005 to 2007, President and CEO of BellSouth Enterprises from 2004 to 2005 and President of BellSouth Consumer Services from 2000 to 2003. Emeritus member of the Iowa State University Foundation Board of Governors. Emeritus Member of the Advisory Board of Iowa State University School of Business. Mr. Harris is a certified public accountant. | | CIGNA Corporation; Deluxe Corporation; Asset Allocation Trust |
Judith M. Johnson
(Born 1949) | | Trustee, since 2008 | | Retired. Prior thereto, Chief Executive Officer and Chief Investment Officer of Minneapolis Employees Retirement Fund from 1996 to 2008. Ms. Johnson is an attorney, certified public accountant and a certified managerial accountant. | | Asset Allocation Trust |
Leroy Keith, Jr.
(Born 1939) | | Trustee, since 2010 | | Chairman, Bloc Global Services (development and construction), Trustee of the Evergreen Funds from 1983 to 2010. Former Managing Director, Almanac Capital Management (commodities firm), former Partner, Stonington Partners, Inc. (private equity fund), former Director, Obagi Medical Products Co. and former Director, Lincoln Educational Services. | | Trustee, Virtus Fund Complex (consisting of 45 portfolios as of 12/31/10); Director, Diversapack Co. (packaging company); Asset Allocation Trust |
David F. Larcker
(Born 1950) | | Trustee, since 2009 | | James Irvin Miller Professor of Accounting at the Graduate School of Business, Stanford University, Director of Corporate Governance Research Program and Co-Director of The Rock Center for Corporate Governance since 2006. From 2005 to 2008, Professor of Accounting at the Graduate School of Business, Stanford University. Prior thereto, Ernst & Young Professor of Accounting at The Wharton School, University of Pennsylvania from 1985 to 2005. | | Asset Allocation Trust |
Olivia S. Mitchell
(Born 1953) | | Trustee, since 2006 | | International Foundation of Employee Benefit Plans Professor and Chair of the Department of Insurance and Risk Management, Wharton School of the University of Pennsylvania since 1993. Director of Wharton’s Pension Research Council and Boettner Center on Pensions & Retirement Research, and Research Associate at the National Bureau of Economic Research. Previously, Cornell University Professor from 1978 to 1993. | | Asset Allocation Trust |
| | | | | | |
| Other Information (Unaudited) | | Wells Fargo Advantage New York Municipal Money Market Fund | | | 23 | |
| | | | | | |
Name and Year of Birth | | Position Held and Length of Service | | Principal Occupations During Past Five Years | | Other Directorships During
Past Five Years |
Timothy J. Penny
(Born 1951) | | Trustee, since 1996 | | President and CEO of Southern Minnesota Initiative Foundation, a non-profit organization, since 2007 and Senior Fellow at the Humphrey Institute Policy Forum at the University of Minnesota since 1995. Member of the Board of Trustees of NorthStar Education Finance, Inc., a non-profit organization, since 2007. | | Asset Allocation Trust |
Michael S. Scofield
(Born 1943) | | Trustee, since 2010 | | Currently serves on the Investment Company Institute’s Board of Governors and Executive Committee as well the In dependent Director’s Counsel Board of Governors and Executive Committee. Former Chairman of the Independent Directors Counsel. Trustee of the Evergreen Funds from 1984 to 2010. Retired Attorney, Law Offices of Michael S. Scofield and former Director and Chairman, Branded Media Corporation (multi-media branding company). | | Asset Allocation Trust |
Donald C. Willeke
(Born 1940) | | Trustee, since 1996 | | Principal of the law firm of Willeke & Daniels. General Counsel of the Minneapolis Employees Retirement Fund from 1984 until its consolidation into the Minnesota Public Employees Retirement Association on June 30, 2010. | | Asset Allocation Trust |
Officers
| | | | | | |
Name and Year of Birth | | Position Held and
Length of Service | | Principal Occupations During Past Five Years | | |
Karla M. Rabusch
(Born 1959) | | President, since 2003 | | Executive Vice President of Wells Fargo Bank, N.A. and President of Wells Fargo Funds Management, LLC since 2003. Senior Vice President and Chief Administrative Officer of Wells Fargo Funds Management, LLC from 2001 to 2003. | | |
C. David Messman
(Born 1960) | | Secretary, since 2000; Chief Legal Counsel, since 2003 | | Senior Vice President and Secretary of Wells Fargo Funds Management, LLC since 2001. Vice President and Managing Counsel of Wells Fargo Bank, N.A. since 1996. | | |
Kasey Phillips
(Born 1970) | | Treasurer, since 2008 | | Senior Vice President of Wells Fargo Funds Management, LLC since 2009. Senior Vice President of Evergreen Investment Management Company, LLC from 2006 to 2010. Treasurer of the Evergreen Funds from 2005 to 2010. Vice President and Assistant Vice President of Evergreen Investment Services, Inc. from 1999 to 2006. | | |
David Berardi
(Born 1975) | | Assistant Treasurer, since 2009 | | Vice President of Wells Fargo Funds Management, LLC since 2009 . Vice President of Evergreen Investment Management Company, LLC from 2008 to 2010. Assistant Vice President of Evergreen Investment Services, Inc. from 2004 to 2008. Manager of Fund Reporting and Control for Evergreen Investment Management Company, LLC from 2004 to 2010. | | |
Jeremy DePalma
(Born 1974) | | Assistant Treasurer, since 2009 | | Senior Vice President of Wells Fargo Funds Management, LLC since 2009. Senior Vice President of Evergreen Investment Management Company, LLC from 2008 to 2010. Vice President, Evergreen Investment Services, Inc. from 2004 to 2007. Assistant Vice President, Evergreen Investment Services, Inc. from 2000 to 2004 and the head of the Fund Reporting and Control Team within Fund Administration from 2005 to 2010. | | |
Debra Ann Early
(Born 1964) | | Chief Compliance Officer, since 2007 | | Chief Compliance Officer of Wells Fargo Funds Management, LLC since 2007. Chief Compliance Officer of Parnassus Investments from 2005 to 2007. Chief Financial Officer of Parnassus Investments from 2004 to 2007 and Senior Audit Manager of PricewaterhouseCoopers LLP from 1998 to 2004. | | |
| 1. | The Statement of Additional Information includes additional information about the Fund’s Trustees and is available, without charge, upon request, by calling 1-800-222-8222 or by visiting the Fund’s Web site at www.wellsfargo.com/advantagefunds. |
| | | | |
| 24 | | Wells Fargo Advantage New York Municipal Money Market Fund | | Other Information (Unaudited) |
BOARD CONSIDERATION OF INVESTMENT ADVISORY AND SUB-ADVISORY AGREEMENTS:
California Municipal Money Market Fund, Municipal Cash Management Money Market Fund, Municipal Money Market Fund, National Tax-Free Money Market Fund, New Jersey Municipal Money Market Fund, New York Municipal Money Market Fund and Pennsylvania Municipal Money Market Fund
(Not all of the funds described in this Board considerations section are part of this shareholder report. This shareholder report only relates to New York Municipal Money Market Fund.)
Each year, as required by Section 15 of the Investment Company Act of 1940 (the “1940 Act”), the Board of Trustees (the “Board”) of Wells Fargo Funds Trust (the “Trust”), all the members of which have no direct or indirect interest in the investment advisory and sub-advisory agreements and are not “interested persons” of the Trust, as defined in the 1940 Act (the “Independent Trustees”), determines whether to approve the continuation of the Trust’s investment advisory and sub-advisory agreements. In this regard, at an in person meeting held on March 24-25, 2011 (the “Meeting”), the Board reviewed and re-approved: (i) an investment advisory agreement with Wells Fargo Funds Management, LLC (“Funds Management”) for each of the California Municipal Money Market Fund, Municipal Cash Management Money Market Fund, Municipal Money Market Fund, National Tax-Free Money Market Fund, New Jersey Municipal Money Market Fund, New York Municipal Money Market Fund and Pennsylvania Municipal Money Market Fund (collectively, the “Funds”); and (ii) an investment sub-advisory agreement with Wells Capital Management Incorporated (“Wells Capital Management”) for each of the Funds. The investment advisory agreements with Funds Management and the investment sub-advisory agreements with Wells Capital Management are collectively referred to as the “Advisory Agreements.”
At the Meeting, the Board considered the factors and reached the conclusions described below relating to the selection of Funds Management and Wells Capital Management and continuation of the Advisory Agreements. Prior to the Meeting, the Trustees conferred extensively among themselves and with representatives of Funds Management about these matters. The Board also met throughout the year and received information that was useful to them in considering the continuation of the Advisory Agreements. The Independent Trustees were assisted in their evaluation of the Advisory Agreements by independent legal counsel, from whom they received separate legal advice and with whom they met separately from Funds Management.
Nature, extent and quality of services
The Board received and considered various information regarding the nature, extent and quality of services provided to the Funds by Funds Management and Wells Capital Management under the Advisory Agreements. The Board also received and considered information provided in response to a detailed set of requests submitted by the Independent Trustees’ independent legal counsel on their behalf. The Board received and considered, among other things, information about the background and experience of senior management of Funds Management, and the qualifications, backgrounds, tenures and responsibilities of the portfolio managers primarily responsible for the day-to-day portfolio management of the Funds.
The Board evaluated the ability of Funds Management and Wells Capital Management, based on their respective financial condition, resources, reputation and other attributes, to attract and retain qualified investment professionals, including research, advisory, and supervisory personnel. The Board further considered the compliance programs and compliance records of Funds Management and Wells Capital Management. In addition, the Board took into account the administrative services provided to the Funds by Funds Management and its affiliates.
The Board’s decision to approve the continuation of the Advisory Agreements was based on a comprehensive evaluation of all of the information provided to it. In approving the continuation of the Advisory Agreements, the Board did not identify any particular information or consideration that was all-important or controlling, and each Trustee attributed different weights to various factors. The Board evaluated information provided to it both in terms of the funds generally and with respect to each Fund specifically as it considered appropriate. Although the Board considered the continuation of the Advisory Agreements for each of the Funds as part of the larger process of considering the continuation of the advisory agreements for all of the funds, its decision to continue the Advisory Agreements for each of the Funds was ultimately made on a fund-by-fund basis.
In considering these matters, the Board considered not only the specific information presented in connection with the Meeting, but also the knowledge gained over time through interaction with Funds Management and Wells Capital
| | | | | | |
| Other Information (Unaudited) | | Wells Fargo Advantage New York Municipal Money Market Fund | | | 25 | |
Management about various topics, including Funds Management’s oversight of service providers. The above factors, together with those referenced below, are some of the most important, but not necessarily all, factors considered by the Board in concluding that it was satisfied with the nature, extent and quality of the investment advisory services provided to each Fund by Funds Management and Wells Capital Management.
Fund performance and expenses
The Board considered the performance results for each of the Funds over various time periods ended December 31, 2010. The Board also considered these results in comparison to the median performance of a universe of relevant funds (the “Universe”) that were determined by Lipper Inc. (“Lipper”) to be similar to the Funds, and in comparison to each Fund’s benchmark index and to other comparative data. Lipper is an independent provider of investment company data. The Board received a description of the methodology used by Lipper to select the mutual funds in the Universe.
The Board noted that the performance of each of the Funds was generally higher than or in range of the median performance of the Universe for the periods under review.
The Board received and considered information regarding each Fund’s contractual advisory fee and net operating expense ratios and their various components, including actual management fees (which reflect fee waivers, if any), transfer agent, custodian and other non-management fees, Rule 12b-1 and non-Rule 12b-1 fees, service fees and fee waiver and expense reimbursement arrangements. The Board also considered these ratios in comparison to the median ratios of an expense Universe and a narrower expense group of mutual funds (each, an “Expense Group”) that was determined by Lipper to be similar to each Fund. The Board received a description of the methodology used by Lipper to select the mutual funds in a Fund’s Expense Group. The Board noted that the net operating expense ratios of the Service Class, Administrator Class and Institutional Class of each of the Funds were in range of each Fund’s respective Expense Group’s median net operating expense ratio. The Board also noted that the net operating expense ratios of the Class A and Sweep Class of each of the Funds were higher than each Fund’s respective Expense Group’s median net operating expense ratio and that the net operating expense ratio of the Municipal Money Market Fund (Investor Class) was not appreciably higher than the Expense Group’s median net operating expense ratio.
Based on the above-referenced considerations and other factors, the Board concluded that the overall performance and expense structure of the Funds supported the re-approval of the Advisory Agreements for the Funds.
Investment advisory and sub-advisory fee rates
The Board reviewed and considered the contractual investment advisory fee rates that are payable by the Funds to Funds Management for investment advisory services (the “Advisory Agreement Rates”), both on a stand-alone basis and on a combined basis with the Funds’ administration fee rates. The Board took into account the separate administrative and other services covered by the administration fee rates. The Board also reviewed and considered the contractual investment sub-advisory fee rates that are payable by Funds Management to Wells Capital Management for investment sub-advisory services (the “Sub-Advisory Agreement Rates”). In addition, the Board reviewed and considered the existing fee waiver/cap arrangements applicable to the Advisory Agreement Rates and considered the Advisory Agreement Rates after taking the waivers/caps into account (the “Net Advisory Rates”).
The Board received and considered information comparing the Advisory Agreement Rates and Net Advisory Rates with those of other funds in each Fund’s Expense Group median. The Board noted that the Advisory Agreement Rates for each of the Funds were in range of the median rate of each Fund’s Expense Group, except for the Municipal Money Market Fund and the New York Municipal Money Market Fund (Sweep Class). The Board noted that the Net Advisory Rates for the Service Class, Administrator Class and the Institutional Class of each of the Funds were lower than or in range of the median rate of each Fund’s Expense Group. The Board noted that the Net Advisory Rate for the Investor Class, Class A and Sweep Class of each of the Funds was not appreciably higher than the median rate for the Fund’s Expense, except for the Sweep Class of the Municipal Money Market Fund, New Jersey Municipal Money Market Fund and the New York Municipal Money Market Fund. The Board further noted that Funds Management had agreed to continue and, in certain instances, reduce contractual fee cap arrangements for the Funds designed to lower the Funds’ expenses.
The Board also received and considered information about the nature and extent of services offered and fee rates charged by Funds Management and Wells Capital Management to other types of clients. In this regard, the Board received information about differences between the services, and the compliance, reporting, and other legal burdens
| | | | |
| 26 | | Wells Fargo Advantage New York Municipal Money Market Fund | | Other Information (Unaudited) |
and risks of providing investment advice to mutual funds and those associated with providing advice to non-mutual fund clients such as collective funds or institutional separate accounts.
In each case, the Board determined that the Advisory Agreement Rates for the Funds, both with and without administration fee rates and before and after waivers, were acceptable in light of the Funds’ Expense Group information, the net expense ratio commitments, the services covered by the Advisory Agreements and other information provided. The Board also reviewed and considered the Sub-Advisory Agreement Rates and concluded that the Sub-Advisory Agreement Rates were acceptable in light of the services covered by the Sub-Advisory Agreement and other information provided.
Profitability
The Board received and considered a profitability analysis of Funds Management, as well as an analysis of the profitability to the collective Wells Fargo businesses that provide services to the Funds. It considered that the information provided to it was necessarily estimated, and that the profitability information provided to it, especially on a fund-by-fund basis, did not necessarily provide a precise tool for evaluating the appropriateness of each Fund’s Advisory Agreement Rates in isolation. It noted that the levels of profitability of the Funds to Funds Management varied widely, depending on, among other things, the size and type of fund. The Board concluded that the profitability to Funds Management of the services provided to any of the Funds, individually or in the aggregate, was not unreasonable.
The Board did not consider separate profitability information with respect to Wells Capital Management, because, as an affiliate of Funds Management, its profitability information was subsumed in the collective Wells Fargo profitability analysis provided by Funds Management.
Economies of scale
With respect to possible economies of scale, the Board reviewed the breakpoints in each Fund’s advisory fee structure, which operate generally to reduce the effective Advisory Agreement Rates of the Funds (as a percentage of Fund assets) as the Funds grow in size. It considered that, as a fund shrinks in size, breakpoints conversely result in increasing fee levels. The Board noted that it would continue to review the appropriate levels of breakpoints in the future, and concluded that the breakpoints as implemented appeared to be a reasonable step toward sharing economies of scale with the Funds. However, the Board acknowledged the inherent limitations of any analysis of an investment adviser’s economies of scale and of any attempt to correlate breakpoints with such economies, stemming largely from the Board’s understanding that economies of scale are realized, if at all, by an investment adviser across a variety of products and services, not just with respect to a single fund.
Other benefits to Funds Management and Wells Capital Management
The Board received and considered information regarding potential “fall-out” or ancillary benefits received by Funds Management and its affiliates, including Wells Capital Management, as a result of their relationship with the Funds. Ancillary benefits could include, among others, benefits directly attributable to the relationship of Funds Management and Wells Capital Management with the Funds and benefits potentially derived from an increase in Funds Management’s and Wells Capital Management’s business as a result of their relationship with the Funds (such as the ability to market to shareholders other financial products offered by Funds Management and its affiliates, including Wells Capital Management).
The Board considered that Wells Fargo Funds Distributor, LLC, an affiliate of Funds Management, serves as distributor to the Funds and receives certain compensation for those services. The Board noted that the Funds pay sub-transfer agency fees to various financial institutions, including affiliates of Funds Management that hold fund shares in omnibus accounts. It also considered that these entities may receive distribution-related fees and shareholder servicing payments (including amounts derived from payments under the funds’ Rule 12b-1 plans) in respect of shares sold or held through them.
The Board also reviewed information about whether and to what extent soft dollar credits are sought and how any such credits are utilized and any benefits that may be realized by using an affiliated broker.
Other factors and broader review
The Board also considered the markets for distribution of the Funds’ shares, including the multiple channels through which the Funds’ shares are offered and sold. The Board noted that the Funds are part of one of the few fund families that have both direct-to-fund and intermediary distribution channels. As discussed above, the Board reviews detailed materials received from Funds Management and Wells Capital Management annually as part of the re-approval process under Section 15 of the 1940 Act and also reviews and assesses information about the quality of the services that the
| | | | | | |
| Other Information (Unaudited) | | Wells Fargo Advantage New York Municipal Money Market Fund | | | 27 | |
Funds receive throughout the year. In this regard, the Board has reviewed reports of Funds Management at each of its quarterly meetings, which include, among other things, portfolio reviews and performance reports. In addition, the Board confers with portfolio managers at various times throughout the year.
Conclusion
After considering the above-described factors and based on its deliberations and its evaluation of the information described above, the Board concluded that approval of the continuation of the Advisory Agreements for the Funds was in the best interest of the Funds and their shareholders. Accordingly, the Board unanimously approved the continuation of the Advisory Agreements for an additional one-year period.
| | | | |
| 28 | | Wells Fargo Advantage New York Municipal Money Market Fund | | List of Abbreviations |
The following is a list of common abbreviations for terms and entities which may have appeared in this report.
| ABAG | — Association of Bay Area Governments |
| ACB | — Agricultural Credit Bank |
| ADR | — American Depositary Receipt |
| ADS | — American Depository Shares |
| AGC-ICC | — Assured Guaranty Corporation - Insured Custody Certificates |
| AGM | — Assured Guaranty Municipal |
| AMBAC | — American Municipal Bond Assurance Corporation |
| AMT | — Alternative Minimum Tax |
| ARM | — Adjustable Rate Mortgages |
| BAN | — Bond Anticipation Notes |
| BART | — Bay Area Rapid Transit |
| BHAC | — Berkshire Hathaway Assurance Corporation |
| CCAB | — Convertible Capital Appreciation Bond |
| CDA | — Community Development Authority |
| CDO | — Collateralized Debt Obligation |
| CDSC | — Contingent Deferred Sales Charge |
| CGIC | — Capital Guaranty Insurance Company |
| CGY | — Capital Guaranty Corporation |
| CIFG | — CDC (Caisse des Dépôts et Consignations) IX IS Financial Guarantee |
| COP | — Certificate of Participation |
| DRIVER | — Derivative Inverse Tax-Exempt Receipts |
| DW&P | — Department of Water & Power |
| DWR | — Department of Water Resources |
| ECFA | — Educational & Cultural Facilities Authority |
| EDFA | — Economic Development Finance Authority |
| ETET | — Eagle Tax-Exempt Trust |
| ETF | — Exchange-Traded Fund |
| FFCB | — Federal Farm Credit Bank |
| FGIC | — Financial Guaranty Insurance Corporation |
| FHA | — Federal Housing Authority |
| FHAG | — Federal Housing Agency |
| FHLB | — Federal Home Loan Bank |
| FHLMC | — Federal Home Loan Mortgage Corporation |
| FNMA | — Federal National Mortgage Association |
| GDR | — Global Depositary Receipt |
| GNMA | — Government National Mortgage Association |
| HCFR | — Healthcare Facilities Revenue |
| HEFA | — Health & Educational Facilities Authority |
| HEFAR | — Higher Education Facilities Authority Revenue |
| HFA | — Housing Finance Authority |
| HFFA | — Health Facilities Financing Authority |
| HUD | — Housing & Urban Development |
| IBC | — Insured Bond Certificate |
| IDA | — Industrial Development Authority |
| IDAG | — Industrial Development Agency |
| IDR | — Industrial Development Revenue |
| KRW | — Republic of Korea Won |
| LIBOR | — London Interbank Offered Rate |
| LLC | — Limited Liability Company |
| LLP | — Limited Liability Partnership |
| MBIA | — Municipal Bond Insurance Association |
| MFHR | — Multi-Family Housing Revenue |
| MFMR | — Multi-Family Mortgage Revenue |
| MMD | — Municipal Market Data |
| MSTR | — Municipal Securities Trust Receipts |
| MUD | — Municipal Utility District |
| NATL-RE | — National Public Finance Guarantee Corporation |
| PCFA | — Pollution Control Finance Authority |
| PCR | — Pollution Control Revenue |
| PFA | — Public Finance Authority |
| PFFA | — Public Facilities Financing Authority |
| PFOTER | — Puttable Floating Option Tax-Exempt Receipts |
| plc | — Public Limited Company |
| PSFG | — Public School Fund Guaranty |
| PUTTER | — Puttable Tax-Exempt Receipts |
| R&D | — Research & Development |
| RDA | — Redevelopment Authority |
| RDFA | — Redevelopment Finance Authority |
| REIT | — Real Estate Investment Trust |
| RIB | — Residual Interest Bond |
| ROC | — Reset Option Certificates |
| SAVRS | — Select Auction Variable Rate Securities |
| SFHR | — Single Family Housing Revenue |
| SFMR | — Single Family Mortgage Revenue |
| SLMA | — Student Loan Marketing Association |
| SPDR | — Standard & Poor’s Depositary Receipts |
| STIT | — Short-Term Investment Trust |
| TAN | — Tax Anticipation Notes |
| TIPS | — Treasury Inflation-Protected Securities |
| TRAN | — Tax Revenue Anticipation Notes |
| TCR | — Transferable Custody Receipts |
| TTFA | — Transportation Trust Fund Authority |
| USD | — Unified School District |
| XLCA | — XL Capital Assurance |
This page is intentionally left blank.
This page is intentionally left blank.


FOR MORE INFORMATION
More information about Wells Fargo Advantage Funds is available free upon request. To obtain literature, please write, e-mail, visit the Funds’ Web site, or call:
Wells Fargo Advantage Funds
P.O. Box 8266
Boston, MA 02266-8266
E-mail: wfaf@wellsfargo.com
Web site: www.wellsfargo.com/advantagefunds
Individual investors: 1-800-222-8222
Retail investment professionals: 1-888-877-9275
Institutional investment professionals: 1-866-765-0778
This report and the financial statements contained herein are submitted for the general information of the shareholders of Wells Fargo Advantage Funds. If this report is used for promotional purposes, distribution of the report must be accompanied or preceded by a current prospectus. For a prospectus containing more complete information, including charges and expenses, call 1-800-222-8222 or visit the Funds’ Web site at www.wellsfargo.com/advantagefunds. Please consider the investment objectives, risks, charges, and expenses of the investment carefully before investing. This and other information about Wells Fargo Advantage Funds can be found in the current prospectus. Read the prospectus carefully before you invest or send money.
Wells Fargo Funds Management, LLC, a wholly owned subsidiary of Wells Fargo & Company, provides investment advisory and administrative services for Wells Fargo Advantage Funds. Other affiliates of Wells Fargo & Company provide subadvisory and other services for the Funds. The Funds are distributed by Wells Fargo Funds Distributor, LLC, Member FINRA/SIPC, an affiliate of Wells Fargo & Company.
NOT FDIC INSURED ¡ NO BANK GUARANTEE ¡ MAY LOSE VALUE
© 2011 Wells Fargo Funds Management, LLC. All rights reserved.
| | |
 | | 204807 09-11 SA311/SAR311 7-11 |

Wells Fargo Advantage
Pennsylvania Municipal Money Market Fund

Semi-Annual Report
July 31, 2011

Reduce clutter. Save trees.
Sign up for electronic delivery of prospectuses and shareholder reports at www.wellsfargo.com/advantagedelivery
Contents
The views expressed and any forward-looking statements are as of July 31, 2011, unless otherwise noted and are those of the Fund managers and/or Wells Fargo Funds Management, LLC. Discussions of individual securities, or the markets generally, or any Wells Fargo Advantage Fund are not intended as individual recommendations. Future events or results may vary significantly from those expressed in any forward-looking statements; the views expressed are subject to change at any time in response to changing circumstances in the market. Wells Fargo Funds Management, LLC, disclaims any obligation to publicly update or revise any views expressed or forward-looking statements.
NOT FDIC INSURED ¡ NO BANK GUARANTEE ¡ MAY LOSE VALUE

WELLS FARGO INVESTMENT HISTORY
| | |
| |
| 1932 | | Keystone creates one of the first mutual fund families. |
| |
| 1971 | | Wells Fargo & Company introduces one of the first institutional index funds. |
| |
| 1978 | | Wells Fargo applies Markowitz and Sharpe’s research on Modern Portfolio Theory to introduce one of the industry’s first Tactical Asset Allocation (TAA) models in institutional separately managed accounts. |
| |
| 1984 | | Wells Fargo Stagecoach Funds launches its first asset allocation fund. |
| |
| 1989 | | The Tactical Asset Allocation (TAA) Model is first applied to Wells Fargo’s asset allocation mutual funds. |
| |
| 1994 | | Wells Fargo introduces the LifePath Funds, one of the first suites of target date funds (now the Wells Fargo Advantage Dow Jones Target Date FundsSM ). |
| |
| 1996 | | Evergreen Investments and Keystone Funds merge. |
| |
| 1997 | | Wells Fargo launches Wells Fargo Advantage WealthBuilder PortfoliosSM, a fund-of-funds suite of products that includes the use of quantitative models to shift assets among investment styles. |
| |
| 1999 | | Norwest Advantage Funds and Stagecoach Funds are reorganized into Wells Fargo Funds after the merger of Norwest and Wells Fargo. |
| |
| 2002 | | Evergreen Retail and Evergreen Institutional companies form the umbrella asset management company, Evergreen Investments. |
| |
| 2005 | | The integration of Strong Funds with Wells Fargo Funds creates Wells Fargo Advantage Funds, resulting in one of the top 20 mutual fund companies in the United States. |
| |
| 2006 | | Wells Fargo Advantage Funds relaunches the target date product line as Wells Fargo Advantage Dow Jones Target Date Funds. |
| |
| 2010 | | The mergers and reorganizations of Evergreen and Wells Fargo Advantage mutual funds are completed, unifying the families under the brand of Wells Fargo Advantage Funds. |
Wells Fargo Advantage Funds®
Wells Fargo Advantage Funds skillfully guides institutions, financial advisors, and individuals through the investment terrain to help them reach their financial objectives. Everything we do on behalf of investors is backed by our unique combination of qualifications.
Strength
Our organization is built on the standards of integrity and service established by our parent company—Wells Fargo & Company—more than 150 years ago. And, because we’re part of a highly diversified financial enterprise, we offer the depth of resources to help investors succeed.
Expertise
Our multi-boutique model offers investors access to the independent thinking of premier investment managers that have been chosen for their time-tested strategies. While each team specializes in a specific investment strategy, collectively they provide investors a wide choice of distinct investment styles. Our dedication to investment excellence doesn’t end with our expertise in manager selection—risk management, analysis, and rigorous ongoing review seek to ensure each manager’s investment process remains consistent.
Partnership
Our collaborative approach is built around understanding the needs and goals of our clients. By adhering to core principles of sound judgment and steady guidance, we support you through every stage of the investment decision process.
Carefully consider the investment objectives, risks, charges, and expenses before investing. For a current prospectus for Wells Fargo Advantage Funds containing this and other information, visit wellsfargo.com/advantagefunds. Read it carefully before investing.
Wells Fargo Funds Management, LLC, a wholly owned subsidiary of Wells Fargo & Company, provides investment advisory and administrative services for Wells Fargo Advantage Funds®. Other affiliates of Wells Fargo & Company provide subadvisory and other services for the Funds. The Funds are distributed by Wells Fargo Funds Distributor, LLC, Member FINRA/SIPC, an affiliate of Wells Fargo & Company.
The “Dow Jones Target Date Indexes” are a product of Dow Jones Indexes, a licensed trademark of CME Group Index Services LLC (“CME”). “Dow Jones” and “Dow Jones Target Date Indexes” are service marks of Dow Jones Trademark Holdings, LLC, and have been licensed for use for certain purposes by CME and sublicensed for use by Global Index Advisors, Inc., and Wells Fargo Funds Management, LLC. The Dow Jones Target Date Indexes are based in part on the Barclays Capital Bond Indexes, which are published by Barclays Capital Inc. The Wells Fargo Advantage Dow Jones Target Date Funds, based on the Dow Jones Target Date Indexes, are not sponsored, endorsed, sold, or promoted by Dow Jones, CME or Barclays Capital or any of their respective affiliates, and neither Dow Jones, CME nor Barclays Capital nor any of their respective affiliates makes any representation regarding the advisability of investing in such product(s) and/or about the quality, accuracy, and/or completeness of the Dow Jones Target Date Indexes or the Barclays Capital Bond Indexes. IN NO EVENT SHALL DOW JONES, CME, BARCLAYS CAPITAL, OR ANY OF THEIR LICENSORS HAVE ANY LIABILITY IN CONNECTION WITH THE Wells Fargo Advantage Dow Jones Target Date Funds INCLUDING, WITHOUT LIMITATION, FOR ANY SPECIAL, PUNITIVE, IN DIRECT, OR CONSEQUENTIAL DAMAGES (INCLUDING LOST PROFITS), EVEN IF NOTIFIED OF THE POSSIBILITY OF SUCH DAMAGES.
NOT FDIC INSURED ¡ NO BANK GUARANTEE ¡ MAY LOSE VALUE
Not part of the semi-annual report.
Wells Fargo Advantage Funds offers more than 110 mutual funds across a wide range of asset classes, representing over $221 billion in assets under management, as of July 31, 2011.
| | | | |
| Equity Funds | | | | |
Asia Pacific Fund | | Global Opportunities Fund | | Premier Large Company Growth Fund |
C&B Large Cap Value Fund | | Growth Fund | | Small Cap Opportunities Fund |
C&B Mid Cap Value Fund | | Health Care Fund | | Small Cap Value Fund |
Capital Growth Fund | | Index Fund | | Small Company Growth Fund |
Common Stock Fund | | International Equity Fund | | Small Company Value Fund |
Disciplined U.S. Core Fund | | International Value Fund | | Small/Mid Cap Core Fund |
Discovery Fund† | | Intrinsic Small Cap Value Fund | | Small/Mid Cap Value Fund |
Diversified Equity Fund | | Intrinsic Value Fund | | Social Sustainability Fund† |
Diversified International Fund | | Intrinsic World Equity Fund | | Special Mid Cap Value Fund |
Diversified Small Cap Fund | | Large Cap Core Fund | | Special Small Cap Value Fund |
Emerging Growth Fund | | Large Cap Growth Fund | | Specialized Technology Fund |
Emerging Markets Equity Fund | | Large Company Value Fund | | Strategic Large Cap Growth Fund |
Endeavor Select Fund† | | Omega Growth Fund | | Traditional Small Cap Growth Fund |
Enterprise Fund† | | Opportunity Fund† | | Utility and Telecommunications Fund |
Equity Value Fund | | Precious Metals Fund | | |
| Bond Funds | | | | |
Adjustable Rate Government Fund | | Inflation-Protected Bond Fund | | Short-Term Bond Fund |
California Limited-Term Tax-Free Fund | | Intermediate Tax/AMT-Free Fund | | Short-Term High Yield Bond Fund |
California Tax-Free Fund | | International Bond Fund | | Short-Term Municipal Bond Fund |
Colorado Tax-Free Fund | | Minnesota Tax-Free Fund | | Strategic Municipal Bond Fund |
Government Securities Fund | | Municipal Bond Fund | | Total Return Bond Fund |
High Income Fund | | North Carolina Tax-Free Fund | | Ultra Short-Term Income Fund |
High Yield Bond Fund | | Pennsylvania Tax-Free Fund | | Ultra Short-Term Municipal Income Fund |
Income Plus Fund | | Short Duration Government Bond Fund | | Wisconsin Tax-Free Fund |
| Asset Allocation Funds | | | | |
Asset Allocation Fund | | WealthBuilder Equity Portfolio† | | Target 2020 Fund† |
Conservative Allocation Fund | | WealthBuilder Growth Allocation Portfolio† | | Target 2025 Fund† |
Diversified Capital Builder Fund | | WealthBuilder Growth Balanced Portfolio† | | Target 2030 Fund† |
Diversified Income Builder Fund | | WealthBuilder Moderate Balanced Portfolio† | | Target 2035 Fund† |
Growth Balanced Fund | | WealthBuilder Tactical Equity Portfolio† | | Target 2040 Fund† |
Index Asset Allocation Fund | | Target Today Fund† | | Target 2045 Fund† |
Moderate Balanced Fund | | Target 2010 Fund† | | Target 2050 Fund† |
WealthBuilder Conservative Allocation Portfolio† | | Target 2015 Fund† | | Target 2055 Fund† |
| Money Market Funds | | | | |
100% Treasury Money Market Fund | | Minnesota Money Market Fund | | New Jersey Municipal Money Market Fund |
California Municipal Money Market Fund | | Money Market Fund | | New York Municipal Money Market Fund |
Cash Investment Money Market Fund | | Municipal Cash Management Money Market Fund | | Pennsylvania Municipal Money Market Fund |
Government Money Market Fund | | Municipal Money Market Fund | | Prime Investment Money Market Fund |
Heritage Money Market Fund† | | National Tax-Free Money Market Fund | | Treasury Plus Money Market Fund |
| Variable Trust Funds1 | | | | |
VT Discovery Fund† | | VT Intrinsic Value Fund | | VT Small Cap Growth Fund |
VT Index Asset Allocation Fund | | VT Omega Growth Fund | | VT Small Cap Value Fund |
VT International Equity Fund | | VT Opportunity Fund† | | VT Total Return Bond Fund |
An investment in a money market fund is not insured or guaranteed by the Federal Deposit Insurance Corporation or any other government agency. Although the Wells Fargo Advantage Money Market Funds seek to preserve the value of your investment at $1.00 per share, it is possible to lose money by investing in a money market fund.
| 1. | The Variable Trust Funds are generally available only through insurance company variable contracts. |
| † | In this report, the Wells Fargo Advantage Discovery FundSM, Wells Fargo Advantage Endeavor Select FundSM, Wells Fargo Advantage Enterprise FundSM, Wells Fargo Advantage Opportunity FundSM, Wells Fargo Advantage Social Sustainability FundSM, Wells Fargo Advantage WealthBuilder Conservative Allocation PortfolioSM, Wells Fargo Advantage WealthBuilder Equity PortfolioSM, Wells Fargo Advantage WealthBuilder Growth Allocation PortfolioSM, Wells Fargo Advantage WealthBuilder Growth Balanced PortfolioSM, Wells Fargo Advantage WealthBuilder Moderate Balanced PortfolioSM, Wells Fargo Advantage WealthBuilder Tactical Equity PortfolioSM, Wells Fargo Advantage Dow Jones Target Today FundSM, Wells Fargo Advantage Dow Jones Target 2010 FundSM, Wells Fargo Advantage Dow Jones Target 2015 FundSM, Wells Fargo Advantage Dow Jones Target 2020 FundSM, Wells Fargo Advantage Dow Jones Target 2025 FundSM, Wells Fargo Advantage Dow Jones Target 2030 FundSM, Wells Fargo Advantage Dow Jones Target 2035 FundSM, Wells Fargo Advantage Dow Jones Target 2040 FundSM, Wells Fargo Advantage Dow Jones Target 2045 FundSM, Wells Fargo Advantage Dow Jones Target 2050 FundSM, Wells Fargo Advantage Dow Jones Target 2055 FundSM, Wells Fargo Advantage Heritage Money Market FundSM, Wells Fargo Advantage VT Discovery FundSM, and Wells Fargo Advantage VT Opportunity FundSM are referred to as the Discovery Fund, Endeavor Select Fund, Enterprise Fund, Opportunity Fund, Social Sustainability Fund, WealthBuilder Conservative Allocation Portfolio, WealthBuilder Equity Portfolio, WealthBuilder Growth Allocation Portfolio, WealthBuilder Growth Balanced Portfolio, WealthBuilder Moderate Balanced Portfolio, WealthBuilder Tactical Equity Portfolio, Target Today Fund, Target 2010 Fund, Target 2015 Fund, Target 2020 Fund, Target 2025 Fund, Target 2030 Fund, Target 2035 Fund, Target 2040 Fund, Target 2045 Fund, Target 2050 Fund, Target 2055 Fund, Heritage Money Market Fund, VT Discovery Fund, and VT Opportunity Fund, respectively. |
Not part of the semi-annual report.
| | | | |
| 2 | | Wells Fargo Advantage Pennsylvania Municipal Money Market Fund | | Letter to Shareholders |

Karla M. Rabusch,
President
Wells Fargo Advantage Funds
Dear Valued Shareholder,
We’re pleased to offer you this semi-annual report for the Wells Fargo Advantage Pennsylvania Municipal Money Market Fund for the six-month period that ended July 31, 2011. Upon reviewing the report, you may notice a few changes from past reports, the most significant of which is the change from a multi-fund report to a single-fund report. We believe this change will give you more convenient access to your fund data.
The period began modestly as improving economic optimism generally shifted investors toward equities and riskier assets and away from U.S. Treasuries and lower-yielding fixed-income securities. Returns from fixed income were modest in the opening months of 2011 but were generally still positive as U.S. Treasury yields incrementally climbed higher. But after the slow start, bond prices once again strongly improved, sparked by a sharp decline in U.S. Treasury prices in April that carried into May. Late in the period, lower-rated bonds declined in price more than the higher credit-quality tiers but not enough to outweigh the stronger performance from lower-rated securities during the period. Lower-quality and longer-maturity fixed-income securities generally outperformed higher-quality and shorter-maturity securities over the full period.
The activity within the broader bond market also resonated with money market participants. As the economic and credit environment reverberated from the ongoing sovereign debt concerns and softening economic data, many participants continued to balance a need for stability and desire for higher yields. The result has been good demand for domestic commercial paper and certificate of deposits. Also, in spite of all the discussion about sovereign debt, many money market participants continue to maintain some exposures to foreign banks based on the quality of their fundamentals. By focusing more on the fundamentals and taking a more selective approach to the short-term security market helped the markets avoid the severe yield volatility or significant flight-to-quality experienced during the spring of 2010, when the Greek sovereign debt crisis first emerged.
The global economic “recovery” hit a snag, but the end of 2011 could regain momentum.
The U.S. economic recovery that began in mid-2009 and gained further momentum throughout 2010, particularly during the fourth quarter, has failed to maintain that level of growth through the first seven months of 2011. For example, gross domestic product (GDP), the broadest measure of economic activity, grew at an annualized rate of 3.1% in the fourth quarter of 2010, only to slow dramatically during the first quarter of 2011. The latest revision to first-quarter GDP data during the period indicated that the economy grew at an annualized rate of 0.4% during the first quarter of 2011. While still positive, it’s a much slower pace of growth than experienced in the second half of 2010 and notably lower than consensus forecasts. Nevertheless, the advance estimate of second-quarter 2011 GDP, which was released on July 29, 2011, was 1.3%, suggesting that the U.S. economy continues to expand, though at a slow and uneven pace.
| | | | | | |
| Letter to Shareholders | | Wells Fargo Advantage Pennsylvania Municipal Money Market Fund | | | 3 | |
Jobs and housing remained troublesome.
The July 2011 unemployment rate in the U.S. was reported at 9.1%, down from 9.5% a year earlier but still notably higher than historical averages. Unfortunately, the drop may be more attributable to a decline in the labor force than to a meaningful uptick in hiring. The level of job creation in 2011 has been trending below historical averages, suggesting that the improving economy has yet to translate into widespread hiring. Meanwhile, the beleaguered housing market was an ongoing source of concern, despite some tentative late-year signs of stabilization. That said, persistent weakness in the labor and housing markets bears close watching in the months ahead.
Other economic data in the U.S. has been more encouraging, reflecting greater confidence in the sustainability of the expansion on the part of both consumers and businesses. Retail sales came in strong at certain points during the period and industrial production and new orders have picked up. Although still reluctant to hire, businesses have gradually increased spending in other areas, such as equipment and information technology. Core inflation, which excludes volatile food and energy prices, remained benign.
The Federal Reserve believes the economic recovery will accelerate in future quarters.
With inflation subdued, the Federal Open Market Committee (FOMC) held its target range for the federal funds rate—a proxy for short-term interest rates—steady at 0.00% to 0.25%. On June 22, 2011, in its final statement of the six-month period, the Fed reiterated that the economic recovery “is proceeding at a moderate pace,” but that “recent labor market indicators have been weaker than anticipated.” It described the recent increase in inflation as temporary, suggesting that inflation pressures will ease going forward. While the FOMC explained that it “expects the pace of recovery to pick up over coming quarters,” it indicated that the federal funds rate will remain at an exceptionally low level for as long as necessary to ensure a sustainable recovery and expansion.
As recent headwinds subside, it is reasonable to expect markets to regain focus.
Now that it appears the debt ceiling has been increased and a U.S. default will be averted, money market participants and the broader bond market can get back to more fundamental and lasting concerns—chiefly, the economy. After avoiding short-term Treasuries in late July 2011, ahead of pending U.S. debt ceiling deadline, money market participants have returned to the U.S. short-term markets1. Economic indicators released in the second half of 2011 might not be as soft as those reported during the first half of the year. While that would not mean that the economy is robust, it might remind the markets that the first half of the slowdown was transitory. Most indicators still point toward real GDP growth in the 2% to 3% range in the second half of 2011. While that is not enough to produce big employment gains, it might be sufficient to cause Treasury yields to retrace some of the late-July declines.
Don’t let short-term uncertainty derail long-term investment goals.
While periods of uncertainty can present challenges, experience has taught us that maintaining a long-term investment strategy based on individual goals and
| 1. | Comments expressed that do not fall within the reporting period are as of August 2, 2011. |
While the FOMC explained that it “expects the pace of recovery to pick up over coming quarters,” it indicated that the federal funds rate will remain at an exceptionally low level for as long as necessary to ensure a sustainable recovery and expansion.
Economic indicators released in the second half of 2011 might not be as soft as those reported during the first half of the year. While that would not mean that the economy is robust, it might remind the markets that the first half of the slowdown was transitory.
| | | | |
| 4 | | Wells Fargo Advantage Pennsylvania Municipal Money Market Fund | | Letter to Shareholders |
risk tolerance can be an effective way to plan for the future. As a whole, Wells Fargo Advantage Funds represents investments across a broad range of asset classes and investment styles with more than 110 mutual funds, giving you an opportunity to create a diversified investment portfolio. While diversification may not prevent losses in a downturn, it may help to reduce them and provide you with one way of managing risk.
In our opinion, diligent and earnest assessment of the fundamental characteristics of money market eligible securities will be a key differentiating factor between which investment strategies meet client expectations and which do not. At Wells Fargo Advantage Funds, we intend to continue the emphasis of principal preservation and high liquidity across our lineup of Wells Fargo Advantage Money Market Funds. In changing markets, we believe it is particularly important to have diligent investment analysts in charge of investor assets.
Thank you for choosing Wells Fargo Advantage Funds. We appreciate your confidence in us and are committed to helping you meet your financial needs. If you have any questions about your investments, please contact your investment professional, call us at 1-800-222-8222, or visit www.wellsfargo.com/advantagefunds.
Sincerely,

Karla M. Rabusch
President
Wells Fargo Advantage Funds
| | | | | | |
| Performance Highlights | | Wells Fargo Advantage Pennsylvania Municipal Money Market Fund | | | 5 | |
INVESTMENT OBJECTIVE
The Fund seeks current income exempt from regular federal income tax and Pennsylvania individual income tax, while preserving capital and liquidity.
ADVISER
Wells Fargo Funds Management, LLC
SUB-ADVISER
Wells Capital Management Incorporated
PORTFOLIO MANAGERS
David D. Sylvester
James Randazzo
FUND INCEPTION
August 15, 1991
| | |
SECTOR DISTRIBUTION1
(AS OF JULY 31, 2011) | | |
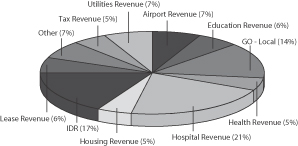
|
| | |
EFFECTIVE MATURITY DISTRIBUTION1
(AS OF JULY 31, 2011) |

|
| | |
WEIGHTED AVERAGE MATURITY2
(AS OF JULY 31, 2011) |
6 Days | �� | |
| | |
WEIGHTED AVERAGE FINAL MATURITY3
(AS OF JULY 31, 2011) |
6 Days | | |
| 1. | Sector distribution and effective maturity distribution are subject to change and are calculated based on the total investments of the Fund. Effective maturity distribution is based on the weighted average maturity of each security. |
| 2. | Weighted Average Maturity (WAM): WAM calculates an average time to maturity of all of the securities held in the portfolio, weighted by each security’s percentage of net assets. The calculation takes into account the final maturity of a fixed-income security and the interest rate reset date for floating-rate securities held in the portfolio. This is a way to measure a Fund’s sensitivity to potential interest rate changes. |
| 3. | Weighted Average Final Maturity (WAFM): WAFM calculates a Fund’s average time to maturity for all of the securities held in the portfolio, weighted to their percentage of assets in the Fund. In contrast to WAM, the WAFM calculation takes into account the final maturity date for each security held in the portfolio. This is a way to measure a Fund’s potential sensitivity to credit spread changes. |
| | | | |
| 6 | | Wells Fargo Advantage Pennsylvania Municipal Money Market Fund | | Performance Highlights |
AVERAGE ANNUAL TOTAL RETURN4 (%) (AS OF JULY 31, 2011)
| | | | | | | | | | | | | | | | | | | | | | | | | | | | |
| | | | | | | | | Expense Ratios5 | |
| | | Inception Date | | | 6 Months* | | | 1 Year | | | 5 Year | | | 10 Year | | | Gross | | | Net6 | |
Class A (EPPXX) | | | 08/22/1995 | | | | 0.00 | | | | 0.01 | | | | 1.22 | | | | 1.25 | | | | 0.90% | | | | 0.70% | |
Service Class (EPAXX) | | | 08/15/1991 | | | | 0.00 | | | | 0.01 | | | | 1.39 | | | | 1.47 | | | | 0.80% | | | | 0.45% | |
Sweep Class | | | 06/30/2000 | | | | 0.00 | | | | 0.01 | | | | 1.05 | | | | 1.00 | | | | 1.25% | | | | 1.05% | |
| * | Returns for periods of less than one year are not annualized. |
| | | | | | | | | | | | |
FUND YIELD SUMMARY6
(AS OF JULY 31, 2011) | | Class A | | | Service Class | | | Sweep Class | |
7-Day Current Yield | | | 0.01% | | | | 0.01% | | | | 0.01% | |
7-Day Compound Yield | | | 0.01% | | | | 0.01% | | | | 0.01% | |
30-Day Simple Yield | | | 0.01% | | | | 0.01% | | | | 0.01% | |
30-Day Compound Yield | | | 0.01% | | | | 0.01% | | | | 0.01% | |
Figures quoted represent past performance, which is no guarantee of future results and do not reflect the deduction of taxes that a shareholder may pay on fund distributions or the redemption of fund shares. Investment returns will fluctuate. The Fund’s yield figures more closely reflect the current earnings of the Fund than the total return figures. Current performance may be lower or higher than the performance data quoted. Current month-end performance is available at the Fund’s Web site – www.wellsfargo.com/advantagefunds.
Each class is sold without a front-end sales charge or contingent deferred sales charge. Other fees and expenses apply to an investment in the Fund and are described in the Fund’s current prospectus.
An investment in a money market fund is not insured or guaranteed by the Federal Deposit Insurance Corporation or any other government agency. Although the Fund seeks to preserve the value of your investment at $1.00 per share, it is possible to lose money by investing in a money market fund. A portion of the Fund’s income may be subject to federal, state and/or local income taxes or the alternative minimum tax (AMT).
| 4. | Historical performance shown for all classes of the Fund prior to July 12, 2010 is based on the performance of the Fund’s predecessor, Evergreen Pennsylvania Municipal Money Market Fund. |
| 5. | Reflects the expense ratios as stated in the most recent prospectuses. |
| 6. | The Adviser has committed through July 11, 2013 to waive fees and/or reimburse expenses to the extent necessary to cap the Fund’s Total Annual Fund Operating Expenses After Fee Waiver, excluding certain expenses, at the amount shown above. Without this cap, the Fund’s returns would have been lower. Without waived fees and/or reimbursed expenses, the Fund’s 7-day current yield would have been (0.84)%, (0.74)%, and (1.19)% for Class A, Service Class and Sweep Class, respectively. |
| | | | | | |
| Fund Expenses | | Wells Fargo Advantage Pennsylvania Municipal Money Market Fund | | | 7 | |
As a shareholder of the Fund, you incur two types of costs: (1) transaction costs, including contingent deferred sales charges (if any) and (2) ongoing costs, including management fees; distribution (12b-1) and/or shareholder service fees; and other Fund expenses. This example is intended to help you understand your ongoing costs (in dollars) of investing in the Fund and to compare these costs with the ongoing costs of investing in other mutual funds.
The example is based on an investment of $1,000 invested at the beginning of the six-month period and held for the entire period from February 1, 2011 to July 31, 2011.
Actual Expenses
The “Actual” line of the table below provides information about actual account values and actual expenses. You may use the information in this line, together with the amount you invested, to estimate the expenses that you paid over the period. Simply divide your account value by $1,000 (for example, an $8,600 account value divided by $1,000 = 8.6), then multiply the result by the number in the “Actual” line under the heading entitled “Expenses Paid During Period” for your applicable class of shares to estimate the expenses you paid on your account during this period.
Hypothetical Example for Comparison Purposes
The “Hypothetical” line of the table below provides information about hypothetical account values and hypothetical expenses based on the Fund’s actual expense ratio and an assumed rate of return of 5% per year before expenses, which is not the Fund’s actual return. The hypothetical account values and expenses may not be used to estimate the actual ending account balance or expenses you paid for the period. You may use this information to compare the ongoing costs of investing in the Fund and other funds. To do so, compare this 5% hypothetical example with the 5% hypothetical examples that appear in the shareholder reports of the other funds.
Please note that the expenses shown in the table are meant to highlight your ongoing costs only and do not reflect any transactional costs, such as any contingent deferred sales charges. Therefore, the “Hypothetical” line of the table is useful in comparing ongoing costs only, and will not help you determine the relative total costs of owning different funds. In addition, if these transactional costs were included, your costs would have been higher.
| | | | | | | | | | | | | | | | |
| | | Beginning
Account Value
02-01-2011 | | | Ending
Account Value
07-31-2011 | | | Expenses
Paid During
the Period¹ | | | Net Annual
Expense Ratio | |
Class A | | | | | | | | | | | | | | | | |
Actual | | $ | 1,000.00 | | | $ | 1,000.05 | | | $ | 1.14 | | | | 0.23 | % |
Hypothetical (5% return before expenses) | | $ | 1,000.00 | | | $ | 1,023.65 | | | $ | 1.15 | | | | 0.23 | % |
Service Class | | | | | | | | | | | | | | | | |
Actual | | $ | 1,000.00 | | | $ | 1,000.05 | | | $ | 1.14 | | | | 0.23 | % |
Hypothetical (5% return before expenses) | | $ | 1,000.00 | | | $ | 1,023.65 | | | $ | 1.15 | | | | 0.23 | % |
Sweep Class | | | | | | | | | | | | | | | | |
Actual | | $ | 1,000.00 | | | $ | 1,000.05 | | | $ | 1.19 | | | | 0.24 | % |
Hypothetical (5% return before expenses) | | $ | 1,000.00 | | | $ | 1,023.60 | | | $ | 1.20 | | | | 0.24 | % |
| 1. | Expenses paid is equal to the annualized expense ratio of each class multiplied by the average account value over the period, multiplied by the number of days in the most recent fiscal half-year divided by the number of days in the fiscal year (to reflect the one-half year period). |
| | | | |
| 8 | | Wells Fargo Advantage Pennsylvania Municipal Money Market Fund | | Portfolio of Investments—July 31, 2011 (Unaudited) |
| | | | | | | | | | | | | | | | | | |
| Security Name | | | | Interest Rate | | | Maturity Date | | | Principal | | | Value | |
| | | | | | | | | | | | | | | | | | |
| | | | | |
Municipal Bonds and Notes: 94.54% | | | | | | | | | | | | | | | | | | |
| | | | | |
Delaware: 1.18% | | | | | | | | | | | | | | | | | | |
| | | | | |
| Variable Rate Demand Note§: 1.18% | | | | | | | | | | | | | | | | | | |
Delaware State Economic Development Authority (Energy Revenue) | | | | | 0.21 | % | | | 08/01/2029 | | | $ | 1,350,000 | | | $ | 1,350,000 | |
| | | | | | | | | | | | | | | | | | |
| | | | | |
Maryland: 0.87% | | | | | | | | | | | | | | | | | | |
| | | | | |
| Variable Rate Demand Note§: 0.87% | | | | | | | | | | | | | | | | | | |
Montgomery County MD Series 10-B (GO-Local) | | | | | 0.09 | | | | 08/09/2011 | | | | 1,000,000 | | | | 1,000,000 | |
| | | | | | | | | | | | | | | | | | |
| | | | | |
Nevada: 1.26% | | | | | | | | | | | | | | | | | | |
| | | | | |
| Variable Rate Demand Note§: 1.26% | | | | | | | | | | | | | | | | | | |
Reno NV Sales Tax Revenue Various Refunding Senior Lien-Reno Transportation Rail Access Corridor Project (Tax Revenue, Bank of New York LOC) | | | | | 0.20 | | | | 06/01/2042 | | | | 1,440,000 | | | | 1,440,000 | |
| | | | | | | | | | | | | | | | | | |
| | | | | |
New Jersey: 4.23% | | | | | | | | | | | | | | | | | | |
| | | | | |
| Variable Rate Demand Note§: 4.23% | | | | | | | | | | | | | | | | | | |
Clipper Tax Exempt Series 2009-32 (Airport Revenue, State Street Bank & Trust Insured) | | | | | 0.13 | | | | 01/01/2018 | | | | 4,850,000 | | | | 4,850,000 | |
| | | | | | | | | | | | | | | | | | |
| | | | | |
Pennsylvania: 82.23% | | | | | | | | | | | | | | | | | | |
| | | | | |
| Variable Rate Demand Notes§: 82.23% | | | | | | | | | | | | | | | | | | |
Allegheny County PA Hospital Development Authority UPMC Senior Living Corporation (Health Revenue, FNMA Insured) | | | | | 0.09 | | | | 07/15/2028 | | | | 5,105,000 | | | | 5,105,000 | |
Allegheny County PA Residential Finance Authority Mortgage SFHR Series 2005-SS (Housing Revenue) | | | | | 0.13 | | | | 05/01/2036 | | | | 2,640,000 | | | | 2,640,000 | |
Beaver County IDA Environmental Improvement Project (Utilities Revenue) | | | | | 0.24 | | | | 09/01/2032 | | | | 2,000,000 | | | | 2,000,000 | |
Beaver County IDA Pollution Control First Energy Generation (Utilities Revenue, Bank of Nova Scotia LOC) | | | | | 0.04 | | | | 04/01/2035 | | | | 1,400,000 | | | | 1,400,000 | |
Berks County PA IDA Fleetwood Business Trust (IDR, U.S. Bank NA LOC) | | | | | 0.12 | | | | 05/15/2025 | | | | 3,815,000 | | | | 3,815,000 | |
Butler County PA IDA Mine Safety Appliances (GO-Local, Societe Generale LOC) | | | | | 0.11 | | | | 10/01/2034 | | | | 5,080,000 | | | | 5,080,000 | |
Butler County PA IDA Mine Safety Appliances Series A (IDR, JPMorgan Chase Bank LOC) | | | | | 0.19 | | | | 05/01/2022 | | | | 3,000,000 | | | | 3,000,000 | |
Butler County PA IDA Mine Safety Appliances Series B (IDR) | | | | | 0.19 | | | | 05/01/2022 | | | | 1,000,000 | | | | 1,000,000 | |
Delaware County PA College Authority Eastern College Series A (Education Revenue, TD Bank NA LOC) | | | | | 0.08 | | | | 10/01/2025 | | | | 3,600,000 | | | | 3,600,000 | |
Delaware County PA IDA Airport Facilities Parcel Service Project (Airport Revenue) | | | | | 0.22 | | | | 12/01/2015 | | | | 3,000,000 | | | | 3,000,000 | |
Deutsche Bank Spears Lifers Trust Series DB-340 (Utilities Revenue, AMBAC Insured) | | | | | 0.08 | | | | 10/01/2022 | | | | 4,500,000 | | | | 4,500,000 | |
Emmaus PA General Authority Series D27 (GO-Local, U.S. Bank NA LOC, State Aid Withholding Insured) | | | | | 0.08 | | | | 03/01/2024 | | | | 2,300,000 | | | | 2,300,000 | |
Emmaus PA General Authority Series F24 (GO-Local, U.S. Bank NA LOC, State Aid Withholding Insured) | | | | | 0.08 | | | | 03/01/2024 | | | | 2,000,000 | | | | 2,000,000 | |
Fayette County PA IDA Coastal Lumber Company Project (IDR, Branch Banking & Trust LOC) | | | | | 0.25 | | | | 09/01/2018 | | | | 1,700,000 | | | | 1,700,000 | |
Franconia Township PA IDA Ashers Chocolate Project Series A (IDR, Commerce Bank NA LOC) | | | | | 0.31 | | | | 05/01/2017 | | | | 985,000 | | | | 985,000 | |
Geisinger PA Health System Series C (Hospital Revenue, TD Bank NA LOC) | | | | | 0.21 | | | | 08/01/2028 | | | | 3,000,000 | | | | 3,000,000 | |
| | | | | | |
| Portfolio of Investments—July 31, 2011 (Unaudited) | | Wells Fargo Advantage Pennsylvania Municipal Money Market Fund | | | 9 | |
| | | | | | | | | | | | | | | | | | |
| Security Name | | | | Interest Rate | | | Maturity Date | | | Principal | | | Value | |
| | | | | | | | | | | | | | | | | | |
| | | | | |
| Variable Rate Demand Notes§ (continued) | | | | | | | | | | | | | | | | | | |
JPMorgan Chase PUTTER DRIVER Trust Series 3498Z (Lease Revenue, FSA State Aid Withholding Insured)†† | | | | | 0.22 | % | | | 06/01/2015 | | | $ | 1,475,000 | | | $ | 1,475,000 | |
Lancaster PA IDA Purple Crow Partners LLC Project (IDR, U.S. Bank NA LOC) | | | | | 0.12 | | | | 09/01/2026 | | | | 855,000 | | | | 855,000 | |
Merrill Lynch PFOTER Series 385 (Hospital Revenue) | | | | | 0.18 | | | | 08/15/2042 | | | | 2,500,000 | | | | 2,500,000 | |
Merrill Lynch PFOTER Series 566 (Hospital Revenue) | | | | | 0.31 | | | | 08/15/2042 | | | | 4,600,000 | | | | 4,600,000 | |
Montgomery County PA IDA Girl Scouts Southeastern PA (Miscellaneous Revenue, TD Bank NA LOC) | | | | | 0.10 | | | | 02/01/2025 | | | | 1,420,000 | | | | 1,420,000 | |
Montgomery County PA IDA Series 3238 (Hospital Revenue, FHA Insured)†† | | | | | 0.11 | | | | 08/01/2030 | | | | 1,300,000 | | | | 1,300,000 | |
Pennsylvania EDFA Fitzpatrick Container Company Project (IDR, PNC Bank NA LOC) | | | | | 0.12 | | | | 12/01/2023 | | | | 1,600,000 | | | | 1,600,000 | |
Pennsylvania EDFA Ganflec Corporation Project Series E (IDR, PNC Bank NA LOC) | | | | | 0.13 | | | | 11/01/2019 | | | | 1,100,000 | | | | 1,100,000 | |
Pennsylvania EDFA Series B1 (IDR, PNC Bank NA LOC) | | | | | 0.21 | | | | 05/01/2015 | | | | 200,000 | | | | 200,000 | |
Pennsylvania EDFA Series B2 (IDR, PNC Bank NA LOC) | | | | | 0.21 | | | | 08/01/2014 | | | | 300,000 | | | | 300,000 | |
Pennsylvania EDFA Series G10 (Port, Airport, & Marina Authority Revenue, PNC Bank NA LOC) | | | | | 0.12 | | | | 12/01/2025 | | | | 2,000,000 | | | | 2,000,000 | |
Pennsylvania EDFA Series G12 (IDR, PNC Bank NA LOC) | | | | | 0.21 | | | | 12/01/2013 | | | | 100,000 | | | | 100,000 | |
Pennsylvania EDFA Series G6 (IDR, PNC Bank NA LOC) | | | | | 0.21 | | | | 12/01/2013 | | | | 350,000 | | | | 350,000 | |
Pennsylvania EDFA Series H4 (IDR, PNC Bank NA LOC) | | | | | 0.21 | | | | 12/01/2012 | | | | 400,000 | | | | 400,000 | |
Pennsylvania EDFA Series J1 (Education Revenue, PNC Bank NA LOC) | | | | | 0.08 | | | | 11/01/2030 | | | | 1,325,000 | | | | 1,325,000 | |
Pennsylvania EDFA Series J1 (IDR, PNC Bank NA LOC) | | | | | 0.21 | | | | 05/01/2015 | | | | 400,000 | | | | 400,000 | |
Pennsylvania HFA SFMR Series 74A (Housing Revenue, GO of Agency Insured) | | | | | 0.05 | | | | 10/01/2032 | | | | 2,300,000 | | | | 2,300,000 | |
Pennsylvania State HEFAR of Independent Colleges Series K (Education Revenue, PNC Bank NA LOC) | | | | | 0.08 | | | | 11/01/2014 | | | | 1,900,000 | | | | 1,900,000 | |
Pennsylvania State Public School Building Authority ROC-RR-II-R-11396 (Lease Revenue, FSA State Aid Withholding Insured) | | | | | 0.19 | | | | 12/01/2023 | | | | 4,700,000 | | | | 4,700,000 | |
Philadelphia PA Hospital & Higher Education Facilities Authority Childrens Hospital Series A (Hospital Revenue) | | | | | 0.18 | | | | 02/15/2014 | | | | 1,400,000 | | | | 1,400,000 | |
Philadelphia PA Hospital & Higher Education Facilities Authority Childrens Hospital Series A (Hospital Revenue) | | | | | 0.18 | | | | 07/01/2022 | | | | 1,405,000 | | | | 1,405,000 | |
Philadelphia PA IDA 1100 Walnut St Project (IDR, PNC Bank NA LOC) | | | | | 0.27 | | | | 12/01/2014 | | | | 800,000 | | | | 800,000 | |
Philadelphia PA IDA Series B (IDR, JPMorgan Chase Bank LOC) | | | | | 0.09 | | | | 10/01/2030 | | | | 500,000 | | | | 500,000 | |
Philadelphia PA School District Series F (GO-Local, Barclays Bank plc LOC, State Aid Withholding Insured) | | | | | 0.04 | | | | 09/01/2030 | | | | 4,500,000 | | | | 4,500,000 | |
RBC Municipal Products Incorporated Trust Series C13 (Hospital Revenue, Royal Bank of Canada LOC)†† | | | | | 0.08 | | | | 11/01/2011 | | | | 2,000,000 | | | | 2,000,000 | |
RBC Municipal Products Incorporated Trust Series E-11 (Hospital Revenue, Royal Bank of Canada LOC)†† | | | | | 0.09 | | | | 02/01/2012 | | | | 2,000,000 | | | | 2,000,000 | |
RBC Municipal Products Incorporated Trust Series E-16 (Hospital Revenue, Royal Bank of Canada LOC)†† | | | | | 0.08 | | | | 04/15/2039 | | | | 4,000,000 | | | | 4,000,000 | |
Southeastern PA Transportation Authority (Tax Revenue, PNC Bank NA LOC) | | | | | 0.17 | | | | 03/01/2022 | | | | 2,000,000 | | | | 2,000,000 | |
Westmoreland County PA Industrial Development Project (IDR, PNC Bank NA LOC) | | | | | 0.15 | | | | 04/01/2017 | | | | 1,740,000 | | | | 1,740,000 | |
| | | | | |
| | | | | | | | | | | | | | | | | 94,295,000 | |
| | | | | | | | | | | | | | | | | | |
| | | | |
| 10 | | Wells Fargo Advantage Pennsylvania Municipal Money Market Fund | | Portfolio of Investments—July 31, 2011 (Unaudited) |
| | | | | | | | | | | | | | | | | | |
| Security Name | | | | Interest Rate | | | Maturity Date | | | Principal | | | Value | |
| | | | | | | | | | | | | | | | | | |
| | | | | |
Puerto Rico: 2.09% | | | | | | | | | | | | | | | | | | |
| | | | | |
| Variable Rate Demand Note§: 2.09% | | | | | | | | | | | | | | | | | | |
Puerto Rico Sales Tax Finance Corporation ROC-RR-II-R-11761 (Tax Revenue)†† | | | | | 0.11 | % | | | 12/01/2047 | | | $ | 2,400,000 | | | $ | 2,400,000 | |
| | | | | | | | | | | | | | | | | | |
| | | | | |
Texas: 2.68% | | | | | | | | | | | | | | | | | | |
| | | | | |
| Variable Rate Demand Notes§: 2.68% | | | | | | | | | | | | | | | | | | |
Port Arthur TX Naval District Environmental Facilities Motiva Enterprises Project Series D (Energy Revenue) | | | | | 0.19 | | | | 11/01/2040 | | | | 675,000 | | | | 675,000 | |
Port Corpus Christi TX Solid Waste Disposal Flint Hills Resources Project (Resource Recovery Revenue) | | | | | 0.13 | | | | 01/01/2032 | | | | 2,400,000 | | | | 2,400,000 | |
| | | | | |
| | | | | | | | | | | | | | | | | 3,075,000 | |
| | | | | | | | | | | | | | | | | | |
| | | | | | | | |
| Total Investments in Securities | | | | | | | | |
| (Cost $108,410,000)* | | | 94.54 | % | | | 108,410,000 | |
Other Assets and Liabilities, Net | | | 5.46 | | | | 6,265,495 | |
| | | | | | | | |
| Total Net Assets | | | 100.00 | % | | $ | 114,675,495 | |
| | | | | | | | |
| †† | Security that may be resold to “qualified institutional buyers” under Rule 144A or securities offered pursuant to Section 4(2) of the Securities Act of 1933, as amended. |
| § | These securities are subject to a demand feature which reduces the effective maturity. |
| * | Cost for federal income tax purposes is substantially the same as for financial reporting purposes. |
The accompanying notes are an integral part of these financial statements.
| | | | | | |
| Statement of Assets and Liabilities—July 31, 2011 (Unaudited) | | Wells Fargo Advantage Pennsylvania Municipal Money Market Fund | | | 11 | |
| | | | |
| | | | |
| |
Assets | | | | |
Investments in unaffiliated securities, at amortized cost | | $ | 108,410,000 | |
Cash | | | 6,144,543 | |
Receivable for investments sold | | | 145,000 | |
Receivable for interest | | | 24,980 | |
Receivable from adviser | | | 82,561 | |
Prepaid expenses and other assets | | | 29,792 | |
| | | | |
Total assets | | | 114,836,876 | |
| | | | |
| |
Liabilities | | | | |
Payable for Fund shares redeemed | | | 20,000 | |
Distribution fees payable | | | 30,047 | |
Due to other related parties | | | 27,437 | |
Shareholder report expenses payable | | | 11,168 | |
Shareholder servicing fees payable | | | 28,957 | |
Professional fees payable | | | 21,298 | |
Accrued expenses and other liabilities | | | 22,474 | |
| | | | |
Total liabilities | | | 161,381 | |
| | | | |
Total net assets | | $ | 114,675,495 | |
| | | | |
| |
NET ASSETS CONSIST OF | | | | |
Paid-in capital | | $ | 114,673,863 | |
Undistributed net investment income | | | 1,839 | |
Accumulated net realized losses on investments | | | (207 | ) |
| | | | |
Total net assets | | $ | 114,675,495 | |
| | | | |
| |
COMPUTATION OF NET ASSET VALUE PER SHARE1 | | | | |
Net assets – Class A | | $ | 4,302,103 | |
Shares outstanding – Class A | | | 4,302,092 | |
Net asset value per share – Class A | | | $1.00 | |
Net assets – Service Class | | $ | 27,902,768 | |
Shares outstanding – Service Class | | | 27,902,970 | |
Net asset value per share – Service Class | | | $1.00 | |
Net assets – Sweep Class | | $ | 82,470,624 | |
Shares outstanding – Sweep Class | | | 82,470,536 | |
Net asset value per share – Sweep Class | | | $1.00 | |
| 1. | The Fund has an unlimited number of authorized shares |
The accompanying notes are an integral part of these financial statements.
| | | | |
| 12 | | Wells Fargo Advantage Pennsylvania Municipal Money Market Fund | | Statement of Operations—Six Months Ended July 31, 2011 (Unaudited) |
| | | | |
| | | | |
| |
Investment income | | | | |
Interest | | $ | 192,942 | |
| | | | |
| |
Expenses | | | | |
Advisory fee | | | 237,334 | |
Administration fees | | | | |
Fund level | | | 39,556 | |
Class A | | | 5,171 | |
Service Class | | | 15,690 | |
Sweep Class | | | 140,108 | |
Shareholder servicing fees | | | | |
Class A | | | 5,622 | |
Service Class | | | 32,688 | |
Sweep Class | | | 159,214 | |
Distribution fees | | | | |
Sweep Class | | | 222,899 | |
Custody and accounting fees | | | 4,448 | |
Professional fees | | | 12,628 | |
Registration fees | | | 28,223 | |
Shareholder report expenses | | | 16,957 | |
Trustees’ fees and expenses | | | 7,421 | |
Other fees and expenses | | | 2,820 | |
| | | | |
Total expenses | | | 930,779 | |
Less: Fee waivers and/or expense reimbursements | | | (745,749 | ) |
| | | | |
Net expenses | | | 185,030 | |
| | | | |
Net investment income | | $ | 7,912 | |
| | | | |
The accompanying notes are an integral part of these financial statements.
| | | | | | |
| Statements of Changes in Net Assets | | Wells Fargo Advantage Pennsylvania Municipal Money Market Fund | | | 13 | |
| | | | | | | | | | | | | | | | |
| | | Six Months Ended
July 31, 2011
(Unaudited) | | | Year Ended
January 31, 2011¹ | |
| | | | |
Operations | | | | | | | | | | | | | | | | |
Net investment income | | | | | | $ | 7,912 | | | | | | | $ | 3,644 | |
Net realized gains (losses) on investments | | | | | | | 0 | | | | | | | | (13 | ) |
| | | | | | | | | | | | | | | | |
Net increase in net assets resulting from operations | | | | | | | 7,912 | | | | | | | | 3,631 | |
| | | | | | | | | | | | | | | | |
| | | | |
Distributions to shareholders from | | | | | | | | | | | | | | | | |
Net investment income | | | | | | | | | | | | | | | | |
Class A | | | | | | | (235 | ) | | | | | | | (840 | ) |
Service Class | | | | | | | (1,308 | ) | | | | | | | (5,893 | )² |
Sweep Class | | | | | | | (6,369 | ) | | | | | | | (22,237 | )³ |
| | | | | | | | | | | | | | | | |
Total distributions to shareholders | | | | | | | (7,912 | ) | | | | | | | (28,970 | ) |
| | | | | | | | | | | | | | | | |
| | | | |
| | | Shares | | | | | | Shares | | | | |
| | | | |
Capital share transactions | | | | | | | | | | | | | | | | |
Proceeds from shares sold | | | | | | | | | | | | | | | | |
Class A | | | 4,846,460 | | | | 4,846,460 | | | | 13,465,509 | | | | 13,465,509 | |
Service Class | | | 40,794,194 | | | | 40,794,194 | | | | 153,136,397 | ² | | | 153,136,397 | ² |
Sweep Class | | | 237,254,140 | | | | 237,254,140 | | | | 770,557,711 | ³ | | | 770,557,711 | ³ |
| | | | | | | | | | | | | | | | |
| | | | | | | 282,894,794 | | | | | | | | 937,159,617 | |
| | | | | | | | | | | | | | | | |
Reinvestment of distributions | | | | | | | | | | | | | | | | |
Class A | | | 233 | | | | 233 | | | | 720 | | | | 720 | |
Service Class | | | 56 | | | | 56 | | | | 722 | ² | | | 722 | ² |
Sweep Class | | | 6,369 | | | | 6,369 | | | | 21,004 | ³ | | | 21,004 | ³ |
| | | | | | | | | | | | | | | | |
| | | | | | | 6,658 | | | | | | | | 22,446 | |
| | | | | | | | | | | | | | | | |
Payment for shares redeemed | | | | | | | | | | | | | | | | |
Class A | | | (6,209,559 | ) | | | (6,209,559 | ) | | | (12,326,698 | ) | | | (12,326,698 | ) |
Service Class | | | (39,577,766 | ) | | | (39,577,766 | ) | | | (156,542,664 | )² | | | (156,542,664 | )² |
Sweep Class | | | (290,299,972 | ) | | | (290,299,972 | ) | | | (792,319,259 | )³ | | | (792,319,259 | )³ |
| | | | | | | | | | | | | | | | |
| | | | | | | (336,087,297 | ) | | | | | | | (961,188,621 | ) |
| | | | | | | | | | | | | | | | |
Net decrease in net assets resulting
from capital share transactions | | | | | | | (53,185,845 | ) | | | | | | | (24,006,558 | ) |
| | | | | | | | | | | | | | | | |
Total decrease in net assets | | | | | | | (53,185,845 | ) | | | | | | | (24,031,897 | ) |
| | | | | | | | | | | | | | | | |
| | | | |
Net assets | | | | | | | | | | | | | | | | |
Beginning of period | | | | | | | 167,861,340 | | | | | | | | 191,893,237 | |
| | | | | | | | | | | | | | | | |
End of period | | | | | | $ | 114,675,495 | | | | | | | $ | 167,861,340 | |
| | | | | | | | | | | | | | | | |
Undistributed net investment income | | | | | | $ | 1,839 | | | | | | | $ | 1,839 | |
| | | | | | | | | | | | | | | | |
| 1. | After the close of business on July 9, 2010, the Fund acquired the net assets of Evergreen Pennsylvania Municipal Money Market Fund which became the accounting and performance survivor in this transaction. The information for the period prior to July 12, 2010 is that of Evergreen Pennsylvania Municipal Money Market Fund. |
| 2. | Class I shares of Evergreen Pennsylvania Municipal Money Market became Service Class shares on July 12, 2010. |
| 3. | Class S shares of Evergreen Pennsylvania Municipal Money Market became Sweep Class shares on July 12, 2010. |
The accompanying notes are an integral part of these financial statements.
| | | | |
| 14 | | Wells Fargo Advantage Pennsylvania Municipal Money Market Fund | | Financial Highlights |
| | | | | | | | | | | | | | | | | | | | | | | | |
(For a share outstanding throughout each period) | | | | |
| | |
| | | Six Months Ended
July 31, 2011
(Unaudited) | | | Year Ended January 31, | |
| Class A | | | 20111 | | | 20101 | | | 20091 | | | 20081 | | | 20071 | |
Net asset value, beginning of period | | $ | 1.00 | | | $ | 1.00 | | | $ | 1.00 | | | $ | 1.00 | | | $ | 1.00 | | | $ | 1.00 | |
Net investment income | | | 0.00 | 2 | | | 0.00 | 2 | | | 0.00 | 2 | | | 0.02 | | | | 0.03 | | | | 0.03 | |
Net realized gains (losses) on investments | | | 0.00 | 2 | | | (0.00 | )2 | | | 0.00 | | | | 0.00 | | | | 0.00 | | | | 0.00 | |
| | | | | | | | | | | | | | | | | | | | | | | | |
Total from investment operations | | | 0.00 | 2 | | | 0.00 | 2 | | | 0.00 | 2 | | | 0.02 | | | | 0.03 | | | | 0.03 | |
Distributions to shareholders from | | | | | | | | | | | | | | | | | | | | | | | | |
Net investment income | | | (0.00 | )2 | | | (0.00 | )2 | | | (0.00 | )2 | | | (0.02 | ) | | | (0.03 | ) | | | (0.03 | ) |
Net asset value, end of period | | | $1.00 | | | | $1.00 | | | | $1.00 | | | | $1.00 | | | | $1.00 | | | | $1.00 | |
Total return3 | | | 0.00 | % | | | 0.01 | % | | | 0.12 | % | | | 1.56 | % | | | 2.97 | % | | | 2.83 | % |
Ratios to average net assets (annualized) | | | | | | | | | | | | | | | | | | | | | | | | |
Gross expenses | | | 0.90 | % | | | 0.86 | % | | | 0.87 | % | | | 0.82 | % | | | 0.82 | % | | | 0.82 | % |
Net expenses | | | 0.23 | % | | | 0.37 | % | | | 0.62 | % | | | 0.82 | % | | | 0.82 | % | | | 0.82 | % |
Net investment income | | | 0.01 | % | | | 0.01 | % | | | 0.12 | % | | | 1.45 | % | | | 2.91 | % | | | 2.79 | % |
Supplemental data | | | | | | | | | | | | | | | | | | | | | | | | |
Net assets, end of period (000’s omitted) | | | $4,302 | | | | $5,665 | | | | $4,525 | | | | $36,362 | | | | $20,293 | | | | $18,178 | |
| 1. | After the close of business on July 9, 2010, the Fund acquired the net assets of Evergreen Pennsylvania Municipal Money Market Fund which became the accounting and performance survivor in the transaction. The information for the periods prior to July 12, 2010 is that of Class A of Evergreen Pennsylvania Municipal Money Market Fund. |
| 2. | Amount is less than $0.005. |
| 3. | Returns for periods of less than one year are not annualized. |
The accompanying notes are an integral part of these financial statements.
| | | | | | |
| Financial Highlights | | Wells Fargo Advantage Pennsylvania Municipal Money Market Fund | | | 15 | |
| | | | | | | | | | | | | | | | | | | | | | | | |
(For a share outstanding throughout each period) | | | | |
| | |
| | | Six Months Ended
July 31, 2011
(Unaudited) | | | Year Ended January 31, | |
| Service Class | | | 20111 | | | 20101 | | | 20091 | | | 20081 | | | 20071 | |
Net asset value, beginning of period | | $ | 1.00 | | | $ | 1.00 | | | $ | 1.00 | | | $ | 1.00 | | | $ | 1.00 | | | $ | 1.00 | |
Net investment income | | | 0.00 | 2 | | | 0.00 | 2 | | | 0.00 | 2 | | | 0.02 | | | | 0.03 | | | | 0.03 | |
Net realized gains (losses) on investments | | | 0.00 | 2 | | | (0.00 | )2 | | | 0.00 | | | | 0.00 | | | | 0.00 | | | | 0.00 | |
| | | | | | | | | | | | | | | | | | | | | | | | |
Total from investment operations | | | 0.00 | 2 | | | 0.00 | 2 | | | 0.00 | 2 | | | 0.02 | | | | 0.03 | | | | 0.03 | |
Distributions to shareholders from | | | | | | | | | | | | | | | | | | | | | | | | |
Net investment income | | | (0.00 | )2 | | | (0.00 | )2 | | | (0.00 | )2 | | | (0.02 | ) | | | (0.03 | ) | | | (0.03 | ) |
Net asset value, end of period | | | $1.00 | | | | $1.00 | | | | $1.00 | | | | $1.00 | | | | $1.00 | | | | $1.00 | |
Total return3 | | | 0.00 | % | | | 0.01 | % | | | 0.23 | % | | | 1.87 | % | | | 3.28 | % | | | 3.14 | % |
Ratios to average net assets (annualized) | | | | | | | | | | | | | | | | | | | | | | | | |
Gross expenses | | | 0.81 | % | | | 0.70 | % | | | 0.56 | % | | | 0.51 | % | | | 0.52 | % | | | 0.52 | % |
Net expenses | | | 0.23 | % | | | 0.36 | % | | | 0.49 | % | | | 0.51 | % | | | 0.52 | % | | | 0.52 | % |
Net investment income | | | 0.01 | % | | | 0.01 | % | | | 0.31 | % | | | 1.87 | % | | | 3.21 | % | | | 3.10 | % |
Supplemental data | | | | | | | | | | | | | | | | | | | | | | | | |
Net assets, end of period (000’s omitted) | | | $27,903 | | | | $26,686 | | | | $30,092 | | | | $92,005 | | | | $98,539 | | | | $62,522 | |
| 1. | After the close of business on July 9, 2010, the Fund acquired the net assets of Evergreen Pennsylvania Municipal Money Market Fund which became the accounting and performance survivor in the transaction. The information for the periods prior to July 12, 2010 is that of Class I of Evergreen Pennsylvania Municipal Money Market Fund. |
| 2. | Amount is less than $0.005. |
| 3. | Returns for periods of less than one year are not annualized. |
The accompanying notes are an integral part of these financial statements.
| | | | |
| 16 | | Wells Fargo Advantage Pennsylvania Municipal Money Market Fund | | Financial Highlights |
| | | | | | | | | | | | | | | | | | | | | | | | |
(For a share outstanding throughout each period) | | | | |
| | |
| | | Six Months Ended
July 31, 2011
(Unaudited) | | | Year Ended January 31, | |
| Sweep Class | | | 2011¹ | | | 20101 | | | 20091 | | | 20081 | | | 20071 | |
Net asset value, beginning of period | | $ | 1.00 | | | $ | 1.00 | | | $ | 1.00 | | | $ | 1.00 | | | $ | 1.00 | | | $ | 1.00 | |
Net investment income | | | 0.00 | ² | | | 0.00 | ² | | | 0.00 | ² | | | 0.01 | | | | 0.03 | | | | 0.02 | |
Net realized gains (losses) on investments | | | 0.00 | 2 | | | (0.00 | )2 | | | 0.00 | | | | 0.00 | | | | 0.00 | | | | 0.00 | |
| | | | | | | | | | | | | | | | | | | | | | | | |
Total from investment operations | | | 0.00 | 2 | | | 0.00 | 2 | | | 0.00 | 2 | | | 0.01 | | | | 0.03 | | | | 0.02 | |
Distributions to shareholders from | | | | | | | | | | | | | | | | | | | | | | | | |
Net investment income | | | (0.00 | )² | | | (0.00 | )² | | | (0.00 | )² | | | (0.01 | ) | | | (0.03 | ) | | | (0.02 | ) |
Net asset value, end of period | | | $1.00 | | | | $1.00 | | | | $1.00 | | | | $1.00 | | | | $1.00 | | | | $1.00 | |
Total return³ | | | 0.00 | % | | | 0.01 | % | | | 0.04 | % | | | 1.26 | % | | | 2.66 | % | | | 2.53 | % |
Ratios to average net assets (annualized) | | | | | | | | | | | | | | | | | | | | | | | | |
Gross expenses | | | 1.26 | % | | | 1.19 | % | | | 1.15 | % | | | 1.11 | % | | | 1.12 | % | | | 1.12 | % |
Net expenses | | | 0.24 | % | | | 0.37 | % | | | 0.67 | % | | | 1.10 | % | | | 1.12 | % | | | 1.12 | % |
Net investment income | | | 0.01 | % | | | 0.00 | % | | | 0.04 | % | | | 1.23 | % | | | 2.60 | % | | | 2.50 | % |
Supplemental data | | | | | | | | | | | | | | | | | | | | | | | | |
Net assets, end of period (000’s omitted) | | | $82,471 | | | | $135,510 | | | | $157,251 | | | | $176,221 | | | | $157,771 | | | | $113,516 | |
| 1. | After the close of business on July 9, 2010, the Fund acquired the net assets of Evergreen Pennsylvania Municipal Money Market Fund which became the accounting and performance survivor in the transaction. The information for the periods prior to July 12, 2010 is that of Class S of Evergreen Pennsylvania Municipal Money Market Fund. |
| 2. | Amount is less than $0.005. |
| 3. | Returns for periods of less than one year are not annualized. |
The accompanying notes are an integral part of these financial statements.
| | | | | | |
| Notes to Financial Statements (Unaudited) | | Wells Fargo Advantage Pennsylvania Municipal Money Market Fund | | | 17 | |
1. ORGANIZATION
Wells Fargo Funds Trust (the “Trust”), a Delaware statutory trust organized on March 10, 1999, is an open-end management investment company registered under the Investment Company Act of 1940, as amended (the “1940 Act”). These financial statements report on Wells Fargo Advantage Pennsylvania Municipal Money Market Fund (the “Fund”) which is a diversified series of the Trust.
2. SIGNIFICANT ACCOUNTING POLICIES
The following significant accounting policies, which are consistently followed in the preparation of the financial statements of the Fund, are in conformity with U.S. generally accepted accounting principles which require management to make estimates and assumptions that affect the reported amounts of assets and liabilities, disclosure of contingent assets and liabilities at the date of the financial statements, and the reported amounts of revenues and expenses during the reporting period. Actual results could differ from those estimates.
Securities valuation
As permitted under Rule 2a-7 of the 1940 Act, securities are valued at amortized cost, which approximates fair value.
The valuation techniques used by the Fund to measure fair value are consistent with the market approach, income approach and/or cost approach, where applicable, for each security type.
Security transactions and income recognition
Securities transactions are recorded on a trade date basis. Realized gains or losses are reported on the basis of identified cost of securities delivered.
Interest income is accrued daily and bond discounts are accreted and premiums are amortized daily based on the effective interest method. To the extent debt obligations are placed on non-accrual status, any related interest income may be reduced by writing off interest receivables when the collection of all or a portion of interest has become doubtful based on consistently applied procedures. If the issuer subsequently resumes interest payments or when the collectability of interest is reasonably assured, the debt obligation is removed from non-accrual status.
Distributions to shareholders
Distributions to shareholders from net investment income are accrued daily and paid monthly. Distributions from net realized gains, if any, are recorded on the ex-dividend date. Such distributions are determined in conformity with income tax regulations, which may differ from generally accepted accounting principles.
Federal and other taxes
The Fund intends to continue to qualify as a regulated investment company by distributing substantially all of its investment company taxable and tax-exempt income and any net realized capital gains (after reduction for capital loss carryforwards) sufficient to relieve it from all, or substantially all, federal income taxes. Accordingly, no provision for federal income taxes was required.
The Fund’s income and federal excise tax returns and all financial records supporting those returns for the prior three fiscal years are subject to examination by the federal and Delaware revenue authorities.
As of January 31, 2011, the Fund had estimated net capital loss carryforwards, which were available to offset future net realized capital gains, in the amount of $207 expiring in 2018.
Under the recently enacted Regulated Investment Company Modernization Act of 2010, the Fund will be permitted to carry forward capital losses incurred in taxable years beginning after December 22, 2010 for an unlimited period. However, any losses incurred during those future taxable years will be required to be utilized prior to the losses incurred in pre-enactment taxable years. As a result of this ordering rule, pre-enactment capital loss carryforwards may be more likely to expire unused. Additionally, post-enactment capital losses that are carried forward will retain their character as either short-term or long-term capital losses rather than being considered all short-term as under previous law.
Class allocations
The separate classes of shares offered by the Fund differ principally in distribution, shareholder servicing and administration fees. Shareholders of each class bear certain expenses that pertain to that particular class. All shareholders bear the common expenses of the Fund, earn income from the portfolio, and are allocated unrealized gains and losses pro rata based on the average daily net assets of each class, without distinction between share classes. Dividends are
| | | | |
| 18 | | Wells Fargo Advantage Pennsylvania Municipal Money Market Fund | | Notes to Financial Statements (Unaudited) |
determined separately for each class based on income and expenses allocable to each class. Realized gains and losses are allocated to each class pro rata based upon the net assets of each class on the date realized. Differences in per share dividend rates generally result from the relative weightings of pro rata income and realized gain allocations and from differences in separate class expenses, including distribution, shareholder servicing and administration fees.
3. FAIR VALUATION MEASUREMENTS
Fair value measurements of investments are determined within a framework that has established a fair value hierarchy based upon the various data inputs utilized in determining the value of the Fund’s investments. The three-level hierarchy gives the highest priority to unadjusted quoted prices in active markets for identical assets or liabilities (Level 1) and the lowest priority to unobservable inputs (Level 3). The Fund’s investments are classified within the fair value hierarchy based on the lowest level of input that is significant to the fair value measurement. The inputs are summarized into three broad levels as follows:
| n | | Level 1 – quoted prices in active markets for identical securities |
| n | | Level 2 – other significant observable inputs (including quoted prices for similar securities, interest rates, prepayment speeds, credit risk, etc.) |
| n | | Level 3 – significant unobservable inputs (including the Fund’s own assumptions in determining the fair value of investments) |
The inputs or methodologies used for valuing securities are not necessarily an indication of the risk associated with investing in those securities.
At July 31, 2011, all of the Fund’s investments in securities carried at fair value were designated as Level 2 since the primary inputs include credit quality of the issuer and short-term interest rates which are observable.
Further details on the major security types can be found in the Fund’s Portfolio of Investments.
4. TRANSACTIONS WITH AFFILIATES AND OTHER EXPENSES
Advisory fee
The Trust has entered into an advisory contract with Wells Fargo Funds Management, LLC (“Funds Management”), an indirect wholly owned subsidiary of Wells Fargo & Company (“Wells Fargo”). The adviser is responsible for implementing investment policies and guidelines and for supervising the sub-adviser, who is responsible for day-to-day portfolio management of the Fund.
Pursuant to the contract, Funds Management is entitled to receive an annual advisory fee starting at 0.30% and declining to 0.20% as the average daily net assets of the Fund increase. For the six months ended July 31, 2011, the advisory fee was equivalent to an annual rate of 0.30% of the Fund’s average daily net assets.
Funds Management may retain the services of certain sub-advisers to provide daily portfolio management to the Fund. The fees related to sub-advisory services are borne directly by the adviser and do not increase the overall fees paid by the Fund to the adviser. Wells Capital Management Incorporated, an affiliate of Funds Management, is the sub-adviser to the Fund and is entitled to receive a fee from the adviser at an annual rate starting at 0.05% and declining to 0.01% as the average daily net assets of the Fund increase.
Administration and transfer agent fees
The Trust has entered into an administration agreement with Funds Management. Under this agreement, for providing administrative services, which includes paying fees and expenses for services provided by the transfer agent, sub-transfer agents, omnibus account servicers and record-keepers, Funds Management is entitled to receive from the Fund an annual fund level administration fee starting at 0.05% and declining to 0.03% as the average daily net assets of the Fund increase and a class level administration fee which is calculated based on the average daily net assets of each class as follows:
| | | | |
| | | Class Level Administration Fee | |
Class A, Sweep Class | | | 0.22 | % |
Service Class | | | 0.12 | |
| | | | | | |
| Notes to Financial Statements (Unaudited) | | Wells Fargo Advantage Pennsylvania Municipal Money Market Fund | | | 19 | |
Funds Management has contractually waived and/or reimbursed advisory and administration fees to the extent necessary to maintain certain net operating expense ratios for the Fund. Waiver of fees and/or reimbursement of expenses by Funds Management were made first from fund level expenses on a proportionate basis and then from class specific expenses.
Distribution fees
The Trust has adopted a Distribution Plan for Sweep Class shares of the Fund pursuant to Rule 12b-1 under the 1940 Act. Distribution fees are charged to the Sweep Class shares and paid to Wells Fargo Funds Distributor, LLC, the principal underwriter of the Fund, at an annual rate of 0.35% of the average daily net assets of Sweep Class shares.
Shareholder servicing fees
The Trust has entered into contracts with one or more shareholder servicing agents, whereby Class A, Service Class and Sweep Class of the Fund is charged a fee at an annual rate of 0.25% of the respective average daily net assets of each class.
A portion of these total shareholder servicing fees were paid to affiliates of Wells Fargo.
5. CONCENTRATION RISK
The Fund invests a substantial portion of its assets in issuers of municipal debt securities located in a single state, therefore, it may be more affected by economic and political developments in that state or region than would be a comparable general tax-exempt mutual fund.
6. INDEMNIFICATION
Under the Trust’s organizational documents, the officers and directors are indemnified against certain liabilities that may arise out of performance of their duties to the Trust. Additionally, in the normal course of business, the Trust may enter into contracts with service providers that contain a variety of indemnification clauses. The Trust’s maximum exposure under these arrangements is dependent on future claims that may be made against the Fund and, therefore, cannot be estimated.
7. NEW ACCOUNTING PRONOUNCEMENTS
In May 2011, the Financial Accounting Standards Board (“FASB”) issued Accounting Standards Update (“ASU”) No. 2011-04 “Amendments to Achieve Common Fair Value Measurement and Disclosure Requirements in U.S. GAAP and IFRSs”. ASU No. 2011-04 amends FASB ASC Topic 820, Fair Value Measurements and Disclosures, to establish common requirements for measuring fair value and for disclosing information about fair value measurements in accordance with GAAP. The ASU is effective prospectively for interim and annual periods beginning after December 15, 2011.
In April 2011, FASB issued ASU No. 2011-03 “Reconsideration of Effective Control for Repurchase Agreements”. ASU No. 2011-03 amends FASB ASC Topic 860, Transfers and Servicing, specifically the criteria required to determine whether a repurchase agreement (repo) and similar agreements should be accounted for as sales of financial assets or secured borrowings with commitments. ASU No. 2011-03 changes the assessment of effective control by focusing on the transferor’s contractual rights and obligations and removing the criterion to assess its ability to exercise those rights or honor those obligations. This could result in changes to the way entities account for certain transactions including repurchase agreements, mortgage dollar rolls and reverse repurchase agreements. The ASU will become effective on a prospective basis for new transfers and modifications to existing transactions as of the beginning of the first interim or annual period beginning on or after December 15, 2011.
As of July 31, 2011, management of the Fund is currently assessing the potential impact, in addition to expanded financial statement disclosure, that may result from adopting these ASUs.
| | | | |
| 20 | | Wells Fargo Advantage Pennsylvania Municipal Money Market Fund | | Other Information (Unaudited) |
PORTFOLIO HOLDINGS INFORMATION
The complete portfolio holdings for the Fund are publicly available on the Fund’s Web site
(www.wellsfargo.com/advantagefunds) on a monthly, seven-day delayed basis. The Fund files its complete schedule of portfolio holdings with the SEC for the first and third quarters of each fiscal year on Form N-Q, which is available without charge by visiting the SEC Web site at www.sec.gov. In addition, the Fund’s Form N-Q may be reviewed and copied at the SEC’s Public Reference Room in Washington, DC, and at regional offices in New York City, at 233 Broadway, and in Chicago, at 175 West Jackson Boulevard, Suite 900. Information about the Public Reference Room may be obtained by calling 1-800-SEC-0330.
PROXY VOTING INFORMATION
A description of the policies and procedures that the Fund uses to determine how to vote proxies relating to portfolio securities is available without charge, upon request, by calling 1-800-222-8222, visiting our Web site at www.wellsfargo.com/advantagefunds, or visiting the SEC Web site at www.sec.gov. Information regarding how the Fund voted proxies relating to portfolio securities during the most recent 12-month period ended June 30 is available without charge on the Fund’s Web site at www.wellsfargo.com/advantagefunds or by visiting the SEC Web site at www.sec.gov.
| | | | | | |
| Other Information (Unaudited) | | Wells Fargo Advantage Pennsylvania Municipal Money Market Fund | | | 21 | |
BOARD OF TRUSTEES
The following table provides basic information about the Board of Trustees (the “Trustees”) of the Trust and Officers of the Trust. This table should be read in conjunction with the Prospectus and the Statement of Additional Information1 of the Fund. Each of the Trustees and Officers listed below acts in identical capacities for the Wells Fargo Advantage family of funds, which consists of 144 funds comprising the Wells Fargo Funds Trust, Wells Fargo Variable Trust, Wells Fargo Master Trust and four closed-end funds (collectively the “Fund Complex”). All of the Trustees are also Members of the Audit and Governance Committees of each Trust in the Fund Complex. The mailing address of each Trustee and Officer is 525 Market Street, 12th Floor, San Francisco, CA 94105. Each Trustee and Officer serves an indefinite term, however, each Trustee serves such term until reaching the mandatory retirement age established by the Trustees.
Independent Trustees
| | | | | | |
Name and Year of Birth | | Position Held and Length of Service | | Principal Occupations During Past Five Years | | Other Directorships During
Past Five Years |
Peter G. Gordon
(Born 1942) | | Trustee, since 1998; Chairman, since 2005 | | Co-Founder, Chairman, President and CEO of Crystal Geyser. Water Company. Trustee Emeritus, Colby College | | Asset Allocation Trust |
Isaiah Harris, Jr.
(Born 1952) | | Trustee, since 2009 | | Retired. Prior thereto, President and CEO of BellSouth Advertising and Publishing Corp. from 2005 to 2007, President and CEO of BellSouth Enterprises from 2004 to 2005 and President of BellSouth Consumer Services from 2000 to 2003. Emeritus member of the Iowa State University Foundation Board of Governors. Emeritus Member of the Advisory Board of Iowa State University School of Business. Mr. Harris is a certified public accountant. | | CIGNA Corporation; Deluxe Corporation; Asset Allocation Trust |
Judith M. Johnson
(Born 1949) | | Trustee, since 2008 | | Retired. Prior thereto, Chief Executive Officer and Chief Investment Officer of Minneapolis Employees Retirement Fund from 1996 to 2008. Ms. Johnson is an attorney, certified public accountant and a certified managerial accountant. | | Asset Allocation Trust |
Leroy Keith, Jr.
(Born 1939) | | Trustee, since 2010 | | Chairman, Bloc Global Services (development and construction), Trustee of the Evergreen Funds from 1983 to 2010. Former Managing Director, Almanac Capital Management (commodities firm), former Partner, Stonington Partners, Inc. (private equity fund), former Director, Obagi Medical Products Co. and former Director, Lincoln Educational Services. | | Trustee, Virtus Fund Complex (consisting of 45 portfolios as of 12/31/10); Director, Diversapack Co. (packaging company); Asset Allocation Trust |
David F. Larcker
(Born 1950) | | Trustee, since 2009 | | James Irvin Miller Professor of Accounting at the Graduate School of Business, Stanford University, Director of Corporate Governance Research Program and Co-Director of The Rock Center for Corporate Governance since 2006. From 2005 to 2008, Professor of Accounting at the Graduate School of Business, Stanford University. Prior thereto, Ernst & Young Professor of Accounting at The Wharton School, University of Pennsylvania from 1985 to 2005. | | Asset Allocation Trust |
Olivia S. Mitchell
(Born 1953) | | Trustee, since 2006 | | International Foundation of Employee Benefit Plans Professor and Chair of the Department of Insurance and Risk Management, Wharton School of the University of Pennsylvania since 1993. Director of Wharton’s Pension Research Council and Boettner Center on Pensions & Retirement Research, and Research Associate at the National Bureau of Economic Research. Previously, Cornell University Professor from 1978 to 1993. | | Asset Allocation Trust |
| | | | |
| 22 | | Wells Fargo Advantage Pennsylvania Municipal Money Market Fund | | Other Information (Unaudited) |
| | | | | | |
Name and Year of Birth | | Position Held and Length of Service | | Principal Occupations During Past Five Years | | Other Directorships During
Past Five Years |
Timothy J. Penny
(Born 1951) | | Trustee, since 1996 | | President and CEO of Southern Minnesota Initiative Foundation, a non-profit organization, since 2007 and Senior Fellow at the Humphrey Institute Policy Forum at the University of Minnesota since 1995. Member of the Board of Trustees of NorthStar Education Finance, Inc., a non-profit organization, since 2007. | | Asset Allocation Trust |
Michael S. Scofield
(Born 1943) | | Trustee, since 2010 | | Currently serves on the Investment Company Institute’s Board of Governors and Executive Committee as well the In dependent Director’s Counsel Board of Governors and Executive Committee. Former Chairman of the Independent Directors Counsel. Trustee of the Evergreen Funds from 1984 to 2010. Retired Attorney, Law Offices of Michael S. Scofield and former Director and Chairman, Branded Media Corporation (multi-media branding company). | | Asset Allocation Trust |
Donald C. Willeke
(Born 1940) | | Trustee, since 1996 | | Principal of the law firm of Willeke & Daniels. General Counsel of the Minneapolis Employees Retirement Fund from 1984 until its consolidation into the Minnesota Public Employees Retirement Association on June 30, 2010. | | Asset Allocation Trust |
Officers
| | | | | | |
Name and Year of Birth | | Position Held and
Length of Service | | Principal Occupations During Past Five Years | | |
Karla M. Rabusch
(Born 1959) | | President, since 2003 | | Executive Vice President of Wells Fargo Bank, N.A. and President of Wells Fargo Funds Management, LLC since 2003. Senior Vice President and Chief Administrative Officer of Wells Fargo Funds Management, LLC from 2001 to 2003. | | |
C. David Messman
(Born 1960) | | Secretary, since 2000; Chief Legal Counsel, since 2003 | | Senior Vice President and Secretary of Wells Fargo Funds Management, LLC since 2001. Vice President and Managing Counsel of Wells Fargo Bank, N.A. since 1996. | | |
Kasey Phillips
(Born 1970) | | Treasurer, since 2008 | | Senior Vice President of Wells Fargo Funds Management, LLC since 2009. Senior Vice President of Evergreen Investment Management Company, LLC from 2006 to 2010. Treasurer of the Evergreen Funds from 2005 to 2010. Vice President and Assistant Vice President of Evergreen Investment Services, Inc. from 1999 to 2006. | | |
David Berardi
(Born 1975) | | Assistant Treasurer, since 2009 | | Vice President of Wells Fargo Funds Management, LLC since 2009 . Vice President of Evergreen Investment Management Company, LLC from 2008 to 2010. Assistant Vice President of Evergreen Investment Services, Inc. from 2004 to 2008. Manager of Fund Reporting and Control for Evergreen Investment Management Company, LLC from 2004 to 2010. | | |
Jeremy DePalma
(Born 1974) | | Assistant Treasurer, since 2009 | | Senior Vice President of Wells Fargo Funds Management, LLC since 2009. Senior Vice President of Evergreen Investment Management Company, LLC from 2008 to 2010. Vice President, Evergreen Investment Services, Inc. from 2004 to 2007. Assistant Vice President, Evergreen Investment Services, Inc. from 2000 to 2004 and the head of the Fund Reporting and Control Team within Fund Administration from 2005 to 2010. | | |
Debra Ann Early
(Born 1964) | | Chief Compliance Officer, since 2007 | | Chief Compliance Officer of Wells Fargo Funds Management, LLC since 2007. Chief Compliance Officer of Parnassus Investments from 2005 to 2007. Chief Financial Officer of Parnassus Investments from 2004 to 2007 and Senior Audit Manager of PricewaterhouseCoopers LLP from 1998 to 2004. | | |
| 1. | The Statement of Additional Information includes additional information about the Fund’s Trustees and is available, without charge, upon request, by calling 1-800-222-8222 or by visiting the Fund’s Web site at www.wellsfargo.com/advantagefunds. |
| | | | | | |
| Other Information (Unaudited) | | Wells Fargo Advantage Pennsylvania Municipal Money Market Fund | | | 23 | |
BOARD CONSIDERATION OF INVESTMENT ADVISORY AND SUB-ADVISORY AGREEMENTS:
California Municipal Money Market Fund, Municipal Cash Management Money Market Fund, Municipal Money Market Fund, National Tax-Free Money Market Fund, New Jersey Municipal Money Market Fund, New York Municipal Money Market Fund and Pennsylvania Municipal Money Market Fund
(Not all of the funds described in this Board considerations section are part of this shareholder report. This shareholder report only relates to Pennsylvania Municipal Money Market Fund.)
Each year, as required by Section 15 of the Investment Company Act of 1940 (the “1940 Act”), the Board of Trustees (the “Board”) of Wells Fargo Funds Trust (the “Trust”), all the members of which have no direct or indirect interest in the investment advisory and sub-advisory agreements and are not “interested persons” of the Trust, as defined in the 1940 Act (the “Independent Trustees”), determines whether to approve the continuation of the Trust’s investment advisory and sub-advisory agreements. In this regard, at an in person meeting held on March 24-25, 2011 (the “Meeting”), the Board reviewed and re-approved: (i) an investment advisory agreement with Wells Fargo Funds Management, LLC (“Funds Management”) for each of the California Municipal Money Market Fund, Municipal Cash Management Money Market Fund, Municipal Money Market Fund, National Tax-Free Money Market Fund, New Jersey Municipal Money Market Fund, New York Municipal Money Market Fund and Pennsylvania Municipal Money Market Fund (collectively, the “Funds”); and (ii) an investment sub-advisory agreement with Wells Capital Management Incorporated (“Wells Capital Management”) for each of the Funds. The investment advisory agreements with Funds Management and the investment sub-advisory agreements with Wells Capital Management are collectively referred to as the “Advisory Agreements.”
At the Meeting, the Board considered the factors and reached the conclusions described below relating to the selection of Funds Management and Wells Capital Management and continuation of the Advisory Agreements. Prior to the Meeting, the Trustees conferred extensively among themselves and with representatives of Funds Management about these matters. The Board also met throughout the year and received information that was useful to them in considering the continuation of the Advisory Agreements. The Independent Trustees were assisted in their evaluation of the Advisory Agreements by independent legal counsel, from whom they received separate legal advice and with whom they met separately from Funds Management.
Nature, extent and quality of services
The Board received and considered various information regarding the nature, extent and quality of services provided to the Funds by Funds Management and Wells Capital Management under the Advisory Agreements. The Board also received and considered information provided in response to a detailed set of requests submitted by the Independent Trustees’ independent legal counsel on their behalf. The Board received and considered, among other things, information about the background and experience of senior management of Funds Management, and the qualifications, backgrounds, tenures and responsibilities of the portfolio managers primarily responsible for the day-to-day portfolio management of the Funds.
The Board evaluated the ability of Funds Management and Wells Capital Management, based on their respective financial condition, resources, reputation and other attributes, to attract and retain qualified investment professionals, including research, advisory, and supervisory personnel. The Board further considered the compliance programs and compliance records of Funds Management and Wells Capital Management. In addition, the Board took into account the administrative services provided to the Funds by Funds Management and its affiliates.
The Board’s decision to approve the continuation of the Advisory Agreements was based on a comprehensive evaluation of all of the information provided to it. In approving the continuation of the Advisory Agreements, the Board did not identify any particular information or consideration that was all-important or controlling, and each Trustee attributed different weights to various factors. The Board evaluated information provided to it both in terms of the funds generally and with respect to each Fund specifically as it considered appropriate. Although the Board considered the continuation of the Advisory Agreements for each of the Funds as part of the larger process of considering the continuation of the advisory agreements for all of the funds, its decision to continue the Advisory Agreements for each of the Funds was ultimately made on a fund-by-fund basis.
In considering these matters, the Board considered not only the specific information presented in connection with the Meeting, but also the knowledge gained over time through interaction with Funds Management and Wells Capital
| | | | |
| 24 | | Wells Fargo Advantage Pennsylvania Municipal Money Market Fund | | Other Information (Unaudited) |
Management about various topics, including Funds Management’s oversight of service providers. The above factors, together with those referenced below, are some of the most important, but not necessarily all, factors considered by the Board in concluding that it was satisfied with the nature, extent and quality of the investment advisory services provided to each Fund by Funds Management and Wells Capital Management.
Fund performance and expenses
The Board considered the performance results for each of the Funds over various time periods ended December 31, 2010. The Board also considered these results in comparison to the median performance of a universe of relevant funds (the “Universe”) that were determined by Lipper Inc. (“Lipper”) to be similar to the Funds, and in comparison to each Fund’s benchmark index and to other comparative data. Lipper is an independent provider of investment company data. The Board received a description of the methodology used by Lipper to select the mutual funds in the Universe.
The Board noted that the performance of each of the Funds was generally higher than or in range of the median performance of the Universe for the periods under review.
The Board received and considered information regarding each Fund’s contractual advisory fee and net operating expense ratios and their various components, including actual management fees (which reflect fee waivers, if any), transfer agent, custodian and other non-management fees, Rule 12b-1 and non-Rule 12b-1 fees, service fees and fee waiver and expense reimbursement arrangements. The Board also considered these ratios in comparison to the median ratios of an expense Universe and a narrower expense group of mutual funds (each, an “Expense Group”) that was determined by Lipper to be similar to each Fund. The Board received a description of the methodology used by Lipper to select the mutual funds in a Fund’s Expense Group. The Board noted that the net operating expense ratios of the Service Class, Administrator Class and Institutional Class of each of the Funds were in range of each Fund’s respective Expense Group’s median net operating expense ratio. The Board also noted that the net operating expense ratios of the Class A and Sweep Class of each of the Funds were higher than each Fund’s respective Expense Group’s median net operating expense ratio and that the net operating expense ratio of the Municipal Money Market Fund (Investor Class) was not appreciably higher than the Expense Group’s median net operating expense ratio.
Based on the above-referenced considerations and other factors, the Board concluded that the overall performance and expense structure of the Funds supported the re-approval of the Advisory Agreements for the Funds.
Investment advisory and sub-advisory fee rates
The Board reviewed and considered the contractual investment advisory fee rates that are payable by the Funds to Funds Management for investment advisory services (the “Advisory Agreement Rates”), both on a stand-alone basis and on a combined basis with the Funds’ administration fee rates. The Board took into account the separate administrative and other services covered by the administration fee rates. The Board also reviewed and considered the contractual investment sub-advisory fee rates that are payable by Funds Management to Wells Capital Management for investment sub-advisory services (the “Sub-Advisory Agreement Rates”). In addition, the Board reviewed and considered the existing fee waiver/cap arrangements applicable to the Advisory Agreement Rates and considered the Advisory Agreement Rates after taking the waivers/caps into account (the “Net Advisory Rates”).
The Board received and considered information comparing the Advisory Agreement Rates and Net Advisory Rates with those of other funds in each Fund’s Expense Group median. The Board noted that the Advisory Agreement Rates for each of the Funds were in range of the median rate of each Fund’s Expense Group, except for the Municipal Money Market Fund and the New York Municipal Money Market Fund (Sweep Class). The Board noted that the Net Advisory Rates for the Service Class, Administrator Class and the Institutional Class of each of the Funds were lower than or in range of the median rate of each Fund’s Expense Group. The Board noted that the Net Advisory Rate for the Investor Class, Class A and Sweep Class of each of the Funds was not appreciably higher than the median rate for the Fund’s Expense, except for the Sweep Class of the Municipal Money Market Fund, New Jersey Municipal Money Market Fund and the New York Municipal Money Market Fund. The Board further noted that Funds Management had agreed to continue and, in certain instances, reduce contractual fee cap arrangements for the Funds designed to lower the Funds’ expenses.
The Board also received and considered information about the nature and extent of services offered and fee rates charged by Funds Management and Wells Capital Management to other types of clients. In this regard, the Board received information about differences between the services, and the compliance, reporting, and other legal burdens
| | | | | | |
| Other Information (Unaudited) | | Wells Fargo Advantage Pennsylvania Municipal Money Market Fund | | | 25 | |
and risks of providing investment advice to mutual funds and those associated with providing advice to non-mutual fund clients such as collective funds or institutional separate accounts.
In each case, the Board determined that the Advisory Agreement Rates for the Funds, both with and without administration fee rates and before and after waivers, were acceptable in light of the Funds’ Expense Group information, the net expense ratio commitments, the services covered by the Advisory Agreements and other information provided. The Board also reviewed and considered the Sub-Advisory Agreement Rates and concluded that the Sub-Advisory Agreement Rates were acceptable in light of the services covered by the Sub-Advisory Agreement and other information provided.
Profitability
The Board received and considered a profitability analysis of Funds Management, as well as an analysis of the profitability to the collective Wells Fargo businesses that provide services to the Funds. It considered that the information provided to it was necessarily estimated, and that the profitability information provided to it, especially on a fund-by-fund basis, did not necessarily provide a precise tool for evaluating the appropriateness of each Fund’s Advisory Agreement Rates in isolation. It noted that the levels of profitability of the Funds to Funds Management varied widely, depending on, among other things, the size and type of fund. The Board concluded that the profitability to Funds Management of the services provided to any of the Funds, individually or in the aggregate, was not unreasonable.
The Board did not consider separate profitability information with respect to Wells Capital Management, because, as an affiliate of Funds Management, its profitability information was subsumed in the collective Wells Fargo profitability analysis provided by Funds Management.
Economies of scale
With respect to possible economies of scale, the Board reviewed the breakpoints in each Fund’s advisory fee structure, which operate generally to reduce the effective Advisory Agreement Rates of the Funds (as a percentage of Fund assets) as the Funds grow in size. It considered that, as a fund shrinks in size, breakpoints conversely result in increasing fee levels. The Board noted that it would continue to review the appropriate levels of breakpoints in the future, and concluded that the breakpoints as implemented appeared to be a reasonable step toward sharing economies of scale with the Funds. However, the Board acknowledged the inherent limitations of any analysis of an investment adviser’s economies of scale and of any attempt to correlate breakpoints with such economies, stemming largely from the Board’s understanding that economies of scale are realized, if at all, by an investment adviser across a variety of products and services, not just with respect to a single fund.
Other benefits to Funds Management and Wells Capital Management
The Board received and considered information regarding potential “fall-out” or ancillary benefits received by Funds Management and its affiliates, including Wells Capital Management, as a result of their relationship with the Funds. Ancillary benefits could include, among others, benefits directly attributable to the relationship of Funds Management and Wells Capital Management with the Funds and benefits potentially derived from an increase in Funds Management’s and Wells Capital Management’s business as a result of their relationship with the Funds (such as the ability to market to shareholders other financial products offered by Funds Management and its affiliates, including Wells Capital Management).
The Board considered that Wells Fargo Funds Distributor, LLC, an affiliate of Funds Management, serves as distributor to the Funds and receives certain compensation for those services. The Board noted that the Funds pay sub-transfer agency fees to various financial institutions, including affiliates of Funds Management that hold fund shares in omnibus accounts. It also considered that these entities may receive distribution-related fees and shareholder servicing payments (including amounts derived from payments under the funds’ Rule 12b-1 plans) in respect of shares sold or held through them.
The Board also reviewed information about whether and to what extent soft dollar credits are sought and how any such credits are utilized and any benefits that may be realized by using an affiliated broker.
Other factors and broader review
The Board also considered the markets for distribution of the Funds’ shares, including the multiple channels through which the Funds’ shares are offered and sold. The Board noted that the Funds are part of one of the few fund families that
| | | | |
| 26 | | Wells Fargo Advantage Pennsylvania Municipal Money Market Fund | | Other Information (Unaudited) |
have both direct-to-fund and intermediary distribution channels. As discussed above, the Board reviews detailed materials received from Funds Management and Wells Capital Management annually as part of the re-approval process under Section 15 of the 1940 Act and also reviews and assesses information about the quality of the services that the Funds receive throughout the year. In this regard, the Board has reviewed reports of Funds Management at each of its quarterly meetings, which include, among other things, portfolio reviews and performance reports. In addition, the Board confers with portfolio managers at various times throughout the year.
Conclusion
After considering the above-described factors and based on its deliberations and its evaluation of the information described above, the Board concluded that approval of the continuation of the Advisory Agreements for the Funds was in the best interest of the Funds and their shareholders. Accordingly, the Board unanimously approved the continuation of the Advisory Agreements for an additional one-year period.
| | | | | | |
| List of Abbreviations | | Wells Fargo Advantage Pennsylvania Municipal Money Market Fund | | | 27 | |
The following is a list of common abbreviations for terms and entities which may have appeared in this report.
| ABAG | — Association of Bay Area Governments |
| ACB | — Agricultural Credit Bank |
| ADR | — American Depositary Receipt |
| ADS | — American Depository Shares |
| AGC-ICC | — Assured Guaranty Corporation - Insured Custody Certificates |
| AGM | — Assured Guaranty Municipal |
| AMBAC | — American Municipal Bond Assurance Corporation |
| AMT | — Alternative Minimum Tax |
| ARM | — Adjustable Rate Mortgages |
| BAN | — Bond Anticipation Notes |
| BART | — Bay Area Rapid Transit |
| BHAC | — Berkshire Hathaway Assurance Corporation |
| CCAB | — Convertible Capital Appreciation Bond |
| CDA | — Community Development Authority |
| CDO | — Collateralized Debt Obligation |
| CDSC | — Contingent Deferred Sales Charge |
| CGIC | — Capital Guaranty Insurance Company |
| CGY | — Capital Guaranty Corporation |
| CIFG | — CDC (Caisse des Dépôts et Consignations) IX IS Financial Guarantee |
| COP | — Certificate of Participation |
| DRIVER | — Derivative Inverse Tax-Exempt Receipts |
| DW&P | — Department of Water & Power |
| DWR | — Department of Water Resources |
| ECFA | — Educational & Cultural Facilities Authority |
| EDFA | — Economic Development Finance Authority |
| ETET | — Eagle Tax-Exempt Trust |
| ETF | — Exchange-Traded Fund |
| FFCB | — Federal Farm Credit Bank |
| FGIC | — Financial Guaranty Insurance Corporation |
| FHA | — Federal Housing Authority |
| FHAG | — Federal Housing Agency |
| FHLB | — Federal Home Loan Bank |
| FHLMC | — Federal Home Loan Mortgage Corporation |
| FNMA | — Federal National Mortgage Association |
| GDR | — Global Depositary Receipt |
| GNMA | — Government National Mortgage Association |
| HCFR | — Healthcare Facilities Revenue |
| HEFA | — Health & Educational Facilities Authority |
| HEFAR | — Higher Education Facilities Authority Revenue |
| HFA | — Housing Finance Authority |
| HFFA | — Health Facilities Financing Authority |
| HUD | — Housing & Urban Development |
| IBC | — Insured Bond Certificate |
| IDA | — Industrial Development Authority |
| IDAG | — Industrial Development Agency |
| IDR | — Industrial Development Revenue |
| KRW | — Republic of Korea Won |
| LIBOR | — London Interbank Offered Rate |
| LLC | — Limited Liability Company |
| LLP | — Limited Liability Partnership |
| MBIA | — Municipal Bond Insurance Association |
| MFHR | — Multi-Family Housing Revenue |
| MFMR | — Multi-Family Mortgage Revenue |
| MMD | — Municipal Market Data |
| MSTR | — Municipal Securities Trust Receipts |
| MUD | — Municipal Utility District |
| NATL-RE | — National Public Finance Guarantee Corporation |
| PCFA | — Pollution Control Finance Authority |
| PCR | — Pollution Control Revenue |
| PFA | — Public Finance Authority |
| PFFA | — Public Facilities Financing Authority |
| PFOTER | — Puttable Floating Option Tax-Exempt Receipts |
| plc | — Public Limited Company |
| PSFG | — Public School Fund Guaranty |
| PUTTER | — Puttable Tax-Exempt Receipts |
| R&D | — Research & Development |
| RDA | — Redevelopment Authority |
| RDFA | — Redevelopment Finance Authority |
| REIT | — Real Estate Investment Trust |
| RIB | — Residual Interest Bond |
| ROC | — Reset Option Certificates |
| SAVRS | — Select Auction Variable Rate Securities |
| SFHR | — Single Family Housing Revenue |
| SFMR | — Single Family Mortgage Revenue |
| SLMA | — Student Loan Marketing Association |
| SPDR | — Standard & Poor’s Depositary Receipts |
| STIT | — Short-Term Investment Trust |
| TAN | — Tax Anticipation Notes |
| TIPS | — Treasury Inflation-Protected Securities |
| TRAN | — Tax Revenue Anticipation Notes |
| TCR | — Transferable Custody Receipts |
| TTFA | — Transportation Trust Fund Authority |
| USD | — Unified School District |
| XLCA | — XL Capital Assurance |
This page is intentionally left blank.
This page is intentionally left blank.
This page is intentionally left blank.


FOR MORE INFORMATION
More information about Wells Fargo Advantage Funds is available free upon request. To obtain literature, please write, e-mail, visit the Funds’ Web site, or call:
Wells Fargo Advantage Funds
P.O. Box 8266
Boston, MA 02266-8266
E-mail: wfaf@wellsfargo.com
Web site: www.wellsfargo.com/advantagefunds
Individual investors: 1-800-222-8222
Retail investment professionals: 1-888-877-9275
Institutional investment professionals: 1-866-765-0778
This report and the financial statements contained herein are submitted for the general information of the shareholders of Wells Fargo Advantage Funds. If this report is used for promotional purposes, distribution of the report must be accompanied or preceded by a current prospectus. For a prospectus containing more complete information, including charges and expenses, call 1-800-222-8222 or visit the Funds’ Web site at www.wellsfargo.com/advantagefunds. Please consider the investment objectives, risks, charges, and expenses of the investment carefully before investing. This and other information about Wells Fargo Advantage Funds can be found in the current prospectus. Read the prospectus carefully before you invest or send money.
Wells Fargo Funds Management, LLC, a wholly owned subsidiary of Wells Fargo & Company, provides investment advisory and administrative services for Wells Fargo Advantage Funds. Other affiliates of Wells Fargo & Company provide subadvisory and other services for the Funds. The Funds are distributed by Wells Fargo Funds Distributor, LLC, Member FINRA/SIPC, an affiliate of Wells Fargo & Company.
NOT FDIC INSURED ¡ NO BANK GUARANTEE ¡ MAY LOSE VALUE
© 2011 Wells Fargo Funds Management, LLC. All rights reserved.
| | |
 | | 204808 09-11 SA312/SAR312 7-11 |

Wells Fargo Advantage
Prime Investment Money Market Fund

Semi-Annual Report
July 31, 2011

Reduce clutter. Save trees.
Sign up for electronic delivery of prospectuses and shareholder reports at www.wellsfargo.com/advantagedelivery
Contents
The views expressed and any forward-looking statements are as of July 31, 2011, unless otherwise noted and are those of the Fund managers and/or Wells Fargo Funds Management, LLC. Discussions of individual securities, or the markets generally, or any Wells Fargo Advantage Fund are not intended as individual recommendations. Future events or results may vary significantly from those expressed in any forward-looking statements; the views expressed are subject to change at any time in response to changing circumstances in the market. Wells Fargo Funds Management, LLC, disclaims any obligation to publicly update or revise any views expressed or forward-looking statements.
NOT FDIC INSURED ¡ NO BANK GUARANTEE ¡ MAY LOSE VALUE

WELLS FARGO INVESTMENT HISTORY
| | |
| |
| 1932 | | Keystone creates one of the first mutual fund families. |
| |
| 1971 | | Wells Fargo & Company introduces one of the first institutional index funds. |
| |
| 1978 | | Wells Fargo applies Markowitz and Sharpe’s research on Modern Portfolio Theory to introduce one of the industry’s first Tactical Asset Allocation (TAA) models in institutional separately managed accounts. |
| |
| 1984 | | Wells Fargo Stagecoach Funds launches its first asset allocation fund. |
| |
| 1989 | | The Tactical Asset Allocation (TAA) Model is first applied to Wells Fargo’s asset allocation mutual funds. |
| |
| 1994 | | Wells Fargo introduces the LifePath Funds, one of the first suites of target date funds (now the Wells Fargo Advantage Dow Jones Target Date FundsSM ). |
| |
| 1996 | | Evergreen Investments and Keystone Funds merge. |
| |
| 1997 | | Wells Fargo launches Wells Fargo Advantage WealthBuilder PortfoliosSM, a fund-of-funds suite of products that includes the use of quantitative models to shift assets among investment styles. |
| |
| 1999 | | Norwest Advantage Funds and Stagecoach Funds are reorganized into Wells Fargo Funds after the merger of Norwest and Wells Fargo. |
| |
| 2002 | | Evergreen Retail and Evergreen Institutional companies form the umbrella asset management company, Evergreen Investments. |
| |
| 2005 | | The integration of Strong Funds with Wells Fargo Funds creates Wells Fargo Advantage Funds, resulting in one of the top 20 mutual fund companies in the United States. |
| |
| 2006 | | Wells Fargo Advantage Funds relaunches the target date product line as Wells Fargo Advantage Dow Jones Target Date Funds. |
| |
| 2010 | | The mergers and reorganizations of Evergreen and Wells Fargo Advantage mutual funds are completed, unifying the families under the brand of Wells Fargo Advantage Funds. |
Wells Fargo Advantage Funds®
Wells Fargo Advantage Funds skillfully guides institutions, financial advisors, and individuals through the investment terrain to help them reach their financial objectives. Everything we do on behalf of investors is backed by our unique combination of qualifications.
Strength
Our organization is built on the standards of integrity and service established by our parent company—Wells Fargo & Company—more than 150 years ago. And, because we’re part of a highly diversified financial enterprise, we offer the depth of resources to help investors succeed.
Expertise
Our multi-boutique model offers investors access to the independent thinking of premier investment managers that have been chosen for their time-tested strategies. While each team specializes in a specific investment strategy, collectively they provide investors a wide choice of distinct investment styles. Our dedication to investment excellence doesn’t end with our expertise in manager selection—risk management, analysis, and rigorous ongoing review seek to ensure each manager’s investment process remains consistent.
Partnership
Our collaborative approach is built around understanding the needs and goals of our clients. By adhering to core principles of sound judgment and steady guidance, we support you through every stage of the investment decision process.
Carefully consider the investment objectives, risks, charges, and expenses before investing. For a current prospectus for Wells Fargo Advantage Funds containing this and other information, visit wellsfargo.com/advantagefunds. Read it carefully before investing.
Wells Fargo Funds Management, LLC, a wholly owned subsidiary of Wells Fargo & Company, provides investment advisory and administrative services for Wells Fargo Advantage Funds®. Other affiliates of Wells Fargo & Company provide subadvisory and other services for the Funds. The Funds are distributed by Wells Fargo Funds Distributor, LLC, Member FINRA/SIPC, an affiliate of Wells Fargo & Company.
The “Dow Jones Target Date Indexes” are a product of Dow Jones Indexes, a licensed trademark of CME Group Index Services LLC (“CME”). “Dow Jones” and “Dow Jones Target Date Indexes” are service marks of Dow Jones Trademark Holdings, LLC, and have been licensed for use for certain purposes by CME and sublicensed for use by Global Index Advisors, Inc., and Wells Fargo Funds Management, LLC. The Dow Jones Target Date Indexes are based in part on the Barclays Capital Bond Indexes, which are published by Barclays Capital Inc. The Wells Fargo Advantage Dow Jones Target Date Funds, based on the Dow Jones Target Date Indexes, are not sponsored, endorsed, sold, or promoted by Dow Jones, CME or Barclays Capital or any of their respective affiliates, and neither Dow Jones, CME nor Barclays Capital nor any of their respective affiliates makes any representation regarding the advisability of investing in such product(s) and/or about the quality, accuracy, and/or completeness of the Dow Jones Target Date Indexes or the Barclays Capital Bond Indexes. IN NO EVENT SHALL DOW JONES, CME, BARCLAYS CAPITAL, OR ANY OF THEIR LICENSORS HAVE ANY LIABILITY IN CONNECTION WITH THE Wells Fargo Advantage Dow Jones Target Date Funds INCLUDING, WITHOUT LIMITATION, FOR ANY SPECIAL, PUNITIVE, IN DIRECT, OR CONSEQUENTIAL DAMAGES (INCLUDING LOST PROFITS), EVEN IF NOTIFIED OF THE POSSIBILITY OF SUCH DAMAGES.
NOT FDIC INSURED ¡ NO BANK GUARANTEE ¡ MAY LOSE VALUE
Not part of the semi-annual report.
Wells Fargo Advantage Funds offers more than 110 mutual funds across a wide range of asset classes, representing over $221 billion in assets under management, as of July 31, 2011.
| | | | |
| Equity Funds | | | | |
Asia Pacific Fund | | Global Opportunities Fund | | Premier Large Company Growth Fund |
C&B Large Cap Value Fund | | Growth Fund | | Small Cap Opportunities Fund |
C&B Mid Cap Value Fund | | Health Care Fund | | Small Cap Value Fund |
Capital Growth Fund | | Index Fund | | Small Company Growth Fund |
Common Stock Fund | | International Equity Fund | | Small Company Value Fund |
Disciplined U.S. Core Fund | | International Value Fund | | Small/Mid Cap Core Fund |
Discovery Fund† | | Intrinsic Small Cap Value Fund | | Small/Mid Cap Value Fund |
Diversified Equity Fund | | Intrinsic Value Fund | | Social Sustainability Fund† |
Diversified International Fund | | Intrinsic World Equity Fund | | Special Mid Cap Value Fund |
Diversified Small Cap Fund | | Large Cap Core Fund | | Special Small Cap Value Fund |
Emerging Growth Fund | | Large Cap Growth Fund | | Specialized Technology Fund |
Emerging Markets Equity Fund | | Large Company Value Fund | | Strategic Large Cap Growth Fund |
Endeavor Select Fund† | | Omega Growth Fund | | Traditional Small Cap Growth Fund |
Enterprise Fund† | | Opportunity Fund† | | Utility and Telecommunications Fund |
Equity Value Fund | | Precious Metals Fund | | |
| Bond Funds | | | | |
Adjustable Rate Government Fund | | Inflation-Protected Bond Fund | | Short-Term Bond Fund |
California Limited-Term Tax-Free Fund | | Intermediate Tax/AMT-Free Fund | | Short-Term High Yield Bond Fund |
California Tax-Free Fund | | International Bond Fund | | Short-Term Municipal Bond Fund |
Colorado Tax-Free Fund | | Minnesota Tax-Free Fund | | Strategic Municipal Bond Fund |
Government Securities Fund | | Municipal Bond Fund | | Total Return Bond Fund |
High Income Fund | | North Carolina Tax-Free Fund | | Ultra Short-Term Income Fund |
High Yield Bond Fund | | Pennsylvania Tax-Free Fund | | Ultra Short-Term Municipal Income Fund |
Income Plus Fund | | Short Duration Government Bond Fund | | Wisconsin Tax-Free Fund |
| Asset Allocation Funds | | | | |
Asset Allocation Fund | | WealthBuilder Equity Portfolio† | | Target 2020 Fund† |
Conservative Allocation Fund | | WealthBuilder Growth Allocation Portfolio† | | Target 2025 Fund† |
Diversified Capital Builder Fund | | WealthBuilder Growth Balanced Portfolio† | | Target 2030 Fund† |
Diversified Income Builder Fund | | WealthBuilder Moderate Balanced Portfolio† | | Target 2035 Fund† |
Growth Balanced Fund | | WealthBuilder Tactical Equity Portfolio† | | Target 2040 Fund† |
Index Asset Allocation Fund | | Target Today Fund† | | Target 2045 Fund† |
Moderate Balanced Fund | | Target 2010 Fund† | | Target 2050 Fund† |
WealthBuilder Conservative Allocation Portfolio† | | Target 2015 Fund† | | Target 2055 Fund† |
| Money Market Funds | | | | |
100% Treasury Money Market Fund | | Minnesota Money Market Fund | | New Jersey Municipal Money Market Fund |
California Municipal Money Market Fund | | Money Market Fund | | New York Municipal Money Market Fund |
Cash Investment Money Market Fund | | Municipal Cash Management Money Market Fund | | Pennsylvania Municipal Money Market Fund |
Government Money Market Fund | | Municipal Money Market Fund | | Prime Investment Money Market Fund |
Heritage Money Market Fund† | | National Tax-Free Money Market Fund | | Treasury Plus Money Market Fund |
| Variable Trust Funds1 | | | | |
VT Discovery Fund† | | VT Intrinsic Value Fund | | VT Small Cap Growth Fund |
VT Index Asset Allocation Fund | | VT Omega Growth Fund | | VT Small Cap Value Fund |
VT International Equity Fund | | VT Opportunity Fund† | | VT Total Return Bond Fund |
An investment in a money market fund is not insured or guaranteed by the Federal Deposit Insurance Corporation or any other government agency. Although the Wells Fargo Advantage Money Market Funds seek to preserve the value of your investment at $1.00 per share, it is possible to lose money by investing in a money market fund.
| 1. | The Variable Trust Funds are generally available only through insurance company variable contracts. |
| † | In this report, the Wells Fargo Advantage Discovery FundSM, Wells Fargo Advantage Endeavor Select FundSM, Wells Fargo Advantage Enterprise FundSM, Wells Fargo Advantage Opportunity FundSM, Wells Fargo Advantage Social Sustainability FundSM, Wells Fargo Advantage WealthBuilder Conservative Allocation PortfolioSM, Wells Fargo Advantage WealthBuilder Equity PortfolioSM, Wells Fargo Advantage WealthBuilder Growth Allocation PortfolioSM, Wells Fargo Advantage WealthBuilder Growth Balanced PortfolioSM, Wells Fargo Advantage WealthBuilder Moderate Balanced PortfolioSM, Wells Fargo Advantage WealthBuilder Tactical Equity PortfolioSM, Wells Fargo Advantage Dow Jones Target Today FundSM, Wells Fargo Advantage Dow Jones Target 2010 FundSM, Wells Fargo Advantage Dow Jones Target 2015 FundSM, Wells Fargo Advantage Dow Jones Target 2020 FundSM, Wells Fargo Advantage Dow Jones Target 2025 FundSM, Wells Fargo Advantage Dow Jones Target 2030 FundSM, Wells Fargo Advantage Dow Jones Target 2035 FundSM, Wells Fargo Advantage Dow Jones Target 2040 FundSM, Wells Fargo Advantage Dow Jones Target 2045 FundSM, Wells Fargo Advantage Dow Jones Target 2050 FundSM, Wells Fargo Advantage Dow Jones Target 2055 FundSM, Wells Fargo Advantage Heritage Money Market FundSM, Wells Fargo Advantage VT Discovery FundSM, and Wells Fargo Advantage VT Opportunity FundSM are referred to as the Discovery Fund, Endeavor Select Fund, Enterprise Fund, Opportunity Fund, Social Sustainability Fund, WealthBuilder Conservative Allocation Portfolio, WealthBuilder Equity Portfolio, WealthBuilder Growth Allocation Portfolio, WealthBuilder Growth Balanced Portfolio, WealthBuilder Moderate Balanced Portfolio, WealthBuilder Tactical Equity Portfolio, Target Today Fund, Target 2010 Fund, Target 2015 Fund, Target 2020 Fund, Target 2025 Fund, Target 2030 Fund, Target 2035 Fund, Target 2040 Fund, Target 2045 Fund, Target 2050 Fund, Target 2055 Fund, Heritage Money Market Fund, VT Discovery Fund, and VT Opportunity Fund, respectively. |
Not part of the semi-annual report.
| | | | |
| 2 | | Wells Fargo Advantage Prime Investment Money Market Fund | | Letter to Shareholders |

Karla M. Rabusch,
President
Wells Fargo Advantage Funds
Dear Valued Shareholder,
We’re pleased to offer you this semi-annual report for the Wells Fargo Advantage Prime Investment Money Market Fund for the six-month period that ended July 31, 2011. Upon reviewing the report, you may notice a few changes from past reports, the most significant of which is the change from a multi-fund report to a single-fund report. We believe this change will give you more convenient access to your fund data.
The period began modestly as improving economic optimism generally shifted investors toward equities and riskier assets and away from U.S. Treasuries and lower-yielding fixed-income securities. Returns from fixed income were modest in the opening months of 2011 but were generally still positive as U.S. Treasury yields incrementally climbed higher. But after the slow start, bond prices once again strongly improved, sparked by a sharp decline in U.S. Treasury prices in April that carried into May. Late in the period, lower-rated bonds declined in price more than the higher credit-quality tiers but not enough to outweigh the stronger performance from lower-rated securities during the period. Lower-quality and longer-maturity fixed-income securities generally outperformed higher-quality and shorter-maturity securities over the full period.
The activity within the broader bond market also resonated with money market participants. As the economic and credit environment reverberated from the ongoing sovereign debt concerns and softening economic data, many participants continued to balance a need for stability and desire for higher yields. The result has been good demand for domestic commercial paper and certificate of deposits. Also, in spite of all the discussion about sovereign debt, many money market participants continue to maintain some exposures to foreign banks based on the quality of their fundamentals. By focusing more on the fundamentals and taking a more selective approach to the short-term security market helped the markets avoid the severe yield volatility or significant flight-to-quality experienced during the spring of 2010, when the Greek sovereign debt crisis first emerged.
The global economic “recovery” hit a snag, but the end of 2011 could regain momentum.
The U.S. economic recovery that began in mid-2009 and gained further momentum throughout 2010, particularly during the fourth quarter, has failed to maintain that level of growth through the first seven months of 2011. For example, gross domestic product (GDP), the broadest measure of economic activity, grew at an annualized rate of 3.1% in the fourth quarter of 2010, only to slow dramatically during the first quarter of 2011. The latest revision to first-quarter GDP data during the period indicated that the economy grew at an annualized rate of 0.4% during the first quarter of 2011. While still positive, it’s a much slower pace of growth than experienced in the second half of 2010 and notably lower than consensus forecasts. Nevertheless, the advance estimate of second-quarter 2011 GDP, which was released on July 29, 2011, was 1.3%, suggesting that the U.S. economy continues to expand, though at a slow and uneven pace.
Jobs and housing remained troublesome.
The July 2011 unemployment rate in the U.S. was reported at 9.1%, down from 9.5% a year earlier but still notably higher than historical averages. Unfortunately,
| | | | | | |
| Letter to Shareholders | | Wells Fargo Advantage Prime Investment Money Market Fund | | | 3 | |
the drop may be more attributable to a decline in the labor force than to a meaningful uptick in hiring. The level of job creation in 2011 has been trending below historical averages, suggesting that the improving economy has yet to translate into widespread hiring. Meanwhile, the beleaguered housing market was an ongoing source of concern, despite some tentative late-year signs of stabilization. That said, persistent weakness in the labor and housing markets bears close watching in the months ahead.
Other economic data in the U.S. has been more encouraging, reflecting greater confidence in the sustainability of the expansion on the part of both consumers and businesses. Retail sales came in strong at certain points during the period and industrial production and new orders have picked up. Although still reluctant to hire, businesses have gradually increased spending in other areas, such as equipment and information technology. Core inflation, which excludes volatile food and energy prices, remained benign.
The Federal Reserve believes the economic recovery will accelerate in future quarters.
With inflation subdued, the Federal Open Market Committee (FOMC) held its target range for the federal funds rate—a proxy for short-term interest rates—steady at 0.00% to 0.25%. On June 22, 2011, in its final statement of the six-month period, the Fed reiterated that the economic recovery “is proceeding at a moderate pace,” but that “recent labor market indicators have been weaker than anticipated.” It described the recent increase in inflation as temporary, suggesting that inflation pressures will ease going forward. While the FOMC explained that it “expects the pace of recovery to pick up over coming quarters,” it indicated that the federal funds rate will remain at an exceptionally low level for as long as necessary to ensure a sustainable recovery and expansion.
As recent headwinds subside, it is reasonable to expect markets to regain focus.
Now that it appears the debt ceiling has been increased and a U.S. default will be averted, money market participants and the broader bond market can get back to more fundamental and lasting concerns-chiefly, the economy. After avoiding short-term Treasuries in late July 2011, ahead of pending U.S. debt ceiling deadline, money market participants have returned to the U.S. short-term markets1. Economic indicators released in the second half of 2011 might not be as soft as those reported during the first half of the year. While that would not mean that the economy is robust, it might remind the markets that the first half of the slowdown was transitory. Most indicators still point toward real GDP growth in the 2% to 3% range in the second half of 2011. While that is not enough to produce big employment gains, it might be sufficient to cause Treasury yields to retrace some of the late-July declines.
Don’t let short-term uncertainty derail long-term investment goals.
While periods of uncertainty can present challenges, experience has taught us that maintaining a long-term investment strategy based on individual goals and risk tolerance can be an effective way to plan for the future. As a whole, Wells Fargo Advantage Funds represents investments across a broad range of asset classes and investment styles with more than 110 mutual funds, giving you an opportunity to create a diversified investment portfolio. While diversification may
| 1. | Comments expressed that do not fall within the reporting period are as of August 2, 2011. |
While the FOMC explained that it “expects the pace of recovery to pick up over coming quarters,” it indicated that the federal funds rate will remain at an exceptionally low level for as long as necessary to ensure a sustainable recovery and expansion.
Economic indicators released in the second half of 2011 might not be as soft as those reported during the first half of the year. While that would not mean that the economy is robust, it might remind the markets that the first half of the slowdown was transitory.
| | | | |
| 4 | | Wells Fargo Advantage Prime Investment Money Market Fund | | Letter to Shareholders |
not prevent losses in a downturn, it may help to reduce them and provide you with one way of managing risk.
In our opinion, diligent and earnest assessment of the fundamental characteristics of money market eligible securities will be a key differentiating factor between which investment strategies meet client expectations and which do not. At Wells Fargo Advantage Funds, we intend to continue the emphasis of principal preservation and high liquidity across our lineup of Wells Fargo Advantage Money Market Funds. In changing markets, we believe it is particularly important to have diligent investment analysts in charge of investor assets.
Thank you for choosing Wells Fargo Advantage Funds. We appreciate your confidence in us and are committed to helping you meet your financial needs. If you have any questions about your investments, please contact your investment professional, call us at 1-800-222-8222, or visit www.wellsfargo.com/advantagefunds.
Sincerely,

Karla M. Rabusch
President
Wells Fargo Advantage Funds
| | | | | | |
| Performance Highlights (Unaudited) | | Wells Fargo Advantage Prime Investment Money Market Fund | | | 5 | |
INVESTMENT OBJECTIVE
The Fund seeks current income, while preserving capital and liquidity.
ADVISER
Wells Fargo Funds Management, LLC
SUB-ADVISER
Wells Capital Management Incorporated
PORTFOLIO MANAGERS
David D. Sylvester
Laurie White
FUND INCEPTION
September 2, 1998
| | |
PORTFOLIO COMPOSITION1
(AS OF JULY 31, 2011) | | |
|
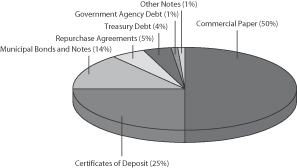 |
| | |
EFFECTIVE MATURITY DISTRIBUTION1
(AS OF JULY 31, 2011) |
|
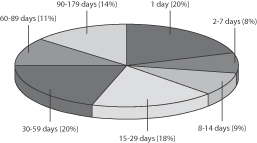 |
| | |
WEIGHTED AVERAGE MATURITY2
(AS OF JULY 31, 2011) |
19 Days |
| | |
WEIGHTED AVERAGE FINAL MATURITY3
(AS OF JULY 31, 2011) |
28 Days |
| 1. | Portfolio composition and effective maturity distribution are subject to change and are calculated based on the total investments of the Fund. Effective maturity distribution is based on the weighted average maturity of each security. |
| 2. | Weighted Average Maturity (WAM): WAM calculates an average time to maturity of all of the securities held in the portfolio, weighted by each security’s percentage of net assets. The calculation takes into account the final maturity of a fixed-income security and the interest rate reset date for floating-rate securities held in the portfolio. This is a way to measure a fund’s sensitivity to potential interest rate changes. |
| 3. | Weighted Average Final Maturity (WAFM): WAFM calculates a fund’s average time to maturity for all of the securities held in the portfolio, weighted to their percentage of assets in the Fund. In contrast to WAM, the WAFM calculation takes into account the final maturity date for each security held in the portfolio. This is a way to measure a fund’s potential sensitivity to credit spread changes. |
| | | | |
| 6 | | Wells Fargo Advantage Prime Investment Money Market Fund | | Performance Highlights (Unaudited) |
AVERAGE ANNUAL TOTAL RETURN4 (%) (AS OF JULY 31, 2011)
| | | | | | | | | | | | | | | | | | | | | | | | | | | | |
| | | | | | | | | | | | | | | | | | Expense Ratios5 | |
| | | Inception Date | | | 6 Months* | | | 1 Year | | | 5 Year | | | 10 Year | | | Gross | | | Net6 | |
Institutional Class (PIIXX) | | | 07/28/2003 | | | | 0.04 | | | | 0.11 | | | | 2.13 | | | | 2.09 | | | | 0.24% | | | | 0.20% | |
Service Class (NWRXX) | | | 09/02/1998 | | | | 0.00 | | | | 0.01 | | | | 1.87 | | | | 1.85 | | | | 0.53% | | | | 0.53% | |
| * | Returns for periods of less than one year are not annualized. |
| | | | | | | | |
FUND YIELD SUMMARY6
(AS OF JULY 31, 2011) | | Institutional
Class | | | Service
Class | |
7-Day Current Yield | | | 0.02% | | | | 0.01% | |
7-Day Compound Yield | | | 0.02% | | | | 0.01% | |
30-Day Simple Yield | | | 0.02% | | | | 0.01% | |
30-Day Compound Yield | | | 0.02% | | | | 0.01% | |
Figures quoted represent past performance, which is no guarantee of future results and do not reflect the deduction of taxes that a shareholder may pay on fund distributions or the redemption of fund shares. Investment returns will fluctuate. The Fund’s yield figures more closely reflect the current earnings of the Fund than the total return figures. Current performance may be lower or higher than the performance data quoted. Current month-end performance is available at the Fund’s Web site – www.wellsfargo.com/advantagefunds.
Each class is sold without a front-end sales charge or contingent deferred sales charge. Other fees and expenses apply to an investment in the Fund and are described in the Fund’s current prospectus.
An investment in a money market fund is not insured or guaranteed by the Federal Deposit Insurance Corporation or any other government agency. Although the Fund seeks to preserve the value of your investment at $1.00 per share, it is possible to lose money by investing in a money market fund.
| 4. | Historical performance shown for the Institutional Class shares prior to their inception reflects the performance of the Service Class shares, and includes the higher expenses applicable to the Service Class shares. If these expenses had not been included, returns would be higher. |
| 5. | Reflects the expense ratios as stated in the most recent prospectuses. |
| 6. | The Adviser has committed through May 31, 2012 to waive fees and/or reimburse expenses to the extent necessary to cap the Fund’s Total Annual Fund Operating Expenses After Fee Waiver, excluding certain expenses, at 0.20% for Institutional Class and 0.55% for Service Class. Without this cap, the Fund’s returns would have been lower. Without waived fees and/or reimbursed expenses, the Fund’s 7-day current yield would have been (0.02)%, and (0.31)% for Institutional Class and Service Class, respectively. |
| | | | | | |
| Fund Expenses | | Wells Fargo Advantage Prime Investment Money Market Fund | | | 7 | |
As a shareholder of the Fund, you incur two types of costs: (1) transaction costs and (2) ongoing costs, including management fees; shareholder service fees; and other Fund expenses. This example is intended to help you understand your ongoing costs (in dollars) of investing in the Fund and to compare these costs with the ongoing costs of investing in other mutual funds.
The example is based on an investment of $1,000 invested at the beginning of the six-month period and held for the entire period from February 1, 2011 to July 31, 2011.
Actual Expenses
The “Actual” line of the table below provides information about actual account values and actual expenses. You may use the information in this line, together with the amount you invested, to estimate the expenses that you paid over the period. Simply divide your account value by $1,000 (for example, an $8,600 account value divided by $1,000 = 8.6), then multiply the result by the number in the “Actual” line under the heading entitled “Expenses Paid During Period” for your applicable class of shares to estimate the expenses you paid on your account during this period.
Hypothetical Example for Comparison Purposes
The “Hypothetical” line of the table below provides information about hypothetical account values and hypothetical expenses based on the Fund’s actual expense ratio and an assumed rate of return of 5% per year before expenses, which is not the Fund’s actual return. The hypothetical account values and expenses may not be used to estimate the actual ending account balance or expenses you paid for the period. You may use this information to compare the ongoing costs of investing in the Fund and other funds. To do so, compare this 5% hypothetical example with the 5% hypothetical examples that appear in the shareholder reports of the other funds.
Please note that the expenses shown in the table are meant to highlight your ongoing costs only and do not reflect any transactional costs. Therefore, the “Hypothetical” line of the table is useful in comparing ongoing costs only, and will not help you determine the relative total costs of owning different funds. In addition, if these transactional costs were included, your costs would have been higher.
| | | | | | | | | | | | | | | | |
| | | Beginning
Account Value
02-01-2011 | | | Ending
Account Value
07-31-2011 | | | Expenses
Paid During
the Period1 | | | Net Annual
Expense Ratio | |
Institutional Class | | | | | | | | | | | | | | | | |
Actual | | $ | 1,000.00 | | | $ | 1,000.37 | | | $ | 0.99 | | | | 0.20 | % |
Hypothetical (5% return before expenses) | | $ | 1,000.00 | | | $ | 1,023.80 | | | $ | 1.00 | | | | 0.20 | % |
Service Class | | | | | | | | | | | | | | | | |
Actual | | $ | 1,000.00 | | | $ | 1,000.05 | | | $ | 1.29 | | | | 0.26 | % |
Hypothetical (5% return before expenses) | | $ | 1,000.00 | | | $ | 1,023.51 | | | $ | 1.30 | | | | 0.26 | % |
| 1. | Expenses paid is equal to the annualized expense ratio of each class multiplied by the average account value over the period, multiplied by the number of days in the most recent fiscal half-year divided by the number of days in the fiscal year (to reflect the one-half year period). |
| | | | |
| 8 | | Wells Fargo Advantage Prime Investment Money Market Fund | | Portfolio of Investments—July 31, 2011 (Unaudited) |
| | | | | | | | | | | | | | | | |
| Security Name | | Interest Rate | | | Maturity Date | | | Principal | | | Value | |
| | | | | | | | | | | | | | | | |
| | | | |
Certificates of Deposit: 23.45% | | | | | | | | | | | | | | | | |
Banco Del Estado De Chile | | | 0.21 | % | | | 08/04/2011 | | | $ | 20,000,000 | | | $ | 20,000,000 | |
Bank of Montreal | | | 0.11 | | | | 08/23/2011 | | | | 10,000,000 | | | | 10,000,000 | |
Bank of Montreal | | | 0.12 | | | | 08/24/2011 | | | | 5,000,000 | | | | 5,000,000 | |
Bank of Montreal | | | 0.12 | | | | 08/26/2011 | | | | 15,000,000 | | | | 15,000,000 | |
Barclays Bank plc (New York)± | | | 0.74 | | | | 08/12/2011 | | | | 40,000,000 | | | | 40,000,000 | |
Barclays Bank plc (New York)± | | | 0.59 | | | | 04/16/2012 | | | | 6,000,000 | | | | 6,000,000 | |
Barclays Bank plc (New York)± | | | 0.65 | | | | 01/17/2012 | | | | 10,000,000 | | | | 10,000,000 | |
Barclays Bank plc (New York)± | | | 0.69 | | | | 10/24/2011 | | | | 21,500,000 | | | | 21,500,000 | |
BNP Paribas | | | 0.13 | | | | 08/01/2011 | | | | 80,000,000 | | | | 80,000,000 | |
Commerzbank (London) | | | 0.15 | | | | 08/01/2011 | | | | 55,000,000 | | | | 55,000,000 | |
Credit Agricole | | | 0.16 | | | | 08/01/2011 | | | | 60,000,000 | | | | 60,000,000 | |
Credit Agricole | | | 0.23 | | | | 08/12/2011 | | | | 6,000,000 | | | | 6,000,000 | |
Credit Agricole | | | 0.23 | | | | 08/15/2011 | | | | 10,000,000 | | | | 10,000,000 | |
Credit Industriel et Commercial | | | 0.11 | | | | 08/01/2011 | | | | 23,000,000 | | | | 23,000,000 | |
Credit Suisse NY± | | | 0.25 | | | | 09/02/2011 | | | | 16,000,000 | | | | 16,000,123 | |
DG Bank NY Branch | | | 0.23 | | | | 08/15/2011 | | | | 10,000,000 | | | | 10,000,000 | |
Groupe BPCE | | | 0.13 | | | | 08/01/2011 | | | | 55,000,000 | | | | 55,000,000 | |
KBC Bank NV Brussels | | | 0.15 | | | | 08/01/2011 | | | | 46,000,000 | | | | 46,000,000 | |
National Bank of Canada± | | | 0.35 | | | | 09/21/2011 | | | | 10,000,000 | | | | 10,000,000 | |
National Bank of Canada± | | | 0.36 | | | | 10/07/2011 | | | | 55,000,000 | | | | 55,000,000 | |
Natixis NY Branch± | | | 0.50 | | | | 08/08/2011 | | | | 56,000,000 | | | | 56,000,000 | |
Nordea Bank Funding plc | | | 0.15 | | | | 09/14/2011 | | | | 10,000,000 | | | | 10,000,000 | |
Nordea Bank Funding plc | | | 0.15 | | | | 09/19/2011 | | | | 9,000,000 | | | | 9,000,000 | |
Norinchukin Bank | | | 0.15 | | | | 08/01/2011 | | | | 12,000,000 | | | | 12,000,000 | |
Norinchukin Bank | | | 0.15 | | | | 08/02/2011 | | | | 21,000,000 | | | | 21,000,000 | |
Rabobank Nederland NV± | | | 0.27 | | | | 12/06/2011 | | | | 34,000,000 | | | | 34,000,000 | |
Rabobank Nederland NV± | | | 0.27 | | | | 10/21/2011 | | | | 28,000,000 | | | | 28,000,000 | |
Rabobank Nederland NV± | | | 0.28 | | | | 04/24/2012 | | | | 20,000,000 | | | | 19,999,257 | |
Royal Bank of Scotland plc± | | | 0.44 | | | | 10/31/2011 | | | | 26,000,000 | | | | 26,000,000 | |
Royal Bank of Scotland plc± | | | 0.47 | | | | 09/13/2011 | | | | 29,000,000 | | | | 29,000,000 | |
Skandinaviska Enskilda Banken AB | | | 0.20 | | | | 09/15/2011 | | | | 20,000,000 | | | | 20,000,000 | |
Skandinaviska Enskilda Banken AB | | | 0.20 | | | | 09/19/2011 | | | | 5,000,000 | | | | 5,000,000 | |
Skandinaviska Enskilda Banken AB | | | 0.24 | | | | 09/01/2011 | | | | 8,000,000 | | | | 8,000,000 | |
Societe Generale (New York) | | | 0.51 | | | | 08/12/2011 | | | | 50,000,000 | | | | 50,000,000 | |
Sumitomo Trust & Banking Corporation | | | 0.14 | | | | 08/03/2011 | | | | 45,000,000 | | | | 45,000,000 | |
Sumitomo Trust & Banking Corporation | | | 0.15 | | | | 08/02/2011 | | | | 24,000,000 | | | | 24,000,000 | |
Sumitomo Trust & Banking Corporation | | | 0.15 | | | | 08/04/2011 | | | | 20,000,000 | | | | 20,000,000 | |
Svenska Handsbanken AB | | | 0.17 | | | | 08/04/2011 | | | | 20,000,000 | | | | 20,000,008 | |
Toronto-Dominion Bank | | | 0.12 | | | | 08/19/2011 | | | | 10,000,000 | | | | 10,000,000 | |
Toronto-Dominion Bank | | | 0.12 | | | | 08/22/2011 | | | | 9,000,000 | | | | 9,000,000 | |
Toronto-Dominion Bank | | | 0.17 | | | | 08/02/2011 | | | | 10,000,000 | | | | 10,000,017 | |
| | | | |
Total Certificates of Deposit (Cost $1,019,499,405) | | | | | | | | | | | | | | | 1,019,499,405 | |
| | | | | | | | | | | | | | | | |
| | | | |
Commercial Paper: 46.41% | | | | | | | | | | | | | | | | |
| | | | |
| Asset-Backed Commercial Paper: 31.72% | | | | | | | | | | | | | | | | |
Alpine Securitzation Corporation††^ | | | 0.13 | | | | 08/19/2011 | | | | 13,000,000 | | | | 12,999,090 | |
Alpine Securitzation Corporation††^ | | | 0.13 | | | | 08/23/2011 | | | | 7,000,000 | | | | 6,999,401 | |
Alpine Securitzation Corporation††^ | | | 0.13 | | | | 08/26/2011 | | | | 11,000,000 | | | | 10,998,931 | |
Amsterdam Funding Corporation††^ | | | 0.15 | | | | 08/25/2011 | | | | 3,000,000 | | | | 2,999,680 | |
Amsterdam Funding Corporation††^ | | | 0.15 | | | | 08/30/2011 | | | | 12,000,000 | | | | 11,998,453 | |
Amsterdam Funding Corporation††^ | | | 0.22 | | | | 08/22/2011 | | | | 3,000,000 | | | | 2,999,598 | |
| | | | | | |
| Portfolio of Investments—July 31, 2011 (Unaudited) | | Wells Fargo Advantage Prime Investment Money Market Fund | | | 9 | |
| | | | | | | | | | | | | | | | |
| Security Name | | Interest Rate | | | Maturity Date | | | Principal | | | Value | |
| | | | | | | | | | | | | | | | |
| | | | |
| Asset-Backed Commercial Paper (continued) | | | | | | | | | | | | | | | | |
Antalis US Funding Corporation††^ | | | 0.00 | % | | | 08/01/2011 | | | $ | 31,000,000 | | | $ | 31,000,000 | |
Arabella Finance LLC††^ | | | 0.38 | | | | 08/08/2011 | | | | 6,000,000 | | | | 5,999,498 | |
Argento Funding Companies Limited††^ | | | 0.17 | | | | 08/24/2011 | | | | 35,000,000 | | | | 34,995,783 | |
Argento Funding Companies Limited††^ | | | 0.19 | | | | 08/04/2011 | | | | 4,000,000 | | | | 3,999,917 | |
Argento Funding Companies Limited††^ | | | 0.21 | | | | 09/07/2011 | | | | 4,000,000 | | | | 3,999,096 | |
Argento Funding Companies Limited††^ | | | 0.21 | | | | 09/09/2011 | | | | 7,000,000 | | | | 6,998,332 | |
Argento Funding Companies Limited††^ | | | 0.23 | | | | 08/09/2011 | | | | 9,000,000 | | | | 8,999,480 | |
Argento Funding Companies Limited††^ | | | 0.23 | | | | 08/17/2011 | | | | 8,000,000 | | | | 7,999,147 | |
Aspen Funding Corporation††^ | | | 0.16 | | | | 08/11/2011 | | | | 5,000,000 | | | | 4,999,750 | |
Atlantic Asset Securitization Corporation††^ | | | 0.11 | | | | 08/02/2011 | | | | 8,000,000 | | | | 7,999,951 | |
Autobahn Funding Company††^ | | | 0.00 | | | | 08/01/2011 | | | | 12,000,000 | | | | 12,000,000 | |
Barton Capital Corporation††^ | | | 0.00 | | | | 08/01/2011 | | | | 76,000,000 | | | | 76,000,000 | |
Bryant Park Funding LLC††^ | | | 0.14 | | | | 08/22/2011 | | | | 16,000,000 | | | | 15,998,600 | |
Bryant Park Funding LLC††^ | | | 0.14 | | | | 08/24/2011 | | | | 3,000,000 | | | | 2,999,713 | |
CAFCO LLC††^ | | | 0.17 | | | | 09/20/2011 | | | | 11,000,000 | | | | 10,997,403 | |
Cancara Asset Securitization LLC††^ | | | 0.15 | | | | 08/10/2011 | | | | 4,000,000 | | | | 3,999,830 | |
Cancara Asset Securitization LLC††^ | | | 0.18 | | | | 08/30/2011 | | | | 19,000,000 | | | | 18,997,092 | |
Cancara Asset Securitization LLC††^ | | | 0.20 | | | | 09/07/2011 | | | | 8,000,000 | | | | 7,998,273 | |
Cancara Asset Securitization LLC††^ | | | 0.20 | | | | 09/08/2011 | | | | 16,000,000 | | | | 15,996,453 | |
Cancara Asset Securitization LLC††^ | | | 0.21 | | | | 08/08/2011 | | | | 2,000,000 | | | | 1,999,907 | |
Cancara Asset Securitization LLC††^ | | | 0.21 | | | | 09/20/2011 | | | | 6,000,000 | | | | 5,998,250 | |
Cancara Asset Securitization LLC††^ | | | 0.25 | | | | 09/19/2011 | | | | 25,000,000 | | | | 24,991,493 | |
Chariot Funding LLC††^ | | | 0.12 | | | | 08/15/2011 | | | | 35,000,000 | | | | 34,998,153 | |
Charta LLC††^ | | | 0.19 | | | | 09/09/2011 | | | | 9,000,000 | | | | 8,998,148 | |
Charta LLC††^ | | | 0.24 | | | | 08/26/2011 | | | | 7,380,000 | | | | 7,378,719 | |
Charta LLC††^ | | | 0.24 | | | | 08/30/2011 | | | | 9,000,000 | | | | 8,998,188 | |
Concord Minuteman Capital Company††^ | | | 0.36 | | | | 08/09/2011 | | | | 8,000,000 | | | | 7,999,289 | |
Concord Minuteman Capital Company††^ | | | 0.38 | | | | 08/16/2011 | | | | 5,000,000 | | | | 4,999,167 | |
Concord Minuteman Capital Company††^ | | | 0.38 | | | | 08/17/2011 | | | | 15,000,000 | | | | 14,997,333 | |
Concord Minuteman Capital Company††^ | | | 0.39 | | | | 08/26/2011 | | | | 5,000,000 | | | | 4,998,611 | |
Concord Minuteman Capital Company††^ | | | 0.39 | | | | 08/29/2011 | | | | 18,000,000 | | | | 17,994,400 | |
CRC Funding LLC††^ | | | 0.17 | | | | 09/19/2011 | | | | 7,000,000 | | | | 6,998,380 | |
CRC Funding LLC††^ | | | 0.24 | | | | 08/26/2011 | | | | 9,000,000 | | | | 8,998,438 | |
Crown Point Capital Company††^ | | | 0.27 | | | | 08/03/2011 | | | | 2,000,000 | | | | 1,999,956 | |
Crown Point Capital Company††^ | | | 0.36 | | | | 08/10/2011 | | | | 6,000,000 | | | | 5,999,400 | |
Crown Point Capital Company††^ | | | 0.36 | | | | 08/11/2011 | | | | 5,000,000 | | | | 4,999,444 | |
Crown Point Capital Company††^ | | | 0.38 | | | | 08/17/2011 | | | | 10,000,000 | | | | 9,998,222 | |
Crown Point Capital Company††^ | | | 0.38 | | | | 08/18/2011 | | | | 8,000,000 | | | | 7,998,489 | |
Crown Point Capital Company††^ | | | 0.39 | | | | 08/26/2011 | | | | 6,000,000 | | | | 5,998,333 | |
Fairway Finance Corporation††^ | | | 0.21 | | | | 09/06/2011 | | | | 14,000,000 | | | | 13,996,920 | |
Falcon Asset Securitization Corporation LLC††^ | | | 0.10 | | | | 08/05/2011 | | | | 6,000,000 | | | | 5,999,913 | |
Falcon Asset Securitization Corporation LLC††^ | | | 0.13 | | | | 08/18/2011 | | | | 6,000,000 | | | | 5,999,603 | |
Gemini Securitization Corporation LLC††^ | | | 0.15 | | | | 08/03/2011 | | | | 7,000,000 | | | | 6,999,912 | |
Gemini Securitization Corporation LLC††^ | | | 0.16 | | | | 08/09/2011 | | | | 8,000,000 | | | | 7,999,680 | |
Gemini Securitization Corporation LLC††^ | | | 0.17 | | | | 08/04/2011 | | | | 1,000,000 | | | | 999,981 | |
Gemini Securitization Corporation LLC††^ | | | 0.20 | | | | 09/14/2011 | | | | 11,000,000 | | | | 10,997,311 | |
Govco LLC††^ | | | 0.21 | | | | 08/22/2011 | | | | 20,000,000 | | | | 19,997,433 | |
Grampian Funding LLC††^ | | | 0.17 | | | | 08/16/2011 | | | | 10,000,000 | | | | 9,999,250 | |
Grampian Funding LLC††^ | | | 0.21 | | | | 09/08/2011 | | | | 11,000,000 | | | | 10,997,446 | |
Grampian Funding LLC††^ | | | 0.23 | | | | 08/15/2011 | | | | 13,000,000 | | | | 12,998,716 | |
Grampian Funding LLC††^ | | | 0.24 | | | | 08/10/2011 | | | | 17,000,000 | | | | 16,998,848 | |
| | | | |
| 10 | | Wells Fargo Advantage Prime Investment Money Market Fund | | Portfolio of Investments—July 31, 2011 (Unaudited) |
| | | | | | | | | | | | | | | | |
| Security Name | | Interest Rate | | | Maturity Date | | | Principal | | | Value | |
| | | | | | | | | | | | | | | | |
| | | | |
| Asset-Backed Commercial Paper (continued) | | | | | | | | | | | | | | | | |
Grampian Funding LLC††^ | | | 0.34 | % | | | 09/02/2011 | | | $ | 14,000,000 | | | $ | 14,001,412 | |
Grampian Funding LLCl††^ | | | 0.23 | | | | 08/11/2011 | | | | 5,000,000 | | | | 4,999,653 | |
Jupiter Securitization Company LLC††^ | | | 0.12 | | | | 08/15/2011 | | | | 15,000,000 | | | | 14,999,242 | |
Jupiter Securitization Company LLC††^ | | | 0.13 | | | | 08/12/2011 | | | | 5,000,000 | | | | 4,999,786 | |
Kells Funding LLC††± | | | 0.33 | | | | 11/29/2011 | | | | 40,000,000 | | | | 40,000,000 | |
Legacy Capital Company††^ | | | 0.37 | | | | 08/12/2011 | | | | 7,000,000 | | | | 6,999,144 | |
Legacy Capital Company††^ | | | 0.39 | | | | 08/26/2011 | | | | 10,000,000 | | | | 9,997,222 | |
Lexington Parker Capital Company LLC††^ | | | 0.30 | | | | 08/04/2011 | | | | 18,000,000 | | | | 17,999,400 | |
Lexington Parker Capital Company LLC††^ | | | 0.35 | | | | 08/08/2011 | | | | 5,000,000 | | | | 4,999,611 | |
Lexington Parker Capital Company LLC††^ | | | 0.36 | | | | 08/11/2011 | | | | 5,000,000 | | | | 4,999,444 | |
Lexington Parker Capital Company LLC††^ | | | 0.38 | | | | 08/16/2011 | | | | 7,000,000 | | | | 6,998,833 | |
Lexington Parker Capital Company LLC††^ | | | 0.38 | | | | 08/23/2011 | | | | 8,000,000 | | | | 7,998,044 | |
Liberty Funding LLC††^ | | | 0.14 | | | | 08/25/2011 | | | | 10,000,000 | | | | 9,999,000 | |
LMA Americas LLC††^ | | | 0.00 | | | | 08/01/2011 | | | | 64,000,000 | | | | 64,000,000 | |
LMA Americas LLC††^ | | | 0.22 | | | | 08/24/2011 | | | | 1,200,000 | | | | 1,199,824 | |
Matchpoint Master Trust†† | | | 0.00 | | | | 08/01/2011 | | | | 40,000,000 | | | | 40,000,000 | |
Metlife Short Term Funding LLC††^ | | | 0.14 | | | | 08/17/2011 | | | | 6,000,000 | | | | 5,999,600 | |
Metlife Short Term Funding LLC††^ | | | 0.14 | | | | 08/18/2011 | | | | 13,000,000 | | | | 12,999,079 | |
Metlife Short Term Funding LLC††^ | | | 0.21 | | | | 08/11/2011 | | | | 3,000,000 | | | | 2,999,808 | |
Mont Blanc Capital Corporation††^ | | | 0.19 | | | | 08/08/2011 | | | | 4,000,000 | | | | 3,999,829 | |
Mont Blanc Capital Corporation††^ | | | 0.20 | | | | 09/06/2011 | | | | 5,000,000 | | | | 4,998,950 | |
Mont Blanc Capital Corporation††^ | | | 0.20 | | | | 09/07/2011 | | | | 2,000,000 | | | | 1,999,568 | |
Mont Blanc Capital Corporation††^ | | | 0.20 | | | | 09/09/2011 | | | | 3,000,000 | | | | 2,999,318 | |
Mont Blanc Capital Corporation††^ | | | 0.20 | | | | 09/14/2011 | | | | 13,000,000 | | | | 12,996,822 | |
Newport Funding Corporation††^ | | | 0.16 | | | | 08/10/2011 | | | | 4,000,000 | | | | 3,999,820 | |
Newport Funding Corporation††^ | | | 0.24 | | | | 09/23/2011 | | | | 4,000,000 | | | | 3,998,587 | |
Nieuw Amsterdam Receivables Corporation††^ | | | 0.00 | | | | 08/01/2011 | | | | 4,000,000 | | | | 4,000,000 | |
Nieuw Amsterdam Receivables Corporation††^ | | | 0.15 | | | | 08/03/2011 | | | | 3,000,000 | | | | 2,999,962 | |
Nieuw Amsterdam Receivables Corporation††^ | | | 0.17 | | | | 08/04/2011 | | | | 5,000,000 | | | | 4,999,904 | |
Nieuw Amsterdam Receivables Corporation††^ | | | 0.18 | | | | 08/05/2011 | | | | 1,000,000 | | | | 999,976 | |
Nieuw Amsterdam Receivables Corporation††^ | | | 0.18 | | | | 08/16/2011 | | | | 1,000,000 | | | | 999,921 | |
Nieuw Amsterdam Receivables Corporation††^ | | | 0.18 | | | | 09/08/2011 | | | | 3,000,000 | | | | 2,999,430 | |
Nieuw Amsterdam Receivables Corporation††^ | | | 0.20 | | | | 08/09/2011 | | | | 1,000,000 | | | | 999,951 | |
Northern Pines Funding LLC††^ | | | 0.15 | | | | 08/11/2011 | | | | 3,000,000 | | | | 2,999,867 | |
Northern Pines Funding LLC††^ | | | 0.24 | | | | 09/06/2011 | | | | 9,000,000 | | | | 8,997,750 | |
Northern Pines Funding LLC††^ | | | 0.30 | | | | 08/23/2011 | | | | 8,000,000 | | | | 7,998,484 | |
Old Line Funding LLC††^ | | | 0.14 | | | | 08/29/2011 | | | | 14,000,000 | | | | 13,998,476 | |
Regency Markets #1 LLC††^ | | | 0.14 | | | | 08/11/2011 | | | | 6,000,000 | | | | 5,999,750 | |
Regency Markets #1 LLC††^ | | | 0.14 | | | | 08/17/2011 | | | | 15,000,000 | | | | 14,999,000 | |
Rhein-Main Security Limited††^ | | | 0.41 | | | | 09/13/2011 | | | | 12,000,000 | | | | 11,993,980 | |
Rhein-Main Security Limited††^ | | | 0.42 | | | | 09/06/2011 | | | | 7,000,000 | | | | 6,996,990 | |
Rhein-Main Security Limited††^ | | | 0.42 | | | | 09/23/2011 | | | | 5,000,000 | | | | 4,996,835 | |
Rheingold Securitization Limited††^ | | | 0.41 | | | | 09/06/2011 | | | | 11,000,000 | | | | 10,995,310 | |
Rheingold Securitization Limited††^ | | | 0.41 | | | | 09/16/2011 | | | | 7,000,000 | | | | 6,996,243 | |
Salisbury Receivables Company LLC††^ | | | 0.14 | | | | 08/22/2011 | | | | 4,000,000 | | | | 3,999,650 | |
Salisbury Receivables Company LLC††^ | | | 0.15 | | | | 08/12/2011 | | | | 1,000,000 | | | | 999,951 | |
Salisbury Receivables Company LLC††^ | | | 0.15 | | | | 08/18/2011 | | | | 3,000,000 | | | | 2,999,773 | |
Salisbury Receivables Company LLC††^ | | | 0.15 | | | | 08/29/2011 | �� | | | 2,000,000 | | | | 1,999,751 | |
Scaldis Capital LLC††^ | | | 0.00 | | | | 08/01/2011 | | | | 2,000,000 | | | | 2,000,000 | |
Scaldis Capital LLC††^ | | | 0.20 | | | | 08/09/2011 | | | | 3,000,000 | | | | 2,999,853 | |
Sheffield Receivables Corporation††^ | | | 0.14 | | | | 08/25/2011 | | | | 13,000,000 | | | | 12,998,700 | |
| | | | | | |
| Portfolio of Investments—July 31, 2011 (Unaudited) | | Wells Fargo Advantage Prime Investment Money Market Fund | | | 11 | |
| | | | | | | | | | | | | | | | |
| Security Name | | Interest Rate | | | Maturity Date | | | Principal | | | Value | |
| | | | | | | | | | | | | | | | |
| | | | |
| Asset-Backed Commercial Paper (continued) | | | | | | | | | | | | | | | | |
Sheffield Receivables Corporation††^ | | | 0.15 | % | | | 08/15/2011 | | | $ | 1,000,000 | | | $ | 999,938 | |
Sheffield Receivables Corporation††^ | | | 0.17 | | | | 09/26/2011 | | | | 3,000,000 | | | | 2,999,207 | |
Sheffield Receivables Corporation††^ | | | 0.17 | | | | 09/27/2011 | | | | 20,000,000 | | | | 19,994,617 | |
Sheffield Receivables Corporation††^ | | | 0.18 | | | | 10/03/2011 | | | | 20,000,000 | | | | 19,993,700 | |
Solitaire Funding LLC††^ | | | 0.15 | | | | 08/16/2011 | | | | 2,000,000 | | | | 1,999,867 | |
Solitaire Funding LLC††^ | | | 0.15 | | | | 08/25/2011 | | | | 4,000,000 | | | | 3,999,573 | |
Solitaire Funding LLC††^ | | | 0.16 | | | | 08/30/2011 | | | | 15,000,000 | | | | 14,997,946 | |
Solitaire Funding LLC††^ | | | 0.20 | | | | 09/09/2011 | | | | 15,000,000 | | | | 14,996,588 | |
Solitaire Funding LLC††^ | | | 0.21 | | | | 08/09/2011 | | | | 5,000,000 | | | | 4,999,733 | |
Solitaire Funding LLC††^ | | | 0.21 | | | | 09/02/2011 | | | | 10,000,000 | | | | 9,998,044 | |
Surrey Funding Corporation††^ | | | 0.14 | | | | 08/09/2011 | | | | 3,000,000 | | | | 2,999,893 | |
Surrey Funding Corporation††^ | | | 0.15 | | | | 08/30/2011 | | | | 11,000,000 | | | | 10,998,582 | |
Surrey Funding Corporation††^ | | | 0.19 | | | | 09/07/2011 | | | | 7,000,000 | | | | 6,998,561 | |
Sydney Capital Corporation††^ | | | 0.30 | | | | 08/10/2011 | | | | 1,000,000 | | | | 999,918 | |
Sydney Capital Corporation††^ | | | 0.34 | | | | 09/12/2011 | | | | 6,000,000 | | | | 5,997,550 | |
Sydney Capital Corporation††^ | | | 0.34 | | | | 09/14/2011 | | | | 6,000,000 | | | | 5,997,433 | |
Sydney Capital Corporation††^ | | | 0.34 | | | | 09/16/2011 | | | | 7,000,000 | | | | 6,996,869 | |
Tasman Funding Incorporated††^ | | | 0.16 | | | | 08/11/2011 | | | | 5,000,000 | | | | 4,999,750 | |
Tasman Funding Incorporated††^ | | | 0.18 | | | | 08/16/2011 | | | | 6,000,000 | | | | 5,999,525 | |
Tasman Funding Incorporated††^ | | | 0.18 | | | | 08/18/2011 | | | | 7,000,000 | | | | 6,999,372 | |
Tasman Funding Incorporated††^ | | | 0.18 | | | | 08/24/2011 | | | | 6,000,000 | | | | 5,999,272 | |
Tasman Funding Incorporated††^ | | | 0.23 | | | | 08/17/2011 | | | | 3,000,000 | | | | 2,999,680 | |
Thames Asset Global Securitization #1 Incorporated††^ | | | 0.14 | | | | 08/10/2011 | | | | 30,000,000 | | | | 29,998,650 | |
Thames Asset Global Securitization #1 Incorporated††^ | | | 0.15 | | | | 08/12/2011 | | | | 2,000,000 | | | | 1,999,902 | |
Thames Asset Global Securitization #1 Incorporated††^ | | | 0.16 | | | | 08/18/2011 | | | | 16,947,000 | | | | 16,945,639 | |
Thames Asset Global Securitization #1 Incorporated††^ | | | 0.16 | | | | 08/23/2011 | | | | 3,000,000 | | | | 2,999,688 | |
Thames Asset Global Securitization #1 Incorporated††^ | | | 0.16 | | | | 08/25/2011 | | | | 16,000,000 | | | | 15,998,187 | |
Versailles CDS LLC††^ | | | 0.20 | | | | 08/05/2011 | | | | 19,000,000 | | | | 18,999,472 | |
Windmill Funding Corporation††^ | | | 0.12 | | | | 08/03/2011 | | | | 1,000,000 | | | | 999,990 | |
Windmill Funding Corporation††^ | | | 0.15 | | | | 08/23/2011 | | | | 7,000,000 | | | | 6,999,316 | |
Windmill Funding Corporation††^ | | | 0.22 | | | | 08/22/2011 | | | | 5,000,000 | | | | 4,999,329 | |
Working Capital Management Company††^ | | | 0.15 | | | | 08/03/2011 | | | | 10,000,000 | | | | 9,999,872 | |
| | | | |
| | | | | | | | | | | | | | | 1,379,357,970 | |
| | | | | | | | | | | | | | | | |
| | | | |
| Financial Company Commerical Paper: 11.40% | | | | | | | | | | | | | | | | |
ABN AMRO Funding USA LLC††^ | | | 0.18 | | | | 08/15/2011 | | | | 6,000,000 | | | | 5,999,557 | |
ABN AMRO Funding USA LLC††^ | | | 0.18 | | | | 08/17/2011 | | | | 10,000,000 | | | | 9,999,155 | |
ABN AMRO Funding USA LLC††^ | | | 0.18 | | | | 08/19/2011 | | | | 3,000,000 | | | | 2,999,715 | |
ABN AMRO Funding USA LLC††^ | | | 0.20 | | | | 08/05/2011 | | | | 6,000,000 | | | | 5,999,833 | |
ANZ National Limited††± | | | 0.34 | | | | 09/13/2011 | | | | 27,000,000 | | | | 27,000,000 | |
ASB Finance Limited††± | | | 0.35 | | | | 12/02/2011 | | | | 18,000,000 | | | | 18,000,000 | |
ASB Finance Limited††± | | | 0.35 | | | | 12/05/2011 | | | | 18,000,000 | | | | 18,000,000 | |
ASB Finance Limited††± | | | 0.35 | | | | 09/02/2011 | | | | 20,000,000 | | | | 20,000,000 | |
BNZ International Funding Limited††^ | | | 0.15 | | | | 08/10/2011 | | | | 5,000,000 | | | | 4,999,788 | |
BNZ International Funding Limited††^ | | | 0.24 | | | | 09/20/2011 | | | | 4,000,000 | | | | 3,998,667 | |
BNZ International Funding Limited††^ | | | 0.34 | | | | 10/07/2011 | | | | 3,000,000 | | | | 2,999,998 | |
BNZ International Funding Limited††± | | | 0.34 | | | | 10/12/2011 | | | | 11,000,000 | | | | 11,000,109 | |
BNZ International Funding Limited††± | | | 0.35 | | | | 09/01/2011 | | | | 21,000,000 | | | | 21,000,074 | |
Credit Suisse NY^ | | | 0.00 | | | | 08/01/2011 | | | | 15,000,000 | | | | 15,000,000 | |
Credit Suisse NY^ | | | 0.15 | | | | 09/07/2011 | | | | 25,000,000 | | | | 24,996,146 | |
ICICI Bank Limited^ | | | 0.64 | | | | 09/16/2011 | | | | 14,000,000 | | | | 13,988,372 | |
| | | | |
| 12 | | Wells Fargo Advantage Prime Investment Money Market Fund | | Portfolio of Investments—July 31, 2011 (Unaudited) |
| | | | | | | | | | | | | | | | |
| Security Name | | Interest Rate | | | Maturity Date | | | Principal | | | Value | |
| | | | | | | | | | | | | | | | |
| | | | |
| Financial Company Commerical Paper (continued) | | | | | | | | | | | | | | | | |
Nordea North America Incorporated^ | | | 0.15 | % | | | 09/15/2011 | | | $ | 26,000,000 | | | $ | 25,995,125 | |
Nordea North America Incorporated^ | | | 0.15 | | | | 09/22/2011 | | | | 15,000,000 | | | | 14,996,750 | |
PB Financing Incorporated††^ | | | 0.33 | | | | 08/03/2011 | | | | 5,000,000 | | | | 4,999,861 | |
PB Financing Incorporated††^ | | | 0.45 | | | | 08/10/2011 | | | | 2,000,000 | | | | 1,999,750 | |
PB Financing Incorporated††^ | | | 0.47 | | | | 08/22/2011 | | | | 6,000,000 | | | | 5,998,285 | |
PB Financing Incorporated††^ | | | 0.49 | | | | 09/08/2011 | | | | 5,000,000 | | | | 4,997,361 | |
PB Financing Incorporated††^ | | | 0.49 | | | | 09/09/2011 | | | | 5,000,000 | | | | 4,997,292 | |
PB Financing Incorporated††^ | | | 0.50 | | | | 09/16/2011 | | | | 1,000,000 | | | | 999,348 | |
PB Financing Incorporated††^ | | | 0.50 | | | | 09/19/2011 | | | | 1,000,000 | | | | 999,306 | |
PB Financing Incorporated††^ | | | 0.51 | | | | 09/23/2011 | | | | 5,000,000 | | | | 4,996,172 | |
Prudential plc††^ | | | 0.20 | | | | 08/18/2011 | | | | 12,000,000 | | | | 11,998,810 | |
Prudential plc††^ | | | 0.21 | | | | 09/08/2011 | | | | 3,000,000 | | | | 2,999,303 | |
Prudential plc††^ | | | 0.22 | | | | 09/13/2011 | | | | 6,000,000 | | | | 5,998,423 | |
Prudential plc††^ | | | 0.23 | | | | 09/06/2011 | | | | 3,000,000 | | | | 2,999,280 | |
Prudential plc††^ | | | 0.23 | | | | 09/12/2011 | | | | 4,000,000 | | | | 3,998,880 | |
RBS Holdings USA Incorporated^ | | | 0.22 | | | | 08/11/2011 | | | | 3,000,000 | | | | 2,999,800 | |
Skandinaviska Enskilda Banken AB††^ | | | 0.23 | | | | 08/29/2011 | | | | 20,000,000 | | | | 19,996,267 | |
Skandinaviska Enskilda Banken AB††^ | | | 0.23 | | | | 09/08/2011 | | | | 10,000,000 | | | | 9,997,467 | |
Sumitomo Trust & Banking Corporation††^ | | | 0.00 | | | | 08/01/2011 | | | | 22,000,000 | | | | 22,000,000 | |
Suncorp-Metway Limited††^ | | | 0.26 | | | | 08/03/2011 | | | | 13,000,000 | | | | 12,999,722 | |
Suncorp-Metway Limited††^ | | | 0.36 | | | | 08/09/2011 | | | | 10,000,000 | | | | 9,999,111 | |
Suncorp-Metway Limited††^ | | | 0.39 | | | | 09/08/2011 | | | | 15,000,000 | | | | 14,993,667 | |
Suncorp-Metway Limited††^ | | | 0.39 | | | | 09/12/2011 | | | | 4,000,000 | | | | 3,998,133 | |
Swedbank AB^ | | | 0.11 | | | | 08/02/2011 | | | | 7,000,000 | | | | 6,999,957 | |
Swedbank AB^ | | | 0.18 | | | | 08/03/2011 | | | | 14,000,000 | | | | 13,999,790 | |
Swedbank AB^ | | | 0.20 | | | | 08/04/2011 | | | | 14,000,000 | | | | 13,999,685 | |
Westpac Securities NZ Limited††± | | | 0.33 | | | | 08/19/2011 | | | | 31,000,000 | | | | 31,000,000 | |
Westpac Securities NZ Limited††± | | | 0.37 | | | | 10/13/2011 | | | | 28,000,000 | | | | 28,000,000 | |
| | | | |
| | | | | | | | | | | | | | | 495,938,959 | |
| | | | | | | | | | | | | | | | |
| | | | |
| Other Commercial Paper: 3.29% | | | | | | | | | | | | | | | | |
ACTS Retirement Life Communities Incorporated^ | | | 0.22 | | | | 09/15/2011 | | | | 1,000,000 | | | | 999,725 | |
Alaska Housing Finance Corporation^ | | | 0.21 | | | | 08/15/2011 | | | | 2,000,000 | | | | 1,999,821 | |
Caisse D’amortissement de la Dette Sociale††^ | | | 0.22 | | | | 09/28/2011 | | | | 4,000,000 | | | | 3,998,582 | |
Caisse D’amortissement de la Dette Sociale††^ | | | 0.22 | | | | 10/03/2011 | | | | 8,000,000 | | | | 7,996,920 | |
Caisse D’amortissement de la Dette Sociale††^ | | | 0.22 | | | | 10/24/2011 | | | | 23,000,000 | | | | 22,988,193 | |
Caisse D’amortissement de la Dette Sociale††^ | | | 0.23 | | | | 10/11/2011 | | | | 35,000,000 | | | | 34,983,778 | |
EDF SA††^ | | | 0.12 | | | | 08/05/2011 | | | | 4,000,000 | | | | 3,999,933 | |
EDF SA††^ | | | 0.19 | | | | 09/06/2011 | | | | 3,000,000 | | | | 2,999,430 | |
EDF SA††^ | | | 0.19 | | | | 09/07/2011 | | | | 2,000,000 | | | | 1,999,609 | |
Erste Abwicklungsanstalt††^ | | | 0.19 | | | | 08/08/2011 | | | | 10,000,000 | | | | 9,999,572 | |
Erste Abwicklungsanstalt††^ | | | 0.25 | | | | 09/07/2011 | | | | 10,000,000 | | | | 9,997,328 | |
Erste Abwicklungsanstalt††^ | | | 0.25 | | | | 09/14/2011 | | | | 10,000,000 | | | | 9,996,822 | |
Louis Dreyfus Corporation^ | | | 0.00 | | | | 08/01/2011 | | | | 4,000,000 | | | | 4,000,000 | |
SBAB Bank AB††^ | | | 0.16 | | | | 08/02/2011 | | | | 2,000,000 | | | | 1,999,982 | |
SBAB Bank AB††^ | | | 0.20 | | | | 08/03/2011 | | | | 2,000,000 | | | | 1,999,967 | |
SBAB Bank AB††^ | | | 0.24 | | | | 08/04/2011 | | | | 2,000,000 | | | | 1,999,947 | |
SBAB Bank AB††^ | | | 0.27 | | | | 09/01/2011 | | | | 5,000,000 | | | | 4,998,794 | |
SBAB Bank AB††^ | | | 0.27 | | | | 09/09/2011 | | | | 9,000,000 | | | | 8,997,205 | |
SBAB Bank AB††^ | | | 0.29 | | | | 09/13/2011 | | | | 4,000,000 | | | | 3,998,567 | |
Trinity Health Corporation^ | | | 0.00 | | | | 08/01/2011 | | | | 2,000,000 | | | | 2,000,000 | |
| | | | | | |
| Portfolio of Investments—July 31, 2011 (Unaudited) | | Wells Fargo Advantage Prime Investment Money Market Fund | | | 13 | |
| | | | | | | | | | | | | | | | |
| Security Name | | Interest Rate | | | Maturity Date | | | Principal | | | Value | |
| | | | | | | | | | | | | | | | |
| | | | |
| Other Commercial Paper (continued) | | | | | | | | | | | | | | | | |
Trinity Health Corporation^ | | | 0.15 | % | | | 08/16/2011 | | | $ | 1,000,000 | | | $ | 999,933 | |
| | | | |
| | | | | | | | | | | | | | | 142,954,108 | |
| | | | | | | | | | | | | | | | |
| | | | |
Total Commercial Paper (Cost $2,018,251,037) | | | | | | | | | | | | | | | 2,018,251,037 | |
| | | | | | | | | | | | | | | | |
| | | | |
Government Agency Debt: 0.69% | | | | | | | | | | | | | | | | |
FHLMC± | | | 0.11 | | | | 02/02/2012 | | | | 30,000,000 | | | | 29,987,761 | |
| | | | |
Total Government Agency Debt (Cost $29,987,761) | | | | | | | | | | | | | | | 29,987,761 | |
| | | | | | | | | | | | | | | | |
| | | | |
Municipal Bonds and Notes: 13.17% | | | | | | | | | | | | | | | | |
| | | | |
Alabama: 0.90% | | | | | | | | | | | | | | | | |
| | | | |
| Variable Rate Demand Notes§: 0.90% | | | | | | | | | | | | | | | | |
Lower Alabama Gas District Supply Revenue Series A (Utilities Revenue, Societe Generale LOC) | | | 0.13 | | | | 11/01/2027 | | | | 5,000,000 | | | | 5,000,000 | |
Mobile AL Infirmary Health System Special Care Facilities Series A (Hospital Revenue, Bank of Nova Scotia LOC) | | | 0.07 | | | | 02/01/2040 | | | | 10,000,000 | | | | 10,000,000 | |
Southeast Alabama Gas District Alabama Supply Project Series 2007-A (Utilities Revenue) | | | 0.24 | | | | 08/01/2027 | | | | 24,063,000 | | | | 24,063,000 | |
| | | | |
| | | | | | | | | | | | | | | 39,063,000 | |
| | | | | | | | | | | | | | | | |
| | | | |
California: 2.87% | | | | | | | | | | | | | | | | |
| | | | |
| Other Municipal Debt: 0.84% | | | | | | | | | | | | | | | | |
City of San Francisco CA (Miscellaneous Revenue) | | | 0.17 | | | | 09/12/2011 | | | | 3,000,000 | | | | 3,000,000 | |
City of San Francisco CA (Miscellaneous Revenue) | | | 0.18 | | | | 09/12/2011 | | | | 6,000,000 | | | | 6,000,000 | |
City of San Francisco CA (Miscellaneous Revenue) | | | 0.18 | | | | 09/12/2011 | | | | 8,000,000 | | | | 8,000,000 | |
City of San Francisco CA (Miscellaneous Revenue) | | | 0.19 | | | | 08/03/2011 | | | | 1,000,000 | | | | 1,000,000 | |
San Jose CA International Airport (Airport Revenue) | | | 0.22 | | | | 08/02/2011 | | | | 8,000,000 | | | | 8,000,000 | |
San Jose CA International Airport Series F (Airport Revenue) | | | 0.20 | | | | 08/02/2011 | | | | 4,000,000 | | | | 4,000,000 | |
Turlock Irrigation District CA (Miscellaneous Revenue) | | | 0.24 | | | | 10/03/2011 | | | | 6,405,000 | | | | 6,405,000 | |
| | | | |
| | | | | | | | | | | | | | | 36,405,000 | |
| | | | | | | | | | | | | | | | |
| | | | |
| Variable Rate Demand Notes§: 2.03% | | | | | | | | | | | | | | | | |
ABAG Finance Authority for Nonprofit Corporation CA Marin Country Day School (Education Revenue, U.S. Bank NA LOC) | | | 0.06 | | | | 07/01/2037 | | | | 1,000,000 | | | | 1,000,000 | |
Big Bear Lake CA Southwest Gas Corporation Project Series A (Utilities Revenue, KBC Bank NV LOC) | | | 0.09 | | | | 12/01/2028 | | | | 2,000,000 | | | | 2,000,000 | |
California HFA Program Series A (Housing Revenue, FNMA LOC) | | | 0.05 | | | | 08/01/2036 | | | | 3,000,000 | | | | 3,000,000 | |
California HFFA Catholic Healthcare Series L (Health Revenue, CitiBank NA LOC) | | | 0.06 | | | | 07/01/2033 | | | | 3,000,000 | | | | 3,000,000 | |
California State Series A Subseries C-2 (GO-State, Bank of Nova
Scotia LOC) | | | 0.04 | | | | 05/01/2033 | | | | 1,000,000 | | | | 1,000,000 | |
Loma Linda CA Loma Linda University Series B (Education Revenue, Bank of America NA LOC) | | | 0.06 | | | | 12/01/2037 | | | | 5,000,000 | | | | 5,000,000 | |
Los Angeles CA Wastewater Systems Sub-Series F-1 (Water & Sewer Revenue, Bank of America NA LOC) | | | 0.09 | | | | 06/01/2028 | | | | 6,975,000 | | | | 6,975,000 | |
Los Angeles CA Wastewater Systems Sub-Series F-2 (Water & Sewer Revenue, Bank of America NA LOC) | | | 0.09 | | | | 06/01/2032 | | | | 4,515,000 | | | | 4,515,000 | |
Newport Beach CA Hoag Memorial Hospital Series F (Health Revenue, Bank of America NA LOC) | | | 0.06 | | | | 12/01/2040 | | | | 11,000,000 | | | | 11,000,000 | |
Riverside CA COP Riverside Renaissance Project Series 2008 (Lease Revenue, Bank of America NA LOC) | | | 0.09 | | | | 03/01/2037 | | | | 17,690,000 | | | | 17,690,000 | |
| | | | |
| 14 | | Wells Fargo Advantage Prime Investment Money Market Fund | | Portfolio of Investments—July 31, 2011 (Unaudited) |
| | | | | | | | | | | | | | | | |
| Security Name | | Interest Rate | | | Maturity Date | | | Principal | | | Value | |
| | | | | | | | | | | | | | | | |
| | | | |
| Variable Rate Demand Notes§ (continued) | | | | | | | | | | | | | | | | |
Sacramento County CA Sanitation District Financing Authority Subordinate Lien Sacramento Regulation Series C (Water & Sewer Revenue, Bank of America NA LOC) | | | 0.06 | % | | | 12/01/2030 | | | $ | 21,140,000 | | | $ | 21,140,000 | |
San Francisco CA City & County Redevelopment Agency
(Lease Revenue)†† | | | 0.23 | | | | 11/01/2041 | | | | 1,000,000 | | | | 1,000,000 | |
San Jose CA Financing Authority Taxable Land Series F (Lease Revenue, Bank of America NA LOC) | | | 0.14 | | | | 06/01/2034 | | | | 11,000,000 | | | | 11,000,000 | |
| | | | |
| | | | | | | | | | | | | | | 88,320,000 | |
| | | | | | | | | | | | | | | | |
| | | | |
Colorado: 0.67% | | | | | | | | | | | | | | | | |
| | | | |
| Variable Rate Demand Notes§: 0.67% | | | | | | | | | | | | | | | | |
Colorado HFA Class I-B1 (Housing Revenue, GO of Authority Insured) | | | 0.17 | | | | 10/01/2038 | | | | 14,485,000 | | | | 14,485,000 | |
Colorado HFA Taxable Multiple Family Project B 2 (Housing Revenue, FNMA Insured) | | | 0.16 | | | | 05/01/2050 | | | | 9,830,000 | | | | 9,830,000 | |
Colorado Springs CO Utility Improvement Bond Series A (Utilities Revenue) | | | 0.10 | | | | 11/01/2038 | | | | 1,000,000 | | | | 1,000,000 | |
Denver CO Public Schools Series A-4 (Education Revenue, Royal Bank of Canada LOC, AGM Insured) | | | 0.11 | | | | 12/15/2037 | | | | 4,000,000 | | | | 4,000,000 | |
| | | | |
| | | | | | | | | | | | | | | 29,315,000 | |
| | | | | | | | | | | | | | | | |
| | | | |
Delaware: 0.21% | | | | | | | | | | | | | | | | |
| | | | |
| Variable Rate Demand Notes§: 0.21% | | | | | | | | | | | | | | | | |
Delaware State EDA Clean Power Project Series 1997-D (Resource Recovery Revenue) | | | 0.21 | | | | 08/01/2029 | | | | 3,000,000 | | | | 3,000,000 | |
Delaware State EDA Series B (Resource Recovery Revenue) | | | 0.28 | | | | 08/01/2029 | | | | 6,000,000 | | | | 6,000,000 | |
| | | | |
| | | | | | | | | | | | | | | 9,000,000 | |
| | | | | | | | | | | | | | | | |
| | | | |
District of Columbia: 0.39% | | | | | | | | | | | | | | | | |
| | | | |
| Other Municipal Debt: 0.07% | | | | | | | | | | | | | | | | |
District of Columbia (GO-State) | | | 0.26 | | | | 08/01/2011 | | | | 3,000,000 | | | | 3,000,000 | |
| | | | | | | | | | | | | | | | |
| | | | |
| Variable Rate Demand Notes§: 0.32% | | | | | | | | | | | | | | | | |
District of Columbia The American University Series A (Education Revenue, PNC Bank NA LOC) | | | 0.06 | | | | 04/01/2038 | | | | 1,000,000 | | | | 1,000,000 | |
Metropolitan Washington DC Airports Authority Subseries D-1 (Airport Revenue, Bank of America NA LOC) | | | 0.10 | | | | 10/01/2039 | | | | 12,785,000 | | | | 12,785,000 | |
| | | | |
| | | | | | | | | | | | | | | 13,785,000 | |
| | | | | | | | | | | | | | | | |
| | | | |
Florida: 0.14% | | | | | | | | | | | | | | | | |
| | | | |
| Other Municipal Debt: 0.14% | | | | | | | | | | | | | | | | |
Hillsborough County FL (Miscellaneous Revenue) | | | 0.17 | | | | 09/01/2011 | | | | 5,885,000 | | | | 5,885,000 | |
| | | | | | | | | | | | | | | | |
| | | | |
Illinois: 0.49% | | | | | | | | | | | | | | | | |
| | | | |
| Variable Rate Demand Notes§: 0.49% | | | | | | | | | | | | | | | | |
Cook County IL GO Series D-1 (GO-Local) | | | 0.19 | | | | 11/01/2030 | | | | 6,400,000 | | | | 6,400,000 | |
Cook County IL GO Series D-2 (GO-Local) | | | 0.19 | | | | 11/01/2030 | | | | 3,600,000 | | | | 3,600,000 | |
Illinois Finance Authority (Education Revenue) | | | 0.05 | | | | 07/01/2038 | | | | 11,490,000 | | | | 11,490,000 | |
| | | | |
| | | | | | | | | | | | | | | 21,490,000 | |
| | | | | | | | | | | | | | | | |
| | | | | | |
| Portfolio of Investments—July 31, 2011 (Unaudited) | | Wells Fargo Advantage Prime Investment Money Market Fund | | | 15 | |
| | | | | | | | | | | | | | | | |
| Security Name | | Interest Rate | | | Maturity Date | | | Principal | | | Value | |
| | | | | | | | | | | | | | | | |
| | | | |
Indiana: 0.07% | | | | | | | | | | | | | | | | |
| | | | |
| Variable Rate Demand Note§: 0.07% | | | | | | | | | | | | | | | | |
Richmond IN Reid Hospital & Health Care Services Incorporated (Hospital Revenue, AGM Insured) | | | 0.20 | % | | | 01/01/2040 | | | $ | 2,935,000 | | | $ | 2,935,000 | |
| | | | | | | | | | | | | | | | |
| | | | |
Iowa: 0.31% | | | | | | | | | | | | | | | | |
| | | | |
| Variable Rate Demand Note§: 0.31% | | | | | | | | | | | | | | | | |
Iowa Financial Authority SFMR Series C (Housing Revenue, GNMA/FHLMC/FNMA Insured) | | | 0.15 | | | | 01/01/2039 | | | | 13,700,000 | | | | 13,700,000 | |
| | | | | | | | | | | | | | | | |
| | | | |
Louisiana: 0.67% | | | | | | | | | | | | | | | | |
| | | | |
| Other Municipal Debt: 0.02% | | | | | | | | | | | | | | | | |
Louisiana Department of Airport (Airport Revenue) | | | 0.25 | | | | 08/05/2011 | | | | 1,000,000 | | | | 1,000,000 | |
| | | | | | | | | | | | | | | | |
| | | | |
| Variable Rate Demand Notes§: 0.65% | | | | | | | | | | | | | | | | |
East Baton Rouge Parish LA Road & Street Improvement Project Series A (Transportation Revenue, JPMorgan Chase Bank LOC) | | | 0.07 | | | | 08/01/2030 | | | | 15,000,000 | | | | 15,000,000 | |
Louisiana Stadium & Exposition PFOTER (Miscellaneous Revenue)†† | | | 0.34 | | | | 07/01/2036 | | | | 9,000,000 | | | | 9,000,000 | |
Parish of St. James LA Series A-1 (Energy Revenue) | | | 0.08 | | | | 11/01/2040 | | | | 2,000,000 | | | | 2,000,000 | |
Parish of St. James LA Series B-1 (Energy Revenue) | | | 0.10 | | | | 11/01/2040 | | | | 2,000,000 | | | | 2,000,000 | |
| | | | |
| | | | | | | | | | | | | | | 28,000,000 | |
| | | | | | | | | | | | | | | | |
| | | | |
Maryland: 0.22% | | | | | | | | | | | | | | | | |
| | | | |
| Other Municipal Debt: 0.02% | | | | | | | | | | | | | | | | |
Montgomery County MD (GO-Local) | | | 0.24 | | | | 08/01/2011 | | | | 1,000,000 | | | | 1,000,000 | |
| | | | | | | | | | | | | | | | |
| | | | |
| Variable Rate Demand Notes§: 0.20% | | | | | | | | | | | | | | | | |
Baltimore MD Package Systems Facilities (Transportation Revenue, Bank of America NA LOC) | | | 0.13 | | | | 07/01/2032 | | | | 4,775,000 | | | | 4,775,000 | |
Maryland CDA Department of Housing & Community Development Series 2007-J (Housing Revenue) | | | 0.11 | | | | 09/01/2031 | | | | 3,945,000 | | | | 3,945,000 | |
| | | | |
| | | | | | | | | | | | | | | 8,720,000 | |
| | | | | | | | | | | | | | | | |
| | | | |
Massachusetts: 0.68% | | | | | | | | | | | | | | | | |
| | | | |
| Variable Rate Demand Notes§: 0.68% | | | | | | | | | | | | | | | | |
Massachusetts State Department of Transportation Series A6 (Transportation Revenue, GO of Commonwealth Insured) | | | 0.07 | | | | 01/01/2029 | | | | 10,000,000 | | | | 10,000,000 | |
Massachusetts State HEFA (Education Revenue, Bank of America NA LOC) | | | 0.11 | | | | 10/01/2034 | | | | 10,930,000 | | | | 10,930,000 | |
Massachusetts Water Resources Authority Series E (Water & Sewer Revenue, GO of Authority Insured) | | | 0.08 | | | | 08/01/2037 | | | | 8,435,000 | | | | 8,435,000 | |
| | | | |
| | | | | | | | | | | | | | | 29,365,000 | |
| | | | | | | | | | | | | | | | |
| | | | |
Michigan: 0.05% | | | | | | | | | | | | | | | | |
| | | | |
| Variable Rate Demand Note§: 0.05% | | | | | | | | | | | | | | | | |
Wayne County MI IDA (IDR, Bank of America NA LOC) | | | 0.14 | | | | 05/01/2020 | | | | 2,000,000 | | | | 2,000,000 | |
| | | | | | | | | | | | | | | | |
| | | | |
Minnesota: 0.40% | | | | | | | | | | | | | | | | |
| | | | |
| Variable Rate Demand Notes§: 0.40% | | | | | | | | | | | | | | | | |
Minnesota State HFA Residential Housing Series E (Housing Revenue, GO of Agency Insured) | | | 0.18 | | | | 07/01/2038 | | | | 8,045,000 | | | | 8,045,000 | |
Minnesota State HFA Residential Housing Series T (Housing Revenue, GO of Agency Insured) | | | 0.21 | | | | 07/01/2048 | | | | 9,420,000 | | | | 9,420,000 | |
| | | | |
| | | | | | | | | | | | | | | 17,465,000 | |
| | | | | | | | | | | | | | | | |
| | | | |
| 16 | | Wells Fargo Advantage Prime Investment Money Market Fund | | Portfolio of Investments—July 31, 2011 (Unaudited) |
| | | | | | | | | | | | | | | | |
| Security Name | | Interest Rate | | | Maturity Date | | | Principal | | | Value | |
| | | | | | | | | | | | | | | | |
| | | | |
Mississippi: 0.42% | | | | | | | | | | | | | | | | |
| | | | |
| Variable Rate Demand Note§: 0.42% | | | | | | | | | | | | | | | | |
Mississippi State GO Bonds Nissan North America Incorporated Project Series 2003A (Tax Revenue, GO of Commonwealth Insured) | | | 0.13 | % | | | 11/01/2028 | | | $ | 18,295,000 | | | $ | 18,294,274 | |
| | | | | | | | | | | | | | | | |
| | | | |
Nevada: 0.18% | | | | | | | | | | | | | | | | |
| | | | |
| Variable Rate Demand Note§: 0.18% | | | | | | | | | | | | | | | | |
Las Vegas NV EDFA Andre Agassi Foundation Project (Education Revenue, Bank of America NA LOC) | | | 0.09 | | | | 10/01/2035 | | | | 8,000,000 | | | | 8,000,000 | |
| | | | | | | | | | | | | | | | |
| | | | |
New Jersey: 0.84% | | | | | | | | | | | | | | | | |
| | | | |
| Variable Rate Demand Notes§: 0.84% | | | | | | | | | | | | | | | | |
New Jersey EDA NUI Corporation Project Series A (Energy Revenue, JPMorgan Chase Bank LOC) | | | 0.20 | | | | 06/01/2026 | | | | 3,000,000 | | | | 3,000,000 | |
New Jersey EDAPivotal Utility Holdings Incorporated Project Series 2007 (Energy Revenue, JPMorgan Chase Bank LOC) | | | 0.20 | | | | 06/01/2032 | | | | 10,600,000 | | | | 10,600,000 | |
New Jersey HFFA Princeton Healthcare Series A (Hospital Revenue, Bank of America NA LOC) | | | 0.10 | | | | 07/01/2041 | | | | 17,000,000 | | | | 17,000,000 | |
New Jersey State Turnpike Authority Series D (Miscellaneous Revenue, Societe Generale LOC, NATL-RE FGIC Insured) | | | 0.19 | | | | 01/01/2018 | | | | 6,000,000 | | | | 6,000,000 | |
| | | | |
| | | | | | | | | | | | | | | 36,600,000 | |
| | | | | | | | | | | | | | | | |
| | | | |
New York: 0.41% | | | | | | | | | | | | | | | | |
| | | | |
| Other Municipal Debt: 0.16% | | | | | | | | | | | | | | | | |
New York Metropolitan Transportation Authority (Transportation Revenue) | | | 0.19 | | | | 08/03/2011 | | | | 1,000,000 | | | | 1,000,000 | |
New York Metropolitan Transportation Authority (Transportation Revenue) | | | 0.19 | | | | 08/15/2011 | | | | 4,000,000 | | | | 4,000,000 | |
New York Metropolitan Transportation Authority (Transportation Revenue) | | | 0.27 | | | | 08/02/2011 | | | | 2,000,000 | | | | 2,000,000 | |
| | | | |
| | | | | | | | | | | | | | | 7,000,000 | |
| | | | | | | | | | | | | | | | |
| | | | |
| Variable Rate Demand Notes§: 0.25% | | | | | | | | | | | | | | | | |
New York City NY Housing Development Corporation Mortgage Thessalonica Courst A (Housing Revenue, CitiBank NA LOC) | | | 0.10 | | | | 01/01/2036 | | | | 3,940,000 | | | | 3,940,000 | |
New York City NY Subseries B (GO-Local, TD Bank NA LOC) | | | 0.05 | | | | 09/01/2027 | | | | 1,000,000 | | | | 1,000,000 | |
New York Metropolitan Transportation Authority ROC RR 11 R-11645 (Transportation Revenue, FSA Insured)†† | | | 0.23 | | | | 11/15/2025 | | | | 4,025,000 | | | | 4,025,000 | |
New York State Housing Finance Agency Victory Housing Series 2004-A (Housing Revenue, FHLMC Insured) | | | 0.05 | | | | 11/01/2033 | | | | 2,000,000 | | | | 2,000,000 | |
| | | | |
| | | | | | | | | | | | | | | 10,965,000 | |
| | | | | | | | | | | | | | | | |
| | | | |
Oregon: 0.25% | | | | | | | | | | | | | | | | |
| | | | |
| Variable Rate Demand Notes§: 0.25% | | | | | | | | | | | | | | | | |
Forest City OR Residential Management Incorporated PFOTER (Miscellaneous Revenue)†† | | | 0.34 | | | | 07/26/2012 | | | | 7,000,000 | | | | 7,000,000 | |
Oregon Housing & Community Services Department Series E (Housing Revenue) | | | 0.19 | | | | 07/01/2038 | | | | 4,000,000 | | | | 4,000,000 | |
| | | | |
| | | | | | | | | | | | | | | 11,000,000 | |
| | | | | | | | | | | | | | | | |
| | | | | | |
| Portfolio of Investments—July 31, 2011 (Unaudited) | | Wells Fargo Advantage Prime Investment Money Market Fund | | | 17 | |
| | | | | | | | | | | | | | | | |
| Security Name | | Interest Rate | | | Maturity Date | | | Principal | | | Value | |
| | | | | | | | | | | | | | | | |
| | | | |
Pennsylvania: 0.32% | | | | | | | | | | | | | | | | |
| | | | |
| Variable Rate Demand Notes§: 0.32% | | | | | | | | | | | | | | | | |
Lancaster County PA Hospital Authority Health System Lancaster General Hospital (Hospital Revenue, Bank of America NA LOC) | | | 0.25 | % | | | 07/01/2041 | | | $ | 8,840,000 | | | $ | 8,840,000 | |
Pennsylvania Housing Finance Agency Series 85C (Housing Revenue, FNMA LOC) | | | 0.07 | | | | 10/01/2035 | | | | 5,000,000 | | | | 5,000,000 | |
| | | | |
| | | | | | | | | | | | | | | 13,840,000 | |
| | | | | | | | | | | | | | | | |
| | | | |
South Carolina: 0.25% | | | | | | | | | | | | | | | | |
| | | | |
| Other Municipal Debt: 0.25% | | | | | | | | | | | | | | | | |
South Carolina Public Service Authority (Miscellaneous Revenue) | | | 0.18 | | | | 08/16/2011 | | | | 4,000,000 | | | | 4,000,000 | |
South Carolina Public Service Authority (Miscellaneous Revenue) | | | 0.23 | | | | 10/03/2011 | | | | 7,000,000 | | | | 7,000,000 | |
| | | | |
| | | | | | | | | | | | | | | 11,000,000 | |
| | | | | | | | | | | | | | | | |
| | | | |
South Dakota: 0.31% | | | | | | | | | | | | | | | | |
| | | | |
| Variable Rate Demand Notes§: 0.31% | | | | | | | | | | | | | | | | |
South Dakota Housing Development Authority Series C (Housing Revenue, FNMA Insured) | | | 0.17 | | | | 05/01/2037 | | | | 3,000,000 | | | | 3,000,000 | |
South Dakota State HEFA Avera Health Subseries A1 (Health Revenue, U.S. Bank NA LOC) | | | 0.08 | | | | 07/01/2038 | | | | 10,470,000 | | | | 10,470,000 | |
| | | | |
| | | | | | | | | | | | | | | 13,470,000 | |
| | | | | | | | | | | | | | | | |
| | | | |
Tennessee: 0.44% | | | | | | | | | | | | | | | | |
| | | | |
| Variable Rate Demand Notes§: 0.44% | | | | | | | | | | | | | | | | |
Johnson City TN Health & Educational Facilities Board (Health Revenue, U.S. Bank NA LOC) | | | 0.11 | | | | 07/01/2033 | | | | 3,915,000 | | | | 3,915,000 | |
Johnson City TN Health & Educational Facilities Board (Health Revenue, PNC Bank NA LOC) | | | 0.12 | | | | 07/01/2033 | | | | 7,830,000 | | | | 7,830,000 | |
Montgomery County TN Public Building Authority Pooled Financing Revenue (Miscellaneous Revenue, Bank of America NA LOC) | | | 0.24 | | | | 07/01/2034 | | | | 4,600,000 | | | | 4,600,000 | |
Montgomery County TN Public Building Authority Pooled Financing Revenue (Miscellaneous Revenue, Bank of America NA LOC) | | | 0.24 | | | | 02/01/2036 | | | | 2,570,000 | | | | 2,570,000 | |
| | | | |
| | | | | | | | | | | | | | | 18,915,000 | |
| | | | | | | | | | | | | | | | |
| | | | |
Texas: 1.24% | | | | | | | | | | | | | | | | |
| | | | |
| Other Municipal Debt: 0.05% | | | | | | | | | | | | | | | | |
Texas Municipal Power Agency (Utilities Revenue) | | | 0.30 | | | | 08/09/2011 | | | | 2,000,000 | | | | 2,000,000 | |
| | | | | | | | | | | | | | | | |
| | | | |
| Variable Rate Demand Notes§: 1.19% | | | | | | | | | | | | | | | | |
Austin TX Airport System Series A (Airport Revenue, State Street Bank & Trust Company LOC) | | | 0.08 | | | | 11/15/2017 | | | | 1,000,000 | | | | 1,000,000 | |
Harris County TX Cultural Education Facilities Finance Corporation Hermann Health Series A (Miscellaneous Revenue, JPMorgan Chase Bank LOC) | | | 0.20 | | | | 06/01/2038 | | | | 5,000,000 | | | | 5,000,000 | |
JPMorgan Chase PUTTER/DRIVER Trust Series 3812 (Miscellaneous Revenue)†† | | | 0.21 | | | | 08/31/2011 | | | | 27,000,000 | | | | 27,000,000 | |
Mission TX Economic Development Corporation (Miscellaneous Revenue, Bank of America NA LOC) | | | 0.13 | | | | 04/01/2022 | | | | 3,000,000 | | | | 3,000,000 | |
North Texas Higher Education Authority Incorporated (Education Revenue, Lloyds TSB Bank LOC, Guaranteed Student Loans Insured) ± | | | 0.07 | | | | 12/01/2032 | | | | 5,000,000 | | | | 5,000,000 | |
| | | | |
| 18 | | Wells Fargo Advantage Prime Investment Money Market Fund | | Portfolio of Investments—July 31, 2011 (Unaudited) |
| | | | | | | | | | | | | | | | |
| Security Name | | Interest Rate | | | Maturity Date | | | Principal | | | Value | |
| | | | | | | | | | | | | | | | |
| | | | |
| Variable Rate Demand Notes§ (continued) | | | | | | | | | | | | | | | | |
North Texas Tollway Authority (Transportation Revenue, JPMorgan Chase Bank LOC) | | | 0.05 | % | | | 01/01/2049 | | | $ | 7,000,000 | | | $ | 7,000,000 | |
Pasadena TX Independent School District Series B (Education Revenue, AGM Insured) | | | 0.16 | | | | 02/01/2035 | | | | 1,000,000 | | | | 1,000,000 | |
Texas State Taxable Product Development Program Series A (Miscellaneous Revenue) | | | 0.15 | | | | 06/01/2045 | | | | 3,000,000 | | | | 3,000,000 | |
| | | | |
| | | | | | | | | | | | | | | 52,000,000 | |
| | | | | | | | | | | | | | | | |
| | | | |
Wisconsin: 0.42% | | | | | | | | | | | | | | | | |
| | | | |
| Variable Rate Demand Notes§: 0.42% | | | | | | | | | | | | | | | | |
Wisconsin Housing & EDA (Housing Revenue, FNMA LOC, GO of Authority Insured) | | | 0.08 | | | | 09/01/2035 | | | | 2,600,000 | | | | 2,600,000 | |
Wisconsin Housing & EDA (Housing Revenue, GO of Authority Insured) | | | 0.15 | | | | 05/01/2030 | | | | 6,940,000 | | | | 6,940,000 | |
Wisconsin Housing & EDA (Housing Revenue, GO of Authority Insured) | | | 0.15 | | | | 11/01/2030 | | | | 8,865,000 | | | | 8,865,000 | |
| | | | |
| | | | | | | | | | | | | | | 18,405,000 | |
| | | | | | | | | | | | | | | | |
| | | | |
Wyoming: 0.02% | | | | | | | | | | | | | | | | |
| | | | |
| Variable Rate Demand Note§: 0.02% | | | | | | | | | | | | | | | | |
Wyoming Student Loan Corporation Series A-1 (Education Revenue, Royal Bank of Canada LOC) | | | 0.08 | | | | 06/01/2035 | | | | 825,000 | | | | 825,000 | |
| | | | | | | | | | | | | | | | |
| | | | |
Total Municipal Bonds and Notes (Cost $572,762,274) | | | | | | | | | | | | | | | 572,762,274 | |
| | | | | | | | | | | | | | | | |
| | | | |
Other Instruments: 0.70% | | | | | | | | | | | | | | | | |
Alaska Housing Finance Corporation Municipal Commercial Paper^ | | | 0.20 | | | | 08/16/2011 | | | | 1,000,000 | | | | 999,913 | |
Bank of America Bankers Acceptance Note^ | | | 0.20 | | | | 08/31/2011 | | | | 7,000,000 | | | | 6,998,775 | |
ING Bank NV Floating Rate Note††± | | | 0.78 | | | | 02/10/2012 | | | | 5,000,000 | | | | 5,000,000 | |
ING Bank NV Floating Rate Note††± | | | 0.78 | | | | 02/02/2012 | | | | 5,000,000 | | | | 5,000,000 | |
Merrill Lynch Series TNP-003 Special Purpose Entity††± | | | 0.39 | | | | 04/01/2026 | | | | 3,710,000 | | | | 3,710,000 | |
Port of Oakland CA Municipal Commercial Paper^ | | | 0.22 | | | | 09/20/2011 | | | | 2,870,000 | | | | 2,869,125 | |
St. Joseph County IN Municipal Commercial Paper^ | | | 0.16 | | | | 09/01/2011 | | | | 4,003,000 | | | | 4,002,414 | |
Trinity Health Corporation Municipal Commercial Paper^ | | | 0.21 | | | | 09/16/2011 | | | | 2,000,000 | | | | 1,999,463 | |
| | | | |
Total Other Instruments (Cost $30,579,690) | | | | | | | | | | | | | | | 30,579,690 | |
| | | | | | | | | | | | | | | | |
| | | | |
Other Notes: 0.30% | | | | | | | | | | | | | | | | |
| | | | |
| Corporate Bonds and Notes: 0.18% | | | | | | | | | | | | | | | | |
Bear Stearns & Companies Incorporated± | | | 0.47 | | | | 08/15/2011 | | | | 6,000,000 | | | | 6,000,405 | |
Seariver Maritime Incorporated(i)± | | | 0.35 | | | | 10/01/2011 | | | | 2,000,000 | | | | 2,000,000 | |
| | | | |
| | | | | | | | | | | | | | | 8,000,405 | |
| | | | | | | | | | | | | | | | |
| | | | |
| Yankee Corporate Bonds and Notes: 0.12% | | | | | | | | | | | | | | | | |
Eksportfinans ASA± | | | 0.26 | | | | 09/22/2011 | | | | 5,000,000 | | | | 5,000,000 | |
| | | | | | | | | | | | | | | | |
| | | | |
Total Other Notes (Cost $13,000,405) | | | | | | | | | | | | | | | 13,000,405 | |
| | | | | | | | | | | | | | | | |
| | | | |
Repurchase Agreements(z): 4.84% | | | | | | | | | | | | | | | | |
Barclays Capital Incorporated, dated 07/29/2011, maturity value $32,000,453(1) | | | 0.17 | | | | 08/01/2011 | | | | 32,000,000 | | | | 32,000,000 | |
Citigroup Global Markets, dated 07/29/2011, maturity value $32,000,587(2) | | | 0.22 | | | | 08/01/2011 | | | | 32,000,000 | | | | 32,000,000 | |
Deutsche Bank Securities, dated 07/29/2011, maturity value 146,502,442(3) | | | 0.20 | | | | 08/01/2011 | | | | 146,500,000 | | | | 146,500,000 | |
| | | | |
Total Repurchase Agreements (Cost $210,500,000) | | | | | | | | | | | | | | | 210,500,000 | |
| | | | | | | | | | | | | | | | |
| | | | | | |
| Portfolio of Investments—July 31, 2011 (Unaudited) | | Wells Fargo Advantage Prime Investment Money Market Fund | | | 19 | |
| | | | | | | | | | | | | | | | |
| | | Yield | | | Maturity Date | | | Principal | | | Value | |
| | | | | | | | | | | | | | | | |
| | | | |
Treasury Debt: 4.08% | | | | | | | | | | | | | | | | |
US Treasury Bill | | | 0.12 | % | | | 10/06/2011 | | | $ | 57,000,000 | | | $ | 56,987,460 | |
US Treasury Bill | | | 0.15 | | | | 08/25/2011 | | | | 40,000,000 | | | | 39,995,867 | |
US Treasury Bill | | | 0.16 | | | | 08/11/2011 | | | | 21,000,000 | | | | 20,998,950 | |
US Treasury Bill | | | 0.16 | | | | 08/18/2011 | | | | 59,500,000 | | | | 59,495,364 | |
| | | | |
Total Treasury Debt (Cost $177,477,641) | | | | | | | | | | | | | | | 177,477,641 | |
| | | | | | | | | | | | | | | | |
| | | | | | | | |
| Total Investments in Securities | | | | | | | | |
| (Cost $4,072,058,213)* | | | 93.64 | % | | | 4,072,058,213 | |
Other Assets and Liabilities, Net | | | 6.36 | | | | 276,461,808 | |
| | | | | | | | |
| Total Net Assets | | | 100.00 | % | | $ | 4,348,520,021 | |
| | | | | | | | |
| | (1) | U.S. government securities, 3.50% to 5.00%, 11/1/2025 to 7/1/2041, market value including accrued interest is $32,960,000. |
| | (2) | U.S. government securities, 2.375% to 6.50%, 12/1/2017 to 7/1/2041, market value including accrued interest is $32,960,000. |
| | (3) | U.S. government securities, 1.00% to 5.50%, 4/30/2012 to 8/1/2041, market value including accrued interest is $150,692,941. |
| †† | Security that may be resold to “qualified institutional buyers” under Rule 144A or securities offered pursuant to Section 4(2) of the Securities Act of 1933, as amended. |
| § | These securities are subject to a demand feature which reduces the effective maturity. |
| ± | Variable rate investments. |
| ^ | Zero coupon security. Rate represents yield to maturity. |
| * | Cost for federal income tax purposes is substantially the same as for financial reporting purposes. |
The accompanying notes are an integral part of these financial statements.
| | | | |
| 20 | | Wells Fargo Advantage Prime Investment Money Market Fund | | Statement of Assets and Liabilities—July 31, 2011 (Unaudited) |
| | | | |
| | | | |
| |
Assets | | | | |
Investments in unaffiliated securities, at amortized cost | | $ | 4,072,058,213 | |
Cash | | | 217,946,158 | |
Receivable for investments sold | | | 58,977,000 | |
Receivable for interest | | | 524,021 | |
Receivable from adviser | | | 95,700 | |
Prepaid expenses and other assets | | | 85,105 | |
| | | | |
Total assets | | | 4,349,686,197 | |
| | | | |
| |
Liabilities | | | | |
Dividends payable | | | 48,512 | |
Due to other related parties | | | 486,284 | |
Shareholder report expenses payable | | | 172,935 | |
Custodian and accounting fees payable | | | 230,360 | |
Shareholder servicing fees payable | | | 179,039 | |
Accrued expenses and other liabilities | | | 49,046 | |
| | | | |
Total liabilities | | | 1,166,176 | |
| | | | |
Total net assets | | $ | 4,348,520,021 | |
| | | | |
| |
NET ASSETS CONSIST OF | | | | |
Paid-in capital | | $ | 4,348,400,512 | |
Undistributed net investment income | | | 1,278 | |
Accumulated net realized gains on investments | | | 118,231 | |
| | | | |
Total net assets | | $ | 4,348,520,021 | |
| | | | |
| |
COMPUTATION OF NET ASSET VALUE PER SHARE1 | | | | |
Net assets – Institutional Class | | $ | 3,285,789,845 | |
Shares outstanding – Institutional Class | | | 3,285,700,381 | |
Net asset value per share – Institutional Class | | | $1.00 | |
Net assets – Service Class | | $ | 1,062,730,176 | |
Shares outstanding – Service Class | | | 1,062,707,593 | |
Net asset value per share – Service Class | | | $1.00 | |
| 1. | The Fund has an unlimited number of authorized shares. |
The accompanying notes are an integral part of these financial statements.
| | | | | | |
| Statement of Operations—Six Months Ended July 31, 2011 (Unaudited) | | Wells Fargo Advantage Prime Investment Money Market Fund | | | 21 | |
| | | | |
| | | | |
| |
Investment income | | | | |
Interest | | $ | 6,992,652 | |
| | | | |
| |
Expenses | | | | |
Advisory fee | | | 2,528,443 | |
Administration fees | | | | |
Fund level | | | 1,248,727 | |
Institutional Class | | | 1,679,814 | |
Service Class | | | 514,411 | |
Shareholder servicing fees | | | | |
Service Class | | | 1,071,690 | |
Custody and accounting fees | | | 201,646 | |
Professional fees | | | 19,321 | |
Registration fees | | | 7,500 | |
Shareholder report expenses | | | 5,000 | |
Trustees’ fees and expenses | | | 5,245 | |
Other fees and expenses | | | 93,691 | |
| | | | |
Total expenses | | | 7,375,488 | |
Less: Fee waivers and/or expense reimbursements | | | (2,061,678 | ) |
| | | | |
Net expenses | | | 5,313,810 | |
| | | | |
Net investment income | | | 1,678,842 | |
Net realized gains on investments | | | 69,051 | |
| | | | |
Net increase in net assets resulting from operations | | $ | 1,747,893 | |
| | | | |
The accompanying notes are an integral part of these financial statements.
| | | | |
| 22 | | Wells Fargo Advantage Prime Investment Money Market Fund | | Statements of Changes in Net Assets |
| | | | | | | | | | | | | | | | | | | | | | | | |
| | | Six Months Ended
July 31, 2011
(Unaudited) | | | Year Ended
January 31, 20111 | | | Year Ended
February 28, 2010 | |
| | | | | | |
Operations | | | | | | | | | | | | | | | | | | | | | | | | |
Net investment income | | | | | | $ | 1,678,842 | | | | | | | $ | 11,212,443 | | | | | | | $ | 30,910,277 | |
Net realized gains on investments | | | | | | | 69,051 | | | | | | | | 155,696 | | | | | | | | 191,889 | |
| | | | | | | | | | | | | | | | | | | | | | | | |
Net increase in net assets resulting from operations | | | | | | | 1,747,893 | | | | | | | | 11,368,139 | | | | | | | | 31,102,166 | |
| | | | | | | | | | | | | | | | | | | | | | | | |
| | | | | | |
Distributions to shareholders from | | | | | | | | | | | | | | | | | | | | | | | | |
Net investment income | | | | | | | | | | | | | | | | | | | | | | | | |
Institutional Class | | | | | | | (1,635,975 | ) | | | | | | | (11,104,930 | ) | | | | | | | (29,986,894 | ) |
Service Class | | | | | | | (42,867 | ) | | | | | | | (107,513 | ) | | | | | | | (922,105 | ) |
Net realized gains | | | | | | | | | | | | | | | | | | | | | | | | |
Institutional Class | | | | | | | 0 | | | | | | | | (104,612 | ) | | | | | | | (289,017 | ) |
Service Class | | | | | | | 0 | | | | | | | | (8,815 | ) | | | | | | | (25,091 | ) |
| | | | | | | | | | | | | | | | | | | | | | | | |
Total distributions to shareholders | | | | | | | (1,678,842 | ) | | | | | | | (11,325,870 | ) | | | | | | | (31,223,107 | ) |
| | | | | | | | | | | | | | | | | | | | | | | | |
| | | | | | |
| | | Shares | | | | | | Shares | | | | | | Shares | | | | |
| | | | | | |
Capital share transactions | | | | | | | | | | | | | | | | | | | | | | | | |
Proceeds from shares sold | | | | | | | | | | | | | | | | | | | | | | | | |
Institutional Class | | | 15,477,498,423 | | | | 15,477,498,423 | | | | 59,603,512,646 | | | | 59,603,512,646 | | | | 88,393,755,276 | | | | 88,393,755,276 | |
Service Class | | | 25,297,613,045 | | | | 25,297,613,045 | | | | 72,055,123,815 | | | | 72,055,123,815 | | | | 87,384,178,808 | | | | 87,384,178,808 | |
| | | | | | | | | | | | | | | | | | | | | | | | |
| | | | | | | 40,775,111,468 | | | | | | | | 131,658,636,461 | | | | | | | | 175,777,934,084 | |
| | | | | | | | | | | | | | | | | | | | | | | | |
Reinvestment of distributions | | | | | | | | | | | | | | | | | | | | | | | | |
Institutional Class | | | 479,552 | | | | 479,552 | | | | 3,141,542 | | | | 3,141,542 | | | | 10,209,420 | | | | 10,209,420 | |
Service Class | | | 1,790 | | | | 1,790 | | | | 3,332 | | | | 3,332 | | | | 51,310 | | | | 51,310 | |
| | | | | | | | | | | | | | | | | | | | | | | | |
| | | | | | | 481,342 | | | | | | | | 3,144,874 | | | | | | | | 10,260,730 | |
| | | | | | | | | | | | | | | | | | | | | | | | |
Payment for shares redeemed | | | | | | | | | | | | | | | | | | | | | | | | |
Institutional Class | | | (17,134,575,692 | ) | | | (17,134,575,692 | ) | | | (64,789,164,200 | ) | | | (64,789,164,200 | ) | | | (87,701,480,100 | ) | | | (87,701,480,100 | ) |
Service Class | | | (25,090,471,093 | ) | | | (25,090,471,093 | ) | | | (72,100,051,190 | ) | | | (72,100,051,190 | ) | | | (87,710,524,485 | ) | | | (87,710,524,485 | ) |
| | | | | | | | | | | | | | | | | | | | | | | | |
| | | | | | | (42,225,046,785 | ) | | | | | | | (136,889,215,390 | ) | | | | | | | (175,412,004,585 | ) |
| | | | | | | | | | | | | | | | | | | | | | | | |
Net increase (decrease) in net assets resulting from capital share transactions | | | | | | | (1,449,453,975 | ) | | | | | | | (5,227,434,055 | ) | | | | | | | 376,190,229 | |
| | | | | | | | | | | | | | | | | | | | | | | | |
Total increase (decrease) in net assets | | | | | | | (1,449,384,924 | ) | | | | | | | (5,227,391,786 | ) | | | | | | | 376,069,288 | |
| | | | | | | | | | | | | | | | | | | | | | | | |
| | | | | | |
Net assets | | | | | | | | | | | | | | | | | | | | | | | | |
Beginning of period | | | | | | | 5,797,904,945 | | | | | | | | 11,025,296,731 | | | | | | | | 10,649,227,443 | |
| | | | | | | | | | | | | | | | | | | | | | | | |
End of period | | | | | | $ | 4,348,520,021 | | | | | | | $ | 5,797,904,945 | | | | | | | $ | 11,025,296,731 | |
| | | | | | | | | | | | | | | | | | | | | | | | |
Undistributed net investment income | | | | | | $ | 1,278 | | | | | | | $ | 1,278 | | | | | | | $ | 1,278 | |
| | | | | | | | | | | | | | | | | | | | | | | | |
| 1. | For the eleven months ended January 31, 2011. The Fund changed its fiscal year end from February 28 to January 31, effective January 31, 2011. |
The accompanying notes are an integral part of these financial statements.
| | | | | | |
| Financial Highlights | | Wells Fargo Advantage Prime Investment Money Market Fund | | | 23 | |
(For a share outstanding throughout each period)
| | | | | | | | | | | | | | | | | | | | | | | | | | | | |
| | | Six Months Ended
July 31, 2011
(Unaudited) | | | Year Ended
January 31,
20111 | | | Year Ended February 28, | |
| Institutional Class | | | | 2010 | | | 2009 | | | 2008 | | | 2007 | | | 20062 | |
Net asset value, beginning of period | | $ | 1.00 | | | $ | 1.00 | | | $ | 1.00 | | | $ | 1.00 | | | $ | 1.00 | | | $ | 1.00 | | | $ | 1.00 | |
Net investment income | | | 0.00 | 3 | | | 0.00 | 3 | | | 0.00 | 3 | | | 0.02 | | | | 0.05 | | | | 0.05 | | | | 0.03 | |
Net realized gains (losses) on investments | | | 0.00 | 3 | | | 0.00 | 3 | | | 0.00 | 3 | | | 0.00 | | | | 0.00 | | | | 0.00 | | | | 0.00 | |
| | | | | | | | | | | | | | | | | | | | | | | | | | | | |
Total from investment operations | | | 0.00 | 3 | | | 0.00 | 3 | | | 0.00 | 3 | | | 0.02 | | | | 0.05 | | | | 0.05 | | | | 0.03 | |
Distributions to shareholders from | | | | | | | | | | | | | | | | | | | | | | | | | | | | |
Net investment income | | | (0.00 | )3 | | | (0.00 | )3 | | | (0.00 | )3 | | | (0.02 | ) | | | (0.05 | ) | | | (0.05 | ) | | | (0.03 | ) |
Net realized gains | | | 0.00 | | | | (0.00 | )3 | | | (0.00 | )3 | | | (0.00 | )3 | | | 0.00 | | | | 0.00 | | | | 0.00 | |
| | | | | | | | | | | | | | | | | | | | | | | | | | | | |
Total distributions to shareholders | | | (0.00 | )3 | | | (0.00 | )3 | | | (0.00 | )3 | | | (0.02 | ) | | | (0.05 | ) | | | (0.05 | ) | | | (0.03 | ) |
Net asset value, end of period | | | $1.00 | | | | $1.00 | | | | $1.00 | | | | $1.00 | | | | $1.00 | | | | $1.00 | | | | $1.00 | |
Total return4 | | | 0.04 | % | | | 0.13 | % | | | 0.30 | % | | | 2.22 | % | | | 4.99 | % | | | 5.10 | % | | | 3.23 | % |
Ratios to average net assets (annualized) | | | | | | | | | | | | | | | | | | | | | | | | | | | | |
Gross expenses | | | 0.24 | % | | | 0.24 | % | | | 0.27 | % | | | 0.28 | % | | | 0.25 | % | | | 0.26 | % | | | 0.26 | % |
Net expenses | | | 0.20 | % | | | 0.20 | % | | | 0.22 | % | | | 0.23 | % | | | 0.20 | % | | | 0.20 | % | | | 0.20 | % |
Net investment income | | | 0.08 | % | | | 0.13 | % | | | 0.29 | % | | | 2.13 | % | | | 4.87 | % | | | 5.06 | % | | | 3.46 | % |
Supplemental data | | | | | | | | | | | | | | | | | | | | | | | | | | | | |
Net assets, end of period (000’s omitted) | | | $3,285,790 | | | | $4,942,329 | | | | $10,124,807 | | | | $9,422,441 | | | | $7,525,254 | | | | $7,088,329 | | | | $2,889,532 | |
| 1. | For the eleven months ended January 31, 2011. The Fund changed its fiscal year end from February 28 to January 31, effective January 31, 2011. |
| 2. | For the eleven months ended February 28, 2006. The Fund changed its fiscal year end from March 31 to February 28. |
| 3. | Amount is less than $0.005. |
| 4. | Returns for periods of less than one year are not annualized. |
The accompanying notes are an integral part of these financial statements.
| | | | |
| 24 | | Wells Fargo Advantage Prime Investment Money Market Fund | | Financial Highlights |
(For a share outstanding throughout each period)
| | | | | | | | | | | | | | | | | | | | | | | | | | | | |
| | | Six Months Ended
July 31, 2011
(Unaudited) | | | Year Ended
January 31,
20111 | | | Year Ended February 28, | |
| Service Class | | | | 2010 | | | 2009 | | | 2008 | | | 2007 | | | 20062 | |
Net asset value, beginning of period | | $ | 1.00 | | | $ | 1.00 | | | $ | 1.00 | | | $ | 1.00 | | | $ | 1.00 | | | $ | 1.00 | | | $ | 1.00 | |
Net investment income | | | 0.00 | 3 | | | 0.00 | 3 | | | 0.00 | 3 | | | 0.02 | | | | 0.05 | | | | 0.05 | | | | 0.03 | |
Net realized gains (losses) on investments | | | 0.00 | 3 | | | 0.00 | 3 | | | 0.00 | 3 | | | 0.00 | | | | 0.00 | | | | 0.00 | | | | 0.00 | |
| | | | | | | | | | | | | | | | | | | | | | | | | | | | |
Total from investment operations | | | 0.00 | 3 | | | 0.00 | 3 | | | 0.00 | 3 | | | 0.02 | | | | 0.05 | | | | 0.05 | | | | 0.03 | |
Distributions to shareholders from | | | | | | | | | | | | | | | | | | | | | | | | | | | | |
Net investment income | | | (0.00 | )3 | | | (0.00 | )3 | | | (0.00 | )3 | | | (0.02 | ) | | | (0.05 | ) | | | (0.05 | ) | | | (0.03 | ) |
Net realized gains | | | 0.00 | | | | (0.00 | )3 | | | (0.00 | )3 | | | (0.00 | )3 | | | 0.00 | | | | 0.00 | | | | 0.00 | |
| | | | | | | | | | | | | | | | | | | | | | | | | | | | |
Total distributions to shareholders | | | (0.00 | )3 | | | (0.00 | )3 | | | (0.00 | )3 | | | (0.02 | ) | | | (0.05 | ) | | | (0.05 | ) | | | (0.03 | ) |
Net asset value, end of period | | | $1.00 | | | | $1.00 | | | | $1.00 | | | | $1.00 | | | | $1.00 | | | | $1.00 | | | | $1.00 | |
Total return4 | | | 0.00 | % | | | 0.01 | % | | | 0.07 | % | | | 1.87 | % | | | 4.63 | % | | | 4.74 | % | | | 2.90 | % |
Ratios to average net assets (annualized) | | | | | | | | | | | | | | | | | | | | | | | | | | | | |
Gross expenses | | | 0.53 | % | | | 0.53 | % | | | 0.56 | % | | | 0.57 | % | | | 0.55 | % | | | 0.55 | % | | | 0.55 | % |
Net expenses | | | 0.26 | % | | | 0.33 | % | | | 0.45 | % | | | 0.57 | % | | | 0.55 | % | | | 0.55 | % | | | 0.55 | % |
Net investment income | | | 0.01 | % | | | 0.01 | % | | | 0.06 | % | | | 1.83 | % | | | 4.55 | % | | | 4.64 | % | | | 3.18 | % |
Supplemental data | | | | | | | | | | | | | | | | | | | | | | | | | | | | |
Net assets, end of period (000’s omitted) | | | $1,062,730 | | | | $855,576 | | | | $900,490 | | | | $1,226,787 | | | | $1,402,557 | | | | $1,190,293 | | | | $1,332,129 | |
| 1. | For the eleven months ended January 31, 2011. The Fund changed its fiscal year end from February 28 to January 31, effective January 31, 2011. |
| 2. | For the eleven months ended February 28, 2006. The Fund changed its fiscal year end from March 31 to February 28. |
| 3. | Amount is less than $0.005. |
| 4. | Returns for periods of less than one year are not annualized. |
The accompanying notes are an integral part of these financial statements.
| | | | | | |
| Notes to Financial Statements (Unaudited) | | Wells Fargo Advantage Prime Investment Money Market Fund | | | 25 | |
1. ORGANIZATION
Wells Fargo Funds Trust (the “Trust”), a Delaware statutory trust organized on March 10, 1999, is an open-end management investment company registered under the Investment Company Act of 1940, as amended (the “1940 Act”). These financial statements report on Wells Fargo Advantage Prime Investment Money Market Fund (the “Fund”) which is a diversified series of the Trust.
2. SIGNIFICANT ACCOUNTING POLICIES
The following significant accounting policies, which are consistently followed in the preparation of the financial statements of the Fund, are in conformity with U.S. generally accepted accounting principles which require management to make estimates and assumptions that affect the reported amounts of assets and liabilities, disclosure of contingent assets and liabilities at the date of the financial statements, and the reported amounts of revenues and expenses during the reporting period. Actual results could differ from those estimates.
Securities valuation
As permitted under Rule 2a-7 of the 1940 Act, securities are valued at amortized cost, which approximates fair value.
The valuation techniques used by the Fund to measure fair value are consistent with the market approach, income approach and/or cost approach, where applicable, for each security type.
Repurchase agreements
The Fund may invest in repurchase agreements and may participate in pooled repurchase agreement transactions with other funds advised by Wells Fargo Funds Management, LLC. The repurchase agreements must be fully collateralized based on values that are marked-to- market daily. The collateral may be held by an agent bank under a tri-party agreement. It is the custodian’s responsibility to value collateral daily and to take action to obtain additional collateral as necessary to maintain market value equal to or greater than the resale price. The repurchase agreements are collateralized by instruments such as U.S. Treasury, federal agency, or high-grade corporate obligations. There could be potential loss to the Fund in the event that the Fund is delayed or prevented from exercising its rights to dispose of the collateral, including the risk of a possible decline in the value of the underlying obligations during the period in which the Fund seeks to assert its rights.
Security transactions and income recognition
Securities transactions are recorded on a trade date basis. Realized gains or losses are reported on the basis of identified cost of securities delivered.
Interest income is accrued daily and bond discounts are accreted and premiums are amortized daily based on the effective interest method. To the extent debt obligations are placed on non-accrual status, any related interest income may be reduced by writing off interest receivables when the collection of all or a portion of interest has become doubtful based on consistently applied procedures. If the issuer subsequently resumes interest payments or when the collectability of interest is reasonably assured, the debt obligation is removed from non-accrual status.
Distributions to shareholders
Distributions to shareholders from net investment income are accrued daily and paid monthly. Distributions from net realized gains, if any, are recorded on the ex-dividend date. Such distributions are determined in conformity with income tax regulations, which may differ from generally accepted accounting principles.
Federal and other taxes
The Fund intends to continue to qualify as a regulated investment company by distributing substantially all of its investment company taxable income and any net realized capital gains (after reduction for capital loss carryforwards) sufficient to relieve it from all, or substantially all, federal income taxes. Accordingly, no provision for federal income taxes was required.
The Fund’s income and federal excise tax returns and all financial records supporting those returns for the prior three fiscal years are subject to examination by the federal and Delaware revenue authorities.
Under the recently enacted Regulated Investment Company Modernization Act of 2010, the Fund will be permitted to carry forward capital losses incurred in taxable years beginning after December 22, 2010 for an unlimited period. However, any
| | | | |
| 26 | | Wells Fargo Advantage Prime Investment Money Market Fund | | Notes to Financial Statements (Unaudited) |
losses incurred during those future taxable years will be required to be utilized prior to the losses incurred in pre-enactment taxable years. As a result of this ordering rule, pre-enactment capital loss carryforwards may be more likely to expire unused. Additionally, post-enactment capital losses that are carried forward will retain their character as either short-term or long-term capital losses rather than being considered all short-term as under previous law.
Class allocations
The separate classes of shares offered by the Fund differ principally in shareholder servicing and administration fees. Shareholders of each class bear certain expenses that pertain to that particular class. All shareholders bear the common expenses of the Fund, earn income from the portfolio, and are allocated unrealized gains and losses pro rata based on the average daily net assets of each class, without distinction between share classes. Dividends are determined separately for each class based on income and expenses allocable to each class. Realized gains and losses are allocated to each class pro rata based upon the net assets of each class on the date realized. Differences in per share dividend rates generally result from the relative weightings of pro rata income and realized gain allocations and from differences in separate class expenses, including shareholder servicing and administration fees.
3. FAIR VALUATION MEASUREMENTS
Fair value measurements of investments are determined within a framework that has established a fair value hierarchy based upon the various data inputs utilized in determining the value of the Fund’s investments. The three-level hierarchy gives the highest priority to unadjusted quoted prices in active markets for identical assets or liabilities (Level 1) and the lowest priority to unobservable inputs (Level 3). The Fund’s investments are classified within the fair value hierarchy based on the lowest level of input that is significant to the fair value measurement. The inputs are summarized into three broad levels as follows:
| n | | Level 1 – quoted prices in active markets for identical securities |
| n | | Level 2 – other significant observable inputs (including quoted prices for similar securities, interest rates, prepayment speeds, credit risk, etc.) |
| n | | Level 3 – significant unobservable inputs (including the Fund’s own assumptions in determining the fair value of investments) |
The inputs or methodologies used for valuing securities are not necessarily an indication of the risk associated with investing in those securities.
At July 31, 2011, all of the Fund’s investments in securities carried at fair value were designated as Level 2 since the primary inputs include credit quality of the issuer and short-term interest rates which are observable.
Further details on the major security types can be found in the Fund’s Portfolio of Investments.
4. TRANSACTIONS WITH AFFILIATES AND OTHER EXPENSES
Advisory fee
The Trust has entered into an advisory contract with Wells Fargo Funds Management, LLC (“Funds Management”), an indirect wholly owned subsidiary of Wells Fargo & Company (“Wells Fargo”). The adviser is responsible for implementing investment policies and guidelines and for supervising the sub-adviser, who is responsible for day-to-day portfolio management of the Fund.
Pursuant to the contract, Funds Management is entitled to receive an annual rate of 0.10% of the Fund’s average daily net assets.
Funds Management may retain the services of certain sub-advisers to provide daily portfolio management to the Fund. The fees related to sub-advisory services are borne directly by the adviser and do not increase the overall fees paid by the Fund to the adviser. Wells Capital Management Incorporated, an affiliate of Funds Management, is the sub-adviser to the Fund and is entitled to receive a fee from the adviser at an annual rate starting at 0.05% and declining to 0.01% as the average daily net assets of the Fund increase.
Administration and transfer agent fees
The Trust has entered into an administration agreement with Funds Management. Under this agreement, for providing administrative services, which includes paying fees and expenses for services provided by the transfer agent, sub-transfer
| | | | | | |
| Notes to Financial Statements (Unaudited) | | Wells Fargo Advantage Prime Investment Money Market Fund | | | 27 | |
agents, omnibus account servicers and record-keepers, Funds Management is entitled to receive from the Fund an annual fund level administration fee starting at 0.05% and declining to 0.03% as the average daily net assets of the Fund increase and a class level administration fee which is calculated based on the average daily net assets of each class as follows:
| | | | |
| | | Class Level Administration Fee | |
Institutional Class | | | 0.08 | % |
Service Class | | | 0.12 | |
Funds Management has contractually waived and/or reimbursed advisory and administration fees to the extent necessary to maintain certain net operating expense ratios for the Fund. Waiver of fees and/or reimbursement of expenses by Funds Management were made first from fund level expenses on a proportionate basis and then from class specific expenses.
Shareholder servicing fees
The Trust has entered into contracts with one or more shareholder servicing agents, whereby the Service Class is charged a fee at an annual rate of 0.25% of its average daily net assets.
A portion of these total shareholder servicing fees were paid to affiliates of Wells Fargo.
5. INDEMNIFICATION
Under the Trust’s organizational documents, the officers and directors are indemnified against certain liabilities that may arise out of performance of their duties to the Trust. Additionally, in the normal course of business, the Trust may enter into contracts with service providers that contain a variety of indemnification clauses. The Trust’s maximum exposure under these arrangements is dependent on future claims that may be made against the Fund and, therefore, cannot be estimated.
6. NEW ACCOUNTING PRONOUNCEMENTS
In May 2011, the Financial Accounting Standards Board (“FASB”) issued Accounting Standards Update (“ASU”) No. 2011-04 “Amendments to Achieve Common Fair Value Measurement and Disclosure Requirements in U.S. GAAP and IFRSs”. ASU No. 2011-04 amends FASB ASC Topic 820, Fair Value Measurements and Disclosures, to establish common requirements for measuring fair value and for disclosing information about fair value measurements in accordance with GAAP. The ASU is effective prospectively for interim and annual periods beginning after December 15, 2011.
In April 2011, FASB issued ASU No. 2011-03 “Reconsideration of Effective Control for Repurchase Agreements”. ASU No. 2011-03 amends FASB ASC Topic 860, Transfers and Servicing, specifically the criteria required to determine whether a repurchase agreement (repo) and similar agreements should be accounted for as sales of financial assets or secured borrowings with commitments. ASU No. 2011-03 changes the assessment of effective control by focusing on the transferor’s contractual rights and obligations and removing the criterion to assess its ability to exercise those rights or honor those obligations. This could result in changes to the way entities account for certain transactions including repurchase agreements, mortgage dollar rolls and reverse repurchase agreements. The ASU will become effective on a prospective basis for new transfers and modifications to existing transactions as of the beginning of the first interim or annual period beginning on or after December 15, 2011.
As of July 31, 2011, management of the Fund is currently assessing the potential impact, in addition to expanded financial statement disclosure, that may result from adopting these ASUs.
| | | | |
| 28 | | Wells Fargo Advantage Prime Investment Money Market Fund | | Other Information (Unaudited) |
PORTFOLIO HOLDINGS INFORMATION
The complete portfolio holdings for the Fund are publicly available on the Fund’s Web site (www.wellsfargo.com/advantagefunds) on a monthly, seven-day delayed basis. The Fund files its complete schedule of portfolio holdings with the SEC for the first and third quarters of each fiscal year on Form N-Q, which is available without charge by visiting the SEC Web site at www.sec.gov. In addition, the Fund’s Form N-Q may be reviewed and copied at the SEC’s Public Reference Room in Washington, DC, and at regional offices in New York City, at 233 Broadway, and in Chicago, at 175 West Jackson Boulevard, Suite 900. Information about the Public Reference Room may be obtained by calling 1-800-SEC-0330.
PROXY VOTING INFORMATION
A description of the policies and procedures that the Fund uses to determine how to vote proxies relating to portfolio securities is available without charge, upon request, by calling 1-800-222-8222, visiting our Web site at www.wellsfargo.com/advantagefunds, or visiting the SEC Web site at www.sec.gov. Information regarding how the Fund voted proxies relating to portfolio securities during the most recent 12-month period ended June 30 is available without charge on the Fund’s Web site at www.wellsfargo.com/advantagefunds or by visiting the SEC Web site at www.sec.gov.
| | | | | | |
| Other Information (Unaudited) | | Wells Fargo Advantage Prime Investment Money Market Fund | | | 29 | |
BOARD OF TRUSTEES
The following table provides basic information about the Board of Trustees (the “Trustees”) of the Trust and Officers of the Trust. This table should be read in conjunction with the Prospectus and the Statement of Additional Information1 of the Fund. Each of the Trustees and Officers listed below acts in identical capacities for the Wells Fargo Advantage family of funds, which consists of 144 funds comprising the Wells Fargo Funds Trust, Wells Fargo Variable Trust, Wells Fargo Master Trust and four closed-end funds (collectively the “Fund Complex”). All of the Trustees are also Members of the Audit and Governance Committees of each Trust in the Fund Complex. The mailing address of each Trustee and Officer is 525 Market Street, 12th Floor, San Francisco, CA 94105. Each Trustee and Officer serves an indefinite term, however, each Trustee serves such term until reaching the mandatory retirement age established by the Trustees.
Independent Trustees
| | | | | | |
Name and Year of Birth | | Position Held and Length of Service | | Principal Occupations During Past Five Years | | Other Directorships During
Past Five Years |
Peter G. Gordon
(Born 1942) | | Trustee, since 1998; Chairman, since 2005 | | Co-Founder, Chairman, President and CEO of Crystal Geyser. Water Company. Trustee Emeritus, Colby College | | Asset Allocation Trust |
Isaiah Harris, Jr.
(Born 1952) | | Trustee, since 2009 | | Retired. Prior thereto, President and CEO of BellSouth Advertising and Publishing Corp. from 2005 to 2007, President and CEO of BellSouth Enterprises from 2004 to 2005 and President of BellSouth Consumer Services from 2000 to 2003. Emeritus member of the Iowa State University Foundation Board of Governors. Emeritus Member of the Advisory Board of Iowa State University School of Business. Mr. Harris is a certified public accountant. | | CIGNA Corporation; Deluxe Corporation; Asset Allocation Trust |
Judith M. Johnson
(Born 1949) | | Trustee, since 2008 | | Retired. Prior thereto, Chief Executive Officer and Chief Investment Officer of Minneapolis Employees Retirement Fund from 1996 to 2008. Ms. Johnson is an attorney, certified public accountant and a certified managerial accountant. | | Asset Allocation Trust |
Leroy Keith, Jr.
(Born 1939) | | Trustee, since 2010 | | Chairman, Bloc Global Services (development and construction), Trustee of the Evergreen Funds from 1983 to 2010. Former Managing Director, Almanac Capital Management (commodities firm), former Partner, Stonington Partners, Inc. (private equity fund), former Director, Obagi Medical Products Co. and former Director, Lincoln Educational Services. | | Trustee, Virtus Fund Complex (consisting of 45 portfolios as of 12/31/10); Director, Diversapack Co. (packaging company); Asset Allocation Trust |
David F. Larcker
(Born 1950) | | Trustee, since 2009 | | James Irvin Miller Professor of Accounting at the Graduate School of Business, Stanford University, Director of Corporate Governance Research Program and Co-Director of The Rock Center for Corporate Governance since 2006. From 2005 to 2008, Professor of Accounting at the Graduate School of Business, Stanford University. Prior thereto, Ernst & Young Professor of Accounting at The Wharton School, University of Pennsylvania from 1985 to 2005. | | Asset Allocation Trust |
Olivia S. Mitchell
(Born 1953) | | Trustee, since 2006 | | International Foundation of Employee Benefit Plans Professor and Chair of the Department of Insurance and Risk Management, Wharton School of the University of Pennsylvania since 1993. Director of Wharton’s Pension Research Council and Boettner Center on Pensions & Retirement Research, and Research Associate at the National Bureau of Economic Research. Previously, Cornell University Professor from 1978 to 1993. | | Asset Allocation Trust |
| | | | |
| 30 | | Wells Fargo Advantage Prime Investment Money Market Fund | | Other Information (Unaudited) |
| | | | | | |
Name and Year of Birth | | Position Held and Length of Service | | Principal Occupations During Past Five Years | | Other Directorships During
Past Five Years |
Timothy J. Penny
(Born 1951) | | Trustee, since 1996 | | President and CEO of Southern Minnesota Initiative Foundation, a non-profit organization, since 2007 and Senior Fellow at the Humphrey Institute Policy Forum at the University of Minnesota since 1995. Member of the Board of Trustees of NorthStar Education Finance, Inc., a non-profit organization, since 2007. | | Asset Allocation Trust |
Michael S. Scofield
(Born 1943) | | Trustee, since 2010 | | Currently serves on the Investment Company Institute’s Board of Governors and Executive Committee as well the In dependent Director’s Counsel Board of Governors and Executive Committee. Former Chairman of the Independent Directors Counsel. Trustee of the Evergreen Funds from 1984 to 2010. Retired Attorney, Law Offices of Michael S. Scofield and former Director and Chairman, Branded Media Corporation (multi-media branding company). | | Asset Allocation Trust |
Donald C. Willeke
(Born 1940) | | Trustee, since 1996 | | Principal of the law firm of Willeke & Daniels. General Counsel of the Minneapolis Employees Retirement Fund from 1984 until its consolidation into the Minnesota Public Employees Retirement Association on June 30, 2010. | | Asset Allocation Trust |
Officers
| | | | | | |
Name and Year of Birth | | Position Held and
Length of Service | | Principal Occupations During Past Five Years | | |
Karla M. Rabusch
(Born 1959) | | President, since 2003 | | Executive Vice President of Wells Fargo Bank, N.A. and President of Wells Fargo Funds Management, LLC since 2003. Senior Vice President and Chief Administrative Officer of Wells Fargo Funds Management, LLC from 2001 to 2003. | | |
C. David Messman
(Born 1960) | | Secretary, since 2000; Chief Legal Counsel, since 2003 | | Senior Vice President and Secretary of Wells Fargo Funds Management, LLC since 2001. Vice President and Managing Counsel of Wells Fargo Bank, N.A. since 1996. | | |
Kasey Phillips
(Born 1970) | | Treasurer, since 2008 | | Senior Vice President of Wells Fargo Funds Management, LLC since 2009. Senior Vice President of Evergreen Investment Management Company, LLC from 2006 to 2010. Treasurer of the Evergreen Funds from 2005 to 2010. Vice President and Assistant Vice President of Evergreen Investment Services, Inc. from 1999 to 2006. | | |
David Berardi
(Born 1975) | | Assistant Treasurer, since 2009 | | Vice President of Wells Fargo Funds Management, LLC since 2009 . Vice President of Evergreen Investment Management Company, LLC from 2008 to 2010. Assistant Vice President of Evergreen Investment Services, Inc. from 2004 to 2008. Manager of Fund Reporting and Control for Evergreen Investment Management Company, LLC from 2004 to 2010. | | |
Jeremy DePalma
(Born 1974) | | Assistant Treasurer, since 2009 | | Senior Vice President of Wells Fargo Funds Management, LLC since 2009. Senior Vice President of Evergreen Investment Management Company, LLC from 2008 to 2010. Vice President, Evergreen Investment Services, Inc. from 2004 to 2007. Assistant Vice President, Evergreen Investment Services, Inc. from 2000 to 2004 and the head of the Fund Reporting and Control Team within Fund Administration from 2005 to 2010. | | |
Debra Ann Early
(Born 1964) | | Chief Compliance Officer, since 2007 | | Chief Compliance Officer of Wells Fargo Funds Management, LLC since 2007. Chief Compliance Officer of Parnassus Investments from 2005 to 2007. Chief Financial Officer of Parnassus Investments from 2004 to 2007 and Senior Audit Manager of PricewaterhouseCoopers LLP from 1998 to 2004. | | |
| 1. | The Statement of Additional Information includes additional information about the Fund’s Trustees and is available, without charge, upon request, by calling 1-800-222-8222 or by visiting the Fund’s Web site at www.wellsfargo.com/advantagefunds. |
| | | | | | |
| Other Information (Unaudited) | | Wells Fargo Advantage Prime Investment Money Market Fund | | | 31 | |
BOARD CONSIDERATION OF INVESTMENT ADVISORY AND SUB-ADVISORY AGREEMENTS:
100% Treasury Money Market Fund, Cash Investment Money Market Fund, Government Money Market Fund, Heritage Money Market Fund, Money Market Fund, Prime Investment Money Market Fund and Treasury Plus Money Market Fund
(Not all of the funds described in this Board considerations section are part of this shareholder report. This shareholder report only relates to Prime Investment Money Market Fund.)
Each year, as required by Section 15 of the Investment Company Act of 1940 (the “1940 Act”), the Board of Trustees (the “Board”) of Wells Fargo Funds Trust (the “Trust”), all the members of which have no direct or indirect interest in the investment advisory and sub-advisory agreements and are not “interested persons” of the Trust, as defined in the 1940 Act (the “Independent Trustees”), determines whether to approve the continuation of the Trust’s investment advisory and sub-advisory agreements. In this regard, at an in person meeting held on March 24-25, 2011 (the “Meeting”), the Board reviewed and re-approved: (i) an investment advisory agreement with Wells Fargo Funds Management, LLC (“Funds Management”) for each of the 100% Treasury Money Market Fund, Cash Investment Money Market Fund, Government Money Market Fund, Heritage Money Market Fund, Money Market Fund, Prime Investment Money Market Fund and Treasury Plus Money Market Fund (collectively, the “Funds”); and (ii) an investment sub-advisory agreement with Wells Capital Management Incorporated (“Wells Capital Management”) for each of the Funds. The investment advisory agreements with Funds Management and the investment sub-advisory agreements with Wells Capital Management are collectively referred to as the “Advisory Agreements.”
At the Meeting, the Board considered the factors and reached the conclusions described below relating to the selection of Funds Management and Wells Capital Management and continuation of the Advisory Agreements. Prior to the Meeting, the Trustees conferred extensively among themselves and with representatives of Funds Management about these matters. The Board also met throughout the year and received information that was useful to them in considering the continuation of the Advisory Agreements. The Independent Trustees were assisted in their evaluation of the Advisory Agreements by independent legal counsel, from whom they received separate legal advice and with whom they met separately from Funds Management.
Nature, extent and quality of services
The Board received and considered various information regarding the nature, extent and quality of services provided to the Funds by Funds Management and Wells Capital Management under the Advisory Agreements. The Board also received and considered information provided in response to a detailed set of requests submitted by the Independent Trustees’ independent legal counsel on their behalf. The Board received and considered, among other things, information about the background and experience of senior management of Funds Management, and the qualifications, backgrounds, tenures and responsibilities of the portfolio managers primarily responsible for the day-to-day portfolio management of the Funds.
The Board evaluated the ability of Funds Management and Wells Capital Management, based on their respective financial condition, resources, reputation and other attributes, to attract and retain qualified investment professionals, including research, advisory, and supervisory personnel. The Board further considered the compliance programs and compliance records of Funds Management and Wells Capital Management. In addition, the Board took into account the administrative services provided to the Funds by Funds Management and its affiliates.
The Board’s decision to approve the continuation of the Advisory Agreements was based on a comprehensive evaluation of all of the information provided to it. In approving the continuation of the Advisory Agreements, the Board did not identify any particular information or consideration that was all-important or controlling, and each Trustee attributed different weights to various factors. The Board evaluated information provided to it both in terms of the funds generally and with respect to each Fund specifically as it considered appropriate. Although the Board considered the continuation of the Advisory Agreements for each of the Funds as part of the larger process of considering the continuation of the advisory agreements for all of the funds, its decision to continue the Advisory Agreements for each of the Funds was ultimately made on a fund-by-fund basis.
In considering these matters, the Board considered not only the specific information presented in connection with the Meeting, but also the knowledge gained over time through interaction with Funds Management and Wells Capital
| | | | |
| 32 | | Wells Fargo Advantage Prime Investment Money Market Fund | | Other Information (Unaudited) |
Management about various topics, including Funds Management’s oversight of service providers. The above factors, together with those referenced below, are some of the most important, but not necessarily all, factors considered by the Board in concluding that it was satisfied with the nature, extent and quality of the investment advisory services provided to each Fund by Funds Management and Wells Capital Management.
Fund performance and expenses
The Board considered the performance results for each of the Funds over various time periods ended December 31, 2010. The Board also considered these results in comparison to the median performance of a universe of relevant funds (the “Universe”) that were determined by Lipper Inc. (“Lipper”) to be similar to the Funds, and in comparison to each Fund’s benchmark index and to other comparative data. Lipper is an independent provider of investment company data. The Board received a description of the methodology used by Lipper to select the mutual funds in the Universe.
The Board noted that the performance of each of the Funds was higher than or in range of the median performance of the Universe for the periods under review, except for the Money Market Fund (Class B).
The Board received and considered information regarding each Fund’s contractual advisory fee and net operating expense ratios and their various components, including actual management fees (which reflect fee waivers, if any), transfer agent, custodian and other non-management fees, Rule 12b-1 and non-Rule 12b-1 fees, service fees and fee waiver and expense reimbursement arrangements. The Board also considered these ratios in comparison to the median ratios of an expense Universe and a narrower expense group of mutual funds (each, an “Expense Group”) that was determined by Lipper to be similar to each Fund. The Board received a description of the methodology used by Lipper to select the mutual funds in a Fund’s Expense Group. The Board noted that the net operating expense ratios of the Service Class, Administrator Class, Institutional Class and Select Class of each of the Funds were in range of each Fund’s respective Expense Group’s median net operating expense ratio, except for the 100% Treasury Money Market Fund (Service Class). The Board also noted that the net operating expense ratios of the Class A and Sweep Class of each of the Funds, the Money Market Fund (A, B, C, Daily and Investor Classes) were higher than each Fund’s respective Expense Group’s median net operating expense ratio.
Based on the above-referenced considerations and other factors, the Board concluded that the overall performance and expense structure of the Funds supported the re-approval of the Advisory Agreements for the Funds.
Investment advisory and sub-advisory fee rates
The Board reviewed and considered the contractual investment advisory fee rates that are payable by the Funds to Funds Management for investment advisory services (the “Advisory Agreement Rates”), both on a stand-alone basis and on a combined basis with the Funds’ administration fee rates. The Board took into account the separate administrative and other services covered by the administration fee rates. The Board also reviewed and considered the contractual investment sub-advisory fee rates that are payable by Funds Management to Wells Capital Management for investment sub-advisory services (the “Sub-Advisory Agreement Rates”). In addition, the Board reviewed and considered the existing fee waiver/cap arrangements applicable to the Advisory Agreement Rates and considered the Advisory Agreement Rates after taking the waivers/caps into account (the “Net Advisory Rates”).
The Board received and considered information comparing the Advisory Agreement Rates and Net Advisory Rates with those of other funds in each Fund’s Expense Group median. The Board noted that the Advisory Agreement Rates for the Class A, Service Class, Administrator Class, Institutional Class and Select Class of each of the Funds were in range of each Fund’s respective Expense Group, except for the 100% Treasury Money Market Fund (Administrator Class). The Board noted that the Advisory Agreement Rates for the Sweep Class of each of the Funds was not appreciably higher than the median rate of each Fund’s Expense Group, except for the 100% Treasury Money Market Fund. The Board also noted that the Advisory Agreement Rates for the Money Market Fund (Class B, Class C, Daily Class and Investor Class) were higher than the median rate of the Expense Group. The Board noted that the Net Advisory Rates for the Service Class, Administrator Class, Institutional Class and Select Class of each of the Funds were in range of each Fund’s respective Expense Group. The Board also noted that the Net Advisory Rates for the Class A and Sweep Class of each of the Funds and the Money Market Fund (Class B, Class C, Daily Class and Investor Class) were higher than each Fund’s respective Expense Group. The Board further noted that Funds Management had agreed to continue and, in certain instances, reduce contractual fee cap arrangements for the Funds designed to lower the Funds’ expenses.
| | | | | | |
| Other Information (Unaudited) | | Wells Fargo Advantage Prime Investment Money Market Fund | | | 33 | |
The Board also received and considered information about the nature and extent of services offered and fee rates charged by Funds Management and Wells Capital Management to other types of clients. In this regard, the Board received information about differences between the services, and the compliance, reporting, and other legal burdens and risks of providing investment advice to mutual funds and those associated with providing advice to non-mutual fund clients such as collective funds or institutional separate accounts.
In each case, the Board determined that the Advisory Agreement Rates for the Funds, both with and without administration fee rates and before and after waivers, were acceptable in light of the Funds’ Expense Group information, the net expense ratio commitments, the services covered by the Advisory Agreements and other information provided. The Board also reviewed and considered the Sub-Advisory Agreement Rates and concluded that the Sub-Advisory Agreement Rates were acceptable in light of the services covered by the Sub-Advisory Agreement and other information provided.
Profitability
The Board received and considered a profitability analysis of Funds Management, as well as an analysis of the profitability to the collective Wells Fargo businesses that provide services to the Funds. It considered that the information provided to it was necessarily estimated, and that the profitability information provided to it, especially on a fund-by-fund basis, did not necessarily provide a precise tool for evaluating the appropriateness of each Fund’s Advisory Agreement Rates in isolation. It noted that the levels of profitability of the Funds to Funds Management varied widely, depending on, among other things, the size and type of fund. The Board concluded that the profitability to Funds Management of the services provided to any of the Funds, individually or in the aggregate, was not unreasonable.
The Board did not consider separate profitability information with respect to Wells Capital Management, because, as an affiliate of Funds Management, its profitability information was subsumed in the collective Wells Fargo profitability analysis provided by Funds Management.
Economies of scale
With respect to possible economies of scale, the Board reviewed the breakpoints in each Fund’s advisory fee structure, which operate generally to reduce the effective Advisory Agreement Rates of the Funds (as a percentage of Fund assets) as the Funds grow in size. It considered that, as a fund shrinks in size, breakpoints conversely result in increasing fee levels. The Board noted that it would continue to review the appropriate levels of breakpoints in the future, and concluded that the breakpoints as implemented appeared to be a reasonable step toward sharing economies of scale with the Funds. However, the Board acknowledged the inherent limitations of any analysis of an investment adviser’s economies of scale and of any attempt to correlate breakpoints with such economies, stemming largely from the Board’s understanding that economies of scale are realized, if at all, by an investment adviser across a variety of products and services, not just with respect to a single fund.
Other benefits to Funds Management and Wells Capital Management
The Board received and considered information regarding potential “fall-out” or ancillary benefits received by Funds Management and its affiliates, including Wells Capital Management, as a result of their relationship with the Funds. Ancillary benefits could include, among others, benefits directly attributable to the relationship of Funds Management and Wells Capital Management with the Funds and benefits potentially derived from an increase in Funds Management’s and Wells Capital Management’s business as a result of their relationship with the Funds (such as the ability to market to shareholders other financial products offered by Funds Management and its affiliates, including Wells Capital Management).
The Board considered that Wells Fargo Funds Distributor, LLC, an affiliate of Funds Management, serves as distributor to the Funds and receives certain compensation for those services. The Board noted that the Funds pay sub-transfer agency fees to various financial institutions, including affiliates of Funds Management that hold fund shares in omnibus accounts. It also considered that these entities may receive distribution-related fees and shareholder servicing payments (including amounts derived from payments under the funds’ Rule 12b-1 plans) in respect of shares sold or held through them.
The Board also reviewed information about whether and to what extent soft dollar credits are sought and how any such credits are utilized and any benefits that may be realized by using an affiliated broker.
Other factors and broader review
The Board also considered the markets for distribution of the Funds’ shares, including the multiple channels through which the Funds’ shares are offered and sold. The Board noted that the Funds are part of one of the few fund families that
| | | | |
| 34 | | Wells Fargo Advantage Prime Investment Money Market Fund | | Other Information (Unaudited) |
have both direct-to-fund and intermediary distribution channels. As discussed above, the Board reviews detailed materials received from Funds Management and Wells Capital Management annually as part of the re-approval process under Section 15 of the 1940 Act and also reviews and assesses information about the quality of the services that the Funds receive throughout the year. In this regard, the Board has reviewed reports of Funds Management at each of its quarterly meetings, which include, among other things, portfolio reviews and performance reports. In addition, the Board confers with portfolio managers at various times throughout the year.
Conclusion
After considering the above-described factors and based on its deliberations and its evaluation of the information described above, the Board concluded that approval of the continuation of the Advisory Agreements for the Funds was in the best interest of the Funds and their shareholders. Accordingly, the Board unanimously approved the continuation of the Advisory Agreements for an additional one-year period.
| | | | | | |
| List of Abbreviations | | Wells Fargo Advantage Prime Investment Money Market Fund | | | 35 | |
The following is a list of common abbreviations for terms and entities which may have appeared in this report.
| ABAG | — Association of Bay Area Governments |
| ACB | — Agricultural Credit Bank |
| ADR | — American Depositary Receipt |
| ADS | — American Depository Shares |
| AGC-ICC | — Assured Guaranty Corporation - Insured Custody Certificates |
| AGM | — Assured Guaranty Municipal |
| AMBAC | — American Municipal Bond Assurance Corporation |
| AMT | — Alternative Minimum Tax |
| ARM | — Adjustable Rate Mortgages |
| BAN | — Bond Anticipation Notes |
| BART | — Bay Area Rapid Transit |
| BHAC | — Berkshire Hathaway Assurance Corporation |
| CCAB | — Convertible Capital Appreciation Bond |
| CDA | — Community Development Authority |
| CDO | — Collateralized Debt Obligation |
| CDSC | — Contingent Deferred Sales Charge |
| CGIC | — Capital Guaranty Insurance Company |
| CGY | — Capital Guaranty Corporation |
| CIFG | — CDC (Caisse des Dépôts et Consignations) IX IS Financial Guarantee |
| COP | — Certificate of Participation |
| DRIVER | — Derivative Inverse Tax-Exempt Receipts |
| DW&P | — Department of Water & Power |
| DWR | — Department of Water Resources |
| ECFA | — Educational & Cultural Facilities Authority |
| EDA | — Economic Development Authority |
| EDFA | — Economic Development Finance Authority |
| ETET | — Eagle Tax-Exempt Trust |
| ETF | — Exchange-Traded Fund |
| FFCB | — Federal Farm Credit Bank |
| FGIC | — Financial Guaranty Insurance Corporation |
| FHA | — Federal Housing Authority |
| FHAG | — Federal Housing Agency |
| FHLB | — Federal Home Loan Bank |
| FHLMC | — Federal Home Loan Mortgage Corporation |
| FNMA | — Federal National Mortgage Association |
| GDR | — Global Depositary Receipt |
| GNMA | — Government National Mortgage Association |
| HCFR | — Healthcare Facilities Revenue |
| HEFA | — Health & Educational Facilities Authority |
| HEFAR | — Higher Education Facilities Authority Revenue |
| HFA | — Housing Finance Authority |
| HFFA | — Health Facilities Financing Authority |
| HUD | — Housing & Urban Development |
| IBC | — Insured Bond Certificate |
| IDA | — Industrial Development Authority |
| IDAG | — Industrial Development Agency |
| IDR | — Industrial Development Revenue |
| KRW | — Republic of Korea Won |
| LIBOR | — London Interbank Offered Rate |
| LLC | — Limited Liability Company |
| LLP | — Limited Liability Partnership |
| MBIA | — Municipal Bond Insurance Association |
| MFHR | — Multi-Family Housing Revenue |
| MFMR | — Multi-Family Mortgage Revenue |
| MMD | — Municipal Market Data |
| MSTR | — Municipal Securities Trust Receipts |
| MUD | — Municipal Utility District |
| NATL-RE | — National Public Finance Guarantee Corporation |
| PCFA | — Pollution Control Finance Authority |
| PCR | — Pollution Control Revenue |
| PFA | — Public Finance Authority |
| PFFA | — Public Facilities Financing Authority |
| PFOTER | — Puttable Floating Option Tax-Exempt Receipts |
| plc | — Public Limited Company |
| PSFG | — Public School Fund Guaranty |
| PUTTER | — Puttable Tax-Exempt Receipts |
| R&D | — Research & Development |
| RDA | — Redevelopment Authority |
| RDFA | — Redevelopment Finance Authority |
| REIT | — Real Estate Investment Trust |
| RIB | — Residual Interest Bond |
| ROC | — Reset Option Certificates |
| SAVRS | — Select Auction Variable Rate Securities |
| SFHR | — Single Family Housing Revenue |
| SFMR | — Single Family Mortgage Revenue |
| SLMA | — Student Loan Marketing Association |
| SPDR | — Standard & Poor’s Depositary Receipts |
| STIT | — Short-Term Investment Trust |
| TAN | — Tax Anticipation Notes |
| TIPS | — Treasury Inflation-Protected Securities |
| TRAN | — Tax Revenue Anticipation Notes |
| TCR | — Transferable Custody Receipts |
| TTFA | — Transportation Trust Fund Authority |
| USD | — Unified School District |
| XLCA | — XL Capital Assurance |
This page is intentionally left blank.
This page is intentionally left blank.
This page is intentionally left blank.


FOR MORE INFORMATION
More information about Wells Fargo Advantage Funds is available free upon request. To obtain literature, please write, e-mail, visit the Funds’ Web site, or call:
Wells Fargo Advantage Funds
P.O. Box 8266
Boston, MA 02266-8266
E-mail: wfaf@wellsfargo.com
Web site: www.wellsfargo.com/advantagefunds
Individual investors: 1-800-222-8222
Retail investment professionals: 1-888-877-9275
Institutional investment professionals: 1-866-765-0778
This report and the financial statements contained herein are submitted for the general information of the shareholders of Wells Fargo Advantage Funds. If this report is used for promotional purposes, distribution of the report must be accompanied or preceded by a current prospectus. For a prospectus containing more complete information, including charges and expenses, call 1-800-222-8222 or visit the Funds’ Web site at www.wellsfargo.com/advantagefunds. Please consider the investment objectives, risks, charges, and expenses of the investment carefully before investing. This and other information about Wells Fargo Advantage Funds can be found in the current prospectus. Read the prospectus carefully before you invest or send money.
Wells Fargo Funds Management, LLC, a wholly owned subsidiary of Wells Fargo & Company, provides investment advisory and administrative services for Wells Fargo Advantage Funds. Other affiliates of Wells Fargo & Company provide subadvisory and other services for the Funds. The Funds are distributed by Wells Fargo Funds Distributor, LLC, Member FINRA/SIPC, an affiliate of Wells Fargo & Company.
NOT FDIC INSURED ¡ NO BANK GUARANTEE ¡ MAY LOSE VALUE
© 2011 Wells Fargo Funds Management, LLC. All rights reserved.
| | |
 | | 204809 09-11 SA313/SAR313 7-11 |

Wells Fargo Advantage
Treasury Plus Money Market Fund

Semi-Annual Report
July 31, 2011

Reduce clutter. Save trees.
Sign up for electronic delivery of prospectuses and shareholder reports at www.wellsfargo.com/advantagedelivery
Contents
The views expressed and any forward-looking statements are as of July 31, 2011, unless otherwise noted and are those of the Fund managers and/or Wells Fargo Funds Management, LLC. Discussions of individual securities, or the markets generally, or any Wells Fargo Advantage Fund are not intended as individual recommendations. Future events or results may vary significantly from those expressed in any forward-looking statements; the views expressed are subject to change at any time in response to changing circumstances in the market. Wells Fargo Funds Management, LLC, disclaims any obligation to publicly update or revise any views expressed or forward-looking statements.
NOT FDIC INSURED ¡ NO BANK GUARANTEE ¡ MAY LOSE VALUE

WELLS FARGO INVESTMENT HISTORY
| | |
| |
| 1932 | | Keystone creates one of the first mutual fund families. |
| |
| 1971 | | Wells Fargo & Company introduces one of the first institutional index funds. |
| |
| 1978 | | Wells Fargo applies Markowitz and Sharpe’s research on Modern Portfolio Theory to introduce one of the industry’s first Tactical Asset Allocation (TAA) models in institutional separately managed accounts. |
| |
| 1984 | | Wells Fargo Stagecoach Funds launches its first asset allocation fund. |
| |
| 1989 | | The Tactical Asset Allocation (TAA) Model is first applied to Wells Fargo’s asset allocation mutual funds. |
| |
| 1994 | | Wells Fargo introduces the LifePath Funds, one of the first suites of target date funds (now the Wells Fargo Advantage Dow Jones Target Date FundsSM ). |
| |
| 1996 | | Evergreen Investments and Keystone Funds merge. |
| |
| 1997 | | Wells Fargo launches Wells Fargo Advantage WealthBuilder PortfoliosSM, a fund-of-funds suite of products that includes the use of quantitative models to shift assets among investment styles. |
| |
| 1999 | | Norwest Advantage Funds and Stagecoach Funds are reorganized into Wells Fargo Funds after the merger of Norwest and Wells Fargo. |
| |
| 2002 | | Evergreen Retail and Evergreen Institutional companies form the umbrella asset management company, Evergreen Investments. |
| |
| 2005 | | The integration of Strong Funds with Wells Fargo Funds creates Wells Fargo Advantage Funds, resulting in one of the top 20 mutual fund companies in the United States. |
| |
| 2006 | | Wells Fargo Advantage Funds relaunches the target date product line as Wells Fargo Advantage Dow Jones Target Date Funds. |
| |
| 2010 | | The mergers and reorganizations of Evergreen and Wells Fargo Advantage mutual funds are completed, unifying the families under the brand of Wells Fargo Advantage Funds. |
Wells Fargo Advantage Funds®
Wells Fargo Advantage Funds skillfully guides institutions, financial advisors, and individuals through the investment terrain to help them reach their financial objectives. Everything we do on behalf of investors is backed by our unique combination of qualifications.
Strength
Our organization is built on the standards of integrity and service established by our parent company—Wells Fargo & Company—more than 150 years ago. And, because we’re part of a highly diversified financial enterprise, we offer the depth of resources to help investors succeed.
Expertise
Our multi-boutique model offers investors access to the independent thinking of premier investment managers that have been chosen for their time-tested strategies. While each team specializes in a specific investment strategy, collectively they provide investors a wide choice of distinct investment styles. Our dedication to investment excellence doesn’t end with our expertise in manager selection—risk management, analysis, and rigorous ongoing review seek to ensure each manager’s investment process remains consistent.
Partnership
Our collaborative approach is built around understanding the needs and goals of our clients. By adhering to core principles of sound judgment and steady guidance, we support you through every stage of the investment decision process.
Carefully consider the investment objectives, risks, charges, and expenses before investing. For a current prospectus for Wells Fargo Advantage Funds containing this and other information, visit wellsfargo.com/advantagefunds. Read it carefully before investing.
Wells Fargo Funds Management, LLC, a wholly owned subsidiary of Wells Fargo & Company, provides investment advisory and administrative services for Wells Fargo Advantage Funds®. Other affiliates of Wells Fargo & Company provide subadvisory and other services for the Funds. The Funds are distributed by Wells Fargo Funds Distributor, LLC, Member FINRA/SIPC, an affiliate of Wells Fargo & Company.
The “Dow Jones Target Date Indexes” are a product of Dow Jones Indexes, a licensed trademark of CME Group Index Services LLC (“CME”). “Dow Jones” and “Dow Jones Target Date Indexes” are service marks of Dow Jones Trademark Holdings, LLC, and have been licensed for use for certain purposes by CME and sublicensed for use by Global Index Advisors, Inc., and Wells Fargo Funds Management, LLC. The Dow Jones Target Date Indexes are based in part on the Barclays Capital Bond Indexes, which are published by Barclays Capital Inc. The Wells Fargo Advantage Dow Jones Target Date Funds, based on the Dow Jones Target Date Indexes, are not sponsored, endorsed, sold, or promoted by Dow Jones, CME or Barclays Capital or any of their respective affiliates, and neither Dow Jones, CME nor Barclays Capital nor any of their respective affiliates makes any representation regarding the advisability of investing in such product(s) and/or about the quality, accuracy, and/or completeness of the Dow Jones Target Date Indexes or the Barclays Capital Bond Indexes. IN NO EVENT SHALL DOW JONES, CME, BARCLAYS CAPITAL, OR ANY OF THEIR LICENSORS HAVE ANY LIABILITY IN CONNECTION WITH THE Wells Fargo Advantage Dow Jones Target Date Funds INCLUDING, WITHOUT LIMITATION, FOR ANY SPECIAL, PUNITIVE, IN DIRECT, OR CONSEQUENTIAL DAMAGES (INCLUDING LOST PROFITS), EVEN IF NOTIFIED OF THE POSSIBILITY OF SUCH DAMAGES.
NOT FDIC INSURED ¡ NO BANK GUARANTEE ¡ MAY LOSE VALUE
Not part of the semi-annual report.
Wells Fargo Advantage Funds offers more than 110 mutual funds across a wide range of asset classes, representing over $221 billion in assets under management, as of July 31, 2011.
| | | | |
| Equity Funds | | | | |
Asia Pacific Fund | | Global Opportunities Fund | | Premier Large Company Growth Fund |
C&B Large Cap Value Fund | | Growth Fund | | Small Cap Opportunities Fund |
C&B Mid Cap Value Fund | | Health Care Fund | | Small Cap Value Fund |
Capital Growth Fund | | Index Fund | | Small Company Growth Fund |
Common Stock Fund | | International Equity Fund | | Small Company Value Fund |
Disciplined U.S. Core Fund | | International Value Fund | | Small/Mid Cap Core Fund |
Discovery Fund† | | Intrinsic Small Cap Value Fund | | Small/Mid Cap Value Fund |
Diversified Equity Fund | | Intrinsic Value Fund | | Social Sustainability Fund† |
Diversified International Fund | | Intrinsic World Equity Fund | | Special Mid Cap Value Fund |
Diversified Small Cap Fund | | Large Cap Core Fund | | Special Small Cap Value Fund |
Emerging Growth Fund | | Large Cap Growth Fund | | Specialized Technology Fund |
Emerging Markets Equity Fund | | Large Company Value Fund | | Strategic Large Cap Growth Fund |
Endeavor Select Fund† | | Omega Growth Fund | | Traditional Small Cap Growth Fund |
Enterprise Fund† | | Opportunity Fund† | | Utility and Telecommunications Fund |
Equity Value Fund | | Precious Metals Fund | | |
| Bond Funds | | | | |
Adjustable Rate Government Fund | | Inflation-Protected Bond Fund | | Short-Term Bond Fund |
California Limited-Term Tax-Free Fund | | Intermediate Tax/AMT-Free Fund | | Short-Term High Yield Bond Fund |
California Tax-Free Fund | | International Bond Fund | | Short-Term Municipal Bond Fund |
Colorado Tax-Free Fund | | Minnesota Tax-Free Fund | | Strategic Municipal Bond Fund |
Government Securities Fund | | Municipal Bond Fund | | Total Return Bond Fund |
High Income Fund | | North Carolina Tax-Free Fund | | Ultra Short-Term Income Fund |
High Yield Bond Fund | | Pennsylvania Tax-Free Fund | | Ultra Short-Term Municipal Income Fund |
Income Plus Fund | | Short Duration Government Bond Fund | | Wisconsin Tax-Free Fund |
| Asset Allocation Funds | | | | |
Asset Allocation Fund | | WealthBuilder Equity Portfolio† | | Target 2020 Fund† |
Conservative Allocation Fund | | WealthBuilder Growth Allocation Portfolio† | | Target 2025 Fund† |
Diversified Capital Builder Fund | | WealthBuilder Growth Balanced Portfolio† | | Target 2030 Fund† |
Diversified Income Builder Fund | | WealthBuilder Moderate Balanced Portfolio† | | Target 2035 Fund† |
Growth Balanced Fund | | WealthBuilder Tactical Equity Portfolio† | | Target 2040 Fund† |
Index Asset Allocation Fund | | Target Today Fund† | | Target 2045 Fund† |
Moderate Balanced Fund | | Target 2010 Fund† | | Target 2050 Fund† |
WealthBuilder Conservative Allocation Portfolio† | | Target 2015 Fund† | | Target 2055 Fund† |
| Money Market Funds | | | | |
100% Treasury Money Market Fund | | Minnesota Money Market Fund | | New Jersey Municipal Money Market Fund |
California Municipal Money Market Fund | | Money Market Fund | | New York Municipal Money Market Fund |
Cash Investment Money Market Fund | | Municipal Cash Management Money Market Fund | | Pennsylvania Municipal Money Market Fund |
Government Money Market Fund | | Municipal Money Market Fund | | Prime Investment Money Market Fund |
Heritage Money Market Fund† | | National Tax-Free Money Market Fund | | Treasury Plus Money Market Fund |
| Variable Trust Funds1 | | | | |
VT Discovery Fund† | | VT Intrinsic Value Fund | | VT Small Cap Growth Fund |
VT Index Asset Allocation Fund | | VT Omega Growth Fund | | VT Small Cap Value Fund |
VT International Equity Fund | | VT Opportunity Fund† | | VT Total Return Bond Fund |
An investment in a money market fund is not insured or guaranteed by the Federal Deposit Insurance Corporation or any other government agency. Although the Wells Fargo Advantage Money Market Funds seek to preserve the value of your investment at $1.00 per share, it is possible to lose money by investing in a money market fund.
| 1. | The Variable Trust Funds are generally available only through insurance company variable contracts. |
| † | In this report, the Wells Fargo Advantage Discovery FundSM, Wells Fargo Advantage Endeavor Select FundSM, Wells Fargo Advantage Enterprise FundSM, Wells Fargo Advantage Opportunity FundSM, Wells Fargo Advantage Social Sustainability FundSM, Wells Fargo Advantage WealthBuilder Conservative Allocation PortfolioSM, Wells Fargo Advantage WealthBuilder Equity PortfolioSM, Wells Fargo Advantage WealthBuilder Growth Allocation PortfolioSM, Wells Fargo Advantage WealthBuilder Growth Balanced PortfolioSM, Wells Fargo Advantage WealthBuilder Moderate Balanced PortfolioSM, Wells Fargo Advantage WealthBuilder Tactical Equity PortfolioSM, Wells Fargo Advantage Dow Jones Target Today FundSM, Wells Fargo Advantage Dow Jones Target 2010 FundSM, Wells Fargo Advantage Dow Jones Target 2015 FundSM, Wells Fargo Advantage Dow Jones Target 2020 FundSM, Wells Fargo Advantage Dow Jones Target 2025 FundSM, Wells Fargo Advantage Dow Jones Target 2030 FundSM, Wells Fargo Advantage Dow Jones Target 2035 FundSM, Wells Fargo Advantage Dow Jones Target 2040 FundSM, Wells Fargo Advantage Dow Jones Target 2045 FundSM, Wells Fargo Advantage Dow Jones Target 2050 FundSM, Wells Fargo Advantage Dow Jones Target 2055 FundSM, Wells Fargo Advantage Heritage Money Market FundSM, Wells Fargo Advantage VT Discovery FundSM, and Wells Fargo Advantage VT Opportunity FundSM are referred to as the Discovery Fund, Endeavor Select Fund, Enterprise Fund, Opportunity Fund, Social Sustainability Fund, WealthBuilder Conservative Allocation Portfolio, WealthBuilder Equity Portfolio, WealthBuilder Growth Allocation Portfolio, WealthBuilder Growth Balanced Portfolio, WealthBuilder Moderate Balanced Portfolio, WealthBuilder Tactical Equity Portfolio, Target Today Fund, Target 2010 Fund, Target 2015 Fund, Target 2020 Fund, Target 2025 Fund, Target 2030 Fund, Target 2035 Fund, Target 2040 Fund, Target 2045 Fund, Target 2050 Fund, Target 2055 Fund, Heritage Money Market Fund, VT Discovery Fund, and VT Opportunity Fund, respectively. |
Not part of the semi-annual report.
| | | | |
| 2 | | Wells Fargo Advantage Treasury Plus Money Market Fund | | Letter to Shareholders |

Karla M. Rabusch,
President
Wells Fargo Advantage Funds
While the FOMC explained that it “expects the pace of recovery to pick up over coming quarters,” it indicated that the federal funds rate will remain at an exceptionally low level for as long as necessary to ensure a sustainable recovery and expansion.
Dear Valued Shareholder,
We’re pleased to offer you this semi-annual report for the Wells Fargo Advantage Treasury Plus Money Market Fund for the six-month period that ended July 31, 2011. Upon reviewing the report, you may notice a few changes from past reports, the most significant of which is the change from a multi-fund report to a single-fund report. We believe this change will give you more convenient access to your fund data.
The period began modestly as improving economic optimism generally shifted investors toward equities and riskier assets and away from U.S. Treasuries and lower-yielding fixed-income securities. Returns from fixed income were modest in the opening months of 2011 but were generally still positive as U.S. Treasury yields incrementally climbed higher. But after the slow start, bond prices once again strongly improved, sparked by a sharp decline in U.S. Treasury prices in April that carried into May. Late in the period, lower-rated bonds declined in price more than the higher credit-quality tiers but not enough to outweigh the stronger performance from lower-rated securities during the period. Lower-quality and longer-maturity fixed-income securities generally outperformed higher-quality and shorter-maturity securities over the full period.
The activity within the broader bond market also resonated with money market participants. As the economic and credit environment reverberated from the ongoing sovereign debt concerns and softening economic data, many participants continued to balance a need for stability and desire for higher yields. The result has been good demand for domestic commercial paper and certificate of deposits. Also, in spite of all the discussion about sovereign debt, many money market participants continue to maintain some exposures to foreign banks based on the quality of their fundamentals. By focusing more on the fundamentals and taking a more selective approach to the short-term security market helped the markets avoid the severe yield volatility or significant flight-to-quality experienced during the spring of 2010, when the Greek sovereign debt crisis first emerged.
The global economic “recovery” hit a snag, but the end of 2011 could regain momentum.
The U.S. economic recovery that began in mid-2009 and gained further momentum throughout 2010, particularly during the fourth quarter, has failed to maintain that level of growth through the first seven months of 2011. For example, gross domestic product (GDP), the broadest measure of economic activity, grew at an annualized rate of 3.1% in the fourth quarter of 2010, only to slow dramatically during the first quarter of 2011. The latest revision to first-quarter GDP data during the period indicated that the economy grew at an annualized rate of 0.4% during the first quarter of 2011. While still positive, it’s a much slower pace of growth than experienced in the second half of 2010 and notably lower than consensus forecasts. Nevertheless, the advance estimate of second-quarter 2011 GDP, which was released on July 29, 2011, was 1.3%, suggesting that the U.S. economy continues to expand, though at a slow and uneven pace.
Jobs and housing remained troublesome.
The July 2011 unemployment rate in the U.S. was reported at 9.1%, down from 9.5% a year earlier but still notably higher than historical averages. Unfortunately,
| | | | | | |
| Letter to Shareholders | | Wells Fargo Advantage Treasury Plus Money Market Fund | | | 3 | |
the drop may be more attributable to a decline in the labor force than to a meaningful uptick in hiring. The level of job creation in 2011 has been trending below historical averages, suggesting that the improving economy has yet to translate into widespread hiring. Meanwhile, the beleaguered housing market was an ongoing source of concern, despite some tentative late-year signs of stabilization. That said, persistent weakness in the labor and housing markets bears close watching in the months ahead.
Other economic data in the U.S. has been more encouraging, reflecting greater confidence in the sustainability of the expansion on the part of both consumers and businesses. Retail sales came in strong at certain points during the period and industrial production and new orders have picked up. Although still reluctant to hire, businesses have gradually increased spending in other areas, such as equipment and information technology. Core inflation, which excludes volatile food and energy prices, remained benign.
The Federal Reserve believes the economic recovery will accelerate in future quarters.
With inflation subdued, the Federal Open Market Committee (FOMC) held its target range for the federal funds rate—a proxy for short-term interest rates—steady at 0.00% to 0.25%. On June 22, 2011, in its final statement of the six-month period, the Fed reiterated that the economic recovery “is proceeding at a moderate pace,” but that “recent labor market indicators have been weaker than anticipated.” It described the recent increase in inflation as temporary, suggesting that inflation pressures will ease going forward. While the FOMC explained that it “expects the pace of recovery to pick up over coming quarters,” it indicated that the federal funds rate will remain at an exceptionally low level for as long as necessary to ensure a sustainable recovery and expansion.
As recent headwinds subside, it is reasonable to expect markets to regain focus.
Now that it appears the debt ceiling has been increased and a U.S. default will be averted, money market participants and the broader bond market can get back to more fundamental and lasting concerns-chiefly, the economy. After avoiding short-term Treasuries in late July 2011, ahead of pending U.S. debt ceiling deadline, money market participants have returned to the U.S. short-term markets1. Economic indicators released in the second half of 2011 might not be as soft as those reported during the first half of the year. While that would not mean that the economy is robust, it might remind the markets that the first half of the slowdown was transitory. Most indicators still point toward real GDP growth in the 2% to 3% range in the second half of 2011. While that is not enough to produce big employment gains, it might be sufficient to cause Treasury yields to retrace some of the late-July declines.
Don’t let short-term uncertainty derail long-term investment goals.
While periods of uncertainty can present challenges, experience has taught us that maintaining a long-term investment strategy based on individual goals and risk tolerance can be an effective way to plan for the future. As a whole, Wells Fargo Advantage Funds represents investments across a broad range of asset classes and investment styles with more than 110 mutual funds, giving you an opportunity to create a diversified investment portfolio. While diversification may
| 1. | Comments expressed that do not fall within the reporting period are as of August 2, 2011. |
Economic indicators released in the second half of 2011 might not be as soft as those reported during the first half of the year. While that would not mean that the economy is robust, it might remind the markets that the first half of the slowdown was transitory.
| | | | |
| 4 | | Wells Fargo Advantage Treasury Plus Money Market Fund | | Letter to Shareholders |
not prevent losses in a downturn, it may help to reduce them and provide you with one way of managing risk.
In our opinion, diligent and earnest assessment of the fundamental characteristics of money market eligible securities will be a key differentiating factor between which investment strategies meet client expectations and which do not. At Wells Fargo Advantage Funds, we intend to continue the emphasis of principal preservation and high liquidity across our lineup of Wells Fargo Advantage Money Market Funds. In changing markets, we believe it is particularly important to have diligent investment analysts in charge of investor assets.
Thank you for choosing Wells Fargo Advantage Funds. We appreciate your confidence in us and are committed to helping you meet your financial needs. If you have any questions about your investments, please contact your investment professional, call us at 1-800-222-8222, or visit www.wellsfargo.com/advantagefunds.
Sincerely,

Karla M. Rabusch
President
Wells Fargo Advantage Funds
| | | | | | |
| Performance Highlights (Unaudited) | | Wells Fargo Advantage Treasury Plus Money Market Fund | | | 5 | |
INVESTMENT OBJECTIVE
The Fund seeks current income, while preserving capital and liquidity
ADVISER
Wells Fargo Funds Management, LLC
SUB-ADVISER
Wells Capital Management Incorporated
PORTFOLIO MANAGERS
David D. Sylvester
Laurie White
FUND INCEPTION
October 1, 1985
|
PORTFOLIO COMPOSITION1 (AS OF JULY 31, 2011) |
|
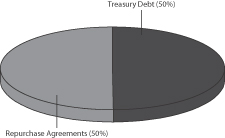 |
|
EFFECTIVE MATURITY DISTRIBUTION1 (AS OF JULY 31, 2011) |
|
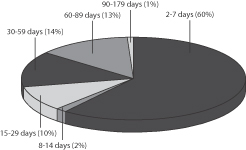 |
|
WEIGHTED AVERAGE MATURITY2 (AS OF JULY 31, 2011) |
20 Days |
|
WEIGHTED AVERAGE FINAL MATURITY3 (AS OF JULY 31, 2011) |
20 Days |
| 1. | Portfolio composition and effective maturity distribution are subject to change and are calculated based on the total investments of the Fund. Effective maturity distribution is based on the weighted average maturity of each security. |
| 2. | Weighted Average Maturity (WAM): WAM calculates an average time to maturity of all of the securities held in the portfolio, weighted by each security’s percentage of net assets. The calculation takes into account the final maturity of a fixed-income security and the interest rate reset date for floating-rate securities held in the portfolio. This is a way to measure a fund’s sensitivity to potential interest rate changes. |
| 3. | Weighted Average Final Maturity (WAFM): WAFM calculates a fund’s average time to maturity for all of the securities held in the portfolio, weighted to their percentage of assets in the Fund. In contrast to WAM, the WAFM calculation takes into account the final maturity date for each security held in the portfolio. This is a way to measure a fund’s potential sensitivity to credit spread changes. |
| | | | |
| 6 | | Wells Fargo Advantage Treasury Plus Money Market Fund | | Performance Highlights (Unaudited) |
AVERAGE ANNUAL TOTAL RETURN4 (%) (AS OF JULY 31, 2011)
| | | | | | | | | | | | | | | | | | | | | | | | | | | | |
| | | | | | | | | | | | | | | | | | Expense Ratios5 | |
| | | Inception Date | | | 6 Months* | | | 1 Year | | | 5 Year | | | 10 Year | | | Gross | | | Net6 | |
Class A (PIVXX) | | | 07/28/2003 | | | | 0.00 | | | | 0.01 | | | | 1.49 | | | | 1.57 | | | | 0.62% | | | | 0.62% | |
Administrator Class (WTPXX) | | | 03/31/2008 | | | | 0.00 | | | | 0.01 | | | | 1.62 | | | | 1.78 | | | | 0.35% | | | | 0.35% | |
Institutional Class (PISXX) | | | 08/11/1995 | | | | 0.00 | | | | 0.01 | | | | 1.70 | | | | 1.89 | | | | 0.23% | | | | 0.20% | |
Service Class (PRVXX) | | | 10/01/1985 | | | | 0.00 | | | | 0.01 | | | | 1.56 | | | | 1.68 | | | | 0.52% | | | | 0.45% | |
Sweep Class | | | 06/30/2010 | | | | 0.00 | | | | 0.01 | | | | 1.49 | | | | 1.60 | | | | 0.97% | | | | 0.97% | |
| * | Returns for periods of less than one year are not annualized. |
| | | | | | | | | | | | | | | | | | | | |
FUND YIELD SUMMARY6 (AS OF JULY 31, 2011) | | Class A | | | Administrator Class | | | Institutional Class | | | Service Class | | | Sweep Class | |
7-Day Current Yield | | | 0.01% | | | | 0.01% | | | | 0.01% | | | | 0.01% | | | | 0.01% | |
7-Day Compound Yield | | | 0.01% | | | | 0.01% | | | | 0.01% | | | | 0.01% | | | | 0.01% | |
30-Day Simple Yield | | | 0.01% | | | | 0.01% | | | | 0.01% | | | | 0.01% | | | | 0.01% | |
30-Day Compound Yield | | | 0.01% | | | | 0.01% | | | | 0.01% | | | | 0.01% | | | | 0.01% | |
Figures quoted represent past performance, which is no guarantee of future results and do not reflect the deduction of taxes that a shareholder may pay on fund distributions or the redemption of fund shares. Investment returns will fluctuate. The Fund’s yield figures more closely reflect the current earnings of the Fund than the total return figures. Current performance may be lower or higher than the performance data quoted. Current month-end performance is available at the Fund’s Web site – www.wellsfargo.com/advantagefunds.
Each class is sold without a front-end sales charge or contingent deferred sales charge. Other fees and expenses apply to an investment in the Fund and are described in the Fund’s current prospectus.
An investment in a money market fund is not insured or guaranteed by the Federal Deposit Insurance Corporation or any other government agency. Although the Fund seeks to preserve the value of your investment at $1.00 per share, it is possible to lose money by investing in a money market fund. The U.S. Government guarantee applies to certain of the underlying securities held by the Fund and not to shares of the Fund itself.
| 4. | Historical performance shown for the Administrator Class shares prior to their inception reflects the performance of the Institutional Class shares, adjusted to reflect the higher expenses applicable to the Administrator Class shares. Historical performance shown for the Sweep Class shares prior to their inception reflects the performance of the Class A shares, and has not been adjusted to include the higher expenses applicable to the Sweep Class shares. If these expenses had been adjusted, returns would be lower. Historical performance shown for Class A shares prior to their inception reflects the performance of the Service Class shares, adjusted to reflect the higher expenses applicable to Class A shares. |
| 5. | Reflects the expense ratios as stated in the most recent prospectuses. |
| 6. | The Adviser has committed through July 11, 2013 to waive fees and/or reimburse expenses to the extent necessary to cap the Fund’s Total Annual Fund Operating Expenses After Fee Waiver, excluding certain expenses, at 0.65% for Class A, 0.35% for Administrator Class, 0.20% for Institutional Class, 0.45% for Service Class and 1.05% for Sweep Class. Without this cap, the Fund’s returns would have been lower. Without waived fees and/or reimbursed expenses, the Fund’s 7-day current yield would have been (0.56)%, (0.29)%, (0.17)%, (0.46)% and (0.91)% for Class A, Administrator Class, Institutional Class, Service Class and Sweep Class, respectively. |
| | | | | | |
| Fund Expenses | | Wells Fargo Advantage Treasury Plus Money Market Fund | | | 7 | |
As a shareholder of the Fund, you incur two types of costs: (1) transaction costs, including contingent deferred sales changes (if any); and (2) ongoing costs, including management fees; distribution (12b-1) and/or shareholder service fees; and other Fund expenses. This example is intended to help you understand your ongoing costs (in dollars) of investing in the Fund and to compare these costs with the ongoing costs of investing in other mutual funds.
The example is based on an investment of $1,000 invested at the beginning of the six-month period and held for the entire period from February 1, 2011 to July 31, 2011.
Actual Expenses
The “Actual” line of the table below provides information about actual account values and actual expenses. You may use the information in this line, together with the amount you invested, to estimate the expenses that you paid over the period. Simply divide your account value by $1,000 (for example, an $8,600 account value divided by $1,000 = 8.6), then multiply the result by the number in the “Actual” line under the heading entitled “Expenses Paid During Period” for your applicable class of shares to estimate the expenses you paid on your account during this period.
Hypothetical Example for Comparison Purposes
The “Hypothetical” line of the table below provides information about hypothetical account values and hypothetical expenses based on the Fund’s actual expense ratio and an assumed rate of return of 5% per year before expenses, which is not the Fund’s actual return. The hypothetical account values and expenses may not be used to estimate the actual ending account balance or expenses you paid for the period. You may use this information to compare the ongoing costs of investing in the Fund and other funds. To do so, compare this 5% hypothetical example with the 5% hypothetical examples that appear in the shareholder reports of the other funds.
Please note that the expenses shown in the table are meant to highlight your ongoing costs only and do not reflect any transactional costs, such as any contingent deferred sales charges. Therefore, the “Hypothetical” line of the table is useful in comparing ongoing costs only, and will not help you determine the relative total costs of owning different funds. In addition, if these transactional costs were included, your costs would have been higher.
| | | | | | | | | | | | | | | | |
| | | Beginning Account Value 02-01-2011 | | | Ending Account Value 07-31-2011 | | | Expenses Paid During the Period1 | | | Net Annual Expense Ratio | |
Class A | | | | | | | | | | | | | | | | |
Actual | | $ | 1,000.00 | | | $ | 1,000.05 | | | $ | 0.45 | | | | 0.09 | % |
Hypothetical (5% return before expenses) | | $ | 1,000.00 | | | $ | 1,024.35 | | | $ | 0.45 | | | | 0.09 | % |
Administrator Class | | | | | | | | | | | | | | | | |
Actual | | $ | 1,000.00 | | | $ | 1,000.05 | | | $ | 0.40 | | | | 0.08 | % |
Hypothetical (5% return before expenses) | | $ | 1,000.00 | | | $ | 1,024.40 | | | $ | 0.40 | | | | 0.08 | % |
Institutional Class | | | | | | | | | | | | | | | | |
Actual | | $ | 1,000.00 | | | $ | 1,000.05 | | | $ | 0.40 | | | | 0.08 | % |
Hypothetical (5% return before expenses) | | $ | 1,000.00 | | | $ | 1,024.40 | | | $ | 0.40 | | | | 0.08 | % |
Service Class | | | | | | | | | | | | | | | | |
Actual | | $ | 1,000.00 | | | $ | 1,000.05 | | | $ | 0.40 | | | | 0.08 | % |
Hypothetical (5% return before expenses) | | $ | 1,000.00 | | | $ | 1,024.40 | | | $ | 0.40 | | | | 0.08 | % |
Sweep Class | | | | | | | | | | | | | | | | |
Actual | | $ | 1,000.00 | | | $ | 1,000.05 | | | $ | 0.45 | | | | 0.09 | % |
Hypothetical (5% return before expenses) | | $ | 1,000.00 | | | $ | 1,024.35 | | | $ | 0.45 | | | | 0.09 | % |
| 1. | Expenses paid is equal to the annualized expense ratio of each class multiplied by the average account value over the period, multiplied by the number of days in the most recent fiscal half-year divided by the number of days in the fiscal year (to reflect the one-half year period). |
| | | | |
| 8 | | Wells Fargo Advantage Treasury Plus Money Market Fund | | Portfolio of Investments—July 31, 2011 (Unaudited) |
| | | | | | | | | | | | | | | | |
| Security Name | | Yield | | | Maturity Date | | | Principal | | | Value | |
| | | | |
Treasury Debt: 39.63% | | | | | | | | | | | | | | | | |
US Treasury Bill | | | 0.02 | % | | | 08/18/2011 | | | $ | 550,000,000 | | | $ | 549,985,783 | |
US Treasury Bill | | | 0.02 | | | | 09/29/2011 | | | | 650,000,000 | | | | 649,948,785 | |
US Treasury Bill | | | 0.02 | | | | 10/20/2011 | | | | 150,000,000 | | | | 149,972,222 | |
US Treasury Bill | | | 0.03 | | | | 10/06/2011 | | | | 300,000,000 | | | | 299,966,084 | |
US Treasury Bill | | | 0.03 | | | | 10/13/2011 | | | | 400,000,000 | | | | 399,941,093 | |
US Treasury Bill | | | 0.04 | | | | 08/11/2011 | | | | 175,000,000 | | | | 174,998,056 | |
US Treasury Bill | | | 0.04 | | | | 08/25/2011 | | | | 550,000,000 | | | | 549,974,534 | |
US Treasury Bill | | | 0.04 | | | | 09/08/2011 | | | | 500,000,000 | | | | 499,963,953 | |
US Treasury Bill | | | 0.04 | | | | 09/22/2011 | | | | 250,000,000 | | | | 249,976,781 | |
US Treasury Bill | | | 0.05 | | | | 09/15/2011 | | | | 250,000,000 | | | | 249,978,438 | |
US Treasury Bill | | | 0.06 | | | | 09/01/2011 | | | | 500,000,000 | | | | 499,964,781 | |
US Treasury Bill | | | 0.12 | | | | 10/27/2011 | | | | 100,000,000 | | | | 99,971,000 | |
US Treasury Note | | | 1.00 | | | | 08/31/2011 | | | | 75,000,000 | | | | 75,059,912 | |
| | | | |
Total Treasury Debt (Cost $4,449,701,422) | | | | | | | | | | | | | | | 4,449,701,422 | |
| | | | | | | | | | | | | | | | |
| | | | |
| | | Interest Rate | | | | | | | | | | |
| | | | |
Repurchase Agreements(z): 39.96% | | | | | | | | | | | | | | | | |
Barclays Capital Incorporated, dated 07/29/2011, maturity value $500,005,833(1) | | | 0.14 | | | | 08/01/2011 | | | | 500,000,000 | | | | 500,000,000 | |
BNP Paribas Securities Corporation, dated 07/29/2011, maturity value $250,002,917(2) | | | 0.14 | | | | 08/01/2011 | | | | 250,000,000 | | | | 250,000,000 | |
Credit Suisse Securities USA, dated 07/29/2011, maturity value $500,005,833(3) | | | 0.14 | | | | 08/01/2011 | | | | 500,000,000 | | | | 500,000,000 | |
Deutsche Bank Securities, dated 07/29/2011, maturity value $650,008,667(4) | | | 0.16 | | | | 08/01/2011 | | | | 650,000,000 | | | | 650,000,000 | |
Goldman Sachs & Company, dated 07/29/2011, maturity value $100,000,667(5) | | | 0.08 | | | | 08/01/2011 | | | | 100,000,000 | | | | 100,000,000 | |
HSBC USA Incorporated, dated 07/29/2011, maturity value $461,605,770(6) | | | 0.15 | | | | 08/01/2011 | | | | 461,600,000 | | | | 461,600,000 | |
Merrill Lynch Pierce Fenner & Smith Incorporated, dated 07/29/2011, maturity value $125,001,354(7) | | | 0.13 | | | | 08/01/2011 | | | | 125,000,000 | | | | 125,000,000 | |
Morgan Stanley & Company, dated 07/29/2011, maturity value $150,001,875(8) | | | 0.15 | | | | 08/01/2011 | | | | 150,000,000 | | | | 150,000,000 | |
RBS Securities Incorporated, dated 07/29/2011, maturity value $750,009,375(9) | | | 0.15 | | | | 08/01/2011 | | | | 750,000,000 | | | | 750,000,000 | |
Societe Generale NY, dated 07/29/2011, maturity value $500,005,833(10) | | | 0.14 | | | | 08/01/2011 | | | | 500,000,000 | | | | 500,000,000 | |
UBS Securities LLC, dated 07/29/2011, maturity value $500,005,833(11) | | | 0.14 | | | | 08/01/2011 | | | | 500,000,000 | | | | 500,000,000 | |
| | | | |
Total Repurchase Agreements (Cost $4,486,600,000) | | | | | | | | | | | | | | | 4,486,600,000 | |
| | | | | | | | | | | | | | | | |
| | | | | | | | |
| Total Investments in Securities | | | | | | | | |
| (Cost $8,936,301,422)* | | | 79.59 | % | | | 8,936,301,422 | |
Other Assets and Liabilities, Net | | | 20.41 | | | | 2,292,320,019 | |
| | | | | | | | |
| Total Net Assets | | | 100.00 | % | �� | $ | 11,228,621,441 | |
| | | | | | | | |
| | | | | | |
| Portfolio of Investments—July 31, 2011 (Unaudited) | | Wells Fargo Advantage Treasury Plus Money Market Fund | | | 9 | |
| | (1) | U.S. government securities, 0.75% to 4.625%, 6/15/2014 to 2/15/2040, market value including accrued interest is $510,000,052. |
| | (2) | U.S. government securities, 5.375% to 6.125%, 8/15/2029 to 2/15/2031, market value including accrued interest is $255,000,052. |
| | (3) | U.S. government securities, 0.875% to 5.125%, 1/31/2012 to 5/15/2016, market value including accrued interest is $510,004,117. |
| | (4) | U.S. government securities, 0.00% to 4.875%, 8/15/2011 to 2/15/2019, market value including accrued interest is $663,000,165. |
| | (5) | U.S. government securities, 3.125% to 7.625%, 5/15/2019 to 11/15/2022, market value including accrued interest is $102,000,045. |
| | (6) | U.S. government securities, 0.00% to 7.125%, 8/31/2011 to 2/15/2023, market value including accrued interest is $470,833,704. |
| | (7) | U.S. government security, 0.00%, 5/15/2021, market value including accrued interest is $127,500,001. |
| | (8) | U.S. government security, 1.75%, 1/15/2028, market value including accrued interest is $153,000,001. |
| | (9) | U.S. government securities, 0.00% to 11.25%, 8/15/2011 to 2/15/2041, market value including accrued interest is $765,001,002. |
| | (10) | U.S. government securities, 0.00% to 1.25%, 11/17/2011 to 10/31/2015, market value including accrued interest is $510,000,070. |
| | (11) | U.S. government securities, 2.125% to 4.25%, 11/30/2014 to 11/15/2040, market value including accrued interest is $510,000,091. |
| * | Cost for federal income tax purposes is substantially the same as for financial reporting purposes. |
The accompanying notes are an integral part of these financial statements.
| | | | |
| 10 | | Wells Fargo Advantage Treasury Plus Money Market Fund | | Statement of Assets and Liabilities—July 31, 2011 (Unaudited) |
| | | | |
| | | | |
| |
Assets | | | | |
Investments | | | | |
Investments in unaffiliated securities, at amortized cost | | $ | 4,449,701,422 | |
Investments in repurchase agreements, at amortized cost | | | 4,486,600,000 | |
| | | | |
Total investments, at amortized cost | | | 8,936,301,422 | |
Cash | | | 2,292,310,611 | |
Receivable for Fund shares sold | | | 515,067 | |
Receivable for interest | | | 368,483 | |
Receivable from adviser | | | 2,106,682 | |
Prepaid expenses and other assets | | | 167,523 | |
| | | | |
Total assets | | | 11,231,769,788 | |
| | | | |
| |
Liabilities | | | | |
Dividends payable | | | 64,230 | |
Payable for Fund shares redeemed | | | 89,166 | |
Distribution fees payable | | | 20,480 | |
Due to other related parties | | | 1,479,734 | |
Shareholder servicing fees payable | | | 832,992 | |
Custody and accounting fees payable | | | 191,937 | |
Trustees’ fees and expenses payable | | | 359,828 | |
Accrued expenses and other liabilities | | | 109,980 | |
| | | | |
Total liabilities | | | 3,148,347 | |
| | | | |
Total net assets | | $ | 11,228,621,441 | |
| | | | |
| |
NET ASSETS CONSIST OF | | | | |
Paid-in capital | | $ | 11,231,214,725 | |
Overdistributed net investment income | | | (381,312 | ) |
Accumulated net realized losses on investments | | | (2,211,972 | ) |
| | | | |
Total net assets | | $ | 11,228,621,441 | |
| | | | |
| |
COMPUTATION OF NET ASSET VALUE PER SHARE¹ | | | | |
Net assets – Class A | | $ | 1,541,196,544 | |
Shares outstanding – Class A | | | 1,541,265,558 | |
Net asset value per share – Class A | | | $1.00 | |
Net assets – Administrator Class | | $ | 171,009,006 | |
Shares outstanding – Administrator Class | | | 171,015,054 | |
Net asset value per share – Administrator Class | | | $1.00 | |
Net assets – Institutional Class | | $ | 7,149,167,394 | |
Shares outstanding – Institutional Class | | | 7,149,417,638 | |
Net asset value per share – Institutional Class | | | $1.00 | |
Net assets – Service Class | | $ | 2,301,588,535 | |
Shares outstanding – Service Class | | | 2,301,666,888 | |
Net asset value per share – Service Class | | | $1.00 | |
Net assets – Sweep Class | | $ | 65,659,962 | |
Shares outstanding – Sweep Class | | | 65,663,172 | |
Net asset value per share – Sweep Class | | | $1.00 | |
| 1. | The Fund has an unlimited number of authorized shares. |
The accompanying notes are an integral part of these financial statements.
| | | | | | |
| Statement of Operations—Six Months Ended July 31, 2011 (Unaudited) | | Wells Fargo Advantage Treasury Plus Money Market Fund | | | 11 | |
| | | | |
| | | | |
| |
Investment income | | | | |
Interest | | $ | 4,792,437 | |
| | | | |
| |
Expenses | | | | |
Advisory fee | | | 5,219,192 | |
Administration fees | | | | |
Fund level | | | 2,307,535 | |
Class A | | | 1,975,392 | |
Administrator Class | | | 68,343 | |
Institutional Class | | | 2,477,460 | |
Service Class | | | 1,342,095 | |
Sweep Class | | | 82,954 | |
Shareholder servicing fees | | | | |
Class A | | | 2,192,708 | |
Administrator Class | | | 66,920 | |
Service Class | | | 2,769,591 | |
Sweep Class | | | 94,266 | |
Distribution fees | | | | |
Sweep Class | | | 131,972 | |
Custody and accounting fees | | | 285,140 | |
Professional fees | | | 17,906 | |
Registration fees | | | 78,547 | |
Shareholder report expenses | | | 31,716 | |
Trustees’ fees and expenses | | | 7,032 | |
Other fees and expenses | | | 104,596 | |
| | | | |
Total expenses | | | 19,253,365 | |
Less: Fee waivers and/or expense reimbursements | | | (14,982,869 | ) |
| | | | |
Net expenses | | | 4,270,496 | |
| | | | |
Net investment income | | | 521,941 | |
Net realized gains on investments | | | 20,222 | |
| | | | |
Net increase in net assets resulting from operations | | $ | 542,163 | |
| | | | |
The accompanying notes are an integral part of these financial statements.
| | | | |
| 12 | | Wells Fargo Advantage Treasury Plus Money Market Fund | | Statements of Changes in Net Assets |
| | | | | | | | | | | | | | | | | | | | | | | | |
| | | Six Months Ended July 31, 2011 (Unaudited) | | | Year Ended January 31, 2011¹ | | | Year Ended February 28, 2010 | |
| | | | | | |
Operations | | | | | | | | | | | | | | | | | | | | | | | | |
Net investment income | | | | | | $ | 521,941 | | | | | | | $ | 1,083,226 | | | | | | | $ | 1,502,924 | |
Net realized gains on investments | | | | | | | 20,222 | | | | | | | | 3,159,002 | | | | | | | | 0 | |
| | | | | | | | | | | | | | | | | | | | | | | | |
Net increase in net assets resulting from operations | | | | | | | 542,163 | | | | | | | | 4,242,228 | | | | | | | | 1,502,924 | |
| | | | | | | | | | | | | | | | | | | | | | | | |
| | | | | | |
Distributions to shareholders from | | | | | | | | | | | | | | | | | | | | | | | | |
Net investment income | | | | | | | | | | | | | | | | | | | | | | | | |
Class A | | | | | | | (89,794 | ) | | | | | | | (168,872 | ) | | | | | | | (202,070 | ) |
Administrator Class | | | | | | | (6,835 | ) | | | | | | | (13,852 | ) | | | | | | | (12,911 | ) |
Institutional Class | | | | | | | (309,696 | ) | | | | | | | (749,161 | ) | | | | | | | (1,209,797 | ) |
Service Class | | | | | | | (111,845 | ) | | | | | | | (145,636 | ) | | | | | | | (78,147 | ) |
Sweep Class | | | | | | | (3,771 | ) | | | | | | | (5,705 | )2 | | | | | | | NA | |
| | | | | | | | | | | | | | | | | | | | | | | | |
Total distributions to shareholders | | | | | | | (521,941 | ) | | | | | | | (1,083,226 | ) | | | | | | | (1,502,925 | ) |
| | | | | | | | | | | | | | | | | | | | | | | | |
| | | | | | |
| | | Shares | | | | | | Shares | | | | | | Shares | | | | |
| | | | | | |
Capital share transactions | | | | | | | | | | | | | | | | | | | | | | | | |
Proceeds from shares sold | | | | | | | | | | | | | | | | | | | | | | | | |
Class A | | | 4,528,142,926 | | | | 4,528,142,926 | | | | 9,813,502,631 | | | | 9,813,502,631 | | | | 9,129,776,256 | | | | 9,129,776,256 | |
Administrator Class | | | 255,264,574 | | | | 255,264,574 | | | | 452,676,086 | | | | 452,676,086 | | | | 580,986,791 | | | | 580,986,791 | |
Institutional Class | | | 17,526,096,608 | | | | 17,526,096,608 | | | | 33,972,670,035 | | | | 33,972,670,035 | | | | 35,941,648,948 | | | | 35,941,648,948 | |
Service Class | | | 5,097,571,445 | | | | 5,097,571,445 | | | | 8,319,611,259 | | | | 8,319,611,259 | | | | 7,688,485,834 | | | | 7,688,485,834 | |
Sweep Class | | | 66,563,125 | | | | 66,563,125 | | | | 129,816,763 | 2 | | | 129,816,763 | 2 | | | NA | | | | NA | |
| | | | | | | | | | | | | | | | | | | | | | | | |
| | | | | | | 27,473,638,678 | | | | | | | | 52,688,276,774 | | | | | | | | 53,340,897,829 | |
| | | | | | | | | | | | | | | | | | | | | | | | |
Reinvestment of distributions | | | | | | | | | | | | | | | | | | | | | | | | |
Class A | | | 32,607 | | | | 32,607 | | | | 63,420 | | | | 63,420 | | | | 71,085 | | | | 71,085 | |
Administrator Class | | | 6,688 | | | | 6,688 | | | | 13,731 | | | | 13,731 | | | | 12,674 | | | | 12,674 | |
Institutional Class | | | 99,154 | | | | 99,154 | | | | 232,649 | | | | 232,649 | | | | 530,506 | | | | 530,506 | |
Service Class | | | 11,507 | | | | 11,507 | | | | 14,960 | | | | 14,960 | | | | 8,743 | | | | 8,743 | |
Sweep Class | | | 3,771 | | | | 3,771 | | | | 5,705² | | | | 5,705² | | | | NA | | | | NA | |
| | | | | | | | | | | | | | | | | | | | | | | | |
| | | | | | | 153,727 | | | | | | | | 330,465 | | | | | | | | 623,008 | |
| | | | | | | | | | | | | | | | | | | | | | | | |
Payment for shares redeemed | | | | | | | | | | | | | | | | | | | | | | | | |
Class A | | | (4,893,047,705 | ) | | | (4,893,047,705 | ) | | | (9,650,275,158 | ) | | | (9,650,275,158 | ) | | | (10,011,375,553 | ) | | | (10,011,375,553 | ) |
Administrator Class | | | (219,263,479 | ) | | | (219,263,479 | ) | | | (497,703,527 | ) | | | (497,703,527 | ) | | | (533,401,775 | ) | | | (533,401,775 | ) |
Institutional Class | | | (15,684,400,140 | ) | | | (15,684,400,140 | ) | | | (36,042,906,467 | ) | | | (36,042,906,467 | ) | | | (36,943,126,319 | ) | | | (36,943,126,319 | ) |
Service Class | | | (5,022,262,556 | ) | | | (5,022,262,556 | ) | | | (8,387,318,907 | ) | | | (8,387,318,907 | ) | | | (7,848,817,003 | ) | | | (7,848,817,003 | ) |
Sweep Class | | | (92,205,909 | ) | | | (92,205,909 | ) | | | (181,259,627 | )2 | | | (181,259,627 | )2 | | | NA | | | | NA | |
| | | | | | | | | | | | | | | | | | | | | | | | |
| | | | | | | (25,911,179,789 | ) | | | | | | | (54,759,463,686 | ) | | | | | | | (55,336,720,650 | ) |
| | | | | | | | | | | | | | | | | | | | | | | | |
Net asset value of shares issued in acquisitions | | | | | | | | | | | | | | | | | | | | | | | | |
Class A | | | 0 | | | | 0 | | | | 142,146,383 | | | | 141,953,899 | | | | 0 | | | | 0 | |
Institutional Class | | | 0 | | | | 0 | | | | 3,285,966,433 | | | | 3,284,567,301 | | | | 0 | | | | 0 | |
Service Class | | | 0 | | | | 0 | | | | 1,591,650,644 | | | | 1,590,081,984 | | | | 0 | | | | 0 | |
Sweep Class | | | 0 | | | | 0 | | | | 142,739,344 | | | | 142,590,103 | | | | NA | | | | NA | |
| | | | | | | | | | | | | | | | | | | | | | | | |
| | | | | | | 0 | | | | | | | | 5,159,193,287 | | | | | | | | 0 | |
| | | | | | | | | | | | | | | | | | | | | | | | |
Net increase (decrease) in net assets resulting from capital share transactions | | | | | | | 1,562,612,616 | | | | | | | | 3,088,336,840 | | | | | | | | (1,995,199,813 | ) |
| | | | | | | | | | | | | | | | | | | | | | | | |
Total increase (decrease) in net assets | | | | | | | 1,562,632,838 | | | | | | | | 3,091,495,842 | | | | | | | | (1,995,199,814 | ) |
| | | | | | | | | | | | | | | | | | | | | | | | |
| | | | | | |
Net assets | | | | | | | | | | | | | | | | | | | | | | | | |
Beginning of period | | | | | | | 9,665,988,603 | | | | | | | | 6,574,492,761 | | | | | | | | 8,569,692,575 | |
| | | | | | | | | | | | | | | | | | | | | | | | |
End of period | | | | | | $ | 11,228,621,441 | | | | | | | $ | 9,665,988,603 | | | | | | | $ | 6,574,492,761 | |
| | | | | | | | | | | | | | | | | | | | | | | | |
Undistributed (overdistributed) net investment income | | | | | | $ | (381,312 | ) | | | | | | $ | (381,312 | ) | | | | | | $ | 20,213 | |
| | | | | | | | | | | | | | | | | | | | | | | | |
| 1. | For the eleven months ended January 31, 2011. The Fund changed its fiscal year end from February 28 to January 31, effective January 31, 2011. |
| 2. | Class commenced operations on June 30, 2010. |
The accompanying notes are an integral part of these financial statements.
| | | | | | |
| Financial Highlights | | Wells Fargo Advantage Treasury Plus Money Market Fund | | | 13 | |
| | | | | | | | | | | | | | | | | | | | | | | | | | | | |
(For a share outstanding throughout each period) | |
| | | |
| | | Six Months Ended
July 31, 2011
(Unaudited) | | | Year Ended
January 31, 20111 | | | Year Ended February 28, | |
| Class A | | | | | 2010 | | | | 2009 | | | | 2008 | | | | 2007 | | | | 2006 | 2 |
Net asset value, beginning of period | | $ | 1.00 | | | $ | 1.00 | | | $ | 1.00 | | | $ | 1.00 | | | $ | 1.00 | | | $ | 1.00 | | | $ | 1.00 | |
Net investment income | | | 0.00 | 3 | | | 0.00 | 3 | | | 0.00 | 3 | | | 0.01 | | | | 0.04 | | | | 0.04 | | | | 0.03 | |
Net realized gains (losses) on investments | | | 0.00 | 3 | | | 0.00 | 3 | | | 0.00 | | | | 0.00 | | | | 0.00 | | | | 0.00 | | | | 0.00 | |
| | | | | | | | | | | | | | | | | | | | | | | | | | | | |
Total from investment operations | | | 0.00 | 3 | | | 0.00 | 3 | | | 0.00 | 3 | | | 0.01 | | | | 0.04 | | | | 0.04 | | | | 0.03 | |
Distributions to shareholders from | | | | | | | | | | | | | | | | | | | | | | | | | | | | |
Net investment income | | | (0.00 | )3 | | | (0.00 | )3 | | | (0.00 | )3 | | | (0.01 | ) | | | (0.04 | ) | | | (0.04 | ) | | | (0.03 | ) |
Net asset value, end of period | | $ | 1.00 | | | $ | 1.00 | | | $ | 1.00 | | | $ | 1.00 | | | $ | 1.00 | | | $ | 1.00 | | | $ | 1.00 | |
Total return4 | | | 0.00 | % | | | 0.01 | % | | | 0.01 | % | | | 0.79 | % | | | 3.99 | % | | | 4.54 | % | | | 2.64 | % |
Ratios to average net assets (annualized) | | | | | | | | | | | | | | | | | | | | | | | | | | | | |
Gross expenses | | | 0.62 | % | | | 0.62 | % | | | 0.65 | % | | | 0.66 | % | | | 0.65 | % | | | 0.65 | % | | | 0.65 | % |
Net expenses | | | 0.09 | % | | | 0.18 | % | | | 0.17 | % | | | 0.48 | % | | | 0.65 | % | | | 0.65 | % | | | 0.65 | % |
Net investment income | | | 0.00 | % | | | 0.01 | % | | | 0.01 | % | | | 0.75 | % | | | 3.95 | % | | | 4.46 | % | | | 2.87 | % |
Supplemental data | | | | | | | | | | | | | | | | | | | | | | | | | | | | |
Net assets, end of period (000’s omitted) | | | $1,541,197 | | | | $1,906,066 | | | | $1,600,619 | | | | $2,482,147 | | | | $2,636,076 | | | | $2,891,708 | | | | $2,773,558 | |
| 1. | For the eleven months ended January 31, 2011. The Fund changed its fiscal year end from February 28 to January 31, effective January 31, 2011. |
| 2. | For the eleven months ended February 28, 2006. The Fund changed its fiscal year end from March 31 to February 28, effective February 28, 2006. |
| 3. | Amount represents less than $0.005. |
| 4. | Returns for periods of less than one year are not annualized. |
The accompanying notes are an integral part of these financial statements.
| | | | |
| 14 | | Wells Fargo Advantage Treasury Plus Money Market Fund | | Financial Highlights |
| | | | | | | | | | | | | | | | |
(For a share outstanding throughout each period) | | | | |
| | | |
| | | Six Months Ended
July 31, 2011
(Unaudited) | | | Year Ended
January 31, 20111 | | | Year Ended February 28, | |
| Administrator Class | | | | | 2010 | | | | 2009 | 2 |
Net asset value, beginning of period | | $ | 1.00 | | | $ | 1.00 | | | $ | 1.00 | | | $ | 1.00 | |
Net investment income | | | 0.00 | 3 | | | 0.00 | 3 | | | 0.00 | 3 | | | 0.01 | |
Net realized gains (losses) on investments | | | 0.00 | 3 | | | 0.00 | 3 | | | 0.00 | | | | 0.00 | |
| | | | | | | | | | | | | | | | |
Total from investment operations | | | 0.00 | 3 | | | 0.00 | 3 | | | 0.00 | 3 | | | 0.01 | |
Distributions to shareholders from | | | | | | | | | | | | | | | | |
Net investment income | | | (0.00 | )3 | | | (0.00 | )3 | | | (0.00 | )3 | | | (0.01 | ) |
Net asset value, end of period | | $ | 1.00 | | | $ | 1.00 | | | $ | 1.00 | | | $ | 1.00 | |
Total return4 | | | 0.00 | % | | | 0.01 | % | | | 0.01 | % | | | 0.84 | % |
Ratios to average net assets (annualized) | | | | | | | | | | | | | | | | |
Gross expenses | | | 0.35 | % | | | 0.36 | % | | | 0.38 | % | | | 0.39 | % |
Net expenses | | | 0.08 | % | | | 0.18 | % | | | 0.16 | % | | | 0.30 | % |
Net investment income | | | 0.00 | % | | | 0.01 | % | | | 0.01 | % | | | 0.73 | % |
Supplemental data | | | | | | | | | | | | | | | | |
Net assets, end of period (000’s omitted) | | | $171,009 | | | | $135,001 | | | | $180,021 | | | | $132,423 | |
| 1. | For the eleven months ended January 31, 2011. The Fund changed its fiscal year end from February 28 to January 31, effective January 31, 2011. |
| 2. | For the period from March 31, 2008 (commencement of class operations) to February 28, 2009. |
| 3. | Amount represents less than $0.005. |
| 4. | Returns for periods of less than one year are not annualized. |
The accompanying notes are an integral part of these financial statements.
| | | | | | |
| Financial Highlights | | Wells Fargo Advantage Treasury Plus Money Market Fund | | | 15 | |
| | | | | | | | | | | | | | | | | | | | | | | | | | | | |
(For a share outstanding throughout each period) | |
| | | |
| | | Six Months Ended
July 31, 2011
(Unaudited) | | | Year Ended
January 31, 20111 | | | Year Ended February 28, | |
| Institutional Class | | | | | 2010 | | | | 2009 | | | | 2008 | | | | 2007 | | | | 2006 | 2 |
Net asset value, beginning of period | | $ | 1.00 | | | $ | 1.00 | | | $ | 1.00 | | | $ | 1.00 | | | $ | 1.00 | | | $ | 1.00 | | | $ | 1.00 | |
Net investment income | | | 0.00 | 3 | | | 0.00 | 3 | | | 0.00 | 3 | | | 0.01 | | | | 0.04 | | | | 0.05 | | | | 0.03 | |
Net realized gains (losses) on investments | | | 0.00 | 3 | | | 0.00 | 3 | | | 0.00 | | | | 0.00 | | | | 0.00 | | | | 0.00 | | | | 0.00 | |
| | | | | | | | | | | | | | | | | | | | | | | | | | | | |
Total from investment operations | | | 0.00 | 3 | | | 0.00 | 3 | | | 0.00 | 3 | | | 0.01 | | | | 0.04 | | | | 0.05 | | | | 0.03 | |
Distributions to shareholders from | | | | | | | | | | | | | | | | | | | | | | | | | | | | |
Net investment income | | | (0.00 | )3 | | | (0.00 | )3 | | | (0.00 | )3 | | | (0.01 | ) | | | (0.04 | ) | | | (0.05 | ) | | | (0.03 | ) |
Net asset value, end of period | | $ | 1.00 | | | $ | 1.00 | | | $ | 1.00 | | | $ | 1.00 | | | $ | 1.00 | | | $ | 1.00 | | | $ | 1.00 | |
Total return4 | | | 0.00 | % | | | 0.01 | % | | | 0.02 | % | | | 1.08 | % | | | 4.45 | % | | | 5.01 | % | | | 3.07 | % |
Ratios to average net assets (annualized) | | | | | | | | | | | | | | | | | | | | | | | | | | | | |
Gross expenses | | | 0.23 | % | | | 0.24 | % | | | 0.26 | % | | | 0.28 | % | | | 0.26 | % | | | 0.26 | % | | | 0.26 | % |
Net expenses | | | 0.08 | % | | | 0.18 | % | | | 0.15 | % | | | 0.20 | % | | | 0.20 | % | | | 0.20 | % | | | 0.20 | % |
Net investment income | | | 0.00 | % | | | 0.01 | % | | | 0.02 | % | | | 0.81 | % | | | 4.19 | % | | | 4.93 | % | | | 3.29 | % |
Supplemental data | | | | | | | | | | | | | | | | | | | | | | | | | | | | |
Net assets, end of period (000’s omitted) | | | $7,149,167 | | | | $5,307,359 | | | | $4,091,490 | | | | $5,092,437 | | | | $2,951,408 | | | | $1,822,046 | | | | $1,166,102 | |
| 1. | For the eleven months ended January 31, 2011. The Fund changed its fiscal year end from February 28 to January 31, effective January 31, 2011. |
| 2. | For the eleven months ended February 28, 2006. The Fund changed its fiscal year end from March 31 to February 28, effective February 28, 2006. |
| 3. | Amount represents less than $0.005. |
| 4. | Returns for periods of less than one year are not annualized. |
The accompanying notes are an integral part of these financial statements.
| | | | |
| 16 | | Wells Fargo Advantage Treasury Plus Money Market Fund | | Financial Highlights |
| | | | | | | | | | | | | | | | | | | | | | | | | | | | |
(For a share outstanding throughout each period) | |
| | | |
| | | Six Months Ended
July 31, 2011
(Unaudited) | | | Year Ended
January 31, 20111 | | | Year Ended February 28, | |
| Service Class | | | | | 2010 | | | | 2009 | | | | 2008 | | | | 2007 | | | | 2006 | 2 |
Net asset value, beginning of period | | $ | 1.00 | | | $ | 1.00 | | | $ | 1.00 | | | $ | 1.00 | | | $ | 1.00 | | | $ | 1.00 | | | $ | 1.00 | |
Net investment income | | | 0.00 | 3 | | | 0.00 | 3 | | | 0.00 | 3 | | | 0.01 | | | | 0.04 | | | | 0.05 | | | | 0.03 | |
Net realized gains (losses) on investments | | | 0.00 | 3 | | | 0.00 | 3 | | | 0.00 | | | | 0.00 | | | | 0.00 | | | | 0.00 | | | | 0.00 | |
| | | | | | | | | | | | | | | | | | | | | | | | | | | | |
Total from investment operations | | | 0.00 | 3 | | | 0.00 | 3 | | | 0.00 | 3 | | | 0.01 | | | | 0.04 | | | | 0.05 | | | | 0.03 | |
Distributions to shareholders from | | | | | | | | | | | | | | | | | | | | | | | | | | | | |
Net investment income | | | (0.00 | )3 | | | (0.00 | )3 | | | (0.00 | )3 | | | (0.01 | ) | | | (0.04 | ) | | | (0.05 | ) | | | (0.03 | ) |
Net asset value, end of period | | $ | 1.00 | | | $ | 1.00 | | | $ | 1.00 | | | $ | 1.00 | | | $ | 1.00 | | | $ | 1.00 | | | $ | 1.00 | |
Total return3 | | | 0.00 | % | | | 0.01 | % | | | 0.01 | % | | | 0.88 | % | | | 4.14 | % | | | 4.70 | % | | | 2.78 | % |
Ratios to average net assets (annualized) | | | | | | | | | | | | | | | | | | | | | | | | | | | | |
Gross expenses | | | 0.52 | % | | | 0.52 | % | | | 0.55 | % | | | 0.56 | % | | | 0.55 | % | | | 0.55 | % | | | 0.55 | % |
Net expenses | | | 0.08 | % | | | 0.19 | % | | | 0.17 | % | | | 0.41 | % | | | 0.50 | % | | | 0.50 | % | | | 0.50 | % |
Net investment income | | | 0.00 | % | | | 0.01 | % | | | 0.01 | % | | | 0.93 | % | | | 4.11 | % | | | 4.61 | % | | | 2.99 | % |
Supplemental data | | | | | | | | | | | | | | | | | | | | | | | | | | | | |
Net assets, end of period (000’s omitted) | | | $2,301,589 | | | | $2,226,264 | | | | $702,363 | | | | $862,686 | | | | $1,187,468 | | | | $1,283,813 | | | | $940,104 | |
| 1. | For the eleven months ended January 31, 2011. The Fund changed its fiscal year end from February 28 to January 31, effective January 31, 2011. |
| 2. | For the eleven months ended February 28, 2006. The Fund changed its fiscal year end from March 31 to February 28, effective February 28, 2006. |
| 3. | Amount represents less than $0.005. |
| 4. | Returns for periods of less than one year are not annualized. |
The accompanying notes are an integral part of these financial statements.
| | | | | | |
| Financial Highlights | | Wells Fargo Advantage Treasury Plus Money Market Fund | | | 17 | |
| | | | | | | | |
(For a share outstanding throughout each period) | | | | |
| | |
| | | Six Months Ended
July 31, 2011
(Unaudited) | | | Year Ended
January 31, 20111 | |
| Sweep Class | | |
Net asset value, beginning of period | | $ | 1.00 | | | $ | 1.00 | |
Net investment income | | | 0.00 | 2 | | | 0.00 | 2 |
Net realized gains (losses) on investments | | | 0.00 | 2 | | | 0.00 | 2 |
| | | | | | | | |
Total from investment operations | | | 0.00 | 2 | | | 0.00 | 2 |
Distributions to shareholders from | | | | | | | | |
Net investment income | | | (0.00 | )2 | | | (0.00 | )2 |
Net asset value, end of period | | $ | 1.00 | | | $ | 1.00 | |
Total return3 | | | 0.00 | % | | | 0.01 | % |
Ratios to average net assets (annualized) | | | | | | | | |
Gross expenses | | | 0.97 | % | | | 0.97 | % |
Net expenses | | | 0.09 | % | | | 0.19 | % |
Net investment income | | | 0.00 | % | | | 0.01 | % |
Supplemental data | | | | | | | | |
Net assets, end of period (000’s omitted) | | | $65,660 | | | | $91,299 | |
| 1. | For the period from June 30, 2010 (commencement of class operations) to January 31, 2011. |
| 2. | Amount represents less than $0.005. |
| 3. | Returns for periods of less than one year are not annualized. |
The accompanying notes are an integral part of these financial statements.
| | | | |
| 18 | | Wells Fargo Advantage Treasury Plus Money Market Fund | | Notes to Financial Statements (Unaudited) |
1. ORGANIZATION
Wells Fargo Funds Trust (the “Trust”), a Delaware statutory trust organized on March 10, 1999, is an open-end management investment company registered under the Investment Company Act of 1940, as amended (the “1940 Act”). These financial statements report on Wells Fargo Advantage Treasury Plus Money Market Fund (the “Fund”) which is a diversified series of the Trust.
2. SIGNIFICANT ACCOUNTING POLICIES
The following significant accounting policies, which are consistently followed in the preparation of the financial statements of the Fund, are in conformity with U.S. generally accepted accounting principles which require management to make estimates and assumptions that affect the reported amounts of assets and liabilities, disclosure of contingent assets and liabilities at the date of the financial statements, and the reported amounts of revenues and expenses during the reporting period. Actual results could differ from those estimates.
Securities valuation
As permitted under Rule 2a-7 of the 1940 Act, securities are valued at amortized cost, which approximates fair value.
The valuation techniques used by the Fund to measure fair value are consistent with the market approach, income approach and/or cost approach, where applicable, for each security type.
Repurchase agreements
The Fund may invest in repurchase agreements and may participate in pooled repurchase agreement transactions with other funds advised by Wells Fargo Funds Management, LLC. The repurchase agreements must be fully collateralized based on values that are marked-to-market daily. The collateral may be held by an agent bank under a tri-party agreement. It is the custodian’s responsibility to value collateral daily and to take action to obtain additional collateral as necessary to maintain market value equal to or greater than the resale price. The repurchase agreements are collateralized by instruments such as U.S. Treasury, federal agency, or high-grade corporate obligations. There could be potential loss to the Fund in the event that the Fund is delayed or prevented from exercising its rights to dispose of the collateral, including the risk of a possible decline in the value of the underlying obligations during the period in which the Fund seeks to assert its rights.
Security transactions and income recognition
Securities transactions are recorded on a trade date basis. Realized gains or losses are reported on the basis of identified cost of securities delivered.
Interest income is accrued daily and bond discounts are accreted and premiums are amortized daily based on the effective interest method. To the extent debt obligations are placed on non-accrual status, any related interest income may be reduced by writing off interest receivables when the collection of all or a portion of interest has become doubtful based on consistently applied procedures. If the issuer subsequently resumes interest payments or when the collectability of interest is reasonably assured, the debt obligation is removed from non-accrual status.
Distributions to shareholders
Distributions to shareholders from net investment income are accrued daily and paid monthly. Distributions from net realized gains, if any, are recorded on the ex-dividend date. Such distributions are determined in conformity with income tax regulations, which may differ from generally accepted accounting principles.
Federal and other taxes
The Fund intends to continue to qualify as a regulated investment company by distributing substantially all of its investment company taxable income and any net realized capital gains (after reduction for capital loss carryforwards) sufficient to relieve it from all, or substantially all, federal income taxes. Accordingly, no provision for federal income taxes was required.
The Fund’s income and federal excise tax returns and all financial records supporting those returns for the prior three fiscal years are subject to examination by the federal and Delaware revenue authorities.
As of January 31, 2011, the Fund had estimated net capital loss carryforwards, which were available to offset future net realized capital gains, in the amount of $2,232,195 with $2,212,624 expiring in 2013 and $19,571 expiring in 2017.
| | | | | | |
| Notes to Financial Statements (Unaudited) | | Wells Fargo Advantage Treasury Plus Money Market Fund | | | 19 | |
Class allocations
The separate classes of shares offered by the Fund differ principally in distribution, shareholder servicing and administration fees. Shareholders of each class bear certain expenses that pertain to that particular class. All shareholders bear the common expenses of the Fund, earn income from the portfolio, and are allocated unrealized gains and losses pro rata based on the average daily net assets of each class, without distinction between share classes. Dividends are determined separately for each class based on income and expenses allocable to each class. Realized gains and losses are allocated to each class pro rata based upon the net assets of each class on the date realized. Differences in per share dividend rates generally result from the relative weightings of pro rata income and realized gain allocations and from differences in separate class expenses, including distribution, shareholder servicing and administration fees.
3. FAIR VALUATION MEASUREMENTS
Fair value measurements of investments are determined within a framework that has established a fair value hierarchy based upon the various data inputs utilized in determining the value of the Fund’s investments. The three-level hierarchy gives the highest priority to unadjusted quoted prices in active markets for identical assets or liabilities (Level 1) and the lowest priority to unobservable inputs (Level 3). The Fund’s investments are classified within the fair value hierarchy based on the lowest level of input that is significant to the fair value measurement. The inputs are summarized into three broad levels as follows:
| n | | Level 1 – quoted prices in active markets for identical securities |
| n | | Level 2 – other significant observable inputs (including quoted prices for similar securities, interest rates, prepayment speeds, credit risk, etc.) |
| n | | Level 3 – significant unobservable inputs (including the Fund’s own assumptions in determining the fair value of investments) |
The inputs or methodologies used for valuing securities are not necessarily an indication of the risk associated with investing in those securities.
At July 31, 2011, all of the Fund’s investments in securities carried at fair value were designated as Level 2 since the primary inputs include credit quality of the issuer and short-term interest rates which are observable.
Further details on the major security types can be found in the Fund’s Portfolio of Investments.
4. TRANSACTIONS WITH AFFILIATES AND OTHER EXPENSES
Advisory fee
The Trust has entered into an advisory contract with Wells Fargo Funds Management, LLC (“Funds Management”), an indirect wholly owned subsidiary of Wells Fargo & Company (“Wells Fargo”). The adviser is responsible for implementing investment policies and guidelines and for supervising the sub-adviser, who is responsible for day-to-day portfolio management of the Fund.
Pursuant to the contract, Funds Management is entitled to receive an annual advisory fee of 0.10% of the Fund’s average daily net assets.
Funds Management may retain the services of certain sub-advisers to provide daily portfolio management to the Fund. The fees related to sub-advisory services are borne directly by the adviser and do not increase the overall fees paid by the Fund to the adviser. Wells Capital Management Incorporated, an affiliate of Funds Management, is the sub-adviser to the Fund and is entitled to receive a fee from the adviser at an annual rate starting at 0.05% and declining to 0.01% as the average daily net assets of the Fund increase.
| | | | |
| 20 | | Wells Fargo Advantage Treasury Plus Money Market Fund | | Notes to Financial Statements (Unaudited) |
Administration and transfer agent fees
The Trust has entered into an administration agreement with Funds Management. Under this agreement, for providing administrative services, which includes paying fees and expenses for services provided by the transfer agent, sub-transfer agents, omnibus account servicers and record-keepers, Funds Management is entitled to receive from the Fund an annual fund level administration fee starting at 0.05% and declining to 0.03% as the average daily net assets of the Fund increase and a class level administration fee which is calculated based on the average daily net assets of each class as follows:
| | | | |
| | | Class Level Administration Fee | |
Class A, Sweep Class | | | 0.22 | % |
Institutional Class | | | 0.08 | |
Administrator Class | | | 0.10 | |
Service Class | | | 0.12 | |
Funds Management has contractually waived and/or reimbursed advisory and administration fees to the extent necessary to maintain certain net operating expense ratios for the Fund. Waiver of fees and/or reimbursement of expenses by Funds Management were made first from fund level expenses on a proportionate basis and then from class specific expenses.
Distribution fees
The Trust has adopted a Distribution Plan for Sweep Class shares of the Fund pursuant to Rule 12b-1 under the 1940 Act. Distribution fees are charged to Sweep Class shares and paid to Wells Fargo Funds Distributor, LLC, the principal underwriter, at an annual rate of 0.35% of the average daily net assets of Sweep Class shares.
Shareholder servicing fees
The Trust has entered into contracts with one or more shareholder servicing agents, whereby Class A, Service Class and Sweep Class of the Fund is charged a fee at an annual rate of 0.25% of the respective average daily net assets of each class. Administrator Class is charged a fee at an annual rate of 0.10% of its average daily net assets.
A portion of these total shareholder servicing fees were paid to affiliates of Wells Fargo.
5. ACQUISITIONS
After the close of business on July 9, 2010, the Fund acquired the net assets of Evergreen Treasury Money Market Fund and Evergreen Institutional Treasury Money Market Fund. The purpose of the transactions was to combine three funds with similar investment objectives and strategies. The acquisitions were accomplished by a tax-free exchange of all of the shares of Evergreen Treasury Money Market Fund and Evergreen Institutional Treasury Money Market Fund at an exchange ratio of 1.00 for each class. Shareholders holding Class A, Class I and Class S shares of Evergreen Treasury Money Market Fund received Class A, Service Class and Sweep Class shares, respectively, of the Fund in the reorganization. Shareholders holding Class AD, Class IS, Class I, Class IN and Class P shares of Evergreen Institutional Treasury Money Market Fund received Institutional Class, Service Class, Institutional Class, Institutional Class and Service Class shares, respectively, of the Fund in the reorganization. The investment portfolio of Evergreen Treasury Money Market Fund and Evergreen Institutional Treasury Money Market Fund with fair values of $912,239,952 and $4,245,469,766, respectively, and amortized costs of $912,239,952 and $4,245,469,766, respectively, at July 9, 2010, were the principal assets acquired by the Fund. For financial reporting purposes, assets received and shares issued by the Fund were recorded at fair value; however, the cost basis of the investments received from Evergreen Treasury Money Market Fund and Evergreen Institutional Treasury Money Market Fund were carried forward to align ongoing reporting of the Fund’s realized and unrealized gains and losses with amounts distributable to shareholders for tax purposes. The value of net assets acquired and number of shares issued were as follows:
| | | | | | | | | | |
| Acquired Fund | | Value of Net
Assets Acquired | | | Number of Shares Issued |
Evergreen Treasury Money Market Fund | | $ | 912,250,676 | | | | 142,146,383 | | | Class A |
| | | | | | | 628,695,032 | | | Service Class |
| | | | | | | 142,739,344 | | | Sweep Class |
| | | | | | |
| Notes to Financial Statements (Unaudited) | | Wells Fargo Advantage Treasury Plus Money Market Fund | | | 21 | |
| | | | | | | | | | |
| Acquired Fund | | Value of Net
Assets Acquired | | | Number of Shares Issued |
Evergreen Institutional Treasury Money Market Fund | | $ | 4,246,942,611 | | | | 3,285,966,433 | | | Institutional Class |
| | | | | | | 962, 955,612 | | | Service Class |
The aggregate net assets of the Fund immediately before and after the acquisitions were $6,570,292,760 and $11,729,486,047, respectively. Assuming the acquisitions had been completed March 1, 2010, the beginning of the annual reporting period for the Fund, the pro forma results of operations for the period ended January 31, 2011 would have been:
| | | | |
Net investment income | | $ | 1,417,483 | |
Net realized gains on investments | | $ | 3,159,002 | |
Net increase in net assets resulting from operations | | $ | 4,576,485 | |
6. INDEMNIFICATION
Under the Trust’s organizational documents, the officers and directors are indemnified against certain liabilities that may arise out of performance of their duties to the Trust. Additionally, in the normal course of business, the Trust may enter into contracts with service providers that contain a variety of indemnification clauses. The Trust’s maximum exposure under these arrangements is dependent on future claims that may be made against the Fund and, therefore, cannot be estimated.
7. NEW ACCOUNTING PRONOUNCEMENTS
In May 2011, the Financial Accounting Standards Board (“FASB”) issued Accounting Standards Update (“ASU”) No. 2011-04 “Amendments to Achieve Common Fair Value Measurement and Disclosure Requirements in U.S. GAAP and IFRSs”. ASU No. 2011-04 amends FASB ASC Topic 820, Fair Value Measurements and Disclosures, to establish common requirements for measuring fair value and for disclosing information about fair value measurements in accordance with GAAP. The ASU is effective prospectively for interim and annual periods beginning after December 15, 2011.
In April 2011, FASB issued ASU No. 2011-03 “Reconsideration of Effective Control for Repurchase Agreements”. ASU No. 2011-03 amends FASB ASC Topic 860, Transfers and Servicing, specifically the criteria required to determine whether a repurchase agreement (repo) and similar agreements should be accounted for as sales of financial assets or secured borrowings with commitments. ASU No. 2011-03 changes the assessment of effective control by focusing on the transferor’s contractual rights and obligations and removing the criterion to assess its ability to exercise those rights or honor those obligations. This could result in changes to the way entities account for certain transactions including repurchase agreements, mortgage dollar rolls and reverse repurchase agreements. The ASU will become effective on a prospective basis for new transfers and modifications to existing transactions as of the beginning of the first interim or annual period beginning on or after December 15, 2011.
As of July 31, 2011, management of the Fund is currently assessing the potential impact, in addition to expanded financial statement disclosure, that may result from adopting these ASUs.
| | | | |
| 22 | | Wells Fargo Advantage Treasury Plus Money Market Fund | | Other Information (Unaudited) |
PORTFOLIO HOLDINGS INFORMATION
The complete portfolio holdings for the Fund are publicly available on the Fund’s Web site
(www.wellsfargo.com/advantagefunds) on a monthly, seven-day delayed basis. The Fund files its complete schedule of portfolio holdings with the SEC for the first and third quarters of each fiscal year on Form N-Q, which is available without charge by visiting the SEC Web site at www.sec.gov. In addition, the Fund’s Form N-Q may be reviewed and copied at the SEC’s Public Reference Room in Washington, DC, and at regional offices in New York City, at 233 Broadway, and in Chicago, at 175 West Jackson Boulevard, Suite 900. Information about the Public Reference Room may be obtained by calling 1-800-SEC-0330.
PROXY VOTING INFORMATION
A description of the policies and procedures that the Fund uses to determine how to vote proxies relating to portfolio securities is available without charge, upon request, by calling 1-800-222-8222, visiting our Web site at www.wellsfargo.com/advantagefunds, or visiting the SEC Web site at www.sec.gov. Information regarding how the Fund voted proxies relating to portfolio securities during the most recent 12-month period ended June 30 is available without charge on the Fund’s Web site at www.wellsfargo.com/advantagefunds or by visiting the SEC Web site at www.sec.gov.
| | | | | | |
| Other Information (Unaudited) | | Wells Fargo Advantage Treasury Plus Money Market Fund | | | 23 | |
BOARD OF TRUSTEES
The following table provides basic information about the Board of Trustees (the “Trustees”) of the Trust and Officers of the Trust. This table should be read in conjunction with the Prospectus and the Statement of Additional Information1 of the Fund. Each of the Trustees and Officers listed below acts in identical capacities for the Wells Fargo Advantage family of funds, which consists of 144 funds comprising the Wells Fargo Funds Trust, Wells Fargo Variable Trust, Wells Fargo Master Trust and four closed-end funds (collectively the “Fund Complex”). All of the Trustees are also Members of the Audit and Governance Committees of each Trust in the Fund Complex. The mailing address of each Trustee and Officer is 525 Market Street, 12th Floor, San Francisco, CA 94105. Each Trustee and Officer serves an indefinite term, however, each Trustee serves such term until reaching the mandatory retirement age established by the Trustees.
Independent Trustees
| | | | | | |
Name and Year of Birth | | Position Held and Length of Service | | Principal Occupations During Past Five Years | | Other Directorships During
Past Five Years |
Peter G. Gordon
(Born 1942) | | Trustee, since 1998; Chairman, since 2005 | | Co-Founder, Chairman, President and CEO of Crystal Geyser. Water Company. Trustee Emeritus, Colby College | | Asset Allocation Trust |
Isaiah Harris, Jr.
(Born 1952) | | Trustee, since 2009 | | Retired. Prior thereto, President and CEO of BellSouth Advertising and Publishing Corp. from 2005 to 2007, President and CEO of BellSouth Enterprises from 2004 to 2005 and President of BellSouth Consumer Services from 2000 to 2003. Emeritus member of the Iowa State University Foundation Board of Governors. Emeritus Member of the Advisory Board of Iowa State University School of Business. Mr. Harris is a certified public accountant. | | CIGNA Corporation; Deluxe Corporation; Asset Allocation Trust |
Judith M. Johnson
(Born 1949) | | Trustee, since 2008 | | Retired. Prior thereto, Chief Executive Officer and Chief Investment Officer of Minneapolis Employees Retirement Fund from 1996 to 2008. Ms. Johnson is an attorney, certified public accountant and a certified managerial accountant. | | Asset Allocation Trust |
Leroy Keith, Jr.
(Born 1939) | | Trustee, since 2010 | | Chairman, Bloc Global Services (development and construction), Trustee of the Evergreen Funds from 1983 to 2010. Former Managing Director, Almanac Capital Management (commodities firm), former Partner, Stonington Partners, Inc. (private equity fund), former Director, Obagi Medical Products Co. and former Director, Lincoln Educational Services. | | Trustee, Virtus Fund Complex (consisting of 45 portfolios as of 12/31/10); Director, Diversapack Co. (packaging company); Asset Allocation Trust |
David F. Larcker
(Born 1950) | | Trustee, since 2009 | | James Irvin Miller Professor of Accounting at the Graduate School of Business, Stanford University, Director of Corporate Governance Research Program and Co-Director of The Rock Center for Corporate Governance since 2006. From 2005 to 2008, Professor of Accounting at the Graduate School of Business, Stanford University. Prior thereto, Ernst & Young Professor of Accounting at The Wharton School, University of Pennsylvania from 1985 to 2005. | | Asset Allocation Trust |
Olivia S. Mitchell
(Born 1953) | | Trustee, since 2006 | | International Foundation of Employee Benefit Plans Professor and Chair of the Department of Insurance and Risk Management, Wharton School of the University of Pennsylvania since 1993. Director of Wharton’s Pension Research Council and Boettner Center on Pensions & Retirement Research, and Research Associate at the National Bureau of Economic Research. Previously, Cornell University Professor from 1978 to 1993. | | Asset Allocation Trust |
| | | | |
| 24 | | Wells Fargo Advantage Treasury Plus Money Market Fund | | Other Information (Unaudited) |
| | | | | | |
Name and Year of Birth | | Position Held and Length of Service | | Principal Occupations During Past Five Years | | Other Directorships During
Past Five Years |
Timothy J. Penny
(Born 1951) | | Trustee, since 1996 | | President and CEO of Southern Minnesota Initiative Foundation, a non-profit organization, since 2007 and Senior Fellow at the Humphrey Institute Policy Forum at the University of Minnesota since 1995. Member of the Board of Trustees of NorthStar Education Finance, Inc., a non-profit organization, since 2007. | | Asset Allocation Trust |
Michael S. Scofield
(Born 1943) | | Trustee, since 2010 | | Currently serves on the Investment Company Institute’s Board of Governors and Executive Committee as well the In dependent Director’s Counsel Board of Governors and Executive Committee. Former Chairman of the Independent Directors Counsel. Trustee of the Evergreen Funds from 1984 to 2010. Retired Attorney, Law Offices of Michael S. Scofield and former Director and Chairman, Branded Media Corporation (multi-media branding company). | | Asset Allocation Trust |
Donald C. Willeke
(Born 1940) | | Trustee, since 1996 | | Principal of the law firm of Willeke & Daniels. General Counsel of the Minneapolis Employees Retirement Fund from 1984 until its consolidation into the Minnesota Public Employees Retirement Association on June 30, 2010. | | Asset Allocation Trust |
Officers
| | | | | | |
Name and Year of Birth | | Position Held and
Length of Service | | Principal Occupations During Past Five Years | | |
Karla M. Rabusch
(Born 1959) | | President, since 2003 | | Executive Vice President of Wells Fargo Bank, N.A. and President of Wells Fargo Funds Management, LLC since 2003. Senior Vice President and Chief Administrative Officer of Wells Fargo Funds Management, LLC from 2001 to 2003. | | |
C. David Messman
(Born 1960) | | Secretary, since 2000; Chief Legal Counsel, since 2003 | | Senior Vice President and Secretary of Wells Fargo Funds Management, LLC since 2001. Vice President and Managing Counsel of Wells Fargo Bank, N.A. since 1996. | | |
Kasey Phillips
(Born 1970) | | Treasurer, since 2008 | | Senior Vice President of Wells Fargo Funds Management, LLC since 2009. Senior Vice President of Evergreen Investment Management Company, LLC from 2006 to 2010. Treasurer of the Evergreen Funds from 2005 to 2010. Vice President and Assistant Vice President of Evergreen Investment Services, Inc. from 1999 to 2006. | | |
David Berardi
(Born 1975) | | Assistant Treasurer, since 2009 | | Vice President of Wells Fargo Funds Management, LLC since 2009 . Vice President of Evergreen Investment Management Company, LLC from 2008 to 2010. Assistant Vice President of Evergreen Investment Services, Inc. from 2004 to 2008. Manager of Fund Reporting and Control for Evergreen Investment Management Company, LLC from 2004 to 2010. | | |
Jeremy DePalma
(Born 1974) | | Assistant Treasurer, since 2009 | | Senior Vice President of Wells Fargo Funds Management, LLC since 2009. Senior Vice President of Evergreen Investment Management Company, LLC from 2008 to 2010. Vice President, Evergreen Investment Services, Inc. from 2004 to 2007. Assistant Vice President, Evergreen Investment Services, Inc. from 2000 to 2004 and the head of the Fund Reporting and Control Team within Fund Administration from 2005 to 2010. | | |
Debra Ann Early
(Born 1964) | | Chief Compliance Officer, since 2007 | | Chief Compliance Officer of Wells Fargo Funds Management, LLC since 2007. Chief Compliance Officer of Parnassus Investments from 2005 to 2007. Chief Financial Officer of Parnassus Investments from 2004 to 2007 and Senior Audit Manager of PricewaterhouseCoopers LLP from 1998 to 2004. | | |
| 1. | The Statement of Additional Information includes additional information about the Fund’s Trustees and is available, without charge, upon request, by calling 1-800-222-8222 or by visiting the Fund’s Web site at www.wellsfargo.com/advantagefunds. |
| | | | | | |
| Other Information (Unaudited) | | Wells Fargo Advantage Treasury Plus Money Market Fund | | | 25 | |
BOARD CONSIDERATION OF INVESTMENT ADVISORY AND SUB-ADVISORY AGREEMENTS:
100% Treasury Money Market Fund, Cash Investment Money Market Fund, Government Money Market Fund, Heritage Money Market Fund, Money Market Fund, Prime Investment Money Market Fund and Treasury Plus Money Market Fund
(Not all of the funds described in this Board considerations section are part of this shareholder report. This shareholder report only relates to Treasury Plus Money Market Fund.)
Each year, as required by Section 15 of the Investment Company Act of 1940 (the “1940 Act”), the Board of Trustees (the “Board”) of Wells Fargo Funds Trust (the “Trust”), all the members of which have no direct or indirect interest in the investment advisory and sub-advisory agreements and are not “interested persons” of the Trust, as defined in the 1940 Act (the “Independent Trustees”), determines whether to approve the continuation of the Trust’s investment advisory and sub-advisory agreements. In this regard, at an in person meeting held on March 24-25, 2011 (the “Meeting”), the Board reviewed and re-approved: (i) an investment advisory agreement with Wells Fargo Funds Management, LLC (“Funds Management”) for each of the 100% Treasury Money Market Fund, Cash Investment Money Market Fund, Government Money Market Fund, Heritage Money Market Fund, Money Market Fund, Prime Investment Money Market Fund and Treasury Plus Money Market Fund (collectively, the “Funds”); and (ii) an investment sub-advisory agreement with Wells Capital Management Incorporated (“Wells Capital Management”) for each of the Funds. The investment advisory agreements with Funds Management and the investment sub-advisory agreements with Wells Capital Management are collectively referred to as the “Advisory Agreements.”
At the Meeting, the Board considered the factors and reached the conclusions described below relating to the selection of Funds Management and Wells Capital Management and continuation of the Advisory Agreements. Prior to the Meeting, the Trustees conferred extensively among themselves and with representatives of Funds Management about these matters. The Board also met throughout the year and received information that was useful to them in considering the continuation of the Advisory Agreements. The Independent Trustees were assisted in their evaluation of the Advisory Agreements by independent legal counsel, from whom they received separate legal advice and with whom they met separately from Funds Management.
Nature, extent and quality of services
The Board received and considered various information regarding the nature, extent and quality of services provided to the Funds by Funds Management and Wells Capital Management under the Advisory Agreements. The Board also received and considered information provided in response to a detailed set of requests submitted by the Independent Trustees’ independent legal counsel on their behalf. The Board received and considered, among other things, information about the background and experience of senior management of Funds Management, and the qualifications, backgrounds, tenures and responsibilities of the portfolio managers primarily responsible for the day-to-day portfolio management of the Funds.
The Board evaluated the ability of Funds Management and Wells Capital Management, based on their respective financial condition, resources, reputation and other attributes, to attract and retain qualified investment professionals, including research, advisory, and supervisory personnel. The Board further considered the compliance programs and compliance records of Funds Management and Wells Capital Management. In addition, the Board took into account the administrative services provided to the Funds by Funds Management and its affiliates.
The Board’s decision to approve the continuation of the Advisory Agreements was based on a comprehensive evaluation of all of the information provided to it. In approving the continuation of the Advisory Agreements, the Board did not identify any particular information or consideration that was all-important or controlling, and each Trustee attributed different weights to various factors. The Board evaluated information provided to it both in terms of the funds generally and with respect to each Fund specifically as it considered appropriate. Although the Board considered the continuation of the Advisory Agreements for each of the Funds as part of the larger process of considering the continuation of the advisory agreements for all of the funds, its decision to continue the Advisory Agreements for each of the Funds was ultimately made on a fund-by-fund basis.
In considering these matters, the Board considered not only the specific information presented in connection with the Meeting, but also the knowledge gained over time through interaction with Funds Management and Wells Capital
| | | | |
| 26 | | Wells Fargo Advantage Treasury Plus Money Market Fund | | Other Information (Unaudited) |
Management about various topics, including Funds Management’s oversight of service providers. The above factors, together with those referenced below, are some of the most important, but not necessarily all, factors considered by the Board in concluding that it was satisfied with the nature, extent and quality of the investment advisory services provided to each Fund by Funds Management and Wells Capital Management.
fund performance and expenses
The Board considered the performance results for each of the Funds over various time periods ended December 31, 2010. The Board also considered these results in comparison to the median performance of a universe of relevant funds (the “Universe”) that were determined by Lipper Inc. (“Lipper”) to be similar to the Funds, and in comparison to each Fund’s benchmark index and to other comparative data. Lipper is an independent provider of investment company data. The Board received a description of the methodology used by Lipper to select the mutual funds in the Universe.
The Board noted that the performance of each of the Funds was higher than or in range of the median performance of the Universe for the periods under review, except for the Money Market Fund (Class B).
The Board received and considered information regarding each Fund’s contractual advisory fee and net operating expense ratios and their various components, including actual management fees (which reflect fee waivers, if any), transfer agent, custodian and other non-management fees, Rule 12b-1 and non-Rule 12b-1 fees, service fees and fee waiver and expense reimbursement arrangements. The Board also considered these ratios in comparison to the median ratios of an expense Universe and a narrower expense group of mutual funds (each, an “Expense Group”) that was determined by Lipper to be similar to each Fund. The Board received a description of the methodology used by Lipper to select the mutual funds in a Fund’s Expense Group. The Board noted that the net operating expense ratios of the Service Class, Administrator Class, Institutional Class and Select Class of each of the Funds were in range of each Fund’s respective Expense Group’s median net operating expense ratio, except for the 100% Treasury Money Market Fund (Service Class). The Board also noted that the net operating expense ratios of the Class A and Sweep Class of each of the Funds, the Money Market Fund (A, B, C, Daily and Investor Classes) were higher than each Fund’s respective Expense Group’s median net operating expense ratio.
Based on the above-referenced considerations and other factors, the Board concluded that the overall performance and expense structure of the Funds supported the re-approval of the Advisory Agreements for the Funds.
Investment advisory and sub-advisory fee rates
The Board reviewed and considered the contractual investment advisory fee rates that are payable by the Funds to Funds Management for investment advisory services (the “Advisory Agreement Rates”), both on a stand-alone basis and on a combined basis with the Funds’ administration fee rates. The Board took into account the separate administrative and other services covered by the administration fee rates. The Board also reviewed and considered the contractual investment sub-advisory fee rates that are payable by Funds Management to Wells Capital Management for investment sub-advisory services (the “Sub-Advisory Agreement Rates”). In addition, the Board reviewed and considered the existing fee waiver/cap arrangements applicable to the Advisory Agreement Rates and considered the Advisory Agreement Rates after taking the waivers/caps into account (the “Net Advisory Rates”).
The Board received and considered information comparing the Advisory Agreement Rates and Net Advisory Rates with those of other funds in each Fund’s Expense Group median. The Board noted that the Advisory Agreement Rates for the Class A, Service Class, Administrator Class, Institutional Class and Select Class of each of the Funds were in range of each Fund’s respective Expense Group, except for the 100% Treasury Money Market Fund (Administrator Class). The Board noted that the Advisory Agreement Rates for the Sweep Class of each of the Funds was not appreciably higher than the median rate of each Fund’s Expense Group, except for the 100% Treasury Money Market Fund. The Board also noted that the Advisory Agreement Rates for the Money Market Fund (Class B, Class C, Daily Class and Investor Class) were higher than the median rate of the Expense Group. The Board noted that the Net Advisory Rates for the Service Class, Administrator Class, Institutional Class and Select Class of each of the Funds were in range of each Fund’s respective Expense Group. The Board also noted that the Net Advisory Rates for the Class A and Sweep Class of each of the Funds and the Money Market Fund (Class B, Class C, Daily Class and Investor Class) were higher than each Fund’s respective Expense Group. The Board further noted that Funds Management had agreed to continue and, in certain instances, reduce contractual fee cap arrangements for the Funds designed to lower the Funds’ expenses.
| | | | | | |
| Other Information (Unaudited) | | Wells Fargo Advantage Treasury Plus Money Market Fund | | | 27 | |
The Board also received and considered information about the nature and extent of services offered and fee rates charged by Funds Management and Wells Capital Management to other types of clients. In this regard, the Board received information about differences between the services, and the compliance, reporting, and other legal burdens and risks of providing investment advice to mutual funds and those associated with providing advice to non-mutual fund clients such as collective funds or institutional separate accounts.
In each case, the Board determined that the Advisory Agreement Rates for the Funds, both with and without administration fee rates and before and after waivers, were acceptable in light of the Funds’ Expense Group information, the net expense ratio commitments, the services covered by the Advisory Agreements and other information provided. The Board also reviewed and considered the Sub-Advisory Agreement Rates and concluded that the Sub-Advisory Agreement Rates were acceptable in light of the services covered by the Sub-Advisory Agreement and other information provided.
Profitability
The Board received and considered a profitability analysis of Funds Management, as well as an analysis of the profitability to the collective Wells Fargo businesses that provide services to the Funds. It considered that the information provided to it was necessarily estimated, and that the profitability information provided to it, especially on a fund-by-fund basis, did not necessarily provide a precise tool for evaluating the appropriateness of each Fund’s Advisory Agreement Rates in isolation. It noted that the levels of profitability of the Funds to Funds Management varied widely, depending on, among other things, the size and type of fund. The Board concluded that the profitability to Funds Management of the services provided to any of the Funds, individually or in the aggregate, was not unreasonable.
The Board did not consider separate profitability information with respect to Wells Capital Management, because, as an affiliate of Funds Management, its profitability information was subsumed in the collective Wells Fargo profitability analysis provided by Funds Management.
Economies of scale
With respect to possible economies of scale, the Board reviewed the breakpoints in each Fund’s advisory fee structure, which operate generally to reduce the effective Advisory Agreement Rates of the Funds (as a percentage of Fund assets) as the Funds grow in size. It considered that, as a fund shrinks in size, breakpoints conversely result in increasing fee levels. The Board noted that it would continue to review the appropriate levels of breakpoints in the future, and concluded that the breakpoints as implemented appeared to be a reasonable step toward sharing economies of scale with the Funds. However, the Board acknowledged the inherent limitations of any analysis of an investment adviser’s economies of scale and of any attempt to correlate breakpoints with such economies, stemming largely from the Board’s understanding that economies of scale are realized, if at all, by an investment adviser across a variety of products and services, not just with respect to a single fund.
Other benefits to Funds Management and Wells Capital Management
The Board received and considered information regarding potential “fall-out” or ancillary benefits received by Funds Management and its affiliates, including Wells Capital Management, as a result of their relationship with the Funds. Ancillary benefits could include, among others, benefits directly attributable to the relationship of Funds Management and Wells Capital Management with the Funds and benefits potentially derived from an increase in Funds Management’s and Wells Capital Management’s business as a result of their relationship with the Funds (such as the ability to market to shareholders other financial products offered by Funds Management and its affiliates, including Wells Capital Management).
The Board considered that Wells Fargo Funds Distributor, LLC, an affiliate of Funds Management, serves as distributor to the Funds and receives certain compensation for those services. The Board noted that the Funds pay sub-transfer agency fees to various financial institutions, including affiliates of Funds Management that hold fund shares in omnibus accounts. It also considered that these entities may receive distribution-related fees and shareholder servicing payments (including amounts derived from payments under the funds’ Rule 12b-1 plans) in respect of shares sold or held through them.
The Board also reviewed information about whether and to what extent soft dollar credits are sought and how any such credits are utilized and any benefits that may be realized by using an affiliated broker.
| | | | |
| 28 | | Wells Fargo Advantage Treasury Plus Money Market Fund | | Other Information (Unaudited) |
Other factors and broader review
The Board also considered the markets for distribution of the Funds’ shares, including the multiple channels through which the Funds’ shares are offered and sold. The Board noted that the Funds are part of one of the few fund families that have both direct-to-fund and intermediary distribution channels. As discussed above, the Board reviews detailed materials received from Funds Management and Wells Capital Management annually as part of the re-approval process under Section 15 of the 1940 Act and also reviews and assesses information about the quality of the services that the Funds receive throughout the year. In this regard, the Board has reviewed reports of Funds Management at each of its quarterly meetings, which include, among other things, portfolio reviews and performance reports. In addition, the Board confers with portfolio managers at various times throughout the year.
Conclusion
After considering the above-described factors and based on its deliberations and its evaluation of the information described above, the Board concluded that approval of the continuation of the Advisory Agreements for the Funds was in the best interest of the Funds and their shareholders. Accordingly, the Board unanimously approved the continuation of the Advisory Agreements for an additional one-year period.
| | | | | | |
| List of Abbreviations | | Wells Fargo Advantage Treasury Plus Money Market Fund | | | 29 | |
The following is a list of common abbreviations for terms and entities which may have appeared in this report.
| ABAG | — Association of Bay Area Governments |
| ACB | — Agricultural Credit Bank |
| ADR | — American Depositary Receipt |
| ADS | — American Depository Shares |
| AGC-ICC | — Assured Guaranty Corporation - Insured Custody Certificates |
| AGM | — Assured Guaranty Municipal |
| AMBAC | — American Municipal Bond Assurance Corporation |
| AMT | — Alternative Minimum Tax |
| ARM | — Adjustable Rate Mortgages |
| BAN | — Bond Anticipation Notes |
| BART | — Bay Area Rapid Transit |
| BHAC | — Berkshire Hathaway Assurance Corporation |
| CCAB | — Convertible Capital Appreciation Bond |
| CDA | — Community Development Authority |
| CDO | — Collateralized Debt Obligation |
| CDSC | — Contingent Deferred Sales Charge |
| CGIC | — Capital Guaranty Insurance Company |
| CGY | — Capital Guaranty Corporation |
| CIFG | — CDC (Caisse des Dépôts et Consignations) IX IS Financial Guarantee |
| COP | — Certificate of Participation |
| DRIVER | — Derivative Inverse Tax-Exempt Receipts |
| DW&P | — Department of Water & Power |
| DWR | — Department of Water Resources |
| ECFA | — Educational & Cultural Facilities Authority |
| EDFA | — Economic Development Finance Authority |
| ETET | — Eagle Tax-Exempt Trust |
| ETF | — Exchange-Traded Fund |
| FFCB | — Federal Farm Credit Bank |
| FGIC | — Financial Guaranty Insurance Corporation |
| FHA | — Federal Housing Authority |
| FHAG | — Federal Housing Agency |
| FHLB | — Federal Home Loan Bank |
| FHLMC | — Federal Home Loan Mortgage Corporation |
| FNMA | — Federal National Mortgage Association |
| GDR | — Global Depositary Receipt |
| GNMA | — Government National Mortgage Association |
| HCFR | — Healthcare Facilities Revenue |
| HEFA | — Health & Educational Facilities Authority |
| HEFAR | — Higher Education Facilities Authority Revenue |
| HFA | — Housing Finance Authority |
| HFFA | — Health Facilities Financing Authority |
| HUD | — Housing & Urban Development |
| IBC | — Insured Bond Certificate |
| IDA | — Industrial Development Authority |
| IDAG | — Industrial Development Agency |
| IDR | — Industrial Development Revenue |
| KRW | — Republic of Korea Won |
| LIBOR | — London Interbank Offered Rate |
| LLC | — Limited Liability Company |
| LLP | — Limited Liability Partnership |
| MBIA | — Municipal Bond Insurance Association |
| MFHR | — Multi-Family Housing Revenue |
| MFMR | — Multi-Family Mortgage Revenue |
| MMD | — Municipal Market Data |
| MSTR | — Municipal Securities Trust Receipts |
| MUD | — Municipal Utility District |
| NATL-RE | — National Public Finance Guarantee Corporation |
| PCFA | — Pollution Control Finance Authority |
| PCR | — Pollution Control Revenue |
| PFA | — Public Finance Authority |
| PFFA | — Public Facilities Financing Authority |
| PFOTER | — Puttable Floating Option Tax-Exempt Receipts |
| plc | — Public Limited Company |
| PSFG | — Public School Fund Guaranty |
| PUTTER | — Puttable Tax-Exempt Receipts |
| R&D | — Research & Development |
| RDA | — Redevelopment Authority |
| RDFA | — Redevelopment Finance Authority |
| REIT | — Real Estate Investment Trust |
| RIB | — Residual Interest Bond |
| ROC | — Reset Option Certificates |
| SAVRS | — Select Auction Variable Rate Securities |
| SFHR | — Single Family Housing Revenue |
| SFMR | — Single Family Mortgage Revenue |
| SLMA | — Student Loan Marketing Association |
| SPDR | — Standard & Poor’s Depositary Receipts |
| STIT | — Short-Term Investment Trust |
| TAN | — Tax Anticipation Notes |
| TIPS | — Treasury Inflation-Protected Securities |
| TRAN | — Tax Revenue Anticipation Notes |
| TCR | — Transferable Custody Receipts |
| TTFA | — Transportation Trust Fund Authority |
| USD | — Unified School District |
| XLCA | — XL Capital Assurance |
This page is intentionally left blank.


FOR MORE INFORMATION
More information about Wells Fargo Advantage Funds is available free upon request. To obtain literature, please write, e-mail, visit the Funds’ Web site, or call:
Wells Fargo Advantage Funds
P.O. Box 8266
Boston, MA 02266-8266
E-mail: wfaf@wellsfargo.com
Web site: www.wellsfargo.com/advantagefunds
Individual investors: 1-800-222-8222
Retail investment professionals: 1-888-877-9275
Institutional investment professionals: 1-866-765-0778
This report and the financial statements contained herein are submitted for the general information of the shareholders of Wells Fargo Advantage Funds. If this report is used for promotional purposes, distribution of the report must be accompanied or preceded by a current prospectus. For a prospectus containing more complete information, including charges and expenses, call 1-800-222-8222 or visit the Funds’ Web site at www.wellsfargo.com/advantagefunds. Please consider the investment objectives, risks, charges, and expenses of the investment carefully before investing. This and other information about Wells Fargo Advantage Funds can be found in the current prospectus. Read the prospectus carefully before you invest or send money.
Wells Fargo Funds Management, LLC, a wholly owned subsidiary of Wells Fargo & Company, provides investment advisory and administrative services for Wells Fargo Advantage Funds. Other affiliates of Wells Fargo & Company provide subadvisory and other services for the Funds. The Funds are distributed by Wells Fargo Funds Distributor, LLC, Member FINRA/SIPC, an affiliate of Wells Fargo & Company.
NOT FDIC INSURED ¡ NO BANK GUARANTEE ¡ MAY LOSE VALUE
© 2011 Wells Fargo Funds Management, LLC. All rights reserved.
| | |
 | | 204810 09-11 SA314/SAR314 7-11 |
Not required in this filing
| ITEM 3. | AUDIT COMMITTEE FINANCIAL EXPERT |
Not required in this filing.
| ITEM 4. | PRINCIPAL ACCOUNTANT FEES AND SERVICES |
Not required in this filing.
| ITEM 5. | AUDIT COMMITTEE OF LISTED REGISTRANTS |
Not required in this filing.
| ITEM 6. | SCHEDULE OF INVESTMENTS |
The Schedule of Investments is included as part of the report to shareholders filed under Item 1 of this Form.
| ITEM 7. | DISCLOSURE OF PROXY VOTING POLICIES AND PROCEDURES FOR CLOSED-END MANAGEMENT INVESTMENT COMPANIES |
Not applicable.
| ITEM 8. | PORTFOLIO MANAGERS OF CLOSED-END MANAGEMENT INVESTMENT COMPANIES |
Not applicable.
| ITEM 9. | PURCHASES OF EQUITY SECURITIES BY CLOSED-END MANAGEMENT INVESTMENT COMPANY AND AFFILIATED PURCHASES |
Not applicable.
| ITEM 10. | SUBMISSION OF MATTERS TO A VOTE OF SECURITY HOLDERS |
The Governance Committee (the “Committee”) of the Board of Trustees of the registrant (the “Trust”) has adopted procedures by which a shareholder of any series of the Trust may submit properly a nominee recommendation for the Committee’s consideration.
The shareholder must submit any such recommendation (a “Shareholder Recommendation”) in writing to the Trust, to the attention of the Trust’s Secretary, at the address of the principal executive offices of the Trust.
The Shareholder Recommendation must be delivered to, or mailed and received at, the principal executive offices of the Trust not less than forty-five (45) calendar days nor more than seventy-five (75) calendar days prior to the date of the Committee meeting at which the nominee would be considered.
The Shareholder Recommendation must include: (i) a statement in writing setting forth (A) the name, age, date of birth, business address, residence address and nationality of the person recommended by the shareholder (the “candidate”); (B) the series (and, if applicable, class) and number of all shares of the Trust owned of record or beneficially by the candidate, as reported to such shareholder by the candidate; (C) any other information regarding the candidate called for with respect to director nominees by paragraphs (a), (d), (e) and (f) of Item 401 of Regulation S-K or paragraph (b) of Item 22 of Rule 14a-101 (Schedule 14A) under the Securities Exchange Act of 1934, as amended (the “Exchange Act”), adopted by the Securities and Exchange Commission (or the corresponding provisions of any regulation or rule subsequently adopted by the Securities and Exchange Commission or any successor agency applicable to the Trust); (D) any other information regarding the candidate that would be required to be disclosed if the candidate were a nominee in a proxy statement or other filing required to be made in connection with solicitation of proxies for election of directors pursuant to Section 14 of the Exchange Act and the rules and regulations promulgated thereunder; and (E) whether the recommending shareholder believes that the candidate is or will be an “interested person” of the Trust (as defined in the Investment Company Act of 1940, as amended) and, if not an “interested person,” information regarding the candidate that will be sufficient for the Trust to make such determination; (ii) the written and signed consent of the candidate to be named as a nominee and to serve as a Trustee if elected; (iii) the recommending shareholder’s name as it appears on the Trust’s books; (iv) the series (and, if applicable, class) and number of all shares of the Trust owned beneficially and of record by the recommending shareholder; and (v) a description of all arrangements or understandings between the recommending shareholder and the candidate and any other person or persons (including their names) pursuant to which the recommendation is being made by the recommending shareholder. In addition, the Committee may require the
candidate to interview in person and furnish such other information as it may reasonably require or deem necessary to determine the eligibility of such candidate to serve as a Trustee of the Trust.
| ITEM 11. | CONTROLS AND PROCEDURES |
(a) The President and Treasurer have concluded that the Wells Fargo Funds Trust (the “Trust”) disclosure controls and procedures (as defined in Rule 30a-3(c) under the Investment Company Act of 1940) provide reasonable assurances that material information relating to the Trust is made known to them by the appropriate persons, based on their evaluation of these controls and procedures as of a date within 90 days of the filing of this report.
(b) There were no significant changes in the Trust’s internal controls over financial reporting (as defined in Rule 30a-3(d) under the Investment Company Act of 1940) that occurred during the second quarter of the period covered by this report that materially affected, or is reasonably likely to materially affect, the registrant’s internal control over financial reporting.
(a)(1) Not required in this filing.
(a)(2) Certification pursuant to Rule 30a-2(a) under the Investment Company Act of 1940 (17 CFR 270.30a-2(a)) is filed and attached hereto as Exhibit 99.CERT.
(a)(3) Not applicable.
(b) Certification pursuant to Rule 30a-2(b) under the Investment Company Act of 1940 (17 CFR 270.30a-2(b)) is filed and attached hereto as Exhibit 99.906CERT.
SIGNATURES
Pursuant to the requirements of the Securities Exchange Act of 1934 and the Investment Company Act of 1940, the registrant has duly caused this report to be signed on its behalf by the undersigned, thereunto duly authorized.
| | |
Wells Fargo Funds Trust |
| |
By: | | |
| | /s/ Karla M. Rabusch |
| | Karla M. Rabusch |
| | President |
| |
| Date: | | September 28, 2011 |
Pursuant to the requirements of the Securities Exchange Act of 1934 and the Investment Company Act of 1940, this report has been signed below by the following persons on behalf of the registrant and in the capacities and on the date indicated.
| | |
By: | | |
| | /s/ Karla M. Rabusch |
| | Karla M. Rabusch |
| | President |
| |
Date: | | September 28, 2011 |
| |
By: | | |
| | /s/ Kasey L. Phillips |
| | Kasey L. Phillips |
| | Treasurer |
| |
Date: | | September 28, 2011 |