
UNITED STATES
SECURITIES AND EXCHANGE COMMISSION
Washington, D.C. 20549
FORM N-CSRS
CERTIFIED SHAREHOLDER REPORT OF REGISTERED
MANAGEMENT INVESTMENT COMPANIES
Investment Company Act file number: 811-09253
Wells Fargo Funds Trust
(Exact name of registrant as specified in charter)
525 Market St., San Francisco, CA 94105
(Address of principal executive offices) (Zip code)
C. David Messman
Wells Fargo Funds Management, LLC
525 Market St., San Francisco, CA 94105
(Name and address of agent for service)
Registrant’s telephone number, including area code: 800-643-9691
Date of fiscal year end: December 31, 2010
Date of reporting period: June 30, 2011
| ITEM 1. | REPORT TO SHAREHOLDERS |


Semi-Annual Report
June 30, 2011
WELLS FARGO MANAGED ACCOUNT COREBUILDER SHARESSM
Reduce clutter. Save trees.
Sign up for electronic delivery of prospectuses and shareholder reports at www.wellsfargo.com/advantagedelivery
Contents
The views expressed and any forward-looking statements are as of June 30, 2011 and are those of the Fund managers and/or Wells Fargo Funds Management, LLC. Discussions of individual securities, or the markets generally, or any Wells Fargo Advantage Fund are not intended as individual recommendations. Future events or results may vary significantly from those expressed in any forward-looking statements; the views expressed are subject to change at any time in response to changing circumstances in the market. Wells Fargo Funds Management, LLC, disclaims any obligation to publicly update or revise any views expressed or forward-looking statements.
NOT FDIC INSURED ¡ NO BANK GUARANTEE ¡ MAY LOSE VALUE
| | | | |
| 2 | | Wells Fargo Managed Account CoreBuilder Shares – Series G | | Performance Highlights |
Wells Fargo Managed Account CoreBuilder Shares – Series G
INVESTMENT OBJECTIVE
The Fund seeks total return, consisting of current income and capital appreciation.
ADVISER
Wells Fargo Funds Management, LLC
SUB-ADVISER
Wells Capital Management Incorporated
PORTFOLIO MANAGER
Michael J. Bray, CFA
FUND INCEPTION
April 14, 2008
| | |
PORTFOLIO ALLOCATION1
(AS OF JUNE 30, 2011) |
|
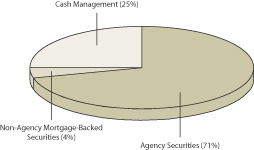 |
| 1. | Portfolio allocation is subject to change and is calculated based on the total investments of the Fund. |
| | | | | | |
| Performance Highlights | | Wells Fargo Managed Account CoreBuilder Shares – Series G | | | 3 | |
Wells Fargo Managed Account CoreBuilder Shares – Series G (continued)
AVERAGE ANNUAL TOTAL RETURN (%) (AS OF JUNE 30, 2011)
| | | | | | | | | | | | | | | | |
| | | Inception Date | | | 6 Months* | | | 1 Year | | | Life of Fund | |
Series G | | | 04/14/2008 | | | | 2.77 | | | | 4.31 | | | | 6.98 | |
Barclays Capital U.S. Securitized Index2 | | | | | | | 2.94 | | | | 4.37 | | | | 6.22 | |
| * | Returns for periods of less than one year are not annualized. |
Figures quoted represent past performance, which is no guarantee of future results and do not reflect the deduction of taxes that a shareholder may pay on fund distributions or the redemption of fund shares. Investment return and principal value of an investment will fluctuate so that an investor’s shares, when redeemed, may be worth more or less than their original cost. Current performance may be lower or higher than the performance data quoted. Current month-end performance is available by calling 800-368-0627.
Bond fund values fluctuate in response to the financial condition of individual issuers, general market and economic conditions, and changes in interest rates. In general, when interest rates rise, bond fund values fall and investors may lose principal value. The use of derivatives may reduce returns and/or increase volatility. Securities issued by U.S. Government agencies or government-sponsored entities may not be guaranteed by the U.S. Treasury. Active trading results in increased turnover and trading expenses, and may generate higher short-term capital gains. Certain investment strategies tend to increase the total risk of an investment (relative to the broader market). This Fund is exposed to mortgage- and asset-backed securities risk. Consult the Fund’s prospectus for additional information on these and other risks. The U.S. Government guarantee applies to certain of the underlying securities and NOT to the shares of the Fund.
CoreBuilder Shares are a series of investment options within the separately managed accounts advised or subadvised by Wells Fargo Funds Management, LLC. The shares are fee-waived mutual funds that enable certain separately managed account investors to achieve greater diversification than smaller managed accounts might otherwise achieve.
| 2. | The Barclays Capital U.S. Securitized Index is an unmanaged composite of asset-backed securities, collateralized mortgage-backed securities (ERISA-eligible) and fixed rate mortgage-backed securities. You cannot invest directly in an index. |
| | | | |
| 4 | | Wells Fargo Managed Account CoreBuilder Shares – Series G | | Fund Expenses |
As a shareholder of the Fund, you incur two types of costs: (1) transaction costs, including sales charges (loads) on purchase payments, redemption fees (if any) and exchange fees (if any); and (2) ongoing costs, including management fees; distribution (12b-1) and/or shareholder service fees; and other Fund expenses. This example is intended to help you understand your ongoing costs (in dollars) of investing in the Fund and to compare these costs with the ongoing costs of investing in other mutual funds.
The example is based on an investment of $1,000 invested at the beginning of the six-month period and held for the entire period from January 1, 2011 to June 30, 2011.
Actual Expenses
The “Actual” line of the table below provides information about actual account values and actual expenses. You may use the information in this line, together with the amount you invested, to estimate the expenses that you paid over the period. Simply divide your account value by $1,000 (for example, an $8,600 account value divided by $1,000 = 8.6), then multiply the result by the number in the “Actual” line under the heading entitled “Expenses Paid During Period” for your applicable class of shares to estimate the expenses you paid on your account during this period.
Hypothetical Example for Comparison Purposes
The “Hypothetical” line of the table below provides information about hypothetical account values and hypothetical expenses based on the Fund’s actual expense ratio and an assumed rate of return of 5% per year before expenses, which is not the Fund’s actual return. The hypothetical account values and expenses may not be used to estimate the actual ending account balance or expenses you paid for the period. You may use this information to compare the ongoing costs of investing in the Fund and other funds. To do so, compare this 5% hypothetical example with the 5% hypothetical examples that appear in the shareholder reports of the other funds.
Please note that the expenses shown in the table are meant to highlight your ongoing costs only and do not reflect any transactional costs, such as sales charges (loads), redemption fees, or exchange fees. Therefore, the “Hypothetical” line of the table is useful in comparing ongoing costs only, and will not help you determine the relative total costs of owning different funds. In addition, if these transactional costs were included, your costs would have been higher.
| | | | | | | | | | | | | | | | |
| | | Beginning
Account Value
01-01-2011 | | | Ending
Account Value
06-30-2011 | | | Expenses
Paid During
the Period1 | | | Net Annual
Expense Ratio | |
| | | | |
Actual | | $ | 1,000.00 | | | $ | 1,027.70 | | | $ | 0.00 | | | | 0.00 | % |
Hypothetical (5% return before expenses) | | $ | 1,000.00 | | | $ | 1,024.79 | | | $ | 0.00 | | | | 0.00 | % |
| 1. | Expenses paid is equal to the annualized expense ratio multiplied by the average account value over the period, multiplied by the number of days in the most recent fiscal half-year divided by the number of days in the fiscal year (to reflect the one-half year period). |
| | | | | | |
| Portfolio of Investments—June 30, 2011 (Unaudited) | | Wells Fargo Managed Account CoreBuilder Shares – Series G | | | 5 | |
| | | | | | | | | | | | | | | | |
| Security Name | | Interest Rate | | | Maturity Date | | | Principal | | | Value | |
| | | | | | | | | | | | | | | | |
| | | | |
| Agency Securities: 109.16% | | | | | | | | | | | | | | | | |
FHLMC%% | | | 4.00 | % | | | 11/15/2039 | | | $ | 810,000 | | | $ | 809,240 | |
FHLMC #A77459 | | | 7.50 | | | | 05/01/2038 | | | | 43,700 | | | | 50,247 | |
FHLMC #A93454 | | | 5.00 | | | | 08/01/2040 | | | | 47,947 | | | | 51,004 | |
FHLMC #F60001 | | | 4.50 | | | | 01/01/2024 | | | | 138,199 | | | | 146,456 | |
FHLMC Series 3748 Class D | | | 4.00 | | | | 11/15/2039 | | | | 75,000 | | | | 73,967 | |
FHLMC Series T-42 Class A5 | | | 7.50 | | | | 02/25/2042 | | | | 106,147 | | | | 124,961 | |
FHLMC Structured Pass-Through Securities Series T-59 Class 2A1± | | | 3.54 | | | | 10/25/2043 | | | | 75,271 | | | | 77,025 | |
FNMA%% | | | 4.00 | | | | 03/25/2024 | | | | 550,000 | | | | 572,859 | |
FNMA%% | | | 4.00 | | | | 02/25/2039 | | | | 560,000 | | | | 560,000 | |
FNMA%% | | | 4.50 | | | | 02/25/2039 | | | | 310,000 | | | | 320,705 | |
FNMA%% | | | 5.00 | | | | 07/25/2036 | | | | 752,000 | | | | 799,000 | |
FNMA%% | | | 5.00 | | | | 02/20/2040 | | | | 425,000 | | | | 455,945 | |
FNMA%% | | | 5.50 | | | | 03/25/2035 | | | | 2,135,000 | | | | 2,308,469 | |
FNMA%% | | | 5.50 | | | | 03/25/2035 | | | | 141,000 | | | | 152,809 | |
FNMA%% | | | 6.00 | | | | 08/25/2035 | | | | 1,585,000 | | | | 1,741,024 | |
FNMA #256986 | | | 7.00 | | | | 11/01/2037 | | | | 28,731 | | | | 32,761 | |
FNMA #257307 | | | 6.00 | | | | 08/01/2038 | | | | 131,781 | | | | 144,865 | |
FNMA #460207 | | | 5.60 | | | | 11/01/2013 | | | | 94,472 | | | | 100,522 | |
FNMA #461110 | | | 4.62 | | | | 07/01/2013 | | | | 101,134 | | | | 105,395 | |
FNMA #462846 | | | 4.15 | | | | 07/01/2014 | | | | 97,486 | | | | 103,281 | |
FNMA #464369 | | | 3.32 | | | | 02/01/2015 | | | | 166,487 | | | | 173,242 | |
FNMA #464495 | | | 4.68 | | | | 02/01/2020 | | | | 29,684 | | | | 31,601 | |
FNMA #888707 | | | 7.50 | | | | 10/01/2037 | | | | 116,891 | | | | 135,935 | |
FNMA #934370 | | | 5.50 | | | | 08/01/2038 | | | | 71,199 | | | | 77,465 | |
FNMA #941312 | | | 6.50 | | | | 07/01/2037 | | | | 193,931 | | | | 219,973 | |
FNMA #976190 | | | 7.50 | | | | 05/01/2038 | | | | 30,434 | | | | 35,258 | |
FNMA #987853 | | | 5.50 | | | | 08/01/2038 | | | | 139,761 | | | | 152,060 | |
FNMA #991906 | | | 6.00 | | | | 11/01/2038 | | | | 215,644 | | | | 237,055 | |
FNMA #995591 | | | 7.00 | | | | 03/01/2024 | | | | 138,148 | | | | 149,926 | |
FNMA #AB1469 | | | 4.50 | | | | 09/01/2040 | | | | 511,933 | | | | 530,406 | |
FNMA #AD9194## | | | 5.00 | | | | 08/01/2040 | | | | 1,438,974 | | | | 1,531,840 | |
FNMA #AE0113 | | | 4.00 | | | | 07/01/2040 | | | | 679,341 | | | | 681,475 | |
FNMA #AE2084 | | | 4.50 | | | | 08/01/2025 | | | | 205,577 | | | | 218,308 | |
FNMA #AE2148 | | | 3.50 | | | | 02/01/2026 | | | | 137,189 | | | | 139,941 | |
FNMA #AE3049## | | | 4.50 | | | | 09/01/2040 | | | | 1,164,622 | | | | 1,206,646 | |
FNMA #AE6219 | | | 4.00 | | | | 12/01/2040 | | | | 44,418 | | | | 44,481 | |
FNMA #AH0313## | | | 4.00 | | | | 12/01/2040 | | | | 634,222 | | | | 635,117 | |
FNMA Series 2005-W4 Class 3A± | | | 3.16 | | | | 06/25/2035 | | | | 48,739 | | | | 50,514 | |
FNMA Whole Loan Series 2004-W11 Class 1A3 | | | 7.00 | | | | 05/25/2044 | | | | 116,391 | | | | 134,971 | |
FNMA Whole Loan Series 2004-W15 Class 1A3 | | | 7.00 | | | | 08/25/2044 | | | | 79,935 | | | | 91,089 | |
GNMA%% | | | 4.50 | | | | 12/25/2018 | | | | 765,000 | | | | 805,043 | |
GNMA #4747 | | | 5.00 | | | | 07/20/2040 | | | | 460,318 | | | | 500,284 | |
GNMA Series 2002-53 Class IO(c) | | | 0.26 | | | | 04/16/2042 | | | | 1,610,220 | | | | 6,261 | |
GNMA Series 2004-10 Class C | | | 4.67 | | | | 07/16/2031 | | | | 125,000 | | | | 134,248 | |
GNMA Series 2005-90 Class A | | | 3.76 | | | | 09/16/2028 | | | | 36,050 | | | | 37,208 | |
GNMA Series 2006-3 Class A | | | 4.21 | | | | 01/16/2028 | | | | 62,289 | | | | 62,663 | |
GNMA Series 2007-12 Class A | | | 3.96 | | | | 06/16/2031 | | | | 81,347 | | | | 84,451 | |
GNMA Series 2007-69 Class TA | | | 3.71 | | | | 06/16/2031 | | | | 5,312 | | | | 5,325 | |
GNMA Series 2007-75 Class B | | | 5.05 | | | | 10/16/2014 | | | | 165,000 | | | | 179,877 | |
GNMA Series 2008-22 Class XM(c) | | | 2.15 | | | | 02/16/2050 | | | | 3,548,178 | | | | 144,447 | |
GNMA Series 2008-86 Class D | | | 5.46 | | | | 04/16/2040 | | | | 135,000 | | | | 144,846 | |
| | | | |
| 6 | | Wells Fargo Managed Account CoreBuilder Shares – Series G | | Portfolio of Investments—June 30, 2011 (Unaudited) |
| | | | | | | | | | | | | | | | |
| Security Name | | Interest Rate | | | Maturity Date | | | Principal | | | Value | |
| | | | | | | | | | | | | | | | |
| | | | |
| Agency Securities (continued) | | | | | | | | | | | | | | | | |
| | | | | | | | | | | | | | | | |
GNMA Series 2010-74 Class B | | | 3.81 | % | | | 08/16/2039 | | | $ | 45,000 | | | $ | 46,492 | |
| | | | |
Total Agency Securities (Cost $17,280,260) | | | | | | | | | | | | | | | 17,358,983 | |
| | | | | | | | | | | | | | | | |
| | | | |
| Non-Agency Mortgage-Backed Securities: 6.37% | | | | | | | | | | | | | | | | |
Bank of America Commercial Mortgage Incorporated Series 2006- 2
Class A4 | | | 5.92 | | | | 05/10/2045 | | | | 35,000 | | | | 38,734 | |
Bear Stearns Commercial Mortgage Securities Series 2007-T28 Class AAB | | | 5.75 | | | | 09/11/2042 | | | | 130,000 | | | | 142,292 | |
Commercial Mortgage Pass-Through Certificates Series 2004-LB4A
Class A4 | | | 4.58 | | | | 10/15/2037 | | | | 90,984 | | | | 91,605 | |
Commercial Mortgage Pass-Through Certificates Series 2006-C7 Class A4 | | | 5.95 | | | | 06/10/2046 | | | | 110,000 | | | | 121,852 | |
JPMorgan Chase Commercial Mortgage Securities Series 2007-CB18
Class A4 | | | 5.44 | | | | 06/12/2047 | | | | 65,000 | | | | 69,469 | |
JPMorgan Chase Commercial Mortgage Securities Series 2011 C4
Class A2†† | | | 3.34 | | | | 07/15/2046 | | | | 45,000 | | | | 45,023 | |
Lehman Brothers-UBS Commercial Mortgage Trust Series 2006-C1 Class A4 | | | 5.16 | | | | 02/15/2031 | | | | 90,000 | | | | 97,377 | |
Merrill Lynch Commercial Mortgage Trust Series 2007-8 Class A3 | | | 6.16 | | | | 08/12/2049 | | | | 35,000 | | | | 38,317 | |
Morgan Stanley Capital I Series 2006-HQ8 Class A4 | | | 5.60 | | | | 03/12/2044 | | | | 131,000 | | | | 143,638 | |
Morgan Stanley Capital I Series 2007-IQ16 Class A4 | | | 5.81 | | | | 12/12/2049 | | | | 120,000 | | | | 131,675 | |
TIAA Real Estate CDO Limited Series 2007-C4 Class A3 | | | 5.98 | | | | 08/15/2039 | | | | 85,000 | | | | 92,940 | |
| | | | |
Total Non-Agency Mortgage-Backed Securities (Cost $941,634) | | | | | | | | | | | | | | | 1,012,922 | |
| | | | | | | | | | | | | | | | |
| | | | |
| | | Yield | | | | | | | | | | |
| | | | |
Short-Term Investments: 38.22% | | | | | | | | | | | | | | | | |
| | | | |
| US Treasury Securities: 0.31% | | | | | | | | | | | | | | | | |
US Treasury Bill(z)# | | | 0.02 | | | | 09/22/2011 | | | | 50,000 | | | | 49,998 | |
| | | | | | | | | | | | | | | | |
| | | | |
| | | | | | | | | Shares | | | | |
| | | | |
| Investment Companies: 37.91% | | | | | | | | | | | | | | | | |
Wells Fargo Advantage Government Money Market Fund##(l)(u) | | | 0.01 | | | | | | | | 6,027,812 | | | | 6,027,812 | |
| | | | | | | | | | | | | | | | |
| | | | | | | | |
| | |
Total Short-Term Investments (Cost $6,077,810) | | | | | | | 6,077,810 | |
| | | | | | | | |
| Total Investments in Securities | | | | | | | | |
| (Cost $24,299,704)* | | | 153.75 | % | | | 24,449,715 | |
Other Assets and Liabilities, Net | | | (53.75 | ) | | | (8,547,338 | ) |
| | | | | | | | |
| Total Net Assets | | | 100.00 | % | | $ | 15,902,377 | |
| | | | | | | | |
| ## | All or a portion of this security has been segregated for when-issued, delayed delivery securities and/or unfunded loans. |
| (z) | Zero coupon security. Rate represents yield to maturity. |
| (c) | Interest-only securities entitle holders to receive only the interest payments on the underlying mortgages. The principal amount shown is the notional amount of the underlying mortgages. Interest rate disclosed represents the coupon rate. |
| # | All or a portion of this security is segregated as collateral for investments in derivative instruments. |
| %% | Security issued on a when-issued (TBA) basis. |
| †† | Security that may be resold to “qualified institutional buyers” under Rule 144A or securities offered pursuant to Section 4(2) of the Securities Act of 1933, as amended. |
| (l) | Investment in an affiliate. |
| (u) | Rate shown is the 7-day annualized yield at period end. |
| ± | Variable rate investments. |
| * | Cost for federal income tax purposes is $24,299,704 and net unrealized appreciation (depreciation) consists of: |
| | | | |
Gross unrealized appreciation | | $ | 293,529 | |
Gross unrealized depreciation | | | (143,518 | ) |
| | | | |
Net unrealized appreciation | | $ | 150,011 | |
The accompanying notes are an integral part of these financial statements.
| | | | | | |
| Statement of Assets and Liabilities—June 30, 2011 (Unaudited) | | Wells Fargo Managed Account CoreBuilder Shares – Series G | | | 7 | |
| | | | |
| | | | |
| |
Assets | | | | |
Investments | | | | |
In unaffiliated securities, at value | | $ | 18,421,903 | |
In affiliated securities, at value | | | 6,027,812 | |
| | | | |
Total investments, at value (see cost below) | | | 24,449,715 | |
Receivable for interest | | | 59,921 | |
Prepaid expenses and other assets | | | 16,208 | |
| | | | |
Total assets | | | 24,525,844 | |
| | | | |
| |
Liabilities | | | | |
Dividends payable | | | 39,898 | |
Payable for investments purchased | | | 8,581,098 | |
Payable for Fund shares redeemed | | | 2,057 | |
Payable for daily variation margin on open futures contracts | | | 414 | |
| | | | |
Total liabilities | | | 8,623,467 | |
| | | | |
Total net assets | | $ | 15,902,377 | |
| | | | |
| |
NET ASSETS CONSIST OF | | | | |
Paid-in capital | | $ | 15,566,928 | |
Overdistributed net investment income | | | (51,103 | ) |
Accumulated net realized gains on investments | | | 250,993 | |
Net unrealized gains on investments | | | 135,559 | |
| | | | |
Total net assets | | $ | 15,902,377 | |
| | | | |
| |
COMPUTATION OF NET ASSET VALUE PER SHARE1 | | | | |
Net assets | | $ | 15,902,377 | |
Shares outstanding | | | 1,546,559 | |
Net asset value per share | | | $10.28 | |
| | | | |
| |
Total investments, at cost | | $ | 24,299,704 | |
| | | | |
| 1. | The Fund has an unlimited number of authorized shares. |
The accompanying notes are an integral part of these financial statements.
| | | | |
| 8 | | Wells Fargo Managed Account CoreBuilder Shares – Series G | | Statement of Operations—Six Months Ended June 30, 2011 (Unaudited) |
| | | | |
| | | | |
| |
Investment Income | | | | |
Interest | | $ | 218,437 | |
Income from affiliated securities | | | 227 | |
| | | | |
Total investment income | | | 218,664 | |
| | | | |
| |
Expenses | | | | |
Custody and accounting fees | | | 4,590 | |
Professional fees | | | 18,724 | |
Registration fees | | | 10 | |
Shareholder report expenses | | | 7,143 | |
Trustees’ fees and expenses | | | 7,285 | |
Other fees and expenses | | | 1,194 | |
| | | | |
Total expenses | | | 38,946 | |
Less: Fee waivers and/or expense reimbursements | | | (38,946 | ) |
| | | | |
Net expenses | | | 0 | |
| | | | |
Net investment income | | | 218,664 | |
| | | | |
| |
REALIZED AND UNREALIZED GAINS (LOSSES) ON INVESTMENTS | | | | |
| |
Net realized gains (losses) on: | | | | |
Unaffiliated securities | | | 256,068 | |
Futures transactions | | | 2,945 | |
| | | | |
Net realized gains on investments | | | 259,013 | |
| | | | |
| |
Net change in unrealized gains (losses) on: | | | | |
Unaffiliated securities | | | (12,129 | ) |
Futures transactions | | | (30,607 | ) |
| | | | |
Net change in unrealized gains (losses) on investments | | | (42,736 | ) |
Net realized and unrealized gains (losses) on investments | | | 216,277 | |
| | | | |
Net increase in net assets resulting from operations | | $ | 434,941 | |
| | | | |
The accompanying notes are an integral part of these financial statements.
| | | | | | |
| Statements of Changes in Net Assets | | Wells Fargo Managed Account CoreBuilder Shares – Series G | | | 9 | |
| | | | | | | | | | | | | | | | |
| | | Six Months Ended
June 30, 2011
(Unaudited) | | | Year Ended
December 31, 2010 | |
| | | | |
Operations | | | | | | | | | | | | | | | | |
Net investment income | | | | | | $ | 218,664 | | | | | | | $ | 288,999 | |
Net realized gains on investments | | | | | | | 259,013 | | | | | | | | 632,810 | |
Net change in unrealized gains (losses) on investments | | | | | | | (42,736 | ) | | | | | | | 177,640 | |
| | | | | | | | | | | | | | | | |
Net increase in net assets resulting from operations | | | | | | | 434,941 | | | | | | | | 1,099,449 | |
| | | | | | | | | | | | | | | | |
| | | | |
Distributions to shareholders from | | | | | | | | | | | | | | | | |
Net investment income | | | | | | | (281,204 | ) | | | | | | | (719,414 | ) |
Net realized gains | | | | | | | 0 | | | | | | | | (336,410 | ) |
| | | | | | | | | | | | | | | | |
Total distributions to shareholders | | | | | | | (281,204 | ) | | | | | | | (1,055,824 | ) |
| | | | | | | | | | | | | | | | |
| | | | |
| | | Shares | | | | | | Shares | | | | |
| | | | |
Capital share transactions | | | | | | | | | | | | | | | | |
Proceeds from shares sold | | | 37,781 | | | | 383,671 | | | | 80,749 | | | | 823,880 | |
Payment for shares redeemed | | | (156,750 | ) | | | (1,582,940 | ) | | | (93,405 | ) | | | (962,963 | ) |
| | | | | | | | | | | | | | | | |
Net decrease in net assets resulting from capital share transactions | | | | | | | (1,199,269 | ) | | | | | | | (139,083 | ) |
| | | | | | | | | | | | | | | | |
Total decrease in net assets | | | | | | | (1,045,532 | ) | | | | | | | (95,458 | ) |
| | | | | | | | | | | | | | | | |
| | | | |
Net assets | | | | | | | | | | | | | | | | |
Beginning of period | | | | | | | 16,947,909 | | | | | | | | 17,043,367 | |
| | | | | | | | | | | | | | | | |
End of period | | | | | | $ | 15,902,377 | | | | | | | $ | 16,947,909 | |
| | | | | | | | | | | | | | | | |
Undistributed (overdistributed) net investment income | | | | | | $ | (51,103 | ) | | | | | | $ | 11,437 | |
| | | | | | | | | | | | | | | | |
The accompanying notes are an integral part of these financial statements.
| | | | |
| 10 | | Wells Fargo Managed Account CoreBuilder Shares – Series G | | Financial Highlights (Unaudited) |
| | | | | | | | | | | | | | | | |
| | | Beginning
Net Asset
Value Per
Share | | | Net
Investment
Income | | | Net Realized
and Unrealized
Gains (Losses)
on Investments | | | Distributions
from Net
Investment
Income | |
January 1, 2011 to June 30, 2011 (Unaudited) | | $ | 10.18 | | | | 0.15 | | | | 0.13 | | | | (0.18 | ) |
January 1, 2010 to December 31, 2010 | | $ | 10.16 | | | | 0.18 | | | | 0.47 | | | | (0.43 | ) |
January 1, 2009 to December 31, 2009 | | $ | 10.15 | | | | 0.31 | | | | 0.46 | | | | (0.51 | ) |
April 14, 20083 to December 31, 2008 | | $ | 10.00 | | | | 0.25 | | | | 0.28 | | | | (0.36 | ) |
| 1. | The adviser has contractually committed to irrevocably absorb and pay or reimburse all ordinary operating expenses of the Fund, except portfolio transactions or other investment-related costs (e.g., commissions), fees payable for services provided by the Fund’s securities lending agent, interest, taxes, leverage expenses and other expenses not incurred in the ordinary course of the Fund’s business. This commitment has an indefinite term. |
| 2. | Returns for periods of less than one year are not annualized. |
| 3. | Commencement of operations. |
The accompanying notes are an integral part of these financial statements.
| | | | | | |
| Financial Highlights (Unaudited) | | Wells Fargo Managed Account CoreBuilder Shares – Series G | | | 11 | |
| | | | | | | | | | | | | | | | | | | | | | | | | | |
Distribution
from Net
Realized Gains | | | Ending
Net Asset
Value Per
Share | | | Ratio to Average Net Assets (Annualized) | | | | | | Portfolio
Turnover
Rate | | | Net Assets at
End of Period
(000’s omitted) | |
| | | Net Investment
Income | | | Net
Expenses1 | | | Total
Return2 | | | |
| | 0.00 | | | $ | 10.28 | | | | 2.83 | % | | | 0.00 | % | | | 2.77 | % | | | 245 | % | | $ | 15,902 | |
| | (0.20 | ) | | $ | 10.18 | | | | 1.74 | % | | | 0.00 | % | | | 6.53 | % | | | 776 | % | | $ | 16,948 | |
| | (0.25 | ) | | $ | 10.16 | | | | 2.59 | % | | | 0.00 | % | | | 7.62 | % | | | 736 | % | | $ | 17,043 | |
| | (0.02 | ) | | $ | 10.15 | | | | 3.48 | % | | | 0.00 | % | | | 5.41 | % | | | 495 | % | | $ | 10,196 | |
| | | | |
| 12 | | Wells Fargo Managed Account CoreBuilder Shares – Series G | | Notes to Financial Statements (Unaudited) |
1. ORGANIZATION
Wells Fargo Funds Trust (the “Trust”), a Delaware statutory trust organized on March 10, 1999, is an open-end management investment company registered under the Investment Company Act of 1940, as amended (the “1940 Act”). These financial statements report on Wells Fargo Managed Account CoreBuilder Shares – Series G (the “Fund”) which is a diversified series of the Trust.
The Fund is a special purpose government securities fund that is used in combination with selected individual securities to effectively model institutional-level investment strategies. As an investment option within the separately managed accounts advised or sub-advised by Wells Fargo Funds Management, LLC, the Fund enables certain separately managed account investors to achieve greater diversification than small managed accounts might otherwise achieve.
2. SIGNIFICANT ACCOUNTING POLICIES
The following significant accounting policies, which are consistently followed in the preparation of the financial statements of the Fund, are in conformity with U.S. generally accepted accounting principles which require management to make estimates and assumptions that affect the reported amounts of assets and liabilities, disclosure of contingent assets and liabilities at the date of the financial statements, and the reported amounts of revenues and expenses during the reporting period. Actual results could differ from those estimates.
Securities valuation
Certain fixed income securities with maturities exceeding 60 days are valued based on available market quotations received from an independent pricing service approved by the Trust’s Board of Trustees which may utilize both transaction data and market information such as yield, prices of securities of comparable quality, coupon rate, maturity, type of issue, trading characteristics and other market data. If valuations are not available from the pricing service or values received are deemed not representative of market value, values will be obtained from a third party broker-dealer or determined based on the Fund’s Fair Value Procedures.
Debt securities of sufficient credit quality with original maturities of 60 days or less generally are valued at amortized cost which approximates fair value. The amortized cost method involves valuing a security at its cost, plus accretion of discount or minus amortization of premium over the period until maturity.
Investments in open-end mutual funds and non-registered investment companies are generally valued at net asset value.
Certain investments which are not valued using any of the methods discussed above, are valued at their fair value, as determined by procedures established in good faith and approved by the Board of Trustees.
The valuation techniques used by the Fund to measure fair value are consistent with the market approach, income approach and/or cost approach, where applicable, for each security type.
When-issued transactions
The Fund may purchase securities on a forward commitment or ‘when-issued’ basis. The Fund records a when-issued transaction on the trade date and will segregate assets to cover its obligation by confirming the availability of qualifying assets having a value sufficient to make payment for the securities purchased. Securities purchased on a when-issued basis are marked-to-market daily and the Fund begins earning interest on the settlement date. Losses may arise due to changes in the market value of the underlying securities or if the counterparty does not perform under the contract.
Futures contracts
The Fund may be subject to interest rate risk in the normal course of pursuing its investment objectives. The Fund may buy and sell futures contracts in order to gain exposure to, or protect against changes in, security values and interest rates. The primary risks associated with the use of futures contracts are the imperfect correlation between changes in market values of securities held by the Fund and the prices of futures contracts, and the possibility of an illiquid market.
Futures contracts are valued based upon their quoted daily settlement prices when available. The aggregate principal amounts of the contracts are not recorded in the financial statements. Fluctuations in the value of the contracts are recorded in the Statement of Assets and Liabilities as an asset or liability and in the Statement of Operations as unrealized gains or losses until the contracts are closed, at which point they are recorded as net realized gains or losses on futures contracts. With futures contracts, there is minimal counterparty risk to the Fund since futures are exchange traded and the exchange’s clearinghouse, as counterparty to all exchange traded futures, guarantees the futures against default.
| | | | | | |
| Notes to Financial Statements (Unaudited) | | Wells Fargo Managed Account CoreBuilder Shares – Series G | | | 13 | |
Mortgage dollar roll transactions
The Fund may engage in mortgage dollar roll transactions with respect to mortgage-backed securities issued by Government National Mortgage Association (GNMA), Federal National Mortgage Association (FNMA) and Federal Home Loan Mortgage Corporation (FHLMC). In a mortgage dollar roll transaction, the Fund sells a mortgage-backed security to a financial institution, such as a bank or broker-dealer and simultaneously agrees to repurchase a substantially similar security from the institution at a later date at an agreed upon price. The mortgage-backed securities that are repurchased will bear the same interest rate as those sold, but generally will be collateralized by different pools of mortgages with different pre-payment histories. During the roll period, the Fund foregoes principal and interest paid on the securities. The Fund is compensated by the difference between the current sales price and the forward price for the future purchase as well as by the earnings on the cash proceeds of the initial sale. Mortgage dollar rolls may be renewed without physical delivery of the securities subject to the contract. The Fund accounts for the dollar roll transactions as purchases and sales.
Security transactions and income recognition
Securities transactions are recorded on a trade date basis. Realized gains or losses are reported on the basis of identified cost of securities delivered.
Interest income is accrued daily and bond discounts are accreted and premiums are amortized daily based on the effective interest method. To the extent debt obligations are placed on non-accrual status, any related interest income may be reduced by writing off interest receivables when the collection of all or a portion of interest has become doubtful based on consistently applied procedures. If the issuer subsequently resumes interest payments or when the collectability of interest is reasonably assured, the debt obligation is removed from non-accrual status.
Distributions to shareholders
Distributions to shareholders from net investment income are accrued daily and paid monthly. Distributions from net realized gains, if any, are recorded on the ex-dividend date. Such distributions are determined in conformity with income tax regulations, which may differ from generally accepted accounting principles.
Federal and other taxes
The Fund intends to continue to qualify as a regulated investment company by distributing substantially all of its investment company taxable income and any net realized capital gains (after reduction for capital loss carryforwards) sufficient to relieve it from all, or substantially all, federal income taxes. Accordingly, no provision for federal income taxes was required.
The Fund’s income and federal excise tax returns and all financial records supporting those returns for the prior three fiscal years are subject to examination by the federal and Delaware revenue authorities.
Under the recently enacted Regulated Investment Company Modernization Act of 2010, the Fund will be permitted to carry forward capital losses incurred in taxable years beginning after December 22, 2010 for an unlimited period. However, any losses incurred during those future taxable years will be required to be utilized prior to the losses incurred in pre-enactment taxable years. As a result of this ordering rule, pre-enactment capital loss carryforwards may be more likely to expire unused. Additionally, post-enactment capital losses that are carried forward will retain their character as either short-term or long-term capital losses rather than being considered all short-term as under previous law.
3. FAIR VALUATION MEASUREMENTS
Fair value measurements of investments are determined within a framework that has established a fair value hierarchy based upon the various data inputs utilized in determining the value of the Fund’s investments. The three-level hierarchy gives the highest priority to unadjusted quoted prices in active markets for identical assets or liabilities (Level 1) and the lowest priority to unobservable inputs (Level 3). The Fund’s investments are classified within the fair value hierarchy based on the lowest level of input that is significant to the fair value measurement. The inputs are summarized into three broad levels as follows:
| n | | Level 1 – quoted prices in active markets for identical securities |
| n | | Level 2 – other significant observable inputs (including quoted prices for similar securities, interest rates, prepayment speeds, credit risk, etc.) |
| | | | |
| 14 | | Wells Fargo Managed Account CoreBuilder Shares – Series G | | Notes to Financial Statements (Unaudited) |
| n | | Level 3 – significant unobservable inputs (including the Fund’s own assumptions in determining the fair value of investments) |
The inputs or methodologies used for valuing securities are not necessarily an indication of the risk associated with investing in those securities.
As of June 30, 2011, the inputs used in valuing the Fund’s assets, which are carried at fair value, were as follows:
| | | | | | | | | | | | | | | | |
| Investments in Securities | | Quoted Prices (Level 1) | | | Significant Other
Observable Inputs (Level 2) | | | Significant Unobservable Inputs (Level 3) | | | Total | |
Agency securities | | $ | 0 | | | $ | 17,358,983 | | | $ | 0 | | | $ | 17,358,983 | |
Non-agency mortgage-backed securities | | | 0 | | | | 1,012,922 | | | | 0 | | | | 1,012,922 | |
Short-term investments | | | | | | | | | | | | | | | | |
Investment companies | | | 6,027,812 | | | | 0 | | | | 0 | | | | 6,027,812 | |
U.S. Treasury securities | | | 49,998 | | | | 0 | | | | 0 | | | | 49,998 | |
| | | $ | 6,077,810 | | | $ | 18,371,905 | | | $ | 0 | | | $ | 24,449,715 | |
Further details on the major security types listed above can be found in the Fund’s Portfolio of Investments.
As of June 30, 2011 the inputs used in valuing the Fund’s other financial instruments, which are carried at fair value, were as follows:
| | | | | | | | | | | | | | | | |
| Other financial instruments | | Quoted Prices (Level 1) | | | Significant Other
Observable Inputs (Level 2) | | | Significant Unobservable Inputs (Level 3) | | | Total | |
Futures contracts | | $ | (14,452 | ) | | $ | 0 | | | $ | 0 | | | $ | (14,452 | ) |
Transfers in and transfers out are recognized at the end of the reporting period. For the six months ended June 30, 2011, the Fund did not have any significant transfers into/out of Level 1 and Level 2.
4. TRANSACTIONS WITH AFFILIATES AND OTHER EXPENSES
The Trust has entered into an advisory contract with Wells Fargo Funds Management, LLC (“Funds Management”) an indirect wholly owned subsidiary of Wells Fargo & Company (“Wells Fargo”). The adviser is responsible for implementing investment policies and guidelines and for supervising the sub-adviser, who is responsible for day-to-day portfolio management of the Fund. For providing these services, Funds Management does not receive a fee from the Fund but is entitled to receive fees from the sponsors of the wrap-fee programs. Out of these fees, Funds Management pays Wells Capital Management Incorporated, an affiliate of Funds Management, for its services as the sub-adviser to the Fund.
Generally, no ordinary operating fees or expenses are charged to the Fund. Funds Management has contractually committed to irrevocably absorb and pay or reimburse all ordinary operating expenses of the Fund, except portfolio transactions or other investment-related costs (e.g., commissions), fees payable for services provided by the Fund’s securities lending agent, interest, taxes, leverage expenses and other expenses not incurred in the ordinary course of the Fund’s business. This commitment has an indefinite term.
5. INVESTMENT PORTFOLIO TRANSACTIONS
Purchases and sales of investments, excluding short-term securities (securities with maturities of one year or less at purchase date), for the six months ended June 30, 2011 were as follows:
| | | | | | | | | | | | | | |
| Purchases at Cost | | | Sales Proceeds | |
U.S.
Government | | | Non-U.S.
Government | | | U.S.
Government | | | Non-U.S.
Government | |
| $ | 45,035,451 | | | $ | 99,419 | | | $ | 44,651,400 | | | $ | 879,543 | |
| | | | | | |
| Notes to Financial Statements (Unaudited) | | Wells Fargo Managed Account CoreBuilder Shares – Series G | | | 15 | |
6. DERIVATIVE TRANSACTIONS
During the six months ended June 30, 2011, the Fund entered into futures contracts to speculate on interest rates.
At June 30, 2011, the Fund had short futures contracts outstanding as follows:
| | | | | | | | | | | | | | | | | | | | | | |
| Expiration Date | | | Contracts | | | Type | | | Initial
Notional
Amount | | | Value at
June 30, 2011 | | | Net Unrealized
Gains (Losses) | |
| | September 2011 | | | | 2 Long | | | | 30-Year U.S. Treasury Bonds | | | $ | 249,129 | | | $ | 246,063 | | | $ | (3,066 | ) |
| | September 2011 | | | | 7 Long | | | | 10-Year U.S. Treasury Notes | | | | 856,404 | | | | 856,297 | | | | (107 | ) |
| | September 2011 | | | | 13 Short | | | | 5-Year U.S. Treasury Notes | | | | 1,546,077 | | | | 1,549,539 | | | | (3,462 | ) |
| | September 2011 | | | | 19 Short | | | | 2-Year U.S. Treasury Notes | | | | 4,159,714 | | | | 4,167,531 | | | | (7,817 | ) |
The Fund had an average contract amount of $448,585 and $3,533,710 in long and short futures contracts, respectively, during the six months ended June 30, 2011.
On June 30, 2011, the cumulative unrealized losses on futures contracts in the amount of $(14,452) is reflected in net unrealized gains on investments on the Statement of Assets and Liabilities for the Fund. The payable for daily variation margin on open futures contracts reflected in the Statement of Assets and Liabilities only represents the current day’s variation margin. The realized gains and change in unrealized gains (losses) on futures contracts are reflected in the Statement of Operations.
7. INDEMNIFICATION
Under the Trust’s organizational documents, the officers and directors are indemnified against certain liabilities that may arise out of performance of their duties to the Trust. Additionally, in the normal course of business, the Trust may enter into contracts with service providers that contain a variety of indemnification clauses. The Trust’s maximum exposure under these arrangements is dependent on future claims that may be made against the Fund and, therefore, cannot be estimated.
8. CONCENTRATION OF OWNERSHIP
From time to time, the Fund may have a concentration of one or more of its shareholders that hold a significant percentage of the Fund’s shares outstanding. Investment and/or voting activities of these shareholders with respect to their holdings in the Fund shares could have a material impact on the Fund.
At June 30, 2011, the following shareholders held 99.68% of the outstanding shares of the Fund:
| | | | |
| Shareholder | | % of Ownership | |
Wells Capital Management Incorporated | | | 64.65 | % |
Citigroup Global Markets Incorporated | | | 35.03 | % |
9. NEW ACCOUNTING PRONOUNCEMENTS
In May 2011, the Financial Accounting Standards Board (“FASB”) issued Accounting Standards Update (“ASU”) No. 2011-04 “Amendments to Achieve Common Fair Value Measurement and Disclosure Requirements in U.S. GAAP and IFRSs”. ASU No. 2011-04 amends FASB ASC Topic 820, Fair Value Measurements and Disclosures, to establish common requirements for measuring fair value and for disclosing information about fair value measurements in accordance with GAAP. The ASU is effective prospectively for interim and annual periods beginning after December 15, 2011.
In April 2011, FASB issued ASU No. 2011-03 “Reconsideration of Effective Control for Repurchase Agreements”. ASU 2011-03 amends FASB ASC Topic 860, Transfers and Servicing, specifically the criteria required to determine whether a repurchase agreement (repo) and similar agreements should be accounted for as sales of financial assets or secured borrowings with commitments. ASU No. 2011-03 changes the assessment of effective control by focusing on the transferor’s contractual rights and obligations and removing the criterion to assess its ability to exercise those rights or honor those obligations. This could result in changes to the way entities account for certain transactions including repurchase agreements, mortgage dollar rolls and reverse repurchase agreements. The ASU will become effective on a prospective basis for new
| | | | |
| 16 | | Wells Fargo Managed Account CoreBuilder Shares – Series G | | Notes to Financial Statements (Unaudited) |
transfers and modifications to existing transactions as of the beginning of the first interim or annual period beginning on or after December 15, 2011.
As of June 30, 2011, management of the Fund is currently assessing the potential impact, in addition to expanded financial statement disclosure, that may result from adopting these ASUs.
10. SUBSEQUENT DISTRIBUTION
On July 14, 2011, the Fund declared distributions from short-term capital gains of $0.00543 per share payable on July 15, 2011 to shareholders of record on July 13, 2011. This distribution is not reflected in the accompanying financial statements.
| | | | | | |
| Other Information (Unaudited) | | Wells Fargo Managed Account CoreBuilder Shares – Series G | | | 17 | |
PROXY VOTING INFORMATION
A description of the policies and procedures that the Fund uses to determine how to vote proxies relating to portfolio securities is available without charge, upon request, by calling 1-800-368-0627, visiting our Web site at www.wellsfargo.com/advantagefunds, or visiting the SEC Web site at www.sec.gov. Information regarding how the Fund voted proxies relating to portfolio securities during the most recent 12-month period ended June 30 is available without charge on the Fund’s Web site at www.wellsfargo.com/advantagefunds or by visiting the SEC Web site at www.sec.gov.
PORTFOLIO HOLDINGS INFORMATION
The Fund files its complete schedule of portfolio holdings with the SEC for the first and third quarters of each fiscal year on Form N-Q, which is available without charge by visiting the SEC Web site at www.sec.gov. In addition, the Fund’s Form N-Q may be reviewed and copied at the SEC’s Public Reference Room in Washington, DC, and at regional offices in New York City, at 233 Broadway, and in Chicago, at 175 West Jackson Boulevard, Suite 900. Information about the Public Reference Room may be obtained by calling 1-800-SEC-0330.
| | | | |
| 18 | | Wells Fargo Managed Account CoreBuilder Shares – Series G | | Other Information (Unaudited) |
BOARD OF TRUSTEES
The following table provides basic information about the Board of Trustees (the “Trustees”) of the Wells Fargo Funds Trust (the “Trust”) and Officers of the Trust. This table should be read in conjunction with the Prospectus and the Statement of Additional Information1 of the Fund. Each of the Trustees and Officers listed below acts in identical capacities for the Wells Fargo Advantage family of funds, which consists of 144 funds comprising the Trust, Wells Fargo Variable Trust, Wells Fargo Master Trust and four closed-end funds (collectively the “Fund Complex”). All of the Trustees are also Members of the Audit and Governance Committees of each Trust in the Fund Complex. The mailing address of each Trustee and Officer is 525 Market Street, 12th Floor, San Francisco, CA 94105. Each Trustee and Officer serves an indefinite term, however, each Trustee serves such term until reaching the mandatory retirement age established by the Trustees.
Independent Trustees
| | | | | | |
Name and Year of Birth | | Position Held and Length of Service | | Principal Occupations During Past Five Years | | Other Directorships During
Past Five Years |
Peter G. Gordon
(Born 1942) | | Trustee, since 1998; Chairman, since 2005 | | Co-Founder, Chairman, President and CEO of Crystal Geyser. Water Company. Trustee Emeritus, Colby College | | Asset Allocation Trust |
Isaiah Harris, Jr.
(Born 1952) | | Trustee, since 2009 | | Retired. Prior thereto, President and CEO of BellSouth Advertising and Publishing Corp. from 2005 to 2007, President and CEO of BellSouth Enterprises from 2004 to 2005 and President of BellSouth Consumer Services from 2000 to 2003. Emeritus member of the Iowa State University Foundation Board of Governors. Emeritus Member of the Advisory Board of Iowa State University School of Business. Mr. Harris is a certified public accountant. | | CIGNA Corporation; Deluxe Corporation; Asset Allocation Trust |
Judith M. Johnson
(Born 1949) | | Trustee, since 2008 | | Retired. Prior thereto, Chief Executive Officer and Chief Investment Officer of Minneapolis Employees Retirement Fund from 1996 to 2008. Ms. Johnson is an attorney, certified public accountant and a certified managerial accountant. | | Asset Allocation Trust |
Leroy Keith, Jr.
(Born 1939) | | Trustee, since 2010 | | Chairman, Bloc Global Services (development and construction), Trustee of the Evergreen Funds from 1983 to 2010. Former Managing Director, Almanac Capital Management (commodities firm), former Partner, Stonington Partners, Inc. (private equity fund), former Director, Obagi Medical Products Co. and former Director, Lincoln Educational Services. | | Trustee, Virtus Fund Complex (consisting of 45 portfolios as of 12/31/10); Director, Diversapack Co. (packaging company); Asset Allocation Trust |
David F. Larcker
(Born 1950) | | Trustee, since 2009 | | James Irvin Miller Professor of Accounting at the Graduate School of Business, Stanford University, Director of Corporate Governance Research Program and Co-Director of The Rock Center for Corporate Governance since 2006. From 2005 to 2008, Professor of Accounting at the Graduate School of Business, Stanford University. Prior thereto, Ernst & Young Professor of Accounting at The Wharton School, University of Pennsylvania from 1985 to 2005. | | Asset Allocation Trust |
Olivia S. Mitchell
(Born 1953) | | Trustee, since 2006 | | International Foundation of Employee Benefit Plans Professor and Chair of the Department of Insurance and Risk Management, Wharton School of the University of Pennsylvania since 1993. Director of Wharton’s Pension Research Council and Boettner Center on Pensions & Retirement Research, and Research Associate at the National Bureau of Economic Research. Previously, Cornell University Professor from 1978 to 1993. | | Asset Allocation Trust |
Timothy J. Penny
(Born 1951) | | Trustee, since 1996 | | President and CEO of Southern Minnesota Initiative Foundation, a non-profit organization, since 2007 and Senior Fellow at the Humphrey Institute Policy Forum at the University of Minnesota since 1995. Member of the Board of Trustees of NorthStar Education Finance, Inc., a non-profit organization, since 2007. | | Asset Allocation Trust |
| | | | | | |
| Other Information (Unaudited) | | Wells Fargo Managed Account CoreBuilder Shares – Series G | | | 19 | |
| | | | | | |
Name and Year of Birth | | Position Held and Length of Service | | Principal Occupations During Past Five Years | | Other Directorships During
Past Five Years |
Michael S. Scofield
(Born 1943) | | Trustee, since 2010 | | Currently serves on the Investment Company Institute’s Board of Governors and Executive Committee as well the In dependent Director’s Counsel Board of Governors and Executive Committee. Former Chairman of the Independent Directors Counsel. Trustee of the Evergreen Funds from 1984 to 2010. Retired Attorney, Law Offices of Michael S. Scofield and former Director and Chairman, Branded Media Corporation (multi-media branding company). | | Asset Allocation Trust |
Donald C. Willeke
(Born 1940) | | Trustee, since 1996 | | Principal of the law firm of Willeke & Daniels. General Counsel of the Minneapolis Employees Retirement Fund from 1984 until its consolidation into the Minnesota Public Employees Retirement Association on June 30, 2010. | | Asset Allocation Trust |
Officers
| | | | | | |
Name and Year of Birth | | Position Held and
Length of Service | | Principal Occupations During Past Five Years | | |
Karla M. Rabusch
(Born 1959) | | President, since 2003 | | Executive Vice President of Wells Fargo Bank, N.A. and President of Wells Fargo Funds Management, LLC since 2003. Senior Vice President and Chief Administrative Officer of Wells Fargo Funds Management, LLC from 2001 to 2003. | | |
C. David Messman
(Born 1960) | | Secretary, since 2000; Chief Legal Counsel, since 2003 | | Senior Vice President and Secretary of Wells Fargo Funds Management, LLC since 2001. Vice President and Managing Counsel of Wells Fargo Bank, N.A. since 1996. | | |
Kasey Phillips
(Born 1970) | | Treasurer, since 2008 | | Senior Vice President of Wells Fargo Funds Management, LLC since 2009. Senior Vice President of Evergreen Investment Management Company, LLC from 2006 to 2010. Treasurer of the Evergreen Funds from 2005 to 2010. Vice President and Assistant Vice President of Evergreen Investment Services, Inc. from 1999 to 2006. | | |
David Berardi
(Born 1975) | | Assistant Treasurer, since 2009 | | Vice President of Wells Fargo Funds Management, LLC since 2009 . Vice President of Evergreen Investment Management Company, LLC from 2008 to 2010. Assistant Vice President of Evergreen Investment Services, Inc. from 2004 to 2008. Manager of Fund Reporting and Control for Evergreen Investment Management Company, LLC from 2004 to 2010. | | |
Jeremy DePalma
(Born 1974) | | Assistant Treasurer, since 2009 | | Senior Vice President of Wells Fargo Funds Management, LLC since 2009. Senior Vice President of Evergreen Investment Management Company, LLC from 2008 to 2010. Vice President, Evergreen Investment Services, Inc. from 2004 to 2007. Assistant Vice President, Evergreen Investment Services, Inc. from 2000 to 2004 and the head of the Fund Reporting and Control Team within Fund Administration from 2005 to 2010. | | |
Debra Ann Early
(Born 1964) | | Chief Compliance Officer, since 2007 | | Chief Compliance Officer of Wells Fargo Funds Management, LLC since 2007. Chief Compliance Officer of Parnassus Investments from 2005 to 2007. Chief Financial Officer of Parnassus Investments from 2004 to 2007 and Senior Audit Manager of PricewaterhouseCoopers LLP from 1998 to 2004. | | |
| 1. | The Statement of Additional Information includes additional information about the Fund’s Trustees and is available, without charge, upon request, by calling 1-800-222-8222 or by visiting the Fund’s Web site at www.wellsfargo.com/advantagefunds. |
| | | | |
| 20 | | Wells Fargo Managed Account CoreBuilder Shares – Series G | | Other Information (Unaudited) |
BOARD CONSIDERATION OF INVESTMENT ADVISORY AND SUB-ADVISORY AGREEMENTS:
Each year, as required by Section 15 of the Investment Company Act of 1940 (the “1940 Act”), the Board of Trustees (the “Board”) of Wells Fargo Funds Trust (the “Trust”), all the members of which have no direct or indirect interest in the investment advisory and sub-advisory agreements and are not “interested persons” of the Trust, as defined in the 1940 Act (the “Independent Trustees”), determines whether to approve the continuation of the Trust’s investment advisory and sub-advisory agreements. In this regard, at an in person meeting held on March 24-25, 2011 (the “Meeting”), the Board reviewed and re-approved: (i) an investment advisory agreement with Wells Fargo Funds Management, LLC (“Funds Management”) for the Wells Fargo Managed Account CoreBuilder Shares (SM) – Series G (the “Fund”) and (ii) an investment sub-advisory agreement with Wells Capital Management Incorporated (“Wells Capital Management”) for the Fund. The investment advisory agreement with Funds Management and the investment sub-advisory agreement with Wells Capital Management are collectively referred to as the “Advisory Agreements.”
At the Meeting, the Board considered the factors and reached the conclusions described below relating to the selection of Funds Management and Wells Capital Management and continuation of the Advisory Agreements. Prior to the Meeting, the Trustees conferred extensively among themselves and with representatives of Funds Management about these matters. The Board also met throughout the year and received information that was useful to them in considering the continuation of the Advisory Agreements. The Independent Trustees were assisted in their evaluation of the Advisory Agreements by independent legal counsel, from whom they received separate legal advice and with whom they met separately from Funds Management.
Nature, extent and quality of services
The Board received and considered various information regarding the nature, extent and quality of services provided to the Fund by Funds Management and Wells Capital Management under the Advisory Agreements. The Board also received and considered information provided in response to a detailed set of requests submitted by the Independent Trustees’ independent legal counsel on their behalf. The Board received and considered, among other things, information about the background and experience of senior management of Funds Management, and the qualifications, backgrounds, tenures and responsibilities of the portfolio managers primarily responsible for the day-to-day portfolio management of the Fund.
The Board evaluated the ability of Funds Management and Wells Capital Management, based on their respective financial condition, resources, reputation and other attributes, to attract and retain qualified investment professionals, including research, advisory, and supervisory personnel. The Board further considered the compliance programs and compliance records of Funds Management and Wells Capital Management. In addition, the Board took into account the administrative services provided to the Fund by Funds Management and its affiliates.
The Board’s decision to approve the continuation of the Advisory Agreements was based on a comprehensive evaluation of all of the information provided to it. In approving the continuation of the Advisory Agreements, the Board did not identify any particular information or consideration that was all-important or controlling, and each Trustee attributed different weights to various factors. The Board evaluated information provided to it both in terms of the funds generally and with respect to the Fund, specifically as it considered appropriate. Although the Board considered the continuation of the Advisory Agreements for the Fund as part of the larger process of considering the continuation of the advisory agreements for all of the funds, its decision to continue the Advisory Agreements for the Fund was ultimately made on a fund-by-fund basis.
In considering these matters, the Board considered not only the specific information presented in connection with the Meeting, but also the knowledge gained over time through interaction with Funds Management and Wells Capital Management about various topics, including Funds Management’s oversight of service providers. The above factors, together with those referenced below, are some of the most important, but not necessarily all, factors considered by the Board in concluding that it was satisfied with the nature, extent and quality of the investment advisory services provided to the Fund by Funds Management and Wells Capital Management.
Fund performance and expenses
The Board received and considered information regarding the “zero fee and expense” structure of the Fund. Specifically, the Board noted that the Fund’s gross operating expense ratio and each of its various components, including advisory
| | | | | | |
| Other Information (Unaudited) | | Wells Fargo Managed Account CoreBuilder Shares – Series G | | | 21 | |
fees, administration fees, custody fees, Rule 12b-1 fees, and other fees, were zero. The Board also noted Funds Management’s representations that the Fund is a special purpose mutual fund for use exclusively within Funds Management’s separately managed account (“SMA”) advisory business and, as such, Funds Management would assume and pay or reimburse all of the ordinary operating expenses of the Fund under an Expense Assumption Agreement but excluding portfolio transaction or other investment related costs, fees payable for services provided by the Fund’s securities lending agent, interest, taxes, leverage expenses, and other expenses not incurred in the ordinary cost of the Fund’s business. The Board further noted that Funds Management is paid a negotiated fee by each SMA sponsor and that the fee level would be identical for all sponsors of SMAs that invest in the Fund.
In light of this unique fee and distribution structure, the Board does not conduct a performance and fee review relative to a peer group or universe. The Board concluded that the fee and distribution structure of the Fund supported the re-approval of the Advisory Agreements for the Fund.
Investment advisory and sub-advisory fee rates
The Board reviewed and considered that the contractual investment advisory fee rate payable by the Fund to Funds Management for investment advisory services (the “Advisory Agreement Rate”) was zero, and also reviewed and considered that the Fund’s other fees would normally be zero, because of Funds Management’s commitment to assume and pay or reimburse all of the ordinary operating expenses of the Fund under an Expense Assumption Agreement. The Board also reviewed and considered the contractual investment sub-advisory fee rate payable by Funds Management to Wells Capital Management for investment sub-advisory services (the “Sub-Advisory Agreement Rate”), and that such fees are paid from the fees Funds Management receives from SMA sponsors and not by the Fund.
The Board noted that the Advisory Agreement Rate for the Fund was consistent with the zero fee structure, and was acceptable in light of the services covered by the Advisory Agreements. The Board also reviewed and considered the Sub-Advisory Agreement Rate and concluded that the Sub-Advisory Agreement Rate was acceptable in light of the services covered by the Sub-Advisory Agreements.
The Board also received and considered information about the nature and extent of services offered and fee rates charged by Funds Management and Wells Capital Management to other types of clients. In this regard, the Board received information about differences between the services, and the compliance, reporting, and other legal burdens and risks of providing investment advice to mutual funds and those associated with providing advice to non-mutual fund clients such as collective funds or institutional separate accounts.
Profitability
The Board received and considered a profitability analysis of Funds Management and its affiliates, but did not consider separate profitability information with respect to the Fund in light of its unique fee and distribution structure.
Economies of scale
In light of the unique fee and distribution structure of the Fund, the Board did not conduct an analysis of economies of scale in the context of reviewing the Fund’s Advisory Agreements.
Other benefits to Funds Management and Wells Capital Management
The Board received and considered information regarding potential “fall-out” or ancillary benefits received by Funds Management and its affiliates, including Wells Capital Management, as a result of their relationship with the Fund. Ancillary benefits could include, among others, benefits directly attributable to the relationship of Funds Management and Wells Capital Management with the Fund and benefits potentially derived from an increase in Funds Management’s and Wells Capital Management’s business as a result of their relationship with the Fund (such as the ability to market to shareholders other financial products offered by Funds Management and its affiliates, including Wells Capital Management). The Board noted that Funds Management receives payments from the SMA sponsors and that it had agreed to assume and pay or reimburse certain operating expenses.
The Board also reviewed information about whether and to what extent soft dollar credits are sought and how any such credits are utilized and any benefits that may be realized by using an affiliated broker.
Other factors and broader review
The Board also considered the markets for distribution of the Fund’s shares, including the multiple channels through which the Fund’s shares are offered and sold. The Board noted that the Fund is part of one of the few fund families that
| | | | |
| 22 | | Wells Fargo Managed Account CoreBuilder Shares – Series G | | Other Information (Unaudited) |
have both direct-to-fund and intermediary distribution channels. As discussed above, the Board reviews detailed materials received from Funds Management and Wells Capital Management annually as part of the re-approval process under Section 15 of the 1940 Act and also reviews and assesses information about the quality of the services that the Fund receives throughout the year. In this regard, the Board has reviewed reports of Funds Management at each of its quarterly meetings, which include, among other things, portfolio reviews and performance reports. In addition, the Board confers with portfolio managers at various times throughout the year.
Conclusion
After considering the above-described factors and based on its deliberations and its evaluation of the information described above, the Board concluded that approval of the continuation of the Advisory Agreements for the Fund was in the best interest of the Fund and its shareholders. Accordingly, the Board unanimously approved the continuation of the Advisory Agreements for an additional one-year period.
| | | | | | |
| List of Abbreviations | | Wells Fargo Managed Account CoreBuilder Shares – Series G | | | 23 | |
The following is a list of common abbreviations for terms and entities which may have appeared in this report.
| ABAG | — Association of Bay Area Governments |
| ACB | — Agricultural Credit Bank |
| ADR | — American Depositary Receipt |
| ADS | — American Depository Shares |
| AGC-ICC | — Assured Guaranty Corporation - Insured Custody Certificates |
| AGM | — Assured Guaranty Municipal |
| AMBAC | — American Municipal Bond Assurance Corporation |
| AMT | — Alternative Minimum Tax |
| ARM | — Adjustable Rate Mortgages |
| BAN | — Bond Anticipation Notes |
| BART | — Bay Area Rapid Transit |
| BHAC | — Berkshire Hathaway Assurance Corporation |
| CDA | — Community Development Authority |
| CDO | — Collateralized Debt Obligation |
| CDSC | — Contingent Deferred Sales Charge |
| CGIC | — Capital Guaranty Insurance Company |
| CGY | — Capital Guaranty Corporation |
| CIFG | — CDC (Caisse des Dépôts et Consignations) IX IS Financial Guarantee |
| COP | — Certificate of Participation |
| DRIVER | — Derivative Inverse Tax-Exempt Receipts |
| DW&P | — Department of Water & Power |
| DWR | — Department of Water Resources |
| ECFA | — Educational & Cultural Facilities Authority |
| EDFA | — Economic Development Finance Authority |
| ETET | — Eagle Tax-Exempt Trust |
| ETF | — Exchange-Traded Fund |
| FFCB | — Federal Farm Credit Bank |
| FGIC | — Financial Guaranty Insurance Corporation |
| FHA | — Federal Housing Authority |
| FHAG | — Federal Housing Agency |
| FHLB | — Federal Home Loan Bank |
| FHLMC | — Federal Home Loan Mortgage Corporation |
| FNMA | — Federal National Mortgage Association |
| GDR | — Global Depositary Receipt |
| GNMA | — Government National Mortgage Association |
| HCFR | — Healthcare Facilities Revenue |
| HEFA | — Health & Educational Facilities Authority |
| HEFAR | — Higher Education Facilities Authority Revenue |
| HFA | — Housing Finance Authority |
| HFFA | — Health Facilities Financing Authority |
| HUD | — Housing & Urban Development |
| IDA | — Industrial Development Authority |
| IDAG | — Industrial Development Agency |
| IDR | — Industrial Development Revenue |
| KRW | — Republic of Korea Won |
| LIBOR | — London Interbank Offered Rate |
| LLC | — Limited Liability Company |
| LLP | — Limited Liability Partnership |
| MBIA | — Municipal Bond Insurance Association |
| MFHR | — Multi-Family Housing Revenue |
| MFMR | — Multi-Family Mortgage Revenue |
| MMD | — Municipal Market Data |
| MSTR | — Municipal Securities Trust Receipts |
| MUD | — Municipal Utility District |
| NATL-RE | — National Public Finance Guarantee Corporation |
| PCFA | — Pollution Control Finance Authority |
| PCR | — Pollution Control Revenue |
| PFA | — Public Finance Authority |
| PFFA | — Public Facilities Financing Authority |
| PFOTER | — Puttable Floating Option Tax-Exempt Receipts |
| plc | — Public Limited Company |
| PSFG | — Public School Fund Guaranty |
| PUTTER | — Puttable Tax-Exempt Receipts |
| R&D | — Research & Development |
| RDA | — Redevelopment Authority |
| RDFA | — Redevelopment Finance Authority |
| REIT | — Real Estate Investment Trust |
| ROC | — Reset Option Certificates |
| SFHR | — Single Family Housing Revenue |
| SFMR | — Single Family Mortgage Revenue |
| SLMA | — Student Loan Marketing Association |
| SPDR | — Standard & Poor’s Depositary Receipts |
| STIT | — Short-Term Investment Trust |
| TAN | — Tax Anticipation Notes |
| TIPS | — Treasury Inflation-Protected Securities |
| TRAN | — Tax Revenue Anticipation Notes |
| TCR | — Transferable Custody Receipts |
| TTFA | — Transportation Trust Fund Authority |
| USD | — Unified School District |
| XLCA | — XL Capital Assurance |
This page is intentionally left blank.

More information about Wells Fargo Advantage Funds is available free upon request. To obtain literature, please write, e-mail, visit the Fund’s Web site, or call:
Wells Fargo Funds Management
Attn: Managed Account Services
P.O. Box 1450
Milwaukee, WI 53201
E-mail: mas@wellsfargo.com
Web site: www.wellsfargo.com/advantagefunds
Sales Support Inquiries: 1-800-368-1683
This report and the financial statements contained herein are submitted for the general information of the shareholders of Wells Fargo Managed Account CoreBuilder Shares. If this report is used for promotional purposes, distribution of the report must be accompanied or preceded by a current prospectus. For a prospectus containing more complete information, including charges and expenses, call 1-800-368-0627. Please consider the investment objectives, risks, charges, and expenses of the investment carefully before investing. This and other information about Wells Fargo Managed Account CoreBuilder Shares can be found in the current prospectus. Read the prospectus carefully before you invest or send money.
Wells Fargo Funds Management, LLC, a wholly owned subsidiary of Wells Fargo & Company, provides investment advisory and administrative services for Wells Fargo Managed Account CoreBuilder Shares. Other affiliates of Wells Fargo & Company provide subadvisory and other services for the Wells Fargo Managed Account CoreBuilder Shares. The Wells Fargo Managed Account CoreBuilder Shares are distributed by Wells Fargo Funds Distributor, LLC, Member FINRA/SIPC, an affiliate of Wells Fargo & Company.
NOT FDIC INSURED ¡ NO BANK GUARANTEE ¡ MAY LOSE VALUE

| | | | | | |
| | | |
© 2011 Wells Fargo Funds Management, LLC. All rights reserved. | | www.wellsfargo.com/advantagefunds | | 204043 08-11 SCBG/SAR129 06-11 |


Semi-Annual Report
June 30, 2011
WELLS FARGO MANAGED ACCOUNT COREBUILDER SHARESSM
Reduce clutter. Save trees.
Sign up for electronic delivery of prospectuses and shareholder reports at www.wellsfargo.com/advantagedelivery
Contents
The views expressed and any forward-looking statements are as of June 30, 2011 and are those of the Fund managers and/or Wells Fargo Funds Management, LLC. Discussions of individual securities, or the markets generally, or any Wells Fargo Advantage Fund are not intended as individual recommendations. Future events or results may vary significantly from those expressed in any forward-looking statements; the views expressed are subject to change at any time in response to changing circumstances in the market. Wells Fargo Funds Management, LLC, disclaims any obligation to publicly update or revise any views expressed or forward-looking statements.
NOT FDIC INSURED ¡ NO BANK GUARANTEE ¡ MAY LOSE VALUE
| | | | |
| 2 | | Wells Fargo Managed Account CoreBuilder Shares – Series M | | Performance Highlights |
Wells Fargo Managed Account CoreBuilder Shares – Series M
INVESTMENT OBJECTIVE
The Fund seeks total return, consisting of current income and capital appreciation.
ADVISER
Wells Fargo Funds Management, LLC
SUB-ADVISER
Wells Capital Management Incorporated
PORTFOLIO MANAGERS
Lyle J. Fitterer, CFA, CPA
Robert J. Miller
FUND INCEPTION
April 14, 2008
| | |
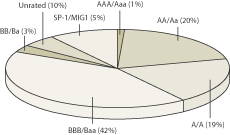
CREDIT QUALITY1 (AS OF JUNE 30, 2011) |
|
 |
| | |
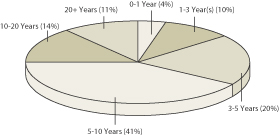
EFFECTIVE MATURITY DISTRIBUTION2 (AS OF JUNE 30, 2011) |
|
 |
| 1. | The ratings indicated are from Standard & Poor’s, Moody’s Investors Service, and/or Fitch Ratings Ltd. Credit Quality Ratings: Credit quality ratings apply to underlying holdings of the Fund and not the Fund itself. Standard and Poor’s rates the creditworthiness of bonds, ranging from AAA (highest) to D (lowest). Ratings from A to CCC may be modified by the addition of a plus (+) or minus (–) sign to show relative standing within the rating categories. Moody’s rates the creditworthiness of bonds, ranging from Aaa (highest) to C (lowest). Ratings Aa to B may be modified by the addition of a number 1 (highest) to 3 (lowest) to show relative standing within the ratings categories. Fitch rates the creditworthiness of bonds, ranging from AAA (highest) to D (lowest). If a security was rated by all three rating agencies, the middle rating was utilized. If rated by two of three rating agencies, the lower rating was utilized and if rated by one of the agencies that rating was utilized. Credit quality is subject to change and is calculated based on the total investments of the Fund. We generally define higher-quality bonds as bond having a rating above BBB/Baa and lower-quality bonds as bonds having a rating below BBB/Baa. |
| 2. | Effective maturity is calculated based on the total long-term investments of the Fund. It is subject to change and may have changed since the date specified. |
| | | | | | |
| Performance Highlights | | Wells Fargo Managed Account CoreBuilder Shares – Series M | | | 3 | |
Wells Fargo Managed Account CoreBuilder Shares – Series M (continued)
AVERAGE ANNUAL TOTAL RETURN (%) (AS OF JUNE 30, 2011)
| | | | | | | | | | | | | | | | |
| | | Inception Date | | | 6 Months* | | | 1 Year | | | Life of Fund | |
Series M | | | 04/14/2008 | | | | 5.88 | | | | 7.53 | | | | 9.40 | |
Barclays Capital Municipal Bond Index3 | | | | | | | 4.42 | | | | 3.48 | | | | 4.83 | |
| * | Returns for periods of less than one year are not annualized. |
Figures quoted represent past performance, which is no guarantee of future results and do not reflect the deduction of taxes that a shareholder may pay on fund distributions or the redemption of fund shares. Investment return and principal value of an investment will fluctuate so that an investor’s shares, when redeemed, may be worth more or less than their original cost. Current performance may be lower or higher than the performance data quoted. Current month-end performance is available by calling 800-368-0627.
Bond fund values fluctuate in response to the financial condition of individual issuers, general market and economic conditions, and changes in interest rates. In general, when interest rates rise, bond fund values fall and investors may lose principal value. The use of derivatives may reduce returns and/or increase volatility. Active trading results in increased turnover and trading expenses and may generate higher short-term capital gains. Certain investment strategies tend to increase the total risk of an investment (relative to the broader market). This Fund is exposed to high-yield securities risk. Consult the Fund’s prospectus for additional information on these and other risks. A portion of the Fund’s income may be subject to federal, state, and/or local income taxes or the alternative minimum tax (AMT). Any capital gains distributions may be taxable.
CoreBuilder Shares are a series of investment options within the separately managed accounts advised or subadvised by Wells Fargo Funds Management, LLC. The shares are fee-waived mutual funds that enable certain separately managed account investors to achieve greater diversification than smaller managed accounts might otherwise achieve.
| 3. | The Barclays Capital Municipal Bond Index is an unmanaged index composed of long-term tax-exempt bonds with a minimum credit rating of Baa. You cannot invest directly in an index. |
| | | | |
| 4 | | Wells Fargo Managed Account CoreBuilder Shares – Series M | | Fund Expenses |
As a shareholder of the Fund, you incur two types of costs: (1) transaction costs, including sales charges (loads) on purchase payments, redemption fees (if any) and exchange fees (if any); and (2) ongoing costs, including management fees; distribution (12b-1) and/or shareholder service fees; and other Fund expenses. This example is intended to help you understand your ongoing costs (in dollars) of investing in the Fund and to compare these costs with the ongoing costs of investing in other mutual funds.
The example is based on an investment of $1,000 invested at the beginning of the six-month period and held for the entire period from January 1, 2011 to June 30, 2011.
Actual Expenses
The “Actual” line of the table below provides information about actual account values and actual expenses. You may use the information in this line, together with the amount you invested, to estimate the expenses that you paid over the period. Simply divide your account value by $1,000 (for example, an $8,600 account value divided by $1,000 = 8.6), then multiply the result by the number in the “Actual” line under the heading entitled “Expenses Paid During Period” for your applicable class of shares to estimate the expenses you paid on your account during this period.
Hypothetical Example for Comparison Purposes
The “Hypothetical” line of the table below provides information about hypothetical account values and hypothetical expenses based on the Fund’s actual expense ratio and an assumed rate of return of 5% per year before expenses, which is not the Fund’s actual return. The hypothetical account values and expenses may not be used to estimate the actual ending account balance or expenses you paid for the period. You may use this information to compare the ongoing costs of investing in the Fund and other funds. To do so, compare this 5% hypothetical example with the 5% hypothetical examples that appear in the shareholder reports of the other funds.
Please note that the expenses shown in the table are meant to highlight your ongoing costs only and do not reflect any transactional costs, such as sales charges (loads), redemption fees, or exchange fees. Therefore, the “Hypothetical” line of the table is useful in comparing ongoing costs only, and will not help you determine the relative total costs of owning different funds. In addition, if these transactional costs were included, your costs would have been higher.
| | | | | | | | | | | | | | | | |
| | | Beginning
Account Value
01-01-2011 | | | Ending
Account Value
06-30-2011 | | | Expenses
Paid During
the Period1 | | | Net Annual
Expense Ratio | |
| | | | |
Actual | | $ | 1,000.00 | | | $ | 1,058.76 | | | $ | 0.00 | | | | 0.00 | % |
Hypothetical (5% return before expenses) | | $ | 1,000.00 | | | $ | 1,024.79 | | | $ | 0.00 | | | | 0.00 | % |
| 1. | Expenses paid is equal to the annualized expense ratio multiplied by the average account value over the period, multiplied by the number of days in the most recent fiscal half-year divided by the number of days in the fiscal year (to reflect the one-half year period). |
| | | | | | |
| Portfolio of Investments—June 30, 2011 (Unaudited) | | Wells Fargo Managed Account CoreBuilder Shares – Series M | | | 5 | |
| | | | | | | | | | | | | | | | |
| Security Name | | Interest Rate | | | Maturity Date | | | Principal | | | Value | |
| | | | | | | | | | | | | | | | |
| | | | |
Municipal Bonds and Notes: 98.60% | | | | | | | | | | | | | | | | |
| | | | |
| Arizona: 1.52% | | | | | | | | | | | | | | | | |
Arizona School Facilities Board Revenue State School Trust (Miscellaneous Revenue, AMBAC Insured) | | | 5.00 | % | | | 07/01/2016 | | | $ | 100,000 | | | $ | 106,428 | |
Verrado AZ Community Facilities District # 1 (Tax Revenue) | | | 4.85 | | | | 07/15/2014 | | | | 85,000 | | | | 85,013 | |
| | | | |
| | | | | | | | | | | | | | | 191,441 | |
| | | | | | | | | | | | | | | | |
| | | | |
| California: 19.75% | | | | | | | | | | | | | | | | |
Alameda CA Corridor Transportation Authority Sub Lien Series A (Transportation Revenue, AMBAC Insured)(z) | | | 5.55 | | | | 10/01/2018 | | | | 400,000 | | | | 275,224 | |
California HFFA Community Development Project (Miscellaneous Revenue, California Mortgages Insured) | | | 6.25 | | | | 02/01/2026 | | | | 100,000 | | | | 105,753 | |
California State Various Purposes (Miscellaneous Revenue) | | | 5.75 | | | | 04/01/2031 | | | | 100,000 | | | | 106,748 | |
California State Various Purposes (Tax Revenue) | | | 6.00 | | | | 11/01/2039 | | | | 100,000 | | | | 106,811 | |
California State Various Purposes Series A (Miscellaneous Revenue) | | | 6.25 | | | | 04/01/2034 | | | | 250,000 | | | | 260,240 | |
California Statewide Communities Sutter Health Series A (Health Revenue) | | | 6.00 | | | | 08/15/2042 | | | | 100,000 | | | | 106,495 | |
Corona-Norco CA USD CCAB Election 2006 Series C (Tax Revenue, AGM Insured)(z) | | | 1.78 | | | | 08/01/2039 | | | | 80,000 | | | | 57,984 | |
Escondido CA Union High School District CAB Election 2008 Series A (Tax Revenue, Assured Guaranty Insured)(z) | | | 6.00 | | | | 08/01/2029 | | | | 200,000 | | | | 63,334 | |
Gilroy CA USD CAB Election 2008 Series A (Tax Revenue, Assured Guaranty Insured)(z) | | | 6.00 | | | | 08/01/2032 | | | | 200,000 | | | | 50,966 | |
Hawthorne CA School District CAB Election of 1997 Series C (Tax Revenue, NATL-RE Insured)(z) | | | 6.80 | | | | 11/01/2025 | | | | 100,000 | | | | 39,201 | |
M-S-R Energy Authority California Gas Series B (Energy Revenue) | | | 6.13 | | | | 11/01/2029 | | | | 150,000 | | | | 155,445 | |
Northern California Gas Authority # 1 LIBOR (Energy Revenue)± | | | 0.80 | | | | 07/01/2017 | | | | 45,000 | | | | 39,137 | |
Oakland CA USD Alameda County Election 2006 Series A (Tax Revenue) | | | 6.50 | | | | 08/01/2024 | | | | 100,000 | | | | 110,291 | |
Palomar CA Community College CAB Election 2006 Series B (Tax Revenue)(z) | | | 6.38 | | | | 08/01/2032 | | | | 570,000 | | | | 138,596 | |
Palomar CA Pomerado Health CAB Election 2004 Series A (Tax Revenue)(z) | | | 7.00 | | | | 08/01/2034 | | | | 250,000 | | | | 48,188 | |
Richmond CA Joint Powers Financing Authority Civic Center Project (Lease Revenue, Assured Guaranty Insured) | | | 5.88 | | | | 08/01/2037 | | | | 50,000 | | | | 51,603 | |
Sacramento County CA Sanitation District Financing Authority Regulation B (Water & Sewer Revenue, NATL-RE FGIC Insured)± | | | 0.70 | | | | 12/01/2035 | | | | 200,000 | | | | 137,340 | |
San Diego County CA COP (Tax Revenue, AMBAC Insured)(z) | | | 6.38 | | | | 07/01/2030 | | | | 250,000 | | | | 76,638 | |
Santa Ana CA Financing Authority Police Administration & Holding Facility Series A (Miscellaneous Revenue) | | | 6.25 | | | | 07/01/2018 | | | | 250,000 | | | | 273,833 | |
Stockton CA USD CAB Election 2008 Series D (Education Revenue)(z) | | | 7.46 | | | | 08/01/2035 | | | | 1,450,000 | | | | 275,834 | |
| | | | |
| | | | | | | | | | | | | | | 2,479,661 | |
| | | | | | | | | | | | | | | | |
| | | | |
| Colorado: 5.71% | | | | | | | | | | | | | | | | |
Colorado ECFA Charter School American Academy Project (Miscellaneous Revenue, Moral Obligation Insured) | | | 7.13 | | | | 12/01/2033 | | | | 200,000 | | | | 225,512 | |
Colorado ECFA Charter School Project (Education Revenue) | | | 5.50 | | | | 05/01/2036 | | | | 250,000 | | | | 233,638 | |
Colorado ECFA Charter School Series A (Lease Revenue, Education Revenue) | | | 6.25 | | | | 11/01/2040 | | | | 150,000 | | | | 151,568 | |
Public Authority for Colorado Energy Natural Gas (Energy Revenue) | | | 5.75 | | | | 11/15/2018 | | | | 100,000 | | | | 106,474 | |
| | | | |
| | | | | | | | | | | | | | | 717,192 | |
| | | | | | | | | | | | | | | | |
| | | | |
| District of Columbia: 0.81% | | | | | | | | | | | | | | | | |
District of Columbia Cesar Chavez Public Charter School Project (Miscellaneous Revenue) | | | 6.50 | | | | 11/15/2021 | | | | 100,000 | | | | 101,390 | |
| | | | | | | | | | | | | | | | |
| | | | |
| 6 | | Wells Fargo Managed Account CoreBuilder Shares – Series M | | Portfolio of Investments—June 30, 2011 (Unaudited) |
| | | | | | | | | | | | | | | | |
| Security Name | | Interest Rate | | | Maturity Date | | | Principal | | | Value | |
| | | | | | | | | | | | | | | | |
| | | | |
| Florida: 3.27% | | | | | | | | | | | | | | | | |
City of Sunrise FL PFFA CAB Series B (Tax Revenue, NATL-RE Insured)(z) | | | 6.35 | % | | | 10/01/2016 | | �� | $ | 175,000 | | | $ | 136,981 | |
Collier County FL IDA Naples Community Hospital Incorporated Project (Health Revenue, Bank of America NA LOC)± | | | 4.65 | | | | 10/01/2034 | | | | 225,000 | | | | 224,971 | |
Florida Gaming Division Seminole Tribe Settlement Series 2010-A (Miscellaneous Revenue)†† | | | 5.13 | | | | 10/01/2017 | | | | 50,000 | | | | 48,517 | |
| | | | |
| | | | | | | | | | | | | | | 410,469 | |
| | | | | | | | | | | | | | | | |
| | | | |
| Georgia: 0.97% | | | | | | | | | | | | | | | | |
Atlanta GA Development Authority Tuff Yamacraw LLC Project Series A (IDR, AMBAC Insured) | | | 5.00 | | | | 01/01/2027 | | | | 50,000 | | | | 45,707 | |
Municipal Gas Authority of Georgia Main Street Natural Gas Incorporated Project Series A (Energy Revenue) | | | 5.00 | | | | 03/15/2022 | | | | 75,000 | | | | 75,875 | |
| | | | |
| | | | | | | | | | | | | | | 121,582 | |
| | | | | | | | | | | | | | | | |
| | | | |
| Guam: 2.97% | | | | | | | | | | | | | | | | |
Guam Government Hotel Occupancy (Tax Revenue) | | | 6.50 | | | | 11/01/2040 | | | | 200,000 | | | | 204,200 | |
Guam Government Waterworks Authority (Water & Sewer Revenue) | | | 5.00 | | | | 07/01/2019 | | | | 75,000 | | | | 70,789 | |
Guam Power Authority Series A (Utilities Revenue, AMBAC Insured) | | | 5.00 | | | | 10/01/2018 | | | | 100,000 | | | | 97,793 | |
| | | | |
| | | | | | | | | | | | | | | 372,782 | |
| | | | | | | | | | | | | | | | |
| | | | |
| Idaho: 2.63% | | | | | | | | | | | | | | | | |
Boise-Kuna ID Irrigation District Arrowrock Hydroelectric Project (Utilities Revenue) | | | 7.38 | | | | 06/01/2040 | | | | 100,000 | | | | 109,880 | |
Idaho Housing & Finance Association Liberty Charter School Series A (Miscellaneous Revenue) | | | 6.00 | | | | 06/01/2038 | | | | 250,000 | | | | 220,693 | |
| | | | |
| | | | | | | | | | | | | | | 330,573 | |
| | | | | | | | | | | | | | | | |
| | | | |
| Illinois: 12.55% | | | | | | | | | | | | | | | | |
Illinois Finance Authority Medical District Commission Project A (Health Revenue, CIFC Corporation Insured) | | | 4.13 | | | | 09/01/2018 | | | | 90,000 | | | | 91,994 | |
Illinois State Series A (Tax Revenue, FSA Insured) | | | 5.00 | | | | 06/01/2015 | | | | 125,000 | | | | 136,870 | |
Illinois State Series A (Tax Revenue, AMBAC Insured) | | | 5.00 | | | | 11/01/2025 | | | | 100,000 | | | | 99,085 | |
Illinois State Series A (Tax Revenue, NATL-RE FGIC Insured) | | | 5.25 | | | | 10/01/2015 | | | | 100,000 | | | | 106,751 | |
Lake County IL Community High School District # 117 Antioch CAB Series B (Tax Revenue, NATL-RE FGIC Insured)(z) | | | 5.85 | | | | 12/01/2016 | | | | 150,000 | | | | 118,760 | |
Lake County IL School District # 38 Big Hollow CAB (Tax Revenue, AMBAC Insured)(z) | | | 5.67 | | | | 02/01/2019 | | | | 75,000 | | | | 48,517 | |
McHenry & Kane Counties IL CAB (Tax Revenue, NATL-RE FGIC Insured)(z) | | | 5.38 | | | | 01/01/2016 | | | | 140,000 | | | | 116,719 | |
Metropolitan Pier & Exposition Authority IL State Tax CAB Refunding McCormick Project (Tax Revenue, NATL-RE FGIC Insured)(z) | | | 5.84 | | | | 06/15/2029 | | | | 100,000 | | | | 35,443 | |
Metropolitan Pier & Exposition Authority IL State Tax CAB Refunding McCormick Project Series B (Tax Revenue, AGM Insured)(z) | | | 6.04 | | | | 06/15/2027 | | | | 75,000 | | | | 30,493 | |
Railsplitter Tobacco Settlement Authority (Tobacco Revenue) | | | 3.13 | | | | 06/01/2014 | | | | 60,000 | | | | 60,879 | |
Railsplitter Tobacco Settlement Authority (Tobacco Revenue) | | | 5.50 | | | | 06/01/2023 | | | | 100,000 | | | | 101,446 | |
Railsplitter Tobacco Settlement Authority (Tobacco Revenue) | | | 6.25 | | | | 06/01/2024 | | | | 300,000 | | | | 310,479 | |
Village of Riverdale IL GO (Tax Revenue) | | | 8.00 | | | | 10/01/2036 | | | | 100,000 | | | | 100,605 | |
Waukegan IL CAB Series A (Tax Revenue, NATL-RE FGIC Insured)(z) | | | 5.47 | | | | 12/30/2017 | | | | 200,000 | | | | 145,110 | |
Will County IL School District # 114 CAB Series C (Tax Revenue)(z) | | | 5.04 | | | | 12/01/2017 | | | | 100,000 | | | | 72,490 | |
| | | | |
| | | | | | | | | | | | | | | 1,575,641 | |
| | | | | | | | | | | | | | | | |
| | | | | | |
| Portfolio of Investments—June 30, 2011 (Unaudited) | | Wells Fargo Managed Account CoreBuilder Shares – Series M | | | 7 | |
| | | | | | | | | | | | | | | | |
| Security Name | | Interest Rate | | | Maturity Date | | | Principal | | | Value | |
| | | | | | | | | | | | | | | | |
| | | | |
| Indiana: 2.17% | | | | | | | | | | | | | | | | |
Indiana State Ascension Health Services Series B-3 (Health Revenue)§± | | | 2.25 | % | | | 11/15/2031 | | | $ | 150,000 | | | $ | 149,270 | |
Jasper County IN PCR Northern Series B (IDR, NATL-RE Insured) | | | 5.60 | | | | 11/01/2016 | | | | 110,000 | | | | 123,154 | |
| | | | |
| | | | | | | | | | | | | | | 272,424 | |
| | | | | | | | | | | | | | | | |
| | | | |
| Kansas: 0.98% | | | | | | | | | | | | | | | | |
Wyandotte County KS CAB Sales Tax Subordinate Lien (Tax Revenue)(z) | | | 6.44 | | | | 06/01/2021 | | | | 100,000 | | | | 56,057 | |
Wyandotte County KS United Government Referendum Sales Tax Second Lien Area B (Tax Revenue) | | | 5.00 | | | | 12/01/2020 | | | | 65,000 | | | | 66,522 | |
| | | | |
| | | | | | | | | | | | | | | 122,579 | |
| | | | | | | | | | | | | | | | |
| | | | |
| Kentucky: 2.59% | | | | | | | | | | | | | | | | |
Kentucky EDFA Norton Healthcare Incorporated Series B (Health Revenue, NATL-RE Insured)(z) | | | 5.73 | | | | 10/01/2020 | | | | 200,000 | | | | 123,172 | |
Kentucky EDFA Norton Healthcare Incorporated Series B (Health Revenue, NATL-RE Insured)(z) | | | 6.18 | | | | 10/01/2023 | | | | 150,000 | | | | 74,403 | |
Kentucky EDFA Unrefunded Balance Norton C (Health Revenue, NATL-RE Insured)± | | | 5.95 | | | | 10/01/2017 | | | | 120,000 | | | | 127,525 | |
| | | | |
| | | | | | | | | | | | | | | 325,100 | |
| | | | | | | | | | | | | | | | |
| | | | |
| Louisiana: 0.41% | | | | | | | | | | | | | | | | |
New Orleans LA Aviation Board Gulf Opportunity Zone Consolidated Rental Car Series A (Airport Revenue) | | | 6.50 | | | | 01/01/2040 | | | | 50,000 | | | | 51,069 | |
| | | | | | | | | | | | | | | | |
| | | | |
| Massachusetts: 0.87% | | | | | | | | | | | | | | | | |
Massachusetts Development Finance Agency Sabis International Charter Series A (Miscellaneous Revenue) | | | 8.00 | | | | 04/15/2039 | | | | 100,000 | | | | 108,749 | |
| | | | | | | | | | | | | | | | |
| | | | |
| Michigan: 10.09% | | | | | | | | | | | | | | | | |
Comstock MI Public Schools CAB (Tax Revenue, AMBAC Insured)(z) | | | 6.67 | | | | 05/01/2014 | | | | 200,000 | | | | 187,530 | |
Michigan Finance Authority Limited Obligation Public Academy - Old Redford Series A (Miscellaneous Revenue) | | | 5.25 | | | | 12/01/2020 | | | | 100,000 | | | | 94,246 | |
Michigan Finance Authority State Aid Notes Series A-1 Detroit School Project (Miscellaneous Revenue) | | | 6.45 | | | | 02/20/2012 | | | | 200,000 | | | | 202,926 | |
Michigan Municipal Bond Authority Local Government Loan Program Series A (Miscellaneous Revenue, AMBAC Insured) | | | 5.00 | | | | 05/01/2013 | | | | 100,000 | | | | 102,497 | |
Michigan Municipal Bond Authority Local Government Loan Program Series A (Miscellaneous Revenue) | | | 5.00 | | | | 11/01/2015 | | | | 50,000 | | | | 50,074 | |
Michigan Municipal Bond Authority Local Government Loan Program Series G (Miscellaneous Revenue, AMBAC Insured)(z) | | | 7.70 | | | | 05/01/2016 | | | | 50,000 | | | | 41,312 | |
Michigan Municipal Bond Authority School District City of Detroit (Miscellaneous Revenue) | | | 5.00 | | | | 06/01/2016 | | | | 250,000 | | | | 264,668 | |
Michigan Public ECFA Bradford Academy Project (Education Revenue) | | | 8.00 | | | | 09/01/2021 | | | | 200,000 | | | | 213,664 | |
Wayne County MI Airport Authority Detroit Metropolitan Airport Project (Airport Revenue, AGM-CR Insured) | | | 5.00 | | | | 12/01/2015 | | | | 100,000 | | | | 109,314 | |
| | | | |
| | | | | | | | | | | | | | | 1,266,231 | |
| | | | | | | | | | | | | | | | |
| | | | |
| Missouri: 2.06% | | | | | | | | | | | | | | | | |
St Louis MO Lambert International Airport Series A (Airport Revenue) | | | 5.00 | | | | 07/01/2021 | | | | 250,000 | | | | 258,838 | |
| | | | | | | | | | | | | | | | |
| | | | |
| Nevada: 0.73% | | | | | | | | | | | | | | | | |
Clark County NV School District Series B (Tax Revenue, AGM Insured) | | | 5.00 | | | | 06/15/2017 | | | | 85,000 | | | | 91,752 | |
| | | | | | | | | | | | | | | | |
| | | | |
| 8 | | Wells Fargo Managed Account CoreBuilder Shares – Series M | | Portfolio of Investments—June 30, 2011 (Unaudited) |
| | | | | | | | | | | | | | | | |
| Security Name | | Interest Rate | | | Maturity Date | | | Principal | | | Value | |
| | | | | | | | | | | | | | | | |
| | | | |
| New Jersey: 0.83% | | | | | | | | | | | | | | | | |
New Jersey State Higher Education Assistance Authority Series A (Education Revenue) | | | 5.63 | % | | | 06/01/2030 | | | $ | 100,000 | | | $ | 103,645 | |
| | | | | | | | | | | | | | | | |
| | | | |
| New York: 0.83% | | | | | | | | | | | | | | | | |
Seneca County NY IDAG Seneca Meadows Incorporated Project (IDR)††± | | | 6.63 | | | | 10/01/2035 | | | | 50,000 | | | | 50,003 | |
Yonkers NY IDAG Sarah Lawrence College Project Series A (Education Revenue) | | | 5.75 | | | | 06/01/2024 | | | | 50,000 | | | | 54,227 | |
| | | | |
| | | | | | | | | | | | | | | 104,230 | |
| | | | | | | | | | | | | | | | |
| | | | |
| Oklahoma: 0.76% | | | | | | | | | | | | | | | | |
Oklahoma HFA Single Homeownership Loan Program Series A (Housing Revenue, GNMA/FNMA Insured) | | | 4.50 | | | | 09/01/2024 | | | | 95,000 | | | | 95,537 | |
| | | | | | | | | | | | | | | | |
| | | | |
| Pennsylvania: 4.16% | | | | | | | | | | | | | | | | |
Allegheny County PA Hospital Development Authority University of Pittsburg Medical Center Series A-1 (Health Revenue)± | | | 1.00 | | | | 02/01/2037 | | | | 450,000 | | | | 322,043 | |
Delaware County PA IDA Resource Recovery Facility Series A (Resource Recovery Revenue) | | | 6.20 | | | | 07/01/2019 | | | | 100,000 | | | | 98,652 | |
Harrisburg PA Authority Resource Recovery Facility Series D-1 (Resource Recovery Revenue, AGM Insured)± | | | 5.25 | | | | 12/01/2033 | | | | 100,000 | | | | 101,674 | |
| | | | |
| | | | | | | | | | | | | | | 522,369 | |
| | | | | | | | | | | | | | | | |
| | | | |
| Puerto Rico: 0.42% | | | | | | | | | | | | | | | | |
Puerto Rico Sales Tax Financing Corporation First Sub-Series A (Tax Revenue) | | | 6.38 | | | | 08/01/2039 | | | | 50,000 | | | | 53,427 | |
| | | | | | | | | | | | | | | | |
| | | | |
| South Carolina: 2.91% | | | | | | | | | | | | | | | | |
Allendale County SC School District Energy Savings Special Obligation (Lease Revenue, State Aid Withholding Insured) | | | 8.50 | | | | 12/01/2018 | | | | 100,000 | | | | 104,329 | |
Town of Newberry SC Newberry County School District Project (Lease Revenue) | | | 5.25 | | | | 12/01/2017 | | | | 240,000 | | | | 261,048 | |
| | | | |
| | | | | | | | | | | | | | | 365,377 | |
| | | | | | | | | | | | | | | | |
| | | | |
| South Dakota: 1.99% | | | | | | | | | | | | | | | | |
South Dakota Education Loans (Education Revenue) | | | 5.45 | | | | 06/01/2020 | | | | 250,000 | | | | 250,028 | |
| | | | | | | | | | | | | | | | |
| | | | |
| Tennessee: 3.40% | | | | | | | | | | | | | | | | |
Elizabethton TN HEFA Prefunded Series B (Health Revenue, NATL-RE-IBC Insured) | | | 7.75 | | | | 07/01/2029 | | | | 100,000 | | | | 108,801 | |
Metropolitan Nashville TN Airport Authority Refunding Aero Nashville LLC Project (Airport Revenue) | | | 5.20 | | | | 07/01/2026 | | | | 100,000 | | | | 92,812 | |
Tennessee Energy Acquisition Corporation Gas Series A (Energy Revenue) | | | 5.25 | | | | 09/01/2018 | | | | 100,000 | | | | 103,634 | |
Tennessee Energy Acquisition Corporation Series A (Energy Revenue) | | | 5.00 | | | | 09/01/2013 | | | | 20,000 | | | | 21,108 | |
Tennessee Energy Acquisition Corporation Series C (Energy Revenue) | | | 5.00 | | | | 02/01/2019 | | | | 100,000 | | | | 100,610 | |
| | | | |
| | | | | | | | | | | | | | | 426,965 | |
| | | | | | | | | | | | | | | | |
| | | | |
| Texas: 7.97% | | | | | | | | | | | | | | | | |
Central Texas Regional Mobility Authority (Miscellaneous Revenue)(z) | | | 6.34 | | | | 01/01/2025 | | | | 700,000 | | | | 298,998 | |
Houston TX Airport Systems AMT Sub Series C (Airport Revenue, XLCA Insured)(m)(a)§±(n) | | | 0.37 | | | | 07/01/2032 | | | | 100,000 | | | | 89,813 | |
La Vernia TX Higher Education Finance Corporation Series A (Miscellaneous Revenue) | | | 6.25 | | | | 02/15/2017 | | | | 250,000 | | | | 266,010 | |
Sabine River TX Authority PCR TXU Electric Company Project Series B (Resource Recovery Revenue)± | | | 5.75 | | | | 05/01/2030 | | | | 35,000 | | | | 34,392 | |
Texas Municipal Gas Acquisition & Supply Corporation Series A (Energy Revenue)± | | | 0.87 | | | | 09/15/2017 | | | | 205,000 | | | | 199,219 | |
| | | | | | |
| Portfolio of Investments—June 30, 2011 (Unaudited) | | Wells Fargo Managed Account CoreBuilder Shares – Series M | | | 9 | |
| | | | | | | | | | | | | | | | |
| Security Name | | Interest Rate | | | Maturity Date | | | Principal | | | Value | |
| | | | | | | | | | | | | | | | |
| | | | |
| Texas (continued) | | | | | | | | | | | | | | | | |
Texas Private Activity Bond IBJ Infrastructure Project Senior Lien (Transportation Revenue) | | | 7.50 | % | | | 06/30/2032 | | | $ | 50,000 | | | $ | 55,821 | |
Texas Private Activity Bond IBJ Infrastructure Project Senior Lien (Transportation Revenue) | | | 7.50 | | | | 06/30/2033 | | | | 50,000 | | | | 55,821 | |
| | | | |
| | | | | | | | | | | | | | | 1,000,074 | |
| | | | | | | | | | | | | | | | |
| | | | |
| Utah: 0.83% | | | | | | | | | | | | | | | | |
Spanish Fork City UT American Leadership Academy (Miscellaneous Revenue)†† | | | 5.55 | | | | 11/15/2021 | | | | 115,000 | | | | 104,175 | |
| | | | | | | | | | | | | | | | |
| | | | |
| Vermont: 0.80% | | | | | | | | | | | | | | | | |
Burlington VT Airport Anticipation Notes (Airport Revenue) | | | 6.50 | | | | 12/15/2012 | | | | 100,000 | | | | 99,943 | |
| | | | | | | | | | | | | | | | |
| | | | |
| Virgin Islands: 1.93% | | | | | | | | | | | | | | | | |
Virgin Islands Public Finance Authority Series B (Tax Revenue) | | | 5.00 | | | | 10/01/2025 | | | | 200,000 | | | | 192,100 | |
Virgin Islands Public Finance Authority Sub Matching Loan Notes Series A (Miscellaneous Revenue) | | | 6.00 | | | | 10/01/2039 | | | | 50,000 | | | | 50,027 | |
| | | | |
| | | | | | | | | | | | | | | 242,127 | |
| | | | | | | | | | | | | | | | |
| | | | |
| Wisconsin: 1.69% | | | | | | | | | | | | | | | | |
Wisconsin State Oneida Tribe of Indians (Tax Revenue)†† | | | 5.50 | | | | 02/01/2021 | | | | 200,000 | | | | 211,608 | |
| | | | | | | | | | | | | | | | |
| | | | |
Total Municipal Bonds and Notes (Cost $12,011,089) | | | | | | | | | | | | | | | 12,376,978 | |
| | | | | | | | | | | | | | | | |
| | | | |
| | | Yield | | | | | | | | | | |
| | | | |
Short-Term Investments: 0.79% | | | | | | | | | | | | | | | | |
| | | | |
| US Treasury Securities: 0.40% | | | | | | | | | | | | | | | | |
US Treasury Bill(z)# | | | 0.02 | | | | 09/22/2011 | | | | 50,000 | | | | 49,998 | |
| | | | | | | | | | | | | | | | |
| | | | |
| | | | | | | | | Shares | | | | |
| | | | |
| Investment Companies: 0.39% | | | | | | | | | | | | | | | | |
Wells Fargo Advantage National Tax-Free Money Market Fund(l)(u) | | | 0.01 | | | | | | | | 48,513 | | | | 48,513 | |
| | | | | | | | | | | | | | | | |
| | | | |
Total Short-Term Investments (Cost $98,511) | | | | | | | | | | | | | | | 98,511 | |
| | | | | | | | | | | | | | | | |
| | | | | | | | |
| | |
| Total Investments in Securities | | | | | | | | |
| (Cost $12,109,600)* | | | 99.39 | % | | | 12,475,489 | |
Other Assets and Liabilities, Net | | | 0.61 | | | | 77,072 | |
| | | | | | | | |
| Total Net Assets | | | 100.00 | % | | $ | 12,552,561 | |
| | | | | | | | |
| | | | |
| 10 | | Wells Fargo Managed Account CoreBuilder Shares – Series M | | Portfolio of Investments—June 30, 2011 (Unaudited) |
| (m) | An auction-rate security whose interest rate resets at predetermined short-term intervals through a Dutch auction; rate shown represents the rate in effect at period-end. |
| (a) | Security is fair valued by the Management Valuation Team, and in certain instances by the Board of Trustees, in accordance with procedures approved by the Board of Trustees. |
| †† | Security that may be resold to “qualified institutional buyers” under Rule 144A or securities offered pursuant to Section 4(2) of the Securities Act of 1933, as amended. |
| (l) | Investment in an affiliate. |
| (u) | Rate shown is the 7-day annualized yield at period end. |
| § | This security is subject to a demand feature which reduces the effective maturity. |
| ± | Variable rate investments. |
| (z) | Zero coupon security. Rate represents yield to maturity. |
| (n) | Auction to set interest rate on security failed at period end due to insufficient investor interest; failed auction does not itself cause a default. |
| # | All or a portion of this security is segregated as collateral for investments in derivative instruments. |
| * | Cost for federal income tax purposes is $12,109,600 and net unrealized appreciation (depreciation) consists of: |
| | | | |
Gross unrealized appreciation | | $ | 472,985 | |
Gross unrealized depreciation | | | (107,096 | ) |
| | | | |
Net unrealized appreciation | | $ | 365,889 | |
The accompanying notes are an integral part of these financial statements.
| | | | | | |
| Statement of Assets and Liabilities—June 30, 2011 (Unaudited) | | Wells Fargo Managed Account CoreBuilder Shares – Series M | | | 11 | |
| | | | |
| | | | |
| |
Assets | | | | |
Investments | | | | |
In unaffiliated securities, at value | | $ | 12,426,976 | |
In affiliated securities, at value | | | 48,513 | |
| | | | |
Total investments, at value (see cost below) | | | 12,475,489 | |
Receivable for interest | | | 119,779 | |
Receivable for daily variation margin on open futures contracts | | | 2,656 | |
Prepaid expenses and other assets | | | 9,375 | |
| | | | |
Total assets | | | 12,607,299 | |
| | | | |
| |
Liabilities | | | | |
Dividends payable | | | 51,603 | |
Payable for Fund shares redeemed | | | 3,135 | |
| | | | |
Total liabilities | | | 54,738 | |
| | | | |
Total net assets | | $ | 12,552,561 | |
| | | | |
| |
NET ASSETS CONSIST OF | | | | |
Paid-in capital | | $ | 12,110,326 | |
Overdistributed net investment income | | | (220 | ) |
Accumulated net realized gains on investments | | | 63,138 | |
Net unrealized gains on investments | | | 379,317 | |
| | | | |
Total net assets | | $ | 12,552,561 | |
| | | | |
| |
COMPUTATION OF NET ASSET VALUE PER SHARE1 | | | | |
Net assets | | $ | 12,552,561 | |
Shares outstanding | | | 1,181,629 | |
Net asset value per share | | | $10.62 | |
| | | | |
| |
Total investments, at cost | | $ | 12,109,600 | |
| | | | |
| 1. | The Fund has an unlimited number of authorized shares. |
The accompanying notes are an integral part of these financial statements.
| | | | |
| 12 | | Wells Fargo Managed Account CoreBuilder Shares – Series M | | Statement of Operations—Six Months Ended June 30, 2011 (Unaudited) |
| | | | |
| | | | |
| |
Investment income | | | | |
Interest | | $ | 241,243 | |
Income from affiliated securities | | | 134 | |
| | | | |
Total investment income | | | 241,377 | |
| | | | |
| |
Expenses | | | | |
Custody and accounting fees | | | 2,670 | |
Professional fees | | | 17,914 | |
Shareholder report expenses | | | 7,122 | |
Trustees’ fees and expenses | | | 7,285 | |
Other fees and expenses | | | 1,513 | |
| | | | |
Total expenses | | | 36,504 | |
Less: Fee waivers and/or expense reimbursements | | | (36,504 | ) |
| | | | |
Net expenses | | | 0 | |
| | | | |
Net investment income | | | 241,377 | |
| | | | |
| |
REALIZED AND UNREALIZED GAINS (LOSSES) ON INVESTMENTS | | | | |
| |
Net realized gains (losses) on: | | | | |
Unaffiliated securities | | | 33,925 | |
Futures transactions | | | 9,313 | |
| | | | |
Net realized gains on investments | | | 43,238 | |
| | | | |
| |
Net unrealized gains (losses) on: | | | | |
Unaffiliated securities | | | 323,669 | |
Futures transactions | | | 13,428 | |
| | | | |
Net unrealized gains (losses) on investments | | | 337,097 | |
| | | | |
Net realized and unrealized gains (losses) on investments | | | 380,335 | |
| | | | |
Net increase in net assets resulting from operations | | $ | 621,712 | |
| | | | |
The accompanying notes are an integral part of these financial statements.
| | | | | | |
| Statements of Changes in Net Assets | | Wells Fargo Managed Account CoreBuilder Shares – Series M | | | 13 | |
| | | | | | | | | | | | | | | | |
| | | Six Months Ended
June 30, 2011
(Unaudited) | | | Year Ended
December 31, 2010 | |
| | | | |
Operations | | | | | | | | | | | | | | | | |
Net investment income | | | | | | $ | 241,377 | | | | | | | $ | 296,788 | |
Net realized gains on investments | | | | | | | 43,238 | | | | | | | | 86,904 | |
Net change in unrealized gains (losses) on investments | | | | | | | 337,097 | | | | | | | | (76,653 | ) |
| | | | | | | | | | | | | | | | |
Net increase in net assets resulting from operations | | | | | | | 621,712 | | | | | | | | 307,039 | |
| | | | | | | | | | | | | | | | |
| | | | |
Distributions to shareholders from | | | | | | | | | | | | | | | | |
Net investment income | | | | | | | (241,259 | ) | | | | | | | (296,788 | ) |
Net realized gains | | | | | | | 0 | | | | | | | | (84,154 | ) |
| | | | | | | | | | | | | | | | |
Total distributions to shareholders | | | | | | | (241,259 | ) | | | | | | | (380,942 | ) |
| | | | | | | | | | | | | | | | |
| | | | |
| | | Shares | | | | | | Shares | | | | |
| | | | |
Capital shares transactions | | | | | | | | | | | | | | | | |
Proceeds from shares sold | | | 450,522 | | | | 4,654,981 | | | | 261,490 | | | | 2,773,962 | |
Cost of shares redeemed | | | (43,013 | ) | | | (440,273 | ) | | | 0 | | | | 0 | |
| | | | | | | | | | | | | | | | |
Net increase in net assets resulting from capital share transactions | | | | | | | 4,214,708 | | | | | | | | 2,773,962 | |
| | | | | | | | | | | | | | | | |
Net increase in net assets | | | | | | | 4,595,161 | | | | | | | | 2,700,059 | |
| | | | | | | | | | | | | | | | |
| | | | |
Net assets | | | | | | | | | | | | | | | | |
Beginning of period | | | | | | | 7,957,400 | | | | | | | | 5,257,341 | |
| | | | | | | | | | | | | | | | |
End of period | | | | | | $ | 12,552,561 | | | | | | | $ | 7,957,400 | |
| | | | | | | | | | | | | | | | |
Overdistributed net investment income | | | | | | $ | (220 | ) | | | | | | $ | (338 | ) |
| | | | | | | | | | | | | | | | |
The accompanying notes are an integral part of these financial statements.
| | | | |
| 14 | | Wells Fargo Managed Account CoreBuilder Shares – Series M | | Financial Highlights |
| | | | | | | | | | | | | | | | |
| | | Beginning
Net Asset
Value Per
Share | | | Net
Investment
Income | | | Net Realized
and Unrealized
Gains (Losses)
on Investments | | | Distributions
from Net
Investment
Income | |
January 1, 2011 to June 30, 2011 (Unaudited) | | $ | 10.28 | | | | 0.25 | | | | 0.35 | | | | (0.26 | ) |
January 1, 2010 to December 31, 2010 | | $ | 10.26 | | | | 0.52 | | | | 0.14 | | | | (0.52 | ) |
January 1, 2009 to December 31, 2009 | | $ | 9.06 | | | | 0.55 | | | | 1.70 | | | | (0.55 | ) |
April 14, 20083 to December 31, 2008 | | $ | 10.00 | | | | 0.37 | | | | (0.92 | ) | | | (0.37 | ) |
| 1. | The adviser has contractually committed to irrevocably absorb and pay or reimburse all ordinary operating expenses of the Fund, except portfolio transactions or other investment-related costs (e.g., commissions), fees payable for services provided by the Fund’s securities lending agent, interest, taxes, leverage expenses and other expenses not incurred in the ordinary course of the Fund’s business. This commitment has an indefinite term. |
| 2. | Returns for periods of less than one year are not annualized. |
| 3. | Commencement of operations. |
The accompanying notes are an integral part of these financial statements.
| | | | | | |
| Financial Highlights | | Wells Fargo Managed Account CoreBuilder Shares – Series M | | | 15 | |
| | | | | | | | | | | | | | | | | | | | | | | | | | |
Distributions
from Net
Realized Gains | | | Ending
Net Asset
Value Per
Share | | | Ratio to Average Net Assets (Annualized) | | | Total
Return2 | | | Portfolio
Turnover
Rate | | | Net Assets at
End of Period
(000’s omitted) | |
| | | Net Investment
Income | | | Net
Expenses1 | | | | |
| | 0.00 | | | $ | 10.62 | | | | 4.92 | % | | | 0.00 | % | | | 5.88 | % | | | 17 | % | | $ | 12,553 | |
| | (0.12 | ) | | $ | 10.28 | | | | 4.93 | % | | | 0.00 | % | | | 6.53 | % | | | 41 | % | | $ | 7,957 | |
| | (0.50 | ) | | $ | 10.26 | | | | 5.50 | % | | | 0.00 | % | | | 25.50 | % | | | 157 | % | | $ | 5,257 | |
| | (0.02 | ) | | $ | 9.06 | | | | 5.29 | % | | | 0.00 | % | | | (5.74 | )% | | | 150 | % | | $ | 4,640 | |
| | | | |
| 16 | | Wells Fargo Managed Account CoreBuilder Shares – Series M | | Notes to Financial Statements (Unaudited) |
1. ORGANIZATION
Wells Fargo Funds Trust (the “Trust”), a Delaware statutory trust organized on March 10, 1999, is an open-end management investment company registered under the Investment Company Act of 1940, as amended (the “1940 Act”). These financial statements report on Wells Fargo Managed Account CoreBuilder Shares – Series M (the “Fund”) which is a diversified series of the Trust.
The Fund is a special purpose municipal bond fund that is used in combination with selected individual securities to effectively model institutional-level investment strategies. As an investment option within the separately managed accounts advised or sub-advised by Wells Fargo Funds Management, LLC, the Fund enables certain separately managed account investors to achieve greater diversification than small managed accounts might otherwise achieve.
2. SIGNIFICANT ACCOUNTING POLICIES
The following significant accounting policies, which are consistently followed in the preparation of the financial statements of the Fund, are in conformity with U.S. generally accepted accounting principles which require management to make estimates and assumptions that affect the reported amounts of assets and liabilities, disclosure of contingent assets and liabilities at the date of the financial statements, and the reported amounts of revenues and expenses during the reporting period. Actual results could differ from those estimates.
Securities valuation
Certain fixed income securities with maturities exceeding 60 days are valued based on available market quotations received from an independent pricing service approved by the Trust’s Board of Trustees which may utilize both transaction data and market information such as yield, prices of securities of comparable quality, coupon rate, maturity, type of issue, trading characteristics and other market data. If valuations are not available from the pricing service or values received are deemed not representative of market value, values will be obtained from a third party broker-dealer or determined based on the Fund’s Fair Value Procedures.
Debt securities of sufficient credit quality with original maturities of 60 days or less generally are valued at amortized cost which approximates fair value. The amortized cost method involves valuing a security at its cost, plus accretion of discount or minus amortization of premium over the period until maturity.
Investments in open-end mutual funds and non-registered investment companies are generally valued at net asset value.
Certain investments which are not valued using any of the methods discussed above, are valued at their fair value, as determined by procedures established in good faith and approved by the Board of Trustees.
The valuation techniques used by the Fund to measure fair value are consistent with the market approach, income approach and/or cost approach, where applicable, for each security type.
When-issued transactions
The Fund may purchase securities on a forward commitment or ‘when-issued’ basis. The Fund records a when-issued transaction on the trade date and will segregate assets to cover its obligation by confirming the availability of qualifying assets having a value sufficient to make payment for the securities purchased. Securities purchased on a when-issued basis are marked-to-market daily and the Fund begins earning interest on the settlement date. Losses may arise due to changes in the market value of the underlying securities or if the counterparty does not perform under the contract.
Futures contracts
The Fund may be subject to interest rate risk in the normal course of pursuing its investment objectives. The Fund may buy and sell futures contracts in order to gain exposure to, or protect against changes in, security values and interest rates. The primary risks associated with the use of futures contracts are the imperfect correlation between changes in market values of securities held by the Fund and the prices of futures contracts, and the possibility of an illiquid market.
Futures contracts are valued based upon their quoted daily settlement prices when available. The aggregate principal amounts of the contracts are not recorded in the financial statements. Fluctuations in the value of the contracts are recorded in the Statement of Assets and Liabilities as an asset or liability and in the Statement of Operations as unrealized gains or losses until the contracts are closed, at which point they are recorded as net realized gains or losses on futures contracts. With futures contracts, there is minimal counterparty risk to the Fund since futures are exchange traded and the exchange’s clearinghouse, as counterparty to all exchange traded futures, guarantees the futures against default.
| | | | | | |
| Notes to Financial Statements (Unaudited) | | Wells Fargo Managed Account CoreBuilder Shares – Series M | | | 17 | |
Security transactions and income recognition
Securities transactions are recorded on a trade date basis. Realized gains or losses are reported on the basis of identified cost of securities delivered.
Interest income is accrued daily and bond discounts are accreted and premiums are amortized daily based on the effective interest method. To the extent debt obligations are placed on non-accrual status, any related interest income may be reduced by writing off interest receivables when the collection of all or a portion of interest has become doubtful based on consistently applied procedures. If the issuer subsequently resumes interest payments or when the collectability of interest is reasonably assured, the debt obligation is removed from non-accrual status.
Distributions to shareholders
Distributions to shareholders from net investment income are accrued daily and paid monthly. Distributions from net realized gains, if any, are recorded on the ex-dividend date. Such distributions are determined in conformity with income tax regulations, which may differ from generally accepted accounting principles.
Federal and other taxes
The Fund intends to continue to qualify as a regulated investment company by distributing substantially all of its investment company taxable income and any net realized capital gains (after reduction for capital loss carryforwards) sufficient to relieve it from all, or substantially all, federal income taxes. Accordingly, no provision for federal income taxes was required.
The Fund’s income and federal excise tax returns and all financial records supporting those returns for the prior three fiscal years are subject to examination by the federal and Delaware revenue authorities.
Under the recently enacted Regulated Investment Company Modernization Act of 2010, the Fund will be permitted to carry forward capital losses incurred in taxable years beginning after December 22, 2010 for an unlimited period. However, any losses incurred during those future taxable years will be required to be utilized prior to the losses incurred in pre-enactment taxable years. As a result of this ordering rule, pre-enactment capital loss carryforwards may be more likely to expire unused. Additionally, post-enactment capital losses that are carried forward will retain their character as either short-term or long-term capital losses rather than being considered all short-term as under previous law.
3. FAIR VALUATION MEASUREMENTS
Fair value measurements of investments are determined within a framework that has established a fair value hierarchy based upon the various data inputs utilized in determining the value of the Fund’s investments. The three-level hierarchy gives the highest priority to unadjusted quoted prices in active markets for identical assets or liabilities (Level 1) and the lowest priority to unobservable inputs (Level 3). The Fund’s investments are classified within the fair value hierarchy based on the lowest level of input that is significant to the fair value measurement. The inputs are summarized into three broad levels as follows:
| n | | Level 1 – quoted prices in active markets for identical securities |
| n | | Level 2 – other significant observable inputs (including quoted prices for similar securities, interest rates, prepayment speeds, credit risk, etc.) |
| n | | Level 3 – significant unobservable inputs (including the Fund’s own assumptions in determining the fair value of investments) |
The inputs or methodologies used for valuing securities are not necessarily an indication of the risk associated with investing in those securities.
| | | | |
| 18 | | Wells Fargo Managed Account CoreBuilder Shares – Series M | | Notes to Financial Statements (Unaudited) |
As of June 30, 2011 the inputs used in valuing the Fund’s assets, which are carried at fair value, were as follows:
| | | | | | | | | | | | | | | | |
| Investments in Securities | | Quoted Prices (Level 1) | | | Significant Other
Observable Inputs (Level 2) | | | Significant Unobservable Inputs (Level 3) | | | Total | |
Municipal bonds and notes | | $ | 0 | | | $ | 12,287,165 | | | $ | 89,813 | | | $ | 12,376,978 | |
| | | | |
Short-term investments | | | | | | | | | | | | | | | | |
U.S. Treasury securities | | | 49,998 | | | | 0 | | | | 0 | | | | 49,998 | |
Investment companies | | | 48,513 | | | | 0 | | | | 0 | | | | 48,513 | |
| | | $ | 98,511 | | | $ | 12,287,165 | | | $ | 89,813 | | | $ | 12,475,489 | |
Further details on the major security types listed above can be found in the Fund’s Portfolio of Investments.
As of June 30, 2011, the inputs used in valuing the Fund’s other financial instruments, which are carried at fair value, were as follows:
| | | | | | | | | | | | | | | | |
| Other financial instruments | | Quoted Prices (Level 1) | | | Significant Other
Observable Inputs (Level 2) | | | Significant Unobservable Inputs (Level 3) | | | Total | |
Futures contracts | | $ | 13,428 | | | $ | 0 | | | $ | 0 | | | $ | 13,428 | |
Transfers in and transfers out are recognized at the end of the reporting period. For the six months ended June 30, 2011, the Fund did not have any significant transfers into/out of Level 1 and Level 2.
The following is a reconciliation of assets in which significant unobservable inputs (Level 3) were used in determining fair value:
| | | | |
| | | Municipal
bonds and
notes | |
Balance as of December 31, 2010 | | $ | 89,572 | |
Accrued discounts (premiums) | | | 217 | |
Realized gains (losses) | | | 0 | |
Change in unrealized gains (losses) | | | 24 | |
Purchases | | | 0 | |
Sales | | | 0 | |
Transfers into Level 3 | | | 0 | |
Transfers out of Level 3 | | | 0 | |
Balance as of June 30, 2011 | | $ | 89,813 | |
Change in unrealized gains (losses)
relating to securities still held at June 30, 2011 | | $ | 24 | |
4. TRANSACTIONS WITH AFFILIATES AND OTHER EXPENSES
The Trust has entered into an advisory contract with Wells Fargo Funds Management, LLC (“Funds Management”), an indirect wholly owned subsidiary of Wells Fargo & Company (“Wells Fargo”). The adviser is responsible for implementing investment policies and guidelines and for supervising the sub-adviser, who is responsible for day-to-day portfolio management of the Fund. For providing these services, Funds Management does not receive a fee from the Fund but is entitled to receive fees from the sponsors of the wrap-fee programs. Out of these fees, Funds Management pays Wells Capital Management Incorporated, an affiliate of Funds Management, for its services as the sub-adviser to the Fund.
Generally, no ordinary operating fees or expenses are charged to the Fund. Funds Management has contractually committed to irrevocably absorb and pay or reimburse all ordinary operating expenses of the Fund, except portfolio transactions or other investment-related costs (e.g., commissions), fees payable for services provided by the Fund’s securities lending agent, interest, taxes, leverage expenses and other expenses not incurred in the ordinary course of the Fund’s business. This commitment has an indefinite term.
| | | | | | |
| Notes to Financial Statements (Unaudited) | | Wells Fargo Managed Account CoreBuilder Shares – Series M | | | 19 | |
5. INVESTMENT PORTFOLIO TRANSACTIONS
Purchases and sales of investments, excluding U.S. Government obligations and short-term securities (securities with maturities of one year or less at purchase date), for the six months ended June 30, 2011 were $6,123,002 and $1,571,317, respectively.
6. DERIVATIVE TRANSACTIONS
During the six months ended June 30, 2011, the Fund entered into futures contracts to take advantage of the differences between municipal and treasury yields and to help shorten duration of the portfolio.
At June 30, 2011, the Fund had short futures contracts outstanding as follows:
| | | | | | | | | | | | | | | | | | |
| Expiration Date | | Contracts | | | Type | | Initial
Notional
Amount | | | Value at June 30,
2011 | | | Net
Unrealized
Gains (Losses) | |
September 2011 | | | 5 Short | | | 30-Year U.S. Treasury Bonds | | $ | 628,584 | | | $ | 615,156 | | | $ | 13,428 | |
The Fund had an average notional amount of $79,359 in short futures contracts during the six months ended June 30, 2011.
On June 30, 2011, the cumulative unrealized gains on futures contracts in the amount of $13,428 is reflected in net unrealized gains on investments on the Statement of Assets and Liabilities. The receivable for daily variation margin on open futures contracts reflected in the Statement of Assets and Liabilities only represents the current day’s variation margin. The realized gains and change in unrealized gains (losses) on futures contracts are reflected in the Statement of Operations.
7. CONCENTRATION OF OWNERSHIP
From time to time, the Fund may have a concentration of one or more of its shareholders that hold a significant percentage of the Fund’s shares outstanding. Investment and/or voting activities of these shareholders with respect to their holdings in Fund shares could have a material impact on the Fund.
At June 30, 2011, Wells Capital Management Incorporated, held 42.30% of the outstanding shares of the Fund.
8. INDEMNIFICATION
Under the Trust’s organizational documents, the officers and directors are indemnified against certain liabilities that may arise out of performance of their duties to the Trust. Additionally, in the normal course of business, the Trust may enter into contracts with service providers that contain a variety of indemnification clauses. The Trust’s maximum exposure under these arrangements is dependent on future claims that may be made against the Fund and, therefore, cannot be estimated.
9. NEW ACCOUNTING PRONOUNCEMENTS
In May 2011, the Financial Accounting Standards Board (“FASB”) issued Accounting Standards Update (“ASU”) No. 2011-04 “Amendments to Achieve Common Fair Value Measurement and Disclosure Requirements in U.S. GAAP and IFRSs”. ASU No. 2011-04 amends FASB ASC Topic 820, Fair Value Measurements and Disclosures, to establish common requirements for measuring fair value and for disclosing information about fair value measurements in accordance with GAAP. The ASU is effective prospectively for interim and annual periods beginning after December 15, 2011.
In April 2011, FASB issued ASU No. 2011-03 “Reconsideration of Effective Control for Repurchase Agreements”. ASU 2011-03 amends FASB ASC Topic 860, Transfers and Servicing, specifically the criteria required to determine whether a repurchase agreement (repo) and similar agreements should be accounted for as sales of financial assets or secured borrowings with commitments. ASU No. 2011-03 changes the assessment of effective control by focusing on the transferor’s contractual rights and obligations and removing the criterion to assess its ability to exercise those rights or honor those obligations. This could result in changes to the way entities account for certain transactions including repurchase agreements, mortgage dollar rolls and reverse repurchase agreements. The ASU will become effective on a prospective basis for new transfers and modifications to existing transactions as of the beginning of the first interim or annual period beginning on or after December 15, 2011.
| | | | |
| 20 | | Wells Fargo Managed Account CoreBuilder Shares – Series M | | Notes to Financial Statements (Unaudited) |
As of June 30, 2011, management of the Funds is currently assessing the potential impact, in addition to expanded financial statement disclosure, that may result from adopting these ASUs.
10. SUBSEQUENT DISTRIBUTIONS
On July 14, 2011, the Fund declared distributions from short-term capital gains and long-term capital gains to shareholders of record on July 13, 2011. The per share amounts payable on July 15, 2011 were as follows:
| | | | | | | | |
| | | Short-term Capital Gains | | | Long-term Capital Gains | |
| | | $ | 0.00360 | | | $ | 0.01271 | |
These distributions are not reflected in the accompanying financial statements.
| | | | | | |
| Other Information (Unaudited) | | Wells Fargo Managed Account CoreBuilder Shares – Series M | | | 21 | |
PROXY VOTING INFORMATION
A description of the policies and procedures that the Fund uses to determine how to vote proxies relating to portfolio securities is available without charge, upon request, by calling 1-800-368-0627, visiting our Web site at www.wellsfargo.com/advantagefunds, or visiting the SEC Web site at www.sec.gov. Information regarding how the Fund voted proxies relating to portfolio securities during the most recent 12-month period ended June 30 is available without charge on the Fund’s Web site at www.wellsfargo.com/advantagefunds or by visiting the SEC Web site at www.sec.gov.
PORTFOLIO HOLDINGS INFORMATION
The Fund files its complete schedule of portfolio holdings with the SEC for the first and third quarters of each fiscal year on Form N-Q, which is available without charge by visiting the SEC Web site at www.sec.gov. In addition, the Fund’s Form N-Q may be reviewed and copied at the SEC’s Public Reference Room in Washington, DC, and at regional offices in New York City, at 233 Broadway, and in Chicago, at 175 West Jackson Boulevard, Suite 900. Information about the Public Reference Room may be obtained by calling 1-800-SEC-0330.
| | | | |
| 22 | | Wells Fargo Managed Account CoreBuilder Shares – Series M | | Other Information (Unaudited) |
BOARD OF TRUSTEES
The following table provides basic information about the Board of Trustees (the “Trustees”) of the Wells Fargo Funds Trust (the “Trust”) and Officers of the Trust. This table should be read in conjunction with the Prospectus and the Statement of Additional Information1 of the Fund. Each of the Trustees and Officers listed below acts in identical capacities for the Wells Fargo Advantage family of funds, which consists of 144 funds comprising the Trust, Wells Fargo Variable Trust, Wells Fargo Master Trust and four closed-end funds (collectively the “Fund Complex”). All of the Trustees are also Members of the Audit and Governance Committees of each Trust in the Fund Complex. The mailing address of each Trustee and Officer is 525 Market Street, 12th Floor, San Francisco, CA 94105. Each Trustee and Officer serves an indefinite term, however, each Trustee serves such term until reaching the mandatory retirement age established by the Trustees.
Independent Trustees
| | | | | | |
Name and Year of Birth | | Position Held and Length of Service | | Principal Occupations During Past Five Years | | Other Directorships During
Past Five Years |
Peter G. Gordon
(Born 1942) | | Trustee, since 1998; Chairman, since 2005 | | Co-Founder, Chairman, President and CEO of Crystal Geyser. Water Company. Trustee Emeritus, Colby College | | Asset Allocation Trust |
Isaiah Harris, Jr.
(Born 1952) | | Trustee, since 2009 | | Retired. Prior thereto, President and CEO of BellSouth Advertising and Publishing Corp. from 2005 to 2007, President and CEO of BellSouth Enterprises from 2004 to 2005 and President of BellSouth Consumer Services from 2000 to 2003. Emeritus member of the Iowa State University Foundation Board of Governors. Emeritus Member of the Advisory Board of Iowa State University School of Business. Mr. Harris is a certified public accountant. | | CIGNA Corporation; Deluxe Corporation; Asset Allocation Trust |
Judith M. Johnson
(Born 1949) | | Trustee, since 2008 | | Retired. Prior thereto, Chief Executive Officer and Chief Investment Officer of Minneapolis Employees Retirement Fund from 1996 to 2008. Ms. Johnson is an attorney, certified public accountant and a certified managerial accountant. | | Asset Allocation Trust |
Leroy Keith, Jr.
(Born 1939) | | Trustee, since 2010 | | Chairman, Bloc Global Services (development and construction), Trustee of the Evergreen Funds from 1983 to 2010. Former Managing Director, Almanac Capital Management (commodities firm), former Partner, Stonington Partners, Inc. (private equity fund), former Director, Obagi Medical Products Co. and former Director, Lincoln Educational Services. | | Trustee, Virtus Fund Complex (consisting of 45 portfolios as of 12/31/10); Director, Diversapack Co. (packaging company); Asset Allocation Trust |
David F. Larcker
(Born 1950) | | Trustee, since 2009 | | James Irvin Miller Professor of Accounting at the Graduate School of Business, Stanford University, Director of Corporate Governance Research Program and Co-Director of The Rock Center for Corporate Governance since 2006. From 2005 to 2008, Professor of Accounting at the Graduate School of Business, Stanford University. Prior thereto, Ernst & Young Professor of Accounting at The Wharton School, University of Pennsylvania from 1985 to 2005. | | Asset Allocation Trust |
Olivia S. Mitchell
(Born 1953) | | Trustee, since 2006 | | International Foundation of Employee Benefit Plans Professor and Chair of the Department of Insurance and Risk Management, Wharton School of the University of Pennsylvania since 1993. Director of Wharton’s Pension Research Council and Boettner Center on Pensions & Retirement Research, and Research Associate at the National Bureau of Economic Research. Previously, Cornell University Professor from 1978 to 1993. | | Asset Allocation Trust |
Timothy J. Penny
(Born 1951) | | Trustee, since 1996 | | President and CEO of Southern Minnesota Initiative Foundation, a non-profit organization, since 2007 and Senior Fellow at the Humphrey Institute Policy Forum at the University of Minnesota since 1995. Member of the Board of Trustees of NorthStar Education Finance, Inc., a non-profit organization, since 2007. | | Asset Allocation Trust |
| | | | | | |
| Other Information (Unaudited) | | Wells Fargo Managed Account CoreBuilder Shares – Series M | | | 23 | |
| | | | | | |
Name and Year of Birth | | Position Held and Length of Service | | Principal Occupations During Past Five Years | | Other Directorships During
Past Five Years |
Michael S. Scofield
(Born 1943) | | Trustee, since 2010 | | Currently serves on the Investment Company Institute’s Board of Governors and Executive Committee as well the In dependent Director’s Counsel Board of Governors and Executive Committee. Former Chairman of the Independent Directors Counsel. Trustee of the Evergreen Funds from 1984 to 2010. Retired Attorney, Law Offices of Michael S. Scofield and former Director and Chairman, Branded Media Corporation (multi-media branding company). | | Asset Allocation Trust |
Donald C. Willeke
(Born 1940) | | Trustee, since 1996 | | Principal of the law firm of Willeke & Daniels. General Counsel of the Minneapolis Employees Retirement Fund from 1984 until its consolidation into the Minnesota Public Employees Retirement Association on June 30, 2010. | | Asset Allocation Trust |
Officers
| | | | | | |
Name and Year of Birth | | Position Held and
Length of Service | | Principal Occupations During Past Five Years | | |
Karla M. Rabusch
(Born 1959) | | President, since 2003 | | Executive Vice President of Wells Fargo Bank, N.A. and President of Wells Fargo Funds Management, LLC since 2003. Senior Vice President and Chief Administrative Officer of Wells Fargo Funds Management, LLC from 2001 to 2003. | | |
C. David Messman
(Born 1960) | | Secretary, since 2000; Chief Legal Counsel, since 2003 | | Senior Vice President and Secretary of Wells Fargo Funds Management, LLC since 2001. Vice President and Managing Counsel of Wells Fargo Bank, N.A. since 1996. | | |
Kasey Phillips
(Born 1970) | | Treasurer, since 2008 | | Senior Vice President of Wells Fargo Funds Management, LLC since 2009. Senior Vice President of Evergreen Investment Management Company, LLC from 2006 to 2010. Treasurer of the Evergreen Funds from 2005 to 2010. Vice President and Assistant Vice President of Evergreen Investment Services, Inc. from 1999 to 2006. | | |
David Berardi
(Born 1975) | | Assistant Treasurer, since 2009 | | Vice President of Wells Fargo Funds Management, LLC since 2009 . Vice President of Evergreen Investment Management Company, LLC from 2008 to 2010. Assistant Vice President of Evergreen Investment Services, Inc. from 2004 to 2008. Manager of Fund Reporting and Control for Evergreen Investment Management Company, LLC from 2004 to 2010. | | |
Jeremy DePalma
(Born 1974) | | Assistant Treasurer, since 2009 | | Senior Vice President of Wells Fargo Funds Management, LLC since 2009. Senior Vice President of Evergreen Investment Management Company, LLC from 2008 to 2010. Vice President, Evergreen Investment Services, Inc. from 2004 to 2007. Assistant Vice President, Evergreen Investment Services, Inc. from 2000 to 2004 and the head of the Fund Reporting and Control Team within Fund Administration from 2005 to 2010. | | |
Debra Ann Early
(Born 1964) | | Chief Compliance Officer, since 2007 | | Chief Compliance Officer of Wells Fargo Funds Management, LLC since 2007. Chief Compliance Officer of Parnassus Investments from 2005 to 2007. Chief Financial Officer of Parnassus Investments from 2004 to 2007 and Senior Audit Manager of PricewaterhouseCoopers LLP from 1998 to 2004. | | |
| 1. | The Statement of Additional Information includes additional information about the Fund’s Trustees and is available, without charge, upon request, by calling 1-800-222-8222 or by visiting the Fund’s Web site at www.wellsfargo.com/advantagefunds. |
| | | | |
| 24 | | Wells Fargo Managed Account CoreBuilder Shares – Series M | | Other Information (Unaudited) |
BOARD CONSIDERATION OF INVESTMENT ADVISORY AND SUB-ADVISORY AGREEMENTS:
Each year, as required by Section 15 of the Investment Company Act of 1940 (the “1940 Act”), the Board of Trustees (the “Board”) of Wells Fargo Funds Trust (the “Trust”), all the members of which have no direct or indirect interest in the investment advisory and sub-advisory agreements and are not “interested persons” of the Trust, as defined in the 1940 Act (the “Independent Trustees”), determines whether to approve the continuation of the Trust’s investment advisory and sub-advisory agreements. In this regard, at an in person meeting held on March 24-25, 2011 (the “Meeting”), the Board reviewed and re-approved: (i) an investment advisory agreement with Wells Fargo Funds Management, LLC (“Funds Management”) for the Wells Fargo Managed Account CoreBuilder Shares (SM)—Series M (the “Fund”) and (ii) an investment sub-advisory agreement with Wells Capital Management Incorporated (“Wells Capital Management”) for the Fund. The investment advisory agreement with Funds Management and the investment sub-advisory agreement with Wells Capital Management are collectively referred to as the “Advisory Agreements.”
At the Meeting, the Board considered the factors and reached the conclusions described below relating to the selection of Funds Management and Wells Capital Management and continuation of the Advisory Agreements. Prior to the Meeting, the Trustees conferred extensively among themselves and with representatives of Funds Management about these matters. The Board also met throughout the year and received information that was useful to them in considering the continuation of the Advisory Agreements. The Independent Trustees were assisted in their evaluation of the Advisory Agreements by independent legal counsel, from whom they received separate legal advice and with whom they met separately from Funds Management.
Nature, extent and quality of services
The Board received and considered various information regarding the nature, extent and quality of services provided to the Fund by Funds Management and Wells Capital Management under the Advisory Agreements. The Board also received and considered information provided in response to a detailed set of requests submitted by the Independent Trustees’ independent legal counsel on their behalf. The Board received and considered, among other things, information about the background and experience of senior management of Funds Management, and the qualifications, backgrounds, tenures and responsibilities of the portfolio managers primarily responsible for the day-to-day portfolio management of the Fund.
The Board evaluated the ability of Funds Management and Wells Capital Management, based on their respective financial condition, resources, reputation and other attributes, to attract and retain qualified investment professionals, including research, advisory, and supervisory personnel. The Board further considered the compliance programs and compliance records of Funds Management and Wells Capital Management. In addition, the Board took into account the administrative services provided to the Fund by Funds Management and its affiliates.
The Board’s decision to approve the continuation of the Advisory Agreements was based on a comprehensive evaluation of all of the information provided to it. In approving the continuation of the Advisory Agreements, the Board did not identify any particular information or consideration that was all-important or controlling, and each Trustee attributed different weights to various factors. The Board evaluated information provided to it both in terms of the funds generally and with respect to the Fund, specifically as it considered appropriate. Although the Board considered the continuation of the Advisory Agreements for the Fund as part of the larger process of considering the continuation of the advisory agreements for all of the funds, its decision to continue the Advisory Agreements for the Fund was ultimately made on a fund-by-fund basis.
In considering these matters, the Board considered not only the specific information presented in connection with the Meeting, but also the knowledge gained over time through interaction with Funds Management and Wells Capital Management about various topics, including Funds Management’s oversight of service providers. The above factors, together with those referenced below, are some of the most important, but not necessarily all, factors considered by the Board in concluding that it was satisfied with the nature, extent and quality of the investment advisory services provided to the Fund by Funds Management and Wells Capital Management.
Fund performance and expenses
The Board received and considered information regarding the “zero fee and expense” structure of the Fund. Specifically, the Board noted that the Fund’s gross operating expense ratio and each of its various components, including advisory
| | | | | | |
| Other Information (Unaudited) | | Wells Fargo Managed Account CoreBuilder Shares – Series M | | | 25 | |
fees, administration fees, custody fees, Rule 12b-1 fees, and other fees, were zero. The Board also noted Funds Management’s representations that the Fund is a special purpose mutual fund for use exclusively within Funds Management’s separately managed account (“SMA”) advisory business and, as such, Funds Management would assume and pay or reimburse all of the ordinary operating expenses of the Fund under an Expense Assumption Agreement but excluding portfolio transaction or other investment related costs, fees payable for services provided by the Fund’s securities lending agent, interest, taxes, leverage expenses, and other expenses not incurred in the ordinary cost of the Fund’s business. The Board further noted that Funds Management is paid a negotiated fee by each SMA sponsor and that the fee level would be identical for all sponsors of SMAs that invest in the Fund.
In light of this unique fee and distribution structure, the Board does not conduct a performance and fee review relative to a peer group or universe. The Board concluded that the fee and distribution structure of the Fund supported the re-approval of the Advisory Agreements for the Fund.
Investment advisory and sub-advisory fee rates
The Board reviewed and considered that the contractual investment advisory fee rate payable by the Fund to Funds Management for investment advisory services (the “Advisory Agreement Rate”) was zero, and also reviewed and considered that the Fund’s other fees would normally be zero, because of Funds Management’s commitment to assume and pay or reimburse all of the ordinary operating expenses of the Fund under an Expense Assumption Agreement. The Board also reviewed and considered the contractual investment sub-advisory fee rate payable by Funds Management to Wells Capital Management for investment sub-advisory services (the “Sub-Advisory Agreement Rate”), and that such fees are paid from the fees Funds Management receives from SMA sponsors and not by the Fund.
The Board noted that the Advisory Agreement Rate for the Fund was consistent with the zero fee structure, and was acceptable in light of the services covered by the Advisory Agreements. The Board also reviewed and considered the Sub-Advisory Agreement Rate and concluded that the Sub-Advisory Agreement Rate was acceptable in light of the services covered by the Sub-Advisory Agreements.
The Board also received and considered information about the nature and extent of services offered and fee rates charged by Funds Management and Wells Capital Management to other types of clients. In this regard, the Board received information about differences between the services, and the compliance, reporting, and other legal burdens and risks of providing investment advice to mutual funds and those associated with providing advice to non-mutual fund clients such as collective funds or institutional separate accounts.
Profitability
The Board received and considered a profitability analysis of Funds Management and its affiliates, but did not consider separate profitability information with respect to the Fund in light of its unique fee and distribution structure.
Economies of scale
In light of the unique fee and distribution structure of the Fund, the Board did not conduct an analysis of economies of scale in the context of reviewing the Fund’s Advisory Agreements.
Other benefits to Funds Management and Wells Capital Management
The Board received and considered information regarding potential “fall-out” or ancillary benefits received by Funds Management and its affiliates, including Wells Capital Management, as a result of their relationship with the Fund. Ancillary benefits could include, among others, benefits directly attributable to the relationship of Funds Management and Wells Capital Management with the Fund and benefits potentially derived from an increase in Funds Management’s and Wells Capital Management’s business as a result of their relationship with the Fund (such as the ability to market to shareholders other financial products offered by Funds Management and its affiliates, including Wells Capital Management). The Board noted that Funds Management receives payments from the SMA sponsors and that it had agreed to assume and pay or reimburse certain operating expenses.
The Board also reviewed information about whether and to what extent soft dollar credits are sought and how any such credits are utilized and any benefits that may be realized by using an affiliated broker.
Other factors and broader review
The Board also considered the markets for distribution of the Fund’s shares, including the multiple channels through which the Fund’s shares are offered and sold. The Board noted that the Fund is part of one of the few fund families that
| | | | |
| 26 | | Wells Fargo Managed Account CoreBuilder Shares – Series M | | Other Information (Unaudited) |
have both direct-to-fund and intermediary distribution channels. As discussed above, the Board reviews detailed materials received from Funds Management and Wells Capital Management annually as part of the re-approval process under Section 15 of the 1940 Act and also reviews and assesses information about the quality of the services that the Fund receives throughout the year. In this regard, the Board has reviewed reports of Funds Management at each of its quarterly meetings, which include, among other things, portfolio reviews and performance reports. In addition, the Board confers with portfolio managers at various times throughout the year.
Conclusion
After considering the above-described factors and based on its deliberations and its evaluation of the information described above, the Board concluded that approval of the continuation of the Advisory Agreements for the Fund was in the best interest of the Fund and its shareholders. Accordingly, the Board unanimously approved the continuation of the Advisory Agreements for an additional one-year period.
| | | | | | |
| List of Abbreviations | | Wells Fargo Managed Account CoreBuilder Shares – Series M | | | 27 | |
The following is a list of common abbreviations for terms and entities which may have appeared in this report.
| ABAG | — Association of Bay Area Governments |
| ACB | — Agricultural Credit Bank |
| ADR | — American Depositary Receipt |
| ADS | — American Depository Shares |
| AGC-ICC | — Assured Guaranty Corporation - Insured Custody Certificates |
| AGM | — Assured Guaranty Municipal |
| AMBAC | — American Municipal Bond Assurance Corporation |
| AMT | — Alternative Minimum Tax |
| ARM | — Adjustable Rate Mortgages |
| BAN | — Bond Anticipation Notes |
| BART | — Bay Area Rapid Transit |
| BHAC | — Berkshire Hathaway Assurance Corporation |
| CAB | — Capital Appreciation Bond |
| CCAB | — Convertible Capital Appreciation Bond |
| CDA | — Community Development Authority |
| CDO | — Collateralized Debt Obligation |
| CDSC | — Contingent Deferred Sales Charge |
| CGIC | — Capital Guaranty Insurance Company |
| CGY | — Capital Guaranty Corporation |
| CIFG | — CDC (Caisse des Dépôts et Consignations) IX IS Financial Guarantee |
| COP | — Certificate of Participation |
| DRIVER | — Derivative Inverse Tax-Exempt Receipts |
| DW&P | — Department of Water & Power |
| DWR | — Department of Water Resources |
| ECFA | — Educational & Cultural Facilities Authority |
| EDFA | — Economic Development Finance Authority |
| ETET | — Eagle Tax-Exempt Trust |
| ETF | — Exchange-Traded Fund |
| FFCB | — Federal Farm Credit Bank |
| FGIC | — Financial Guaranty Insurance Corporation |
| FHA | — Federal Housing Authority |
| FHAG | — Federal Housing Agency |
| FHLB | — Federal Home Loan Bank |
| FHLMC | — Federal Home Loan Mortgage Corporation |
| FNMA | — Federal National Mortgage Association |
| GDR | — Global Depositary Receipt |
| GNMA | — Government National Mortgage Association |
| HCFR | — Healthcare Facilities Revenue |
| HEFA | — Health & Educational Facilities Authority |
| HEFAR | — Higher Education Facilities Authority Revenue |
| HFA | — Housing Finance Authority |
| HFFA | — Health Facilities Financing Authority |
| HUD | — Housing & Urban Development |
| IBC | — Insured Bond Certificate |
| IDA | — Industrial Development Authority |
| IDAG | — Industrial Development Agency |
| IDR | — Industrial Development Revenue |
| KRW | — Republic of Korea Won |
| LIBOR | — London Interbank Offered Rate |
| LLC | — Limited Liability Company |
| LLP | — Limited Liability Partnership |
| MBIA | — Municipal Bond Insurance Association |
| MFHR | — Multi-Family Housing Revenue |
| MFMR | — Multi-Family Mortgage Revenue |
| MMD | — Municipal Market Data |
| MSTR | — Municipal Securities Trust Receipts |
| MUD | — Municipal Utility District |
| NATL-RE | — National Public Finance Guarantee Corporation |
| PCFA | — Pollution Control Finance Authority |
| PCR | — Pollution Control Revenue |
| PFA | — Public Finance Authority |
| PFFA | — Public Facilities Financing Authority |
| PFOTER | — Puttable Floating Option Tax-Exempt Receipts |
| plc | — Public Limited Company |
| PSFG | — Public School Fund Guaranty |
| PUTTER | — Puttable Tax-Exempt Receipts |
| R&D | — Research & Development |
| RDA | — Redevelopment Authority |
| RDFA | — Redevelopment Finance Authority |
| REIT | — Real Estate Investment Trust |
| RIB | — Residual Interest Bond |
| ROC | — Reset Option Certificates |
| SAVRS | — Select Auction Variable Rate Securities |
| SFHR | — Single Family Housing Revenue |
| SFMR | — Single Family Mortgage Revenue |
| SLMA | — Student Loan Marketing Association |
| SPDR | — Standard & Poor’s Depositary Receipts |
| STIT | — Short-Term Investment Trust |
| TAN | — Tax Anticipation Notes |
| TIPS | — Treasury Inflation-Protected Securities |
| TRAN | — Tax Revenue Anticipation Notes |
| TCR | — Transferable Custody Receipts |
| TTFA | — Transportation Trust Fund Authority |
| USD | — Unified School District |
| XLCA | — XL Capital Assurance |
This page is intentionally left blank.

More information about Wells Fargo Advantage Funds is available free upon request. To obtain literature, please write, e-mail, visit the Fund’s Web site, or call:
Wells Fargo Funds Management
Attn: Managed Account Services
P.O. Box 1450
Milwaukee, WI 53201
E-mail: mas@wellsfargo.com
Web site: www.wellsfargo.com/advantagefunds
Sales Support Inquiries: 1-800-368-1683
This report and the financial statements contained herein are submitted for the general information of the shareholders of Wells Fargo Managed Account CoreBuilder Shares. If this report is used for promotional purposes, distribution of the report must be accompanied or preceded by a current prospectus. For a prospectus containing more complete information, including charges and expenses, call 1-800-368-0627. Please consider the investment objectives, risks, charges, and expenses of the investment carefully before investing. This and other information about Wells Fargo Managed Account CoreBuilder Shares can be found in the current prospectus. Read the prospectus carefully before you invest or send money.
Wells Fargo Funds Management, LLC, a wholly owned subsidiary of Wells Fargo & Company, provides investment advisory and administrative services for Wells Fargo Managed Account CoreBuilder Shares. Other affiliates of Wells Fargo & Company provide subadvisory and other services for the Wells Fargo Managed Account CoreBuilder Shares. The Wells Fargo Managed Account CoreBuilder Shares are distributed by Wells Fargo Funds Distributor, LLC, Member FINRA/SIPC, an affiliate of Wells Fargo & Company.
NOT FDIC INSURED ¡ NO BANK GUARANTEE ¡ MAY LOSE VALUE

| | | | | | |
| | | |
© 2011 Wells Fargo Funds Management, LLC. All rights reserved. | | www.wellsfargo.com/advantagefunds | | 204044 08-11 SCBM/SAR130 06-11 |
Not required in this filing
| ITEM 3. | AUDIT COMMITTEE FINANCIAL EXPERT |
Not required in this filing.
| ITEM 4. | PRINCIPAL ACCOUNTANT FEES AND SERVICES |
Not required in this filing.
| ITEM 5. | AUDIT COMMITTEE OF LISTED REGISTRANTS |
Not required in this filing.
| ITEM 6. | SCHEDULE OF INVESTMENTS |
The Schedule of Investments is included as part of the report to shareholders filed under Item 1 of this Form.
| ITEM 7. | DISCLOSURE OF PROXY VOTING POLICIES AND PROCEDURES FOR CLOSED-END MANAGEMENT INVESTMENT COMPANIES |
Not applicable.
| ITEM 8. | PORTFOLIO MANAGERS OF CLOSED-END MANAGEMENT INVESTMENT COMPANIES |
Not applicable.
| ITEM 9. | PURCHASES OF EQUITY SECURITIES BY CLOSED-END MANAGEMEENT INVESTMENT COMPANY AND AFFILIATED PURCHASES |
Not applicable.
| ITEM 10. | SUBMISSION OF MATTERS TO A VOTE OF SECURITY HOLDERS |
The Governance Committee (the “Committee”) of the Board of Trustees of the registrant (the “Trust”) has adopted procedures by which a shareholder of any series of the Trust may submit properly a nominee recommendation for the Committee’s consideration.
The shareholder must submit any such recommendation (a “Shareholder Recommendation”) in writing to the Trust, to the attention of the Trust’s Secretary, at the address of the principal executive offices of the Trust.
The Shareholder Recommendation must be delivered to, or mailed and received at, the principal executive offices of the Trust not less than forty-five (45) calendar days nor more than seventy-five (75) calendar days prior to the date of the Committee meeting at which the nominee would be considered.
The Shareholder Recommendation must include: (i) a statement in writing setting forth (A) the name, age, date of birth, business address, residence address and nationality of the person recommended by the shareholder (the “candidate”); (B) the series (and, if applicable, class) and number of all shares of the Trust owned of record or beneficially by the candidate, as reported to such shareholder by the candidate; (C) any other information regarding the candidate called for with respect to director nominees by paragraphs (a), (d), (e) and (f) of Item 401 of Regulation S-K or paragraph (b) of Item 22 of Rule 14a-101 (Schedule 14A) under the Securities Exchange Act of 1934, as amended (the “Exchange Act”), adopted by the Securities and Exchange Commission (or the corresponding provisions of any regulation or rule subsequently adopted by the Securities and Exchange Commission or any successor agency applicable to the Trust); (D) any other information regarding the candidate that would be required to be disclosed if the candidate were a nominee in a proxy statement or other filing required to be made in connection with solicitation of proxies for election of directors pursuant to Section 14 of the Exchange Act and the rules and regulations promulgated thereunder; and (E) whether the recommending shareholder believes that the candidate is or will be an “interested person” of the Trust (as defined in the Investment Company Act of 1940, as amended) and, if not an “interested person,” information regarding the candidate that will be sufficient for the Trust to make such determination; (ii) the written and signed consent of the candidate to be named as a nominee and to serve as a Trustee if elected; (iii) the recommending shareholder’s name as it appears on the Trust’s books; (iv) the series (and, if applicable, class) and number of all shares of the Trust owned beneficially and of record by the recommending shareholder; and (v) a description of all arrangements or understandings between the recommending shareholder and the candidate and any other person or persons (including their names) pursuant to which the recommendation is being made by the recommending shareholder. In addition, the Committee may require the candidate to interview in person and furnish such other information as it may reasonably require or deem necessary to determine the eligibility of such candidate to serve as a Trustee of the Trust.
| ITEM 11. | CONTROLS AND PROCEDURES |
(a) The President and Treasurer have concluded that the Wells Fargo Funds Trust (the “Trust”) disclosure controls and procedures (as defined in Rule 30a-3(c) under the Investment Company Act of 1940) provide reasonable assurances that material information relating to the Trust is made known to them by the appropriate persons, based on their evaluation of these controls and procedures as of a date within 90 days of the filing of this report.
(b) There were no significant changes in the Trust’s internal controls over financial reporting (as defined in Rule 30a-3(d) under the Investment Company Act of 1940) that occurred during the second quarter of the period covered by this report that materially affected, or is reasonably likely to materially affect, the registrant’s internal control over financial reporting.
(a)(1) Not required in this filing.
(a)(2) Certification pursuant to Rule 30a-2(a) under the Investment Company Act of 1940 (17 CFR 270.30a-2(a)) is filed and attached hereto as Exhibit 99.CERT.
(a)(3) Not applicable.
(b) Certification pursuant to Rule 30a-2(b) under the Investment Company Act of 1940 (17 CFR 270.30a-2(b)) is filed and attached hereto as Exhibit 99.906CERT.
SIGNATURES
Pursuant to the requirements of the Securities Exchange Act of 1934 and the Investment Company Act of 1940, the registrant has duly caused this report to be signed on its behalf by the undersigned, thereunto duly authorized.
| | |
| Wells Fargo Funds Trust |
| |
| By: | | |
| | /s/ Karla M. Rabusch |
| | |
| | Karla M. Rabusch |
| | President |
| | |
| Date: August 26, 2011 |
Pursuant to the requirements of the Securities Exchange Act of 1934 and the Investment Company Act of 1940, this report has been signed below by the following persons on behalf of the registrant and in the capacities and on the date indicated.
| | |
| By: | | |
| | /s/ Karla M. Rabusch |
| | |
| | Karla M. Rabusch |
| | President |
| | |
| Date: August 26, 2011 |
| |
| | |
| By: | | |
| | /s/ Kasey L. Phillips |
| | |
| | Kasey L. Phillips |
| | Treasurer |
| | |
| Date: August 26, 2011 |