
UNITED STATES
SECURITIES AND EXCHANGE COMMISSION
Washington, D.C. 20549
FORM N-CSRS
CERTIFIED SHAREHOLDER REPORT OF REGISTERED
MANAGEMENT INVESTMENT COMPANIES
Investment Company Act file number: 811-09253
Wells Fargo Funds Trust
(Exact name of registrant as specified in charter)
525 Market St., San Francisco, CA 94105
(Address of principal executive offices) (Zip code)
C. David Messman
Wells Fargo Funds Management, LLC
525 Market St., San Francisco, CA 94105
(Name and address of agent for service)
Registrant’s telephone number, including area code: 800-643-9691
Date of fiscal year end: March 31, 2011
Date of reporting period: September 30, 2011
| ITEM 1. | REPORT TO SHAREHOLDERS |

Wells Fargo Advantage Health Care Fund

Semi-Annual Report
September 30, 2011


WELLS FARGO INVESTMENT HISTORY
| | |
| |
| 1932 | | Keystone creates one of the first mutual fund families. |
| |
| 1971 | | Wells Fargo & Company introduces one of the first institutional index funds. |
| |
| 1978 | | Wells Fargo applies Markowitz and Sharpe’s research on Modern Portfolio Theory to introduce one of the industry’s first Tactical Asset Allocation (TAA) models in institutional separately managed accounts. |
| |
| 1984 | | Wells Fargo Stagecoach Funds launches its first asset allocation fund. |
| |
| 1989 | | The Tactical Asset Allocation (TAA) Model is first applied to Wells Fargo’s asset allocation mutual funds. |
| |
| 1994 | | Wells Fargo introduces the LifePath Funds, one of the first suites of target date funds (now the Wells Fargo Advantage Dow Jones Target Date FundsSM ). |
| |
| 1996 | | Evergreen Investments and Keystone Funds merge. |
| |
| 1997 | | Wells Fargo launches Wells Fargo Advantage WealthBuilder PortfoliosSM, a fund-of-funds suite of products that includes the use of quantitative models to shift assets among investment styles. |
| |
| 1999 | | Norwest Advantage Funds and Stagecoach Funds are reorganized into Wells Fargo Funds after the merger of Norwest and Wells Fargo. |
| |
| 2002 | | Evergreen Retail and Evergreen Institutional companies form the umbrella asset management company, Evergreen Investments. |
| |
| 2005 | | The integration of Strong Funds with Wells Fargo Funds creates Wells Fargo Advantage Funds, resulting in one of the top 20 mutual fund companies in the United States. |
| |
| 2006 | | Wells Fargo Advantage Funds relaunches the target date product line as Wells Fargo Advantage Dow Jones Target Date Funds. |
| |
| 2010 | | The mergers and reorganizations of Evergreen and Wells Fargo Advantage mutual funds are completed, unifying the families under the brand of Wells Fargo Advantage Funds. |
Wells Fargo Advantage Funds®
Wells Fargo Advantage Funds skillfully guides institutions, financial advisors, and individuals through the investment terrain to help them reach their financial objectives. Everything we do on behalf of investors is backed by our unique combination of qualifications.
Strength
Our organization is built on the standards of integrity and service established by our parent company—Wells Fargo & Company—more than 150 years ago. And, because we’re part of a highly diversified financial enterprise, we offer the depth of resources to help investors succeed.
Expertise
Our multi-boutique model offers investors access to the independent thinking of premier investment managers that have been chosen for their time-tested strategies. While each team specializes in a specific investment strategy, collectively they provide investors a wide choice of distinct investment styles. Our dedication to investment excellence doesn’t end with our expertise in manager selection—risk management, analysis, and rigorous ongoing review seek to ensure each manager’s investment process remains consistent.
Partnership
Our collaborative approach is built around understanding the needs and goals of our clients. By adhering to core principles of sound judgment and steady guidance, we support you through every stage of the investment decision process.
Carefully consider the investment objectives, risks, charges, and expenses before investing. For a current prospectus for Wells Fargo Advantage Funds containing this and other information, visit wellsfargo.com/advantagefunds. Read it carefully before investing.
Wells Fargo Funds Management, LLC, a wholly owned subsidiary of Wells Fargo & Company, provides investment advisory and administrative services for Wells Fargo Advantage Funds®. Other affiliates of Wells Fargo & Company provide subadvisory and other services for the Funds. The Funds are distributed by Wells Fargo Funds Distributor, LLC, Member FINRA/SIPC, an affiliate of Wells Fargo & Company.
The “Dow Jones Target Date Indexes” are a product of Dow Jones Indexes, a licensed trademark of CME Group Index Services LLC (“CME”). “Dow Jones” and “Dow Jones Target Date Indexes” are service marks of Dow Jones Trademark Holdings, LLC, and have been licensed for use for certain purposes by CME and sublicensed for use by Global Index Advisors, Inc., and Wells Fargo Funds Management, LLC. The Dow Jones Target Date Indexes are based in part on the Barclays Capital Bond Indexes, which are published by Barclays Capital Inc. The Wells Fargo Advantage Dow Jones Target Date Funds, based on the Dow Jones Target Date Indexes, are not sponsored, endorsed, sold, or promoted by Dow Jones, CME or Barclays Capital or any of their respective affiliates, and neither Dow Jones, CME nor Barclays Capital nor any of their respective affiliates makes any representation regarding the advisability of investing in such product(s) and/or about the quality, accuracy, and/or completeness of the Dow Jones Target Date Indexes or the Barclays Capital Bond Indexes. IN NO EVENT SHALL DOW JONES, CME, BARCLAYS CAPITAL, OR ANY OF THEIR LICENSORS HAVE ANY LIABILITY IN CONNECTION WITH THE Wells Fargo Advantage Dow Jones Target Date Funds INCLUDING, WITHOUT LIMITATION, FOR ANY SPECIAL, PUNITIVE, IN DIRECT, OR CONSEQUENTIAL DAMAGES (INCLUDING LOST PROFITS), EVEN IF NOTIFIED OF THE POSSIBILITY OF SUCH DAMAGES.
NOT FDIC INSURED ¡ NO BANK GUARANTEE ¡ MAY LOSE VALUE
Not part of the semi-annual report.
Wells Fargo Advantage Funds offers more than 110 mutual funds across a wide range of asset classes, representing over $213 billion in assets under management, as of September 30, 2011.
| | | | |
| Equity Funds | | | | |
Asia Pacific Fund | | Global Opportunities Fund | | Premier Large Company Growth Fund |
C&B Large Cap Value Fund | | Growth Fund | | Small Cap Opportunities Fund |
C&B Mid Cap Value Fund | | Health Care Fund | | Small Cap Value Fund |
Capital Growth Fund | | Index Fund | | Small Company Growth Fund |
Common Stock Fund | | International Equity Fund | | Small Company Value Fund |
Disciplined U.S. Core Fund | | International Value Fund | | Small/Mid Cap Core Fund |
Discovery Fund† | | Intrinsic Small Cap Value Fund | | Small/Mid Cap Value Fund |
Diversified Equity Fund | | Intrinsic Value Fund | | Social Sustainability Fund† |
Diversified International Fund | | Intrinsic World Equity Fund | | Special Mid Cap Value Fund |
Diversified Small Cap Fund | | Large Cap Core Fund | | Special Small Cap Value Fund |
Emerging Growth Fund | | Large Cap Growth Fund | | Specialized Technology Fund |
Emerging Markets Equity Fund | | Large Company Value Fund | | Strategic Large Cap Growth Fund |
Endeavor Select Fund† | | Omega Growth Fund | | Traditional Small Cap Growth Fund |
Enterprise Fund† | | Opportunity Fund† | | Utility and Telecommunications Fund |
Equity Value Fund | | Precious Metals Fund | | |
| Bond Funds | | | | |
Adjustable Rate Government Fund | | Inflation-Protected Bond Fund | | Short-Term Bond Fund |
California Limited-Term Tax-Free Fund | | Intermediate Tax/AMT-Free Fund | | Short-Term High Yield Bond Fund |
California Tax-Free Fund | | International Bond Fund | | Short-Term Municipal Bond Fund |
Colorado Tax-Free Fund | | Minnesota Tax-Free Fund | | Strategic Municipal Bond Fund |
Government Securities Fund | | Municipal Bond Fund | | Total Return Bond Fund |
High Income Fund | | North Carolina Tax-Free Fund | | Ultra Short-Term Income Fund |
High Yield Bond Fund | | Pennsylvania Tax-Free Fund | | Ultra Short-Term Municipal Income Fund |
Income Plus Fund | | Short Duration Government Bond Fund | | Wisconsin Tax-Free Fund |
| Asset Allocation Funds | | | | |
Asset Allocation Fund | | WealthBuilder Equity Portfolio† | | Target 2020 Fund† |
Conservative Allocation Fund | | WealthBuilder Growth Allocation Portfolio† | | Target 2025 Fund† |
Diversified Capital Builder Fund | | WealthBuilder Growth Balanced Portfolio† | | Target 2030 Fund† |
Diversified Income Builder Fund | | WealthBuilder Moderate Balanced Portfolio† | | Target 2035 Fund† |
Growth Balanced Fund | | WealthBuilder Tactical Equity Portfolio† | | Target 2040 Fund† |
Index Asset Allocation Fund | | Target Today Fund† | | Target 2045 Fund† |
Moderate Balanced Fund | | Target 2010 Fund† | | Target 2050 Fund† |
WealthBuilder Conservative Allocation Portfolio† | | Target 2015 Fund† | | Target 2055 Fund† |
| Money Market Funds | | | | |
100% Treasury Money Market Fund | | Minnesota Money Market Fund | | New Jersey Municipal Money Market Fund |
California Municipal Money Market Fund | | Money Market Fund | | New York Municipal Money Market Fund |
Cash Investment Money Market Fund | | Municipal Cash Management Money Market Fund | | Pennsylvania Municipal Money Market Fund |
Government Money Market Fund | | Municipal Money Market Fund | | Prime Investment Money Market Fund |
Heritage Money Market Fund† | | National Tax-Free Money Market Fund | | Treasury Plus Money Market Fund |
| Variable Trust Funds1 | | | | |
VT Discovery Fund† | | VT Intrinsic Value Fund | | VT Small Cap Growth Fund |
VT Index Asset Allocation Fund | | VT Omega Growth Fund | | VT Small Cap Value Fund |
VT International Equity Fund | | VT Opportunity Fund† | | VT Total Return Bond Fund |
An investment in a money market fund is not insured or guaranteed by the Federal Deposit Insurance Corporation or any other government agency. Although the Wells Fargo Advantage Money Market Funds seek to preserve the value of your investment at $1.00 per share, it is possible to lose money by investing in a money market fund.
| 1. | The Variable Trust Funds are generally available only through insurance company variable contracts. |
| † | In this report, the Wells Fargo Advantage Discovery FundSM, Wells Fargo Advantage Endeavor Select FundSM, Wells Fargo Advantage Enterprise FundSM, Wells Fargo Advantage Opportunity FundSM, Wells Fargo Advantage Social Sustainability FundSM, Wells Fargo Advantage WealthBuilder Conservative Allocation PortfolioSM, Wells Fargo Advantage WealthBuilder Equity PortfolioSM, Wells Fargo Advantage WealthBuilder Growth Allocation PortfolioSM, Wells Fargo Advantage WealthBuilder Growth Balanced PortfolioSM, Wells Fargo Advantage WealthBuilder Moderate Balanced PortfolioSM, Wells Fargo Advantage WealthBuilder Tactical Equity PortfolioSM, Wells Fargo Advantage Dow Jones Target Today FundSM, Wells Fargo Advantage Dow Jones Target 2010 FundSM, Wells Fargo Advantage Dow Jones Target 2015 FundSM, Wells Fargo Advantage Dow Jones Target 2020 FundSM, Wells Fargo Advantage Dow Jones Target 2025 FundSM, Wells Fargo Advantage Dow Jones Target 2030 FundSM, Wells Fargo Advantage Dow Jones Target 2035 FundSM, Wells Fargo Advantage Dow Jones Target 2040 FundSM, Wells Fargo Advantage Dow Jones Target 2045 FundSM, Wells Fargo Advantage Dow Jones Target 2050 FundSM, Wells Fargo Advantage Dow Jones Target 2055 FundSM, Wells Fargo Advantage Heritage Money Market FundSM, Wells Fargo Advantage VT Discovery FundSM, and Wells Fargo Advantage VT Opportunity FundSM are referred to as the Discovery Fund, Endeavor Select Fund, Enterprise Fund, Opportunity Fund, Social Sustainability Fund, WealthBuilder Conservative Allocation Portfolio, WealthBuilder Equity Portfolio, WealthBuilder Growth Allocation Portfolio, WealthBuilder Growth Balanced Portfolio, WealthBuilder Moderate Balanced Portfolio, WealthBuilder Tactical Equity Portfolio, Target Today Fund, Target 2010 Fund, Target 2015 Fund, Target 2020 Fund, Target 2025 Fund, Target 2030 Fund, Target 2035 Fund, Target 2040 Fund, Target 2045 Fund, Target 2050 Fund, Target 2055 Fund, Heritage Money Market Fund, VT Discovery Fund, and VT Opportunity Fund, respectively. |
Not part of the semi-annual report.
| | | | |
| 2 | | Wells Fargo Advantage Health Care Fund | | Letter to Shareholders |

Karla M. Rabusch,
President
Wells Fargo Advantage Funds
All major areas of the global stock market ended with losses, with most of the decline occurring in the second half of the period.
Dear Valued Shareholder,
We’re pleased to offer you this semi-annual report for the Wells Fargo Advantage Health Care Fund for the six-month period that ended September 30, 2011. Upon reviewing the report, you may notice a few changes from past reports, the most significant of which is the change from a multi-fund report to a single-fund report. We believe this change will give you more convenient access to your fund data.
The period was marked by growing pessimism about the economy and, consequently, increased market volatility as a variety of macroeconomic events—including the ongoing European sovereign debt crisis and the downgrade of the U.S. credit rating by Standard & Poor’s—caused investors to question the strength of the economic recovery. All major areas of the global stock market ended with losses, with most of the decline occurring in the second half of the period.
Market sentiment darkened as economic numbers weakened.
Prior to the period, economic numbers seemed to support the view of a gradual global economic recovery. However, growth in gross domestic product (GDP) for the first quarter of 2011 was initially reported at 1.8% but was later revised significantly downward to 0.4%. The amount of the downward revision not only reawakened fears that the economy was slowing, but also caused investors to put less of an emphasis on the 1.3% estimate for second-quarter GDP growth. The prolonged debate in the summer of 2011 over increasing the U.S. debt ceiling, which raised the possibility of the country defaulting on its debt, further weakened investor sentiment. Although the debate was resolved in time to prevent a default, Standard & Poor’s later cited the country’s dysfunctional political climate as one reason why it lowered the U.S. credit rating to AA+ from AAA1.
Persistent weakness in jobs and housing slowed economic growth.
The unemployment rate remained stubbornly high throughout the six-month period, beginning the period at 9.0% in April 2011 and ending the period modestly higher at 9.1% in September 2011. Widespread frustration over the continued weakness in the labor market was one factor behind the “Occupy Wall Street” protest movement that began in September 2011. Persistent weakness in the housing market remained another source of concern. By September, some market analysts were openly discussing the possibility of a return to recession; even those analysts who forecasted a continued recovery believed that it would occur only gradually. The end result was a U.S. stock market that weakened in June and recovered in July, then fell sharply in August and September to end the period with significant losses.
Europe’s sovereign debt problems continued to weigh on confidence.
The ongoing drama of the European sovereign debt crisis returned to center stage, as it became increasingly likely that eurozone member Greece would default on its sovereign debt, despite receiving aid from the European Union and the International Monetary Fund. Because many eurozone banks owned Greek debt, and many U.S. banks had financial ties to eurozone banks, investors worried
| 1. | The ratings indicated are from Standard & Poor’s. Credit quality ratings apply to underlying holdings of the fund and not the fund itself. Standard and Poor’s rates the creditworthiness of bonds, ranging from AAA (highest) to D (lowest). Ratings from A to CCC may be modified by the addition of a plus (+) or minus (-) sign to show relative standing within the rating categories. |
| | | | | | |
| Letter to Shareholders | | Wells Fargo Advantage Health Care Fund | | | 3 | |
about the effect of such an event on the global economy and financial system. Meanwhile, market participants increasingly worried about the debt burdens of Italy—which also had its credit rating downgraded by Standard & Poor’s—and later of France. Although France maintained its AAA rating as of the end of the period, French banks were heavily exposed to weaker sovereign credits, leading to fears of a state bailout and a resulting increase in France’s required expenditures. Partly because of the debt worries, European stock markets generally ended the period with losses.
Central banks continued to provide stimulus.
Throughout the reporting period, the Federal Open Market Committee kept its key interest rates at effectively zero in order to support the financial system. As previously planned, the Federal Reserve (Fed) ended its second round of quantitative easing (QE2)—in which it purchased a total of $600 billion in long-term U.S. Treasuries from November 2010 through June 2011—as well as reinvested an additional $250 billion to $300 billion in Treasuries with the proceeds from earlier investments. However, in response to extreme market volatility and signs of a weakening economy, in early August 2011, the Fed announced its intention to keep interest rates low until 2013. In September, the Fed implemented a program to sell $400 billion in short-term Treasuries in exchange for longer-term bonds—so-called “Operation Twist”—with the goal of pushing down long-term yields.
At the beginning of the period, the European Central Bank (ECB) had a key rate of 1.00%, but it raised it to 1.25% in April and then to 1.50% in July in an attempt to keep inflation in check. The ECB continued to provide unlimited liquidity for banks and, in August, after a sell-off in the sovereign bonds of Spain and Italy, announced plans to purchase the debt of those countries.
Global stock markets sold off during the period.
Stocks began the period rallying on hopes of a continued economic recovery, only to sell off sharply in late summer. For the period, economically sensitive stocks generally posted the deepest losses. As a result, the stocks of smaller companies—which generally have lesser access to capital and less diversified revenue streams than larger companies—performed the worst. The weaker economy also renewed concerns about potential loan losses at banks and other financial institutions. Among both large caps and small caps, growth stocks posted narrower losses than value stocks, largely because of weakness in financials (which are typically considered part of the value space). More defensive sectors such as health care and utilities generally outperformed. In addition, a rally in gold helped gold-related stocks post better returns than the broader market.
Many variables are at work in the market.
The full effect of the credit crisis remains unknown. Elevated unemployment and debt defaults continue to pressure consumers and businesses alike.
In this environment, experience tells us that strict adherence to time-tested strategies has its rewards. Wells Fargo Advantage Funds represents investments across a range of asset classes and investment styles, giving you an opportunity to create a diversified investment portfolio. While diversification may not prevent losses in a downturn, it does provide you with one way of managing risk.
Stocks began the period rallying on hopes of a continued economic recovery, only to sell off sharply in late summer.
| | | | |
| 4 | | Wells Fargo Advantage Health Care Fund | | Letter to Shareholders |
Thank you for choosing to invest with Wells Fargo Advantage Funds. We appreciate your confidence in us and remain committed to helping you meet your financial needs. For current information about your fund investments, contact your investment professional, visit our website at www.wellsfargo.com/advantagefunds, or call us directly at 1-800-222-8222. We are available 24 hours a day, 7 days a week.
Sincerely,

Karla M. Rabusch
President
Wells Fargo Advantage Funds
| | | | | | |
| Performance Highlights (Unaudited) | | Wells Fargo Advantage Health Care Fund | | | 5 | |
INVESTMENT OBJECTIVE
The Fund seeks long-term capital appreciation.
ADVISER
Wells Fargo Funds Management, LLC
SUB-ADVISER
Wells Capital Management Incorporated
PORTFOLIO MANAGER
Robert Junkin, CPA
FUND INCEPTION
December 22, 1999
| | | | |
TEN LARGEST EQUITY HOLDINGS1
(AS OF SEPTEMBER 30, 2011) | |
Pfizer Incorporated | | | 3.47% | |
Amgen Incorporated | | | 3.39% | |
Celgene Corporation | | | 3.03% | |
Careview Communications Incorporated | | | 2.84% | |
Alexion Pharmaceuticals Incorporated | | | 2.83% | |
Gilead Sciences Incorporated | | | 2.60% | |
UnitedHealth Group Incorporated | | | 2.47% | |
Sanofi-Aventis SA | | | 2.26% | |
Aetna Incorporated | | | 2.23% | |
Allergan Incorporated | | | 2.17% | |
| | |
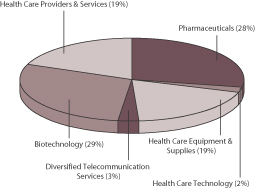
INDUSTRY DISTRIBUTION2 (AS OF SEPTEMBER 30, 2011) | | |
| |
 | | |
| 1. | The ten largest equity holdings are calculated based on the value of the securities divided by total net assets of the Fund. Holdings are subject to change and may have changed since the date specified. |
| 2. | Industry distribution is subject to change and is calculated based on the total long-term investments of the Fund. |
| | | | |
| 6 | | Wells Fargo Advantage Health Care Fund | | Performance Highlights (Unaudited) |
AVERAGE ANNUAL TOTAL RETURN3 (%) (AS OF SEPTEMBER 30, 2011)
| | | | | | | | | | | | | | | | | | | | | | | | | | | | | | | | | | | | | | | | | | | | |
| | | | | | Including Sales Charge | | | Excluding Sales Charge | | | Expense Ratios4 | |
| | | Inception Date | | | 6 Months* | | | 1 Year | | | 5 Year | | | 10 Year | | | 6 Months* | | | 1 Year | | | 5 Year | | | 10 Year | | | Gross | | | Net5 | |
Class A (EHABX) | | | 12/22/1999 | | | | (15.64 | ) | | | (5.41 | ) | | | (1.93 | ) | | | 3.99 | | | | (10.50 | ) | | | 0.34 | | | | (0.77 | ) | | | 4.61 | | | | 1.61% | | | | 1.47% | |
Class B (EHCBX) ** | | | 12/22/1999 | | | | (15.31 | ) | | | (5.42 | ) | | | (1.85 | ) | | | 4.08 | | | | (10.85 | ) | | | (0.44 | ) | | | (1.50 | ) | | | 4.08 | | | | 2.36% | | | | 2.22% | |
Class C (EHCCX) | | | 12/22/1999 | | | | (11.81 | ) | | | (1.38 | ) | | | (1.50 | ) | | | 3.85 | | | | (10.81 | ) | | | (0.38 | ) | | | (1.50 | ) | | | 3.85 | | | | 2.36% | | | | 2.22% | |
Administrator Class (EHCYX) | | | 12/22/1999 | | | | | | | | | | | | | | | | | | | | (10.35 | ) | | | 0.61 | | | | (0.51 | ) | | | 4.89 | | | | 1.45% | | | | 1.24% | |
S&P 1500 Supercomposite Healthcare Sector Index6 | | | | | | | | | | | | | | | | | | | | | | | (4.33 | ) | | | 6.45 | | | | 1.60 | | | | 2.09 | | | | | | | | | |
S&P 500 Index7 | | | | | | | | | | | | | | | | | | | | | | | (13.78 | ) | | | 1.14 | | | | (1.18 | ) | | | 2.82 | | | | | | | | | |
| * | Returns for periods of less than one year are not annualized. |
| ** | Class B shares are closed to investment, except in connection with the reinvestment of any distributions and permitted exchanges. |
Figures quoted represent past performance, which is no guarantee of future results and do not reflect the deduction of taxes that a shareholder may pay on fund distributions or the redemption of fund shares. Investment return and principal value of an investment will fluctuate so that an investor’s shares, when redeemed, may be worth more or less than their original cost. Performance shown without sales charges would be lower if sales charges were reflected. Current performance may be lower or higher than the performance data quoted and assumes the reinvestment of dividends and capital gains. Current month-end performance is available on the Fund’s Web site – www.wellsfargo.com/advantagefunds.
Index returns do not include transaction costs associated with buying and selling securities, any mutual fund fees or expenses or any taxes. It is not possible to invest directly in an index.
For Class A shares, the maximum front-end sales charge is 5.75%. For Class B shares, the maximum contingent deferred sales charge is 5.00%. For Class C shares, the maximum contingent deferred sales charge is 1.00%. Performance including sales charge assumes the sales charge for the corresponding time period. Administrator Class shares are sold without a front-end sales charge or contingent deferred sales charge.
Stock fund values fluctuate in response to the activities of individual companies and general market and economic conditions. The use of derivatives may reduce returns and/or increase volatility. Funds that concentrate their investments in limited sectors may be susceptible to financial, economic or market events impacting those sectors. Certain investment strategies tend to increase the total risk of an investment (relative to the broader market). This Fund is exposed to foreign investment risk, non-diversification risk, and smaller company securities risk. Consult the Fund’s prospectus for additional information on these and other risks.
| 3. | Historical performance shown for all classes of the Fund prior to July 19, 2010 is based on the performance of the Fund’s predecessor, Evergreen Health Care Fund. |
| 4. | Reflects the expense ratios as stated in the most prospectuses. |
| 5. | The Adviser has committed through July 18, 2013 to waive fees and/or reimburse expenses to the extent necessary to cap the Fund’s Total Annual Fund Operating Expenses After Fee Waiver, excluding certain expenses, at 1.46% for Class A, 2.21% for Class B, 2.21% for Class C and 1.23% for Administrator Class. Without this cap, the Fund’s returns would have been lower. |
| 6. | The S&P 1500 Supercomposite Healthcare Sector Index is an unmanaged capitalization-weighted index tracking the performance of health care stocks within the S&P 500, S&P MidCap 400 Index and S&P 600 Index. S&P indices are unmanaged and track the performance of publicly-traded U.S. stocks. They are often used to indicate the performance of specific market capitalizations and/or the overall U.S. stock market. You cannot invest directly in an index. |
| 7. | The S&P 500 Index consists of 500 stocks chosen for market size, liquidity, and industry group representation. It is a market-value weighted index with each stock’s weight in the index proportionate to its market value. You cannot invest directly in an index. |
| | | | | | |
| Fund Expenses (Unaudited) | | Wells Fargo Advantage Health Care Fund | | | 7 | |
As a shareholder of the Fund, you incur two types of costs: (1) transaction costs, including sales charges (loads) on purchase payments and contingent deferred sales charges (if any) on redemptions and (2) ongoing costs, including management fees; distribution (12b-1) and/or shareholder service fees; and other Fund expenses. This example is intended to help you understand your ongoing costs (in dollars) of investing in the Fund and to compare these costs with the ongoing costs of investing in other mutual funds.
The example is based on an investment of $1,000 invested at the beginning of the six-month period and held for the entire period from April 1, 2011 to September 30, 2011.
Actual Expenses
The “Actual” line of the table below provides information about actual account values and actual expenses. You may use the information in this line, together with the amount you invested, to estimate the expenses that you paid over the period. Simply divide your account value by $1,000 (for example, an $8,600 account value divided by $1,000 = 8.6), then multiply the result by the number in the “Actual” line under the heading entitled “Expenses Paid During Period” for your applicable class of shares to estimate the expenses you paid on your account during this period.
Hypothetical Example for Comparison Purposes
The “Hypothetical” line of the table below provides information about hypothetical account values and hypothetical expenses based on the Fund’s actual expense ratio and an assumed rate of return of 5% per year before expenses, which is not the Fund’s actual return. The hypothetical account values and expenses may not be used to estimate the actual ending account balance or expenses you paid for the period. You may use this information to compare the ongoing costs of investing in the Fund and other funds. To do so, compare this 5% hypothetical example with the 5% hypothetical examples that appear in the shareholder reports of the other funds.
Please note that the expenses shown in the table are meant to highlight your ongoing costs only and do not reflect any transactional costs, such as sales charges (loads) and contingent deferred sales charges. Therefore, the “Hypothetical” line of the table is useful in comparing ongoing costs only, and will not help you determine the relative total costs of owning different funds. In addition, if these transactional costs were included, your costs would have been higher.
| | | | | | | | | | | | | | | | |
| | | Beginning
Account Value
04-01-2011 | | | Ending
Account Value
09-30-2011 | | | Expenses
Paid During
the Period1 | | | Net Annual
Expense Ratio | |
Class A | | | | | | | | | | | | | | | | |
Actual | | $ | 1,000.00 | | | $ | 894.98 | | | $ | 6.87 | | | | 1.45 | % |
Hypothetical (5% return before expenses) | | $ | 1,000.00 | | | $ | 1,017.75 | | | $ | 7.31 | | | | 1.45 | % |
Class B | | | | | | | | | | | | | | | | |
Actual | | $ | 1,000.00 | | | $ | 891.46 | | | $ | 10.40 | | | | 2.20 | % |
Hypothetical (5% return before expenses) | | $ | 1,000.00 | | | $ | 1,014.00 | | | $ | 11.08 | | | | 2.20 | % |
Class C | | | | | | | | | | | | | | | | |
Actual | | $ | 1,000.00 | | | $ | 891.91 | | | $ | 10.41 | | | | 2.20 | % |
Hypothetical (5% return before expenses) | | $ | 1,000.00 | | | $ | 1,014.00 | | | $ | 11.08 | | | | 2.20 | % |
Administrator Class | | | | | | | | | | | | | | | | |
Actual | | $ | 1,000.00 | | | $ | 896.48 | | | $ | 5.83 | | | | 1.23 | % |
Hypothetical (5% return before expenses) | | $ | 1,000.00 | | | $ | 1,018.85 | | | $ | 6.21 | | | | 1.23 | % |
| 1. | Expenses paid is equal to the annualized expense ratio of each class multiplied by the average account value over the period, multiplied by the number of days in the most recent fiscal half-year divided by the number of days in the fiscal year (to reflect the one-half year period). |
| | | | |
| 8 | | Wells Fargo Advantage Health Care Fund | | Portfolio of Investments—September 30, 2011 (Unaudited) |
| | | | | | | | | | | | |
| Security Name | | | | | | Shares | | | Value | |
| | | | | | | | | | | | |
| | | | |
Common Stocks: 97.14% | | | | | | | | | | | | |
| | | | |
Health Care : 94.30% | | | | | | | | | | | | |
| | | | |
| Biotechnology : 28.58% | | | | | | | | | | | | |
Acorda Therapeutics Incorporated† | | | | | | | 67,672 | | | $ | 1,350,733 | |
Alexion Pharmaceuticals Incorporated† | | | | | | | 39,061 | | | | 2,502,248 | |
Amgen Incorporated | | | | | | | 54,538 | | | | 2,996,863 | |
Biogen Idec Incorporated† | | | | | | | 4,807 | | | | 447,772 | |
Celgene Corporation†« | | | | | | | 43,267 | | | | 2,679,093 | |
Cubist Pharmaceuticals Incorporated†« | | | | | | | 14,513 | | | | 512,599 | |
Dendreon Corporation†« | | | | | | | 88,549 | | | | 796,941 | |
Gilead Sciences Incorporated† | | | | | | | 59,281 | | | | 2,300,103 | |
Human Genome Sciences Incorporated† | | | | | | | 75,625 | | | | 959,681 | |
Idenix Pharmaceuticals Incorporated†« | | | | | | | 346,007 | | | | 1,726,575 | |
Incyte Corporation†« | | | | | | | 46,141 | | | | 644,590 | |
Novavax Incorporated†« | | | | | | | 390,762 | | | | 629,127 | |
NPS Pharmaceuticals Incorporated†« | | | | | | | 89,611 | | | | 583,368 | |
Onyx Pharmaceuticals Incorporated†« | | | | | | | 5,592 | | | | 167,816 | |
Pharmasset Incorporated†« | | | | | | | 21,172 | | | | 1,743,938 | |
Regeneron Pharmaceutical Incorporated†« | | | | | | | 19,896 | | | | 1,157,947 | |
Theratechnologies Incorporated†« | | | | | | | 462,974 | | | | 1,378,451 | |
United Therapeutics Corporation†« | | | | | | | 22,099 | | | | 828,492 | |
Vertex Pharmaceuticals Incorporated†« | | | | | | | 42,069 | | | | 1,873,753 | |
| | | | |
| | | | | | | | | | | 25,280,090 | |
| | | | | | | | | | | | |
| | | | |
| Health Care Equipment & Supplies : 18.33% | | | | | | | | | | | | |
Alere Incorporated†« | | | | | | | 78,739 | | | | 1,547,221 | |
ArthroCare Corporation† | | | | | | | 43,964 | | | | 1,264,844 | |
Atricure Incorporated† | | | | | | | 68,670 | | | | 668,846 | |
CareFusion Corporation† | | | | | | | 60,347 | | | | 1,445,311 | |
Covidien plc | | | | | | | 21,030 | | | | 927,423 | |
Fresenius SE | | | | | | | 12,058 | | | | 1,071,797 | |
Genmark Diagnostics Incorporated† | | | | | | | 127,545 | | | | 733,384 | |
HeartWare International Incorporated† | | | | | | | 17,591 | | | | 1,133,036 | |
Hospira Incorporated† | | | | | | | 29,783 | | | | 1,101,971 | |
NuVasive Incorporated†« | | | | | | | 69,977 | | | | 1,194,507 | |
SonoSite Incorporated†« | | | | | | | 30,866 | | | | 936,474 | |
Thoratec Corporation†« | | | | | | | 43,973 | | | | 1,435,279 | |
TSO3 Incorporated† | | | | | | | 500,000 | | | | 663,231 | |
Wright Medical Group Incorporated†« | | | | | | | 64,735 | | | | 1,157,462 | |
Zimmer Holdings Incorporated†« | | | | | | | 17,417 | | | | 931,810 | |
| | | | |
| | | | | | | | | | | 16,212,596 | |
| | | | | | | | | | | | |
| | | | |
| Health Care Providers & Services: 18.42% | | | | | | | | | | | | |
Aetna Incorporated | | | | | | | 54,283 | | | | 1,973,187 | |
CIGNA Corporation | | | | | | | 42,789 | | | | 1,794,571 | |
Express Scripts Incorporated† | | | | | | | 43,645 | | | | 1,617,920 | |
Fresenius Medical Care AG & Company | | | | | | | 16,636 | | | | 1,128,572 | |
Hanger Orthopedic Group Incorporated† | | | | | | | 76,566 | | | | 1,446,332 | |
HCA Holdings Incorporated† | | | | | | | 49,035 | | | | 988,546 | |
Health Management Associates Incorporated Class A† | | | | | | | 77,911 | | | | 539,144 | |
Health Net Incorporated† | | | | | | | 61,010 | | | | 1,446,547 | |
| | | | | | |
| Portfolio of Investments—September 30, 2011 (Unaudited) | | Wells Fargo Advantage Health Care Fund | | | 9 | |
| | | | | | | | | | | | | | |
| Security Name | | | | | | | Shares | | | Value | |
| | | | | | | | | | | | | | |
| | | | |
| Health Care Providers & Services: (continued) | | | | | | | | | | | | | | |
McKesson Corporation | | | | | | | | | 23,334 | | | $ | 1,696,382 | |
Medipattern Corporation† | | | | | | | | | 1,524,387 | | | | 465,506 | |
UnitedHealth Group Incorporated« | | | | | | | | | 47,308 | | | | 2,181,845 | |
Vanguard Health Systems Incorporated† | | | | | | | | | 100,000 | | | | 1,016,000 | |
| | | | |
| | | | | | | | | | | | | 16,294,552 | |
| | | | | | | | | | | | | | |
| | | | |
| Health Care Technology: 1.54% | | | | | | | | | | | | | | |
Allscripts Healthcare Solutions Incorporated† | | | | | | | | | 75,700 | | | | 1,364,114 | |
| | | | | | | | | | | | | | |
| | | | |
| Pharmaceuticals: 27.43% | | | | | | | | | | | | | | |
Allergan Incorporated« | | | | | | | | | 23,324 | | | | 1,921,431 | |
Bristol-Myers Squibb Company« | | | | | | | | | 31,962 | | | | 1,002,968 | |
Elan Corporation plc ADR† | | | | | | | | | 180,374 | | | | 1,899,338 | |
Eli Lilly & Company | | | | | | | | | 24,312 | | | | 907,321 | |
Endo Pharmaceuticals Holdings Incorporated† | | | | | | | | | 41,470 | | | | 1,160,745 | |
Forest Laboratories Incorporated†« | | | | | | | | | 28,074 | | | | 864,398 | |
Jazz Pharmaceuticals Incorporated† | | | | | | | | | 30,411 | | | | 1,262,665 | |
Johnson & Johnson« | | | | | | | | | 16,699 | | | | 1,063,893 | |
Map Pharmaceuticals Incorporated†« | | | | | | | | | 109,282 | | | | 1,597,703 | |
Mylan Laboratories Incorporated† | | | | | | | | | 83,077 | | | | 1,412,309 | |
Optimer Pharmaceuticals Incorporated†« | | | | | | | | | 87,148 | | | | 1,206,128 | |
Pfizer Incorporated | | | | | | | | | 173,608 | | | | 3,069,389 | |
Roche Holding AG Genusschein | | | | | | | | | 5,527 | | | | 898,323 | |
Salix Pharmaceuticals Limited†« | | | | | | | | | 38,013 | | | | 1,125,185 | |
Sanofi-Aventis SA | | | | | | | | | 30,430 | | | | 2,001,586 | |
Teva Pharmaceutical Industries Limited ADR | | | | | | | | | 44,535 | | | | 1,657,593 | |
Valera Pharmaceuticals Incorporated Escrow†(a)(i) | | | | | | | | | 410,964 | | | | 0 | |
Warner Chilcott Limited | | | | | | | | | 85,264 | | | | 1,219,275 | |
| | | | |
| | | | | | | | | | | | | 24,270,250 | |
| | | | | | | | | | | | | | |
| | | | |
Telecommunication Services: 2.84% | | | | | | | | | | | | | | |
| | | | |
| Diversified Telecommunication Services: 2.84% | | | | | | | | | | | | | | |
Careview Communications Incorporated†« | | | | | | | | | 1,599,642 | | | | 2,511,438 | |
| | | | | | | | | | | | | | |
| | | | |
Total Common Stocks (Cost $79,034,626) | | | | | | | | | | | | | 85,933,040 | |
| | | | | | | | | | | | | | |
| | | | |
| | | | | Expiration Date | | | | | | | |
| Rights: 0.03% | | | | | | | | | | | | | | |
| | | | |
Health Care: 0.03% | | | | | | | | | | | | | | |
| | | | |
| Pharmaceuticals: 0.03% | | | | | | | | | | | | | | |
Sanofi-Aventis SA† | | | | | 12/31/2020 | | | | 23,418 | | | | 24,823 | |
| | | | | | | | | | | | | | |
| | | | |
Total Rights (Cost $51,988) | | | | | | | | | | | | | 24,823 | |
| | | | | | | | | | | | | | |
| | | | |
| 10 | | Wells Fargo Advantage Health Care Fund | | Portfolio of Investments—September 30, 2011 (Unaudited) |
| | | | | | | | | | | | | | | | |
| Security Name | | | | | Expiration Date | | | Shares | | | Value | |
| | | | | | | | | | | | | | | | |
| | | | |
Warrants: 0.05% | | | | | | | | | | | | | | | | |
| | | | |
Health Care: 0.05% | | | | | | | | | | | | | | | | |
| | | | |
| Biotechnology: 0.05% | | | | | | | | | | | | | | | | |
Novavax Incorporated†(a)(i) | | | | | | | 07/31/2013 | | | | 158,377 | | | $ | 41,178 | |
| | | | | | | | | | | | | | | | |
| | | | |
Total Warrants (Cost $0) | | | | | | | | | | | | | | | 41,178 | |
| | | | | | | | | | | | | | | | |
| | | | |
| | | Yield | | | | | | | | | | |
| Short-Term Investments: 31.14% | | | | | | | | | | | | | | | | |
| | | | |
| Investment Companies: 31.14% | | | | | | | | | | | | | | | | |
Wells Fargo Advantage Cash Investment Money Market Fund, Institutional Class(l)(u) | | | 0.06 | % | | | | | | | 3,113,644 | | | | 3,113,644 | |
Wells Fargo Securities Lending Cash Investments, LLC(l)(r)(u)(v) | | | 0.20 | | | | | | | | 24,435,695 | | | | 24,435,695 | |
| | | | |
Total Short-Term Investments (Cost $27,549,339) | | | | | | | | | | | | | | | 27,549,339 | |
| | | | | | | | | | | | | | | | |
| | | | | | | | |
| Total Investments in Securities | | | | | | | | |
| (Cost $106,635,953)* | | | 128.36 | % | | | 113,548,380 | |
Other Assets and Liabilities, Net | | | (28.36 | ) | | | (25,086,059 | ) |
| | | | | | | | |
| Total Net Assets | | | 100.00 | % | | $ | 88,462,321 | |
| | | | | | | | |
| † | Non-income earning security. |
| « | All or a portion of this security is on loan. |
| (a) | Security is fair valued by the Management Valuation Team, and in certain instances by the Board of Trustees, in accordance with procedures approved by the Board of Trustees. |
| (l) | Investment in an affiliate. |
| (u) | Rate shown is the 7-day annualized yield at period end. |
| (v) | Security represents investment of cash collateral received from securities on loan. |
| (r) | The investment company is exempt from registration under Section 3(c)(7) of the 1940 Act. |
| * | Cost for federal income tax purposes is $107,400,040 and net unrealized appreciation (depreciation) consists of: |
| | | | |
Gross unrealized appreciation | | $ | 15,829,360 | |
Gross unrealized depreciation | | | (9,681,020 | ) |
| | | | |
Net unrealized appreciation | | $ | 6,148,340 | |
The accompanying notes are an integral part of these financial statements.
| | | | | | |
| Statement of Assets and Liabilities—September 30, 2011 (Unaudited) | | Wells Fargo Advantage Health Care Fund | | | 11 | |
| | | | |
| | |
Assets | | | | |
Investments | | | | |
In unaffiliated securities (including securities on loan), at value | | $ | 85,999,041 | |
In affiliated securities, at value | | | 27,549,339 | |
| | | | |
Total investments, at value (see cost below) | | | 113,548,380 | |
Foreign currency, at value (see cost below) | | | 39 | |
Receivable for investments sold | | | 1,626,013 | |
Receivable for Fund shares sold | | | 5,605 | |
Receivable for dividends | | | 20,933 | |
Receivable for securities lending income | | | 13,862 | |
Prepaid expenses and other assets | | | 29,784 | |
| | | | |
Total assets | | | 115,244,616 | |
| | | | |
| |
Liabilities | | | | |
Payable for investments purchased | | | 1,821,035 | |
Payable for Fund shares redeemed | | | 293,426 | |
Payable upon receipt of securities loaned | | | 24,435,695 | |
Advisory fee payable | | | 69,163 | |
Distribution fees payable | | | 23,889 | |
Due to other related parties | | | 25,822 | |
Accrued expenses and other liabilities | | | 113,265 | |
| | | | |
Total liabilities | | | 26,782,295 | |
| | | | |
Total net assets | | $ | 88,462,321 | |
| | | | |
| |
NET ASSETS CONSIST OF | | | | |
Paid-in capital | | $ | 81,823,688 | |
Undistributed net investment loss | | | (566,272 | ) |
Accumulated net realized gains on investments | | | 290,454 | |
Net unrealized gains on investments | | | 6,914,451 | |
| | | | |
Total net assets | | $ | 88,462,321 | |
| | | | |
| |
COMPUTATION OF NET ASSET VALUE AND OFFERING PRICE PER SHARE1 | | | | |
Net assets – Class A | | $ | 52,200,844 | |
Shares outstanding – Class A | | | 2,986,578 | |
Net asset value per share – Class A | | | $17.48 | |
Maximum offering price per share – Class A2 | | | $18.55 | |
Net assets – Class B | | $ | 12,928,731 | |
Shares outstanding – Class B | | | 819,438 | |
Net asset value per share – Class B | | | $15.78 | |
Net assets – Class C | | $ | 19,113,012 | |
Shares outstanding – Class C | | | 1,212,387 | |
Net asset value per share – Class C | | | $15.76 | |
Net assets – Administrator Class | | $ | 4,219,734 | |
Shares outstanding – Administrator Class | | | 233,101 | |
Net asset value per share – Administrator Class | | | $18.10 | |
| |
Total investments, at cost | | $ | 106,635,953 | |
| | | | |
Securities on loan, at value | | $ | 23,764,412 | |
| | | | |
Foreign currency, at cost | | $ | 43 | |
| | | | |
| 1. | The Fund has an unlimited number of authorized shares. |
| 2. | Maximum offering price is computed as 100/94.25 of net asset value. On investments of $50,000 or more, the offering price is reduced. |
The accompanying notes are an integral part of these financial statements.
| | | | |
| 12 | | Wells Fargo Advantage Health Care Fund | | Statement of Operations—Six Months Ended September 30, 2011 (Unaudited) |
| | | | |
| | |
Investment income | | | | |
Dividends* | | $ | 253,087 | |
Securities lending income, net | | | 96,756 | |
Income from affiliated securities | | | 1,895 | |
| | | | |
Total investment income | | | 351,738 | |
| | | | |
| |
Expenses | | | | |
Advisory fee | | | 425,551 | |
Administration fees | | | | |
Fund level | | | 26,597 | |
Class A | | | 79,700 | |
Class B | | | 21,663 | |
Class C | | | 29,692 | |
Administrator Class | | | 2,788 | |
Shareholder servicing fees | | | | |
Class A | | | 76,157 | |
Class B | | | 20,830 | |
Class C | | | 28,550 | |
Administrator Class | | | 6,582 | |
Distribution fees | | | | |
Class B | | | 62,490 | |
Class C | | | 85,649 | |
Custody and accounting fees | | | 6,537 | |
Professional fees | | | 12,841 | |
Registration fees | | | 7,945 | |
Shareholder report expenses | | | 13,264 | |
Trustees’ fees and expenses | | | 1,000 | |
Other fees and expenses | | | 4,625 | |
| | | | |
Total expenses | | | 912,461 | |
Less: Fee waivers and/or expense reimbursements | | | (1,303 | ) |
| | | | |
Net expenses | | | 911,158 | |
| | | | |
Net investment loss | | | (559,420 | ) |
| | | | |
| |
REALIZED AND UNREALIZED GAINS (LOSSES) ON INVESTMENTS | | | | |
Net realized gains on investments | | | 9,602,429 | |
Net change in unrealized gains (losses) investments | | | (19,612,078 | ) |
| | | | |
Net realized and unrealized gains (losses) on investments | | | (10,009,649 | ) |
| | | | |
Net decrease in net assets resulting from operations | | $ | (10,569,069 | ) |
| | | | |
| |
* Net of foreign dividend withholding taxes of | | | $6,679 | |
The accompanying notes are an integral part of these financial statements.
| | | | | | |
| Statements of Changes in Net Assets | | Wells Fargo Advantage Health Care Fund | | | 13 | |
| | | | | | | | | | | | | | | | | | | | | | | | |
| | | Six Months Ended September 30, 2011
(Unaudited) | | | Year Ended March 31, 20111 | | | Year Ended October 31, 20102 | |
| | | | | | |
Operations | | | | | | | | | | | | | | | | | | | | | | | | |
Net investment loss | | | | | | $ | (559,420 | ) | | | | | | $ | (370,404 | ) | | | | | | $ | (549,964 | ) |
Net realized gains on investments | | | | | | | 9,602,429 | | | | | | | | 3,963,912 | | | | | | | | 5, 234,549 | |
Net change in unrealized gains (losses) on investments | | | | | | | (19,612,078 | ) | | | | | | | 6,803,706 | | | | | | | | 13,845,174 | |
| | | | | | | | | | | | | | | | | | | | | | | | |
Net increase (decrease) in net assets resulting from operations | | | | | | | (10,569,069 | ) | | | | | | | 10,397,214 | | | | | | | | 18,529,759 | |
| | | | | | | | | | | | | | | | | | | | | | | | |
| | | | | | |
Capital share transactions | | | Shares | | | | | | | | Shares | | | | | | | | Shares | | | | | |
Proceeds from shares sold | | | | | | | | | | | | | | | | | | | | | | | | |
Class A | | | 198,917 | | | | 3,903,993 | | | | 137,633 | | | | 2,523,285 | | | | 280,789 | | | | 4,815,150 | |
Class B | | | 619 | | | | 11,654 | | | | 386 | | | | 6,529 | | | | 18,318 | | | | 286,395 | |
Class C | | | 20,487 | | | | 369,851 | | | | 16,840 | | | | 284,288 | | | | 31,646 | | | | 495,682 | |
Administrator Class | | | 14,596 | | | | 300,092 | | | | 127,754 | | | | 2,363,718 | | | | 33,994 | 3 | | | 6,01,485 | 3 |
| | | | | | | | | | | | | | | | | | | | | | | | |
| | | | | | | 4,585,590 | | | | | | | | 5,177,820 | | | | | | | | 6,198,712 | |
| | | | | | | | | | | | | | | | | | | | | | | | |
Payment for shares redeemed | | | | | | | | | | | | | | | | | | | | | | | | |
Class A | | | (402,128 | ) | | | (7,833,416 | ) | | | (748,947 | ) | | | (13,622,132 | ) | | | (1,600,428 | ) | | | (27,382,655 | ) |
Class B | | | (234,423 | ) | | | (4,136,092 | ) | | | (178,385 | ) | | | (2,986,898 | ) | | | (374,283 | ) | | | (5,824,189 | ) |
Class C | | | (132,805 | ) | | | (2,323,797 | ) | | | (170,692 | ) | | | (2,842,039 | ) | | | (444,695 | ) | | | (6,906,077 | ) |
Administrator Class | | | (69,578 | ) | | | (1,378,533 | ) | | | (62,746 | ) | | | (1,208,005 | ) | | | (192,388 | )3 | | | (3,370,161 | )3 |
| | | | | | | | | | | | | | | | | | | | | | | | |
| | | | | | | (15,671,838 | ) | | | | | | | (20,659,074 | ) | | | | | | | (43,483,082 | ) |
| | | | | | | | | | | | | | | | | | | | | | | | |
Net decrease in net assets resulting
from capital share transactions | | | | | | | (11,086,248 | ) | | | | | | | (15,481,254 | ) | | | | | | | (37,284,370 | ) |
| | | | | | | | | | | | | | | | | | | | | | | | |
Total decrease in net assets | | | | | | | (21,655,317 | ) | | | | | | | (5,084,040 | ) | | | | | | | (18,754,611 | ) |
| | | | | | | | | | | | | | | | | | | | | | | | |
| | | | | | |
Net assets | | | | | | | | | | | | | | | | | | | | | | | | |
Beginning of period | | | | | | | 110,117,638 | | | | | | | | 115,201,678 | | | | | | | | 133,956,289 | |
| | | | | | | | | | | | | | | | | | | | | | | | |
End of period | | | | | | $ | 88,462,321 | | | | | | | $ | 110,117,638 | | | | | | | $ | 115,201,678 | |
| | | | | | | | | | | | | | | | | | | | | | | | |
Undistributed net investment loss | | | | | | $ | (566,272 | ) | | | | | | $ | (6,852 | ) | | | | | | $ | (6,591 | ) |
| | | | | | | | | | | | | | | | | | | | | | | | |
| 1. | For the five months ended March 31, 2011. The Fund changed its fiscal year end from October 31 to March 31, effective March 31, 2011. |
| 2. | After the close of business on July 16, 2010, the Fund acquired the net assets of Evergreen Health Care Fund which became the accounting and performance survivor in this transaction. The information for the period prior to July 19, 2010 is that of Evergreen Health Care Fund. |
| 3. | Class I shares of Evergreen Health Care Fund became Administrator Class shares on July 19, 2010. |
The accompanying notes are an integral part of these financial statements.
| | | | |
| 14 | | Wells Fargo Advantage Health Care Fund | | Financial Highlights |
(For a share outstanding throughout each period)
| | | | | | | | | | | | | | | | | | | | | | | | | | | | |
| | | Six Months Ended
September 30, 2011 (Unaudited) | | | Year Ended
March 31, 20111 | | | Year Ended October 31, | |
| Class A | | | | 20102 | | | 20092 | | | 20082 | | | 20072 | | | 20062 | |
Net asset value, beginning of period | | $ | 19.52 | | | $ | 17.74 | | | $ | 15.40 | | | $ | 14.59 | | | $ | 23.09 | | | $ | 20.93 | | | $ | 19.38 | |
Net investment loss | | | (0.08 | )3 | | | (0.04 | )3 | | | (0.03 | )3 | | | (0.11 | )3 | | | (0.13 | )3 | | | (0.09 | ) | | | (0.12 | )3 |
Net realized and unrealized gains (losses) on investments | | | (1.96 | ) | | | 1.82 | | | | 2.37 | | | | 0.92 | | | | (6.58 | ) | | | 2.86 | | | | 2.80 | |
| | | | | | | | | | | | | | | | | | | | | | | | | | | | |
Total from investment operations | | | (2.04 | ) | | | 1.78 | | | | 2.34 | | | | 0.81 | | | | (6.71 | ) | | | 2.77 | | | | 2.68 | |
Distributions to shareholders from | | | | | | | | | | | | | | | | | | | | | | | | | | | | |
Net realized gains | | | 0.00 | | | | 0.00 | | | | 0.00 | | | | 0.00 | | | | (1.79 | ) | | | (0.61 | ) | | | (1.13 | ) |
Net asset value, end of period | | $ | 17.48 | | | $ | 19.52 | | | $ | 17.74 | | | $ | 15.40 | | | $ | 14.59 | | | $ | 23.09 | | | $ | 20.93 | |
Total return4 | | | (10.50 | )% | | | 10.03 | % | | | 15.19 | % | | | 5.55 | % | | | (31.30 | )% | | | 13.57 | % | | | 14.46 | % |
Ratios to average net assets (annualized) | | | | | | | | | | | | | | | | | | | | | | | | | |
Gross expenses | | | 1.45 | % | | | 1.59 | % | | | 1.77 | % | | | 1.81 | % | | | 1.68 | % | | | 1.66 | % | | | 1.70 | % |
Net expenses | | | 1.45 | % | | | 1.46 | % | | | 1.73 | % | | | 1.81 | % | | | 1.66 | % | | | 1.64 | % | | | 1.69 | % |
Net investment loss | | | (0.78 | )% | | | (0.52 | )% | | | (0.16 | )% | | | (0.81 | )% | | | (0.68 | )% | | | (0.41 | )% | | | (0.63 | )% |
Supplemental data | | | | | | | | | | | | | | | | | | | | | | | | | | | | |
Portfolio turnover rate | | | 32 | % | | | 33 | % | | | 42 | % | | | 49 | % | | | 47 | % | | | 71 | % | | | 41 | % |
Net assets, end of period (000’s omitted) | | | $52,201 | | | | $62,261 | | | | $67,434 | | | | $78,860 | | | | $96,713 | | | | $161,559 | | | | $148,460 | |
| 1. | For the five months ended March 31, 2011. The Fund changed its fiscal year end from October 31 to March 31, effective March 31, 2011. |
| 2. | After the close of business on July 16, 2010, the Fund acquired the net assets of Evergreen Health Care Fund which became the accounting and performance survivor in this transaction. The information for the periods prior to July 19, 2010 is that of Class A of Evergreen Health Care Fund. |
| 3. | Calculated based upon average shares outstanding. |
| 4. | Total return calculations do not include any sales charges. Returns for periods of less than one year are not annualized. |
The accompanying notes are an integral part of these financial statements.
| | | | | | |
| Financial Highlights | | Wells Fargo Advantage Health Care Fund | | | 15 | |
(For a share outstanding throughout each period)
| | | | | | | | | | | | | | | | | | | | | | | | | | | | |
| Class B | | Six Months Ended September 30, 2011 (Unaudited) | | | Year Ended March 31, 20111 | | | Year Ended October 31, | |
| | | | 20102 | | | 20092 | | | 20082 | | | 20072 | | | 20062 | |
Net asset value, beginning of period | | $ | 17.69 | | | $ | 16.13 | | | $ | 14.10 | | | $ | 13.46 | | | $ | 21.60 | | | $ | 19.76 | | | $ | 18.47 | |
Net investment loss | | | (0.14 | )3 | | | (0.09 | )3 | | | (0.14 | )3 | | | (0.20 | )3 | | | (0.26 | ) | | | (0.31 | ) | | | (0.26 | ) |
Net realized and unrealized gains (losses) on investments | | | (1.77 | ) | | | 1.65 | | | | 2.17 | | | | 0.84 | | | | (6.09 | ) | | | 2.76 | | | | 2.68 | |
| | | | | | | | | | | | | | | | | | | | | | | | | | | | |
Total from investment operations | | | (1.91 | ) | | | 1.56 | | | | 2.03 | | | | 0.64 | | | | (6.35 | ) | | | 2.45 | | | | 2.42 | |
Distributions to shareholders from | | | | | | | | | | | | | | | | | | | | | | | | | | | | |
Net realized gains | | | 0.00 | | | | 0.00 | | | | 0.00 | | | | 0.00 | | | | (1.79 | ) | | | (0.61 | ) | | | (1.13 | ) |
Net asset value, end of period | | $ | 15.78 | | | $ | 17.69 | | | $ | 16.13 | | | $ | 14.10 | | | $ | 13.46 | | | $ | 21.60 | | | $ | 19.76 | |
Total return4 | | | (10.85 | )% | | | 9.67 | % | | | 14.40 | % | | | 4.75 | % | | | (31.83 | )% | | | 12.73 | % | | | 13.72 | % |
Ratios to average net assets (annualized) | | | | | | | | | | | | | | | | | | | | | | | | | | | | |
Gross expenses | | | 2.20 | % | | | 2.35 | % | | | 2.52 | % | | | 2.57 | % | | | 2.40 | % | | | 2.35 | % | | | 2.40 | % |
Net expenses | | | 2.20 | % | | | 2.21 | % | | | 2.48 | % | | | 2.57 | % | | | 2.40 | % | | | 2.35 | % | | | 2.39 | % |
Net investment loss | | | (1.53 | )% | | | (1.28 | )% | | | (0.91 | )% | | | (1.56 | )% | | | (1.43 | )% | | | (1.12 | )% | | | (1.32 | )% |
Supplemental data | | | | | | | | | | | | | | | | | | | | | | | | | | | | |
Portfolio turnover rate | | | 32 | % | | | 33 | % | | | 42 | % | | | 49 | % | | | 47 | % | | | 71 | % | | | 41 | % |
Net assets, end of period (000’s omitted) | | | $12,929 | | | | $18,629 | | | | $19,854 | | | | $22,384 | | | | $37,393 | | | | $88,967 | | | | $97,682 | |
| 1. | For the five months ended March 31, 2011. The Fund changed its fiscal year end from October 31 to March 31, effective March 31, 2011. |
| 2. | After the close of business on July 16, 2010, the Fund acquired the net assets of Evergreen Health Care Fund which became the accounting and performance survivor in this transaction. The information for the periods prior to July 19, 2010 is that of Class B of Evergreen Health Care Fund. |
| 3. | Calculated based upon average shares outstanding. |
| 4. | Total return calculations do not include any sales charges. Returns for periods of less than one year are not annualized. |
The accompanying notes are an integral part of these financial statements.
| | | | |
| 16 | | Wells Fargo Advantage Health Care Fund | | Financial Highlights |
(For a share outstanding throughout each period)
| | | | | | | | | | | | | | | | | | | | | | | | | | | | |
| Class C | | Six Months Ended September 30, 2011 (Unaudited) | | | Year Ended March 31, 20111 | | | Year Ended October 31, | |
| | | | 20102 | | | 20092 | | | 20082 | | | 20072 | | | 20062 | |
Net asset value, beginning of period | | $ | 17.67 | | | $ | 16.11 | | | $ | 14.09 | | | $ | 13.45 | | | $ | 21.58 | | | $ | 19.74 | | | $ | 18.46 | |
Net investment loss | | | (0.14 | ) 3 | | | (0.09 | ) 3 | | | (0.14 | ) 3 | | | (0.20 | ) 3 | | | (0.25 | ) | | | (0.26 | ) | | | (0.23 | ) |
Net realized and unrealized gains (losses) on investments | | | (1.77 | ) | | | 1.65 | | | | 2.16 | | | | 0.84 | | | | (6.09 | ) | | | 2.71 | | | | 2.64 | |
| | | | | | | | | | | | | | | | | | | | | | | | | | | | |
Total from investment operations | | | (1.91 | ) | | | 1.56 | | | | 2.02 | | | | 0.64 | | | | (6.34 | ) | | | 2.45 | | | | 2.41 | |
Distributions to shareholders from | | | | | | | | | | | | | | | | | | | | | | | | | | | | |
Net realized gains | | | 0.00 | | | | 0.00 | | | | 0.00 | | | | 0.00 | | | | (1.79 | ) | | | (0.61 | ) | | | (1.13 | ) |
Net asset value, end of period | | $ | 15.76 | | | $ | 17.67 | | | $ | 16.11 | | | $ | 14.09 | | | $ | 13.45 | | | $ | 21.58 | | | $ | 19.74 | |
Total return4 | | | (10.81 | )% | | | 9.68 | % | | | 14.34 | % | | | 4.76 | % | | | (31.81 | )% | | | 12.74 | % | | | 13.67 | % |
Ratios to average net assets (annualized) | | | | | | | | | | | | | | | | | | | | | | | | | | | | |
Gross expenses | | | 2.20 | % | | | 2.35 | % | | | 2.52 | % | | | 2.56 | % | | | 2.40 | % | | | 2.35 | % | | | 2.40 | % |
Net expenses | | | 2.20 | % | | | 2.21 | % | | | 2.48 | % | | | 2.56 | % | | | 2.40 | % | | | 2.35 | % | | | 2.39 | % |
Net investment loss | | | (1.54 | )% | | | (1.29 | )% | | | (0.90 | )% | | | (1.56 | )% | | | (1.43 | )% | | | (1.12 | )% | | | (1.33 | )% |
Supplemental data | | | | | | | | | | | | | | | | | | | | | | | | | | | | |
Portfolio turnover rate | | | 32 | % | | | 33 | % | | | 42 | % | | | 49 | % | | | 47 | % | | | 71 | % | | | 41 | % |
Net assets, end of period (000’s omitted) | | | $19,113 | | | | $23,411 | | | | $23,823 | | | | $26,656 | | | | $38,178 | | | | $66,280 | | | | $65,655 | |
| 1. | For the five months ended March 31, 2011. The Fund changed its fiscal year end from October 31 to March 31, effective March 31, 2011. |
| 2. | After the close of business on July 16, 2010, the Fund acquired the net assets of Evergreen Health Care Fund which became the accounting and performance survivor in this transaction. The information for the periods prior to July 19, 2010 is that of Class C of Evergreen Health Care Fund. |
| 3. | Calculated based upon average shares outstanding. |
| 4. | Total return calculations do not include any sales charges. Returns for periods of less than one year are not annualized. |
The accompanying notes are an integral part of these financial statements.
| | | | | | |
| Financial Highlights | | Wells Fargo Advantage Health Care Fund | | | 17 | |
(For a share outstanding throughout each period)
| | | | | | | | | | | | | | | | | | | | | | | | | | | | |
| Administrator Class | | Six Months Ended September 30, 2011 (Unaudited) | | | Year Ended March 31, 20111 | | | Year Ended October 31, | |
| | | | 20102 | | | 20092 | | | 20082 | | | 20072 | | | 20062 | |
Net asset value, beginning of period | | $ | 20.19 | | | $ | 18.33 | | | $ | 15.88 | | | $ | 15.00 | | | $ | 23.64 | | | $ | 21.36 | | | $ | 19.70 | |
Net investment income (loss) | | | (0.06 | )3 | | | (0.03 | )3 | | | 0.01 | 3 | | | (0.08 | )3 | | | (0.08 | )3 | | | (0.02 | )3 | | | (0.07 | )3 |
Net realized and unrealized gains (losses) on investments | | | (2.03 | ) | | | 1.89 | | | | 2.44 | | | | 0.96 | | | | (6.77 | ) | | | 2.91 | | | | 2.86 | |
| | | | | | | | | | | | | | | | | | | | | | | | | | | | |
Total from investment operations | | | (2.09 | ) | | | 1.86 | | | | 2.45 | | | | 0.88 | | | | (6.85 | ) | | | 2.89 | | | | 2.79 | |
Distributions to shareholders from | | | | | | | | | | | | | | | | | | | | | | | | | | | | |
Net realized gains | | | 0.00 | | | | 0.00 | | | | 0.00 | | | | 0.00 | | | | (1.79 | ) | | | (0.61 | ) | | | (1.13 | ) |
Net asset value, end of period | | $ | 18.10 | | | $ | 20.19 | | | $ | 18.33 | | | $ | 15.88 | | | $ | 15.00 | | | $ | 23.64 | | | $ | 21.36 | |
Total return4 | | | (10.35 | )% | | | 10.15 | % | | | 15.43 | % | | | 5.87 | % | | | (31.15 | )% | | | 13.86 | % | | | 14.80 | % |
Ratios to average net assets (annualized) | | | | | | | | | | | | | | | | | | | | | | | | | | | | |
Gross expenses | | | 1.27 | % | | | 1.42 | % | | | 1.54 | % | | | 1.56 | % | | | 1.41 | % | | | 1.35 | % | | | 1.40 | % |
Net expenses | | | 1.23 | % | | | 1.23 | % | | | 1.49 | % | | | 1.56 | % | | | 1.41 | % | | | 1.35 | % | | | 1.39 | % |
Net investment income (loss) | | | (0.57 | )% | | | (0.37 | )% | | | 0.04 | % | | | (0.56 | )% | | | (0.43 | )% | | | (0.11 | )% | | | (0.33 | )% |
Supplemental data | | | | | | | | | | | | | | | | | | | | | | | | | | | | |
Portfolio turnover rate | | | 32 | % | | | 33 | % | | | 42 | % | | | 49 | % | | | 47 | % | | | 71 | % | | | 41 | % |
Net assets, end of period (000’s omitted) | | | $4,220 | | | | $5,817 | | | | $4,090 | | | | $6,057 | | | | $6,466 | | | | $9,535 | | | | $14,210 | |
| 1. | For the five months ended March 31, 2011. The Fund changed its fiscal year end from October 31 to March 31, effective March 31, 2011. |
| 2. | After the close of business on July 16, 2010, the Fund acquired the net assets of Evergreen Health Care Fund which became the accounting and performance survivor in this transaction. The information for the periods prior to July 19, 2010 is that of Class I of Evergreen Health Care Fund. |
| 3. | Calculated based upon average shares outstanding. |
| 4. | Returns for periods of less than one year are not annualized. |
The accompanying notes are an integral part of these financial statements.
| | | | |
| 18 | | Wells Fargo Advantage Health Care Fund | | Notes to Financial Statements (Unaudited) |
1. ORGANIZATION
Wells Fargo Funds Trust (the “Trust”), a Delaware statutory trust organized on March 10, 1999, is an open-end management investment company registered under the Investment Company Act of 1940, as amended (the “1940 Act”). These financial statements report on Wells Fargo Advantage Health Care Fund (the “Fund”) which is a non-diversified series of the Trust.
2. SIGNIFICANT ACCOUNTING POLICIES
The following significant accounting policies, which are consistently followed in the preparation of the financial statements of the Fund, are in conformity with U.S. generally accepted accounting principles which require management to make estimates and assumptions that affect the reported amounts of assets and liabilities, disclosure of contingent assets and liabilities at the date of the financial statements, and the reported amounts of revenues and expenses during the reporting period. Actual results could differ from those estimates.
Securities valuation
Investments in securities are valued each business day as of the close of regular trading on the New York Stock Exchange, which is usually 4:00 p.m. (Eastern Time). Securities which are traded on a national or foreign securities exchange are valued at the last reported sales price, except that securities listed on The Nasdaq Stock Market, Inc. (“Nasdaq”) are valued at the Nasdaq Official Closing Price (“NOCP”), and if no NOCP is available, then at the last reported sales price. If no sales price is shown on the Nasdaq, the bid price will be used. In the absence of any sale of securities listed on the Nasdaq, and in the case of other securities, including U.S. Government obligations, but excluding debt securities maturing in 60 days or less, the price will be deemed “stale” and the valuations will be determined in accordance with the Fund’s Fair Value Procedures.
Securities denominated in foreign currencies are translated into U.S. dollars using the closing rates of exchange in effect on the day of valuation.
Many securities markets and exchanges outside the U.S. close prior to the close of the New York Stock Exchange and therefore may not fully reflect trading or events that occur after the close of the principal exchange in which the foreign investments are traded but before the close of the New York Stock Exchange. If such trading or events are expected to materially affect the value of the investments, then those investments are fair valued following procedures approved by the Board of Trustees. These procedures take into account multiple factors including movements in U.S. securities markets after foreign exchanges close. Depending on market activity, such fair valuations may be frequent. Such fair value pricing may result in NAVs that are higher or lower than NAVs based on the closing price or latest quoted bid price.
Debt securities of sufficient credit quality with original maturities of 60 days or less generally are valued at amortized cost which approximates fair value. The amortized cost method involves valuing a security at its cost, plus accretion of discount or minus amortization of premium over the period until maturity.
Investments in open-end mutual funds and non-registered investment companies are generally valued at net asset value.
Certain investments which are not valued using any of the methods discussed above, are valued at their fair value, as determined by procedures established in good faith and approved by the Board of Trustees.
Foreign currency translation
The accounting records of the Fund are maintained in U.S. dollars. Assets, including investment securities, and liabilities denominated in foreign currency are translated into U.S. dollars at the prevailing rates of exchange at the date of valuation. Purchases and sales of securities, and income and expenses are translated at the prevailing rate of exchange on the respective dates of such transactions. Reported net realized foreign exchange gains or losses arise from sales of foreign currencies, currency gains or losses realized between the trade and settlement dates on securities transactions, and the difference between the amounts of dividends, interest and foreign withholding taxes recorded and the U.S. dollar equivalent of the amounts actually paid or received. Net unrealized foreign exchange gains and losses arise from changes in the fair value of assets and liabilities other than investments in securities resulting in changes in exchange rates.
| | | | | | |
| Notes to Financial Statements (Unaudited) | | Wells Fargo Advantage Health Care Fund | | | 19 | |
The changes in net assets arising from changes in exchange rates and the changes in net assets resulting from changes in market prices of securities are not separately presented. Such changes are recorded with net realized and unrealized gains or losses from investments. Gains and losses from certain foreign currency transactions are treated as ordinary income for U.S. federal income tax purposes.
Security loans
The Fund may lend its securities from time to time in order to earn additional income in the form of fees or interest on securities received as collateral or the investment of any cash received as collateral. The Fund continues to receive interest or dividends on the securities loaned. The Fund receives collateral in the form of cash or securities with a value at least equal to the value of the securities on loan. The value of the loaned securities is determined at the close of each business day and any additional required collateral is delivered to the Fund on the next business day. In the event of default or bankruptcy by the borrower, the Fund could experience delays and costs in recovering the loaned securities or in gaining access to the collateral. In addition, the investment of any cash collateral received may lose all or part of its value. The Fund has the right under the lending agreement to recover the securities from the borrower on demand.
The Fund lends its securities through an unaffiliated securities lending agent. Cash collateral received in connection with its securities lending transactions is invested in Wells Fargo Securities Lending Cash Investments, LLC (the “Cash Collateral Fund”). The Cash Collateral Fund is exempt from registration under Section 3(c)(7) of the 1940 Act and is managed by Wells Fargo Funds Management LLC (“Funds Management”) and is sub-advised by Wells Capital Management Incorporated (“Wells Capital Management”). Funds Management receives an investment advisory fee starting at 0.05% and declining to 0.01% as the average daily net assets of the Cash Collateral Fund increase. All of the fees received by Funds Management are paid to Wells Capital Management for its services as sub-adviser. The Cash Collateral Fund seeks to provide a positive return compared to the daily Fed Funds Open rate by investing in high-quality, U.S. dollar-denominated short-term money market instruments. Cash Collateral Fund investments are fair valued based upon the amortized cost valuation technique. Income earned from investment in the Cash Collateral Fund is included in securities lending income on the Statement of Operations.
Security transactions and income recognition
Securities transactions are recorded on a trade date basis. Realized gains or losses are reported on the basis of identified cost of securities delivered.
Dividend income is recognized on the ex-dividend date, except for certain dividends from foreign securities, which are recorded as soon as the Fund is informed of the ex-dividend date. Dividend income from foreign securities is recorded net of foreign taxes withheld where recovery of such taxes is not assured.
Distributions to shareholders
Distributions to shareholders from net investment income and net realized gains, if any, are recorded on the ex-dividend date. Such distributions are determined in conformity with income tax regulations, which may differ from generally accepted accounting principles.
Federal and other taxes
The Fund intends to continue to qualify as a regulated investment company by distributing substantially all of its investment company taxable income and any net realized capital gains (after reduction for capital loss carryforwards) sufficient to relieve it from all, or substantially all, federal income taxes. Accordingly, no provision for federal income taxes was required.
The Fund’s income and federal excise tax returns and all financial records supporting those returns for the prior three fiscal years are subject to examination by the federal and Delaware revenue authorities.
As of March 31, 2011, the Fund had estimated net capital loss carryforwards, which were available to offset future net realized capital gains, in the amount of $8,451,228 expiring in 2017.
Under the recently enacted Regulated Investment Company Modernization Act of 2010, the Fund will be permitted to carry forward capital losses incurred in taxable years beginning after December 22, 2010 for an unlimited period. However, any
| | | | |
| 20 | | Wells Fargo Advantage Health Care Fund | | Notes to Financial Statements (Unaudited) |
losses incurred during those future taxable years will be required to be utilized prior to the losses incurred in pre-enactment taxable years. As a result of this ordering rule, pre-enactment capital loss carryforwards may be more likely to expire unused. Additionally, post-enactment capital losses that are carried forward will retain their character as either short-term or long-term capital losses rather than being considered all short-term as under previous law.
Class allocations
The separate classes of shares offered by the Fund differ principally in applicable sales charges, distribution, shareholder servicing and administration fees. Shareholders of each class bear certain expenses that pertain to that particular class. All shareholders bear the common expenses of the Fund, earn income from the portfolio, and are allocated unrealized gains and losses pro rata based on the average daily net assets of each class, without distinction between share classes. Dividends are determined separately for each class based on income and expenses allocable to each class. Realized gains and losses are allocated to each class pro rata based upon the net assets of each class on the date realized. Differences in per share dividend rates generally result from the relative weightings of pro rata income and realized gain allocations and from differences in separate class expenses, including distribution, shareholder servicing and administration fees.
3. FAIR VALUATION MEASUREMENTS
Fair value measurements of investments are determined within a framework that has established a fair value hierarchy based upon the various data inputs utilized in determining the value of the Fund’s investments. The three-level hierarchy gives the highest priority to unadjusted quoted prices in active markets for identical assets or liabilities (Level 1) and the lowest priority to unobservable inputs (Level 3). The Fund’s investments are classified within the fair value hierarchy based on the lowest level of input that is significant to the fair value measurement. The inputs are summarized into three broad levels as follows:
| n | | Level 1 – quoted prices in active markets for identical securities |
| n | | Level 2 – other significant observable inputs (including quoted prices for similar securities, interest rates, prepayment speeds, credit risk, etc.) |
| n | | Level 3 – significant unobservable inputs (including the Fund’s own assumptions in determining the fair value of investments) |
The inputs or methodologies used for valuing securities are not necessarily an indication of the risk associated with investing in those securities.
As of September 30, 2011, the inputs used in valuing the Fund’s assets, which are carried at fair value, were as follows:
| | | | | | | | | | | | | | | | |
| Investments in Securities | | Quoted Prices (Level 1) | | | Significant Other
Observable Inputs (Level 2) | | | Significant Unobservable Inputs (Level 3) | | | Total | |
| | | | |
Equity securities | | | | | | | | | | | | | | | | |
Common stocks | | $ | 85,933,040 | | | $ | 0 | | | $ | 0 | | | $ | 85,933,040 | |
Rights | | | 0 | | | | 24,823 | | | | 0 | | | | 24,823 | |
Warrants | | | 0 | | | | 0 | | | | 41,178 | | | | 41,178 | |
| | | | |
Short-term investments | | | | | | | | | | | | | | | | |
Investment companies | | | 3,113,644 | | | | 24,435,695 | | | | 0 | | | | 27,549,339 | |
| | | $ | 89,046,684 | | | $ | 24,460,518 | | | $ | 41,178 | | | $ | 113,548,380 | |
Further details on the major security types listed above can be found in the Fund’s Portfolio of Investments.
Transfers in and transfers out are recognized at the end of the reporting period. For the six months ended September 30, 2011, the Fund did not have any significant transfers into/out of Level 1 and Level 2.
| | | | | | |
| Notes to Financial Statements (Unaudited) | | Wells Fargo Advantage Health Care Fund | | | 21 | |
The following is a reconciliation of assets in which significant unobservable inputs (Level 3) were used in determining fair value:
| | | | |
| | | Warrants | |
Balance as of March 31, 2011 | | $ | 107,696 | |
Accrued discounts (premiums) | | | 0 | |
Realized gains (losses) | | | 0 | |
Change in unrealized gains (losses) | | | (66,518 | ) |
Purchases | | | 0 | |
Sales | | | 0 | |
Transfers into Level 3 | | | 0 | |
Transfers out of Level 3 | | | 0 | |
Balance as of September 30, 2011 | | $ | 41,178 | |
Change in unrealized gains (losses) relating to securities still held at September 30, 2011 | | $ | (66,518 | ) |
4. TRANSACTIONS WITH AFFILIATES AND OTHER EXPENSES
Advisory fee
The Trust has entered into an advisory contract with Funds Management, an indirect wholly owned subsidiary of Wells Fargo & Company (“Wells Fargo”). The adviser is responsible for implementing investment policies and guidelines and for supervising the sub-adviser, who is responsible for day-to-day portfolio management of the Fund.
Pursuant to the contract, Funds Management is entitled to receive an annual advisory fee starting at 0.80% and declining to 0.65% as the average daily net assets of the Fund increase. For the six months ended September 30, 2011, the advisory fee was equivalent to an annual rate of 0.80% of the Fund’s average daily net assets.
Funds Management may retain the services of certain sub-advisers to provide daily portfolio management to the Fund. The fees related to sub-advisory services are borne directly by the adviser and do not increase the overall fees paid by the Fund to the adviser. Wells Capital Management, an affiliate of Funds Management, is the sub-adviser to the Fund and is entitled to receive a fee from the adviser at an annual rate starting at 0.40% and declining to 0.35% as the average daily net assets of the Fund increase.
Administration and transfer agent fees
The Trust has entered into an administration agreement with Funds Management. Under this agreement, for providing administrative services, which includes paying fees and expenses for services provided by the transfer agent, sub-transfer agents, omnibus account servicers and record-keepers, Funds Management is entitled to receive from the Fund an annual fund level administration fee starting at 0.05% and declining to 0.03% as the average daily net assets of the Fund increase and a class level administration fee which is calculated based on the average daily net assets of each class as follows:
| | | | |
| | | Class Level Administration Fee | |
Class A, Class B, Class C | | | 0.26 | % |
Administrator Class | | | 0.10 | |
Funds Management has contractually waived and/or reimbursed advisory and administration fees to the extent necessary to maintain certain net operating expense ratios for the Fund. Waiver of fees and/or reimbursement of expenses by Funds Management were made first from fund level expenses on a proportionate basis and then from class specific expenses.
Distribution fees
The Trust has adopted a Distribution Plan for Class B and Class C shares of the Fund pursuant to Rule 12b-1 under the 1940 Act. Distribution fees are charged to Class B and Class C shares and paid to Wells Fargo Funds Distributor, LLC, the principal underwriter, at an annual rate of 0.75% of the average daily net assets of Class B and Class C shares.
For the six months ended September 30, 2011, Wells Fargo Funds Distributor, LLC received $1,276 from the sale of Class A shares and $35, $6,214 and $177 in contingent deferred sales charges from redemptions of Class A, Class B and Class C shares, respectively.
| | | | |
| 22 | | Wells Fargo Advantage Health Care Fund | | Notes to Financial Statements (Unaudited) |
Shareholder servicing fees
The Trust has entered into contracts with one or more shareholder servicing agents, whereby Class A, Class B, Class C and Administrator Class of the Fund is charged a fee at an annual rate of 0.25% of the average daily net assets of each respective class.
A portion of these total shareholder servicing fees were paid to affiliates of Wells Fargo.
5. INVESTMENT PORTFOLIO TRANSACTIONS
Purchases and sales of investments, excluding U.S. Government obligations (if any) and short-term securities (securities with maturities of one year or less at purchase date), for the six months ended September 30, 2011 were $32,692,181 and $41,390,678, respectively.
6. BANK BORROWINGS
The Trust (excluding the money market funds) and Wells Fargo Variable Trust are parties to a $150,000,000 revolving credit agreement with State Street Bank and Trust Company, whereby the Fund is permitted to use bank borrowings for temporary or emergency purposes, such as to fund shareholder redemption requests. Interest under the credit agreement is charged to the Fund based on a borrowing rate equal to the higher of the Federal Funds rate in effect on that day plus 1.25% or the overnight LIBOR rate in effect on that day plus 1.25%. In addition, under the credit agreement, the Fund pays an annual commitment fee equal to 0.10% of the unused balance, which is allocated pro rata. Prior to September 6, 2011, the revolving credit agreement was for $125,000,000 and the annual commitment fee paid by the Fund was 0.125% of the unused balance. For the six months ended September 30, 2011, the Fund paid $105 in commitment fees.
For the six months ended September 30, 2011, there were no borrowings by the Fund under the agreement.
7. CONCENTRATION RISK
The Fund invests a substantial portion of its assets in the health care sector and, therefore, may be more affected by changes in that sector than would be a comparable mutual fund whose investments are not heavily weighted in any sector.
8. INDEMNIFICATION
Under the Trust’s organizational documents, the officers and directors are indemnified against certain liabilities that may arise out of performance of their duties to the Trust. Additionally, in the normal course of business, the Trust may enter into contracts with service providers that contain a variety of indemnification clauses. The Trust’s maximum exposure under these arrangements is dependent on future claims that may be made against the Fund and, therefore, cannot be estimated.
9. NEW ACCOUNTING PRONOUNCEMENTS
In May 2011, the Financial Accounting Standards Board (“FASB”) issued Accounting Standards Update (“ASU”) No. 2011-04 “Amendments to Achieve Common Fair Value Measurement and Disclosure Requirements in U.S. GAAP and IFRSs”. ASU No. 2011-04 amends FASB ASC Topic 820, Fair Value Measurements and Disclosures, to establish common requirements for measuring fair value and for disclosing information about fair value measurements in accordance with GAAP. The ASU is effective prospectively for interim and annual periods beginning after December 15, 2011.
In April 2011, FASB issued ASU No. 2011-03 “Reconsideration of Effective Control for Repurchase Agreements”. ASU No. 2011-03 amends FASB ASC Topic 860, Transfers and Servicing, specifically the criteria required to determine whether a repurchase agreement (repo) and similar agreements should be accounted for as sales of financial assets or secured borrowings with commitments. ASU No. 2011-03 changes the assessment of effective control by focusing on the transferor’s contractual rights and obligations and removing the criterion to assess its ability to exercise those rights or honor those obligations. This could result in changes to the way entities account for certain transactions including repurchase agreements, mortgage dollar rolls and reverse repurchase agreements. The ASU will become effective on a prospective basis for new transfers and modifications to existing transactions as of the beginning of the first interim or annual period beginning on or after December 15, 2011.
As of September 30, 2011, management of the Fund is currently assessing the potential impact, in addition to expanded financial statement disclosure, that may result from adopting these ASUs.
| | | | | | |
| Other Information (Unaudited) | | Wells Fargo Advantage Health Care Fund | | | 23 | |
PROXY VOTING INFORMATION
A description of the policies and procedures that the Fund uses to determine how to vote proxies relating to portfolio securities is available without charge, upon request, by calling 1-800-222-8222, visiting our Web site at www.wellsfargo.com/advantagefunds, or visiting the SEC Web site at www.sec.gov. Information regarding how the Fund voted proxies relating to portfolio securities during the most recent 12-month period ended June 30 is available without charge on the Fund’s Web site at www.wellsfargo.com/advantagefunds or by visiting the SEC Web site at www.sec.gov.
PORTFOLIO HOLDINGS INFORMATION
The complete portfolio holdings for the Fund are publicly available on the Fund’s Web site (www.wellsfargo.com/advantagefunds) on a monthly, 30-day or more delayed basis. In addition, top ten holdings information for the Fund is publicly available on the Fund’s Web site on a monthly, seven-day or more delayed basis. The Fund files its complete schedule of portfolio holdings with the SEC for the first and third quarters of each fiscal year on Form N-Q, which is available without charge by visiting the SEC Web site at www.sec.gov. In addition, the Fund’s Form N-Q may be reviewed and copied at the SEC’s Public Reference Room in Washington, DC, and at regional offices in New York City, at 233 Broadway, and in Chicago, at 175 West Jackson Boulevard, Suite 900. Information about the Public Reference Room may be obtained by calling 1-800-SEC-0330.
| | | | |
| 24 | | Wells Fargo Advantage Health Care Fund | | Other Information (Unaudited) |
BOARD OF TRUSTEES
The following table provides basic information about the Board of Trustees (the “Trustees”) of the Trust and Officers of the Trust. This table should be read in conjunction with the Prospectus and the Statement of Additional Information1 of the Fund. Each of the Trustees and Officers listed below acts in identical capacities for the Wells Fargo Advantage family of funds, which consists of 144 funds comprising the Wells Fargo Funds Trust, Wells Fargo Variable Trust, Wells Fargo Master Trust and four closed-end funds (collectively the “Fund Complex”). All of the Trustees are also Members of the Audit and Governance Committees of each Trust in the Fund Complex. The mailing address of each Trustee and Officer is 525 Market Street, 12th Floor, San Francisco, CA 94105. Each Trustee and Officer serves an indefinite term, however, each Trustee serves such term until reaching the mandatory retirement age established by the Trustees.
Independent Trustees
| | | | | | |
Name and Year of Birth | | Position Held and Length of Service | | Principal Occupations During Past Five Years | | Other Directorships During
Past Five Years |
Peter G. Gordon
(Born 1942) | | Trustee, since 1998; Chairman, since 2005 | | Co-Founder, Chairman, President and CEO of Crystal Geyser. Water Company. Trustee Emeritus, Colby College | | Asset Allocation Trust |
Isaiah Harris, Jr.
(Born 1952) | | Trustee, since 2009 | | Retired. Prior thereto, President and CEO of BellSouth Advertising and Publishing Corp. from 2005 to 2007, President and CEO of BellSouth Enterprises from 2004 to 2005 and President of BellSouth Consumer Services from 2000 to 2003. Emeritus member of the Iowa State University Foundation Board of Governors. Emeritus Member of the Advisory Board of Iowa State University School of Business. Mr. Harris is a certified public accountant. | | CIGNA Corporation; Deluxe Corporation; Asset Allocation Trust |
Judith M. Johnson
(Born 1949) | | Trustee, since 2008 | | Retired. Prior thereto, Chief Executive Officer and Chief Investment Officer of Minneapolis Employees Retirement Fund from 1996 to 2008. Ms. Johnson is an attorney, certified public accountant and a certified managerial accountant. | | Asset Allocation Trust |
Leroy Keith, Jr.
(Born 1939) | | Trustee, since 2010 | | Chairman, Bloc Global Services (development and construction), Trustee of the Evergreen Funds from 1983 to 2010. Former Managing Director, Almanac Capital Management (commodities firm), former Partner, Stonington Partners, Inc. (private equity fund), former Director, Obagi Medical Products Co. and former Director, Lincoln Educational Services. | | Trustee, Virtus Fund Complex (consisting of 45 portfolios as of 12/31/10); Director, Diversapack Co. (packaging company); Asset Allocation Trust |
David F. Larcker
(Born 1950) | | Trustee, since 2009 | | James Irvin Miller Professor of Accounting at the Graduate School of Business, Stanford University, Director of Corporate Governance Research Program and Co-Director of The Rock Center for Corporate Governance since 2006. From 2005 to 2008, Professor of Accounting at the Graduate School of Business, Stanford University. Prior thereto, Ernst & Young Professor of Accounting at The Wharton School, University of Pennsylvania from 1985 to 2005. | | Asset Allocation Trust |
Olivia S. Mitchell
(Born 1953) | | Trustee, since 2006 | | International Foundation of Employee Benefit Plans Professor, Wharton School of the University of Pennsylvania since 1993. Director of Wharton’s Pension Research Council and Boettner Center on Pensions & Retirement Research, and Research Associate at the National Bureau of Economic Research. Previously, Cornell University Professor from 1978 to 1993. | | Asset Allocation Trust |
| | | | | | |
| Other Information (Unaudited) | | Wells Fargo Advantage Health Care Fund | | | 25 | |
| | | | | | |
Name and Year of Birth | | Position Held and Length of Service | | Principal Occupations During Past Five Years | | Other Directorships During
Past Five Years |
Timothy J. Penny
(Born 1951) | | Trustee, since 1996 | | President and CEO of Southern Minnesota Initiative Foundation, a non-profit organization, since 2007 and Senior Fellow at the Humphrey Institute Policy Forum at the University of Minnesota since 1995. Member of the Board of Trustees of NorthStar Education Finance, Inc., a non-profit organization, since 2007. | | Asset Allocation Trust |
Michael S. Scofield
(Born 1943) | | Trustee, since 2010 | | Served on the Investment Company Institute’s Board of Governors and Executive Committee from 2008-2011 as well the Governing Council of the Independent Directors Council from 2006-2011 and the Independent Directors Council Executive Committee from 2008-2011. Chairman of the IDC from 2008-2010. Institutional Investor (Fund Directions) Trustee of Year in 2007. Trustee of the Evergreen Funds (and its predecessors) from 1984 to 2010. Chairman of the Evergreen Funds from 2000-2010. Former Trustee of the Mentor Funds. Retired Attorney, Law Offices of Michael S. Scofield and former Director and Chairman, Branded Media Corporation (multi-media branding company). | | Asset Allocation Trust |
Donald C. Willeke
(Born 1940) | | Trustee, since 1996 | | Principal of the law firm of Willeke & Daniels. General Counsel of the Minneapolis Employees Retirement Fund from 1984 until its consolidation into the Minnesota Public Employees Retirement Association on June 30, 2010. | | Asset Allocation Trust |
Officers
| | | | | | |
Name and Year of Birth | | Position Held and
Length of Service | | Principal Occupations During Past Five Years | | |
Karla M. Rabusch
(Born 1959) | | President, since 2003 | | Executive Vice President of Wells Fargo Bank, N.A. and President of Wells Fargo Funds Management, LLC since 2003. Senior Vice President and Chief Administrative Officer of Wells Fargo Funds Management, LLC from 2001 to 2003. | | |
C. David Messman
(Born 1960) | | Secretary, since 2000; Chief Legal Counsel, since 2003 | | Senior Vice President and Secretary of Wells Fargo Funds Management, LLC since 2001. Vice President and Managing Counsel of Wells Fargo Bank, N.A. since 1996. | | |
Kasey Phillips
(Born 1970) | | Treasurer, since 2008 | | Senior Vice President of Wells Fargo Funds Management, LLC since 2009. Senior Vice President of Evergreen Investment Management Company, LLC from 2006 to 2010. Treasurer of the Evergreen Funds from 2005 to 2010. Vice President and Assistant Vice President of Evergreen Investment Services, Inc. from 1999 to 2006. | | |
David Berardi
(Born 1975) | | Assistant Treasurer, since 2009 | | Vice President of Wells Fargo Funds Management, LLC since 2009 . Vice President of Evergreen Investment Management Company, LLC from 2008 to 2010. Assistant Vice President of Evergreen Investment Services, Inc. from 2004 to 2008. Manager of Fund Reporting and Control for Evergreen Investment Management Company, LLC from 2004 to 2010. | | |
Jeremy DePalma
(Born 1974) | | Assistant Treasurer, since 2009 | | Senior Vice President of Wells Fargo Funds Management, LLC since 2009. Senior Vice President of Evergreen Investment Management Company, LLC from 2008 to 2010. Vice President, Evergreen Investment Services, Inc. from 2004 to 2007. Assistant Vice President, Evergreen Investment Services, Inc. from 2000 to 2004 and the head of the Fund Reporting and Control Team within Fund Administration from 2005 to 2010. | | |
Debra Ann Early
(Born 1964) | | Chief Compliance Officer, since 2007 | | Chief Compliance Officer of Wells Fargo Funds Management, LLC since 2007. Chief Compliance Officer of Parnassus Investments from 2005 to 2007. Chief Financial Officer of Parnassus Investments from 2004 to 2007 and Senior Audit Manager of PricewaterhouseCoopers LLP from 1998 to 2004. | | |
| 1. | The Statement of Additional Information includes additional information about the Fund’s Trustees and is available, without charge, upon request, by calling 1-800-222-8222 or by visiting the Fund’s Web site at www.wellsfargo.com/advantagefunds. |
| | | | |
| 26 | | Wells Fargo Advantage Health Care Fund | | List of Abbreviations |
The following is a list of common abbreviations for terms and entities which may have appeared in this report.
| ACB | — Agricultural Credit Bank |
| ADR | — American Depository Receipt |
| ADS | — American Depository Shares |
| AGC-ICC | — Assured Guaranty Corporation - Insured Custody Certificates |
| AGM | — Assured Guaranty Municipal |
| AMBAC | — American Municipal Bond Assurance Corporation |
| AMT | — Alternative Minimum Tax |
| BAN | — Bond Anticipation Notes |
| BHAC | — Berkshire Hathaway Assurance Corporation |
| CAB | — Capital Appreciation Bond |
| CCAB | — Convertible Capital Appreciation Bond |
| CDA | — Community Development Authority |
| CDO | — Collateralized Debt Obligation |
| COP | — Certificate of Participation |
| DRIVER | — Derivative Inverse Tax-Exempt Receipts |
| DW&P | — Department of Water & Power |
| DWR | — Department of Water Resources |
| ECFA | — Educational & Cultural Facilities Authority |
| EDA | — Economic Development Authority |
| EDFA | — Economic Development Finance Authority |
| ETF | — Exchange-Traded Fund |
| FFCB | — Federal Farm Credit Bank |
| FGIC | — Financial Guaranty Insurance Corporation |
| FHA | — Federal Housing Authority |
| FHLB | — Federal Home Loan Bank |
| FHLMC | — Federal Home Loan Mortgage Corporation |
| FNMA | — Federal National Mortgage Association |
| GDR | — Global Depository Receipt |
| GNMA | — Government National Mortgage Association |
| HCFR | — Healthcare Facilities Revenue |
| HEFA | — Health & Educational Facilities Authority |
| HEFAR | — Higher Education Facilities Authority Revenue |
| HFA | — Housing Finance Authority |
| HFFA | — Health Facilities Financing Authority |
| IBC | — Insured Bond Certificate |
| IDA | — Industrial Development Authority |
| IDAG | — Industrial Development Agency |
| IDR | — Industrial Development Revenue |
| KRW | — Republic of Korea Won |
| LIBOR | — London Interbank Offered Rate |
| LLC | — Limited Liability Company |
| LLP | — Limited Liability Partnership |
| MBIA | — Municipal Bond Insurance Association |
| MFHR | — Multi-Family Housing Revenue |
| MUD | — Municipal Utility District |
| NATL-RE | — National Public Finance Guarantee Corporation |
| PCFA | — Pollution Control Finance Authority |
| PCR | — Pollution Control Revenue |
| PFA | — Public Finance Authority |
| PFFA | — Public Facilities Financing Authority |
| PFOTER | — Puttable Floating Option Tax-Exempt Receipts |
| plc | — Public Limited Company |
| PUTTER | — Puttable Tax-Exempt Receipts |
| R&D | — Research & Development |
| RDA | — Redevelopment Authority |
| RDFA | — Redevelopment Finance Authority |
| REIT | — Real Estate Investment Trust |
| ROC | — Reset Option Certificates |
| SAVRS | — Select Auction Variable Rate Securities |
| SBA | — Small Business Authority |
| SFHR | — Single Family Housing Revenue |
| SFMR | — Single Family Mortgage Revenue |
| SPDR | — Standard & Poor’s Depositary Receipts |
| TAN | — Tax Anticipation Notes |
| TIPS | — Treasury Inflation-Protected Securities |
| TRAN | — Tax Revenue Anticipation Notes |
| TCR | — Transferable Custody Receipts |
| TTFA | — Transportation Trust Fund Authority |
| TVA | — Tennessee Valley Authority |
| XLCA | — XL Capital Assurance |


FOR MORE INFORMATION
More information about Wells Fargo Advantage Funds is available free upon request. To obtain literature, please write, e-mail, visit the Fund’s Web site, or call:
Wells Fargo Advantage Funds
P.O. Box 8266
Boston, MA 02266-8266
E-mail: wfaf@wellsfargo.com
Web site: www.wellsfargo.com/advantagefunds
Individual investors: 1-800-222-8222
Retail investment professionals: 1-888-877-9275
Institutional investment professionals: 1-866-765-0778
This report and the financial statements contained herein are submitted for the general information of the shareholders of Wells Fargo Advantage Funds. If this report is used for promotional purposes, distribution of the report must be accompanied or preceded by a current prospectus. For a prospectus containing more complete information, including charges and expenses, call 1-800-222-8222 or visit the Fund’s Web site at www.wellsfargo.com/advantagefunds. Please consider the investment objectives, risks, charges, and expenses of the investment carefully before investing. This and other information about Wells Fargo Advantage Funds can be found in the current prospectus. Read the prospectus carefully before you invest or send money.
Wells Fargo Funds Management, LLC, a wholly owned subsidiary of Wells Fargo & Company, provides investment advisory and administrative services for Wells Fargo Advantage Funds. Other affiliates of Wells Fargo & Company provide subadvisory and other services for the Funds. The Funds are distributed by Wells Fargo Funds Distributor, LLC, Member FINRA/SIPC, an affiliate of Wells Fargo & Company.
NOT FDIC INSURED ¡ NO BANK GUARANTEE ¡ MAY LOSE VALUE
© 2011 Wells Fargo Funds Management, LLC. All rights reserved.
| | |
 | | 205632 11-11 SA315/SAR315 9-11 |

Wells Fargo Advantage Precious Metals Fund

Semi-Annual Report
September 30, 2011


WELLS FARGO INVESTMENT HISTORY
| | |
| |
| 1932 | | Keystone creates one of the first mutual fund families. |
| |
| 1971 | | Wells Fargo & Company introduces one of the first institutional index funds. |
| |
| 1978 | | Wells Fargo applies Markowitz and Sharpe’s research on Modern Portfolio Theory to introduce one of the industry’s first Tactical Asset Allocation (TAA) models in institutional separately managed accounts. |
| |
| 1984 | | Wells Fargo Stagecoach Funds launches its first asset allocation fund. |
| |
| 1989 | | The Tactical Asset Allocation (TAA) Model is first applied to Wells Fargo’s asset allocation mutual funds. |
| |
| 1994 | | Wells Fargo introduces the LifePath Funds, one of the first suites of target date funds (now the Wells Fargo Advantage Dow Jones Target Date FundsSM ). |
| |
| 1996 | | Evergreen Investments and Keystone Funds merge. |
| |
| 1997 | | Wells Fargo launches Wells Fargo Advantage WealthBuilder PortfoliosSM, a fund-of-funds suite of products that includes the use of quantitative models to shift assets among investment styles. |
| |
| 1999 | | Norwest Advantage Funds and Stagecoach Funds are reorganized into Wells Fargo Funds after the merger of Norwest and Wells Fargo. |
| |
| 2002 | | Evergreen Retail and Evergreen Institutional companies form the umbrella asset management company, Evergreen Investments. |
| |
| 2005 | | The integration of Strong Funds with Wells Fargo Funds creates Wells Fargo Advantage Funds, resulting in one of the top 20 mutual fund companies in the United States. |
| |
| 2006 | | Wells Fargo Advantage Funds relaunches the target date product line as Wells Fargo Advantage Dow Jones Target Date Funds. |
| |
| 2010 | | The mergers and reorganizations of Evergreen and Wells Fargo Advantage mutual funds are completed, unifying the families under the brand of Wells Fargo Advantage Funds. |
Wells Fargo Advantage Funds®
Wells Fargo Advantage Funds skillfully guides institutions, financial advisors, and individuals through the investment terrain to help them reach their financial objectives. Everything we do on behalf of investors is backed by our unique combination of qualifications.
Strength
Our organization is built on the standards of integrity and service established by our parent company—Wells Fargo & Company—more than 150 years ago. And, because we’re part of a highly diversified financial enterprise, we offer the depth of resources to help investors succeed.
Expertise
Our multi-boutique model offers investors access to the independent thinking of premier investment managers that have been chosen for their time-tested strategies. While each team specializes in a specific investment strategy, collectively they provide investors a wide choice of distinct investment styles. Our dedication to investment excellence doesn’t end with our expertise in manager selection—risk management, analysis, and rigorous ongoing review seek to ensure each manager’s investment process remains consistent.
Partnership
Our collaborative approach is built around understanding the needs and goals of our clients. By adhering to core principles of sound judgment and steady guidance, we support you through every stage of the investment decision process.
Carefully consider the investment objectives, risks, charges, and expenses before investing. For a current prospectus for Wells Fargo Advantage Funds containing this and other information, visit wellsfargo.com/advantagefunds. Read it carefully before investing.
Wells Fargo Funds Management, LLC, a wholly owned subsidiary of Wells Fargo & Company, provides investment advisory and administrative services for Wells Fargo Advantage Funds®. Other affiliates of Wells Fargo & Company provide subadvisory and other services for the Funds. The Funds are distributed by Wells Fargo Funds Distributor, LLC, Member FINRA/SIPC, an affiliate of Wells Fargo & Company.
The “Dow Jones Target Date Indexes” are a product of Dow Jones Indexes, a licensed trademark of CME Group Index Services LLC (“CME”). “Dow Jones” and “Dow Jones Target Date Indexes” are service marks of Dow Jones Trademark Holdings, LLC, and have been licensed for use for certain purposes by CME and sublicensed for use by Global Index Advisors, Inc., and Wells Fargo Funds Management, LLC. The Dow Jones Target Date Indexes are based in part on the Barclays Capital Bond Indexes, which are published by Barclays Capital Inc. The Wells Fargo Advantage Dow Jones Target Date Funds, based on the Dow Jones Target Date Indexes, are not sponsored, endorsed, sold, or promoted by Dow Jones, CME or Barclays Capital or any of their respective affiliates, and neither Dow Jones, CME nor Barclays Capital nor any of their respective affiliates makes any representation regarding the advisability of investing in such product(s) and/or about the quality, accuracy, and/or completeness of the Dow Jones Target Date Indexes or the Barclays Capital Bond Indexes. IN NO EVENT SHALL DOW JONES, CME, BARCLAYS CAPITAL, OR ANY OF THEIR LICENSORS HAVE ANY LIABILITY IN CONNECTION WITH THE Wells Fargo Advantage Dow Jones Target Date Funds INCLUDING, WITHOUT LIMITATION, FOR ANY SPECIAL, PUNITIVE, IN DIRECT, OR CONSEQUENTIAL DAMAGES (INCLUDING LOST PROFITS), EVEN IF NOTIFIED OF THE POSSIBILITY OF SUCH DAMAGES.
NOT FDIC INSURED ¡ NO BANK GUARANTEE ¡ MAY LOSE VALUE
Not part of the semi-annual report.
Wells Fargo Advantage Funds offers more than 110 mutual funds across a wide range of asset classes, representing over $213 billion in assets under management, as of September 30, 2011.
| | | | |
| Equity Funds | | | | |
Asia Pacific Fund | | Global Opportunities Fund | | Premier Large Company Growth Fund |
C&B Large Cap Value Fund | | Growth Fund | | Small Cap Opportunities Fund |
C&B Mid Cap Value Fund | | Health Care Fund | | Small Cap Value Fund |
Capital Growth Fund | | Index Fund | | Small Company Growth Fund |
Common Stock Fund | | International Equity Fund | | Small Company Value Fund |
Disciplined U.S. Core Fund | | International Value Fund | | Small/Mid Cap Core Fund |
Discovery Fund† | | Intrinsic Small Cap Value Fund | | Small/Mid Cap Value Fund |
Diversified Equity Fund | | Intrinsic Value Fund | | Social Sustainability Fund† |
Diversified International Fund | | Intrinsic World Equity Fund | | Special Mid Cap Value Fund |
Diversified Small Cap Fund | | Large Cap Core Fund | | Special Small Cap Value Fund |
Emerging Growth Fund | | Large Cap Growth Fund | | Specialized Technology Fund |
Emerging Markets Equity Fund | | Large Company Value Fund | | Strategic Large Cap Growth Fund |
Endeavor Select Fund† | | Omega Growth Fund | | Traditional Small Cap Growth Fund |
Enterprise Fund† | | Opportunity Fund† | | Utility and Telecommunications Fund |
Equity Value Fund | | Precious Metals Fund | | |
| Bond Funds | | | | |
Adjustable Rate Government Fund | | Inflation-Protected Bond Fund | | Short-Term Bond Fund |
California Limited-Term Tax-Free Fund | | Intermediate Tax/AMT-Free Fund | | Short-Term High Yield Bond Fund |
California Tax-Free Fund | | International Bond Fund | | Short-Term Municipal Bond Fund |
Colorado Tax-Free Fund | | Minnesota Tax-Free Fund | | Strategic Municipal Bond Fund |
Government Securities Fund | | Municipal Bond Fund | | Total Return Bond Fund |
High Income Fund | | North Carolina Tax-Free Fund | | Ultra Short-Term Income Fund |
High Yield Bond Fund | | Pennsylvania Tax-Free Fund | | Ultra Short-Term Municipal Income Fund |
Income Plus Fund | | Short Duration Government Bond Fund | | Wisconsin Tax-Free Fund |
| Asset Allocation Funds | | | | |
Asset Allocation Fund | | WealthBuilder Equity Portfolio† | | Target 2020 Fund† |
Conservative Allocation Fund | | WealthBuilder Growth Allocation Portfolio† | | Target 2025 Fund† |
Diversified Capital Builder Fund | | WealthBuilder Growth Balanced Portfolio† | | Target 2030 Fund† |
Diversified Income Builder Fund | | WealthBuilder Moderate Balanced Portfolio† | | Target 2035 Fund† |
Growth Balanced Fund | | WealthBuilder Tactical Equity Portfolio† | | Target 2040 Fund† |
Index Asset Allocation Fund | | Target Today Fund† | | Target 2045 Fund† |
Moderate Balanced Fund | | Target 2010 Fund† | | Target 2050 Fund† |
WealthBuilder Conservative Allocation Portfolio† | | Target 2015 Fund† | | Target 2055 Fund† |
| Money Market Funds | | | | |
100% Treasury Money Market Fund | | Minnesota Money Market Fund | | New Jersey Municipal Money Market Fund |
California Municipal Money Market Fund | | Money Market Fund | | New York Municipal Money Market Fund |
Cash Investment Money Market Fund | | Municipal Cash Management Money Market Fund | | Pennsylvania Municipal Money Market Fund |
Government Money Market Fund | | Municipal Money Market Fund | | Prime Investment Money Market Fund |
Heritage Money Market Fund† | | National Tax-Free Money Market Fund | | Treasury Plus Money Market Fund |
| Variable Trust Funds1 | | | | |
VT Discovery Fund† | | VT Intrinsic Value Fund | | VT Small Cap Growth Fund |
VT Index Asset Allocation Fund | | VT Omega Growth Fund | | VT Small Cap Value Fund |
VT International Equity Fund | | VT Opportunity Fund† | | VT Total Return Bond Fund |
An investment in a money market fund is not insured or guaranteed by the Federal Deposit Insurance Corporation or any other government agency. Although the Wells Fargo Advantage Money Market Funds seek to preserve the value of your investment at $1.00 per share, it is possible to lose money by investing in a money market fund.
| 1. | The Variable Trust Funds are generally available only through insurance company variable contracts. |
| † | In this report, the Wells Fargo Advantage Discovery FundSM, Wells Fargo Advantage Endeavor Select FundSM, Wells Fargo Advantage Enterprise FundSM, Wells Fargo Advantage Opportunity FundSM, Wells Fargo Advantage Social Sustainability FundSM, Wells Fargo Advantage WealthBuilder Conservative Allocation PortfolioSM, Wells Fargo Advantage WealthBuilder Equity PortfolioSM, Wells Fargo Advantage WealthBuilder Growth Allocation PortfolioSM, Wells Fargo Advantage WealthBuilder Growth Balanced PortfolioSM, Wells Fargo Advantage WealthBuilder Moderate Balanced PortfolioSM, Wells Fargo Advantage WealthBuilder Tactical Equity PortfolioSM, Wells Fargo Advantage Dow Jones Target Today FundSM, Wells Fargo Advantage Dow Jones Target 2010 FundSM, Wells Fargo Advantage Dow Jones Target 2015 FundSM, Wells Fargo Advantage Dow Jones Target 2020 FundSM, Wells Fargo Advantage Dow Jones Target 2025 FundSM, Wells Fargo Advantage Dow Jones Target 2030 FundSM, Wells Fargo Advantage Dow Jones Target 2035 FundSM, Wells Fargo Advantage Dow Jones Target 2040 FundSM, Wells Fargo Advantage Dow Jones Target 2045 FundSM, Wells Fargo Advantage Dow Jones Target 2050 FundSM, Wells Fargo Advantage Dow Jones Target 2055 FundSM, Wells Fargo Advantage Heritage Money Market FundSM, Wells Fargo Advantage VT Discovery FundSM, and Wells Fargo Advantage VT Opportunity FundSM are referred to as the Discovery Fund, Endeavor Select Fund, Enterprise Fund, Opportunity Fund, Social Sustainability Fund, WealthBuilder Conservative Allocation Portfolio, WealthBuilder Equity Portfolio, WealthBuilder Growth Allocation Portfolio, WealthBuilder Growth Balanced Portfolio, WealthBuilder Moderate Balanced Portfolio, WealthBuilder Tactical Equity Portfolio, Target Today Fund, Target 2010 Fund, Target 2015 Fund, Target 2020 Fund, Target 2025 Fund, Target 2030 Fund, Target 2035 Fund, Target 2040 Fund, Target 2045 Fund, Target 2050 Fund, Target 2055 Fund, Heritage Money Market Fund, VT Discovery Fund, and VT Opportunity Fund, respectively. |
Not part of the semi-annual report.
| | | | |
| 2 | | Wells Fargo Advantage Precious Metals Fund | | Letter to Shareholders |

Karla M. Rabusch,
President
Wells Fargo Advantage Funds
All major areas of the global stock market ended with losses, with most of the decline occurring in the second half of the period.
Dear Valued Shareholder,
We’re pleased to offer you this semi-annual report for the Wells Fargo Advantage Precious Metals Fund for the six-month period that ended September 30, 2011. Upon reviewing the report, you may notice a few changes from past reports, the most significant of which is the change from a multi-fund report to a single-fund report. We believe this change will give you more convenient access to your fund data.
The period was marked by growing pessimism about the economy and, consequently, increased market volatility as a variety of macroeconomic events—including the ongoing European sovereign debt crisis and the downgrade of the U.S. credit rating by Standard & Poor’s—caused investors to question the strength of the economic recovery. All major areas of the global stock market ended with losses, with most of the decline occurring in the second half of the period.
Market sentiment darkened as economic numbers weakened.
Prior to the period, economic numbers seemed to support the view of a gradual global economic recovery. However, growth in gross domestic product (GDP) for the first quarter of 2011 was initially reported at 1.8% but was later revised significantly downward to 0.4%. The amount of the downward revision not only reawakened fears that the economy was slowing, but also caused investors to put less of an emphasis on the 1.3% estimate for second-quarter GDP growth. The prolonged debate in the summer of 2011 over increasing the U.S. debt ceiling, which raised the possibility of the country defaulting on its debt, further weakened investor sentiment. Although the debate was resolved in time to prevent a default, Standard & Poor’s later cited the country’s dysfunctional political climate as one reason why it lowered the U.S. credit rating to AA+ from AAA1.
Persistent weakness in jobs and housing slowed economic growth.
The unemployment rate remained stubbornly high throughout the six-month period, beginning the period at 9.0% in April 2011 and ending the period modestly higher at 9.1% in September 2011. Widespread frustration over the continued weakness in the labor market was one factor behind the “Occupy Wall Street” protest movement that began in September 2011. Persistent weakness in the housing market remained another source of concern. By September, some market analysts were openly discussing the possibility of a return to recession; even those analysts who forecasted a continued recovery believed that it would occur only gradually. The end result was a U.S. stock market that weakened in June and recovered in July, then fell sharply in August and September to end the period with significant losses.
Europe’s sovereign debt problems continued to weigh on confidence.
The ongoing drama of the European sovereign debt crisis returned to center stage, as it became increasingly likely that eurozone member Greece would default on its sovereign debt, despite receiving aid from the European Union and the International Monetary Fund. Because many eurozone banks owned Greek
| 1. | The ratings indicated are from Standard & Poor’s. Credit quality ratings apply to underlying holdings of the fund and not the fund itself. Standard and Poor’s rates the creditworthiness of bonds, ranging from AAA (highest) to D (lowest). Ratings from A to CCC may be modified by the addition of a plus (+) or minus (-) sign to show relative standing within the rating categories. |
| | | | | | |
| Letter to Shareholders | | Wells Fargo Advantage Precious Metals Fund | | | 3 | |
debt, and many U.S. banks had financial ties to eurozone banks, investors worried about the effect of such an event on the global economy and financial system. Meanwhile, market participants increasingly worried about the debt burdens of Italy—which also had its credit rating downgraded by Standard & Poor’s—and later of France. Although France maintained its AAA rating as of the end of the period, French banks were heavily exposed to weaker sovereign credits, leading to fears of a state bailout and a resulting increase in France’s required expenditures. Partly because of the debt worries, European stock markets generally ended the period with losses.
Central banks continued to provide stimulus.
Throughout the reporting period, the Federal Open Market Committee kept its key interest rates at effectively zero in order to support the financial system. As previously planned, the Federal Reserve (Fed) ended its second round of quantitative easing (QE2)—in which it purchased a total of $600 billion in long-term U.S. Treasuries from November 2010 through June 2011—as well as reinvested an additional $250 billion to $300 billion in Treasuries with the proceeds from earlier investments. However, in response to extreme market volatility and signs of a weakening economy, in early August 2011, the Fed announced its intention to keep interest rates low until 2013. In September, the Fed implemented a program to sell $400 billion in short-term Treasuries in exchange for longer-term bonds—so-called “Operation Twist”—with the goal of pushing down long-term yields.
At the beginning of the period, the European Central Bank (ECB) had a key rate of 1.00%, but it raised it to 1.25% in April and then to 1.50% in July in an attempt to keep inflation in check. The ECB continued to provide unlimited liquidity for banks and, in August, after a sell-off in the sovereign bonds of Spain and Italy, announced plans to purchase the debt of those countries.
Global stock markets sold off during the period.
Stocks began the period rallying on hopes of a continued economic recovery, only to sell off sharply in late summer. For the period, economically sensitive stocks generally posted the deepest losses. As a result, the stocks of smaller companies—which generally have lesser access to capital and less diversified revenue streams than larger companies—performed the worst. The weaker economy also renewed concerns about potential loan losses at banks and other financial institutions. Among both large caps and small caps, growth stocks posted narrower losses than value stocks, largely because of weakness in financials (which are typically considered part of the value space). More defensive sectors such as health care and utilities generally outperformed. In addition, a rally in gold helped gold-related stocks post better returns than the broader market.
Many variables are at work in the market.
The full effect of the credit crisis remains unknown. Elevated unemployment and debt defaults continue to pressure consumers and businesses alike.
In this environment, experience tells us that strict adherence to time-tested strategies has its rewards. Wells Fargo Advantage Funds represents investments across a range of asset classes and investment styles, giving you an opportunity to create a diversified investment portfolio. While diversification may not prevent losses in a downturn, it does provide you with one way of managing risk.
Stocks began the period rallying on hopes of a continued economic recovery, only to sell off sharply in late summer.
| | | | |
| 4 | | Wells Fargo Advantage Precious Metals Fund | | Letter to Shareholders |
Thank you for choosing to invest with Wells Fargo Advantage Funds. We appreciate your confidence in us and remain committed to helping you meet your financial needs. For current information about your fund investments, contact your investment professional, visit our website at www.wellsfargo.com/advantagefunds, or call us directly at 1-800-222-8222. We are available 24 hours a day, 7 days a week.
Sincerely,

Karla M. Rabusch
President
Wells Fargo Advantage Funds
| | | | | | |
| Performance Highlights (Unaudited) | | Wells Fargo Advantage Precious Metals Fund | | | 5 | |
INVESTMENT OBJECTIVE
The Fund seeks long-term capital appreciation.
ADVISER
Wells Fargo Funds Management, LLC
SUB-ADVISER
Wells Capital Management Incorporated
PORTFOLIO MANAGER
Michael Bradshaw, CFA
FUND INCEPTION
January 30, 1978
| | | | |
TEN LARGEST EQUITY HOLDINGS1 (AS OF SEPTEMBER 30, 2011) | |
Newcrest Mining Limited | | | 8.11% | |
Randgold Resources Limited ADR | | | 8.01% | |
Kinross Gold Corporation | | | 6.57% | |
Barrick Gold Corporation | | | 6.06% | |
IAMGOLD Corporation | | | 5.75% | |
Eldorado Gold Corporation – Canadian Exchange | | | 5.54% | |
Goldcorp Incorporated – Canadian Exchange | | | 5.43% | |
Agnico-Eagle Mines Limited | | | 3.83% | |
Newmont Mining Corporation | | | 3.70% | |
Wells Fargo Special Investments (Cayman) SPC | | | 3.63% | |
| | |
COUNTRY ALLOCATION2 (AS OF SEPTEMBER 30, 2011) |
|
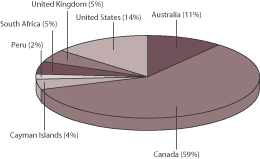 |
| 1. | The ten largest equity holdings are calculated based on the value of the securities divided by total net assets of the Fund. Holdings are subject to change and may have changed since the date specified. |
| 2. | Country allocation is subject to change and is calculated based on the total long-term investments of the Fund. |
| | | | |
| 6 | | Wells Fargo Advantage Precious Metals Fund | | Performance Highlights (Unaudited) |
AVERAGE ANNUAL TOTAL RETURN3 (%) (AS OF SEPTEMBER 30, 2011)
| | | | | | | | | | | | | | | | | | | | | | | | | | | | | | | | | | | | | | | | | | | | |
| | | | | | Including Sales Charge | | | Excluding Sales Charge | | | Expense Ratios4 | |
| | | Inception Date | | | 6 Months* | | | 1 Year | | | 5 Year | | | 10 Year | | | 6 Months* | | | 1 Year | | | 5 Year | | | 10 Year | | | Gross | | | Net5 | |
Class A (EKWAX) | | | 01/20/1998 | | | | (12.66 | ) | | | (8.51 | ) | | | 13.83 | | | | 23.74 | | | | (7.33 | ) | | | (2.93 | ) | | | 15.18 | | | | 24.48 | | | | 1.16% | | | | 1.10% | |
Class B (EKWBX)** | | | 01/30/1978 | | | | (12.29 | ) | | | (7.95 | ) | | | 14.11 | | | | 23.85 | | | | (7.68 | ) | | | (3.66 | ) | | | 14.34 | | | | 23.85 | | | | 1.91% | | | | 1.85% | |
Class C (EKWCX) | | | 01/29/1998 | | | | (8.68 | ) | | | (4.65 | ) | | | 14.34 | | | | 23.58 | | | | (7.68 | ) | | | (3.65 | ) | | | 14.34 | | | | 23.58 | | | | 1.91% | | | | 1.85% | |
Administrator Class (EKWDX) | | | 07/30/2010 | | | | | | | | | | | | | | | | | | | | (7.24 | ) | | | (2.76 | ) | | | 15.32 | | | | 24.63 | | | | 1.00% | | | | 0.96% | |
Institutional Class (EKWYX) | | | 02/29/2000 | | | | | | | | | | | | | | | | | | | | (7.15 | ) | | | (2.55 | ) | | | 15.52 | | | | 24.83 | | | | 0.73% | | | | 0.73% | |
FTSE Gold Mines Index6 | | | | | | | | | | | | | | | | | | | | | | | (6.10 | ) | | | (2.62 | ) | | | 10.83 | | | | 16.03 | | | | | | | | | |
S&P 500 Index7 | | | | | | | | | | | | | | | | | | | | | | | (13.78 | ) | | | 1.14 | | | | (1.18 | ) | | | 2.82 | | | | | | | | | |
| * | Returns for periods of less than one year are not annualized. |
| ** | Class B shares are closed to investment, except in connection with the reinvestment of any distributions and permitted exchanges. |
Figures quoted represent past performance, which is no guarantee of future results and do not reflect the deduction of taxes that a shareholder may pay on fund distributions or the redemption of fund shares. Investment return and principal value of an investment will fluctuate so that an investor’s shares, when redeemed, may be worth more or less than their original cost. Performance shown without sales charges would be lower if sales charges were reflected. Current performance may be lower or higher than the performance data quoted and assumes the reinvestment of dividends and capital gains. Current month-end performance is available on the Fund’s Web site – www.wellsfargo.com/advantagefunds.
Index returns do not include transaction costs associated with buying and selling securities, any mutual fund fees or expenses or any taxes. It is not possible to invest directly in an index.
For Class A shares, the maximum front-end sales charge is 5.75%. For Class B shares, the maximum contingent deferred sales charge is 5.00%. For Class C shares, the maximum contingent deferred sales charge is 1.00%. Performance including sales charge assumes the sales charge for the corresponding time period. Administrator Class and Institutional Class shares are sold without a front-end sales charge or contingent deferred sales charge.
Stock fund values fluctuate in response to the activities of individual companies and general market and economic conditions. Bond values fluctuate in response to the financial condition of individual issuers, general market and economic conditions, and changes in interest rates. In general, when interest rates rise, bond values fall and investors may lose principal value. The use of derivatives may reduce returns and/or increase volatility. Funds that concentrate their investments in limited sectors may be susceptible to financial, economic or market events impacting those sectors. Certain investment strategies tend to increase the total risk of an investment (relative to the broader market). This Fund is exposed to foreign investment risk, non-diversification risk, smaller company securities risk, and subsidiary risk. Consult the Fund’s prospectus for additional information on these and other risks.
| 3. | Historical performance shown for the Administrator Class shares prior to their inception reflects the performance of the Institutional Class shares, adjusted to reflect the higher expenses applicable to the Administrator Class shares. Historical performance shown for all classes of the Fund prior July 19, 2010 is based on the performance of the Fund’s predecessor, Evergreen Precious Metals Fund. |
| 4. | Reflects the expense ratios as stated in the most prospectuses. |
| 5. | The Adviser has committed through July 18, 2013 to waive fees and/or reimburse expenses to the extent necessary to cap the Fund’s Total Annual Fund Operating Expenses After Fee Waiver, excluding certain expenses, at 1.09% for Class A, 1.84% for Class B, 1.84% for Class C, 0.95% for Administrator Class and 0.79% for Institutional Class. Without this cap, the Fund’s returns would have been lower. |
| 6. | FTSE Gold Mines Index is an unmanaged, open-ended index designed to reflect the performance of the worldwide market in the shares of companies whose principal activity is the mining of gold. You cannot invest directly in an index. |
| 7. | The S&P 500 Index consists of 500 stocks chosen for market size, liquidity, and industry group representation. It is a market-value weighted index with each stock’s weight in the index proportionate to its market value. You cannot invest directly in an index. |
| | | | | | |
| Fund Expenses (Unaudited) | | Wells Fargo Advantage Precious Metals Fund | | | 7 | |
As a shareholder of the Fund, you incur two types of costs: (1) transaction costs, including sales charges (loads) on purchase payments and contingent deferred sales charges (if any) on redemptions and (2) ongoing costs, including management fees; distribution (12b-1) and/or shareholder service fees; and other Fund expenses. This example is intended to help you understand your ongoing costs (in dollars) of investing in the Fund and to compare these costs with the ongoing costs of investing in other mutual funds.
The example is based on an investment of $1,000 invested at the beginning of the six-month period and held for the entire period from April 1, 2011 to September 30, 2011.
Actual Expenses
The “Actual” line of the table below provides information about actual account values and actual expenses. You may use the information in this line, together with the amount you invested, to estimate the expenses that you paid over the period. Simply divide your account value by $1,000 (for example, an $8,600 account value divided by $1,000 = 8.6), then multiply the result by the number in the “Actual” line under the heading entitled “Expenses Paid During Period” for your applicable class of shares to estimate the expenses you paid on your account during this period.
Hypothetical Example for Comparison Purposes
The “Hypothetical” line of the table below provides information about hypothetical account values and hypothetical expenses based on the Fund’s actual expense ratio and an assumed rate of return of 5% per year before expenses, which is not the Fund’s actual return. The hypothetical account values and expenses may not be used to estimate the actual ending account balance or expenses you paid for the period. You may use this information to compare the ongoing costs of investing in the Fund and other funds. To do so, compare this 5% hypothetical example with the 5% hypothetical examples that appear in the shareholder reports of the other funds.
Please note that the expenses shown in the table are meant to highlight your ongoing costs only and do not reflect any transactional costs, such as sales charges (loads) and contingent deferred sales charges. Therefore, the “Hypothetical” line of the table is useful in comparing ongoing costs only, and will not help you determine the relative total costs of owning different funds. In addition, if these transactional costs were included, your costs would have been higher.
| | | | | | | | | | | | | | | | |
| | | Beginning
Account Value
04-01-2011 | | | Ending
Account Value
09-30-2011 | | | Expenses
Paid During
the Period1 | | | Net Annual
Expense Ratio | |
Class A | | | | | | | | | | | | | | | | |
Actual | | $ | 1,000.00 | | | $ | 926.67 | | | $ | 5.25 | | | | 1.09 | % |
Hypothetical (5% return before expenses) | | $ | 1,000.00 | | | $ | 1,019.55 | | | $ | 5.50 | | | | 1.09 | % |
Class B | | | | | | | | | | | | | | | | |
Actual | | $ | 1,000.00 | | | $ | 923.23 | | | $ | 8.85 | | | | 1.84 | % |
Hypothetical (5% return before expenses) | | $ | 1,000.00 | | | $ | 1,015.80 | | | $ | 9.27 | | | | 1.84 | % |
Class C | | | | | | | | | | | | | | | | |
Actual | | $ | 1,000.00 | | | $ | 923.24 | | | $ | 8.85 | | | | 1.84 | % |
Hypothetical (5% return before expenses) | | $ | 1,000.00 | | | $ | 1,015.80 | | | $ | 9.27 | | | | 1.84 | % |
Administrator Class | | | | | | | | | | | | | | | | |
Actual | | $ | 1,000.00 | | | $ | 927.65 | | | $ | 4.34 | | | | 0.90 | % |
Hypothetical (5% return before expenses) | | $ | 1,000.00 | | | $ | 1,020.50 | | | $ | 4.55 | | | | 0.90 | % |
Institutional Class | | | | | | | | | | | | | | | | |
Actual | | $ | 1,000.00 | | | $ | 928.47 | | | $ | 3.37 | | | | 0.70 | % |
Hypothetical (5% return before expenses) | | $ | 1,000.00 | | | $ | 1,021.50 | | | $ | 3.54 | | | | 0.70 | % |
| 1. | Expenses paid is equal to the annualized expense ratio of each class multiplied by the average account value over the period, multiplied by the number of days in the most recent fiscal half-year divided by the number of days in the fiscal year (to reflect the one-half year period). |
| | | | |
| 8 | | Wells Fargo Advantage Precious Metals Fund | | Portfolio of Investments—September 30, 2011 (Unaudited) |
| | | | | | | | | | | | |
| Security Name | | | | | | Shares | | | Value | |
| | | | | | | | | | | | |
| | | |
Common Stocks: 91.72% | | | | | | | | | | |
| | | |
| Australia: 10.35% | | | | | | | | | | |
Ampella Mining (Materials, Metals & Mining)† | | | | | | | 1,400,000 | | | $ | 2,543,864 | |
CGA Mining Limited (Materials, Metals & Mining)† | | | | | | | 4,500,000 | | | | 10,048,669 | |
Gryphon Minerals Limited (Materials, Metals & Mining) | | | | | | | 2,000,000 | | | | 2,494,061 | |
Medusa Mining Limited (Materials, Metals & Mining) | | | | | | | 300,000 | | | | 1,963,585 | |
Newcrest Mining Limited (Materials, Metals & Mining) | | | | | | | 3,266,238 | | | | 107,658,950 | |
Perseus Mining Limited (Materials, Metals & Mining)† | | | | | | | 2,800,000 | | | | 8,234,102 | |
Troy Resources NL (Materials, Metals & Mining)(i) | | | | | | | 500,000 | | | | 1,956,294 | |
Troy Resources NL (Materials, Metals & Mining) | | | | | | | 575,000 | | | | 2,249,738 | |
Troy Resources NL (Materials, Metals & Mining) 144A | | | | | | | 95,833 | | | | 374,955 | |
| | | | |
| | | | | | | | | | | 137,524,218 | |
| | | | | | | | | | | | |
| | | |
| Canada: 57.79% | | | | | | | | | | |
Agnico-Eagle Mines Limited (Materials, Metals & Mining) | | | | | | | 855,164 | | | | 50,899,361 | |
Agnico-Eagle Mines Limited – Canadian Exchange (Materials, Metals & Mining) | | | | | | | 35,000 | | | | 2,083,200 | |
Alacer Gold Corporation (Materials, Metals & Mining)† | | | | | | | 2,772,881 | | | | 27,069,923 | |
Alacer Gold Corporation – Canadian Exchange (Materials, Metals & Mining) | | | | | | | 450,000 | | | | 4,393,072 | |
Alamos Gold Incorporated (Materials, Metals & Mining) | | | | | | | 1,397,600 | | | | 21,006,012 | |
Allied Gold Mining plc (Materials, Metals & Mining) | | | | | | | 833,333 | | | | 2,544,771 | |
Atacama Pac Gold Corporation (Materials, Metals & Mining)† | | | | | | | 300,000 | | | | 1,285,428 | |
Aurizon Mines Limited (Materials, Metals & Mining)† | | | | | | | 2,495,700 | | | | 12,741,669 | |
Barrick Gold Corporation (Materials, Metals & Mining) | | | | | | | 1,724,083 | | | | 80,428,472 | |
Centerra Gold Incorporated (Materials, Metals & Mining) 144A | | | | | | | 350,000 | | | | 6,516,366 | |
Centerra Gold Incorporated – Canadian Exchange (Materials, Metals & Mining) | | | | | | | 700,000 | | | | 13,032,732 | |
Detour Gold Corporation (Materials, Metals & Mining) | | | | | | | 90,000 | | | | 2,344,689 | |
Detour Gold Corporation (Materials, Metals & Mining) 144A | | | | | | | 475,000 | | | | 12,374,750 | |
Detour Gold Corporation (Materials, Metals & Mining)† | | | | | | | 255,000 | | | | 6,643,287 | |
Eldorado Gold Corporation – Canadian Exchange (Materials, Metals & Mining) | | | | | | | 4,271,044 | | | | 73,568,417 | |
Entree Gold Incorporated (Materials, Metals & Mining) 144A | | | | | | | 525,000 | | | | 711,423 | |
Entree Gold Incorporated (Materials, Metals & Mining)†(i) | | | | | | | 225,000 | | | | 309,190 | |
Exeter Resource Corporation (Materials, Metals & Mining) 144A | | | | | | | 585,000 | | | | 2,143,716 | |
Exeter Resource Corporation (Materials, Metals & Mining)† | | | | | | | 200,000 | | | | 732,894 | |
Extorre Gold Mines Limited (Materials, Metals & Mining)† | | | | | | | 885,000 | | | | 5,177,068 | |
First Quantum Minerals Limited (Materials, Metals & Mining) | | | | | | | 502,500 | | | | 6,689,450 | |
Franco-Nevada Corporation (Materials, Metals & Mining) 144A | | | | | | | 100,000 | | | | 3,617,712 | |
Franco-Nevada Corporation – Canadian Exchange (Materials, Metals & Mining) | | | | | | | 170,000 | | | | 6,150,110 | |
Goldcorp Incorporated (Materials, Metals & Mining) | | | | | | | 746,694 | | | | 34,079,114 | |
Goldcorp Incorporated – Canadian Exchange (Materials, Metals & Mining) | | | | | | | 1,572,254 | | | | 72,123,533 | |
Great Basin Gold Limited (Materials, Metals & Mining)† | | | | | | | 2,000,450 | | | | 3,378,945 | |
Guyana Goldfields Incorporated (Materials, Metals & Mining) 144A | | | | | | | 150,000 | | | | 1,125,107 | |
Guyana Goldfields Incorporated (Materials, Metals & Mining)† | | | | | | | 300,000 | | | | 2,250,215 | |
IAMGOLD Corporation (Materials, Metals & Mining) | | | | | | | 3,839,044 | | | | 76,311,944 | |
International Minerals Corporation (Materials, Metals & Mining) | | | | | | | 200,700 | | | | 1,407,715 | |
Kinross Gold Corporation (Materials, Metals & Mining) | | | | | | | 5,875,553 | | | | 87,300,659 | |
Kirkland Lake Gold Incorporated (Materials, Metals & Mining)† | | | | | | | 400,000 | | | | 6,485,352 | |
Lake Shore Gold Corporation (Materials, Metals & Mining)† | | | | | | | 1,500,000 | | | | 2,275,981 | |
Mag Silver Corporation (Materials, Metals & Mining)† | | | | | | | 300,000 | | | | 2,347,552 | |
Magma Metals Limited (Materials, Metals & Mining)(i) | | | | | | | 1,000,000 | | | | 157,458 | |
Nautilus Minerals Incorporated (Materials, Metals & Mining)†(i) | | | | | | | 254,934 | | | | 593,605 | |
Northgate Minerals Corporation (Materials, Metals & Mining)† | | | | | | | 1,200,000 | | | | 4,030,919 | |
| | | | | | |
| Portfolio of Investments—September 30, 2011 (Unaudited) | | Wells Fargo Advantage Precious Metals Fund | | | 9 | |
| | | | | | | | | | | | | | |
| Security Name | | | | | | | Shares | | | Value | |
| | | | | | | | | | | | | | |
| | | |
| Canada (continued) | | | | | | | | | | | | |
Osisko Mining Corporation (Materials, Metals & Mining) 144A | | | | | | | | | 1,500,000 | | | $ | 18,995,133 | |
Osisko Mining Corporation (Materials, Metals & Mining)† | | | | | | | | | 609,400 | | | | 7,717,089 | |
Pan American Silver Corporation (Materials, Metals & Mining) | | | | | | | | | 200,000 | | | | 5,354,000 | |
Platinum Group Metals Limited (Materials, Metals & Mining)†(i) | | | | | | | | | 650,000 | | | | 700,926 | |
Platinum Group Metals Limited (Materials, Metals & Mining) 144A | | | | | | | | | 800,000 | | | | 809,238 | |
Queenston Mining Incorporated (Materials, Metals & Mining)† | | | | | | | | | 500,000 | | | | 2,290,295 | |
Semafo Incorporated (Materials, Metals & Mining)† | | | | | | | | | 267,300 | | | | 2,206,456 | |
Semafo Incorporated – Canadian Exchange (Materials, Metals & Mining) | | | | | | | | | 1,293,100 | | | | 10,674,029 | |
Silver Wheaton Corporation (Materials, Metals & Mining) | | | | | | | | | 250,000 | | | | 7,362,500 | |
Silvercorp Metals Incorporated (Materials, Metals & Mining) | | | | | | | | | 911,448 | | | | 7,210,520 | |
Tahoe Resources Incorporated (Materials, Metals & Mining)† | | | | | | | | | 220,000 | | | | 3,170,150 | |
Tahoe Resources Incorporated (Materials, Metals & Mining) 144A | | | | | | | | | 280,000 | | | | 4,034,736 | |
Torex Gold Resources Incorporated (Materials, Metals & Mining)†(i) | | | | | | | | | 200,000 | | | | 248,115 | |
Torex Gold Resources Incorporated (Materials, Metals & Mining) 144A | | | | | | | | | 2,130,000 | | | | 2,642,428 | |
Yamana Gold Incorporated (Materials, Metals & Mining) | | | | | | | | | 840,537 | | | | 11,481,735 | |
Yamana Gold Incorporated – Canadian Exchange (Materials, Metals & Mining) | | | | | | | | | 3,372,040 | | | | 46,273,438 | |
| | | | |
| | | | | | | | | | | | | 767,502,599 | |
| | | | | | | | | | | | | | |
| | | |
| Peru: 2.29% | | | | | | | | | | | | |
Compania de Minas Buenaventura SA ADR (Materials, Metals & Mining) | | | | | | | | | 804,644 | | | | 30,367,265 | |
| | | | | | | | | | | | | | |
| | | |
| South Africa: 4.66% | | | | | | | | | | | | |
AngloGold Ashanti Limited ADR (Materials, Metals & Mining) | | | | | | | | | 615,591 | | | | 25,460,844 | |
Gold Fields Limited ADR (Materials, Metals & Mining) | | | | | | | | | 1,299,196 | | | | 19,903,683 | |
Impala Platinum Holdings Limited (Materials, Metals & Mining) | | | | | | | | | 819,346 | | | | 16,556,001 | |
| | | | |
| | | | | | | | | | | | | 61,920,528 | |
| | | | | | | | | | | | | | |
| | | |
| United Kingdom: 3.11% | | | | | | | | | | | | |
African Barrick Gold Limited (Materials, Metals & Mining) | | | | | | | | | 933,300 | | | | 7,284,278 | |
Avocet Mining plc (Materials, Metals & Mining) | | | | | | | | | 750,000 | | | | 2,657,005 | |
Fresnillo plc (Materials, Metals & Mining) | | | | | | | | | 1,000,000 | | | | 24,447,082 | |
Hochschild Mining plc (Materials, Metals & Mining) | | | | | | | | | 1,099,251 | | | | 6,952,834 | |
| | | | |
| | | | | | | | | | | | | 41,341,199 | |
| | | | | | | | | | | | | | |
| | | |
| United States: 13.52% | | | | | | | | | | | | |
Newmont Mining Corporation (Materials, Metals & Mining) | | | | | | | | | 781,455 | | | | 49,153,520 | |
Randgold Resources Limited ADR (Materials, Metals & Mining) | | | | | | | | | 1,100,000 | | | | 106,392,000 | |
Royal Gold Incorporated (Materials, Metals & Mining) | | | | | | | | | 374,436 | | | | 23,986,370 | |
| | | | |
| | | | | | | | | | | | | 179,531,890 | |
| | | | | | | | | | | | | | |
| | | |
Total Common Stocks (Cost $637,031,286) | | | | | | | | | | | 1,218,187,699 | |
| | | | | | | | | | | | | | |
| | | |
Other: 3.63% | | | | | | | | | | | | |
Wells Fargo Special Investments (Cayman) SPC(l) | | | | | | | | | 16,335 | | | | 48,258,805 | |
| | | |
Total Other (Cost $26,967,322) | | | | | | | | | | | 48,258,805 | |
| | | | | | | | | | | | | | |
| | | | |
| | | | | Expiration Date | | | | | | | |
| Warrants: 0.13% | | | | | | | | | | | | | | |
| | | | |
| Canada: 0.13% | | | | | | | | | | | | | | |
Agnico-Eagle Mines Limited (Materials, Metals & Mining)† | | | | | 12/02/2013 | | | | 17,500 | | | | 340,725 | |
| | | | |
| 10 | | Wells Fargo Advantage Precious Metals Fund | | Portfolio of Investments—September 30, 2011 (Unaudited) |
| | | | | | | | | | | | | | | | |
| Security Name | | | | | Expiration Date | | | Shares | | | Value | |
| | | | | | | | | | | | | | | | |
| | | | |
| Canada (continued) | | | | | | | | | | | | | | | | |
Franco Nevada Corporation (Materials, Metals & Mining)† | | | | | | | 03/13/2012 | | | | 42,500 | | | $ | 278,629 | |
Kinross Gold Corporation (Materials, Metals & Mining)† | | | | | | | 09/17/2014 | | | | 256,630 | | | | 597,554 | |
Kinross Gold Corporation (Materials, Metals & Mining)† | | | | | | | 09/03/2013 | | | | 232,238 | | | | 248,217 | |
Silver Wheaton Corporation (Materials, Metals & Mining)† | | | | | | | 09/05/2013 | | | | 12,950 | | | | 185,056 | |
Torex Gold Resources Incorporated (Materials, Metals & Mining)†(i) | | | | | | | 11/12/2011 | | | | 532,500 | | | | 43,194 | |
| | | | |
Total Warrants (Cost $2,090,817) | | | | | | | | | | | | | | | 1,693,375 | |
| | | | | | | | | | | | | | | | |
| | | | |
Investment Companies: 2.11% | | | | | | | | | | | | | | | | |
Gold Bullion Securities Limited† | | | | | | | | | | | 177,748 | | | | 27,991,755 | |
| | | | | | | | | | | | | | | | |
| | | | |
Total Investment Companies (Cost $10,327,228) | | | | | | | | | | | | | | | 27,991,755 | |
| | | | | | | | | | | | | | | | |
| | | | |
| | | Yield | | | | | | | | | | |
| Short-Term Investments: 2.51% | | | | | | | | | | | | | | | | |
| | | | |
| Investment Companies: 2.51% | | | | | | | | | | | | | | | | |
Wells Fargo Advantage Cash Investment Money Market Fund, Institutional
Class (l)(u) | | | 0.06 | % | | | | | | | 33,374,468 | | | | 33,374,468 | |
| | | | | | | | | | | | | | | | |
| | | |
Total Short-Term Investments (Cost $33,374,468) | | | | | | | | | | | | 33,374,468 | |
| | | | | | | | | | | | | | | | |
| | | | | | | | |
| Total Investments in Securities | | | | | | | | |
| (Cost $709,791,121)* | | | 100.10 | % | | | 1,329,506,102 | |
Other Assets and Liabilities, Net | | | (0.10 | ) | | | (1,310,504 | ) |
| | | | | | | | |
| Total Net Assets | | | 100.00 | % | | $ | 1,328,195,598 | |
| | | | | | | | |
| † | Non-income earning security. |
| 144A | Security that may be resold to “qualified institutional buyers” under Rule 144A or securities offered pursuant to Section 4(2) of the Securities Act of 1933, as amended. |
| (l) | Investment in an affiliate. The total cost of affiliated investments is $60,341,790. |
| (u) | Rate shown is the 7-day annualized yield at period end. |
| * | Cost for federal income tax purposes is $711,895,335 and net unrealized appreciation (depreciation) consists of: |
| | | | |
Gross unrealized appreciation | | $ | 630,547,125 | |
Gross unrealized depreciation | | | (12,936,358 | ) |
| | | | |
Net unrealized appreciation | | $ | 617,610,767 | |
The accompanying notes are an integral part of these financial statements.
| | | | | | |
| Statement of Assets and Liabilities—September 30, 2011 (Unaudited) | | Wells Fargo Advantage Precious Metals Fund | | | 11 | |
| | | | |
| | | | |
| |
Assets | | | | |
Investments | | | | |
In unaffiliated securities, at value | | $ | 1,247,872,829 | |
In affiliated securities, at value | | | 81,633,273 | |
| | | | |
Total investments, at value (see cost below) | | | 1,329,506,102 | |
Foreign currency, at value (see cost below) | | | 57,692 | |
Receivable for Fund shares sold | | | 1,636,108 | |
Receivable for dividends | | | 1,216,945 | |
Prepaid expenses and other assets | | | 145,829 | |
| | | | |
Total assets | | | 1,332,562,676 | |
| | | | |
| |
Liabilities | | | | |
Payable for Fund shares redeemed | | | 2,438,872 | |
Advisory fee payable | | | 667,609 | |
Distribution fees payable | | | 306,482 | |
Due to other related parties | | | 394,122 | |
Shareholder servicing fees payable | | | 316,088 | |
Accrued expenses and other liabilities | | | 243,905 | |
| | | | |
Total liabilities | | | 4,367,078 | |
| | | | |
Total net assets | | $ | 1,328,195,598 | |
| | | | |
| |
NET ASSETS CONSIST OF | | | | |
Paid-in capital | | $ | 751,970,830 | |
Undistributed net investment income | | | 13,412,621 | |
Accumulated net realized losses on investments | | | (56,893,486 | ) |
Net unrealized gains on investments | | | 619,705,633 | |
| | | | |
Total net assets | | $ | 1,328,195,598 | |
| | | | |
| |
COMPUTATION OF NET ASSET VALUE AND OFFERING PRICE PER SHARE1 | | | | |
Net assets – Class A | | $ | 779,250,527 | |
Shares outstanding – Class A | | | 9,818,730 | |
Net asset value per share – Class A | | | $79.36 | |
Maximum offering price per share – Class A2 | | | $84.20 | |
Net assets – Class B | | $ | 53,172,341 | |
Shares outstanding – Class B | | | 727,219 | |
Net asset value per share – Class B | | | $73.12 | |
Net assets – Class C | | $ | 345,075,039 | |
Shares outstanding – Class C | | | 4,765,785 | |
Net asset value per share – Class C | | | $72.41 | |
Net assets – Administrator Class | | $ | 61,811,076 | |
Shares outstanding – Administrator Class | | | 777,613 | |
Net asset value per share – Administrator Class | | | $79.49 | |
Net assets – Institutional Class | | $ | 88,886,615 | |
Shares outstanding – Institutional Class | | | 1,115,247 | |
Net asset value per share – Institutional Class | | | $79.70 | |
| |
Total investments, at cost | | $ | 709,791,121 | |
| | | | |
Foreign currency, at cost | | $ | 59,080 | |
| | | | |
| 1. | The Fund has an unlimited number of authorized shares. |
| 2. | Maximum offering price is computed as 100/94.25 of net asset value. On investments of $50,000 or more, the offering price is reduced. |
The accompanying notes are an integral part of these financial statements.
| | | | |
| 12 | | Wells Fargo Advantage Precious Metals Fund | | Statement of Operations—Six Months Ended September 30, 2011 (Unaudited) |
| | | | |
| | | | |
| |
Investment income | | | | |
Dividends* | | $ | 5,897,631 | |
Interest | | | 4,760 | |
Income from affiliated securities | | | 16,598 | |
| | | | |
Total investment income | | | 5,918,989 | |
| | | | |
| |
Expenses | | | | |
Advisory fee | | | 4,088,005 | |
Administration fees | | | | |
Fund level | | | 370,891 | |
Class A | | | 1,117,762 | |
Class B | | | 84,948 | |
Class C | | | 504,142 | |
Administrator Class | | | 36,804 | |
Institutional Class | | | 38,797 | |
Shareholder servicing fees | | | | |
Class A | | | 1,072,260 | |
Class B | | | 81,421 | |
Class C | | | 484,752 | |
Administrator Class | | | 73,069 | |
Distribution fees | | | | |
Class B | | | 245,043 | |
Class C | | | 1,454,256 | |
Custody and accounting fees | | | 32,442 | |
Professional fees | | | 13,851 | |
Registration fees | | | 4,625 | |
Shareholder report expenses | | | 95,163 | |
Trustees’ fees and expenses | | | 2,774 | |
Other fees and expenses | | | 224 | |
| | | | |
Total expenses | | | 9,801,229 | |
Less: Fee waivers and/or expense reimbursements | | | (274,350 | ) |
| | | | |
Net expenses | | | 9,526,879 | |
| | | | |
Net investment loss | | | (3,607,890 | ) |
| | | | |
| |
REALIZED AND UNREALIZED GAINS (LOSSES) ON INVESTMENTS | | | | |
Net realized gains on investments | | | 20,466,923 | |
Net change in unrealized gains (losses) on: | | | | |
Unaffiliated securities | | | (133,688,855 | ) |
Affiliated securities | | | 5,606,467 | |
| | | | |
Net change in unrealized gains (losses) on investments | | | (128,082,388 | ) |
| | | | |
Net realized and unrealized gains (losses) on investments | | | (107,615,465 | ) |
| | | | |
Net decrease in net assets resulting from operations | | $ | (111,223,355 | ) |
| | | | |
| |
* Net of foreign dividend withholding taxes of | | | $495,331 | |
The accompanying notes are an integral part of these financial statements.
| | | | | | |
| Statements of Changes in Net Assets | | Wells Fargo Advantage Precious Metals Fund | | | 13 | |
| | | | | | | | | | | | | | | | | | | | | | | | |
| | | Six Months Ended
September 30, 2011
(Unaudited) | | | Year Ended
March 31, 20111 | | | Year Ended
October 31, 20102 | |
| | | | | | |
Operations | | | | | | | | | | | | | | | | | | | | | | | | |
Net investment loss | | | | | | $ | (3,607,890 | ) | | | | | | $ | (4,824,569 | ) | | | | | | $ | (8,246,409 | ) |
Net realized gains on investments | | | | | | | 20,466,923 | | | | | | | | 19,147,723 | | | | | | | | 138,017,092 | |
Net change in unrealized gains (losses) on investments | | | | | | | (128,082,388 | ) | | | | | | | 29,742,054 | | | | | | | | 317,397,891 | |
| | | | | | | | | | | | | | | | | | | | | | | | |
Net increase (decrease) in net assets resulting from operations | | | | | | | (111,223,355 | ) | | | | | | | 44,065,208 | | | | | | | | 447,168,574 | |
| | | | | | | | | | | | | | | | | | | | | | | | |
| | | | | | |
Distributions to shareholders from | | | | | | | | | | | | | | | | | | | | | | | | |
Net investment income | | | | | | | | | | | | | | | | | | | | | | | | |
Class A | | | | | | | 0 | | | | | | | | (40,792,879 | ) | | | | | | | 0 | |
Class B | | | | | | | 0 | | | | | | | | (3,075,690 | ) | | | | | | | 0 | |
Class C | | | | | | | 0 | | | | | | | | (15,988,531 | ) | | | | | | | 0 | |
Administrator Class | | | | | | | 0 | | | | | | | | (4,409,918 | ) | | | | | | | 0 | 3 |
Institutional Class | | | | | | | 0 | | | | | | | | (4,302,183 | ) | | | | | | | 0 | 4 |
Net realized gains | | | | | | | | | | | | | | | | | | | | | | | | |
Class A | | | | | | | 0 | | | | | | | | (64,067,611 | ) | | | | | | | 0 | |
Class B | | | | | | | 0 | | | | | | | | (6,219,040 | ) | | | | | | | 0 | |
Class C | | | | | | | 0 | | | | | | | | (31,312,147 | ) | | | | | | | 0 | |
Administrator Class | | | | | | | 0 | | | | | | | | (6,492,419 | ) | | | | | | | 0 | 3 |
Institutional Class | | | | | | | 0 | | | | | | | | (6,352,244 | ) | | | | | | | 0 | 4 |
| | | | | | | | | | | | | | | | | | | | | | | | |
Total distributions to shareholders | | | | | | | 0 | | | | | | | | (183,012,662 | ) | | | | | | | 0 | |
| | | | | | | | | | | | | | | | | | | | | | | | |
| | | | | | |
Capital share transactions | | | Shares | | | | | | | | Shares | | | | | | | | Shares | | | | | |
Proceeds from shares sold | | | | | | | | | | | | | | | | | | | | | | | | |
Class A | | | 1,413,184 | | | | 120,840,657 | | | | 1,499,208 | | | | 131,908,878 | | | | 3,801,670 | | | | 302,514,191 | |
Class B | | | 8,874 | | | | 697,228 | | | | 29,428 | | | | 2,421,290 | | | | 43,458 | | | | 3,154,965 | |
Class C | | | 340,060 | | | | 26,830,552 | | | | 538,280 | | | | 43,231,944 | | | | 988,761 | | | | 71,591,926 | |
Administrator Class | | | 251,594 | | | | 21,811,632 | | | | 1,243,336 | | | | 120,059,547 | | | | 1,357 | 3 | | | 122,474 | 3 |
Institutional Class | | | 188,689 | | | | 16,544,545 | | | | 306,056 | | | | 26,802,077 | | | | 494,840 | 4 | | | 40,121,137 | 4 |
| | | | | | | | | | | | | | | | | | | | | | | | |
| | | | | | | 186,724,614 | | | | | | | | 324,423,736 | | | | | | | | 417,504,693 | |
| | | | | | | | | | | | | | | | | | | | | | | | |
Reinvestment of distributions | | | | | | | | | | | | | | | | | | | | | | | | |
Class A | | | 0 | | | | 0 | | | | 999,625 | | | | 88,852,858 | | | | 0 | | | | 0 | |
Class B | | | 0 | | | | 0 | | | | 86,602 | | | | 7,123,324 | | | | 0 | | | | 0 | |
Class C | | | 0 | | | | 0 | | | | 412,268 | | | | 33,605,609 | | | | 0 | | | | 0 | |
Administrator Class | | | 0 | | | | 0 | | | | 11,352 | | | | 1,009,042 | | | | 0 | 3 | | | 0 | 3 |
Institutional Class | | | 0 | | | | 0 | | | | 111,456 | | | | 9,929,327 | | | | 0 | 4 | | | 0 | 4 |
| | | | | | | | | | | | | | | | | | | | | | | | |
| | | | | | | 0 | | | | | | | | 140,520,160 | | | | | | | | 0 | |
| | | | | | | | | | | | | | | | | | | | | | | | |
Payment for shares redeemed | | | | | | | | | | | | | | | | | | | | | | | | |
Class A | | | (1,789,931 | ) | | | (151,212,067 | ) | | | (2,517,021 | ) | | | (228,244,955 | ) | | | (2,825,257 | ) | | | (220,696,606 | ) |
Class B | | | (187,722 | ) | | | (14,675,841 | ) | | | (168,968 | ) | | | (13,699,776 | ) | | | (241,788 | ) | | | (17,543,547 | ) |
Class C | | | (649,435 | ) | | | (50,102,389 | ) | | | (494,503 | ) | | | (38,921,274 | ) | | | (958,570 | ) | | | (68,573,931 | ) |
Administrator Class | | | (572,037 | ) | | | (47,881,964 | ) | | | (157,989 | ) | | | (13,252,438 | ) | | | 0 | 3 | | | 0 | 3 |
Institutional Class | | | (201,154 | ) | | | (17,284,282 | ) | | | (187,356 | ) | | | (16,035,319 | ) | | | (257,253 | )4 | | | (20,460,632 | )4 |
| | | | | | | | | | | | | | | | | | | | | | | | |
| | | | | | | (281,156,543 | ) | | | | | | | (310,153,762 | ) | | | | | | | (327,274,716 | ) |
| | | | | | | | | | | | | | | | | | | | | | | | |
Net increase (decrease) in net assets resulting from capital share transactions | | | | | | | (94,431,929 | ) | | | | | | | 154,790,134 | | | | | | | | 90,229,977 | |
| | | | | | | | | | | | | | | | | | | | | | | | |
Total increase (decrease) in net assets | | | | | | | (205,655,284 | ) | | | | | | | 15,842,680 | | | | | | | | 537,398,551 | |
| | | | | | | | | | | | | | | | | | | | | | | | |
| | | | | | |
Net assets | | | | | | | | | | | | | | | | | | | | | | | | |
Beginning of period | | | | | | | 1,533,850,882 | | | | | | | | 1,518,008,202 | | | | | | | | 980,609,651 | |
| | | | | | | | | | | | | | | | | | | | | | | | |
End of period | | | | | | $ | 1,328,195,598 | | | | | | | $ | 1,533,850,882 | | | | | | | $ | 1,518,008,202 | |
| | | | | | | | | | | | | | | | | | | | | | | | |
Undistributed net investment income | | | | | | $ | 13,412,621 | | | | | | | $ | 17,020,511 | | | | | | | $ | 68,923,581 | |
| | | | | | | | | | | | | | | | | | | | | | | | |
| 1. | For the five months ended March 31, 2011. The Fund changed its fiscal year end from October 31 to March 31, effective March 31, 2011. |
| 2. | After the close of business on July 16, 2010, the Fund acquired the net assets of Evergreen Precious Metals Fund which became the accounting and performance survivor in this transaction. The information for the period prior to July 19, 2010 is that of Evergreen Precious Metals Fund. |
| 3. | Class commenced operations on July 30, 2010. |
| 4. | Class I shares of Evergreen Precious Metals Fund became Institutional Class shares on July 19, 2010. |
The accompanying notes are an integral part of these financial statements.
| | | | |
| 14 | | Wells Fargo Advantage Precious Metals Fund | | Financial Highlights |
(For a share outstanding throughout each period)
| | | | | | | | | | | | | | | | | | | | | | | | | | | | |
| | | Six Months Ended
September 30, 2011 (Unaudited) | | | Year Ended
March 31, 20111 | | | Year Ended October 31, | |
| Class A | | | | 20102 | | | 20092 | | | 20082 | | | 20072 | | | 20062 | |
Net asset value, beginning of period | | $ | 85.64 | | | $ | 93.43 | | | $ | 64.40 | | | $ | 33.15 | | | $ | 76.98 | | | $ | 56.05 | | | $ | 36.01 | |
Net investment loss | | | (0.13 | )3 | | | (0.21 | )3 | | | (0.35 | )3 | | | (0.33 | )3 | | | (0.14 | )3 | | | (0.15 | )3 | | | (0.11 | )3 |
Net realized and unrealized gains (losses) on investments | | | (6.15 | ) | | | 3.24 | | | | 29.38 | | | | 33.23 | | | | (38.79 | ) | | | 24.35 | | | | 20.47 | |
| | | | | | | | | | | | | | | | | | | | | | | | | | | | |
Total from investment operations | | | (6.28 | ) | | | 3.03 | | | | 29.03 | | | | 32.90 | | | | (38.93 | ) | | | 24.20 | | | | 20.36 | |
Distributions to shareholders from | | | | | | | | | | | | | | | | | | | | | | | | | | | | |
Net investment income | | | 0.00 | | | | (4.06 | ) | | | 0.00 | | | | 0.00 | | | | 0.00 | | | | (0.42 | ) | | | (0.32 | ) |
Net realized gains | | | 0.00 | | | | (6.76 | ) | | | 0.00 | | | | (1.65 | ) | | | (4.90 | ) | | | (2.85 | ) | | | 0.00 | |
| | | | | | | | | | | | | | | | | | | | | | | | | | | | |
Total distributions to shareholders | | | 0.00 | | | | (10.82 | ) | | | 0.00 | | | | (1.65 | ) | | | (4.90 | ) | | | (3.27 | ) | | | (0.32 | ) |
Net asset value, end of period | | $ | 79.36 | | | $ | 85.64 | | | $ | 93.43 | | | $ | 64.40 | | | $ | 33.15 | | | $ | 76.98 | | | $ | 56.05 | |
Total return4 | | | (7.33 | )% | | | 3.14 | % | | | 45.10 | % | | | 103.24 | % | | | (53.66 | )% | | | 44.99 | % | | | 56.86 | % |
Ratios to average net assets (annualized) | | | | | | | | | | | | | | | | | | | | | | | | | | | | |
Gross expenses | | | 1.13 | % | | | 1.15 | % | | | 1.09 | % | | | 1.08 | % | | | 1.07 | % | | | 1.12 | % | | | 1.16 | % |
Net expenses | | | 1.09 | % | | | 1.09 | % | | | 1.05 | % | | | 1.08 | % | | | 1.05 | % | | | 1.10 | % | | | 1.14 | % |
Net investment loss | | | (0.29 | )% | | | (0.57 | )% | | | (0.45 | )% | | | (0.62 | )% | | | (0.21 | )% | | | (0.26 | )% | | | (0.22 | )% |
Supplemental data | | | | | | | | | | | | | | | | | | | | | | | | | | | | |
Portfolio turnover rate | | | 1 | % | | | 5 | % | | | 14 | % | | | 14 | % | | | 19 | % | | | 37 | % | | | 23 | % |
Net assets, end of period (000’s omitted) | | | $779,251 | | | | $873,142 | | | | $954,220 | | | | $594,910 | | | | $275,695 | | | | $587,874 | | | | $413,685 | |
| 1. | For the five months ended March 31, 2011. The Fund changed its fiscal year end from October 31 to March 31, effective March 31, 2011. |
| 2. | After the close of business on July 16, 2010, the Fund acquired the net assets of Evergreen Precious Metals Fund which became the accounting and performance survivor in this transaction. The information for the periods prior to July 19, 2010 is that of Class A of Evergreen Precious Metals Fund. |
| 3. | Calculated based upon average shares outstanding. |
| 4. | Total return calculations do not include any sales charges. Returns for periods of less than one year are not annualized. |
The accompanying notes are an integral part of these financial statements.
| | | | | | |
| Financial Highlights | | Wells Fargo Advantage Precious Metals Fund | | | 15 | |
(For a share outstanding throughout each period)
| | | | | | | | | | | | | | | | | | | | | | | | | | | | |
| | | Six Months Ended
September 30, 2011 (Unaudited) | | | Year Ended
March 31, 20111 | | | Year Ended October 31, | |
| Class B | | | | 20102 | | | 20092 | | | 20082 | | | 20072 | | | 20062 | |
Net asset value, beginning of period | | $ | 79.20 | | | $ | 86.53 | | | $ | 60.10 | | | $ | 31.25 | | | $ | 73.39 | | | $ | 53.61 | | | $ | 34.48 | |
Net investment loss | | | (0.44 | ) | | | (0.44 | )3 | | | (0.86 | )3 | | | (0.68 | )3 | | | (0.60 | )3 | | | (0.55 | )3 | | | (0.46 | )3 |
Net realized and unrealized gains (losses) on investments | | | (5.64 | ) | | | 3.01 | | | | 27.29 | | | | 31.18 | | | | (36.64 | ) | | | 23.24 | | | | 19.66 | |
| | | | | | | | | | | | | | | | | | | | | | | | | | | | |
Total from investment operations | | | (6.08 | ) | | | 2.57 | | | | 26.43 | | | | 30.50 | | | | (37.24 | ) | | | 22.69 | | | | 19.20 | |
Distributions to shareholders from | | | | | | | | | | | | | | | | | | | | | | | | | | | | |
Net investment income | | | 0.00 | | | | (3.14 | ) | | | 0.00 | | | | 0.00 | | | | 0.00 | | | | (0.06 | ) | | | (0.07 | ) |
Net realized gains | | | 0.00 | | | | (6.76 | ) | | | 0.00 | | | | (1.65 | ) | | | (4.90 | ) | | | (2.85 | ) | | | 0.00 | |
| | | | | | | | | | | | | | | | | | | | | | | | | | | | |
Total distributions to shareholders | | | 0.00 | | | | (9.90 | ) | | | 0.00 | | | | (1.65 | ) | | | (4.90 | ) | | | (2.91 | ) | | | (0.07 | ) |
Net asset value, end of period | | $ | 73.12 | | | $ | 79.20 | | | $ | 86.53 | | | $ | 60.10 | | | $ | 31.25 | | | $ | 73.39 | | | $ | 53.61 | |
Total return4 | | | (7.68 | )% | | | 2.82 | % | | | 44.00 | % | | | 101.77 | % | | | (54.00 | )% | | | 43.96 | % | | | 55.78 | % |
Ratios to average net assets (annualized) | | | | | | | | | | | | | | | | | | | | | | | | | | | | |
Gross expenses | | | 1.88 | % | | | 1.90 | % | | | 1.83 | % | | | 1.83 | % | | | 1.80 | % | | | 1.82 | % | | | 1.86 | % |
Net expenses | | | 1.84 | % | | | 1.84 | % | | | 1.80 | % | | | 1.83 | % | | | 1.80 | % | | | 1.82 | % | | | 1.84 | % |
Net investment loss | | | (1.06 | )% | | | (1.32 | )% | | | (1.19 | )% | | | (1.37 | )% | | | (0.97 | )% | | | (0.98 | )% | | | (0.93 | )% |
Supplemental data | | | | | | | | | | | | | | | | | | | | | | | | | | | | |
Portfolio turnover rate | | | 1 | % | | | 5 | % | | | 14 | % | | | 14 | % | | | 19 | % | | | 37 | % | | | 23 | % |
Net assets, end of period (000’s omitted) | | | $53,172 | | | | $71,761 | | | | $82,984 | | | | $69,553 | | | | $40,766 | | | | $99,221 | | | | $73,208 | |
| 1. | For the five months ended March 31, 2011. The Fund changed its fiscal year end from October 31 to March 31, effective March 31, 2011. |
| 2. | After the close of business on July 16, 2010, the Fund acquired the net assets of Evergreen Precious Metals Fund which became the accounting and performance survivor in this transaction. The information for the periods prior to July 19, 2010 is that of Class B of Evergreen Precious Metals Fund. |
| 3. | Calculated based upon average shares outstanding. |
| 4. | Total return calculations do not include any sales charges. Returns for periods of less than one year are not annualized. |
The accompanying notes are an integral part of these financial statements.
| | | | |
| 16 | | Wells Fargo Advantage Precious Metals Fund | | Financial Highlights |
(For a share outstanding throughout each period)
| | | | | | | | | | | | | | | | | | | | | | | | | | | | |
| | | Six Months Ended
September 30, 2011 (Unaudited) | | | Year Ended
March 31, 20111 | | | Year Ended October 31, | |
| Class C | | | | 20102 | | | 20092 | | | 20082 | | | 20072 | | | 20062 | |
Net asset value, beginning of period | | $ | 78.43 | | | $ | 85.86 | | | $ | 59.63 | | | $ | 31.02 | | | $ | 72.90 | | | $ | 53.31 | | | $ | 34.30 | |
Net investment loss | | | (0.42 | ) | | | (0.43 | )3 | | | (0.86 | )3 | | | (0.68 | )3 | | | (0.60 | )3 | | | (0.55 | )3 | | | (0.45 | )3 |
Net realized and unrealized gains (losses) on investments | | | (5.60 | ) | | | 2.98 | | | | 27.09 | | | | 30.94 | | | | (36.38 | ) | | | 23.09 | | | | 19.55 | |
| | | | | | | | | | | | | | | | | | | | | | | | | | | | |
Total from investment operations | | | (6.02 | ) | | | 2.55 | | | | 26.23 | | | | 30.26 | | | | (36.98 | ) | | | 22.54 | | | | 19.10 | |
Distributions to shareholders from | | | | | | | | | | | | | | | | | | | | | | | | | | | | |
Net investment income | | | 0.00 | | | | (3.22 | ) | | | 0.00 | | | | 0.00 | | | | 0.00 | | | | (0.10 | ) | | | (0.09 | ) |
Net realized gains | | | 0.00 | | | | (6.76 | ) | | | 0.00 | | | | (1.65 | ) | | | (4.90 | ) | | | (2.85 | ) | | | 0.00 | |
| | | | | | | | | | | | | | | | | | | | | | | | | | | | |
Total distributions to shareholders | | | 0.00 | | | | (9.98 | ) | | | 0.00 | | | | (1.65 | ) | | | (4.90 | ) | | | (2.95 | ) | | | (0.09 | ) |
Net asset value, end of period | | $ | 72.41 | | | $ | 78.43 | | | $ | 85.86 | | | $ | 59.63 | | | $ | 31.02 | | | $ | 72.90 | | | $ | 53.31 | |
Total return4 | | | (7.68 | )% | | | 2.82 | % | | | 44.01 | % | | | 101.75 | % | | | (54.01 | )% | | | 43.95 | % | | | 55.79 | % |
Ratios to average net assets (annualized) | | | | | | | | | | | | | | | | | | | | | | | | | | | | |
Gross expenses | | | 1.88 | % | | | 1.90 | % | | | 1.84 | % | | | 1.83 | % | | | 1.80 | % | | | 1.82 | % | | | 1.86 | % |
Net expenses | | | 1.84 | % | | | 1.84 | % | | | 1.80 | % | | | 1.83 | % | | | 1.80 | % | | | 1.82 | % | | | 1.84 | % |
Net investment loss | | | (1.04 | )% | | | (1.31 | )% | | | (1.19 | )% | | | (1.37 | )% | | | (0.97 | )% | | | (0.98 | )% | | | (0.92 | )% |
Supplemental data | | | | | | | | | | | | | | | | | | | | | | | | | | | | |
Portfolio turnover rate | | | 1 | % | | | 5 | % | | | 14 | % | | | 14 | % | | | 19 | % | | | 37 | % | | | 23 | % |
Net assets, end of period (000’s omitted) | | | $345,075 | | | | $398,047 | | | | $396,590 | | | | $273,636 | | | | $129,074 | | | | $323,495 | | | | $208,445 | |
| 1. | For the five months ended March 31, 2011. The Fund changed its fiscal year end from October 31 to March 31, effective March 31, 2011. |
| 2. | After the close of business on July 16, 2010, the Fund acquired the net assets of Evergreen Precious Metals Fund which became the accounting and performance survivor in this transaction. The information for the periods prior to July 19, 2010 is that of Class C of Evergreen Precious Metals Fund. |
| 3. | Calculated based upon average shares outstanding. |
| 4. | Total return calculations do not include any sales charges. Returns for periods of less than one year are not annualized. |
The accompanying notes are an integral part of these financial statements.
| | | | | | |
| Financial Highlights | | Wells Fargo Advantage Precious Metals Fund | | | 17 | |
(For a share outstanding throughout each period)
| | | | | | | | | | | | |
| Administrator Class | | Six Months Ended
September 30, 2011 (Unaudited) | | | Year Ended
March 31, 20111 | | | Year Ended
October 31, 20102 | |
Net asset value, beginning of period | | $ | 85.70 | | | $ | 93.65 | | | $ | 77.73 | |
Net investment loss | | | (0.05 | )3 | | | (0.11 | )3 | | | (0.12 | )3 |
Net realized and unrealized gains (losses) on investments | | | (6.16 | ) | | | 3.22 | | | | 16.04 | |
| | | | | | | | | | | | |
Total from investment operations | | | (6.21 | ) | | | 3.11 | | | | 15.92 | |
Distributions to shareholders from | | | | | | | | | | | | |
Net investment income | | | 0.00 | | | | (4.30 | ) | | | 0.00 | |
Net realized gains | | | 0.00 | | | | (6.76 | ) | | | 0.00 | |
| | | | | | | | | | | | |
Total distributions to shareholders | | | 0.00 | | | | (11.06 | ) | | | 0.00 | |
Net asset value, end of period | | $ | 79.49 | | | $ | 85.70 | | | $ | 93.65 | |
Total return4 | | | (7.24 | )% | | | 3.20 | % | | | 20.48 | % |
Ratios to average net assets (annualized) | | | | | | | | | | | | |
Gross expenses | | | 0.91 | % | | | 0.91 | % | | | 1.06 | % |
Net expenses | | | 0.90 | % | | | 0.91 | % | | | 0.95 | % |
Net investment loss | | | (0.11 | )% | | | (0.30 | )% | | | (0.54 | )% |
Supplemental data | | | | | | | | | | | | |
Portfolio turnover rate | | | 1 | % | | | 5 | % | | | 14 | % |
Net assets, end of period (000’s omitted) | | | $61,811 | | | | $94,103 | | | | $127 | |
| 1. | For the five months ended March 31, 2011. The Fund changed its fiscal year end from October 31 to March 31, effective March 31, 2011. |
| 2. | For the period from July 30, 2010 (commencement of class operations) to October 31, 2010. |
| 3. | Calculated based upon average shares outstanding. |
| 4. | Returns for periods of less than one year are not annualized. |
The accompanying notes are an integral part of these financial statements.
| | | | |
| 18 | | Wells Fargo Advantage Precious Metals Fund | | Financial Highlights |
(For a share outstanding throughout each period)
| | | | | | | | | | | | | | | | | | | | | | | | | | | | |
| | | Six Months Ended
September 30, 2011 (Unaudited) | | | Year Ended March 31, 20111 | | | Year Ended October 31, | |
| Institutional Class | | | | 20102 | | | 20092 | | | 20082 | | | 20072 | | | 20062 | |
Net asset value, beginning of period | | $ | 85.84 | | | $ | 93.68 | | | $ | 64.41 | | | $ | 33.07 | | | $ | 76.63 | | | $ | 55.78 | | | $ | 35.82 | |
Net Investment income (loss) | | | 0.04 | | | | (0.06 | )3 | | | (0.14 | )3 | | | (0.20 | )3 | | | 0.03 | 3 | | | 0.01 | 3 | | | 0.04 | 3 |
Net realized and unrealized gains (losses) on investments | | | (6.18 | ) | | | 3.26 | | | | 29.41 | | | | 33.19 | | | | (38.69 | ) | | | 24.24 | | | | 20.33 | |
| | | | | | | | | | | | | | | | | | | | | | | | | | | | |
Total from investment operations | | | (6.14 | ) | | | 3.20 | | | | 29.27 | | | | 32.99 | | | | (38.66 | ) | | | 24.25 | | | | 20.37 | |
Distributions to shareholders from | | | | | | | | | | | | | | | | | | | | | | | | | | | | |
Net investment income | | | 0.00 | | | | (4.28 | ) | | | 0.00 | | | | 0.00 | | | | 0.00 | | | | (0.55 | ) | | | (0.41 | ) |
Net realized gains | | | 0.00 | | | | (6.76 | ) | | | 0.00 | | | | (1.65 | ) | | | (4.90 | ) | | | (2.85 | ) | | | 0.00 | |
| | | | | | | | | | | | | | | | | | | | | | | | | | | | |
Total distributions to shareholders | | | 0.00 | | | | (11.04 | ) | | | 0.00 | | | | (1.65 | ) | | | (4.90 | ) | | | (3.40 | ) | | | (0.41 | ) |
Net asset value, end of period | | $ | 79.70 | | | $ | 85.84 | | | $ | 93.68 | | | $ | 64.41 | | | $ | 33.07 | | | $ | 76.63 | | | $ | 55.78 | |
Total return4 | | | (7.15 | )% | | | 3.32 | % | | | 45.47 | % | | | 103.78 | % | | | (53.54 | )% | | | 45.40 | % | | | 57.30 | % |
Ratios to average net assets (annualized) | | | | | | | | | | | | | | | | | | | | | | | | | | | | |
Gross expenses | | | 0.70 | % | | | 0.72 | % | | | 0.78 | % | | | 0.82 | % | | | 0.82 | % | | | 0.82 | % | | | 0.86 | % |
Net expenses | | | 0.70 | % | | | 0.69 | % | | | 0.78 | % | | | 0.82 | % | | | 0.82 | % | | | 0.82 | % | | | 0.84 | % |
Net investment income (loss) | | | 0.10 | % | | | (0.15 | )% | | | (0.18 | )% | | | (0.37 | )% | | | 0.04 | % | | | 0.02 | % | | | 0.09 | % |
Supplemental data | | | | | | | | | | | | | | | | | | | | | | | | | | | | |
Portfolio turnover rate | | | 1 | % | | | 5 | % | | | 14 | % | | | 14 | % | | | 19 | % | | | 37 | % | | | 23 | % |
Net assets, end of period (000’s omitted) | | | $88,887 | | | | $96,798 | | | | $84,087 | | | | $42,511 | | | | $15,213 | | | | $8,293 | | | | $5,910 | |
| 1. | For the five months ended March 31, 2011. The Fund changed its fiscal year end from October 31 to March 31, effective March 31, 2011. |
| 2. | After the close of business on July 16, 2010, the Fund acquired the net assets of Evergreen Precious Metals Fund which became the accounting and performance survivor in this transaction. The information for the periods prior to July 19, 2010 is that of Class I of Evergreen Precious Metals Fund. |
| 3. | Calculated based upon average shares outstanding. |
| 4. | Returns for periods of less than one year are not annualized. |
The accompanying notes are an integral part of these financial statements.
| | | | | | |
| Notes to Financial Statements (Unaudited) | | Wells Fargo Advantage Precious Metals Fund | | | 19 | |
1. ORGANIZATION
Wells Fargo Funds Trust (the “Trust”), a Delaware statutory trust organized on March 10, 1999, is an open-end management investment company registered under the Investment Company Act of 1940, as amended (the “1940 Act”). These financial statements report on Wells Fargo Advantage Precious Metals Fund (the “Fund”) which is a non-diversified series of the Trust.
2. SIGNIFICANT ACCOUNTING POLICIES
The following significant accounting policies, which are consistently followed in the preparation of the financial statements of the Fund, are in conformity with U.S. generally accepted accounting principles which require management to make estimates and assumptions that affect the reported amounts of assets and liabilities, disclosure of contingent assets and liabilities at the date of the financial statements, and the reported amounts of revenues and expenses during the reporting period. Actual results could differ from those estimates.
Securities valuation
Investments in securities are valued each business day as of the close of regular trading on the New York Stock Exchange, which is usually 4:00 p.m. (Eastern Time). Securities which are traded on a national or foreign securities exchange are valued at the last reported sales price, except that securities listed on The Nasdaq Stock Market, Inc. (“Nasdaq”) are valued at the Nasdaq Official Closing Price (“NOCP”), and if no NOCP is available, then at the last reported sales price. If no sales price is shown on the Nasdaq, the bid price will be used. In the absence of any sale of securities listed on the Nasdaq, and in the case of other securities, including U.S. Government obligations, but excluding debt securities maturing in 60 days or less, the price will be deemed “stale” and the valuations will be determined in accordance with the Fund’s Fair Value Procedures.
Securities denominated in foreign currencies are translated into U.S. dollars using the closing rates of exchange in effect on the day of valuation.
Many securities markets and exchanges outside the U.S. close prior to the close of the New York Stock Exchange and therefore may not fully reflect trading or events that occur after the close of the principal exchange in which the foreign investments are traded but before the close of the New York Stock Exchange. If such trading or events are expected to materially affect the value of the investments, then those investments are fair valued following procedures approved by the Board of Trustees. These procedures take into account multiple factors including movements in U.S. securities markets after foreign exchanges close. Depending on market activity, such fair valuations may be frequent. Such fair value pricing may result in NAVs that are higher or lower than NAVs based on the closing price or latest quoted bid price.
Debt securities of sufficient credit quality with original maturities of 60 days or less generally are valued at amortized cost which approximates fair value. The amortized cost method involves valuing a security at its cost, plus accretion of discount or minus amortization of premium over the period until maturity.
Investments in open-end mutual funds and non-registered investment companies are generally valued at net asset value.
Certain investments which are not valued using any of the methods discussed above, are valued at their fair value, as determined by procedures established in good faith and approved by the Board of Trustees.
Foreign currency translation
The accounting records of the Fund are maintained in U.S. dollars. Assets, including investment securities, and liabilities denominated in foreign currency are translated into U.S. dollars at the prevailing rates of exchange at the date of valuation. Purchases and sales of securities, and income and expenses are translated at the prevailing rate of exchange on the respective dates of such transactions. Reported net realized foreign exchange gains or losses arise from sales of foreign currencies, currency gains or losses realized between the trade and settlement dates on securities transactions, and the difference between the amounts of dividends, interest and foreign withholding taxes recorded and the U.S. dollar equivalent of the amounts actually paid or received. Net unrealized foreign exchange gains and losses arise from changes in the fair value of assets and liabilities other than investments in securities resulting in changes in exchange rates.
The changes in net assets arising from changes in exchange rates and the changes in net assets resulting from changes in market prices of securities are not separately presented. Such changes are recorded with net realized and unrealized
| | | | |
| 20 | | Wells Fargo Advantage Precious Metals Fund | | Notes to Financial Statements (Unaudited) |
gains or losses from investments. Gains and losses from certain foreign currency transactions are treated as ordinary income for U.S. federal income tax purposes.
Security transactions and income recognition
Securities transactions are recorded on a trade date basis. Realized gains or losses are reported on the basis of identified cost of securities delivered.
Interest income is accrued daily and bond discounts are accreted and premiums are amortized daily based on the effective interest method. To the extent debt obligations are placed on non-accrual status, any related interest income may be reduced by writing off interest receivables when the collection of all or a portion of interest has become doubtful based on consistently applied procedures. If the issuer subsequently resumes interest payments or when the collectability of interest is reasonably assured, the debt obligation is removed from non-accrual status.
Dividend income is recognized on the ex-dividend date, except for certain dividends from foreign securities, which are recorded as soon as the Fund is informed of the ex-dividend date. Dividend income from foreign securities is recorded net of foreign taxes withheld where recovery of such taxes is not assured.
Distributions to shareholders
Distributions to shareholders from net investment income and net realized gains, if any, are recorded on the ex-dividend date. Such distributions are determined in conformity with income tax regulations, which may differ from generally accepted accounting principles.
Federal and other taxes
The Fund intends to continue to qualify as a regulated investment company by distributing substantially all of its investment company taxable income and any net realized capital gains (after reduction for capital loss carryforwards) sufficient to relieve it from all, or substantially all, federal income taxes. Accordingly, no provision for federal income taxes was required.
The Fund’s income and federal excise tax returns and all financial records supporting those returns for the prior three fiscal years are subject to examination by the federal and Delaware revenue authorities.
Under the recently enacted Regulated Investment Company Modernization Act of 2010, the Fund will be permitted to carry forward capital losses incurred in taxable years beginning after December 22, 2010 for an unlimited period. However, any losses incurred during those future taxable years will be required to be utilized prior to the losses incurred in pre-enactment taxable years. As a result of this ordering rule, pre-enactment capital loss carryforwards may be more likely to expire unused. Additionally, post-enactment capital losses that are carried forward will retain their character as either short-term or long-term capital losses rather than being considered all short-term as under previous law.
Class allocations
The separate classes of shares offered by the Fund differ principally in applicable sales charges, distribution, shareholder servicing and administration fees. Shareholders of each class bear certain expenses that pertain to that particular class. All shareholders bear the common expenses of the Fund, earn income from the portfolio, and are allocated unrealized gains and losses pro rata based on the average daily net assets of each class, without distinction between share classes. Dividends are determined separately for each class based on income and expenses allocable to each class. Realized gains and losses are allocated to each class pro rata based upon the net assets of each class on the date realized. Differences in per share dividend rates generally result from the relative weightings of pro rata income and realized gain allocations and from differences in separate class expenses, including distribution, shareholder servicing and administration fees.
3. FAIR VALUATION MEASUREMENTS
Fair value measurements of investments are determined within a framework that has established a fair value hierarchy based upon the various data inputs utilized in determining the value of the Fund’s investments. The three-level hierarchy gives the highest priority to unadjusted quoted prices in active markets for identical assets or liabilities (Level 1) and the lowest priority to unobservable inputs (Level 3). The Fund’s investments are classified within the fair value hierarchy based on the lowest level of input that is significant to the fair value measurement. The inputs are summarized into three broad levels as follows:
| n | | Level 1 – quoted prices in active markets for identical securities |
| | | | | | |
| Notes to Financial Statements (Unaudited) | | Wells Fargo Advantage Precious Metals Fund | | | 21 | |
| n | | Level 2 – other significant observable inputs (including quoted prices for similar securities, interest rates, prepayment speeds, credit risk, etc.) |
| n | | Level 3 – significant unobservable inputs (including the Fund’s own assumptions in determining the fair value of investments) |
The inputs or methodologies used for valuing securities are not necessarily an indication of the risk associated with investing in those securities.
As of September 30, 2011, the inputs used in valuing the Fund’s assets, which are carried at fair value, were as follows:
| | | | | | | | | | | | | | | | |
| Investments in Securities | | Quoted Prices (Level 1) | | | Significant Other
Observable Inputs (Level 2) | | | Significant Unobservable Inputs (Level 3) | | | Total | |
Equity securities | | | | | | | | | | | | | | | | |
Common stocks | | $ | 1,037,395,937 | * | | $ | 180,791,762 | * | | $ | 0 | | | $ | 1,218,187,699 | |
Other | | | 0 | | | | 48,258,805 | | | | 0 | | | | 48,258,805 | |
Warrants | | | 0 | | | | 1,693,375 | | | | 0 | | | | 1,693,375 | |
Investment companies | | | 27,991,755 | | | | 0 | | | | 0 | | | | 27,991,755 | |
Short-term investments | | | | | | | | | | | | | | | | |
Investment companies | | | 33,374,468 | | | | 0 | | | | 0 | | | | 33,374,468 | |
| | | $ | 1,098,762,160 | | | $ | 230,743,942 | | | $ | 0 | | | $ | 1,329,506,102 | |
| * | At the end of the period, foreign securities valued in the amount of $180,791,762 in common stocks were transferred out of Level 1 and into Level 2 since adjustments to prices of foreign securities due to movements against a specified benchmark were necessary at September 30, 2011. |
Further details on the major security types listed above can be found in the Fund’s Portfolio of Investments.
4. TRANSACTIONS WITH AFFILIATES AND OTHER EXPENSES
Advisory Fee
The Trust has entered into an advisory contract with Wells Fargo Funds Management, LLC (“Funds Management”), an indirect wholly owned subsidiary of Wells Fargo & Company (“Wells Fargo”). The adviser is responsible for implementing investment policies and guidelines and for supervising the sub-adviser, who is responsible for day-to-day portfolio management of the Fund.
Pursuant to the contract, Funds Management is entitled to receive an annual advisory fee starting at 0.60% and declining to 0.45% as the average daily net assets of the Fund increase. For the six months ended September 30, 2011, the advisory fee was equivalent to an annual rate of 0.55% of the Fund’s average daily net assets.
Funds Management may retain the services of certain sub-advisers to provide daily portfolio management to the Fund. The fees related to sub-advisory services are borne directly by the adviser and do not increase the overall fees paid by the Fund to the adviser. Wells Capital Management Incorporated (“Wells Capital Management”), an affiliate of Funds Management, is the sub-adviser to the Fund and is entitled to receive a fee from the adviser at an annual rate starting at 0.40% and declining to 0.35% as the average daily net assets of the Fund increase.
Administration and transfer agent fees
The Trust has entered into an administration agreement with Funds Management. Under this agreement, for providing administrative services, which includes paying fees and expenses for services provided by the transfer agent, sub-transfer agents, omnibus account servicers and record-keepers, Funds Management is entitled to receive from the Fund an annual fund level administration fee starting at 0.05% and declining to 0.03% as the average daily net assets of the Fund increase and a class level administration fee which is calculated based on the average daily net assets of each class as follows:
| | | | |
| | | Class Level Administration Fee | |
Class A, Class B, Class C | | | 0.26 | % |
Administrator Class | | | 0.10 | |
Institutional Class | | | 0.08 | |
| | | | |
| 22 | | Wells Fargo Advantage Precious Metals Fund | | Notes to Financial Statements (Unaudited) |
Funds Management has contractually waived and/or reimbursed advisory and administration fees to the extent necessary to maintain certain net operating expense ratios for the Fund. Waiver of fees and/or reimbursement of expenses by Funds Management were made first from fund level expenses on a proportionate basis and then from class specific expenses.
Distribution fees
The Trust has adopted a Distribution Plan for Class B and Class C shares of the Fund pursuant to Rule 12b-1 under the 1940 Act. Distribution fees are charged to Class B and Class C shares and paid to Wells Fargo Funds Distributor, LLC, the principal underwriter, at an annual rate of 0.75% of the average daily net assets of Class B and Class C shares.
For the six months ended September 30, 2011, Wells Fargo Funds Distributor, LLC received $104,166 from the sale of Class A shares and $649, $36,483 and $37,858 in contingent deferred sales charges from redemptions of Class A, Class B and Class C shares, respectively.
Shareholder servicing fees
The Trust has entered into contracts with one or more shareholder servicing agents, whereby Class A, Class B, Class C and Administrator Class of the Fund is charged a fee at an annual rate of 0.25% of the average daily net assets of each respective class.
A portion of these total shareholder servicing fees were paid to affiliates of Wells Fargo.
5. INVESTMENT PORTFOLIO TRANSACTIONS
Purchases and sales of investments, excluding U.S. Government obligations (if any) and short-term securities (securities with maturities of one year or less at purchase date), for the six months ended September 30, 2011 were $16,663,033 and $104,116,814, respectively.
6. INVESTMENTS IN AFFILIATE
An affiliate company is a company in which the Fund has ownership of at least 5% of the outstanding voting shares. During the six months ended September 30, 2011, the Fund invested in a wholly-owned subsidiary. A summary of the transactions with the affiliate for the six months ended September 30, 2011 was as follows:
| | | | | | | | | | | | | | | | | | | | |
| | | Beginning
Shares | | | Shares
Purchased | | | Shares Sold | | | Amount of Equity in
Net Profit and Loss | | | Value, End of
Period | |
Wells Fargo Special Investments (Cayman) SPC | | | 16,335 | | | | 0 | | | | 0 | | | $ | 21,291,483 | | | $ | 48,258,805 | |
7. BANK BORROWINGS
The Trust (excluding the money market funds) and Wells Fargo Variable Trust are parties to a $150,000,000 revolving credit agreement with State Street Bank and Trust Company, whereby the Fund is permitted to use bank borrowings for temporary or emergency purposes, such as to fund shareholder redemption requests. Interest under the credit agreement is charged to the Fund based on a borrowing rate equal to the higher of the Federal Funds rate in effect on that day plus 1.25% or the overnight LIBOR rate in effect on that day plus 1.25%. In addition, under the credit agreement, the Fund pays an annual commitment fee equal to 0.10% of the unused balance, which is allocated pro rata. Prior to September 6, 2011, the revolving credit agreement was for $125,000,000 and the annual commitment fee paid by the Fund was 0.125% of the unused balance. For the six months ended September 30, 2011, the Fund paid $1,788 in commitment fees.
During the six months ended September 30, 2011, the Fund had average borrowings outstanding of $16,000 (on an annualized basis) at a rate of 1.40% and paid interest of $224.
8. CONCENTRATION RISK
The Fund invests a substantial portion of its assets in precious metals and therefore, may be more affected by changes in that sector than would be a comparable mutual fund that is not heavily weighted in any sector.
| | | | | | |
| Notes to Financial Statements (Unaudited) | | Wells Fargo Advantage Precious Metals Fund | | | 23 | |
9. INDEMNIFICATION
Under the Trust’s organizational documents, the officers and directors are indemnified against certain liabilities that may arise out of performance of their duties to the Trust. Additionally, in the normal course of business, the Trust may enter into contracts with service providers that contain a variety of indemnification clauses. The Trust’s maximum exposure under these arrangements is dependent on future claims that may be made against the Fund and, therefore, cannot be estimated.
10. NEW ACCOUNTING PRONOUNCEMENTS
In May 2011, the Financial Accounting Standards Board (“FASB”) issued Accounting Standards Update (“ASU”) No. 2011-04 “Amendments to Achieve Common Fair Value Measurement and Disclosure Requirements in U.S. GAAP and IFRSs”. ASU No. 2011-04 amends FASB ASC Topic 820, Fair Value Measurements and Disclosures, to establish common requirements for measuring fair value and for disclosing information about fair value measurements in accordance with GAAP. The ASU is effective prospectively for interim and annual periods beginning after December 15, 2011.
In April 2011, FASB issued ASU No. 2011-03 “Reconsideration of Effective Control for Repurchase Agreements”. ASU No. 2011-03 amends FASB ASC Topic 860, Transfers and Servicing, specifically the criteria required to determine whether a repurchase agreement (repo) and similar agreements should be accounted for as sales of financial assets or secured borrowings with commitments. ASU No. 2011-03 changes the assessment of effective control by focusing on the transferor’s contractual rights and obligations and removing the criterion to assess its ability to exercise those rights or honor those obligations. This could result in changes to the way entities account for certain transactions including repurchase agreements, mortgage dollar rolls and reverse repurchase agreements. The ASU will become effective on a prospective basis for new transfers and modifications to existing transactions as of the beginning of the first interim or annual period beginning on or after December 15, 2011.
As of September 30, 2011, management of the Fund is currently assessing the potential impact, in addition to expanded financial statement disclosure, that may result from adopting these ASUs.
| | | | |
| 24 | | Wells Fargo Advantage Precious Metals Fund | | Other Information (Unaudited) |
PROXY VOTING INFORMATION
A description of the policies and procedures that the Fund uses to determine how to vote proxies relating to portfolio securities is available without charge, upon request, by calling 1-800-222-8222, visiting our Web site at www.wellsfargo.com/advantagefunds, or visiting the SEC Web site at www.sec.gov. Information regarding how the Fund voted proxies relating to portfolio securities during the most recent 12-month period ended June 30 is available without charge on the Fund’s Web site at www.wellsfargo.com/advantagefunds or by visiting the SEC Web site at www.sec.gov.
PORTFOLIO HOLDINGS INFORMATION
The complete portfolio holdings for the Fund are publicly available on the Fund’s Web site (www.wellsfargo.com/advantagefunds) on a monthly, 30-day or more delayed basis. In addition, top ten holdings information for the Fund is publicly available on the Fund’s Web site on a monthly, seven-day or more delayed basis. The Fund files its complete schedule of portfolio holdings with the SEC for the first and third quarters of each fiscal year on Form N-Q, which is available without charge by visiting the SEC Web site at www.sec.gov. In addition, the Fund’s Form N-Q may be reviewed and copied at the SEC’s Public Reference Room in Washington, DC, and at regional offices in New York City, at 233 Broadway, and in Chicago, at 175 West Jackson Boulevard, Suite 900. Information about the Public Reference Room may be obtained by calling 1-800-SEC-0330.
| | | | | | |
| Other Information (Unaudited) | | Wells Fargo Advantage Precious Metals Fund | | | 25 | |
BOARD OF TRUSTEES
The following table provides basic information about the Board of Trustees (the “Trustees”) of the Trust and Officers of the Trust. This table should be read in conjunction with the Prospectus and the Statement of Additional Information1 of the Fund. Each of the Trustees and Officers listed below acts in identical capacities for the Wells Fargo Advantage family of funds, which consists of 144 funds comprising the Wells Fargo Funds Trust, Wells Fargo Variable Trust, Wells Fargo Master Trust and four closed-end funds (collectively the “Fund Complex”). All of the Trustees are also Members of the Audit and Governance Committees of each Trust in the Fund Complex. The mailing address of each Trustee and Officer is 525 Market Street, 12th Floor, San Francisco, CA 94105. Each Trustee and Officer serves an indefinite term, however, each Trustee serves such term until reaching the mandatory retirement age established by the Trustees.
Independent Trustees
| | | | | | |
Name and Year of Birth | | Position Held and Length of Service | | Principal Occupations During Past Five Years | | Other Directorships During
Past Five Years |
Peter G. Gordon
(Born 1942) | | Trustee, since 1998; Chairman, since 2005 | | Co-Founder, Chairman, President and CEO of Crystal Geyser. Water Company. Trustee Emeritus, Colby College | | Asset Allocation Trust |
Isaiah Harris, Jr.
(Born 1952) | | Trustee, since 2009 | | Retired. Prior thereto, President and CEO of BellSouth Advertising and Publishing Corp. from 2005 to 2007, President and CEO of BellSouth Enterprises from 2004 to 2005 and President of BellSouth Consumer Services from 2000 to 2003. Emeritus member of the Iowa State University Foundation Board of Governors. Emeritus Member of the Advisory Board of Iowa State University School of Business. Mr. Harris is a certified public accountant. | | CIGNA Corporation; Deluxe Corporation; Asset Allocation Trust |
Judith M. Johnson
(Born 1949) | | Trustee, since 2008 | | Retired. Prior thereto, Chief Executive Officer and Chief Investment Officer of Minneapolis Employees Retirement Fund from 1996 to 2008. Ms. Johnson is an attorney, certified public accountant and a certified managerial accountant. | | Asset Allocation Trust |
Leroy Keith, Jr.
(Born 1939) | | Trustee, since 2010 | | Chairman, Bloc Global Services (development and construction), Trustee of the Evergreen Funds from 1983 to 2010. Former Managing Director, Almanac Capital Management (commodities firm), former Partner, Stonington Partners, Inc. (private equity fund), former Director, Obagi Medical Products Co. and former Director, Lincoln Educational Services. | | Trustee, Virtus Fund Complex (consisting of 45 portfolios as of 12/31/10); Director, Diversapack Co. (packaging company); Asset Allocation Trust |
David F. Larcker
(Born 1950) | | Trustee, since 2009 | | James Irvin Miller Professor of Accounting at the Graduate School of Business, Stanford University, Director of Corporate Governance Research Program and Co-Director of The Rock Center for Corporate Governance since 2006. From 2005 to 2008, Professor of Accounting at the Graduate School of Business, Stanford University. Prior thereto, Ernst & Young Professor of Accounting at The Wharton School, University of Pennsylvania from 1985 to 2005. | | Asset Allocation Trust |
Olivia S. Mitchell
(Born 1953) | | Trustee, since 2006 | | International Foundation of Employee Benefit Plans Professor, Wharton School of the University of Pennsylvania since 1993. Director of Wharton’s Pension Research Council and Boettner Center on Pensions & Retirement Research, and Research Associate at the National Bureau of Economic Research. Previously, Cornell University Professor from 1978 to 1993. | | Asset Allocation Trust |
| | | | |
| 26 | | Wells Fargo Advantage Precious Metals Fund | | Other Information (Unaudited) |
| | | | | | |
Name and Year of Birth | | Position Held and Length of Service | | Principal Occupations During Past Five Years | | Other Directorships During
Past Five Years |
Timothy J. Penny
(Born 1951) | | Trustee, since 1996 | | President and CEO of Southern Minnesota Initiative Foundation, a non-profit organization, since 2007 and Senior Fellow at the Humphrey Institute Policy Forum at the University of Minnesota since 1995. Member of the Board of Trustees of NorthStar Education Finance, Inc., a non-profit organization, since 2007. | | Asset Allocation Trust |
Michael S. Scofield
(Born 1943) | | Trustee, since 2010 | | Served on the Investment Company Institute’s Board of Governors and Executive Committee from 2008-2011 as well the Governing Council of the Independent Directors Council from 2006-2011 and the Independent Directors Council Executive Committee from 2008-2011. Chairman of the IDC from 2008-2010. Institutional Investor (Fund Directions) Trustee of Year in 2007. Trustee of the Evergreen Funds (and its predecessors) from 1984 to 2010. Chairman of the Evergreen Funds from 2000-2010. Former Trustee of the Mentor Funds. Retired Attorney, Law Offices of Michael S. Scofield and former Director and Chairman, Branded Media Corporation (multi-media branding company). | | Asset Allocation Trust |
Donald C. Willeke
(Born 1940) | | Trustee, since 1996 | | Principal of the law firm of Willeke & Daniels. General Counsel of the Minneapolis Employees Retirement Fund from 1984 until its consolidation into the Minnesota Public Employees Retirement Association on June 30, 2010. | | Asset Allocation Trust |
Officers
| | | | | | |
Name and Year of Birth | | Position Held and
Length of Service | | Principal Occupations During Past Five Years | | |
Karla M. Rabusch
(Born 1959) | | President, since 2003 | | Executive Vice President of Wells Fargo Bank, N.A. and President of Wells Fargo Funds Management, LLC since 2003. Senior Vice President and Chief Administrative Officer of Wells Fargo Funds Management, LLC from 2001 to 2003. | | |
C. David Messman
(Born 1960) | | Secretary, since 2000; Chief Legal Counsel, since 2003 | | Senior Vice President and Secretary of Wells Fargo Funds Management, LLC since 2001. Vice President and Managing Counsel of Wells Fargo Bank, N.A. since 1996. | | |
Kasey Phillips
(Born 1970) | | Treasurer, since 2008 | | Senior Vice President of Wells Fargo Funds Management, LLC since 2009. Senior Vice President of Evergreen Investment Management Company, LLC from 2006 to 2010. Treasurer of the Evergreen Funds from 2005 to 2010. Vice President and Assistant Vice President of Evergreen Investment Services, Inc. from 1999 to 2006. | | |
David Berardi
(Born 1975) | | Assistant Treasurer, since 2009 | | Vice President of Wells Fargo Funds Management, LLC since 2009 . Vice President of Evergreen Investment Management Company, LLC from 2008 to 2010. Assistant Vice President of Evergreen Investment Services, Inc. from 2004 to 2008. Manager of Fund Reporting and Control for Evergreen Investment Management Company, LLC from 2004 to 2010. | | |
Jeremy DePalma
(Born 1974) | | Assistant Treasurer, since 2009 | | Senior Vice President of Wells Fargo Funds Management, LLC since 2009. Senior Vice President of Evergreen Investment Management Company, LLC from 2008 to 2010. Vice President, Evergreen Investment Services, Inc. from 2004 to 2007. Assistant Vice President, Evergreen Investment Services, Inc. from 2000 to 2004 and the head of the Fund Reporting and Control Team within Fund Administration from 2005 to 2010. | | |
Debra Ann Early
(Born 1964) | | Chief Compliance Officer, since 2007 | | Chief Compliance Officer of Wells Fargo Funds Management, LLC since 2007. Chief Compliance Officer of Parnassus Investments from 2005 to 2007. Chief Financial Officer of Parnassus Investments from 2004 to 2007 and Senior Audit Manager of PricewaterhouseCoopers LLP from 1998 to 2004. | | |
| 1. | The Statement of Additional Information includes additional information about the Fund’s Trustees and is available, without charge, upon request, by calling 1-800-222-8222 or by visiting the Fund’s Web site at www.wellsfargo.com/advantagefunds. |
| | | | | | |
| List of Abbreviations | | Wells Fargo Advantage Precious Metals Fund | | | 27 | |
The following is a list of common abbreviations for terms and entities which may have appeared in this report.
| ACB | — Agricultural Credit Bank |
| ADR | — American Depository Receipt |
| ADS | — American Depository Shares |
| AGC-ICC | — Assured Guaranty Corporation - Insured Custody Certificates |
| AGM | — Assured Guaranty Municipal |
| AMBAC | — American Municipal Bond Assurance Corporation |
| AMT | — Alternative Minimum Tax |
| BAN | — Bond Anticipation Notes |
| BHAC | — Berkshire Hathaway Assurance Corporation |
| CAB | — Capital Appreciation Bond |
| CCAB | — Convertible Capital Appreciation Bond |
| CDA | — Community Development Authority |
| CDO | — Collateralized Debt Obligation |
| COP | — Certificate of Participation |
| DRIVER | — Derivative Inverse Tax-Exempt Receipts |
| DW&P | — Department of Water & Power |
| DWR | — Department of Water Resources |
| ECFA | — Educational & Cultural Facilities Authority |
| EDA | — Economic Development Authority |
| EDFA | — Economic Development Finance Authority |
| ETF | — Exchange-Traded Fund |
| FFCB | — Federal Farm Credit Bank |
| FGIC | — Financial Guaranty Insurance Corporation |
| FHA | — Federal Housing Authority |
| FHLB | — Federal Home Loan Bank |
| FHLMC | — Federal Home Loan Mortgage Corporation |
| FNMA | — Federal National Mortgage Association |
| GDR | — Global Depository Receipt |
| GNMA | — Government National Mortgage Association |
| HCFR | — Healthcare Facilities Revenue |
| HEFA | — Health & Educational Facilities Authority |
| HEFAR | — Higher Education Facilities Authority Revenue |
| HFA | — Housing Finance Authority |
| HFFA | — Health Facilities Financing Authority |
| IBC | — Insured Bond Certificate |
| IDA | — Industrial Development Authority |
| IDAG | — Industrial Development Agency |
| IDR | — Industrial Development Revenue |
| KRW | — Republic of Korea Won |
| LIBOR | — London Interbank Offered Rate |
| LLC | — Limited Liability Company |
| LLP | — Limited Liability Partnership |
| MBIA | — Municipal Bond Insurance Association |
| MFHR | — Multi-Family Housing Revenue |
| MUD | — Municipal Utility District |
| NATL-RE | — National Public Finance Guarantee Corporation |
| PCFA | — Pollution Control Finance Authority |
| PCR | — Pollution Control Revenue |
| PFA | — Public Finance Authority |
| PFFA | — Public Facilities Financing Authority |
| PFOTER | — Puttable Floating Option Tax-Exempt Receipts |
| plc | — Public Limited Company |
| PUTTER | — Puttable Tax-Exempt Receipts |
| R&D | — Research & Development |
| RDA | — Redevelopment Authority |
| RDFA | — Redevelopment Finance Authority |
| REIT | — Real Estate Investment Trust |
| ROC | — Reset Option Certificates |
| SAVRS | — Select Auction Variable Rate Securities |
| SBA | — Small Business Authority |
| SFHR | — Single Family Housing Revenue |
| SFMR | — Single Family Mortgage Revenue |
| SPDR | — Standard & Poor’s Depositary Receipts |
| TAN | — Tax Anticipation Notes |
| TIPS | — Treasury Inflation-Protected Securities |
| TRAN | — Tax Revenue Anticipation Notes |
| TCR | — Transferable Custody Receipts |
| TTFA | — Transportation Trust Fund Authority |
| TVA | — Tennessee Valley Authority |
| XLCA | — XL Capital Assurance |
This page is intentionally left blank.
This page is intentionally left blank.
This page is intentionally left blank.


FOR MORE INFORMATION
More information about Wells Fargo Advantage Funds is available free upon request. To obtain literature, please write, e-mail, visit the Fund’s Web site, or call:
Wells Fargo Advantage Funds
P.O. Box 8266
Boston, MA 02266-8266
E-mail: wfaf@wellsfargo.com
Web site: www.wellsfargo.com/advantagefunds
Individual investors: 1-800-222-8222
Retail investment professionals: 1-888-877-9275
Institutional investment professionals: 1-866-765-0778
This report and the financial statements contained herein are submitted for the general information of the shareholders of Wells Fargo Advantage Funds. If this report is used for promotional purposes, distribution of the report must be accompanied or preceded by a current prospectus. For a prospectus containing more complete information, including charges and expenses, call 1-800-222-8222 or visit the Fund’s Web site at www.wellsfargo.com/advantagefunds. Please consider the investment objectives, risks, charges, and expenses of the investment carefully before investing. This and other information about Wells Fargo Advantage Funds can be found in the current prospectus. Read the prospectus carefully before you invest or send money.
Wells Fargo Funds Management, LLC, a wholly owned subsidiary of Wells Fargo & Company, provides investment advisory and administrative services for Wells Fargo Advantage Funds. Other affiliates of Wells Fargo & Company provide subadvisory and other services for the Funds. The Funds are distributed by Wells Fargo Funds Distributor, LLC, Member FINRA/SIPC, an affiliate of Wells Fargo & Company.
NOT FDIC INSURED ¡ NO BANK GUARANTEE ¡ MAY LOSE VALUE
© 2011 Wells Fargo Funds Management, LLC. All rights reserved.
| | |
 | | 205633 11-11 SA316/SAR316 9-11 |

Wells Fargo Advantage
Specialized Technology Fund

Semi-Annual Report
September 30, 2011


WELLS FARGO INVESTMENT HISTORY
| | |
| |
| 1932 | | Keystone creates one of the first mutual fund families. |
| |
| 1971 | | Wells Fargo & Company introduces one of the first institutional index funds. |
| |
| 1978 | | Wells Fargo applies Markowitz and Sharpe’s research on Modern Portfolio Theory to introduce one of the industry’s first Tactical Asset Allocation (TAA) models in institutional separately managed accounts. |
| |
| 1984 | | Wells Fargo Stagecoach Funds launches its first asset allocation fund. |
| |
| 1989 | | The Tactical Asset Allocation (TAA) Model is first applied to Wells Fargo’s asset allocation mutual funds. |
| |
| 1994 | | Wells Fargo introduces the LifePath Funds, one of the first suites of target date funds (now the Wells Fargo Advantage Dow Jones Target Date FundsSM ). |
| |
| 1996 | | Evergreen Investments and Keystone Funds merge. |
| |
| 1997 | | Wells Fargo launches Wells Fargo Advantage WealthBuilder PortfoliosSM, a fund-of-funds suite of products that includes the use of quantitative models to shift assets among investment styles. |
| |
| 1999 | | Norwest Advantage Funds and Stagecoach Funds are reorganized into Wells Fargo Funds after the merger of Norwest and Wells Fargo. |
| |
| 2002 | | Evergreen Retail and Evergreen Institutional companies form the umbrella asset management company, Evergreen Investments. |
| |
| 2005 | | The integration of Strong Funds with Wells Fargo Funds creates Wells Fargo Advantage Funds, resulting in one of the top 20 mutual fund companies in the United States. |
| |
| 2006 | | Wells Fargo Advantage Funds relaunches the target date product line as Wells Fargo Advantage Dow Jones Target Date Funds. |
| |
| 2010 | | The mergers and reorganizations of Evergreen and Wells Fargo Advantage mutual funds are completed, unifying the families under the brand of Wells Fargo Advantage Funds. |
Wells Fargo Advantage Funds®
Wells Fargo Advantage Funds skillfully guides institutions, financial advisors, and individuals through the investment terrain to help them reach their financial objectives. Everything we do on behalf of investors is backed by our unique combination of qualifications.
Strength
Our organization is built on the standards of integrity and service established by our parent company—Wells Fargo & Company—more than 150 years ago. And, because we’re part of a highly diversified financial enterprise, we offer the depth of resources to help investors succeed.
Expertise
Our multi-boutique model offers investors access to the independent thinking of premier investment managers that have been chosen for their time-tested strategies. While each team specializes in a specific investment strategy, collectively they provide investors a wide choice of distinct investment styles. Our dedication to investment excellence doesn’t end with our expertise in manager selection—risk management, analysis, and rigorous ongoing review seek to ensure each manager’s investment process remains consistent.
Partnership
Our collaborative approach is built around understanding the needs and goals of our clients. By adhering to core principles of sound judgment and steady guidance, we support you through every stage of the investment decision process.
Carefully consider the investment objectives, risks, charges, and expenses before investing. For a current prospectus for Wells Fargo Advantage Funds containing this and other information, visit wellsfargo.com/advantagefunds. Read it carefully before investing.
Wells Fargo Funds Management, LLC, a wholly owned subsidiary of Wells Fargo & Company, provides investment advisory and administrative services for Wells Fargo Advantage Funds®. Other affiliates of Wells Fargo & Company provide subadvisory and other services for the Funds. The Funds are distributed by Wells Fargo Funds Distributor, LLC, Member FINRA/SIPC, an affiliate of Wells Fargo & Company.
The “Dow Jones Target Date Indexes” are a product of Dow Jones Indexes, a licensed trademark of CME Group Index Services LLC (“CME”). “Dow Jones” and “Dow Jones Target Date Indexes” are service marks of Dow Jones Trademark Holdings, LLC, and have been licensed for use for certain purposes by CME and sublicensed for use by Global Index Advisors, Inc., and Wells Fargo Funds Management, LLC. The Dow Jones Target Date Indexes are based in part on the Barclays Capital Bond Indexes, which are published by Barclays Capital Inc. The Wells Fargo Advantage Dow Jones Target Date Funds, based on the Dow Jones Target Date Indexes, are not sponsored, endorsed, sold, or promoted by Dow Jones, CME or Barclays Capital or any of their respective affiliates, and neither Dow Jones, CME nor Barclays Capital nor any of their respective affiliates makes any representation regarding the advisability of investing in such product(s) and/or about the quality, accuracy, and/or completeness of the Dow Jones Target Date Indexes or the Barclays Capital Bond Indexes. IN NO EVENT SHALL DOW JONES, CME, BARCLAYS CAPITAL, OR ANY OF THEIR LICENSORS HAVE ANY LIABILITY IN CONNECTION WITH THE Wells Fargo Advantage Dow Jones Target Date Funds INCLUDING, WITHOUT LIMITATION, FOR ANY SPECIAL, PUNITIVE, IN DIRECT, OR CONSEQUENTIAL DAMAGES (INCLUDING LOST PROFITS), EVEN IF NOTIFIED OF THE POSSIBILITY OF SUCH DAMAGES.
NOT FDIC INSURED ¡ NO BANK GUARANTEE ¡ MAY LOSE VALUE
Not part of the semi-annual report.
Wells Fargo Advantage Funds offers more than 110 mutual funds across a wide range of asset classes, representing over $213 billion in assets under management, as of September 30, 2011.
| | | | |
| Equity Funds | | | | |
Asia Pacific Fund | | Global Opportunities Fund | | Premier Large Company Growth Fund |
C&B Large Cap Value Fund | | Growth Fund | | Small Cap Opportunities Fund |
C&B Mid Cap Value Fund | | Health Care Fund | | Small Cap Value Fund |
Capital Growth Fund | | Index Fund | | Small Company Growth Fund |
Common Stock Fund | | International Equity Fund | | Small Company Value Fund |
Disciplined U.S. Core Fund | | International Value Fund | | Small/Mid Cap Core Fund |
Discovery Fund† | | Intrinsic Small Cap Value Fund | | Small/Mid Cap Value Fund |
Diversified Equity Fund | | Intrinsic Value Fund | | Social Sustainability Fund† |
Diversified International Fund | | Intrinsic World Equity Fund | | Special Mid Cap Value Fund |
Diversified Small Cap Fund | | Large Cap Core Fund | | Special Small Cap Value Fund |
Emerging Growth Fund | | Large Cap Growth Fund | | Specialized Technology Fund |
Emerging Markets Equity Fund | | Large Company Value Fund | | Strategic Large Cap Growth Fund |
Endeavor Select Fund† | | Omega Growth Fund | | Traditional Small Cap Growth Fund |
Enterprise Fund† | | Opportunity Fund† | | Utility and Telecommunications Fund |
Equity Value Fund | | Precious Metals Fund | | |
| Bond Funds | | | | |
Adjustable Rate Government Fund | | Inflation-Protected Bond Fund | | Short-Term Bond Fund |
California Limited-Term Tax-Free Fund | | Intermediate Tax/AMT-Free Fund | | Short-Term High Yield Bond Fund |
California Tax-Free Fund | | International Bond Fund | | Short-Term Municipal Bond Fund |
Colorado Tax-Free Fund | | Minnesota Tax-Free Fund | | Strategic Municipal Bond Fund |
Government Securities Fund | | Municipal Bond Fund | | Total Return Bond Fund |
High Income Fund | | North Carolina Tax-Free Fund | | Ultra Short-Term Income Fund |
High Yield Bond Fund | | Pennsylvania Tax-Free Fund | | Ultra Short-Term Municipal Income Fund |
Income Plus Fund | | Short Duration Government Bond Fund | | Wisconsin Tax-Free Fund |
| Asset Allocation Funds | | | | |
Asset Allocation Fund | | WealthBuilder Equity Portfolio† | | Target 2020 Fund† |
Conservative Allocation Fund | | WealthBuilder Growth Allocation Portfolio† | | Target 2025 Fund† |
Diversified Capital Builder Fund | | WealthBuilder Growth Balanced Portfolio† | | Target 2030 Fund† |
Diversified Income Builder Fund | | WealthBuilder Moderate Balanced Portfolio† | | Target 2035 Fund† |
Growth Balanced Fund | | WealthBuilder Tactical Equity Portfolio† | | Target 2040 Fund† |
Index Asset Allocation Fund | | Target Today Fund† | | Target 2045 Fund† |
Moderate Balanced Fund | | Target 2010 Fund† | | Target 2050 Fund† |
WealthBuilder Conservative Allocation Portfolio† | | Target 2015 Fund† | | Target 2055 Fund† |
| Money Market Funds | | | | |
100% Treasury Money Market Fund | | Minnesota Money Market Fund | | New Jersey Municipal Money Market Fund |
California Municipal Money Market Fund | | Money Market Fund | | New York Municipal Money Market Fund |
Cash Investment Money Market Fund | | Municipal Cash Management Money Market Fund | | Pennsylvania Municipal Money Market Fund |
Government Money Market Fund | | Municipal Money Market Fund | | Prime Investment Money Market Fund |
Heritage Money Market Fund† | | National Tax-Free Money Market Fund | | Treasury Plus Money Market Fund |
| Variable Trust Funds1 | | | | |
VT Discovery Fund† | | VT Intrinsic Value Fund | | VT Small Cap Growth Fund |
VT Index Asset Allocation Fund | | VT Omega Growth Fund | | VT Small Cap Value Fund |
VT International Equity Fund | | VT Opportunity Fund† | | VT Total Return Bond Fund |
An investment in a money market fund is not insured or guaranteed by the Federal Deposit Insurance Corporation or any other government agency. Although the Wells Fargo Advantage Money Market Funds seek to preserve the value of your investment at $1.00 per share, it is possible to lose money by investing in a money market fund.
| 1. | The Variable Trust Funds are generally available only through insurance company variable contracts. |
| † | In this report, the Wells Fargo Advantage Discovery FundSM, Wells Fargo Advantage Endeavor Select FundSM, Wells Fargo Advantage Enterprise FundSM, Wells Fargo Advantage Opportunity FundSM, Wells Fargo Advantage Social Sustainability FundSM, Wells Fargo Advantage WealthBuilder Conservative Allocation PortfolioSM, Wells Fargo Advantage WealthBuilder Equity PortfolioSM, Wells Fargo Advantage WealthBuilder Growth Allocation PortfolioSM, Wells Fargo Advantage WealthBuilder Growth Balanced PortfolioSM, Wells Fargo Advantage WealthBuilder Moderate Balanced PortfolioSM, Wells Fargo Advantage WealthBuilder Tactical Equity PortfolioSM, Wells Fargo Advantage Dow Jones Target Today FundSM, Wells Fargo Advantage Dow Jones Target 2010 FundSM, Wells Fargo Advantage Dow Jones Target 2015 FundSM, Wells Fargo Advantage Dow Jones Target 2020 FundSM, Wells Fargo Advantage Dow Jones Target 2025 FundSM, Wells Fargo Advantage Dow Jones Target 2030 FundSM, Wells Fargo Advantage Dow Jones Target 2035 FundSM, Wells Fargo Advantage Dow Jones Target 2040 FundSM, Wells Fargo Advantage Dow Jones Target 2045 FundSM, Wells Fargo Advantage Dow Jones Target 2050 FundSM, Wells Fargo Advantage Dow Jones Target 2055 FundSM, Wells Fargo Advantage Heritage Money Market FundSM, Wells Fargo Advantage VT Discovery FundSM, and Wells Fargo Advantage VT Opportunity FundSM are referred to as the Discovery Fund, Endeavor Select Fund, Enterprise Fund, Opportunity Fund, Social Sustainability Fund, WealthBuilder Conservative Allocation Portfolio, WealthBuilder Equity Portfolio, WealthBuilder Growth Allocation Portfolio, WealthBuilder Growth Balanced Portfolio, WealthBuilder Moderate Balanced Portfolio, WealthBuilder Tactical Equity Portfolio, Target Today Fund, Target 2010 Fund, Target 2015 Fund, Target 2020 Fund, Target 2025 Fund, Target 2030 Fund, Target 2035 Fund, Target 2040 Fund, Target 2045 Fund, Target 2050 Fund, Target 2055 Fund, Heritage Money Market Fund, VT Discovery Fund, and VT Opportunity Fund, respectively. |
Not part of the semi-annual report.
| | | | |
| 2 | | Wells Fargo Advantage Specialized Technology Fund | | Letter to Shareholders |

Karla M. Rabusch,
President
Wells Fargo Advantage Funds
All major areas of the global stock market ended with losses, with most of the decline occurring in the second half of the period.
Dear Valued Shareholder:
We’re pleased to offer you this semi-annual report for the Wells Fargo Advantage Specialized Technology Fund for the six-month period that ended September 30, 2011. Upon reviewing the report, you may notice a few changes from past reports, the most significant of which is the change from a multi-fund report to a single-fund report. We believe this change will give you more convenient access to your fund data.
The period was marked by growing pessimism about the economy and, consequently, increased market volatility as a variety of macroeconomic events—including the ongoing European sovereign debt crisis and the downgrade of the U.S. credit rating by Standard & Poor’s—caused investors to question the strength of the economic recovery. All major areas of the global stock market ended with losses, with most of the decline occurring in the second half of the period.
Market sentiment darkened as economic numbers weakened.
Prior to the period, economic numbers seemed to support the view of a gradual global economic recovery. However, growth in gross domestic product (GDP) for the first quarter of 2011 was initially reported at 1.8% but was later revised significantly downward to 0.4%. The amount of the downward revision not only reawakened fears that the economy was slowing, but also caused investors to put less of an emphasis on the 1.3% estimate for second-quarter GDP growth. The prolonged debate in the summer of 2011 over increasing the U.S. debt ceiling, which raised the possibility of the country defaulting on its debt, further weakened investor sentiment. Although the debate was resolved in time to prevent a default, Standard & Poor’s later cited the country’s dysfunctional political climate as one reason why it lowered the U.S. credit rating to AA+ from AAA1.
Persistent weakness in jobs and housing slowed economic growth.
The unemployment rate remained stubbornly high throughout the six-month period, beginning the period at 9.0% in April 2011 and ending the period modestly higher at 9.1% in September 2011. Widespread frustration over the continued weakness in the labor market was one factor behind the “Occupy Wall Street” protest movement that began in September 2011. Persistent weakness in the housing market remained another source of concern. By September, some market analysts were openly discussing the possibility of a return to recession; even those analysts who forecasted a continued recovery believed that it would occur only gradually. The end result was a U.S. stock market that weakened in June and recovered in July, then fell sharply in August and September to end the period with significant losses.
Europe’s sovereign debt problems continued to weigh on confidence.
The ongoing drama of the European sovereign debt crisis returned to center stage, as it became increasingly likely that eurozone member Greece would default on its sovereign debt, despite receiving aid from the European Union and
| 1. | The ratings indicated are from Standard & Poor’s. Credit quality ratings apply to underlying holdings of the Fund and not the Fund itself. Standard and Poor’s rates the creditworthiness of bonds, ranging from AAA (highest) to D (lowest). Ratings from A to CCC may be modified by the addition of a plus (+) or minus (-) sign to show relative standing within the rating categories. |
| | | | | | |
| Letter to Shareholders | | Wells Fargo Advantage Specialized Technology Fund | | | 3 | |
the International Monetary Fund. Because many eurozone banks owned Greek debt, and many U.S. banks had financial ties to eurozone banks, investors worried about the effect of such an event on the global economy and financial system. Meanwhile, market participants increasingly worried about the debt burdens of Italy—which also had its credit rating downgraded by Standard & Poor’s—and later of France. Although France maintained its AAA rating as of the end of the period, French banks were heavily exposed to weaker sovereign credits, leading to fears of a state bailout and a resulting increase in France’s required expenditures. Partly because of the debt worries, European stock markets generally ended the period with losses.
Central banks continued to provide stimulus.
Throughout the reporting period, the Federal Open Market Committee kept its key interest rates at effectively zero in order to support the financial system. As previously planned, the Federal Reserve (Fed) ended its second round of quantitative easing (QE2)—in which it purchased a total of $600 billion in long-term U.S. Treasuries from November 2010 through June 2011—as well as reinvested an additional $250 billion to $300 billion in Treasuries with the proceeds from earlier investments. However, in response to extreme market volatility and signs of a weakening economy, in early August 2011, the Fed announced its intention to keep interest rates low until 2013. In September, the Fed implemented a program to sell $400 billion in short-term Treasuries in exchange for longer-term bonds—so-called “Operation Twist”—with the goal of pushing down long-term yields.
At the beginning of the period, the European Central Bank (ECB) had a key rate of 1.00%, but it raised it to 1.25% in April and then to 1.50% in July in an attempt to keep inflation in check. The ECB continued to provide unlimited liquidity for banks and, in August, after a sell-off in the sovereign bonds of Spain and Italy, announced plans to purchase the debt of those countries.
Global stock markets sold off during the period.
Stocks began the period rallying on hopes of a continued economic recovery, only to sell off sharply in late summer. For the period, economically sensitive stocks generally posted the deepest losses. As a result, the stocks of smaller companies—which generally have less access to capital and less diversified revenue streams than larger companies—performed the worst. The weaker economy also renewed concerns about potential loan losses at banks and other financial institutions. Among both large caps and small caps, growth stocks posted narrower losses than value stocks, largely because of weakness in financials (which are typically considered part of the value space). More defensive sectors such as health care and utilities generally outperformed. In addition, a rally in gold helped gold-related stocks post better returns than the broader market.
Many variables are at work in the market.
The full effect of the credit crisis remains unknown. Elevated unemployment and debt defaults continue to pressure consumers and businesses alike.
In this environment, experience tells us that strict adherence to time-tested strategies has its rewards. Wells Fargo Advantage Funds represents investments across a range of asset classes and investment styles, giving you an opportunity to
Stocks began the period rallying on hopes of a continued economic recovery, only to sell off sharply in late summer.
| | | | |
| 4 | | Wells Fargo Advantage Specialized Technology Fund | | Letter to Shareholders |
create a diversified investment portfolio. While diversification may not prevent losses in a downturn, it does provide you with one way of managing risk.
Thank you for choosing to invest with Wells Fargo Advantage Funds. We appreciate your confidence in us and remain committed to helping you meet your financial needs. For current information about your fund investments, contact your investment professional, visit our website at www.wellsfargo.com/advantagefunds, or call us directly at 1-800-222-8222. We are available 24 hours a day, 7 days a week.
Sincerely,

Karla M. Rabusch
President
Wells Fargo Advantage Funds
| | | | | | |
| Performance Highlights (Unaudited) | | Wells Fargo Advantage Specialized Technology Fund | | | 5 | |
INVESTMENT OBJECTIVE
The Fund seeks long-term capital appreciation.
ADVISER
Wells Fargo Funds Management, LLC
SUB-ADVISER
RCM Capital Management, LLC
PORTFOLIO MANAGERS
Huachen Chen, CFA
Walter C. Price, Jr., CFA
FUND INCEPTION
September 18, 2000
| | | | |
TEN LARGEST EQUITY HOLDINGS1
(AS OF SEPTEMBER 30, 2011) | |
Apple Incorporated | | | 14.49% | |
Microsoft Corporation | | | 8.66% | |
Oracle Corporation | | | 5.33% | |
Amazon.com Incorporated | | | 4.24% | |
Intuit Incorporated | | | 3.56% | |
TIBCO Software Incorporated | | | 3.29% | |
Google Incorporated Class A | | | 3.01% | |
Intel Corporation | | | 3.01% | |
Salesforce.com Incorporated | | | 2.96% | |
Hitachi Limited | | | 2.73% | |
| | |
INDUSTRY DISTRIBUTION2 (AS OF SEPTEMBER 30, 2011) |
|
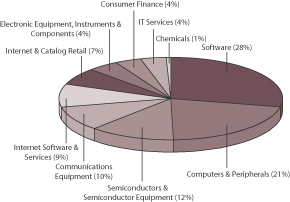 |
| 1. | The ten largest equity holdings are calculated based on the value of the securities divided by total net assets of the Fund. Holdings are subject to change and may have changed since the date specified. |
| 2. | Industry distribution is subject to change and is calculated based on the total long-term investments of the Fund. |
| | | | |
| 6 | | Wells Fargo Advantage Specialized Technology Fund | | Performance Highlights (Unaudited) |
AVERAGE ANNUAL TOTAL RETURN3 (%) (AS OF SEPTEMBER 30, 2011)
| | | | | | | | | | | | | | | | | | | | | | | | | | | | | | | | | | | | | | | | | | | | |
| | | | | | Including Sales Charge | | | Excluding Sales Charge | | | Expense Ratios4 | |
| | | Inception Date | | | 6 Months* | | | 1 Year | | | 5 Year | | | 10 Year | | | 6 Months* | | | 1 Year | | | 5 Year | | | 10 Year | | | Gross | | | Net5 | |
Class A (WFSTX) | | | 09/18/2000 | | | | (24.12 | ) | | | (8.93 | ) | | | 4.94 | | | | 8.36 | | | | (19.50 | ) | | | (3.38 | ) | | | 6.18 | | | | 8.99 | | | | 1.69% | | | | 1.69% | |
Class B (WFTBX)** | | | 09/18/2000 | | | | (24.88 | ) | | | (9.23 | ) | | | 5.04 | | | | 8.39 | | | | (19.88 | ) | | | (4.23 | ) | | | 5.36 | | | | 8.39 | | | | 2.44% | | | | 2.44% | |
Class C (WFTCX) | | | 09/18/2000 | | | | (20.80 | ) | | | (5.09 | ) | | | 5.37 | | | | 8.14 | | | | (19.80 | ) | | | (4.09 | ) | | | 5.37 | | | | 8.14 | | | | 2.44% | | | | 2.44% | |
Administrator Class (WFTDX) | | | 07/30/2010 | | | | | | | | | | | | | | | | | | | | (19.37 | ) | | | (3.11 | ) | | | 6.24 | | | | 9.02 | | | | 1.53% | | | | 1.52% | |
Investor Class (WFTZX) | | | 04/08/2005 | | | | | | | | | | | | | | | | | | | | (19.52 | ) | | | (3.54 | ) | | | 6.07 | | | | 8.85 | | | | 1.76% | | | | 1.76% | |
S&P North American Technology Index6 | | | | | | | | | | | | | | | | | | | | | | | (11.69 | ) | | | 2.30 | | | | 3.74 | | | | 4.66 | | | | | | | | | |
S&P 500 Index7 | | | | | | | | | | | | | | | | | | | | | | | (13.78 | ) | | | 1.14 | | | | (1.18 | ) | | | 2.82 | | | | | | | | | |
| * | Returns for periods of less than one year are not annualized. |
| ** | Class B shares are closed to investment, except in connection with the reinvestment of any distributions and permitted exchanges. |
Figures quoted represent past performance, which is no guarantee of future results and do not reflect the deduction of taxes that a shareholder may pay on fund distributions or the redemption of fund shares. Investment return and principal value of an investment will fluctuate so that an investor’s shares, when redeemed, may be worth more or less than their original cost. Performance shown without sales charges would be lower if sales charges were reflected. Current performance may be lower or higher than the performance data quoted and assumes the reinvestment of dividends and capital gains. Current month-end performance is available on the Fund’s Web site – www.wellsfargo.com/advantagefunds.
Index returns do not include transaction costs associated with buying and selling securities, any mutual fund fees or expenses or any taxes. It is not possible to invest directly in an index.
For Class A shares, the maximum front-end sales charge is 5.75%. For Class B shares, the maximum contingent deferred sales charge is 5.00%. For Class C shares, the maximum contingent deferred sales charge is 1.00%. Performance including sales charge assumes the sales charge for the corresponding time period. Administrator Class and Investor Class shares are sold without a front-end sales charge or contingent deferred sales charge.
Stock fund values fluctuate in response to the activities of individual companies and general market and economic conditions. The use of derivatives may reduce returns and/or increase volatility. Funds that concentrate their investments in limited sectors may be susceptible to financial, economic or market events impacting those sectors. Certain investment strategies tend to increase the total risk of an investment (relative to the broader market). This Fund is exposed to foreign investment risk, non-diversification risk, and smaller company securities risk. Consult the Fund’s prospectus for additional information on these and other risks.
| 3. | Historical performance shown for the Administrator Class shares prior to their inception reflects the performance of Class A shares, and includes the higher expenses applicable to Class A shares. If these expenses had not been included, returns would be higher. Historical performance shown for the Investor Class shares prior to their inception reflects the performance of Class A shares, adjusted to reflect the higher expenses applicable to the Investor Class shares. Effective June 20, 2008, Class Z was renamed Investor Class and modified to assume the features and attributes of the Investor Class. |
| 4. | Reflects the expense ratios as stated in the most recent prospectuses. |
| 5. | The Adviser has committed through July 31, 2013 to waive fees and/or reimburse expenses to the extent necessary to cap the Fund’s Total Annual Fund Operating Expenses After Fee Waiver, excluding certain expenses, at 1.70% for Class A, 2.45% for Class B, 2.45% for Class C, 1.50% for Administrator Class and 1.77% for Investor Class. Without this cap, the Fund’s returns would have been lower. |
| 6. | The S&P North American Technology Index (formerly the Goldman Sachs Technology Index) is a modified capitalization-weighted index of selected technology stocks. You cannot invest directly in an index. |
| 7. | The S&P 500 Index consists of 500 stocks chosen for market size, liquidity, and industry group representation. It is a market-value weighted index with each stock’s weight in the index proportionate to its market value. You cannot invest directly in an index. |
| | | | | | |
| Fund Expenses (Unaudited) | | Wells Fargo Advantage Specialized Technology Fund | | | 7 | |
As a shareholder of the Fund, you incur two types of costs: (1) transaction costs, including sales charges (loads) on purchase payments and contingent deferred sales charges (if any) on redemptions and (2) ongoing costs, including management fees; distribution (12b-1) and/or shareholder service fees; and other Fund expenses. This example is intended to help you understand your ongoing costs (in dollars) of investing in the Fund and to compare these costs with the ongoing costs of investing in other mutual funds.
The example is based on an investment of $1,000 invested at the beginning of the six-month period and held for the entire period from April 1, 2011 to September 30, 2011.
Actual Expenses
The “Actual” line of the table below provides information about actual account values and actual expenses. You may use the information in this line, together with the amount you invested, to estimate the expenses that you paid over the period. Simply divide your account value by $1,000 (for example, an $8,600 account value divided by $1,000 = 8.6), then multiply the result by the number in the “Actual” line under the heading entitled “Expenses Paid During Period” for your applicable class of shares to estimate the expenses you paid on your account during this period.
Hypothetical Example for Comparison Purposes
The “Hypothetical” line of the table below provides information about hypothetical account values and hypothetical expenses based on the Fund’s actual expense ratio and an assumed rate of return of 5% per year before expenses, which is not the Fund’s actual return. The hypothetical account values and expenses may not be used to estimate the actual ending account balance or expenses you paid for the period. You may use this information to compare the ongoing costs of investing in the Fund and other funds. To do so, compare this 5% hypothetical example with the 5% hypothetical examples that appear in the shareholder reports of the other funds.
Please note that the expenses shown in the table are meant to highlight your ongoing costs only and do not reflect any transactional costs, such as sales charges (loads) and contingent deferred sales charges. Therefore, the “Hypothetical” line of the table is useful in comparing ongoing costs only, and will not help you determine the relative total costs of owning different funds. In addition, if these transactional costs were included, your costs would have been higher.
| | | | | | | | | | | | | | | | |
| | | Beginning
Account Value
04-01-2011 | | | Ending
Account Value
09-30-2011 | | | Expenses
Paid During
the Period1 | | | Net Annual
Expense Ratio | |
Class A | | | | | | | | | | | | | | | | |
Actual | | $ | 1,000.00 | | | $ | 804.96 | | | $ | 7.67 | | | | 1.70 | % |
Hypothetical (5% return before expenses) | | $ | 1,000.00 | | | $ | 1,016.50 | | | $ | 8.57 | | | | 1.70 | % |
Class B | | | | | | | | | | | | | | | | |
Actual | | $ | 1,000.00 | | | $ | 801.22 | | | $ | 11.03 | | | | 2.45 | % |
Hypothetical (5% return before expenses) | | $ | 1,000.00 | | | $ | 1,012.75 | | | $ | 12.33 | | | | 2.45 | % |
Class C | | | | | | | | | | | | | | | | |
Actual | | $ | 1,000.00 | | | $ | 801.96 | | | $ | 11.04 | | | | 2.45 | % |
Hypothetical (5% return before expenses) | | $ | 1,000.00 | | | $ | 1,012.75 | | | $ | 12.33 | | | | 2.45 | % |
Administrator Class | | | | | | | | | | | | | | | | |
Actual | | $ | 1,000.00 | | | $ | 806.31 | | | $ | 6.73 | | | | 1.49 | % |
Hypothetical (5% return before expenses) | | $ | 1,000.00 | | | $ | 1,017.55 | | | $ | 7.52 | | | | 1.49 | % |
Investor Class | | | | | | | | | | | | | | | | |
Actual | | $ | 1,000.00 | | | $ | 804.77 | | | $ | 7.99 | | | | 1.77 | % |
Hypothetical (5% return before expenses) | | $ | 1,000.00 | | | $ | 1,016.15 | | | $ | 8.92 | | | | 1.77 | % |
| 1. | Expenses paid is equal to the annualized expense ratio of each class multiplied by the average account value over the period, multiplied by the number of days in the most recent fiscal half-year divided by the number of days in the fiscal year (to reflect the one-half year period). |
| | | | |
| 8 | | Wells Fargo Advantage Specialized Technology Fund | | Portfolio of Investments—September 30, 2011 (Unaudited) |
| | | | | | | | | | | | |
| Security Name | | | | | | Shares | | | Value | |
| | | | | | | | | | | | |
| | | |
Common Stocks: 88.93% | | | | | | | | | | |
| | | | |
Consumer Discretionary: 6.33% | | | | | | | | | | | | |
| | | |
| Automobiles: 0.40% | | | | | | | | | | |
Tesla Motors Incorporated†« | | | | | | | 34,212 | | | $ | 834,431 | |
| | | | | | | | | | | | |
| | | |
| Internet & Catalog Retail: 5.93% | | | | | | | | | | |
Amazon.com Incorporated† | | | | | | | 41,060 | | | | 8,878,404 | |
Ctrip.com International Limited ADR†« | | | | | | | 12,730 | | | | 409,397 | |
priceline.com Incorporated† | | | | | | | 6,980 | | | | 3,137,231 | |
| | | | |
| | | | | | | | | | | 12,425,032 | |
| | | | | | | | | | | | |
| | | | |
Financials: 3.39% | | | | | | | | | | | | |
| | | |
| Consumer Finance: 3.39% | | | | | | | | | | |
MasterCard Incorporated | | | | | | | 10,690 | | | | 3,390,440 | |
Visa Incorporated Class A | | | | | | | 43,290 | | | | 3,710,819 | |
| | | | |
| | | | | | | | | | | 7,101,259 | |
| | | | | | | | | | | | |
| | | | |
Information Technology: 78.62% | | | | | | | | | | | | |
| | | |
| Communications Equipment: 8.52% | | | | | | | | | | |
Acme Packet Incorporated†« | | | | | | | 61,020 | | | | 2,598,842 | |
ADTRAN Incorporated« | | | | | | | 180,180 | | | | 4,767,563 | |
Aruba Networks Incorporated†« | | | | | | | 52,015 | | | | 1,087,634 | |
Cisco Systems Incorporated | | | | | | | 357,535 | | | | 5,538,217 | |
QUALCOMM Incorporated | | | | | | | 28,035 | | | | 1,363,342 | |
Telefonaktiebolaget LM Ericsson ADR« | | | | | | | 216,910 | | | | 2,071,491 | |
Telefonaktiebolaget LM Ericsson Class B | | | | | | | 43,080 | | | | 413,654 | |
| | | | |
| | | | | | | | | | | 17,840,743 | |
| | | | | | | | | | | | |
| | | |
| Computers & Peripherals: 18.90% | | | | | | | | | | |
Apple Incorporated† | | | | | | | 79,570 | | | | 30,330,493 | |
EMC Corporation†« | | | | | | | 181,445 | | | | 3,808,531 | |
Hewlett-Packard Company | | | | | | | 123,670 | | | | 2,776,392 | |
NetApp Incorporated†« | | | | | | | 72,050 | | | | 2,445,377 | |
SanDisk Corporation†« | | | | | | | 5,310 | | | | 214,258 | |
| | | | |
| | | | | | | | | | | 39,575,051 | |
| | | | | | | | | | | | |
| | | |
| Electronic Equipment, Instruments & Components: 3.91% | | | | | | | | | | |
Amphenol Corporation Class A« | | | | | | | 60,795 | | | | 2,478,612 | |
Hitachi Limited | | | | | | | 1,151,000 | | | | 5,713,638 | |
| | | | |
| | | | | | | | | | | 8,192,250 | |
| | | | | | | | | | | | |
| | | |
| Internet Software & Services: 8.03% | | | | | | | | | | |
Baidu Incorporated ADR† | | | | | | | 39,515 | | | | 4,224,549 | |
Google Incorporated Class A† | | | | | | | 12,260 | | | | 6,306,299 | |
Netease.com Incorporated ADR†« | | | | | | | 76,750 | | | | 2,928,780 | |
Phoenix New Media Limited ADR†« | | | | | | | 100,310 | | | | 569,761 | |
Renren Incorporated ADR†« | | | | | | | 911 | | | | 4,646 | |
SINA Corporation†« | | | | | | | 38,935 | | | | 2,788,135 | |
| | | | |
| | | | | | | | | | | 16,822,170 | |
| | | | | | | | | | | | |
| | | | | | |
| Portfolio of Investments—September 30, 2011 (Unaudited) | | Wells Fargo Advantage Specialized Technology Fund | | | 9 | |
| | | | | | | | | | | | | | |
| Security Name | | | | | | | Shares | | | Value | |
| | | | | | | | | | | | | | |
| | | | |
| IT Services: 3.26% | | | | | | | | | | | | | | |
Cognizant Technology Solutions Corporation Class A† | | | | | | | | | 71,510 | | | $ | 4,483,677 | |
International Business Machines Corporation | | | | | | | | | 13,340 | | | | 2,334,900 | |
| | | | |
| | | | | | | | | | | | | 6,818,577 | |
| | | | | | | | | | | | | | |
| | | |
| Semiconductors & Semiconductor Equipment: 10.96% | | | | | | | | | | | |
Analog Devices Incorporated | | | | | | | | | 116,235 | | | | 3,632,344 | |
Atmel Corporation† | | | | | | | | | 112,265 | | | | 905,979 | |
Avago Technologies Limited | | | | | | | | | 24,600 | | | | 806,142 | |
Catcher Technology GDR | | | | | | | | | 110,598 | | | | 3,248,816 | |
Cirrus Logic Incorporated†« | | | | | | | | | 14,595 | | | | 215,130 | |
Cypress Semiconductor Corporation | | | | | | | | | 83,630 | | | | 1,251,941 | |
Intel Corporation | | | | | | | | | 295,025 | | | | 6,292,883 | |
ON Semiconductor Corporation†« | | | | | | | | | 218,325 | | | | 1,565,390 | |
Skyworks Solutions Incorporated†« | | | | | | | | | 107,735 | | | | 1,932,766 | |
Spansion Incorporated Class A† | | | | | | | | | 62,254 | | | | 760,744 | |
Texas Instruments Incorporated | | | | | | | | | 87,258 | | | | 2,325,426 | |
| | | | |
| | | | | | | | | | | | | 22,937,561 | |
| | | | | | | | | | | | | | |
| | | |
| Software: 25.04% | | | | | | | | | | | |
Intuit Incorporated | | | | | | | | | 157,209 | | | | 7,457,995 | |
Microsoft Corporation | | | | | | | | | 728,525 | | | | 18,132,987 | |
Oracle Corporation | | | | | | | | | 388,575 | | | | 11,167,645 | |
Salesforce.com Incorporated†« | | | | | | | | | 54,255 | | | | 6,200,261 | |
TIBCO Software Incorporated† | | | | | | | | | 307,710 | | | | 6,889,627 | |
VMware Incorporated†« | | | | | | | | | 32,075 | | | | 2,578,188 | |
| | | | |
| | | | | | | | | | | | | 52,426,703 | |
| | | | | | | | | | | | | | |
| | | | |
Materials: 0.59% | | | | | | | | | | | | | | |
| | | |
| Chemicals: 0.59% | | | | | | | | | | | |
Monsanto Company | | | | | | | | | 20,677 | | | | 1,241,447 | |
| | | | | | | | | | | | | | |
| | | |
Total Common Stocks (Cost $193,846,194) | | | | | | | | | | 186,215,224 | |
| | | | | | | | | | | | | | |
| | | | |
| | | | | | | | Principal | | | | |
| Other: 0.37% | | | | | | | | | | | |
Gryphon Funding Limited, Pass-Through Entity(a)(i)(v) | | | | | | | | $ | 799,381 | | | | 300,008 | |
VFNC Corporation, Pass-Through Entity 0.24%(a)(i)(v)±144A | | | | | | | | | 927,716 | | | | 473,135 | |
| | | |
Total Other (Cost $344,186) | | | | | | | | | | 773,143 | |
| | | | | | | | | | | | | | |
| | | | |
| | | Yield | | | | | Shares | | | | |
| | | |
Short-Term Investments: 21.94% | | | | | | | | | | | |
| | | |
| Investment Companies: 21.94% | | | | | | | | | | | |
Wells Fargo Advantage Cash Investment Money Market Fund, Institutional Class(l)(u) | | | 0.06 | % | | | | | 19,438,714 | | | | 19,438,714 | |
Wells Fargo Securities Lending Cash Investments, LLC(v)(l)(u)(r) | | | 0.20 | | | | | | 26,490,731 | | | | 26,490,731 | |
| | | |
Total Short-Term Investments (Cost $45,929,445) | | | | | | | | | | 45,929,445 | |
| | | | | | | | | | | | | | |
| | | | | | | | |
| Total Investments in Securities | | | | | | | | |
| (Cost $240,119,825)* | | | 111.24 | % | | | 232,917,812 | |
Other Assets and Liabilities, Net | | | (11.24 | ) | | | (23,532,883 | ) |
| | | | | | | | |
| Total Net Assets | | | 100.00 | % | | $ | 209,384,929 | |
| | | | | | | | |
| | | | |
| 10 | | Wells Fargo Advantage Specialized Technology Fund | | Portfolio of Investments—September 30, 2011 (Unaudited) |
| † | Non-income earning security. |
| « | All or a portion of this security is on loan. |
| (a) | Security is fair valued by the Management Valuation Team, and in certain instances by the Board of Trustees, in accordance with procedures approved by the Board of Trustees. |
| (v) | Security represents investment of cash collateral received from securities on loan. |
| ± | Variable rate investment. |
| 144A | Security that may be resold to “qualified institutional buyers” under Rule 144A or securities offered pursuant to Section 4(2) of the Securities Act of 1933, as amended. |
| (l) | Investment in an affiliate. |
| (u) | Rate shown is the 7-day annualized yield at period end. |
| (r) | The investment company is exempt from registration under Section 3(c)(7) of the 1940 Act. |
| * | Cost for federal income tax purposes is $240,309,337 and net unrealized appreciation (depreciation) consists of: |
| | | | |
Gross unrealized appreciation | | $ | 12,599,936 | |
Gross unrealized depreciation | | | (19,991,461 | ) |
| | | | |
Net unrealized depreciation | | $ | (7,391,525 | ) |
The accompanying notes are an integral part of these financial statements.
| | | | | | |
| Statement of Assets and Liabilities—September 30, 2011 (Unaudited) | | Wells Fargo Advantage Specialized Technology Fund | | | 11 | |
| | | | |
| | | | |
| |
Assets | | | | |
Investments | | | | |
In unaffiliated securities (including securities on loan), at value | | $ | 186,988,367 | |
In affiliated securities, at value | | | 45,929,445 | |
| | | | |
Total investments, at value (see cost below) | | | 232,917,812 | |
Foreign currency, at value (see cost below) | | | 2,533 | |
Receivable for investments sold | | | 4,352,074 | |
Receivable for Fund shares sold | | | 278,728 | |
Receivable for dividends | | | 66,855 | |
Receivable for securities lending income | | | 7,570 | |
Prepaid expenses and other assets | | | 31,459 | |
| | | | |
Total assets | | | 237,657,031 | |
| | | | |
| |
Liabilities | | | | |
Payable for investments purchased | | | 982,069 | |
Payable for Fund shares redeemed | | | 115,879 | |
Payable upon receipt of securities loaned | | | 26,834,917 | |
Advisory fee payable | | | 201,444 | |
Distribution fees payable | | | 4,734 | |
Due to other related parties | | | 29,307 | |
Accrued expenses and other liabilities | | | 103,752 | |
| | | | |
Total liabilities | | | 28,272,102 | |
| | | | |
Total net assets | | $ | 209,384,929 | |
| | | | |
| |
NET ASSETS CONSIST OF | | | | |
Paid-in capital | | $ | 193,409,954 | |
Undistributed net investment loss | | | (1,490,314 | ) |
Accumulated net realized gains on investments | | | 24,668,148 | |
Net unrealized losses on investments | | | (7,202,859 | ) |
| | | | |
Total net assets | | $ | 209,384,929 | |
| | | | |
| |
COMPUTATION OF NET ASSET VALUE AND OFFERING PRICE PER SHARE1 | | | | |
Net assets – Class A | | $ | 122,562,045 | |
Shares outstanding – Class A | | | 17,159,252 | |
Net asset value per share – Class A | | | $7.14 | |
Maximum offering price per share – Class A2 | | | $7.58 | |
Net assets – Class B | | $ | 981,384 | |
Shares outstanding – Class B | | | 149,321 | |
Net asset value per share – Class B | | | $6.57 | |
Net assets – Class C | | $ | 5,785,085 | |
Shares outstanding – Class C | | | 882,088 | |
Net asset value per share – Class C | | | $6.56 | |
Net assets – Administrator Class | | $ | 6,290,800 | |
Shares outstanding – Administrator Class | | | 878,912 | |
Net asset value per share – Administrator Class | | | $7.16 | |
Net assets – Investor Class | | $ | 73,765,615 | |
Shares outstanding – Investor Class | | | 10,403,628 | |
Net asset value per share – Investor Class | | | $7.09 | |
| |
Total investments, at cost | | $ | 240,119,825 | |
| | | | |
Securities on loan, at value | | $ | 26,205,452 | |
| | | | |
Foreign currency, at cost | | $ | 2,794 | |
| | | | |
| 1. | The Fund has an unlimited number of authorized shares. |
| 2. | Maximum offering price is computed as 100/94.25 of net asset value. On investments of $50,000 or more, the offering price is reduced. |
The accompanying notes are an integral part of these financial statements.
| | | | |
| 12 | | Wells Fargo Advantage Specialized Technology Fund | | Statement of Operations—Six Months Ended September 30, 2011 (Unaudited) |
| | | | |
| | | | |
| |
Investment income | | | | |
Dividends* | | $ | 648,570 | |
Securities lending income, net | | | 78,288 | |
Income from affiliated securities | | | 9,395 | |
| | | | |
Total investment income | | | 736,253 | |
| | | | |
| |
Expenses | | | | |
Advisory fee | | | 1,343,357 | |
Administration fees | | | | |
Fund level | | | 63,969 | |
Class A | | | 200,647 | |
Class B | | | 1,692 | |
Class C | | | 8,911 | |
Administrator Class | | | 2,477 | |
Investor Class | | | 145,900 | |
Shareholder servicing fees | | | | |
Class A | | | 192,296 | |
Class B | | | 1,627 | |
Class C | | | 8,568 | |
Administrator Class | | | 5,653 | |
Investor Class | | | 110,001 | |
Distribution fees | | | | |
Class B | | | 4,882 | |
Class C | | | 25,704 | |
Custody and accounting fees | | | 31,588 | |
Professional fees | | | 13,201 | |
Registration fees | | | 15,853 | |
Shareholder report expenses | | | 38,460 | |
Trustees’ fees and expenses | | | 5,361 | |
Other fees and expenses | | | 7,966 | |
| | | | |
Total expenses | | | 2,228,113 | |
Less: Fee waivers and/or expense reimbursements | | | (1,546 | ) |
| | | | |
Net expenses | | | 2,226,567 | |
| | | | |
Net investment loss | | | (1,490,314 | ) |
| | | | |
| |
REALIZED AND UNREALIZED GAINS (LOSSES) ON INVESTMENTS | | | | |
Net realized gains on investments | | | 15,069,173 | |
Net change in unrealized gains (losses) on investments | | | (65,487,960 | ) |
| | | | |
Net realized and unrealized gains (losses) on investments | | | (50,418,787 | ) |
| | | | |
Net decrease in net assets resulting from operations | | $ | (51,909,101 | ) |
| | | | |
| |
* Net of foreign dividend withholding taxes of | | | $25,090 | |
The accompanying notes are an integral part of these financial statements.
| | | | | | |
| Statement of Changes in Net Assets (Unaudited) | | Wells Fargo Advantage Specialized Technology Fund | | | 13 | |
| | | | | | | | | | | | | | | | | | | | | | | | |
| | | Six Months Ended
September 30, 2011 (Unaudited) | | | Year Ended March 31, 20111 | | | Year Ended October 31, 2010 | |
| | | | | | |
Operations | | | | | | | | | | | | | | | | | | | | | | | | |
Net investment loss | | | | | | $ | (1,490,314 | ) | | | | | | $ | (1,335,086 | ) | | | | | | $ | (2,664,554 | ) |
Net realized gains on investments | | | | | | | 15,069,173 | | | | | | | | 23,344,044 | | | | | | | | 21,675,307 | |
Net change in unrealized gains (losses) on investments | | | | | | | (65,487,960 | ) | | | | | | | 12,304,761 | | | | | | | | 41,116,263 | |
| | | | | | | | | | | | | | | | | | | | | | | | |
Net increase (decrease) in net assets resulting from operations | | | | | | | (51,909,101 | ) | | | | | | | 34,313,719 | | | | | | | | 60,127,016 | |
| | | | | | | | | | | | | | | | | | | | | | | | |
| | | | | | |
Capital share transactions | | | Shares | | | | | | | | Shares | | | | | | | | Shares | | | | | |
Proceeds from shares sold | | | | | | | | | | | | | | | | | | | | | | | | |
Class A | | | 1,303,747 | | | | 10,903,981 | | | | 1,666,240 | | | | 14,289,747 | | | | 3,665,187 | | | | 24,221,218 | |
Class B | | | 3,535 | | | | 27,477 | | | | 29,724 | | | | 236,793 | | | | 22,849 | | | | 145,405 | |
Class C | | | 132,713 | | | | 1,042,721 | | | | 148,227 | | | | 1,180,215 | | | | 109,467 | | | | 674,286 | |
Administrator Class | | | 546,757 | | | | 4,590,543 | | | | 433,827 | | | | 3,556,702 | | | | 14,002 | 2 | | | 97,500 | 2 |
Investor Class | | | 748,860 | | | | 6,207,378 | | | | 1,123,642 | | | | 9,476,844 | | | | 1,232,433 | | | | 8,210,302 | |
| | | | | | | | | | | | | | | | | | | | | | | | |
| | | | | | | 22,772,100 | | | | | | | | 28,740,301 | | | | | | | | 33,348,711 | |
| | | | | | | | | | | | | | | | | | | | | | | | |
Payment for shares redeemed | | | | | | | | | | | | | | | | | | | | | | | | |
Class A | | | (2,994,869 | ) | | | (24,842,251 | ) | | | (1,917,957 | ) | | | (16,053,122 | ) | | | (4,576,710 | ) | | | (30,203,768 | ) |
Class B | | | (52,878 | ) | | | (416,084 | ) | | | (94,078 | ) | | | (733,426 | ) | | | (185,637 | ) | | | (1,124,725 | ) |
Class C | | | (74,770 | ) | | | (558,202 | ) | | | (101,328 | ) | | | (802,968 | ) | | | (168,835 | ) | | | (1,025,508 | ) |
Administrator Class | | | (104,465 | ) | | | (834,873 | ) | | | (11,209 | ) | | | (97,066 | ) | | | 0 | 2 | | | 0 | 2 |
Investor Class | | | (1,026,824 | ) | | | (8,512,797 | ) | | | (1,041,458 | ) | | | (8,732,625 | ) | | | (1,681,096 | ) | | | (10,992,495 | ) |
| | | | | | | | | | | | | | | | | | | | | | | | |
| | | | | | | (35,164,207 | ) | | | | | | | (26,419,207 | ) | | | | | | | (43,346,496 | ) |
| | | | | | | | | | | | | | | | | | | | | | | | |
Net increase (decrease) in net assets resulting
from capital share transactions | | | | | | | (12,392,107 | ) | | | | | | | 2,321,094 | | | | | | | | (9,997,785 | ) |
| | | | | | | | | | | | | | | | | | | | | | | | |
Total increase (decrease) in net assets | | | | | | | (64,301,208 | ) | | | | | | | 36,634,813 | | | | | | | | 50,129,231 | |
| | | | | | | | | | | | | | | | | | | | | | | | |
| | | | | | |
Net assets | | | | | | | | | | | | | | | | | | | | | | | | |
Beginning of period | | | | | | | 273,686,137 | | | | | | | | 237,051,324 | | | | | | | | 186,922,093 | |
| | | | | | | | | | | | | | | | | | | | | | | | |
End of period | | | | | | $ | 209,384,929 | | | | | | | $ | 273,686,137 | | | | | | | $ | 237,051,324 | |
| | | | | | | | | | | | | | | | | | | | | | | | |
Undistributed net investment income (loss) | | | | | | $ | (1,490,314 | ) | | | | | | $ | 0 | | | | | | | $ | 0 | |
| | | | | | | | | | | | | | | | | | | | | | | | |
| 1. | For the five months ended March 31, 2011. The Fund changed its fiscal year end from October 31 to March 31, effective March 31, 2011. |
| 2. | Class commenced operations on July 30, 2010. |
The accompanying notes are an integral part of these financial statements.
| | | | |
| 14 | | Wells Fargo Advantage Specialized Technology Fund | | Financial Highlights |
(For a share outstanding throughout each period)
| | | | | | | | | | | | | | | | | | | | | | | | | | | | |
| | | Six Months Ended
September 30, 2011 (Unaudited) | | | Year Ended
March 31, 20111 | | | Year Ended October 31, | |
| Class A | | | | 2010 | | | 2009 | | | 2008 | | | 2007 | | | 2006 | |
Net asset value, beginning of period | | $ | 8.88 | | | $ | 7.74 | | | $ | 5.81 | | | $ | 4.52 | | | $ | 7.83 | | | $ | 5.45 | | | $ | 5.20 | |
Net investment loss | | | (0.05 | ) | | | (0.04 | ) | | | (0.08 | ) | | | (0.04 | )2 | | | (0.04 | )2 | | | (0.07 | )2 | | | (0.07 | ) |
Net realized and unrealized gains (losses) on investments | | | (1.69 | ) | | | 1.18 | | | | 2.01 | | | | 1.33 | | | | (3.27 | ) | | | 2.45 | | | | 0.32 | |
| | | | | | | | | | | | | | | | | | | | | | | | | | | | |
Total from investment operations | | | (1.74 | ) | | | 1.14 | | | | 1.93 | | | | 1.29 | | | | (3.31 | ) | | | 2.38 | | | | 0.25 | |
Net asset value, end of period | | $ | 7.14 | | | $ | 8.88 | | | $ | 7.74 | | | $ | 5.81 | | | $ | 4.52 | | | $ | 7.83 | | | $ | 5.45 | |
Total return3 | | | (19.50 | )% | | | 14.60 | % | | | 33.22 | % | | | 28.54 | % | | | (42.27 | )% | | | 43.67 | % | | | 4.81 | % |
Ratios to average net assets (annualized) | | | | | | | | | | | | | | | | | | | | | | | | | |
Gross expenses | | | 1.70 | % | | | 1.67 | % | | | 1.73 | % | | | 1.85 | % | | | 1.81 | % | | | 1.79 | % | | | 1.83 | % |
Net expenses | | | 1.70 | % | | | 1.67 | % | | | 1.73 | % | | | 1.75 | % | | | 1.75 | % | | | 1.75 | % | | | 1.75 | % |
Net investment loss | | | (1.12 | )% | | | (1.20 | )% | | | (1.23 | )% | | | (0.84 | )% | | | (0.62 | )% | | | (1.05 | )% | | | (1.13 | )% |
Supplemental data | | | | | | | | | | | | | | | | | | | | | | | | | | | | |
Portfolio turnover rate | | | 76 | % | | | 43 | % | | | 164 | % | | | 144 | % | | | 191 | % | | | 178 | % | | | 279 | % |
Net assets, end of period (000’s omitted) | | | $122,562 | | | | $167,298 | | | | $147,945 | | | | $116,272 | | | | $100,523 | | | | $163,333 | | | | $110,207 | |
| 1. | For the five months ended March 31, 2011. The Fund changed its fiscal year end from October 31 to March 31, effective March 31, 2011. |
| 2. | Calculated based upon average shares outstanding. |
| 3. | Total return calculations do not include any sales charges. Returns for periods of less than one year are not annualized. |
The accompanying notes are an integral part of these financial statements.
| | | | | | |
| Financial Highlights | | Wells Fargo Advantage Specialized Technology Fund | | | 15 | |
(For a share outstanding throughout each period)
| | | | | | | | | | | | | | | | | | | | | | | | | | | | |
| | | Six Months Ended
September 30, 2011
(Unaudited) | | | Year Ended
March 31, 20111 | | | Year Ended October 31, | |
| Class B | | | | 2010 | | | 2009 | | | 2008 | | | 2007 | | | 2006 | |
Net asset value, beginning of period | | $ | 8.20 | | | $ | 7.18 | | | $ | 5.42 | | | $ | 4.25 | | | $ | 7.42 | | | $ | 5.20 | | | $ | 5.00 | |
Net investment loss | | | (0.07 | )2 | | | (0.06 | )2 | | | (0.12 | )2 | | | (0.07 | )2 | | | (0.08 | )2 | | | (0.10 | )2 | | | (0.14 | ) |
Net realized and unrealized gains (losses) on investments | | | (1.56 | ) | | | 1.08 | | | | 1.88 | | | | 1.24 | | | | (3.09 | ) | | | 2.32 | | | | 0.34 | |
| | | | | | | | | | | | | | | | | | | | | | | | | | | | |
Total from investment operations | | | (1.63 | ) | | | 1.02 | | | | 1.76 | | | | 1.17 | | | | (3.17 | ) | | | 2.22 | | | | 0.20 | |
Net asset value, end of period | | $ | 6.57 | | | $ | 8.20 | | | $ | 7.18 | | | $ | 5.42 | | | $ | 4.25 | | | $ | 7.42 | | | $ | 5.20 | |
Total return3 | | | (19.88 | )% | | | 14.21 | % | | | 32.47 | % | | | 27.53 | % | | | (42.72 | )% | | | 42.69 | % | | | 4.00 | % |
Ratios to average net assets (annualized) | | | | | | | | | | | | | | | | | | | | | | | | | | | | |
Gross expenses | | | 2.45 | % | | | 2.42 | % | | | 2.48 | % | | | 2.60 | % | | | 2.55 | % | | | 2.54 | % | | | 2.58 | % |
Net expenses | | | 2.45 | % | | | 2.42 | % | | | 2.48 | % | | | 2.50 | % | | | 2.50 | % | | | 2.50 | % | | | 2.50 | % |
Net investment loss | | | (1.87 | )% | | | (1.95 | )% | | | (1.97 | )% | | | (1.54 | )% | | | (1.33 | )% | | | (1.79 | )% | | | (1.89 | )% |
Supplemental data | | | | | | | | | | | | | | | | | | | | | | | | | | | | |
Portfolio turnover rate | | | 76 | % | | | 43 | % | | | 164 | % | | | 144 | % | | | 191 | % | | | 178 | % | | | 279 | % |
Net assets, end of period (000’s omitted) | | | $981 | | | | $1,629 | | | | $1,888 | | | | $2,310 | | | | $3,254 | | | | $16,366 | | | | $23,903 | |
| 1. | For the five months ended March 31, 2011. The Fund changed its fiscal year end from October 31 to March 31, effective March 31, 2011. |
| 2. | Calculated based upon average shares outstanding. |
| 3. | Total return calculations do not include any sales charges. Returns for periods of less than one year are not annualized. |
The accompanying notes are an integral part of these financial statements.
| | | | |
| 16 | | Wells Fargo Advantage Specialized Technology Fund | | Financial Highlights |
(For a share outstanding throughout each period)
| | | | | | | | | | | | | | | | | | | | | | | | | | | | |
| | | Six Months Ended
September 30, 2011
(Unaudited) | | | Year Ended
March 31, 20111 | | | Year Ended October 31, | |
| Class C | | | | 2010 | | | 2009 | | | 2008 | | | 2007 | | | 2006 | |
Net asset value, beginning of period | | $ | 8.18 | | | $ | 7.16 | | | $ | 5.41 | | | $ | 4.24 | | | $ | 7.40 | | | $ | 5.19 | | | $ | 4.99 | |
Net investment loss | | | (0.07 | )2 | | | (0.06 | )2 | | | (0.12 | )2 | | | (0.07 | )2 | | | (0.08 | )2 | | | (0.11 | )2 | | | (0.12 | ) |
Net realized and unrealized gains (losses) on investments | | | (1.55 | ) | | | 1.08 | | | | 1.87 | | | | 1.24 | | | | (3.08 | ) | | | 2.32 | | | | 0.32 | |
| | | | | | | | | | | | | | | | | | | | | | | | | | | | |
Total from investment operations | | | (1.62 | ) | | | 1.02 | | | | 1.75 | | | | 1.17 | | | | (3.16 | ) | | | 2.21 | | | | 0.20 | |
Net asset value, end of period | | $ | 6.56 | | | $ | 8.18 | | | $ | 7.16 | | | $ | 5.41 | | | $ | 4.24 | | | $ | 7.40 | | | $ | 5.19 | |
Total return3 | | | (19.80 | )% | | | 14.25 | % | | | 32.35 | % | | | 27.59 | % | | | (42.70 | )% | | | 42.58 | % | | | 4.01 | % |
Ratios to average net assets (annualized) | | | | | | | | | | | | | | | | | | | | | | | | | | | | |
Gross expenses | | | 2.45 | % | | | 2.43 | % | | | 2.48 | % | | | 2.60 | % | | | 2.54 | % | | | 2.54 | % | | | 2.58 | % |
Net expenses | | | 2.45 | % | | | 2.43 | % | | | 2.48 | % | | | 2.50 | % | | | 2.50 | % | | | 2.50 | % | | | 2.50 | % |
Net investment loss | | | (1.87 | )% | | | (1.95 | )% | | | (1.98 | )% | | | (1.60 | )% | | | (1.38 | )% | | | (1.81 | )% | | | (1.88 | )% |
Supplemental data | | | | | | | | | | | | | | | | | | | | | | | | | | | | |
Portfolio turnover rate | | | 76 | % | | | 43 | % | | | 164 | % | | | 144 | % | | | 191 | % | | | 178 | % | | | 279 | % |
Net assets, end of period (000’s omitted) | | | $5,785 | | | | $6,742 | | | | $5,566 | | | | $4,527 | | | | $3,626 | | | | $6,907 | | | | $5,173 | |
| 1. | For the five months ended March 31, 2011. The Fund changed its fiscal year end from October 31 to March 31, effective March 31, 2011. |
| 2. | Calculated based upon average shares outstanding. |
| 3. | Total return calculations do not include any sales charges. Returns for periods of less than one year are not annualized. |
The accompanying notes are an integral part of these financial statements.
| | | | | | |
| Financial Highlights | | Wells Fargo Advantage Specialized Technology Fund | | | 17 | |
(For a share outstanding throughout each period)
| | | | | | | | | | | | |
| Administrator Class | | Six Months Ended
September 30, 2011
(Unaudited) | | | Year Ended
March 31, 20111 | | | Year Ended October 31, 20102 | |
Net asset value, beginning of period | | $ | 8.88 | | | $ | 7.74 | | | $ | 6.63 | |
Net investment loss | | | (0.03 | ) | | | (0.04 | )3 | | | (0.02 | )3 |
Net realized and unrealized gains (losses) on investments | | | (1.69 | ) | | | 1.18 | | | | 1.13 | |
| | | | | | | | | | | | |
Total from investment operations | | | (1.72 | ) | | | 1.14 | | | | 1.11 | |
Net asset value, end of period | | $ | 7.16 | | | $ | 8.88 | | | $ | 7.74 | |
Total return4 | | | (19.37 | )% | | | 14.73 | % | | | 16.74 | % |
Ratios to average net assets (annualized) | | | | | | | | | | | | |
Gross expenses | | | 1.52 | % | | | 1.48 | % | | | 1.58 | % |
Net expenses | | | 1.49 | % | | | 1.48 | % | | | 1.50 | % |
Net investment loss | | | (0.86 | )% | | | (1.03 | )% | | | (0.97 | )% |
Supplemental data | | | | | | | | | | | | |
Portfolio turnover rate | | | 76 | % | | | 43 | % | | | 164 | % |
Net assets, end of period (000’s omitted) | | | $6,291 | | | | $3,879 | | | | $108 | |
| 1. | For the five months ended March 31, 2011. The Fund changed its fiscal year end from October 31 to March 31, effective March 31, 2011. |
| 2. | For the period from July 30, 2010 (commencement of class operations) to October 31, 2010. |
| 3. | Calculated based upon average shares outstanding. |
| 4. | Returns for periods of less than one year are not annualized. |
The accompanying notes are an integral part of these financial statements.
| | | | |
| 18 | | Wells Fargo Advantage Specialized Technology Fund | | Financial Highlights |
(For a share outstanding throughout each period)
| | | | | | | | | | | | | | | | | | | | | | | | | | | | |
| | | Six Months Ended
September 30, 2011
(Unaudited) | | | Year Ended
March 31, 20111 | | | Year Ended October 31, | |
| Investor Class | | | | 2010 | | | 2009 | | | 20084 | | | 20074 | | | 20064 | |
Net asset value, beginning of period | | $ | 8.81 | | | $ | 7.69 | | | $ | 5.78 | | | $ | 4.50 | | | $ | 7.79 | | | $ | 5.44 | | | $ | 5.20 | |
Net investment loss | | | (0.05 | ) | | | (0.05 | ) | | | (0.09 | )2 | | | (0.05 | )2 | | | (0.05 | )2 | | | (0.07 | )2 | | | (0.08 | ) |
Net realized and unrealized gains (losses) on investments | | | (1.67 | ) | | | 1.17 | | | | 2.00 | | | | 1.33 | | | | (3.24 | ) | | | 2.42 | | | | 0.32 | |
| | | | | | | | | | | | | | | | | | | | | | | | | | | | |
Total from investment operations | | | (1.72 | ) | | | 1.12 | | | | 1.91 | | | | 1.28 | | | | (3.29 | ) | | | 2.35 | | | | 0.24 | |
Net asset value, end of period | | $ | 7.09 | | | $ | 8.81 | | | $ | 7.69 | | | $ | 5.78 | | | $ | 4.50 | | | $ | 7.79 | | | $ | 5.44 | |
Total return3 | | | (19.52 | )% | | | 14.56 | % | | | 33.04 | % | | | 28.44 | % | | | (42.23 | )% | | | 43.20 | % | | | 4.62 | % |
Ratios to average net assets (annualized) | | | | | | | | | | | | | | | | | | | | | | | | | | | | |
Gross expenses | | | 1.77 | % | | | 1.74 | % | | | 1.82 | % | | | 1.96 | % | | | 1.96 | % | | | 1.96 | % | | | 2.00 | % |
Net expenses | | | 1.77 | % | | | 1.74 | % | | | 1.82 | % | | | 1.86 | % | | | 1.90 | % | | | 1.90 | % | | | 1.90 | % |
Net investment loss | | | (1.19 | )% | | | (1.27 | )% | | | (1.32 | )% | | | (0.96 | )% | | | (0.77 | )% | | | (1.20 | )% | | | (1.30 | )% |
Supplemental data | | | | | | | | | | | | | | | | | | | | | | | | | | | | |
Portfolio turnover rate | | | 76 | % | | | 43 | % | | | 164 | % | | | 144 | % | | | 191 | % | | | 178 | % | | | 279 | % |
Net assets, end of period (000’s omitted) | | | $73,766 | | | | $94,139 | | | | $81,544 | | | | $63,814 | | | | $49,567 | | | | $92,530 | | | | $79,827 | |
| 1. | For the five months ended March 31, 2011. The Fund changed its fiscal year end from October 31 to March 31, effective March 31, 2011. |
| 2. | Calculated based upon average shares outstanding. |
| 3. | Returns for periods of less than one year are not annualized. |
| 4. | On June 20, 2008, Class Z was renamed Investor Class. |
The accompanying notes are an integral part of these financial statements.
| | | | | | |
| Notes to Financial Statements (Unaudited) | | Wells Fargo Advantage Specialized Technology Fund | | | 19 | |
1. ORGANIZATION
Wells Fargo Funds Trust (the “Trust”), a Delaware statutory trust organized on March 10, 1999, is an open-end management investment company registered under the Investment Company Act of 1940, as amended (the “1940 Act”). These financial statements report on Wells Fargo Advantage Specialized Technology Fund (the “Fund”) which is a non-diversified series of the Trust.
2. SIGNIFICANT ACCOUNTING POLICIES
The following significant accounting policies, which are consistently followed in the preparation of the financial statements of the Fund, are in conformity with U.S. generally accepted accounting principles which require management to make estimates and assumptions that affect the reported amounts of assets and liabilities, disclosure of contingent assets and liabilities at the date of the financial statements, and the reported amounts of revenues and expenses during the reporting period. Actual results could differ from those estimates.
Securities valuation
Investments in securities are valued each business day as of the close of regular trading on the New York Stock Exchange, which is usually 4:00 p.m. (Eastern Time). Securities which are traded on a national or foreign securities exchange are valued at the last reported sales price, except that securities listed on The Nasdaq Stock Market, Inc. (“Nasdaq”) are valued at the Nasdaq Official Closing Price (“NOCP”), and if no NOCP is available, then at the last reported sales price. If no sales price is shown on the Nasdaq, the bid price will be used. In the absence of any sale of securities listed on the Nasdaq, and in the case of other securities, including U.S. Government obligations, but excluding debt securities maturing in 60 days or less, the price will be deemed “stale” and the valuations will be determined in accordance with the Fund’s Fair Value Procedures.
Securities denominated in foreign currencies are translated into U.S. dollars using the closing rates of exchange in effect on the day of valuation.
Many securities markets and exchanges outside the U.S. close prior to the close of the New York Stock Exchange and therefore may not fully reflect trading or events that occur after the close of the principal exchange in which the foreign investments are traded but before the close of the New York Stock Exchange. If such trading or events are expected to materially affect the value of the investments, then those investments are fair valued following procedures approved by the Board of Trustees. These procedures take into account multiple factors including movements in U.S. securities markets after foreign exchanges close. Depending on market activity, such fair valuations may be frequent. Such fair value pricing may result in NAVs that are higher or lower than NAVs based on the closing price or latest quoted bid price.
Debt securities of sufficient credit quality with original maturities of 60 days or less generally are valued at amortized cost which approximates fair value. The amortized cost method involves valuing a security at its cost, plus accretion of discount or minus amortization of premium over the period until maturity.
Investments in open-end mutual funds and non-registered investment companies are generally valued at net asset value.
Certain investments which are not valued using any of the methods discussed above, are valued at their fair value, as determined by procedures established in good faith and approved by the Board of Trustees.
Foreign currency translation
The accounting records of the Fund are maintained in U.S. dollars. Assets, including investment securities, and liabilities denominated in foreign currency are translated into U.S. dollars at the prevailing rates of exchange at the date of valuation. Purchases and sales of securities, and income and expenses are translated at the prevailing rate of exchange on the respective dates of such transactions. Reported net realized foreign exchange gains or losses arise from sales of foreign currencies, currency gains or losses realized between the trade and settlement dates on securities transactions, and the difference between the amounts of dividends, interest and foreign withholding taxes recorded and the U.S. dollar equivalent of the amounts actually paid or received. Net unrealized foreign exchange gains and losses arise from changes in the fair value of assets and liabilities other than investments in securities resulting in changes in exchange rates.
The changes in net assets arising from changes in exchange rates and the changes in net assets resulting from changes in market prices of securities are not separately presented. Such changes are recorded with net realized and unrealized gains or losses from investments. Gains and losses from certain foreign currency transactions are treated as ordinary income for U.S. federal income tax purposes.
| | | | |
| 20 | | Wells Fargo Advantage Specialized Technology Fund | | Notes to Financial Statements (Unaudited) |
Security loans
The Fund may lend its securities from time to time in order to earn additional income in the form of fees or interest on securities received as collateral or the investment of any cash received as collateral. The Fund continues to receive interest or dividends on the securities loaned. The Fund receives collateral in the form of cash or securities with a value at least equal to the value of the securities on loan. The value of the loaned securities is determined at the close of each business day and any additional required collateral is delivered to the Fund on the next business day. In the event of default or bankruptcy by the borrower, the Fund could experience delays and costs in recovering the loaned securities or in gaining access to the collateral. In addition, the investment of any cash collateral received may lose all or part of its value. The Fund has the right under the lending agreement to recover the securities from the borrower on demand.
The Fund lends its securities through an unaffiliated securities lending agent. Cash collateral received in connection with its securities lending transactions is invested in Wells Fargo Securities Lending Cash Investments, LLC (the “Cash Collateral Fund”). The Cash Collateral Fund is exempt from registration under Section 3(c)(7) of the 1940 Act and is managed by Wells Fargo Funds Management LLC (“Funds Management”) and is sub-advised by Wells Capital Management Incorporated (“Wells Capital Management”). Funds Management receives an investment advisory fee starting at 0.05% and declining to 0.01% as the average daily net assets of the Cash Collateral Fund increase. All of the fees received by Funds Management are paid to Wells Capital Management for its services as sub-adviser. The Cash Collateral Fund seeks to provide a positive return compared to the daily Fed Funds Open rate by investing in high-quality, U.S. dollar-denominated short-term money market instruments. Cash Collateral Fund investments are fair valued based upon the amortized cost valuation technique. Income earned from investment in the Cash Collateral Fund is included in securities lending income on the Statement of Operations.
In a securities lending transaction, the net asset value of the Fund will be affected by an increase or decrease in the value of the securities loaned and by an increase or decrease in the value of instruments in which cash collateral is invested. The amount of securities lending activity undertaken by the Fund fluctuates from time to time. After the occurrence of a default or impairment of structured investment vehicles purchased in a joint account by the Fund’s former securities lending agent, as the various participating funds’ lending activity fluctuated, their ratable interest in the joint account, including their ratable exposure to the defaulted or impaired structured investment vehicles fluctuated depending on the relative activity of each participating fund. In order to eliminate the fluctuation of the various participating funds’ ratable exposure to the defaulted or impaired structured investment vehicles, the adviser to the Fund recommended to the Board of Trustees, and the Board of Trustees approved, actions designed to fix the allocation of percentage ownership in defaulted or impaired structured investment vehicles among all funds participating in securities lending (“side pocketing”) based on each participating fund’s percentage ownership of the total cash collateral investment joint account as of the date the fixed allocation is implemented. Accordingly, on February 13, 2009 a side pocketing occurred, which fixed each participating fund’s ownership of defaulted or impaired structured investment vehicle in the joint account based on each participating fund’s percentage ownership of the joint account as of such date.
Security transactions and income recognition
Securities transactions are recorded on a trade date basis. Realized gains or losses are reported on the basis of identified cost of securities delivered.
Dividend income is recognized on the ex-dividend date, except for certain dividends from foreign securities, which are recorded as soon as the Fund is informed of the ex-dividend date. Dividend income from foreign securities is recorded net of foreign taxes withheld where recovery of such taxes is not assured.
Distributions to shareholders
Distributions to shareholders from net investment income and net realized gains, if any, are recorded on the ex-dividend date. Such distributions are determined in conformity with income tax regulations, which may differ from generally accepted accounting principles.
Federal and other taxes
The Fund intends to continue to qualify as a regulated investment company by distributing substantially all of its investment company taxable income and any net realized capital gains (after reduction for capital loss carryforwards) sufficient to relieve it from all, or substantially all, federal income taxes. Accordingly, no provision for federal income taxes was required.
| | | | | | |
| Notes to Financial Statements (Unaudited) | | Wells Fargo Advantage Specialized Technology Fund | | | 21 | |
The Fund’s income and federal excise tax returns and all financial records supporting those returns for the prior three fiscal years are subject to examination by the federal and Delaware revenue authorities.
Under the recently enacted Regulated Investment Company Modernization Act of 2010, the Fund will be permitted to carry forward capital losses incurred in taxable years beginning after December 22, 2010 for an unlimited period. However, any losses incurred during those future taxable years will be required to be utilized prior to the losses incurred in pre-enactment taxable years. As a result of this ordering rule, pre-enactment capital loss carryforwards may be more likely to expire unused. Additionally, post-enactment capital losses that are carried forward will retain their character as either short-term or long-term capital losses rather than being considered all short-term as under previous law.
Class allocations
The separate classes of shares offered by the Fund differ principally in applicable sales charges, distribution, shareholder servicing and administration fees. Shareholders of each class bear certain expenses that pertain to that particular class. All shareholders bear the common expenses of the Fund, earn income from the portfolio, and are allocated unrealized gains and losses pro rata based on the average daily net assets of each class, without distinction between share classes. Dividends are determined separately for each class based on income and expenses allocable to each class. Realized gains and losses are allocated to each class pro rata based upon the net assets of each class on the date realized. Differences in per share dividend rates generally result from the relative weightings of pro rata income and realized gain allocations and from differences in separate class expenses, including distribution, shareholder servicing and administration fees.
3. FAIR VALUATION MEASUREMENTS
Fair value measurements of investments are determined within a framework that has established a fair value hierarchy based upon the various data inputs utilized in determining the value of the Fund’s investments. The three-level hierarchy gives the highest priority to unadjusted quoted prices in active markets for identical assets or liabilities (Level 1) and the lowest priority to unobservable inputs (Level 3). The Fund’s investments are classified within the fair value hierarchy based on the lowest level of input that is significant to the fair value measurement. The inputs are summarized into three broad levels as follows:
| n | | Level 1 – quoted prices in active markets for identical securities |
| n | | Level 2 – other significant observable inputs (including quoted prices for similar securities, interest rates, prepayment speeds, credit risk, etc.) |
| n | | Level 3 – significant unobservable inputs (including the Fund’s own assumptions in determining the fair value of investments) |
The inputs or methodologies used for valuing securities are not necessarily an indication of the risk associated with investing in those securities.
As of September 30, 2011, the inputs used in valuing the Fund’s assets, which are carried at fair value, were as follows:
| | | | | | | | | | | | | | | | |
| Investments in Securities | | Quoted Prices (Level 1) | | | Significant Other
Observable Inputs (Level 2) | | | Significant Unobservable Inputs (Level 3) | | | Total | |
Equity securities | | | | | | | | | | | | | | | | |
Common stocks | | $ | 186,215,224 | | | $ | 0 | | | $ | 0 | | | $ | 186,215,224 | |
Other | | | 0 | | | | 0 | | | | 773,143 | | | | 773,143 | |
Short-term investments | | | | | | | | | | | | | | | | |
Investment companies | | | 19,438,714 | | | | 26,490,731 | | | | 0 | | | | 45,929,445 | |
Total | | $ | 205,653,938 | | | $ | 26,490,731 | | | $ | 773,143 | | | $ | 232,917,812 | |
Further details on the major security types listed above can be found in the Fund’s Portfolio of Investments.
Transfers in and transfers out are recognized at the end of the reporting period. For the six months ended September 30, 2011, the Fund did not have any significant transfers into/out of Level 1 and Level 2.
| | | | |
| 22 | | Wells Fargo Advantage Specialized Technology Fund | | Notes to Financial Statements (Unaudited) |
The following is a reconciliation of assets in which significant unobservable inputs (Level 3) were used in determining fair value:
| | | | |
| | | Other | |
Balance as of March 31, 2011 | | $ | 1,021,418 | |
Accrued discounts (premiums) | | | 0 | |
Realized gains (losses) | | | 0 | |
Change in unrealized gains (losses) | | | (9,787 | ) |
Purchases | | | 0 | |
Sales | | | (238,488 | ) |
Transfers into Level 3 | | | 0 | |
Transfers out of Level 3 | | | 0 | |
Balance as of September 30, 2011 | | $ | 773,143 | |
Change in unrealized gains (losses) relating
to securities still held at September 30, 2011 | | $ | (114,191 | ) |
4. TRANSACTIONS WITH AFFILIATES AND OTHER EXPENSES
Advisory fee
The Trust has entered into an advisory contract with Funds Management, an indirect wholly owned subsidiary of Wells Fargo & Company (“Wells Fargo”). The adviser is responsible for implementing investment policies and guidelines and for supervising the sub-adviser, who is responsible for day-to-day portfolio management of the Fund.
Pursuant to the contract, Funds Management is entitled to receive an annual advisory fee starting at 1.05% and declining to 0.90% as the average daily net assets of the Fund increase. For the six months ended September 30, 2011, the advisory fee was equivalent to an annual rate of 1.05% of the Fund’s average daily net assets.
Funds Management may retain the services of certain sub-advisers to provide daily portfolio management to the Fund. The fees related to sub-advisory services are borne directly by the adviser and do not increase the overall fees paid by the Fund to the adviser. RCM Capital Management, LLC is the sub-adviser to the Fund and is entitled to receive a fee from the adviser at an annual rate starting at 1.00% and declining to 0.55% as the average daily net assets of the Fund increase.
Administration and transfer agent fees
The Trust has entered into an administration agreement with Funds Management. Under this agreement, for providing administrative services, which includes paying fees and expenses for services provided by the transfer agent, sub-transfer agents, omnibus account servicers and record-keepers, Funds Management is entitled to receive from the Fund an annual fund level administration fee starting at 0.05% and declining to 0.03% as the average daily net assets of the Fund increase and a class level administration fee which is calculated based on the average daily net assets of each class as follows:
| | | | |
| | | Class Level Administration Fee | |
Class A, Class B, Class C | | | 0.26 | % |
Administrator Class | | | 0.10 | |
Investor Class | | | 0.33 | |
Funds Management has contractually waived and/or reimbursed advisory and administration fees to the extent necessary to maintain certain net operating expense ratios for the Fund. Waiver of fees and/or reimbursement of expenses by Funds Management were made first from fund level expenses on a proportionate basis and then from class specific expenses.
Distribution fees
The Trust has adopted a Distribution Plan for Class B and Class C shares of the Fund pursuant to Rule 12b-1 under the 1940 Act. Distribution fees are charged to Class B and Class C shares and paid to Wells Fargo Funds Distributor, LLC, the principal underwriter, at an annual rate of 0.75% of the average daily net assets of Class B and Class C shares.
| | | | | | |
| Notes to Financial Statements (Unaudited) | | Wells Fargo Advantage Specialized Technology Fund | | | 23 | |
For the six months ended September 30, 2011, Wells Fargo Funds Distributor, LLC received $5,324 from the sale of Class A shares and $1,882, $589 and $419 in contingent deferred sales charges from redemptions of Class A, Class B and Class C shares, respectively.
Shareholder servicing fees
The Trust has entered into contracts with one or more shareholder servicing agents, whereby Class A, Class B, Class C, Administrator Class and Investor Class of the Fund is charged a fee at an annual rate of 0.25% of the average daily net assets of each respective class.
A portion of these total shareholder servicing fees were paid to affiliates of Wells Fargo.
5. INVESTMENT PORTFOLIO TRANSACTIONS
Purchases and sales of investments, excluding U.S. Government obligations (if any) and short-term securities (securities with maturities of one year or less at purchase date), for the six months ended September 30, 2011 were $182,261,611 and $203,717,403, respectively.
6. BANK BORROWINGS
The Trust (excluding the money market funds) and Wells Fargo Variable Trust are parties to a $150,000,000 revolving credit agreement with State Street Bank and Trust Company, whereby the Fund is permitted to use bank borrowings for temporary or emergency purposes, such as to fund shareholder redemption requests. Interest under the credit agreement is charged to the Fund based on a borrowing rate equal to the higher of the Federal Funds rate in effect on that day plus 1.25% or the overnight LIBOR rate in effect on that day plus 1.25%. In addition, under the credit agreement, the Fund pays an annual commitment fee equal to 0.10% of the unused balance, which is allocated pro rata. Prior to September 6, 2011, the revolving credit agreement was for $125,000,000 and the annual commitment fee paid by the Fund was 0.125% of the unused balance. For the six months ended September 30, 2011, the Fund paid $253 in commitment fees.
For the six months ended September 30, 2011, there were no borrowings by the Fund under the agreement.
7. CONCENTRATION RISK
The Fund invests a substantial portion of its assets in the technology sector and, therefore, may be more affected by changes in that sector than would be a comparable mutual fund whose investments are not heavily weighted in any sector.
8. INDEMNIFICATION
Under the Trust’s organizational documents, the officers and directors are indemnified against certain liabilities that may arise out of performance of their duties to the Trust. Additionally, in the normal course of business, the Trust may enter into contracts with service providers that contain a variety of indemnification clauses. The Trust’s maximum exposure under these arrangements is dependent on future claims that may be made against the Fund and, therefore, cannot be estimated.
9. NEW ACCOUNTING PRONOUNCEMENTS
In May 2011, the Financial Accounting Standards Board (“FASB”) issued Accounting Standards Update (“ASU”) No. 2011-04 “Amendments to Achieve Common Fair Value Measurement and Disclosure Requirements in U.S. GAAP and IFRSs”. ASU No. 2011-04 amends FASB ASC Topic 820, Fair Value Measurements and Disclosures, to establish common requirements for measuring fair value and for disclosing information about fair value measurements in accordance with GAAP. The ASU is effective prospectively for interim and annual periods beginning after December 15, 2011.
In April 2011, FASB issued ASU No. 2011-03 “Reconsideration of Effective Control for Repurchase Agreements”. ASU No. 2011-03 amends FASB ASC Topic 860, Transfers and Servicing, specifically the criteria required to determine whether a repurchase agreement (repo) and similar agreements should be accounted for as sales of financial assets or secured borrowings with commitments. ASU No. 2011-03 changes the assessment of effective control by focusing on the transferor’s contractual rights and obligations and removing the criterion to assess its ability to exercise those rights or honor those obligations. This could result in changes to the way entities account for certain transactions including repurchase agreements, mortgage dollar rolls and reverse repurchase agreements. The ASU will become effective on a
| | | | |
| 24 | | Wells Fargo Advantage Specialized Technology Fund | | Notes to Financial Statements (Unaudited) |
prospective basis for new transfers and modifications to existing transactions as of the beginning of the first interim or annual period beginning on or after December 15, 2011.
As of September 30, 2011, management of the Fund is currently assessing the potential impact, in addition to expanded financial statement disclosure, that may result from adopting these ASUs.
| | | | | | |
| Other Information (Unaudited) | | Wells Fargo Advantage Specialized Technology Fund | | | 25 | |
PROXY VOTING INFORMATION
A description of the policies and procedures that the Fund uses to determine how to vote proxies relating to portfolio securities is available without charge, upon request, by calling 1-800-222-8222, visiting our Web site at www.wellsfargo.com/advantagefunds, or visiting the SEC Web site at www.sec.gov. Information regarding how the Fund voted proxies relating to portfolio securities during the most recent 12-month period ended June 30 is available without charge on the Fund’s Web site at www.wellsfargo.com/advantagefunds or by visiting the SEC Web site at www.sec.gov.
PORTFOLIO HOLDINGS INFORMATION
The complete portfolio holdings for the Fund are publicly available on the Fund’s Web site (www.wellsfargo.com/advantagefunds) on a monthly, 30-day or more delayed basis. In addition, top ten holdings information for the Fund is publicly available on the Fund’s Web site on a monthly, seven-day or more delayed basis. The Fund files its complete schedule of portfolio holdings with the SEC for the first and third quarters of each fiscal year on Form N-Q, which is available without charge by visiting the SEC Web site at www.sec.gov. In addition, the Fund’s Form N-Q may be reviewed and copied at the SEC’s Public Reference Room in Washington, DC, and at regional offices in New York City, at 233 Broadway, and in Chicago, at 175 West Jackson Boulevard, Suite 900. Information about the Public Reference Room may be obtained by calling 1-800-SEC-0330.
| | | | |
| 26 | | Wells Fargo Advantage Specialized Technology Fund | | Other Information (Unaudited) |
BOARD OF TRUSTEES
The following table provides basic information about the Board of Trustees (the “Trustees”) of the Trust and Officers of the Trust. This table should be read in conjunction with the Prospectus and the Statement of Additional Information1 of the Fund. Each of the Trustees and Officers listed below acts in identical capacities for the Wells Fargo Advantage family of funds, which consists of 144 funds comprising the Wells Fargo Funds Trust, Wells Fargo Variable Trust, Wells Fargo Master Trust and four closed-end funds (collectively the “Fund Complex”). All of the Trustees are also Members of the Audit and Governance Committees of each Trust in the Fund Complex. The mailing address of each Trustee and Officer is 525 Market Street, 12th Floor, San Francisco, CA 94105. Each Trustee and Officer serves an indefinite term, however, each Trustee serves such term until reaching the mandatory retirement age established by the Trustees.
Independent Trustees
| | | | | | |
Name and Year of Birth | | Position Held and Length of Service | | Principal Occupations During Past Five Years | | Other Directorships During
Past Five Years |
Peter G. Gordon
(Born 1942) | | Trustee, since 1998; Chairman, since 2005 | | Co-Founder, Chairman, President and CEO of Crystal Geyser. Water Company. Trustee Emeritus, Colby College | | Asset Allocation Trust |
Isaiah Harris, Jr.
(Born 1952) | | Trustee, since 2009 | | Retired. Prior thereto, President and CEO of BellSouth Advertising and Publishing Corp. from 2005 to 2007, President and CEO of BellSouth Enterprises from 2004 to 2005 and President of BellSouth Consumer Services from 2000 to 2003. Emeritus member of the Iowa State University Foundation Board of Governors. Emeritus Member of the Advisory Board of Iowa State University School of Business. Mr. Harris is a certified public accountant. | | CIGNA Corporation; Deluxe Corporation; Asset Allocation Trust |
Judith M. Johnson
(Born 1949) | | Trustee, since 2008 | | Retired. Prior thereto, Chief Executive Officer and Chief Investment Officer of Minneapolis Employees Retirement Fund from 1996 to 2008. Ms. Johnson is an attorney, certified public accountant and a certified managerial accountant. | | Asset Allocation Trust |
Leroy Keith, Jr.
(Born 1939) | | Trustee, since 2010 | | Chairman, Bloc Global Services (development and construction), Trustee of the Evergreen Funds from 1983 to 2010. Former Managing Director, Almanac Capital Management (commodities firm), former Partner, Stonington Partners, Inc. (private equity fund), former Director, Obagi Medical Products Co. and former Director, Lincoln Educational Services. | | Trustee, Virtus Fund Complex (consisting of 45 portfolios as of 12/31/10); Director, Diversapack Co. (packaging company); Asset Allocation Trust |
David F. Larcker
(Born 1950) | | Trustee, since 2009 | | James Irvin Miller Professor of Accounting at the Graduate School of Business, Stanford University, Director of Corporate Governance Research Program and Co-Director of The Rock Center for Corporate Governance since 2006. From 2005 to 2008, Professor of Accounting at the Graduate School of Business, Stanford University. Prior thereto, Ernst & Young Professor of Accounting at The Wharton School, University of Pennsylvania from 1985 to 2005. | | Asset Allocation Trust |
Olivia S. Mitchell
(Born 1953) | | Trustee, since 2006 | | International Foundation of Employee Benefit Plans Professor, Wharton School of the University of Pennsylvania since 1993. Director of Wharton’s Pension Research Council and Boettner Center on Pensions & Retirement Research, and Research Associate at the National Bureau of Economic Research. Previously, Cornell University Professor from 1978 to 1993. | | Asset Allocation Trust |
| | | | | | |
| Other Information (Unaudited) | | Wells Fargo Advantage Specialized Technology Fund | | | 27 | |
| | | | | | |
Name and Year of Birth | | Position Held and Length of Service | | Principal Occupations During Past Five Years | | Other Directorships During
Past Five Years |
Timothy J. Penny
(Born 1951) | | Trustee, since 1996 | | President and CEO of Southern Minnesota Initiative Foundation, a non-profit organization, since 2007 and Senior Fellow at the Humphrey Institute Policy Forum at the University of Minnesota since 1995. Member of the Board of Trustees of NorthStar Education Finance, Inc., a non-profit organization, since 2007. | | Asset Allocation Trust |
Michael S. Scofield
(Born 1943) | | Trustee, since 2010 | | Served on the Investment Company Institute’s Board of Governors and Executive Committee from 2008-2011 as well the Governing Council of the Independent Directors Council from 2006-2011 and the Independent Directors Council Executive Committee from 2008-2011. Chairman of the IDC from 2008-2010. Institutional Investor (Fund Directions) Trustee of Year in 2007. Trustee of the Evergreen Funds (and its predecessors) from 1984 to 2010. Chairman of the Evergreen Funds from 2000-2010. Former Trustee of the Mentor Funds. Retired Attorney, Law Offices of Michael S. Scofield and former Director and Chairman, Branded Media Corporation (multi-media branding company). | | Asset Allocation Trust |
Donald C. Willeke
(Born 1940) | | Trustee, since 1996 | | Principal of the law firm of Willeke & Daniels. General Counsel of the Minneapolis Employees Retirement Fund from 1984 until its consolidation into the Minnesota Public Employees Retirement Association on June 30, 2010. | | Asset Allocation Trust |
Officers
| | | | | | |
Name and Year of Birth | | Position Held and
Length of Service | | Principal Occupations During Past Five Years | | |
Karla M. Rabusch
(Born 1959) | | President, since 2003 | | Executive Vice President of Wells Fargo Bank, N.A. and President of Wells Fargo Funds Management, LLC since 2003. Senior Vice President and Chief Administrative Officer of Wells Fargo Funds Management, LLC from 2001 to 2003. | | |
C. David Messman
(Born 1960) | | Secretary, since 2000; Chief Legal Counsel, since 2003 | | Senior Vice President and Secretary of Wells Fargo Funds Management, LLC since 2001. Vice President and Managing Counsel of Wells Fargo Bank, N.A. since 1996. | | |
Kasey Phillips
(Born 1970) | | Treasurer, since 2008 | | Senior Vice President of Wells Fargo Funds Management, LLC since 2009. Senior Vice President of Evergreen Investment Management Company, LLC from 2006 to 2010. Treasurer of the Evergreen Funds from 2005 to 2010. Vice President and Assistant Vice President of Evergreen Investment Services, Inc. from 1999 to 2006. | | |
David Berardi
(Born 1975) | | Assistant Treasurer, since 2009 | | Vice President of Wells Fargo Funds Management, LLC since 2009 . Vice President of Evergreen Investment Management Company, LLC from 2008 to 2010. Assistant Vice President of Evergreen Investment Services, Inc. from 2004 to 2008. Manager of Fund Reporting and Control for Evergreen Investment Management Company, LLC from 2004 to 2010. | | |
Jeremy DePalma
(Born 1974) | | Assistant Treasurer, since 2009 | | Senior Vice President of Wells Fargo Funds Management, LLC since 2009. Senior Vice President of Evergreen Investment Management Company, LLC from 2008 to 2010. Vice President, Evergreen Investment Services, Inc. from 2004 to 2007. Assistant Vice President, Evergreen Investment Services, Inc. from 2000 to 2004 and the head of the Fund Reporting and Control Team within Fund Administration from 2005 to 2010. | | |
Debra Ann Early
(Born 1964) | | Chief Compliance Officer, since 2007 | | Chief Compliance Officer of Wells Fargo Funds Management, LLC since 2007. Chief Compliance Officer of Parnassus Investments from 2005 to 2007. Chief Financial Officer of Parnassus Investments from 2004 to 2007 and Senior Audit Manager of PricewaterhouseCoopers LLP from 1998 to 2004. | | |
| 1. | The Statement of Additional Information includes additional information about the Fund’s Trustees and is available, without charge, upon request, by calling 1-800-222-8222 or by visiting the Fund’s Web site at www.wellsfargo.com/advantagefunds. |
| | | | |
| 28 | | Wells Fargo Advantage Specialized Technology Fund | | List of Abbreviations |
The following is a list of common abbreviations for terms and entities which may have appeared in this report.
| ACB | — Agricultural Credit Bank |
| ADR | — American Depository Receipt |
| ADS | — American Depository Shares |
| AGC-ICC | — Assured Guaranty Corporation - Insured Custody Certificates |
| AGM | — Assured Guaranty Municipal |
| AMBAC | — American Municipal Bond Assurance Corporation |
| AMT | — Alternative Minimum Tax |
| BAN | — Bond Anticipation Notes |
| BHAC | — Berkshire Hathaway Assurance Corporation |
| CAB | — Capital Appreciation Bond |
| CCAB | — Convertible Capital Appreciation Bond |
| CDA | — Community Development Authority |
| CDO | — Collateralized Debt Obligation |
| COP | — Certificate of Participation |
| DRIVER | — Derivative Inverse Tax-Exempt Receipts |
| DW&P | — Department of Water & Power |
| DWR | — Department of Water Resources |
| ECFA | — Educational & Cultural Facilities Authority |
| EDA | — Economic Development Authority |
| EDFA | — Economic Development Finance Authority |
| ETF | — Exchange-Traded Fund |
| FFCB | — Federal Farm Credit Bank |
| FGIC | — Financial Guaranty Insurance Corporation |
| FHA | — Federal Housing Authority |
| FHLB | — Federal Home Loan Bank |
| FHLMC | — Federal Home Loan Mortgage Corporation |
| FNMA | — Federal National Mortgage Association |
| GDR | — Global Depository Receipt |
| GNMA | — Government National Mortgage Association |
| HCFR | — Healthcare Facilities Revenue |
| HEFA | — Health & Educational Facilities Authority |
| HEFAR | — Higher Education Facilities Authority Revenue |
| HFA | — Housing Finance Authority |
| HFFA | — Health Facilities Financing Authority |
| IBC | — Insured Bond Certificate |
| IDA | — Industrial Development Authority |
| IDAG | — Industrial Development Agency |
| IDR | — Industrial Development Revenue |
| KRW | — Republic of Korea Won |
| LIBOR | — London Interbank Offered Rate |
| LLC | — Limited Liability Company |
| LLP | — Limited Liability Partnership |
| MBIA | — Municipal Bond Insurance Association |
| MFHR | — Multi-Family Housing Revenue |
| MUD | — Municipal Utility District |
| NATL-RE | — National Public Finance Guarantee Corporation |
| PCFA | — Pollution Control Finance Authority |
| PCR | — Pollution Control Revenue |
| PFA | — Public Finance Authority |
| PFFA | — Public Facilities Financing Authority |
| PFOTER | — Puttable Floating Option Tax-Exempt Receipts |
| plc | — Public Limited Company |
| PUTTER | — Puttable Tax-Exempt Receipts |
| R&D | — Research & Development |
| RDA | — Redevelopment Authority |
| RDFA | — Redevelopment Finance Authority |
| REIT | — Real Estate Investment Trust |
| ROC | — Reset Option Certificates |
| SAVRS | — Select Auction Variable Rate Securities |
| SBA | — Small Business Authority |
| SFHR | — Single Family Housing Revenue |
| SFMR | — Single Family Mortgage Revenue |
| SPDR | — Standard & Poor’s Depositary Receipts |
| TAN | — Tax Anticipation Notes |
| TIPS | — Treasury Inflation-Protected Securities |
| TRAN | — Tax Revenue Anticipation Notes |
| TCR | — Transferable Custody Receipts |
| TTFA | — Transportation Trust Fund Authority |
| TVA | — Tennessee Valley Authority |
| XLCA | — XL Capital Assurance |
This page is intentionally left blank.
This page is intentionally left blank.


FOR MORE INFORMATION
More information about Wells Fargo Advantage Funds is available free upon request. To obtain literature, please write, e-mail, visit the Fund’s Web site, or call:
Wells Fargo Advantage Funds
P.O. Box 8266
Boston, MA 02266-8266
E-mail: wfaf@wellsfargo.com
Web site: www.wellsfargo.com/advantagefunds
Individual investors: 1-800-222-8222
Retail investment professionals: 1-888-877-9275
Institutional investment professionals: 1-866-765-0778
This report and the financial statements contained herein are submitted for the general information of the shareholders of Wells Fargo Advantage Funds. If this report is used for promotional purposes, distribution of the report must be accompanied or preceded by a current prospectus. For a prospectus containing more complete information, including charges and expenses, call 1-800-222-8222 or visit the Fund’s Web site at www.wellsfargo.com/advantagefunds. Please consider the investment objectives, risks, charges, and expenses of the investment carefully before investing. This and other information about Wells Fargo Advantage Funds can be found in the current prospectus. Read the prospectus carefully before you invest or send money.
Wells Fargo Funds Management, LLC, a wholly owned subsidiary of Wells Fargo & Company, provides investment advisory and administrative services for Wells Fargo Advantage Funds. Other affiliates of Wells Fargo & Company provide subadvisory and other services for the Funds. The Funds are distributed by Wells Fargo Funds Distributor, LLC, Member FINRA/SIPC, an affiliate of Wells Fargo & Company.
NOT FDIC INSURED ¡ NO BANK GUARANTEE ¡ MAY LOSE VALUE
© 2011 Wells Fargo Funds Management, LLC. All rights reserved.
| | |
 | | 205634 11-11 SA317/SAR317 9-11 |

Wells Fargo Advantage
Utility and Telecommunications Fund

Semi-Annual Report
September 30, 2011


WELLS FARGO INVESTMENT HISTORY
| | |
| |
| 1932 | | Keystone creates one of the first mutual fund families. |
| |
| 1971 | | Wells Fargo & Company introduces one of the first institutional index funds. |
| |
| 1978 | | Wells Fargo applies Markowitz and Sharpe’s research on Modern Portfolio Theory to introduce one of the industry’s first Tactical Asset Allocation (TAA) models in institutional separately managed accounts. |
| |
| 1984 | | Wells Fargo Stagecoach Funds launches its first asset allocation fund. |
| |
| 1989 | | The Tactical Asset Allocation (TAA) Model is first applied to Wells Fargo’s asset allocation mutual funds. |
| |
| 1994 | | Wells Fargo introduces the LifePath Funds, one of the first suites of target date funds (now the Wells Fargo Advantage Dow Jones Target Date FundsSM ). |
| |
| 1996 | | Evergreen Investments and Keystone Funds merge. |
| |
| 1997 | | Wells Fargo launches Wells Fargo Advantage WealthBuilder PortfoliosSM, a fund-of-funds suite of products that includes the use of quantitative models to shift assets among investment styles. |
| |
| 1999 | | Norwest Advantage Funds and Stagecoach Funds are reorganized into Wells Fargo Funds after the merger of Norwest and Wells Fargo. |
| |
| 2002 | | Evergreen Retail and Evergreen Institutional companies form the umbrella asset management company, Evergreen Investments. |
| |
| 2005 | | The integration of Strong Funds with Wells Fargo Funds creates Wells Fargo Advantage Funds, resulting in one of the top 20 mutual fund companies in the United States. |
| |
| 2006 | | Wells Fargo Advantage Funds relaunches the target date product line as Wells Fargo Advantage Dow Jones Target Date Funds. |
| |
| 2010 | | The mergers and reorganizations of Evergreen and Wells Fargo Advantage mutual funds are completed, unifying the families under the brand of Wells Fargo Advantage Funds. |
Wells Fargo Advantage Funds®
Wells Fargo Advantage Funds skillfully guides institutions, financial advisors, and individuals through the investment terrain to help them reach their financial objectives. Everything we do on behalf of investors is backed by our unique combination of qualifications.
Strength
Our organization is built on the standards of integrity and service established by our parent company—Wells Fargo & Company—more than 150 years ago. And, because we’re part of a highly diversified financial enterprise, we offer the depth of resources to help investors succeed.
Expertise
Our multi-boutique model offers investors access to the independent thinking of premier investment managers that have been chosen for their time-tested strategies. While each team specializes in a specific investment strategy, collectively they provide investors a wide choice of distinct investment styles. Our dedication to investment excellence doesn’t end with our expertise in manager selection—risk management, analysis, and rigorous ongoing review seek to ensure each manager’s investment process remains consistent.
Partnership
Our collaborative approach is built around understanding the needs and goals of our clients. By adhering to core principles of sound judgment and steady guidance, we support you through every stage of the investment decision process.
Carefully consider the investment objectives, risks, charges, and expenses before investing. For a current prospectus for Wells Fargo Advantage Funds containing this and other information, visit wellsfargo.com/advantagefunds. Read it carefully before investing.
Wells Fargo Funds Management, LLC, a wholly owned subsidiary of Wells Fargo & Company, provides investment advisory and administrative services for Wells Fargo Advantage Funds®. Other affiliates of Wells Fargo & Company provide subadvisory and other services for the Funds. The Funds are distributed by Wells Fargo Funds Distributor, LLC, Member FINRA/SIPC, an affiliate of Wells Fargo & Company.
The “Dow Jones Target Date Indexes” are a product of Dow Jones Indexes, a licensed trademark of CME Group Index Services LLC (“CME”). “Dow Jones” and “Dow Jones Target Date Indexes” are service marks of Dow Jones Trademark Holdings, LLC, and have been licensed for use for certain purposes by CME and sublicensed for use by Global Index Advisors, Inc., and Wells Fargo Funds Management, LLC. The Dow Jones Target Date Indexes are based in part on the Barclays Capital Bond Indexes, which are published by Barclays Capital Inc. The Wells Fargo Advantage Dow Jones Target Date Funds, based on the Dow Jones Target Date Indexes, are not sponsored, endorsed, sold, or promoted by Dow Jones, CME or Barclays Capital or any of their respective affiliates, and neither Dow Jones, CME nor Barclays Capital nor any of their respective affiliates makes any representation regarding the advisability of investing in such product(s) and/or about the quality, accuracy, and/or completeness of the Dow Jones Target Date Indexes or the Barclays Capital Bond Indexes. IN NO EVENT SHALL DOW JONES, CME, BARCLAYS CAPITAL, OR ANY OF THEIR LICENSORS HAVE ANY LIABILITY IN CONNECTION WITH THE Wells Fargo Advantage Dow Jones Target Date Funds INCLUDING, WITHOUT LIMITATION, FOR ANY SPECIAL, PUNITIVE, IN DIRECT, OR CONSEQUENTIAL DAMAGES (INCLUDING LOST PROFITS), EVEN IF NOTIFIED OF THE POSSIBILITY OF SUCH DAMAGES.
NOT FDIC INSURED ¡ NO BANK GUARANTEE ¡ MAY LOSE VALUE
Not part of the semi-annual report.
Wells Fargo Advantage Funds offers more than 110 mutual funds across a wide range of asset classes, representing over $213 billion in assets under management, as of September 30, 2011.
| | | | |
| Equity Funds | | | | |
Asia Pacific Fund | | Global Opportunities Fund | | Premier Large Company Growth Fund |
C&B Large Cap Value Fund | | Growth Fund | | Small Cap Opportunities Fund |
C&B Mid Cap Value Fund | | Health Care Fund | | Small Cap Value Fund |
Capital Growth Fund | | Index Fund | | Small Company Growth Fund |
Common Stock Fund | | International Equity Fund | | Small Company Value Fund |
Disciplined U.S. Core Fund | | International Value Fund | | Small/Mid Cap Core Fund |
Discovery Fund† | | Intrinsic Small Cap Value Fund | | Small/Mid Cap Value Fund |
Diversified Equity Fund | | Intrinsic Value Fund | | Social Sustainability Fund† |
Diversified International Fund | | Intrinsic World Equity Fund | | Special Mid Cap Value Fund |
Diversified Small Cap Fund | | Large Cap Core Fund | | Special Small Cap Value Fund |
Emerging Growth Fund | | Large Cap Growth Fund | | Specialized Technology Fund |
Emerging Markets Equity Fund | | Large Company Value Fund | | Strategic Large Cap Growth Fund |
Endeavor Select Fund† | | Omega Growth Fund | | Traditional Small Cap Growth Fund |
Enterprise Fund† | | Opportunity Fund† | | Utility and Telecommunications Fund |
Equity Value Fund | | Precious Metals Fund | | |
| Bond Funds | | | | |
Adjustable Rate Government Fund | | Inflation-Protected Bond Fund | | Short-Term Bond Fund |
California Limited-Term Tax-Free Fund | | Intermediate Tax/AMT-Free Fund | | Short-Term High Yield Bond Fund |
California Tax-Free Fund | | International Bond Fund | | Short-Term Municipal Bond Fund |
Colorado Tax-Free Fund | | Minnesota Tax-Free Fund | | Strategic Municipal Bond Fund |
Government Securities Fund | | Municipal Bond Fund | | Total Return Bond Fund |
High Income Fund | | North Carolina Tax-Free Fund | | Ultra Short-Term Income Fund |
High Yield Bond Fund | | Pennsylvania Tax-Free Fund | | Ultra Short-Term Municipal Income Fund |
Income Plus Fund | | Short Duration Government Bond Fund | | Wisconsin Tax-Free Fund |
| Asset Allocation Funds | | | | |
Asset Allocation Fund | | WealthBuilder Equity Portfolio† | | Target 2020 Fund† |
Conservative Allocation Fund | | WealthBuilder Growth Allocation Portfolio† | | Target 2025 Fund† |
Diversified Capital Builder Fund | | WealthBuilder Growth Balanced Portfolio† | | Target 2030 Fund† |
Diversified Income Builder Fund | | WealthBuilder Moderate Balanced Portfolio† | | Target 2035 Fund† |
Growth Balanced Fund | | WealthBuilder Tactical Equity Portfolio† | | Target 2040 Fund† |
Index Asset Allocation Fund | | Target Today Fund† | | Target 2045 Fund† |
Moderate Balanced Fund | | Target 2010 Fund† | | Target 2050 Fund† |
WealthBuilder Conservative Allocation Portfolio† | | Target 2015 Fund† | | Target 2055 Fund† |
| Money Market Funds | | | | |
100% Treasury Money Market Fund | | Minnesota Money Market Fund | | New Jersey Municipal Money Market Fund |
California Municipal Money Market Fund | | Money Market Fund | | New York Municipal Money Market Fund |
Cash Investment Money Market Fund | | Municipal Cash Management Money Market Fund | | Pennsylvania Municipal Money Market Fund |
Government Money Market Fund | | Municipal Money Market Fund | | Prime Investment Money Market Fund |
Heritage Money Market Fund† | | National Tax-Free Money Market Fund | | Treasury Plus Money Market Fund |
| Variable Trust Funds1 | | | | |
VT Discovery Fund† | | VT Intrinsic Value Fund | | VT Small Cap Growth Fund |
VT Index Asset Allocation Fund | | VT Omega Growth Fund | | VT Small Cap Value Fund |
VT International Equity Fund | | VT Opportunity Fund† | | VT Total Return Bond Fund |
An investment in a money market fund is not insured or guaranteed by the Federal Deposit Insurance Corporation or any other government agency. Although the Wells Fargo Advantage Money Market Funds seek to preserve the value of your investment at $1.00 per share, it is possible to lose money by investing in a money market fund.
| 1. | The Variable Trust Funds are generally available only through insurance company variable contracts. |
| † | In this report, the Wells Fargo Advantage Discovery FundSM, Wells Fargo Advantage Endeavor Select FundSM, Wells Fargo Advantage Enterprise FundSM, Wells Fargo Advantage Opportunity FundSM, Wells Fargo Advantage Social Sustainability FundSM, Wells Fargo Advantage WealthBuilder Conservative Allocation PortfolioSM, Wells Fargo Advantage WealthBuilder Equity PortfolioSM, Wells Fargo Advantage WealthBuilder Growth Allocation PortfolioSM, Wells Fargo Advantage WealthBuilder Growth Balanced PortfolioSM, Wells Fargo Advantage WealthBuilder Moderate Balanced PortfolioSM, Wells Fargo Advantage WealthBuilder Tactical Equity PortfolioSM, Wells Fargo Advantage Dow Jones Target Today FundSM, Wells Fargo Advantage Dow Jones Target 2010 FundSM, Wells Fargo Advantage Dow Jones Target 2015 FundSM, Wells Fargo Advantage Dow Jones Target 2020 FundSM, Wells Fargo Advantage Dow Jones Target 2025 FundSM, Wells Fargo Advantage Dow Jones Target 2030 FundSM, Wells Fargo Advantage Dow Jones Target 2035 FundSM, Wells Fargo Advantage Dow Jones Target 2040 FundSM, Wells Fargo Advantage Dow Jones Target 2045 FundSM, Wells Fargo Advantage Dow Jones Target 2050 FundSM, Wells Fargo Advantage Dow Jones Target 2055 FundSM, Wells Fargo Advantage Heritage Money Market FundSM, Wells Fargo Advantage VT Discovery FundSM, and Wells Fargo Advantage VT Opportunity FundSM are referred to as the Discovery Fund, Endeavor Select Fund, Enterprise Fund, Opportunity Fund, Social Sustainability Fund, WealthBuilder Conservative Allocation Portfolio, WealthBuilder Equity Portfolio, WealthBuilder Growth Allocation Portfolio, WealthBuilder Growth Balanced Portfolio, WealthBuilder Moderate Balanced Portfolio, WealthBuilder Tactical Equity Portfolio, Target Today Fund, Target 2010 Fund, Target 2015 Fund, Target 2020 Fund, Target 2025 Fund, Target 2030 Fund, Target 2035 Fund, Target 2040 Fund, Target 2045 Fund, Target 2050 Fund, Target 2055 Fund, Heritage Money Market Fund, VT Discovery Fund, and VT Opportunity Fund, respectively. |
Not part of the semi-annual report.
| | | | |
| 2 | | Wells Fargo Advantage Utility and Telecommunications Fund | | Letter to Shareholders |

Karla M. Rabusch,
President
Wells Fargo Advantage Funds
All major areas of the global stock market ended with losses, with most of the decline occurring in the second half of the period.
Dear Valued Shareholder,
We’re pleased to offer you this semi-annual report for the Wells Fargo Advantage Utility and Telecommunications Fund for the six-month period that ended September 30, 2011. Upon reviewing the report, you may notice a few changes from past reports, the most significant of which is the change from a multi-fund report to a single-fund report. We believe this change will give you more convenient access to your fund data.
The period was marked by growing pessimism about the economy and, consequently, increased market volatility as a variety of macroeconomic events—including the ongoing European sovereign debt crisis and the downgrade of the U.S. credit rating by Standard & Poor’s—caused investors to question the strength of the economic recovery. All major areas of the global stock market ended with losses, with most of the decline occurring in the second half of the period.
Market sentiment darkened as economic numbers weakened.
Prior to the period, economic numbers seemed to support the view of a gradual global economic recovery. However, growth in gross domestic product (GDP) for the first quarter of 2011 was initially reported at 1.8% but was later revised significantly downward to 0.4%. The amount of the downward revision not only reawakened fears that the economy was slowing, but also caused investors to put less of an emphasis on the 1.3% estimate for second-quarter GDP growth. The prolonged debate in the summer of 2011 over increasing the U.S. debt ceiling, which raised the possibility of the country defaulting on its debt, further weakened investor sentiment. Although the debate was resolved in time to prevent a default, Standard & Poor’s later cited the country’s dysfunctional political climate as one reason why it lowered the U.S. credit rating for long-term debt to AA+ from AAA1.
Persistent weakness in jobs and housing slowed economic growth.
The unemployment rate remained stubbornly high throughout the six-month period, beginning the period at 9.0% in April 2011 and ending the period modestly higher at 9.1% in September 2011. Widespread frustration over the continued weakness in the labor market was one factor behind the “Occupy Wall Street” protest movement that began in September 2011. Persistent weakness in the housing market remained another source of concern. By September, some market analysts were openly discussing the possibility of a return to recession; even those analysts who forecasted a continued recovery believed that it would occur only gradually. The end result was a U.S. stock market that weakened in June and recovered in July, then fell sharply in August and September to end the period with significant losses.
Europe’s sovereign debt problems continued to weigh on confidence.
The ongoing drama of the European sovereign debt crisis returned to center stage, as it became increasingly likely that eurozone member Greece would default on its sovereign debt, despite receiving aid from the European Union and
| 1. | The ratings indicated are from Standard & Poor’s. Credit quality ratings apply to underlying holdings of the fund and not the fund itself. Standard and Poor’s rates the creditworthiness of bonds, ranging from AAA (highest) to D (lowest). Ratings from A to CCC may be modified by the addition of a plus (+) or minus (-) sign to show relative standing within the rating categories. |
| | | | | | |
| Letter to Shareholders | | Wells Fargo Advantage Utility and Telecommunications Fund | | | 3 | |
the International Monetary Fund. Because many eurozone banks owned Greek debt, and many U.S. banks had financial ties to eurozone banks, investors worried about the effect of such an event on the global economy and financial system. Meanwhile, market participants increasingly worried about the debt burdens of Italy—which also had its credit rating downgraded by Standard & Poor’s—and later of France. Although France maintained its AAA rating as of the end of the period, French banks were heavily exposed to weaker sovereign credits, leading to fears of a state bailout and a resulting increase in France’s required expenditures. Partly because of the debt worries, European stock markets generally ended the period with losses.
Central banks continued to provide stimulus.
Throughout the reporting period, the Federal Open Market Committee kept its key interest rates at effectively zero in order to support the financial system. As previously planned, the Federal Reserve (Fed) ended its second round of quantitative easing (QE2)—in which it purchased a total of $600 billion in long-term U.S. Treasuries from November 2010 through June 2011—as well as reinvested an additional $250 billion to $300 billion in Treasuries with the proceeds from earlier investments. However, in response to extreme market volatility and signs of a weakening economy, in early August 2011, the Fed announced its intention to keep interest rates low until 2013. In September, the Fed implemented a program to sell $400 billion in short-term Treasuries in exchange for longer-term bonds—so-called “Operation Twist”—with the goal of pushing down long-term yields.
At the beginning of the period, the European Central Bank (ECB) had a key rate of 1.00%, but it raised it to 1.25% in April and then to 1.50% in July in an attempt to keep inflation in check. The ECB continued to provide unlimited liquidity for banks and, in August, after a sell-off in the sovereign bonds of Spain and Italy, announced plans to purchase the debt of those countries.
Global stock markets sold off during the period.
Stocks began the period rallying on hopes of a continued economic recovery, only to sell off sharply in late summer. For the period, economically sensitive stocks generally posted the deepest losses. As a result, the stocks of smaller companies—which generally have lesser access to capital and less diversified revenue streams than larger companies—performed the worst. The weaker economy also renewed concerns about potential loan losses at banks and other financial institutions. Among both large caps and small caps, growth stocks posted narrower losses than value stocks, largely because of weakness in financials (which are typically considered part of the value space). More defensive sectors such as health care and utilities generally outperformed. In addition, a rally in gold helped gold-related stocks post better returns than the broader market.
Many variables are at work in the market.
The full effect of the credit crisis remains unknown. Elevated unemployment and debt defaults continue to pressure consumers and businesses alike.
In this environment, experience tells us that strict adherence to time-tested strategies has its rewards. Wells Fargo Advantage Funds represents investments across a range of asset classes and investment styles, giving you an opportunity to
Stocks began the period rallying on hopes of a continued economic recovery, only to sell off sharply in late summer.
| | | | |
| 4 | | Wells Fargo Advantage Utility and Telecommunications Fund | | Letter to Shareholders |
create a diversified investment portfolio. While diversification may not prevent losses in a downturn, it does provide you with one way of managing risk.
Thank you for choosing to invest with Wells Fargo Advantage Funds. We appreciate your confidence in us and remain committed to helping you meet your financial needs. For current information about your fund investments, contact your investment professional, visit our website at www.wellsfargo.com/advantagefunds, or call us directly at 1-800-222-8222. We are available 24 hours a day, 7 days a week.
Sincerely,

Karla M. Rabusch
President
Wells Fargo Advantage Funds
| | | | | | |
| Performance Highlights (Unaudited) | | Wells Fargo Advantage Utility and Telecommunications Fund | | | 5 | |
INVESTMENT OBJECTIVE
The Fund seeks total return, consisting of current income and capital appreciation.
ADVISER
Wells Fargo Funds Management, LLC
SUB-ADVISER
Crow Point Partners, LLC
PORTFOLIO MANAGER
Timothy P. O’Brien, CFA
FUND INCEPTION
January 4, 1994
| | | | |
TEN LARGEST EQUITY HOLDINGS1
(AS OF SEPTEMBER 30, 2011) | |
CMS Energy Corporation | | | 5.00% | |
Constellation Energy Group Incorporated | | | 4.94% | |
Sempra Energy | | | 4.46% | |
Northeast Utilities | | | 4.37% | |
Wisconsin Energy Corporation | | | 4.11% | |
Dominion Resources Incorporated | | | 4.03% | |
El Paso Corporation | | | 3.91% | |
Nextera Energy Incorporated | | | 3.90% | |
National Fuel Gas Company | | | 3.86% | |
Public Service Enterprise Group Incorporated | | | 3.85% | |
| | |
INDUSTRY DISTRIBUTION2 (AS OF SEPTEMBER 30, 2011) | | |
|
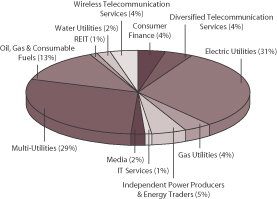 |
| 1. | The ten largest equity holdings are calculated based on the value of the securities divided by total net assets of the Fund. Holdings are subject to change and may have changed since the date specified. |
| 2. | Industry distribution is subject to change and is calculated based on the total long-term investments of the Fund. |
| | | | |
| 6 | | Wells Fargo Advantage Utility and Telecommunications Fund | | Performance Highlights (Unaudited) |
AVERAGE ANNUAL TOTAL RETURN3 (%) (AS OF SEPTEMBER 30, 2011)
| | | | | | | | | | | | | | | | | | | | | | | | | | | | | | | | | | | | | | | | | | | | |
| | | | | | Including Sales Charge | | | Excluding Sales Charge | | | Expense Ratios4 | |
| | | Inception Date | | | 6 Months* | | | 1 Year | | | 5 Year | | | 10 Year | | | 6 Months* | | | 1 Year | | | 5 Year | | | 10 Year | | | Gross | | | Net5 | |
Class A (EVUAX) | | | 01/04/1994 | | | | (7.07 | ) | | | 3.19 | | | | 1.96 | | | | 7.14 | | | | (1.40 | ) | | | 9.48 | | | | 3.18 | | | | 7.78 | | | | 1.25% | | | | 1.15% | |
Class B (EVUBX)** | | | 01/04/1994 | | | | (6.59 | ) | | | 3.69 | | | | 2.07 | | | | 7.22 | | | | (1.71 | ) | | | 8.69 | | | | 2.41 | | | | 7.22 | | | | 2.00% | | | | 1.90% | |
Class C (EVUCX) | | | 09/02/1994 | | | | (2.71 | ) | | | 7.70 | | | | 2.42 | | | | 6.97 | | | | (1.71 | ) | | | 8.70 | | | | 2.42 | | | | 6.97 | | | | 2.00% | | | | 1.90% | |
Administrator Class (EVUDX) | | | 07/30/2010 | | | | | | | | | | | | | | | | | | | | (1.21 | ) | | | 9.82 | | | | 3.27 | | | | 7.89 | | | | 1.09% | | | | 0.96% | |
Institutional Class (EVUYX) | | | 02/28/1994 | | | | | | | | | | | | | | | | | | | | (1.20 | ) | | | 9.88 | | | | 3.44 | | | | 8.07 | | | | 0.82% | | | | 0.79% | |
S&P Utilities Index6 | | | | | | | | | | | | | | | | | | | | | | | 7.78 | | | | 11.95 | | | | 3.88 | | | | 5.23 | | | | | | | | | |
S&P 500 Index7 | | | | | | | | | | | | | | | | | | | | | | | (13.78 | ) | | | 1.14 | | | | (1.18 | ) | | | 2.82 | | | | | | | | | |
| * | Returns for periods of less than one year are not annualized. |
| ** | Class B shares are closed to investment, except in connection with the reinvestment of any distributions and permitted exchanges. |
Figures quoted represent past performance, which is no guarantee of future results and do not reflect the deduction of taxes that a shareholder may pay on fund distributions or the redemption of fund shares. Investment return and principal value of an investment will fluctuate so that an investor’s shares, when redeemed, may be worth more or less than their original cost. Performance shown without sales charges would be lower if sales charges were reflected. Current performance may be lower or higher than the performance data quoted and assumes the reinvestment of dividends and capital gains. Current month-end performance is available on the Fund’s Web site – www.wellsfargo.com/advantagefunds.
Index returns do not include transaction costs associated with buying and selling securities, any mutual fund fees or expenses or any taxes. It is not possible to invest directly in an index.
For Class A shares, the maximum front-end sales charge is 5.75%. For Class B shares, the maximum contingent deferred sales charge is 5.00%. For Class C shares, the maximum contingent deferred sales charge is 1.00%. Performance including sales charge assumes the sales charge for the corresponding time period. Administrator Class and Institutional Class shares are sold without a front-end sales charge or contingent deferred sales charge.
Stock fund values fluctuate in response to the activities of individual companies and general market and economic conditions. Bond values fluctuate in response to the financial condition of individual issuers, general market and economic conditions, and changes in interest rates. In general, when interest rates rise, bond values fall and investors may lose principal value. The use of derivatives may reduce returns and/or increase volatility. Funds that concentrate their investments in limited sectors may be susceptible to financial, economic or market events impacting those sectors. Certain investment strategies tend to increase the total risk of an investment (relative to the broader market). This Fund is exposed to convertible securities risk, foreign investment risk, high-yield securities risk, non-diversification risk, smaller company securities risk, and subsidiary risk. Consult the Fund’s prospectus for additional information on these and other risks.
| 3. | Historical performance shown for the Administrator Class shares prior to their inception reflects the performance of the Institutional Class shares, adjusted to reflect the higher expenses applicable to the Administrator Class shares. Historical performance shown for all classes of the Fund prior to July 19, 2010 is based on the performance of the Fund’s predecessor, Evergreen Utility and Telecommunications Fund. |
| 4. | Reflects the expense ratios as stated in the most prospectuses. |
| 5. | The Adviser has committed through July 18, 2013 to waive fees and/or reimburse expenses to the extent necessary to cap the Fund’s Total Annual Fund Operating Expenses After Fee Waiver, excluding certain expenses, at 1.14% for Class A, 1.89% for Class B, 1.89% for Class C, 0.95% for Administrator Class and 0.78% for Institutional Class. Without this cap, the Fund’s returns would have been lower. |
| 6. | The S&P Utilities Index is a market value-weighted index, measuring the performance of all stocks within the Utility Sector of the S&P 500 Index. You cannot invest directly in an index. |
| 7. | The S&P 500 Index consists of 500 stocks chosen for market size, liquidity, and industry group representation. It is a market-value weighted index with each stock’s weight in the index proportionate to its market value. You cannot invest directly in an index. |
| | | | | | |
| Fund Expenses (Unaudited) | | Wells Fargo Advantage Utility and Telecommunications Fund | | | 7 | |
As a shareholder of the Fund, you incur two types of costs: (1) transaction costs, including sales charges (loads) on purchase payments and contingent deferred sales charges (if any) on redemptions and (2) ongoing costs, including management fees; distribution (12b-1) and/or shareholder service fees; and other Fund expenses. This example is intended to help you understand your ongoing costs (in dollars) of investing in the Fund and to compare these costs with the ongoing costs of investing in other mutual funds.
The example is based on an investment of $1,000 invested at the beginning of the six-month period and held for the entire period from April 1, 2011 to September 30, 2011.
Actual Expenses
The “Actual” line of the table below provides information about actual account values and actual expenses. You may use the information in this line, together with the amount you invested, to estimate the expenses that you paid over the period. Simply divide your account value by $1,000 (for example, an $8,600 account value divided by $1,000 = 8.6), then multiply the result by the number in the “Actual” line under the heading entitled “Expenses Paid During Period” for your applicable class of shares to estimate the expenses you paid on your account during this period.
Hypothetical Example for Comparison Purposes
The “Hypothetical” line of the table below provides information about hypothetical account values and hypothetical expenses based on the Fund’s actual expense ratio and an assumed rate of return of 5% per year before expenses, which is not the Fund’s actual return. The hypothetical account values and expenses may not be used to estimate the actual ending account balance or expenses you paid for the period. You may use this information to compare the ongoing costs of investing in the Fund and other funds. To do so, compare this 5% hypothetical example with the 5% hypothetical examples that appear in the shareholder reports of the other funds.
Please note that the expenses shown in the table are meant to highlight your ongoing costs only and do not reflect any transactional costs, such as sales charges (loads) and contingent deferred sales charges. Therefore, the “Hypothetical” line of the table is useful in comparing ongoing costs only, and will not help you determine the relative total costs of owning different funds. In addition, if these transactional costs were included, your costs would have been higher.
| | | | | | | | | | | | | | | | |
| | | Beginning
Account Value
04-01-2011 | | | Ending
Account Value
09-30-2011 | | | Expenses
Paid During
the Period1 | | | Net Annual
Expense Ratio | |
Class A | | | | | | | | | | | | | | | | |
Actual | | $ | 1,000.00 | | | $ | 986.04 | | | $ | 5.66 | | | | 1.14 | % |
Hypothetical (5% return before expenses) | | $ | 1,000.00 | | | $ | 1,019.30 | | | $ | 5.76 | | | | 1.14 | % |
Class B | | | | | | | | | | | | | | | | |
Actual | | $ | 1,000.00 | | | $ | 982.88 | | | $ | 9.37 | | | | 1.89 | % |
Hypothetical (5% return before expenses) | | $ | 1,000.00 | | | $ | 1,015.55 | | | $ | 9.52 | | | | 1.89 | % |
Class C | | | | | | | | | | | | | | | | |
Actual | | $ | 1,000.00 | | | $ | 982.93 | | | $ | 9.37 | | | | 1.89 | % |
Hypothetical (5% return before expenses) | | $ | 1,000.00 | | | $ | 1,015.55 | | | $ | 9.52 | | | | 1.89 | % |
Administrator Class | | | | | | | | | | | | | | | | |
Actual | | $ | 1,000.00 | | | $ | 987.86 | | | $ | 4.67 | | | | 0.94 | % |
Hypothetical (5% return before expenses) | | $ | 1,000.00 | | | $ | 1,020.30 | | | $ | 4.75 | | | | 0.94 | % |
Institutional Class | | | | | | | | | | | | | | | | |
Actual | | $ | 1,000.00 | | | $ | 987.98 | | | $ | 3.83 | | | | 0.77 | % |
Hypothetical (5% return before expenses) | | $ | 1,000.00 | | | $ | 1,021.15 | | | $ | 3.89 | | | | 0.77 | % |
| 1. | Expenses paid is equal to the annualized expense ratio of each class multiplied by the average account value over the period, multiplied by the number of days in the most recent fiscal half-year divided by the number of days in the fiscal year (to reflect the one-half year period). |
| | | | |
| 8 | | Wells Fargo Advantage Utility and Telecommunications Fund | | Portfolio of Investments—September 30, 2011 (Unaudited) |
| | | | | | | | | | | | |
| Security Name | | | | | | Shares | | | Value | |
| | | | | | | | | | | | |
| | | | |
Common Stocks: 89.66% | | | | | | | | | | | | |
| | | | |
Consumer Discretionary: 1.61% | | | | | | | | | | | | |
| | | | |
| Media: 1.61% | | | | | | | | | | | | |
Comcast Corporation Class A | | | | | | | 267,500 | | | $ | 5,590,750 | |
| | | | | | | | | | | | |
| | | | |
Energy: 12.11% | | | | | | | | | | | | |
| | | | |
| Oil, Gas & Consumable Fuels: 12.11% | | | | | | | | | | | | |
El Paso Corporation | | | | | | | 775,000 | | | | 13,547,000 | |
Enbridge Incorporated | | | | | | | 100,000 | | | | 3,193,000 | |
EQT Corporation | | | | | | | 58,600 | | | | 3,126,896 | |
GeoResources Incorporated†« | | | | | | | 187,270 | | | | 3,331,533 | |
Kodiak Oil & Gas Corporation†« | | | | | | | 600,000 | | | | 3,126,000 | |
Markwest Energy Partners LP | | | | | | | 75,000 | | | | 3,446,250 | |
Southwestern Energy Company† | | | | | | | 95,000 | | | | 3,166,350 | |
Spectra Energy Corporation | | | | | | | 100,000 | | | | 2,453,000 | |
The Williams Companies Incorporated | | | | | | | 270,000 | | | | 6,571,800 | |
| | | | |
| | | | | | | | | | | 41,961,829 | |
| | | | | | | | | | | | |
| | | | |
Financials: 4.86% | | | | | | | | | | | | |
| | | | |
| Consumer Finance: 4.16% | | | | | | | | | | | | |
MasterCard Incorporated Class A | | | | | | | 13,000 | | | | 4,123,080 | |
Visa Incorporated Class A« | | | | | | | 120,000 | | | | 10,286,400 | |
| | | | |
| | | | | | | | | | | 14,409,480 | |
| | | | | | | | | | | | |
| | | | |
| Diversified Financial Services: 0.10% | | | | | | | | | | | | |
Hicks Acquisition Company II Incorporated†(a) | | | | | | | 35,000 | | | | 351,750 | |
| | | | | | | | | | | | |
| | | | |
| REIT: 0.60% | | | | | | | | | | | | |
Starwood Property Trust Incorporated | | | | | | | 120,000 | | | | 2,059,200 | |
| | | | | | | | | | | | |
| | | | |
Industrials: 0.10% | | | | | | | | | | | | |
| | | | |
| Building Products: 0.10% | | | | | | | | | | | | |
Ameresco Incorporated Class A† | | | | | | | 35,000 | | | | 355,600 | |
| | | | | | | | | | | | |
| | | | |
Information Technology: 0.74% | | | | | | | | | | | | |
| | | | |
| Computers & Peripherals: 0.06% | | | | | | | | | | | | |
Mitek Systems Incorporated† | | | | | | | 25,000 | | | | 231,250 | |
| | | | | | | | | | | | |
| | | | |
| IT Services: 0.68% | | | | | | | | | | | | |
Convergys Corporation†« | | | | | | | 250,000 | | | | 2,345,000 | |
| | | | | | | | | | | | |
| | | | |
Telecommunication Services: 7.59% | | | | | | | | | | | | |
| | | | |
| Diversified Telecommunication Services: 4.17% | | | | | | | | | | | | |
AT&T Incorporated | | | | | | | 150,000 | | | | 4,278,000 | |
Surewest Communications | | | | | | | 17,596 | | | | 184,230 | |
Tele2 AB | | | | | | | 100,000 | | | | 1,811,252 | |
Verizon Communications Incorporated« | | | | | | | 100,000 | | | | 3,680,000 | |
VimpelCom Limited ADR« | | | | | | | 350,000 | | | | 3,335,500 | |
Windstream Corporation« | | | | | | | 100,000 | | | | 1,166,000 | |
| | | | |
| | | | | | | | | | | 14,454,982 | |
| | | | | | | | | | | | |
| | | | | | |
| Portfolio of Investments—September 30, 2011 (Unaudited) | | Wells Fargo Advantage Utility and Telecommunications Fund | | | 9 | |
| | | | | | | | | | | | | | |
| Security Name | | | | | | | Shares | | | Value | |
| | | | | | | | | | | | | | |
| | | | |
| Wireless Telecommunication Services: 3.42% | | | | | | | | | | | | | | |
Turkcell Iletisim Hizmetleri AS ADR« | | | | | | | | | 174,100 | | | $ | 1,963,848 | |
Shenandoah Telecommunication«(i) | | | | | | | | | 300,000 | | | | 3,342,000 | |
Sprint Nextel Corporation† | | | | | | | | | 2,153,705 | | | | 6,547,263 | |
| | | | |
| | | | | | | | | | | | | 11,853,111 | |
| | | | | | | | | | | | | | |
| | | | |
Utilities: 62.65% | | | | | | | | | | | | | | |
| | | | |
| Electric Utilities: 25.04% | | | | | | | | | | | | | | |
American Electric Power Company Incorporated | | | | | | | | | 75,000 | | | | 2,851,500 | |
FirstEnergy Corporation« | | | | | | | | | 250,000 | | | | 11,227,500 | |
Great Plains Energy Incorporated | | | | | | | | | 375,000 | | | | 7,237,500 | |
Hawaiian Electric Industries Incorporated« | | | | | | | | | 150,000 | | | | 3,642,000 | |
ITC Holdings Corporation | | | | | | | | | 100,000 | | | | 7,743,000 | |
Nextera Energy Incorporated | | | | | | | | | 250,050 | | | | 13,507,701 | |
Northeast Utilities | | | | | | | | | 450,000 | | | | 15,142,500 | |
NV Energy Incorporated | | | | | | | | | 300,000 | | | | 4,413,000 | |
Portland General Electric Company« | | | | | | | | | 250,000 | | | | 5,922,500 | |
PPL Corporation | | | | | | | | | 380,000 | | | | 10,845,200 | |
The Southern Company | | | | | | | | | 100,000 | | | | 4,237,000 | |
| | | | |
| | | | | | | | | | | | | 86,769,401 | |
| | | | | | | | | | | | | | |
| | | | |
| Gas Utilities: 3.87% | | | | | | | | | | | | | | |
National Fuel Gas Company | | | | | | | | | 275,000 | | | | 13,387,000 | |
| | | | | | | | | | | | | | |
| | | | |
| Independent Power Producers & Energy Traders: 4.94% | | | | | | | | | | | | | | |
Constellation Energy Group Incorporated | | | | | | | | | 450,000 | | | | 17,127,000 | |
| | | | | | | | | | | | | | |
| | | | |
| Multi-Utilities: 26.86% | | | | | | | | | | | | | | |
CenterPoint Energy Incorporated | | | | | | | | | 250,000 | | | | 4,905,000 | |
CMS Energy Corporation« | | | | | | | | | 875,000 | | | | 17,316,250 | |
Dominion Resources Incorporated« | | | | | | | | | 275,000 | | | | 13,961,750 | |
MDU Resources Group Incorporated | | | | | | | | | 300,000 | | | | 5,757,000 | |
Public Service Enterprise Group Incorporated | | | | | | | | | 400,000 | | | | 13,348,000 | |
SCANA Corporation« | | | | | | | | | 200,000 | | | | 8,090,000 | |
Sempra Energy« | | | | | | | | | 300,000 | | | | 15,450,000 | |
Wisconsin Energy Corporation | | | | | | | | | 455,000 | | | | 14,236,950 | |
| | | | |
| | | | | | | | | | | | | 93,064,950 | |
| | | | | | | | | | | | | | |
| | | | |
| Water Utilities: 1.94% | | | | | | | | | | | | | | |
American Water Works Company Incorporated | | | | | | | | | 200,000 | | | | 6,036,000 | |
Pennichuck Corporation | | | | | | | | | 24,348 | | | | 681,258 | |
| | | | |
| | | | | | | | | | | | | 6,717,258 | |
| | | | | | | | | | | | | | |
| | | | |
Total Common Stocks (Cost $237,987,124) | | | | | | | | | | | | | 310,678,561 | |
| | | | | | | | | | | | | | |
| | | | |
| | | Dividend Yield | | | | | | | | | |
| | | | |
Preferred Stocks: 5.74% | | | | | | | | | | | | | | |
| | | | |
Energy: 0.27% | | | | | | | | | | | | | | |
| | | | |
| Oil, Gas & Consumable Fuels: 0.27% | | | | | | | | | | | | | | |
ATP Oil & Gas Corporation 144A | | | 8.00 | % | | | | | 15,710 | | | | 924,926 | |
| | | | | | | | | | | | | | |
| | | | |
| 10 | | Wells Fargo Advantage Utility and Telecommunications Fund | | Portfolio of Investments—September 30, 2011 (Unaudited) |
| | | | | | | | | | | | | | | | |
| Security Name | | Dividend Yield | | | | | | Shares | | | Value | |
| | | | | | | | | | | | | | | | |
| | | | |
Financials: 0.41% | | | | | | | | | | | | | | | | |
| | | | |
| REIT: 0.41% | | | | | | | | | | | | | | | | |
Strategic Hotels & Resorts Incorporated Series B | | | 8.50 | % | | | | | | | 5,198 | | | $ | 123,556 | |
Strategic Hotels & Resorts Incorporated Series C | | | 8.50 | | | | | | | | 28,346 | | | | 690,792 | |
Pebblebrook Hotel Trust | | | 8.00 | | | | | | | | 25,000 | | | | 620,500 | |
| | | | |
| | | | | | | | | | | | | | | 1,434,848 | |
| | | | | | | | | | | | | | | | |
| | | | |
Utilities: 5.06% | | | | | | | | | | | | | | | | |
| | | | |
| Electric Utilities: 4.45% | | | | | | | | | | | | | | | | |
Entergy Arkansas Incorporated | | | 6.50 | | | | | | | | 250,000 | | | | 6,242,200 | |
Georgia Power Company | | | 6.45 | | | | | | | | 26,800 | | | | 2,913,964 | |
Interstate Power & Light Company | | | 8.38 | | | | | | | | 216,300 | | | | 6,272,700 | |
| | | | |
| | | | | | | | | | | | | | | 15,428,864 | |
| | | | | | | | | | | | | | | | |
| | | | |
| Multi-Utilities: 0.61% | | | | | | | | | | | | | | | | |
Pacific Gas & Electric Company | | | 7.70 | | | | | | | | 31,400 | | | | 742,610 | |
Scana Corporation | | | 4.36 | | | | | | | | 47,500 | | | | 1,347,100 | |
| | | | |
| | | | | | | | | | | | | | | 2,089,710 | |
| | | | | | | | | | | | | | | | |
| | | | |
Total Preferred Stocks (Cost $18,980,461) | | | | | | | | | | | | | | | 19,878,348 | |
| | | | | | | | | | | | | | | | |
| | | | |
| | | | | | Expiration Date | | | | | | | |
| | | | |
Warrants: 0.00% | | | | | | | | | | | | | | | | |
| | | | |
Utilities: 0.00% | | | | | | | | | | | | | | | | |
| | | | |
| Independent Power Producers & Energy Traders: 0.00% | | | | | | | | | | | | | | | | |
China Hydroelectric Corporation† | | | | | | | 01/25/2014 | | | | 30,000 | | | | 3,600 | |
| | | | | | | | | | | | | | | | |
| | | | |
Total Warrants (Cost $36,000) | | | | | | | | | | | | | | | 3,600 | |
| | | | | | | | | | | | | | | | |
| | | | |
| | | Yield | | | | | | | | | | |
| | | | |
Short-Term Investments: 25.41% | | | | | | | | | | | | | | | | |
| | | | |
| Investment Companies: 25.41% | | | | | | | | | | | | | | | | |
Wells Fargo Advantage Cash Investment Money Market Fund, Institutional Class(l)(u) | | | 0.06 | | | | | | | | 21,628,776 | | | | 21,628,776 | |
Wells Fargo Securities Lending Cash Investments, LLC(l)(u)(v)(r) | | | 0.20 | | | | | | | | 66,432,700 | | | | 66,432,700 | |
| | | | |
Total Short-Term Investments (Cost $88,061,476) | | | | | | | | | | | | | | | 88,061,476 | |
| | | | | | | | | | | | | | | | |
| | | | | | | | |
| Total Investments in Securities | | | | | | | | |
| (Cost $345,065,061)* | | | 120.81 | % | | | 418,621,985 | |
Other Assets and Liabilities, Net | | | (20.81 | ) | | | (72,113,066 | ) |
| | | | | | | | |
| Total Net Assets | | | 100.00 | % | | $ | 346,508,919 | |
| | | | | | | | |
| | | | | | |
| Portfolio of Investments—September 30, 2011 (Unaudited) | | Wells Fargo Advantage Utility and Telecommunications Fund | | | 11 | |
| † | Non-income earning security. |
| « | All or a portion of this security is on loan. |
| (a) | Security is fair valued by the Management Valuation Team, and in certain instances by the Board of Trustees, in accordance with procedures approved by the Board of Trustees. |
| 144A | Security that may be resold to “qualified institutional buyers” under Rule 144A or securities offered pursuant to Section 4(2) of the Securities Act of 1933, as amended. |
| (l) | Investment in an affiliate. |
| (u) | Rate shown is the 7-day annualized yield at period end. |
| (v) | Security represents investment of cash collateral received from securities on loan. |
| (r) | The investment company is exempt from registration under Section 3(c)(7) of the 1940 Act. |
| * | Cost for federal income tax purposes is $345,039,035 and net unrealized appreciation (depreciation) consists of: |
| | | | |
Gross unrealized appreciation | | $ | 77,447,532 | |
Gross unrealized depreciation | | | (3,864,582 | ) |
| | | | |
Net unrealized appreciation | | $ | 73,582,950 | |
The accompanying notes are an integral part of these financial statements.
| | | | |
| 12 | | Wells Fargo Advantage Utility and Telecommunications Fund | | Statement of Assets and Liabilities—September 30, 2011 (Unaudited) |
| | | | |
| | | | |
| |
Assets | | | | |
Investments | | | | |
In unaffiliated securities (including securities on loan), at value | | $ | 330,560,509 | |
In affiliated securities, at value | | | 88,061,476 | |
| | | | |
Total investments, at value (see cost below) | | | 418,621,985 | |
Receivable for investments sold | | | 319,577 | |
Receivable for Fund shares sold | | | 328,551 | |
Receivable for dividends | | | 903,880 | |
Receivable for securities lending income | | | 9,576 | |
Prepaid expenses and other assets | | | 48,801 | |
| | | | |
Total assets | | | 420,232,370 | |
| | | | |
| |
Liabilities | | | | |
Payable for Fund shares redeemed | | | 533,293 | |
Payable upon receipt of securities loaned | | | 66,432,700 | |
Due to custodian bank | | | 6,255,000 | |
Advisory fee payable | | | 175,030 | |
Distribution fees payable | | | 51,744 | |
Due to other related parties | | | 98,150 | |
Accrued expenses and other liabilities | | | 177,534 | |
| | | | |
Total liabilities | | | 73,723,451 | |
| | | | |
Total net assets | | $ | 346,508,919 | |
| | | | |
| |
NET ASSETS CONSIST OF | | | | |
Paid-in capital | | $ | 366,581,602 | |
Undistributed net investment income | | | 205,208 | |
Accumulated net realized losses on investments | | | (93,847,560 | ) |
Net unrealized gains on investments | | | 73,569,669 | |
| | | | |
Total net assets | | $ | 346,508,919 | |
| | | | |
| |
COMPUTATION OF NET ASSET VALUE AND OFFERING PRICE PER SHARE1 | | | | |
Net assets – Class A | | $ | 263,093,059 | |
Shares outstanding – Class A | | | 21,454,899 | |
Net asset value per share – Class A | | | $12.26 | |
Maximum offering price per share – Class A2 | | | $13.01 | |
Net assets – Class B | | $ | 20,635,678 | |
Shares outstanding – Class B | | | 1,681,631 | |
Net asset value per share – Class B | | | $12.27 | |
Net assets – Class C | | $ | 52,896,455 | |
Shares outstanding – Class C | | | 4,310,926 | |
Net asset value per share – Class C | | | $12.27 | |
Net assets – Administrator Class | | $ | 3,525,159 | |
Shares outstanding – Administrator Class | | | 287,238 | |
Net asset value per share – Administrator Class | | | $12.27 | |
Net assets – Institutional Class | | $ | 6,358,568 | |
Shares outstanding – Institutional Class | | | 517,680 | |
Net asset value per share – Institutional Class | | | $12.28 | |
| |
Total investments, at cost | | $ | 345,065,061 | |
| | | | |
Securities on loan, at value | | $ | 64,834,872 | |
| | | | |
| 1. | The Fund has an unlimited number of authorized shares. |
| 2. | Maximum offering price is computed as 100/94.25 of net asset value. On investments of $50,000 or more, the offering price is reduced. |
The accompanying notes are an integral part of these financial statements.
| | | | | | |
| Statement of Operations—Six Months Ended September 30, 2011 (Unaudited) | | Wells Fargo Advantage Utility and Telecommunications Fund | | | 13 | |
| | | | |
| | | | |
| |
Investment income | | | | |
Dividends* | | $ | 5,971,978 | |
Income from affiliated securities | | | 11,279 | |
Securities lending income, net | | | 87,557 | |
| | | | |
Total investment income | | | 6,070,814 | |
| | | | |
| |
Expenses | | | | |
Advisory fee | | | 1,123,657 | |
Administration fees | | | | |
Fund level | | | 93,638 | |
Class A | | | 367,084 | |
Class B | | | 29,809 | |
Class C | | | 76,186 | |
Administrator Class | | | 1,914 | |
Institutional Class | | | 2,727 | |
Shareholder servicing fees | | | | |
Class A | | | 352,965 | |
Class B | | | 28,663 | |
Class C | | | 73,256 | |
Administrator Class | | | 4,013 | |
Distribution fees | | | | |
Class B | | | 85,988 | |
Class C | | | 219,767 | |
Custody and accounting fees | | | 14,603 | |
Professional fees | | | 15,016 | |
Registration fees | | | 22,334 | |
Shareholder report expenses | | | 8,000 | |
Trustees’ fees and expenses | | | 5,157 | |
Other fees and expenses | | | 1,871 | |
| | | | |
Total expenses | | | 2,526,648 | |
Less: Fee waivers and/or expense reimbursements | | | (102,595 | ) |
| | | | |
Net expenses | | | 2,424,053 | |
| | | | |
Net investment income | | | 3,646,761 | |
| | | | |
| |
REALIZED AND UNREALIZED GAINS (LOSSES) ON INVESTMENTS | | | | |
| |
Net realized gains (losses) on: | | | | |
Unaffiliated securities | | | 7,478,674 | |
Written options | | | (593,562 | ) |
| | | | |
Net realized gains on investments | | | 6,885,112 | |
| | | | |
| |
Net change in unrealized gains (losses) on: | | | | |
Unaffiliated securities | | | (15,059,523 | ) |
Written options | | | (17,112 | ) |
| | | | |
Net change in unrealized gains (losses) on investments | | | (15,076,635 | ) |
| | | | |
Net realized and unrealized gains (losses) on investments | | | (8,191,523 | ) |
| | | | |
Net decrease in net assets resulting from operations | | $ | (4,544,762 | ) |
| | | | |
| |
* Net of foreign dividend withholding taxes of | | | $95,116 | |
The accompanying notes are an integral part of these financial statements.
| | | | |
| 14 | | Wells Fargo Advantage Utility and Telecommunications Fund | | Statements of Changes in Net Assets |
| | | | | | | | | | | | | | | | | | | | | | | | |
| | | Six Months Ended
September 30, 2011
(Unaudited) | | | Year Ended
March 31, 20111 | | | Year Ended
October 31, 20102 | |
| | | | | | |
Operations | | | | | | | | | | | | | | | | | | | | | | | | |
Net investment income | | | | | | $ | 3,646,761 | | | | | | | $ | 4,147,948 | | | | | | | $ | 9,836,366 | |
Net realized gains on investments | | | | | | | 6,885,112 | | | | | | | | 10,014,435 | | | | | | | | 15,886,440 | |
Net change in unrealized gains (losses) on investments | | | | | | | (15,076,635 | ) | | | | | | | 16,641,565 | | | | | | | | 18,063,899 | |
| | | | | | | | | | | | | | | | | | | | | | | | |
Net increase (decrease) in net assets resulting from operations | | | | | | | (4,544,762 | ) | | | | | | | 30,803,948 | | | | | | | | 43,786,705 | |
| | | | | | | | | | | | | | | | | | | | | | | | |
| | | | | | |
Distributions to shareholders from | | | | | | | | | | | | | | | | | | | | | | | | |
Net investment income | | | | | | | | | | | | | | | | | | | | | | | | |
Class A | | | | | | | (3,409,229 | ) | | | | | | | (3,377,592 | ) | | | | | | | (7,266,042 | ) |
Class B | | | | | | | (184,864 | ) | | | | | | | (209,487 | ) | | | | | | | (498,304 | ) |
Class C | | | | | | | (477,296 | ) | | | | | | | (507,114 | ) | | | | | | | (1,293,236 | ) |
Administrator Class | | | | | | | (49,537 | ) | | | | | | | (57,673 | ) | | | | | | | (44 | )3 |
Institutional Class | | | | | | | (95,079 | ) | | | | | | | (90,001 | ) | | | | | | | (246,342 | )4 |
| | | | | | | | | | | | | | | | | | | | | | | | |
Total distributions to shareholders | | | | | | | (4,216,005 | ) | | | | | | | (4,241,867 | ) | | | | | | | (9,303,968 | ) |
| | | | | | | | | | | | | | | | | | | | | | | | |
| | | | | | |
Capital share transactions | | | Shares | | | | | | | | Shares | | | | | | | | Shares | | | | | |
Proceeds from shares sold | | | | | | | | | | | | | | | | | | | | | | | | |
Class A | | | 689,650 | | | | 8,781,044 | | | | 773,836 | | | | 9,471,654 | | | | 1,932,934 | | | | 21,982,130 | |
Class B | | | 55,269 | | | | 688,722 | | | | 8,720 | | | | 106,576 | | | | 52,615 | | | | 599,896 | |
Class C | | | 92,507 | | | | 1,179,743 | | | | 169,806 | | | | 2,084,647 | | | | 732,973 | | | | 8,422,289 | |
Administrator Class | | | 15,156 | | | | 194,102 | | | | 440,154 | | | | 5,232,017 | | | | 901 | 3 | | | 10,000 | 3 |
Institutional Class | | | 49,448 | | | | 631,272 | | | | 44,146 | | | | 538,290 | | | | 486,747 | 4 | | | 5,585,331 | 4 |
| | | | | | | | | | | | | | | | | | | | | | | | |
| | | | | | | 11,474,883 | | | | | | | | 17,433,184 | | | | | | | | 36,599,646 | |
| | | | | | | | | | | | | | | | | | | | | | | | |
Reinvestment of distributions | | | | | | | | | | | | | | | | | | | | | | | | |
Class A | | | 237,182 | | | | 2,977,125 | | | | 243,520 | | | | 2,917,047 | | | | 540,491 | | | | 6,139,396 | |
Class B | | | 10,620 | | | | 133,505 | | | | 12,680 | | | | 151,524 | | | | 30,728 | | | | 349,330 | |
Class C | | | 26,304 | | | | 330,630 | | | | 27,109 | | | | 324,575 | | | | 62,162 | | | | 706,472 | |
Administrator Class | | | 2,186 | | | | 27,462 | | | | 2,279 | | | | 27,329 | | | | 4 | 3 | | | 44 | 3 |
Institutional Class | | | 7,390 | | | | 92,893 | | | | 7,214 | | | | 86,815 | | | | 20,700 | 4 | | | 236,053 | 4 |
| | | | | | | | | | | | | | | | | | | | | | | | |
| | | | | | | 3,561,615 | | | | | | | | 3,507,290 | | | | | | | | 7,431,295 | |
| | | | | | | | | | | | | | | | | | | | | | | | |
Payment for shares redeemed | | | | | | | | | | | | | | | | | | | | | | | | |
Class A | | | (2,014,274 | ) | | | (25,656,914 | ) | | | (2,481,126 | ) | | | (29,809,524 | ) | | | (6,501,199 | ) | | | (73,626,445 | ) |
Class B | | | (326,703 | ) | | | (4,163,837 | ) | | | (385,828 | ) | | | (4,662,845 | ) | | | (655,913 | ) | | | (7,422,193 | ) |
Class C | | | (624,323 | ) | | | (7,956,685 | ) | | | (920,278 | ) | | | (11,066,439 | ) | | | (2,734,181 | ) | | | (30,926,291 | ) |
Administrator Class | | | (40,197 | ) | | | (520,695 | ) | | | (133,245 | ) | | | (1,610,527 | ) | | | 0 | 3 | | | 0 | 3 |
Institutional Class | | | (87,132 | ) | | | (1,113,541 | ) | | | (110,009 | ) | | | (1,326,426 | ) | | | (753,525 | )4 | | | (8,601,349 | )4 |
| | | | | | | | | | | | | | | | | | | | | | | | |
| | | | | | | (39,411,672 | ) | | | | | | | (48,475,761 | ) | | | | | | | (120,576,278 | ) |
| | | | | | | | | | | | | | | | | | | | | | | | |
Net decrease in net assets resulting
from capital share transactions | | | | | | | (24,375,174 | ) | | | | | | | (27,535,287 | ) | | | | | | | (76,545,337 | ) |
| | | | | | | | | | | | | | | | | | | | | | | | |
Total decrease in net assets | | | | | | | (33,135,941 | ) | | | | | | | (973,206 | ) | | | | | | | (42,062,600 | ) |
| | | | | | | | | | | | | | | | | | | | | | | | |
| | | | | | |
Net assets | | | | | | | | | | | | | | | | | | | | | | | | |
Beginning of period | | | | | | | 379,644,860 | | | | | | | | 380,618,066 | | | | | | | | 422,680,666 | |
| | | | | | | | | | | | | | | | | | | | | | | | |
End of period | | | | | | $ | 346,508,919 | | | | | | | $ | 379,644,860 | | | | | | | $ | 380,618,066 | |
| | | | | | | | | | | | | | | | | | | | | | | | |
Undistributed net investment income | | | | | | $ | 205,208 | | | | | | | $ | 774,452 | | | | | | | $ | 321,287 | |
| | | | | | | | | | | | | | | | | | | | | | | | |
| 1. | For the five months ended March 31, 2011. The Fund changed its fiscal year end from October 31 to March 31, effective March 31, 2011. |
| 2. | After the close of business on July 16, 2010, the Fund acquired the net assets of Evergreen Utility and Telecommunications Fund which became the accounting and performance survivor in this transaction. The information for the period prior to July 19, 2010 is that of Evergreen Utility and Telecommunications Fund. |
| 3. | Class commenced operations on July 30, 2010. |
| 4. | Class I shares of Evergreen Utility and Telecommunications Fund became Institutional Class shares on July 19, 2010. |
The accompanying notes are an integral part of these financial statements.
| | | | | | |
| Financial Highlights | | Wells Fargo Advantage Utility and Telecommunications Fund | | | 15 | |
(For a share outstanding throughout each period)
| | | | | | | | | | | | | | | | | | | | | | | | | | | | |
| | | Six Months Ended
September 30, 2011
(Unaudited) | | | Year Ended
March 31, 20111 | | | Year Ended October 31, | |
| Class A | | | | 20102 | | | 20092 | | | 20082 | | | 20072 | | | 20062 | |
Net asset value, beginning of period | | $ | 12.59 | | | $ | 11.73 | | | $ | 10.77 | | | $ | 10.67 | | | $ | 16.69 | | | $ | 13.63 | | | $ | 12.03 | |
Net investment income | | | 0.14 | | | | 0.14 | | | | 0.29 | | | | 0.48 | | | | 1.06 | | | | 0.75 | | | | 1.15 | 3 |
Net realized and unrealized gains (losses) on investments | | | (0.31 | ) | | | 0.87 | | | | 0.94 | | | | 0.11 | | | | (6.17 | ) | | | 3.23 | | | | 1.35 | |
| | | | | | | | | | | | | | | | | | | | | | | | | | | | |
Total from investment operations | | | (0.17 | ) | | | 1.01 | | | | 1.23 | | | | 0.59 | | | | (5.11 | ) | | | 3.98 | | | | 2.50 | |
Distributions to shareholders from | | | | | | | | | | | | | | | | | | | | | | | | | | | | |
Net investment income | | | (0.16 | ) | | | (0.15 | ) | | | (0.27 | ) | | | (0.49 | ) | | | (0.91 | ) | | | (0.92 | ) | | | (0.90 | ) |
Net asset value, end of period | | $ | 12.26 | | | $ | 12.59 | | | $ | 11.73 | | | $ | 10.77 | | | $ | 10.67 | | | $ | 16.69 | | | $ | 13.63 | |
Total return4 | | | (1.40 | )% | | | 8.66 | % | | | 11.55 | % | | | 5.77 | % | | | (31.70 | )% | | | 29.97 | % | | | 21.67 | % |
Ratios to average net assets (annualized) | | | | | | | | | | | | | | | | | | | | | | | | | |
Gross expenses | | | 1.20 | % | | | 1.24 | % | | | 1.16 | % | | | 1.13 | % | | | 1.09 | % | | | 1.09 | % | | | 1.20 | % |
Net expenses | | | 1.14 | % | | | 1.14 | % | | | 1.12 | % | | | 1.13 | % | | | 1.07 | % | | | 1.04 | % | | | 1.11 | % |
Net investment income | | | 2.10 | % | | | 2.85 | % | | | 2.56 | % | | | 4.66 | % | | | 7.05 | % | | | 5.12 | % | | | 9.05 | % |
Supplemental data | | | | | | | | | | | | | | | | | | | | | | | | | | | | |
Portfolio turnover rate | | | 15 | % | | | 8 | % | | | 51 | % | | | 109 | % | | | 153 | % | | | 75 | % | | | 121 | % |
Net assets, end of period (000’s omitted) | | | $263,093 | | | | $283,716 | | | | $281,501 | | | | $301,953 | | | | $304,608 | | | | $507,539 | | | | $329,166 | |
| 1. | For the five months ended March 31, 2011. The Fund changed its fiscal year end from October 31 to March 31, effective March 31, 2011. |
| 2. | After the close of business on July 16, 2010, the Fund acquired the net assets of Evergreen Utility and Telecommunications Fund which became the accounting and performance survivor in the transaction. The information for the periods prior to July 19, 2010 is that of Class A of Evergreen Utility and Telecommunications Fund. |
| 3. | Calculated based upon average shares outstanding. |
| 4. | Total return calculations do not include any sales charges. Returns for periods of less than one year are not annualized. |
The accompanying notes are an integral part of these financial statements.
| | | | |
| 16 | | Wells Fargo Advantage Utility and Telecommunications Fund | | Financial Highlights |
(For a share outstanding throughout each period)
| | | | | | | | | | | | | | | | | | | | | | | | | | | | |
| | | Six Months Ended
September 30, 2011
(Unaudited) | | | Year Ended
March 31, 20111 | | | Year Ended October 31, | |
| Class B | | | | 20102 | | | 20092 | | | 20082 | | | 20072 | | | 20062 | |
Net asset value, beginning of period | | $ | 12.59 | | | $ | 11.72 | | | $ | 10.77 | | | $ | 10.67 | | | $ | 16.69 | | | $ | 13.63 | | | $ | 12.03 | |
Net investment income | | | 0.09 | 3 | | | 0.10 | 3 | | | 0.21 | 3 | | | 0.40 | 3 | | | 0.89 | 3 | | | 0.69 | | | | 1.09 | 3 |
Net realized and unrealized gains (losses) on investments | | | (0.30 | ) | | | 0.87 | | | | 0.93 | | | | 0.11 | | | | (6.11 | ) | | | 3.16 | | | | 1.32 | |
| | | | | | | | | | | | | | | | | | | | | | | | | | | | |
Total from investment operations | | | (0.21 | ) | | | 0.97 | | | | 1.14 | | | | 0.51 | | | | (5.22 | ) | | | 3.85 | | | | 2.41 | |
Distributions to shareholders from | | | | | | | | | | | | | | | | | | | | | | | | | | | | |
Net investment income | | | (0.11 | ) | | | (0.10 | ) | | | (0.19 | ) | | | (0.41 | ) | | | (0.80 | ) | | | (0.79 | ) | | | (0.81 | ) |
Net asset value, end of period | | $ | 12.27 | | | $ | 12.59 | | | $ | 11.72 | | | $ | 10.77 | | | $ | 10.67 | | | $ | 16.69 | | | $ | 13.63 | |
Total return4 | | | (1.71 | )% | | | 8.32 | % | | | 10.64 | % | | | 4.97 | % | | | (32.18 | )% | | | 28.91 | % | | | 20.85 | % |
Ratios to average net assets (annualized) | | | | | | | | | | | | | | | | | | | | | | | | | | | | |
Gross expenses | | | 1.95 | % | | | 1.99 | % | | | 1.91 | % | | | 1.88 | % | | | 1.81 | % | | | 1.79 | % | | | 1.90 | % |
Net expenses | | | 1.89 | % | | | 1.89 | % | | | 1.87 | % | | | 1.88 | % | | | 1.81 | % | | | 1.79 | % | | | 1.86 | % |
Net investment income | | | 1.34 | % | | | 2.09 | % | | | 1.82 | % | | | 3.92 | % | | | 6.02 | % | | | 4.32 | % | | | 8.60 | % |
Supplemental data | | | | | | | | | | | | | | | | | | | | | | | | | | | | |
Portfolio turnover rate | | | 15 | % | | | 8 | % | | | 51 | % | | | 109 | % | | | 153 | % | | | 75 | % | | | 121 | % |
Net assets, end of period (000’s omitted) | | | $20,636 | | | | $24,461 | | | | $27,042 | | | | $31,007 | | | | $35,106 | | | | $77,683 | | | | $69,496 | |
| 1. | For the five months ended March 31, 2011. The Fund changed its fiscal year end from October 31 to March 31, effective March 31, 2011. |
| 2. | After the close of business on July 16, 2010, the Fund acquired the net assets of Evergreen Utility and Telecommunications Fund which became the accounting and performance survivor in the transaction. The information for the periods prior to July 19, 2010 is that of Class B of Evergreen Utility and Telecommunications Fund. |
| 3. | Calculated based upon average shares outstanding. |
| 4. | Total return calculations do not include any sales charges. Returns for periods of less than one year are not annualized. |
The accompanying notes are an integral part of these financial statements.
| | | | | | |
| Financial Highlights | | Wells Fargo Advantage Utility and Telecommunications Fund | | | 17 | |
(For a share outstanding throughout each period)
| | | | | | | | | | | | | | | | | | | | | | | | | | | | |
| | | Six Months Ended
September 30, 2011
(Unaudited) | | | Year Ended
March 31, 20111 | | | Year Ended October 31, | |
| Class C | | | | 20102 | | | 20092 | | | 20082 | | | 20072 | | | 20062 | |
Net asset value, beginning of period | | $ | 12.59 | | | $ | 11.72 | | | $ | 10.77 | | | $ | 10.67 | | | $ | 16.69 | | | $ | 13.63 | | | $ | 12.04 | |
Net investment income | | | 0.09 | 3 | | | 0.11 | 3 | | | 0.21 | 3 | | | 0.40 | | | | 0.95 | | | | 0.67 | 3 | | | 1.00 | 3 |
Net realized and unrealized gains (losses) on investments | | | (0.30 | ) | | | 0.86 | | | | 0.93 | | | | 0.11 | | | | (6.17 | ) | | | 3.19 | | | | 1.41 | |
| | | | | | | | | | | | | | | | | | | | | | | | | | | | |
Total from investment operations | | | (0.21 | ) | | | 0.97 | | | | 1.14 | | | | 0.51 | | | | (5.22 | ) | | | 3.86 | | | | 2.41 | |
Distributions to shareholders from | | | | | | | | | | | | | | | | | | | | | | | | | | | | |
Net investment income | | | (0.11 | ) | | | (0.10 | ) | | | (0.19 | ) | | | (0.41 | ) | | | (0.80 | ) | | | (0.80 | ) | | | (0.82 | ) |
Net asset value, end of period | | $ | 12.27 | | | $ | 12.59 | | | $ | 11.72 | | | $ | 10.77 | | | $ | 10.67 | | | $ | 16.69 | | | $ | 13.63 | |
Total return4 | | | (1.71 | )% | | | 8.32 | % | | | 10.62 | % | | | 5.06 | % | | | (32.25 | )% | | | 28.99 | % | | | 20.77 | % |
Ratios to average net assets (annualized) | | | | | | | | | | | | | | | | | | | | | | | | | | | | |
Gross expenses | | | 1.95 | % | | | 1.99 | % | | | 1.91 | % | | | 1.88 | % | | | 1.82 | % | | | 1.79 | % | | | 1.90 | % |
Net expenses | | | 1.89 | % | | | 1.89 | % | | | 1.87 | % | | | 1.88 | % | | | 1.82 | % | | | 1.79 | % | | | 1.86 | % |
Net investment income | | | 1.34 | % | | | 2.10 | % | | | 1.83 | % | | | 3.86 | % | | | 6.36 | % | | | 4.33 | % | | | 7.92 | % |
Supplemental data | | | | | | | | | | | | | | | | | | | | | | | | | | | | |
Portfolio turnover rate | | | 15 | % | | | 8 | % | | | 51 | % | | | 109 | % | | | 153 | % | | | 75 | % | | | 121 | % |
Net assets, end of period (000’s omitted) | | | $52,896 | | | | $60,655 | | | | $64,942 | | | | $80,526 | | | | $74,008 | | | | $123,039 | | | | $45,765 | |
| 1. | For the five months ended March 31, 2011. The Fund changed its fiscal year end from October 31 to March 31, effective March 31, 2011. |
| 2. | After the close of business on July 16, 2010, the Fund acquired the net assets of Evergreen Utility and Telecommunications Fund which became the accounting and performance survivor in the transaction. The information for the periods prior to July 19, 2010 is that of Class C of Evergreen Utility and Telecommunications Fund. |
| 3. | Calculated based upon average shares outstanding. |
| 4. | Total return calculations do not include any sales charges. Returns for periods of less than one year are not annualized. |
The accompanying notes are an integral part of these financial statements.
| | | | |
| 18 | | Wells Fargo Advantage Utility and Telecommunications Fund | | Financial Highlights |
(For a share outstanding throughout each period)
| | | | | | | | | | | | |
| Administrator Class | | Six Months Ended
September 30, 2011
(Unaudited) | | | Year Ended
March 31,
20111 | | | Year Ended
October 31,
20102 | |
Net asset value, beginning of period | | $ | 12.59 | | | $ | 11.74 | | | $ | 11.10 | |
Net investment income | | | 0.15 | | | | 0.12 | 3 | | | 0.06 | |
Net realized and unrealized gains (losses) on investments | | | (0.30 | ) | | | 0.89 | | | | 0.63 | |
| | | | | | | | | | | | |
Total from investment operations | | | (0.15 | ) | | | 1.01 | | | | 0.69 | |
Distributions to shareholders from | | | | | | | | | | | | |
Net investment income | | | (0.17 | ) | | | (0.16 | ) | | | (0.05 | ) |
Net asset value, end of period | | $ | 12.27 | | | $ | 12.59 | | | $ | 11.74 | |
Total return4 | | | (1.21 | )% | | | 8.70 | % | | | 6.22 | % |
Ratios to average net assets (annualized) | | | | | | | | | | | | |
Gross expenses | | | 1.00 | % | | | 1.04 | % | | | 1.14 | % |
Net expenses | | | 0.94 | % | | | 0.95 | % | | | 0.95 | % |
Net investment income | | | 2.32 | % | | | 2.37 | % | | | 2.23 | % |
Supplemental data | | | | | | | | | | | | |
Portfolio turnover rate | | | 15 | % | | | 8 | % | | | 51 | % |
Net assets, end of period (000’s omitted) | | | $3,525 | | | | $3,904 | | | | $11 | |
| 1. | For the five months ended March 31, 2011. The Fund changed its fiscal year end from October 31 to March 31, effective March 31, 2011. |
| 2. | For the period from July 30, 2010 (commencement of class operations) to October 31, 2010. |
| 3. | Calculated based upon average shares outstanding. |
| 4. | Returns for periods of less than one year are not annualized. |
The accompanying notes are an integral part of these financial statements.
| | | | | | |
| Financial Highlights | | Wells Fargo Advantage Utility and Telecommunications Fund | | | 19 | |
(For a share outstanding throughout each period)
| | | | | | | | | | | | | | | | | | | | | | | | | | | | |
| | | Six Months Ended
September 30, 2011
(Unaudited) | | | Year Ended
March 31, 20111 | | | Year Ended October 31, | |
| Institutional Class | | | | 20102 | | | 20092 | | | 20082 | | | 20072 | | | 20062 | |
Net asset value, beginning of period | | $ | 12.61 | | | $ | 11.74 | | | $ | 10.78 | | | $ | 10.69 | | | $ | 16.72 | | | $ | 13.65 | | | $ | 12.04 | |
Net investment income | | | 0.16 | | | | 0.16 | | | | 0.31 | 3 | | | 0.51 | | | | 1.14 | 3 | | | 0.78 | | | | 1.26 | 3 |
Net realized and unrealized gains (losses) on investments | | | (0.31 | ) | | | 0.87 | | | | 0.95 | | | | 0.09 | | | | (6.23 | ) | | | 3.24 | | | | 1.28 | |
| | | | | | | | | | | | | | | | | | | | | | | | | | | | |
Total from investment operations | | | (0.15 | ) | | | 1.03 | | | | 1.26 | | | | 0.60 | | | | (5.09 | ) | | | 4.02 | | | | 2.54 | |
Distributions to shareholders from | | | | | | | | | | | | | | | | | | | | | | | | | | | | |
Net investment income | | | (0.18 | ) | | | (0.16 | ) | | | (0.30 | ) | | | (0.51 | ) | | | (0.94 | ) | | | (0.95 | ) | | | (0.93 | ) |
Net asset value, end of period | | $ | 12.28 | | | $ | 12.61 | | | $ | 11.74 | | | $ | 10.78 | | | $ | 10.69 | | | $ | 16.72 | | | $ | 13.65 | |
Total return4 | | | (1.20 | )% | | | 8.85 | % | | | 11.75 | % | | | 6.03 | % | | | (31.55 | )% | | | 30.24 | % | | | 22.09 | % |
Ratios to average net assets (annualized) | | | | | | | | | | | | | | | | | | | | | | | | | | | | |
Gross expenses | | | 0.77 | % | | | 0.81 | % | | | 0.86 | % | | | 0.89 | % | | | 0.83 | % | | | 0.79 | % | | | 0.90 | % |
Net expenses | | | 0.77 | % | | | 0.78 | % | | | 0.84 | % | | | 0.89 | % | | | 0.83 | % | | | 0.79 | % | | | 0.86 | % |
Net investment income | | | 2.47 | % | | | 3.22 | % | | | 2.73 | % | | | 4.88 | % | | | 7.92 | % | | | 5.31 | % | | | 9.98 | % |
Supplemental data | | | | | | | | | | | | | | | | | | | | | | | | | | | | |
Portfolio turnover rate | | | 15 | % | | | 8 | % | | | 51 | % | | | 109 | % | | | 153 | % | | | 75 | % | | | 121 | % |
Net assets, end of period (000’s omitted) | | | $6,359 | | | | $6,909 | | | | $7,123 | | | | $9,196 | | | | $8,927 | | | | $3,677 | | | | $2,606 | |
| 1. | For the five months ended March 31, 2011. The Fund changed its fiscal year end from October 31 to March 31, effective March 31, 2011. |
| 2. | After the close of business on July 16, 2010, the Fund acquired the net assets of Evergreen Utility and Telecommunications Fund which became the accounting and performance survivor in the transaction. The information for the periods prior to July 19, 2010 is that of Class I of Evergreen Utility and Telecommunications Fund. |
| 3. | Calculated based upon average shares outstanding. |
| 4. | Returns for periods of less than one year are not annualized. |
The accompanying notes are an integral part of these financial statements.
| | | | |
| 20 | | Wells Fargo Advantage Utility and Telecommunications Fund | | Notes to Financial Statements (Unaudited) |
1. ORGANIZATION
Wells Fargo Funds Trust (the “Trust”), a Delaware statutory trust organized on March 10, 1999, is an open-end management investment company registered under the Investment Company Act of 1940, as amended (the “1940 Act”). These financial statements report on Wells Fargo Advantage Utility and Telecommunications Fund (the “Fund”) which is a non-diversified series of the Trust.
2. SIGNIFICANT ACCOUNTING POLICIES
The following significant accounting policies, which are consistently followed in the preparation of the financial statements of the Fund, are in conformity with U.S. generally accepted accounting principles which require management to make estimates and assumptions that affect the reported amounts of assets and liabilities, disclosure of contingent assets and liabilities at the date of the financial statements, and the reported amounts of revenues and expenses during the reporting period. Actual results could differ from those estimates.
Securities valuation
Investments in securities are valued each business day as of the close of regular trading on the New York Stock Exchange, which is usually 4:00 p.m. (Eastern Time). Securities which are traded on a national or foreign securities exchange are valued at the last reported sales price, except that securities listed on The Nasdaq Stock Market, Inc. (“Nasdaq”) are valued at the Nasdaq Official Closing Price (“NOCP”), and if no NOCP is available, then at the last reported sales price. If no sales price is shown on the Nasdaq, the bid price will be used. In the absence of any sale of securities listed on the Nasdaq, and in the case of other securities, including U.S. Government obligations, but excluding debt securities maturing in 60 days or less, the price will be deemed “stale” and the valuations will be determined in accordance with the Fund’s Fair Value Procedures.
Securities denominated in foreign currencies are translated into U.S. dollars using the closing rates of exchange in effect on the day of valuation.
Many securities markets and exchanges outside the U.S. close prior to the close of the New York Stock Exchange and therefore may not fully reflect trading or events that occur after the close of the principal exchange in which the foreign investments are traded but before the close of the New York Stock Exchange. If such trading or events are expected to materially affect the value of the investments, then those investments are fair valued following procedures approved by the Board of Trustees. These procedures take into account multiple factors including movements in U.S. securities markets after foreign exchanges close. Depending on market activity, such fair valuations may be frequent. Such fair value pricing may result in NAVs that are higher or lower than NAVs based on the closing price or latest quoted bid price.
Debt securities of sufficient credit quality with original maturities of 60 days or less generally are valued at amortized cost which approximates fair value. The amortized cost method involves valuing a security at its cost, plus accretion of discount or minus amortization of premium over the period until maturity.
Investments in open-end mutual funds and non-registered investment companies are generally valued at net asset value.
Certain investments which are not valued using any of the methods discussed above, are valued at their fair value, as determined by procedures established in good faith and approved by the Board of Trustees.
Foreign currency translation
The accounting records of the Fund are maintained in U.S. dollars. Assets, including investment securities, and liabilities denominated in foreign currency are translated into U.S. dollars at the prevailing rates of exchange at the date of valuation. Purchases and sales of securities, and income and expenses are translated at the prevailing rate of exchange on the respective dates of such transactions. Reported net realized foreign exchange gains or losses arise from sales of foreign currencies, currency gains or losses realized between the trade and settlement dates on securities transactions, and the difference between the amounts of dividends, interest and foreign withholding taxes recorded and the U.S. dollar equivalent of the amounts actually paid or received. Net unrealized foreign exchange gains and losses arise from changes in the fair value of assets and liabilities other than investments in securities resulting in changes in exchange rates.
The changes in net assets arising from changes in exchange rates and the changes in net assets resulting from changes in market prices of securities are not separately presented. Such changes are recorded with net realized and unrealized gains or losses from investments. Gains and losses from certain foreign currency transactions are treated as ordinary income for U.S. federal income tax purposes.
| | | | | | |
| Notes to Financial Statements (Unaudited) | | Wells Fargo Advantage Utility and Telecommunications Fund | | | 21 | |
Security loans
The Fund may lend its securities from time to time in order to earn additional income in the form of fees or interest on securities received as collateral or the investment of any cash received as collateral. The Fund continues to receive interest or dividends on the securities loaned. The Fund receives collateral in the form of cash or securities with a value at least equal to the value of the securities on loan. The value of the loaned securities is determined at the close of each business day and any additional required collateral is delivered to the Fund on the next business day. In the event of default or bankruptcy by the borrower, the Fund could experience delays and costs in recovering the loaned securities or in gaining access to the collateral. In addition, the investment of any cash collateral received may lose all or part of its value. The Fund has the right under the lending agreement to recover the securities from the borrower on demand.
The Fund lends its securities through an unaffiliated securities lending agent. Cash collateral received in connection with its securities lending transactions is invested in Wells Fargo Securities Lending Cash Investments, LLC (the “Cash Collateral Fund”). The Cash Collateral Fund is exempt from registration under Section 3(c)(7) of the 1940 Act and is managed by Wells Fargo Funds Management LLC (“Funds Management”) and is sub-advised by Wells Capital Management Incorporated (“Wells Capital Management”). Funds Management receives an investment advisory fee starting at 0.05% and declining to 0.01% as the average daily net assets of the Cash Collateral Fund increase. All of the fees received by Funds Management are paid to Wells Capital Management for its services as sub-adviser. The Cash Collateral Fund seeks to provide a positive return compared to the daily Fed Funds Open rate by investing in high-quality, U.S. dollar-denominated short-term money market instruments. Cash Collateral Fund investments are fair valued based upon the amortized cost valuation technique. Income earned from investment in the Cash Collateral Fund is included in securities lending income on the Statement of Operations.
Options
The Fund may be subject to equity price risk in the normal course of pursuing its investment objectives. The Fund may write covered put or call options. When the Fund writes an option, an amount equal to the premium received is recorded as a liability and is subsequently adjusted to the current market value of the written option. Premiums received from written options, which expire unexercised, are recognized as realized gains from investments on the expiration date. The difference between the premium received and the amount paid on effecting a closing purchase transaction, including brokerage commissions, is treated as a realized gain or loss. If a call option is exercised, the premium is added to the proceeds from the sale of the underlying security in calculating the realized gain or loss on the sale. If a put option is exercised, the premium reduces the cost of the security purchased. The Fund, as a writer of an option, bears the market risk of an unfavorable change in the price of the security underlying the written option.
The Fund may also purchase call or put options. The premium is included in the Statement of Assets and Liabilities as an investment which is subsequently adjusted to the current market value of the option. Premiums paid for purchased options which expire are recognized as realized losses from investments on the expiration date. Premiums paid for purchased options which are exercised or closed are added to the amount paid or offset against the proceeds on the underlying security to determine the realized gain or loss. The risk of loss associated with purchased options is limited to the premium paid.
Options traded on an exchange are regulated and terms of the options are standardized. Options traded over the counter expose the Fund to counterparty risk in the event the counterparty does not perform. This risk is mitigated by having a master netting arrangement between the Fund and the counterparty and by having the counterparty post collateral to cover the Fund’s exposure to the counterparty.
Security transactions and income recognition
Securities transactions are recorded on a trade date basis. Realized gains or losses are reported on the basis of identified cost of securities delivered.
Dividend income is recognized on the ex-dividend date, except for certain dividends from foreign securities, which are recorded as soon as the Fund is informed of the ex-dividend date. Dividend income from foreign securities is recorded net of foreign taxes withheld where recovery of such taxes is not assured.
| | | | |
| 22 | | Wells Fargo Advantage Utility and Telecommunications Fund | | Notes to Financial Statements (Unaudited) |
Distributions to shareholders
Distributions to shareholders from net investment income and net realized gains, if any, are recorded on the ex-dividend date. Such distributions are determined in conformity with income tax regulations, which may differ from generally accepted accounting principles.
Federal and other taxes
The Fund intends to continue to qualify as a regulated investment company by distributing substantially all of its investment company taxable income and any net realized capital gains (after reduction for capital loss carryforwards) sufficient to relieve it from all, or substantially all, federal income taxes. Accordingly, no provision for federal income taxes was required.
The Fund’s income and federal excise tax returns and all financial records supporting those returns for the prior three fiscal years are subject to examination by the federal and Delaware revenue authorities.
As of March 31, 2011, the Fund had estimated net capital loss carryforwards, which were available to offset future net realized capital gains, in the amount of $100,854,177 with $46,086,660 expiring in 2016 and $54,767,517 expiring in 2017.
Under the recently enacted Regulated Investment Company Modernization Act of 2010, the Fund will be permitted to carry forward capital losses incurred in taxable years beginning after December 22, 2010 for an unlimited period. However, any losses incurred during those future taxable years will be required to be utilized prior to the losses incurred in pre-enactment taxable years. As a result of this ordering rule, pre-enactment capital loss carryforwards may be more likely to expire unused. Additionally, post-enactment capital losses that are carried forward will retain their character as either short-term or long-term capital losses rather than being considered all short-term as under previous law.
Class allocations
The separate classes of shares offered by the Fund differ principally in applicable sales charges, distribution, shareholder servicing and administration fees. Shareholders of each class bear certain expenses that pertain to that particular class. All shareholders bear the common expenses of the Fund, earn income from the portfolio, and are allocated unrealized gains and losses pro rata based on the average daily net assets of each class, without distinction between share classes. Dividends are determined separately for each class based on income and expenses allocable to each class. Realized gains and losses are allocated to each class pro rata based upon the net assets of each class on the date realized. Differences in per share dividend rates generally result from the relative weightings of pro rata income and realized gain allocations and from differences in separate class expenses, including distribution, shareholder servicing and administration fees.
3. FAIR VALUATION MEASUREMENTS
Fair value measurements of investments are determined within a framework that has established a fair value hierarchy based upon the various data inputs utilized in determining the value of the Fund’s investments. The three-level hierarchy gives the highest priority to unadjusted quoted prices in active markets for identical assets or liabilities (Level 1) and the lowest priority to unobservable inputs (Level 3). The Fund’s investments are classified within the fair value hierarchy based on the lowest level of input that is significant to the fair value measurement. The inputs are summarized into three broad levels as follows:
| n | | Level 1 – quoted prices in active markets for identical securities |
| n | | Level 2 – other significant observable inputs (including quoted prices for similar securities, interest rates, prepayment speeds, credit risk, etc.) |
| n | | Level 3 – significant unobservable inputs (including the Fund’s own assumptions in determining the fair value of investments) |
The inputs or methodologies used for valuing securities are not necessarily an indication of the risk associated with investing in those securities.
| | | | | | |
| Notes to Financial Statements (Unaudited) | | Wells Fargo Advantage Utility and Telecommunications Fund | | | 23 | |
As of September 30, 2011, the inputs used in valuing the Fund’s assets, which are carried at fair value, were as follows:
| | | | | | | | | | | | | | | | |
| Investments in Securities | | Quoted Prices (Level 1) | | | Significant Other
Observable Inputs (Level 2) | | | Significant Unobservable Inputs (Level 3) | | | Total | |
Equity securities | | | | | | | | | | | | | | | | |
Common stocks | | $ | 308,515,559 | | | $ | 2,163,002 | | | $ | 0 | | | $ | 310,678,561 | |
Preferred stocks | | | 11,968,612 | | | | 7,909,736 | | | | 0 | | | | 19,878,348 | |
Warrants | | | 0 | | | | 3,600 | | | | 0 | | | | 3,600 | |
Short-term investments | | | | | | | | | | | | | | | | |
Investment companies | | | 21,628,776 | | | | 66,432,700 | | | | 0 | | | | 88,061,476 | |
| | | $ | 342,112,947 | | | $ | 76,509,038 | | | $ | 0 | | | $ | 418,621,985 | |
Further details on the major security types listed above can be found in the Fund’s Portfolio of Investments.
Transfers in and transfers out are recognized at the end of the reporting period. For the six months ended September 30, 2011, the Fund did not have any significant transfers into/out of Level 1 and Level 2.
4. TRANSACTIONS WITH AFFILIATES AND OTHER EXPENSES
Advisory fee
The Trust has entered into an advisory contract with Funds Management, an indirect wholly owned subsidiary of Wells Fargo & Company (“Wells Fargo”). The adviser is responsible for implementing investment policies and guidelines and for supervising the sub-adviser, who is responsible for day-to-day portfolio management of the Fund.
Pursuant to the contract, Funds Management is entitled to receive an annual advisory fee starting at 0.60% and declining to 0.45% as the average daily net assets of the Fund increase. For the six months ended September 30, 2011, the advisory fee was equivalent to an annual rate of 0.60% of the Fund’s average daily net assets.
Funds Management may retain the services of certain sub-advisers to provide daily portfolio management to the Fund. The fees related to sub-advisory services are borne directly by the adviser and do not increase the overall fees paid by the Fund to the adviser. Crow Point Partners, LLC is the sub-adviser to the Fund and is entitled to receive a fee from the adviser at an annual rate starting at 0.20% and declining to 0.10% as the average daily net assets of the Fund increase.
Administration and transfer agent fees
The Trust has entered into an administration agreement with Funds Management. Under this agreement, for providing administrative services, which includes paying fees and expenses for services provided by the transfer agent, sub-transfer agents, omnibus account servicers and record-keepers, Funds Management is entitled to receive from the Fund an annual fund level administration fee starting at 0.05% and declining to 0.03% as the average daily net assets of the Fund increase and a class level administration fee which is calculated based on the average daily net assets of each class as follows:
| | | | |
| | | Class Level Administration Fee | |
Class A, Class B, Class C | | | 0.26 | % |
Administrator Class | | | 0.10 | |
Institutional Class | | | 0.08 | |
Funds Management has contractually waived and/or reimbursed advisory and administration fees to the extent necessary to maintain certain net operating expense ratios for the Fund. Waiver of fees and/or reimbursement of expenses by Funds Management were made first from fund level expenses on a proportionate basis and then from class specific expenses.
Distribution fees
The Trust has adopted a Distribution Plan for Class B and Class C shares of the Fund pursuant to Rule 12b-1 under the 1940 Act. Distribution fees are charged to the Class B and Class C shares and paid to Wells Fargo Funds Distributor, LLC, the principal underwriter, at an annual rate of 0.75% of the average daily net assets of Class B and Class C shares.
| | | | |
| 24 | | Wells Fargo Advantage Utility and Telecommunications Fund | | Notes to Financial Statements (Unaudited) |
For the six months ended September 30, 2011, Wells Fargo Funds Distributor, LLC received $12,561 from the sale of Class A shares and $6, $24,217 and $303 in contingent deferred sales charges from redemptions of Class A, Class B and Class C shares, respectively.
Shareholder servicing fees
The Trust has entered into contracts with one or more shareholder servicing agents, whereby Class A, Class B, Class C, and Administrator Class of the Fund is charged a fee at an annual rate of 0.25% of the average daily net assets of the class.
A portion of these total shareholder servicing fees were paid to affiliates of Wells Fargo.
5. INVESTMENT PORTFOLIO TRANSACTIONS
Purchases and sales of investments, excluding U.S. Government obligations (if any) and short-term securities (securities with maturities of one year or less at purchase date), for the six months ended September 30, 2011 were $53,938,593 and $83,807,339, respectively.
6. DERIVATIVE TRANSACTIONS
During the six months ended September 30, 2011, the Fund entered into purchased and written options for economic hedging purposes.
During the six months ended September 30, 2011, the Fund had written option activities as follows:
| | | | | | | | | | | | | | | | |
| | | Call Options | | | Put Options | |
| | | Number of
Contracts | | | Premiums
Received | | | Number of
Contracts | | | Premiums
Received | |
Options outstanding at March 31, 2011 | | | 497 | | | $ | 45,701 | | | | 11,438 | | | $ | 1,613 | |
Options written | | | 9,981 | | | | 731,486 | | | | 34,314 | | | | 4,927 | |
Options expired | | | (6,194 | ) | | | (427,113 | ) | | | (45,752 | ) | | | (6,540 | ) |
Options terminated in closing purchase transactions | | | (4,051 | ) | | | (332,452 | ) | | | 0 | | | | 0 | |
Options exercised | | | (233 | ) | | | (17,622 | ) | | | 0 | | | | 0 | |
Options outstanding at September 30, 2011 | | | 0 | | | $ | 0 | | | | 0 | | | $ | 0 | |
As of September 30, 2011, the Fund did not have any open written options but had total premiums received that averaged $68,068 and $2,871 for call and put options, respectively, during the six months ended September 30, 2011. During the six months ended September 30, 2011, the Fund had purchased put options with an average cost of $2,657.
A summary of derivative instruments by primary risk exposure is outlined in the following tables, unless the only primary risk exposure category is already reflected in the appropriate financial statements.
The effect of derivative instruments on the Statement of Operations for the six months ended September 30, 2011 was as follows for the Fund:
| | | | | | | | | | | | |
| | | Amount of Realized
Losses on
Derivatives | | | Change in Unrealized
Gains (Losses) on
Derivatives | |
| | | Unaffiliated
Securities | | Written
Options | | | Unaffiliated
Securities | | Written
Options | |
Equity contracts | | $(18,493)* | | $ | (593,562 | ) | | $(1,415)* | | $ | (17,112 | ) |
| * | Amount relates to purchased options. |
7. BANK BORROWINGS
The Trust (excluding the money market funds) and Wells Fargo Variable Trust are parties to a $150,000,000 revolving credit agreement with State Street Bank and Trust Company, whereby the Fund is permitted to use bank borrowings for temporary or emergency purposes, such as to fund shareholder redemption requests. Interest under the credit agreement is charged to the Fund based on a borrowing rate equal to the higher of the Federal Funds rate in effect on
| | | | | | |
| Notes to Financial Statements (Unaudited) | | Wells Fargo Advantage Utility and Telecommunications Fund | | | 25 | |
that day plus 1.25% or the overnight LIBOR rate in effect on that day plus 1.25%. In addition, under the credit agreement, the Fund pays an annual commitment fee equal to 0.10% of the unused balance, which is allocated pro rata. Prior to September 6, 2011, the revolving credit agreement was for $125,000,000 and the annual commitment fee paid by the Fund was 0.125% of the unused balance. For the six months ended September 30, 2011, the Fund paid $357 in commitment fees.
For the six months ended September 30, 2011, there were no borrowings by the Fund under the agreement.
8. CONCENTRATION RISK
The Fund invests a substantial portion of its assets in the utility and telecommunications sectors and, therefore, may be more affected by changes in those sectors than would be a comparable mutual fund whose investments are not heavily weighted in any sector.
9. INDEMNIFICATION
Under the Trust’s organizational documents, the officers and directors are indemnified against certain liabilities that may arise out of performance of their duties to the Trust. Additionally, in the normal course of business, the Trust may enter into contracts with service providers that contain a variety of indemnification clauses. The Trust’s maximum exposure under these arrangements is dependent on future claims that may be made against the Fund and, therefore, cannot be estimated.
10. NEW ACCOUNTING PRONOUNCEMENTS
In May 2011, the Financial Accounting Standards Board (“FASB”) issued Accounting Standards Update (“ASU”) No. 2011-04 “Amendments to Achieve Common Fair Value Measurement and Disclosure Requirements in U.S. GAAP and IFRSs”. ASU No. 2011-04 amends FASB ASC Topic 820, Fair Value Measurements and Disclosures, to establish common requirements for measuring fair value and for disclosing information about fair value measurements in accordance with GAAP. The ASU is effective prospectively for interim and annual periods beginning after December 15, 2011.
In April 2011, FASB issued ASU No. 2011-03 “Reconsideration of Effective Control for Repurchase Agreements”. ASU No. 2011-03 amends FASB ASC Topic 860, Transfers and Servicing, specifically the criteria required to determine whether a repurchase agreement (repo) and similar agreements should be accounted for as sales of financial assets or secured borrowings with commitments. ASU No. 2011-03 changes the assessment of effective control by focusing on the transferor’s contractual rights and obligations and removing the criterion to assess its ability to exercise those rights or honor those obligations. This could result in changes to the way entities account for certain transactions including repurchase agreements, mortgage dollar rolls and reverse repurchase agreements. The ASU will become effective on a prospective basis for new transfers and modifications to existing transactions as of the beginning of the first interim or annual period beginning on or after December 15, 2011.
As of September 30, 2011, management of the Fund is currently assessing the potential impact, in addition to expanded financial statement disclosure, that may result from adopting these ASUs.
| | | | |
| 26 | | Wells Fargo Advantage Utility and Telecommunications Fund | | Other Information (Unaudited) |
PROXY VOTING INFORMATION
A description of the policies and procedures that the Fund uses to determine how to vote proxies relating to portfolio securities is available without charge, upon request, by calling 1-800-222-8222, visiting our Web site at www.wellsfargo.com/advantagefunds, or visiting the SEC Web site at www.sec.gov. Information regarding how the Fund voted proxies relating to portfolio securities during the most recent 12-month period ended June 30 is available without charge on the Fund’s Web site at www.wellsfargo.com/advantagefunds or by visiting the SEC Web site at www.sec.gov.
PORTFOLIO HOLDINGS INFORMATION
The complete portfolio holdings for the Fund are publicly available on the Fund’s Web site (www.wellsfargo.com/advantagefunds) on a monthly, 30-day or more delayed basis. In addition, top ten holdings information for the Fund is publicly available on the Fund’s Web site on a monthly, seven-day or more delayed basis. The Fund files its complete schedule of portfolio holdings with the SEC for the first and third quarters of each fiscal year on Form N-Q, which is available without charge by visiting the SEC Web site at www.sec.gov. In addition, the Fund’s Form N-Q may be reviewed and copied at the SEC’s Public Reference Room in Washington, DC, and at regional offices in New York City, at 233 Broadway, and in Chicago, at 175 West Jackson Boulevard, Suite 900. Information about the Public Reference Room may be obtained by calling 1-800-SEC-0330.
| | | | | | |
| Other Information (Unaudited) | | Wells Fargo Advantage Utility and Telecommunications Fund | | | 27 | |
BOARD OF TRUSTEES
The following table provides basic information about the Board of Trustees (the “Trustees”) of the Trust and Officers of the Trust. This table should be read in conjunction with the Prospectus and the Statement of Additional Information1 of the Fund. Each of the Trustees and Officers listed below acts in identical capacities for the Wells Fargo Advantage family of funds, which consists of 144 funds comprising the Wells Fargo Funds Trust, Wells Fargo Variable Trust, Wells Fargo Master Trust and four closed-end funds (collectively the “Fund Complex”). All of the Trustees are also Members of the Audit and Governance Committees of each Trust in the Fund Complex. The mailing address of each Trustee and Officer is 525 Market Street, 12th Floor, San Francisco, CA 94105. Each Trustee and Officer serves an indefinite term, however, each Trustee serves such term until reaching the mandatory retirement age established by the Trustees.
Independent Trustees
| | | | | | |
Name and Year of Birth | | Position Held and Length of Service | | Principal Occupations During Past Five Years | | Other Directorships During
Past Five Years |
Peter G. Gordon
(Born 1942) | | Trustee, since 1998; Chairman, since 2005 | | Co-Founder, Chairman, President and CEO of Crystal Geyser. Water Company. Trustee Emeritus, Colby College | | Asset Allocation Trust |
Isaiah Harris, Jr.
(Born 1952) | | Trustee, since 2009 | | Retired. Prior thereto, President and CEO of BellSouth Advertising and Publishing Corp. from 2005 to 2007, President and CEO of BellSouth Enterprises from 2004 to 2005 and President of BellSouth Consumer Services from 2000 to 2003. Emeritus member of the Iowa State University Foundation Board of Governors. Emeritus Member of the Advisory Board of Iowa State University School of Business. Mr. Harris is a certified public accountant. | | CIGNA Corporation; Deluxe Corporation; Asset Allocation Trust |
Judith M. Johnson
(Born 1949) | | Trustee, since 2008 | | Retired. Prior thereto, Chief Executive Officer and Chief Investment Officer of Minneapolis Employees Retirement Fund from 1996 to 2008. Ms. Johnson is an attorney, certified public accountant and a certified managerial accountant. | | Asset Allocation Trust |
Leroy Keith, Jr.
(Born 1939) | | Trustee, since 2010 | | Chairman, Bloc Global Services (development and construction), Trustee of the Evergreen Funds from 1983 to 2010. Former Managing Director, Almanac Capital Management (commodities firm), former Partner, Stonington Partners, Inc. (private equity fund), former Director, Obagi Medical Products Co. and former Director, Lincoln Educational Services. | | Trustee, Virtus Fund Complex (consisting of 45 portfolios as of 12/31/10); Director, Diversapack Co. (packaging company); Asset Allocation Trust |
David F. Larcker
(Born 1950) | | Trustee, since 2009 | | James Irvin Miller Professor of Accounting at the Graduate School of Business, Stanford University, Director of Corporate Governance Research Program and Co-Director of The Rock Center for Corporate Governance since 2006. From 2005 to 2008, Professor of Accounting at the Graduate School of Business, Stanford University. Prior thereto, Ernst & Young Professor of Accounting at The Wharton School, University of Pennsylvania from 1985 to 2005. | | Asset Allocation Trust |
Olivia S. Mitchell
(Born 1953) | | Trustee, since 2006 | | International Foundation of Employee Benefit Plans Professor, Wharton School of the University of Pennsylvania since 1993. Director of Wharton’s Pension Research Council and Boettner Center on Pensions & Retirement Research, and Research Associate at the National Bureau of Economic Research. Previously, Cornell University Professor from 1978 to 1993. | | Asset Allocation Trust |
| | | | |
| 28 | | Wells Fargo Advantage Utility and Telecommunications Fund | | Other Information (Unaudited) |
| | | | | | |
Name and Year of Birth | | Position Held and Length of Service | | Principal Occupations During Past Five Years | | Other Directorships During
Past Five Years |
Timothy J. Penny
(Born 1951) | | Trustee, since 1996 | | President and CEO of Southern Minnesota Initiative Foundation, a non-profit organization, since 2007 and Senior Fellow at the Humphrey Institute Policy Forum at the University of Minnesota since 1995. Member of the Board of Trustees of NorthStar Education Finance, Inc., a non-profit organization, since 2007. | | Asset Allocation Trust |
Michael S. Scofield
(Born 1943) | | Trustee, since 2010 | | Served on the Investment Company Institute’s Board of Governors and Executive Committee from 2008-2011 as well the Governing Council of the Independent Directors Council from 2006-2011 and the Independent Directors Council Executive Committee from 2008-2011. Chairman of the IDC from 2008-2010. Institutional Investor (Fund Directions) Trustee of Year in 2007. Trustee of the Evergreen Funds (and its predecessors) from 1984 to 2010. Chairman of the Evergreen Funds from 2000-2010. Former Trustee of the Mentor Funds. Retired Attorney, Law Offices of Michael S. Scofield and former Director and Chairman, Branded Media Corporation (multi-media branding company). | | Asset Allocation Trust |
Donald C. Willeke
(Born 1940) | | Trustee, since 1996 | | Principal of the law firm of Willeke & Daniels. General Counsel of the Minneapolis Employees Retirement Fund from 1984 until its consolidation into the Minnesota Public Employees Retirement Association on June 30, 2010. | | Asset Allocation Trust |
Officers
| | | | | | |
Name and Year of Birth | | Position Held and
Length of Service | | Principal Occupations During Past Five Years | | |
Karla M. Rabusch
(Born 1959) | | President, since 2003 | | Executive Vice President of Wells Fargo Bank, N.A. and President of Wells Fargo Funds Management, LLC since 2003. Senior Vice President and Chief Administrative Officer of Wells Fargo Funds Management, LLC from 2001 to 2003. | | |
C. David Messman
(Born 1960) | | Secretary, since 2000; Chief Legal Counsel, since 2003 | | Senior Vice President and Secretary of Wells Fargo Funds Management, LLC since 2001. Vice President and Managing Counsel of Wells Fargo Bank, N.A. since 1996. | | |
Kasey Phillips
(Born 1970) | | Treasurer, since 2008 | | Senior Vice President of Wells Fargo Funds Management, LLC since 2009. Senior Vice President of Evergreen Investment Management Company, LLC from 2006 to 2010. Treasurer of the Evergreen Funds from 2005 to 2010. Vice President and Assistant Vice President of Evergreen Investment Services, Inc. from 1999 to 2006. | | |
David Berardi
(Born 1975) | | Assistant Treasurer, since 2009 | | Vice President of Wells Fargo Funds Management, LLC since 2009 . Vice President of Evergreen Investment Management Company, LLC from 2008 to 2010. Assistant Vice President of Evergreen Investment Services, Inc. from 2004 to 2008. Manager of Fund Reporting and Control for Evergreen Investment Management Company, LLC from 2004 to 2010. | | |
Jeremy DePalma
(Born 1974) | | Assistant Treasurer, since 2009 | | Senior Vice President of Wells Fargo Funds Management, LLC since 2009. Senior Vice President of Evergreen Investment Management Company, LLC from 2008 to 2010. Vice President, Evergreen Investment Services, Inc. from 2004 to 2007. Assistant Vice President, Evergreen Investment Services, Inc. from 2000 to 2004 and the head of the Fund Reporting and Control Team within Fund Administration from 2005 to 2010. | | |
Debra Ann Early
(Born 1964) | | Chief Compliance Officer, since 2007 | | Chief Compliance Officer of Wells Fargo Funds Management, LLC since 2007. Chief Compliance Officer of Parnassus Investments from 2005 to 2007. Chief Financial Officer of Parnassus Investments from 2004 to 2007 and Senior Audit Manager of PricewaterhouseCoopers LLP from 1998 to 2004. | | |
| 1. | The Statement of Additional Information includes additional information about the Fund’s Trustees and is available, without charge, upon request, by calling 1-800-222-8222 or by visiting the Fund’s Web site at www.wellsfargo.com/advantagefunds. |
| | | | | | |
| List of Abbreviations | | Wells Fargo Advantage Utility and Telecommunications Fund | | | 29 | |
The following is a list of common abbreviations for terms and entities which may have appeared in this report.
| ACB | — Agricultural Credit Bank |
| ADR | — American Depository Receipt |
| ADS | — American Depository Shares |
| AGC-ICC | — Assured Guaranty Corporation - Insured Custody Certificates |
| AGM | — Assured Guaranty Municipal |
| AMBAC | — American Municipal Bond Assurance Corporation |
| AMT | — Alternative Minimum Tax |
| BAN | — Bond Anticipation Notes |
| BHAC | — Berkshire Hathaway Assurance Corporation |
| CAB | — Capital Appreciation Bond |
| CCAB | — Convertible Capital Appreciation Bond |
| CDA | — Community Development Authority |
| CDO | — Collateralized Debt Obligation |
| COP | — Certificate of Participation |
| DRIVER | — Derivative Inverse Tax-Exempt Receipts |
| DW&P | — Department of Water & Power |
| DWR | — Department of Water Resources |
| ECFA | — Educational & Cultural Facilities Authority |
| EDA | — Economic Development Authority |
| EDFA | — Economic Development Finance Authority |
| ETF | — Exchange-Traded Fund |
| FFCB | — Federal Farm Credit Bank |
| FGIC | — Financial Guaranty Insurance Corporation |
| FHA | — Federal Housing Authority |
| FHLB | — Federal Home Loan Bank |
| FHLMC | — Federal Home Loan Mortgage Corporation |
| FNMA | — Federal National Mortgage Association |
| GDR | — Global Depository Receipt |
| GNMA | — Government National Mortgage Association |
| HCFR | — Healthcare Facilities Revenue |
| HEFA | — Health & Educational Facilities Authority |
| HEFAR | — Higher Education Facilities Authority Revenue |
| HFA | — Housing Finance Authority |
| HFFA | — Health Facilities Financing Authority |
| IBC | — Insured Bond Certificate |
| IDA | — Industrial Development Authority |
| IDAG | — Industrial Development Agency |
| IDR | — Industrial Development Revenue |
| KRW | — Republic of Korea Won |
| LIBOR | — London Interbank Offered Rate |
| LLC | — Limited Liability Company |
| LLP | — Limited Liability Partnership |
| MBIA | — Municipal Bond Insurance Association |
| MFHR | — Multi-Family Housing Revenue |
| MUD | — Municipal Utility District |
| NATL-RE | — National Public Finance Guarantee Corporation |
| PCFA | — Pollution Control Finance Authority |
| PCR | — Pollution Control Revenue |
| PFA | — Public Finance Authority |
| PFFA | — Public Facilities Financing Authority |
| PFOTER | — Puttable Floating Option Tax-Exempt Receipts |
| plc | — Public Limited Company |
| PUTTER | — Puttable Tax-Exempt Receipts |
| R&D | — Research & Development |
| RDA | — Redevelopment Authority |
| RDFA | — Redevelopment Finance Authority |
| REIT | — Real Estate Investment Trust |
| ROC | — Reset Option Certificates |
| SAVRS | — Select Auction Variable Rate Securities |
| SBA | — Small Business Authority |
| SFHR | — Single Family Housing Revenue |
| SFMR | — Single Family Mortgage Revenue |
| SPDR | — Standard & Poor’s Depositary Receipts |
| TAN | — Tax Anticipation Notes |
| TIPS | — Treasury Inflation-Protected Securities |
| TRAN | — Tax Revenue Anticipation Notes |
| TCR | — Transferable Custody Receipts |
| TTFA | — Transportation Trust Fund Authority |
| TVA | — Tennessee Valley Authority |
| XLCA | — XL Capital Assurance |
This page is intentionally left blank.


FOR MORE INFORMATION
More information about Wells Fargo Advantage Funds is available free upon request. To obtain literature, please write, e-mail, visit the Fund’s Web site, or call:
Wells Fargo Advantage Funds
P.O. Box 8266
Boston, MA 02266-8266
E-mail: wfaf@wellsfargo.com
Web site: www.wellsfargo.com/advantagefunds
Individual investors: 1-800-222-8222
Retail investment professionals: 1-888-877-9275
Institutional investment professionals: 1-866-765-0778
This report and the financial statements contained herein are submitted for the general information of the shareholders of Wells Fargo Advantage Funds. If this report is used for promotional purposes, distribution of the report must be accompanied or preceded by a current prospectus. For a prospectus containing more complete information, including charges and expenses, call 1-800-222-8222 or visit the Fund’s Web site at www.wellsfargo.com/advantagefunds. Please consider the investment objectives, risks, charges, and expenses of the investment carefully before investing. This and other information about Wells Fargo Advantage Funds can be found in the current prospectus. Read the prospectus carefully before you invest or send money.
Wells Fargo Funds Management, LLC, a wholly owned subsidiary of Wells Fargo & Company, provides investment advisory and administrative services for Wells Fargo Advantage Funds. Other affiliates of Wells Fargo & Company provide subadvisory and other services for the Funds. The Funds are distributed by Wells Fargo Funds Distributor, LLC, Member FINRA/SIPC, an affiliate of Wells Fargo & Company.
NOT FDIC INSURED ¡ NO BANK GUARANTEE ¡ MAY LOSE VALUE
© 2011 Wells Fargo Funds Management, LLC. All rights reserved.
| | |
 | | 205635 11-11 SA318/SAR318 9-11 |
Not required in this filing
| ITEM 3. | AUDIT COMMITTEE FINANCIAL EXPERT |
Not required in this filing.
| ITEM 4. | PRINCIPAL ACCOUNTANT FEES AND SERVICES |
Not required in this filing.
| ITEM 5. | AUDIT COMMITTEE OF LISTED REGISTRANTS |
Not required in this filing.
| ITEM 6. | SCHEDULE OF INVESTMENTS |
The Schedule of Investments is included as part of the report to shareholders filed under Item 1 of this Form.
| ITEM 7. | DISCLOSURE OF PROXY VOTING POLICIES AND PROCEDURES FOR CLOSED-END MANAGEMENT INVESTMENT COMPANIES |
Not applicable.
| ITEM 8. | PORTFOLIO MANAGERS OF CLOSED-END MANAGEMENT INVESTMENT COMPANIES |
Not applicable.
| ITEM 9. | PURCHASES OF EQUITY SECURITIES BY CLOSED-END MANAGEMENT INVESTMENT COMPANY AND AFFILIATED PURCHASES |
Not applicable.
| ITEM 10. | SUBMISSION OF MATTERS TO A VOTE OF SECURITY HOLDERS |
The Governance Committee (the “Committee”) of the Board of Trustees of the registrant (the “Trust”) has adopted procedures by which a shareholder of any series of the Trust may submit properly a nominee recommendation for the Committee’s consideration.
The shareholder must submit any such recommendation (a “Shareholder Recommendation”) in writing to the Trust, to the attention of the Trust’s Secretary, at the address of the principal executive offices of the Trust.
The Shareholder Recommendation must be delivered to, or mailed and received at, the principal executive offices of the Trust not less than forty-five (45) calendar days nor more than seventy-five (75) calendar days prior to the date of the Committee meeting at which the nominee would be considered.
The Shareholder Recommendation must include: (i) a statement in writing setting forth (A) the name, age, date of birth, business address, residence address and nationality of the person recommended by the shareholder (the “candidate”); (B) the series (and, if applicable, class) and number of all shares of the Trust owned of record or beneficially by the candidate, as reported to such shareholder by the candidate; (C) any other information regarding the candidate called for with respect to director nominees by paragraphs (a), (d), (e) and (f) of Item 401 of Regulation S-K or paragraph (b) of Item 22 of Rule 14a-101 (Schedule 14A) under the Securities Exchange Act of 1934, as amended (the “Exchange Act”), adopted by the Securities and Exchange Commission (or the corresponding provisions of any regulation or rule subsequently adopted by the Securities and Exchange Commission or any successor agency applicable to the Trust); (D) any other information regarding the candidate that would be required to be disclosed if the candidate were a nominee in a proxy statement or other filing required to be made in connection with solicitation of proxies for election of directors pursuant to Section 14 of the Exchange Act and the rules and regulations promulgated thereunder; and (E) whether the recommending shareholder believes that the candidate is or will be an “interested person” of the Trust (as defined in the Investment Company Act of 1940, as amended) and, if not an “interested person,” information regarding the candidate that will be sufficient for the Trust to make such determination; (ii) the written and signed consent of the candidate to be named as a nominee and to serve as a Trustee if elected; (iii) the recommending shareholder’s name as it appears on the Trust’s books; (iv) the series (and, if applicable, class) and number of all shares of the Trust owned beneficially and of record by the recommending shareholder; and (v) a description of all arrangements or understandings between the recommending shareholder and the candidate and any other person or persons (including their names) pursuant to which the recommendation is being made by the recommending shareholder. In addition, the Committee may require the candidate to interview in person and furnish such other information as it may reasonably require or deem necessary to determine the eligibility of such candidate to serve as a Trustee of the Trust.
| ITEM 11. | CONTROLS AND PROCEDURES |
(a) The President and Treasurer have concluded that the Wells Fargo Funds Trust (the “Trust”) disclosure controls and procedures (as defined in Rule 30a-3(c) under the Investment Company Act of 1940) provide reasonable assurances that material information relating to the Trust is made known to them by the appropriate persons, based on their evaluation of these controls and procedures as of a date within 90 days of the filing of this report.
(b) There were no significant changes in the Trust’s internal controls over financial reporting (as defined in Rule 30a-3(d) under the Investment Company Act of 1940) that occurred during the second quarter of the period covered by this report that materially affected, or is reasonably likely to materially affect, the registrant’s internal control over financial reporting.
| | |
| |
| (a)(1) | | Not required in this filing. |
| |
| (a)(2) | | Certification pursuant to Rule 30a-2(a) under the Investment Company Act of 1940 (17 CFR 270.30a-2(a)) is filed and attached hereto as Exhibit 99.CERT. |
| |
| (a)(3) | | Not applicable. |
| |
| (b) | | Certification pursuant to Rule 30a-2(b) under the Investment Company Act of 1940 (17 CFR 270.30a-2(b)) is filed and attached hereto as Exhibit 99.906CERT. |
SIGNATURES
Pursuant to the requirements of the Securities Exchange Act of 1934 and the Investment Company Act of 1940, the registrant has duly caused this report to be signed on its behalf by the undersigned, thereunto duly authorized.
| | |
| Wells Fargo Funds Trust |
| |
| By: | | /s/ KARLA M. RABUSCH |
| | Karla M. Rabusch |
| | President |
| |
| Date: | | November 23, 2011 |
Pursuant to the requirements of the Securities Exchange Act of 1934 and the Investment Company Act of 1940, this report has been signed below by the following persons on behalf of the registrant and in the capacities and on the date indicated.
| | |
| |
| By: | | /s/ KARLA M. RABUSCH |
| | Karla M. Rabusch |
| | President |
| |
| Date: | | November 23, 2011 |
| | |
| |
| By: | | /s/ KASEY L. PHILLIPS |
| | Kasey L. Phillips |
| | Treasurer |
| |
| Date: | | November 23, 2011 |