
UNITED STATES
SECURITIES AND EXCHANGE COMMISSION
Washington, D.C. 20549
FORM N-CSRS
CERTIFIED SHAREHOLDER REPORT OF REGISTERED
MANAGEMENT INVESTMENT COMPANIES
Investment Company Act file number: 811-09253
Wells Fargo Funds Trust
(Exact name of registrant as specified in charter)
525 Market St., San Francisco, CA 94105
(Address of principal executive offices) (Zip code)
C. David Messman
Wells Fargo Funds Management, LLC
525 Market St., San Francisco, CA 94105
(Name and address of agent for service)
Registrant’s telephone number, including area code: 800-222-8222
Date of fiscal year end: June 30, 2011
Date of reporting period: December 31, 2011
ITEM 1. REPORT TO SHAREHOLDERS

Wells Fargo Advantage California Limited-Term Tax-Free Fund

Semi-Annual Report
December 31, 2011

Reduce clutter. Save trees.
Sign up for electronic delivery of prospectuses and shareholder reports at www.wellsfargo.com/advantagedelivery
Contents
The views expressed and any forward-looking statements are as of December 31, 2011, unless otherwise noted, and are those of the Fund managers and/or Wells Fargo Funds Management, LLC. Discussions of individual securities, or the markets generally, or any Wells Fargo Advantage Fund are not intended as individual recommendations. Future events or results may vary significantly from those expressed in any forward-looking statements; the views expressed are subject to change at any time in response to changing circumstances in the market. Wells Fargo Funds Management, LLC, disclaims any obligation to publicly update or revise any views expressed or forward-looking statements.
NOT FDIC INSURED ¡ NO BANK GUARANTEE ¡ MAY LOSE VALUE

WELLS FARGO INVESTMENT HISTORY
| | |
| |
| 1932 | | Keystone creates one of the first mutual fund families. |
| |
| 1971 | | Wells Fargo & Company introduces one of the first institutional index funds. |
| |
| 1978 | | Wells Fargo applies Markowitz and Sharpe’s research on Modern Portfolio Theory to introduce one of the industry’s first Tactical Asset Allocation (TAA) models in institutional separately managed accounts. |
| |
| 1984 | | Wells Fargo Stagecoach Funds launches its first asset allocation fund. |
| |
| 1989 | | The Tactical Asset Allocation (TAA) Model is first applied to Wells Fargo’s asset allocation mutual funds. |
| |
| 1994 | | Wells Fargo introduces the LifePath Funds, one of the first suites of target date funds (now the Wells Fargo Advantage Dow Jones Target Date FundsSM ). |
| |
| 1996 | | Evergreen Investments and Keystone Funds merge. |
| |
| 1997 | | Wells Fargo launches Wells Fargo Advantage WealthBuilder PortfoliosSM, a fund-of-funds suite of products that includes the use of quantitative models to shift assets among investment styles. |
| |
| 1999 | | Norwest Advantage Funds and Stagecoach Funds are reorganized into Wells Fargo Funds after the merger of Norwest and Wells Fargo. |
| |
| 2002 | | Evergreen Retail and Evergreen Institutional companies form the umbrella asset management company, Evergreen Investments. |
| |
| 2005 | | The integration of Strong Funds with Wells Fargo Funds creates Wells Fargo Advantage Funds, resulting in one of the top 20 mutual fund companies in the United States. |
| |
| 2006 | | Wells Fargo Advantage Funds relaunches the target date product line as Wells Fargo Advantage Dow Jones Target Date Funds. |
| |
| 2010 | | The mergers and reorganizations of Evergreen and Wells Fargo Advantage mutual funds are completed, unifying the families under the brand of Wells Fargo Advantage Funds. |
Wells Fargo Advantage Funds®
Wells Fargo Advantage Funds skillfully guides institutions, financial advisors, and individuals through the investment terrain to help them reach their financial objectives. Everything we do on behalf of investors is backed by our unique combination of qualifications.
Strength
Our organization is built on the standards of integrity and service established by our parent company—Wells Fargo & Company—more than 150 years ago. And, because we’re part of a highly diversified financial enterprise, we offer the depth of resources to help investors succeed.
Expertise
Our multi-boutique model offers investors access to the independent thinking of premier investment managers that have been chosen for their time-tested strategies. While each team specializes in a specific investment strategy, collectively they provide investors a wide choice of distinct investment styles. Our dedication to investment excellence doesn’t end with our expertise in manager selection—risk management, analysis, and rigorous ongoing review seek to ensure each manager’s investment process remains consistent.
Partnership
Our collaborative approach is built around understanding the needs and goals of our clients. By adhering to core principles of sound judgment and steady guidance, we support you through every stage of the investment decision process.
Carefully consider a fund’s investment objectives, risks, charges, and expenses before investing. For a current prospectus and, if available, a summary prospectus, containing this and other information, visit wellsfargo.com/advantagefunds. Read it carefully before investing.
Wells Fargo Funds Management, LLC, a wholly owned subsidiary of Wells Fargo & Company, provides investment advisory and administrative services for Wells Fargo Advantage Funds®. Other affiliates of Wells Fargo & Company provide subadvisory and other services for the Funds. The Funds are distributed by Wells Fargo Funds Distributor, LLC, Member FINRA/SIPC, an affiliate of Wells Fargo & Company.
“Dow Jones®” and “Dow Jones Target Date IndexesSM” are service marks of Dow Jones Trademark Holdings, LLC (“Dow Jones”), have been licensed to CME Group Index Services LLC (“CME Indexes”) and have been sublicensed for use for certain purposes by Global Index Advisors, Inc, and Wells Fargo Funds Management, LLC. The Wells Fargo Advantage Dow Jones Target Date FundsSM based on the Dow Jones Target Date IndexesSM, are not sponsored, endorsed, sold or promoted by Dow Jones, CME Indexes or their respective affiliates and none of them makes any representation regarding the advisability of investing in such product(s).
NOT FDIC INSURED ¡ NO BANK GUARANTEE ¡ MAY LOSE VALUE
Not part of the semi-annual report.
Wells Fargo Advantage Funds offers more than 110 mutual funds across a wide range of asset classes, representing over $216 billion in assets under management, as of December 31, 2011.
| | | | |
| Equity Funds | | | | |
Asia Pacific Fund | | Global Opportunities Fund | | Premier Large Company Growth Fund |
C&B Large Cap Value Fund | | Growth Fund | | Small Cap Opportunities Fund |
C&B Mid Cap Value Fund | | Health Care Fund | | Small Cap Value Fund |
Capital Growth Fund | | Index Fund | | Small Company Growth Fund |
Common Stock Fund | | International Equity Fund | | Small Company Value Fund |
Disciplined U.S. Core Fund | | International Value Fund | | Small/Mid Cap Core Fund |
Discovery Fund† | | Intrinsic Small Cap Value Fund | | Small/Mid Cap Value Fund |
Diversified Equity Fund | | Intrinsic Value Fund | | Social Sustainability Fund† |
Diversified International Fund | | Intrinsic World Equity Fund | | Special Mid Cap Value Fund |
Diversified Small Cap Fund | | Large Cap Core Fund | | Special Small Cap Value Fund |
Emerging Growth Fund | | Large Cap Growth Fund | | Specialized Technology Fund |
Emerging Markets Equity Fund | | Large Company Value Fund | | Strategic Large Cap Growth Fund |
Endeavor Select Fund† | | Omega Growth Fund | | Traditional Small Cap Growth Fund |
Enterprise Fund† | | Opportunity Fund† | | Utility and Telecommunications Fund |
Equity Value Fund | | Precious Metals Fund | | |
| Bond Funds | | | | |
Adjustable Rate Government Fund | | Inflation-Protected Bond Fund | | Short-Term Bond Fund |
California Limited-Term Tax-Free Fund | | Intermediate Tax/AMT-Free Fund | | Short-Term High Yield Bond Fund |
California Tax-Free Fund | | International Bond Fund | | Short-Term Municipal Bond Fund |
Colorado Tax-Free Fund | | Minnesota Tax-Free Fund | | Strategic Municipal Bond Fund |
Government Securities Fund | | Municipal Bond Fund | | Total Return Bond Fund |
High Income Fund | | North Carolina Tax-Free Fund | | Ultra Short-Term Income Fund |
High Yield Bond Fund | | Pennsylvania Tax-Free Fund | | Ultra Short-Term Municipal Income Fund |
Income Plus Fund | | Short Duration Government Bond Fund | | Wisconsin Tax-Free Fund |
| Asset Allocation Funds | | | | |
Asset Allocation Fund | | WealthBuilder Equity Portfolio† | | Target 2020 Fund† |
Conservative Allocation Fund | | WealthBuilder Growth Allocation Portfolio† | | Target 2025 Fund† |
Diversified Capital Builder Fund | | WealthBuilder Growth Balanced Portfolio† | | Target 2030 Fund† |
Diversified Income Builder Fund | | WealthBuilder Moderate Balanced Portfolio† | | Target 2035 Fund† |
Growth Balanced Fund | | WealthBuilder Tactical Equity Portfolio† | | Target 2040 Fund† |
Index Asset Allocation Fund | | Target Today Fund† | | Target 2045 Fund† |
Moderate Balanced Fund | | Target 2010 Fund† | | Target 2050 Fund† |
WealthBuilder Conservative Allocation Portfolio† | | Target 2015 Fund† | | Target 2055 Fund† |
| Money Market Funds | | | | |
100% Treasury Money Market Fund | | Heritage Money Market Fund† | | National Tax-Free Money Market Fund |
California Municipal Money Market Fund | | Money Market Fund | | Prime Investment Money Market Fund |
Cash Investment Money Market Fund | | Municipal Cash Management Money Market Fund | | Treasury Plus Money Market Fund |
Government Money Market Fund | | Municipal Money Market Fund | | |
| Variable Trust Funds1 | | | | |
VT Discovery Fund† | | VT Intrinsic Value Fund | | VT Small Cap Growth Fund |
VT Index Asset Allocation Fund | | VT Omega Growth Fund | | VT Small Cap Value Fund |
VT International Equity Fund | | VT Opportunity Fund† | | VT Total Return Bond Fund |
An investment in a money market fund is not insured or guaranteed by the Federal Deposit Insurance Corporation or any other government agency. Although the Wells Fargo Advantage Money Market Funds seek to preserve the value of your investment at $1.00 per share, it is possible to lose money by investing in a money market fund.
| 1. | The Variable Trust Funds are generally available only through insurance company variable contracts. |
| † | In this report, the Wells Fargo Advantage Discovery FundSM, Wells Fargo Advantage Endeavor Select FundSM, Wells Fargo Advantage Enterprise FundSM, Wells Fargo Advantage Opportunity FundSM, Wells Fargo Advantage Social Sustainability FundSM, Wells Fargo Advantage WealthBuilder Conservative Allocation PortfolioSM, Wells Fargo Advantage WealthBuilder Equity PortfolioSM, Wells Fargo Advantage WealthBuilder Growth Allocation PortfolioSM, Wells Fargo Advantage WealthBuilder Growth Balanced PortfolioSM, Wells Fargo Advantage WealthBuilder Moderate Balanced PortfolioSM, Wells Fargo Advantage WealthBuilder Tactical Equity PortfolioSM, Wells Fargo Advantage Dow Jones Target Today FundSM, Wells Fargo Advantage Dow Jones Target 2010 FundSM, Wells Fargo Advantage Dow Jones Target 2015 FundSM, Wells Fargo Advantage Dow Jones Target 2020 FundSM, Wells Fargo Advantage Dow Jones Target 2025 FundSM, Wells Fargo Advantage Dow Jones Target 2030 FundSM, Wells Fargo Advantage Dow Jones Target 2035 FundSM, Wells Fargo Advantage Dow Jones Target 2040 FundSM, Wells Fargo Advantage Dow Jones Target 2045 FundSM, Wells Fargo Advantage Dow Jones Target 2050 FundSM, Wells Fargo Advantage Dow Jones Target 2055 FundSM, Wells Fargo Advantage Heritage Money Market FundSM, Wells Fargo Advantage VT Discovery FundSM, and Wells Fargo Advantage VT Opportunity FundSM are referred to as the Discovery Fund, Endeavor Select Fund, Enterprise Fund, Opportunity Fund, Social Sustainability Fund, WealthBuilder Conservative Allocation Portfolio, WealthBuilder Equity Portfolio, WealthBuilder Growth Allocation Portfolio, WealthBuilder Growth Balanced Portfolio, WealthBuilder Moderate Balanced Portfolio, WealthBuilder Tactical Equity Portfolio, Target Today Fund, Target 2010 Fund, Target 2015 Fund, Target 2020 Fund, Target 2025 Fund, Target 2030 Fund, Target 2035 Fund, Target 2040 Fund, Target 2045 Fund, Target 2050 Fund, Target 2055 Fund, Heritage Money Market Fund, VT Discovery Fund, and VT Opportunity Fund, respectively. |
Not part of the semi-annual report.
| | | | |
| 2 | | Wells Fargo Advantage California Limited-Term Tax-Free Fund | | Letter to Shareholders |

Karla M. Rabusch,
President
Wells Fargo Advantage Funds
For the entire six-month period, most of the major fixed-income indexes posted solid positive returns. However, the market’s six-month return figures mask the uneven path that the financial markets traced since the summer as investors had to contend with a variety of global and domestic headwinds.
Dear Valued Shareholder:
We’re pleased to offer you this semi-annual report for the Wells Fargo Advantage California Limited-Term Tax-Free Fund for the six-month period that ended December 31, 2011. Upon reviewing the report, you may notice a few changes from past reports, the most significant of which is the change from a multi-fund report to a single-fund report. We made this change to make it easier for you to find your fund information.
For the entire six-month period, most of the major fixed-income indexes posted solid positive returns. However, the market’s six-month return figures mask the uneven path that the financial markets traced since the summer as investors had to contend with a variety of global and domestic headwinds. Whatever the future holds, we continue to believe that most investors can benefit from adhering to a well-diversified investment strategy. Over the long-term, such a strategy may allow you to balance risks and opportunities as you pursue your financial goals in a dynamic market landscape.
The economic recovery gained traction as the year progressed.
The U.S. economic recovery that began in mid-2009 has experienced a few slow patches along the way. However, the recovery regained some upward momentum during the six-month period, yet the rate of growth remained subpar compared with most previous recovery cycles.
In September 2011, it was reported that U.S. gross domestic product (GDP) grew at a mere 1.3% annual rate in the second quarter of 2011, following anemic growth at an annual rate of 0.4% in the first quarter. According to the December estimate, GDP growth accelerated to an annual rate of 1.8% in the third quarter, reigniting hopes for a sustainable recovery. Those hopes were buoyed by widespread anticipation of even stronger GDP growth in the fourth quarter. By year-end, few economists believed that the U.S. economy was in danger of sliding back into recession, although many expected a sluggish growth environment in 2012.
The struggling housing and labor markets slowed growth.
As has been the case throughout the recovery, the housing and labor markets continued to restrain economic momentum during 2011.
The beleaguered housing market has arguably exerted the biggest drag on growth. Despite intermittent signs of improvement, ongoing weakness in sales of both new and existing homes has put considerable downward pressure on prices. On the other hand, the labor market took a decided turn for the better during the final months of 2011: initial unemployment claims have eased, and the private sector has been steadily adding jobs. The pace of hiring, while not brisk, was sufficient to push the U.S. unemployment rate down to 8.5% as of December 2011—still well above its historical average but at its lowest level since February 2009. Many observers expect the unemployment rate to decline further in 2012, which could act as a tailwind for consumer spending—widely viewed as one of the keys to long-term economic growth.
The Federal Reserve announced that it will keep rates low until 2013.
Consumers have already demonstrated some resilience in their spending—even in the face of higher energy costs. Oil prices skyrocketed in early 2011 before
| | | | | | |
| Letter to Shareholders | | Wells Fargo Advantage California Limited-Term Tax-Free Fund | | | 3 | |
retreating later in the year, only to spike again during the fourth quarter. Yet “core” inflation, which excludes volatile energy and food prices, remained fairly benign throughout the year.
With inflation in check, the Federal Reserve (Fed) held its target range for the federal funds rate—a proxy for short-term interest rates—steady at 0% to 0.25%. Following its August 9, 2011 meeting, the Federal Open Market Committee issued a statement explaining that economic conditions were likely to warrant exceptionally low levels for the federal funds rate through at least mid-2013. In September, the Fed launched yet another stimulus program—dubbed “Operation Twist”—that is designed to keep intermediate- and longer-term yields relatively low. The goal with keeping longer-term rates low is to encourage lending activity to spark business investments and home purchases, which, in turn, may provide support for a more sustainable economic recovery.
Market volatility was a dominant theme during the final six-months of the year.
Early on in the period, market climate shifted to one of anxiety over the increasingly fragile state of the U.S. and global economies. In addition, investors not only worried that the U.S. might be on the brink of recession, they also feared that Europe’s sovereign debt problems could spiral out of control if a Greek default triggered financial contagion across the continent. In July and August, investor sentiment was further undermined by partisan wrangling over the federal debt ceiling and the downgrade of the U.S. credit rating by Standard & Poor’s. The barrage of unsettling headlines led to heightened market volatility and an increase in risk aversion, which translated into sharply falling stock prices and higher demand for “safer” assets such as Treasuries and municipals in the third quarter of 2011. Although volatility persisted into the fourth quarter, the financial markets were able to rebound amid improved U.S. economic data and hopes for a resolution to the European crisis.
For the entire six-month period, the Barclays Capital U.S. Aggregate Bond Index1, which represents the universe of investment-grade bonds, and the Barclays Capital U.S. Treasury Index2 added 4.98% and 7.43%, respectively. By comparison, the Barclays Capital Municipal Bond Index3 gained 6.02% over the last half of the year.
Recent events have not altered our message to shareholders.
The market turmoil of 2011 and an uncertain outlook going forward have left many investors questioning their resolve—and their investments. Yet, it is precisely at such times that the market may present opportunities—as well as challenges—for prudent investors. Bear in mind that many investors who indiscriminately sold their equity investments during the severe market downturn of 2008 to 2009 missed out on the impressive two-year rally that followed. In our
| 1. | The Barclays Capital U.S. Aggregate Bond Index is composed of the Barclays Capital Government/Credit Index and the Mortgage-Backed Securities Index and includes U.S. Treasury issues, agency issues, corporate bond issues, and mortgage-backed securities. You cannot invest directly in an index. |
| 2. | The Barclays Capital U.S. Treasury Index is an index of U.S. Treasury Securities. You cannot invest directly in an index. |
| 3. | The Barclays Capital Municipal Bond Index is an unmanaged index composed of long-term tax-exempt bonds with a minimum credit rating of Baa. You cannot invest directly in an index. |
Although volatility persisted into the fourth quarter, the financial markets were able to rebound amid improved U.S. economic data and hopes for a resolution to the European crisis.
| | | | |
| 4 | | Wells Fargo Advantage California Limited-Term Tax-Free Fund | | Letter to Shareholders |
opinion, the lesson to be learned from these dramatic market events is that, for many investors, simply building and maintaining a well-diversified4 investment plan is the best long-term strategy.
Thank you for choosing to invest with Wells Fargo Advantage Funds. We appreciate your confidence in us and remain committed to helping you meet your financial needs. For current information about your fund investments, contact your investment professional, visit our website at www.wellsfargo.com/advantagefunds, or call us directly at 1-800-222-8222. We are available 24 hours a day, 7 days a week.
Sincerely,

Karla M. Rabusch
President
Wells Fargo Advantage Funds
| 4. | Diversification does not assure or guarantee better performance and cannot eliminate the risk of investment losses. |
| | | | | | |
| Letter to Shareholders | | Wells Fargo Advantage California Limited-Term Tax-Free Fund | | | 5 | |
|
|
Notice to Shareholders Effective April 1, 2012, the Fund may invest up to 10% of its total assets in inverse floaters to seek enhanced returns. Inverse floaters are derivative debt instruments created by depositing a municipal security in a trust. They pay interest at rates that generally vary inversely with specified short-term interest rates. The interest payment received on inverse floaters generally will decrease when specified short-term interest rates increase. Inverse floaters involve leverage, which may magnify the Fund’s gains or losses, and exhibit greater price and income volatility than bonds with similar maturities. We intend to limit leverage created by the Fund’s investment in inverse floaters to an amount equal to 10% of the Fund’s total assets. Inverse floaters are also subject to the risks associated with derivatives and municipal securities. |
|
|
Notice to Shareholders The Board of Trustees for Wells Fargo Advantage Funds has unanimously approved the following modifications to certain net asset value (NAV) waiver privileges and commission schedules: n Effective May 1, 2012, automatic investment plan (AIP) purchases and proceeds received from systematic withdrawals will no longer qualify for NAV repurchase privileges. n Effective May 1, 2012, discretionary rights to waive the upfront commission for Class C and “jumbo” Class A share purchases will no longer be granted to broker/dealers. However, we will continue to waive the Class C shares contingent deferred sales charge for redemptions by employer-sponsored retirement plans where the dealer of record waived its commission at the time of purchase. n Effective July 31, 2012, NAV purchase privileges for former Evergreen Class IS and Class R shareholders are being modified to remove the ability to purchase Class A shares at NAV unless those shares are held directly with the fund on or after July 31, 2012. |
| | | | |
| 6 | | Wells Fargo Advantage California Limited-Term Tax-Free Fund | | Performance Highlights (Unaudited) |
INVESTMENT OBJECTIVE
The Fund seeks current income exempt from federal income tax and California individual income tax, consistent with capital preservation.
ADVISER
Wells Fargo Funds Management, LLC
SUB-ADVISER
Wells Capital Management Incorporated
PORTFOLIO MANAGERS
Adrian Van Poppel
Terry J. Goode
FUND INCEPTION
November 18, 1992
| | |
CREDIT QUALITY1
(AS OF DECEMBER 31, 2011) |
|
 |
| | |
EFFECTIVE MATURITY DISTRIBUTION2
(AS OF DECEMBER 31, 2011) |
|
 |
| 1. | The ratings indicated are from Standard & Poor’s, Moody’s Investors Service, and/or Fitch Ratings Ltd. Credit Quality Ratings: Credit quality ratings apply to underlying holdings of the Fund and not the Fund itself. Standard and Poor’s rates the creditworthiness of bonds, ranging from AAA (highest) to D (lowest). Ratings from A to CCC may be modified by the addition of a plus (+) or minus (–) sign to show relative standing within the rating categories. Standard & Poor’s rates the creditworthiness of short-term notes from SP-1 (highest) to SP-3 (lowest). Ratings from A to CCC may be modified by the addition of a plus (+) or minus (–) sign to show relative standing within the rating categories. Moody’s rates the creditworthiness of bonds, ranging from Aaa (highest) to C (lowest). Ratings Aa to B may be modified by the addition of a number 1 (highest) to 3 (lowest) to show relative standing within the ratings categories. Moody’s rates the creditworthiness of short-term U.S. tax-exempt municipal securities from MIG 1/VMIG 1 (highest) to SG (lowest). Fitch rates the creditworthiness of bonds, ranging from AAA (highest) to D (lowest). If a security was rated by all three rating agencies, the middle rating was utilized. If rated by two of three rating agencies, the lower rating was utilized and if rated by one of the agencies that rating was utilized. Credit quality is subject to change and is calculated based on the total investments of the Fund. We generally define higher quality bonds as bonds that have a rating of BBB/Baa and above and lower quality bonds as bonds with a rating below BBB/Baa. |
| 2. | Effective maturity is calculated based on the total long-term investments of the Fund. It is subject to change and may have changed since the date specified. |
| | | | | | |
| Performance Highlights (Unaudited) | | Wells Fargo Advantage California Limited-Term Tax-Free Fund | | | 7 | |
AVERAGE ANNUAL TOTAL RETURN3 (%) (AS OF DECEMBER 31, 2011)
| | | | | | | | | | | | | | | | | | | | | | | | | | | | | | | | | | | | | | | | | | | | |
| | | | | | Including Sales Charge | | | Excluding Sales Charge | | | Expense Ratios4 | |
| | | Inception Date | | | 6 Months* | | | 1 Year | | | 5 Year | | | 10 Year | | | 6 Months* | | | 1 Year | | | 5 Year | | | 10 Year | | | Gross | | | Net5 | |
Class A (SFCIX) | | | 11/18/1992 | | | | (0.67 | ) | | | 1.38 | | | | 2.93 | | | | 3.01 | | | | 2.44 | | | | 4.49 | | | | 3.55 | | | | 3.32 | | | | 0.86% | | | | 0.81% | |
Class C (SFCCX) | | | 08/30/2002 | | | | 1.06 | | | | 2.71 | | | | 2.78 | | | | 2.53 | | | | 2.06 | | | | 3.71 | | | | 2.78 | | | | 2.53 | | | | 1.61% | | | | 1.56% | |
Administrator Class (SCTIX) | | | 09/06/1996 | | | | | | | | | | | | | | | | | | | | 2.66 | | | | 4.72 | | | | 3.80 | | | | 3.58 | | | | 0.80% | | | | 0.61% | |
Barclays Capital 1-5 Year Municipal Bond Index6 | | | | | | | | | | | | | | | | | | | | | | | 1.85 | | | | 4.19 | | | | 4.50 | | | | 3.87 | | | | | | | | | |
Barclays Capital 1-5 Year California Municipal Bond Index7 | | | | | | | | | | | | | | | | | | | | | | | 1.74 | | | | 4.27 | | | | 4.51 | | | | 3.87 | | | | | | | | | |
| * | Returns for periods of less than one year are not annualized. |
Figures quoted represent past performance, which is no guarantee of future results and do not reflect the deduction of taxes that a shareholder may pay on fund distributions or the redemption of fund shares. Investment return and principal value of an investment will fluctuate so that an investor’s shares, when redeemed, may be worth more or less than their original cost. Performance shown without sales charges would be lower if sales charges were reflected. Current performance may be lower or higher than the performance data quoted and assumes the reinvestment of dividends and capital gains. Current month-end performance is available on the Fund’s Web site – www.wellsfargo.com/advantagefunds.
Index returns do not include transaction costs associated with buying and selling securities, any mutual fund fees or expenses or any taxes. It is not possible to invest directly in an index.
For Class A shares, the maximum front-end sales charge is 3.00%. For Class C shares, the maximum contingent deferred sales charge is 1.00%. Performance including sales charge assumes the sales charge for the corresponding time period. Administrator Class shares are sold without a front-end sales charge or contingent deferred sales charge.
Bond fund values fluctuate in response to the financial condition of individual issuers, general market and economic conditions, and changes in interest rates. In general, when interest rates rise, bond fund values fall and investors may lose principal value. The use of derivatives may reduce returns and/or increase volatility. Certain investment strategies tend to increase the total risk of an investment (relative to the broader market). This Fund is exposed to California and Puerto Rico municipal securities risk, high-yield securities risk, and non-diversification risk. Consult the Fund’s prospectus for additional information on these and other risks. A portion of the Fund’s income may be subject to federal, state, and/or local income taxes or the alternative minimum tax (AMT). Any capital gains distributions may be taxable.
| 3. | Historical performance shown for Class C shares prior to their inception reflects the performance of Class A shares, adjusted to reflect the higher expenses applicable to Class C shares. |
| 4. | Reflects the expense ratios as stated in the most recent prospectuses. |
| 5. | The Adviser has committed through October 31, 2012 to waive fees and/or reimburse expenses to the extent necessary to cap the Fund’s Total Annual Fund Operating Expenses After Fee Waiver, excluding certain expenses, at 0.80% for Class A, 1.55% for Class C, and 0.60% for Administrator Class shares. Without this cap, the Fund’s returns would have been lower. |
| 6. | The Barclays Capital 1-5 Year Municipal Bond Index is the 1-5 Year Blend Component of the Barclays Capital Municipal Bond Index. You cannot invest directly in an index. |
| 7. | The Barclays Capital 1-5 Year California Municipal Bond Index is the 1-5 Year Blend Component of the Barclays Capital California Municipal Bond Index. You cannot invest directly in an index. |
| | | | |
| 8 | | Wells Fargo Advantage California Limited-Term Tax-Free Fund | | Fund Expenses (Unaudited) |
As a shareholder of the Fund, you incur two types of costs: (1) transaction costs, including sales charges (loads) on purchase payments and contingent deferred sales charges (if any) on redemptions and (2) ongoing costs, including management fees; distribution (12b-1) and/or shareholder service fees; and other Fund expenses. This example is intended to help you understand your ongoing costs (in dollars) of investing in the Fund and to compare these costs with the ongoing costs of investing in other mutual funds.
The example is based on an investment of $1,000 invested at the beginning of the six-month period and held for the entire period from July 1, 2011 to December 31, 2011.
Actual Expenses
The “Actual” line of the table below provides information about actual account values and actual expenses. You may use the information in this line, together with the amount you invested, to estimate the expenses that you paid over the period. Simply divide your account value by $1,000 (for example, an $8,600 account value divided by $1,000 = 8.6), then multiply the result by the number in the “Actual” line under the heading entitled “Expenses Paid During Period” for your applicable class of shares to estimate the expenses you paid on your account during this period.
Hypothetical Example for Comparison Purposes
The “Hypothetical” line of the table below provides information about hypothetical account values and hypothetical expenses based on the Fund’s actual expense ratio and an assumed rate of return of 5% per year before expenses, which is not the Fund’s actual return. The hypothetical account values and expenses may not be used to estimate the actual ending account balance or expenses you paid for the period. You may use this information to compare the ongoing costs of investing in the Fund and other funds. To do so, compare this 5% hypothetical example with the 5% hypothetical examples that appear in the shareholder reports of the other funds.
Please note that the expenses shown in the table are meant to highlight your ongoing costs only and do not reflect any transactional costs, such as sales charges (loads) and contingent deferred sales charges. Therefore, the “Hypothetical” line of the table is useful in comparing ongoing costs only, and will not help you determine the relative total costs of owning different funds. In addition, if these transactional costs were included, your costs would have been higher.
| | | | | | | | | | | | | | | | |
| | | Beginning
Account Value
07-01-2011 | | | Ending
Account Value
12-31-2011 | | | Expenses
Paid During
the Period1 | | | Net Annual
Expense Ratio | |
Class A | | | | | | | | | | | | | | | | |
Actual | | $ | 1,000.00 | | | $ | 1,024.44 | | | $ | 4.07 | | | | 0.80 | % |
Hypothetical (5% return before expenses) | | $ | 1,000.00 | | | $ | 1,021.11 | | | $ | 4.06 | | | | 0.80 | % |
Class C | | | | | | | | | | | | | | | | |
Actual | | $ | 1,000.00 | | | $ | 1,020.59 | | | $ | 7.87 | | | | 1.55 | % |
Hypothetical (5% return before expenses) | | $ | 1,000.00 | | | $ | 1,017.34 | | | $ | 7.86 | | | | 1.55 | % |
Administrator Class | | | | | | | | | | | | | | | | |
Actual | | $ | 1,000.00 | | | $ | 1,026.62 | | | $ | 3.06 | | | | 0.60 | % |
Hypothetical (5% return before expenses) | | $ | 1,000.00 | | | $ | 1,022.12 | | | $ | 3.05 | | | | 0.60 | % |
| 1. | Expenses paid is equal to the annualized expense ratio of each class multiplied by the average account value over the period, multiplied by the number of days in the most recent fiscal half-year divided by the number of days in the fiscal year (to reflect the one-half year period). |
| | | | | | |
| Portfolio of Investments—December 31, 2011 (Unaudited) | | Wells Fargo Advantage California Limited-Term Tax-Free Fund | | | 9 | |
| | | | | | | | | | | | | | | | |
| Security Name | | Interest Rate | | | Maturity Date | | | Principal | | | Value | |
| | | | | | | | | | | | | | | | |
| | | | |
Municipal Bonds and Notes: 96.28% | | | | | | | | | | | | | | | | |
| | | | |
| California: 89.85% | | | | | | | | | | | | | | | | |
ABAG Financial Authority For Nonprofit Corporations Children’s Hospital (Health Revenue) | | | 4.25 | % | | | 12/01/2016 | | | $ | 305,000 | | | $ | 331,251 | |
ABAG Financial Authority For Nonprofit Corporations Episcopal Senior Community (Housing Revenue) | | | 4.00 | | | | 07/01/2014 | | | | 910,000 | | | | 928,473 | |
ABAG Financial Authority For Nonprofit Corporations Episcopal Senior Community (Housing Revenue) | | | 5.00 | | | | 07/01/2015 | | | | 995,000 | | | | 1,050,183 | |
ABAG Financial Authority For Nonprofit Corporations Episcopal Senior Community (Housing Revenue) | | | 5.00 | | | | 07/01/2016 | | | | 1,045,000 | | | | 1,109,330 | |
Adelanto CA School District CAB Series B (Tax Revenue, NATL-RE FGIC Insured)(z) | | | 5.12 | | | | 09/01/2018 | | | | 1,220,000 | | | | 870,372 | |
Alameda CA Corridor Transportation Authority CAB Sub Lien Series A (Transportation Revenue, AMBAC Insured)(z) | | | 4.49 | | | | 10/01/2019 | | | | 3,000,000 | | | | 2,124,150 | |
Alameda CA Corridor Transportation Authority Senior Lien Series A (Transportation Revenue, NATL-RE Insured) | | | 5.13 | | | | 10/01/2014 | | | | 1,000,000 | | | | 1,003,390 | |
Alameda Contra Costa CA Transit District FHR Computer System Project (Lease Revenue) | | | 4.00 | | | | 08/01/2012 | | | | 310,000 | | | | 313,661 | |
Alameda County CA COP (Lease Revenue, AMBAC Insured) | | | 5.63 | | | | 12/01/2015 | | | | 550,000 | | | | 634,134 | |
Alameda County CA Refunding COP Series A (Lease Revenue, NATL-RE Insured) | | | 5.38 | | | | 12/01/2014 | | | | 2,000,000 | | | | 2,024,940 | |
Alameda County CA Refunding COP Series A (Lease Revenue, NATL-RE Insured) | | | 5.38 | | | | 12/01/2015 | | | | 1,435,000 | | | | 1,452,894 | |
Alisal CA Unified School District 2006 Election Series A (Tax Revenue, Assured Guaranty Insured) | | | 5.50 | | | | 08/01/2013 | | | | 700,000 | | | | 751,422 | |
Alvord CA Unified School District 2007 Election Series B (Tax Revenue, AGM Insured)(z) | | | 0.53 | | | | 08/01/2020 | | | | 1,605,000 | | | | 1,533,321 | |
Alvord CA Unified School District 2007 Election Series B (Tax Revenue, AGM Insured)(z) | | | 1.01 | | | | 08/01/2018 | | | | 475,000 | | | | 444,035 | |
Alvord CA Unified School District 2007 Election Series B (Tax Revenue, AGM Insured)(z) | | | 1.59 | | | | 08/01/2017 | | | | 155,000 | | | | 141,779 | |
Alvord CA Unified School District 2007 Election Series B (Tax Revenue, AGM Insured)(z) | | | 2.58 | | | | 08/01/2016 | | | | 305,000 | | | | 270,852 | |
Anaheim CA PFA Convention Center Project Series A (Lease Revenue, AMBAC Insured) | | | 5.25 | | | | 08/01/2013 | | | | 1,600,000 | | | | 1,628,224 | |
Anaheim CA PFA Public Improvements Project Series C (Lease Revenue, AGM Insured) | | | 6.00 | | | | 09/01/2014 | | | | 500,000 | | | | 558,465 | |
Antelope Valley CA Health Care District Series A (Health Revenue, AGM Insured) | | | 5.20 | | | | 01/01/2017 | | | | 645,000 | | | | 646,258 | |
Antelope Valley CA Health Care District Series A (Health Revenue, AGM Insured)±§ | | | 5.25 | | | | 09/01/2017 | | | | 1,800,000 | | | | 1,795,500 | |
Bakersfield CA COP Convention Center Series A (Lease Revenue, AMBAC Insured) | | | 5.00 | | | | 04/01/2017 | | | | 210,000 | | | | 232,777 | |
Bakersfield CA Series B (Water & Sewer Revenue, AGM Insured)±§ | | | 3.25 | | | | 09/01/2035 | | | | 12,040,000 | | | | 12,040,000 | |
Baldwin Park CA Unified School District BAN (Tax Revenue)(z) | | | 2.33 | | | | 08/01/2014 | | | | 500,000 | | | | 470,745 | |
Baldwin Park CA Unified School District CAB Election of 2006 (Tax Revenue, AGM Insured)(z) | | | 0.46 | | | | 08/01/2012 | | | | 50,000 | | | | 49,865 | |
Bay Area Infrastructure Financing Authority of California State Payment Acceleration Notes (Transportation Revenue, NATL-RE FGIC Insured) | | | 5.00 | | | | 08/01/2017 | | | | 2,815,000 | | | | 2,868,401 | |
Bay Area Infrastructure Financing Authority of California State Payment Acceleration Notes (Transportation Revenue, XLCA Insured) | | | 5.00 | | | | 08/01/2017 | | | | 100,000 | | | | 105,077 | |
Bay Area Infrastructure Financing Authority of California State Payment Acceleration Notes (Transportation Revenue, NATL-RE FGIC Insured) | | | 5.00 | | | | 08/01/2017 | | | | 300,000 | | | | 324,702 | |
Brea CA PFA Tax Allocation Series A (Housing Revenue) | | | 5.00 | | | | 09/01/2012 | | | | 750,000 | | | | 759,555 | |
| | | | |
| 10 | | Wells Fargo Advantage California Limited-Term Tax-Free Fund | | Portfolio of Investments—December 31, 2011 (Unaudited) |
| | | | | | | | | | | | | | | | |
| Security Name | | Interest Rate | | | Maturity Date | | | Principal | | | Value | |
| | | | | | | | | | | | | | | | |
| | | | |
| California (continued) | | | | | | | | | | | | | | | | |
Cabrillo CA Unified School District CAB Series A (Tax Revenue, AMBAC Insured)(z) | | | 3.24 | % | | | 08/01/2015 | | | $ | 1,500,000 | | | $ | 1,335,660 | |
California Community College Financing Authority Coast Community College Series A (Education Revenue) | | | 2.00 | | | | 06/01/2012 | | | | 100,000 | | | | 100,449 | |
California Community College Financing Authority TRAN Series B (Tax Revenue, GO of Participants Insured) | | | 2.00 | | | | 06/29/2012 | | | | 1,875,000 | | | | 1,887,694 | |
California Education Notes Program Series B (Miscellaneous Revenue, GO of District Insured) | | | 2.00 | | | | 04/30/2012 | | | | 1,815,000 | | | | 1,825,146 | |
California Educational Facilities Authority (Education Revenue)±§ | | | 0.85 | | | | 10/01/2033 | | | | 2,000,000 | | | | 2,000,000 | |
California HFA AMT Home Mortgage Series A (Housing Revenue, AGM Insured) | | | 3.60 | | | | 08/01/2012 | | | | 400,000 | | | | 403,280 | |
California HFA AMT Home Mortgage Series E (Housing Revenue) | | | 4.65 | | | | 08/01/2022 | | | | 1,370,000 | | | | 1,286,225 | |
California HFA AMT Home Mortgage Series E (Housing Revenue, FGIC Insured) | | | 5.00 | | | | 02/01/2014 | | | | 1,380,000 | | | | 1,398,313 | |
California HFA AMT Home Mortgage Series E (Housing Revenue) | | | 5.00 | | | | 02/01/2042 | | | | 595,000 | | | | 600,426 | |
California HFA AMT Home Mortgage Series G (Housing Revenue) | | | 5.50 | | | | 08/01/2042 | | | | 2,080,000 | | | | 2,109,578 | |
California HFA AMT Home Mortgage Series H (Housing Revenue, FGIC Insured) | | | 5.75 | | | | 08/01/2030 | | | | 1,150,000 | | | | 1,149,000 | |
California HFA AMT Home Mortgage Series J (Housing Revenue, FGIC Insured) | | | 4.05 | | | | 08/01/2013 | | | | 1,775,000 | | | | 1,769,604 | |
California HFA AMT Home Mortgage Series J (Housing Revenue, AGM Insured) | | | 4.38 | | | | 08/01/2012 | | | | 500,000 | | | | 505,735 | |
California HFA AMT Home Mortgage Series J (Housing Revenue) | | | 5.75 | | | | 08/01/2047 | | | | 720,000 | | | | 733,291 | |
California HFA AMT Home Mortgage Series L (Housing Revenue, FNMA Insured) | | | 3.95 | | | | 08/01/2015 | | | | 1,300,000 | | | | 1,330,628 | |
California HFA AMT Home Mortgage Series L (Housing Revenue, FGIC FHA VA Guaranty Insured) | | | 4.00 | | | | 08/01/2013 | | | | 500,000 | | | | 498,180 | |
California HFA AMT Home Mortgage Series L (Housing Revenue, FGIC FHA VA Guaranty Insured) | | | 4.05 | | | | 02/01/2014 | | | | 940,000 | | | | 933,373 | |
California HFA AMT Home Mortgage Series M (Housing Revenue) | | | 4.55 | | | | 08/01/2021 | | | | 415,000 | | | | 394,520 | |
California HFA CAB Home Mortgage Series B (Housing Revenue, FHA Private Mortgages Insured)(z) | | | 9.79 | | | | 08/01/2015 | | | | 5,000 | | | | 3,560 | |
California HFA Home Mortgage Series A (Housing Revenue, GNMA/FNMA Insured) | | | 3.75 | | | | 08/01/2020 | | | | 1,975,000 | | | | 2,091,565 | |
California HFFA Casa Colina Project (Health Revenue) | | | 5.50 | | | | 04/01/2013 | | | | 850,000 | | | | 855,976 | |
California HFFA Catholic Healthcare West Series C (Health Revenue)±§ | | | 5.00 | | | | 07/01/2037 | | | | 150,000 | | | | 153,365 | |
California HFFA Catholic Healthcare West Series F (Health Revenue)±§ | | | 5.00 | | | | 07/01/2027 | | | | 1,000,000 | | | | 1,078,220 | |
California HFFA Catholic Healthcare West Series I (Health Revenue)±§ | | | 4.95 | | | | 07/01/2026 | | | | 1,790,000 | | | | 1,937,460 | |
California HFFA Catholic Healthcare West Series L (Health Revenue) | | | 5.13 | | | | 07/01/2022 | | | | 415,000 | | | | 447,719 | |
California HFFA Paradise Estate (Health Revenue, California Mortgages Insured) | | | 5.13 | | | | 01/01/2022 | | | | 3,000,000 | | | | 3,058,320 | |
California HFFA Revenue Home Mortgage Series D (Housing Revenue, FGIC FHA VA Guaranty Insured) | | | 4.10 | | | | 02/01/2015 | | | | 1,750,000 | | | | 1,743,980 | |
California HFFA Revenue Home Mortgage Series D (Housing Revenue, FGIC Insured) | | | 4.30 | | | | 08/01/2015 | | | | 475,000 | | | | 482,909 | |
California Infrastructure & Economic Development Bank Energy Efficiency Master Trust Series A (Miscellaneous Revenue) | | | 5.00 | | | | 03/01/2012 | | | | 300,000 | | | | 302,256 | |
California Infrastructure & Economic Development Bank Pacific Gas & Electric Series E (IDR)±§ | | | 2.25 | | | | 11/01/2026 | | | | 100,000 | | | | 100,411 | |
California Infrastructure & Economic Development Bank YMCA Metropolitan LA Project (Miscellaneous Revenue, AMBAC Insured) | | | 4.40 | | | | 02/01/2016 | | | | 1,060,000 | | | | 1,072,497 | |
California Municipal Finance Authority COP Community Hospitals Central California (Health Revenue) | | | 5.00 | | | | 02/01/2012 | | | | 1,585,000 | | | | 1,588,852 | |
California PCFA (Resource Recovery Revenue)±§ | | | 5.25 | | | | 06/01/2023 | | | | 3,245,000 | | | | 3,587,802 | |
California PCFA Solid Waste Disposal Waste Management Project Series A (Solid Waste Revenue)±§ | | | 5.13 | | | | 07/01/2031 | | | | 1,000,000 | | | | 1,072,610 | |
California Special Districts Finance Program COP Series 00 (Lease Revenue, NATL-RE Insured) | | | 5.00 | | | | 12/01/2015 | | | | 285,000 | | | | 285,442 | |
| | | | | | |
| Portfolio of Investments—December 31, 2011 (Unaudited) | | Wells Fargo Advantage California Limited-Term Tax-Free Fund | | | 11 | |
| | | | | | | | | | | | | | | | |
| Security Name | | Interest Rate | | | Maturity Date | | | Principal | | | Value | |
| | | | | | | | | | | | | | | | |
| | | | |
| California (continued) | | | | | | | | | | | | | | | | |
California State (Miscellaneous Revenue, NATL-RE Insured) | | | 4.38 | % | | | 02/01/2013 | | | $ | 200,000 | | | $ | 200,660 | |
California State (Tax Revenue) | | | 5.00 | | | | 05/01/2012 | | | | 100,000 | | | | 101,607 | |
California State (Miscellaneous Revenue, NATL-RE Insured) | | | 5.00 | | | | 06/01/2012 | | | | 280,000 | | | | 281,064 | |
California State (Tax Revenue) | | | 5.00 | | | | 10/01/2016 | | | | 1,000,000 | | | | 1,033,990 | |
California State (Tax Revenue) | | | 5.00 | | | | 02/01/2020 | | | | 150,000 | | | | 150,623 | |
California State (Miscellaneous Revenue, AMBAC Insured) | | | 5.50 | | | | 03/01/2015 | | | | 105,000 | | | | 105,429 | |
California State (Miscellaneous Revenue, NATL-RE-IBC Insured) | | | 6.25 | | | | 09/01/2012 | | | | 275,000 | | | | 285,893 | |
California State Department of Transportation COP Series A (Lease Revenue, NATL-RE Insured) | | | 5.25 | | | | 03/01/2016 | | | | 200,000 | | | | 200,768 | |
California State Department of Veterans Affairs Home Purchase AMT Series A (Housing Revenue) | | | 4.00 | | | | 12/01/2013 | | | | 1,995,000 | | | | 2,097,383 | |
California State FSA (Miscellaneous Revenue, AGM-CR Insured) | | | 5.50 | | | | 03/01/2012 | | | | 30,000 | | | | 30,128 | |
California State Public Works Board California Community Colleges Series A (Lease Revenue) | | | 4.63 | | | | 12/01/2013 | | | | 100,000 | | | | 100,285 | |
California State Public Works Board California Community Colleges Series A (Lease Revenue, AMBAC Insured) | | | 5.25 | | | | 12/01/2012 | | | | 1,020,000 | | | | 1,023,743 | |
California State Public Works Board California Community Colleges Series A (Lease Revenue, AMBAC Insured) | | | 5.50 | | | | 04/01/2013 | | | | 100,000 | | | | 100,377 | |
California State Public Works Board California Community Colleges Series B (Lease Revenue, NATL-RE Insured) | | | 5.10 | | | | 09/01/2013 | | | | 1,930,000 | | | | 1,936,446 | |
California State Public Works Board California Community Colleges Series D (Lease Revenue, NATL-RE-IBC Insured) | | | 5.38 | | | | 03/01/2012 | | | | 750,000 | | | | 752,955 | |
California State Public Works Board California State University Trustees Series B (Lease Revenue) | | | 5.00 | | | | 09/01/2013 | | | | 365,000 | | | | 366,190 | |
California State Public Works Board Department of Corrections (Lease Revenue, AGM Certificates Insured) | | | 5.25 | | | | 06/01/2015 | | | | 935,000 | | | | 1,004,134 | |
California State Public Works Board Department of Corrections Series A (Lease Revenue, AMBAC Insured) | | | 4.75 | | | | 09/01/2012 | | | | 200,000 | | | | 200,664 | |
California State Public Works Board Department of Corrections Series E (Lease Revenue, XLCA Insured) | | | 5.00 | | | | 06/01/2015 | | | | 640,000 | | | | 689,325 | |
California State Public Works Board Department of Corrections Series E (Lease Revenue, NATL-RE IBC Bank of New York Insured) | | | 5.50 | | | | 06/01/2015 | | | | 700,000 | | | | 731,878 | |
California State Public Works Board Department of Corrections State Prisons Series A (Lease Revenue, AMBAC Insured) | | | 5.25 | | | | 12/01/2013 | | | | 1,910,000 | | | | 1,983,134 | |
California State Public Works Board Department of General Services Series A (Lease Revenue, AMBAC Insured) | | | 5.25 | | | | 12/01/2017 | | | | 2,000,000 | | | | 2,055,800 | |
California State Public Works Board Department of Health Services Series A (Lease Revenue, NATL-RE Insured) | | | 5.20 | | | | 11/01/2012 | | | | 500,000 | | | | 501,825 | |
California State Public Works Board Department of Health Services Series A (Lease Revenue, NATL-RE Insured) | | | 5.50 | | | | 11/01/2015 | | | | 500,000 | | | | 501,680 | |
California State Public Works Board Series A (Lease Revenue) | | | 6.50 | | | | 09/01/2017 | | | | 2,210,000 | | | | 2,462,139 | |
California State Public Works Board Trustees California State University Series A (Lease Revenue) | | | 5.25 | | | | 10/01/2013 | | | | 250,000 | | | | 250,858 | |
California State University Hayward Foundation Project (Education Revenue, NATL-RE GO of Corporation Insured) | | | 5.25 | | | | 08/01/2025 | | | | 500,000 | | | | 500,370 | |
California State Various Purposes (Miscellaneous Revenue, NATL-RE Insured) | | | 5.00 | | | | 02/01/2012 | | | | 50,000 | | | | 50,207 | |
California State Various Purposes (Tax Revenue) | | | 6.25 | | | | 09/01/2012 | | | | 920,000 | | | | 956,441 | |
California State Veterans Bonds Series CA (Tax Revenue) | | | 4.45 | | | | 12/01/2017 | | | | 1,000,000 | | | | 1,090,480 | |
California Statewide CDA (Miscellaneous Revenue) | | | 5.88 | | | | 07/01/2022 | | | | 2,750,000 | | | | 2,807,173 | |
California Statewide CDA American Baptist Homes West (Housing Revenue) | | | 4.25 | | | | 10/01/2015 | | | | 2,270,000 | | | | 2,296,514 | |
California Statewide CDA Childrens Hospital of Los Angeles Project (Lease Revenue, NATL-RE Insured) | | | 6.00 | | | | 06/01/2012 | | | | 500,000 | | | | 509,035 | |
California Statewide CDA COP (Hospital Revenue, ACA Radian Insured) | | | 4.00 | | | | 06/01/2015 | | | | 325,000 | | | | 343,229 | |
| | | | |
| 12 | | Wells Fargo Advantage California Limited-Term Tax-Free Fund | | Portfolio of Investments—December 31, 2011 (Unaudited) |
| | | | | | | | | | | | | | | | |
| Security Name | | Interest Rate | | | Maturity Date | | | Principal | | | Value | |
| | | | | | | | | | | | | | | | |
| | | | |
| California (continued) | | | | | | | | | | | | | | | | |
California Statewide CDA COP Health Facilities Series A (Lease Revenue, NATL-RE-IBC Insured) | | | 5.50 | % | | | 09/01/2014 | | | $ | 730,000 | | | $ | 786,955 | |
California Statewide CDA COP SAVRS (Health Revenue, ACA Radian
Insured)±§(a)(m)(n) | | | 0.81 | | | | 05/15/2029 | | | | 200,000 | | | | 186,092 | |
California Statewide CDA Disposal Republic Services Series A (Resource Recovery Revenue) | | | 4.95 | | | | 12/01/2012 | | | | 1,000,000 | | | | 1,034,190 | |
California Statewide CDA Henry Mayo Memorial Hospital Series B (Health Revenue, AMBAC California Mortgages Insured) | | | 4.00 | | | | 10/01/2014 | | | | 1,155,000 | | | | 1,183,459 | |
California Statewide CDA International School Peninsula Project (Education Revenue) | | | 4.60 | | | | 11/01/2013 | | | | 205,000 | | | | 207,327 | |
California Statewide CDA John Muir Mt. Diablo Health Systems (Health Revenue, NATL-RE Insured) | | | 5.50 | | | | 08/15/2012 | | | | 220,000 | | | | 225,148 | |
California Statewide CDA Kaiser Permanente Series B (Health Revenue)±§ | | | 3.90 | | | | 08/01/2031 | | | | 750,000 | | | | 793,485 | |
California Statewide CDA Monterey Community Hospital (Health Revenue) | | | 3.25 | | | | 06/01/2016 | | | | 415,000 | | | | 431,173 | |
California Statewide CDA Proposition 1A Receivables Program (Miscellaneous Revenue) | | | 4.00 | | | | 06/15/2013 | | | | 1,500,000 | | | | 1,567,305 | |
California Statewide CDA Proposition 1A Receivables Program (Miscellaneous Revenue) | | | 5.00 | | | | 06/15/2013 | | | | 4,000,000 | | | | 4,237,263 | |
California Statewide CDA Sherman Oaks Project Series A (Miscellaneous Revenue, AMBAC California Mortgages Insured) | | | 5.50 | | | | 08/01/2014 | | | | 800,000 | | | | 858,104 | |
California Statewide CDA St. Joseph Hospital (Health Revenue, FSA Insured) | | | 4.50 | | | | 07/01/2018 | | | | 1,200,000 | | | | 1,288,320 | |
California Statewide CDA University of California Irvine Campus Apartment (Education Revenue) | | | 5.00 | | | | 05/15/2017 | | | | 1,000,000 | | | | 1,099,090 | |
Centinela Valley CA Union High School District CAB Series A (Tax Revenue, AGM Insured) | | | 2.00 | | | | 08/01/2012 | | | | 665,000 | | | | 670,726 | |
Centinela Valley CA Union High School District CAB Series A (Tax Revenue, AGM Insured)(z) | | | 2.52 | | | | 08/01/2015 | | | | 375,000 | | | | 342,525 | |
Chula Vista CA COP (Lease Revenue, NATL-RE Insured) | | | 4.50 | | | | 08/01/2016 | | | | 430,000 | | | | 439,189 | |
Clovis CA PFA (Water & Sewer Revenue, AMBAC Insured) | | | 5.00 | | | | 08/01/2015 | | | | 375,000 | | | | 416,048 | |
Coalinga CA PFA Senior Lien Notes Series A (Miscellaneous Revenue, AMBAC Insured) | | | 5.85 | | | | 09/15/2013 | | | | 500,000 | | | | 522,765 | |
Compton CA Community RDA 2nd Lien (Tax Revenue) | | | 3.00 | | | | 08/01/2012 | | | | 830,000 | | | | 830,266 | |
Compton CA Community RDA 2nd Lien (Tax Revenue) | | | 3.00 | | | | 08/01/2013 | | | | 855,000 | | | | 851,537 | |
Compton CA Community RDA 2nd Lien (Tax Revenue) | | | 3.50 | | | | 08/01/2014 | | | | 1,130,000 | | | | 1,128,090 | |
Compton CA Solid Waste Management Facilities (Resource Recovery Revenue) | | | 4.80 | | | | 08/01/2020 | | | | 195,000 | | | | 202,215 | |
Contra Costa County CA PFA Series B (Lease Revenue, NATL-RE Insured) | | | 4.00 | | | | 06/01/2013 | | | | 450,000 | | | | 454,653 | |
Corona CA PFA City Hall Project Series B (Lease Revenue, NATL-RE Insured) | | | 5.38 | | | | 09/01/2018 | | | | 1,205,000 | | | | 1,221,894 | |
Cudahy CA Community Development Commission Redevelopment Projects Series B (Tax Revenue) | | | 5.50 | | | | 10/01/2015 | | | | 690,000 | | | | 737,596 | |
Cudahy CA Community Development Commission Redevelopment Projects Series B (Tax Revenue) | | | 6.00 | | | | 10/01/2016 | | | | 625,000 | | | | 684,231 | |
Cudahy CA Community Development Commission Redevelopment Projects Series B (Tax Revenue) | | | 6.00 | | | | 10/01/2017 | | | | 385,000 | | | | 422,122 | |
Cudahy CA Community Development Commission Redevelopment Projects Series B (Tax Revenue) | | | 6.38 | | | | 10/01/2018 | | | | 410,000 | | | | 459,626 | |
Culver City CA RDFA (Tax Revenue, AMBAC Insured) | | | 5.50 | | | | 11/01/2014 | | | | 985,000 | | | | 1,014,816 | |
Culver City CA Redevelopment Agency CAB Tax Allocation A (Tax Revenue)(z) | | | 5.44 | | | | 11/01/2019 | | | | 2,575,000 | | | | 1,689,741 | |
Delano County CA Financing Authority Police Station Project Series A (Lease Revenue) | | | 2.00 | | | | 12/01/2012 | | | | 370,000 | | | | 369,900 | |
Delano County CA Financing Authority Police Station Project Series A (Lease Revenue) | | | 4.00 | | | | 12/01/2016 | | | | 1,040,000 | | | | 1,099,124 | |
Duarte CA COP Series A (Health Revenue) | | | 5.25 | | | | 04/01/2019 | | | | 1,500,000 | | | | 1,502,520 | |
| | | | | | |
| Portfolio of Investments—December 31, 2011 (Unaudited) | | Wells Fargo Advantage California Limited-Term Tax-Free Fund | | | 13 | |
| | | | | | | | | | | | | | | | |
| Security Name | | Interest Rate | | | Maturity Date | | | Principal | | | Value | |
| | | | | | | | | | | | | | | | |
| | | | |
| California (continued) | | | | | | | | | | | | | | | | |
El Dorado CA Irrigation District & El Dorado Water Agency Series A (Lease Revenue, NATL-RE FGIC Insured) | | | 5.00 | % | | | 03/01/2017 | | | $ | 500,000 | | | $ | 531,140 | |
Emeryville CA PFA Emeryville Redevelopment Project Series A (Lease Revenue, NATL-RE Insured) | | | 5.25 | | | | 09/01/2015 | | | | 1,265,000 | | | | 1,294,968 | |
Emeryville CA PFA Emeryville Redevelopment Project Series A (Lease Revenue, NATL-RE Insured) | | | 5.25 | | | | 09/01/2017 | | | | 1,400,000 | | | | 1,427,706 | |
Firebaugh-Las Deltas CA Unified School District CAB Election of 1997 (Tax Revenue, FGIC Insured)(z) | | | 4.72 | | | | 08/01/2022 | | | | 100,000 | | | | 60,925 | |
Folsom Cordova CA Unified School District School Facilities Improvement District # 1 Series A (Tax Revenue, NATL-RE Insured) | | | 5.50 | | | | 10/01/2015 | | | | 370,000 | | | | 374,906 | |
Fontana CA PFA (Lease Revenue, AMBAC Insured) | | | 5.00 | | | | 09/01/2012 | | | | 400,000 | | | | 408,268 | |
Fontana CA RDA Jurupa Hills Redevelopment Project Series A (Tax Revenue) | | | 5.50 | | | | 10/01/2017 | | | | 50,000 | | | | 50,258 | |
Fontana CA RDA Sierra Corridor Commercial Redevelopment Project (Tax Revenue, NATL-RE FGIC Insured) | | | 4.50 | | | | 09/01/2015 | | | | 825,000 | | | | 860,945 | |
Fontana CA Unified School District BAN (Tax Revenue)(z) | | | 0.79 | | | | 12/01/2012 | | | | 500,000 | | | | 496,320 | |
Foothill-Eastern CA Transportation Corridor Agency CAB (Transportation Revenue, NATL-RE Insured)(z) | | | 5.76 | | | | 01/15/2017 | | | | 580,000 | | | | 435,499 | |
Fowler CA Unified School District School Facilities Improvement District # 1 (Tax Revenue, NATL-RE Insured) | | | 5.20 | | | | 07/01/2020 | | | | 1,730,000 | | | | 1,927,687 | |
Fresno CA Joint Powers Financing Authority (Lease Revenue, AGM Insured) | | | 5.00 | | | | 06/01/2017 | | | | 650,000 | | | | 652,360 | |
Fresno CA Unified School District Series A (Tax Revenue, NATL-RE Insured) | | | 6.55 | | | | 08/01/2020 | | | | 200,000 | | | | 216,678 | |
Garden Grove CA Agency for Community Development (Tax Revenue, AMBAC Insured) | | | 5.25 | | | | 10/01/2016 | | | | 600,000 | | | | 618,720 | |
Golden State Tobacco Securitization Corporation CA Series 2003 A-1 (Tobacco Revenue) | | | 6.25 | | | | 06/01/2033 | | | | 2,820,000 | | | | 3,014,213 | |
Golden West California Schools Financing Authority CAB Series A (Miscellaneous Revenue, NATL-RE Insured)(z) | | | 2.65 | | | | 02/01/2013 | | | | 360,000 | | | | 349,726 | |
Golden West California Schools Financing Authority CAB Series A (Miscellaneous Revenue, NATL-RE Insured)(z) | | | 3.12 | | | | 02/01/2014 | | | | 235,000 | | | | 220,195 | |
Golden West California Schools Financing Authority CAB Series A (Miscellaneous Revenue, NATL-RE Insured)(z) | | | 3.12 | | | | 02/01/2014 | | | | 455,000 | | | | 426,335 | |
Golden West California Schools Financing Authority CAB Series A (Miscellaneous Revenue, NATL-RE Insured) | | | 6.60 | | | | 02/01/2016 | | | | 650,000 | | | | 707,798 | |
Hawthorne CA School District Election 2008 Series A (Tax Revenue, Assured Guaranty Insured)(z) | | | 2.32 | | | | 08/01/2015 | | | | 100,000 | | | | 91,989 | |
Hawthorne CA School District Election 2008 Series A (Tax Revenue, Assured Guaranty Insured)(z) | | | 2.51 | | | | 08/01/2016 | | | | 155,000 | | | | 138,108 | |
Hawthorne CA School District Election 2008 Series A (Tax Revenue, Assured Guaranty Insured)(z) | | | 2.73 | | | | 08/01/2017 | | | | 165,000 | | | | 141,676 | |
Hemet CA Unified School District COP (Lease Revenue)±§ | | | 1.60 | | | | 10/01/2036 | | | | 4,945,000 | | | | 4,944,110 | |
Hesperia CA Unified School District COP Interim School Facility Funding Program (GO - Local, AGM Insured)±§ | | | 3.50 | | | | 02/01/2038 | | | | 4,550,000 | | | | 4,550,000 | |
Horicon CA Elementary School District (Tax Revenue, AMBAC Insured) | | | 4.00 | | | | 08/01/2012 | | | �� | 265,000 | | | | 268,548 | |
Horicon CA Elementary School District (Tax Revenue, AMBAC Insured) | | | 4.00 | | | | 08/01/2013 | | | | 280,000 | | | | 289,576 | |
Horicon CA Elementary School District (Tax Revenue, AMBAC Insured) | | | 4.00 | | | | 08/01/2014 | | | | 295,000 | | | | 309,549 | |
Industry CA Refunding Senior Series B (Airport Revenue, NATL-RE Insured) | | | 4.00 | | | | 05/01/2018 | | | | 1,000,000 | | | | 1,009,030 | |
Inglewood CA RDA Sub Lien Merged Redevelopment Project (Tax Revenue, ACA Insured)(z) | | | 4.14 | | | | 05/01/2012 | | | | 395,000 | | | | 389,604 | |
Inglewood CA RDA Sub Lien Merged Redevelopment Project (Tax Revenue, ACA Insured)(z) | | | 4.56 | | | | 05/01/2013 | | | | 150,000 | | | | 141,218 | |
Inglewood CA Unified School District Election 1998 Series D (Tax Revenue, AGM Insured) | | | 4.00 | | | | 10/01/2012 | | | | 100,000 | | | | 102,407 | |
Inland Valley CA Development Agency Series B (Tax Revenue)±§ | | | 4.25 | | | | 03/01/2041 | | | | 2,500,000 | | | | 2,544,400 | |
| | | | |
| 14 | | Wells Fargo Advantage California Limited-Term Tax-Free Fund | | Portfolio of Investments—December 31, 2011 (Unaudited) |
| | | | | | | | | | | | | | | | |
| Security Name | | Interest Rate | | | Maturity Date | | | Principal | | | Value | |
| | | | | | | | | | | | | | | | |
| | | | |
| California (continued) | | | | | | | | | | | | | | | | |
Inland Valley CA Development Agency Series C (Tax Revenue)±§ | | | 4.50 | % | | | 03/01/2041 | | | $ | 3,000,000 | | | $ | 3,066,180 | |
Irvine Ranch CA Water District Various Refunding Series A-1 (Utilities Revenue, GO of District Insured)±§ | | | 0.14 | | | | 10/01/2037 | | | | 975,000 | | | | 974,971 | |
Kern CA Community College District COP (Lease Revenue) | | | 4.00 | | | | 04/01/2014 | | | | 2,500,000 | | | | 2,588,800 | |
Keyes CA Unified School District CAB (Tax Revenue, NATL-RE FGIC Insured)(z) | | | 2.67 | | | | 08/01/2013 | | | | 145,000 | | | | 138,983 | |
Keyes CA Unified School District CAB (Tax Revenue, NATL-RE FGIC Insured)(z) | | | 3.11 | | | | 08/01/2015 | | | | 150,000 | | | | 134,201 | |
Keyes CA Unified School District CAB (Tax Revenue, NATL-RE FGIC Insured)(z) | | | 3.29 | | | | 08/01/2016 | | | | 155,000 | | | | 133,342 | |
Lake Elsinore CA PFFA (Tax Revenue, AMBAC Insured) | | | 4.00 | | | | 09/01/2016 | | | | 1,830,000 | | | | 1,860,341 | |
Lancaster CA RDA Combined Redevelopment Project Areas (Tax Revenue) | | | 4.50 | | | | 08/01/2014 | | | | 750,000 | | | | 758,738 | |
Lancaster CA RDA Combined Redevelopment Project Areas (Tax Revenue) | | | 4.75 | | | | 08/01/2015 | | | | 585,000 | | | | 593,640 | |
Liberty CA Unified School District CAB Series B (Tax Revenue, NATL-RE FGIC Insured)(z) | | | 4.62 | | | | 08/01/2017 | | | | 300,000 | | | | 232,269 | |
Lindsay CA Unified School District COP (Lease Revenue, Assured Guaranty Insured) | | | 5.00 | | | | 10/01/2014 | | | | 340,000 | | | | 366,656 | |
Long Beach CA Bond Finance Authority Aquarium of The Pacific (Lease Revenue, AMBAC Insured) | | | 5.50 | | | | 11/01/2012 | | | | 1,535,000 | | | | 1,539,590 | |
Long Beach CA Bond Finance Authority Aquarium of The Pacific (Lease Revenue, AMBAC Insured) | | | 5.50 | | | | 11/01/2015 | | | | 1,045,000 | | | | 1,047,341 | |
Long Beach CA Bond Finance Authority Public Safety Facilities Project (Lease Revenue, AMBAC Insured) | | | 5.25 | | | | 11/01/2013 | | | | 1,080,000 | | | | 1,103,663 | |
Long Beach CA Harbor AMT Series A (Port Authority Revenue, NATL-RE Insured) | | | 5.00 | | | | 05/15/2016 | | | | 500,000 | | | | 554,550 | |
Long Beach CA Public Safety Facilities Project (Lease Revenue, AMBAC Insured) | | | 5.25 | | | | 11/01/2015 | | | | 250,000 | | | | 254,205 | |
Long Beach CA Senior Series B (Port Authority Revenue) | | | 4.00 | | | | 06/01/2014 | | | | 995,000 | | | | 1,032,502 | |
Los Alamitos CA Unified School District TRAN (Tax Revenue)(z) | | | 2.03 | | | | 09/01/2016 | | | | 1,000,000 | | | | 909,280 | |
Los Angeles CA Building Authority Series A (Lease Revenue) | | | 5.20 | | | | 10/01/2012 | | | | 475,000 | | | | 476,743 | |
Los Angeles CA CDA Earthquake Disaster Project Series D (Tax Revenue) | | | 5.00 | | | | 09/01/2014 | | | | 255,000 | | | | 266,424 | |
Los Angeles CA CDA Earthquake Disaster Project Series D (Tax Revenue) | | | 5.00 | | | | 09/01/2015 | | | | 375,000 | | | | 397,778 | |
Los Angeles CA COP CAB Disney Package Projects (Lease Revenue)(z) | | | 3.43 | | | | 03/01/2017 | | | | 575,000 | | | | 481,833 | |
Los Angeles CA COP Hollywood Presbyterian Medical Center (Lease Revenue, INDLC Insured) | | | 9.63 | | | | 07/01/2013 | | | | 160,000 | | | | 173,547 | |
Los Angeles CA TRAN (Tax Revenue) | | | 2.50 | | | | 03/30/2012 | | | | 1,000,000 | | | | 1,005,700 | |
Los Angeles CA TRAN (Tax Revenue) | | | 2.50 | | | | 04/30/2012 | | | | 1,000,000 | | | | 1,007,520 | |
Los Angeles CA Unified School District COP Multiple Properties Series A (Lease Revenue) | | | 5.00 | | | | 12/01/2015 | | | | 1,750,000 | | | | 1,922,848 | |
Los Angeles CA Unified School District Election of 2004 Series F (Tax Revenue, FGIC Insured) | | | 5.00 | | | | 07/01/2020 | | | | 2,500,000 | | | | 2,800,925 | |
Los Angeles County CA Capital Asset Leasing Corporation Series B (Lease Revenue, AMBAC Insured) | | | 6.00 | | | | 12/01/2014 | | | | 200,000 | | | | 214,100 | |
Los Angeles County CA Capital Asset Leasing Corporation Series B (Lease Revenue, AMBAC Insured) | | | 6.00 | | | | 12/01/2015 | | | | 1,835,000 | | | | 1,989,691 | |
Los Angeles County CA Capital Asset Leasing Corporation Series B (Lease Revenue, AMBAC Insured) | | | 6.00 | | | | 12/01/2016 | | | | 3,285,000 | | | | 3,583,311 | |
Los Angeles County CA Community Facilities District # 5 Rowland Heights Area (Tax Revenue, AGM Insured) | | | 5.00 | | | | 09/01/2019 | | | | 1,000,000 | | | | 1,005,980 | |
Los Angeles County CA COP CAB Disney Package Projects (Lease Revenue)(z) | | | 1.81 | | | | 03/01/2014 | | | | 100,000 | | | | 96,133 | |
Los Angeles County CA Metropolitan Transportation Authority Series D (Tax Revenue) | | | 5.00 | | | | 07/01/2012 | | | | 200,000 | | | | 204,780 | |
Los Angeles County CA Public Works Financing Authority Master Project Series A (Lease Revenue, NATL-RE FGIC Insured) | | | 5.00 | | | | 09/01/2014 | | | | 690,000 | | | | 745,028 | |
Los Angeles County CA Schools Financing Program COP Series A1 (Miscellaneous Revenue) | | | 2.00 | | | | 06/29/2012 | | | | 915,000 | | | | 922,384 | |
| | | | | | |
| Portfolio of Investments—December 31, 2011 (Unaudited) | | Wells Fargo Advantage California Limited-Term Tax-Free Fund | | | 15 | |
| | | | | | | | | | | | | | | | |
| Security Name | | Interest Rate | | | Maturity Date | | | Principal | | | Value | |
| | | | | | | | | | | | | | | | |
| | | | |
| California (continued) | | | | | | | | | | | | | | | | |
Los Angeles County CA Schools Financing Program COP Series A2 (Miscellaneous Revenue) | | | 2.00 | % | | | 03/30/2012 | | | $ | 1,000,000 | | | $ | 1,003,720 | |
Los Angeles County CA Schools Financing Program COP Series A3 (Miscellaneous Revenue) | | | 2.00 | | | | 03/30/2012 | | | | 1,000,000 | | | | 1,002,990 | |
Los Angeles County CA TRAN Series A (Tax Revenue) | | | 2.50 | | | | 02/29/2012 | | | | 1,000,000 | | | | 1,003,680 | |
Los Angeles County CA TRAN Series B (Tax Revenue) | | | 2.50 | | | | 03/30/2012 | | | | 1,000,000 | | | | 1,005,650 | |
Mendocino County CA TRAN (Tax Revenue) | | | 2.00 | | | | 06/29/2012 | | | | 2,000,000 | | | | 2,015,340 | |
Merced CA Union High School CAB Series A (Tax Revenue, NATL-RE FGIC Insured)(z) | | | 3.77 | | | | 08/01/2019 | | | | 2,190,000 | | | | 1,647,077 | |
Metropolitan Water District of Southern California Series A4 (Water & Sewer Revenue)±§ | | | 0.25 | | | | 07/01/2036 | | | | 2,000,000 | | | | 1,992,080 | |
Modesto CA Irrigation District COP Capital Improvements Series A (Lease Revenue, AGM Insured) | | | 5.25 | | | | 07/01/2016 | | | | 1,000,000 | | | | 1,000,140 | |
Mojave CA Unified School District COP (Lease Revenue, AGM Insured)(z) | | | 1.25 | | | | 09/01/2012 | | | | 500,000 | | | | 495,795 | |
Mojave CA Unified School District COP (Lease Revenue, AGM Insured) | | | 3.00 | | | | 08/01/2012 | | | | 300,000 | | | | 304,557 | |
Monrovia CA Redevelopment Agency Century Redevelopment Project Area # 1 (Tax Revenue) | | | 4.40 | | | | 06/01/2012 | | | | 1,000,000 | | | | 998,410 | |
Moreno Valley CA PFA (Lease Revenue, AMBAC Insured) | | | 5.00 | | | | 11/01/2013 | | | | 580,000 | | | | 613,988 | |
Moreno Valley CA Unified School District Financing Authority Series A (Tax Revenue, AGM Insured) | | | 5.00 | | | | 08/15/2014 | | | | 1,000,000 | | | | 1,005,080 | |
Mount Diablo CA Unified School District (Tax Revenue) | | | 2.00 | | | | 02/01/2012 | | | | 620,000 | | | | 620,905 | |
Mount Pleasant CA Elementary School District CAB 1998 Election Series S (Tax Revenue, AMBAC Insured)(z) | | | 2.70 | | | | 09/01/2014 | | | | 1,070,000 | | | | 995,624 | |
Napa-Vallejo CA Solid Waste Transfer Facility (Resource Recovery Revenue) | | | 5.30 | | | | 02/15/2012 | | | | 990,000 | | | | 992,465 | |
New Haven CA Unified School District Refunding (Tax Revenue, AGM Insured) | | | 12.00 | | | | 08/01/2013 | | | | 905,000 | | | | 1,063,502 | |
Norco CA RDA Refunding Redevelopment Project Area #1 (Tax Revenue) | | | 4.00 | | | | 03/01/2014 | | | | 100,000 | | | | 103,049 | |
Northern California Transmission California-Oregon Transportation Project Series A (Utilities Revenue, NATL-RE Insured) | | | 7.00 | | | | 05/01/2013 | | | | 1,845,000 | | | | 1,934,058 | |
Norwalk CA Community Facilities Authority Refunding Parking & Improvement Project Series A (Lease Revenue, AMBAC Insured) | | | 3.90 | | | | 04/01/2012 | | | | 180,000 | | | | 180,434 | |
Oakland CA COP Oakland Museum Series A (Lease Revenue, AMBAC Insured) | | | 5.00 | | | | 04/01/2012 | | | | 225,000 | | | | 226,258 | |
Oakland CA Financing Authority Housing Set-Aside (Tax Revenue, AMBAC Insured) | | | 5.00 | | | | 09/01/2018 | | | | 2,000,000 | | | | 2,091,860 | |
Oakland CA Joint Powers Financing Authority Oakland Convention Centers (Lease Revenue, AMBAC Insured) | | | 5.50 | | | | 10/01/2013 | | | | 1,805,000 | | | | 1,878,572 | |
Oakland CA Joint Powers Financing Authority Oakland Convention Centers (Lease Revenue, AMBAC Insured) | | | 5.50 | | | | 10/01/2014 | | | | 580,000 | | | | 611,094 | |
Oakland CA Joint Powers Financing Authority Series A1 (Lease Revenue, Assured Guaranty Insured) | | | 5.25 | | | | 01/01/2017 | | | | 1,885,000 | | | | 2,135,875 | |
Oakland CA RDA Sub Tax Allocation Centre Distribution (Tax Revenue, NATL-RE FGIC Insured) | | | 5.50 | | | | 09/01/2012 | | | | 105,000 | | | | 106,994 | |
Oakland CA RDA Sub Tax Allocation Centre Distribution (Tax Revenue, NATL-RE FGIC Insured) | | | 5.50 | | | | 09/01/2015 | | | | 475,000 | | | | 486,467 | |
Oakland CA Unified School District Alameda County (Tax Revenue, NATL-RE FGIC Insured) | | | 3.75 | | | | 08/01/2012 | | | | 500,000 | | | | 507,390 | |
Oakland CA Unified School District Alameda County Election 2000 (Tax Revenue, NATL-RE Insured) | | | 5.00 | | | | 08/01/2016 | | | | 530,000 | | | | 575,071 | |
Oakland CA Unified School District Alameda County Election 2006 Series A (Tax Revenue) | | | 4.00 | | | | 08/01/2014 | | | | 435,000 | | | | 454,997 | |
Orange County CA COP Civic Center Facilities (Lease Revenue, AMBAC Insured)(z) | | | 3.98 | | | | 12/01/2018 | | | | 2,000,000 | | | | 1,520,800 | |
Oxnard CA COP (Lease Revenue, AMBAC Insured) | | | 4.45 | | | | 06/01/2012 | | | | 185,000 | | | | 185,248 | |
Oxnard Ca Harbor District Series A (Port Authority Revenue) | | | 5.00 | | | | 08/01/2015 | | | | 1,960,000 | | | | 2,046,789 | |
| | | | |
| 16 | | Wells Fargo Advantage California Limited-Term Tax-Free Fund | | Portfolio of Investments—December 31, 2011 (Unaudited) |
| | | | | | | | | | | | | | | | |
| Security Name | | Interest Rate | | | Maturity Date | | | Principal | | | Value | |
| | | | | | | | | | | | | | | | |
| | | | |
| California (continued) | | | | | | | | | | | | | | | | |
Palm Desert CA Financing Authority Housing Set-Aside (Tax Revenue, NATL-RE Insured) | | | 5.00 | % | | | 10/01/2013 | | | $ | 1,200,000 | | | $ | 1,254,456 | |
Palm Springs CA Airport Sub Lien Palm Springs International Airport (Port Authority Revenue) | | | 5.10 | | | | 07/01/2012 | | | | 290,000 | | | | 291,807 | |
Palm Springs CA Airport Sub Lien Palm Springs International Airport (Port Authority Revenue) | | | 5.20 | | | | 07/01/2013 | | | | 410,000 | | | | 412,632 | |
Palm Springs CA Airport Sub Lien Palm Springs International Airport (Port Authority Revenue) | | | 5.30 | | | | 07/01/2013 | | | | 90,000 | | | | 90,193 | |
Palm Springs CA Airport Sub Lien Palm Springs International Airport (Port Authority Revenue) | | | 5.30 | | | | 07/01/2014 | | | | 430,000 | | | | 427,519 | |
Palo Verde CA Unified School District FlexFund Program (Lease Revenue) | | | 4.80 | | | | 09/01/2027 | | | | 931,498 | | | | 960,309 | |
Palomar CA Palomar County Election 2006 Series B (Tax Revenue)(z) | | | 2.09 | | | | 08/01/2016 | | | | 250,000 | | | | 227,025 | |
Palomar CA Palomar County Election 2006 Series B (Tax Revenue)(z) | | | 2.55 | | | | 08/01/2017 | | | | 880,000 | | | | 763,013 | |
Palomar Pomerado CA Health System CAB (Tax Revenue, NATL-RE Insured)(z) | | | 3.58 | | | | 08/01/2017 | | | | 2,000,000 | | | | 1,638,580 | |
Paramount CA Unified School District School Facility Bridge Funding (Lease Revenue, AGM Insured)±§ | | | 3.25 | | | | 09/01/2015 | | | | 690,000 | | | | 690,000 | |
Paramount CA Unified School District School Facility Bridge Funding (Lease Revenue, AGM Insured)±§ | | | 3.25 | | | | 09/01/2027 | | | | 700,000 | | | | 700,000 | |
Patterson CA Joint Unified School District CAB Series A (Tax Revenue, NATL-RE FGIC Insured)(z) | | | 3.33 | | | | 08/01/2015 | | | | 140,000 | | | | 124,267 | |
Pomona CA PFA Redevelopment Project Series AD (Tax Revenue, NATL-RE Insured) | | | 4.75 | | | | 02/01/2013 | | | | 1,830,000 | | | | 1,832,763 | |
Pomona CA Unified School District Series A (Tax Revenue, NATL-RE Insured) | | | 6.15 | | | | 08/01/2015 | | | | 3,470,000 | | | | 3,589,125 | |
Pomona CA Unified School District Series A (Tax Revenue, NATL-RE Insured) | | | 6.50 | | | | 08/01/2019 | | | | 800,000 | | | | 827,360 | |
Pomona CA Unified School District Series A (Tax Revenue, NATL-RE Insured) | | | 6.70 | | | | 08/01/2012 | | | | 100,000 | | | | 103,789 | |
Port of Oakland CA Series N AMT (Port Authority Revenue, NATL-RE Insured) | | | 5.00 | | | | 11/01/2014 | | | | 1,000,000 | | | | 1,026,550 | |
Poway CA Community Facilities District # 88-1 Parkway Business (Tax Revenue) | | | 3.63 | | | | 08/15/2014 | | | | 1,100,000 | | | | 1,117,567 | |
Poway CA RDA Paguay Redevelopment Project Series A (Tax Revenue, NATL-RE Insured) | | | 4.50 | | | | 06/15/2014 | | | | 580,000 | | | | 590,463 | |
Poway CA Unified School District PFA CAB (Lease Revenue, AGM Insured)±§ | | | 3.50 | | | | 12/01/2039 | | | | 990,000 | | | | 990,000 | |
Rancho Cucamonga CA Redevelopment Agency Rancho Redevelopment Project (Tax Revenue, AGM Insured) | | | 5.00 | | | | 09/01/2013 | | | | 500,000 | | | | 501,765 | |
Rancho Santa Fe CA Community Services District Superior Lien Series A (Tax Revenue) | | | 3.00 | | | | 09/01/2012 | | | | 200,000 | | | | 201,752 | |
Rancho Santa Fe CA Community Services District Superior Lien Series A (Tax Revenue) | | | 3.00 | | | | 09/01/2013 | | | | 230,000 | | | | 232,769 | |
Rancho Santa Fe CA Community Services District Superior Lien Series A (Tax Revenue) | | | 3.00 | | | | 09/01/2014 | | | | 620,000 | | | | 625,382 | |
Rancho Santa Fe CA Community Services District Superior Lien Series A (Tax Revenue) | | | 3.13 | | | | 09/01/2015 | | | | 675,000 | | | | 676,262 | |
Rancho Santa Fe CA Community Services District Superior Lien Series A (Tax Revenue) | | | 3.50 | | | | 09/01/2016 | | | | 725,000 | | | | 727,458 | |
Redlands CA PFA Series A (Water & Sewer Revenue, AGM Insured) | | | 5.00 | | | | 09/01/2017 | | | | 1,000,000 | | | | 1,002,770 | |
Redondo Beach CA Unified School District CAB Election of 2008 Series E (Tax Revenue)(z) | | | 2.09 | | | | 08/01/2016 | | | | 225,000 | | | | 204,323 | |
Redondo Beach CA Unified School District CAB Election of 2008 Series E (Tax Revenue)(z) | | | 2.76 | | | | 08/01/2018 | | | | 345,000 | | | | 287,585 | |
Redondo Beach CA Unified School District CAB Election of 2008 Series E (Tax Revenue)(z) | | | 3.56 | | | | 08/01/2020 | | | | 460,000 | | | | 339,250 | |
Ridgecrest CA Redevelopment Agency Ridgecrest Redevelopment Project (Tax Revenue) | | | 3.00 | | | | 06/30/2013 | | | | 915,000 | | | | 917,553 | |
| | | | | | |
| Portfolio of Investments—December 31, 2011 (Unaudited) | | Wells Fargo Advantage California Limited-Term Tax-Free Fund | | | 17 | |
| | | | | | | | | | | | | | | | |
| Security Name | | Interest Rate | | | Maturity Date | | | Principal | | | Value | |
| | | | | | | | | | | | | | | | |
| | | | |
| California (continued) | | | | | | | | | | | | | | | | |
Ridgecrest CA Redevelopment Agency Ridgecrest Redevelopment Project (Tax Revenue) | | | 3.38 | % | | | 06/30/2014 | | | $ | 1,060,000 | | | $ | 1,066,074 | |
Ridgecrest CA Redevelopment Agency Ridgecrest Redevelopment Project (Tax Revenue) | | | 3.75 | | | | 06/30/2015 | | | | 630,000 | | | | 643,192 | |
Riverside CA Community College District Election 2004 Series D (Tax Revenue)(z) | | | 3.78 | | | | 08/01/2020 | | | | 535,000 | | | | 387,308 | |
Riverside CA Community Facilities District # 88-1 Series A (Tax Revenue)±§ | | | 4.00 | | | | 09/01/2014 | | | | 1,025,000 | | | | 1,073,288 | |
Riverside CA Community Facilities District # 90-1 Series A (Tax Revenue, NATL-RE Insured) | | | 5.50 | | | | 09/01/2013 | | | | 1,100,000 | | | | 1,105,445 | |
Riverside CA COP (Lease Revenue, NATL-RE Insured) | | | 5.00 | | | | 11/01/2012 | | | | 200,000 | | | | 206,746 | |
Riverside County CA Asset Leasing Corporation Hospital Project Series B (Health Revenue, NATL-RE Insured) | | | 5.70 | | | | 06/01/2016 | | | | 500,000 | | | | 512,660 | |
Riverside County CA Palm Desert Financing Authority Series A (Lease Revenue) | | | 4.50 | | | | 05/01/2012 | | | | 1,200,000 | | | | 1,210,584 | |
Riverside County CA PFA Jurupa Valley Desert & Interstate 215 (Tax Revenue, NATL-RE Insured) | | | 4.50 | | | | 10/01/2015 | | | | 235,000 | | | | 247,199 | |
Riverside County CA PFA Jurupa Valley Desert & Interstate 215 (Tax Revenue, NATL-RE Insured) | | | 5.00 | | | | 10/01/2014 | | | | 1,000,000 | | | | 1,060,390 | |
Robla CA School District Series B (Tax Revenue, NATL-RE Insured)(z) | | | 3.98 | | | | 08/01/2018 | | | | 1,220,000 | | | | 939,827 | |
Roseville City CA Natural Gas Financing Authority (Energy Revenue) | | | 5.00 | | | | 02/15/2015 | | | | 500,000 | | | | 516,040 | |
Roseville City CA School District COP Financing Project (Lease Revenue, AGM Insured) | | | 4.75 | | | | 09/01/2016 | | | | 500,000 | | | | 501,375 | |
Sacramento CA Airport Grant Series D (Port Authority Revenue, NATL-RE FGIC Insured) | | | 5.00 | | | | 07/01/2012 | | | | 225,000 | | | | 229,853 | |
Sacramento CA Airport Grant Series D (Port Authority Revenue) | | | 5.00 | | | | 07/01/2014 | | | | 1,000,000 | | | | 1,085,790 | |
Sacramento CA City Financing Authority Building Series A (Lease Revenue, AMBAC Insured) | | | 5.25 | | | | 05/01/2015 | | | | 535,000 | | | | 535,733 | |
Sacramento CA City Financing Authority Environment Protection Agency Series B (Lease Revenue, AMBAC Insured) | | | 5.00 | | | | 05/01/2014 | | | | 1,250,000 | | | | 1,251,500 | |
Sacramento CA City Financing Authority Series B (Lease Revenue) | | | 5.00 | | | | 11/01/2014 | | | | 745,000 | | | | 772,610 | |
Sacramento CA MUD Procter & Gamble Project (Utilities Revenue) | | | 5.00 | | | | 07/01/2012 | | | | 755,000 | | | | 771,791 | |
Sacramento CA MUD Series G (Utilities Revenue, NATL-RE Insured) | | | 6.50 | | | | 09/01/2013 | | | | 305,000 | | | | 319,405 | |
Sacramento CA Regional Art Facilities Financing Authority COP (Lease Revenue, AMBAC Insured) | | | 4.10 | | | | 09/01/2015 | | | | 150,000 | | | | 150,735 | |
Sacramento CA Sanitation Districts Financing Authority (Water & Sewer, FGIC Insured)±§ | | | 0.98 | | | | 12/01/2035 | | | | 2,000,000 | | | | 2,000,000 | |
Salinas Valley CA Solid Waste Authority (Resource Recovery Revenue, AMBAC Insured) | | | 5.00 | | | | 08/01/2012 | | | | 985,000 | | | | 1,001,134 | |
San Bernardino County CA COP Arrowhead Project Series A (Lease Revenue) | | | 5.50 | | | | 08/01/2020 | | | | 2,000,000 | | | | 2,302,800 | |
San Bernardino County CA COP Medical Centre Financing Project (Lease Revenue, NATL-RE-IBC Insured) | | | 5.50 | | | | 08/01/2017 | | | | 1,590,000 | | | | 1,662,886 | |
San Bernardino County CA Financing Authority Facilities Project (Miscellaneous Revenue) | | | 5.10 | | | | 06/01/2017 | | | | 710,000 | | | | 670,730 | |
San Bernardino County CA Joint Powers Financing Authority Series A (Tax Revenue, AGM Insured) | | | 5.75 | | | | 10/01/2014 | | | | 1,425,000 | | | | 1,552,637 | |
San Buenaventura CA Community Mental Health System (Health Revenue) | | | 6.00 | | | | 12/01/2019 | | | | 2,000,000 | | | | 2,045,360 | |
San Diego CA PFFA Ballpark Series A (Lease Revenue, AMBAC Insured) 144A | | | 5.00 | | | | 02/15/2016 | | | | 1,825,000 | | | | 2,030,970 | |
San Diego CA Public Facilities Financing Authority (Water & Sewer Revenue, NATL-RE Insured) | | | 5.00 | | | | 08/01/2018 | | | | 1,000,000 | | | | 1,024,720 | |
San Diego CA RDA Naval Training Center Series A (Tax Revenue) | | | 3.00 | | | | 09/01/2013 | | | | 165,000 | | | | 164,790 | |
San Diego CA RDA Naval Training Center Series A (Tax Revenue) | | | 3.00 | | | | 09/01/2014 | | | | 355,000 | | | | 351,127 | |
San Diego CA RDA Naval Training Center Series A (Tax Revenue) | | | 3.50 | | | | 09/01/2015 | | | | 365,000 | | | | 366,577 | |
San Diego CA RDA Naval Training Center Series A (Tax Revenue) | | | 4.00 | | | | 09/01/2016 | | | | 380,000 | | | | 389,804 | |
| | | | |
| 18 | | Wells Fargo Advantage California Limited-Term Tax-Free Fund | | Portfolio of Investments—December 31, 2011 (Unaudited) |
| | | | | | | | | | | | | | | | |
| Security Name | | Interest Rate | | | Maturity Date | | | Principal | | | Value | |
| | | | | | | | | | | | | | | | |
| | | | |
| California (continued) | | | | | | | | | | | | | | | | |
San Diego CA RDA Naval Training Center Series A (Tax Revenue, AMBAC Insured) | | | 4.50 | % | | | 09/01/2017 | | | $ | 555,000 | | | $ | 583,089 | |
San Diego CA RDA Naval Training Center Series A (Tax Revenue) | | | 4.50 | | | | 09/01/2017 | | | | 345,000 | | | | 362,643 | |
San Diego CA RDA Tax Allocation Centre City Series A (Tax Revenue, XLCA Insured) | | | 5.00 | | | | 09/01/2014 | | | | 665,000 | | | | 704,993 | |
San Diego CA Redevelopment Agency Tax Allocation Centre City Series A (Tax Revenue, XLCA Insured) | | | 5.25 | | | | 09/01/2015 | | | | 2,215,000 | | | | 2,352,729 | |
San Diego County CA COP (Lease Revenue, AMBAC Insured) | | | 5.63 | | | | 09/01/2012 | | | | 900,000 | | | | 924,471 | |
San Diego County CA Unified School District TRAN Series B2 (Miscellaneous Revenue, GO of Participants Insured) | | | 2.00 | | | | 04/30/2012 | | | | 1,000,000 | | | | 1,005,850 | |
San Francisco CA Airport Improvement United Airlines Incorporated Project (Port Authority Revenue) | | | 8.00 | | | | 07/01/2013 | | | | 265,000 | | | | 283,423 | |
San Francisco CA Building Authority Department of General Services Series A (Lease Revenue) | | | 5.00 | | | | 10/01/2013 | | | | 365,000 | | | | 376,337 | |
San Francisco CA City & County Airports Commission Second Series Issue 30 (Port Authority Revenue, XLCA Insured) | | | 4.00 | | | | 05/01/2014 | | | | 240,000 | | | | 247,397 | |
San Francisco CA City & County RDA CAB Redevelopment Project Series C (Tax Revenue, NATL-RE Insured)(z) | | | 2.58 | | | | 08/01/2013 | | | | 300,000 | | | | 287,979 | |
San Francisco CA City & County RDFA Mission Bay North Redevelopment Series C (Tax Revenue) | | | 4.50 | | | | 08/01/2014 | | | | 125,000 | | | | 128,311 | |
San Francisco CA City & County RDFA Mission Bay North Redevelopment Series C (Tax Revenue) | | | 4.50 | | | | 08/01/2016 | | | | 310,000 | | | | 324,412 | |
San Francisco CA City & County RDFA Mission Bay South Redevelopment Series D (Tax Revenue) | | | 4.00 | | | | 08/01/2012 | | | | 500,000 | | | | 507,785 | |
San Francisco CA City & County RDFA Mission Bay South Redevelopment Series D (Tax Revenue) | | | 5.00 | | | | 08/01/2014 | | | | 500,000 | | | | 526,350 | |
San Francisco CA City & County RDFA San Francisco Redevelopment Project Series B (Tax Revenue, NATL-RE FGIC Insured) | | | 5.25 | | | | 08/01/2018 | | | | 2,000,000 | | | | 2,066,440 | |
San Joaquin County CA Administration Building (Lease Revenue, NATL-RE Insured) | | | 5.00 | | | | 11/15/2014 | | | | 760,000 | | | | 817,585 | |
San Joaquin Hills County CA Transportation Corridor Agency CAB Series A (Transportation Revenue, NATL-RE Insured)(z) | | | 6.28 | | | | 01/15/2015 | | | | 2,000,000 | | | | 1,657,100 | |
San Jose CA Airport Revenue Series A (Port Authority Revenue, AGM-CR AMBAC Insured) | | | 5.50 | | | | 03/01/2019 | | | | 5,220,000 | | | | 5,861,903 | |
San Jose CA Financing Authority Convention Center Project Series F (Lease Revenue, NATL-RE Insured) | | | 5.00 | | | | 09/01/2015 | | | | 1,000,000 | | | | 1,003,210 | |
San Jose CA Libraries & Parks Project (Tax Revenue) | | | 5.00 | | | | 09/01/2017 | | | | 715,000 | | | | 717,595 | |
San Jose CA Redevelopment Agency Series A (Tax Revenue, NATL-RE Insured) | | | 5.00 | | | | 08/01/2017 | | | | 300,000 | | | | 307,902 | |
San Jose CA Redevelopment Agency Series A (Tax Revenue) | | | 6.13 | | | | 08/01/2015 | | | | 550,000 | | | | 588,368 | |
San Luis & Delta Mendota CA Water Authority DHCCP Development Project Series A (Water & Sewer Revenue) | | | 4.50 | | | | 03/01/2014 | | | | 750,000 | | | | 799,568 | |
Santa Ana CA Community Redevelopment Agency Merged Project Area Series A (Tax Revenue) | | | 5.25 | | | | 09/01/2019 | | | | 1,000,000 | | | | 1,095,420 | |
Santa Ana CA Unified School District CAB Election of 2008 Series A (Tax Revenue)(z) | | | 3.91 | | | | 08/01/2020 | | | | 1,815,000 | | | | 1,299,649 | |
Santa Clara CA Redevelopment Agency CAB Bayshore North Project (Tax Revenue)(z) | | | 4.43 | | | | 06/01/2016 | | | | 1,370,000 | | | | 1,127,990 | |
Santa Cruz County CA RDA Live Oak Soquel Community Improvement Series A (Tax Revenue) | | | 4.20 | | | | 09/01/2012 | | | | 120,000 | | | | 121,967 | |
Santa Maria CA Water & Wastewater CAB Sub Series A (Water & Sewer Revenue, AMBAC Insured)(z) | | | 2.75 | | | | 08/01/2014 | | | | 1,420,000 | | | | 1,322,659 | |
Sierra CA Joint Community College District School Facilities Improvement District # 2 CAB Series B (Tax Revenue, NATL-RE Insured)(z) | | | 1.72 | | | | 08/01/2015 | | | | 500,000 | | | | 469,915 | |
Signal Hill CA Redevelopment Project # 1 (Tax Revenue) | | | 4.13 | | | | 10/01/2016 | | | | 550,000 | | | | 574,965 | |
| | | | | | |
| Portfolio of Investments—December 31, 2011 (Unaudited) | | Wells Fargo Advantage California Limited-Term Tax-Free Fund | | | 19 | |
| | | | | | | | | | | | | | | | |
| Security Name | | Interest Rate | | | Maturity Date | | | Principal | | | Value | |
| | | | | | | | | | | | | | | | |
| | | | |
| California (continued) | | | | | | | | | | | | | | | | |
South Gate CA PFA Southgate Redevelopment Project # 1 (Tax Revenue, AMBAC Insured) | | | 5.25 | % | | | 09/01/2019 | | | $ | 1,365,000 | | | $ | 1,392,873 | |
Southern California Public Power Authority Hydroelectric Power Project Series A (Utilities Revenue, AGM Insured) | | | 5.25 | | | | 10/01/2015 | | | | 500,000 | | | | 501,900 | |
Southern California Public Power Authority Magnolia Power Project Series 2009-1-A (Utilities Revenue, KBC Bank NV LOC)±§ | | | 1.05 | | | | 07/01/2036 | | | | 7,500,000 | | | | 7,500,000 | |
Southern California Public Power Authority National Gas Project # 1 Series A (Energy Revenue) | | | 5.00 | | | | 11/01/2012 | | | | 550,000 | | | | 570,471 | |
Torrance CA RDA Referendum Senior Lien Series C (Tax Revenue, NATL-RE Insured) | | | 5.45 | | | | 09/01/2018 | | | | 1,775,000 | | | | 1,776,633 | |
Tracy CA Joint Unified School District Election 2006 (Tax Revenue, AGM Insured) | | | 6.00 | | | | 08/01/2013 | | | | 315,000 | | | | 340,720 | |
Tustin CA Community Redevelopment Project Area (Tax Revenue) | | | 3.00 | | | | 09/01/2012 | | | | 560,000 | | | | 564,351 | |
Union City CA Community Redevelopment Agency Sub Lien (Tax Revenue) | | | 4.00 | | | | 12/01/2015 | | | | 210,000 | | | | 215,607 | |
Union City CA Community Redevelopment Agency Sub Lien (Tax Revenue) | | | 4.38 | | | | 12/01/2016 | | | | 475,000 | | | | 498,465 | |
Union City CA Community Redevelopment Agency Union City Community Redevelopment Project (Tax Revenue, Assured Guaranty Insured) | | | 3.00 | | | | 10/01/2013 | | | | 55,000 | | | | 55,054 | |
University of California Series B (Education Revenue, AMBAC Insured) | | | 5.00 | | | | 05/15/2012 | | | | 725,000 | | | | 738,057 | |
Vallejo City CA Unified School District Series A (Tax Revenue, NATL-RE Insured) | | | 5.00 | | | | 02/01/2013 | | | | 545,000 | | | | 559,001 | |
Vallejo City CA Unified School District Series A (Tax Revenue, NATL-RE Insured) | | | 5.90 | | | | 02/01/2018 | | | | 2,065,000 | | | | 2,272,677 | |
Victor Valley CA Elementary School District School Construction Project (Lease Revenue, NATL-RE Insured) | | | 6.45 | | | | 05/01/2018 | | | | 1,230,000 | | | | 1,324,021 | |
Victor Valley CA Joint Unified School District CAB (Tax Revenue, Assured Guaranty Insured)(z) | | | 1.72 | | | | 08/01/2015 | | | | 280,000 | | | | 263,152 | |
Walnut Valley CA Unified School District Series A (Tax Revenue, NATL-RE Insured) | | | 7.20 | | | | 02/01/2016 | | | | 205,000 | | | | 212,312 | |
Washington CA Unified School District Yolo County COP New High School Project (Lease Revenue, AMBAC Insured) | | | 4.25 | | | | 08/01/2013 | | | | 465,000 | | | | 483,368 | |
Washington Township CA Health Care District (Health Revenue) | | | 5.00 | | | | 07/01/2012 | | | | 1,000,000 | | | | 1,003,030 | |
Washington Township CA Health Care District (Health Revenue) | | | 5.00 | | | | 07/01/2018 | | | | 1,750,000 | | | | 1,752,958 | |
Washington Township CA Health Care District Series A (Health Revenue) | | | 5.00 | | | | 07/01/2013 | | | | 905,000 | | | | 949,128 | |
Washington Township CA Health Care District Series A (Health Revenue) | | | 5.00 | | | | 07/01/2014 | | | | 975,000 | | | | 1,043,591 | |
Washington Township CA Health Care District Series A (Health Revenue) | | | 5.00 | | | | 07/01/2021 | | | | 1,040,000 | | | | 1,111,292 | |
West Contra Costa CA Unified School District (Tax Revenue, AGM Insured) | | | 5.00 | | | | 08/01/2016 | | | | 1,055,000 | | | | 1,204,504 | |
West Contra Costa CA Unified School District Election of 2002 Series C (Tax Revenue, NATL-RE FGIC Insured) | | | 4.25 | | | | 08/01/2017 | | | | 785,000 | | | | 815,717 | |
West Hollywood CA Community Development Department East Side Redevelopment Project Series A (Tax Revenue) | | | 3.25 | | | | 09/01/2013 | | | | 265,000 | | | | 266,839 | |
West Hollywood CA Community Development Department East Side Redevelopment Project Series A (Tax Revenue) | | | 4.00 | | | | 09/01/2014 | | | | 250,000 | | | | 253,023 | |
West Hollywood CA Community Development Department East Side Redevelopment Project Series A (Tax Revenue) | | | 5.00 | | | | 09/01/2015 | | | | 200,000 | | | | 206,960 | |
West Sacramento CA Flood Control Agency (Miscellaneous Revenue) | | | 2.25 | | | | 09/01/2012 | | | | 100,000 | | | | 101,154 | |
West Sacramento CA Flood Control Agency (Miscellaneous Revenue) | | | 2.25 | | | | 09/01/2016 | | | | 265,000 | | | | 269,028 | |
West Sacramento CA Flood Control Agency (Miscellaneous Revenue) | | | 2.25 | | | | 09/01/2017 | | | | 270,000 | | | | 271,172 | |
West Sacramento CA Flood Control Agency (Miscellaneous Revenue) | | | 2.50 | | | | 09/01/2018 | | | | 275,000 | | | | 279,436 | |
West Sacramento CA Flood Control Agency (Miscellaneous Revenue) | | | 2.75 | | | | 09/01/2019 | | | | 285,000 | | | | 292,772 | |
West Sacramento CA Flood Control Agency (Miscellaneous Revenue) | | | 5.00 | | | | 09/01/2020 | | | | 290,000 | | | | 345,935 | |
Westminster CA Redevelopment Agency Commercial Project #1 (Tax Revenue) | | | 2.00 | | | | 11/01/2012 | | | | 2,335,000 | | | | 2,349,103 | |
Whittier CA HCFR Presbyterian Intercommunity Hospital Series D (Health Revenue) | | | 4.00 | | | | 06/01/2013 | | | | 1,000,000 | | | | 1,035,040 | |
| | | | |
| 20 | | Wells Fargo Advantage California Limited-Term Tax-Free Fund | | Portfolio of Investments—December 31, 2011 (Unaudited) |
| | | | | | | | | | | | | | | | |
| Security Name | | Interest Rate | | | Maturity Date | | | Principal | | | Value | |
| | | | | | | | | | | | | | | | |
| | | | |
| California (continued) | | | | | | | | | | | | | | | | |
Whittier CA PFA Greenleaf Avenue Whittier RDA Series A (Lease Revenue) | | | 5.00 | % | | | 11/01/2012 | | | $ | 245,000 | | | $ | 246,754 | |
William S Hart CA Union High School District (Tax Revenue) ±§144A | | | 1.00 | | | | 09/01/2027 | | | | 4,435,000 | | | | 4,435,000 | |
| | | | |
| | | | | | | | | | | | | | | 349,106,992 | |
| | | | | | | | | | | | | | | | |
| | | | |
| Guam: 0.14% | | | | | | | | | | | | | | | | |
Guam Government Limited Obligation Section 30 Series A (Miscellaneous Revenue) | | | 5.00 | | | | 12/01/2012 | | | | 520,000 | | | | 533,385 | |
| | | | | | | | | | | | | | | | |
| | | | |
| Puerto Rico: 5.38% | | | | | | | | | | | | | | | | |
Puerto Rico Commonwealth Public Imports Series A (Tax Revenue, AGM Insured) | | | 5.00 | | | | 07/01/2015 | | | | 1,000,000 | | | | 1,070,880 | |
Puerto Rico Commonwealth Refinance Series C-4 (Tax Revenue, AGM Insured)±§ | | | 2.50 | | | | 07/01/2018 | | | | 4,000,000 | | | | 4,000,000 | |
Puerto Rico Electric Power Authority Series JJ (Utilities Revenue, NATL-RE Insured) | | | 5.25 | | | | 07/01/2013 | | | | 2,000,000 | | | | 2,111,680 | |
Puerto Rico HFA Capital Funding Program (GO-Local, HUD Loan Insured) | | | 5.00 | | | | 12/01/2016 | | | | 1,815,000 | | | | 1,906,930 | |
Puerto Rico HFA Sub-Capital Fund Modernization (Housing Revenue) | | | 5.50 | | | | 12/01/2015 | | | | 1,000,000 | | | | 1,109,940 | |
Puerto Rico HFA Sub-Capital Fund Modernization (Housing Revenue) | | | 5.50 | | | | 12/01/2016 | | | | 3,440,000 | | | | 3,896,970 | |
Puerto Rico HFA Sub-Capital Fund Modernization (Housing Revenue) | | | 5.50 | | | | 12/01/2017 | | | | 1,895,000 | | | | 2,168,051 | |
Puerto Rico HFA Sub-Capital Fund Modernization (Housing Revenue) | | | 5.50 | | | | 12/01/2018 | | | | 1,250,000 | | | | 1,440,213 | |
Puerto Rico HFA Sub-Capital Fund Modernization (Housing Revenue) | | | 5.50 | | | | 12/01/2019 | | | | 1,000,000 | | | | 1,140,650 | |
Puerto Rico Highway & Transportation Authority (Tax Revenue, NATL-RE Insured) | | | 5.25 | | | | 07/01/2014 | | | | 860,000 | | | | 873,020 | |
Puerto Rico Municipal Financing Agency Series C (Tax Revenue, AGM Insured) | | | 5.00 | | | | 08/01/2013 | | | | 1,125,000 | | | | 1,190,160 | |
| | | | |
| | | | | | | | | | | | | | | 20,908,494 | |
| | | | | | | | | | | | | | | | |
| | | | |
| Virgin Islands: 0.91% | | | | | | | | | | | | | | | | |
Virgin Islands PFA Gross Receipts Taxes Loan Notes (Tax Revenue, NATL-RE FGIC Insured) | | | 5.00 | | | | 10/01/2013 | | | | 500,000 | | | | 524,100 | |
Virgin Islands PFA Gross Receipts Taxes Loan Notes (Miscellaneous Revenue, AGM Insured) | | | 5.25 | | | | 10/01/2016 | | | | 1,000,000 | | | | 1,092,360 | |
Virgin Islands Water & Power Authority Series A (Utilities Revenue) | | | 5.00 | | | | 07/01/2018 | | | | 1,750,000 | | | | 1,942,833 | |
| | | | |
| | | | | | | | | | | | | | | 3,559,293 | |
| | | | | | | | | | | | | | | | |
| | | | |
Total Municipal Bonds and Notes (Cost $367,356,432) | | | | | | | | | | | | | | | 374,108,164 | |
| | | | | | | | | | | | | | | | |
| | | | |
| | | Yield | | | | | | | | | | |
| Short-Term Investments: 3.02% | | | | | | | | | | | | | | | | |
| | | | |
| Investment Companies: 3.02% | | | | | | | | | | | | | | | | |
Wells Fargo Advantage California Municipal Money Market Fund, Institutional Class(l)(u) | | | 0.01 | | | | | | | | 11,716,017 | | | | 11,716,017 | |
| | | | | | | | | | | | | | | | |
| | | | |
Total Short-Term Investments (Cost $11,716,017) | | | | | | | | | | | | | | | 11,716,017 | |
| | | | | | | | | | | | | | | | |
| | | | | | | | |
| Total Investments in Securities | | | | | | | | |
| (Cost $379,072,449)* | | | 99.30 | % | | | 385,824,181 | |
Other Assets and Liabilities, Net | | | 0.70 | | | | 2,724,552 | |
| | | | | | | | |
| Total Net Assets | | | 100.00 | % | | $ | 388,548,733 | |
| | | | | | | | |
| | | | | | |
| Portfolio of Investments—December 31, 2011 (Unaudited) | | Wells Fargo Advantage California Limited-Term Tax-Free Fund | | | 21 | |
| (z) | Zero coupon security. Rate represents yield to maturity. |
| ± | Variable rate investment. |
| § | These securities are subject to a demand feature which reduces the effective maturity. |
| (a) | Security is fair valued by the Management Valuation Team, and in certain instances by the Board of Trustees, in accordance with procedures approved by the Board of Trustees. |
| (m) | An auction-rate security whose interest rate resets at predetermined short-term intervals through a Dutch auction; rate shown represents the rate in effect at period-end. |
| (n) | Auction to set interest rate on security failed at period end due to insufficient investor interest; failed auction does not itself cause a default. |
| 144A | Security that may be resold to “qualified institutional buyers” under Rule 144A or security offered pursuant to Section 4(2) of the Securities Act of 1933, as amended. |
| (l) | Investment in an affiliate. |
| (u) | Rate shown is the 7-day annualized yield at period end. |
| * | Cost for federal income tax purposes is $379,112,613 and net unrealized appreciation (depreciation) consists of: |
| | | | |
Gross unrealized appreciation | | $ | 7,191,659 | |
Gross unrealized depreciation | | | (480,091 | ) |
| | | | |
Net unrealized appreciation | | $ | 6,711,568 | |
The accompanying notes are an integral part of these financial statements.
| | | | |
| 22 | | Wells Fargo Advantage California Limited-Term Tax-Free Fund | | Statement of Assets and Liabilities—December 31, 2011 (Unaudited) |
| | | | |
| | | | |
| |
Assets | | | | |
Investments | | | | |
In unaffiliated securities, at value | | $ | 374,108,164 | |
In affiliated securities, at value | | | 11,716,017 | |
| | | | |
Total investments, at value (see cost below) | | | 385,824,181 | |
Receivable for investments sold | | | 234,982 | |
Receivable for Fund shares sold | | | 723,454 | |
Receivable for interest | | | 4,290,681 | |
Prepaid expenses and other assets | | | 3,416 | |
| | | | |
Total assets | | | 391,076,714 | |
| | | | |
| |
Liabilities | | | | |
Dividends payable | | | 445,288 | |
Payable for investments purchased | | | 1,092,870 | |
Payable for Fund shares redeemed | | | 726,104 | |
Advisory fee payable | | | 85,913 | |
Distribution fees payable | | | 20,553 | |
Due to other related parties | | | 60,396 | |
Accrued expenses and other liabilities | | | 96,857 | |
| | | | |
Total liabilities | | | 2,527,981 | |
| | | | |
Total net assets | | $ | 388,548,733 | |
| | | | |
| |
NET ASSETS CONSIST OF | | | | |
Paid-in capital | | $ | 383,158,009 | |
Undistributed net investment income | | | 149,568 | |
Accumulated net realized losses on investments | | | (1,510,576 | ) |
Net unrealized gains on investments | | | 6,751,732 | |
| | | | |
Total net assets | | $ | 388,548,733 | |
| | | | |
| |
COMPUTATION OF NET ASSET VALUE AND OFFERING PRICE PER SHARE1 | | | | |
Net assets – Class A | | $ | 132,420,197 | |
Shares outstanding – Class A | | | 12,468,817 | |
Net asset value per share – Class A | | | $10.62 | |
Maximum offering price per share – Class A2 | | | $10.95 | |
Net assets – Class C | | $ | 30,494,352 | |
Shares outstanding – Class C | | | 2,871,735 | |
Net asset value per share – Class C | | | $10.62 | |
Net assets – Administrator Class | | $ | 225,634,184 | |
Shares outstanding – Administrator Class | | | 21,580,736 | |
Net asset value per share – Administrator Class | | | $10.46 | |
| |
Total investments, at cost | | $ | 379,072,449 | |
| | | | |
| 1. | The Fund has an unlimited number of authorized shares. |
| 2. | Maximum offering price is computed as 100/97.00 of net asset value. On investments of $50,000 or more, the offering price is reduced. |
The accompanying notes are an integral part of these financial statements.
| | | | | | |
| Statement of Operations—Six Month Ended December 31, 2011 (Unaudited) | | Wells Fargo Advantage California Limited-Term Tax-Free Fund | | | 23 | |
| | | | |
| | | | |
| |
Investment income | | | | |
Interest | | $ | 6,658,565 | |
Income from affiliated securities | | | 385 | |
| | | | |
Total investment income | | | 6,658,950 | |
| | | | |
| |
Expenses | | | | |
Advisory fee | | | 659,075 | |
Administration fees | | | | |
Fund level | | | 94,154 | |
Class A | | | 102,831 | |
Class C | | | 23,745 | |
Administrator Class | | | 109,197 | |
Shareholder servicing fees | | | | |
Class A | | | 160,673 | |
Class C | | | 37,101 | |
Administrator Class | | | 250,044 | |
Distribution fees | | | | |
Class C | | | 111,304 | |
Custody and accounting fees | | | 14,024 | |
Professional fees | | | 16,755 | |
Registration fees | | | 13,126 | |
Shareholder report expenses | | | 8,630 | |
Trustees’ fees and expenses | | | 6,067 | |
Other fees and expenses | | | 3,717 | |
| | | | |
Total expenses | | | 1,610,443 | |
Less: Fee waivers and/or expense reimbursements | | | (211,076 | ) |
| | | | |
Net expenses | | | 1,399,367 | |
| | | | |
Net investment income | | | 5,259,583 | |
| | | | |
| |
REALIZED AND UNREALIZED GAINS (LOSSES) ON INVESTMENTS | | | | |
Net realized gains on investments | | | 103,123 | |
Net change in unrealized gains (losses) on investments | | | 3,852,747 | |
| | | | |
Net realized and unrealized gains (losses) on investments | | | 3,955,870 | |
| | | | |
Net increase in net assets resulting from operations | | $ | 9,215,453 | |
| | | | |
The accompanying notes are an integral part of these financial statements.
| | | | |
| 24 | | Wells Fargo Advantage California Limited-Term Tax-Free Fund | | Statements of Changes in Net Assets |
| | | | | | | | | | | | | | | | |
| | | Six Months Ended
December 31, 2011
(Unaudited) | | | Year Ended
June 30, 2011 | |
| | | | |
Operations | | | | | | | | | | | | | | | | |
Net investment income | | | | | | $ | 5,259,583 | | | | | | | $ | 9,095,789 | |
Net realized gains (losses) on investments | | | | | | | 103,123 | | | | | | | | (291,436 | ) |
Net change in unrealized gains (losses) on investments | | | | | | | 3,852,747 | | | | | | | | (560,245 | ) |
| | | | | | | | | | | | | | | | |
Net increase in net assets resulting from operations | | | | | | | 9,215,453 | | | | | | | | 8,244,108 | |
| | | | | | | | | | | | | | | | |
| | | | |
Distributions to shareholders from | | | | | | | | | | | | | | | | |
Net investment income | | | | | | | | | | | | | | | | |
Class A | | | | | | | (1,757,047 | ) | | | | | | | (3,398,590 | ) |
Class C | | | | | | | (294,105 | ) | | | | | | | (547,570 | ) |
Administrator Class | | | | | | | (3,207,891 | ) | | | | | | | (5,148,662 | ) |
| | | | | | | | | | | | | | | | |
Total distributions to shareholders | | | | | | | (5,259,043 | ) | | | | | | | (9,094,822 | ) |
| | | | | | | | | | | | | | | | |
| | | | |
Capital share transactions | | | Shares | | | | | | | | Shares | | | | | |
Proceeds from shares sold | | | | | | | | | | | | | | | | |
Class A | | | 1,694,906 | | | | 17,925,934 | | | | 6,502,606 | | | | 68,496,518 | |
Class C | | | 521,488 | | | | 5,509,895 | | | | 774,056 | | | | 8,141,155 | |
Administrator Class | | | 4,612,038 | | | | 48,013,426 | | | | 16,362,453 | | | | 169,142,919 | |
| | | | | | | | | | | | | | | | |
| | | | | | | 71,449,255 | | | | | | | | 245,780,592 | |
| | | | | | | | | | | | | | | | |
Reinvestment of distributions | | | | | | | | | | | | | | | | |
Class A | | | 114,278 | | | | 1,208,748 | | | | 212,684 | | | | 2,229,236 | |
Class C | | | 20,219 | | | | 213,822 | | | | 38,961 | | | | 408,456 | |
Administrator Class | | | 139,050 | | | | 1,448,243 | | | | 128,785 | | | | 1,328,495 | |
| | | | | | | | | | | | | | | | |
| | | | | | | 2,870,813 | | | | | | | | 3,966,187 | |
| | | | | | | | | | | | | | | | |
Payment for shares redeemed | | | | | | | | | | | | | | | | |
Class A | | | (1,385,727 | ) | | | (14,636,979 | ) | | | (5,757,005 | ) | | | (60,259,685 | ) |
Class C | | | (343,501 | ) | | | (3,632,588 | ) | | | (945,414 | ) | | | (9,892,108 | ) |
Administrator Class | | | (3,450,719 | ) | | | (35,911,239 | ) | | | (14,008,624 | ) | | | (144,615,695 | ) |
| | | | | | | | | | | | | | | | |
| | | | | | | (54,180,806 | ) | | | | | | | (214,767,488 | ) |
| | | | | | | | | | | | | | | | |
Net increase in net assets resulting
from capital share transactions | | | | | | | 20,139,262 | | | | | | | | 34,979,291 | |
| | | | | | | | | | | | | | | | |
Total increase in net assets | | | | | | | 24,095,672 | | | | | | | | 34,128,577 | |
| | | | | | | | | | | | | | | | |
| | | | |
Net assets | | | | | | | | | | | | | | | | |
Beginning of period | | | | | | | 364,453,061 | | | | | | | | 330,324,484 | |
| | | | | | | | | | | | | | | | |
End of period | | | | | | $ | 388,548,733 | | | | | | | $ | 364,453,061 | |
| | | | | | | | | | | | | | | | |
Undistributed net investment income | | | | | | $ | 149,568 | | | | | | | $ | 149,028 | |
| | | | | | | | | | | | | | | | |
The accompanying notes are an integral part of these financial statements.
| | | | | | |
| Financial Highlights | | Wells Fargo Advantage California Limited-Term Tax-Free Fund | | | 25 | |
(For a share outstanding throughout each period)
| | | | | | | | | | | | | | | | | | | | | | | | |
| | | Six Months Ended
December 31, 2011 (Unaudited) | | | Year Ended June 30, | |
| Class A | | | 2011 | | | 2010 | | | 2009 | | | 2008 | | | 2007 | |
Net asset value, beginning of period | | $ | 10.51 | | | $ | 10.51 | | | $ | 10.29 | | | $ | 10.30 | | | $ | 10.36 | | | $ | 10.34 | |
Net investment income | | | 0.15 | | | | 0.27 | | | | 0.28 | | | | 0.39 | | | | 0.38 | | | | 0.36 | |
Net realized and unrealized gains (losses) on investments | | | 0.11 | | | | 0.00 | | | | 0.23 | | | | (0.01 | ) | | | (0.06 | ) | | | 0.02 | |
| | | | | | | | | | | | | | | | | | | | | | | | |
Total from investment operations | | | 0.26 | | | | 0.27 | | | | 0.51 | | | | 0.38 | | | | 0.32 | | | | 0.38 | |
Distributions to shareholders from | | | | | | | | | | | | | | | | | | | | | | | | |
Net investment income | | | (0.15 | ) | | | (0.27 | ) | | | (0.29 | ) | | | (0.39 | ) | | | (0.38 | ) | | | (0.36 | ) |
Net asset value, end of period | | $ | 10.62 | | | $ | 10.51 | | | $ | 10.51 | | | $ | 10.29 | | | $ | 10.30 | | | $ | 10.36 | |
Total return1 | | | 2.44 | % | | | 2.52 | % | | | 5.14 | % | | | 3.77 | % | | | 3.09 | % | | | 3.74 | % |
Ratios to average net assets (annualized) | | | | | | | | | | | | | | | | | | | | | | | | |
Gross expenses | | | 0.84 | % | | | 0.84 | % | | | 0.85 | % | | | 0.95 | % | | | 1.09 | % | | | 1.09 | % |
Net expenses | | | 0.80 | % | | | 0.80 | % | | | 0.85 | % | | | 0.85 | % | | | 0.85 | % | | | 0.85 | % |
Net investment income | | | 2.73 | % | | | 2.58 | % | | | 2.67 | % | | | 3.82 | % | | | 3.63 | % | | | 3.50 | % |
Supplemental data | | | | | | | | | | | | | | | | | | | | | | | | |
Portfolio turnover rate | | | 27 | % | | | 54 | % | | | 34 | % | | | 64 | % | | | 69 | % | | | 80 | % |
Net assets, end of period (000’s omitted) | | | $132,420 | | | | $126,570 | | | | $116,578 | | | | $46,372 | | | | $37,376 | | | | $41,140 | |
| 1. | Total return calculations do not include any sales charges. Returns for periods of less than one year are not annualized. |
The accompanying notes are an integral part of these financial statements.
| | | | |
| 26 | | Wells Fargo Advantage California Limited-Term Tax-Free Fund | | Financial Highlights |
(For a share outstanding throughout each period)
| | | | | | | | | | | | | | | | | | | | | | | | |
| | | Six Months Ended
December 31, 2011 (Unaudited) | | | Year Ended June 30, | |
| Class C | | | 2011 | | | 2010 | | | 2009 | | | 2008 | | | 2007 | |
Net asset value, beginning of period | | $ | 10.51 | | | $ | 10.51 | | | $ | 10.29 | | | $ | 10.30 | | | $ | 10.36 | | | $ | 10.34 | |
Net investment income | | | 0.11 | | | | 0.19 | | | | 0.19 | | | | 0.30 | | | | 0.31 | | | | 0.30 | |
Net realized and unrealized gains (losses) on investments | | | 0.11 | | | | 0.00 | | | | 0.24 | | | | 0.00 | | | | (0.07 | ) | | | 0.01 | |
| | | | | | | | | | | | | | | | | | | | | | | | |
Total from investment operations | | | 0.22 | | | | 0.19 | | | | 0.43 | | | | 0.30 | | | | 0.24 | | | | 0.31 | |
Distributions to shareholders from | | | | | | | | | | | | | | | | | | | | | | | | |
Net investment income | | | (0.11 | ) | | | (0.19 | ) | | | (0.21 | ) | | | (0.31 | ) | | | (0.30 | ) | | | (0.29 | ) |
Net asset value, end of period | | $ | 10.62 | | | $ | 10.51 | | | $ | 10.51 | | | $ | 10.29 | | | $ | 10.30 | | | $ | 10.36 | |
Total return1 | | | 2.06 | % | | | 1.85 | % | | | 4.25 | % | | | 2.99 | % | | | 2.32 | % | | | 2.97 | % |
Ratios to average net assets (annualized) | | | | | | | | | | | | | | | | | | | | | | | | |
Gross expenses | | | 1.59 | % | | | 1.60 | % | | | 1.61 | % | | | 1.69 | % | | | 1.83 | % | | | 1.84 | % |
Net expenses | | | 1.55 | % | | | 1.55 | % | | | 1.60 | % | | | 1.60 | % | | | 1.60 | % | | | 1.60 | % |
Net investment income | | | 1.98 | % | | | 1.82 | % | | | 1.85 | % | | | 3.07 | % | | | 2.88 | % | | | 2.75 | % |
Supplemental data | | | | | | | | | | | | | | | | | | | | | | | | |
Portfolio turnover rate | | | 27 | % | | | 54 | % | | | 34 | % | | | 64 | % | | | 69 | % | | | 80 | % |
Net assets, end of period (000’s omitted) | | | $30,494 | | | | $28,089 | | | | $29,501 | | | | $6,014 | | | | $4,632 | | | | $5,006 | |
| 1. | Total return calculations do not include any sales charges. Returns for periods of less than one year are not annualized. |
The accompanying notes are an integral part of these financial statements.
| | | | | | |
| Financial Highlights | | Wells Fargo Advantage California Limited-Term Tax-Free Fund | | | 27 | |
(For a share outstanding throughout each period)
| | | | | | | | | | | | | | | | | | | | | | | | |
| | | Six Months Ended
December 31, 2011 (Unaudited) | | | Year Ended June 30, | |
| Administrator Class | | | 2011 | | | 2010 | | | 2009 | | | 2008 | | | 2007 | |
Net asset value, beginning of period | | $ | 10.34 | | | $ | 10.35 | | | $ | 10.13 | | | $ | 10.14 | | | $ | 10.20 | | | $ | 10.18 | |
Net investment income | | | 0.15 | | | | 0.29 | | | | 0.30 | | | | 0.41 | | | | 0.39 | | | | 0.38 | |
Net realized and unrealized gains (losses) on investments | | | 0.12 | | | | (0.01 | ) | | | 0.23 | | | | (0.01 | ) | | | (0.05 | ) | | | 0.02 | |
| | | | | | | | | | | | | | | | | | | | | | | | |
Total from investment operations | | | 0.27 | | | | 0.28 | | | | 0.53 | | | | 0.40 | | | | 0.34 | | | | 0.40 | |
Distributions to shareholders from | | | | | | | | | | | | | | | | | | | | | | | | |
Net investment income | | | (0.15 | ) | | | (0.29 | ) | | | (0.31 | ) | | | (0.41 | ) | | | (0.40 | ) | | | (0.38 | ) |
Net asset value, end of period | | $ | 10.46 | | | $ | 10.34 | | | $ | 10.35 | | | $ | 10.13 | | | $ | 10.14 | | | $ | 10.20 | |
Total return1 | | | 2.66 | % | | | 2.72 | % | | | 5.34 | % | | | 4.03 | % | | | 3.34 | % | | | 4.00 | % |
Ratios to average net assets (annualized) | | | | | | | | | | | | | | | | | | | | | | | | |
Gross expenses | | | 0.76 | % | | | 0.79 | % | | | 0.79 | % | | | 0.87 | % | | | 0.91 | % | | | 0.91 | % |
Net expenses | | | 0.60 | % | | | 0.60 | % | | | 0.60 | % | | | 0.60 | % | | | 0.60 | % | | | 0.60 | % |
Net investment income | | | 2.94 | % | | | 2.77 | % | | | 2.91 | % | | | 4.08 | % | | | 3.85 | % | | | 3.74 | % |
Supplemental data | | | | | | | | | | | | | | | | | | | | | | | | |
Portfolio turnover rate | | | 27 | % | | | 54 | % | | | 34 | % | | | 64 | % | | | 69 | % | | | 80 | % |
Net assets, end of period (000’s omitted) | | | $225,634 | | | | $209,794 | | | | $184,246 | | | | $60,259 | | | | $43,800 | | | | $24,600 | |
| 1. | Returns for periods of less than one year are not annualized. |
The accompanying notes are an integral part of these financial statements.
| | | | |
| 28 | | Wells Fargo Advantage California Limited-Term Tax-Free Fund | | Notes to Financial Statements (Unaudited) |
1. ORGANIZATION
Wells Fargo Funds Trust (the “Trust”), a Delaware statutory trust organized on March 10, 1999, is an open-end management investment company registered under the Investment Company Act of 1940, as amended (the “1940 Act”). These financial statements report on Wells Fargo Advantage California Limited-Term Tax-Free Fund (the “Fund”) which is a non-diversified series of the Trust.
2. SIGNIFICANT ACCOUNTING POLICIES
The following significant accounting policies, which are consistently followed in the preparation of the financial statements of the Fund, are in conformity with U.S. generally accepted accounting principles which require management to make estimates and assumptions that affect the reported amounts of assets and liabilities, disclosure of contingent assets and liabilities at the date of the financial statements, and the reported amounts of revenues and expenses during the reporting period. Actual results could differ from those estimates.
Securities valuation
Fixed income securities with maturities exceeding 60 days are valued based on available evaluated prices received from an independent pricing service approved by the Board of Trustees which may utilize both transaction data and market information such as yield, prices of securities of comparable quality, coupon rate, maturity, type of issue, trading characteristics and other market data. If valuations are not available from the pricing service or values received are deemed not representative of market value, values will be obtained from a third party broker-dealer or determined based on the Fund’s Fair Value Procedures.
Debt securities of sufficient credit quality with original maturities of 60 days or less generally are valued at amortized cost which approximates fair value. The amortized cost method involves valuing a security at its cost, plus accretion of discount or minus amortization of premium over the period until maturity.
Investments in open-end mutual funds and non-registered investment companies are generally valued at net asset value.
Investments which are not valued using any of the methods discussed above, are valued at their fair value, as determined by procedures established in good faith and approved by the Board of Trustees.
When-issued transactions
The Fund may purchase securities on a forward commitment or ‘when-issued’ basis. The Fund records a when-issued transaction on the trade date and will segregate assets to cover its obligation by confirming the availability of qualifying assets having a value sufficient to make payment for the securities purchased. Securities purchased on a when-issued basis are marked-to-market daily and the Fund begins earning interest on the settlement date. Losses may arise due to changes in the market value of the underlying securities or if the counterparty does not perform under the contract.
Security transactions and income recognition
Securities transactions are recorded on a trade date basis. Realized gains or losses are reported on the basis of identified cost of securities delivered.
Interest income is accrued daily and bond discounts are accreted and premiums are amortized daily based on the effective interest method. To the extent debt obligations are placed on non-accrual status, any related interest income may be reduced by writing off interest receivables when the collection of all or a portion of interest has become doubtful based on consistently applied procedures. If the issuer subsequently resumes interest payments or when the collectability of interest is reasonably assured, the debt obligation is removed from non-accrual status.
Distributions to shareholders
Distributions to shareholders from net investment income are accrued daily and paid monthly. Distributions from net realized gains, if any, are recorded on the ex-dividend date. Such distributions are determined in conformity with income tax regulations, which may differ from generally accepted accounting principles.
Federal and other taxes
The Fund intends to continue to qualify as a regulated investment company by distributing substantially all of its investment company taxable and tax-exempt income and any net realized capital gains (after reduction for capital loss carryforwards) sufficient to relieve it from all, or substantially all, federal income taxes. Accordingly, no provision for federal income taxes was required.
| | | | | | |
| Notes to Financial Statements (Unaudited) | | Wells Fargo Advantage California Limited-Term Tax-Free Fund | | | 29 | |
The Fund’s income and federal excise tax returns and all financial records supporting those returns for the prior three fiscal years are subject to examination by the federal and Delaware revenue authorities.
Under the recently enacted Regulated Investment Company Modernization Act of 2010, the Fund is permitted to carry forward capital losses incurred in taxable years which began after December 22, 2010 for an unlimited period. However, any losses incurred are required to be utilized prior to the losses incurred in pre-enactment taxable years. As a result of this ordering rule, pre-enactment capital loss carryforwards may be more likely to expire unused. Additionally, post-enactment capital losses that are carried forward will retain their character as either short-term or long-term capital losses rather than being considered all short-term as under previous law.
At June 30, 2011, net capital loss carryforwards, which were available to offset future net realized capital gains, were as follows:
| | | | | | | | | | | | | | |
| Expiration | |
| 2015 | | | 2016 | | | 2018 | | | 2019 | |
| $ | 251,711 | | | $ | 11,320 | | | $ | 1,059,767 | | | $ | 110,356 | |
As of June 30, 2011, the Fund had $146,396 of current year deferred post-October capital losses, which would be treated as realized for tax purposes on the first day of the succeeding year.
Class allocations
The separate classes of shares offered by the Fund differ principally in applicable sales charges, distribution, shareholder servicing and administration fees. Shareholders of each class bear certain expenses that pertain to that particular class. All shareholders bear the common expenses of the Fund, earn income from the portfolio, and are allocated unrealized gains and losses pro rata based on the average daily net assets of each class, without distinction between share classes. Dividends are determined separately for each class based on income and expenses allocable to each class. Realized gains and losses are allocated to each class pro rata based upon the net assets of each class on the date realized. Differences in per share dividend rates generally result from the relative weightings of pro rata income and realized gain allocations and from differences in separate class expenses, including distribution, shareholder servicing and administration fees.
3. FAIR VALUATION MEASUREMENTS
Fair value measurements of investments are determined within a framework that has established a fair value hierarchy based upon the various data inputs utilized in determining the value of the Fund’s investments. The three-level hierarchy gives the highest priority to unadjusted quoted prices in active markets for identical assets or liabilities (Level 1) and the lowest priority to significant unobservable inputs (Level 3). The Fund’s investments are classified within the fair value hierarchy based on the lowest level of input that is significant to the fair value measurement. The inputs are summarized into three broad levels as follows:
| n | | Level 1 – quoted prices in active markets for identical securities |
| n | | Level 2 – other significant observable inputs (including quoted prices for similar securities, interest rates, prepayment speeds, credit risk, etc.) |
| n | | Level 3 – significant unobservable inputs (including the Fund’s own assumptions in determining the fair value of investments) |
The inputs or methodologies used for valuing securities are not necessarily an indication of the risk associated with investing in those securities.
As of December 31, 2011, the inputs used in valuing the Fund’s assets, which are carried at fair value, were as follows:
| | | | | | | | | | | | | | | | |
| Investments in Securities | | Quoted Prices (Level 1) | | | Significant Other
Observable Inputs (Level 2) | | | Significant Unobservable Inputs (Level 3) | | | Total | |
Municipal bonds and notes | | $ | 0 | | | $ | 373,922,072 | | | $ | 186,092 | | | $ | 374,108,164 | |
Short-term investments | | | | | | | | | | | | | | | | |
Investment companies | | | 11,716,017 | | | | 0 | | | | 0 | | | | 11,716,017 | |
| | | $ | 11,716,017 | | | $ | 373,922,072 | | | $ | 186,092 | | | $ | 385,824,181 | |
| | | | |
| 30 | | Wells Fargo Advantage California Limited-Term Tax-Free Fund | | Notes to Financial Statements (Unaudited) |
Further details on the major security types listed above can be found in the Portfolio of Investments.
Transfers in and transfers out are recognized at the end of the reporting period. For the six months ended December 31, 2011, the Fund did not have any significant transfers into/out of Level 1 and Level 2.
The following is a reconciliation of assets in which significant unobservable inputs (Level 3) were used in determining fair value:
| | | | |
| | | Municipal
bonds and
notes | |
Balance as of June 30, 2011 | | $ | 190,905 | |
Accrued discounts (premiums) | | | 0 | |
Realized gains (losses) | | | 0 | |
Change in unrealized gains (losses) | | | (4,813 | ) |
Purchases | | | 0 | |
Sales | | | 0 | |
Transfers into Level 3 | | | 0 | |
Transfers out of Level 3 | | | 0 | |
Balance as of December 31, 2011 | | $ | 186,092 | |
Change in unrealized gains (losses)
relating to securities still held at December 31, 2011 | | $ | (4,813 | ) |
4. TRANSACTIONS WITH AFFILIATES AND OTHER EXPENSES
Advisory fee
The Trust has entered into an advisory contract with Wells Fargo Funds Management, LLC (“Funds Management”), an indirect wholly owned subsidiary of Wells Fargo & Company (“Wells Fargo”). The adviser is responsible for implementing investment policies and guidelines and for supervising the sub-adviser, who is responsible for day-to-day portfolio management of the Fund.
Pursuant to the contract, Funds Management is entitled to receive an annual advisory fee starting at 0.35% and declining to 0.25% as the average daily net assets of the Fund increase. For the six months ended December 31, 2011, the advisory fee was equivalent to an annual rate of 0.35% of the Fund’s average daily net assets.
Funds Management may retain the services of certain sub-advisers to provide daily portfolio management to the Fund. The fees related to sub-advisory services are borne directly by Funds Management and do not increase the overall fees paid by the Fund. Wells Capital Management Incorporated, an affiliate of Funds Management, is the sub-adviser to the Fund and is entitled to receive a fee from Funds Management at an annual rate starting at 0.15% and declining to 0.05% as the average daily net assets of the Fund increase.
Administration and transfer agent fees
The Trust has entered into an administration agreement with Funds Management. Under this agreement, for providing administrative services, which includes paying fees and expenses for services provided by the transfer agent, sub-transfer agents, omnibus account servicers and record-keepers, Funds Management is entitled to receive from the Fund an annual fund level administration fee starting at 0.05% and declining to 0.03% as the average daily net assets of the Fund increase and a class level administration fee which is calculated based on the average daily net assets of each class as follows:
| | | | |
| | | Class Level Administration Fee | |
Class A, Class C | | | 0.16 | % |
Administrator Class | | | 0.10 | |
Funds Management has contractually waived and/or reimbursed advisory and administration fees to the extent necessary to maintain certain net operating expense ratios for the Fund. Waiver of fees and/or reimbursement of expenses by Funds Management were made first from fund level expenses on a proportionate basis and then from class specific expenses.
| | | | | | |
| Notes to Financial Statements (Unaudited) | | Wells Fargo Advantage California Limited-Term Tax-Free Fund | | | 31 | |
Distribution fees
The Trust has adopted a Distribution Plan for Class C shares of the Fund pursuant to Rule 12b-1 under the 1940 Act. Distribution fees are charged to Class C shares and paid to Wells Fargo Funds Distributor, LLC, the principal underwriter, at an annual rate of 0.75% of the average daily net assets of Class C shares.
For the six months ended December 31, 2011, Wells Fargo Funds Distributor, LLC received $5,304 from the sale of Class A shares and $3,528 and $2,779 in contingent deferred sales charges from redemptions of Class A and Class C shares, respectively.
Shareholder servicing fees
The Trust has entered into contracts with one or more shareholder servicing agents, whereby Class A, Class C and Administrator Class of the Fund is charged a fee at an annual rate of 0.25% of the average daily net assets of each respective class.
A portion of these total shareholder servicing fees were paid to affiliates of Wells Fargo.
5. INVESTMENT PORTFOLIO TRANSACTIONS
Purchases and sales of investments, excluding U.S. Government obligations (if any) and short-term securities (securities with maturities of one year or less at purchase date), for the six months ended December 31, 2011 were $110,954,965 and $98,447,837, respectively.
6. BANK BORROWINGS
The Trust (excluding the money market funds) and Wells Fargo Variable Trust are parties to a $150,000,000 revolving credit agreement with State Street Bank and Trust Company, whereby the Fund is permitted to use bank borrowings for temporary or emergency purposes, such as to fund shareholder redemption requests. Interest under the credit agreement is charged to the Fund based on a borrowing rate equal to the higher of the Federal Funds rate in effect on that day plus 1.25% or the overnight LIBOR rate in effect on that day plus 1.25%. In addition, under the credit agreement, the Fund pays an annual commitment fee equal to 0.10% of the unused balance, which is allocated pro rata. Prior to September 6, 2011, the revolving credit agreement was for $125,000,000 and the annual commitment fee paid by the Fund was 0.125% of the unused balance. For the six months ended December 31, 2011, the Fund paid $255 in commitment fees.
For the six months ended December 31, 2011, there were no borrowings by the Fund under the agreement.
7. CONCENTRATION RISK
The Fund invests a substantial portion of its assets in issuers of municipal debt securities located in a single state, therefore, it may be more affected by economic and political developments in that state or region than would be a comparable general tax-exempt mutual fund.
8. INDEMNIFICATION
Under the Trust’s organizational documents, the officers and directors are indemnified against certain liabilities that may arise out of performance of their duties to the Trust. Additionally, in the normal course of business, the Trust may enter into contracts with service providers that contain a variety of indemnification clauses. The Trust’s maximum exposure under these arrangements is dependent on future claims that may be made against the Fund and, therefore, cannot be estimated.
9. NEW ACCOUNTING PRONOUNCEMENTS
In May 2011, the Financial Accounting Standards Board (“FASB”) issued Accounting Standards Update (“ASU”) No. 2011-04 “Amendments to Achieve Common Fair Value Measurement and Disclosure Requirements in U.S. GAAP and IFRSs”. ASU No. 2011-04 amends FASB ASC Topic 820, Fair Value Measurements and Disclosures, to establish common requirements for measuring fair value and for disclosing information about fair value measurements in accordance with GAAP. The ASU is effective prospectively for interim and annual periods beginning after December 15, 2011. Management expects that adoption of the ASU will result in additional disclosures in the financial statements, as applicable.
| | | | |
| 32 | | Wells Fargo Advantage California Limited-Term Tax-Free Fund | | Notes to Financial Statements (Unaudited) |
In April 2011, FASB issued ASU No. 2011-03 “Reconsideration of Effective Control for Repurchase Agreements”. ASU No. 2011-03 amends FASB ASC Topic 860, Transfers and Servicing, specifically the criteria required to determine whether a repurchase agreement (repo) and similar agreements should be accounted for as sales of financial assets or secured borrowings with commitments. ASU No. 2011-03 changes the assessment of effective control by focusing on the transferor’s contractual rights and obligations and removing the criterion to assess its ability to exercise those rights or honor those obligations. This could result in changes to the way entities account for certain transactions including repurchase agreements, mortgage dollar rolls and reverse repurchase agreements. The ASU will become effective on a prospective basis for new transfers and modifications to existing transactions as of the beginning of the first interim or annual period beginning on or after December 15, 2011. Management has evaluated the impact of adopting the ASU and expects no significant changes.
| | | | | | |
| Other Information (Unaudited) | | Wells Fargo Advantage California Limited-Term Tax-Free Fund | | | 33 | |
PROXY VOTING INFORMATION
A description of the policies and procedures that the Fund uses to determine how to vote proxies relating to portfolio securities is available without charge, upon request, by calling 1-800-222-8222, visiting our Web site at www.wellsfargo.com/advantagefunds, or visiting the SEC Web site at www.sec.gov. Information regarding how the Fund voted proxies relating to portfolio securities during the most recent 12-month period ended June 30 is available without charge on the Fund’s Web site at www.wellsfargo.com/advantagefunds or by visiting the SEC Web site at www.sec.gov.
PORTFOLIO HOLDINGS INFORMATION
The complete portfolio holdings for the Fund are publicly available on the Fund’s Web site (www.wellsfargo.com/advantagefunds) on a monthly, 30-day or more delayed basis. In addition, top ten holdings information for the Fund is publicly available on the Fund’s Web site on a monthly, seven-day or more delayed basis. The Fund files its complete schedule of portfolio holdings with the SEC for the first and third quarters of each fiscal year on Form N-Q, which is available without charge by visiting the SEC Web site at www.sec.gov. In addition, the Fund’s Form N-Q may be reviewed and copied at the SEC’s Public Reference Room in Washington, DC, and at regional offices in New York City, at 233 Broadway, and in Chicago, at 175 West Jackson Boulevard, Suite 900. Information about the Public Reference Room may be obtained by calling 1-800-SEC-0330.
| | | | |
| 34 | | Wells Fargo Advantage California Limited-Term Tax-Free Fund | | Other Information (Unaudited) |
BOARD OF TRUSTEES
The following table provides basic information about the Board of Trustees (the “Trustees”) of the Trust and Officers of the Trust. This table should be read in conjunction with the Prospectus and the Statement of Additional Information1 of the Fund. Each of the Trustees and Officers listed below acts in identical capacities for the Wells Fargo Advantage family of funds, which consists of 138 funds comprising the Wells Fargo Funds Trust, Wells Fargo Variable Trust, Wells Fargo Master Trust and four closed-end funds (collectively the “Fund Complex”). All of the Trustees are also Members of the Audit and Governance Committees of each Trust in the Fund Complex. The mailing address of each Trustee and Officer is 525 Market Street, 12th Floor, San Francisco, CA 94105. Each Trustee and Officer serves an indefinite term, however, each Trustee serves such term until reaching the mandatory retirement age established by the Trustees.
Independent Trustees
| | | | | | |
Name and Year of Birth | | Position Held and Length of Service | | Principal Occupations During Past Five Years | | Other Directorships During
Past Five Years |
Peter G. Gordon
(Born 1942) | | Trustee, since 1998; Chairman, since 2005 (Lead Trustee since 2001) | | Co-Founder, Retired Chairman, President and CEO of Crystal Geyser Water Company. Trustee Emeritus, Colby College | | Asset Allocation Trust |
Isaiah Harris, Jr.
(Born 1952) | | Trustee, since 2009 | | Retired. Prior thereto, President and CEO of BellSouth Advertising and Publishing Corp. from 2005 to 2007, President and CEO of BellSouth Enterprises from 2004 to 2005 and President of BellSouth Consumer Services from 2000 to 2003. Emeritus member of the Iowa State University Foundation Board of Governors. Emeritus Member of the Advisory Board of Iowa State University School of Business. Mr. Harris is a certified public accountant. | | CIGNA Corporation; Deluxe Corporation; Asset Allocation Trust |
Judith M. Johnson
(Born 1949) | | Trustee, since 2008 | | Retired. Prior thereto, Chief Executive Officer and Chief Investment Officer of Minneapolis Employees Retirement Fund from 1996 to 2008. Ms. Johnson is an attorney, certified public accountant and a certified managerial accountant. | | Asset Allocation Trust |
Leroy Keith, Jr.
(Born 1939) | | Trustee, since 2010 | | Chairman, Bloc Global Services (development and construction). Trustee of the Evergreen Funds from 1983 to 2010. Former Managing Director, Almanac Capital Management (commodities firm), former Partner, Stonington Partners, Inc. (private equity fund), former Director, Obagi Medical Products Co. and former Director, Lincoln Educational Services. | | Trustee, Virtus Fund Complex (consisting of 40 portfolios as of 12/31/11); Asset Allocation Trust |
David F. Larcker
(Born 1950) | | Trustee, since 2009 | | James Irvin Miller Professor of Accounting at the Graduate School of Business, Stanford University, Director of Corporate Governance Research Program and Senior Faculty of The Rock Center for Corporate Governance since 2006. From 2005 to 2008, Professor of Accounting at the Graduate School of Business, Stanford University. Prior thereto, Ernst & Young Professor of Accounting at The Wharton School, University of Pennsylvania from 1985 to 2005. | | Asset Allocation Trust |
Olivia S. Mitchell
(Born 1953) | | Trustee, since 2006 | | International Foundation of Employee Benefit Plans Professor, Wharton School of the University of Pennsylvania since 1993. Director of Wharton’s Pension Research Council and Boettner Center on Pensions & Retirement Research, and Research Associate at the National Bureau of Economic Research. Previously, Cornell University Professor from 1978 to 1993. | | Asset Allocation Trust |
| | | | | | |
| Other Information (Unaudited) | | Wells Fargo Advantage California Limited-Term Tax-Free Fund | | | 35 | |
| | | | | | |
Name and Year of Birth | | Position Held and Length of Service | | Principal Occupations During Past Five Years | | Other Directorships During
Past Five Years |
Timothy J. Penny
(Born 1951) | | Trustee, since 1996 | | President and CEO of Southern Minnesota Initiative Foundation, a non-profit organization, since 2007 and Senior Fellow at the Humphrey Institute Policy Forum at the University of Minnesota since 1995. Member of the Board of Trustees of NorthStar Education Finance, Inc., a non-profit organization, since 2007. | | Asset Allocation Trust |
Michael S. Scofield
(Born 1943) | | Trustee, since 2010 | | Served on the Investment Company Institute’s Board of Governors and Executive Committee from 2008-2011 as well the Governing Council of the Independent Directors Council from 2006-2011 and the Independent Directors Council Executive Committee from 2008-2011. Chairman of the IDC from 2008-2010. Institutional Investor (Fund Directions) Trustee of Year in 2007. Trustee of the Evergreen Funds (and its predecessors) from 1984 to 2010. Chairman of the Evergreen Funds from 2000-2010. Former Trustee of the Mentor Funds. Retired Attorney, Law Offices of Michael S. Scofield and former Director and Chairman, Branded Media Corporation (multi-media branding company). | | Asset Allocation Trust |
Donald C. Willeke
(Born 1940) | | Trustee, since 1996 | | Principal of the law firm of Willeke & Daniels. General Counsel of the Minneapolis Employees Retirement Fund from 1984 until its consolidation into the Minnesota Public Employees Retirement Association on June 30, 2010. Director and Vice Chair of The Free Trust (non-profit corporation). Director of the American Chestnut Foundation (non-profit corporation). | | Asset Allocation Trust |
Officers
| | | | | | |
Name and Year of Birth | | Position Held and
Length of Service | | Principal Occupations During Past Five Years | | |
Karla M. Rabusch
(Born 1959) | | President, since 2003 | | Executive Vice President of Wells Fargo Bank, N.A. and President of Wells Fargo Funds Management, LLC since 2003. Senior Vice President and Chief Administrative Officer of Wells Fargo Funds Management, LLC from 2001 to 2003. | | |
C. David Messman
(Born 1960) | | Secretary, since 2000; Chief Legal Counsel, since 2003 | | Senior Vice President and Secretary of Wells Fargo Funds Management, LLC since 2001. Vice President and Managing Senior Counsel of Wells Fargo Bank, N.A. since 1996. | | |
Kasey Phillips
(Born 1970) | | Treasurer, since 2009 | | Senior Vice President of Wells Fargo Funds Management, LLC since 2009. Senior Vice President of Evergreen Investment Management Company, LLC from 2006 to 2010. Treasurer of the Evergreen Funds from 2005 to 2010. | | |
David Berardi
(Born 1975) | | Assistant Treasurer, since 2009 | | Vice President of Wells Fargo Funds Management, LLC since 2009. Vice President of Evergreen Investment Management Company, LLC from 2008 to 2010. Assistant Vice President of Evergreen Investment Services, Inc. from 2004 to 2008. Manager of Fund Reporting and Control for Evergreen Investment Management Company, LLC from 2004 to 2010. | | |
Jeremy DePalma
(Born 1974) | | Assistant Treasurer, since 2009 | | Senior Vice President of Wells Fargo Funds Management, LLC since 2009. Senior Vice President of Evergreen Investment Management Company, LLC from 2008 to 2010. Vice President, Evergreen Investment Services, Inc. from 2004 to 2007. Head of the Fund Reporting and Control Team within Fund Administration from 2005 to 2010. | | |
Debra Ann Early
(Born 1964) | | Chief Compliance Officer, since 2007 | | Chief Compliance Officer of Wells Fargo Funds Management, LLC since 2007. Chief Compliance Officer of Parnassus Investments from 2005 to 2007. Chief Financial Officer of Parnassus Investments from 2004 to 2007 and Senior Audit Manager of PricewaterhouseCoopers LLP from 1998 to 2004. | | |
| 1. | The Statement of Additional Information includes additional information about the Trustees and is available, without charge, upon request, by calling 1-800-222-8222 or by visiting the Web site at www.wellsfargo.com/advantagefunds. |
| | | | |
| 36 | | Wells Fargo Advantage California Limited-Term Tax-Free Fund | | List of Abbreviations |
The following is a list of common abbreviations for terms and entities which may have appeared in this report.
| ACB | — Agricultural Credit Bank |
| ADR | — American Depository Receipt |
| ADS | — American Depository Shares |
| AGC-ICC | — Assured Guaranty Corporation - Insured Custody Certificates |
| AGM | — Assured Guaranty Municipal |
| AMBAC | — American Municipal Bond Assurance Corporation |
| AMT | — Alternative Minimum Tax |
| BAN | — Bond Anticipation Notes |
| BHAC | — Berkshire Hathaway Assurance Corporation |
| CAB | — Capital Appreciation Bond |
| CCAB | — Convertible Capital Appreciation Bond |
| CDA | — Community Development Authority |
| CDO | — Collateralized Debt Obligation |
| COP | — Certificate of Participation |
| DRIVER | — Derivative Inverse Tax-Exempt Receipts |
| DW&P | — Department of Water & Power |
| DWR | — Department of Water Resources |
| ECFA | — Educational & Cultural Facilities Authority |
| EDA | — Economic Development Authority |
| EDFA | — Economic Development Finance Authority |
| ETF | — Exchange-Traded Fund |
| FFCB | — Federal Farm Credit Bank |
| FGIC | — Financial Guaranty Insurance Corporation |
| FHA | — Federal Housing Authority |
| FHLB | — Federal Home Loan Bank |
| FHLMC | — Federal Home Loan Mortgage Corporation |
| FNMA | — Federal National Mortgage Association |
| GDR | — Global Depository Receipt |
| GNMA | — Government National Mortgage Association |
| HCFR | — Healthcare Facilities Revenue |
| HEFA | — Health & Educational Facilities Authority |
| HEFAR | — Higher Education Facilities Authority Revenue |
| HFA | — Housing Finance Authority |
| HFFA | — Health Facilities Financing Authority |
| IBC | — Insured Bond Certificate |
| IDA | — Industrial Development Authority |
| IDAG | — Industrial Development Agency |
| IDR | — Industrial Development Revenue |
| KRW | — Republic of Korea Won |
| LIBOR | — London Interbank Offered Rate |
| LLC | — Limited Liability Company |
| LLP | — Limited Liability Partnership |
| MBIA | — Municipal Bond Insurance Association |
| MFHR | — Multi-Family Housing Revenue |
| MUD | — Municipal Utility District |
| NATL-RE | — National Public Finance Guarantee Corporation |
| PCFA | — Pollution Control Finance Authority |
| PCR | — Pollution Control Revenue |
| PFA | — Public Finance Authority |
| PFFA | — Public Facilities Financing Authority |
| PFOTER | — Puttable Floating Option Tax-Exempt Receipts |
| plc | — Public Limited Company |
| PUTTER | — Puttable Tax-Exempt Receipts |
| R&D | — Research & Development |
| RDA | — Redevelopment Authority |
| RDFA | — Redevelopment Finance Authority |
| REIT | — Real Estate Investment Trust |
| ROC | — Reset Option Certificates |
| SAVRS | — Select Auction Variable Rate Securities |
| SBA | — Small Business Authority |
| SFHR | — Single Family Housing Revenue |
| SFMR | — Single Family Mortgage Revenue |
| SPDR | — Standard & Poor’s Depositary Receipts |
| TAN | — Tax Anticipation Notes |
| TIPS | — Treasury Inflation-Protected Securities |
| TRAN | — Tax Revenue Anticipation Notes |
| TCR | — Transferable Custody Receipts |
| TTFA | — Transportation Trust Fund Authority |
| TVA | — Tennessee Valley Authority |
| XLCA | — XL Capital Assurance |
This page is intentionally left blank.
This page is intentionally left blank.


FOR MORE INFORMATION
More information about Wells Fargo Advantage Funds is available free upon request. To obtain literature, please write, e-mail, visit the Fund’s Web site, or call:
Wells Fargo Advantage Funds
P.O. Box 8266
Boston, MA 02266-8266
E-mail: wfaf@wellsfargo.com
Web site: www.wellsfargo.com/advantagefunds
Individual investors: 1-800-222-8222
Retail investment professionals: 1-888-877-9275
Institutional investment professionals: 1-866-765-0778
This report and the financial statements contained herein are submitted for the general information of the shareholders of Wells Fargo Advantage Funds. If this report is used for promotional purposes, distribution of the report must be accompanied or preceded by a current prospectus. For a prospectus containing more complete information, including charges and expenses, call 1-800-222-8222 or visit the Fund’s Web site at www.wellsfargo.com/advantagefunds. Please consider the investment objectives, risks, charges, and expenses of the investment carefully before investing. This and other information about Wells Fargo Advantage Funds can be found in the current prospectus. Read the prospectus carefully before you invest or send money.
Wells Fargo Funds Management, LLC, a wholly owned subsidiary of Wells Fargo & Company, provides investment advisory and administrative services for Wells Fargo Advantage Funds. Other affiliates of Wells Fargo & Company provide subadvisory and other services for the Funds. The Funds are distributed by Wells Fargo Funds Distributor, LLC, Member FINRA/SIPC, an affiliate of Wells Fargo & Company.
NOT FDIC INSURED ¡ NO BANK GUARANTEE ¡ MAY LOSE VALUE
© 2012 Wells Fargo Funds Management, LLC. All rights reserved.
| | |
 | | 207582 02-12 SA248/SAR248 12-11 |

Wells Fargo Advantage California Tax-Free Fund

Semi-Annual Report
December 31, 2011

Reduce clutter. Save trees.
Sign up for electronic delivery of prospectuses and shareholder reports at www.wellsfargo.com/advantagedelivery
Contents
The views expressed and any forward-looking statements are as of December 31, 2011, unless otherwise noted, and are those of the Fund managers and/or Wells Fargo Funds Management, LLC. Discussions of individual securities, or the markets generally, or any Wells Fargo Advantage Fund are not intended as individual recommendations. Future events or results may vary significantly from those expressed in any forward-looking statements; the views expressed are subject to change at any time in response to changing circumstances in the market. Wells Fargo Funds Management, LLC, disclaims any obligation to publicly update or revise any views expressed or forward-looking statements.
NOT FDIC INSURED ¡ NO BANK GUARANTEE ¡ MAY LOSE VALUE

WELLS FARGO INVESTMENT HISTORY
| | |
| |
| 1932 | | Keystone creates one of the first mutual fund families. |
| |
| 1971 | | Wells Fargo & Company introduces one of the first institutional index funds. |
| |
| 1978 | | Wells Fargo applies Markowitz and Sharpe’s research on Modern Portfolio Theory to introduce one of the industry’s first Tactical Asset Allocation (TAA) models in institutional separately managed accounts. |
| |
| 1984 | | Wells Fargo Stagecoach Funds launches its first asset allocation fund. |
| |
| 1989 | | The Tactical Asset Allocation (TAA) Model is first applied to Wells Fargo’s asset allocation mutual funds. |
| |
| 1994 | | Wells Fargo introduces the LifePath Funds, one of the first suites of target date funds (now the Wells Fargo Advantage Dow Jones Target Date FundsSM ). |
| |
| 1996 | | Evergreen Investments and Keystone Funds merge. |
| |
| 1997 | | Wells Fargo launches Wells Fargo Advantage WealthBuilder PortfoliosSM, a fund-of-funds suite of products that includes the use of quantitative models to shift assets among investment styles. |
| |
| 1999 | | Norwest Advantage Funds and Stagecoach Funds are reorganized into Wells Fargo Funds after the merger of Norwest and Wells Fargo. |
| |
| 2002 | | Evergreen Retail and Evergreen Institutional companies form the umbrella asset management company, Evergreen Investments. |
| |
| 2005 | | The integration of Strong Funds with Wells Fargo Funds creates Wells Fargo Advantage Funds, resulting in one of the top 20 mutual fund companies in the United States. |
| |
| 2006 | | Wells Fargo Advantage Funds relaunches the target date product line as Wells Fargo Advantage Dow Jones Target Date Funds. |
| |
| 2010 | | The mergers and reorganizations of Evergreen and Wells Fargo Advantage mutual funds are completed, unifying the families under the brand of Wells Fargo Advantage Funds. |
Wells Fargo Advantage Funds®
Wells Fargo Advantage Funds skillfully guides institutions, financial advisors, and individuals through the investment terrain to help them reach their financial objectives. Everything we do on behalf of investors is backed by our unique combination of qualifications.
Strength
Our organization is built on the standards of integrity and service established by our parent company—Wells Fargo & Company—more than 150 years ago. And, because we’re part of a highly diversified financial enterprise, we offer the depth of resources to help investors succeed.
Expertise
Our multi-boutique model offers investors access to the independent thinking of premier investment managers that have been chosen for their time-tested strategies. While each team specializes in a specific investment strategy, collectively they provide investors a wide choice of distinct investment styles. Our dedication to investment excellence doesn’t end with our expertise in manager selection—risk management, analysis, and rigorous ongoing review seek to ensure each manager’s investment process remains consistent.
Partnership
Our collaborative approach is built around understanding the needs and goals of our clients. By adhering to core principles of sound judgment and steady guidance, we support you through every stage of the investment decision process.
Carefully consider a fund’s investment objectives, risks, charges, and expenses before investing. For a current prospectus and, if available, a summary prospectus, containing this and other information, visit wellsfargo.com/advantagefunds. Read it carefully before investing.
Wells Fargo Funds Management, LLC, a wholly owned subsidiary of Wells Fargo & Company, provides investment advisory and administrative services for Wells Fargo Advantage Funds®. Other affiliates of Wells Fargo & Company provide subadvisory and other services for the Funds. The Funds are distributed by Wells Fargo Funds Distributor, LLC, Member FINRA/SIPC, an affiliate of Wells Fargo & Company.
“Dow Jones®” and “Dow Jones Target Date IndexesSM” are service marks of Dow Jones Trademark Holdings, LLC (“Dow Jones”), have been licensed to CME Group Index Services LLC (“CME Indexes”) and have been sublicensed for use for certain purposes by Global Index Advisors, Inc, and Wells Fargo Funds Management, LLC. The Wells Fargo Advantage Dow Jones Target Date FundsSM based on the Dow Jones Target Date IndexesSM, are not sponsored, endorsed, sold or promoted by Dow Jones, CME Indexes or their respective affiliates and none of them makes any representation regarding the advisability of investing in such product(s).
NOT FDIC INSURED ¡ NO BANK GUARANTEE ¡ MAY LOSE VALUE
Not part of the semi-annual report.
Wells Fargo Advantage Funds offers more than 110 mutual funds across a wide range of asset classes, representing over $216 billion in assets under management, as of December 31, 2011.
| | | | |
| Equity Funds | | | | |
Asia Pacific Fund | | Global Opportunities Fund | | Premier Large Company Growth Fund |
C&B Large Cap Value Fund | | Growth Fund | | Small Cap Opportunities Fund |
C&B Mid Cap Value Fund | | Health Care Fund | | Small Cap Value Fund |
Capital Growth Fund | | Index Fund | | Small Company Growth Fund |
Common Stock Fund | | International Equity Fund | | Small Company Value Fund |
Disciplined U.S. Core Fund | | International Value Fund | | Small/Mid Cap Core Fund |
Discovery Fund† | | Intrinsic Small Cap Value Fund | | Small/Mid Cap Value Fund |
Diversified Equity Fund | | Intrinsic Value Fund | | Social Sustainability Fund† |
Diversified International Fund | | Intrinsic World Equity Fund | | Special Mid Cap Value Fund |
Diversified Small Cap Fund | | Large Cap Core Fund | | Special Small Cap Value Fund |
Emerging Growth Fund | | Large Cap Growth Fund | | Specialized Technology Fund |
Emerging Markets Equity Fund | | Large Company Value Fund | | Strategic Large Cap Growth Fund |
Endeavor Select Fund† | | Omega Growth Fund | | Traditional Small Cap Growth Fund |
Enterprise Fund† | | Opportunity Fund† | | Utility and Telecommunications Fund |
Equity Value Fund | | Precious Metals Fund | | |
| Bond Funds | | | | |
Adjustable Rate Government Fund | | Inflation-Protected Bond Fund | | Short-Term Bond Fund |
California Limited-Term Tax-Free Fund | | Intermediate Tax/AMT-Free Fund | | Short-Term High Yield Bond Fund |
California Tax-Free Fund | | International Bond Fund | | Short-Term Municipal Bond Fund |
Colorado Tax-Free Fund | | Minnesota Tax-Free Fund | | Strategic Municipal Bond Fund |
Government Securities Fund | | Municipal Bond Fund | | Total Return Bond Fund |
High Income Fund | | North Carolina Tax-Free Fund | | Ultra Short-Term Income Fund |
High Yield Bond Fund | | Pennsylvania Tax-Free Fund | | Ultra Short-Term Municipal Income Fund |
Income Plus Fund | | Short Duration Government Bond Fund | | Wisconsin Tax-Free Fund |
| Asset Allocation Funds | | | | |
Asset Allocation Fund | | WealthBuilder Equity Portfolio† | | Target 2020 Fund† |
Conservative Allocation Fund | | WealthBuilder Growth Allocation Portfolio† | | Target 2025 Fund† |
Diversified Capital Builder Fund | | WealthBuilder Growth Balanced Portfolio† | | Target 2030 Fund† |
Diversified Income Builder Fund | | WealthBuilder Moderate Balanced Portfolio† | | Target 2035 Fund† |
Growth Balanced Fund | | WealthBuilder Tactical Equity Portfolio† | | Target 2040 Fund† |
Index Asset Allocation Fund | | Target Today Fund† | | Target 2045 Fund† |
Moderate Balanced Fund | | Target 2010 Fund† | | Target 2050 Fund† |
WealthBuilder Conservative Allocation Portfolio† | | Target 2015 Fund† | | Target 2055 Fund† |
| Money Market Funds | | | | |
100% Treasury Money Market Fund | | Heritage Money Market Fund† | | National Tax-Free Money Market Fund |
California Municipal Money Market Fund | | Money Market Fund | | Prime Investment Money Market Fund |
Cash Investment Money Market Fund | | Municipal Cash Management Money Market Fund | | Treasury Plus Money Market Fund |
Government Money Market Fund | | Municipal Money Market Fund | | |
| Variable Trust Funds1 | | | | |
VT Discovery Fund† | | VT Intrinsic Value Fund | | VT Small Cap Growth Fund |
VT Index Asset Allocation Fund | | VT Omega Growth Fund | | VT Small Cap Value Fund |
VT International Equity Fund | | VT Opportunity Fund† | | VT Total Return Bond Fund |
An investment in a money market fund is not insured or guaranteed by the Federal Deposit Insurance Corporation or any other government agency. Although the Wells Fargo Advantage Money Market Funds seek to preserve the value of your investment at $1.00 per share, it is possible to lose money by investing in a money market fund.
| 1. | The Variable Trust Funds are generally available only through insurance company variable contracts. |
| † | In this report, the Wells Fargo Advantage Discovery FundSM, Wells Fargo Advantage Endeavor Select FundSM, Wells Fargo Advantage Enterprise FundSM, Wells Fargo Advantage Opportunity FundSM, Wells Fargo Advantage Social Sustainability FundSM, Wells Fargo Advantage WealthBuilder Conservative Allocation PortfolioSM, Wells Fargo Advantage WealthBuilder Equity PortfolioSM, Wells Fargo Advantage WealthBuilder Growth Allocation PortfolioSM, Wells Fargo Advantage WealthBuilder Growth Balanced PortfolioSM, Wells Fargo Advantage WealthBuilder Moderate Balanced PortfolioSM, Wells Fargo Advantage WealthBuilder Tactical Equity PortfolioSM, Wells Fargo Advantage Dow Jones Target Today FundSM, Wells Fargo Advantage Dow Jones Target 2010 FundSM, Wells Fargo Advantage Dow Jones Target 2015 FundSM, Wells Fargo Advantage Dow Jones Target 2020 FundSM, Wells Fargo Advantage Dow Jones Target 2025 FundSM, Wells Fargo Advantage Dow Jones Target 2030 FundSM, Wells Fargo Advantage Dow Jones Target 2035 FundSM, Wells Fargo Advantage Dow Jones Target 2040 FundSM, Wells Fargo Advantage Dow Jones Target 2045 FundSM, Wells Fargo Advantage Dow Jones Target 2050 FundSM, Wells Fargo Advantage Dow Jones Target 2055 FundSM, Wells Fargo Advantage Heritage Money Market FundSM, Wells Fargo Advantage VT Discovery FundSM, and Wells Fargo Advantage VT Opportunity FundSM are referred to as the Discovery Fund, Endeavor Select Fund, Enterprise Fund, Opportunity Fund, Social Sustainability Fund, WealthBuilder Conservative Allocation Portfolio, WealthBuilder Equity Portfolio, WealthBuilder Growth Allocation Portfolio, WealthBuilder Growth Balanced Portfolio, WealthBuilder Moderate Balanced Portfolio, WealthBuilder Tactical Equity Portfolio, Target Today Fund, Target 2010 Fund, Target 2015 Fund, Target 2020 Fund, Target 2025 Fund, Target 2030 Fund, Target 2035 Fund, Target 2040 Fund, Target 2045 Fund, Target 2050 Fund, Target 2055 Fund, Heritage Money Market Fund, VT Discovery Fund, and VT Opportunity Fund, respectively. |
Not part of the semi-annual report.
| | | | |
| 2 | | Wells Fargo Advantage California Tax-Free Fund | | Letter to Shareholders |

Karla M. Rabusch,
President
Wells Fargo Advantage Funds
For the entire six-month period, most of the major fixed-income indexes posted solid positive returns. However, the market’s six-month return figures mask the uneven path that the financial markets traced since the summer as investors had to contend with a variety of global and domestic headwinds.
Dear Valued Shareholder:
We’re pleased to offer you this semi-annual report for the Wells Fargo Advantage California Tax-Free Fund for the six-month period that ended December 31, 2011. Upon reviewing the report, you may notice a few changes from past reports, the most significant of which is the change from a multi-fund report to a single-fund report. We made this change to make it easier for you to find your fund information.
For the entire six-month period, most of the major fixed-income indexes posted solid positive returns. However, the market’s six-month return figures mask the uneven path that the financial markets traced since the summer as investors had to contend with a variety of global and domestic headwinds. Whatever the future holds, we continue to believe that most investors can benefit from adhering to a well-diversified investment strategy. Over the long-term, such a strategy may allow you to balance risks and opportunities as you pursue your financial goals in a dynamic market landscape.
The economic recovery gained traction as the year progressed.
The U.S. economic recovery that began in mid-2009 has experienced a few slow patches along the way. However, the recovery regained some upward momentum during the six-month period, yet the rate of growth remained subpar compared with most previous recovery cycles.
In September 2011, it was reported that U.S. gross domestic product (GDP) grew at a mere 1.3% annual rate in the second quarter of 2011, following anemic growth at an annual rate of 0.4% in the first quarter. According to the December estimate, GDP growth accelerated to an annual rate of 1.8% in the third quarter, reigniting hopes for a sustainable recovery. Those hopes were buoyed by widespread anticipation of even stronger GDP growth in the fourth quarter. By year-end, few economists believed that the U.S. economy was in danger of sliding back into recession, although many expected a sluggish growth environment in 2012.
The struggling housing and labor markets slowed growth.
As has been the case throughout the recovery, the housing and labor markets continued to restrain economic momentum during 2011.
The beleaguered housing market has arguably exerted the biggest drag on growth. Despite intermittent signs of improvement, ongoing weakness in sales of both new and existing homes has put considerable downward pressure on prices. On the other hand, the labor market took a decided turn for the better during the final months of 2011: initial unemployment claims have eased, and the private sector has been steadily adding jobs. The pace of hiring, while not brisk, was sufficient to push the U.S. unemployment rate down to 8.5% as of December 2011—still well above its historical average but at its lowest level since February 2009. Many observers expect the unemployment rate to decline further in 2012, which could act as a tailwind for consumer spending—widely viewed as one of the keys to long-term economic growth.
The Federal Reserve announced that it will keep rates low until 2013.
Consumers have already demonstrated some resilience in their spending—even in the face of higher energy costs. Oil prices skyrocketed in early 2011 before retreating later in the year, only to spike again during the fourth quarter. Yet
| | | | | | |
| Letter to Shareholders | | Wells Fargo Advantage California Tax-Free Fund | | | 3 | |
“core” inflation, which excludes volatile energy and food prices, remained fairly benign throughout the year.
With inflation in check, the Federal Reserve (Fed) held its target range for the federal funds rate—a proxy for short-term interest rates—steady at 0% to 0.25%. Following its August 9, 2011 meeting, the Federal Open Market Committee issued a statement explaining that economic conditions were likely to warrant exceptionally low levels for the federal funds rate through at least mid-2013. In September, the Fed launched yet another stimulus program—dubbed “Operation Twist”—that is designed to keep intermediate- and longer-term yields relatively low. The goal with keeping longer-term rates low is to encourage lending activity to spark business investments and home purchases, which, in turn, may provide support for a more sustainable economic recovery.
Market volatility was a dominant theme during the final six-months of the year
Early on in the period, market climate shifted to one of anxiety over the increasingly fragile state of the U.S. and global economies. In addition, investors not only worried that the U.S. might be on the brink of recession, they also feared that Europe’s sovereign debt problems could spiral out of control if a Greek default triggered financial contagion across the continent. In July and August, investor sentiment was further undermined by partisan wrangling over the federal debt ceiling and the downgrade of the U.S. credit rating by Standard & Poor’s. The barrage of unsettling headlines led to heightened market volatility and an increase in risk aversion, which translated into sharply falling stock prices and higher demand for “safer” assets such as Treasuries and municipals in the third quarter of 2011. Although volatility persisted into the fourth quarter, the financial markets were able to rebound amid improved U.S. economic data and hopes for a resolution to the European crisis.
For the entire six-month period, the Barclays Capital U.S. Aggregate Bond Index1, which represents the universe of investment-grade bonds, and the Barclays Capital U.S. Treasury Index2 added 4.98% and 7.43%, respectively. By comparison, the Barclays Capital Municipal Bond Index3 gained 6.02% over the last half of the year
Recent events have not altered our message to shareholders.
The market turmoil of 2011 and an uncertain outlook going forward have left many investors questioning their resolve—and their investments. Yet, it is precisely at such times that the market may present opportunities—as well as challenges—for prudent investors. Bear in mind that many investors who indiscriminately sold their equity investments during the severe market downturn of 2008 to 2009 missed out on the impressive two-year rally that followed. In our opinion, the lesson to be learned from these dramatic market events is that, for many investors, simply building and maintaining a well-diversified4 investment plan is the best long-term strategy.
| 1. | The Barclays Capital U.S. Aggregate Bond Index is composed of the Barclays Capital Government/Credit Index and the Mortgage-Backed Securities Index and includes U.S. Treasury issues, agency issues, corporate bond issues, and mortgage-backed securities. You cannot invest directly in an index. |
| 2. | The Barclays Capital U.S. Treasury Index is an index of U.S. Treasury Securities. You cannot invest directly in an index. |
| 3. | The Barclays Capital Municipal Bond Index is an unmanaged index composed of long-term tax-exempt bonds with a minimum credit rating of Baa. You cannot invest directly in an index. |
| 4. | Diversification does not assure or guarantee better performance and cannot eliminate the risk of investment losses. |
Although volatility persisted into the fourth quarter, the financial markets were able to rebound amid improved U.S. economic data and hopes for a resolution to the European crisis.
| | | | |
| 4 | | Wells Fargo Advantage California Tax-Free Fund | | Letter to Shareholders |
Thank you for choosing to invest with Wells Fargo Advantage Funds. We appreciate your confidence in us and remain committed to helping you meet your financial needs. For current information about your fund investments, contact your investment professional, visit our website at www.wellsfargo.com/advantagefunds, or call us directly at 1-800-222-8222. We are available 24 hours a day, 7 days a week.
Sincerely,

Karla M. Rabusch
President
Wells Fargo Advantage Funds
| | | | | | |
| Letter to Shareholders | | Wells Fargo Advantage California Tax-Free Fund | | | 5 | |
|
|
Notice to Shareholders Effective April 1, 2012, the Fund may invest up to 10% of its total assets in inverse floaters to seek enhanced returns. Inverse floaters are derivative debt instruments created by depositing a municipal security in a trust. They pay interest at rates that generally vary inversely with specified short-term interest rates. The interest payment received on inverse floaters generally will decrease when specified short-term interest rates increase. Inverse floaters involve leverage, which may magnify the Fund’s gains or losses, and exhibit greater price and income volatility than bonds with similar maturities. We intend to limit leverage created by the Fund’s investment in inverse floaters to an amount equal to 10% of the Fund’s total assets. Inverse floaters are also subject to the risks associated with derivatives and municipal securities. |
|
|
Notice to Shareholders The Board of Trustees for Wells Fargo Advantage Funds has unanimously approved the following modifications to certain net asset value (NAV) waiver privileges and commission schedules: n Effective May 1, 2012, automatic investment plan (AIP) purchases and proceeds received from systematic withdrawals will no longer qualify for NAV repurchase privileges. n Effective May 1, 2012, discretionary rights to waive the upfront commission for Class C and “jumbo” Class A share purchases will no longer be granted to broker/dealers. However, we will continue to waive the Class C shares contingent deferred sales charge for redemptions by employer-sponsored retirement plans where the dealer of record waived its commission at the time of purchase. n Effective July 31, 2012, NAV purchase privileges for former Evergreen Class IS and Class R shareholders are being modified to remove the ability to purchase Class A shares at NAV unless those shares are held directly with the fund on or after July 31, 2012. |
| | | | |
| 6 | | Wells Fargo Advantage California Tax-Free Fund | | Performance Highlights (Unaudited) |
INVESTMENT OBJECTIVE
The Fund seeks current income exempt from federal income tax and California individual income tax.
ADVISER
Wells Fargo Funds Management, LLC
SUB-ADVISER
Wells Capital Management Incorporated
PORTFOLIO MANAGERS
Adrian Van Poppel
Robert J. Miller
Terry J. Goode
FUND INCEPTION
October 6, 1988
| | |
CREDIT QUALITY1
(AS OF DECEMBER 31, 2011) |
|
 |
| | |
EFFECTIVE MATURITY DISTRIBUTION2
(AS OF DECEMBER 31, 2011) |
|
 |
| 1. | The ratings indicated are from Standard & Poor’s, Moody’s Investors Service, and/or Fitch Ratings Ltd. Credit Quality Ratings: Credit quality ratings apply to underlying holdings of the Fund and not the Fund itself. Standard and Poor’s rates the creditworthiness of bonds, ranging from AAA (highest) to D (lowest). Ratings from A to CCC may be modified by the addition of a plus (+) or minus (–) sign to show relative standing within the rating categories. Standard & Poor’s rates the creditworthiness of short-term notes from SP-1 (highest) to SP-3 (lowest). Ratings from A to CCC may be modified by the addition of a plus (+) or minus (–) sign to show relative standing within the rating categories. Moody’s rates the creditworthiness of bonds, ranging from Aaa (highest) to C (lowest). Ratings Aa to B may be modified by the addition of a number 1 (highest) to 3 (lowest) to show relative standing within the ratings categories. Moody’s rates the creditworthiness of short-term U.S. tax-exempt municipal securities from MIG 1/VMIG 1 (highest) to SG (lowest). Fitch rates the creditworthiness of bonds, ranging from AAA (highest) to D (lowest). If a security was rated by all three rating agencies, the middle rating was utilized. If rated by two of three rating agencies, the lower rating was utilized and if rated by one of the agencies that rating was utilized. Credit quality is subject to change and is calculated based on the total investments of the Fund. We generally define higher quality bonds as bonds that have a rating of BBB/Baa and above and lower quality bonds as bonds with a rating below BBB/Baa. |
| 2. | Effective maturity is calculated based on the total long-term investments of the Fund. It is subject to change and may have changed since the date specified. |
| | | | | | |
| Performance Highlights (Unaudited) | | Wells Fargo Advantage California Tax-Free Fund | | | 7 | |
AVERAGE ANNUAL TOTAL RETURN (%) (AS OF DECEMBER 31, 2011)
| | | | | | | | | | | | | | | | | | | | | | | | | | | | | | | | | | | | | | | | | | | | |
| | | | | | Including Sales Charge | | | Excluding Sales Charge | | | Expense Ratios3 | |
| | | Inception Date | | | 6 Months* | | | 1 Year | | | 5 Year | | | 10 Year | | | 6 Months* | | | 1 Year | | | 5 Year | | | 10 Year | | | Gross | | | Net4 | |
Class A (SCTAX) | | | 10/06/1988 | | | | 2.09 | | | | 6.15 | | | | 3.22 | | | | 4.24 | | | | 6.93 | | | | 11.17 | | | | 4.18 | | | | 4.72 | | | | 0.82% | | | | 0.75% | |
Class B (SGCBX)** | | | 12/15/1997 | | | | 1.63 | | | | 5.41 | | | | 3.09 | | | | 4.16 | | | | 6.63 | | | | 10.41 | | | | 3.44 | | | | 4.16 | | | | 1.57% | | | | 1.50% | |
Class C (SCTCX) | | | 07/01/1993 | | | | 5.53 | | | | 9.42 | | | | 3.41 | | | | 3.92 | | | | 6.53 | | | | 10.42 | | | | 3.41 | | | | 3.92 | | | | 1.57% | | | | 1.50% | |
Administrator Class (SGCAX) | | | 12/15/1997 | | | | | | | | | | | | | | | | | | | | 7.03 | | | | 11.38 | | | | 4.42 | | | | 4.96 | | | | 0.76% | | | | 0.55% | |
Barclays Capital Municipal Bond Index5 | | | | | | | | | | | | | | | | | | | | | | | 6.02 | | | | 10.70 | | | | 5.22 | | | | 5.38 | | | | | | | | | |
Barclays Capital California Municipal Bond Index6 | | | | | | | | | | | | | | | | | | | | | | | 6.59 | | | | 12.28 | | | | 5.04 | | | | 5.32 | | | | | | | | | |
| * | Returns for periods of less than one year are not annualized. |
| ** | Class B shares are closed to investment, except in connection with the reinvestment of any distributions and permitted exchanges. |
Figures quoted represent past performance, which is no guarantee of future results and do not reflect the deduction of taxes that a shareholder may pay on fund distributions or the redemption of fund shares. Investment return and principal value of an investment will fluctuate so that an investor’s shares, when redeemed, may be worth more or less than their original cost. Performance shown without sales charges would be lower if sales charges were reflected. Current performance may be lower or higher than the performance data quoted and assumes the reinvestment of dividends and capital gains. Current month-end performance is available on the Fund’s Web site – www.wellsfargo.com/advantagefunds.
Index returns do not include transaction costs associated with buying and selling securities, any mutual fund fees or expenses or any taxes. It is not possible to invest directly in an index.
For Class A shares, the maximum front-end sales charge is 4.50%. For Class B shares, the maximum contingent deferred sales charge is 5.00%. For Class C shares, the maximum contingent deferred sales charge is 1.00%. Performance including sales charge assumes the sales charge for the corresponding time period. Administrator Class shares are sold without a front-end sales charge or contingent deferred sales charge.
Bond fund values fluctuate in response to the financial condition of individual issuers, general market and economic conditions, and changes in interest rates. In general, when interest rates rise, bond fund values fall and investors may lose principal value. The use of derivatives may reduce returns and/or increase volatility. Certain investment strategies tend to increase the total risk of an investment (relative to the broader market). This Fund is exposed to California municipal securities risk, high-yield securities risk, and non-diversification risk. Consult the Fund’s prospectus for additional information on these and other risks. A portion of the Fund’s income may be subject to federal, state, and/or local income taxes or the alternative minimum tax (AMT). Any capital gains distributions may be taxable.
| 3. | Reflects the expense ratios as stated in the most recent prospectuses. |
| 4. | The Adviser has committed through July 11, 2013 to waive fees and/or reimburse expenses to the extent necessary to cap the Fund’s Total Annual Fund Operating Expenses After Fee Waiver, excluding certain expenses, at the amounts shown above. Without this cap, the Fund’s returns would have been lower. |
| 5. | The Barclays Capital Municipal Bond Index is an unmanaged index composed of long-term tax-exempt bonds with a minimum credit rating of Baa. You cannot invest directly in an index. |
| 6. | The Barclays Capital California Municipal Bond Index is the California component of the Barclays Capital Municipal Bond Index. You cannot invest directly in an index. |
| | | | |
| 8 | | Wells Fargo Advantage California Tax-Free Fund | | Fund Expenses (Unaudited) |
As a shareholder of the Fund, you incur two types of costs: (1) transaction costs, including sales charges (loads) on purchase payments and contingent deferred sales charges (if any) on redemptions and (2) ongoing costs, including management fees; distribution (12b-1) and/or shareholder service fees; and other Fund expenses. This example is intended to help you understand your ongoing costs (in dollars) of investing in the Fund and to compare these costs with the ongoing costs of investing in other mutual funds.
The example is based on an investment of $1,000 invested at the beginning of the six-month period and held for the entire period from July 1, 2011 to December 31, 2011.
Actual Expenses
The “Actual” line of the table below provides information about actual account values and actual expenses. You may use the information in this line, together with the amount you invested, to estimate the expenses that you paid over the period. Simply divide your account value by $1,000 (for example, an $8,600 account value divided by $1,000 = 8.6), then multiply the result by the number in the “Actual” line under the heading entitled “Expenses Paid During Period” for your applicable class of shares to estimate the expenses you paid on your account during this period.
Hypothetical Example for Comparison Purposes
The “Hypothetical” line of the table below provides information about hypothetical account values and hypothetical expenses based on the Fund’s actual expense ratio and an assumed rate of return of 5% per year before expenses, which is not the Fund’s actual return. The hypothetical account values and expenses may not be used to estimate the actual ending account balance or expenses you paid for the period. You may use this information to compare the ongoing costs of investing in the Fund and other funds. To do so, compare this 5% hypothetical example with the 5% hypothetical examples that appear in the shareholder reports of the other funds.
Please note that the expenses shown in the table are meant to highlight your ongoing costs only and do not reflect any transactional costs, such as sales charges (loads) and contingent deferred sales charges. Therefore, the “Hypothetical” line of the table is useful in comparing ongoing costs only, and will not help you determine the relative total costs of owning different funds. In addition, if these transactional costs were included, your costs would have been higher.
| | | | | | | | | | | | | | | | |
| | | Beginning
Account Value
07-01-2011 | | | Ending
Account Value
12-31-2011 | | | Expenses
Paid During
the Period1 | | | Net Annual
Expense Ratio | |
Class A | | | | | | | | | | | | | | | | |
Actual | | $ | 1,000.00 | | | $ | 1,069.33 | | | $ | 3.90 | | | | 0.75 | % |
Hypothetical (5% return before expenses) | | $ | 1,000.00 | | | $ | 1,021.37 | | | $ | 3.81 | | | | 0.75 | % |
Class B | | | | | | | | | | | | | | | | |
Actual | | $ | 1,000.00 | | | $ | 1,066.30 | | | $ | 7.79 | | | | 1.50 | % |
Hypothetical (5% return before expenses) | | $ | 1,000.00 | | | $ | 1,017.60 | | | $ | 7.61 | | | | 1.50 | % |
Class C | | | | | | | | | | | | | | | | |
Actual | | $ | 1,000.00 | | | $ | 1,065.35 | | | $ | 7.79 | | | | 1.50 | % |
Hypothetical (5% return before expenses) | | $ | 1,000.00 | | | $ | 1,017.60 | | | $ | 7.61 | | | | 1.50 | % |
Administrator Class | | | | | | | | | | | | | | | | |
Actual | | $ | 1,000.00 | | | $ | 1,070.32 | | | $ | 2.86 | | | | 0.55 | % |
Hypothetical (5% return before expenses) | | $ | 1,000.00 | | | $ | 1,022.37 | | | $ | 2.80 | | | | 0.55 | % |
| 1. | Expenses paid is equal to the annualized expense ratio of each class multiplied by the average account value over the period, multiplied by the number of days in the most recent fiscal half-year divided by the number of days in the fiscal year (to reflect the one-half year period). |
| | | | | | |
| Portfolio of Investments—December 31, 2011 (Unaudited) | | Wells Fargo Advantage California Tax-Free Fund | | | 9 | |
| | | | | | | | | | | | | | | | |
| Security Name | | Interest Rate | | | Maturity Date | | | Principal | | | Value | |
| | | | | | | | | | | | | | | | |
| | | | |
Municipal Bonds and Notes: 98.24% | | | | | | | | | | | | | | | | |
| | | | |
| California: 97.01% | | | | | | | | | | | | | | | | |
Alameda CA Corridor Transportation Authority CAB Sub Lien Series A (Transportation Revenue, AMBAC Insured)(z) | | | 0.28 | % | | | 10/01/2021 | | | $ | 3,000,000 | | | $ | 2,919,210 | |
Alameda CA Corridor Transportation Authority CAB Sub Lien Series A (Transportation Revenue, AMBAC Insured)(z) | | | 4.26 | | | | 10/01/2018 | | | | 3,800,000 | | | | 2,854,902 | |
Alameda CA Corridor Transportation Authority CAB Sub Lien Series A (Transportation Revenue, AMBAC Insured)(z) | | | 4.49 | | | | 10/01/2019 | | | | 3,000,000 | | | | 2,124,150 | |
Alhambra CA Unified School District Election of 2008 Series B (Tax Revenue, AGM Insured) | | | 6.00 | | | | 08/01/2029 | | | | 4,100,000 | | | | 4,804,462 | |
Alisal CA Unified School District CAB Election of 2006 Series A (Tax Revenue, Assured Guaranty Insured)(z) | | | 3.48 | | | | 08/01/2017 | | | | 1,105,000 | | | | 910,299 | |
Anaheim CA City School District Election of 2010 (Tax Revenue, AGM Insured) | | | 6.25 | | | | 08/01/2033 | | | | 1,290,000 | | | | 1,499,083 | |
Anaheim CA PFA CAB Sub Lien Public Improvements Project Series C (Lease Revenue, AGM Insured)(z) | | | 4.13 | | | | 09/01/2018 | | | | 5,900,000 | | | | 4,487,068 | |
Anaheim CA PFA CAB Sub Lien Public Improvements Project Series C (Lease Revenue, AGM Insured)(z) | | | 6.06 | | | | 09/01/2025 | | | | 15,110,000 | | | | 6,678,469 | |
Anaheim CA PFA Electric System Distribution Facilities Series A (Utilities Revenue, AGM Insured) | | | 5.00 | | | | 10/01/2031 | | | | 4,305,000 | | | | 4,401,518 | |
Antelope Valley CA Health Care District Series A (Health Revenue, AGM Insured) | | | 5.20 | | | | 01/01/2017 | | | | 2,195,000 | | | | 2,199,280 | |
Bakersfield CA Series B (Water & Sewer Revenue, AGM Insured)± | | | 3.25 | | | | 09/01/2035 | | | | 5,560,000 | | | | 5,560,000 | |
Bay Area Infrastructure Financing Authority of California State Payment Acceleration Notes (Transportation Revenue, XLCA Insured) | | | 5.00 | | | | 08/01/2017 | | | | 1,635,000 | | | | 1,718,009 | |
Belmont CA Community Facilities Special Tax District # 2000-1 Library Project Series A (Tax Revenue, AMBAC Insured) | | | 5.75 | | | | 08/01/2030 | | | | 3,190,000 | | | | 3,636,249 | |
Brea CA PFA Tax Allocation Series A (Housing Revenue) | | | 7.00 | | | | 09/01/2023 | | | | 2,105,000 | | | | 2,256,034 | |
Cabrillo CA Unified School District CAB Series A (Tax Revenue, AMBAC Insured)(z) | | | 5.20 | | | | 08/01/2021 | | | | 1,500,000 | | | | 916,155 | |
California Educational Facilities Authority (Education Revenue)± | | | 0.85 | | | | 10/01/2033 | | | | 3,000,000 | | | | 3,000,000 | |
California Health Facilities Financing Prerefunded Providence Health (Health Revenue)§ | | | 6.50 | | | | 10/01/2038 | | | | 100,000 | | | | 133,725 | |
California HFA AMT Home Mortgage Series E (Housing Revenue) | | | 5.00 | | | | 02/01/2042 | | | | 2,800,000 | | | | 2,825,536 | |
California HFA AMT Home Mortgage Series G (Housing Revenue) | | | 5.50 | | | | 08/01/2042 | | | | 5,525,000 | | | | 5,603,566 | |
California HFA AMT Home Mortgage Series H (Housing Revenue, FGIC Insured) | | | 5.75 | | | | 08/01/2030 | | | | 1,725,000 | | | | 1,723,499 | |
California HFA AMT Home Mortgage Series J (Housing Revenue) | | | 5.75 | | | | 08/01/2047 | | | | 590,000 | | | | 600,891 | |
California HFA AMT Home Mortgage Series K (Housing Revenue) | | | 4.55 | | | | 08/01/2021 | | | | 6,440,000 | | | | 6,192,704 | |
California HFA AMT Home Mortgage Series M (Housing Revenue) | | | 4.55 | | | | 08/01/2021 | | | | 3,430,000 | | | | 3,260,730 | |
California HFA AMT Home Mortgage Series M (Housing Revenue) | | | 5.00 | | | | 08/01/2037 | | | | 2,075,000 | | | | 2,097,203 | |
California HFA MFHR Series B (Housing Revenue, AMBAC FHA Insured) | | | 6.05 | | | | 08/01/2016 | | | | 1,190,000 | | | | 1,191,345 | |
California HFFA Casa Colina Project (Health Revenue) | | | 6.00 | | | | 04/01/2022 | | | | 3,000,000 | | | | 3,011,400 | |
California HFFA Catholic Healthcare West Series A (Health Revenue) | | | 5.25 | | | | 03/01/2023 | | | | 3,000,000 | | | | 3,309,540 | |
California HFFA Catholic Healthcare West Series A (Health Revenue) | | | 6.00 | | | | 07/01/2029 | | | | 3,280,000 | | | | 3,638,799 | |
California HFFA Catholic Healthcare West Series L (Health Revenue) | | | 5.13 | | | | 07/01/2022 | | | | 1,875,000 | | | | 2,022,825 | |
California HFFA Paradise Estate (Health Revenue, California Mortgages Insured) | | | 5.13 | | | | 01/01/2022 | | | | 3,600,000 | | | | 3,669,984 | |
California HFFA Sutter Health Series D (Health Revenue) | | | 5.25 | | | | 08/15/2031 | | | | 3,100,000 | | | | 3,307,297 | |
California HFFA The Episcopal Home (Health Revenue, California Mortgages Insured) | | | 5.25 | | | | 02/01/2021 | | | | 2,000,000 | | | | 2,002,800 | |
California Housing Finance Agency Home Mortgage Series K AMT (Housing Revenue) | | | 5.30 | | | | 08/01/2023 | | | | 5,250,000 | | | | 5,187,158 | |
| | | | |
| 10 | | Wells Fargo Advantage California Tax-Free Fund | | Portfolio of Investments—December 31, 2011 (Unaudited) |
| | | | | | | | | | | | | | | | |
| Security Name | | Interest Rate | | | Maturity Date | | | Principal | | | Value | |
| | | | | | | | | | | | | | | | |
| | | | |
| California (continued) | | | | | | | | | | | | | | | | |
California Housing Finance Agency Revenue CAB Home Mortgage Series N (Miscellaneous Revenue) | | | 6.00 | % | | | 04/01/2035 | | | $ | 2,140,000 | | | $ | 2,415,611 | |
California Infrastructure & Economic Development Bank Independent Systems Operator Series A (Utilities Revenue) | | | 6.25 | | | | 02/01/2039 | | | | 3,000,000 | | | | 3,232,860 | |
California Infrastructure & Economic Development Bank Los Angeles YMCA Metropolitan Project (Miscellaneous Revenue, AMBAC Insured) | | | 5.25 | | | | 02/01/2026 | | | | 2,000,000 | | | | 2,021,520 | |
California Infrastructure & Economic Development Bank School King City Unified High School (Lease Revenue) | | | 5.75 | | | | 08/15/2029 | | | | 2,150,000 | | | | 2,296,394 | |
California Municipal Finance Authority Community Hospitals Central California (Health Revenue) | | | 5.00 | | | | 02/01/2020 | | | | 1,000,000 | | | | 1,025,210 | |
California Rural Home Mortgage Finance Authority SFMR Mortgage-Backed Securities Series B (Housing Revenue, GNMA/FNMA Insured) | | | 6.25 | | | | 12/01/2031 | | | | 50,000 | | | | 50,547 | |
California Rural Home Mortgage Finance Authority SFMR Mortgage-Backed Securities Series B5 (Housing Revenue, GNMA/FNMA/FHLMC Insured) | | | 6.35 | | | | 12/01/2029 | | | | 10,000 | | | | 10,235 | |
California Rural Home Mortgage Finance Authority SFMR Mortgage-Backed Securities Series C (Housing Revenue, GNMA/FNMA Insured) | | | 5.40 | | | | 02/01/2046 | | | | 2,855,000 | | | | 3,024,530 | |
California Special District Association Finance Corporation Program Series MM (Lease Revenue) | | | 5.50 | | | | 06/01/2021 | | | | 1,090,000 | | | | 1,090,796 | |
California State (Miscellaneous Revenue) | | | 5.00 | | | | 08/01/2025 | | | | 5,000,000 | | | | 5,444,450 | |
California State (Miscellaneous Revenue) | | | 5.00 | | | | 09/01/2029 | | | | 1,475,000 | | | | 1,592,233 | |
California State (Miscellaneous Revenue) | | | 5.25 | | | | 11/01/2040 | | | | 3,000,000 | | | | 3,160,140 | |
California State (Miscellaneous Revenue) | | | 5.75 | | | | 04/01/2029 | | | | 1,600,000 | | | | 1,810,128 | |
California State Department of Transportation COP Series A (Lease Revenue, NATL-RE Insured) | | | 5.25 | | | | 03/01/2016 | | | | 2,520,000 | | | | 2,529,677 | |
California State Department of Veterans Affairs Series A (Housing Revenue) | | | 4.85 | | | | 12/01/2022 | | | | 1,960,000 | | | | 2,055,628 | |
California State Public Works Board Judicial Council Project Series D (Lease Revenue) | | | 5.25 | | | | 12/01/2025 | | | | 4,000,000 | | | | 4,310,800 | |
California State Public Works Board Regents University of California Series G (Lease Revenue) | | | 5.00 | | | | 12/01/2030 | | | | 10,000,000 | | | | 10,820,400 | |
California State Public Works Board University of California Research Project Series L (Education Revenue, NATL-RE Insured) | | | 5.25 | | | | 11/01/2028 | | | | 4,225,000 | | | | 4,641,670 | |
California State Public Works California State University Project Series B-1 (Lease Revenue) | | | 5.70 | | | | 03/01/2035 | | | | 2,210,000 | | | | 2,328,589 | |
California State Public Works Department of General Services Butterfield Series A (Lease Revenue) | | | 5.25 | | | | 06/01/2024 | | | | 2,400,000 | | | | 2,488,392 | |
California State Public Works Department of General Services East End Series A (Lease Revenue, AMBAC Insured) | | | 5.00 | | | | 12/01/2027 | | | | 5,500,000 | | | | 5,525,300 | |
California State Public Works Department of Mental Health Coaling Series A-A (Lease Revenue) | | | 5.13 | | | | 06/01/2029 | | | | 3,145,000 | | | | 3,177,960 | |
California State Various Purposes (Tax Revenue) | | | 5.00 | | | | 10/01/2029 | | | | 7,000,000 | | | | 7,462,210 | |
California State Various Purposes (Miscellaneous Revenue) | | | 5.25 | | | | 09/01/2028 | | | | 5,000,000 | | | | 5,556,150 | |
California State Various Purposes (Miscellaneous Revenue) | | | 5.25 | | | | 10/01/2029 | | | | 800,000 | | | | 866,048 | |
California State Various Purposes (Tax Revenue) | | | 5.60 | | | | 03/01/2036 | | | | 7,800,000 | | | | 8,518,770 | |
California State Various Purposes (Miscellaneous Revenue) | | | 6.00 | | | | 04/01/2038 | | | | 23,390,000 | | | | 26,308,136 | |
California State Veterans Series BZ (Miscellaneous Revenue, NATL-RE Insured) | | | 5.35 | | | | 12/01/2021 | | | | 5,000 | | | | 5,007 | |
California Statewide CDA Aspire Public Schools (Miscellaneous Revenue) | | | 5.00 | | | | 07/01/2020 | | | | 1,335,000 | | | | 1,337,336 | |
California Statewide CDA COP Cedars Sinai Medical Center (Lease Revenue) | | | 6.50 | | | | 08/01/2012 | | | | 515,000 | | | | 526,799 | |
California Statewide CDA COP Childrens Hospital Los Angeles MBIA (Health Revenue, NATL-RE-IBC Insured) | | | 5.25 | | | | 08/15/2029 | | | | 2,000,000 | | | | 1,941,700 | |
California Statewide CDA COP Childrens Hospital Los Angeles MBIA (Health Revenue, NATL-RE IBC Bank of New York Insured) | | | 5.25 | | | | 08/15/2029 | | | | 2,025,000 | | | | 1,981,604 | |
| | | | | | |
| Portfolio of Investments—December 31, 2011 (Unaudited) | | Wells Fargo Advantage California Tax-Free Fund | | | 11 | |
| | | | | | | | | | | | | | | | |
| Security Name | | Interest Rate | | | Maturity Date | | | Principal | | | Value | |
| | | | | | | | | | | | | | | | |
| | | | |
| California (continued) | | | | | | | | | | | | | | | | |
California Statewide CDA COP SAVRS (Health Revenue, ACA Radian Insured)±§(n)(a)(m) | | | 0.81 | % | | | 05/15/2029 | | | $ | 1,850,000 | | | $ | 1,721,351 | |
California Statewide CDA COP The Internext Group (Health Revenue) | | | 5.38 | | | | 04/01/2017 | | | | 2,845,000 | | | | 2,846,366 | |
California Statewide CDA Huntington Memorial Hospital (Health Revenue) | | | 5.00 | | | | 07/01/2027 | | | | 3,080,000 | | | | 3,116,467 | |
California Statewide CDA Insured St Joseph Health System (Health Revenue, AGM Insured) | | | 5.25 | | | | 07/01/2021 | | | | 1,775,000 | | | | 2,023,411 | |
California Statewide CDA Pioneer Park Project Series T (Housing Revenue, GNMAFHA Insured) | | | 6.10 | | | | 12/20/2035 | | | | 2,010,000 | | | | 2,021,437 | |
California Statewide CDA Referendum International School Peninsula Project (Education Revenue) | | | 5.00 | | | | 11/01/2016 | | | | 1,190,000 | | | | 1,210,873 | |
California Statewide CDA School Facilities (Miscellaneous Revenue) | | | 6.75 | | | | 07/01/2031 | | | | 2,625,000 | | | | 2,668,181 | |
California Statewide CDA School Facilities Aspire Public Schools (Miscellaneous Revenue) | | | 5.20 | | | | 07/01/2020 | | | | 595,000 | | | | 603,288 | |
California Statewide CDA Valleycare Health System Series A (Health Revenue) | | | 5.00 | | | | 07/15/2022 | | | | 1,000,000 | | | | 947,350 | |
California Statewide CDA Water & Wastewater Pooled Series B (Water & Sewer Revenue, FSA Insured) | | | 5.25 | | | | 10/01/2027 | | | | 4,000,000 | | | | 4,043,280 | |
California Statewide Community University of California Irvine East Campus Apartments Phase I (Housing Revenue) | | | 5.13 | | | | 05/15/2031 | | | | 1,250,000 | | | | 1,265,238 | |
Camrosa CA Water District Financing Authority Water & Sewer Series A (Water & Sewer Revenue) | | | 5.00 | | | | 01/15/2031 | | | | 2,000,000 | | | | 2,103,920 | |
Capistrano CA Unified School District School Facilities Improvement District #1 Series C (Tax Revenue, AGM Insured) | | | 5.50 | | | | 08/01/2022 | | | | 1,215,000 | | | | 1,231,609 | |
Capitol Area Development Authority California Series A (Lease Revenue, NATL-RE Insured) | | | 6.50 | | | | 04/01/2012 | | | | 30,000 | | | | 30,143 | |
Carson CA RDA Tax Allocation Series A (Tax Revenue, NATL-RE Insured) | | | 5.25 | | | | 10/01/2020 | | | | 1,140,000 | | | | 1,189,693 | |
Cathedral City CA PFA CAB Series A (Tax Revenue, NATL-RE Insured)(z) | | | 6.02 | | | | 08/01/2024 | | | | 1,075,000 | | | | 509,883 | |
Cathedral City CA PFA CAB Series A (Tax Revenue, NATL-RE Insured)(z) | | | 6.33 | | | | 08/01/2026 | | | | 1,085,000 | | | | 437,798 | |
Center California Unified School District CAB Series C (Tax Revenue, NATL-RE Insured)(z) | | | 4.73 | | | | 09/01/2021 | | | | 5,000,000 | | | | 3,178,650 | |
Central Valley CA School District Financing Authority Series A (Miscellaneous Revenue, NATL-RE Insured) | | | 6.45 | | | | 02/01/2018 | | | | 2,645,000 | | | | 2,964,172 | |
Chico CA PFA Redevelopment Project Area (Tax Revenue, NATL-RE Insured) | | | 5.13 | | | | 04/01/2021 | | | | 3,000,000 | | | | 3,006,870 | |
College of The Sequoias Tulare Area Improvement District # 3 California Election of 2008 Series A (Tax Revenue, Assured Guaranty Insured)(z) | | | 5.23 | | | | 08/01/2024 | | | | 1,000,000 | | | | 521,830 | |
Compton CA Community Redevelopment Agency Redevelopment Project 2nd Lien Series A (Tax Revenue) | | | 5.00 | | | | 08/01/2020 | | | | 1,140,000 | | | | 1,195,324 | |
Compton CA Community Redevelopment Agency Redevelopment Project 2nd Lien Series B (Tax Revenue) | | | 5.75 | | | | 08/01/2026 | | | | 6,895,000 | | | | 7,011,319 | |
Compton CA Solid Waste Management Facilities (Resource Recovery Revenue) | | | 4.80 | | | | 08/01/2020 | | | | 250,000 | | | | 259,250 | |
Contra Costa County CA Home GNMA Mortgage Backed Securities Program (Housing Revenue, GNMA Insured) | | | 7.75 | | | | 05/01/2022 | | | | 245,000 | | | | 318,948 | |
Contra Costa County CA PFA Unrefunded 2007 Pleasant Hill (Tax Revenue) | | | 5.25 | | | | 08/01/2028 | | | | 750,000 | | | | 668,220 | |
Delano CA Union High School Election of 2010 Series B (Tax Revenue, AGM Insured) | | | 5.75 | | | | 08/01/2035 | | | | 5,510,000 | | | | 6,282,006 | |
Duarte CA COP Series A (Health Revenue) | | | 5.25 | | | | 04/01/2019 | | | | 1,500,000 | | | | 1,502,520 | |
Duarte CA COP Series A (Health Revenue) | | | 5.25 | | | | 04/01/2024 | | | | 6,515,000 | | | | 6,520,277 | |
Duarte CA RDA CAB Sub Merged Redevelopment Project (Tax Revenue)(z) | | | 3.61 | | | | 12/01/2016 | | | | 2,665,000 | | | | 2,232,790 | |
East Bay California MUD Subseries A (Utilities Revenue, AGM Insured)± | | | 0.70 | | | | 06/01/2025 | | | | 2,525,000 | | | | 2,525,000 | |
Elk Grove CA Unified School District Special Tax Refunding Community Facilities District Project (Tax Revenue, AMBAC Insured) | | | 6.50 | | | | 12/01/2024 | | | | 1,500,000 | | | | 1,649,025 | |
Emeryville CA PFA Assessment Distribution Refinancing (Miscellaneous Revenue) | | | 5.75 | | | | 09/02/2014 | | | | 500,000 | | | | 500,925 | |
| | | | |
| 12 | | Wells Fargo Advantage California Tax-Free Fund | | Portfolio of Investments—December 31, 2011 (Unaudited) |
| | | | | | | | | | | | | | | | |
| Security Name | | Interest Rate | | | Maturity Date | | | Principal | | | Value | |
| | | | | | | | | | | | | | | | |
| | | | |
| California (continued) | | | | | | | | | | | | | | | | |
Emeryville CA PFA Assessment Distribution Refinancing (Miscellaneous Revenue) | | | 5.90 | % | | | 09/02/2021 | | | $ | 1,750,000 | | | $ | 1,750,770 | |
Escondido CA Union High School CAB Election of 2008 Series A (Tax Revenue, Assured Guaranty Insured)(z) | | | 5.51 | | | | 08/01/2027 | | | | 8,385,000 | | | | 3,588,528 | |
Etiwanda CA School District PFA Loan Agency (Miscellaneous Revenue, Assured Guaranty Insured) | | | 5.00 | | | | 09/15/2032 | | | | 2,000,000 | | | | 2,103,320 | |
Fontana CA RDA Jurupa Hills Redevelopment Project Series A (Tax Revenue) | | | 5.50 | | | | 10/01/2017 | | | | 2,455,000 | | | | 2,467,643 | |
Fontana CA RDA Jurupa Hills Redevelopment Project Series A (Tax Revenue) | | | 5.60 | | | | 10/01/2027 | | | | 4,785,000 | | | | 4,791,077 | |
Foothill/Eastern Corridor CA Transportation Agency (Transportation Revenue) | | | 5.75 | | | | 01/15/2040 | | | | 4,000,000 | | | | 3,759,400 | |
Foothill/Eastern Corridor CA Transportation Agency (Transportation Revenue, NATL-RE-IBC Insured)± | | | 5.80 | | | | 01/15/2020 | | | | 3,000,000 | | | | 3,032,130 | |
Foothill/Eastern Corridor CA Transportation Agency (Transportation Revenue, NATL-RE-IBC Insured)± | | | 5.85 | | | | 01/15/2023 | | | | 3,000,000 | | | | 3,027,780 | |
Gilroy CA Unified School District Election of 2008 Series A (Tax Revenue, Assured Guaranty Insured) | | | 6.00 | | | | 08/01/2027 | | | | 1,000,000 | | | | 1,174,000 | |
Golden West Schools Financing Authority California CAB Series A (Miscellaneous Revenue, NATL-RE Insured)(z) | | | 3.46 | | | | 08/01/2015 | | | | 2,000,000 | | | | 1,767,120 | |
Golden West Schools Financing Authority California CAB Series PG-A (Miscellaneous Revenue, NATL-RE Insured)(z) | | | 5.21 | | | | 08/01/2016 | | | | 585,000 | | | | 461,822 | |
Hawaiian Gardens CA RDA Project # 1 (Tax Revenue) | | | 6.00 | | | | 12/01/2013 | | | | 1,320,000 | | | | 1,324,554 | |
Hesperia CA Unified School District COP Interim School Facility Funding Program (Lease Revenue, AGM Insured)± | | | 3.50 | | | | 02/01/2028 | | | | 3,240,000 | | | | 3,240,000 | |
Hesperia CA Unified School District COP Interim School Facility Funding Program (GO-Local, AGM Insured)± | | | 3.50 | | | | 02/01/2038 | | | | 2,000,000 | | | | 2,000,000 | |
Inland Valley CA Development Agency Series C (Tax Revenue)± | | | 4.50 | | | | 03/01/2041 | | | | 3,750,000 | | | | 3,832,725 | |
Irvine Ranch CA Water District Various Refunding Series A-1 (Utilities Revenue, GO of District Insured)±§ | | | 0.14 | | | | 10/01/2037 | | | | 975,000 | | | | 974,971 | |
Jamul-Dulzura CA Unified School District Series C (Tax Revenue) | | | 6.40 | | | | 08/01/2016 | | | | 140,000 | | | | 140,657 | |
Jefferson CA Union High School CAB Election of 2006 Series D (Tax Revenue)(z) | | | 7.34 | | | | 08/01/2034 | | | | 9,905,000 | | | | 1,953,068 | |
Jefferson CA Union High School CAB Election of 2006 Series D (Tax Revenue)(z) | | | 7.43 | | | | 08/01/2036 | | | | 11,130,000 | | | | 1,863,496 | |
Jurupa CA Unified School District Refunding Program (Tax Revenue, AGM Insured) | | | 5.00 | | | | 08/01/2020 | | | | 2,140,000 | | | | 2,487,301 | |
Jurupa CA Unified School District Refunding Program (Tax Revenue, AGM Insured) | | | 5.00 | | | | 08/01/2022 | | | | 2,370,000 | | | | 2,735,241 | |
Kaweah CA Delta Health Care District Election of 2003 (Tax Revenue, NATL-RE Insured) | | | 5.25 | | | | 08/01/2028 | | | | 5,370,000 | | | | 5,468,378 | |
La Quinta CA Redevelopment Agency Tax Redevelopment Project Area #1 (Tax Revenue, AMBAC Insured) | | | 5.00 | | | | 09/01/2022 | | | | 1,000,000 | | | | 1,028,610 | |
La Quinta CA Redevelopment Agency Tax Redevelopment Project Area #1 (Tax Revenue, AMBAC Insured) | | | 5.00 | | | | 09/01/2021 | | | | 1,000,000 | | | | 1,021,210 | |
Lake Elsinore CA School Financing Authority Horsethief Canyon (Tax Revenue) | | | 5.63 | | | | 09/01/2016 | | | | 2,430,000 | | | | 2,438,311 | |
Lancaster CA Redevelopment Agency Tax Allocation Combined Redevelopment Project Areas (Tax Revenue) | | | 6.50 | | | | 08/01/2029 | | | | 2,000,000 | | | | 2,065,020 | |
Lodi CA Unified School District (Tax Revenue, NATL-RE Insured) | | | 5.00 | | | | 08/01/2022 | | | | 4,195,000 | | | | 4,254,317 | |
Lodi CA Unified School District School Facility Election of 2006 (Tax Revenue, AGM Insured) | | | 5.00 | | | | 08/01/2030 | | | | 2,000,000 | | | | 2,104,280 | |
Long Beach CA Bond Financing Authority (Miscellaneous Revenue, AMBAC Insured) | | | 6.00 | | | | 11/01/2017 | | | | 1,320,000 | | | | 1,416,716 | |
| | | | | | |
| Portfolio of Investments—December 31, 2011 (Unaudited) | | Wells Fargo Advantage California Tax-Free Fund | | | 13 | |
| | | | | | | | | | | | | | | | |
| Security Name | | Interest Rate | | | Maturity Date | | | Principal | | | Value | |
| | | | | | | | | | | | | | | | |
| | | | |
| California (continued) | | | | | | | | | | | | | | | | |
Long Beach CA Bond Financing Authority Redevelopment Housing & Gas Utilities Financing Series A-1 (IDR, AMBAC Insured) | | | 5.00 | % | | | 08/01/2030 | | | $ | 5,000,000 | | | $ | 4,423,700 | |
Long Beach CA Unified School District Election of 2008 Series A (Tax Revenue) | | | 5.50 | | | | 08/01/2026 | | | | 2,530,000 | | | | 2,976,874 | |
Los Angeles CA ABC Unified School District Election of 1997 Series B (Tax Revenue, NATL-RE FGIC GO of Distric Insured)(z) | | | 3.77 | | | | 08/01/2018 | | | | 1,500,000 | | | | 1,171,155 | |
Los Angeles CA Community Redevelopment Agency Manchester Social Services Project (Lease Revenue, AMBAC Insured) | | | 5.00 | | | | 09/01/2025 | | | | 2,310,000 | | | | 2,362,645 | |
Los Angeles CA Community Redevelopment Agency MFHR The Alexandria Project (Housing Revenue, Fleet National Bank LOC)±§ | | | 4.90 | | | | 08/15/2039 | | | | 4,740,000 | | | | 5,292,921 | |
Los Angeles CA Community Redevelopment Refunding Grand Central Square Class B (Tax Revenue) | | | 5.00 | | | | 12/01/2022 | | | | 1,200,000 | | | | 1,146,432 | |
Los Angeles CA COP Sonneblick del Rio Project (Lease Revenue, AMBAC Insured) | | | 6.00 | | | | 11/01/2019 | | | | 2,000,000 | | | | 2,005,580 | |
Los Angeles CA Department of Airports Ontario International Series A (Airport Revenue, NATL-RE Insured) | | | 5.00 | | | | 05/15/2025 | | | | 2,925,000 | | | | 2,992,831 | |
Los Angeles CA Harbor Department (Port Authority Revenue) | | | 7.60 | | | | 10/01/2018 | | | | 85,000 | | | | 103,669 | |
M-S-R California Energy Authority California Gas Series C (Utilities Revenue) | | | 6.13 | | | | 11/01/2029 | | | | 1,060,000 | | | | 1,142,139 | |
M-S-R California Energy Authority Series B (Energy Revenue) | | | 7.00 | | | | 11/01/2034 | | | | 1,000,000 | | | | 1,195,090 | |
Merced CA Union High School District CAB Election of 2008 Series C (Tax Revenue)(z) | | | 6.12 | | | | 08/01/2032 | | | | 3,380,000 | | | | 977,158 | |
Merced CA Union High School District CAB Series A (Tax Revenue, NATL-RE FGIC Insured)(z) | | | 3.43 | | | | 08/01/2018 | | | | 2,135,000 | | | | 1,704,008 | |
Monrovia CA RDA Central Redevelopment Project Area 1 (Tax Revenue, AMBAC Insured) | | | 5.00 | | | | 05/01/2021 | | | | 3,820,000 | | | | 3,856,672 | |
Montebello CA Unified School District CAB (Tax Revenue, AGM Insured)(z) | | | 4.84 | | | | 08/01/2021 | | | | 1,435,000 | | | | 906,461 | |
Montebello CA Unified School District Election of 2004 (Tax Revenue, NATL-RE Insured) | | | 5.00 | | | | 08/01/2030 | | | | 3,175,000 | | | | 3,201,797 | |
Morongo Band of Mission Indians California Enterprise Casino Series B (Miscellaneous Revenue)144A | | | 6.50 | | | | 03/01/2028 | | | | 2,000,000 | | | | 1,926,660 | |
Napa-Vallejo CA Waste Management Authority Solid Waste Transfer Facility (Resource Recovery Revenue) | | | 5.50 | | | | 02/15/2013 | | | | 1,080,000 | | | | 1,082,516 | |
Natomas CA Unified School District Series 1999 (Tax Revenue, NATL-RE Insured) | | | 5.95 | | | | 09/01/2021 | | | | 1,000,000 | | | | 1,108,130 | |
Northern California Gas Authority # 1 LIBOR (Utilities Revenue)± | | | 0.88 | | | | 07/01/2019 | | | | 7,000,000 | | | | 5,530,210 | |
Northern California Gas Authority # 1 LIBOR (Energy Revenue)± | | | 0.96 | | | | 07/01/2027 | | | | 5,000,000 | | | | 3,554,400 | |
Northern California Power Agency Public Power Prerefunded Balance (Utilities Revenue, AMBAC Insured)§ | | | 7.50 | | | | 07/01/2023 | | | | 50,000 | | | | 69,186 | |
Northern Inyo County CA Local Hospital District (Tax Revenue, AGC-ICC Insured) | | | 5.60 | | | | 08/01/2035 | | | | 1,600,000 | | | | 1,660,128 | |
Norwalk-LA Mirada CA Unified School District Election of 2002 Series D (Tax Revenue, AGM Insured)(z) | | | 5.06 | | | | 08/01/2023 | | | | 1,500,000 | | | | 839,670 | |
Oakland CA Series A-Measure G (Tax Revenue, NATL-RE FGIC Insured) | | | 5.00 | | | | 01/15/2027 | | | | 2,970,000 | | | | 2,977,663 | |
Ontario CA RDFA Ontario Redevelopment Project # 1 (Tax Revenue, NATL-RE Insured) | | | 5.80 | | | | 08/01/2023 | | | | 1,110,000 | | | | 1,342,789 | |
Ontario CA RDFA Ontario Redevelopment Project # 1 (Tax Revenue, NATL-RE Insured) | | | 6.00 | | | | 08/01/2015 | | | | 930,000 | | | | 988,404 | |
Palm Springs CA Palm Springs International Airport (Port Authority Revenue) | | | 6.00 | | | | 07/01/2018 | | | | 290,000 | | | | 288,599 | |
Palm Springs CA Palm Springs International Airport (Port Authority Revenue) | | | 6.40 | | | | 07/01/2023 | | | | 500,000 | | | | 478,425 | |
Palo Verde CA Unified School District FlexFund Program (Lease Revenue) | | | 4.80 | | | | 09/01/2027 | | | | 1,769,169 | | | | 1,823,890 | |
Palomar CA Pomerado Health Care District COP (Health Revenue) | | | 5.50 | | | | 11/01/2019 | | | | 4,950,000 | | | | 5,297,144 | |
Paramount CA Unified School District Election of 2006 (Tax Revenue)(z) | | | 6.24 | | | | 08/01/2033 | | | | 2,500,000 | | | | 663,575 | |
Pasadena CA Old Pasadena Parking Facilities Project (Lease Revenue) | | | 6.25 | | | | 01/01/2018 | | | | 1,025,000 | | | | 1,152,920 | |
Perris CA PFA Series A (Tax Revenue, NATL-RE Insured) | | | 5.25 | | | | 10/01/2020 | | | | 1,030,000 | | | | 1,064,484 | |
| | | | |
| 14 | | Wells Fargo Advantage California Tax-Free Fund | | Portfolio of Investments—December 31, 2011 (Unaudited) |
| | | | | | | | | | | | | | | | |
| Security Name | | Interest Rate | | | Maturity Date | | | Principal | | | Value | |
| | | | | | | | | | | | | | | | |
| | | | |
| California (continued) | | | | | | | | | | | | | | | | |
Perris CA PFA Series A (Tax Revenue) | | | 5.75 | % | | | 10/01/2031 | | | $ | 2,045,000 | | | $ | 2,159,295 | |
Pico Rivera CA Water Authority Series A (Water & Sewer Revenue, NATL-RE Insured) | | | 5.50 | | | | 05/01/2019 | | | | 2,000,000 | | | | 2,140,000 | |
Pico Rivera CA Water Authority Series A (Water & Sewer Revenue) | | | 6.25 | | | | 12/01/2032 | | | | 5,500,000 | | | | 5,513,420 | |
Pioneer CA Union Elementary School District COP (Lease Revenue, NATL-RE Insured) | | | 5.00 | | | | 08/01/2029 | | | | 2,635,000 | | | | 2,718,371 | |
Pomona CA Unified School District Series A (Tax Revenue, NATL-RE Insured) | | | 6.55 | | | | 08/01/2029 | | | | 2,480,000 | | | | 3,100,050 | |
Port Oakland CA Series L Unrefunded Balance (Port Authority Revenue, NATL-RE FGIC Insured) | | | 5.50 | | | | 11/01/2020 | | | | 1,775,000 | | | | 1,812,701 | |
Port Oakland CA Unrefunded Balance AMT Refunding Series N (Port Authority Revenue, NATL-RE Insured) | | | 5.00 | | | | 11/01/2022 | | | | 5,330,000 | | | | 5,403,501 | |
Port Oakland CA Unrefunded Balance AMT Series L (Port Authority Revenue, NATL-RE FGIC Insured) | | | 5.38 | | | | 11/01/2027 | | | | 2,070,000 | | | | 2,090,679 | |
Port Oakland CA Unrefunded Balance Series M (Port Authority Revenue, NATL-RE-IBC FGIC Insured) | | | 5.38 | | | | 11/01/2027 | | | | 4,385,000 | | | | 4,430,955 | |
Port of Redwood City CA (Port Authority Revenue) | | | 5.13 | | | | 06/01/2030 | | | | 3,600,000 | | | | 3,338,532 | |
Poway CA Unified School District Election of 2008 Import District 07-1-A (Tax Revenue)(z) | | | 5.03 | | | | 08/01/2024 | | | | 1,800,000 | | | | 961,452 | |
Redlands CA RDA Project Area Series A (Tax Revenue, AMBAC Insured) | | | 4.63 | | | | 08/01/2022 | | | | 735,000 | | | | 688,364 | |
Redwood City CA RDA CAB Redevelopment Project Area 2-A (Tax Revenue, AMBAC Insured)(z) | | | 6.75 | | | | 07/15/2030 | | | | 3,505,000 | | | | 1,025,388 | |
Rialto CA RDA Merged Project Area Series A (Tax Revenue) | | | 5.00 | | | | 09/01/2021 | | | | 1,000,000 | | | | 1,004,510 | |
Rialto CA Unified School District CAB Election of 2010 Series A (Tax Revenue, AGM Insured)(z) | | | 5.67 | | | | 08/01/2026 | | | | 3,320,000 | | | | 1,468,801 | |
Richmond CA Joint Powers Financing Authority Civic Center Project Series A (Lease Revenue, Assured Guaranty Insured) | | | 5.88 | | | | 08/01/2037 | | | | 5,000,000 | | | | 5,417,450 | |
Richmond CA Joint Powers Financing Authority Point Potrero Series A (Lease Revenue) | | | 6.25 | | | | 07/01/2024 | | | | 7,500,000 | | | | 8,303,250 | |
Richmond CA Joint Powers Financing Authority Series A (Lease Revenue) | | | 5.25 | | | | 05/15/2013 | | | | 115,000 | | | | 115,187 | |
Riverside County CA Asset Leasing Corporation Riverside County Hospital Project (Health Revenue, NATL-RE Insured)(z) | | | 6.33 | | | | 06/01/2026 | | | | 8,980,000 | | | | 3,661,236 | |
Riverside County CA Palm Desert Financing Authority Series A (Lease Revenue) | | | 6.00 | | | | 05/01/2022 | | | | 5,270,000 | | | | 5,832,731 | |
Roseville CA Natural Gas Financing Authority (Energy Revenue) | | | 5.00 | | | | 02/15/2025 | | | | 1,905,000 | | | | 1,856,594 | |
Sacramento County CA Airport System AMT Senior Series B (Port Authority Revenue, AGM Insured) | | | 5.75 | | | | 07/01/2024 | | | | 2,000,000 | | | | 2,238,720 | |
Sacramento County CA Animal Care Youth Detention (Lease Revenue, AMBAC Insured) | | | 5.00 | | | | 10/01/2025 | | | | 1,085,000 | | | | 1,132,827 | |
Sacramento County CA City Financing Authority Series A (Lease Revenue, AMBAC Insured) | | | 5.40 | | | | 11/01/2020 | | | | 2,500,000 | | | | 2,755,600 | |
Sacramento County CA Sanitation Districts Financing Authority Class A (Water & Sewer Revenue, FGIC Insured)± | | | 0.98 | | | | 12/01/2035 | | | | 6,000,000 | | | | 6,000,000 | |
Sacramento County CA Water Financing Authority Water Agency Zones 40 & 41 Series B (Water & Sewer Revenue, NATL-RE FGIC Insured)± | | | 0.90 | | | | 06/01/2034 | | | | 11,365,000 | | | | 7,112,672 | |
San Bernardino County CA COP Arrowhead Project Series A (Lease Revenue) | | | 5.50 | | | | 08/01/2020 | | | | 6,000,000 | | | | 6,908,400 | |
San Bernardino County CA COP Medical Center Financing Project (Lease Revenue, NATL-RE Insured) | | | 5.00 | | | | 08/01/2028 | | | | 5,815,000 | | | | 5,814,767 | |
San Bernardino County CA Financing Authority Courthouse Facilities Project (Miscellaneous Revenue, NATL-RE Insured) | | | 5.50 | | | | 06/01/2037 | | | | 3,270,000 | | | | 3,295,539 | |
San Buenaventura CA Community Mental Health System (Health Revenue) | | | 8.00 | | | | 12/01/2031 | | | | 3,500,000 | | | | 3,936,450 | |
San Diego CA PFFA Ball Park Series A (Lease Revenue, AMBAC Insured)144A | | | 5.25 | | | | 02/15/2032 | | | | 4,825,000 | | | | 4,904,806 | |
San Diego CA PFFA Refunding Balance Ballpark Project Series A (Lease Revenue, AMBAC Insured)144A | | | 5.25 | | | | 02/15/2026 | | | | 4,950,000 | | | | 5,129,438 | |
| | | | | | |
| Portfolio of Investments—December 31, 2011 (Unaudited) | | Wells Fargo Advantage California Tax-Free Fund | | | 15 | |
| | | | | | | | | | | | | | | | |
| Security Name | | Interest Rate | | | Maturity Date | | | Principal | | | Value | |
| | | | | | | | | | | | | | | | |
| | | | |
| California (continued) | | | | | | | | | | | | | | | | |
San Diego CA RDA CAB Tax Allocation Centre (Tax Revenue, AGM Insured)(z) | | | 5.19 | % | | | 09/01/2023 | | | $ | 885,000 | | | $ | 486,325 | |
San Diego CA RDA Centre City Sub Parking Series B (Transportation Revenue) | | | 5.30 | | | | 09/01/2020 | | | | 1,060,000 | | | | 1,061,378 | |
San Diego CA Redevelopment Agency (Tax Revenue) | | | 5.00 | | | | 09/01/2025 | | | | 575,000 | | | | 581,009 | |
San Diego County CA Unified School District TRAN Series B-2 (Miscellaneous Revenue, GO of Participants Insured) | | | 2.00 | | | | 04/30/2012 | | | | 700,000 | | | | 704,095 | |
San Francisco CA City & County COP Multiple Capital Improvement Projects Series A (Lease Revenue) | | | 5.20 | | | | 04/01/2026 | | | | 3,000,000 | | | | 3,265,860 | |
San Francisco CA City & County International Airport Series A (Port Authority Revenue) | | | 4.90 | | | | 05/01/2029 | | | | 2,850,000 | | | | 3,007,206 | |
San Francisco CA City & County RDFA Mission Bay North Redevelopment Series C (Tax Revenue) | | | 4.50 | | | | 08/01/2016 | | | | 250,000 | | | | 261,623 | |
San Francisco CA City & County RDFA Mission Bay North Redevelopment Series C (Tax Revenue) | | | 3.00 | | | | 08/01/2013 | | | | 470,000 | | | | 476,237 | |
San Francisco CA City & County RDFA Mission Bay North Redevelopment Series C (Tax Revenue) | | | 4.00 | | | | 08/01/2014 | | | | 385,000 | | | | 393,162 | |
San Joaquin Hills County CA Transportation Corridor Agency CAB Series A (Transportation Revenue, NATL-RE Insured)(z) | | | 6.28 | | | | 01/15/2015 | | | | 4,060,000 | | | | 3,363,913 | |
San Jose CA Libraries & Parks Project (Tax Revenue) | | | 5.13 | | | | 09/01/2031 | | | | 2,040,000 | | | | 2,046,365 | |
San Jose CA Redevelopment Agency Tax Allocation Refunding Merged Area Redevelopment Project Series C (Tax Revenue, NATL-RE Insured) | | | 5.00 | | | | 08/01/2025 | | | | 2,000,000 | | | | 1,899,580 | |
San Jose CA Redevelopment Agency Tax Allocation Refunding Merged Area Redevelopment Project Series C (Tax Revenue, NATL-RE Insured) | | | 5.00 | | | | 08/01/2026 | | | | 1,650,000 | | | | 1,542,750 | |
San Jose CA Unified School District (Lease Revenue, AGM Insured)(z) | | | 4.05 | | | | 01/01/2021 | | | | 1,205,000 | | | | 838,403 | |
San Jose CA Unified School District (Lease Revenue, AGM Insured)(z) | | | 5.44 | | | | 01/01/2026 | | | | 3,175,000 | | | | 1,495,362 | |
San Mateo County CA Jefferson Union High School District Election of 2006 Series D (Tax Revenue)(z) | | | 7.28 | | | | 08/01/2033 | | | | 8,865,000 | | | | 1,904,379 | |
San Rafael City CA High School District CAB Election of 2002 Series B (Tax Revenue, NATL-RE FGIC Insured)(z) | | | 4.65 | | | | 08/01/2023 | | | | 1,260,000 | | | | 738,801 | |
Sanger CA Unified School District Refunding Revenue (Tax Revenue, NATL-RE Insured) | | | 5.60 | | | | 08/01/2023 | | | | 2,530,000 | | | | 2,820,722 | |
Santa Ana CA Community Redevelopment Merged Project Area Series A (Tax Revenue) | | | 6.00 | | | | 09/01/2022 | | | | 2,000,000 | | | | 2,233,900 | |
Santa Ana CA Unified School District CAB Election of 2008 Series B (Tax Revenue, Assured Guaranty Insured)(z) | | | 6.34 | | | | 08/01/2038 | | | | 20,495,000 | | | | 3,909,216 | |
Santa Cruz County CA Live Oak School District COP (Lease Revenue, Assured Guaranty Insured) | | | 5.50 | | | | 08/01/2029 | | | | 1,000,000 | | | | 1,106,930 | |
Santa Cruz County CA RDA California Live Oak Soquel Community Improvement Project (Tax Revenue) | | | 6.63 | | | | 09/01/2029 | | | | 2,100,000 | | | | 2,372,034 | |
School Facilities Financing Authority California Grant Joint Union High School Series A (Miscellaneous Revenue, AGM Insured)(z) | | | 4.35 | | | | 08/01/2020 | | | | 1,455,000 | | | | 1,004,008 | |
Simi Valley CA Unified School District Capital Improvement Projects (Lease Revenue, AMBAC Insured) | | | 5.25 | | | | 08/01/2022 | | | | 1,970,000 | | | | 2,059,477 | |
Sonoma CA Community RDA The Springs Redevelopment Project (Tax Revenue, Assured Guaranty Insured) | | | 6.50 | | | | 08/01/2028 | | | | 3,000,000 | | | | 3,133,320 | |
Sonoma Valley CA Unified School CAB Election of 2010 Series A (Tax Revenue)(z) | | | 5.48 | | | | 08/01/2027 | | | | 1,020,000 | | | | 438,529 | |
South Gate CA PFA South Gate Redevelopment Project # 1 (Tax Revenue, XLCA Insured) | | | 5.25 | | | | 09/01/2019 | | | | 2,015,000 | | | | 2,071,017 | |
South Pasadena CA Unified School District Series A (Tax Revenue, FGIC-TCRS Insured) | | | 5.55 | | | | 11/01/2020 | | | | 810,000 | | | | 979,476 | |
Southern California Logistics Airport Authority Refunding Southern California Airport Authority Project (Tax Revenue, XLCA Insured) | | | 5.00 | | | | 12/01/2036 | | | | 2,700,000 | | | | 1,645,920 | |
| | | | |
| 16 | | Wells Fargo Advantage California Tax-Free Fund | | Portfolio of Investments—December 31, 2011 (Unaudited) |
| | | | | | | | | | | | | | | | |
| Security Name | | Interest Rate | | | Maturity Date | | | Principal | | | Value | |
| | | | | | | | | | | | | | | | |
| | | | |
| California (continued) | | | | | | | | | | | | | | | | |
Southern California Public Power Authority Magnolia Power Project Series 2009-1-A (Utilities Revenue, KBC Bank NV LOC)± | | | 1.05 | % | | | 07/01/2036 | | | $ | 2,000,000 | | | $ | 2,000,000 | |
Southwest Community California Finance Authority Riverside County (Lease Revenue) | | | 6.38 | | | | 05/01/2033 | | | | 3,515,000 | | | | 3,863,407 | |
Sulphur Springs CA Unified School District Series A (Tax Revenue, NATL-RE Insured)(z) | | | 2.28 | | | | 09/01/2013 | | | | 5,690,000 | | | | 5,476,511 | |
Susanville CA PFA Refunding Senior Utility Enterprise Series A (Water & Sewer Revenue, AGM Insured) | | | 4.75 | | | | 06/01/2030 | | | | 2,005,000 | | | | 2,060,960 | |
Sweetwater CA Union High School District PFA Series A (Tax Revenue, AGM Insured) | | | 5.00 | | | | 09/01/2026 | | | | 2,090,000 | | | | 2,149,774 | |
Torrance CA COP Refunding and Public Improvement Project Series A (Lease Revenue, AMBAC Insured) | | | 5.00 | | | | 06/01/2034 | | | | 1,310,000 | | | | 1,316,760 | |
Torrance CA COP Refunding and Public Improvement Project Series A (Lease Revenue, AMBAC Insured) | | | 5.25 | | | | 06/01/2034 | | | | 2,690,000 | | | | 2,719,079 | |
Tracy CA Operating Partnership Joint Powers Authority Capital Improvement Projects (Lease Revenue, Assured Guaranty Insured) | | | 6.25 | | | | 10/01/2033 | | | | 1,000,000 | | | | 1,119,370 | |
Tulare CA PFFA Capital Facilities Project (Lease Revenue, Assured Guaranty Insured) | | | 5.25 | | | | 04/01/2027 | | | | 3,000,000 | | | | 3,217,470 | |
Union City CA Community RDA (Tax Revenue, Assured Guaranty Insured) | | | 5.25 | | | | 10/01/2033 | | | | 13,440,000 | | | | 14,131,891 | |
Union City CA Community RDA Series A (Tax Revenue, AMBAC Insured) | | | 5.38 | | | | 10/01/2034 | | | | 5,000,000 | | | | 4,944,550 | |
University of California Revenues Unrefunded Balance UCLA Medical Center Series A (Health Revenue, AMBAC Insured) | | | 5.25 | | | | 05/15/2030 | | | | 465,000 | | | | 465,888 | |
Vacaville CA Unified School District (Lease Revenue, Assured Guaranty Insured) | | | 6.50 | | | | 12/01/2034 | | | | 1,260,000 | | | | 1,430,780 | |
Vallejo City CA Unified School District Refunding Series A (Tax Revenue, NATL-RE Insured) | | | 5.90 | | | | 02/01/2017 | | | | 1,000,000 | | | | 1,094,800 | |
Ventura County CA MFHR Mira Vista Senior Apartments Series A (Housing Revenue, AMBAC Insured) | | | 5.05 | | | | 12/01/2026 | | | | 1,000,000 | | | | 857,800 | |
Vista CA Community Development Commission Vista Redevelopment Project Area (Tax Revenue) | | | 5.88 | | | | 09/01/2037 | | | | 2,500,000 | | | | 2,500,450 | |
Walnut Valley CA Unified School District Series C (Tax Revenue, FGIC Insured) | | | 5.75 | | | | 08/01/2015 | | | | 1,135,000 | | | | 1,140,210 | |
West Contra Costa CA Healthcare District (Health Revenue) | | | 6.00 | | | | 07/01/2032 | | | | 3,000,000 | | | | 3,074,160 | |
West Contra Costa CA Healthcare District COP (Tax Revenue, AMBAC Insured) | | | 5.50 | | | | 07/01/2029 | | | | 2,000,000 | | | | 2,001,840 | |
West Contra Costa CA Unified School District (Tax Revenue, AGM Insured) | | | 5.25 | | | | 08/01/2024 | | | | 1,350,000 | | | | 1,528,025 | |
West Contra Costa CA Unified School District Election of 2005 Series B (Tax Revenue) | | | 6.00 | | | | 08/01/2027 | | | | 1,080,000 | | | | 1,276,085 | |
West Contra Costa CA Unified School District Election of 2005 Series C-1 (Tax Revenue, Assured Guaranty Insured)(z) | | | 4.72 | | | | 08/01/2021 | | | | 6,000,000 | | | | 3,832,860 | |
West Fresno CA Elementary School District Election of 1997 Series C (Tax Revenue, AGM Insured) | | | 6.60 | | | | 05/01/2035 | | | | 1,000,000 | | | | 1,191,300 | |
West Hollywood CA Community Development East Side Redevelopment Project Series A (Tax Revenue) | | | 7.00 | | | | 09/01/2026 | | | | 875,000 | | | | 944,388 | |
West Hollywood CA Community Development East Side Redevelopment Project Series A (Tax Revenue) | | | 7.25 | | | | 09/01/2031 | | | | 1,000,000 | | | | 1,087,530 | |
Windsor CA Joint Powers Financing Authority Windsor Civic Center Series A (Lease Revenue, AGM Insured) | | | 5.38 | | | | 10/01/2018 | | | | 2,145,000 | | | | 2,174,108 | |
Wiseburn CA School District CAB (Tax Revenue, Assured Guaranty Insured)(z) | | | 5.51 | | | | 08/01/2027 | | | | 1,525,000 | | | | 652,654 | |
Yorba Linda CA RDA CAB Redevelopment Series A (Tax Revenue, NATL-RE Insured)(z) | | | 4.76 | | | | 09/01/2019 | | | | 1,810,000 | | | | 1,260,194 | |
Yuba CA Community College District Election of 2006 Series C (Tax Revenue) | | | 5.25 | | | | 08/01/2047 | | | | 5,000,000 | | | | 5,173,350 | |
| | | | |
| | | | | | | | | | | | | | | 657,987,381 | |
| | | | | | | | | | | | | | | | |
| | | | | | |
| Portfolio of Investments—December 31, 2011 (Unaudited) | | Wells Fargo Advantage California Tax-Free Fund | | | 17 | |
| | | | | | | | | | | | | | | | |
| Security Name | | Interest Rate | | | Maturity Date | | | Principal | | | Value | |
| | | | | | | | | | | | | | | | |
| | | | |
| Guam: 0.16% | | | | | | | | | | | | | | | | |
Guam Government Business Privilege Tax Series A (Tax Revenue) | | | 5.00 | % | | | 01/01/2031 | | | $ | 1,000,000 | | | $ | 1,057,250 | |
| | | | | | | | | | | | | | | | |
| | | | |
| Virgin Islands: 1.07% | | | | | | | | | | | | | | | | |
Virgin Islands PFA Matching Fund Loan Notes Senior Lien Series A (Tax Revenue) | | | 5.00 | | | | 10/01/2029 | | | | 5,000,000 | | | | 5,099,050 | |
Virgin Islands PFA Matching Fund Loan Notes Senior Lien Series A (Tax Revenue) | | | 6.75 | | | | 10/01/2037 | | | | 2,000,000 | | | | 2,177,954 | |
| | | | |
| | | | | | | | | | | | | | | 7,277,004 | |
| | | | | | | | | | | | | | | | |
| | | | |
Total Municipal Bonds and Notes (Cost $637,597,569) | | | | | | | | | | | | | | | 666,321,635 | |
| | | | | | | | | | | | | | | | |
| | | | |
| | | Yield | | | | | | Shares | | | | |
| | | | |
Short-Term Investments: 0.93% | | | | | | | | | | | | | | | | |
| | | | |
| Investment Companies: 0.93% | | | | | | | | | | | | | | | | |
Wells Fargo Advantage California Municipal Money Market Fund, Institutional Class(l)(u) | | | 0.01 | | | | | | | | 6,335,243 | | | | 6,335,243 | |
| | | | | | | | | | | | | | | | |
| | | | |
Total Short-Term Investments (Cost $6,335,243) | | | | | | | | | | | | | | | 6,335,243 | |
| | | | | | | | | | | | | | | | |
| | | | | | | | |
| Total Investments in Securities | | | | | | | | |
| (Cost $643,932,812)* | | | 99.17 | % | | | 672,656,878 | |
Other Assets and Liabilities, Net | | | 0.83 | | | | 5,620,039 | |
| | | | | | | | |
| Total Net Assets | | | 100.00 | % | | $ | 678,276,917 | |
| | | | | | | | |
| (z) | Zero coupon security. Rate represents yield to maturity. |
| ± | Variable rate investment. |
| § | These securities are subject to a demand feature which reduces the effective maturity. |
| (n) | Auction to set interest rate on security failed at period end due to insufficient investor interest; failed auction does not itself cause a default. |
| (a) | Security is fair valued by the Management Valuation Team, and in certain instances by the Board of Trustees, in accordance with procedures approved by the Board of Trustees. |
| (m) | An auction-rate security whose interest rate resets at predetermined short-term intervals through a Dutch auction; rate shown represents the rate in effect at period-end. |
| 144A | Security that may be resold to “qualified institutional buyers” under Rule 144A or security offered pursuant to Section 4(2) of the Securities Act of 1933, as amended. |
| (l) | Investment in an affiliate. |
| (u) | Rate shown is the 7-day annualized yield at period end. |
| * | Cost for federal income tax purposes is $644,027,371 and net unrealized appreciation (depreciation) consists of: |
| | | | |
Gross unrealized appreciation | | $ | 32,031,787 | |
Gross unrealized depreciation | | | (3,402,280 | ) |
| | | | |
Net unrealized appreciation | | $ | 28,629,507 | |
The accompanying notes are an integral part of these financial statements.
| | | | |
| 18 | | Wells Fargo Advantage California Tax-Free Fund | | Statement of Assets and Liabilities —December 31, 2011 (Unaudited) |
| | | | |
| | | | |
| |
Assets | | | | |
Investments | | | | |
In unaffiliated securities, at value | | $ | 666,321,635 | |
In affiliated securities, at value | | | 6,335,243 | |
| | | | |
Total investments, at value (see cost below) | | | 672,656,878 | |
Receivable for investments sold | | | 135,000 | |
Receivable for Fund shares sold | | | 220,034 | |
Receivable for interest | | | 8,751,846 | |
Prepaid expenses and other assets | | | 25,090 | |
| | | | |
Total assets | | | 681,788,848 | |
| | | | |
| |
Liabilities | | | | |
Dividends payable | | | 928,746 | |
Payable for investments purchased | | | 1,250,000 | |
Payable for Fund shares redeemed | | | 821,532 | |
Advisory fee payable | | | 150,267 | |
Distribution fees payable | | | 27,132 | |
Due to other related parties | | | 120,083 | |
Accrued expenses and other liabilities | | | 214,171 | |
| | | | |
Total liabilities | | | 3,511,931 | |
| | | | |
Total net assets | | $ | 678,276,917 | |
| | | | |
| |
NET ASSETS CONSIST OF | | | | |
Paid-in capital | | $ | 664,951,054 | |
Undistributed net investment income | | | 67,181 | |
Accumulated net realized losses on investments | | | (15,465,384 | ) |
Net unrealized gains on investments | | | 28,724,066 | |
| | | | |
Total net assets | | $ | 678,276,917 | |
| | | | |
| |
COMPUTATION OF NET ASSET VALUE AND OFFERING PRICE PER SHARE1 | | | | |
Net assets – Class A | | $ | 502,266,917 | |
Shares outstanding – Class A | | | 45,571,513 | |
Net asset value per share – Class A | | | $11.02 | |
Maximum offering price per share – Class A2 | | | $11.54 | |
Net assets – Class B | | $ | 1,846,786 | |
Shares outstanding – Class B | | | 164,212 | |
Net asset value per share – Class B | | | $11.25 | |
Net assets – Class C | | $ | 39,060,123 | |
Shares outstanding – Class C | | | 3,475,246 | |
Net asset value per share – Class C | | | $11.24 | |
Net assets – Administrator Class | | $ | 135,103,091 | |
Shares outstanding – Administrator Class | | | 12,234,365 | |
Net asset value per share – Administrator Class | | | $11.04 | |
| |
Total investments, at cost | | $ | 643,932,812 | |
| | | | |
| 1. | The Fund has an unlimited number of authorized shares. |
| 2. | Maximum offering price is computed as 100/95.50 of net asset value. On investments of $50,000 or more, the offering price is reduced. |
The accompanying notes are an integral part of these financial statements.
| | | | | | |
| Statement of Operations—Six Months Ended December 31, 2011 (Unaudited) | | Wells Fargo Advantage California Tax-Free Fund | | | 19 | |
| | | | |
| | | | |
| |
Investment income | | | | |
Interest | | $ | 16,822,899 | |
Income from affiliated securities | | | 576 | |
| | | | |
Total investment income | | | 16,823,475 | |
| | | | |
| |
Expenses | | | | |
Advisory fee | | | 1,145,771 | |
Administration fees | | | | |
Fund level | | | 166,499 | |
Class A | | | 400,157 | |
Class B | | | 1,794 | |
Class C | | | 29,301 | |
Administrator Class | | | 63,467 | |
Shareholder servicing fees | | | | |
Class A | | | 625,246 | |
Class B | | | 2,802 | |
Class C | | | 45,782 | |
Administrator Class | | | 148,439 | |
Distribution fees | | | | |
Class B | | | 8,407 | |
Class C | | | 137,347 | |
Custody and accounting fees | | | 21,635 | |
Professional fees | | | 23,235 | |
Registration fees | | | 11,060 | |
Shareholder report expenses | | | 13,467 | |
Trustees’ fees and expenses | | | 6,062 | |
Other fees and expenses | | | 10,948 | |
| | | | |
Total expenses | | | 2,861,419 | |
Less: Fee waivers and/or expense reimbursements | | | (345,106 | ) |
| | | | |
Net expenses | | | 2,516,313 | |
| | | | |
Net investment income | | | 14,307,162 | |
| | | | |
| |
REALIZED AND UNREALIZED GAINS (LOSSES) ON INVESTMENTS | | | | |
Net realized gains on investments | | | 1,352,032 | |
Net change in unrealized gains (losses) on investments | | | 28,732,322 | |
| | | | |
Net realized and unrealized gains (losses) on investments | | | 30,084,354 | |
| | | | |
Net increase in net assets resulting from operations | | $ | 44,391,516 | |
| | | | |
The accompanying notes are an integral part of these financial statements.
| | | | |
| 20 | | Wells Fargo Advantage California Tax-Free Fund | | Statements of Changes in Net Assets |
| | | | | | | | | | | | | | | | |
| | | Six Months Ended December 31, 2011 (Unaudited) | | | Year Ended June 30, 2011 | |
| | | | |
Operations | | | | | | | | | | | | | | | | |
Net investment income | | | | | | $ | 14,307,162 | | | | | | | $ | 31,568,614 | |
Net realized gains on investments | | | | | | | 1,352,032 | | | | | | | | 3,306,237 | |
Net change in unrealized gains (losses) on investments | | | | | | | 28,732,322 | | | | | | | | (20,404,084 | ) |
| | | | | | | | | | | | | | | | |
Net increase in net assets resulting from operations | | | | | | | 44,391,516 | | | | | | | | 14,470,767 | |
| | | | | | | | | | | | | | | | |
| | | | |
Distributions to shareholders from | | | | | | | | | | | | | | | | |
Net investment income | | | | | | | | | | | | | | | | |
Class A | | | | | | | (10,758,310 | ) | | | | | | | (22,714,619 | ) |
Class B | | | | | | | (39,878 | ) | | | | | | | (123,054 | ) |
Class C | | | | | | | (649,518 | ) | | | | | | | (1,322,388 | ) |
Administrator Class | | | | | | | (2,857,921 | ) | | | | | | | (7,406,442 | ) |
| | | | | | | | | | | | | | | | |
Total distributions to shareholders | | | | | | | (14,305,627 | ) | | | | | | | (31,566,503 | ) |
| | | | | | | | | | | | | | | | |
| | | | |
Capital share transactions | | | Shares | | | | | | | | Shares | | | | | |
Proceeds from shares sold | | | | | | | | | | | | | | | | |
Class A | | | 1,621,663 | | | | 17,474,317 | | | | 3,894,080 | | | | 41,089,476 | |
Class B | | | 0 | | | | 0 | | | | 12,937 | | | | 136,797 | |
Class C | | | 485,802 | | | | 5,361,101 | | | | 603,322 | | | | 6,555,077 | |
Administrator Class | | | 2,586,922 | | | | 28,034,161 | | | | 6,169,537 | | | | 65,715,235 | |
| | | | | | | | | | | | | | | | |
| | | | | | | 50,869,579 | | | | | | | | 113,496,585 | |
| | | | | | | | | | | | | | | | |
Reinvestment of distributions | | | | | | | | | | | | | | | | |
Class A | | | 694,478 | | | | 7,513,091 | | | | 1,500,047 | | | | 15,829,883 | |
Class B | | | 2,281 | | | | 25,157 | | | | 6,900 | | | | 74,462 | |
Class C | | | 38,888 | | | | 429,260 | | | | 81,216 | | | | 874,117 | |
Administrator Class | | | 133,488 | | | | 1,447,592 | | | | 422,123 | | | | 4,472,032 | |
| | | | | | | | | | | | | | | | |
| | | | | | | 9,415,100 | | | | | | | | 21,250,494 | |
| | | | | | | | | | | | | | | | |
Payment for shares redeemed | | | | | | | | | | | | | | | | |
Class A | | | (2,635,991 | ) | | | (28,444,907 | ) | | | (12,710,500 | ) | | | (132,648,311 | ) |
Class B | | | (76,971 | ) | | | (845,818 | ) | | | (216,327 | ) | | | (2,344,529 | ) |
Class C | | | (195,364 | ) | | | (2,145,256 | ) | | | (1,013,313 | ) | | | (10,763,616 | ) |
Administrator Class | | | (1,689,846 | ) | | | (18,256,484 | ) | | | (12,603,756 | ) | | | (131,148,032 | ) |
| | | | | | | | | | | | | | | | |
| | | | | | | (49,692,465 | ) | | | | | | | (276,904,488 | ) |
| | | | | | | | | | | | | | | | |
Net asset value of shares issued in acquisition | | | | | | | | | | | | | | | | |
Class A | | | 0 | | | | 0 | | | | 18,378,847 | | | | 197,281,651 | |
Class B | | | 0 | | | | 0 | | | | 42,617 | | | | 466,825 | |
Class C | | | 0 | | | | 0 | | | | 279,079 | | | | 3,055,151 | |
Administrator Class | | | 0 | | | | 0 | | | | 1,086,486 | | | | 11,686,036 | |
| | | | | | | | | | | | | | | | |
| | | | | | | 0 | | | | | | | | 212,489,663 | |
| | | | | | | | | | | | | | | | |
Net increase in net assets resulting
from capital share transactions | | | | | | | 10,592,214 | | | | | | | | 70,332,254 | |
| | | | | | | | | | | | | | | | |
Total increase in net assets | | | | | | | 40,678,103 | | | | | | | | 53,236,518 | |
| | | | | | | | | | | | | | | | |
| | | | |
Net assets | | | | | | | | | | | | | | | | |
Beginning of period | | | | | | | 637,598,814 | | | | | | | | 584,362,296 | |
| | | | | | | | | | | | | | | | |
End of period | | | | | | $ | 678,276,917 | | | | | | | $ | 637,598,814 | |
| | | | | | | | | | | | | | | | |
Undistributed net investment income | | | | | | $ | 67,181 | | | | | | | $ | 65,646 | |
| | | | | | | | | | | | | | | | |
The accompanying notes are an integral part of these financial statements.
| | | | | | |
| Financial Highlights | | Wells Fargo Advantage California Tax-Free Fund | | | 21 | |
(For a share outstanding throughout each period)
| | | | | | | | | | | | | | | | | | | | | | | | |
| | | Six Months Ended
December 31, 2011
(Unaudited) | | | Year Ended June 30, | |
| Class A | | | 2011 | | | 2010 | | | 2009 | | | 2008 | | | 2007 | |
Net asset value, beginning of period | | $ | 10.53 | | | $ | 10.69 | | | $ | 10.14 | | | $ | 10.64 | | | $ | 11.02 | | | $ | 11.00 | |
Net investment income | | | 0.23 | | | | 0.46 | | | | 0.46 | 1 | | | 0.49 | | | | 0.48 | | | | 0.48 | |
Net realized and unrealized gains (losses) on investments | | | 0.49 | | | | (0.16 | ) | | | 0.55 | | | | (0.50 | ) | | | (0.35 | ) | | | 0.05 | |
| | | | | | | | | | | | | | | | | | | | | | | | |
Total from investment operations | | | 0.72 | | | | 0.30 | | | | 1.01 | | | | (0.01 | ) | | | 0.13 | | | | 0.53 | |
Distributions to shareholders from | | | | | | | | | | | | | | | | | | | | | | | | |
Net investment income | | | (0.23 | ) | | | (0.46 | ) | | | (0.46 | ) | | | (0.49 | ) | | | (0.48 | ) | | | (0.48 | ) |
Net realized gains | | | 0.00 | | | | 0.00 | | | | 0.00 | | | | 0.00 | | | | (0.03 | ) | | | (0.03 | ) |
| | | | | | | | | | | | | | | | | | | | | | | | |
Total distributions to shareholders | | | (0.23 | ) | | | (0.46 | ) | | | (0.46 | ) | | | (0.49 | ) | | | (0.51 | ) | | | (0.51 | ) |
Net asset value, end of period | | | $11.02 | | | | $10.53 | | | | $10.69 | | | | $10.14 | | | | $10.64 | | | | $11.02 | |
Total return2 | | | 6.93 | % | | | 2.89 | % | | | 10.10 | % | | | 0.06 | % | | | 1.25 | % | | | 4.89 | % |
Ratios to average net assets (annualized) | | | | | | | | | | | | | | | | | | | | | | | | |
Gross expenses | | | 0.83 | % | | | 0.82 | % | | | 0.86 | % | | | 0.88 | % | | | 1.02 | % | | | 1.03 | % |
Net expenses | | | 0.75 | % | | | 0.75 | % | | | 0.80 | % | | | 0.80 | % | | | 0.80 | % | | | 0.80 | % |
Net investment income | | | 4.30 | % | | | 4.36 | % | | | 4.35 | % | | | 4.85 | % | | | 4.42 | % | | | 4.31 | % |
Supplemental data | | | | | | | | | | | | | | | | | | | | | | | | |
Portfolio turnover rate | | | 23 | % | | | 23 | % | | | 31 | % | | | 44 | % | | | 43 | % | | | 49 | % |
Net assets, end of period (000’s omitted) | | | $502,267 | | | | $483,091 | | | | $372,415 | | | | $351,526 | | | | $375,441 | | | | $365,396 | |
| 1. | Calculated based upon average shares outstanding. |
| 2. | Total return calculations do not include any sales charges. Returns for periods of less than one year are not annualized. |
The accompanying notes are an integral part of these financial statements.
| | | | |
| 22 | | Wells Fargo Advantage California Tax-Free Fund | | Financial Highlights |
(For a share outstanding throughout each period)
| | | | | | | | | | | | | | | | | | | | | | | | |
| | | Six Months Ended
December 31, 2011 (Unaudited) | | | Year Ended June 30, | |
| Class B | | | 2011 | | | 2010 | | | 2009 | | | 2008 | | | 2007 | |
Net asset value, beginning of period | | $ | 10.74 | | | $ | 10.91 | | | $ | 10.35 | | | $ | 10.86 | | | $ | 11.24 | | | $ | 11.22 | |
Net investment income | | | 0.20 | 1 | | | 0.39 | 1 | | | 0.39 | 1 | | | 0.42 | | | | 0.42 | | | | 0.41 | |
Net realized and unrealized gains (losses) on investments | | | 0.51 | | | | (0.17 | ) | | | 0.56 | | | | (0.50 | ) | | | (0.36 | ) | | | 0.05 | |
| | | | | | | | | | | | | | | | | | | | | | | | |
Total from investment operations | | | 0.71 | | | | 0.22 | | | | 0.95 | | | | (0.08 | ) | | | 0.06 | | | | 0.46 | |
Distributions to shareholders from | | | | | | | | | | | | | | | | | | | | | | | | |
Net investment income | | | (0.20 | ) | | | (0.39 | ) | | | (0.39 | ) | | | (0.43 | ) | | | (0.41 | ) | | | (0.41 | ) |
Net realized gains | | | 0.00 | | | | 0.00 | | | | 0.00 | | | | 0.00 | | | | (0.03 | ) | | | (0.03 | ) |
| | | | | | | | | | | | | | | | | | | | | | | | |
Total distributions to shareholders | | | (0.20 | ) | | | (0.39 | ) | | | (0.39 | ) | | | (0.43 | ) | | | (0.44 | ) | | | (0.44 | ) |
Net asset value, end of period | | | $11.25 | | | | $10.74 | | | | $10.91 | | | | $10.35 | | | | $10.86 | | | | $11.24 | |
Total return2 | | | 6.63 | % | | | 2.06 | % | | | 9.26 | % | | | (0.69 | )% | | | 0.57 | % | | | 4.11 | % |
Ratios to average net assets (annualized) | | | | | | | | | | | | | | | | | | | | | | | | |
Gross expenses | | | 1.58 | % | | | 1.56 | % | | | 1.62 | % | | | 1.64 | % | | | 1.77 | % | | | 1.78 | % |
Net expenses | | | 1.50 | % | | | 1.50 | % | | | 1.55 | % | | | 1.55 | % | | | 1.55 | % | | | 1.55 | % |
Net investment income | | | 3.56 | % | | | 3.57 | % | | | 3.63 | % | | | 4.08 | % | | | 3.68 | % | | | 3.57 | % |
Supplemental data | | | | | | | | | | | | | | | | | | | | | | | | |
Portfolio turnover rate | | | 23 | % | | | 23 | % | | | 31 | % | | | 44 | % | | | 43 | % | | | 49 | % |
Net assets, end of period (000’s omitted) | | | $1,847 | | | | $2,566 | | | | $4,286 | | | | $11,926 | | | | $25,900 | | | | $42,839 | |
| 1. | Calculated based upon average shares outstanding. |
| 2. | Total return calculations do not include any sales charges. Returns for periods of less than one year are not annualized. |
The accompanying notes are an integral part of these financial statements.
| | | | | | |
| Financial Highlights | | Wells Fargo Advantage California Tax-Free Fund | | | 23 | |
(For a share outstanding throughout each period)
| | | | | | | | | | | | | | | | | | | | | | | | |
| | | Six Months Ended
December 31, 2011 (Unaudited) | | | Year Ended June 30, | |
| Class C | | | 2011 | | | 2010 | | | 2009 | | | 2008 | | | 2007 | |
Net asset value, beginning of period | | $ | 10.74 | | | $ | 10.90 | | | $ | 10.35 | | | $ | 10.85 | | | $ | 11.24 | | | $ | 11.22 | |
Net investment income | | | 0.20 | | | | 0.39 | | | | 0.39 | 1 | | | 0.42 | | | | 0.41 | | | | 0.41 | |
Net realized and unrealized gains (losses) on investments | | | 0.50 | | | | (0.16 | ) | | | 0.55 | | | | (0.50 | ) | | | (0.36 | ) | | | 0.05 | |
| | | | | | | | | | | | | | | | | | | | | | | | |
Total from investment operations | | | 0.70 | | | | 0.23 | | | | 0.94 | | | | (0.08 | ) | | | 0.05 | | | | 0.46 | |
Distributions to shareholders from | | | | | | | | | | | | | | | | | | | | | | | | |
Net investment income | | | (0.20 | ) | | | (0.39 | ) | | | (0.39 | ) | | | (0.42 | ) | | | (0.41 | ) | | | (0.41 | ) |
Net realized gains | | | 0.00 | | | | 0.00 | | | | 0.00 | | | | 0.00 | | | | (0.03 | ) | | | (0.03 | ) |
| | | | | | | | | | | | | | | | | | | | | | | | |
Total distributions to shareholders | | | (0.20 | ) | | | (0.39 | ) | | | (0.39 | ) | | | (0.42 | ) | | | (0.44 | ) | | | (0.44 | ) |
Net asset value, end of period | | | $11.24 | | | | $10.74 | | | | $10.90 | | | | $10.35 | | | | $10.85 | | | | $11.24 | |
Total return2 | | | 6.53 | % | | | 2.16 | % | | | 9.16 | % | | | (0.60 | )% | | | 0.47 | % | | | 4.11 | % |
Ratios to average net assets (annualized) | | | | | | | | | | | | | | | | | | | | | | | | |
Gross expenses | | | 1.58 | % | | | 1.57 | % | | | 1.62 | % | | | 1.63 | % | | | 1.76 | % | | | 1.78 | % |
Net expenses | | | 1.50 | % | | | 1.50 | % | | | 1.55 | % | | | 1.55 | % | | | 1.55 | % | | | 1.55 | % |
Net investment income | | | 3.55 | % | | | 3.61 | % | | | 3.58 | % | | | 4.10 | % | | | 3.69 | % | | | 3.56 | % |
Supplemental data | | | | | | | | | | | | | | | | | | | | | | | | |
Portfolio turnover rate | | | 23 | % | | | 23 | % | | | 31 | % | | | 44 | % | | | 43 | % | | | 49 | % |
Net assets, end of period (000’s omitted) | | | $39,060 | | | | $33,772 | | | | $34,848 | | | | $27,786 | | | | $29,438 | | | | $29,732 | |
| 1. | Calculated based upon average shares outstanding. |
| 2. | Total return calculations do not include any sales charges. Returns for periods of less than one year are not annualized. |
The accompanying notes are an integral part of these financial statements.
| | | | |
| 24 | | Wells Fargo Advantage California Tax-Free Fund | | Financial Highlights |
(For a share outstanding throughout each period)
| | | | | | | | | | | | | | | | | | | | | | | | |
| | | Six Months Ended
December 31, 2011 (Unaudited) | | | Year Ended June 30, | |
| Administrator Class | | | 2011 | | | 2010 | | | 2009 | | | 2008 | | | 2007 | |
Net asset value, beginning of period | | $ | 10.55 | | | $ | 10.71 | | | $ | 10.16 | | | $ | 10.66 | | | $ | 11.04 | | | $ | 11.03 | |
Net investment income | | | 0.24 | | | | 0.48 | | | | 0.48 | | | | 0.52 | | | | 0.51 | | | | 0.51 | |
Net realized and unrealized gains (losses) on investments | | | 0.49 | | | | (0.16 | ) | | | 0.56 | | | | (0.50 | ) | | | (0.35 | ) | | | 0.04 | |
| | | | | | | | | | | | | | | | | | | | | | | | |
Total from investment operations | | | 0.73 | | | | 0.32 | | | | 1.04 | | | | 0.02 | | | | 0.16 | | | | 0.55 | |
Distributions to shareholders from | | | | | | | | | | | | | | | | | | | | | | | | |
Net investment income | | | (0.24 | ) | | | (0.48 | ) | | | (0.49 | ) | | | (0.52 | ) | | | (0.51 | ) | | | (0.51 | ) |
Net realized gains | | | 0.00 | | | | 0.00 | | | | 0.00 | | | | 0.00 | | | | (0.03 | ) | | | (0.03 | ) |
| | | | | | | | | | | | | | | | | | | | | | | | |
Total distributions to shareholders | | | (0.24 | ) | | | (0.48 | ) | | | (0.49 | ) | | | (0.52 | ) | | | (0.54 | ) | | | (0.54 | ) |
Net asset value, end of period | | | $11.04 | | | | $10.55 | | | | $10.71 | | | | $10.16 | | | | $10.66 | | | | $11.04 | |
Total return1 | | | 7.03 | % | | | 3.10 | % | | | 10.35 | % | | | 0.32 | % | | | 1.51 | % | | | 5.06 | % |
Ratios to average net assets (annualized) | | | | | | | | | | | | | | | | | | | | | | | | |
Gross expenses | | | 0.75 | % | | | 0.75 | % | | | 0.78 | % | | | 0.81 | % | | | 0.84 | % | | | 0.85 | % |
Net expenses | | | 0.55 | % | | | 0.55 | % | | | 0.55 | % | | | 0.55 | % | | | 0.55 | % | | | 0.55 | % |
Net investment income | | | 4.50 | % | | | 4.54 | % | | | 4.53 | % | | | 5.10 | % | | | 4.67 | % | | | 4.56 | % |
Supplemental data | | | | | | | | | | | | | | | | | | | | | | | | |
Portfolio turnover rate | | | 23 | % | | | 23 | % | | | 31 | % | | | 44 | % | | | 43 | % | | | 49 | % |
Net assets, end of period (000’s omitted) | | | $135,103 | | | | $118,170 | | | | $172,814 | | | | $74,046 | | | | $77,702 | | | | $50,556 | |
| 1. | Returns for periods of less than one year are not annualized. |
The accompanying notes are an integral part of these financial statements.
| | | | | | |
| Notes to Financial Statements (Unaudited) | | Wells Fargo Advantage California Tax-Free Fund | | | 25 | |
1. ORGANIZATION
Wells Fargo Funds Trust (the “Trust”), a Delaware statutory trust organized on March 10, 1999, is an open-end management investment company registered under the Investment Company Act of 1940, as amended (the “1940 Act”). These financial statements report on Wells Fargo Advantage California Tax-Free Fund (the “Fund”) which is a non-diversified series of the Trust.
2. SIGNIFICANT ACCOUNTING POLICIES
The following significant accounting policies, which are consistently followed in the preparation of the financial statements of the Fund, are in conformity with U.S. generally accepted accounting principles which require management to make estimates and assumptions that affect the reported amounts of assets and liabilities, disclosure of contingent assets and liabilities at the date of the financial statements, and the reported amounts of revenues and expenses during the reporting period. Actual results could differ from those estimates.
Securities valuation
Fixed income securities with maturities exceeding 60 days are valued based on available evaluated prices received from an independent pricing service approved by the Board of Trustees which may utilize both transaction data and market information such as yield, prices of securities of comparable quality, coupon rate, maturity, type of issue, trading characteristics and other market data. If valuations are not available from the pricing service or values received are deemed not representative of market value, values will be obtained from a third party broker-dealer or determined based on the Fund’s Fair Value Procedures.
Debt securities of sufficient credit quality with original maturities of 60 days or less generally are valued at amortized cost which approximates fair value. The amortized cost method involves valuing a security at its cost, plus accretion of discount or minus amortization of premium over the period until maturity.
Investments in open-end mutual funds and non-registered investment companies are generally valued at net asset value.
Investments which are not valued using any of the methods discussed above, are valued at their fair value, as determined by procedures established in good faith and approved by the Board of Trustees.
When-issued transactions
The Fund may purchase securities on a forward commitment or ‘when-issued’ basis. The Fund records a when-issued transaction on the trade date and will segregate assets to cover its obligation by confirming the availability of qualifying assets having a value sufficient to make payment for the securities purchased. Securities purchased on a when-issued basis are marked-to-market daily and the Fund begins earning interest on the settlement date. Losses may arise due to changes in the market value of the underlying securities or if the counterparty does not perform under the contract.
Security transactions and income recognition
Securities transactions are recorded on a trade date basis. Realized gains or losses are reported on the basis of identified cost of securities delivered.
Interest income is accrued daily and bond discounts are accreted and premiums are amortized daily based on the effective interest method. To the extent debt obligations are placed on non-accrual status, any related interest income may be reduced by writing off interest receivables when the collection of all or a portion of interest has become doubtful based on consistently applied procedures. If the issuer subsequently resumes interest payments or when the collectability of interest is reasonably assured, the debt obligation is removed from non-accrual status.
Distributions to shareholders
Distributions to shareholders from net investment income are accrued daily and paid monthly. Distributions from net realized gains, if any, are recorded on the ex-dividend date. Such distributions are determined in conformity with income tax regulations, which may differ from generally accepted accounting principles.
Federal and other taxes
The Fund intends to continue to qualify as a regulated investment company by distributing substantially all of its investment company taxable and tax-exempt income and any net realized capital gains (after reduction for capital loss carryforwards) sufficient to relieve it from all, or substantially all, federal income taxes. Accordingly, no provision for federal income taxes was required.
| | | | |
| 26 | | Wells Fargo Advantage California Tax-Free Fund | | Notes to Financial Statements (Unaudited) |
The Fund’s income and federal excise tax returns and all financial records supporting those returns for the prior three fiscal years are subject to examination by the federal and Delaware revenue authorities.
Under the recently enacted Regulated Investment Company Modernization Act of 2010, the Fund is permitted to carry forward capital losses incurred in taxable years which began after December 22, 2010 for an unlimited period. However, any losses incurred are required to be utilized prior to the losses incurred in pre-enactment taxable years. As a result of this ordering rule, pre-enactment capital loss carryforwards may be more likely to expire unused. Additionally, post-enactment capital losses that are carried forward will retain their character as either short-term or long-term capital losses rather than being considered all short-term as under previous law.
As of December 31, 2011, the Fund had net capital loss carryforwards, which were available to offset future net realized capital gains, in the amount of $16,722,857 with $3,299,963 expiring in 2016, $4,968,967 expiring in 2017 and $8,453,927 expiring in 2018.
Class allocations
The separate classes of shares offered by the Fund differ principally in applicable sales charges, distribution, shareholder servicing and administration fees. Shareholders of each class bear certain expenses that pertain to that particular class. All shareholders bear the common expenses of the Fund, earn income from the portfolio, and are allocated unrealized gains and losses pro rata based on the average daily net assets of each class, without distinction between share classes. Dividends are determined separately for each class based on income and expenses allocable to each class. Realized gains and losses are allocated to each class pro rata based upon the net assets of each class on the date realized. Differences in per share dividend rates generally result from the relative weightings of pro rata income and realized gain allocations and from differences in separate class expenses, including distribution, shareholder servicing and administration fees.
3. FAIR VALUATION MEASUREMENTS
Fair value measurements of investments are determined within a framework that has established a fair value hierarchy based upon the various data inputs utilized in determining the value of the Fund’s investments. The three-level hierarchy gives the highest priority to unadjusted quoted prices in active markets for identical assets or liabilities (Level 1) and the lowest priority to significant unobservable inputs (Level 3). The Fund’s investments are classified within the fair value hierarchy based on the lowest level of input that is significant to the fair value measurement. The inputs are summarized into three broad levels as follows:
| n | | Level 1 – quoted prices in active markets for identical securities |
| n | | Level 2 – other significant observable inputs (including quoted prices for similar securities, interest rates, prepayment speeds, credit risk, etc.) |
| n | | Level 3 – significant unobservable inputs (including the Fund’s own assumptions in determining the fair value of investments) |
The inputs or methodologies used for valuing securities are not necessarily an indication of the risk associated with investing in those securities.
As of December 31, 2011, the inputs used in valuing the Fund’s assets, which are carried at fair value, were as follows:
| | | | | | | | | | | | | | | | |
| Investments in Securities | | Quoted Prices (Level 1) | | | Significant Other
Observable Inputs (Level 2) | | | Significant Unobservable Inputs (Level 3) | | | Total | |
Municipal bonds and notes | | $ | 0 | | | $ | 664,600,284 | | | $ | 1,721,351 | | | $ | 666,321,635 | |
Short-term investments | | | | | | | | | | | | | | | | |
Investment companies | | | 6,335,243 | | | | 0 | | | | 0 | | | | 6,335,243 | |
| | | $ | 6,335,243 | | | $ | 664,600,284 | | | $ | 1,721,351 | | | $ | 672,656,878 | |
Further details on the major security types listed above can be found in the Portfolio of Investments.
Transfers in and transfers out are recognized at the end of the reporting period. For the six months ended December 31, 2011, the Fund did not have any significant transfers into/out of Level 1 and Level 2.
| | | | | | |
| Notes to Financial Statements (Unaudited) | | Wells Fargo Advantage California Tax-Free Fund | | | 27 | |
The following is a reconciliation of assets in which significant unobservable inputs (Level 3) were used in determining fair value:
| | | | |
| | | Municipal
bond and
notes | |
Balance as of June 30, 2011 | | $ | 1,765,875 | |
Accrued discounts (premiums) | | | 2,024 | |
Realized gains (losses) | | | 0 | |
Change in unrealized gains (losses) | | | (46,548 | ) |
Purchases | | | 0 | |
Sales | | | 0 | |
Transfers into Level 3 | | | 0 | |
Transfers out of Level 3 | | | 0 | |
Balance as of December 31, 2011 | | $ | 1,721,351 | |
Change in unrealized gains (losses)
relating to securities still held at December 31, 2011 | | $ | (46,548 | ) |
4. TRANSACTIONS WITH AFFILIATES AND OTHER EXPENSES
Advisory fee
The Trust has entered into an advisory contract with Wells Fargo Funds Management, LLC (“Funds Management”), an indirect wholly owned subsidiary of Wells Fargo & Company (“Wells Fargo”). The adviser is responsible for implementing investment policies and guidelines and for supervising the sub-adviser, who is responsible for day-to-day portfolio management of the Fund.
Pursuant to the contract, Funds Management is entitled to receive an annual advisory fee starting at 0.35% and declining to 0.25% as the average daily net assets of the Fund increase. For the six months ended December 31, 2011, the advisory fee was equivalent to an annual rate of 0.34% of the Fund’s average daily net assets.
Funds Management may retain the services of certain sub-advisers to provide daily portfolio management to the Fund. The fees related to sub-advisory services are borne directly by Funds Management and do not increase the overall fees paid by the Fund. Wells Capital Management Incorporated, an affiliate of Funds Management, is the sub-adviser to the Fund and is entitled to receive a fee from Funds Management at an annual rate starting at 0.20% and declining to 0.10% as the average daily net assets of the Fund increase.
Administration and transfer agent fees
The Trust has entered into an administration agreement with Funds Management. Under this agreement, for providing administrative services, which includes paying fees and expenses for services provided by the transfer agent, sub-transfer agents, omnibus account servicers and record-keepers, Funds Management is entitled to receive from the Fund an annual fund level administration fee starting at 0.05% and declining to 0.03% as the average daily net assets of the Fund increase and a class level administration fee which is calculated based on the average daily net assets of each class as follows:
| | | | |
| | | Class Level Administration Fee | |
Class A, Class B, Class C | | | 0.16 | % |
Administrator Class | | | 0.10 | |
Funds Management has contractually waived and/or reimbursed advisory and administration fees to the extent necessary to maintain certain net operating expense ratios for the Fund. Waiver of fees and/or reimbursement of expenses by Funds Management were made first from fund level expenses on a proportionate basis and then from class specific expenses.
| | | | |
| 28 | | Wells Fargo Advantage California Tax-Free Fund | | Notes to Financial Statements (Unaudited) |
Distribution fees
The Trust has adopted a Distribution Plan for Class B and Class C shares of the Fund pursuant to Rule 12b-1 under the 1940 Act. Distribution fees are charged to Class B and Class C shares and paid to Wells Fargo Funds Distributor, LLC, the principal underwriter, at an annual rate of 0.75% of the average daily net assets of Class B and Class C shares.
For the six months ended December 31, 2011, Wells Fargo Funds Distributor, LLC received $18,016 from the sale of Class A shares and $550 and $326 in contingent deferred sales charges from redemptions of Class B and Class C shares, respectively.
Shareholder servicing fees
The Trust has entered into contracts with one or more shareholder servicing agents, whereby Class A, Class B, Class C and Administrator Class of the Fund is charged a fee at an annual rate of 0.25% of the average daily net assets of each respective class.
A portion of these total shareholder servicing fees were paid to affiliates of Wells Fargo.
5. INVESTMENT PORTFOLIO TRANSACTIONS
Purchases and sales of investments, excluding U.S. Government obligations (if any) and short-term securities (securities with maturities of one year or less at purchase date), for the six months ended December 31, 2011 were $164,418,611 and $144,838,729, respectively.
6. ACQUISITION
After the close of business on July 9, 2010, the Fund acquired the net assets of Evergreen California Municipal Bond Fund. The purpose of the transaction was to combine two funds with similar investment objectives and strategies. Shareholders holding Class A, Class B, Class C and Class I shares of Evergreen California Municipal Bond Fund received Class A, Class B, Class C and Administrator Class shares, respectively, of the Fund in the reorganization. The acquisition was accomplished by a tax-free exchange of all of the shares of Evergreen California Municipal Bond Fund for 19,787,029 shares of the Fund valued at $212,489,663 at an exchange ratio of 0.99, 0.97, 0.97, and 0.98 for Class A, Class B, Class C and Administrator Class shares, respectively. The investment portfolio of Evergreen California Municipal Bond Fund with a fair value of $209,413,381, identified cost of $203,996,395 and unrealized gains of $5,416,986 at July 9, 2010 were the principal assets acquired by the Fund. The aggregate net assets of Evergreen California Municipal Bond Fund and the Fund immediately prior to the acquisition were $212,489,663 and $586,340,971, respectively. The aggregate net assets of the Fund immediately after the acquisition were $798,830,634. For financial reporting purposes, assets received and shares issued by the Fund were recorded at fair value; however, the cost basis of the investments received from Evergreen California Municipal Bond Fund was carried forward to align ongoing reporting of the Fund’s realized and unrealized gains and losses with amounts distributable to shareholders for tax purposes.
Assuming the acquisition had been completed July 1, 2010, the beginning of the annual reporting period for the Fund, the pro forma results of operations for the year ended June 30, 2011 would have been:
| | | | |
Net investment income | | $ | 31,847,486 | |
Net realized and unrealized losses on investments | | $ | (21,828,221 | ) |
Net increase in net assets resulting from operations | | $ | 10,019,265 | |
7. BANK BORROWINGS
The Trust (excluding the money market funds) and Wells Fargo Variable Trust are parties to a $150,000,000 revolving credit agreement with State Street Bank and Trust Company, whereby the Fund is permitted to use bank borrowings for temporary or emergency purposes, such as to fund shareholder redemption requests. Interest under the credit agreement is charged to the Fund based on a borrowing rate equal to the higher of the Federal Funds rate in effect on that day plus 1.25% or the overnight LIBOR rate in effect on that day plus 1.25%. In addition, under the credit agreement, the Fund pays an annual commitment fee equal to 0.10% of the unused balance, which is allocated pro rata. Prior to September 6, 2011, the revolving credit agreement was for $125,000,000 and the annual commitment fee paid by the Fund was 0.125% of the unused balance. For the six months ended December 31, 2011, the Fund paid $463 in commitment fees.
| | | | | | |
| Notes to Financial Statements (Unaudited) | | Wells Fargo Advantage California Tax-Free Fund | | | 29 | |
For the six months ended December 31, 2011, there were no borrowings by the Fund under the agreement.
8. CONCENTRATION RISK
The Fund invests a substantial portion of its assets in issuers of municipal debt securities located in a single state, therefore, it may be more affected by economic and political developments in that state or region than would be a comparable general tax-exempt mutual fund.
9. INDEMNIFICATION
Under the Trust’s organizational documents, the officers and directors are indemnified against certain liabilities that may arise out of performance of their duties to the Trust. Additionally, in the normal course of business, the Trust may enter into contracts with service providers that contain a variety of indemnification clauses. The Trust’s maximum exposure under these arrangements is dependent on future claims that may be made against the Fund and, therefore, cannot be estimated.
10. NEW ACCOUNTING PRONOUNCEMENTS
In May 2011, the Financial Accounting Standards Board (“FASB”) issued Accounting Standards Update (“ASU”) No. 2011-04 “Amendments to Achieve Common Fair Value Measurement and Disclosure Requirements in U.S. GAAP and IFRSs”. ASU No. 2011-04 amends FASB ASC Topic 820, Fair Value Measurements and Disclosures, to establish common requirements for measuring fair value and for disclosing information about fair value measurements in accordance with GAAP. The ASU is effective prospectively for interim and annual periods beginning after December 15, 2011. Management expects that adoption of the ASU will result in additional disclosures in the financial statements, as applicable.
In April 2011, FASB issued ASU No. 2011-03 “Reconsideration of Effective Control for Repurchase Agreements”. ASU No. 2011-03 amends FASB ASC Topic 860, Transfers and Servicing, specifically the criteria required to determine whether a repurchase agreement (repo) and similar agreements should be accounted for as sales of financial assets or secured borrowings with commitments. ASU No. 2011-03 changes the assessment of effective control by focusing on the transferor’s contractual rights and obligations and removing the criterion to assess its ability to exercise those rights or honor those obligations. This could result in changes to the way entities account for certain transactions including repurchase agreements, mortgage dollar rolls and reverse repurchase agreements. The ASU will become effective on a prospective basis for new transfers and modifications to existing transactions as of the beginning of the first interim or annual period beginning on or after December 15, 2011. Management has evaluated the impact of adopting the ASU and expects no significant changes.
| | | | |
| 30 | | Wells Fargo Advantage California Tax-Free Fund | | Other Information (Unaudited) |
PROXY VOTING INFORMATION
A description of the policies and procedures that the Fund uses to determine how to vote proxies relating to portfolio securities is available without charge, upon request, by calling 1-800-222-8222, visiting our Web site at www.wellsfargo.com/advantagefunds, or visiting the SEC Web site at www.sec.gov. Information regarding how the Fund voted proxies relating to portfolio securities during the most recent 12-month period ended June 30 is available without charge on the Fund’s Web site at www.wellsfargo.com/advantagefunds or by visiting the SEC Web site at www.sec.gov.
PORTFOLIO HOLDINGS INFORMATION
The complete portfolio holdings for the Fund are publicly available on the Fund’s Web site (www.wellsfargo.com/advantagefunds) on a monthly, 30-day or more delayed basis. In addition, top ten holdings information for the Fund is publicly available on the Fund’s Web site on a monthly, seven-day or more delayed basis. The Fund files its complete schedule of portfolio holdings with the SEC for the first and third quarters of each fiscal year on Form N-Q, which is available without charge by visiting the SEC Web site at www.sec.gov. In addition, the Fund’s Form N-Q may be reviewed and copied at the SEC’s Public Reference Room in Washington, DC, and at regional offices in New York City, at 233 Broadway, and in Chicago, at 175 West Jackson Boulevard, Suite 900. Information about the Public Reference Room may be obtained by calling 1-800-SEC-0330.
| | | | | | |
| Other Information (Unaudited) | | Wells Fargo Advantage California Tax-Free Fund | | | 31 | |
BOARD OF TRUSTEES
The following table provides basic information about the Board of Trustees (the “Trustees”) of the Trust and Officers of the Trust. This table should be read in conjunction with the Prospectus and the Statement of Additional Information1 of the Fund. Each of the Trustees and Officers listed below acts in identical capacities for the Wells Fargo Advantage family of funds, which consists of 138 funds comprising the Wells Fargo Funds Trust, Wells Fargo Variable Trust, Wells Fargo Master Trust and four closed-end funds (collectively the “Fund Complex”). All of the Trustees are also Members of the Audit and Governance Committees of each Trust in the Fund Complex. The mailing address of each Trustee and Officer is 525 Market Street, 12th Floor, San Francisco, CA 94105. Each Trustee and Officer serves an indefinite term, however, each Trustee serves such term until reaching the mandatory retirement age established by the Trustees.
Independent Trustees
| | | | | | |
Name and Year of Birth | | Position Held and Length of Service | | Principal Occupations During Past Five Years | | Other Directorships During
Past Five Years |
Peter G. Gordon
(Born 1942) | | Trustee, since 1998; Chairman, since 2005 (Lead Trustee since 2001) | | Co-Founder, Retired Chairman, President and CEO of Crystal Geyser Water Company. Trustee Emeritus, Colby College | | Asset Allocation Trust |
Isaiah Harris, Jr.
(Born 1952) | | Trustee, since 2009 | | Retired. Prior thereto, President and CEO of BellSouth Advertising and Publishing Corp. from 2005 to 2007, President and CEO of BellSouth Enterprises from 2004 to 2005 and President of BellSouth Consumer Services from 2000 to 2003. Emeritus member of the Iowa State University Foundation Board of Governors. Emeritus Member of the Advisory Board of Iowa State University School of Business. Mr. Harris is a certified public accountant. | | CIGNA Corporation; Deluxe Corporation; Asset Allocation Trust |
Judith M. Johnson
(Born 1949) | | Trustee, since 2008 | | Retired. Prior thereto, Chief Executive Officer and Chief Investment Officer of Minneapolis Employees Retirement Fund from 1996 to 2008. Ms. Johnson is an attorney, certified public accountant and a certified managerial accountant. | | Asset Allocation Trust |
Leroy Keith, Jr.
(Born 1939) | | Trustee, since 2010 | | Chairman, Bloc Global Services (development and construction). Trustee of the Evergreen Funds from 1983 to 2010. Former Managing Director, Almanac Capital Management (commodities firm), former Partner, Stonington Partners, Inc. (private equity fund), former Director, Obagi Medical Products Co. and former Director, Lincoln Educational Services. | | Trustee, Virtus Fund Complex (consisting of 40 portfolios as of 12/31/11); Asset Allocation Trust |
David F. Larcker
(Born 1950) | | Trustee, since 2009 | | James Irvin Miller Professor of Accounting at the Graduate School of Business, Stanford University, Director of Corporate Governance Research Program and Senior Faculty of The Rock Center for Corporate Governance since 2006. From 2005 to 2008, Professor of Accounting at the Graduate School of Business, Stanford University. Prior thereto, Ernst & Young Professor of Accounting at The Wharton School, University of Pennsylvania from 1985 to 2005. | | Asset Allocation Trust |
Olivia S. Mitchell
(Born 1953) | | Trustee, since 2006 | | International Foundation of Employee Benefit Plans Professor, Wharton School of the University of Pennsylvania since 1993. Director of Wharton’s Pension Research Council and Boettner Center on Pensions & Retirement Research, and Research Associate at the National Bureau of Economic Research. Previously, Cornell University Professor from 1978 to 1993. | | Asset Allocation Trust |
| | | | |
| 32 | | Wells Fargo Advantage California Tax-Free Fund | | Other Information (Unaudited) |
| | | | | | |
Name and Year of Birth | | Position Held and Length of Service | | Principal Occupations During Past Five Years | | Other Directorships During
Past Five Years |
Timothy J. Penny
(Born 1951) | | Trustee, since 1996 | | President and CEO of Southern Minnesota Initiative Foundation, a non-profit organization, since 2007 and Senior Fellow at the Humphrey Institute Policy Forum at the University of Minnesota since 1995. Member of the Board of Trustees of NorthStar Education Finance, Inc., a non-profit organization, since 2007. | | Asset Allocation Trust |
Michael S. Scofield
(Born 1943) | | Trustee, since 2010 | | Served on the Investment Company Institute’s Board of Governors and Executive Committee from 2008-2011 as well the Governing Council of the Independent Directors Council from 2006-2011 and the Independent Directors Council Executive Committee from 2008-2011. Chairman of the IDC from 2008-2010. Institutional Investor (Fund Directions) Trustee of Year in 2007. Trustee of the Evergreen Funds (and its predecessors) from 1984 to 2010. Chairman of the Evergreen Funds from 2000-2010. Former Trustee of the Mentor Funds. Retired Attorney, Law Offices of Michael S. Scofield and former Director and Chairman, Branded Media Corporation (multi-media branding company). | | Asset Allocation Trust |
Donald C. Willeke
(Born 1940) | | Trustee, since 1996 | | Principal of the law firm of Willeke & Daniels. General Counsel of the Minneapolis Employees Retirement Fund from 1984 until its consolidation into the Minnesota Public Employees Retirement Association on June 30, 2010. Director and Vice Chair of The Free Trust (non-profit corporation). Director of the American Chestnut Foundation (non-profit corporation). | | Asset Allocation Trust |
Officers
| | | | | | |
Name and Year of Birth | | Position Held and
Length of Service | | Principal Occupations During Past Five Years | | |
Karla M. Rabusch
(Born 1959) | | President, since 2003 | | Executive Vice President of Wells Fargo Bank, N.A. and President of Wells Fargo Funds Management, LLC since 2003. Senior Vice President and Chief Administrative Officer of Wells Fargo Funds Management, LLC from 2001 to 2003. | | |
C. David Messman
(Born 1960) | | Secretary, since 2000; Chief Legal Counsel, since 2003 | | Senior Vice President and Secretary of Wells Fargo Funds Management, LLC since 2001. Vice President and Managing Senior Counsel of Wells Fargo Bank, N.A. since 1996. | | |
Kasey Phillips
(Born 1970) | | Treasurer, since 2009 | | Senior Vice President of Wells Fargo Funds Management, LLC since 2009. Senior Vice President of Evergreen Investment Management Company, LLC from 2006 to 2010. Treasurer of the Evergreen Funds from 2005 to 2010. | | |
David Berardi
(Born 1975) | | Assistant Treasurer, since 2009 | | Vice President of Wells Fargo Funds Management, LLC since 2009. Vice President of Evergreen Investment Management Company, LLC from 2008 to 2010. Assistant Vice President of Evergreen Investment Services, Inc. from 2004 to 2008. Manager of Fund Reporting and Control for Evergreen Investment Management Company, LLC from 2004 to 2010. | | |
Jeremy DePalma
(Born 1974) | | Assistant Treasurer, since 2009 | | Senior Vice President of Wells Fargo Funds Management, LLC since 2009. Senior Vice President of Evergreen Investment Management Company, LLC from 2008 to 2010. Vice President, Evergreen Investment Services, Inc. from 2004 to 2007. Head of the Fund Reporting and Control Team within Fund Administration from 2005 to 2010. | | |
Debra Ann Early
(Born 1964) | | Chief Compliance Officer, since 2007 | | Chief Compliance Officer of Wells Fargo Funds Management, LLC since 2007. Chief Compliance Officer of Parnassus Investments from 2005 to 2007. Chief Financial Officer of Parnassus Investments from 2004 to 2007 and Senior Audit Manager of PricewaterhouseCoopers LLP from 1998 to 2004. | | |
| 1. | The Statement of Additional Information includes additional information about the Trustees and is available, without charge, upon request, by calling 1-800-222-8222 or by visiting the Web site at www.wellsfargo.com/advantagefunds. |
| | | | | | |
| List of Abbreviations | | Wells Fargo Advantage California Tax-Free Fund | | | 33 | |
The following is a list of common abbreviations for terms and entities which may have appeared in this report.
| ACB | — Agricultural Credit Bank |
| ADR | — American Depository Receipt |
| ADS | — American Depository Shares |
| AGC-ICC | — Assured Guaranty Corporation - Insured Custody Certificates |
| AGM | — Assured Guaranty Municipal |
| AMBAC | — American Municipal Bond Assurance Corporation |
| AMT | — Alternative Minimum Tax |
| BAN | — Bond Anticipation Notes |
| BHAC | — Berkshire Hathaway Assurance Corporation |
| CAB | — Capital Appreciation Bond |
| CCAB | — Convertible Capital Appreciation Bond |
| CDA | — Community Development Authority |
| CDO | — Collateralized Debt Obligation |
| COP | — Certificate of Participation |
| DRIVER | — Derivative Inverse Tax-Exempt Receipts |
| DW&P | — Department of Water & Power |
| DWR | — Department of Water Resources |
| ECFA | — Educational & Cultural Facilities Authority |
| EDA | — Economic Development Authority |
| EDFA | — Economic Development Finance Authority |
| ETF | — Exchange-Traded Fund |
| FFCB | — Federal Farm Credit Bank |
| FGIC | — Financial Guaranty Insurance Corporation |
| FHA | — Federal Housing Authority |
| FHLB | — Federal Home Loan Bank |
| FHLMC | — Federal Home Loan Mortgage Corporation |
| FNMA | — Federal National Mortgage Association |
| GDR | — Global Depository Receipt |
| GNMA | — Government National Mortgage Association |
| HCFR | — Healthcare Facilities Revenue |
| HEFA | — Health & Educational Facilities Authority |
| HEFAR | — Higher Education Facilities Authority Revenue |
| HFA | — Housing Finance Authority |
| HFFA | — Health Facilities Financing Authority |
| IBC | — Insured Bond Certificate |
| IDA | — Industrial Development Authority |
| IDAG | — Industrial Development Agency |
| IDR | — Industrial Development Revenue |
| KRW | — Republic of Korea Won |
| LIBOR | — London Interbank Offered Rate |
| LLC | — Limited Liability Company |
| LLP | — Limited Liability Partnership |
| MBIA | — Municipal Bond Insurance Association |
| MFHR | — Multi-Family Housing Revenue |
| MUD | — Municipal Utility District |
| NATL-RE | — National Public Finance Guarantee Corporation |
| PCFA | — Pollution Control Finance Authority |
| PCR | — Pollution Control Revenue |
| PFA | — Public Finance Authority |
| PFFA | — Public Facilities Financing Authority |
| PFOTER | — Puttable Floating Option Tax-Exempt Receipts |
| plc | — Public Limited Company |
| PUTTER | — Puttable Tax-Exempt Receipts |
| R&D | — Research & Development |
| RDA | — Redevelopment Authority |
| RDFA | — Redevelopment Finance Authority |
| REIT | — Real Estate Investment Trust |
| ROC | — Reset Option Certificates |
| SAVRS | — Select Auction Variable Rate Securities |
| SBA | — Small Business Authority |
| SFHR | — Single Family Housing Revenue |
| SFMR | — Single Family Mortgage Revenue |
| SPDR | — Standard & Poor’s Depositary Receipts |
| TAN | — Tax Anticipation Notes |
| TIPS | — Treasury Inflation-Protected Securities |
| TRAN | — Tax Revenue Anticipation Notes |
| TCR | — Transferable Custody Receipts |
| TTFA | — Transportation Trust Fund Authority |
| TVA | — Tennessee Valley Authority |
| XLCA | — XL Capital Assurance |
This page is intentionally left blank.


FOR MORE INFORMATION
More information about Wells Fargo Advantage Funds is available free upon request. To obtain literature, please write, e-mail, visit the Fund’s Web site, or call:
Wells Fargo Advantage Funds
P.O. Box 8266
Boston, MA 02266-8266
E-mail: wfaf@wellsfargo.com
Web site: www.wellsfargo.com/advantagefunds
Individual investors: 1-800-222-8222
Retail investment professionals: 1-888-877-9275
Institutional investment professionals: 1-866-765-0778
This report and the financial statements contained herein are submitted for the general information of the shareholders of Wells Fargo Advantage Funds. If this report is used for promotional purposes, distribution of the report must be accompanied or preceded by a current prospectus. For a prospectus containing more complete information, including charges and expenses, call 1-800-222-8222 or visit the Fund’s Web site at www.wellsfargo.com/advantagefunds. Please consider the investment objectives, risks, charges, and expenses of the investment carefully before investing. This and other information about Wells Fargo Advantage Funds can be found in the current prospectus. Read the prospectus carefully before you invest or send money.
Wells Fargo Funds Management, LLC, a wholly owned subsidiary of Wells Fargo & Company, provides investment advisory and administrative services for Wells Fargo Advantage Funds. Other affiliates of Wells Fargo & Company provide subadvisory and other services for the Funds. The Funds are distributed by Wells Fargo Funds Distributor, LLC, Member FINRA/SIPC, an affiliate of Wells Fargo & Company.
NOT FDIC INSURED ¡ NO BANK GUARANTEE ¡ MAY LOSE VALUE
© 2012 Wells Fargo Funds Management, LLC. All rights reserved.
| | |
 | | 207583 02-12 SA249/SAR249 12-11 |

Wells Fargo Advantage
Colorado Tax-Free Fund

Semi-Annual Report
December 31, 2011

Reduce clutter. Save trees.
Sign up for electronic delivery of prospectuses and shareholder reports at www.wellsfargo.com/advantagedelivery
Contents
The views expressed and any forward-looking statements are as of December 31, 2011, unless otherwise noted, and are those of the Fund managers and/or Wells Fargo Funds Management, LLC. Discussions of individual securities, or the markets generally, or any Wells Fargo Advantage Fund are not intended as individual recommendations. Future events or results may vary significantly from those expressed in any forward-looking statements; the views expressed are subject to change at any time in response to changing circumstances in the market. Wells Fargo Funds Management, LLC, disclaims any obligation to publicly update or revise any views expressed or forward-looking statements.
NOT FDIC INSURED ¡ NO BANK GUARANTEE ¡ MAY LOSE VALUE

WELLS FARGO INVESTMENT HISTORY
| | |
| |
| 1932 | | Keystone creates one of the first mutual fund families. |
| |
| 1971 | | Wells Fargo & Company introduces one of the first institutional index funds. |
| |
| 1978 | | Wells Fargo applies Markowitz and Sharpe’s research on Modern Portfolio Theory to introduce one of the industry’s first Tactical Asset Allocation (TAA) models in institutional separately managed accounts. |
| |
| 1984 | | Wells Fargo Stagecoach Funds launches its first asset allocation fund. |
| |
| 1989 | | The Tactical Asset Allocation (TAA) Model is first applied to Wells Fargo’s asset allocation mutual funds. |
| |
| 1994 | | Wells Fargo introduces the LifePath Funds, one of the first suites of target date funds (now the Wells Fargo Advantage Dow Jones Target Date FundsSM ). |
| |
| 1996 | | Evergreen Investments and Keystone Funds merge. |
| |
| 1997 | | Wells Fargo launches Wells Fargo Advantage WealthBuilder PortfoliosSM, a fund-of-funds suite of products that includes the use of quantitative models to shift assets among investment styles. |
| |
| 1999 | | Norwest Advantage Funds and Stagecoach Funds are reorganized into Wells Fargo Funds after the merger of Norwest and Wells Fargo. |
| |
| 2002 | | Evergreen Retail and Evergreen Institutional companies form the umbrella asset management company, Evergreen Investments. |
| |
| 2005 | | The integration of Strong Funds with Wells Fargo Funds creates Wells Fargo Advantage Funds, resulting in one of the top 20 mutual fund companies in the United States. |
| |
| 2006 | | Wells Fargo Advantage Funds relaunches the target date product line as Wells Fargo Advantage Dow Jones Target Date Funds. |
| |
| 2010 | | The mergers and reorganizations of Evergreen and Wells Fargo Advantage mutual funds are completed, unifying the families under the brand of Wells Fargo Advantage Funds. |
Wells Fargo Advantage Funds®
Wells Fargo Advantage Funds skillfully guides institutions, financial advisors, and individuals through the investment terrain to help them reach their financial objectives. Everything we do on behalf of investors is backed by our unique combination of qualifications.
Strength
Our organization is built on the standards of integrity and service established by our parent company—Wells Fargo & Company—more than 150 years ago. And, because we’re part of a highly diversified financial enterprise, we offer the depth of resources to help investors succeed.
Expertise
Our multi-boutique model offers investors access to the independent thinking of premier investment managers that have been chosen for their time-tested strategies. While each team specializes in a specific investment strategy, collectively they provide investors a wide choice of distinct investment styles. Our dedication to investment excellence doesn’t end with our expertise in manager selection—risk management, analysis, and rigorous ongoing review seek to ensure each manager’s investment process remains consistent.
Partnership
Our collaborative approach is built around understanding the needs and goals of our clients. By adhering to core principles of sound judgment and steady guidance, we support you through every stage of the investment decision process.
Carefully consider a fund’s investment objectives, risks, charges, and expenses before investing. For a current prospectus and, if available, a summary prospectus, containing this and other information, visit wellsfargo.com/advantagefunds. Read it carefully before investing.
Wells Fargo Funds Management, LLC, a wholly owned subsidiary of Wells Fargo & Company, provides investment advisory and administrative services for Wells Fargo Advantage Funds®. Other affiliates of Wells Fargo & Company provide subadvisory and other services for the Funds. The Funds are distributed by Wells Fargo Funds Distributor, LLC, Member FINRA/SIPC, an affiliate of Wells Fargo & Company.
“Dow Jones®” and “Dow Jones Target Date IndexesSM” are service marks of Dow Jones Trademark Holdings, LLC (“Dow Jones”), have been licensed to CME Group Index Services LLC (“CME Indexes”) and have been sublicensed for use for certain purposes by Global Index Advisors, Inc, and Wells Fargo Funds Management, LLC. The Wells Fargo Advantage Dow Jones Target Date FundsSM based on the Dow Jones Target Date IndexesSM, are not sponsored, endorsed, sold or promoted by Dow Jones, CME Indexes or their respective affiliates and none of them makes any representation regarding the advisability of investing in such product(s).
NOT FDIC INSURED ¡ NO BANK GUARANTEE ¡ MAY LOSE VALUE
Not part of the semi-annual report.
Wells Fargo Advantage Funds offers more than 110 mutual funds across a wide range of asset classes, representing over $216 billion in assets under management, as of December 31, 2011.
| | | | |
| Equity Funds | | | | |
Asia Pacific Fund | | Global Opportunities Fund | | Premier Large Company Growth Fund |
C&B Large Cap Value Fund | | Growth Fund | | Small Cap Opportunities Fund |
C&B Mid Cap Value Fund | | Health Care Fund | | Small Cap Value Fund |
Capital Growth Fund | | Index Fund | | Small Company Growth Fund |
Common Stock Fund | | International Equity Fund | | Small Company Value Fund |
Disciplined U.S. Core Fund | | International Value Fund | | Small/Mid Cap Core Fund |
Discovery Fund† | | Intrinsic Small Cap Value Fund | | Small/Mid Cap Value Fund |
Diversified Equity Fund | | Intrinsic Value Fund | | Social Sustainability Fund† |
Diversified International Fund | | Intrinsic World Equity Fund | | Special Mid Cap Value Fund |
Diversified Small Cap Fund | | Large Cap Core Fund | | Special Small Cap Value Fund |
Emerging Growth Fund | | Large Cap Growth Fund | | Specialized Technology Fund |
Emerging Markets Equity Fund | | Large Company Value Fund | | Strategic Large Cap Growth Fund |
Endeavor Select Fund† | | Omega Growth Fund | | Traditional Small Cap Growth Fund |
Enterprise Fund† | | Opportunity Fund† | | Utility and Telecommunications Fund |
Equity Value Fund | | Precious Metals Fund | | |
| Bond Funds | | | | |
Adjustable Rate Government Fund | | Inflation-Protected Bond Fund | | Short-Term Bond Fund |
California Limited-Term Tax-Free Fund | | Intermediate Tax/AMT-Free Fund | | Short-Term High Yield Bond Fund |
California Tax-Free Fund | | International Bond Fund | | Short-Term Municipal Bond Fund |
Colorado Tax-Free Fund | | Minnesota Tax-Free Fund | | Strategic Municipal Bond Fund |
Government Securities Fund | | Municipal Bond Fund | | Total Return Bond Fund |
High Income Fund | | North Carolina Tax-Free Fund | | Ultra Short-Term Income Fund |
High Yield Bond Fund | | Pennsylvania Tax-Free Fund | | Ultra Short-Term Municipal Income Fund |
Income Plus Fund | | Short Duration Government Bond Fund | | Wisconsin Tax-Free Fund |
| Asset Allocation Funds | | | | |
Asset Allocation Fund | | WealthBuilder Equity Portfolio† | | Target 2020 Fund† |
Conservative Allocation Fund | | WealthBuilder Growth Allocation Portfolio† | | Target 2025 Fund† |
Diversified Capital Builder Fund | | WealthBuilder Growth Balanced Portfolio† | | Target 2030 Fund† |
Diversified Income Builder Fund | | WealthBuilder Moderate Balanced Portfolio† | | Target 2035 Fund† |
Growth Balanced Fund | | WealthBuilder Tactical Equity Portfolio† | | Target 2040 Fund† |
Index Asset Allocation Fund | | Target Today Fund† | | Target 2045 Fund† |
Moderate Balanced Fund | | Target 2010 Fund† | | Target 2050 Fund† |
WealthBuilder Conservative Allocation Portfolio† | | Target 2015 Fund† | | Target 2055 Fund† |
| Money Market Funds | | | | |
100% Treasury Money Market Fund | | Heritage Money Market Fund† | | National Tax-Free Money Market Fund |
California Municipal Money Market Fund | | Money Market Fund | | Prime Investment Money Market Fund |
Cash Investment Money Market Fund | | Municipal Cash Management Money Market Fund | | Treasury Plus Money Market Fund |
Government Money Market Fund | | Municipal Money Market Fund | | |
| Variable Trust Funds1 | | | | |
VT Discovery Fund† | | VT Intrinsic Value Fund | | VT Small Cap Growth Fund |
VT Index Asset Allocation Fund | | VT Omega Growth Fund | | VT Small Cap Value Fund |
VT International Equity Fund | | VT Opportunity Fund† | | VT Total Return Bond Fund |
An investment in a money market fund is not insured or guaranteed by the Federal Deposit Insurance Corporation or any other government agency. Although the Wells Fargo Advantage Money Market Funds seek to preserve the value of your investment at $1.00 per share, it is possible to lose money by investing in a money market fund.
| 1. | The Variable Trust Funds are generally available only through insurance company variable contracts. |
| † | In this report, the Wells Fargo Advantage Discovery FundSM, Wells Fargo Advantage Endeavor Select FundSM, Wells Fargo Advantage Enterprise FundSM, Wells Fargo Advantage Opportunity FundSM, Wells Fargo Advantage Social Sustainability FundSM, Wells Fargo Advantage WealthBuilder Conservative Allocation PortfolioSM, Wells Fargo Advantage WealthBuilder Equity PortfolioSM, Wells Fargo Advantage WealthBuilder Growth Allocation PortfolioSM, Wells Fargo Advantage WealthBuilder Growth Balanced PortfolioSM, Wells Fargo Advantage WealthBuilder Moderate Balanced PortfolioSM, Wells Fargo Advantage WealthBuilder Tactical Equity PortfolioSM, Wells Fargo Advantage Dow Jones Target Today FundSM, Wells Fargo Advantage Dow Jones Target 2010 FundSM, Wells Fargo Advantage Dow Jones Target 2015 FundSM, Wells Fargo Advantage Dow Jones Target 2020 FundSM, Wells Fargo Advantage Dow Jones Target 2025 FundSM, Wells Fargo Advantage Dow Jones Target 2030 FundSM, Wells Fargo Advantage Dow Jones Target 2035 FundSM, Wells Fargo Advantage Dow Jones Target 2040 FundSM, Wells Fargo Advantage Dow Jones Target 2045 FundSM, Wells Fargo Advantage Dow Jones Target 2050 FundSM, Wells Fargo Advantage Dow Jones Target 2055 FundSM, Wells Fargo Advantage Heritage Money Market FundSM, Wells Fargo Advantage VT Discovery FundSM, and Wells Fargo Advantage VT Opportunity FundSM are referred to as the Discovery Fund, Endeavor Select Fund, Enterprise Fund, Opportunity Fund, Social Sustainability Fund, WealthBuilder Conservative Allocation Portfolio, WealthBuilder Equity Portfolio, WealthBuilder Growth Allocation Portfolio, WealthBuilder Growth Balanced Portfolio, WealthBuilder Moderate Balanced Portfolio, WealthBuilder Tactical Equity Portfolio, Target Today Fund, Target 2010 Fund, Target 2015 Fund, Target 2020 Fund, Target 2025 Fund, Target 2030 Fund, Target 2035 Fund, Target 2040 Fund, Target 2045 Fund, Target 2050 Fund, Target 2055 Fund, Heritage Money Market Fund, VT Discovery Fund, and VT Opportunity Fund, respectively. |
Not part of the semi-annual report.
| | | | |
| 2 | | Wells Fargo Advantage Colorado Tax-Free Fund | | Letter to Shareholders |

Karla M. Rabusch,
President
Wells Fargo Advantage Funds
For the entire six-month period, most of the major fixed-income indexes posted solid positive returns. However, the market’s six-month return figures mask the uneven path that the financial markets traced since the summer as investors had to contend with a variety of global and domestic headwinds.
Dear Valued Shareholder:
We’re pleased to offer you this semi-annual report for the Wells Fargo Advantage Colorado Tax-Free Fund for the six-month period that ended December 31, 2011. Upon reviewing the report, you may notice a few changes from past reports, the most significant of which is the change from a multi-fund report to a single-fund report. We made this change to make it easier for you to find your fund information.
For the entire six-month period, most of the major fixed-income indexes posted solid positive returns. However, the market’s six-month return figures mask the uneven path that the financial markets traced since the summer as investors had to contend with a variety of global and domestic headwinds. Whatever the future holds, we continue to believe that most investors can benefit from adhering to a well-diversified investment strategy. Over the long-term, such a strategy may allow you to balance risks and opportunities as you pursue your financial goals in a dynamic market landscape.
The economic recovery gained traction as the year progressed.
The U.S. economic recovery that began in mid-2009 has experienced a few slow patches along the way. However, the recovery regained some upward momentum during the six-month period, yet the rate of growth remained subpar compared with most previous recovery cycles.
In September 2011, it was reported that U.S. gross domestic product (GDP) grew at a mere 1.3% annual rate in the second quarter of 2011, following anemic growth at an annual rate of 0.4% in the first quarter. According to the December estimate, GDP growth accelerated to an annual rate of 1.8% in the third quarter, reigniting hopes for a sustainable recovery. Those hopes were buoyed by widespread anticipation of even stronger GDP growth in the fourth quarter. By year-end, few economists believed that the U.S. economy was in danger of sliding back into recession, although many expected a sluggish growth environment in 2012.
The struggling housing and labor markets slowed growth.
As has been the case throughout the recovery, the housing and labor markets continued to restrain economic momentum during 2011.
The beleaguered housing market has arguably exerted the biggest drag on growth. Despite intermittent signs of improvement, ongoing weakness in sales of both new and existing homes has put considerable downward pressure on prices. On the other hand, the labor market took a decided turn for the better during the final months of 2011: initial unemployment claims have eased, and the private sector has been steadily adding jobs. The pace of hiring, while not brisk, was sufficient to push the U.S. unemployment rate down to 8.5% as of December 2011—still well above its historical average but at its lowest level since February 2009. Many observers expect the unemployment rate to decline further in 2012, which could act as a tailwind for consumer spending—widely viewed as one of the keys to long-term economic growth.
The Federal Reserve announced that it will keep rates low until 2013.
Consumers have already demonstrated some resilience in their spending—even in the face of higher energy costs. Oil prices skyrocketed in early 2011 before
| | | | | | |
| Letter to Shareholders | | Wells Fargo Advantage Colorado Tax-Free Fund | | | 3 | |
retreating later in the year, only to spike again during the fourth quarter. Yet “core” inflation, which excludes volatile energy and food prices, remained fairly benign throughout the year.
With inflation in check, the Federal Reserve (Fed) held its target range for the federal funds rate—a proxy for short-term interest rates—steady at 0% to 0.25%. Following its August 9, 2011 meeting, the Federal Open Market Committee issued a statement explaining that economic conditions were likely to warrant exceptionally low levels for the federal funds rate through at least mid-2013. In September, the Fed launched yet another stimulus program—dubbed “Operation Twist”—that is designed to keep intermediate- and longer-term yields relatively low. The goal with keeping longer-term rates low is to encourage lending activity to spark business investments and home purchases, which, in turn, may provide support for a more sustainable economic recovery.
Market volatility was a dominant theme during the final six-months of the year
Early on in the period, market climate shifted to one of anxiety over the increasingly fragile state of the U.S. and global economies. In addition, investors not only worried that the U.S. might be on the brink of recession, they also feared that Europe’s sovereign debt problems could spiral out of control if a Greek default triggered financial contagion across the continent. In July and August, investor sentiment was further undermined by partisan wrangling over the federal debt ceiling and the downgrade of the U.S. credit rating by Standard & Poor’s. The barrage of unsettling headlines led to heightened market volatility and an increase in risk aversion, which translated into sharply falling stock prices and higher demand for “safer” assets such as Treasuries and municipals in the third quarter of 2011. Although volatility persisted into the fourth quarter, the financial markets were able to rebound amid improved U.S. economic data and hopes for a resolution to the European crisis.
For the entire six-month period, the Barclays Capital U.S. Aggregate Bond Index,1 which represents the universe of investment-grade bonds, and the Barclays Capital U.S. Treasury Index2 added 4.98% and 7.43%, respectively. By comparison, the Barclays Capital Municipal Bond Index3 gained 6.02% over the last half of the year.
Recent events have not altered our message to shareholders.
The market turmoil of 2011 and an uncertain outlook going forward have left many investors questioning their resolve—and their investments. Yet, it is precisely at such times that the market may present opportunities—as well as challenges—for prudent investors. Bear in mind that many investors who indiscriminately sold their equity investments during the severe market downturn of 2008 to 2009 missed out on the impressive two-year rally that followed. In our
| 1. | The Barclays Capital U.S. Aggregate Bond Index is composed of the Barclays Capital Government/Credit Index and the Mortgage-Backed Securities Index and includes U.S. Treasury issues, agency issues, corporate bond issues, and mortgage-backed securities. You cannot invest directly in an index. |
| 2. | The Barclays Capital U.S. Treasury Index is an index of U.S. Treasury Securities. You cannot invest directly in an index. |
| 3. | The Barclays Capital Municipal Bond Index is an unmanaged index composed of long-term tax-exempt bonds with a minimum credit rating of Baa. You cannot invest directly in an index. |
Although volatility persisted into the fourth quarter, the financial markets were able to rebound amid improved U.S. economic data and hopes for a resolution to the European crisis.
| | | | |
| 4 | | Wells Fargo Advantage Colorado Tax-Free Fund | | Letter to Shareholders |
opinion, the lesson to be learned from these dramatic market events is that, for many investors, simply building and maintaining a well-diversified4 investment plan is the best long-term strategy.
Thank you for choosing to invest with Wells Fargo Advantage Funds. We appreciate your confidence in us and remain committed to helping you meet your financial needs. For current information about your fund investments, contact your investment professional, visit our website at www.wellsfargo.com/advantagefunds, or call us directly at 1-800-222-8222. We are available 24 hours a day, 7 days a week.
Sincerely,

Karla M. Rabusch
President
Wells Fargo Advantage Funds
| 4. | Diversification does not assure or guarantee better performance and cannot eliminate the risk of investment losses. |
| | | | | | |
| Letter to Shareholders | | Wells Fargo Advantage Colorado Tax-Free Fund | | | 5 | |
|
|
Notice to Shareholders Effective April 1, 2012, the Fund may invest up to 10% of its total assets in inverse floaters to seek enhanced returns. Inverse floaters are derivative debt instruments created by depositing a municipal security in a trust. They pay interest at rates that generally vary inversely with specified short-term interest rates. The interest payment received on inverse floaters generally will decrease when specified short-term interest rates increase. Inverse floaters involve leverage, which may magnify the Fund’s gains or losses, and exhibit greater price and income volatility than bonds with similar maturities. We intend to limit leverage created by the Fund’s investment in inverse floaters to an amount equal to 10% of the Fund’s total assets. Inverse floaters are also subject to the risks associated with derivatives and municipal securities. |
|
|
Notice to Shareholders The Board of Trustees for Wells Fargo Advantage Funds has unanimously approved the following modifications to certain net asset value (NAV) waiver privileges and commission schedules: n Effective May 1, 2012, automatic investment plan (AIP) purchases and proceeds received from systematic withdrawals will no longer qualify for NAV repurchase privileges. n Effective May 1, 2012, discretionary rights to waive the upfront commission for Class C and “jumbo” Class A share purchases will no longer be granted to broker/dealers. However, we will continue to waive the Class C shares contingent deferred sales charge for redemptions by employer-sponsored retirement plans where the dealer of record waived its commission at the time of purchase. n Effective July 31, 2012, NAV purchase privileges for former Evergreen Class IS and Class R shareholders are being modified to remove the ability to purchase Class A shares at NAV unless those shares are held directly with the fund on or after July 31, 2012. |
| | | | |
| 6 | | Wells Fargo Advantage Colorado Tax-Free Fund | | Performance Highlights (Unaudited) |
INVESTMENT OBJECTIVE
The Fund seeks current income exempt from federal income tax and Colorado individual income tax.
ADVISER
Wells Fargo Funds Management, LLC
SUB-ADVISER
Wells Capital Management Incorporated
PORTFOLIO MANAGERS
Adrian Van Poppel
Terry J. Goode
FUND INCEPTION
June 1, 1993
| | |
CREDIT QUALITY1
(AS OF DECEMBER 31, 2011) | | |
|
 |
| | |
EFFECTIVE MATURITY DISTRIBUTION2
(AS OF DECEMBER 31, 2011) | | |
|
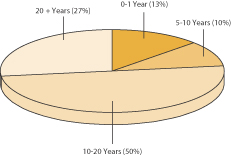 |
| 1. | The ratings indicated are from Standard & Poor’s, Moody’s Investors Service, and/or Fitch Ratings Ltd. Credit Quality Ratings: Credit quality ratings apply to underlying holdings of the Fund and not the Fund itself. Standard and Poor’s rates the creditworthiness of bonds, ranging from AAA (highest) to D (lowest). Ratings from A to CCC may be modified by the addition of a plus (+) or minus (–) sign to show relative standing within the rating categories. Standard & Poor’s rates the creditworthiness of short-term notes from SP-1 (highest) to SP-3 (lowest). Ratings from A to CCC may be modified by the addition of a plus (+) or minus (–) sign to show relative standing within the rating categories. Moody’s rates the creditworthiness of bonds, ranging from Aaa (highest) to C (lowest). Ratings Aa to B may be modified by the addition of a number 1 (highest) to 3 (lowest) to show relative standing within the ratings categories. Moody’s rates the creditworthiness of short-term U.S. tax-exempt municipal securities from MIG 1/VMIG 1 (highest) to SG (lowest). Fitch rates the creditworthiness of bonds, ranging from AAA (highest) to D (lowest). If a security was rated by all three rating agencies, the middle rating was utilized. If rated by two of three rating agencies, the lower rating was utilized and if rated by one of the agencies that rating was utilized. Credit quality is subject to change and is calculated based on the total investments of the Fund. We generally define higher quality bonds as bonds that have a rating of BBB/Baa and above and lower quality bonds as bonds with a rating below BBB/Baa. |
| 2. | Effective maturity is calculated based on the total long-term investments of the Fund. It is subject to change and may have changed since the date specified. |
| | | | | | |
| Performance Highlights (Unaudited) | | Wells Fargo Advantage Colorado Tax-Free Fund | | | 7 | |
AVERAGE ANNUAL TOTAL RETURN3 (%) (AS OF DECEMBER 31, 2011)
| | | | | | | | | | | | | | | | | | | | | | | | | | | | | | | | | | | | | | | | | | | | |
| | | | | | Including Sales Charge | | | Excluding Sales Charge | | | Expense Ratios4 | |
| | | Inception Date | | | 6 Months* | | | 1 Year | | | 5 Year | | | 10 Year | | | 6 Months* | | | 1 Year | | | 5 Year | | | 10 Year | | | Gross | | | Net5 | |
Class A (NWCOX) | | | 06/01/1993 | | | | 0.26 | | | | 4.22 | | | | 2.78 | | | | 3.95 | | | | 4.99 | | | | 9.13 | | | | 3.73 | | | | 4.43 | | | | 0.91% | | | | 0.86% | |
Class B (NWCBX)** | | | 08/02/1993 | | | | (0.41 | ) | | | 3.32 | | | | 2.60 | | | | 3.88 | | | | 4.59 | | | | 8.32 | | | | 2.96 | | | | 3.88 | | | | 1.66% | | | | 1.61% | |
Class C (WCOTX) | | | 03/31/2008 | | | | 3.59 | | | | 7.43 | | | | 2.93 | | | | 3.48 | | | | 4.59 | | | | 8.43 | | | | 2.93 | | | | 3.48 | | | | 1.66% | | | | 1.61% | |
Administrator Class (NCOTX) | | | 08/23/1993 | | | | | | | | | | | | | | | | | | | | 5.12 | | | | 9.40 | | | | 3.99 | | | | 4.67 | | | | 0.85% | | | | 0.61% | |
Barclays Capital Municipal Bond Index6 | | | | | | | | | | | | | | | | | | | | | | | 6.02 | | | | 10.70 | | | | 5.22 | | | | 5.38 | | | | | | | | | |
Barclays Capital Colorado Municipal Bond Index7 | | | | | | | | | | | | | | | | | | | | | | | 6.20 | | | | 10.70 | | | | 5.29 | | | | 5.52 | | | | | | | | | |
| * | Returns for periods of less than one year are not annualized. |
| ** | Class B shares are closed to investment, except in connection with the reinvestment of any distributions and permitted exchanges. |
Figures quoted represent past performance, which is no guarantee of future results and do not reflect the deduction of taxes that a shareholder may pay on fund distributions or the redemption of fund shares. Investment return and principal value of an investment will fluctuate so that an investor’s shares, when redeemed, may be worth more or less than their original cost. Performance shown without sales charges would be lower if sales charges were reflected. Current performance may be lower or higher than the performance data quoted and assumes the reinvestment of dividends and capital gains. Current month-end performance is available on the Fund’s Web site – www.wellsfargo.com/advantagefunds.
Index returns do not include transaction costs associated with buying and selling securities, any mutual fund fees or expenses or any taxes. It is not possible to invest directly in an index.
For Class A shares, the maximum front-end sales charge is 4.50%. For Class B shares, the maximum contingent deferred sales charge is 5.00%. For Class C shares, the maximum contingent deferred sales charge is 1.00%. Performance including sales charge assumes the sales charge for the corresponding time period. Administrator Class shares are sold without a front-end sales charge or contingent deferred sales charge.
Bond fund values fluctuate in response to the financial condition of individual issuers, general market and economic conditions, and changes in interest rates. In general, when interest rates rise, bond fund values fall and investors may lose principal value. The use of derivatives may reduce returns and/or increase volatility. Certain investment strategies tend to increase the total risk of an investment (relative to the broader market). This Fund is exposed to Colorado municipal securities risk, high-yield securities risk, and non-diversification risk. Consult the Fund’s prospectus for additional information on these and other risks. A portion of the Fund’s income may be subject to federal, state, and/or local income taxes or the alternative minimum tax (AMT). Any capital gains distributions may be taxable.
| 3. | Historical performance shown for Class C shares prior to their inception reflects the performance of Class A shares, adjusted to reflect the higher expenses applicable to Class C shares. |
| 4. | Reflects the expense ratios as stated in the most recent prospectuses. |
| 5. | The Adviser has committed through October 31, 2012 to waive fees and/or reimburse expenses to the extent necessary to cap the Fund’s Total Annual Fund Operating Expenses After Fee Waiver, excluding certain expenses, at 0.85% for Class A, 1.60% for Class B, 1.60% for Class C, and 0.60% for Administrator Class shares. Without this cap, the Fund’s returns would have been lower. |
| 6. | The Barclays Capital Municipal Bond Index is an unmanaged index composed of long-term tax-exempt bonds with a minimum credit rating of Baa. You cannot invest directly in an index. |
| 7. | The Barclays Capital Colorado Municipal Bond Index is the Colorado component of the Barclays Capital Municipal Bond Index. You cannot invest directly in an index. |
| | | | |
| 8 | | Wells Fargo Advantage Colorado Tax-Free Fund | | Fund Expenses (Unaudited) |
As a shareholder of the Fund, you incur two types of costs: (1) transaction costs, including sales charges (loads) on purchase payments and contingent deferred sales charges (if any) on redemptions and (2) ongoing costs, including management fees; distribution (12b-1) and/or shareholder service fees; and other Fund expenses. This example is intended to help you understand your ongoing costs (in dollars) of investing in the Fund and to compare these costs with the ongoing costs of investing in other mutual funds.
The example is based on an investment of $1,000 invested at the beginning of the six-month period and held for the entire period from July 1, 2011 to December 31, 2011.
Actual Expenses
The “Actual” line of the table below provides information about actual account values and actual expenses. You may use the information in this line, together with the amount you invested, to estimate the expenses that you paid over the period. Simply divide your account value by $1,000 (for example, an $8,600 account value divided by $1,000 = 8.6), then multiply the result by the number in the “Actual” line under the heading entitled “Expenses Paid During Period” for your applicable class of shares to estimate the expenses you paid on your account during this period.
Hypothetical Example for Comparison Purposes
The “Hypothetical” line of the table below provides information about hypothetical account values and hypothetical expenses based on the Fund’s actual expense ratio and an assumed rate of return of 5% per year before expenses, which is not the Fund’s actual return. The hypothetical account values and expenses may not be used to estimate the actual ending account balance or expenses you paid for the period. You may use this information to compare the ongoing costs of investing in the Fund and other funds. To do so, compare this 5% hypothetical example with the 5% hypothetical examples that appear in the shareholder reports of the other funds.
Please note that the expenses shown in the table are meant to highlight your ongoing costs only and do not reflect any transactional costs, such as sales charges (loads) and contingent deferred sales charges. Therefore, the “Hypothetical” line of the table is useful in comparing ongoing costs only, and will not help you determine the relative total costs of owning different funds. In addition, if these transactional costs were included, your costs would have been higher.
| | | | | | | | | | | | | | | | |
| | | Beginning
Account Value 07-01-2011 | | | Ending
Account Value 12-31-2011 | | | Expenses
Paid During
the Period1 | | | Net Annual
Expense Ratio | |
Class A | | | | | | | | | | | | | | | | |
Actual | | $ | 1,000.00 | | | $ | 1,049.88 | | | $ | 4.38 | | | | 0.85 | % |
Hypothetical (5% return before expenses) | | $ | 1,000.00 | | | $ | 1,020.86 | | | $ | 4.32 | | | | 0.85 | % |
Class B | | | | | | | | | | | | | | | | |
Actual | | $ | 1,000.00 | | | $ | 1,045.92 | | | $ | 8.28 | | | | 1.61 | % |
Hypothetical (5% return before expenses) | | $ | 1,000.00 | | | $ | 1,017.04 | | | $ | 8.16 | | | | 1.61 | % |
Class C | | | | | | | | | | | | | | | | |
Actual | | $ | 1,000.00 | | | $ | 1,045.91 | | | $ | 8.23 | | | | 1.60 | % |
Hypothetical (5% return before expenses) | | $ | 1,000.00 | | | $ | 1,017.09 | | | $ | 8.11 | | | | 1.60 | % |
Administrator Class | | | | | | | | | | | | | | | | |
Actual | | $ | 1,000.00 | | | $ | 1,051.19 | | | $ | 3.09 | | | | 0.60 | % |
Hypothetical (5% return before expenses) | | $ | 1,000.00 | | | $ | 1,022.12 | | | $ | 3.05 | | | | 0.60 | % |
| 1. | Expenses paid is equal to the annualized expense ratio of each class multiplied by the average account value over the period, multiplied by the number of days in the most recent fiscal half-year divided by the number of days in the fiscal year (to reflect the one-half year period). |
| | | | | | |
| Portfolio of Investments—December 31, 2011 (Unaudited) | | Wells Fargo Advantage Colorado Tax-Free Fund | | | 9 | |
| | | | | | | | | | | | | | | | |
| Security Name | | Interest Rate | | | Maturity Date | | | Principal | | | Value | |
| | | | | | | | | | | | | | | | |
| | | | |
Municipal Bonds and Notes: 93.08% | | | | | | | | | | | | | | | | |
| | | | |
| California: 1.19% | | | | | | | | | | | | | | | | |
Norco CA Redevelopment Agency Project Area #1 (Tax Revenue) | | | 6.00 | % | | | 03/01/2036 | | | $ | 1,120,000 | | | $ | 1,164,565 | |
| | | | | | | | | | | | | | | | |
| | | | |
| Colorado: 84.00% | | | | | | | | | | | | | | | | |
Arapahoe County CO Centennial 25 Metropolitan District (Tax Revenue) | | | 6.38 | | | | 12/01/2016 | | | | 315,000 | | | | 315,170 | |
Arapahoe County CO School District #006 (Tax Revenue, NATL-RE FGIC Insured) | | | 5.25 | | | | 12/01/2021 | | | | 200,000 | | | | 209,152 | |
Arapahoe County CO Water & Wastewater Authority (Water & Sewer Revenue, AGM Insured) | | | 5.00 | | | | 12/01/2033 | | | | 500,000 | | | | 522,355 | |
Arapahoe County CO Water & Wastewater Public Improvement District Project Series A (Tax Revenue, NATL-RE Insured) | | | 5.13 | | | | 12/01/2032 | | | | 2,000,000 | | | | 2,018,420 | |
Arkansas CO River Power Authority (Utilities Revenue) | | | 6.00 | | | | 10/01/2040 | | | | 1,980,000 | | | | 2,000,552 | |
Aurora CO Children Hospital Association (Health Revenue) | | | 5.00 | | | | 12/01/2040 | | | | 3,000,000 | | | | 3,036,900 | |
Aurora CO COP Series A (Lease Revenue) | | | 5.00 | | | | 12/01/2027 | | | | 2,000,000 | | | | 2,189,940 | |
Aurora CO Water Improvement Revenue Authority (Water & Sewer Revenue, AMBAC Insured) | | | 5.00 | | | | 08/01/2039 | | | | 1,000,000 | | | | 1,058,820 | |
Canon City CO Finance Authority COP (Lease Revenue, Assured Guaranty Insured) | | | 5.00 | | | | 12/01/2032 | | | | 150,000 | | | | 158,241 | |
Colorado ECFA Alexander Dawson School Colorado Project (Miscellaneous Revenue) | | | 5.00 | | | | 02/15/2040 | | | | 2,000,000 | | | | 2,085,300 | |
Colorado ECFA Charter School American Academy Project (Miscellaneous Revenue, Moral Obligation Insured) | | | 7.25 | | | | 12/01/2028 | | | | 1,000,000 | | | | 1,167,480 | |
Colorado ECFA Charter School American Academy Project (Miscellaneous Revenue, Moral Obligation Insured) | | | 7.38 | | | | 12/01/2028 | | | | 1,000,000 | | | | 1,174,810 | |
Colorado ECFA Charter School Banning Lewis (Miscellaneous Revenue) 144A | | | 6.13 | | | | 12/15/2035 | | | | 480,000 | | | | 423,456 | |
Colorado ECFA Charter School Collegiate Project (Miscellaneous Revenue, XLCA Insured) | | | 5.00 | | | | 06/15/2019 | | | | 1,040,000 | | | | 1,085,479 | |
Colorado ECFA Charter School Collegiate Project (Miscellaneous Revenue, XLCA Insured) | | | 5.25 | | | | 06/15/2024 | | | | 1,165,000 | | | | 1,195,104 | |
Colorado ECFA Charter School Community Leadership (Miscellaneous Revenue) | | | 6.25 | | | | 07/01/2028 | | | | 750,000 | | | | 657,593 | |
Colorado ECFA Charter School Flagstaff Series A (Miscellaneous Revenue) | | | 6.75 | | | | 08/01/2028 | | | | 1,000,000 | | | | 966,590 | |
Colorado ECFA Charter School Pinnacle High School Project (Miscellaneous Revenue) | | | 5.13 | | | | 12/01/2039 | | | | 500,000 | | | | 499,610 | |
Colorado ECFA Charter School Series B (Lease Revenue) | | | 6.13 | | | | 11/01/2020 | | | | 1,230,000 | | | | 1,276,150 | |
Colorado ECFA Charter School Twin Peaks Charter (Miscellaneous Revenue) | | | 6.75 | | | | 11/15/2028 | | | | 750,000 | | | | 841,253 | |
Colorado ECFA Cheyenne Mountain Charter Series A (Miscellaneous Revenue, Morgal Obligation Insured) | | | 5.25 | | | | 06/15/2029 | | | | 590,000 | | | | 596,396 | |
Colorado ECFA Johnson & Wales University Project Series A (Education Revenue, XLCA Insured) | | | 5.00 | | | | 04/01/2018 | | | | 860,000 | | | | 877,553 | |
Colorado ECFA Johnson & Wales University Project Series A (Education Revenue, XLCA Insured) | | | 5.00 | | | | 04/01/2023 | | | | 100,000 | | | | 100,854 | |
Colorado ECFA Parker Core Charter (Miscellaneous Revenue, XLCA Insured) | | | 5.00 | | | | 11/01/2024 | | | | 1,445,000 | | | | 1,475,750 | |
Colorado ECFA Refunding University Corporation Atmosphere Project (Education Revenue, GO of Corporation Insured) | | | 5.00 | | | | 09/01/2032 | | | | 1,265,000 | | | | 1,328,440 | |
Colorado ECFA Student Housing Campus Village Apartment (Lease Revenue) | | | 5.50 | | | | 06/01/2033 | | | | 2,735,000 | | | | 2,812,346 | |
Colorado Health Facilities Authority Adventist Health Sunbelt Series D (Health Revenue)±§ | | | 5.25 | | | | 11/15/2027 | | | | 1,000,000 | | | | 1,057,090 | |
Colorado Health Facilities Authority Adventist Health Sunbelt Series D (Health Revenue)±§ | | | 5.25 | | | | 11/15/2035 | | | | 1,000,000 | | | | 1,035,990 | |
Colorado Health Facilities Authority Catholic Health D-2 Project Prerefunded Balance (Health Revenue)±§ | | | 5.25 | | | | 10/01/2038 | | | | 15,000 | | | | 16,346 | |
Colorado Health Facilities Authority Catholic Health D-2 Project Unrefunded Balance (Health Revenue)±§ | | | 5.25 | | | | 10/01/2038 | | | | 85,000 | | | | 92,134 | |
| | | | |
| 10 | | Wells Fargo Advantage Colorado Tax-Free Fund | | Portfolio of Investments—December 31, 2011 (Unaudited) |
| | | | | | | | | | | | | | | | |
| Security Name | | Interest Rate | | | Maturity Date | | | Principal | | | Value | |
| | | | | | | | | | | | | | | | |
| | | | |
| Colorado (continued) | | | | | | | | | | | | | | | | |
Colorado Health Facilities Authority Exempla Incorporated Series A (Health Revenue) | | | 5.50 | % | | | 01/01/2023 | | | $ | 990,000 | | | $ | 1,000,049 | |
Colorado Health Facilities Authority Hospital Parkview Medical Center Incorporation (Health Revenue) | | | 5.00 | | | | 09/01/2025 | | | | 900,000 | | | | 914,922 | |
Colorado HFA Catholic Health Initiatives Series D (Health Revenue) | | | 6.25 | | | | 10/01/2033 | | | | 1,000,000 | | | | 1,113,780 | |
Colorado HFA Company Series E2 (Housing Revenue, NATL-RE-IBC Insured) | | | 7.00 | | | | 02/01/2030 | | | | 370,000 | | | | 375,073 | |
Colorado HFA Multifamily Project Class II Series A2 (Housing Revenue) | | | 5.40 | | | | 10/01/2029 | | | | 1,685,000 | | | | 1,777,203 | |
Colorado HFA Series E3 (Housing Revenue) | | | 6.60 | | | | 08/01/2017 | | | | 150,000 | | | | 152,403 | |
Colorado HFA Single Family Mortgage Class I Series A (Housing Revenue, FHA VA Guaranty Housing & Urban Development Loan Insured) | | | 5.50 | | | | 11/01/2029 | | | | 595,000 | | | | 608,750 | |
Colorado HFA Single Family Mortgage Class III Series A3 (Housing Revenue) | | | 5.25 | | | | 05/01/2032 | | | | 205,000 | | | | 205,033 | |
Colorado HFA Single Family Mortgage Class III Series A4 (Housing Revenue, GO of Authority Insured) | | | 4.75 | | | | 05/01/2030 | | | | 900,000 | | | | 902,682 | |
Colorado HFA Single Family Mortgage Class III Series B3 (Housing Revenue, GO of Authority Insured) | | | 5.25 | | | | 05/01/2032 | | | | 730,000 | | | | 730,380 | |
Colorado HFA Single Family Program Series A2 (Housing Revenue) | | | 6.45 | | | | 04/01/2030 | | | | 1,565,000 | | | | 1,624,220 | |
Colorado HFA Single Family Program Series A2 (Housing Revenue) | | | 6.50 | | | | 08/01/2031 | | | | 195,000 | | | | 201,905 | |
Colorado HFA Single Family Program Series A3 (Housing Revenue) | | | 6.50 | | | | 05/01/2016 | | | | 25,000 | | | | 25,796 | |
Colorado HFA Single Family Program Series B2 (Housing Revenue) | | | 6.10 | | | | 08/01/2023 | | | | 250,000 | | | | 256,243 | |
Colorado HFA Single Family Program Series B2 (Housing Revenue, NATL-RE-IBC Insured) | | | 6.80 | | | | 02/01/2031 | | | | 1,435,000 | | | | 1,562,356 | |
Colorado HFA Single Family Program Series B3 (Housing Revenue) | | | 6.55 | | | | 08/01/2033 | | | | 225,000 | | | | 229,759 | |
Colorado HFA Single Family Program Series B3 (Housing Revenue) | | | 6.70 | | | | 08/01/2017 | | | | 425,000 | | | | 453,611 | |
Colorado HFA Single Family Program Series C3 (Housing Revenue, FHA Insured) | | | 6.38 | | | | 08/01/2033 | | | | 215,000 | | | | 231,073 | |
Colorado HFA Waste Management Incorporated Project (Miscellaneous Revenue) | | | 5.70 | | | | 07/01/2018 | | | | 500,000 | | | | 558,795 | |
Colorado Mountain Junior College District Student Housing Facilities (Education Revenue, NATL-RE Insured) | | | 5.00 | | | | 06/01/2023 | | | | 1,320,000 | | | | 1,376,258 | |
Colorado North Range Metropolitan District # 1 (Tax Revenue, ACA Insured) | | | 5.00 | | | | 12/15/2024 | | | | 600,000 | | | | 487,638 | |
Colorado Springs CO Utilities Series B (Utilities Revenue)± | | | 0.45 | | | | 11/01/2036 | | | | 5,000,000 | | | | 5,000,000 | |
Colorado State COP Fitzsimons Academic Series B (Lease Revenue, NATL-RE Insured) | | | 5.00 | | | | 11/01/2030 | | | | 1,000,000 | | | | 1,025,520 | |
Colorado Water Reserve Power Development Authority Clean Water Series A (Water & Sewer Revenue) | | | 4.50 | | | | 09/01/2024 | | | | 1,000,000 | | | | 1,064,970 | |
Colorado Water Reserve Power Development Authority Clean Water Series A (Water & Sewer Revenue) | | | 4.88 | | | | 09/01/2017 | | | | 1,810,000 | | | | 1,816,498 | |
Colorado Water Reserve Power Development Authority Clean Water Series A (Water & Sewer Revenue) | | | 5.00 | | | | 09/01/2019 | | | | 1,000,000 | | | | 1,003,570 | |
Colorado Water Reserve Power Development Authority Clean Water Series A Unrefunded Balance (Miscellaneous Revenue) | | | 5.13 | | | | 09/01/2018 | | | | 55,000 | | | | 55,202 | |
Colorado Water Reserve Power Development Authority Clean Water Series B Unrefunded Balance (Miscellaneous Revenue) | | | 5.00 | | | | 09/01/2019 | | | | 30,000 | | | | 30,107 | |
Denver CO City & County Multi-Family Housing Project (Housing Revenue)±§ | | | 0.55 | | | | 12/01/2029 | | | | 4,000,000 | | | | 4,000,000 | |
Denver CO City & County Series A (Airport Revenue, XLCA Insured) | | | 5.00 | | | | 11/15/2022 | | | | 1,250,000 | | | | 1,385,925 | |
Denver CO City & County Series A (Tax Revenue, Assured Guaranty Insured) | | | 6.00 | | | | 09/01/2021 | | | | 2,000,000 | | | | 2,488,860 | |
Denver CO Convention Center (Tax Revenue, XLCA Insured) | | | 5.00 | | | | 12/01/2030 | | | | 1,205,000 | | | | 1,137,351 | |
Douglas County CO School District # 1 Douglas & Elbert Counties (Tax Revenue, NATL-RE FGIC State Aid Withholding Insured) | | | 5.75 | | | | 12/15/2022 | | | | 1,000,000 | | | | 1,148,710 | |
E-470 Public Highway Authority Colorado CAB Senior Series B (Transportation Revenue, NATL-RE Insured)(z) | | | 5.57 | | | | 09/01/2020 | | | | 2,455,000 | | | | 1,524,260 | |
E-470 Public Highway Authority Colorado CAB Series A (Miscellaneous Revenue, NATL-RE Insured)(z) | | | 7.03 | | | | 09/01/2034 | | | | 6,000,000 | | | | 1,256,760 | |
Fort Collins CO COP Series A (Lease Revenue, AMBAC Insured) | | | 5.38 | | | | 06/01/2025 | | | | 1,000,000 | | | | 1,087,980 | |
| | | | | | |
| Portfolio of Investments—December 31, 2011 (Unaudited) | | Wells Fargo Advantage Colorado Tax-Free Fund | | | 11 | |
| | | | | | | | | | | | | | | | |
| Security Name | | Interest Rate | | | Maturity Date | | | Principal | | | Value | |
| | | | | | | | | | | | | | | | |
| | | | |
| Colorado (continued) | | | | | | | | | | | | | | | | |
Garfield County CO Public Library District Lease Purchase Financing Program (Lease Revenue) | | | 5.00 | % | | | 12/01/2026 | | | $ | 715,000 | | | $ | 787,043 | |
Garfield County CO School District Series RE 2 (Tax Revenue, AGM State Aid Withholding Insured) | | | 5.25 | | | | 12/01/2021 | | | | 1,395,000 | | | | 1,458,835 | |
Glendale CO COP (Lease Revenue, XLCA Insured) | | | 5.00 | | | | 12/01/2025 | | | | 1,000,000 | | | | 1,058,870 | |
Inverness CO Water & Sanitation District Arapahoe & Douglas Counties Series A (Tax Revenue, Radian Insured) | | | 4.60 | | | | 12/01/2019 | | | | 465,000 | | | | 465,265 | |
La Plata County CO School District 9 (Education Revenue) | | | 5.00 | | | | 11/01/2024 | | | | 1,180,000 | | | | 1,406,843 | |
Park Meadows CO Business Improvement District (Tax Revenue) | | | 5.00 | | | | 12/01/2017 | | | | 295,000 | | | | 304,590 | |
Regional Transportation District Colorado COP Transit Vehicles-A (Lease Revenue, AMBAC Insured) | | | 5.00 | | | | 12/01/2022 | | | | 1,000,000 | | | | 1,096,960 | |
Sterling Hills CO West Metropolitan District (Tax Revenue, AGM Insured) | | | 5.00 | | | | 12/01/2031 | | | | 1,000,000 | | | | 1,055,990 | |
University of Colorado Enterprise System Series A (Education Revenue) | | | 5.00 | | | | 06/01/2026 | | | | 1,000,000 | | | | 1,175,590 | |
University of Colorado Hospital Authority Series A (Health Revenue) | | | 6.00 | | | | 11/15/2029 | | | | 2,000,000 | | | | 2,192,800 | |
| | | | |
| | | | | | | | | | | | | | | 82,091,702 | |
| | | | | | | | | | | | | | | | |
| | | | |
| Guam: 1.61% | | | | | | | | | | | | | | | | |
Guam Government Business Privilege Tax Series A (Tax Revenue) | | | 5.00 | | | | 01/01/2031 | | | | 1,000,000 | | | | 1,057,250 | |
Guam Government Limited Obligation Section 30 Series A (Miscellaneous Revenue) | | | 5.75 | | | | 12/01/2034 | | | | 500,000 | | | | 516,660 | |
| | | | |
| | | | | | | | | | | | | | | 1,573,910 | |
| | | | | | | | | | | | | | | | |
| | | | |
| New York: 1.13% | | | | | | | | | | | | | | | | |
New York NY Municipal Water Finance Authority (Water & Sewer Revenue) | | | 5.00 | | | | 06/15/2032 | | | | 1,000,000 | | | | 1,102,100 | |
| | | | | | | | | | | | | | | | |
| | | | |
| Puerto Rico: 1.44% | | | | | | | | | | | | | | | | |
Puerto Rico Highway & Transportation Authority Series L (Transportation Revenue, NATL-RE Insured) | | | 5.25 | | | | 07/01/2023 | | | | 1,305,000 | | | | 1,406,738 | |
| | | | | | | | | | | | | | | | |
| | | | |
| Virgin Islands: 3.71% | | | | | | | | | | | | | | | | |
Virgin Islands PFA Matching Fund Loan Notes Senior Lien Series A (Tax Revenue) | | | 5.00 | | | | 10/01/2029 | | | | 1,000,000 | | | | 1,019,810 | |
Virgin Islands PFA Sub Matching Fund Loan Series A (Tax Revenue) | | | 5.00 | | | | 10/01/2025 | | | | 2,500,000 | | | | 2,605,972 | |
| | | | |
| | | | | | | | | | | | | | | 3,625,782 | |
| | | | | | | | | | | | | | | | |
| | | | |
Total Municipal Bonds and Notes (Cost $88,483,687) | | | | | | | | | | | | | | | 90,964,797 | |
| | | | | | | | | | | | | | | | |
| | | | |
| | | Yield | | | | | | Shares | | | | |
| Short-Term Investments: 6.21% | | | | | | | | | | | | | | | | |
| | | | |
| Investment Companies: 6.21% | | | | | | | | | | | | | | | | |
Wells Fargo Advantage National Tax-Free Money Market Fund, Institutional Class(l)(u) | | | 0.01 | | | | | | | | 6,066,564 | | | | 6,066,564 | |
| | | | | | | | | | | | | | | | |
| | | | |
Total Short-Term Investments (Cost $6,066,564) | | | | | | | | | | | | | | | 6,066,564 | |
| | | | | | | | | | | | | | | | |
| | | | | | | | |
| Total Investments in Securities | | | | | | | | |
| (Cost $94,550,251)* | | | 99.29 | % | | | 97,031,361 | |
Other Assets and Liabilities, Net | | | 0.71 | | | | 697,564 | |
| | | | | | | | |
| Total Net Assets | | | 100.00 | % | | $ | 97,728,925 | |
| | | | | | | | |
| | | | |
| 12 | | Wells Fargo Advantage Colorado Tax-Free Fund | | Portfolio of Investments—December 31, 2011 (Unaudited) |
| 144A | Security that may be resold to “qualified institutional buyers” under Rule 144A or security offered pursuant to Section 4(2) of the Securities Act of 1933, as amended. |
| ± | Variable rate investment. |
| § | These securities are subject to a demand feature which reduces the effective maturity. |
| (z) | Zero coupon security. Rate represents yield to maturity. |
| (l) | Investment in an affiliate. |
| (u) | Rate shown is the 7-day annualized yield at period end. |
| * | Cost for federal income tax purposes is $94,547,801 and net unrealized appreciation (depreciation) consists of: |
| | | | |
Gross unrealized appreciation | | $ | 3,773,466 | |
Gross unrealized depreciation | | | (1,289,906 | ) |
| | | | |
Net unrealized appreciation | | $ | 2,483,560 | |
The accompanying notes are an integral part of these financial statements.
| | | | | | |
| Statement of Assets and Liabilities—December 31, 2011 (Unaudited) | | Wells Fargo Advantage Colorado Tax-Free Fund | | | 13 | |
| | | | |
| | | | |
| |
Assets | | | | |
Investments | | | | |
In unaffiliated securities, at value | | $ | 90,964,797 | |
In affiliated securities, at value | | | 6,066,564 | |
| | | | |
Total investments, at value (see cost below) | | | 97,031,361 | |
Receivable for Fund shares sold | | | 147,840 | |
Receivable for interest | | | 846,184 | |
Prepaid expenses and other assets | | | 3,506 | |
| | | | |
Total assets | | | 98,028,891 | |
| | | | |
| |
Liabilities | | | | |
Dividends payable | | | 172,809 | |
Payable for Fund shares redeemed | | | 54,574 | |
Advisory fee payable | | | 18,827 | |
Distribution fees payable | | | 2,685 | |
Due to other related parties | | | 15,914 | |
Shareholder servicing fees payable | | | 20,931 | |
Accrued expenses and other liabilities | | | 14,226 | |
| | | | |
Total liabilities | | | 299,966 | |
| | | | |
Total net assets | | $ | 97,728,925 | |
| | | | |
| |
NET ASSETS CONSIST OF | | | | |
Paid-in capital | | $ | 97,002,708 | |
Undistributed net investment income | | | 209,137 | |
Accumulated net realized losses on investments | | | (1,964,030 | ) |
Net unrealized gains on investments | | | 2,481,110 | |
| | | | |
Total net assets | | $ | 97,728,925 | |
| | | | |
| |
COMPUTATION OF NET ASSET VALUE AND OFFERING PRICE PER SHARE1 | | | | |
Net assets – Class A | | $ | 50,506,266 | |
Shares outstanding – Class A | | | 4,834,412 | |
Net asset value per share – Class A | | | $10.45 | |
Maximum offering price per share – Class A2 | | | $10.94 | |
Net assets – Class B | | $ | 61,876 | |
Shares outstanding – Class B | | | 5,913 | |
Net asset value per share – Class B | | | $10.46 | |
Net assets – Class C | | $ | 3,955,030 | |
Shares outstanding – Class C | | | 378,233 | |
Net asset value per share – Class C | | | $10.46 | |
Net assets – Administrator Class | | $ | 43,205,753 | |
Shares outstanding – Administrator Class | | | 4,135,470 | |
Net asset value per share – Administrator Class | | | $10.45 | |
| |
Total investments, at cost | | $ | 94,550,251 | |
| | | | |
| 1. | The Fund has an unlimited number of authorized shares. |
| 2. | Maximum offering price is computed as 100/95.50 of net asset value. On investments of $50,000 or more, the offering price is reduced. |
The accompanying notes are an integral part of these financial statements.
| | | | |
| 14 | | Wells Fargo Advantage Colorado Tax-Free Fund | | Statement of Operations—Six Months Ended December 31, 2011 (Unaudited) |
| | | | |
| | | | |
| |
Investment income | | | | |
Interest | | $ | 2,243,230 | |
Income from affiliated securities | | | 219 | |
| | | | |
Total investment income | | | 2,243,449 | |
| | | | |
| |
Expenses | | | | |
Advisory fee | | | 165,674 | |
Administration fees | | | | |
Fund level | | | 23,668 | |
Class A | | | 39,762 | |
Class B | | | 78 | |
Class C | | | 3,129 | |
Administrator Class | | | 20,480 | |
Shareholder servicing fees | | | | |
Class A | | | 62,128 | |
Class B | | | 121 | |
Class C | | | 4,889 | |
Administrator Class | | | 48,237 | |
Distribution fees | | | | |
Class B | | | 363 | |
Class C | | | 14,668 | |
Custody and accounting fees | | | 6,527 | |
Professional fees | | | 16,980 | |
Registration fees | | | 5,481 | |
Shareholder report expenses | | | 3,155 | |
Trustees’ fees and expenses | | | 7,112 | |
Other fees and expenses | | | 3,302 | |
| | | | |
Total expenses | | | 425,754 | |
Less: Fee waivers and/or expense reimbursements | | | (59,572 | ) |
| | | | |
Net expenses | | | 366,182 | |
| | | | |
Net investment income | | | 1,877,267 | |
| | | | |
| |
REALIZED AND UNREALIZED GAINS (LOSSES) ON INVESTMENTS | | | | |
Net realized losses on investments | | | (530,365 | ) |
Net change in unrealized gains (losses) on investments | | | 3,249,419 | |
| | | | |
Net realized and unrealized gains (losses) on investments | | | 2,719,054 | |
| | | | |
Net increase in net assets resulting from operations | | $ | 4,596,321 | |
| | | | |
The accompanying notes are an integral part of these financial statements.
| | | | | | |
| Statements of Changes in Net Assets | | Wells Fargo Advantage Colorado Tax-Free Fund | | | 15 | |
| | | | | | | | | | | | | | | | |
| | | Six Months Ended
December 31, 2011
(Unaudited) | | | Year Ended
June 30, 2011 | |
| | | | |
Operations | | | | | | | | | | | | | | | | |
Net investment income | | | | | | $ | 1,877,267 | | | | | | | $ | 4,563,555 | |
Net realized losses on investments | | | | | | | (530,365 | ) | | | | | | | (57,673 | ) |
Net change in unrealized gains (losses) on investments | | | | | | | 3,249,419 | | | | | | | | (2,756,715 | ) |
| | | | | | | | | | | | | | | | |
Net increase in net assets resulting from operations | | | | | | | 4,596,321 | | | | | | | | 1,749,167 | |
| | | | | | | | | | | | | | | | |
| | | | |
Distributions to shareholders from | | | | | | | | | | | | | | | | |
Net investment income | | | | | | | | | | | | | | | | |
Class A | | | | | | | (966,634 | ) | | | | | | | (2,540,157 | ) |
Class B | | | | | | | (1,533 | ) | | | | | | | (4,219 | ) |
Class C | | | | | | | (61,450 | ) | | | | | | | (139,244 | ) |
Administrator Class | | | | | | | (848,050 | ) | | | | | | | (1,880,102 | ) |
| | | | | | | | | | | | | | | | |
Total distributions to shareholders | | | | | | | (1,877,667 | ) | | | | | | | (4,563,722 | ) |
| | | | | | | | | | | | | | | | |
| | | | |
Capital share transactions | | | Shares | | | | | | | | Shares | | | | | |
Proceeds from shares sold | | | | | | | | | | | | | | | | |
Class A | | | 232,946 | | | | 2,406,682 | | | | 850,705 | | | | 8,743,632 | |
Class C | | | 19,591 | | | | 202,276 | | | | 129,510 | | | | 1,319,531 | |
Administrator Class | | | 567,643 | | | | 5,859,396 | | | | 1,066,806 | | | | 10,829,732 | |
| | | | | | | | | | | | | | | | |
| | | | | | | 8,468,354 | | | | | | | | 20,892,895 | |
| | | | | | | | | | | | | | | | |
Reinvestment of distributions | | | | | | | | | | | | | | | | |
Class A | | | 51,280 | | | | 529,362 | | | | 146,211 | | | | 1,492,967 | |
Class B | | | 136 | | | | 1,410 | | | | 248 | | | | 2,525 | |
Class C | | | 4,246 | | | | 43,871 | | | | 10,555 | | | | 107,682 | |
Administrator Class | | | 30,836 | | | | 318,387 | | | | 41,955 | | | | 424,080 | |
| | | | | | | | | | | | | | | | |
| | | | | | | 893,030 | | | | | | | | 2,027,254 | |
| | | | | | | | | | | | | | | | |
Payment for shares redeemed | | | | | | | | | | | | | | | | |
Class A | | | (201,054 | ) | | | (2,068,308 | ) | | | (2,947,580 | ) | | | (29,590,490 | ) |
Class B | | | (4,171 | ) | | | (43,407 | ) | | | (14,697 | ) | | | (152,429 | ) |
Class C | | | (16,056 | ) | | | (166,186 | ) | | | (148,149 | ) | | | (1,487,162 | ) |
Administrator Class | | | (307,955 | ) | | | (3,176,873 | ) | | | (1,530,034 | ) | | | (15,438,811 | ) |
| | | | | | | | | | | | | | | | |
| | | | | | | (5,454,774 | ) | | | | | | | (46,668,892 | ) |
| | | | | | | | | | | | | | | | |
Net increase (decrease) in net assets resulting
from capital share transactions | | | | | | | 3,906,610 | | | | | | | | (23,748,743 | ) |
| | | | | | | | | | | | | | | | |
Total increase (decrease) in net assets | | | | | | | 6,625,264 | | | | | | | | (26,563,298 | ) |
| | | | | | | | | | | | | | | | |
| | | | |
Net assets | | | | | | | | | | | | | | | | |
Beginning of period | | | | | | | 91,103,661 | | | | | | | | 117,666,959 | |
| | | | | | | | | | | | | | | | |
End of period | | | | | | $ | 97,728,925 | | | | | | | $ | 91,103,661 | |
| | | | | | | | | | | | | | | | |
Undistributed net investment income | | | | | | $ | 209,137 | | | | | | | $ | 209,537 | |
| | | | | | | | | | | | | | | | |
The accompanying notes are an integral part of these financial statements.
| | | | |
| 16 | | Wells Fargo Advantage Colorado Tax-Free Fund | | Financial Highlights |
(For a share outstanding throughout each period)
| | | | | | | | | | | | | | | | | | | | | | | | |
| | | Six Months Ended
December 31, 2011 (Unaudited) | | | Year Ended June 30, | |
| Class A | | | 2011 | | | 2010 | | | 2009 | | | 2008 | | | 2007 | |
Net asset value, beginning of period | | $ | 10.15 | | | $ | 10.35 | | | $ | 9.90 | | | $ | 10.32 | | | $ | 10.57 | | | $ | 10.55 | |
Net investment income | | | 0.20 | 1 | | | 0.44 | | | | 0.41 | 1 | | | 0.45 | 1 | | | 0.44 | 1 | | | 0.45 | |
Net realized and unrealized gains (losses) on investments | | | 0.30 | | | | (0.21 | ) | | | 0.46 | | | | (0.41 | ) | | | (0.24 | ) | | | 0.02 | |
| | | | | | | | | | | | | | | | | | | | | | | | |
Total from investment operations | | | 0.50 | | | | 0.23 | | | | 0.87 | | | | 0.04 | | | | 0.20 | | | | 0.47 | |
Distributions to shareholders from | | | | | | | | | | | | | | | | | | | | | | | | |
Net investment income | | | (0.20 | ) | | | (0.43 | ) | | | (0.42 | ) | | | (0.45 | ) | | | (0.44 | ) | | | (0.45 | ) |
Net realized gains | | | 0.00 | | | | 0.00 | | | | 0.00 | | | | (0.01 | ) | | | (0.01 | ) | | | 0.00 | |
| | | | | | | | | | | | | | | | | | | | | | | | |
Total distributions to shareholders | | | (0.20 | ) | | | (0.43 | ) | | | (0.42 | ) | | | (0.46 | ) | | | (0.45 | ) | | | (0.45 | ) |
Net asset value, end of period | | $ | 10.45 | | | $ | 10.15 | | | $ | 10.35 | | | $ | 9.90 | | | $ | 10.32 | | | $ | 10.57 | |
Total return2 | | | 4.99 | % | | | 2.34 | % | | | 8.90 | % | | | 0.51 | % | | | 1.85 | % | | | 4.46 | % |
Ratios to average net assets (annualized) | | | | | | | | | | | | | | | | | | | | | | | | |
Gross expenses | | | 0.90 | % | | | 0.89 | % | | | 0.89 | % | | | 1.00 | % | | | 1.12 | % | | | 1.15 | % |
Net expenses | | | 0.85 | % | | | 0.85 | % | | | 0.85 | % | | | 0.88 | % | | | 0.89 | % | | | 0.92 | % |
Net investment income | | | 3.89 | % | | | 4.25 | % | | | 3.95 | % | | | 4.58 | % | | | 4.20 | % | | | 4.21 | % |
Supplemental data | | | | | | | | | | | | | | | | | | | | | | | | |
Portfolio turnover rate | | | 19 | % | | | 22 | % | | | 15 | % | | | 20 | % | | | 15 | % | | | 21 | % |
Net assets, end of period (000’s omitted) | | | $50,506 | | | | $48,218 | | | | $69,351 | | | | $53,883 | | | | $46,174 | | | | $49,827 | |
| 1. | Calculated based upon average shares outstanding. |
| 2. | Total return calculations do not include any sales charges. Returns for periods of less than one year are not annualized. |
The accompanying notes are an integral part of these financial statements.
| | | | | | |
| Financial Highlights | | Wells Fargo Advantage Colorado Tax-Free Fund | | | 17 | |
(For a share outstanding throughout each period)
| | | | | | | | | | | | | | | | | | | | | | | | |
| | | Six Months Ended
December 31, 2011 (Unaudited) | | | Year Ended June 30, | |
| Class B | | | 2011 | | | 2010 | | | 2009 | | | 2008 | | | 2007 | |
Net asset value, beginning of period | | $ | 10.16 | | | $ | 10.36 | | | $ | 9.92 | | | $ | 10.33 | | | $ | 10.58 | | | $ | 10.57 | |
Net investment income | | | 0.16 | 1 | | | 0.36 | 1 | | | 0.33 | 1 | | | 0.38 | 1 | | | 0.36 | 1 | | | 0.37 | |
Net realized and unrealized gains (losses) on investments | | | 0.31 | | | | (0.20 | ) | | | 0.45 | | | | (0.40 | ) | | | (0.24 | ) | | | 0.01 | |
| | | | | | | | | | | | | | | | | | | | | | | | |
Total from investment operations | | | 0.47 | | | | 0.16 | | | | 0.78 | | | | (0.02 | ) | | | 0.12 | | | | 0.38 | |
Distributions to shareholders from | | | | | | | | | | | | | | | | | | | | | | | | |
Net investment income | | | (0.17 | ) | | | (0.36 | ) | | | (0.34 | ) | | | (0.38 | ) | | | (0.36 | ) | | | (0.37 | ) |
Net realized gains | | | 0.00 | | | | 0.00 | | | | 0.00 | | | | (0.01 | ) | | | (0.01 | ) | | | 0.00 | |
| | | | | | | | | | | | | | | | | | | | | | | | |
Total distributions to shareholders | | | (0.17 | ) | | | (0.36 | ) | | | (0.34 | ) | | | (0.39 | ) | | | (0.37 | ) | | | (0.37 | ) |
Net asset value, end of period | | $ | 10.46 | | | $ | 10.16 | | | $ | 10.36 | | | $ | 9.92 | | | $ | 10.33 | | | $ | 10.58 | |
Total return2 | | | 4.59 | % | | | 1.57 | % | | | 7.97 | % | | | (0.14 | )% | | | 1.09 | % | | | 3.59 | % |
Ratios to average net assets (annualized) | | | | | | | | | | | | | | | | | | | | | | | | |
Gross expenses | | | 1.65 | % | | | 1.64 | % | | | 1.66 | % | | | 1.74 | % | | | 1.87 | % | | | 1.90 | % |
Net expenses | | | 1.61 | % | | | 1.60 | % | | | 1.60 | % | | | 1.63 | % | | | 1.64 | % | | | 1.67 | % |
Net investment income | | | 3.17 | % | | | 3.50 | % | | | 3.24 | % | | | 3.83 | % | | | 3.45 | % | | | 3.47 | % |
Supplemental data | | | | | | | | | | | | | | | | | | | | | | | | |
Portfolio turnover rate | | | 19 | % | | | 22 | % | | | 15 | % | | | 20 | % | | | 15 | % | | | 21 | % |
Net assets, end of period (000’s omitted) | | | $62 | | | | $101 | | | | $253 | | | | $1,072 | | | | $2,870 | | | | $6,057 | |
| 1. | Calculated based upon average shares outstanding. |
| 2. | Total return calculations do not include any sales charges. Returns for periods of less than one year are not annualized. |
The accompanying notes are an integral part of these financial statements.
| | | | |
| 18 | | Wells Fargo Advantage Colorado Tax-Free Fund | | Financial Highlights |
(For a share outstanding throughout each period)
| | | | | | | | | | | | | | | | | | | | |
| | | Six Months Ended
December 31, 2011 (Unaudited) | | | Year Ended June 30, | |
| Class C | | | 2011 | | | 2010 | | | 2009 | | | 20081 | |
Net asset value, beginning of period | | $ | 10.16 | | | $ | 10.36 | | | $ | 9.91 | | | $ | 10.33 | | | $ | 10.35 | |
Net investment income | | | 0.16 | 2 | | | 0.36 | | | | 0.33 | 2 | | | 0.37 | 2 | | | 0.08 | 2 |
Net realized and unrealized gains (losses) on investments | | | 0.31 | | | | (0.20 | ) | | | 0.46 | | | | (0.40 | ) | | | (0.01 | ) |
| | | | | | | | | | | | | | | | | | | | |
Total from investment operations | | | 0.47 | | | | 0.16 | | | | 0.79 | | | | (0.03 | ) | | | 0.07 | |
Distributions to shareholders from | | | | | | | | | | | | | | | | | | | | |
Net investment income | | | (0.17 | ) | | | (0.36 | ) | | | (0.34 | ) | | | (0.38 | ) | | | (0.09 | ) |
Net realized gains | | | 0.00 | | | | 0.00 | | | | 0.00 | | | | (0.01 | ) | | | 0.00 | |
| | | | | | | | | | | | | | | | | | | | |
Total distributions to shareholders | | | (0.17 | ) | | | (0.36 | ) | | | (0.34 | ) | | | (0.39 | ) | | | (0.09 | ) |
Net asset value, end of period | | $ | 10.46 | | | $ | 10.16 | | | $ | 10.36 | | | $ | 9.91 | | | $ | 10.33 | |
Total return3 | | | 4.59 | % | | | 1.57 | % | | | 8.08 | % | | | (0.23 | )% | | | 0.58 | % |
Ratios to average net assets (annualized) | | | | | | | | | | | | | | | | | | | | |
Gross expenses | | | 1.65 | % | | | 1.64 | % | | | 1.65 | % | | | 1.73 | % | | | 1.74 | % |
Net expenses | | | 1.60 | % | | | 1.60 | % | | | 1.60 | % | | | 1.60 | % | | | 1.61 | % |
Net investment income | | | 3.14 | % | | | 3.50 | % | | | 3.17 | % | | | 3.82 | % | | | 2.25 | % |
Supplemental data | | | | | | | | | | | | | | | | | | | | |
Portfolio turnover rate | | | 19 | % | | | 22 | % | | | 15 | % | | | 20 | % | | | 15 | % |
Net assets, end of period (000’s omitted) | | | $3,955 | | | | $3,763 | | | | $3,920 | | | | $1,053 | | | | $401 | |
| 1. | For the period from March 31, 2008 (commencement of class operations) to June 30, 2008. |
| 2. | Calculated based upon average shares outstanding. |
| 3. | Total return calculations do not include any sales charges. Returns for periods of less than one year are not annualized. |
The accompanying notes are an integral part of these financial statements.
| | | | | | |
| Financial Highlights | | Wells Fargo Advantage Colorado Tax-Free Fund | | | 19 | |
(For a share outstanding throughout each period)
| | | | | | | | | | | | | | | | | | | | | | | | |
| | | Six Months Ended
December 31, 2011 (Unaudited) | | | Year Ended June 30, | |
| Administrator Class | | | 2011 | | | 2010 | | | 2009 | | | 2008 | | | 2007 | |
Net asset value, beginning of period | | $ | 10.15 | | | $ | 10.35 | | | $ | 9.90 | | | $ | 10.32 | | | $ | 10.57 | | | $ | 10.55 | |
Net investment income | | | 0.22 | 1 | | | 0.46 | | | | 0.43 | 1 | | | 0.48 | 1 | | | 0.47 | 1 | | | 0.48 | |
Net realized and unrealized gains (losses) on investments | | | 0.30 | | | | (0.20 | ) | | | 0.47 | | | | (0.42 | ) | | | (0.25 | ) | | | 0.02 | |
| | | | | | | | | | | | | | | | | | | | | | | | |
Total from investment operations | | | 0.52 | | | | 0.26 | | | | 0.90 | | | | 0.06 | | | | 0.22 | | | | 0.50 | |
Distributions to shareholders from | | | | | | | | | | | | | | | | | | | | | | | | |
Net investment income | | | (0.22 | ) | | | (0.46 | ) | | | (0.45 | ) | | | (0.47 | ) | | | (0.46 | ) | | | (0.48 | ) |
Net realized gains | | | 0.00 | | | | 0.00 | | | | 0.00 | | | | (0.01 | ) | | | (0.01 | ) | | | 0.00 | |
| | | | | | | | | | | | | | | | | | | | | | | | |
Total distributions to shareholders | | | (0.22 | ) | | | (0.46 | ) | | | (0.45 | ) | | | (0.48 | ) | | | (0.47 | ) | | | (0.48 | ) |
Net asset value, end of period | | $ | 10.45 | | | $ | 10.15 | | | $ | 10.35 | | | $ | 9.90 | | | $ | 10.32 | | | $ | 10.57 | |
Total return2 | | | 5.12 | % | | | 2.59 | % | | | 9.17 | % | | | 0.76 | % | | | 2.10 | % | | | 4.72 | % |
Ratios to average net assets (annualized) | | | | | | | | | | | | | | | | | | | | | | | | |
Gross expenses | | | 0.83 | % | | | 0.83 | % | | | 0.83 | % | | | 0.92 | % | | | 0.94 | % | | | 0.97 | % |
Net expenses | | | 0.60 | % | | | 0.60 | % | | | 0.60 | % | | | 0.63 | % | | | 0.64 | % | | | 0.67 | % |
Net investment income | | | 4.14 | % | | | 4.51 | % | | | 4.21 | % | | | 4.84 | % | | | 4.44 | % | | | 4.46 | % |
Supplemental data | | | | | | | | | | | | | | | | | | | | | | | | |
Portfolio turnover rate | | | 19 | % | | | 22 | % | | | 15 | % | | | 20 | % | | | 15 | % | | | 21 | % |
Net assets, end of period (000’s omitted) | | | $43,206 | | | | $39,021 | | | | $44,143 | | | | $43,746 | | | | $45,046 | | | | $35,446 | |
| 1. | Calculated based upon average shares outstanding. |
| 2. | Returns for periods of less than one year are not annualized. |
The accompanying notes are an integral part of these financial statements.
| | | | |
| 20 | | Wells Fargo Advantage Colorado Tax-Free Fund | | Notes to Financial Statements (Unaudited) |
1. ORGANIZATION
Wells Fargo Funds Trust (the “Trust”), a Delaware statutory trust organized on March 10, 1999, is an open-end management investment company registered under the Investment Company Act of 1940, as amended (the “1940 Act”). These financial statements report on Wells Fargo Advantage Colorado Tax-Free Fund (the “Fund”) which is a non-diversified series of the Trust.
2. SIGNIFICANT ACCOUNTING POLICIES
The following significant accounting policies, which are consistently followed in the preparation of the financial statements of the Fund, are in conformity with U.S. generally accepted accounting principles which require management to make estimates and assumptions that affect the reported amounts of assets and liabilities, disclosure of contingent assets and liabilities at the date of the financial statements, and the reported amounts of revenues and expenses during the reporting period. Actual results could differ from those estimates.
Securities valuation
Fixed income securities with maturities exceeding 60 days are valued based on available evaluated prices received from an independent pricing service approved by the Board of Trustees which may utilize both transaction data and market information such as yield, prices of securities of comparable quality, coupon rate, maturity, type of issue, trading characteristics and other market data. If valuations are not available from the pricing service or values received are deemed not representative of market value, values will be obtained from a third party broker-dealer or determined based on the Fund’s Fair Value Procedures.
Debt securities of sufficient credit quality with original maturities of 60 days or less generally are valued at amortized cost which approximates fair value. The amortized cost method involves valuing a security at its cost, plus accretion of discount or minus amortization of premium over the period until maturity.
Investments in open-end mutual funds and non-registered investment companies are generally valued at net asset value.
Investments which are not valued using any of the methods discussed above, are valued at their fair value, as determined by procedures established in good faith and approved by the Board of Trustees.
When-issued transactions
The Fund may purchase securities on a forward commitment or ‘when-issued’ basis. The Fund records a when-issued transaction on the trade date and will segregate assets to cover its obligation by confirming the availability of qualifying assets having a value sufficient to make payment for the securities purchased. Securities purchased on a when-issued basis are marked-to-market daily and the Fund begins earning interest on the settlement date. Losses may arise due to changes in the market value of the underlying securities or if the counterparty does not perform under the contract.
Security transactions and income recognition
Securities transactions are recorded on a trade date basis. Realized gains or losses are reported on the basis of identified cost of securities delivered.
Interest income is accrued daily and bond discounts are accreted and premiums are amortized daily based on the effective interest method. To the extent debt obligations are placed on non-accrual status, any related interest income may be reduced by writing off interest receivables when the collection of all or a portion of interest has become doubtful based on consistently applied procedures. If the issuer subsequently resumes interest payments or when the collectability of interest is reasonably assured, the debt obligation is removed from non-accrual status.
Distributions to shareholders
Distributions to shareholders from net investment income are accrued daily and paid monthly. Distributions from net realized gains, if any, are recorded on the ex-dividend date. Such distributions are determined in conformity with income tax regulations, which may differ from generally accepted accounting principles.
Federal and other taxes
The Fund intends to continue to qualify as a regulated investment company by distributing substantially all of its investment company taxable and tax-exempt income and any net realized capital gains (after reduction for capital loss carryforwards) sufficient to relieve it from all, or substantially all, federal income taxes. Accordingly, no provision for federal income taxes was required.
| | | | | | |
| Notes to Financial Statements (Unaudited) | | Wells Fargo Advantage Colorado Tax-Free Fund | | | 21 | |
The Fund’s income and federal excise tax returns and all financial records supporting those returns for the prior three fiscal years are subject to examination by the federal and Delaware revenue authorities.
The Fund’s income and federal excise tax returns and all financial records supporting those returns for the prior three fiscal years are subject to examination by the federal and Delaware revenue authorities.
Under the recently enacted Regulated Investment Company Modernization Act of 2010, the Fund is permitted to carry forward capital losses incurred in taxable years which began after December 22, 2010 for an unlimited period. However, any losses incurred are required to be utilized prior to the losses incurred in pre-enactment taxable years. As a result of this ordering rule, pre-enactment capital loss carryforwards may be more likely to expire unused. Additionally, post-enactment capital losses that are carried forward will retain their character as either short-term or long-term capital losses rather than being considered all short-term as under previous law.
As of June 30, 2011, the Fund had net capital loss carryforwards, which were available to offset future net realized capital gains, in the amount of $809,079 with $95,092 expiring in 2017, $656,194 expiring in 2018 and $57,793 expiring in 2019.
As of June 30, 2011, the Fund had $627,036 of current year deferred post-October capital losses, which would be treated as realized for tax purposes on the first day of the succeeding year.
Class allocations
The separate classes of shares offered by the Fund differ principally in applicable sales charges, distribution, shareholder servicing and administration fees. Shareholders of each class bear certain expenses that pertain to that particular class. All shareholders bear the common expenses of the Fund, earn income from the portfolio, and are allocated unrealized gains and losses pro rata based on the average daily net assets of each class, without distinction between share classes. Dividends are determined separately for each class based on income and expenses allocable to each class. Realized gains and losses are allocated to each class pro rata based upon the net assets of each class on the date realized. Differences in per share dividend rates generally result from the relative weightings of pro rata income and realized gain allocations and from differences in separate class expenses, including distribution, shareholder servicing and administration fees.
3. FAIR VALUATION MEASUREMENTS
Fair value measurements of investments are determined within a framework that has established a fair value hierarchy based upon the various data inputs utilized in determining the value of the Fund’s investments. The three-level hierarchy gives the highest priority to unadjusted quoted prices in active markets for identical assets or liabilities (Level 1) and the lowest priority to significant unobservable inputs (Level 3). The Fund’s investments are classified within the fair value hierarchy based on the lowest level of input that is significant to the fair value measurement. The inputs are summarized into three broad levels as follows:
| n | | Level 1 – quoted prices in active markets for identical securities |
| n | | Level 2 – other significant observable inputs (including quoted prices for similar securities, interest rates, prepayment speeds, credit risk, etc.) |
| n | | Level 3 – significant unobservable inputs (including the Fund’s own assumptions in determining the fair value of investments) |
The inputs or methodologies used for valuing securities are not necessarily an indication of the risk associated with investing in those securities.
As of December 31, 2011, the inputs used in valuing the Fund’s assets, which are carried at fair value, were as follows:
| | | | | | | | | | | | | | | | |
| Investments in Securities | | Quoted Prices
(Level 1) | | | Significant Other
Observable Inputs
(Level 2) | | | Significant
Unobservable Inputs
(Level 3) | | | Total | |
Municipal bonds and notes | | $ | 0 | | | $ | 90,964,797 | | | $ | 0 | | | $ | 90,964,797 | |
Short-term investments | | | | | | | | | | | | | | | | |
Investment companies | | | 6,066,564 | | | | 0 | | | | 0 | | | | 6,066,564 | |
| | | $ | 6,066,564 | | | $ | 90,964,797 | | | $ | 0 | | | $ | 97,031,361 | |
Further details on the major security types listed above can be found in the Portfolio of Investments.
| | | | |
| 22 | | Wells Fargo Advantage Colorado Tax-Free Fund | | Notes to Financial Statements (Unaudited) |
Transfers in and transfers out are recognized at the end of the reporting period. For the six months ended December 31, 2011, the Fund did not have any significant transfers into/out of Level 1 and Level 2.
4. TRANSACTIONS WITH AFFILIATES AND OTHER EXPENSES
Advisory fee
The Trust has entered into an advisory contract with Wells Fargo Funds Management, LLC (“Funds Management”), an indirect wholly owned subsidiary of Wells Fargo & Company (“Wells Fargo”). The adviser is responsible for implementing investment policies and guidelines and for supervising the sub-adviser, who is responsible for day-to-day portfolio management of the Fund.
Pursuant to the contract, Funds Management is entitled to receive an annual advisory fee starting at 0.35% and declining to 0.25% as the average daily net assets of the Fund increase. For the six months ended December 31, 2011, the advisory fee was equivalent to an annual rate of 0.35% of the Fund’s average daily net assets.
Funds Management may retain the services of certain sub-advisers to provide daily portfolio management to the Fund. The fees related to sub-advisory services are borne directly by Funds Management and do not increase the overall fees paid by the Fund. Wells Capital Management Incorporated, an affiliate of Funds Management, is the sub-adviser to the Fund and is entitled to receive a fee from Funds Management at an annual rate starting at 0.20% and declining to 0.10% as the average daily net assets of the Fund increase.
Administration and transfer agent fees
The Trust has entered into an administration agreement with Funds Management. Under this agreement, for providing administrative services, which includes paying fees and expenses for services provided by the transfer agent, sub-transfer agents, omnibus account servicers and record-keepers, Funds Management is entitled to receive from the Fund an annual fund level administration fee starting at 0.05% and declining to 0.03% as the average daily net assets of the Fund increase and a class level administration fee which is calculated based on the average daily net assets of each class as follows:
| | | | |
| | | Class Level
Administration Fee | |
Class A, Class B, Class C | | | 0.16 | % |
Administrator Class | | | 0.10 | |
Funds Management has contractually waived and/or reimbursed advisory and administration fees to the extent necessary to maintain certain net operating expense ratios for the Fund. Waiver of fees and/or reimbursement of expenses by Funds Management were made first from fund level expenses on a proportionate basis and then from class specific expenses.
Distribution fees
The Trust has adopted a Distribution Plan for Class B and Class C shares of the Fund pursuant to Rule 12b-1 under the 1940 Act. Distribution fees are charged to Class B and Class C shares and paid to Wells Fargo Funds Distributor, LLC, the principal underwriter, at an annual rate of 0.75% of the average daily net assets of Class B and Class C shares.
For the six months ended December 31, 2011, Wells Fargo Funds Distributor, LLC received $2,739 from the sale of Class A shares and $500 and $300 in contingent deferred sales charges from redemptions of Class A and Class C shares, respectively.
Shareholder servicing fees
The Trust has entered into contracts with one or more shareholder servicing agents, whereby each class of the Fund is charged a fee at an annual rate of 0.25% of the average daily net assets of each respective class.
A portion of these total shareholder servicing fees were paid to affiliates of Wells Fargo.
5. INVESTMENT PORTFOLIO TRANSACTIONS
Purchases and sales of investments, excluding U.S. Government obligations (if any) and short-term securities (securities with maturities of one year or less at purchase date), for the six months ended December 31, 2011 were $18,009,361 and $17,281,970, respectively.
| | | | | | |
| Notes to Financial Statements (Unaudited) | | Wells Fargo Advantage Colorado Tax-Free Fund | | | 23 | |
6. BANK BORROWINGS
The Trust (excluding the money market funds) and Wells Fargo Variable Trust are parties to a $150,000,000 revolving credit agreement with State Street Bank and Trust Company, whereby the Fund is permitted to use bank borrowings for temporary or emergency purposes, such as to fund shareholder redemption requests. Interest under the credit agreement is charged to the Fund based on a borrowing rate equal to the higher of the Federal Funds rate in effect on that day plus 1.25% or the overnight LIBOR rate in effect on that day plus 1.25%. In addition, under the credit agreement, the Fund pays an annual commitment fee equal to 0.10% of the unused balance, which is allocated pro rata. Prior to September 6, 2011, the revolving credit agreement was for $125,000,000 and the annual commitment fee paid by the Fund was 0.125% of the unused balance. For the six months ended December 31, 2011, the Fund paid $66 in commitment fees.
For the six months ended December 31, 2011, there were no borrowings by the Fund under the agreement.
7. CONCENTRATION RISK
The Fund invests a substantial portion of its assets in issuers of municipal debt securities located in a single state, therefore, it may be more affected by economic and political developments in that state or region than would be a comparable general tax-exempt mutual fund.
8. INDEMNIFICATION
Under the Trust’s organizational documents, the officers and directors are indemnified against certain liabilities that may arise out of performance of their duties to the Trust. Additionally, in the normal course of business, the Trust may enter into contracts with service providers that contain a variety of indemnification clauses. The Trust’s maximum exposure under these arrangements is dependent on future claims that may be made against the Fund and, therefore, cannot be estimated.
9. NEW ACCOUNTING PRONOUNCEMENTS
In May 2011, the Financial Accounting Standards Board (“FASB”) issued Accounting Standards Update (“ASU”) No. 2011-04 “Amendments to Achieve Common Fair Value Measurement and Disclosure Requirements in U.S. GAAP and IFRSs”. ASU No. 2011-04 amends FASB ASC Topic 820, Fair Value Measurements and Disclosures, to establish common requirements for measuring fair value and for disclosing information about fair value measurements in accordance with GAAP. The ASU is effective prospectively for interim and annual periods beginning after December 15, 2011. Management expects that adoption of the ASU will result in additional disclosures in the financial statements, as applicable.
In April 2011, FASB issued ASU No. 2011-03 “Reconsideration of Effective Control for Repurchase Agreements”. ASU No. 2011-03 amends FASB ASC Topic 860, Transfers and Servicing, specifically the criteria required to determine whether a repurchase agreement (repo) and similar agreements should be accounted for as sales of financial assets or secured borrowings with commitments. ASU No. 2011-03 changes the assessment of effective control by focusing on the transferor’s contractual rights and obligations and removing the criterion to assess its ability to exercise those rights or honor those obligations. This could result in changes to the way entities account for certain transactions including repurchase agreements, mortgage dollar rolls and reverse repurchase agreements. The ASU will become effective on a prospective basis for new transfers and modifications to existing transactions as of the beginning of the first interim or annual period beginning on or after December 15, 2011. Management has evaluated the impact of adopting the ASU and expects no significant changes.
| | | | |
| 24 | | Wells Fargo Advantage Colorado Tax-Free Fund | | Other Information (Unaudited) |
PROXY VOTING INFORMATION
A description of the policies and procedures that the Fund uses to determine how to vote proxies relating to portfolio securities is available without charge, upon request, by calling 1-800-222-8222, visiting our Web site at www.wellsfargo.com/advantagefunds, or visiting the SEC Web site at www.sec.gov. Information regarding how the Fund voted proxies relating to portfolio securities during the most recent 12-month period ended June 30 is available without charge on the Fund’s Web site at www.wellsfargo.com/advantagefunds or by visiting the SEC Web site at www.sec.gov.
PORTFOLIO HOLDINGS INFORMATION
The complete portfolio holdings for the Fund are publicly available on the Fund’s Web site (www.wellsfargo.com/advantagefunds) on a monthly, 30-day or more delayed basis. In addition, top ten holdings information for the Fund is publicly available on the Fund’s Web site on a monthly, seven-day or more delayed basis. The Fund files its complete schedule of portfolio holdings with the SEC for the first and third quarters of each fiscal year on Form N-Q, which is available without charge by visiting the SEC Web site at www.sec.gov. In addition, the Fund’s Form N-Q may be reviewed and copied at the SEC’s Public Reference Room in Washington, DC, and at regional offices in New York City, at 233 Broadway, and in Chicago, at 175 West Jackson Boulevard, Suite 900. Information about the Public Reference Room may be obtained by calling 1-800-SEC-0330.
| | | | | | |
| Other Information (Unaudited) | | Wells Fargo Advantage Colorado Tax-Free Fund | | | 25 | |
BOARD OF TRUSTEES
The following table provides basic information about the Board of Trustees (the “Trustees”) of the Trust and Officers of the Trust. This table should be read in conjunction with the Prospectus and the Statement of Additional Information1 of the Fund. Each of the Trustees and Officers listed below acts in identical capacities for the Wells Fargo Advantage family of funds, which consists of 138 funds comprising the Wells Fargo Funds Trust, Wells Fargo Variable Trust, Wells Fargo Master Trust and four closed-end funds (collectively the “Fund Complex”). All of the Trustees are also Members of the Audit and Governance Committees of each Trust in the Fund Complex. The mailing address of each Trustee and Officer is 525 Market Street, 12th Floor, San Francisco, CA 94105. Each Trustee and Officer serves an indefinite term, however, each Trustee serves such term until reaching the mandatory retirement age established by the Trustees.
Independent Trustees
| | | | | | |
Name and Year of Birth | | Position Held and Length of Service | | Principal Occupations During Past Five Years | | Other Directorships During
Past Five Years |
Peter G. Gordon
(Born 1942) | | Trustee, since 1998; Chairman, since 2005 (Lead Trustee since 2001) | | Co-Founder, Retired Chairman, President and CEO of Crystal Geyser Water Company. Trustee Emeritus, Colby College | | Asset Allocation Trust |
Isaiah Harris, Jr.
(Born 1952) | | Trustee, since 2009 | | Retired. Prior thereto, President and CEO of BellSouth Advertising and Publishing Corp. from 2005 to 2007, President and CEO of BellSouth Enterprises from 2004 to 2005 and President of BellSouth Consumer Services from 2000 to 2003. Emeritus member of the Iowa State University Foundation Board of Governors. Emeritus Member of the Advisory Board of Iowa State University School of Business. Mr. Harris is a certified public accountant. | | CIGNA Corporation; Deluxe Corporation; Asset Allocation Trust |
Judith M. Johnson
(Born 1949) | | Trustee, since 2008 | | Retired. Prior thereto, Chief Executive Officer and Chief Investment Officer of Minneapolis Employees Retirement Fund from 1996 to 2008. Ms. Johnson is an attorney, certified public accountant and a certified managerial accountant. | | Asset Allocation Trust |
Leroy Keith, Jr.
(Born 1939) | | Trustee, since 2010 | | Chairman, Bloc Global Services (development and construction). Trustee of the Evergreen Funds from 1983 to 2010. Former Managing Director, Almanac Capital Management (commodities firm), former Partner, Stonington Partners, Inc. (private equity fund), former Director, Obagi Medical Products Co. and former Director, Lincoln Educational Services. | | Trustee, Virtus Fund Complex (consisting of 40 portfolios as of 12/31/11); Asset Allocation Trust |
David F. Larcker
(Born 1950) | | Trustee, since 2009 | | James Irvin Miller Professor of Accounting at the Graduate School of Business, Stanford University, Director of Corporate Governance Research Program and Senior Faculty of The Rock Center for Corporate Governance since 2006. From 2005 to 2008, Professor of Accounting at the Graduate School of Business, Stanford University. Prior thereto, Ernst & Young Professor of Accounting at The Wharton School, University of Pennsylvania from 1985 to 2005. | | Asset Allocation Trust |
Olivia S. Mitchell
(Born 1953) | | Trustee, since 2006 | | International Foundation of Employee Benefit Plans Professor, Wharton School of the University of Pennsylvania since 1993. Director of Wharton’s Pension Research Council and Boettner Center on Pensions & Retirement Research, and Research Associate at the National Bureau of Economic Research. Previously, Cornell University Professor from 1978 to 1993. | | Asset Allocation Trust |
| | | | |
| 26 | | Wells Fargo Advantage Colorado Tax-Free Fund | | Other Information (Unaudited) |
| | | | | | |
Name and Year of Birth | | Position Held and Length of Service | | Principal Occupations During Past Five Years | | Other Directorships During
Past Five Years |
Timothy J. Penny
(Born 1951) | | Trustee, since 1996 | | President and CEO of Southern Minnesota Initiative Foundation, a non-profit organization, since 2007 and Senior Fellow at the Humphrey Institute Policy Forum at the University of Minnesota since 1995. Member of the Board of Trustees of NorthStar Education Finance, Inc., a non-profit organization, since 2007. | | Asset Allocation Trust |
Michael S. Scofield
(Born 1943) | | Trustee, since 2010 | | Served on the Investment Company Institute’s Board of Governors and Executive Committee from 2008-2011 as well the Governing Council of the Independent Directors Council from 2006-2011 and the Independent Directors Council Executive Committee from 2008-2011. Chairman of the IDC from 2008-2010. Institutional Investor (Fund Directions) Trustee of Year in 2007. Trustee of the Evergreen Funds (and its predecessors) from 1984 to 2010. Chairman of the Evergreen Funds from 2000-2010. Former Trustee of the Mentor Funds. Retired Attorney, Law Offices of Michael S. Scofield and former Director and Chairman, Branded Media Corporation (multi-media branding company). | | Asset Allocation Trust |
Donald C. Willeke
(Born 1940) | | Trustee, since 1996 | | Principal of the law firm of Willeke & Daniels. General Counsel of the Minneapolis Employees Retirement Fund from 1984 until its consolidation into the Minnesota Public Employees Retirement Association on June 30, 2010. Director and Vice Chair of The Free Trust (non-profit corporation). Director of the American Chestnut Foundation (non-profit corporation). | | Asset Allocation Trust |
Officers
| | | | | | |
Name and Year of Birth | | Position Held and
Length of Service | | Principal Occupations During Past Five Years | | |
Karla M. Rabusch
(Born 1959) | | President, since 2003 | | Executive Vice President of Wells Fargo Bank, N.A. and President of Wells Fargo Funds Management, LLC since 2003. Senior Vice President and Chief Administrative Officer of Wells Fargo Funds Management, LLC from 2001 to 2003. | | |
C. David Messman
(Born 1960) | | Secretary, since 2000; Chief Legal Counsel, since 2003 | | Senior Vice President and Secretary of Wells Fargo Funds Management, LLC since 2001. Vice President and Managing Senior Counsel of Wells Fargo Bank, N.A. since 1996. | | |
Kasey Phillips
(Born 1970) | | Treasurer, since 2009 | | Senior Vice President of Wells Fargo Funds Management, LLC since 2009. Senior Vice President of Evergreen Investment Management Company, LLC from 2006 to 2010. Treasurer of the Evergreen Funds from 2005 to 2010. | | |
David Berardi
(Born 1975) | | Assistant Treasurer, since 2009 | | Vice President of Wells Fargo Funds Management, LLC since 2009. Vice President of Evergreen Investment Management Company, LLC from 2008 to 2010. Assistant Vice President of Evergreen Investment Services, Inc. from 2004 to 2008. Manager of Fund Reporting and Control for Evergreen Investment Management Company, LLC from 2004 to 2010. | | |
Jeremy DePalma
(Born 1974) | | Assistant Treasurer, since 2009 | | Senior Vice President of Wells Fargo Funds Management, LLC since 2009. Senior Vice President of Evergreen Investment Management Company, LLC from 2008 to 2010. Vice President, Evergreen Investment Services, Inc. from 2004 to 2007. Head of the Fund Reporting and Control Team within Fund Administration from 2005 to 2010. | | |
Debra Ann Early
(Born 1964) | | Chief Compliance Officer, since 2007 | | Chief Compliance Officer of Wells Fargo Funds Management, LLC since 2007. Chief Compliance Officer of Parnassus Investments from 2005 to 2007. Chief Financial Officer of Parnassus Investments from 2004 to 2007 and Senior Audit Manager of PricewaterhouseCoopers LLP from 1998 to 2004. | | |
| 1. | The Statement of Additional Information includes additional information about the Trustees and is available, without charge, upon request, by calling 1-800-222-8222 or by visiting the Web site at www.wellsfargo.com/advantagefunds. |
| | | | | | |
| List of Abbreviations | | Wells Fargo Advantage Colorado Tax-Free Fund | | | 27 | |
The following is a list of common abbreviations for terms and entities which may have appeared in this report.
| ACB | — Agricultural Credit Bank |
| ADR | — American Depository Receipt |
| ADS | — American Depository Shares |
| AGC-ICC | — Assured Guaranty Corporation - Insured Custody Certificates |
| AGM | — Assured Guaranty Municipal |
| AMBAC | — American Municipal Bond Assurance Corporation |
| AMT | — Alternative Minimum Tax |
| BAN | — Bond Anticipation Notes |
| BHAC | — Berkshire Hathaway Assurance Corporation |
| CAB | — Capital Appreciation Bond |
| CCAB | — Convertible Capital Appreciation Bond |
| CDA | — Community Development Authority |
| CDO | — Collateralized Debt Obligation |
| COP | — Certificate of Participation |
| DRIVER | — Derivative Inverse Tax-Exempt Receipts |
| DW&P | — Department of Water & Power |
| DWR | — Department of Water Resources |
| ECFA | — Educational & Cultural Facilities Authority |
| EDA | — Economic Development Authority |
| EDFA | — Economic Development Finance Authority |
| ETF | — Exchange-Traded Fund |
| FFCB | — Federal Farm Credit Bank |
| FGIC | — Financial Guaranty Insurance Corporation |
| FHA | — Federal Housing Authority |
| FHLB | — Federal Home Loan Bank |
| FHLMC | — Federal Home Loan Mortgage Corporation |
| FNMA | — Federal National Mortgage Association |
| GDR | — Global Depository Receipt |
| GNMA | — Government National Mortgage Association |
| HCFR | — Healthcare Facilities Revenue |
| HEFA | — Health & Educational Facilities Authority |
| HEFAR | — Higher Education Facilities Authority Revenue |
| HFA | — Housing Finance Authority |
| HFFA | — Health Facilities Financing Authority |
| IBC | — Insured Bond Certificate |
| IDA | — Industrial Development Authority |
| IDAG | — Industrial Development Agency |
| IDR | — Industrial Development Revenue |
| KRW | — Republic of Korea Won |
| LIBOR | — London Interbank Offered Rate |
| LLC | — Limited Liability Company |
| LLP | — Limited Liability Partnership |
| MBIA | — Municipal Bond Insurance Association |
| MFHR | — Multi-Family Housing Revenue |
| MUD | — Municipal Utility District |
| NATL-RE | — National Public Finance Guarantee Corporation |
| PCFA | — Pollution Control Finance Authority |
| PCR | — Pollution Control Revenue |
| PFA | — Public Finance Authority |
| PFFA | — Public Facilities Financing Authority |
| PFOTER | — Puttable Floating Option Tax-Exempt Receipts |
| plc | — Public Limited Company |
| PUTTER | — Puttable Tax-Exempt Receipts |
| R&D | — Research & Development |
| RDA | — Redevelopment Authority |
| RDFA | — Redevelopment Finance Authority |
| REIT | — Real Estate Investment Trust |
| ROC | — Reset Option Certificates |
| SAVRS | — Select Auction Variable Rate Securities |
| SBA | — Small Business Authority |
| SFHR | — Single Family Housing Revenue |
| SFMR | — Single Family Mortgage Revenue |
| SPDR | — Standard & Poor’s Depositary Receipts |
| TAN | — Tax Anticipation Notes |
| TIPS | — Treasury Inflation-Protected Securities |
| TRAN | — Tax Revenue Anticipation Notes |
| TCR | — Transferable Custody Receipts |
| TTFA | — Transportation Trust Fund Authority |
| TVA | — Tennessee Valley Authority |
| XLCA | — XL Capital Assurance |
This page is intentionally left blank.
This page is intentionally left blank.
This page is intentionally left blank.


FOR MORE INFORMATION
More information about Wells Fargo Advantage Funds is available free upon request. To obtain literature, please write, e-mail, visit the Fund’s Web site, or call:
Wells Fargo Advantage Funds
P.O. Box 8266
Boston, MA 02266-8266
E-mail: wfaf@wellsfargo.com
Web site: www.wellsfargo.com/advantagefunds
Individual investors: 1-800-222-8222
Retail investment professionals: 1-888-877-9275
Institutional investment professionals: 1-866-765-0778
This report and the financial statements contained herein are submitted for the general information of the shareholders of Wells Fargo Advantage Funds. If this report is used for promotional purposes, distribution of the report must be accompanied or preceded by a current prospectus. For a prospectus containing more complete information, including charges and expenses, call 1-800-222-8222 or visit the Fund’s Web site at www.wellsfargo.com/advantagefunds. Please consider the investment objectives, risks, charges, and expenses of the investment carefully before investing. This and other information about Wells Fargo Advantage Funds can be found in the current prospectus. Read the prospectus carefully before you invest or send money.
Wells Fargo Funds Management, LLC, a wholly owned subsidiary of Wells Fargo & Company, provides investment advisory and administrative services for Wells Fargo Advantage Funds. Other affiliates of Wells Fargo & Company provide subadvisory and other services for the Funds. The Funds are distributed by Wells Fargo Funds Distributor, LLC, Member FINRA/SIPC, an affiliate of Wells Fargo & Company.
NOT FDIC INSURED ¡ NO BANK GUARANTEE ¡ MAY LOSE VALUE
© 2012 Wells Fargo Funds Management, LLC. All rights reserved.
| | |
 | | 207584 02-12 SA250/SAR250 12-11 |

Wells Fargo Advantage Intermediate Tax/AMT-Free Fund

Semi-Annual Report
December 31, 2011

Reduce clutter. Save trees.
Sign up for electronic delivery of prospectuses and shareholder reports at www.wellsfargo.com/advantagedelivery
Contents
The views expressed and any forward-looking statements are as of December 31, 2011, unless otherwise noted, and are those of the Fund managers and/or Wells Fargo Funds Management, LLC. Discussions of individual securities, or the markets generally, or any Wells Fargo Advantage Fund are not intended as individual recommendations. Future events or results may vary significantly from those expressed in any forward-looking statements; the views expressed are subject to change at any time in response to changing circumstances in the market. Wells Fargo Funds Management, LLC, disclaims any obligation to publicly update or revise any views expressed or forward-looking statements.
NOT FDIC INSURED ¡ NO BANK GUARANTEE ¡ MAY LOSE VALUE

WELLS FARGO INVESTMENT HISTORY
| | |
| |
| 1932 | | Keystone creates one of the first mutual fund families. |
| |
| 1971 | | Wells Fargo & Company introduces one of the first institutional index funds. |
| |
| 1978 | | Wells Fargo applies Markowitz and Sharpe’s research on Modern Portfolio Theory to introduce one of the industry’s first Tactical Asset Allocation (TAA) models in institutional separately managed accounts. |
| |
| 1984 | | Wells Fargo Stagecoach Funds launches its first asset allocation fund. |
| |
| 1989 | | The Tactical Asset Allocation (TAA) Model is first applied to Wells Fargo’s asset allocation mutual funds. |
| |
| 1994 | | Wells Fargo introduces the LifePath Funds, one of the first suites of target date funds (now the Wells Fargo Advantage Dow Jones Target Date FundsSM ). |
| |
| 1996 | | Evergreen Investments and Keystone Funds merge. |
| |
| 1997 | | Wells Fargo launches Wells Fargo Advantage WealthBuilder PortfoliosSM, a fund-of-funds suite of products that includes the use of quantitative models to shift assets among investment styles. |
| |
| 1999 | | Norwest Advantage Funds and Stagecoach Funds are reorganized into Wells Fargo Funds after the merger of Norwest and Wells Fargo. |
| |
| 2002 | | Evergreen Retail and Evergreen Institutional companies form the umbrella asset management company, Evergreen Investments. |
| |
| 2005 | | The integration of Strong Funds with Wells Fargo Funds creates Wells Fargo Advantage Funds, resulting in one of the top 20 mutual fund companies in the United States. |
| |
| 2006 | | Wells Fargo Advantage Funds relaunches the target date product line as Wells Fargo Advantage Dow Jones Target Date Funds. |
| |
| 2010 | | The mergers and reorganizations of Evergreen and Wells Fargo Advantage mutual funds are completed, unifying the families under the brand of Wells Fargo Advantage Funds. |
Wells Fargo Advantage Funds®
Wells Fargo Advantage Funds skillfully guides institutions, financial advisors, and individuals through the investment terrain to help them reach their financial objectives. Everything we do on behalf of investors is backed by our unique combination of qualifications.
Strength
Our organization is built on the standards of integrity and service established by our parent company—Wells Fargo & Company—more than 150 years ago. And, because we’re part of a highly diversified financial enterprise, we offer the depth of resources to help investors succeed.
Expertise
Our multi-boutique model offers investors access to the independent thinking of premier investment managers that have been chosen for their time-tested strategies. While each team specializes in a specific investment strategy, collectively they provide investors a wide choice of distinct investment styles. Our dedication to investment excellence doesn’t end with our expertise in manager selection—risk management, analysis, and rigorous ongoing review seek to ensure each manager’s investment process remains consistent.
Partnership
Our collaborative approach is built around understanding the needs and goals of our clients. By adhering to core principles of sound judgment and steady guidance, we support you through every stage of the investment decision process.
Carefully consider a fund’s investment objectives, risks, charges, and expenses before investing. For a current prospectus and, if available, a summary prospectus, containing this and other information, visit wellsfargo.com/advantagefunds. Read it carefully before investing.
Wells Fargo Funds Management, LLC, a wholly owned subsidiary of Wells Fargo & Company, provides investment advisory and administrative services for Wells Fargo Advantage Funds®. Other affiliates of Wells Fargo & Company provide subadvisory and other services for the Funds. The Funds are distributed by Wells Fargo Funds Distributor, LLC, Member FINRA/SIPC, an affiliate of Wells Fargo & Company.
“Dow Jones®” and “Dow Jones Target Date IndexesSM” are service marks of Dow Jones Trademark Holdings, LLC (“Dow Jones”), have been licensed to CME Group Index Services LLC (“CME Indexes”) and have been sublicensed for use for certain purposes by Global Index Advisors, Inc, and Wells Fargo Funds Management, LLC. The Wells Fargo Advantage Dow Jones Target Date FundsSM based on the Dow Jones Target Date IndexesSM, are not sponsored, endorsed, sold or promoted by Dow Jones, CME Indexes or their respective affiliates and none of them makes any representation regarding the advisability of investing in such product(s).
NOT FDIC INSURED ¡ NO BANK GUARANTEE ¡ MAY LOSE VALUE
Not part of the semi-annual report.
Wells Fargo Advantage Funds offers more than 110 mutual funds across a wide range of asset classes, representing over $216 billion in assets under management, as of December 31, 2011.
| | | | |
| Equity Funds | | | | |
Asia Pacific Fund | | Global Opportunities Fund | | Premier Large Company Growth Fund |
C&B Large Cap Value Fund | | Growth Fund | | Small Cap Opportunities Fund |
C&B Mid Cap Value Fund | | Health Care Fund | | Small Cap Value Fund |
Capital Growth Fund | | Index Fund | | Small Company Growth Fund |
Common Stock Fund | | International Equity Fund | | Small Company Value Fund |
Disciplined U.S. Core Fund | | International Value Fund | | Small/Mid Cap Core Fund |
Discovery Fund† | | Intrinsic Small Cap Value Fund | | Small/Mid Cap Value Fund |
Diversified Equity Fund | | Intrinsic Value Fund | | Social Sustainability Fund† |
Diversified International Fund | | Intrinsic World Equity Fund | | Special Mid Cap Value Fund |
Diversified Small Cap Fund | | Large Cap Core Fund | | Special Small Cap Value Fund |
Emerging Growth Fund | | Large Cap Growth Fund | | Specialized Technology Fund |
Emerging Markets Equity Fund | | Large Company Value Fund | | Strategic Large Cap Growth Fund |
Endeavor Select Fund† | | Omega Growth Fund | | Traditional Small Cap Growth Fund |
Enterprise Fund† | | Opportunity Fund† | | Utility and Telecommunications Fund |
Equity Value Fund | | Precious Metals Fund | | |
| Bond Funds | | | | |
Adjustable Rate Government Fund | | Inflation-Protected Bond Fund | | Short-Term Bond Fund |
California Limited-Term Tax-Free Fund | | Intermediate Tax/AMT-Free Fund | | Short-Term High Yield Bond Fund |
California Tax-Free Fund | | International Bond Fund | | Short-Term Municipal Bond Fund |
Colorado Tax-Free Fund | | Minnesota Tax-Free Fund | | Strategic Municipal Bond Fund |
Government Securities Fund | | Municipal Bond Fund | | Total Return Bond Fund |
High Income Fund | | North Carolina Tax-Free Fund | | Ultra Short-Term Income Fund |
High Yield Bond Fund | | Pennsylvania Tax-Free Fund | | Ultra Short-Term Municipal Income Fund |
Income Plus Fund | | Short Duration Government Bond Fund | | Wisconsin Tax-Free Fund |
| Asset Allocation Funds | | | | |
Asset Allocation Fund | | WealthBuilder Equity Portfolio† | | Target 2020 Fund† |
Conservative Allocation Fund | | WealthBuilder Growth Allocation Portfolio† | | Target 2025 Fund† |
Diversified Capital Builder Fund | | WealthBuilder Growth Balanced Portfolio† | | Target 2030 Fund† |
Diversified Income Builder Fund | | WealthBuilder Moderate Balanced Portfolio† | | Target 2035 Fund† |
Growth Balanced Fund | | WealthBuilder Tactical Equity Portfolio† | | Target 2040 Fund† |
Index Asset Allocation Fund | | Target Today Fund† | | Target 2045 Fund† |
Moderate Balanced Fund | | Target 2010 Fund† | | Target 2050 Fund† |
WealthBuilder Conservative Allocation Portfolio† | | Target 2015 Fund† | | Target 2055 Fund† |
| Money Market Funds | | | | |
100% Treasury Money Market Fund | | Heritage Money Market Fund† | | National Tax-Free Money Market Fund |
California Municipal Money Market Fund | | Money Market Fund | | Prime Investment Money Market Fund |
Cash Investment Money Market Fund | | Municipal Cash Management Money Market Fund | | Treasury Plus Money Market Fund |
Government Money Market Fund | | Municipal Money Market Fund | | |
| Variable Trust Funds1 | | | | |
VT Discovery Fund† | | VT Intrinsic Value Fund | | VT Small Cap Growth Fund |
VT Index Asset Allocation Fund | | VT Omega Growth Fund | | VT Small Cap Value Fund |
VT International Equity Fund | | VT Opportunity Fund† | | VT Total Return Bond Fund |
An investment in a money market fund is not insured or guaranteed by the Federal Deposit Insurance Corporation or any other government agency. Although the Wells Fargo Advantage Money Market Funds seek to preserve the value of your investment at $1.00 per share, it is possible to lose money by investing in a money market fund.
| 1. | The Variable Trust Funds are generally available only through insurance company variable contracts. |
| † | In this report, the Wells Fargo Advantage Discovery FundSM, Wells Fargo Advantage Endeavor Select FundSM, Wells Fargo Advantage Enterprise FundSM, Wells Fargo Advantage Opportunity FundSM, Wells Fargo Advantage Social Sustainability FundSM, Wells Fargo Advantage WealthBuilder Conservative Allocation PortfolioSM, Wells Fargo Advantage WealthBuilder Equity PortfolioSM, Wells Fargo Advantage WealthBuilder Growth Allocation PortfolioSM, Wells Fargo Advantage WealthBuilder Growth Balanced PortfolioSM, Wells Fargo Advantage WealthBuilder Moderate Balanced PortfolioSM, Wells Fargo Advantage WealthBuilder Tactical Equity PortfolioSM, Wells Fargo Advantage Dow Jones Target Today FundSM, Wells Fargo Advantage Dow Jones Target 2010 FundSM, Wells Fargo Advantage Dow Jones Target 2015 FundSM, Wells Fargo Advantage Dow Jones Target 2020 FundSM, Wells Fargo Advantage Dow Jones Target 2025 FundSM, Wells Fargo Advantage Dow Jones Target 2030 FundSM, Wells Fargo Advantage Dow Jones Target 2035 FundSM, Wells Fargo Advantage Dow Jones Target 2040 FundSM, Wells Fargo Advantage Dow Jones Target 2045 FundSM, Wells Fargo Advantage Dow Jones Target 2050 FundSM, Wells Fargo Advantage Dow Jones Target 2055 FundSM, Wells Fargo Advantage Heritage Money Market FundSM, Wells Fargo Advantage VT Discovery FundSM, and Wells Fargo Advantage VT Opportunity FundSM are referred to as the Discovery Fund, Endeavor Select Fund, Enterprise Fund, Opportunity Fund, Social Sustainability Fund, WealthBuilder Conservative Allocation Portfolio, WealthBuilder Equity Portfolio, WealthBuilder Growth Allocation Portfolio, WealthBuilder Growth Balanced Portfolio, WealthBuilder Moderate Balanced Portfolio, WealthBuilder Tactical Equity Portfolio, Target Today Fund, Target 2010 Fund, Target 2015 Fund, Target 2020 Fund, Target 2025 Fund, Target 2030 Fund, Target 2035 Fund, Target 2040 Fund, Target 2045 Fund, Target 2050 Fund, Target 2055 Fund, Heritage Money Market Fund, VT Discovery Fund, and VT Opportunity Fund, respectively. |
Not part of the semi-annual report.
| | | | |
| 2 | | Wells Fargo Advantage Intermediate Tax/AMT-Free Fund | | Letter to Shareholders |

Karla M. Rabusch,
President
Wells Fargo Advantage Funds
For the entire six-month period, most of the major fixed-income indexes posted solid positive returns. However, the market’s six-month return figures mask the uneven path that the financial markets traced since the summer as investors had to contend with a variety of global and domestic headwinds.
Dear Valued Shareholder:
We’re pleased to offer you this semi-annual report for the Wells Fargo Advantage Intermediate Tax/AMT-Free Fund for the six-month period that ended December 31, 2011. Upon reviewing the report, you may notice a few changes from past reports, the most significant of which is the change from a multi-fund report to a single-fund report. We made this change to make it easier for you to find your fund information.
For the entire six-month period, most of the major fixed-income indexes posted solid positive returns. However, the market’s six-month return figures mask the uneven path that the financial markets traced since the summer as investors had to contend with a variety of global and domestic headwinds. Whatever the future holds, we continue to believe that most investors can benefit from adhering to a well-diversified investment strategy. Over the long-term, such a strategy may allow you to balance risks and opportunities as you pursue your financial goals in a dynamic market landscape.
The economic recovery gained traction as the year progressed.
The U.S. economic recovery that began in mid-2009 has experienced a few slow patches along the way. However, the recovery regained some upward momentum during the six-month period, yet the rate of growth remained subpar compared with most previous recovery cycles.
In September 2011, it was reported that U.S. gross domestic product (GDP) grew at a mere 1.3% annual rate in the second quarter of 2011, following anemic growth at an annual rate of 0.4% in the first quarter. According to the December estimate, GDP growth accelerated to an annual rate of 1.8% in the third quarter, reigniting hopes for a sustainable recovery. Those hopes were buoyed by widespread anticipation of even stronger GDP growth in the fourth quarter. By year-end, few economists believed that the U.S. economy was in danger of sliding back into recession, although many expected a sluggish growth environment in 2012.
The struggling housing and labor markets slowed growth.
As has been the case throughout the recovery, the housing and labor markets continued to restrain economic momentum during 2011.
The beleaguered housing market has arguably exerted the biggest drag on growth. Despite intermittent signs of improvement, ongoing weakness in sales of both new and existing homes has put considerable downward pressure on prices. On the other hand, the labor market took a decided turn for the better during the final months of 2011: initial unemployment claims have eased, and the private sector has been steadily adding jobs. The pace of hiring, while not brisk, was sufficient to push the U.S. unemployment rate down to 8.5% as of December 2011—still well above its historical average but at its lowest level since February 2009. Many observers expect the unemployment rate to decline further in 2012, which could act as a tailwind for consumer spending—widely viewed as one of the keys to long-term economic growth.
The Federal Reserve announced that it will keep rates low until 2013.
Consumers have already demonstrated some resilience in their spending—even in the face of higher energy costs. Oil prices skyrocketed in early 2011 before
| | | | | | |
| Letter to Shareholders | | Wells Fargo Advantage Intermediate Tax/AMT-Free Fund | | | 3 | |
retreating later in the year, only to spike again during the fourth quarter. Yet “core” inflation, which excludes volatile energy and food prices, remained fairly benign throughout the year.
With inflation in check, the Federal Reserve (Fed) held its target range for the federal funds rate—a proxy for short-term interest rates—steady at 0% to 0.25%. Following its August 9, 2011 meeting, the Federal Open Market Committee issued a statement explaining that economic conditions were likely to warrant exceptionally low levels for the federal funds rate through at least mid-2013. In September, the Fed launched yet another stimulus program—dubbed “Operation Twist”—that is designed to keep intermediate- and longer-term yields relatively low. The goal with keeping longer-term rates low is to encourage lending activity to spark business investments and home purchases, which, in turn, may provide support for a more sustainable economic recovery.
Market volatility was a dominant theme during the final six-months of the year
Early on in the period, market climate shifted to one of anxiety over the increasingly fragile state of the U.S. and global economies. In addition, investors not only worried that the U.S. might be on the brink of recession, they also feared that Europe’s sovereign debt problems could spiral out of control if a Greek default triggered financial contagion across the continent. In July and August, investor sentiment was further undermined by partisan wrangling over the federal debt ceiling and the downgrade of the U.S. credit rating by Standard & Poor’s. The barrage of unsettling headlines led to heightened market volatility and an increase in risk aversion, which translated into sharply falling stock prices and higher demand for “safer” assets such as Treasuries and municipals in the third quarter of 2011. Although volatility persisted into the fourth quarter, the financial markets were able to rebound amid improved U.S. economic data and hopes for a resolution to the European crisis.
For the entire six-month period, the Barclays Capital U.S. Aggregate Bond Index1, which represents the universe of investment-grade bonds, and the Barclays Capital U.S. Treasury Index2 added 4.98% and 7.43%, respectively. By comparison, the Barclays Capital Municipal Bond Index3 gained 6.02% over the last half of the year
Recent events have not altered our message to shareholders.
The market turmoil of 2011 and an uncertain outlook going forward have left many investors questioning their resolve—and their investments. Yet, it is precisely at such times that the market may present opportunities—as well as challenges—for prudent investors. Bear in mind that many investors who indiscriminately sold their equity investments during the severe market downturn of 2008 to 2009 missed out on the impressive two-year rally that followed. In our opinion, the lesson to be learned from these dramatic market events is that, for
| 1. | The Barclays Capital U.S. Aggregate Bond Index is composed of the Barclays Capital Government/Credit Index and the Mortgage-Backed Securities Index and includes U.S. Treasury issues, agency issues, corporate bond issues, and mortgage-backed securities. You cannot invest directly in an index. |
| 2. | The Barclays Capital U.S. Treasury Index is an index of U.S. Treasury Securities. You cannot invest directly in an index. |
| 3. | The Barclays Capital Municipal Bond Index is an unmanaged index composed of long-term tax-exempt bonds with a minimum credit rating of Baa. You cannot invest directly in an index. |
Although volatility persisted into the fourth quarter, the financial markets were able to rebound amid improved U.S. economic data and hopes for a resolution to the European crisis.
| | | | |
| 4 | | Wells Fargo Advantage Intermediate Tax/AMT-Free Fund | | Letter to Shareholders |
many investors, simply building and maintaining a well-diversified4 investment plan is the best long-term strategy.
Thank you for choosing to invest with Wells Fargo Advantage Funds. We appreciate your confidence in us and remain committed to helping you meet your financial needs. For current information about your fund investments, contact your investment professional, visit our website at www.wellsfargo.com/advantagefunds, or call us directly at 1-800-222-8222. We are available 24 hours a day, 7 days a week.
Sincerely,

Karla M. Rabusch
President
Wells Fargo Advantage Funds
| 4. | Diversification does not assure or guarantee better performance and cannot eliminate the risk of investment losses. |
| | | | | | |
| Letter to Shareholders | | Wells Fargo Advantage Intermediate Tax/AMT-Free Fund | | | 5 | |
|
|
Notice to Shareholders Effective April 1, 2012, the Fund may invest up to 10% of its total assets in inverse floaters to seek enhanced returns. Inverse floaters are derivative debt instruments created by depositing a municipal security in a trust. They pay interest at rates that generally vary inversely with specified short-term interest rates. The interest payment received on inverse floaters generally will decrease when specified short-term interest rates increase. Inverse floaters involve leverage, which may magnify the Fund’s gains or losses, and exhibit greater price and income volatility than bonds with similar maturities. We intend to limit leverage created by the Fund’s investment in inverse floaters to an amount equal to 10% of the Fund’s total assets. Inverse floaters are also subject to the risks associated with derivatives and municipal securities. |
|
|
Notice to Shareholders The Board of Trustees for Wells Fargo Advantage Funds has unanimously approved the following modifications to certain net asset value (NAV) waiver privileges and commission schedules: n Effective May 1, 2012, automatic investment plan (AIP) purchases and proceeds received from systematic withdrawals will no longer qualify for NAV repurchase privileges. n Effective May 1, 2012, discretionary rights to waive the upfront commission for Class C and “jumbo” Class A share purchases will no longer be granted to broker/dealers. However, we will continue to waive the Class C shares contingent deferred sales charge for redemptions by employer-sponsored retirement plans where the dealer of record waived its commission at the time of purchase. n Effective July 31, 2012, NAV purchase privileges for former Evergreen Class IS and Class R shareholders are being modified to remove the ability to purchase Class A shares at NAV unless those shares are held directly with the fund on or after July 31, 2012. |
| | | | |
| 6 | | Wells Fargo Advantage Intermediate Tax/AMT-Free Fund | | Performance Highlights (Unaudited) |
INVESTMENT OBJECTIVE
The Fund seeks current income exempt from federal income tax.
ADVISER
Wells Fargo Funds Management, LLC
SUB-ADVISER
Wells Capital Management Incorporated
PORTFOLIO MANAGERS
Lyle J. Fitterer, CFA, CPA
Robert J. Miller
FUND INCEPTION
July 31, 2001
| | |
CREDIT QUALITY1 (AS OF DECEMBER 31, 2011) |
|
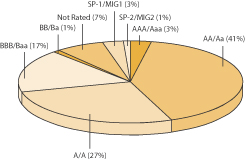 |
| | |
EFFECTIVE MATURITY DISTRIBUTION2 (AS OF DECEMBER 31, 2011) |
|
 |
| 1. | The ratings indicated are from Standard & Poor’s, Moody’s Investors Service, and/or Fitch Ratings Ltd. Credit Quality Ratings: Credit quality ratings apply to underlying holdings of the Fund and not the Fund itself. Standard and Poor’s rates the creditworthiness of bonds, ranging from AAA (highest) to D (lowest). Ratings from A to CCC may be modified by the addition of a plus (+) or minus (–) sign to show relative standing within the rating categories. Standard & Poor’s rates the creditworthiness of short-term notes from SP-1 (highest) to SP-3 (lowest). Ratings from A to CCC may be modified by the addition of a plus (+) or minus (–) sign to show relative standing within the rating categories. Moody’s rates the creditworthiness of bonds, ranging from Aaa (highest) to C (lowest). Ratings Aa to B may be modified by the addition of a number 1 (highest) to 3 (lowest) to show relative standing within the ratings categories. Moody’s rates the creditworthiness of short-term U.S. tax-exempt municipal securities from MIG 1/VMIG 1 (highest) to SG (lowest). Fitch rates the creditworthiness of bonds, ranging from AAA (highest) to D (lowest). If a security was rated by all three rating agencies, the middle rating was utilized. If rated by two of three rating agencies, the lower rating was utilized and if rated by one of the agencies that rating was utilized. Credit quality is subject to change and is calculated based on the total investments of the Fund.We generally define higher quality bonds as bonds that have a rating of BBB/Baa and above and lower quality bonds as bonds with a rating below BBB/Baa. |
| 2. | Effective maturity is calculated based on the total long-term investments of the Fund. It is subject to change and may have changed since the date specified. |
| | | | | | |
| Performance Highlights (Unaudited) | | Wells Fargo Advantage Intermediate Tax/AMT-Free Fund | | | 7 | |
AVERAGE ANNUAL TOTAL RETURN3 (%) (AS OF DECEMBER 31, 2011)
| | | | | | | | | | | | | | | | | | | | | | | | | | | | | | | | | | | | | | | | | | | | |
| | | | | | Including Sales Charge | | | Excluding Sales Charge | | | Expense Ratios4 | |
| | | Inception Date | | | 6 Months* | | | 1 Year | | | 5 Year | | | 10 Year | | | 6 Months* | | | 1 Year | | | 5 Year | | | 10 Year | | | Gross | | | Net5 | |
Class A (WFTAX) | | | 07/31/2007 | | | | 2.07 | | | | 6.06 | | | | 4.28 | | | | 4.96 | | | | 5.22 | | | | 9.34 | | | | 4.92 | | | | 5.28 | | | | 0.82% | | | | 0.70% | |
Class C (WFTFX) | | | 07/31/2007 | | | | 3.83 | | | | 7.52 | | | | 4.14 | | | | 4.51 | | | | 4.83 | | | | 8.52 | | | | 4.14 | | | | 4.51 | | | | 1.57% | | | | 1.45% | |
Administrator Class (WFITX) | | | 03/31/2008 | | | | | | | | | | | | | | | | | | | | 5.18 | | | | 9.34 | | | | 5.00 | | | | 5.36 | | | | 0.76% | | | | 0.60% | |
Institutional Class (WITIX) | | | 03/31/2008 | | | | | | | | | | | | | | | | | | | | 5.27 | | | | 9.64 | | | | 5.16 | | | | 5.49 | | | | 0.49% | | | | 0.42% | |
Investor Class (SIMBX) | | | 07/31/2001 | | | | | | | | | | | | | | | | | | | | 5.12 | | | | 9.21 | | | | 4.87 | | | | 5.35 | | | | 0.85% | | | | 0.73% | |
Barclays Capital Municipal Bond 1-15 Year Blend Index6 | | | | | | | | | | | | | | | | | | | | | | | 4.96 | | | | 8.80 | | | | 5.48 | | | | 5.12 | | | | | | | | | |
| * | Returns for periods of less than one year are not annualized. |
Figures quoted represent past performance, which is no guarantee of future results and do not reflect the deduction of taxes that a shareholder may pay on fund distributions or the redemption of fund shares. Investment return and principal value of an investment will fluctuate so that an investor’s shares, when redeemed, may be worth more or less than their original cost. Performance shown without sales charges would be lower if sales charges were reflected. Current performance may be lower or higher than the performance data quoted and assumes the reinvestment of dividends and capital gains. Current month-end performance is available on the Fund’s Web site – www.wellsfargo.com/advantagefunds.
Index returns do not include transaction costs associated with buying and selling securities, any mutual fund fees or expenses or any taxes. It is not possible to invest directly in an index.
For Class A shares, the maximum front-end sales charge is 3.00%. For Class C shares, the maximum contingent deferred sales charge is 1.00%. Performance including sales charge assumes the sales charge for the corresponding time period. Administrator Class, Institutional Class, and Investor Class shares are sold without a front-end sales charge or contingent deferred sales charge.
Bond fund values fluctuate in response to the financial condition of individual issuers, general market and economic conditions, and changes in interest rates. In general, when interest rates rise, bond fund values fall and investors may lose principal value. The use of derivatives may reduce returns and/or increase volatility. Certain investment strategies tend to increase the total risk of an investment (relative to the broader market). This Fund is exposed to high-yield securities risk and municipal securities risk. Consult the Fund’s prospectus for additional information on these and other risks. A portion of the Fund’s income may be subject to federal, state, and/or local income taxes or the alternative minimum tax (AMT). Any capital gains distributions may be taxable.
| 3. | Historical performance shown for Class C shares prior to their inception reflects the performance of the Investor Class shares, adjusted to reflect the higher expenses applicable to Class C shares. Historical performance shown for Class A shares prior to their inception reflects the performance of the Investor Class shares, and includes the higher expenses applicable to the Investor Class shares (except during those periods in which expenses of Class A shares would have been higher than those of the Investor Class no such adjustment is reflected). If these expenses had not been included, returns would be higher. Historical performance shown for the Administrator Class and Institutional Class shares prior to their inception reflects the performance of the Investor Class shares, and includes the higher expenses applicable to the Investor Class shares. If these expenses had not been included, returns would be higher. |
| 4. | Reflects the expense ratios as stated in the most recent prospectuses. |
| 5. | The Adviser has committed through July 11, 2013 to waive fees and/or reimburse expenses to the extent necessary to cap the Fund’s Total Annual Fund Operating Expenses After Fee Waiver, excluding certain expenses, at the amounts shown above. Without this cap, the Fund’s returns would have been lower. |
| 6. | The Barclays Capital Municipal Bond 1-15 Year Blend Index is the 1-15 Year Blend component of the Barclays Capital Municipal Bond Index. The Barclays Capital Municipal Bond Index is an unmanaged index composed of tax-exempt bonds with maturities between 6-8 years and a minimum credit rating of Baa. You cannot invest directly in an index. |
| | | | |
| 8 | | Wells Fargo Advantage Intermediate Tax/AMT-Free Fund | | Fund Expenses (Unaudited) |
As a shareholder of the Fund, you incur two types of costs: (1) transaction costs, including sales charges (loads) on purchase payments and contingent deferred sales charges (if any) on redemptions and (2) ongoing costs, including management fees; distribution (12b-1) and/or shareholder service fees; and other Fund expenses. This example is intended to help you understand your ongoing costs (in dollars) of investing in the Fund and to compare these costs with the ongoing costs of investing in other mutual funds.
The example is based on an investment of $1,000 invested at the beginning of the six-month period and held for the entire period from July 1, 2011 to December 31, 2011.
Actual Expenses
The “Actual” line of the table below provides information about actual account values and actual expenses. You may use the information in this line, together with the amount you invested, to estimate the expenses that you paid over the period. Simply divide your account value by $1,000 (for example, an $8,600 account value divided by $1,000 = 8.6), then multiply the result by the number in the “Actual” line under the heading entitled “Expenses Paid During Period” for your applicable class of shares to estimate the expenses you paid on your account during this period.
Hypothetical Example for Comparison Purposes
The “Hypothetical” line of the table below provides information about hypothetical account values and hypothetical expenses based on the Fund’s actual expense ratio and an assumed rate of return of 5% per year before expenses, which is not the Fund’s actual return. The hypothetical account values and expenses may not be used to estimate the actual ending account balance or expenses you paid for the period. You may use this information to compare the ongoing costs of investing in the Fund and other funds. To do so, compare this 5% hypothetical example with the 5% hypothetical examples that appear in the shareholder reports of the other funds.
Please note that the expenses shown in the table are meant to highlight your ongoing costs only and do not reflect any transactional costs, such as sales charges (loads) and contingent deferred sales charges. Therefore, the “Hypothetical” line of the table is useful in comparing ongoing costs only, and will not help you determine the relative total costs of owning different funds. In addition, if these transactional costs were included, your costs would have been higher.
| | | | | | | | | | | | | | | | |
| | | Beginning
Account Value
07-01-2011 | | | Ending
Account Value
12-31-2011 | | | Expenses
Paid During
the Period1 | | | Net Annual
Expense Ratio | |
Class A | | | | | | | | | | | | | | | | |
Actual | | $ | 1,000.00 | | | $ | 1,052.25 | | | $ | 3.61 | | | | 0.70 | % |
Hypothetical (5% return before expenses) | | $ | 1,000.00 | | | $ | 1,021.62 | | | $ | 3.56 | | | | 0.70 | % |
Class C | | | | | | | | | | | | | | | | |
Actual | | $ | 1,000.00 | | | $ | 1,048.30 | | | $ | 7.47 | | | | 1.45 | % |
Hypothetical (5% return before expenses) | | $ | 1,000.00 | | | $ | 1,017.85 | | | $ | 7.35 | | | | 1.45 | % |
Administrator Class | | | | | | | | | | | | | | | | |
Actual | | $ | 1,000.00 | | | $ | 1,051.81 | | | $ | 3.09 | | | | 0.60 | % |
Hypothetical (5% return before expenses) | | $ | 1,000.00 | | | $ | 1,022.12 | | | $ | 3.05 | | | | 0.60 | % |
Institutional Class | | | | | | | | | | | | | | | | |
Actual | | $ | 1,000.00 | | | $ | 1,052.73 | | | $ | 2.17 | | | | 0.42 | % |
Hypothetical (5% return before expenses) | | $ | 1,000.00 | | | $ | 1,023.03 | | | $ | 2.14 | | | | 0.42 | % |
Investor Class | | | | | | | | | | | | | | | | |
Actual | | $ | 1,000.00 | | | $ | 1,051.16 | | | $ | 3.76 | | | | 0.73 | % |
Hypothetical (5% return before expenses) | | $ | 1,000.00 | | | $ | 1,021.47 | | | $ | 3.71 | | | | 0.73 | % |
| 1. | Expenses paid is equal to the annualized expense ratio of each class multiplied by the average account value over the period, multiplied by the number of days in the most recent fiscal half-year divided by the number of days in the fiscal year (to reflect the one-half year period). |
| | | | | | |
| Portfolio of Investments—December 31, 2011 (Unaudited) | | Wells Fargo Advantage Intermediate Tax/AMT-Free Fund | | | 9 | |
| | | | | | | | | | | | | | | | |
| Security Name | | Interest Rate | | | Maturity Date | | | Principal | | | Value | |
| | | | | | | | | | | | | | | | |
| | | | |
Municipal Bonds and Notes: 95.95% | | | | | | | | | | | | | | | | |
| | | | |
| Alabama: 1.27% | | | | | | | | | | | | | | | | |
Alabama Public School & College Authority Capital Improvement (Tax Revenue) | | | 5.00 | % | | | 12/01/2017 | | | $ | 2,640,000 | | | $ | 3,200,472 | |
Courtland AL Industrial Development Board International Paper Company Project Series A (IDR) | | | 5.00 | | | | 11/01/2013 | | | | 6,000,000 | | | | 6,298,620 | |
Jefferson County AL School Warrants (Lease Revenue, AGM Insured) | | | 5.20 | | | | 02/15/2012 | | | | 1,000,000 | | | | 997,220 | |
Jefferson County AL Series B8 (Water & Sewer Revenue, AGM Insured) | | | 5.25 | | | | 02/01/2016 | | | | 3,480,000 | | | | 3,419,726 | |
Mobile AL Industrial Development Board Alabama Power Company (IDR)±§ | | | 5.00 | | | | 06/01/2034 | | | | 3,000,000 | | | | 3,342,480 | |
| | | | |
| | | | | | | | | | | | | | | 17,258,518 | |
| | | | | | | | | | | | | | | | |
| | | | |
| Alaska: 0.03% | | | | | | | | | | | | | | | | |
Alaska Energy Authority Bradley Lake Fourth Series (Utilities Revenue, AGM GO of Authority Insured) | | | 6.00 | | | | 07/01/2015 | | | | 350,000 | | | | 400,404 | |
| | | | | | | | | | | | | | | | |
| | | | |
| Arizona: 2.68% | | | | | | | | | | | | | | | | |
Arizona Health Facilities Authority Phoenix Children’s Hospital Series A (Health Revenue)±§ | | | 1.10 | | | | 02/01/2042 | | | | 2,750,000 | | | | 2,565,860 | |
Arizona Health Facilities Authority Phoenix Children’s Hospital Series B (Health Revenue)±§ | | | 0.95 | | | | 02/01/2042 | | | | 4,875,000 | | | | 4,569,874 | |
Arizona Lottery Series A (Miscellaneous Revenue, AGM Insured) | | | 5.00 | | | | 07/01/2027 | | | | 5,000,000 | | | | 5,508,550 | |
Arizona School Facilities Board Refunding Revenue State School Trust (Miscellaneous Revenue, AMBAC Insured) | | | 4.00 | | | | 07/01/2015 | | | | 2,600,000 | | | | 2,715,440 | |
Arizona School Facilities Board Refunding Revenue State School Trust (Miscellaneous Revenue, AMBAC Insured) | | | 5.00 | | | | 07/01/2018 | | | | 3,050,000 | | | | 3,338,347 | |
Goodyear AZ McDowell Road Commercial Corridor Improvement District (Miscellaneous Revenue, AMBAC Insured) | | | 5.25 | | | | 01/01/2020 | | | | 2,290,000 | | | | 2,544,556 | |
Phoenix AZ Civic Improvement Corporation Series A (Port Authority Revenue) | | | 5.00 | | | | 07/01/2029 | | | | 5,000,000 | | | | 5,331,400 | |
Pima County AZ IDA Series A (Education Revenue) | | | 7.00 | | | | 07/01/2021 | | | | 775,000 | | | | 793,879 | |
Pima County AZ IDA Series A (Education Revenue) | | | 7.75 | | | | 07/01/2035 | | | | 1,000,000 | | | | 1,019,150 | |
Pinal County AZ Electrical District # 4 (Utilities Revenue) | | | 4.75 | | | | 12/01/2015 | | | | 915,000 | | | | 982,188 | |
Salt River AZ Agricultural Improvement Project & Power District Election Project Series B (Utilities Revenue) | | | 5.00 | | | | 01/01/2031 | | | | 2,460,000 | | | | 2,532,152 | |
Tempe AZ Series A (Tax Revenue) | | | 4.00 | | | | 07/01/2019 | | | | 2,160,000 | | | | 2,530,289 | |
University of Arizona COP Projects Series B (Education Revenue, AMBAC Insured) | | | 5.00 | | | | 06/01/2021 | | | | 1,450,000 | | | | 1,504,506 | |
Verrado AZ Community Facilities District # 1 (Tax Revenue) | | | 4.85 | | | | 07/15/2014 | | | | 325,000 | | | | 328,364 | |
Verrado AZ Community Facilities District # 1 (Tax Revenue) | | | 6.00 | | | | 07/15/2013 | | | | 135,000 | | | | 138,954 | |
| | | | |
| | | | | | | | | | | | | | | 36,403,509 | |
| | | | | | | | | | | | | | | | |
| | | | |
| Arkansas: 0.61% | | | | | | | | | | | | | | | | |
Pulaski AR Technical College Student Tuition & Fee (Education Revenue) | | | 5.00 | | | | 04/01/2041 | | | | 7,000,000 | | | | 7,256,550 | |
Rogers AR Capital Improvement (Tax Revenue, XLCA Insured) | | | 4.25 | | | | 03/01/2031 | | | | 950,000 | | | | 983,374 | |
| | | | |
| | | | | | | | | | | | | | | 8,239,924 | |
| | | | | | | | | | | | | | | | |
| | | | |
| California: 15.59% | | | | | | | | | | | | | | | | |
Alameda CA Corridor Transportation Authority CAB Sub Lien Series A (Transportation Revenue, AMBAC Insured)(z) | | | 4.26 | | | | 10/01/2018 | | | | 5,720,000 | | | | 4,297,379 | |
Alhambra CA Police Facilities (Lease Revenue, AMBAC Insured) | | | 6.75 | | | | 09/01/2023 | | | | 4,175,000 | | | | 4,944,494 | |
Bass Lake CA Elementary School District CAB Election 2006 Project (Tax Revenue, AGM Insured)(z) | | | 6.24 | | | | 08/01/2036 | | | | 700,000 | | | | 154,525 | |
| | | | |
| 10 | | Wells Fargo Advantage Intermediate Tax/AMT-Free Fund | | Portfolio of Investments—December 31, 2011 (Unaudited) |
| | | | | | | | | | | | | | | | |
| Security Name | | Interest Rate | | | Maturity Date | | | Principal | | | Value | |
| | | | | | | | | | | | | | | | |
| | | |
| California (continued) | | | | | | | | | | | | | |
California DWR Power Supply Project Series L (Utilities Revenue) | | | 5.00 | % | | | 05/01/2019 | | | $ | 5,000,000 | | | $ | 6,194,450 | |
California Infrastructure & Economic Development Bank California Independent System Operator Series A (Utilities Revenue) | | | 5.25 | | | | 02/01/2024 | | | | 1,800,000 | | | | 1,916,838 | |
California Infrastructure & Economic Development Bank California Independent System Operator Series A (Utilities Revenue) | | | 5.75 | | | | 02/01/2039 | | | | 1,000,000 | | | | 1,053,260 | |
California Public Works Board Department of Corrections Project Series A (Lease Revenue, AMBAC Insured) | | | 5.00 | | | | 12/01/2019 | | | | 2,305,000 | | | | 2,523,906 | |
California Public Works Department of General Services Buildings 8 & 9A (Lease Revenue) | | | 6.25 | | | | 04/01/2034 | | | | 2,750,000 | | | | 3,000,360 | |
California Statewide Communities Project Series B (Hospital Revenue) | | | 5.25 | | | | 08/15/2031 | | | | 3,000,000 | | | | 3,188,490 | |
California State (Miscellaneous Revenue, LOC Societe Generale)±§ | | | 0.70 | | | | 06/01/2032 | | | | 3,000,000 | | | | 3,000,000 | |
California State GO (Education Revenue) | | | 5.00 | | | | 09/01/2021 | | | | 10,000,000 | | | | 11,999,200 | |
California State GO (Education Revenue) | | | 5.25 | | | | 09/01/2022 | | | | 2,900,000 | | | | 3,524,399 | |
California State GO (Tax Revenue) | | | 5.25 | | | | 03/01/2024 | | | | 5,000,000 | | | | 5,715,700 | |
California State GO (Tax Revenue) | | | 5.25 | | | | 03/01/2030 | | | | 1,440,000 | | | | 1,560,139 | |
California State GO (Tax Revenue) | | | 6.00 | | | | 03/01/2033 | | | | 2,260,000 | | | | 2,604,537 | |
California State DWR Power Supply (Water & Sewer Revenue) | | | 5.00 | | | | 05/01/2021 | | | | 1,500,000 | | | | 1,762,605 | |
California State DWR Power Supply Subseries F-5 (Water & Sewer Revenue) | | | 5.00 | | | | 05/01/2022 | | | | 7,035,000 | | | | 8,160,881 | |
California State Health Facilities Financing Authority Series D (Hospital Revenue) | | | 5.00 | | | | 08/15/2035 | | | | 1,000,000 | | | | 1,015,220 | |
California State Public Works Board Series G (Lease Revenue) | | | 5.00 | | | | 12/01/2030 | | | | 12,110,000 | | | | 13,103,504 | |
California State Public Works Board Series D (Lease Revenue) | | | 5.25 | | | | 12/01/2026 | | | | 5,000,000 | | | | 5,342,600 | |
California State Public Works Board University of California Institute Project C (Lease Revenue) | | | 5.00 | | | | 04/01/2030 | | | | 1,350,000 | | | | 1,385,735 | |
California State Public Works Board University of California Research Project Series L (Education Revenue, NATL-RE Insured) | | | 5.25 | | | | 11/01/2028 | | | | 1,890,000 | | | | 2,076,392 | |
California State Various Purposes (Miscellaneous Revenue) | | | 6.00 | | | | 04/01/2038 | | | | 7,000,000 | | | | 7,873,320 | |
California Statewide Community Devevelopment (Miscellaneous Revenue) | | | 6.90 | | | | 08/01/2031 | | | | 1,915,000 | | | | 1,982,389 | |
Colton CA Unified School District CAB Election 2208 Project Series B (Tax Revenue, AGM Insured)(z) | | | 5.51 | | | | 08/01/2027 | | | | 730,000 | | | | 312,418 | |
Colton CA Unified School District CAB Election 2208 Project Series B (Tax Revenue, AGM Insured)(z) | | | 5.79 | | | | 08/01/2029 | | | | 2,005,000 | | | | 734,812 | |
Colton CA Unified School District CAB Election 2208 Project Series B (Tax Revenue, AGM Insured)(z) | | | 5.82 | | | | 08/01/2030 | | | | 1,000,000 | | | | 344,290 | |
Emery CA Unified School District CAB Election of 2010 Series A (Miscellaneous Revenue, AGM Insured) | | | 6.25 | | | | 08/01/2031 | | | | 3,000,000 | | | | 3,530,340 | |
Gilroy CA Unified School District GO CAB BAN (Tax Revenue)(z) | | | 1.60 | | | | 04/01/2013 | | | | 2,000,000 | | | | 1,960,100 | |
Glendora CA Unified School District CAB 2005 Election Project Series B (Tax Revenue, Assured Guaranty Insured)(z) | | | 6.13 | | | | 08/01/2035 | | | | 5,470,000 | | | | 1,316,730 | |
Jurupa CA Unified School District (Education Revenue) | | | 5.00 | | | | 08/01/2021 | | | | 1,795,000 | | | | 2,081,249 | |
Lakeside CA Unified School District Election 2008 Series A (Tax Revenue)(z) | | | 1.89 | | | | 06/01/2014 | | | | 1,695,000 | | | | 1,618,844 | |
Los Angeles CA Department Airports Series A (Port Authority Revenue) | | | 4.00 | | | | 05/15/2019 | | | | 2,000,000 | | | | 2,304,960 | |
Los Angeles CA Harbor Department Series C (Port Authority Revenue) | | | 5.00 | | | | 08/01/2021 | | | | 3,000,000 | | | | 3,732,930 | |
Los Angeles CA Harbor Department Series C (Port Authority Revenue) | | | 5.25 | | | | 08/01/2023 | | | | 7,725,000 | | | | 9,148,177 | |
Los Angeles CA Metropolitan Transportation Authority Series A (Tax Revenue, AMBAC Insured) | | | 5.00 | | | | 07/01/2035 | | | | 1,750,000 | | | | 1,857,730 | |
Los Angeles CA Municipal Improvement Corporation Series C (Lease Revenue) | | | 4.50 | | | | 09/01/2019 | | | | 1,925,000 | | | | 2,170,072 | |
Los Angeles CA Municipal Improvement Corporation Series C (Lease Revenue) | | | 5.00 | | | | 09/01/2018 | | | | 2,380,000 | | | | 2,756,016 | |
Los Angeles CA Schools Regionalized Business Services Project Series A (Lease Revenue, AMBAC Insured)(z) | | | 4.31 | | | | 08/01/2015 | | | | 1,100,000 | | | | 943,657 | |
New Haven CA Unified School District CAB Project (Tax Revenue, Assured Guaranty Insured)(z) | | | 6.04 | | | | 08/01/2033 | | | | 6,000,000 | | | | 1,660,740 | |
Northern California Gas Authority # 1 LIBOR (Utilities Revenue)±§ | | | 0.85 | | | | 07/01/2017 | | | | 2,200,000 | | | | 1,918,378 | |
| | | | | | |
| Portfolio of Investments—December 31, 2011 (Unaudited) | | Wells Fargo Advantage Intermediate Tax/AMT-Free Fund | | | 11 | |
| | | | | | | | | | | | | | | | |
| Security Name | | Interest Rate | | | Maturity Date | | | Principal | | | Value | |
| | | | | | | | | | | | | | | | |
| | | |
| California (continued) | | | | | | | | | | | | | |
Northern California Gas Authority # 1 LIBOR (Utilities Revenue)±§ | | | 0.88 | % | | | 07/01/2019 | | | $ | 18,500,000 | | | $ | 14,615,555 | |
Northern California Power Agency Series A (Utilities Revenue) | | | 5.25 | | | | 08/01/2023 | | | | 5,150,000 | | | | 5,934,036 | |
Northern Humboldt CA High School District 2010 Election Series A (Tax Revenue) | | | 6.50 | | | | 08/01/2034 | | | | 1,145,000 | | | | 1,352,005 | |
Oakland CA Unified School District Alameda County Election 2006 Project Series A (Tax Revenue) | | | 6.50 | | | | 08/01/2020 | | | | 1,000,000 | | | | 1,202,160 | |
Pasadena CA PFA Rose Bowl Renovation Series A (Lease Revenue) | | | 5.00 | | | | 03/01/2021 | | | | 1,655,000 | | | | 1,999,041 | |
Patterson CA Unified School District CAB 2008 Election Project Series B (Tax Revenue, FSA Insured)(z) | | | 6.11 | | | | 08/01/2033 | | | | 3,000,000 | | | | 818,280 | |
Richmond CA Joint Powers Financing Authority Point Potrero Series A (Lease Revenue) | | | 6.25 | | | | 07/01/2024 | | | | 2,000,000 | | | | 2,214,200 | |
Rio Hondo CA Community College District (Tax Revenue)(z) | | | 5.44 | | | | 08/01/2026 | | | | 325,000 | | | | 148,343 | |
Rio Hondo CA Community College District (Tax Revenue)(z) | | | 5.70 | | | | 08/01/2030 | | | | 2,860,000 | | | | 1,006,262 | |
Roseville City CA Natural Gas Financing Authority (Energy Revenue) | | | 5.00 | | | | 02/15/2015 | | | | 1,000,000 | | | | 1,032,080 | |
Sacramento County CA Airport Systems (Port Authority Revenue) | | | 5.00 | | | | 07/01/2025 | | | | 2,000,000 | | | | 2,191,260 | |
San Diego CA Public Facilities Financing Authority Series B (Sewer Revenue) | | | 5.00 | | | | 05/15/2021 | | | | 2,170,000 | | | | 2,569,345 | |
San Diego CA Unified School District Election 1998 Series E-2 (Tax Revenue, AGM Insured) | | | 5.50 | | | | 07/01/2027 | | | | 5,000,000 | | | | 6,041,350 | |
San Jose CA Libraries & Parks Project (Tax Revenue) | | | 5.13 | | | | 09/01/2031 | | | | 6,110,000 | | | | 6,129,063 | |
San Jose CA Redevelopment Agency Series A-1 (Tax Revenue) | | | 5.50 | | | | 08/01/2030 | | | | 1,355,000 | | | | 1,354,932 | |
Santa Ana CA Financing Authority Police Administration & Holding Facilities Project Series A (Lease Revenue, NATL-RE Insured) | | | 6.25 | | | | 07/01/2019 | | | | 1,000,000 | | | | 1,130,760 | |
Santa Monica CA Community College District 2002 Election Series E (Tax Revenue)(z) | | | 4.00 | | | | 08/01/2022 | | | | 2,060,000 | | | | 1,351,422 | |
Southern California Public Power Authority Milford Wind Corridor Project 1 (Utilities Revenue) | | | 5.00 | | | | 07/01/2024 | | | | 5,000,000 | | | | 5,729,750 | |
Southern California Public Power Authority Projects (Utilities Revenue) | | | 6.75 | | | | 07/01/2013 | | | | 100,000 | | | | 108,450 | |
Southern California Public Power Authority Southern Transmission Project Series S (Utilities Revenue) | | | 5.75 | | | | 07/01/2024 | | | | 2,000,000 | | | | 2,320,180 | |
Sylvan CA Unified School District CAB Election 2006 (Tax Revenue, AGM Insured)(z) | | | 6.05 | | | | 08/01/2031 | | | | 2,590,000 | | | | 805,956 | |
Sylvan CA Unified School District CAB Election 2006 (Tax Revenue, AGM Insured)(z) | | | 6.08 | | | | 08/01/2032 | | | | 2,800,000 | | | | 815,976 | |
Tustin CA USD Community District #88-1 Election 2008 Series B (Tax Revenue) | | | 6.00 | | | | 08/01/2036 | | | | 1,500,000 | | | | 1,743,360 | |
University of California General Revenues Series Q (Education Revenue) | | | 5.25 | | | | 05/15/2024 | | | | 2,155,000 | | | | 2,454,588 | |
Washington Township CA Health Care District Series A (Hospital Revenue) | | | 5.00 | | | | 07/01/2016 | | | | 300,000 | | | | 332,157 | |
Washington Township CA Health Care District Series A (Hospital Revenue) | | | 5.00 | | | | 07/01/2020 | | | | 1,300,000 | | | | 1,401,556 | |
Washington Township CA Health Care District Series A (Hospital Revenue) | | | 5.13 | | | | 07/01/2017 | | | | 260,000 | | | | 291,756 | |
West Basin CA Municipal Water District COP Refunding Series B (Water & Sewer Revenue, Assured Guaranty Insured) | | | 5.00 | | | | 08/01/2022 | | | | 2,560,000 | | | | 2,858,035 | |
West Contra Costa CA University (Education Revenue, AGM Insured) | | | 5.25 | | | | 08/01/2023 | | | | 2,450,000 | | | | 2,816,765 | |
West Contra Costa CA University (Education Revenue, Assured Guaranty Insured)(z) | | | 5.78 | | | | 08/01/2026 | | | | 4,620,000 | | | | 2,012,287 | |
| | | | |
| | | | | | | | | | | | | | | 211,552,676 | |
| | | | | | | | | | | | | | | | |
| | | | |
| Colorado: 0.26% | | | | | | | | | | | | | | | | |
Colorado ECFA Charter School Monument Academy Project (Miscellaneous Revenue) | | | 5.50 | | | | 10/01/2017 | | | | 1,065,000 | | | | 1,095,001 | |
Colorado Health Facilities Authority Catholic Health D-2 Project Prerefunded Balance (Health Revenue)±§ | | | 5.25 | | | | 10/01/2038 | | | | 125,000 | | | | 136,216 | |
North Range CO Metropolitan District # 1 (Tax Revenue, ACA Insured) | | | 5.00 | | | | 12/15/2015 | | | | 250,000 | | | | 240,365 | |
| | | | |
| 12 | | Wells Fargo Advantage Intermediate Tax/AMT-Free Fund | | Portfolio of Investments—December 31, 2011 (Unaudited) |
| | | | | | | | | | | | | | | | |
| Security Name | | Interest Rate | | | Maturity Date | | | Principal | | | Value | |
| | | | | | | | | | | | | | | | |
| | | | |
| Colorado (continued) | | | | | | | | | | | | | | | | |
Public Authority for Colorado Energy Natural Gas (Utilities Revenue) | | | 5.75 | % | | | 11/15/2018 | | | $ | 1,905,000 | | | $ | 2,039,836 | |
| | | | |
| | | | | | | | | | | | | | | 3,511,418 | |
| | | | | | | | | | | | | | | | |
| | | | |
| District of Columbia: 0.51% | | | | | | | | | | | | | | | | |
District of Columbia American Medical Association Series B (Miscellaneous Revenue) | | | 5.00 | | | | 10/01/2024 | | | | 1,095,000 | | | | 1,199,321 | |
District of Columbia Federal Highway Guaranteed Anticipation Bonds (Miscellaneous Revenue) | | | 5.25 | | | | 12/01/2025 | | | | 2,630,000 | | | | 3,104,005 | |
District of Columbia Howard University Series A (Education Revenue) | | | 5.75 | | | | 10/01/2026 | | | | 2,510,000 | | | | 2,684,320 | |
| | | | |
| | | | | | | | | | | | | | | 6,987,646 | |
| | | | | | | | | | | | | | | | |
| | | |
| Florida: 7.11% | | | | | | | | | | | | | |
Boynton Beach FL Utilities Systems (Water & Sewer Revenue, NATL-RE FGIC Insured) | | | 5.50 | | | | 11/01/2016 | | | | 1,500,000 | | | | 1,682,655 | |
Broward County FL Professional Sports Facilities Project Series A (Tax Revenue, AMBAC Insured) | | | 5.00 | | | | 09/01/2021 | | | | 2,200,000 | | | | 2,338,006 | |
Citizens Property Insurance Corporation of Florida (Miscellaneous Revenue, AGM Insured)±§ | | | 1.75 | | | | 06/01/2014 | | | | 4,000,000 | | | | 4,014,040 | |
Connerton FL West Community Development District Series B (Miscellaneous Revenue)(s)(i) | | | 5.13 | | | | 05/01/2016 | | | | 1,325,000 | | | | 531,789 | |
Escambia County FL School Board (Lease Revenue) | | | 5.00 | | | | 02/01/2021 | | | | 4,720,000 | | | | 4,938,914 | |
Florida State Development Finance Corporation Renaissance Charter School Series A (Miscellaneous Revenue) | | | 5.00 | | | | 09/15/2020 | | | | 2,945,000 | | | | 2,897,880 | |
Florida State Development Finance Corporation Renaissance Charter School Series A (Education Revenue) | | | 7.00 | | | | 06/15/2026 | | | | 5,000,000 | | | | 5,086,150 | |
Gulf Breeze FL Capital Funding Loan Program Series A (Miscellaneous Revenue, AGM Insured) | | | 5.00 | | | | 10/01/2017 | | | | 1,665,000 | | | | 1,916,548 | |
Gulf Breeze FL Capital Funding Loan Program Series B (Miscellaneous Revenue, AGM Insured) | | | 4.00 | | | | 10/01/2016 | | | | 1,000,000 | | | | 1,090,320 | |
Gulf Breeze FL Capital Funding Loan Program Series B (Miscellaneous Revenue, AGM Insured) | | | 4.00 | | | | 10/01/2017 | | | | 1,000,000 | | | | 1,097,310 | |
Gulf Breeze FL Miami Beach Local Government Series B (Miscellaneous Revenue, FGIC Insured)±§ | | | 4.75 | | | | 12/01/2015 | | | | 455,000 | | | | 460,328 | |
Gulf Breeze FL Revenue Local Government Series B (Miscellaneous Revenue, FGIC Insured)±§ | | | 5.50 | | | | 12/01/2015 | | | | 850,000 | | | | 852,074 | |
Gulf Breeze FL Revenue Local Government Loan Series E (Miscellaneous Revenue, FGIC Insured) | | | 5.00 | | | | 12/01/2020 | | | | 1,900,000 | | | | 2,030,112 | |
Gulf Breeze FL Revenue Local Government Loan Series J (Water & Sewer Revenue)±§ | | | 4.10 | | | | 12/01/2020 | | | | 3,000,000 | | | | 3,183,540 | |
Gulf Breeze FL Revenue Local Government Loan Series J (Water & Sewer Revenue)±§ | | | 4.20 | | | | 12/01/2020 | | | | 3,290,000 | | | | 3,538,296 | |
JEA Florida Electric Systems Subseries B (Utilities Revenue) | | | 5.00 | | | | 10/01/2019 | | | | 2,950,000 | | | | 3,155,261 | |
Lakeland FL Energy System Revenue (Utilities Revenue)±§ | | | 1.20 | | | | 10/01/2014 | | | | 6,000,000 | | | | 6,025,860 | |
Miami FL Special Obligation Series A (Miscellaneous Revenue, AGM Insured) | | | 5.00 | | | | 02/01/2019 | | | | 2,150,000 | | | | 2,367,086 | |
Miami FL Special Obligation Series A (Miscellaneous Revenue, AGM Insured) | | | 5.75 | | | | 02/01/2025 | | | | 4,500,000 | | | | 5,025,780 | |
Miami FL Special Obligation Series A (Miscellaneous Revenue, AGM Insured) | | | 5.75 | | | | 02/01/2026 | | | | 2,000,000 | | | | 2,214,560 | |
Miami-Dade County FL Aviation Series A (Port Authority Revenue) | | | 5.50 | | | | 10/01/2019 | | | | 3,000,000 | | | | 3,609,510 | |
Miami-Dade County FL Educational Facilities Authority University of Miami Series A (Education Revenue) | | | 5.25 | | | | 04/01/2016 | | | | 1,000,000 | | | | 1,121,760 | |
Miami-Dade County FL IDA Series C (IDR)±§ | | | 3.00 | | | | 07/01/2032 | | | | 5,800,000 | | | | 5,800,000 | |
Miami-Dade County FL Public Services (Tax Revenue) | | | 4.00 | | | | 10/01/2019 | | | | 3,440,000 | | | | 3,863,395 | |
Miami-Dade County FL Public Services (Tax Revenue) | | | 4.00 | | | | 10/01/2020 | | | | 3,600,000 | | | | 4,025,052 | |
| | | | | | |
| Portfolio of Investments—December 31, 2011 (Unaudited) | | Wells Fargo Advantage Intermediate Tax/AMT-Free Fund | | | 13 | |
| | | | | | | | | | | | | | | | |
| Security Name | | Interest Rate | | | Maturity Date | | | Principal | | | Value | |
| | | | | | | | | | | | | | | | |
| | | |
| Florida (continued) | | | | | | | | | | | | | |
Miami-Dade County FL Public Services (Tax Revenue) | | | 4.00 | % | | | 04/01/2021 | | | $ | 2,485,000 | | | $ | 2,765,084 | |
Miami-Dade County FL Water & Sewer Refunding Series C (Water & Sewer Revenue, BHAC Insured) | | | 5.00 | | | | 10/01/2024 | | | | 2,950,000 | | | | 3,301,788 | |
Miami-Dade County FL Water & Sewer Series C (Water & Sewer Revenue) | | | 5.25 | | | | 10/01/2022 | | | | 3,000,000 | | | | 3,495,990 | |
North Brevard County FL Hospital District Parrish Medical Center Project (Health Revenue) | | | 4.75 | | | | 10/01/2013 | | | | 865,000 | | | | 907,887 | |
North Brevard County FL Hospital District Parrish Medical Center Project (Health Revenue) | | | 5.00 | | | | 10/01/2015 | | | | 930,000 | | | | 1,010,845 | |
Orange County FL School Board Certificates Partner Series A (Lease Revenue, NATL-RE FGIC Insured) | | | 5.00 | | | | 08/01/2016 | | | | 1,000,000 | | | | 1,135,100 | |
Orlando FL Housing Authority West Oaks Apartments Projects Puttable (Housing Revenue, FNMA Insured) | | | 5.05 | | | | 08/01/2033 | | | | 100,000 | | | | 106,477 | |
Putnam County FL Development Authority PCR Seminole Project Series A (Utilities Revenue, AMBAC Insured)±§ | | | 5.35 | | | | 03/15/2042 | | | | 3,200,000 | | | | 3,569,632 | |
Seminole County FL School Board COP (Lease Revenue, AMBAC Insured) | | | 5.50 | | | | 07/01/2014 | | | | 1,180,000 | | | | 1,290,932 | |
South Lake County FL Hospital District South Lake Hospital Incorporated (Health Revenue) | | | 5.00 | | | | 10/01/2016 | | | | 1,015,000 | | | | 1,114,632 | |
South Lake County FL Hospital District South Lake Hospital Incorporated (Hospital Revenue) | | | 5.00 | | | | 10/01/2017 | | | | 900,000 | | | | 996,678 | |
University of North Florida Financing Corporation Housing Project (Lease Revenue, NATL-RE FGIC Insured) | | | 5.00 | | | | 11/01/2016 | | | | 2,515,000 | | | | 2,840,994 | |
University of South Florida Financing Corporation COP Master Lease Series A (Lease Revenue, AMBAC Insured) | | | 5.00 | | | | 07/01/2018 | | | | 1,000,000 | | | | 1,093,010 | |
| | | | |
| | | | | | | | | | | | | | | 96,495,275 | |
| | | | | | | | | | | | | | | | |
| | | | |
| Georgia: 1.65% | | | | | | | | | | | | | | | | |
DeKalb County GA Water and Sewer Authority (Utilities Revenue) | | | 5.25 | | | | 10/01/2031 | | | | 1,710,000 | | | | 1,889,841 | |
Fulton County GA Tuff Atlanta Housing Project Series A (Education Revenue, AMBAC Insured) | | | 5.50 | | | | 09/01/2018 | | | | 2,765,000 | | | | 2,821,434 | |
Georgia Environmental Loan Local Water Authority Loan Project (Miscellaneous Revenue) | | | 4.00 | | | | 03/15/2021 | | | | 5,000,000 | | | | 5,555,300 | |
Georgia Municipal Electric Authority Power Revenue Prerefunded Balance (Utilities Revenue, NATL-RE IBC Bank of New York Insured) | | | 6.50 | | | | 01/01/2017 | | | | 10,000 | | | | 11,214 | |
Georgia Municipal Electric Authority Power Revenue Unrefunded Balance (Utilities Revenue, NATL-RE IBC Bank of New York Insured) | | | 6.50 | | | | 01/01/2017 | | | | 930,000 | | | | 1,065,101 | |
Georgia Public Gas Partners Incorporated Series A (Energy Revenue) | | | 5.00 | | | | 10/01/2017 | | | | 2,500,000 | | | | 2,863,150 | |
Georgia Public Gas Partners Incorporated Series A (Energy Revenue) | | | 5.00 | | | | 10/01/2019 | | | | 5,000,000 | | | | 5,799,400 | |
Main Street Natural Gas Incorporated of Georgia Gas Project Series A (Energy Revenue) | | | 5.00 | | | | 03/15/2022 | | | | 1,250,000 | | | | 1,322,775 | |
Main Street Natural Gas Incorporated of Georgia Gas Project Series A (Energy Revenue) | | | 5.50 | | | | 09/15/2022 | | | | 1,000,000 | | | | 1,041,830 | |
| | | | |
| | | | | | | | | | | | | | | 22,370,045 | |
| | | | | | | | | | | | | | | | |
| | | | |
| Guam: 0.56% | | | | | | | | | | | | | | | | |
Guam Education Financing Foundation COP Guam Public School Facilities Project Series A (Lease Revenue) | | | 5.00 | | | | 10/01/2015 | | | | 1,000,000 | | | | 1,020,340 | |
Guam Education Financing Foundation COP Guam Public School Facilities Project Series A (Lease Revenue) | | | 5.00 | | | | 10/01/2017 | | | | 2,195,000 | | | | 2,238,044 | |
Guam Government Department of Education John F. Kennedy High School Series A (Lease Revenue) | | | 6.00 | | | | 12/01/2020 | | | | 2,500,000 | | | | 2,610,350 | |
Guam Government Limited Obligation Revenue Section 30 Series A (Miscellaneous Revenue) | | | 5.00 | | | | 12/01/2014 | | | | 1,635,000 | | | | 1,735,405 | |
| | | | |
| | | | | | | | | | | | | | | 7,604,139 | |
| | | | | | | | | | | | | | | | |
| | | | |
| 14 | | Wells Fargo Advantage Intermediate Tax/AMT-Free Fund | | Portfolio of Investments—December 31, 2011 (Unaudited) |
| | | | | | | | | | | | | | | | |
| Security Name | | Interest Rate | | | Maturity Date | | | Principal | | | Value | |
| | | | | | | | | | | | | | | | |
| | | | |
| Idaho: 0.26% | | | | | | | | | | | | | | | | |
University of Idaho Series 2011 (Education Revenue)±§ | | | 5.25 | % | | | 04/01/2041 | | | $ | 3,000,000 | | | $ | 3,498,180 | |
| | | | | | | | | | | | | | | | |
| | | | |
| Illinois: 12.82% | | | | | | | | | | | | | | | | |
Champaign Coles IL Counties Community College District # 505 Series A (Tax Revenue) | | | 4.00 | | | | 12/01/2018 | | | | 1,015,000 | | | | 1,162,216 | |
Chicago IL Board of Education Series A (Tax Revenue, NATL-RE FGIC Insured)(z) | | | 3.10 | | | | 12/01/2018 | | | | 13,920,000 | | | | 11,238,173 | |
Chicago IL Board of Education School Reform (Education Revenue) | | | 5.25 | | | | 12/01/2023 | | | | 5,000,000 | | | | 5,883,500 | |
Chicago IL Board of Education Benito Juarez Community Academy Series G (Tax Revenue, NATL-RE Insured) | | | 6.00 | | | | 12/01/2022 | | | | 1,630,000 | | | | 1,791,403 | |
Chicago IL CAB Project (Miscellaneous Revenue, NATL-RE Insured)±§ | | | 5.44 | | | | 01/01/2018 | | | | 1,725,000 | | | | 1,958,807 | |
Chicago IL O’Hare International Airport Third Lien Series C (Port Authority Revenue, Assured Guaranty Insured) | | | 5.25 | | | | 01/01/2025 | | | | 4,075,000 | | | | 4,565,997 | |
Chicago IL O’Hare International Airport Third Lien Series F (Port Authority Revenue) | | | 4.25 | | | | 01/01/2021 | | | | 735,000 | | | | 805,413 | |
Chicago IL Park District (Miscellaneous Revenue) | | | 5.00 | | | | 01/01/2036 | | | | 1,500,000 | | | | 1,587,135 | |
Chicago IL GO Series A (Tax Revenue, AMBAC Insured) | | | 5.00 | | | | 01/01/2019 | | | | 1,500,000 | | | | 1,662,660 | |
Chicago IL GO Series A (Tax Revenue) | | | 5.25 | | | | 01/01/2023 | | | | 2,500,000 | | | | 2,737,850 | |
Chicago IL GO Series A Prerefunded (Tax Revenue, NATL-RE Insured)±§ | | | 5.65 | | | | 01/01/2028 | | | | 555,000 | | | | 662,315 | |
Chicago IL GO Series C (Tax Revenue) | | | 5.00 | | | | 01/01/2024 | | | | 3,180,000 | | | | 3,426,895 | |
Chicago IL GO Series D (Miscellaneous Revenue, AGM Insured)±§ | | | 4.00 | | | | 01/01/2040 | | | | 20,000,000 | | | | 20,000,000 | |
Chicago IL Transit Authority Sales Tax Receipts Series A (Tax Revenue) | | | 5.00 | | | | 12/01/2018 | | | | 1,135,000 | | | | 1,355,939 | |
Cook County IL Series A(Miscellaneous Revenue) | | | 5.25 | | | | 11/15/2022 | | | | 1,000,000 | | | | 1,143,630 | |
DeKalb Kane La Salle Counties Illinois Community College District (GO - State)(z) | | | 4.44 | | | | 02/01/2023 | | | | 1,000,000 | | | | 613,320 | |
Du Page County IL (Transportation Revenue, AGM Insured) | | | 5.00 | | | | 01/01/2017 | | | | 2,020,000 | | | | 2,210,385 | |
Du Page County IL Community Unit School District #108 Lake Park Project (Tax Revenue, AGM Insured) | | | 5.60 | | | | 01/01/2021 | | | | 2,000,000 | | | | 2,079,680 | |
Du Page County IL High School District (GO - State, AGM Insured) | | | 5.00 | | | | 01/01/2021 | | | | 1,000,000 | | | | 1,110,420 | |
Eureka IL Eureka College Project 1998 Series B (Education Revenue)±§ | | | 7.00 | | | | 01/01/2019 | | | | 560,000 | | | | 560,834 | |
Huntley IL Special Service Area # 9 (Tax Revenue, Assured Guaranty Insured) | | | 4.60 | | | | 03/01/2017 | | | | 1,565,000 | | | | 1,675,927 | |
Illinois Education Facilities Authority Field Museum (Miscellaneous Revenue)±§ | | | 4.13 | | | | 11/01/2036 | | | | 4,560,000 | | | | 4,752,158 | |
Illinois Education Facilities Authority (Miscellaneous Revenue)±§ | | | 3.40 | | | | 11/01/2036 | | | | 1,275,000 | | | | 1,334,517 | |
Illinois Finance Authority DePaul University Series A (Education Revenue, XLCA Insured) | | | 5.00 | | | | 10/01/2019 | | | | 1,550,000 | | | | 1,678,542 | |
Illinois Finance Authority East St. Louis Project (Miscellaneous Revenue, XLCA Moral Obligation Insured) | | | 5.00 | | | | 11/15/2013 | | | | 1,255,000 | | | | 1,266,232 | |
Illinois Finance Authority Series A (Health Revenue, GO of Participants Insured) | | | 4.90 | | | | 07/01/2013 | | | | 1,270,000 | | | | 1,232,052 | |
Illinois Finance Authority Series A (Health Revenue, GO of Participants Insured) | | | 4.95 | | | | 07/01/2014 | | | | 1,685,000 | | | | 1,598,458 | |
Illinois Finance Authority Student Housing Illinois State University Project (Education Revenue) | | | 5.50 | | | | 04/01/2021 | | | | 4,585,000 | | | | 4,857,303 | |
Illinois Health Facilities Authority Mercy Hospital & Medical Center (Health Revenue) | | | 10.00 | | | | 01/01/2015 | | | | 370,000 | | | | 423,117 | |
Illinois Municipal Electric Agency Power Supply (Utilities Revenue, NATL-RE FGIC Insured) | | | 5.00 | | | | 02/01/2023 | | | | 1,000,000 | | | | 1,077,910 | |
Illinois Municipal Electric Agency Power Supply Series A (Utilities Revenue, NATL-RE-IBC FGIC Insured) | | | 5.25 | | | | 02/01/2023 | | | | 1,100,000 | | | | 1,210,957 | |
Illinois Regional Transportation Authority (Tax Revenue, AGM GO of Authority Insured) | | | 5.75 | | | | 06/01/2018 | | | | 6,395,000 | | | | 7,928,137 | |
| | | | | | |
| Portfolio of Investments—December 31, 2011 (Unaudited) | | Wells Fargo Advantage Intermediate Tax/AMT-Free Fund | | | 15 | |
| | | | | | | | | | | | | | | | |
| Security Name | | Interest Rate | | | Maturity Date | | | Principal | | | Value | |
| | | | | | | | | | | | | | | | |
| | | |
| Illinois (continued) | | | | | | | | | | | | | |
Illinois State GO (Tax Revenue, AGM Insured) | | | 5.00 | % | | | 09/01/2016 | | | $ | 585,000 | | | $ | 644,816 | |
Illinois State GO (Tax Revenue, AMBAC Insured) | | | 5.00 | | | | 04/01/2020 | | | | 3,000,000 | | | | 3,214,620 | |
Illinois State Series A (Miscellaneous Revenue, NATL-RE Insured) | | | 5.00 | | | | 03/01/2016 | | | | 2,705,000 | | | | 2,875,469 | |
Illinois State Series A (Miscellaneous Revenue) | | | 5.00 | | | | 10/01/2016 | | | | 5,000,000 | | | | 5,296,150 | |
Illinois State Series A (Miscellaneous Revenue, NATL-RE FGIC-TCR Insured) | | | 5.25 | | | | 10/01/2015 | | | | 5,200,000 | | | | 5,553,756 | |
Illinois State GO Series B (Miscellaneous Revenue)§ | | | 3.00 | | | | 10/01/2033 | | | | 12,675,000 | | | | 12,675,000 | |
Illinois State GO Series B (Tax Revenue) | | | 5.00 | | | | 06/15/2018 | | | | 1,000,000 | | | | 1,197,170 | |
Illinois Toll Highway Authority Series A-1 (Transportation Revenue) | | | 5.25 | | | | 01/01/2026 | | | | 3,500,000 | | | | 3,921,715 | |
Kane County IL School District #129 (Education Revenue, NATL-RE FGIC Insured) | | | 5.00 | | | | 02/01/2018 | | | | 1,750,000 | | | | 1,884,855 | |
Kane Mchenry Cook and DeKalb County Unified School District (Education Revenue) | | | 5.00 | | | | 01/01/2024 | | | | 2,000,000 | | | | 2,153,700 | |
Lake County IL Community High School District #117 Antioch CAB Series B (Tax Revenue, NATL-RE FGIC Insured)(z) | | | 3.81 | | | | 12/01/2016 | | | | 1,000,000 | | | | 829,710 | |
Northern Cook County IL Solid Waste Agency Series A (Resource Recovery Revenue, NATL-RE Insured) | | | 5.00 | | | | 05/01/2013 | | | | 1,200,000 | | | | 1,262,004 | |
Railsplitter IL Tobacco Settlement Authority (Tobacco Revenue) | | | 5.50 | | | | 06/01/2023 | | | | 6,000,000 | | | | 6,640,800 | |
Regional Transportation Authority IL GO of Illinois (Tax Revenue, NATL-RE GO of Authority Insured) | | | 6.50 | | | | 07/01/2026 | | | | 7,725,000 | | | | 10,024,037 | |
Southwestern Illinois Development Authority Local Government Program Collinsville Limited (Tax Revenue) | | | 5.00 | | | | 03/01/2025 | | | | 1,975,000 | | | | 1,596,017 | |
Tazewell County IL School District #51 (Tax Revenue, NATL-RE FGIC Insured) | | | 9.00 | | | | 12/01/2017 | | | | 455,000 | | | | 617,376 | |
Tazewell County IL School District #51 (Tax Revenue, NATL-RE FGIC Insured) | | | 9.00 | | | | 12/01/2018 | | | | 535,000 | | | | 752,274 | |
University of Illinois Auxiliary Facilities Systems (Education Revenue)(z) | | | 3.55 | | | | 04/01/2020 | | | | 8,270,000 | | | | 6,177,111 | |
University of Illinois Auxiliary Facilities Systems Series A (Education Revenue, AMBAC Insured) | | | 5.50 | | | | 04/01/2024 | | | | 1,000,000 | | | | 1,227,000 | |
University of Illinois Board of Trustees Series B (Lease Revenue, AGM Insured) | | | 5.00 | | | | 10/01/2020 | | | | 2,000,000 | | | | 2,217,060 | |
Will County IL Community Unified School District CAB (Tax Revenue, NATL-RE FGIC Insured)(z) | | | 3.53 | | | | 11/01/2018 | | | | 9,730,000 | | | | 7,647,585 | |
| | | | |
| | | | | | | | | | | | | | | 174,000,107 | |
| | | | | | | | | | | | | | | | |
| | | | |
| Indiana: 2.98% | | | | | | | | | | | | | | | | |
Fort Wayne IN Redevelopment Authority Grand Wayne Center Project (Lease Revenue) | | | 5.00 | | | | 02/01/2020 | | | | 1,000,000 | | | | 1,036,380 | |
Hammond IN Multi-School Building Corporation First Mortgage (Lease Revenue, NATL-RE FGIC State Aid Withholding Insured) | | | 5.00 | | | | 07/15/2014 | | | | 100,000 | | | | 110,639 | |
Indiana Bond Bank Common School Series B (Miscellaneous Revenue, NATL-RE Insured) | | | 5.00 | | | | 02/01/2018 | | | | 1,470,000 | | | | 1,530,902 | |
Indiana Bond Bank Hendricks Regional Health Series A (Miscellaneous Revenue, Morgal Obligation Insured) | | | 4.00 | | | | 08/01/2017 | | | | 1,000,000 | | | | 1,101,360 | |
Indiana Bond Bank Hendricks Regional Health Series A (Miscellaneous Revenue, Morgal Obligation Insured) | | | 5.00 | | | | 08/01/2016 | | | | 1,340,000 | | | | 1,524,250 | |
Indiana Bond Bank Special Program BMA Index Series B2 (Energy Revenue)±§ | | | 0.76 | | | | 10/15/2022 | | | | 900,000 | | | | 714,888 | |
Indiana Bond Bank Special Program Series A (Energy Revenue) | | | 5.00 | | | | 10/15/2017 | | | | 5,410,000 | | | | 5,968,691 | |
Indiana Bond Bank Special Program Series A (Energy Revenue) | | | 5.25 | | | | 10/15/2016 | | | | 500,000 | | | | 558,070 | |
Indiana HEFA Ascension Health Series B3 (Health Revenue)±§ | | | 1.74 | | | | 11/15/2031 | | | | 15,000,000 | | | | 14,988,000 | |
Indiana State Bond Bank (Miscellaneous Revenue) | | | 5.00 | | | | 09/01/2022 | | | | 1,545,000 | | | | 1,804,158 | |
Jasper County IN PCR Northern Series A (IDR, NATL-RE Insured) | | | 5.60 | | | | 11/01/2016 | | | | 5,900,000 | | | | 6,699,273 | |
Jeffersonville IN Building Corporation First Mortgage Series C (Lease Revenue) | | | 4.25 | | | | 08/15/2017 | | | | 980,000 | | | | 1,068,347 | |
| | | | |
| 16 | | Wells Fargo Advantage Intermediate Tax/AMT-Free Fund | | Portfolio of Investments—December 31, 2011 (Unaudited) |
| | | | | | | | | | | | | | | | |
| Security Name | | Interest Rate | | | Maturity Date | | | Principal | | | Value | |
| | | | | | | | | | | | | | | | |
| | | | |
| Indiana (continued) | | | | | | | | | | | | | | | | |
Mt. Vernon IN School Building Corporation First Mortgage Series 2007 (Lease Revenue, AGM State Aid Withholding Insured) | | | 5.00 | % | | | 07/15/2019 | | | $ | 1,000,000 | | | $ | 1,158,080 | |
Portage IN Redevelopment District (Tax Revenue, CIFC Insured) | | | 4.00 | | | | 01/15/2015 | | | | 270,000 | | | | 286,038 | |
Portage IN Redevelopment District (Tax Revenue, CIFC Insured) | | | 4.00 | | | | 01/15/2016 | | | | 240,000 | | | | 256,406 | |
Portage IN Redevelopment District (Tax Revenue, CIFC Insured) | | | 4.00 | | | | 07/15/2016 | | | | 360,000 | | | | 387,101 | |
University of Southern Indiana Student Fee Series J (Education Revenue, Assured Guaranty Insured) | | | 5.00 | | | | 10/01/2019 | | | | 1,000,000 | | | | 1,193,040 | |
| | | | |
| | | | | | | | | | | | | | | 40,385,623 | |
| | | | | | | | | | | | | | | | |
| | | | |
| Iowa: 0.81% | | | | | | | | | | | | | | | | |
Iowa Finance Authority PCFA Interstate Power (IDR, FGIC Insured) | | | 5.00 | | | | 07/01/2014 | | | | 1,500,000 | | | | 1,628,295 | |
Iowa Student Loan Liquidity Corporation Series 1 (Education Revenue) | | | 5.25 | | | | 12/01/2017 | | | | 3,000,000 | | | | 3,386,070 | |
Iowa Student Loan Liquidity Corporation Series 1 (Education Revenue) | | | 5.25 | | | | 12/01/2018 | | | | 5,285,000 | | | | 6,001,699 | |
| | | | |
| | | | | | | | | | | | | | | 11,016,064 | |
| | | | | | | | | | | | | | | | |
| | | | |
| Kansas: 1.81% | | | | | | | | | | | | | | | | |
Burlington KS Environmental Impact Kansas City Power & Light Series A (IDR, XLCA Insured)±§ | | | 5.25 | | | | 12/01/2023 | | | | 6,200,000 | | | | 6,499,212 | |
Junction City KS GO (Utilities Revenue) | | | 5.00 | | | | 09/01/2018 | | | | 1,405,000 | | | | 1,538,630 | |
Junction City KS GO (Miscellaneous Revenue, AMBAC Insured) | | | 5.00 | | | | 09/01/2023 | | | | 1,715,000 | | | | 1,806,204 | |
Kansas Development Finance Authority Health Facilities Series F (Health Revenue) | | | 5.00 | | | | 11/15/2021 | | | | 1,300,000 | | | | 1,477,164 | |
Kansas Development Finance Authority Health Facilities Series F (Health Revenue) | | | 5.25 | | | | 11/15/2030 | | | | 3,550,000 | | | | 3,715,146 | |
Kansas Development Finance Authority Health Facilities Hartford Series B-1 (Health Revenue, ACA Insured) | | | 6.13 | | | | 04/01/2012 | | | | 30,000 | | | | 30,036 | |
Kansas Development Finance Authority Health Facilities Series F (Health Revenue) | | | 5.00 | | | | 11/15/2026 | | | | 550,000 | | | | 581,862 | |
Olathe KS Special Obligation West Village Center Project (Tax Revenue) | | | 5.00 | | | | 09/01/2013 | | | | 280,000 | | | | 256,595 | |
Olathe KS Special Obligation West Village Center Project (Tax Revenue) | | | 5.00 | | | | 09/01/2014 | | | | 305,000 | | | | 269,837 | |
Wyandotte County & Kansas City KS Unified Government Special Obligation Sales Tax Second Lien Series A (Tax Revenue)(z) | | | 4.87 | | | | 06/01/2021 | | | | 9,000,000 | | | | 5,714,910 | |
Wyandotte County & Kansas City KS Unified Government Special Obligation Sales Tax Second Lien Series B (Tax Revenue) | | | 5.00 | | | | 12/01/2020 | | | | 1,460,000 | | | | 1,529,700 | |
Wyandotte County & Kansas City KS Unified Government Transportation Development District Legends Village West Project (Tax Revenue) | | | 4.88 | | | | 10/01/2028 | | | | 1,445,000 | | | | 1,133,314 | |
| | | | |
| | | | | | | | | | | | | | | 24,552,610 | |
| | | | | | | | | | | | | | | | |
| | | | |
| Kentucky: 1.34% | | | | | | | | | | | | | | | | |
Kentucky Asset Liability Commission General Fund Series A (Miscellaneous Revenue, NATL-RE FGIC Insured)±§ | | | 0.82 | | | | 11/01/2027 | | | | 4,625,000 | | | | 3,866,916 | |
Kentucky Asset Liability Commission General Fund Series B (Miscellaneous Revenue, NATL-RE FGIC Insured)±§ | | | 0.84 | | | | 11/01/2025 | | | | 6,175,000 | | | | 4,762,160 | |
Kentucky State Property & Buildings Commission Series A Project # 95 (Miscellaneous Revenue) | | | 5.00 | | | | 08/01/2019 | | | | 1,265,000 | | | | 1,528,297 | |
University of Kentucky COP Master Street Lease # 4 (Lease Revenue) | | | 4.45 | | | | 06/18/2018 | | | | 7,681,457 | | | | 8,027,046 | |
| | | | |
| | | | | | | | | | | | | | | 18,184,419 | |
| | | | | | | | | | | | | | | | |
| | | | |
| Louisiana: 1.89% | | | | | | | | | | | | | | | | |
Louisiana Local Government Environmental Facilities & Community Development Authority (Housing Revenue, FNMA Insured)±§ | | | 4.25 | | | | 04/15/2039 | | | | 1,210,000 | | | | 1,271,879 | |
| | | | | | |
| Portfolio of Investments—December 31, 2011 (Unaudited) | | Wells Fargo Advantage Intermediate Tax/AMT-Free Fund | | | 17 | |
| | | | | | | | | | | | | | | | |
| Security Name | | Interest Rate | | | Maturity Date | | | Principal | | | Value | |
| | | | | | | | | | | | | | | | |
| | | |
| Louisiana (continued) | | | | | | | | | | | | | |
Louisiana Public Facilities Authority Archdiocese of New Orleans Project (Miscellaneous Revenue, CIFC Insured) | | | 5.00 | % | | | 07/01/2014 | | | $ | 200,000 | | | $ | 213,666 | |
Louisiana Public Facilities Authority Archdiocese of New Orleans Project (Miscellaneous Revenue, CIFC Insured) | | | 5.00 | | | | 07/01/2016 | | | | 100,000 | | | | 110,651 | |
Louisiana Public Facilities Authority Archdiocese of New Orleans Project (Miscellaneous Revenue, CIFC Insured) | | | 5.00 | | | | 07/01/2017 | | | | 150,000 | | | | 167,898 | |
Louisiana Public Facilities Authority Black & Gold Facilities Project Series A (Housing Revenue, CIFC Insured) | | | 4.00 | | | | 07/01/2015 | | | | 505,000 | | | | 532,684 | |
Louisiana Public Facilities Authority Black & Gold Facilities Project Series A (Housing Revenue, CIFC Insured) | | | 4.13 | | | | 07/01/2016 | | | | 170,000 | | | | 181,808 | |
Louisiana Public Facilities Authority Black & Gold Facilities Project Series A (Housing Revenue, CIFC Insured) | | | 4.25 | | | | 07/01/2017 | | | | 55,000 | | | | 59,464 | |
Louisiana Public Facilities Authority Black & Gold Facilities Project Series A (Housing Revenue, CIFC Insured) | | | 5.00 | | | | 07/01/2014 | | | | 100,000 | | | | 99,977 | |
Louisiana Public Facilities Authority Black & Gold Facilities Project Series A (Housing Revenue, CIFC Insured) | | | 5.00 | | | | 07/01/2016 | | | | 740,000 | | | | 725,703 | |
Louisiana Public Facilities Authority Black & Gold Facilities Project Series A (Housing Revenue, CIFC Insured) | | | 5.00 | | | | 07/01/2019 | | | | 1,465,000 | | | | 1,379,210 | |
Louisiana Public Facilities Authority Black & Gold Facilities Project Series A (Housing Revenue, CIFC Insured) | | | 5.00 | | | | 07/01/2020 | | | | 500,000 | | | | 464,240 | |
Louisiana Public Facilities Authority Black & Gold Facilities Project Series A (Education Revenue, CIFC Insured) | | | 5.00 | | | | 07/01/2022 | | | | 1,175,000 | | | | 1,269,541 | |
Louisiana Public Facilities Authority Black & Gold Facilities Project Series A (Housing Revenue, CIFC Insured) | | | 5.00 | | | | 07/01/2022 | | | | 100,000 | | | | 89,979 | |
Louisiana State Citizens Property Insurance Corporation Series B (Miscellaneous Revenue, AMBAC Insured) | | | 5.25 | | | | 06/01/2013 | | | | 1,945,000 | | | | 2,036,746 | |
Louisiana State Correctional Facilities Corporation (Lease Revenue, AMBAC Insured) | | | 5.00 | | | | 09/01/2019 | | | | 1,000,000 | | | | 1,194,710 | |
New Orleans LA Public Improvement Series A (Tax Revenue, Radian Insured) | | | 5.00 | | | | 12/01/2016 | | | | 1,365,000 | | | | 1,524,964 | |
New Orleans LA Public Improvement Series A (Tax Revenue, Radian Insured) | | | 5.00 | | | | 12/01/2017 | | | | 1,245,000 | | | | 1,405,742 | |
New Orleans LA Sewer Service (Water & Sewer Revenue, NATL-RE Insured) | | | 5.00 | | | | 06/01/2012 | | | | 925,000 | | | | 936,156 | |
New Orleans LA Sewer Service (Water & Sewer Revenue, NATL-RE Insured) | | | 5.00 | | | | 06/01/2016 | | | | 100,000 | | | | 103,547 | |
New Orleans LA Sewer Service (Water & Sewer Revenue, Assured Guaranty Insured) | | | 5.50 | | | | 06/01/2016 | | | | 690,000 | | | | 762,540 | |
New Orleans LA Sewer Service (Water & Sewer Revenue, FGIC Insured) | | | 5.50 | | | | 12/01/2016 | | | | 1,350,000 | | | | 1,553,553 | |
New Orleans LA Sewer Service (Water & Sewer Revenue, FGIC Insured) | | | 5.50 | | | | 06/01/2020 | | | | 740,000 | | | | 745,483 | |
New Orleans LA Sewer Service (Water & Sewer Revenue, Assured Guaranty Insured) | | | 5.63 | | | | 06/01/2017 | | | | 590,000 | | | | 662,900 | |
Parish of DeSoto LA PCR Southwestern Electrical Power (Utilities Revenue)±§ | | | 3.25 | | | | 01/01/2019 | | | | 5,000,000 | | | | 5,173,850 | |
Port of New Orleans LA Board Commerce Special Project CG Railway Incorporated (Port Authority Revenue, NATL-RE Insured) | | | 5.25 | | | | 08/15/2013 | | | | 1,000,000 | | | | 1,025,820 | |
Tobacco Settlement Financing Corporation (Tobacco Revenue) | | | 5.88 | | | | 05/15/2039 | | | | 2,000,000 | | | | 2,000,680 | |
| | | | |
| | | | | | | | | | | | | | | 25,693,391 | |
| | | | | | | | | | | | | | | | |
| | | | |
| Massachusetts: 3.14% | | | | | | | | | | | | | | | | |
Massachusetts Development Finance Agency Revenue Lasell College (Education Revenue) | | | 5.00 | | | | 07/01/2021 | | | | 2,820,000 | | | | 2,923,635 | |
Massachusetts Development Finance Agency Sabis International Charter Series A (Miscellaneous Revenue) | | | 6.50 | | | | 04/15/2019 | | | | 1,050,000 | | | | 1,176,452 | |
Massachusetts Development Finance Agency Sabis International Charter Series A (Miscellaneous Revenue) | | | 6.55 | | | | 04/15/2020 | | | | 615,000 | | | | 686,801 | |
Massachusetts Educational Financing Authority Issue I Series A (Education Revenue) | | | 5.50 | | | | 01/01/2017 | | | | 2,000,000 | | | | 2,296,740 | |
| | | | |
| 18 | | Wells Fargo Advantage Intermediate Tax/AMT-Free Fund | | Portfolio of Investments—December 31, 2011 (Unaudited) |
| | | | | | | | | | | | | | | | |
| Security Name | | Interest Rate | | | Maturity Date | | | Principal | | | Value | |
| | | | | | | | | | | | | | | | |
| | | |
| Massachusetts (continued) | | | | | | | | | | | | | |
Massachusetts Educational Financing Authority Series I (Education Revenue) | | | 5.50 | % | | | 01/01/2018 | | | $ | 2,000,000 | | | $ | 2,321,640 | |
Massachusetts State Construction Loan Series C (Tax Revenue, AGM Insured) | | | 5.25 | | | | 08/01/2025 | | | | 5,000,000 | | | | 5,809,950 | |
Massachusetts State Series A (Miscellaneous Revenue)± | | | 0.71 | | | | 11/01/2018 | | | | 2,650,000 | | | | 2,376,971 | |
Massachusetts State HEFA (Health Revenue)± | | | 0.98 | | | | 07/01/2038 | | | | 14,000,000 | | | | 13,813,240 | |
Massachusetts State Series C (Miscellaneous Revenue, AGM Insured)±§ | | | 4.41 | | | | 11/01/2019 | | | | 4,175,000 | | | | 4,276,202 | |
Massachusetts State Water Resources (Utilities Revenue) | | | 5.25 | | | | 08/01/2027 | | | | 5,500,000 | | | | 6,867,355 | |
| | | | |
| | | | | | | | | | | | | | | 42,548,986 | |
| | | | | | | | | | | | | | | | |
| | | | |
| Michigan: 6.12% | | | | | | | | | | | | | | | | |
Clinton MI Township Building Authority (Lease Revenue, AMBAC Insured) | | | 5.50 | | | | 11/01/2017 | | | | 5,240,000 | | | | 5,783,021 | |
Detroit MI Capital Improvement Limited Tax Series A-1 (Tax Revenue) | | | 5.00 | | | | 04/01/2015 | | | | 4,235,000 | | | | 3,812,474 | |
Detroit MI City School District (Tax Revenue, FGIC Insured) | | | 6.00 | | | | 05/01/2021 | | | | 2,030,000 | | | | 2,420,572 | |
Detroit MI City School District Series A (Tax Revenue, AGM Insured) | | | 5.00 | | | | 05/01/2019 | | | | 8,000,000 | | | | 8,520,000 | |
Detroit MI District Aid (Tax Revenue) | | | 5.00 | | | | 11/01/2014 | | | | 1,000,000 | | | | 1,090,910 | |
Detroit MI District Aid (Tax Revenue) | | | 5.00 | | | | 11/01/2018 | | | | 3,000,000 | | | | 3,468,510 | |
Detroit MI District Aid (Tax Revenue) | | | 5.00 | | | | 11/01/2020 | | | | 1,700,000 | | | | 1,978,613 | |
Detroit MI Municipal Bond Authority School District (Miscellaneous Revenue, AGM Insured) | | | 5.00 | | | | 06/01/2016 | | | | 5,000,000 | | | | 5,348,600 | |
Detroit MI Senior Lien Series A-1 (Water & Sewer Revenue, AGM Insured) | | | 5.50 | | | | 07/01/2017 | | | | 3,130,000 | | | | 3,596,933 | |
Detroit MI Series A-1 (Tax Revenue, NATL-RE Insured) | | | 5.00 | | | | 04/01/2019 | | | | 100,000 | | | | 97,617 | |
Detroit MI Sewage Disposal Refunding Revenue Senior Lien Series B (Water & Sewer Revenue, AGM Insured) | | | 7.50 | | | | 07/01/2033 | | | | 10,000,000 | | | | 12,155,300 | |
Detroit MI Sewer Disposal System Authority (Utilities Revenue)§ | | | 5.25 | | | | 07/01/2022 | | | | 1,885,000 | | | | 2,010,409 | |
Detroit MI Water Supply System Senior Lien Series B (Water & Sewer Revenue)±§ | | | 5.00 | | | | 07/01/2022 | | | | 1,500,000 | | | | 1,567,845 | |
Detroit MI Water Supply System Series A (Water & Sewer Revenue, AGM Insured) | | | 5.00 | | | | 07/01/2015 | | | | 1,000,000 | | | | 1,098,860 | |
Flint MI International Academy (Miscellaneous Revenue) | | | 5.00 | | | | 10/01/2017 | | | | 515,000 | | | | 509,139 | |
Flint MI International Academy (Miscellaneous Revenue) | | | 5.38 | | | | 10/01/2022 | | | | 2,270,000 | | | | 2,134,549 | |
Flint MI International Academy (Miscellaneous Revenue) | | | 5.50 | | | | 10/01/2027 | | | | 435,000 | | | | 388,912 | |
Hazel Park MI School District (Education Revenue) | | | 5.00 | | | | 05/01/2020 | | | | 1,160,000 | | | | 1,350,391 | |
Kent County MI (Tax Revenue) | | | 5.00 | | | | 01/01/2025 | | | | 1,000,000 | | | | 1,114,780 | |
Macomb MI Interceptor Drainage (Sewer Revenue) | | | 5.00 | | | | 05/01/2024 | | | | 1,750,000 | | | | 2,048,585 | |
Macomb MI Interceptor Drainage (Sewer Revenue) | | | 5.00 | | | | 05/01/2025 | | | | 1,750,000 | | | | 2,017,540 | |
Macomb MI Interceptor Drainage (Sewer Revenue) | | | 5.00 | | | | 05/01/2026 | | | | 1,930,000 | | | | 2,200,528 | |
Michigan Municipal Bond Authority Local Government Loan Program Series B Group A (Miscellaneous Revenue, AMBAC Insured) | | | 5.00 | | | | 12/01/2018 | | | | 1,075,000 | | | | 1,103,681 | |
Michigan Municipal Building Authority Government Loan Program Series A (Miscellaneous Revenue, AMBAC Insured) | | | 4.50 | | | | 05/01/2016 | | | | 100,000 | | | | 101,450 | |
Michigan Municipal Building Authority School District (Miscellaneous Revenue, AGM Insured) | | | 5.00 | | | | 06/01/2014 | | | | 600,000 | | | | 633,876 | |
Michigan Public Educational Facilities Authority Limited Obligation Chandler Park Academy (Miscellaneous Revenue) | | | 5.60 | | | | 11/01/2018 | | | | 1,270,000 | | | | 1,286,485 | |
Michigan Public Educational Facilities Authority Limited Obligation Nataki Talibah (Miscellaneous Revenue) | | | 6.25 | | | | 10/01/2023 | | | | 990,000 | | | | 901,504 | |
Michigan State Comprehensive Transportation Program (Tax Revenue) | | | 5.25 | | | | 05/15/2017 | | | | 2,750,000 | | | | 3,233,313 | |
Michigan State Environmental Protection Program (Tax Revenue) | | | 6.25 | | | | 11/01/2012 | | | | 110,000 | | | | 114,137 | |
Michigan State Housing Development Authority Limited Greenwood Villa Project (Housing Revenue, AGM Insured) | | | 4.75 | | | | 09/15/2017 | | | | 1,955,000 | | | | 2,101,703 | |
Michigan State Municipal Bond Authority (Lease Revenue) | | | 5.00 | | | | 06/01/2018 | | | | 1,785,000 | | | | 1,886,281 | |
| | | | | | |
| Portfolio of Investments—December 31, 2011 (Unaudited) | | Wells Fargo Advantage Intermediate Tax/AMT-Free Fund | | | 19 | |
| | | | | | | | | | | | | | | | |
| Security Name | | Interest Rate | | | Maturity Date | | | Principal | | | Value | |
| | | | | | | | | | | | | | | | |
| | | | |
| Michigan (continued) | | | | | | | | | | | | | | | | |
Michigan State Strategic Fund Limited Obligation Cadillac Place Office Building Project (Lease Revenue) | | | 5.25 | % | | | 10/15/2025 | | | $ | 4,165,000 | | | $ | 4,608,031 | |
Western Townships MI Utilities Authority (Tax Revenue) | | | 5.00 | | | | 01/01/2017 | | | | 1,500,000 | | | | 1,746,615 | |
Wyandotte MI Series A (Utilities Revenue, Assured Guaranty Insured) | | | 4.00 | | | | 10/01/2016 | | | | 500,000 | | | | 554,215 | |
| | | | |
| | | | | | | | | | | | | | | 82,985,379 | |
| | | | | | | | | | | | | | | | |
| | | | |
| Minnesota: 1.42% | | | | | | | | | | | | | | | | |
Becker MN PCR Northern States Power Series B (IDR)±§ | | | 8.50 | | | | 09/01/2019 | | | | 3,800,000 | | | | 4,018,804 | |
Minneapolis & St. Paul MN Metropolitan Airports Commission Sub Series B (Port Authority Revenue, NATL-RE FGIC Insured) | | | 5.00 | | | | 01/01/2018 | | | | 4,555,000 | | | | 5,156,078 | |
Minneapolis MN St. Mary’s Hospital & Rehabilitation (Health Revenue) | | | 10.00 | | | | 06/01/2013 | | | | 85,000 | | | | 92,003 | |
Minneapolis St. Paul MN Metro Airports Commission Series A (Airport Revenue) | | | 5.00 | | | | 01/01/2024 | | | | 2,000,000 | | | | 2,200,140 | |
Minnesota Tobacco Securitization Authority Tobacco Settlement Series B (Tobacco Revenue) | | | 5.25 | | | | 03/01/2031 | | | | 2,925,000 | | | | 3,008,392 | |
Northern Minnesota Municipal Power Agency Series A (Utilities Revenue, Assured Guaranty Insured) | | | 5.00 | | | | 01/01/2016 | | | | 1,365,000 | | | | 1,563,089 | |
St. Louis Park MN Nicollett Health Services Series C (Health Revenue) | | | 5.50 | | | | 07/01/2023 | | | | 2,500,000 | | | | 2,709,875 | |
St. Paul MN Housing & Redevelopment Authority Hmong Academy Project Series A (Miscellaneous Revenue) | | | 5.50 | | | | 09/01/2018 | | | | 500,000 | | | | 497,480 | |
| | | | |
| | | | | | | | | | | | | | | 19,245,861 | |
| | | | | | | | | | | | | | | | |
| | | | |
| Mississippi: 0.04% | | | | | | | | | | | | | | | | |
Mississippi Development Bank Special Obligation Municipal Energy Agency Power Supply Project (Utilities Revenue, XLCA Insured) | | | 5.00 | | | | 03/01/2013 | | | | 505,000 | | | | 523,847 | |
| | | | | | | | | | | | | | | | |
| | | | |
| Missouri: 0.40% | | | | | | | | | | | | | | | | |
Chesterfield Valley MO Transportation Development District (Tax Revenue, CIFC Insured) | | | 4.00 | | | | 04/15/2026 | | | | 1,500,000 | | | | 992,370 | |
Fenton MO Gravois Bluffs Redevelopment Project (Tax Revenue) | | | 4.50 | | | | 04/01/2021 | | | | 945,000 | | | | 970,893 | |
Lake of the Ozarks Missouri Community Bridge Corporation (Transportation Revenue) | | | 5.25 | | | | 12/01/2014 | | | | 260,000 | | | | 246,194 | |
Manchester MO Highway 141 Manchester Road Project (Tax Revenue) | | | 6.00 | | | | 11/01/2025 | | | | 1,000,000 | | | | 1,030,310 | |
Maryland Heights MO South Heights Redevelopment Project A (Tax Revenue) | | | 5.50 | | | | 09/01/2018 | | | | 1,085,000 | | | | 1,074,779 | |
Ozark MO COP Community Center Project (Lease Revenue) | | | 4.50 | | | | 09/01/2013 | | | | 145,000 | | | | 150,094 | |
Ozark MO COP Community Center Project (Lease Revenue) | | | 4.50 | | | | 09/01/2014 | | | | 170,000 | | | | 178,677 | |
Ozark MO COP Community Center Project (Lease Revenue) | | | 4.55 | | | | 09/01/2016 | | | | 225,000 | | | | 234,835 | |
St. Louis MO Lambert St. Louis International Airport Series A-1 (Port Authority Revenue) | | | 6.00 | | | | 07/01/2019 | | | | 415,000 | | | | 494,095 | |
| | | | |
| | | | | | | | | | | | | | | 5,372,247 | |
| | | | | | | | | | | | | | | | |
| | | | |
| Nebraska: 0.05% | | | | | | | | | | | | | | | | |
Municipal Energy Agency of Nebraska Series A (Utilities Revenue, BHAC Insured) | | | 5.00 | | | | 04/01/2019 | | | | 500,000 | | | | 611,480 | |
O’Neill NE St. Anthony’s Project (Health Revenue) | | | 6.25 | | | | 09/01/2012 | | | | 115,000 | | | | 117,076 | |
| | | | |
| | | | | | | | | | | | | | | 728,556 | |
| | | | | | | | | | | | | | | | |
| | | | |
| Nevada: 2.30% | | | | | | | | | | | | | | | | |
Clark County NV Airport Revenue Series C (Port Authority Revenue, AGM Insured) | | | 5.00 | | | | 07/01/2023 | | | | 5,000,000 | | | | 5,583,750 | |
Clark County NV Airport Revenue Series D (Port Authority Revenue) | | | 5.00 | | | | 07/01/2024 | | | | 2,750,000 | | | | 3,070,320 | |
| | | | |
| 20 | | Wells Fargo Advantage Intermediate Tax/AMT-Free Fund | | Portfolio of Investments—December 31, 2011 (Unaudited) |
| | | | | | | | | | | | | | | | |
| Security Name | | Interest Rate | | | Maturity Date | | | Principal | | | Value | |
| | | | | | | | | | | | | | | | |
| | | | |
| Nevada (continued) | | | | | | | | | | | | | | | | |
Clark County NV Las Vegas McCarran International Series A (Port Authority Revenue) | | | 5.00 | % | | | 07/01/2016 | | | $ | 3,000,000 | | | $ | 3,433,710 | |
Clark County NV Las Vegas McCarran International Series A-2 (Port Authority Revenue, AMBAC Insured) | | | 5.00 | | | | 07/01/2027 | | | | 3,500,000 | | | | 3,687,250 | |
Clark County NV School District Series A (Tax Revenue, NATL-RE FGIC Insured) | | | 5.00 | | | | 06/15/2019 | | | | 7,500,000 | | | | 8,395,575 | |
Clark County NV Special Improvement District # 121A (Miscellaneous Revenue, AMBAC Insured) | | | 4.25 | | | | 12/01/2013 | | | | 885,000 | | | | 911,984 | |
Clark County NV Unrefunded Balance (Miscellaneous Revenue, NATL-RE FGIC Insured) | | | 5.00 | | | | 06/01/2031 | | | | 2,340,000 | | | | 2,346,575 | |
Reno NV Washoe Medical Center Series A (Health Revenue, AMBAC Insured) | | | 5.50 | | | | 06/01/2016 | | | | 980,000 | | | | 1,065,985 | |
Reno-Sparks Indian Colony NV Governmental (Miscellaneous Revenue, U.S. Bank NA LOC) | | | 5.00 | | | | 06/01/2021 | | | | 2,580,000 | | | | 2,686,451 | |
| | | | |
| | | | | | | | | | | | | | | 31,181,600 | |
| | | | | | | | | | | | | | | | |
| | | | |
| New Hampshire: 0.39% | | | | | | | | | | | | | | | | |
New Hampshire HEFA Exeter Project (Health Revenue) | | | 6.00 | | | | 10/01/2016 | | | | 2,240,000 | | | | 2,269,523 | |
New Hampshire State HFA (Lease Revenue) | | | 4.80 | | | | 07/01/2028 | | | | 2,850,000 | | | | 3,022,112 | |
| | | | |
| | | | | | | | | | | | | | | 5,291,635 | |
| | | | | | | | | | | | | | | | |
| | | | |
| New Jersey: 3.37% | | | | | | | | | | | | | | | | |
Gloucester County NJ Improvement Authority Waste Management Incorporated Project Series A (Resource Recovery Revenue)±§ | | | 2.63 | | | | 12/01/2029 | | | | 2,000,000 | | | | 2,026,880 | |
New Jersey EDA (Tobacco Revenue, FGIC Insured) | | | 5.00 | | | | 06/15/2012 | | | | 1,500,000 | | | | 1,518,885 | |
New Jersey HEFAR Student Loan Series 1A (Education Revenue) | | | 5.00 | | | | 12/01/2016 | | | | 2,000,000 | | | | 2,258,220 | |
New Jersey HEFAR Student Loan Series 2 (Education Revenue) | | | 4.50 | | | | 12/01/2029 | | | | 6,930,000 | | | | 6,925,565 | |
New Jersey HEFAR Student Loan Series A (Education Revenue) | | | 5.00 | | | | 06/01/2016 | | | | 500,000 | | | | 553,065 | |
New Jersey HFFA Atlantic City Medical Center Project (Health Revenue) | | | 6.00 | | | | 07/01/2012 | | | | 820,000 | | | | 836,744 | |
New Jersey Housing & Mortgage Finance Agency Series AA (Housing Revenue) | | | 5.25 | | | | 10/01/2016 | | | | 765,000 | | | | 827,462 | |
New Jersey Sports & Exposition Authority (Miscellaneous Revenue, NATL-RE Insured) | | | 5.50 | | | | 03/01/2022 | | | | 1,755,000 | | | | 2,066,074 | |
New Jersey State HEFAR Series 1A (Education Revenue) | | | 4.75 | | | | 12/01/2029 | | | | 1,935,000 | | | | 1,964,818 | |
New Jersey State HEFAR Series A (Education Revenue) | | | 5.00 | | | | 06/01/2017 | | | | 2,000,000 | | | | 2,239,640 | |
New Jersey State HEFAR Series A (Education Revenue) | | | 5.00 | | | | 06/01/2019 | | | | 1,010,000 | | | | 1,143,088 | |
New Jersey State HEFAR Series A (Education Revenue) | | | 5.00 | | | | 06/01/2027 | | | | 2,235,000 | | | | 2,299,748 | |
New Jersey State Transportation Trust Authority (Housing Revenue) | | | 5.25 | | | | 12/15/2020 | | | | 8,305,000 | | | | 10,008,688 | |
New Jersey Transportation Trust Fund Authority Facilities Center Series A (Transportation Revenue, AGM-CR Insured) | | | 5.50 | | | | 12/15/2022 | | | | 8,010,000 | | | | 9,873,366 | |
Trenton NJ (Tax Revenue, Assured Guaranty State Aid Withholding Insured) | | | 5.00 | | | | 07/15/2020 | | | | 1,000,000 | | | | 1,185,030 | |
| | | | |
| | | | | | | | | | | | | | | 45,727,273 | |
| | | | | | | | | | | | | | | | |
| | | | |
| New Mexico: 0.33% | | | | | | | | | | | | | | | | |
New Mexico Mortgage Finance Authority SFMR Class I Series A (Housing Revenue, GNMA/FNMA/FHLMC Insured) | | | 4.63 | | | | 09/01/2025 | | | | 2,510,000 | | | | 2,634,697 | |
New Mexico Mortgage Finance Authority SFMR Series B (Housing Revenue, GNMA/FNMA/FHLMC Insured) | | | 5.00 | | | | 03/01/2028 | | | | 1,000,000 | | | | 1,097,490 | |
Otero County NM Jail Project (Miscellaneous Revenue) | | | 5.50 | | | | 04/01/2013 | | | | 705,000 | | | | 695,229 | |
| | | | |
| | | | | | | | | | | | | | | 4,427,416 | |
| | | | | | | | | | | | | | | | |
| | | | |
| New York: 3.44% | | | | | | | | | | | | | | | | |
Genesee County NY IDA United Memorial Medical Center Project (Health Revenue) | | | 4.75 | | | | 12/01/2014 | | | | 390,000 | | | | 389,984 | |
| | | | | | |
| Portfolio of Investments—December 31, 2011 (Unaudited) | | Wells Fargo Advantage Intermediate Tax/AMT-Free Fund | | | 21 | |
| | | | | | | | | | | | | | | | |
| Security Name | | Interest Rate | | | Maturity Date | | | Principal | | | Value | |
| | | | | | | | | | | | | | | | |
| | | | |
| New York (continued) | | | | | | | | | | | | | | | | |
Metropolitan NY Transportation Authority Series A (Transportation Revenue) | | | 5.00 | % | | | 11/15/2020 | | | $ | 5,000,000 | | | $ | 5,581,400 | |
Metropolitan NY Transportation Authority Series B-2 (Miscellaneous Revenue, AGM Insured)(a)±§(m)(n)144A | | | 0.59 | | | | 11/01/2022 | | | | 5,225,000 | | | | 4,465,017 | |
New York City NY IDAG 2006 Project Samaritan AIDS Services (Miscellaneous Revenue, CitiBank NA LOC) | | | 4.50 | | | | 11/01/2015 | | | | 275,000 | | | | 306,716 | |
New York City NY Transitional Finance Authority Future Tax Series A (Tax Revenue) | | | 5.00 | | | | 05/01/2023 | | | | 2,875,000 | | | | 3,416,880 | |
New York City NY Trust for Cultural Resources (Tax Revenue) | | | 5.00 | | | | 07/01/2031 | | | | 2,475,000 | | | | 2,637,434 | |
New York NY Unrefunded Balance Series F (Tax Revenue, NATL-RE-IBC Insured) | | | 5.13 | | | | 08/01/2013 | | | | 5,000 | | | | 5,019 | |
New York State Dormitory Authority Hospital Series A (Health Revenue, FHA Insured) | | | 6.00 | | | | 08/15/2015 | | | | 200,000 | | | | 204,878 | |
New York State Dormitory Authority Montefiore Medical Center (Health Revenue, NATL-RE FGIC FHA Insured) | | | 5.00 | | | | 02/01/2014 | | | | 880,000 | | | | 941,054 | |
New York State Dormitory Authority Mount Sinai School of Medicine (Education Revenue, GO of Institution Insured) | | | 5.50 | | | | 07/01/2022 | | | | 2,000,000 | | | | 2,328,580 | |
New York State Dormitory Authority North Shore Jewish Series B (Health Revenue)±§ | | | 1.02 | | | | 05/01/2018 | | | | 3,635,000 | | | | 3,408,394 | |
New York State Dormitory Authority United Health Hospitals (Health Revenue, FHA Insured) | | | 4.50 | | | | 08/01/2018 | | | | 1,500,000 | | | | 1,643,955 | |
New York Urban Development Corporation (Miscellaneous Revenue) | | | 5.88 | | | | 02/01/2013 | | | | 8,500,000 | | | | 8,525,415 | |
New York Urban Development Corporation Series D (Miscellaneous Revenue, AGC-ICC Insured) | | | 5.50 | | | | 01/01/2019 | | | | 3,000,000 | | | | 3,716,100 | |
Port Authority NY & NJ Special Obligation (Port Authority Revenue) | | | 5.00 | | | | 12/01/2020 | | | | 5,000,000 | | | | 5,155,850 | |
Tobacco Settlement Financing Corporation New York Series B (Tobacco Revenue, XLCA-ICR Insured) | | | 4.00 | | | | 06/01/2012 | | | | 100,000 | | | | 101,564 | |
Troy NY Capital Resource Corporation Rensselaer Polytechnic Series B (Education Revenue) | | | 5.00 | | | | 09/01/2020 | | | | 1,430,000 | | | | 1,669,425 | |
Upper Mohawk Valley NY Regional Water Finance Authority Series A (Water & Sewer Revenue, Assured Guaranty Insured) | | | 5.00 | | | | 04/01/2018 | | | | 1,000,000 | | | | 1,124,960 | |
Yonkers NY (Miscellaneous Revenue, AGM Insured) | | | 5.00 | | | | 10/01/2024 | | | | 1,000,000 | | | | 1,081,720 | |
| | | | |
| | | | | | | | | | | | | | | 46,704,345 | |
| | | | | | | | | | | | | | | | |
| | | | |
| North Carolina: 0.81% | | | | | | | | | | | | | | | | |
Charlotte NC COP Series E (Lease Revenue) | | | 4.00 | | | | 06/01/2017 | | | | 90,000 | | | | 102,417 | |
Craven County NC COP (Lease Revenue, NATL-RE Insured) | | | 5.00 | | | | 06/01/2023 | | | | 4,400,000 | | | | 4,887,256 | |
Nash NC Health Care System (Health Revenue, AGM Insured) | | | 5.00 | | | | 11/01/2014 | | | | 1,600,000 | | | | 1,746,016 | |
North Carolina Eastern Municipal Power Agency Series B (Utilities Revenue) | | | 5.00 | | | | 01/01/2017 | | | | 1,000,000 | | | | 1,167,560 | |
North Carolina Eastern Municipal Power Agency Unrefunded Balance Series B (Utilities Revenue, FGIC Insured) | | | 5.50 | | | | 01/01/2017 | | | | 95,000 | | | | 95,313 | |
Pitt County NC COP School Facilities Project (Lease Revenue, NATL-RE Insured) | | | 5.00 | | | | 04/01/2023 | | | | 2,755,000 | | | | 3,053,008 | |
| | | | |
| | | | | | | | | | | | | | | 11,051,570 | |
| | | | | | | | | | | | | | | | |
| | | | |
| North Dakota: 0.20% | | | | | | | | | | | | | | | | |
Mercer County ND PCR Antelope Valley Station (Utilities Revenue, AMBAC Insured) | | | 7.20 | | | | 06/30/2013 | | | | 815,000 | | | | 845,196 | |
North Dakota State Housing Finance Agency Series D (Housing Revenue) | | | 4.50 | | | | 01/01/2029 | | | | 1,755,000 | | | | 1,873,708 | |
| | | | |
| | | | | | | | | | | | | | | 2,718,904 | |
| | | | | | | | | | | | | | | | |
| | | | |
| Ohio: 0.60% | | | | | | | | | | | | | | | | |
Akron Bath Copley OH Joint Township Akron General Health Systems Series A (Health Revenue) | | | 5.00 | | | | 01/01/2014 | | | | 500,000 | | | | 519,295 | |
| | | | |
| 22 | | Wells Fargo Advantage Intermediate Tax/AMT-Free Fund | | Portfolio of Investments—December 31, 2011 (Unaudited) |
| | | | | | | | | | | | | | | | |
| Security Name | | Interest Rate | | | Maturity Date | | | Principal | | | Value | |
| | | | | | | | | | | | | | | | |
| | | | |
| Ohio (continued) | | | | | | | | | | | | | | | | |
American Municipal Power OH Incorporated Hydroelec Project Series C (Utilities Revenue) | | | 5.25 | % | | | 02/15/2019 | | | $ | 2,570,000 | | | $ | 3,056,989 | |
Kent OH State University General Receipts Series B (Education Revenue, Assured Guaranty Insured) | | | 5.00 | | | | 05/01/2018 | | | | 1,165,000 | | | | 1,379,908 | |
Ohio State Building Authority (Lease Revenue) | | | 5.00 | | | | 10/01/2024 | | | | 1,000,000 | | | | 1,142,700 | |
River South OH Authority Lazarus Building Redevelopment Series A (Lease Revenue) | | | 5.75 | | | | 12/01/2027 | | | | 950,000 | | | | 885,714 | |
Summit County OH Port Authority (Port Authority Revenue) | | | 5.25 | | | | 01/01/2024 | | | | 1,000,000 | | | | 1,130,850 | |
| | | | |
| | | | | | | | | | | | | | | 8,115,456 | |
| | | | | | | | | | | | | | | | |
| | | | |
| Oklahoma: 0.23% | | | | | | | | | | | | | | | | |
McClain County OK EDA Blanchard Public Schools Project (Lease Revenue) | | | 4.50 | | | | 09/01/2016 | | | | 400,000 | | | | 442,796 | |
McClain County OK EDA Newcastle Public Schools Project (Lease Revenue) | | | 5.00 | | | | 09/01/2012 | | | | 350,000 | | | | 358,596 | |
McGee Creek OK Authority (Water Sewer Revenue, NATL-RE Insured) | | | 6.00 | | | | 01/01/2023 | | | | 1,970,000 | | | | 2,259,787 | |
| | | | |
| | | | | | | | | | | | | | | 3,061,179 | |
| | | | | | | | | | | | | | | | |
| | | | |
| Pennsylvania: 4.95% | | | | | | | | | | | | | | | | |
Adams County PA IDA Gettysburg College Project (Education Revenue) | | | 5.00 | | | | 08/15/2024 | | | | 1,500,000 | | | | 1,684,605 | |
Adams County PA IDA Gettysburg College Project (Education Revenue) | | | 5.00 | | | | 08/15/2025 | | | | 1,500,000 | | | | 1,662,675 | |
Allegheny County PA Hospital Development Authority University of Pittsburgh Medical Center Series A-1 (Health Revenue)±§ | | | 1.01 | | | | 02/01/2021 | | | | 10,000,000 | | | | 9,112,800 | |
Allegheny County PA Series C-59B (Tax Revenue, AGM Insured)±§ | | | 0.84 | | | | 11/01/2026 | | | | 3,000,000 | | | | 2,380,830 | |
Beaver County PA IDA PCR First Energy Series B (IDR)±§ | | | 3.00 | | | | 10/01/2047 | | | | 2,600,000 | | | | 2,610,036 | |
Bucks County PA Water and Sewer Authority (Water & Sewer Revenue) | | | 5.00 | | | | 12/01/2026 | | | | 2,400,000 | | | | 2,712,336 | |
Chester County PA Avon Grove Charter School Project Series A (Miscellaneous Revenue) | | | 5.65 | | | | 12/15/2017 | | | | 695,000 | | | | 703,451 | |
Chester County PA IDA Renaissance Academy Project Series A (Miscellaneous Revenue) | | | 5.63 | | | | 10/01/2015 | | | | 295,000 | | | | 294,973 | |
Delaware County PA IDA Resource Recovery Facility Series A (Resource Recovery Revenue) | | | 6.10 | | | | 07/01/2013 | | | | 930,000 | | | | 933,218 | |
Harrisburg PA Authority Resource Recovery Facility Series D-1 (Resource Recovery Revenue, AGM Insured)±§ | | | 5.25 | | | | 12/01/2033 | | | | 5,000,000 | | | | 4,980,150 | |
Harrisburg PA Authority Resources Guaranteed Subordinated Series D-2 (Resource Recovery Revenue, AGM Insured)±§ | | | 5.00 | | | | 12/01/2033 | | | | 3,975,000 | | | | 3,968,243 | |
Johnstown PA School District (Miscellaneous Revenue) | | | 5.00 | | | | 08/01/2024 | | | | 2,730,000 | | | | 3,035,105 | |
Lycoming County PA College Authority (Education Revenue) | | | 5.50 | | | | 07/01/2026 | | | | 3,000,000 | | | | 3,370,500 | |
Millcreek Richland Joint Authority Pennsylvania Series B (Water & Sewer Revenue, Radian Municipal Government Guaranty Insured) | | | 4.70 | | | | 08/01/2017 | | | | 565,000 | | | | 607,607 | |
Northampton County PA General Purpose Hospital Authority Saint Lukes Hospital Project Series C (Health Revenue)±§ | | | 4.50 | | | | 08/15/2032 | | | | 1,170,000 | | | | 1,259,482 | |
Pennsylvania State EDFA Waste Management Project (Resource Recovery Revenue)±§ | | | 2.63 | | | | 12/01/2033 | | | | 1,500,000 | | | | 1,520,160 | |
Pennsylvania State Turnpike Commission (Tax Revenue) | | | 5.00 | | | | 06/01/2017 | | | | 325,000 | | | | 374,475 | |
Pennsylvania State Turnpike Commission Series C (Transportation Revenue)±§ | | | 1.15 | | | | 12/01/2014 | | | | 5,000,000 | | | | 5,040,100 | |
Philadelphia PA Authority for Industrial Development (Miscellaneous Revenue) | | | 7.00 | | | | 05/01/2026 | | | | 740,000 | | | | 757,708 | |
Philadelphia PA Eighteenth Series AGC (Energy Revenue, Assured Guaranty Insured) | | | 5.25 | | | | 08/01/2016 | | | | 895,000 | | | | 969,849 | |
Philadelphia PA Gas Works 1998 General Ordinance Series A (Utilities Revenue) | | | 5.00 | | | | 08/01/2015 | | | | 1,000,000 | | | | 1,095,560 | |
Philadelphia PA Gas Works 1998 General Ordinance Series A (Energy Revenue) | | | 5.00 | | | | 08/01/2016 | | | | 1,000,000 | | | | 1,112,300 | |
| | | | | | |
| Portfolio of Investments—December 31, 2011 (Unaudited) | | Wells Fargo Advantage Intermediate Tax/AMT-Free Fund | | | 23 | |
| | | | | | | | | | | | | | | | |
| Security Name | | Interest Rate | | | Maturity Date | | | Principal | | | Value | |
| | | | | | | | | | | | | | | | |
| | | | |
| Pennsylvania (continued) | | | | | | | | | | | | | | | | |
Philadelphia PA Gas Works Revenue Refunding 8th-1998 General Ordinance Series A (Energy Revenue) | | | 5.25 | % | | | 08/01/2017 | | | $ | 1,225,000 | | | $ | 1,390,289 | |
Philadelphia PA IDA First Philadelphia Charter High Series A (Miscellaneous Revenue) | | | 5.30 | | | | 08/15/2017 | | | | 955,000 | | | | 966,976 | |
Philadelphia PA IDA West Philadelphia Achievement Charter Elementary School Project (Miscellaneous Revenue) | | | 5.00 | | | | 05/01/2016 | | | | 360,000 | | | | 359,420 | |
Philadelphia PA IDA West Philadelphia Achievement Charter Elementary School Project (Miscellaneous Revenue) | | | 6.25 | | | | 05/01/2021 | | | | 285,000 | | | | 290,213 | |
Philadelphia PA IDR Master Charter School (Miscellaneous Revenue) | | | 5.00 | | | | 08/01/2020 | | | | 840,000 | | | | 866,914 | |
Philadelphia PA School District (Education Revenue) | | | 5.00 | | | | 09/01/2021 | | | | 2,200,000 | | | | 2,519,132 | |
Philadelphia PA School District Refunding Series 2010C (Tax Revenue, State Aid Withholding Insured) | | | 5.00 | | | | 09/01/2018 | | | | 6,000,000 | | | | 6,821,220 | |
Reading PA School District (Education Revenue, State Aid Withholding Insured) | | | 5.00 | | | | 04/01/2021 | | | | 3,295,000 | | | | 3,787,372 | |
| | | | |
| | | | | | | | | | | | | | | 67,187,699 | |
| | | | | | | | | | | | | | | | |
| | | | |
| Puerto Rico: 0.84% | | | | | | | | | | | | | | | | |
Puerto Rico Electric Power Authority Series UU (Utilities Revenue, AGM Insured)±§ | | | 0.77 | | | | 07/01/2029 | | | | 4,000,000 | | | | 2,595,400 | |
Puerto Rico Electric Power Authority Series ZZ (Utilities Revenue) | | | 5.25 | | | | 07/01/2019 | | | | 3,000,000 | | | | 3,418,050 | |
Puerto Rico HFA Sub-Capital Fund Modernization (Housing Revenue) | | | 5.50 | | | | 12/01/2017 | | | | 2,000,000 | | | | 2,288,180 | |
Puerto Rico Highway Transportation (Transportation Revenue) | | | 4.95 | | | | 07/01/2026 | | | | 2,940,000 | | | | 3,074,887 | |
| | | | |
| | | | | | | | | | | | | | | 11,376,517 | |
| | | | | | | | | | | | | | | | |
| | | | |
| Rhode Island: 0.53% | | | | | | | | | | | | | | | | |
Providence RI Series A (Tax Revenue, AGM Insured) | | | 4.00 | | | | 01/15/2018 | | | | 2,115,000 | | | | 2,276,226 | |
Rhode Island Health & Educational Building Corporation Providence Public Schools Financing Program Series A (Miscellaneous Revenue, AGM Insured) | | | 5.00 | | | | 05/15/2015 | | | | 2,060,000 | | | | 2,251,498 | |
Rhode Island Health & Educational Building Corporation Providence Public Schools Financing Program Series A (Miscellaneous Revenue, AGM Insured) | | | 5.00 | | | | 05/15/2022 | | | | 2,425,000 | | | | 2,608,112 | |
| | | | |
| | | | | | | | | | | | | | | 7,135,836 | |
| | | | | | | | | | | | | | | | |
| | | | |
| South Carolina: 1.67% | | | | | | | | | | | | | | | | |
Berkeley County SC Pollution Control Facilities Generating Company Project (Utilities Revenue) | | | 4.88 | | | | 10/01/2014 | | | | 1,000,000 | | | | 1,064,220 | |
Connector 2000 Association Incorporated CAB Series A (Transportation Revenue)(z) | | | 0.00 | | | | 01/01/2012 | | | | 12,297 | | | | 12,297 | |
Connector 2000 Association Incorporated CAB Series A (Transportation Revenue)(z) | | | 8.03 | | | | 01/01/2013 | | | | 21,103 | | | | 19,506 | |
Connector 2000 Association Incorporated CAB Series A (Transportation Revenue)(z) | | | 8.61 | | | | 01/01/2014 | | | | 22,075 | | | | 18,664 | |
Connector 2000 Association Incorporated CAB Series A (Transportation Revenue)(z) | | | 9.40 | | | | 01/01/2015 | | | | 23,869 | | | | 18,154 | |
Connector 2000 Association Incorporated CAB Series A (Transportation Revenue)(z) | | | 9.52 | | | | 07/22/2051 | | | | 133,365 | | | | 3,470 | |
Connector 2000 Association Incorporated CAB Series A (Transportation Revenue)(z) | | | 9.66 | | | | 01/01/2042 | | | | 230,675 | | | | 13,944 | |
Connector 2000 Association Incorporated CAB Series A (Transportation Revenue)(z) | | | 10.47 | | | | 01/01/2032 | | | | 297,803 | | | | 39,507 | |
Connector 2000 Association Incorporated CAB Series A (Transportation Revenue)(z) | | | 14.03 | | | | 01/01/2022 | | | | 59,087 | | | | 15,591 | |
Connector 2000 Association Incorporated CAB Series A (Transportation Revenue)(z) | | | 14.91 | | | | 01/01/2021 | | | | 55,876 | | | | 15,694 | |
| | | | |
| 24 | | Wells Fargo Advantage Intermediate Tax/AMT-Free Fund | | Portfolio of Investments—December 31, 2011 (Unaudited) |
| | | | | | | | | | | | | | | | |
| Security Name | | Interest Rate | | | Maturity Date | | | Principal | | | Value | |
| | | | | | | | | | | | | | | | |
| | | | |
| South Carolina (continued) | | | | | | | | | | | | | | | | |
Connector 2000 Association Incorporated CAB Series A (Transportation Revenue)(z) | | | 15.74 | % | | | 01/01/2020 | | | $ | 47,106 | | | $ | 14,376 | |
Connector 2000 Association Incorporated CAB Series A (Transportation Revenue)(z) | | | 17.14 | | | | 01/01/2019 | | | | 43,307 | | | | 14,072 | |
Connector 2000 Association Incorporated CAB Series A (Transportation Revenue)(z) | | | 18.71 | | | | 01/01/2018 | | | | 39,781 | | | | 13,996 | |
Connector 2000 Association Incorporated CAB Series A (Transportation Revenue)(z) | | | 20.68 | | | | 01/01/2017 | | | | 35,996 | | | | 13,860 | |
Connector 2000 Association Incorporated CAB Series A (Transportation Revenue)(z) | | | 24.14 | | | | 01/01/2016 | | | | 26,606 | | | | 11,057 | |
Connector 2000 Association Incorporated CAB Series B (Transportation Revenue)(z) | | | 12.68 | | | | 07/22/2051 | | | | 51,744 | | | | 429 | |
Connector 2000 Association Incorporated CAB Series B (Transportation Revenue)(z) | | | 15.54 | | | | 01/01/2032 | | | | 102,842 | | | | 5,486 | |
Kershaw County SC Public Schools Foundation Installment Power Revenue (Lease Revenue, CIFC Insured) | | | 5.00 | | | | 12/01/2020 | | | | 1,000,000 | | | | 1,089,720 | |
Lee County SC School Facilities Incorporated Series 2006 (Lease Revenue, Radian Insured) | | | 6.00 | | | | 12/01/2016 | | | | 740,000 | | | | 831,804 | |
McCormick County SC Health Care Center Project Prerefunded (Health Revenue) | | | 8.00 | | | | 03/01/2019 | | | | 1,255,000 | | | | 1,448,270 | |
Piedmont SC Municipal Power Agency Series A-3 (Utilities Revenue) | | | 5.25 | | | | 01/01/2019 | | | | 3,500,000 | | | | 4,099,375 | |
South Carolina Education Assistance Authority Student Loan Series I (Education Revenue) | | | 5.00 | | | | 10/01/2024 | | | | 3,210,000 | | | | 3,446,320 | |
South Carolina Jobs EDA Palmetto Health (Health Revenue)±§ | | | 0.85 | | | | 08/01/2039 | | | | 1,980,000 | | | | 1,952,498 | |
South Carolina Transportation Infrastructure Series A (Miscellaneous Revenue, XLCA Insured) | | | 5.00 | | | | 10/01/2022 | | | | 6,450,000 | | | | 7,029,984 | |
South Carolina Transportation Infrastructure Series A (Miscellaneous Revenue, AMBAC Insured) | | | 5.25 | | | | 10/01/2022 | | | | 1,000,000 | | | | 1,090,530 | |
Tobacco Settlement Revenue Management Authority South Carolina (Tobacco Revenue) | | | 5.00 | | | | 06/01/2018 | | | | 390,000 | | | | 390,437 | |
| | | | |
| | | | | | | | | | | | | | | 22,673,261 | |
| | | | | | | | | | | | | | | | |
| | | | |
| South Dakota: 0.11% | | | | | | | | | | | | | | | | |
Lower Brule Sioux Tribe South Dakota Series B (Tax Revenue) | | | 5.25 | | | | 05/01/2015 | | | | 500,000 | | | | 452,495 | |
Rapid City SD Airport Project (Port Authority Revenue) | | | 6.25 | | | | 12/01/2026 | | | | 920,000 | | | | 1,014,309 | |
| | | | |
| | | | | | | | | | | | | | | 1,466,804 | |
| | | | | | | | | | | | | | | | |
| | | | |
| Tennessee: 1.92% | | | | | | | | | | | | | | | | |
Lewisburg TN Industrial Development Board Waste Management Incorporated Project (Resource Recovery Revenue)±§ | | | 2.50 | | | | 07/01/2012 | | | | 1,250,000 | | | | 1,254,488 | |
Shelby County TN Health Educational & Housing Facilities Board Le Bonheur Children’s Medical Center Series D (Health Revenue, NATL-RE Insured) | | | 5.50 | | | | 08/15/2019 | | | | 725,000 | | | | 853,949 | |
Tennessee Energy Acquisition Corporation Series A (Energy Revenue) | | | 5.00 | | | | 09/01/2016 | | | | 2,000,000 | | | | 2,038,280 | |
Tennessee Energy Acquisition Corporation Series A (Energy Revenue) | | | 5.25 | | | | 09/01/2017 | | | | 3,140,000 | | | | 3,222,205 | |
Tennessee Energy Acquisition Corporation Series A (Energy Revenue) | | | 5.25 | | | | 09/01/2018 | | | | 1,000,000 | | | | 1,017,360 | |
Tennessee Energy Acquisition Corporation Series C (Utilities Revenue) | | | 5.00 | | | | 02/01/2015 | | | | 1,165,000 | | | | 1,194,777 | |
Tennessee Energy Acquisition Corporation Series C (Energy Revenue) | | | 5.00 | | | | 02/01/2016 | | | | 1,820,000 | | | | 1,870,305 | |
Tennessee Energy Acquisition Corporation Series C (Energy Revenue) | | | 5.00 | | | | 02/01/2019 | | | | 8,030,000 | | | | 8,020,203 | |
Tennessee Energy Acquisition Corporation Series C (Energy Revenue) | | | 5.00 | | | | 02/01/2020 | | | | 6,650,000 | | | | 6,601,721 | |
| | | | |
| | | | | | | | | | | | | | | 26,073,288 | |
| | | | | | | | | | | | | | | | |
| | | | | | |
| Portfolio of Investments—December 31, 2011 (Unaudited) | | Wells Fargo Advantage Intermediate Tax/AMT-Free Fund | | | 25 | |
| | | | | | | | | | | | | | | | |
| Security Name | | Interest Rate | | | Maturity Date | | | Principal | | | Value | |
| | | | | | | | | | | | | | | | |
| | | | |
| Texas: 6.90% | | | | | | | | | | | | | | | | |
Arlington TX Special Obligation Dallas Cowboys Series A (Tax Revenue, NATL-RE Insured) | | | 5.00 | % | | | 08/15/2034 | | | $ | 3,425,000 | | | $ | 3,564,911 | |
Austin TX Electric Utilities Systems (Utilities Revenue) | | | 5.00 | | | | 11/15/2024 | | | | 1,370,000 | | | | 1,567,705 | |
Central Texas Regional Mobility Authority (Transportation Revenue) | | | 5.75 | | | | 01/01/2019 | | | | 1,310,000 | | | | 1,427,939 | |
Dallas Fort Worth TX International Dallas Airport (Airport Revenue) | | | 5.00 | | | | 11/01/2022 | | | | 1,230,000 | | | | 1,363,357 | |
Eagle Pass TX International Bridges (Miscellaneous Revenue, AMBAC Insured) | | | 5.25 | | | | 02/15/2014 | | | | 1,640,000 | | | | 1,689,577 | |
Galveston TX Wharves & Terminal (Port Revenue) | | | 5.00 | | | | 02/01/2026 | | | | 2,000,000 | | | | 2,046,840 | |
Garza County TX Public Facilities Corporation (Lease Revenue) | | | 5.25 | | | | 10/01/2014 | | | | 1,000,000 | | | | 1,040,690 | |
Garza County TX Public Facilities Corporation (Lease Revenue) | | | 5.50 | | | | 10/01/2016 | | | | 1,000,000 | | | | 1,057,620 | |
Harris County TX Flood Control District (Utilities Revenue) | | | 5.00 | | | | 10/01/2023 | | | | 530,000 | | | | 615,844 | |
Harris County TX Toll Road Project Series C (Tax Revenue, AGM Insured) | | | 5.25 | | | | 08/15/2027 | | | | 4,000,000 | | | | 4,957,240 | |
Houston TX Airport Senior Lien Series A (Port Authority Revenue) | | | 5.00 | | | | 07/01/2025 | | | | 1,000,000 | | | | 1,099,380 | |
Houston TX Utilities Systems Series A (Water & Sewer Revenue) | | | 5.25 | | | | 11/15/2031 | | | | 3,000,000 | | | | 3,377,940 | |
Midtown TX Redevelopment Authority (Tax Revenue, AMBAC Insured) | | | 5.00 | | | | 01/01/2020 | | | | 1,495,000 | | | | 1,577,165 | |
North Texas Health Facilities Development Corporation United Regional Health Care System (Health Revenue, AGM Insured) | | | 5.00 | | | | 09/01/2016 | | | | 1,135,000 | | | | 1,281,880 | |
North Texas Higher Education Authority Incoming Student Loan Series A-2 (Education Revenue)±§ | | | 1.27 | | | | 07/01/2030 | | | | 10,395,000 | | | | 10,248,950 | |
Round Rock TX Transportation Systems Development Corporation (Tax Revenue, NATL-RE Insured) | | | 4.50 | | | | 08/15/2020 | | | | 1,000,000 | | | | 1,065,980 | |
SA Energy Acquisition Public Facility Corporation Texas (Energy Revenue) | | | 5.25 | | | | 08/01/2016 | | | | 1,000,000 | | | | 1,034,660 | |
SA Energy Acquisition Public Facility Corporation Texas (Energy Revenue) | | | 5.50 | | | | 08/01/2019 | | | | 1,450,000 | | | | 1,507,391 | |
SA Energy Acquisition Public Facility Corporation Texas (Energy Revenue) | | | 5.25 | | | | 08/01/2015 | | | | 1,265,000 | | | | 1,314,892 | |
Texas Municipal Gas Acquisition & Supply Corporation Senior Lien Series D (Energy Revenue) | | | 5.63 | | | | 12/15/2017 | | | | 12,905,000 | | | | 13,733,114 | |
Texas Municipal Gas Acquisition & Supply Corporation Series A (Utilities Revenue)±§ | | | 1.07 | | | | 09/15/2017 | | | | 6,170,000 | | | | 5,868,410 | |
Texas Municipal Gas Acquisition & Supply Corporation Series B (Utilities Revenue)±§ | | | 0.57 | | | | 09/15/2017 | | | | 9,550,000 | | | | 9,097,617 | |
Texas Municipal Gas Acquisition & Supply Corporation Series D (Energy Revenue) | | | 6.25 | | | | 12/15/2026 | | | | 2,500,000 | | | | 2,718,775 | |
Texas Municipal Gas Acquisition & Supply Corporation Sub Lien Series C (Energy Revenue)±§ | | | 1.82 | | | | 12/15/2026 | | | | 735,000 | | | | 507,231 | |
Texas Private Activity Surface Transportation Corporation LBJ Infrastructure Project (Transportation Revenue) | | | 7.50 | | | | 06/30/2032 | | | | 2,000,000 | | | | 2,250,640 | |
Texas Private Activity Surface Transportation Corporation LBJ Infrastructure Project (Transportation Revenue) | | | 7.50 | | | | 06/30/2033 | | | | 2,000,000 | | | | 2,262,900 | |
Texas Private Activity Surface Transportation Corporation Senior Lien Note Mobility (Transportation Revenue) | | | 7.50 | | | | 12/31/2031 | | | | 3,500,000 | | | | 3,932,495 | |
Texas State PFA Charter School Kipp Incorporated Series A (Miscellaneous Revenue, ACA Insured) | | | 4.50 | | | | 02/15/2016 | | | | 855,000 | | | | 877,982 | |
Texas State PFA Cosmos Foundation Series A (Lease Revenue) | | | 5.00 | | | | 02/15/2018 | | | | 860,000 | | | | 872,866 | |
Texas State PFA Uplift Education Series A (Miscellaneous Revenue) | | | 5.00 | | | | 12/01/2012 | | | | 150,000 | | | | 152,382 | |
Tomball TX Independent School District Refunding School Building (Tax Revenue, PSF-GTD Insured)(z) | | | 1.07 | | | | 02/15/2015 | | | | 825,000 | | | | 797,668 | |
University of Houston Texas (Education Revenue) | | | 5.00 | | | | 02/15/2024 | | | | 2,600,000 | | | | 2,954,302 | |
University of Houston Texas Series B (Education Revenue) | | | 5.25 | | | | 07/01/2026 | | | | 3,625,000 | | | | 4,718,046 | |
Waco TX Health Facilities Development Corporation Hillcrest System Project Series A (Health Revenue, NATL-RE FHA Insured) | | | 5.00 | | | | 08/01/2016 | | | | 920,000 | | | | 1,006,940 | |
| | | | |
| | | | | | | | | | | | | | | 93,591,329 | |
| | | | | | | | | | | | | | | | |
| | | | |
| 26 | | Wells Fargo Advantage Intermediate Tax/AMT-Free Fund | | Portfolio of Investments—December 31, 2011 (Unaudited) |
| | | | | | | | | | | | | | | | |
| Security Name | | Interest Rate | | | Maturity Date | | | Principal | | | Value | |
| | | | | | | | | | | | | | | | |
| | | | |
| Utah: 0.43% | | | | | | | | | | | | | | | | |
Intermountain Power Agency Utah Series A (Utilities Revenue, AGM Insured) | | | 5.00 | % | | | 07/01/2018 | | | $ | 3,700,000 | | | $ | 3,932,249 | |
Utah County UT Lakeview Academy Series A (Miscellaneous Revenue) | | | 5.35 | | | | 07/15/2017 | | | | 775,000 | | | | 760,802 | |
Utah County UT Lincoln Academy Series A (Miscellaneous Revenue) 144A | | | 5.45 | | | | 06/15/2017 | | | | 340,000 | | | | 334,645 | |
West Valley City UT Charter School Monticello Academy (Miscellaneous Revenue) 144A | | | 6.38 | | | | 06/01/2037 | | | | 970,000 | | | | 838,507 | |
| | | | |
| | | | | | | | | | | | | | | 5,866,203 | |
| | | | | | | | | | | | | | | | |
| | | | |
| Vermont: 0.14% | | | | | | | | | | | | | | | | |
Burlington VT Airport Authority (Miscellaneous Revenue) | | | 6.50 | | | | 12/15/2012 | | | | 1,900,000 | | | | 1,900,988 | |
| | | | | | | | | | | | | | | | |
| | | | |
| Virgin Islands: 1.23% | | | | | | | | | | | | | | | | |
Virgin Islands PFA (Tax Revenue) | | | 5.25 | | | | 10/01/2029 | | | | 2,040,000 | | | | 2,096,018 | |
Virgin Islands PFA (Miscellaneous Revenue) | | | 6.75 | | | | 10/01/2019 | | | | 3,000,000 | | | | 3,357,000 | |
Virgin Islands PFA Matching Fund Loan Diago Series A (Miscellaneous Revenue) | | | 6.00 | | | | 10/01/2014 | | | | 500,000 | | | | 543,120 | |
Virgin Islands PFA Sub Lien Series C (Miscellaneous Revenue) | | | 5.00 | | | | 10/01/2017 | | | | 5,000,000 | | | | 5,503,700 | |
Virgin Islands PFA Sub Matching Fund Loan Series A (Tax Revenue) | | | 5.00 | | | | 10/01/2025 | | | | 5,000,000 | | | | 5,211,950 | |
| | | | |
| | | | | | | | | | | | | | | 16,711,788 | |
| | | | | | | | | | | | | | | | |
| | | | |
| Virginia: 0.25% | | | | | | | | | | | | | | | | |
Marquis VA CDA (Miscellaneous Revenue)(i) | | | 5.63 | | | | 09/01/2018 | | | | 1,800,000 | | | | 1,306,080 | |
Reynolds Crossing VA CDA Reynolds Crossing Project (Miscellaneous Revenue) | | | 5.10 | | | | 03/01/2021 | | | | 744,000 | | | | 744,246 | |
Virginia State College Building Authority Regent University Project (Education Revenue) | | | 5.00 | | | | 06/01/2013 | | | | 55,000 | | | | 57,360 | |
Virginia State College Building Authority Regent University Project (Education Revenue) | | | 5.00 | | | | 06/01/2015 | | | | 210,000 | | | | 226,241 | |
Watkins Centre VA CDA (Miscellaneous Revenue) | | | 5.40 | | | | 03/01/2020 | | | | 1,070,000 | | | | 1,085,141 | |
| | | | |
| | | | | | | | | | | | | | | 3,419,068 | |
| | | | | | | | | | | | | | | | |
| | | | |
| Washington: 0.99% | | | | | | | | | | | | | | | | |
Goat Hill Properties Washington Government Office Building Project (Lease Revenue, NATL-RE County Guaranty Insured) | | | 5.00 | | | | 12/01/2021 | | | | 1,410,000 | | | | 1,513,973 | |
Grant County WA Public Utility District # 2 Priest Rapids Series A (Utilities Revenue, NATL-RE FGIC Insured) | | | 5.00 | | | | 01/01/2023 | | | | 345,000 | | | | 383,078 | |
TES Properties Washington (Lease Revenue) | | | 5.00 | | | | 12/01/2024 | | | | 1,480,000 | | | | 1,647,432 | |
TES Properties Washington (Lease Revenue) | | | 5.50 | | | | 12/01/2029 | | | | 1,400,000 | | | | 1,544,004 | |
Washington State HEFAR Pacific Lutheran University (Education Revenue, Radian Insured) | | | 5.00 | | | | 11/01/2013 | | | | 800,000 | | | | 833,592 | |
Washington State HEFAR Pacific Lutheran University (Education Revenue, Radian Insured) | | | 5.00 | | | | 11/01/2014 | | | | 1,105,000 | | | | 1,165,234 | |
Washington State HEFAR Whitworth University Project (Education Revenue, US Bank NA Insured) | | | 5.00 | | | | 10/01/2015 | | | | 1,010,000 | | | | 1,091,588 | |
Washington Tobacco Settlement Authority (Tobacco Revenue) | | | 5.50 | | | | 06/01/2012 | | | | 250,000 | | | | 253,843 | |
Washington Tobacco Settlement Authority (Tobacco Revenue) | | | 6.50 | | | | 06/01/2026 | | | | 4,835,000 | | | | 4,948,913 | |
| | | | |
| | | | | | | | | | | | | | | 13,381,657 | |
| | | | | | | | | | | | | | | | |
| | | | |
| West Virginia: 0.25% | | | | | | | | | | | | | | | | |
West Virginia EDA PCR Appalachian Power Company Amos Series C (Utilities Revenue)±§ | | | 4.85 | | | | 05/01/2019 | | | | 2,000,000 | | | | 2,101,820 | |
West Virginia School Building Authority (Miscellaneous Revenue) | | | 5.25 | | | | 07/01/2020 | | | | 1,100,000 | | | | 1,308,483 | |
| | | | |
| | | | | | | | | | | | | | | 3,410,303 | |
| | | | | | | | | | | | | | | | |
| | | | | | |
| Portfolio of Investments—December 31, 2011 (Unaudited) | | Wells Fargo Advantage Intermediate Tax/AMT-Free Fund | | | 27 | |
| | | | | | | | | | | | | | | | |
| Security Name | | Interest Rate | | | Maturity Date | | | Principal | | | Value | |
| | | | | | | | | | | | | | | | |
| | | | |
| Wisconsin: 0.72% | | | | | | | | | | | | | | | | |
Kenosha WI Unified School District #1 Series A (Tax Revenue) | | | 4.50 | % | | | 04/01/2015 | | | $ | 1,620,000 | | | $ | 1,780,364 | |
Wisconsin HEFA Mercy Alliance Incorporated Project Series A (Health Revenue) | | | 5.00 | | | | 06/01/2019 | | | | 3,000,000 | | | | 3,163,680 | |
Wisconsin Housing & EDA Series E (Housing Revenue, GO of Authority Insured) | | | 4.00 | | | | 05/01/2013 | | | | 20,000 | | | | 20,734 | |
Wisconsin Housing & EDA Series E (Housing Revenue, GO of Authority Insured) | | | 4.15 | | | | 05/01/2015 | | | | 210,000 | | | | 225,038 | |
Wisconsin State HEFA (Health Revenue, AMBAC Insured) | | | 5.50 | | | | 02/15/2019 | | | | 1,000,000 | | | | 1,106,770 | |
Wisconsin State HEFA Bell Tower Residence Project (Health Revenue, Allied Irish Bank plc LOC) | | | 4.75 | | | | 07/01/2015 | | | | 890,000 | | | | 941,122 | |
Wisconsin State HEFA Series M (Health Revenue, NATL-RE Insured)(a)±§(m)(n) | | | 0.46 | | | | 06/01/2019 | | | | 2,650,000 | | | | 2,518,025 | |
| | | | |
| | | | | | | | | | | | | | | 9,755,733 | |
| | | | | | | | | | | | | | | | |
| | | |
Total Municipal Bonds and Notes (Cost $1,242,595,974) | | | | | | | | | | | | 1,301,788,676 | |
| | | | | | | | | | | | | | | | |
| | | | |
| | | Yield | | | | | | Shares | | | | |
| Short-Term Investments: 0.47% | | | | | | | | | | | | | |
| | | | |
| Investment Companies: 0.47% | | | | | | | | | | | | | | | | |
Wells Fargo Advantage National Tax-Free Money Market Fund, Institutional Class(l)(u) | | | 0.01 | | | | | | | | 6,421,816 | | | | 6,421,816 | |
| | | | | | | | | | | | | | | | |
| | | |
Total Short-Term Investments (Cost $6,421,816) | | | | | | | | | | | | 6,421,816 | |
| | | | | | | | | | | | | | | | |
| | | | | | | | |
| Total Investments in Securities | | | | | | | | |
| (Cost $1,249,017,790)* | | | 96.42 | % | | | 1,308,210,492 | |
Other Assets and Liabilities, Net | | | 3.58 | | | | 48,528,100 | |
| | | | | | | | |
Total Net Assets | | | 100.00 | % | | $ | 1,356,738,592 | |
| | | | | | | | |
| (a) | Security is fair valued by the Management Valuation Team, and in certain instances by the Board of Trustees, in accordance with procedures approved by the Board of Trustees. |
| ± | Variable rate investment. |
| § | These securities are subject to a demand feature which reduces the effective maturity. |
| (s) | Security is currently in default with regards to scheduled interest and/or principal payments. The Fund has stopped accruing interest on this security. |
| (m) | An auction-rate security whose interest rate resets at predetermined short-term intervals through a Dutch auction; rate shown represents the rate in effect at period-end. |
| (n) | Auction to set interest rate on security failed at period end due to insufficient investor interest; failed auction does not itself cause a default. |
| 144A | Security that may be resold to “qualified institutional buyers” under Rule 144A or security offered pursuant to Section 4(2) of the Securities Act of 1933, as amended. |
| (z) | Zero coupon security. Rate represents yield to maturity. |
| (l) | Investment in an affiliate. |
| (u) | Rate shown is the 7-day annualized yield at period end. |
| * | Cost for federal income tax purposes is $1,246,991,607 and net unrealized appreciation (depreciation) consists of: |
| | | | |
Gross unrealized appreciation | | $ | 68,843,585 | |
Gross unrealized depreciation | | | (7,624,700 | ) |
| | | | |
Net unrealized appreciation | | $ | 61,218,885 | |
The accompanying notes are an integral part of these financial statements.
| | | | |
| 28 | | Wells Fargo Advantage Intermediate Tax/AMT-Free Fund | | Statement of Assets and Liabilities—December 31, 2011 (Unaudited) |
| | | | |
| | | | |
| |
Assets | | | | |
Investments | | | | |
In unaffiliated securities, at value | | $ | 1,301,788,676 | |
In affiliated securities, at value | | | 6,421,816 | |
| | | | |
Total investments, at value (see cost below) | | | 1,308,210,492 | |
Cash | | | 131,250 | |
Receivable for investments sold | | | 31,642,064 | |
Receivable for Fund shares sold | | | 6,477,043 | |
Receivable for interest | | | 15,015,948 | |
Prepaid expenses and other assets | | | 106,972 | |
| | | | |
Total assets | | | 1,361,583,769 | |
| | | | |
| |
Liabilities | | | | |
Distributions payable | | | 1,325,705 | |
Payable for investments purchased | | | 312,526 | |
Payable for Fund shares redeemed | | | 2,370,388 | |
Advisory fee payable | | | 258,514 | |
Distribution fees payable | | | 36,869 | |
Due to other related parties | | | 224,662 | |
Accrued expenses and other liabilities | | | 316,513 | |
| | | | |
Total liabilities | | | 4,845,177 | |
| | | | |
Total net assets | | $ | 1,356,738,592 | |
| | | | |
| |
NET ASSETS CONSIST OF | | | | |
Paid-in capital | | $ | 1,294,364,247 | |
Overdistributed net investment income | | | (51,445 | ) |
Accumulated net realized gains on investments | | | 3,233,088 | |
Net unrealized gains on investments | | | 59,192,702 | |
| | | | |
Total net assets | | $ | 1,356,738,592 | |
| | | | |
| |
COMPUTATION OF NET ASSET VALUE AND OFFERING PRICE PER SHARE1 | | | | |
Net assets – Class A | | $ | 242,835,147 | |
Shares outstanding – Class A | | | 21,454,040 | |
Net asset value per share – Class A | | | $11.32 | |
Maximum offering price per share – Class A2 | | | $11.67 | |
Net assets – Class C | | $ | 55,336,638 | |
Shares outstanding – Class C | | | 4,889,078 | |
Net asset value per share – Class C | | | $11.32 | |
Net assets – Administrator Class | | $ | 324,697,744 | |
Shares outstanding – Administrator Class | | | 28,672,943 | |
Net asset value per share – Administrator Class | | | $11.32 | |
Net assets – Institutional Class | | $ | 308,275,572 | |
Shares outstanding – Institutional Class | | | 27,202,926 | |
Net asset value per share – Institutional Class | | | $11.33 | |
Net assets – Investor Class | | $ | 425,593,491 | |
Shares outstanding – Investor Class | | | 37,616,529 | |
Net asset value per share – Investor Class | | | $11.31 | |
| |
Total investments, at cost | | $ | 1,249,017,790 | |
| | | | |
| 1. | The Fund has an unlimited number of authorized shares. |
| 2. | Maximum offering price is computed as 100/97.00 of net asset value. On investments of $50,000 or more, the offering price is reduced. |
The accompanying notes are an integral part of these financial statements.
| | | | | | |
| Statement of Operations—Six Months Ended December 31, 2011 (Unaudited) | | Wells Fargo Advantage Intermediate Tax/AMT-Free Fund | | | 29 | |
| | | | |
| | | | |
| |
Investment income | | | | |
Interest | | $ | 25,130,722 | |
Income from affiliated securities | | | 429 | |
| | | | |
Total investment income | | | 25,131,151 | |
| | | | |
| |
Expenses | | | | |
Advisory fee | | | 2,058,614 | |
Administration fees | | | | |
Fund level | | | 311,340 | |
Class A | | | 193,478 | |
Class C | | | 42,328 | |
Administrator Class | | | 163,356 | |
Institutional Class | | | 81,757 | |
Investor Class | | | 398,522 | |
Shareholder servicing fees | | | | |
Class A | | | 302,309 | |
Class C | | | 66,137 | |
Administrator Class | | | 395,934 | |
Investor Class | | | 520,649 | |
Distribution fees | | | | |
Class C | | | 198,412 | |
Custody and accounting fees | | | 34,892 | |
Professional fees | | | 23,181 | |
Registration fees | | | 66,757 | |
Shareholder report expenses | | | 32,868 | |
Trustees’ fees and expenses | | | 6,235 | |
Other fees and expenses | | | 13,060 | |
| | | | |
Total expenses | | | 4,909,829 | |
Less: Fee waivers and/or expense reimbursements | | | (739,240 | ) |
| | | | |
Net expenses | | | 4,170,589 | |
| | | | |
Net investment income | | | 20,960,562 | |
| | | | |
| |
REALIZED AND UNREALIZED GAINS (LOSSES) ON INVESTMENTS | | | | |
| |
Net realized gains (losses) on: | | | | |
Unaffiliated securities | | | 5,519,230 | |
Futures transactions | | | (160,300 | ) |
| | | | |
Net realized gains on investments | | | 5,358,930 | |
| | | | |
Net change in unrealized gains (losses) on investments | | | 36,843,833 | |
| | | | |
Net realized and unrealized gains (losses) on investments | | | 42,202,763 | |
| | | | |
Net increase in net assets resulting from operations | | $ | 63,163,325 | |
| | | | |
The accompanying notes are an integral part of these financial statements.
| | | | |
| 30 | | Wells Fargo Advantage Intermediate Tax/AMT-Free Fund | | Statements of Changes in Net Assets |
| | | | | | | | | | | | | | | | |
| | | Six Months Ended December 31, 2011
(Unaudited) | | | Year Ended June 30, 2011 | |
| | | | |
Operations | | | | | | | | | | | | | | | | |
Net investment income | | | | | | $ | 20,960,562 | | | | | | | $ | 39,268,813 | |
Net realized gains on investments | | | | | | | 5,358,930 | | | | | | | | 12,710,358 | |
Net change in unrealized gains (losses) on investments | | | | | | | 36,843,833 | | | | | | | | (2,415,364 | ) |
| | | | | | | | | | | | | | | | |
Net increase in net assets resulting from operations | | | | | | | 63,163,325 | | | | | | | | 49,563,807 | |
| | | | | | | | | | | | | | | | |
| | | | |
Distributions to shareholders from | | | | | | | | | | | | | | | | |
Net investment income | | | | | | | | | | | | | | | | |
Class A | | | | | | | (4,033,244 | ) | | | | | | | (8,909,149 | ) |
Class C | | | | | | | (683,461 | ) | | | | | | | (1,295,606 | ) |
Administrator Class | | | | | | | (5,609,812 | ) | | | | | | | (11,218,880 | ) |
Institutional Class | | | | | | | (3,706,455 | ) | | | | | | | (4,292,702 | ) |
Investor Class | | | | | | | (6,927,590 | ) | | | | | | | (13,551,943 | ) |
Net realized gains | | | | | | | | | | | | | | | | |
Class A | | | | | | | (17,975 | ) | | | | | | | 0 | |
Class C | | | | | | | (4,101 | ) | | | | | | | 0 | |
Administrator Class | | | | | | | (24,037 | ) | | | | | | | 0 | |
Institutional Class | | | | | | | (21,756 | ) | | | | | | | 0 | |
Investor Class | | | | | | | (31,823 | ) | | | | | | | 0 | |
| | | | | | | | | | | | | | | | |
Total distributions to shareholders | | | | | | | (21,060,254 | ) | | | | | | | (39,268,280 | ) |
| | | | | | | | | | | | | | | | |
| | | | |
Capital share transactions | | | Shares | | | | | | | | Shares | | | | | |
Proceeds from shares sold | | | | | | | | | | | | | | | | |
Class A | | | 2,515,866 | | | | 28,103,367 | | | | 11,002,505 | | | | 119,944,196 | |
Class C | | | 710,148 | | | | 7,910,606 | | | | 1,700,494 | | | | 18,594,555 | |
Administrator Class | | | 7,128,896 | | | | 79,338,255 | | | | 13,355,775 | | | | 144,810,130 | |
Institutional Class | | | 17,148,751 | | | | 191,190,113 | | | | 10,830,535 | | | | 118,640,054 | |
Investor Class | | | 5,361,609 | | | | 59,727,250 | | | | 11,345,639 | | | | 123,354,157 | |
| | | | | | | | | | | | | | | | |
| | | | | | | 366,269,591 | | | | | | | | 525,343,092 | |
| | | | | | | | | | | | | | | | |
Reinvestment of distributions | | | | | | | | | | | | | | | | |
Class A | | | 302,398 | | | | 3,372,220 | | | | 631,187 | | | | 6,862,386 | |
Class C | | | 43,559 | | | | 485,821 | | | | 81,277 | | | | 883,334 | |
Administrator Class | | | 396,393 | | | | 4,423,308 | | | | 615,258 | | | | 6,687,401 | |
Institutional Class | | | 59,718 | | | | 667,931 | | | | 159,400 | | | | 1,745,506 | |
Investor Class | | | 565,875 | | | | 6,307,447 | | | | 1,138,082 | | | | 12,371,358 | |
| | | | | | | | | | | | | | | | |
| | | | | | | 15,256,727 | | | | | | | | 28,549,985 | |
| | | | | | | | | | | | | | | | |
Payment for shares redeemed | | | | | | | | | | | | | | | | |
Class A | | | (3,280,433 | ) | | | (36,520,262 | ) | | | (14,406,806 | ) | | | (155,798,206 | ) |
Class C | | | (447,825 | ) | | | (4,984,649 | ) | | | (1,313,366 | ) | | | (14,166,146 | ) |
Administrator Class | | | (10,238,943 | ) | | | (113,956,501 | ) | | | (12,187,652 | ) | | | (132,312,174 | ) |
Institutional Class | | | (1,781,814 | ) | | | (19,831,438 | ) | | | (9,338,095 | ) | | | (101,035,321 | ) |
Investor Class | | | (4,948,065 | ) | | | (55,101,757 | ) | | | (18,574,950 | ) | | | (201,758,793 | ) |
| | | | | | | | | | | | | | | | |
| | | | | | | (230,394,607 | ) | | | | | | | (605,070,640 | ) |
| | | | | | | | | | | | | | | | |
Net asset value of shares issued in acquisition | | | | | | | | | | | | | | | | |
Class A | | | 0 | | | | 0 | | | | 4,281,757 | | | | 46,515,298 | |
Class C | | | 0 | | | | 0 | | | | 1,371,429 | | | | 14,898,374 | |
Administrator Class | | | 0 | | | | 0 | | | | 16,705,622 | | | | 181,583,466 | |
| | | | | | | | | | | | | | | | |
| | | | | | | 0 | | | | | | | | 242,997,138 | |
| | | | | | | | | | | | | | | | |
Net increase in net assets resulting
from capital share transactions | | | | | | | 151,131,711 | | | | | | | | 191,819,575 | |
| | | | | | | | | | | | | | | | |
Total increase in net assets | | | | | | | 193,234,782 | | | | | | | | 202,115,102 | |
| | | | | | | | | | | | | | | | |
| | | | |
Net assets | | | | | | | | | | | | | | | | |
Beginning of period | | | | | | | 1,163,503,810 | | | | | | | | 961,388,708 | |
| | | | | | | | | | | | | | | | |
End of period | | | | | | $ | 1,356,738,592 | | | | | | | $ | 1,163,503,810 | |
| | | | | | | | | | | | | | | | |
Overdistributed net investment income | | | | | | $ | (51,445 | ) | | | | | | $ | (51,445 | ) |
| | | | | | | | | | | | | | | | |
The accompanying notes are an integral part of these financial statements.
| | | | | | |
| Financial Highlights | | Wells Fargo Advantage Intermediate Tax/AMT-Free Fund | | | 31 | |
(For a share outstanding throughout each period)
| | | | | | | | | | | | | | | | | | | | |
| | | Six Months Ended
December 31, 2011
(Unaudited) | | | Year Ended June 30, | |
| Class A | | | 2011 | | | 2010 | | | 2009 | | | 20081 | |
Net asset value, beginning of period | | $ | 10.94 | | | $ | 10.81 | | | $ | 10.21 | | | $ | 10.53 | | | $ | 10.65 | |
Net investment income | | | 0.19 | | | | 0.36 | | | | 0.37 | | | | 0.44 | | | | 0.40 | |
Net realized and unrealized gains (losses) on investments | | | 0.38 | | | | 0.13 | | | | 0.60 | | | | (0.31 | ) | | | (0.10 | ) |
| | | | | | | | | | | | | | | | | | | | |
Total from investment operations | | | 0.57 | | | | 0.49 | | | | 0.97 | | | | 0.13 | | | | 0.30 | |
Distributions to shareholders from | | | | | | | | | | | | | | | | | | | | |
Net investment income | | | (0.19 | ) | | | (0.36 | ) | | | (0.37 | ) | | | (0.44 | ) | | | (0.40 | ) |
Net realized gains | | | (0.00 | )2 | | | 0.00 | | | | 0.00 | | | | (0.01 | ) | | | (0.02 | ) |
| | | | | | | | | | | | | | | | | | | | |
Total distributions to shareholders | | | (0.19 | ) | | | (0.36 | ) | | | (0.37 | ) | | | (0.45 | ) | | | (0.42 | ) |
Net asset value, end of period | | $ | 11.32 | | | $ | 10.94 | | | $ | 10.81 | | | $ | 10.21 | | | $ | 10.53 | |
Total return3 | | | 5.22 | % | | | 4.57 | % | | | 9.64 | % | | | 1.33 | % | | | 2.86 | % |
Ratios to average net assets (annualized) | | | | | | | | | | | | | | | | | | | | |
Gross expenses | | | 0.82 | % | | | 0.82 | % | | | 0.85 | % | | | 0.90 | % | | | 0.96 | % |
Net expenses | | | 0.70 | % | | | 0.70 | % | | | 0.70 | % | | | 0.70 | % | | | 0.70 | % |
Net investment income | | | 3.34 | % | | | 3.27 | % | | | 3.47 | % | | | 4.27 | % | | | 4.13 | % |
Supplemental data | | | | | | | | | | | | | | | | | | | | |
Portfolio turnover rate | | | 19 | % | | | 52 | % | | | 61 | % | | | 92 | % | | | 98 | % |
Net assets, end of period (000’s omitted) | | | $242,835 | | | | $239,853 | | | | $220,688 | | | | $124,317 | | | | $30,506 | |
| 1. | For the period from July 31, 2007 (commencement of class operations) to June 30, 2008. |
| 2. | Amount is less than $0.005. |
| 3. | Total return calculations do not include any sales charges. Returns for periods of less than one year are not annualized. |
The accompanying notes are an integral part of these financial statements.
| | | | |
| 32 | | Wells Fargo Advantage Intermediate Tax/AMT-Free Fund | | Financial Highlights |
(For a share outstanding throughout each period)
| | | | | | | | | | | | | | | | | | | | |
| | | Six Months Ended
December 31, 2011
(Unaudited) | | | Year Ended June 30, | |
| Class C | | | 2011 | | | 2010 | | | 2009 | | | 20081 | |
Net asset value, beginning of period | | $ | 10.94 | | | $ | 10.81 | | | $ | 10.21 | | | $ | 10.53 | | | $ | 10.65 | |
Net investment income | | | 0.15 | | | | 0.28 | | | | 0.29 | | | | 0.36 | | | | 0.33 | |
Net realized and unrealized gains (losses) on investments | | | 0.38 | | | | 0.13 | | | | 0.60 | | | | (0.31 | ) | | | (0.10 | ) |
| | | | | | | | | | | | | | | | | | | | |
Total from investment operations | | | 0.53 | | | | 0.41 | | | | 0.89 | | | | 0.05 | | | | 0.23 | |
Distributions to shareholders from | | | | | | | | | | | | | | | | | | | | |
Net investment income | | | (0.15 | ) | | | (0.28 | ) | | | (0.29 | ) | | | (0.36 | ) | | | (0.33 | ) |
Net realized gains | | | (0.00 | )2 | | | 0.00 | | | | 0.00 | | | | (0.01 | ) | | | (0.02 | ) |
| | | | | | | | | | | | | | | | | | | | |
Total distributions to shareholders | | | (0.15 | ) | | | (0.28 | ) | | | (0.29 | ) | | | (0.37 | ) | | | (0.35 | ) |
Net asset value, end of period | | $ | 11.32 | | | $ | 10.94 | | | $ | 10.81 | | | $ | 10.21 | | | $ | 10.53 | |
Total return3 | | | 4.83 | % | | | 3.80 | % | | | 8.82 | % | | | 0.56 | % | | | 2.14 | % |
Ratios to average net assets (annualized) | | | | | | | | | | | | | | | | | | | | |
Gross expenses | | | 1.57 | % | | | 1.57 | % | | | 1.61 | % | | | 1.63 | % | | | 1.74 | % |
Net expenses | | | 1.45 | % | | | 1.45 | % | | | 1.45 | % | | | 1.45 | % | | | 1.45 | % |
Net investment income | | | 2.58 | % | | | 2.54 | % | | | 2.68 | % | | | 3.51 | % | | | 3.31 | % |
Supplemental data | | | | | | | | | | | | | | | | | | | | |
Portfolio turnover rate | | | 19 | % | | | 52 | % | | | 61 | % | | | 92 | % | | | 98 | % |
Net assets, end of period (000’s omitted) | | | $55,337 | | | | $50,157 | | | | $29,666 | | | | $9,603 | | | | $3,329 | |
| 1. | For the period from July 31, 2007 (commencement of class operations) to June 30, 2008. |
| 2. | Amount is less than $0.005. |
| 3. | Total return calculations do not include any sales charges. Returns for periods of less than one year are not annualized. |
The accompanying notes are an integral part of these financial statements.
| | | | | | |
| Financial Highlights | | Wells Fargo Advantage Intermediate Tax/AMT-Free Fund | | | 33 | |
(For a share outstanding throughout each period)
| | | | | | | | | | | | | | | | | | | | |
| | | Six Months Ended
December 31, 2011 (Unaudited) | | | Year Ended June 30, | |
| Administrator Class | | | 2011 | | | 2010 | | | 2009 | | | 20081 | |
Net asset value, beginning of period | | $ | 10.95 | | | $ | 10.82 | | | $ | 10.21 | | | $ | 10.53 | | | $ | 10.56 | |
Net investment income | | | 0.19 | | | | 0.37 | | | | 0.38 | | | | 0.45 | | | | 0.11 | |
Net realized and unrealized gains (losses) on investments | | | 0.37 | | | | 0.13 | | | | 0.62 | | | | (0.31 | ) | | | (0.03 | ) |
| | | | | | | | | | | | | | | | | | | | |
Total from investment operations | | | 0.56 | | | | 0.50 | | | | 1.00 | | | | 0.14 | | | | 0.08 | |
Distributions to shareholders from | | | | | | | | | | | | | | | | | | | | |
Net investment income | | | (0.19 | ) | | | (0.37 | ) | | | (0.39 | ) | | | (0.45 | ) | | | (0.11 | ) |
Net realized gains | | | (0.00 | )2 | | | 0.00 | | | | 0.00 | | | | (0.01 | ) | | | 0.00 | |
| | | | | | | | | | | | | | | | | | | | |
Total distributions to shareholders | | | (0.19 | ) | | | (0.37 | ) | | | (0.39 | ) | | | (0.46 | ) | | | (0.11 | ) |
Net asset value, end of period | | $ | 11.32 | | | $ | 10.95 | | | $ | 10.82 | | | $ | 10.21 | | | $ | 10.53 | |
Total return3 | | | 5.18 | % | | | 4.68 | % | | | 9.85 | % | | | 1.43 | % | | | 0.80 | % |
Ratios to average net assets (annualized) | | | | | | | | | | | | | | | | | | | | |
Gross expenses | | | 0.75 | % | | | 0.76 | % | | | 0.77 | % | | | 0.78 | % | | | 0.85 | % |
Net expenses | | | 0.60 | % | | | 0.60 | % | | | 0.60 | % | | | 0.60 | % | | | 0.60 | % |
Net investment income | | | 3.43 | % | | | 3.39 | % | | | 3.51 | % | | | 4.40 | % | | | 4.31 | % |
Supplemental data | | | | | | | | | | | | | | | | | | | | |
Portfolio turnover rate | | | 19 | % | | | 52 | % | | | 61 | % | | | 92 | % | | | 98 | % |
Net assets, end of period (000’s omitted) | | | $324,698 | | | | $343,666 | | | | $139,551 | | | | $13,486 | | | | $10,834 | |
| 1. | For the period from March 31, 2008 (commencement of class operations) to June 30, 2008. |
| 2. | Amount is less than $0.005. |
| 3. | Returns for periods of less than one year are not annualized. |
The accompanying notes are an integral part of these financial statements.
| | | | |
| 34 | | Wells Fargo Advantage Intermediate Tax/AMT-Free Fund | | Financial Highlights |
(For a share outstanding throughout each period)
| | | | | | | | | | | | | | | | | | | | |
| | | Six Months Ended
December 31, 2011
(Unaudited) | | | Year Ended June 30, | |
| Institutional Class | | | 2011 | | | 2010 | | | 2009 | | | 2008¹ | |
Net asset value, beginning of period | | $ | 10.96 | | | $ | 10.82 | | | $ | 10.22 | | | $ | 10.54 | | | $ | 10.56 | |
Net investment income | | | 0.20 | | | | 0.39 | | | | 0.39 | | | | 0.46 | | | | 0.12 | |
Net realized and unrealized gains (losses) on investments | | | 0.37 | | | | 0.14 | | | | 0.61 | | | | (0.30 | ) | | | (0.02 | ) |
| | | | | | | | | | | | | | | | | | | | |
Total from investment operations | | | 0.57 | | | | 0.53 | | | | 1.00 | | | | 0.16 | | | | 0.10 | |
Distributions to shareholders from | | | | | | | | | | | | | | | | | | | | |
Net investment income | | | (0.20 | ) | | | (0.39 | ) | | | (0.40 | ) | | | (0.47 | ) | | | (0.12 | ) |
Net realized gains | | | (0.00 | )² | | | 0.00 | | | | 0.00 | | | | (0.01 | ) | | | 0.00 | |
| | | | | | | | | | | | | | | | | | | | |
Total distributions to shareholders | | | (0.20 | ) | | | (0.39 | ) | | | (0.40 | ) | | | (0.48 | ) | | | (0.12 | ) |
Net asset value, end of period | | $ | 11.33 | | | $ | 10.96 | | | $ | 10.82 | | | $ | 10.22 | | | $ | 10.54 | |
Total return³ | | | 5.27 | % | | | 4.86 | % | | | 10.05 | % | | | 1.62 | % | | | 0.87 | % |
Ratios to average net assets (annualized) | | | | | | | | | | | | | | | | | | | | |
Gross expenses | | | 0.49 | % | | | 0.49 | % | | | 0.51 | % | | | 0.56 | % | | | 0.58 | % |
Net expenses | | | 0.42 | % | | | 0.42 | % | | | 0.42 | % | | | 0.42 | % | | | 0.44 | % |
Net investment income | | | 3.63 | % | | | 3.55 | % | | | 3.69 | % | | | 4.48 | % | | | 4.46 | % |
Supplemental data | | | | | | | | | | | | | | | | | | | | |
Portfolio turnover rate | | | 19 | % | | | 52 | % | | | 61 | % | | | 92 | % | | | 98 | % |
Net assets, end of period (000’s omitted) | | | $308,276 | | | | $129,033 | | | | $109,593 | | | | $6,347 | | | | $10 | |
| 1. | For the period from March 31, 2008 (commencement of class operations) to June 30, 2008. |
| 2. | Amount is less than $0.005. |
| 3. | Returns for periods of less than one year are not annualized. |
The accompanying notes are an integral part of these financial statements.
| | | | | | |
| Financial Highlights | | Wells Fargo Advantage Intermediate Tax/AMT-Free Fund | | | 35 | |
(For a share outstanding throughout each period)
| | | | | | | | | | | | | | | | | | | | | | | | |
| | | Six Months Ended
December 31, 2011
(Unaudited) | | | Year Ended June 30, | |
| Investor Class | | | 2011 | | | 2010 | | | 2009 | | | 2008 | | | 2007 | |
Net asset value, beginning of period | | $ | 10.94 | | | $ | 10.81 | | | $ | 10.20 | | | $ | 10.53 | | | $ | 10.60 | | | $ | 10.55 | |
Net investment income | | | 0.19 | | | | 0.35 | | | | 0.37 | | | | 0.43 | | | | 0.44 | | | | 0.39 | |
Net realized and unrealized gains (losses) on investments | | | 0.37 | | | | 0.13 | | | | 0.61 | | | | (0.32 | ) | | | (0.05 | ) | | | 0.07 | |
| | | | | | | | | | | | | | | | | | | | | | | | |
Total from investment operations | | | 0.56 | | | | 0.48 | | | | 0.98 | | | | 0.11 | | | | 0.39 | | | | 0.46 | |
Distributions to shareholders from | | | | | | | | | | | | | | | | | | | | | | | | |
Net investment income | | | (0.19 | ) | | | (0.35 | ) | | | (0.37 | ) | | | (0.43 | ) | | | (0.44 | ) | | | (0.39 | ) |
Net realized gains | | | (0.00 | )¹ | | | 0.00 | | | | 0.00 | | | | (0.01 | ) | | | (0.02 | ) | | | (0.02 | ) |
| | | | | | | | | | | | | | | | | | | | | | | | |
Total distributions to shareholders | | | (0.19 | ) | | | (0.35 | ) | | | (0.37 | ) | | | (0.44 | ) | | | (0.46 | ) | | | (0.41 | ) |
Net asset value, end of period | | $ | 11.31 | | | $ | 10.94 | | | $ | 10.81 | | | $ | 10.20 | | | $ | 10.53 | | | $ | 10.60 | |
Total return2 | | | 5.12 | % | | | 4.54 | % | | | 9.70 | % | | | 1.18 | % | | | 3.67 | % | | | 4.41 | % |
Ratios to average net assets (annualized) | | | | | | | | | | | | | | | | | | | | | | | | |
Gross expenses | | | 0.85 | % | | | 0.85 | % | | | 0.91 | % | | | 0.95 | % | | | 1.16 | % | | | 1.23 | % |
Net expenses | | | 0.73 | % | | | 0.73 | % | | | 0.75 | % | | | 0.75 | % | | | 0.75 | % | | | 0.75 | % |
Net investment income | | | 3.30 | % | | | 3.24 | % | | | 3.44 | % | | | 4.24 | % | | | 4.07 | % | | | 3.66 | % |
Supplemental data | | | | | | | | | | | | | | | | | | | | | | | | |
Portfolio turnover rate | | | 19 | % | | | 52 | % | | | 61 | % | | | 92 | % | | | 98 | % | | | 78 | % |
Net assets, end of period (000’s omitted) | | | $425,593 | | | | $400,794 | | | | $461,890 | | | | $386,977 | | | | $460,702 | | | | $313,361 | |
1. Amount is less than $0.005.
2. Returns for periods of less than one year are not annualized.
The accompanying notes are an integral part of these financial statements.
| | | | |
| 36 | | Wells Fargo Advantage Intermediate Tax/AMT-Free Fund | | Notes to Financial Statements (Unaudited) |
1. ORGANIZATION
Wells Fargo Funds Trust (the “Trust”), a Delaware statutory trust organized on March 10, 1999, is an open-end management investment company registered under the Investment Company Act of 1940, as amended (the “1940 Act”). These financial statements report on Wells Fargo Advantage Intermediate Tax/AMT-Free Fund (the “Fund”) which is a diversified series of the Trust.
2. SIGNIFICANT ACCOUNTING POLICIES
The following significant accounting policies, which are consistently followed in the preparation of the financial statements of the Fund, are in conformity with U.S. generally accepted accounting principles which require management to make estimates and assumptions that affect the reported amounts of assets and liabilities, disclosure of contingent assets and liabilities at the date of the financial statements, and the reported amounts of revenues and expenses during the reporting period. Actual results could differ from those estimates.
Securities valuation
Fixed income securities with maturities exceeding 60 days are valued based on available evaluated prices received from an independent pricing service approved by the Board of Trustees which may utilize both transaction data and market information such as yield, prices of securities of comparable quality, coupon rate, maturity, type of issue, trading characteristics and other market data. If valuations are not available from the pricing service or values received are deemed not representative of market value, values will be obtained from a third party broker-dealer or determined based on the Fund’s Fair Value Procedures.
Debt securities of sufficient credit quality with original maturities of 60 days or less generally are valued at amortized cost which approximates fair value. The amortized cost method involves valuing a security at its cost, plus accretion of discount or minus amortization of premium over the period until maturity.
Investments in open-end mutual funds and non-registered investment companies are generally valued at net asset value.
Investments which are not valued using any of the methods discussed above, are valued at their fair value, as determined by procedures established in good faith and approved by the Board of Trustees.
When-issued transactions
The Fund may purchase securities on a forward commitment or ‘when-issued’ basis. The Fund records a when-issued transaction on the trade date and will segregate assets to cover its obligation by confirming the availability of qualifying assets having a value sufficient to make payment for the securities purchased. Securities purchased on a when-issued basis are marked-to-market daily and the Fund begins earning interest on the settlement date. Losses may arise due to changes in the market value of the underlying securities or if the counterparty does not perform under the contract.
Futures contracts
The Fund may be subject to interest rate risk in the normal course of pursuing its investment objectives. The Fund may buy and sell futures contracts in order to gain exposure to, or protect against, changes in security values and interest rates. The primary risks associated with the use of futures contracts are the imperfect correlation between changes in market values of securities held by the Fund and the prices of futures contracts, and the possibility of an illiquid market.
Futures contracts are valued based upon their quoted daily settlement prices when available. The aggregate principal amounts of the contracts are not recorded in the financial statements. Fluctuations in the value of the contracts are recorded in the Statement of Assets and Liabilities as an asset or liability and in the Statement of Operations as unrealized gains or losses until the contracts are closed, at which point they are recorded as net realized gains or losses on futures contracts. With futures contracts, there is minimal counterparty risk to the Fund since futures are exchange traded and the exchange’s clearinghouse, as counterparty to all exchange traded futures, guarantees the futures against default.
Security transactions and income recognition
Securities transactions are recorded on a trade date basis. Realized gains or losses are reported on the basis of identified cost of securities delivered.
Interest income is accrued daily and bond discounts are accreted and premiums are amortized daily based on the effective interest method. To the extent debt obligations are placed on non-accrual status, any related interest income
| | | | | | |
| Notes to Financial Statements (Unaudited) | | Wells Fargo Advantage Intermediate Tax/AMT-Free Fund | | | 37 | |
may be reduced by writing off interest receivables when the collection of all or a portion of interest has become doubtful based on consistently applied procedures. If the issuer subsequently resumes interest payments or when the collectability of interest is reasonably assured, the debt obligation is removed from non-accrual status.
Distributions to shareholders
Distributions to shareholders from net investment income are accrued daily and paid monthly. Distributions from net realized gains, if any, are recorded on the ex-dividend date. Such distributions are determined in conformity with income tax regulations, which may differ from generally accepted accounting principles.
Federal and other taxes
The Fund intends to continue to qualify as a regulated investment company by distributing substantially all of its investment company taxable and tax-exempt income and any net realized capital gains (after reduction for capital loss carryforwards) sufficient to relieve it from all, or substantially all, federal income taxes. Accordingly, no provision for federal income taxes was required.
The Fund’s income and federal excise tax returns and all financial records supporting those returns for the prior three fiscal years are subject to examination by the federal and Delaware revenue authorities.
Under the recently enacted Regulated Investment Company Modernization Act of 2010, the Fund is permitted to carry forward capital losses incurred in taxable years which began after December 22, 2010 for an unlimited period. However, any losses incurred are required to be utilized prior to the losses incurred in pre-enactment taxable years. As a result of this ordering rule, pre-enactment capital loss carryforwards may be more likely to expire unused. Additionally, post-enactment capital losses that are carried forward will retain their character as either short-term or long-term capital losses rather than being considered all short-term as under previous law.
As of June 30, 2011, the Fund had net capital loss carryforwards, which were available to offset future net realized capital gains, in the amount of $2,040,386 expiring in 2018.
Class allocations
The separate classes of shares offered by the Fund differ principally in applicable sales charges, distribution, shareholder servicing and administration fees. Shareholders of each class bear certain expenses that pertain to that particular class. All shareholders bear the common expenses of the Fund, earn income from the portfolio, and are allocated unrealized gains and losses pro rata based on the average daily net assets of each class, without distinction between share classes. Dividends are determined separately for each class based on income and expenses allocable to each class. Realized gains and losses are allocated to each class pro rata based upon the net assets of each class on the date realized. Differences in per share dividend rates generally result from the relative weightings of pro rata income and realized gain allocations and from differences in separate class expenses, including distribution, shareholder servicing and administration fees.
3. FAIR VALUATION MEASUREMENTS
Fair value measurements of investments are determined within a framework that has established a fair value hierarchy based upon the various data inputs utilized in determining the value of the Fund’s investments. The three-level hierarchy gives the highest priority to unadjusted quoted prices in active markets for identical assets or liabilities (Level 1) and the lowest priority to significant unobservable inputs (Level 3). The Fund’s investments are classified within the fair value hierarchy based on the lowest level of input that is significant to the fair value measurement. The inputs are summarized into three broad levels as follows:
| n | | Level 1 – quoted prices in active markets for identical securities |
| n | | Level 2 – other significant observable inputs (including quoted prices for similar securities, interest rates, prepayment speeds, credit risk, etc.) |
| n | | Level 3 – significant unobservable inputs (including the Fund’s own assumptions in determining the fair value of investments) |
The inputs or methodologies used for valuing securities are not necessarily an indication of the risk associated with investing in those securities.
| | | | |
| 38 | | Wells Fargo Advantage Intermediate Tax/AMT-Free Fund | | Notes to Financial Statements (Unaudited) |
As of December 31, 2011, the inputs used in valuing the Fund’s assets, which are carried at fair value, were as follows:
| | | | | | | | | | | | | | | | |
| Investments in Securities | | Quoted Prices
(Level 1) | | | Significant Other
Observable Inputs
(Level 2) | | | Significant
Unobservable Inputs
(Level 3) | | | Total | |
Municipal bonds and notes | | $ | 0 | | | $ | 1,294,805,634 | | | $ | 6,983,042 | | | $ | 1,301,788,676 | |
Short-term investments | | | | | | | | | | | | | | | | |
Investment companies | | | 6,421,816 | | | | 0 | | | | 0 | | | | 6,421,816 | |
| | | $ | 6,421,816 | | | $ | 1,294,805,634 | | | $ | 6,983,042 | | | $ | 1,308,210,492 | |
Further details on the major security types listed above can be found in the Portfolio of Investments.
Transfers in and transfers out are recognized at the end of the reporting period. For the six months ended December 31, 2011, the Fund did not have any significant transfers into/out of Level 1 and Level 2.
The following is a reconciliation of assets in which significant unobservable inputs (Level 3) were used in determining fair value:
| | | | |
| | | Municipal
bonds and
notes | |
Balance as of June 30, 2011 | | $ | 6,939,000 | |
Accrued discounts (premiums) | | | 25,372 | |
Realized gains (losses) | | | 0 | |
Change in unrealized gains (losses) | | | 18,670 | |
Purchases | | | 0 | |
Sales | | | 0 | |
Transfers into Level 3 | | | 0 | |
Transfers out of Level 3 | | | 0 | |
Balance as of December 31, 2011 | | $ | 6,983,042 | |
Change in unrealized gains (losses)
relating to securities still held at December 31, 2011 | | $ | 18,670 | |
4. TRANSACTIONS WITH AFFILIATES AND OTHER EXPENSES
Advisory fee
The Trust has entered into an advisory contract with Wells Fargo Funds Management, LLC (“Funds Management”), an indirect wholly owned subsidiary of Wells Fargo & Company (“Wells Fargo”). The adviser is responsible for implementing investment policies and guidelines and for supervising the sub-adviser, who is responsible for day-to-day portfolio management of the Fund.
Pursuant to the contract, Funds Management is entitled to receive an annual advisory fee starting at 0.35% and declining to 0.25% as the average daily net assets of the Fund increase. For the six months ended December 31, 2011, the advisory fee was equivalent to an annual rate of 0.33% of the Fund’s average daily net assets.
Funds Management may retain the services of certain sub-advisers to provide daily portfolio management to the Fund. The fees related to sub-advisory services are borne directly by Funds Management and do not increase the overall fees paid by the Fund. Wells Capital Management Incorporated, an affiliate of Funds Management, is the sub-adviser to the Fund and is entitled to receive a fee from Funds Management at an annual rate starting at 0.20% and declining to 0.10% as the average daily net assets of the Fund increase.
Administration and transfer agent fees
The Trust has entered into an administration agreement with Funds Management. Under this agreement, for providing administrative services, which includes paying fees and expenses for services provided by the transfer agent, sub-transfer agents, omnibus account servicers and record-keepers, Funds Management is entitled to receive from the Fund an
| | | | | | |
| Notes to Financial Statements (Unaudited) | | Wells Fargo Advantage Intermediate Tax/AMT-Free Fund | | | 39 | |
annual fund level administration fee starting at 0.05% and declining to 0.03% as the average daily net assets of the Fund increase and a class level administration fee which is calculated based on the average daily net assets of each class as follows:
| | | | |
| | | Class Level
Administration Fee | |
Class A, Class C | | | 0.16 | % |
Administrator Class | | | 0.10 | |
Institutional Class | | | 0.08 | |
Investor Class | | | 0.19 | |
Funds Management has contractually waived and/or reimbursed advisory and administration fees to the extent necessary to maintain certain net operating expense ratios for the Fund. Waiver of fees and/or reimbursement of expenses by Funds Management were made first from fund level expenses on a proportionate basis and then from class specific expenses.
Distribution fees
The Trust has adopted a Distribution Plan for Class C shares of the Fund pursuant to Rule 12b-1 under the 1940 Act. Distribution fees are charged to Class C shares and paid to Wells Fargo Funds Distributor, LLC, the principal underwriter, at an annual rate of 0.75% of its average daily net assets.
For the six months ended December 31, 2011, Wells Fargo Funds Distributor, LLC received $6,755 from the sale of Class A shares and $7,732 and $1,011 in contingent deferred sales charges from redemptions of Class A and Class C shares, respectively.
Shareholder servicing fees
The Trust has entered into contracts with one or more shareholder servicing agents, whereby Class A, Class C, Administrator Class and Investor Class of the Fund is charged a fee at an annual rate of 0.25% of the average daily net assets of each respective class.
A portion of these total shareholder servicing fees were paid to affiliates of Wells Fargo.
5. INVESTMENT PORTFOLIO TRANSACTIONS
Purchases and sales of investments, excluding U.S. Government obligations (if any) and short-term securities (securities with maturities of one year or less at purchase date), for the six months ended December 31, 2011 were $334,531,247 and $229,079,951, respectively.
6. DERIVATIVE TRANSACTIONS
During the six month ended December 31, 2011, the Fund entered into futures contracts to take advantage of the differences between municipal and treasury yields and to help shorten duration of the portfolio.
As of December 31, 2011, the Fund did not have any open futures contracts but had an average notional amount of $3,718,954 in short futures contracts during the six months ended December 31, 2011.
The realized losses and change in unrealized gains (losses) on futures contracts are reflected in the Statement of Operations.
7. ACQUISITION
After the close of business on July 9, 2010, the Fund acquired the net assets of Evergreen Intermediate Municipal Bond Fund. The purpose of the transaction was to combine two funds with similar investment objectives and strategies. Shareholders holding Class A, Class B, Class C, Class I and Class IS shares of Evergreen Intermediate Municipal Bond Fund received Class A, Class A, Class C, Administrator Class and Class A shares, respectively, of the Fund in the reorganization. The acquisition was accomplished by a tax-free exchange of all of the shares of Evergreen Intermediate Municipal Bond Fund for 22,358,808 shares of the Fund valued at $242,997,138 at an exchange ratio of 5.83 for each class of shares. The investment portfolio of Evergreen Intermediate Municipal Bond Fund with a fair value of $241,388,756, identified cost of $232,120,065 and unrealized gains of $9,268,691 at July 9, 2010 were the principal assets acquired by the Fund. The
| | | | |
| 40 | | Wells Fargo Advantage Intermediate Tax/AMT-Free Fund | | Notes to Financial Statements (Unaudited) |
aggregate net assets of Evergreen Intermediate Municipal Bond Fund and the Fund immediately prior to the acquisition were $242,997,138 and $971,529,268, respectively. The aggregate net assets of the Fund immediately after the acquisition were $1,214,526,406. For financial reporting purposes, assets received and shares issued by the Fund were recorded at fair value; however, the cost basis of the investments received from Evergreen Intermediate Municipal Bond Fund was carried forward to align ongoing reporting of the Fund’s realized and unrealized gains and losses with amounts distributable to shareholders for tax purposes.
Assuming the acquisition had been completed July 1, 2010, the beginning of the annual reporting period for the Fund, the pro forma results of operations for the year ended June 30, 2011 would have been:
| | | | |
Net investment income | | $ | 39,510,430 | |
Net realized and unrealized gains (losses) on investments | | $ | 2,260,570 | |
Net decrease in net assets resulting from operations | | $ | 41,770,570 | |
8. BORROWINGS
The Trust (excluding the money market funds) and Wells Fargo Variable Trust are parties to a $150,000,000 revolving credit agreement with State Street Bank and Trust Company, whereby the Fund is permitted to use bank borrowings for temporary or emergency purposes, such as to fund shareholder redemption requests. Interest under the credit agreement is charged to the Fund based on a borrowing rate equal to the higher of the Federal Funds rate in effect on that day plus 1.25% or the overnight LIBOR rate in effect on that day plus 1.25%. In addition, under the credit agreement, the Fund pays an annual commitment fee equal to 0.10% of the unused balance, which is allocated pro rata. Prior to September 6, 2011, the revolving credit agreement was for $125,000,000 and the annual commitment fee paid by the Fund was 0.125% of the unused balance. For the six months ended December 31, 2011, the Fund paid $841 in commitment fees.
For the six months ended December 31, 2011, there were no borrowings by the Fund under the agreement.
9. INDEMNIFICATION
Under the Trust’s organizational documents, the officers and directors are indemnified against certain liabilities that may arise out of performance of their duties to the Trust. Additionally, in the normal course of business, the Trust may enter into contracts with service providers that contain a variety of indemnification clauses. The Trust’s maximum exposure under these arrangements is dependent on future claims that may be made against the Fund and, therefore, cannot be estimated.
10. NEW ACCOUNTING PRONOUNCEMENTS
In May 2011, the Financial Accounting Standards Board (“FASB”) issued Accounting Standards Update (“ASU”) No. 2011-04 “Amendments to Achieve Common Fair Value Measurement and Disclosure Requirements in U.S. GAAP and IFRSs”. ASU No. 2011-04 amends FASB ASC Topic 820, Fair Value Measurements and Disclosures, to establish common requirements for measuring fair value and for disclosing information about fair value measurements in accordance with GAAP. The ASU is effective prospectively for interim and annual periods beginning after December 15, 2011. Management expects that adoption of the ASU will result in additional disclosures in the financial statements, as applicable.
In April 2011, FASB issued ASU No. 2011-03 “Reconsideration of Effective Control for Repurchase Agreements”. ASU No. 2011-03 amends FASB ASC Topic 860, Transfers and Servicing, specifically the criteria required to determine whether a repurchase agreement (repo) and similar agreements should be accounted for as sales of financial assets or secured borrowings with commitments. ASU No. 2011-03 changes the assessment of effective control by focusing on the transferor’s contractual rights and obligations and removing the criterion to assess its ability to exercise those rights or honor those obligations. This could result in changes to the way entities account for certain transactions including repurchase agreements, mortgage dollar rolls and reverse repurchase agreements. The ASU will become effective on a prospective basis for new transfers and modifications to existing transactions as of the beginning of the first interim or annual period beginning on or after December 15, 2011. Management has evaluated the impact of adopting the ASU and expects no significant changes.
| | | | | | |
| Other Information (Unaudited) | | Wells Fargo Advantage Intermediate Tax/AMT-Free Fund | | | 41 | |
PROXY VOTING INFORMATION
A description of the policies and procedures that the Fund uses to determine how to vote proxies relating to portfolio securities is available without charge, upon request, by calling 1-800-222-8222, visiting our Web site at www.wellsfargo.com/advantagefunds, or visiting the SEC Web site at www.sec.gov. Information regarding how the Fund voted proxies relating to portfolio securities during the most recent 12-month period ended June 30 is available without charge on the Fund’s Web site at www.wellsfargo.com/advantagefunds or by visiting the SEC Web site at www.sec.gov.
PORTFOLIO HOLDINGS INFORMATION
The complete portfolio holdings for the Fund are publicly available on the Fund’s Web site (www.wellsfargo.com/advantagefunds) on a monthly, 30-day or more delayed basis. In addition, top ten holdings information for the Fund is publicly available on the Fund’s Web site on a monthly, seven-day or more delayed basis. The Fund files its complete schedule of portfolio holdings with the SEC for the first and third quarters of each fiscal year on Form N-Q, which is available without charge by visiting the SEC Web site at www.sec.gov. In addition, the Fund’s Form N-Q may be reviewed and copied at the SEC’s Public Reference Room in Washington, DC, and at regional offices in New York City, at 233 Broadway, and in Chicago, at 175 West Jackson Boulevard, Suite 900. Information about the Public Reference Room may be obtained by calling 1-800-SEC-0330.
| | | | |
| 42 | | Wells Fargo Advantage Intermediate Tax/AMT-Free Fund | | Other Information (Unaudited) |
BOARD OF TRUSTEES
The following table provides basic information about the Board of Trustees (the “Trustees”) of the Trust and Officers of the Trust. This table should be read in conjunction with the Prospectus and the Statement of Additional Information1 of the Fund. Each of the Trustees and Officers listed below acts in identical capacities for the Wells Fargo Advantage family of funds, which consists of 138 funds comprising the Wells Fargo Funds Trust, Wells Fargo Variable Trust, Wells Fargo Master Trust and four closed-end funds (collectively the “Fund Complex”). All of the Trustees are also Members of the Audit and Governance Committees of each Trust in the Fund Complex. The mailing address of each Trustee and Officer is 525 Market Street, 12th Floor, San Francisco, CA 94105. Each Trustee and Officer serves an indefinite term, however, each Trustee serves such term until reaching the mandatory retirement age established by the Trustees.
Independent Trustees
| | | | | | |
Name and Year of Birth | | Position Held and Length of Service | | Principal Occupations During Past Five Years | | Other Directorships During
Past Five Years |
Peter G. Gordon
(Born 1942) | | Trustee, since 1998; Chairman, since 2005 (Lead Trustee since 2001) | | Co-Founder, Retired Chairman, President and CEO of Crystal Geyser Water Company. Trustee Emeritus, Colby College | | Asset Allocation Trust |
Isaiah Harris, Jr.
(Born 1952) | | Trustee, since 2009 | | Retired. Prior thereto, President and CEO of BellSouth Advertising and Publishing Corp. from 2005 to 2007, President and CEO of BellSouth Enterprises from 2004 to 2005 and President of BellSouth Consumer Services from 2000 to 2003. Emeritus member of the Iowa State University Foundation Board of Governors. Emeritus Member of the Advisory Board of Iowa State University School of Business. Mr. Harris is a certified public accountant. | | CIGNA Corporation; Deluxe Corporation; Asset Allocation Trust |
Judith M. Johnson
(Born 1949) | | Trustee, since 2008 | | Retired. Prior thereto, Chief Executive Officer and Chief Investment Officer of Minneapolis Employees Retirement Fund from 1996 to 2008. Ms. Johnson is an attorney, certified public accountant and a certified managerial accountant. | | Asset Allocation Trust |
Leroy Keith, Jr.
(Born 1939) | | Trustee, since 2010 | | Chairman, Bloc Global Services (development and construction). Trustee of the Evergreen Funds from 1983 to 2010. Former Managing Director, Almanac Capital Management (commodities firm), former Partner, Stonington Partners, Inc. (private equity fund), former Director, Obagi Medical Products Co. and former Director, Lincoln Educational Services. | | Trustee, Virtus Fund Complex (consisting of 40 portfolios as of 12/31/11); Asset Allocation Trust |
David F. Larcker
(Born 1950) | | Trustee, since 2009 | | James Irvin Miller Professor of Accounting at the Graduate School of Business, Stanford University, Director of Corporate Governance Research Program and Senior Faculty of The Rock Center for Corporate Governance since 2006. From 2005 to 2008, Professor of Accounting at the Graduate School of Business, Stanford University. Prior thereto, Ernst & Young Professor of Accounting at The Wharton School, University of Pennsylvania from 1985 to 2005. | | Asset Allocation Trust |
Olivia S. Mitchell
(Born 1953) | | Trustee, since 2006 | | International Foundation of Employee Benefit Plans Professor, Wharton School of the University of Pennsylvania since 1993. Director of Wharton’s Pension Research Council and Boettner Center on Pensions & Retirement Research, and Research Associate at the National Bureau of Economic Research. Previously, Cornell University Professor from 1978 to 1993. | | Asset Allocation Trust |
| | | | | | |
| Other Information (Unaudited) | | Wells Fargo Advantage Intermediate Tax/AMT-Free Fund | | | 43 | |
| | | | | | |
Name and Year of Birth | | Position Held and Length of Service | | Principal Occupations During Past Five Years | | Other Directorships During
Past Five Years |
Timothy J. Penny
(Born 1951) | | Trustee, since 1996 | | President and CEO of Southern Minnesota Initiative Foundation, a non-profit organization, since 2007 and Senior Fellow at the Humphrey Institute Policy Forum at the University of Minnesota since 1995. Member of the Board of Trustees of NorthStar Education Finance, Inc., a non-profit organization, since 2007. | | Asset Allocation Trust |
Michael S. Scofield
(Born 1943) | | Trustee, since 2010 | | Served on the Investment Company Institute’s Board of Governors and Executive Committee from 2008-2011 as well the Governing Council of the Independent Directors Council from 2006-2011 and the Independent Directors Council Executive Committee from 2008-2011. Chairman of the IDC from 2008-2010. Institutional Investor (Fund Directions) Trustee of Year in 2007. Trustee of the Evergreen Funds (and its predecessors) from 1984 to 2010. Chairman of the Evergreen Funds from 2000-2010. Former Trustee of the Mentor Funds. Retired Attorney, Law Offices of Michael S. Scofield and former Director and Chairman, Branded Media Corporation (multi-media branding company). | | Asset Allocation Trust |
Donald C. Willeke
(Born 1940) | | Trustee, since 1996 | | Principal of the law firm of Willeke & Daniels. General Counsel of the Minneapolis Employees Retirement Fund from 1984 until its consolidation into the Minnesota Public Employees Retirement Association on June 30, 2010. Director and Vice Chair of The Free Trust (non-profit corporation). Director of the American Chestnut Foundation (non-profit corporation). | | Asset Allocation Trust |
Officers
| | | | | | |
Name and Year of Birth | | Position Held and
Length of Service | | Principal Occupations During Past Five Years | | |
Karla M. Rabusch
(Born 1959) | | President, since 2003 | | Executive Vice President of Wells Fargo Bank, N.A. and President of Wells Fargo Funds Management, LLC since 2003. Senior Vice President and Chief Administrative Officer of Wells Fargo Funds Management, LLC from 2001 to 2003. | | |
C. David Messman
(Born 1960) | | Secretary, since 2000; Chief Legal Counsel, since 2003 | | Senior Vice President and Secretary of Wells Fargo Funds Management, LLC since 2001. Vice President and Managing Senior Counsel of Wells Fargo Bank, N.A. since 1996. | | |
Kasey Phillips
(Born 1970) | | Treasurer, since 2009 | | Senior Vice President of Wells Fargo Funds Management, LLC since 2009. Senior Vice President of Evergreen Investment Management Company, LLC from 2006 to 2010. Treasurer of the Evergreen Funds from 2005 to 2010. | | |
David Berardi
(Born 1975) | | Assistant Treasurer, since 2009 | | Vice President of Wells Fargo Funds Management, LLC since 2009. Vice President of Evergreen Investment Management Company, LLC from 2008 to 2010. Assistant Vice President of Evergreen Investment Services, Inc. from 2004 to 2008. Manager of Fund Reporting and Control for Evergreen Investment Management Company, LLC from 2004 to 2010. | | |
Jeremy DePalma
(Born 1974) | | Assistant Treasurer, since 2009 | | Senior Vice President of Wells Fargo Funds Management, LLC since 2009. Senior Vice President of Evergreen Investment Management Company, LLC from 2008 to 2010. Vice President, Evergreen Investment Services, Inc. from 2004 to 2007. Head of the Fund Reporting and Control Team within Fund Administration from 2005 to 2010. | | |
Debra Ann Early
(Born 1964) | | Chief Compliance Officer, since 2007 | | Chief Compliance Officer of Wells Fargo Funds Management, LLC since 2007. Chief Compliance Officer of Parnassus Investments from 2005 to 2007. Chief Financial Officer of Parnassus Investments from 2004 to 2007 and Senior Audit Manager of PricewaterhouseCoopers LLP from 1998 to 2004. | | |
| 1. | The Statement of Additional Information includes additional information about the Trustees and is available, without charge, upon request, by calling 1-800-222-8222 or by visiting the Web site at www.wellsfargo.com/advantagefunds. |
| | | | |
| 44 | | Wells Fargo Advantage Intermediate Tax/AMT-Free Fund | | List of Abbreviations |
The following is a list of common abbreviations for terms and entities which may have appeared in this report.
| ACB | — Agricultural Credit Bank |
| ADR | — American Depository Receipt |
| ADS | — American Depository Shares |
| AGC-ICC | — Assured Guaranty Corporation - Insured Custody Certificates |
| AGM | — Assured Guaranty Municipal |
| AMBAC | — American Municipal Bond Assurance Corporation |
| AMT | — Alternative Minimum Tax |
| BAN | — Bond Anticipation Notes |
| BHAC | — Berkshire Hathaway Assurance Corporation |
| CAB | — Capital Appreciation Bond |
| CCAB | — Convertible Capital Appreciation Bond |
| CDA | — Community Development Authority |
| CDO | — Collateralized Debt Obligation |
| COP | — Certificate of Participation |
| DRIVER | — Derivative Inverse Tax-Exempt Receipts |
| DW&P | — Department of Water & Power |
| DWR | — Department of Water Resources |
| ECFA | — Educational & Cultural Facilities Authority |
| EDA | — Economic Development Authority |
| EDFA | — Economic Development Finance Authority |
| ETF | — Exchange-Traded Fund |
| FFCB | — Federal Farm Credit Bank |
| FGIC | — Financial Guaranty Insurance Corporation |
| FHA | — Federal Housing Authority |
| FHLB | — Federal Home Loan Bank |
| FHLMC | — Federal Home Loan Mortgage Corporation |
| FNMA | — Federal National Mortgage Association |
| GDR | — Global Depository Receipt |
| GNMA | — Government National Mortgage Association |
| HCFR | — Healthcare Facilities Revenue |
| HEFA | — Health & Educational Facilities Authority |
| HEFAR | — Higher Education Facilities Authority Revenue |
| HFA | — Housing Finance Authority |
| HFFA | — Health Facilities Financing Authority |
| IBC | — Insured Bond Certificate |
| IDA | — Industrial Development Authority |
| IDAG | — Industrial Development Agency |
| IDR | — Industrial Development Revenue |
| KRW | — Republic of Korea Won |
| LIBOR | — London Interbank Offered Rate |
| LLC | — Limited Liability Company |
| LLP | — Limited Liability Partnership |
| MBIA | — Municipal Bond Insurance Association |
| MFHR | — Multi-Family Housing Revenue |
| MUD | — Municipal Utility District |
| NATL-RE | — National Public Finance Guarantee Corporation |
| PCFA | — Pollution Control Finance Authority |
| PCR | — Pollution Control Revenue |
| PFA | — Public Finance Authority |
| PFFA | — Public Facilities Financing Authority |
| PFOTER | — Puttable Floating Option Tax-Exempt Receipts |
| plc | — Public Limited Company |
| PUTTER | — Puttable Tax-Exempt Receipts |
| R&D | — Research & Development |
| RDA | — Redevelopment Authority |
| RDFA | — Redevelopment Finance Authority |
| REIT | — Real Estate Investment Trust |
| ROC | — Reset Option Certificates |
| SAVRS | — Select Auction Variable Rate Securities |
| SBA | — Small Business Authority |
| SFHR | — Single Family Housing Revenue |
| SFMR | — Single Family Mortgage Revenue |
| SPDR | — Standard & Poor’s Depositary Receipts |
| TAN | — Tax Anticipation Notes |
| TIPS | — Treasury Inflation-Protected Securities |
| TRAN | — Tax Revenue Anticipation Notes |
| TCR | — Transferable Custody Receipts |
| TTFA | — Transportation Trust Fund Authority |
| TVA | — Tennessee Valley Authority |
| XLCA | — XL Capital Assurance |
This page is intentionally left blank.
This page is intentionally left blank.


FOR MORE INFORMATION
More information about Wells Fargo Advantage Funds is available free upon request. To obtain literature, please write, e-mail, visit the Fund’s Web site, or call:
Wells Fargo Advantage Funds
P.O. Box 8266
Boston, MA 02266-8266
E-mail: wfaf@wellsfargo.com
Web site: www.wellsfargo.com/advantagefunds
Individual investors: 1-800-222-8222
Retail investment professionals: 1-888-877-9275
Institutional investment professionals: 1-866-765-0778
This report and the financial statements contained herein are submitted for the general information of the shareholders of Wells Fargo Advantage Funds. If this report is used for promotional purposes, distribution of the report must be accompanied or preceded by a current prospectus. For a prospectus containing more complete information, including charges and expenses, call 1-800-222-8222 or visit the Fund’s Web site at www.wellsfargo.com/advantagefunds. Please consider the investment objectives, risks, charges, and expenses of the investment carefully before investing. This and other information about Wells Fargo Advantage Funds can be found in the current prospectus. Read the prospectus carefully before you invest or send money.
Wells Fargo Funds Management, LLC, a wholly owned subsidiary of Wells Fargo & Company, provides investment advisory and administrative services for Wells Fargo Advantage Funds. Other affiliates of Wells Fargo & Company provide subadvisory and other services for the Funds. The Funds are distributed by Wells Fargo Funds Distributor, LLC, Member FINRA/SIPC, an affiliate of Wells Fargo & Company.
NOT FDIC INSURED ¡ NO BANK GUARANTEE ¡ MAY LOSE VALUE
© 2012 Wells Fargo Funds Management, LLC. All rights reserved.
| | |
 | | 207585 02-12 SA251/SAR251 12-11 |

Wells Fargo Advantage Minnesota Tax-Free Fund

Semi-Annual Report
December 31, 2011

Reduce clutter. Save trees.
Sign up for electronic delivery of prospectuses and shareholder reports at www.wellsfargo.com/advantagedelivery
Contents
The views expressed and any forward-looking statements are as of December 31, 2011, unless otherwise noted, and are those of the Fund managers and/or Wells Fargo Funds Management, LLC. Discussions of individual securities, or the markets generally, or any Wells Fargo Advantage Fund are not intended as individual recommendations. Future events or results may vary significantly from those expressed in any forward-looking statements; the views expressed are subject to change at any time in response to changing circumstances in the market. Wells Fargo Funds Management, LLC, disclaims any obligation to publicly update or revise any views expressed or forward-looking statements.
NOT FDIC INSURED ¡ NO BANK GUARANTEE ¡ MAY LOSE VALUE

WELLS FARGO INVESTMENT HISTORY
| | |
| |
| 1932 | | Keystone creates one of the first mutual fund families. |
| |
| 1971 | | Wells Fargo & Company introduces one of the first institutional index funds. |
| |
| 1978 | | Wells Fargo applies Markowitz and Sharpe’s research on Modern Portfolio Theory to introduce one of the industry’s first Tactical Asset Allocation (TAA) models in institutional separately managed accounts. |
| |
| 1984 | | Wells Fargo Stagecoach Funds launches its first asset allocation fund. |
| |
| 1989 | | The Tactical Asset Allocation (TAA) Model is first applied to Wells Fargo’s asset allocation mutual funds. |
| |
| 1994 | | Wells Fargo introduces the LifePath Funds, one of the first suites of target date funds (now the Wells Fargo Advantage Dow Jones Target Date FundsSM ). |
| |
| 1996 | | Evergreen Investments and Keystone Funds merge. |
| |
| 1997 | | Wells Fargo launches Wells Fargo Advantage WealthBuilder PortfoliosSM, a fund-of-funds suite of products that includes the use of quantitative models to shift assets among investment styles. |
| |
| 1999 | | Norwest Advantage Funds and Stagecoach Funds are reorganized into Wells Fargo Funds after the merger of Norwest and Wells Fargo. |
| |
| 2002 | | Evergreen Retail and Evergreen Institutional companies form the umbrella asset management company, Evergreen Investments. |
| |
| 2005 | | The integration of Strong Funds with Wells Fargo Funds creates Wells Fargo Advantage Funds, resulting in one of the top 20 mutual fund companies in the United States. |
| |
| 2006 | | Wells Fargo Advantage Funds relaunches the target date product line as Wells Fargo Advantage Dow Jones Target Date Funds. |
| |
| 2010 | | The mergers and reorganizations of Evergreen and Wells Fargo Advantage mutual funds are completed, unifying the families under the brand of Wells Fargo Advantage Funds. |
Wells Fargo Advantage Funds®
Wells Fargo Advantage Funds skillfully guides institutions, financial advisors, and individuals through the investment terrain to help them reach their financial objectives. Everything we do on behalf of investors is backed by our unique combination of qualifications.
Strength
Our organization is built on the standards of integrity and service established by our parent company—Wells Fargo & Company—more than 150 years ago. And, because we’re part of a highly diversified financial enterprise, we offer the depth of resources to help investors succeed.
Expertise
Our multi-boutique model offers investors access to the independent thinking of premier investment managers that have been chosen for their time-tested strategies. While each team specializes in a specific investment strategy, collectively they provide investors a wide choice of distinct investment styles. Our dedication to investment excellence doesn’t end with our expertise in manager selection—risk management, analysis, and rigorous ongoing review seek to ensure each manager’s investment process remains consistent.
Partnership
Our collaborative approach is built around understanding the needs and goals of our clients. By adhering to core principles of sound judgment and steady guidance, we support you through every stage of the investment decision process.
Carefully consider a fund’s investment objectives, risks, charges, and expenses before investing. For a current prospectus and, if available, a summary prospectus, containing this and other information, visit wellsfargo.com/advantagefunds. Read it carefully before investing.
Wells Fargo Funds Management, LLC, a wholly owned subsidiary of Wells Fargo & Company, provides investment advisory and administrative services for Wells Fargo Advantage Funds®. Other affiliates of Wells Fargo & Company provide subadvisory and other services for the Funds. The Funds are distributed by Wells Fargo Funds Distributor, LLC, Member FINRA/SIPC, an affiliate of Wells Fargo & Company.
“Dow Jones®” and “Dow Jones Target Date IndexesSM” are service marks of Dow Jones Trademark Holdings, LLC (“Dow Jones”), have been licensed to CME Group Index Services LLC (“CME Indexes”) and have been sublicensed for use for certain purposes by Global Index Advisors, Inc, and Wells Fargo Funds Management, LLC. The Wells Fargo Advantage Dow Jones Target Date FundsSM based on the Dow Jones Target Date IndexesSM, are not sponsored, endorsed, sold or promoted by Dow Jones, CME Indexes or their respective affiliates and none of them makes any representation regarding the advisability of investing in such product(s).
NOT FDIC INSURED ¡ NO BANK GUARANTEE ¡ MAY LOSE VALUE
Not part of the semi-annual report.
Wells Fargo Advantage Funds offers more than 110 mutual funds across a wide range of asset classes, representing over $216 billion in assets under management, as of December 31, 2011.
| | | | |
| Equity Funds | | | | |
Asia Pacific Fund | | Global Opportunities Fund | | Premier Large Company Growth Fund |
C&B Large Cap Value Fund | | Growth Fund | | Small Cap Opportunities Fund |
C&B Mid Cap Value Fund | | Health Care Fund | | Small Cap Value Fund |
Capital Growth Fund | | Index Fund | | Small Company Growth Fund |
Common Stock Fund | | International Equity Fund | | Small Company Value Fund |
Disciplined U.S. Core Fund | | International Value Fund | | Small/Mid Cap Core Fund |
Discovery Fund† | | Intrinsic Small Cap Value Fund | | Small/Mid Cap Value Fund |
Diversified Equity Fund | | Intrinsic Value Fund | | Social Sustainability Fund† |
Diversified International Fund | | Intrinsic World Equity Fund | | Special Mid Cap Value Fund |
Diversified Small Cap Fund | | Large Cap Core Fund | | Special Small Cap Value Fund |
Emerging Growth Fund | | Large Cap Growth Fund | | Specialized Technology Fund |
Emerging Markets Equity Fund | | Large Company Value Fund | | Strategic Large Cap Growth Fund |
Endeavor Select Fund† | | Omega Growth Fund | | Traditional Small Cap Growth Fund |
Enterprise Fund† | | Opportunity Fund† | | Utility and Telecommunications Fund |
Equity Value Fund | | Precious Metals Fund | | |
| Bond Funds | | | | |
Adjustable Rate Government Fund | | Inflation-Protected Bond Fund | | Short-Term Bond Fund |
California Limited-Term Tax-Free Fund | | Intermediate Tax/AMT-Free Fund | | Short-Term High Yield Bond Fund |
California Tax-Free Fund | | International Bond Fund | | Short-Term Municipal Bond Fund |
Colorado Tax-Free Fund | | Minnesota Tax-Free Fund | | Strategic Municipal Bond Fund |
Government Securities Fund | | Municipal Bond Fund | | Total Return Bond Fund |
High Income Fund | | North Carolina Tax-Free Fund | | Ultra Short-Term Income Fund |
High Yield Bond Fund | | Pennsylvania Tax-Free Fund | | Ultra Short-Term Municipal Income Fund |
Income Plus Fund | | Short Duration Government Bond Fund | | Wisconsin Tax-Free Fund |
| Asset Allocation Funds | | | | |
Asset Allocation Fund | | WealthBuilder Equity Portfolio† | | Target 2020 Fund† |
Conservative Allocation Fund | | WealthBuilder Growth Allocation Portfolio† | | Target 2025 Fund† |
Diversified Capital Builder Fund | | WealthBuilder Growth Balanced Portfolio† | | Target 2030 Fund† |
Diversified Income Builder Fund | | WealthBuilder Moderate Balanced Portfolio† | | Target 2035 Fund† |
Growth Balanced Fund | | WealthBuilder Tactical Equity Portfolio† | | Target 2040 Fund† |
Index Asset Allocation Fund | | Target Today Fund† | | Target 2045 Fund† |
Moderate Balanced Fund | | Target 2010 Fund† | | Target 2050 Fund† |
WealthBuilder Conservative Allocation Portfolio† | | Target 2015 Fund† | | Target 2055 Fund† |
| Money Market Funds | | | | |
100% Treasury Money Market Fund | | Heritage Money Market Fund† | | National Tax-Free Money Market Fund |
California Municipal Money Market Fund | | Money Market Fund | | Prime Investment Money Market Fund |
Cash Investment Money Market Fund | | Municipal Cash Management Money Market Fund | | Treasury Plus Money Market Fund |
Government Money Market Fund | | Municipal Money Market Fund | | |
| Variable Trust Funds1 | | | | |
VT Discovery Fund† | | VT Intrinsic Value Fund | | VT Small Cap Growth Fund |
VT Index Asset Allocation Fund | | VT Omega Growth Fund | | VT Small Cap Value Fund |
VT International Equity Fund | | VT Opportunity Fund† | | VT Total Return Bond Fund |
An investment in a money market fund is not insured or guaranteed by the Federal Deposit Insurance Corporation or any other government agency. Although the Wells Fargo Advantage Money Market Funds seek to preserve the value of your investment at $1.00 per share, it is possible to lose money by investing in a money market fund.
| 1. | The Variable Trust Funds are generally available only through insurance company variable contracts. |
| † | In this report, the Wells Fargo Advantage Discovery FundSM, Wells Fargo Advantage Endeavor Select FundSM, Wells Fargo Advantage Enterprise FundSM, Wells Fargo Advantage Opportunity FundSM, Wells Fargo Advantage Social Sustainability FundSM, Wells Fargo Advantage WealthBuilder Conservative Allocation PortfolioSM, Wells Fargo Advantage WealthBuilder Equity PortfolioSM, Wells Fargo Advantage WealthBuilder Growth Allocation PortfolioSM, Wells Fargo Advantage WealthBuilder Growth Balanced PortfolioSM, Wells Fargo Advantage WealthBuilder Moderate Balanced PortfolioSM, Wells Fargo Advantage WealthBuilder Tactical Equity PortfolioSM, Wells Fargo Advantage Dow Jones Target Today FundSM, Wells Fargo Advantage Dow Jones Target 2010 FundSM, Wells Fargo Advantage Dow Jones Target 2015 FundSM, Wells Fargo Advantage Dow Jones Target 2020 FundSM, Wells Fargo Advantage Dow Jones Target 2025 FundSM, Wells Fargo Advantage Dow Jones Target 2030 FundSM, Wells Fargo Advantage Dow Jones Target 2035 FundSM, Wells Fargo Advantage Dow Jones Target 2040 FundSM, Wells Fargo Advantage Dow Jones Target 2045 FundSM, Wells Fargo Advantage Dow Jones Target 2050 FundSM, Wells Fargo Advantage Dow Jones Target 2055 FundSM, Wells Fargo Advantage Heritage Money Market FundSM, Wells Fargo Advantage VT Discovery FundSM, and Wells Fargo Advantage VT Opportunity FundSM are referred to as the Discovery Fund, Endeavor Select Fund, Enterprise Fund, Opportunity Fund, Social Sustainability Fund, WealthBuilder Conservative Allocation Portfolio, WealthBuilder Equity Portfolio, WealthBuilder Growth Allocation Portfolio, WealthBuilder Growth Balanced Portfolio, WealthBuilder Moderate Balanced Portfolio, WealthBuilder Tactical Equity Portfolio, Target Today Fund, Target 2010 Fund, Target 2015 Fund, Target 2020 Fund, Target 2025 Fund, Target 2030 Fund, Target 2035 Fund, Target 2040 Fund, Target 2045 Fund, Target 2050 Fund, Target 2055 Fund, Heritage Money Market Fund, VT Discovery Fund, and VT Opportunity Fund, respectively. |
Not part of the semi-annual report.
| | | | |
| 2 | | Wells Fargo Advantage Minnesota Tax-Free Fund | | Letter to Shareholders |

Karla M. Rabusch,
President
Wells Fargo Advantage Funds
For the entire six-month period, most of the major fixed-income indexes posted solid positive returns. However, the market’s six-month return figures mask the uneven path that the financial markets traced since the summer as investors had to contend with a variety of global and domestic headwinds.
Dear Valued Shareholder:
We’re pleased to offer you this semi-annual report for the Wells Fargo Advantage Minnesota Tax-Free Fund for the six-month period that ended December 31, 2011. Upon reviewing the report, you may notice a few changes from past reports, the most significant of which is the change from a multi-fund report to a single-fund report. We made this change to make it easier for you to find your fund information.
For the entire six-month period, most of the major fixed-income indexes posted solid positive returns. However, the market’s six-month return figures mask the uneven path that the financial markets traced since the summer as investors had to contend with a variety of global and domestic headwinds. Whatever the future holds, we continue to believe that most investors can benefit from adhering to a well-diversified investment strategy. Over the long-term, such a strategy may allow you to balance risks and opportunities as you pursue your financial goals in a dynamic market landscape.
The economic recovery gained traction as the year progressed.
The U.S. economic recovery that began in mid-2009 has experienced a few slow patches along the way. However, the recovery regained some upward momentum during the six-month period, yet the rate of growth remained subpar compared with most previous recovery cycles.
In September 2011, it was reported that U.S. gross domestic product (GDP) grew at a mere 1.3% annual rate in the second quarter of 2011, following anemic growth at an annual rate of 0.4% in the first quarter. According to the December estimate, GDP growth accelerated to an annual rate of 1.8% in the third quarter, reigniting hopes for a sustainable recovery. Those hopes were buoyed by widespread anticipation of even stronger GDP growth in the fourth quarter. By year-end, few economists believed that the U.S. economy was in danger of sliding back into recession, although many expected a sluggish growth environment in 2012.
The struggling housing and labor markets slowed growth.
As has been the case throughout the recovery, the housing and labor markets continued to restrain economic momentum during 2011.
The beleaguered housing market has arguably exerted the biggest drag on growth. Despite intermittent signs of improvement, ongoing weakness in sales of both new and existing homes has put considerable downward pressure on prices. On the other hand, the labor market took a decided turn for the better during the final months of 2011: initial unemployment claims have eased, and the private sector has been steadily adding jobs. The pace of hiring, while not brisk, was sufficient to push the U.S. unemployment rate down to 8.5% as of December 2011—still well above its historical average but at its lowest level since February 2009. Many observers expect the unemployment rate to decline further in 2012, which could act as a tailwind for consumer spending—widely viewed as one of the keys to long-term economic growth.
The Federal Reserve announced that it will keep rates low until 2013.
Consumers have already demonstrated some resilience in their spending—even in the face of higher energy costs. Oil prices skyrocketed in early 2011 before
| | | | | | |
| Letter to Shareholders | | Wells Fargo Advantage Minnesota Tax-Free Fund | | | 3 | |
retreating later in the year, only to spike again during the fourth quarter. Yet “core” inflation, which excludes volatile energy and food prices, remained fairly benign throughout the year.
With inflation in check, the Federal Reserve (Fed) held its target range for the federal funds rate—a proxy for short-term interest rates—steady at 0% to 0.25%. Following its August 9, 2011 meeting, the Federal Open Market Committee issued a statement explaining that economic conditions were likely to warrant exceptionally low levels for the federal funds rate through at least mid-2013. In September, the Fed launched yet another stimulus program—dubbed “Operation Twist”—that is designed to keep intermediate- and longer-term yields relatively low. The goal with keeping longer-term rates low is to encourage lending activity to spark business investments and home purchases, which, in turn, may provide support for a more sustainable economic recovery.
Market volatility was a dominant theme during the final six-months of the year
Early on in the period, market climate shifted to one of anxiety over the increasingly fragile state of the U.S. and global economies. In addition, investors not only worried that the U.S. might be on the brink of recession, they also feared that Europe’s sovereign debt problems could spiral out of control if a Greek default triggered financial contagion across the continent. In July and August, investor sentiment was further undermined by partisan wrangling over the federal debt ceiling and the downgrade of the U.S. credit rating by Standard & Poor’s. The barrage of unsettling headlines led to heightened market volatility and an increase in risk aversion, which translated into sharply falling stock prices and higher demand for “safer” assets such as Treasuries and municipals in the third quarter of 2011. Although volatility persisted into the fourth quarter, the financial markets were able to rebound amid improved U.S. economic data and hopes for a resolution to the European crisis.
For the entire six-month period, the Barclays Capital U.S. Aggregate Bond Index1, which represents the universe of investment-grade bonds, and the Barclays Capital U.S. Treasury Index2 added 4.98% and 7.43%, respectively. By comparison, the Barclays Capital Municipal Bond Index3 gained 6.02% over the last half of the year
Recent events have not altered our message to shareholders.
The market turmoil of 2011 and an uncertain outlook going forward have left many investors questioning their resolve—and their investments. Yet, it is precisely at such times that the market may present opportunities—as well as challenges—for prudent investors. Bear in mind that many investors who indiscriminately sold their equity investments during the severe market downturn of 2008 to 2009 missed out on the impressive two-year rally that followed. In our
| 1. | The Barclays Capital U.S. Aggregate Bond Index is composed of the Barclays Capital Government/Credit Index and the Mortgage-Backed Securities Index and includes U.S. Treasury issues, agency issues, corporate bond issues, and mortgage-backed securities. You cannot invest directly in an index. |
| 2. | The Barclays Capital U.S. Treasury Index is an index of U.S. Treasury Securities. You cannot invest directly in an index. |
| 3. | The Barclays Capital Municipal Bond Index is an unmanaged index composed of long-term tax-exempt bonds with a minimum credit rating of Baa. You cannot invest directly in an index. |
Although volatility persisted into the fourth quarter, the financial markets were able to rebound amid improved U.S. economic data and hopes for a resolution to the European crisis.
| | | | |
| 4 | | Wells Fargo Advantage Minnesota Tax-Free Fund | | Letter to Shareholders |
opinion, the lesson to be learned from these dramatic market events is that, for many investors, simply building and maintaining a well-diversified4 investment plan is the best long-term strategy.
Thank you for choosing to invest with Wells Fargo Advantage Funds. We appreciate your confidence in us and remain committed to helping you meet your financial needs. For current information about your fund investments, contact your investment professional, visit our website at www.wellsfargo.com/advantagefunds, or call us directly at 1-800-222-8222. We are available 24 hours a day, 7 days a week.
Sincerely,

Karla M. Rabusch
President
Wells Fargo Advantage Funds
| 4. | Diversification does not assure or guarantee better performance and cannot eliminate the risk of investment losses. |
| | | | | | |
| Letter to Shareholders | | Wells Fargo Advantage Minnesota Tax-Free Fund | | | 5 | |
|
|
Notice to Shareholders Effective April 1, 2012, the Fund may invest up to 10% of its total assets in inverse floaters to seek enhanced returns. Inverse floaters are derivative debt instruments created by depositing a municipal security in a trust. They pay interest at rates that generally vary inversely with specified short-term interest rates. The interest payment received on inverse floaters generally will decrease when specified short-term interest rates increase. Inverse floaters involve leverage, which may magnify the Fund’s gains or losses, and exhibit greater price and income volatility than bonds with similar maturities. We intend to limit leverage created by the Fund’s investment in inverse floaters to an amount equal to 10% of the Fund’s total assets. Inverse floaters are also subject to the risks associated with derivatives and municipal securities. |
|
|
Notice to Shareholders The Board of Trustees for Wells Fargo Advantage Funds has unanimously approved the following modifications to certain net asset value (NAV) waiver privileges and commission schedules: n Effective May 1, 2012, automatic investment plan (AIP) purchases and proceeds received from systematic withdrawals will no longer qualify for NAV repurchase privileges. n Effective May 1, 2012, discretionary rights to waive the upfront commission for Class C and “jumbo” Class A share purchases will no longer be granted to broker/dealers. However, we will continue to waive the Class C shares contingent deferred sales charge for redemptions by employer-sponsored retirement plans where the dealer of record waived its commission at the time of purchase. n Effective July 31, 2012, NAV purchase privileges for former Evergreen Class IS and Class R shareholders are being modified to remove the ability to purchase Class A shares at NAV unless those shares are held directly with the fund on or after July 31, 2012. |
| | | | |
| 6 | | Wells Fargo Advantage Minnesota Tax-Free Fund | | Performance Highlights (Unaudited) |
INVESTMENT OBJECTIVE
The Fund seeks current income exempt from federal income tax and Minnesota individual income tax.
ADVISER
Wells Fargo Funds Management, LLC
SUB-ADVISER
Wells Capital Management Incorporated
PORTFOLIO MANAGERS
Wendy Casetta
Bruce R. Johns1
Adrian Van Poppel1
FUND INCEPTION
January 12, 1988
|
CREDIT QUALITY2 (AS OF DECEMBER 31, 2011) |
|
 |
|
EFFECTIVE MATURITY DISTRIBUTION3 (AS OF DECEMBER 31, 2011) |
|
 |
| 1. | Effective January 3, 2012, Bruce Johns replaced Adrian Van Poppel as a portfolio manager of the Fund. |
| 2. | The ratings indicated are from Standard & Poor’s, Moody’s Investors Service, and/or Fitch Ratings Ltd. Credit Quality Ratings: Credit quality ratings apply to underlying holdings of the Fund and not the Fund itself. Standard and Poor’s rates the creditworthiness of bonds, ranging from AAA (highest) to D (lowest). Ratings from A to CCC may be modified by the addition of a plus (+) or minus (–) sign to show relative standing within the rating categories. Standard & Poor’s rates the creditworthiness of short-term notes from SP-1 (highest) to SP-3 (lowest). Ratings from A to CCC may be modified by the addition of a plus (+) or minus (–) sign to show relative standing within the rating categories. Moody’s rates the creditworthiness of bonds, ranging from Aaa (highest) to C (lowest). Ratings Aa to B may be modified by the addition of a number 1 (highest) to 3 (lowest) to show relative standing within the ratings categories. Moody’s rates the creditworthiness of short-term U.S. tax-exempt municipal securities from MIG 1/VMIG 1 (highest) to SG (lowest). Fitch rates the creditworthiness of bonds, ranging from AAA (highest) to D (lowest). If a security was rated by all three rating agencies, the middle rating was utilized. If rated by two of three rating agencies, the lower rating was utilized and if rated by one of the agencies that rating was utilized. Credit quality is subject to change and is calculated based on the total investments of the Fund. We generally define higher quality bonds as bonds that have a rating of BBB/Baa and above and lower quality bonds as bonds with a rating below BBB/Baa. |
| 3. | Effective maturity is calculated based on the total long-term investments of the Fund. It is subject to change and may have changed since the date specified. |
| | | | | | |
| Performance Highlights (Unaudited) | | Wells Fargo Advantage Minnesota Tax-Free Fund | | | 7 | |
AVERAGE ANNUAL TOTAL RETURN4 (%) (AS OF DECEMBER 31, 2011)
| | | | | | | | | | | | | | | | | | | | | | | | | | | | | | | | | | | | | | | | | | | | |
| | | | | | Including Sales Charge | | | Excluding Sales Charge | | | Expense Ratios5 | |
| | | Inception Date | | | 6 Months* | | | 1 Year | | | 5 Year | | | 10 Year | | | 6 Months* | | | 1 Year | | | 5 Year | | | 10 Year | | | Gross | | | Net6 | |
Class A (NMTFX) | | | 01/12/1988 | | | | 0.44 | | | | 4.81 | | | | 3.55 | | | | 4.25 | | | | 5.17 | | | | 9.75 | | | | 4.50 | | | | 4.73 | | | | 0.86% | | | | 0.85% | |
Class B (NWMBX)** | | | 08/06/1993 | | | | (0.22 | ) | | | 3.93 | | | | 3.38 | | | | 4.18 | | | | 4.78 | | | | 8.93 | | | | 3.73 | | | | 4.18 | | | | 1.61% | | | | 1.60% | |
Class C (WMTCX) | | | 04/08/2005 | | | | 3.78 | | | | 7.93 | | | | 3.74 | | | | 3.94 | | | | 4.78 | | | | 8.93 | | | | 3.74 | | | | 3.94 | | | | 1.61% | | | | 1.60% | |
Administrator Class (NWMIX) | | | 08/02/1993 | | | | | | | | | | | | | | | | | | | | 5.21 | | | | 9.92 | | | | 4.77 | | | | 4.96 | | | | 0.80% | | | | 0.60% | |
Barclays Capital Municipal Bond Index7 | | | | | | | | | | | | | | | | | | | | | | | 6.02 | | | | 10.70 | | | | 5.22 | | | | 5.38 | | | | | | | | | |
Barclays Capital Minnesota Municipal Bond Index8 | | | | | | | | | | | | | | | | | | | | | | | 5.25 | | | | 9.47 | | | | 5.49 | | | | 5.35 | | | | | | | | | |
| * | Returns for periods of less than one year are not annualized. |
| ** | Class B shares are closed to investment, except in connection with the reinvestment of any distributions and permitted exchanges. |
Figures quoted represent past performance, which is no guarantee of future results and do not reflect the deduction of taxes that a shareholder may pay on fund distributions or the redemption of fund shares. Investment return and principal value of an investment will fluctuate so that an investor’s shares, when redeemed, may be worth more or less than their original cost. Performance shown without sales charges would be lower if sales charges were reflected. Current performance may be lower or higher than the performance data quoted and assumes the reinvestment of dividends and capital gains. Current month-end performance is available on the Fund’s Web site – www.wellsfargo.com/advantagefunds.
Index returns do not include transaction costs associated with buying and selling securities, any mutual fund fees or expenses or any taxes. It is not possible to invest directly in an index.
For Class A shares, the maximum front-end sales charge is 4.50%. For Class B shares, the maximum contingent deferred sales charge is 5.00%. For Class C shares, the maximum contingent deferred sales charge is 1.00%. Performance including sales charge assumes the sales charge for the corresponding time period. Administrator Class shares are sold without a front-end sales charge or contingent deferred sales charge.
Bond fund values fluctuate in response to the financial condition of individual issuers, general market and economic conditions, and changes in interest rates. In general, when interest rates rise, bond fund values fall and investors may lose principal value. The use of derivatives may reduce returns and/or increase volatility. Certain investment strategies tend to increase the total risk of an investment (relative to the broader market). This Fund is exposed to Minnesota municipal securities risk, high-yield securities risk, and non-diversification risk. Consult the Fund’s prospectus for additional information on these and other risks. A portion of the Fund’s income may be subject to federal, state, and/or local income taxes or the alternative minimum tax (AMT). Any capital gains distributions may be taxable.
| 4. | Effective July 18, 2008, Class Z was renamed Administrator Class. Historical performance shown for Class C shares prior to their inception reflects the performance of Class A shares, adjusted to reflect the higher expenses applicable to Class C shares. |
| 5. | Reflects the expense ratios as stated in the most recent prospectuses. |
| 6. | The Adviser has committed through October 31, 2012 to waive fees and/or reimburse expenses to the extent necessary to cap the Fund’s Total Annual Fund Operating Expenses After Fee Waiver, excluding certain expenses, at the amounts shown above. Without this cap, the Fund’s returns would have been lower. |
| 7. | The Barclays Capital Municipal Bond Index is an unmanaged index composed of long-term tax-exempt bonds with a minimum credit rating of Baa. You cannot invest directly in an index. |
| 8. | The Barclays Capital Minnesota Municipal Bond Index is the Minnesota component of the Barclays Capital Municipal Bond Index. You cannot invest directly in an index. |
| | | | |
| 8 | | Wells Fargo Advantage Minnesota Tax-Free Fund | | Fund Expenses (Unaudited) |
As a shareholder of the Fund, you incur two types of costs: (1) transaction costs, including sales charges (loads) on purchase payments and contingent deferred sales charges (if any) on redemptions and (2) ongoing costs, including management fees; distribution (12b-1) and/or shareholder service fees; and other Fund expenses. This example is intended to help you understand your ongoing costs (in dollars) of investing in the Fund and to compare these costs with the ongoing costs of investing in other mutual funds.
The example is based on an investment of $1,000 invested at the beginning of the six-month period and held for the entire period from July 1, 2011 to December 31, 2011.
Actual Expenses
The “Actual” line of the table below provides information about actual account values and actual expenses. You may use the information in this line, together with the amount you invested, to estimate the expenses that you paid over the period. Simply divide your account value by $1,000 (for example, an $8,600 account value divided by $1,000 = 8.6), then multiply the result by the number in the “Actual” line under the heading entitled “Expenses Paid During Period” for your applicable class of shares to estimate the expenses you paid on your account during this period.
Hypothetical Example for Comparison Purposes
The “Hypothetical” line of the table below provides information about hypothetical account values and hypothetical expenses based on the Fund’s actual expense ratio and an assumed rate of return of 5% per year before expenses, which is not the Fund’s actual return. The hypothetical account values and expenses may not be used to estimate the actual ending account balance or expenses you paid for the period. You may use this information to compare the ongoing costs of investing in the Fund and other funds. To do so, compare this 5% hypothetical example with the 5% hypothetical examples that appear in the shareholder reports of the other funds.
Please note that the expenses shown in the table are meant to highlight your ongoing costs only and do not reflect any transactional costs, such as sales charges (loads) and contingent deferred sales charges. Therefore, the “Hypothetical” line of the table is useful in comparing ongoing costs only, and will not help you determine the relative total costs of owning different funds. In addition, if these transactional costs were included, your costs would have been higher.
| | | | | | | | | | | | | | | | |
| | | Beginning
Account Value
07-01-2011 | | | Ending
Account Value
12-31-2011 | | | Expenses
Paid During
the Period1 | | | Net Annual
Expense Ratio | |
Class A | | | | | | | | | | | | | | | | |
Actual | | $ | 1,000.00 | | | $ | 1,051.72 | | | $ | 4.38 | | | | 0.85 | % |
Hypothetical (5% return before expenses) | | $ | 1,000.00 | | | $ | 1,020.86 | | | $ | 4.32 | | | | 0.85 | % |
Class B | | | | | | | | | | | | | | | | |
Actual | | $ | 1,000.00 | | | $ | 1,047.77 | | | $ | 8.24 | | | | 1.60 | % |
Hypothetical (5% return before expenses) | | $ | 1,000.00 | | | $ | 1,017.09 | | | $ | 8.11 | | | | 1.60 | % |
Class C | | | | | | | | | | | | | | | | |
Actual | | $ | 1,000.00 | | | $ | 1,047.77 | | | $ | 8.24 | | | | 1.60 | % |
Hypothetical (5% return before expenses) | | $ | 1,000.00 | | | $ | 1,017.09 | | | $ | 8.11 | | | | 1.60 | % |
Administrator Class | | | | | | | | | | | | | | | | |
Actual | | $ | 1,000.00 | | | $ | 1,052.08 | | | $ | 3.09 | | | | 0.60 | % |
Hypothetical (5% return before expenses) | | $ | 1,000.00 | | | $ | 1,022.12 | | | $ | 3.05 | | | | 0.60 | % |
| 1. | Expenses paid is equal to the annualized expense ratio of each class multiplied by the average account value over the period, multiplied by the number of days in the most recent fiscal half-year divided by the number of days in the fiscal year (to reflect the one-half year period). |
| | | | | | |
| Portfolio of Investments—December 31, 2011 (Unaudited) | | Wells Fargo Advantage Minnesota Tax-Free Fund | | | 9 | |
| | | | | | | | | | | | | | | | |
| Security Name | | Interest Rate | | | Maturity Date | | | Principal | | | Value | |
| | | | | | | | | | | | | | | | |
| | | | |
Municipal Bonds and Notes: 98.78% | | | | | | | | | | | | | | | | |
| | | | |
| Guam: 1.97% | | | | | | | | | | | | | | | | |
Guam Government Business Privilege Tax Series A (Tax Revenue) | | | 5.00 | % | | | 01/01/2031 | | | $ | 1,000,000 | | | $ | 1,057,250 | |
Guam Government Business Privilege Tax Series A (Tax Revenue) | | | 5.13 | | | | 01/01/2042 | | | | 500,000 | | | | 519,635 | |
Guam Government Hotel Occupancy Series A (Tax Revenue) | | | 6.50 | | | | 11/01/2040 | | | | 1,000,000 | | | | 1,094,330 | |
Guam Limited Obligation Section 30 Series A (Miscellaneous Revenue) | | | 5.00 | | | | 12/01/2013 | | | | 500,000 | | | | 522,815 | |
| | | | |
| | | | | | | | | | | | | | | 3,194,030 | |
| | | | | | | | | | | | | | | | |
| | | | |
| Michigan: 0.85% | | | | | | | | | | | | | | | | |
Flint MI International Academy (Miscellaneous Revenue) | | | 5.50 | | | | 10/01/2027 | | | | 1,550,000 | | | | 1,385,778 | |
| | | | | | | | | | | | | | | | |
| | | | |
| Minnesota: 92.70% | | | | | | | | | | | | | | | | |
Anoka County MN Capital Improvement Series A (Tax Revenue) | | | 5.00 | | | | 02/01/2024 | | | | 500,000 | | | | 572,340 | |
Austin MN Housing & RDA Courtyard Residence Project Series A (Housing Revenue) | | | 5.00 | | | | 01/01/2031 | | | | 1,500,000 | | | | 1,626,075 | |
Baytown Township MN St. Croix Preparatory Academy Series A (Miscellaneous Revenue) | | | 7.00 | | | | 08/01/2038 | | | | 2,150,000 | | | | 2,144,668 | |
Becker MN PCR Northern States Power Series B (IDR)±§ | | | 8.50 | | | | 09/01/2019 | | | | 1,000,000 | | | | 1,057,580 | |
Buffalo MN Housing & RDA Public Facility Buffalo Wild Marsh Golf Course (Lease Revenue) | | | 4.38 | | | | 05/01/2024 | | | | 185,000 | | | | 191,168 | |
Center City MN Health Care Facilities Hazelden Foundation Project (Miscellaneous Revenue) | | | 5.00 | | | | 11/01/2041 | | | | 1,400,000 | | | | 1,431,780 | |
Cuyuna Range MN Hospital District (Health Revenue) | | | 4.75 | | | | 06/01/2013 | | | | 470,000 | | | | 474,611 | |
Dakota County MN Community Development Agency SFMR (Housing Revenue, GNMA, FNMA, FHLMC Insured) | | | 5.30 | | | | 12/01/2039 | | | | 509,656 | | | | 543,288 | |
Duluth MN Duluth Entertainment Convention Center Improvements Series A (Tax Revenue) | | | 5.00 | | | | 02/01/2034 | | | | 1,000,000 | | | | 1,055,720 | |
Duluth MN Housing & RDA Public School Academy Series A (Miscellaneous Revenue) | | | 5.60 | | | | 11/01/2030 | | | | 2,000,000 | | | | 1,873,860 | |
Elk River MN Independent School District # 728 Series A (Tax Revenue, AGM SD Credit Program Insured) | | | 5.00 | | | | 02/01/2021 | | | | 3,400,000 | | | | 3,805,484 | |
Falcon Heights MN Kaleidoscope Charter School Series A (Miscellaneous Revenue) | | | 5.50 | | | | 11/01/2017 | | | | 100,000 | | | | 100,540 | |
Falcon Heights MN Kaleidoscope Charter School Series A (Miscellaneous Revenue) | | | 6.00 | | | | 11/01/2027 | | | | 800,000 | | | | 745,032 | |
Itasca County MN Independent School District # 318 (Tax Revenue, AGM SD Credit Program Insured) | | | 5.00 | | | | 02/01/2017 | | | | 2,785,000 | | | | 2,795,499 | |
Lakeville MN (Miscellaneous Revenue) | | | 5.00 | | | | 02/01/2013 | | | | 160,000 | | | | 162,173 | |
Lakeville MN (Miscellaneous Revenue) | | | 5.00 | | | | 02/01/2016 | | | | 180,000 | | | | 182,380 | |
Maple Grove MN Maple Grove Hospital Corporation (Health Revenue) | | | 5.25 | | | | 05/01/2024 | | | | 1,735,000 | | | | 1,783,007 | |
Meeker County MN Memorial Hospital Project (Health Revenue) | | | 5.63 | | | | 11/01/2022 | | | | 800,000 | | | | 822,128 | |
Minneapolis & St. Paul MN Housing & RDA Health Partners Obligation Group Project (Health Revenue) | | | 5.25 | | | | 12/01/2016 | | | | 500,000 | | | | 530,950 | |
Minneapolis & St. Paul MN Housing & RDA Health Partners Obligation Group Project (Health Revenue) | | | 5.63 | | | | 12/01/2022 | | | | 500,000 | | | | 518,270 | |
Minneapolis & St. Paul MN Housing & RDA Health Partners Obligation Group Project (Health Revenue) | | | 5.88 | | | | 12/01/2029 | | | | 600,000 | | | | 614,928 | |
Minneapolis & St. Paul MN Housing & RDA HealthSpan Series B (Health Revenue, AMBAC Insured)±(a)(m)(n)§ | | | 0.18 | | | | 11/15/2017 | | | | 1,300,000 | | | | 1,114,174 | |
Minneapolis & St. Paul MN Metropolitan Airports Commission Senior Series A (Airport Revenue, AMBAC Insured) | | | 5.00 | | | | 01/01/2018 | | | | 1,000,000 | | | | 1,162,840 | |
Minneapolis & St. Paul MN Metropolitan Airports Commission Series A (Airport Revenue, NATL-RE Insured) | | | 5.25 | | | | 01/01/2017 | | | | 320,000 | | | | 335,949 | |
| | | | |
| 10 | | Wells Fargo Advantage Minnesota Tax-Free Fund | | Portfolio of Investments—December 31, 2011 (Unaudited) |
| | | | | | | | | | | | | | | | |
| Security Name | | Interest Rate | | | Maturity Date | | | Principal | | | Value | |
| | | | | | | | | | | | | | | | |
| | | | |
| Minnesota (continued) | | | | | | | | | | | | | | | | |
Minneapolis & St. Paul MN Metropolitan Airports Commission Series B (Airport Revenue, AMBAC Insured) | | | 5.00 | % | | | 01/01/2020 | | | $ | 2,000,000 | | | $ | 2,106,980 | |
Minneapolis & St. Paul MN Metropolitan Airports Commission Series C (Airport Revenue, NATL-RE FGIC Insured) | | | 5.00 | | | | 01/01/2022 | | | | 2,000,000 | | | | 2,109,920 | |
Minneapolis & St. Paul MN Metropolitan Airports Commission Sub Series B (Port Authority Revenue, NATL-RE FGIC Insured) | | | 5.00 | | | | 01/01/2018 | | | | 1,000,000 | | | | 1,131,960 | |
Minneapolis & St. Paul MN RDA Healthcare System Childrens Series A (Health Revenue) | | | 5.25 | | | | 08/15/2025 | | | | 1,000,000 | | | | 1,117,360 | |
Minneapolis MN Development Limited Tax Supported Bond (Miscellaneous Revenue) | | | 6.00 | | | | 12/01/2040 | | | | 1,000,000 | | | | 1,080,920 | |
Minneapolis MN Fairview Health Services Series A (Health Revenue) | | | 6.63 | | | | 11/15/2028 | | | | 1,000,000 | | | | 1,128,810 | |
Minneapolis MN Fairview Health Services Series B (Health Revenue, Assured Guaranty Insured) | | | 6.50 | | | | 11/15/2038 | | | | 1,900,000 | | | | 2,163,359 | |
Minneapolis MN St. Anthony Falls Project (Tax Revenue) | | | 5.65 | | | | 02/01/2027 | | | | 500,000 | | | | 472,805 | |
Minneapolis MN St. Mary’s Hospital & Rehabilitation (Health Revenue) | | | 10.00 | | | | 06/01/2013 | | | | 5,000 | | | | 5,412 | |
Minneapolis MN Supported Development Limited Tax Common Bond Fund Series 1A (Miscellaneous Revenue) | | | 4.80 | | | | 12/01/2016 | | | | 555,000 | | | | 607,425 | |
Minneapolis MN Supported Development Limited Tax Common Bond Fund Series 2A (Miscellaneous Revenue) | | | 5.00 | | | | 06/01/2028 | | | | 1,115,000 | | | | 1,116,004 | |
Minnesota Agricultural & Economic Development Board Essentia Health Series E (Health Revenue, Assured Guaranty Insured) | | | 5.00 | | | | 02/15/2037 | | | | 4,030,000 | | | | 4,164,965 | |
Minnesota Agricultural & Economic Development Board Essentia Health Series A (Health Revenue) | | | 4.75 | | | | 02/15/2015 | | | | 2,000,000 | | | | 2,055,160 | |
Minnesota Agricultural & Economic Development Board Evangelical Lutheran Project (Health Revenue) | | | 6.00 | | | | 02/01/2022 | | | | 1,210,000 | | | | 1,224,169 | |
Minnesota Agricultural & Economic Development Board Health Care Essentia C1 (Health Revenue, Assured Guaranty Insured) | | | 4.00 | | | | 02/15/2020 | | | | 50,000 | | | | 55,417 | |
Minnesota Agricultural & Economic Development Board Health Care Essentia C1 (Health Revenue, Assured Guaranty Insured) | | | 5.00 | | | | 02/15/2030 | | | | 1,000,000 | | | | 1,059,490 | |
Minnesota Agricultural & Economic Development Board Health Care System Unrefunded Balance Series A (Health Revenue, NATL-RE Insured) | | | 5.50 | | | | 11/15/2017 | | | | 1,095,000 | | | | 1,098,624 | |
Minnesota State (Tax Revenue) | | | 5.00 | | | | 06/01/2020 | | | | 1,115,000 | | | | 1,282,752 | |
Minnesota State HEFAR Bethel University Series 6R (Education Revenue) | | | 5.50 | | | | 05/01/2025 | | | | 1,535,000 | | | | 1,560,389 | |
Minnesota State HEFAR Carleton College Series D (Education Revenue) | | | 5.00 | | | | 03/01/2030 | | | | 2,000,000 | | | | 2,207,340 | |
Minnesota State HEFAR Hamline University Series 7-E (Education Revenue) | | | 5.00 | | | | 10/01/2029 | | | | 500,000 | | | | 521,195 | |
Minnesota State HEFAR Hamline University Series 7E (Education Revenue) | | | 4.50 | | | | 10/01/2021 | | | | 300,000 | | | | 324,246 | |
Minnesota State HEFAR St. Benedict College Series 7M (Education Revenue) | | | 5.13 | | | | 03/01/2036 | | | | 275,000 | | | | 277,079 | |
Minnesota State HEFAR St. Benedict College Series V (Education Revenue) | | | 5.00 | | | | 03/01/2018 | | | | 635,000 | | | | 717,544 | |
Minnesota State HEFAR St. Olaf College Series 7F (Education Revenue) | | | 4.50 | | | | 10/01/2030 | | | | 500,000 | | | | 522,260 | |
Minnesota State HEFAR St. Thomas University Series 6W (Education Revenue) | | | 5.00 | | | | 10/01/2018 | | | | 1,100,000 | | | | 1,239,403 | |
Minnesota State HEFAR St. Thomas University Series 6W (Education Revenue) | | | 6.00 | | | | 10/01/2025 | | | | 1,030,000 | | | | 1,132,310 | |
Minnesota State HEFAR St. Thomas University Series 6W (Education Revenue) | | | 6.00 | | | | 10/01/2030 | | | | 1,000,000 | | | | 1,089,330 | |
Minnesota State HEFAR St. Thomas University Series 6X (Education Revenue) | | | 5.00 | | | | 04/01/2029 | | | | 1,000,000 | | | | 1,063,450 | |
Minnesota State HFA Residential Housing Finance Agency Series B (Housing Revenue, GO of Agency Insured) | | | 5.00 | | | | 07/01/2034 | | | | 410,000 | | | | 412,813 | |
Minnesota State Highway & Various Purposes (Tax Revenue) | | | 5.00 | | | | 08/01/2022 | | | | 4,500,000 | | | | 5,234,895 | |
Minnesota State Housing Finance Agency (Housing Revenue) | | | 4.20 | | | | 07/01/2021 | | | | 1,600,000 | | | | 1,701,584 | |
Minnesota State Housing Finance Agency Residential Housing Finance Series B (Housing Revenue, GO of Agency Insured) | | | 4.75 | | | | 07/01/2026 | | | | 805,000 | | | | 810,675 | |
Minnesota State Housing Finance Agency Residential Housing Finance Series Q (Housing Revenue, GO of Agency Insured) | | | 5.25 | | | | 07/01/2033 | | | | 1,760,000 | | | | 1,795,341 | |
Minnesota State Housing Finance Agency Series A (Housing Revenue, NATL-RE Insured) | | | 5.35 | | | | 07/01/2017 | | | | 430,000 | | | | 448,262 | |
| | | | | | |
| Portfolio of Investments—December 31, 2011 (Unaudited) | | Wells Fargo Advantage Minnesota Tax-Free Fund | | | 11 | |
| | | | | | | | | | | | | | | | |
| Security Name | | Interest Rate | | | Maturity Date | | | Principal | | | Value | |
| | | | | | | | | | | | | | | | |
| | | | |
| Minnesota (continued) | | | | | | | | | | | | | | | | |
Minnesota State Housing Finance Agency Series B (Housing Revenue) | | | 5.90 | % | | | 07/01/2028 | | | $ | 750,000 | | | $ | 784,073 | |
Minnesota State Housing Finance Agency Series D (Housing Revenue, AMBAC GO of Agency Insured) | | | 5.80 | | | | 07/01/2021 | | | | 380,000 | | | | 398,411 | |
Minnesota State Municipal Power Agency (Utilities Revenue) | | | 5.00 | | | | 10/01/2037 | | | | 1,100,000 | | | | 1,146,772 | |
Minnesota State Public Facilities Authority Series B (Water & Sewer Revenue) | | | 5.00 | | | | 03/01/2020 | | | | 1,500,000 | | | | 1,893,525 | |
Minnesota State Public Safety Commission (Miscellaneous Revenue, Assured Guaranty Insured) | | | 5.00 | | | | 06/01/2019 | | | | 2,325,000 | | | | 2,890,091 | |
Minnesota State Various Purposes Series H (Tax Revenue) | | | 5.00 | | | | 11/01/2020 | | | | 1,425,000 | | | | 1,780,823 | |
Montgomery MN Independent School District School Building #394 Series B (Tax Revenue, AGM SD Credit Program Insured) | | | 5.00 | | | | 02/01/2025 | | | | 500,000 | | | | 544,135 | |
Mounds View MN Independent School District # 621 Series A (Tax Revenue, South Dakota Credit Program Insured) | | | 4.00 | | | | 02/01/2022 | | | | 530,000 | | | | 605,764 | |
Mower County MN Housing & RDA Facilities Project Series A (Lease Revenue) | | | 5.75 | | | | 02/01/2027 | | | | 695,000 | | | | 777,615 | |
Mower County MN Housing & RDA Facilities Project Series A (Lease Revenue) | | | 5.90 | | | | 02/01/2029 | | | | 375,000 | | | | 418,995 | |
Northern Minnesota Municipal Power Agency Series A (Utilities Revenue, Assured Guaranty Insured) | | | 5.00 | | | | 01/01/2016 | | | | 1,500,000 | | | | 1,717,680 | |
Northern Minnesota Municipal Power Agency Series A (Utilities Revenue, Assured Guaranty Insured) | | | 5.00 | | | | 01/01/2018 | | | | 820,000 | | | | 981,040 | |
Northern Minnesota Municipal Power Agency Series A (Utilities Revenue, Assured Guaranty Insured) | | | 5.00 | | | | 01/01/2021 | | | | 615,000 | | | | 709,095 | |
Pine City MN Lakes International Language Academy Series A (Miscellaneous Revenue) | | | 6.00 | | | | 05/01/2026 | | | | 1,000,000 | | | | 954,610 | |
Pine City MN Lakes International Language Academy Series A (Miscellaneous Revenue) | | | 6.25 | | | | 05/01/2035 | | | | 900,000 | | | | 836,451 | |
Pine County MN Housing & RDA Public Project Series A (Lease Revenue) | | | 5.00 | | | | 02/01/2028 | | | | 1,475,000 | | | | 1,513,822 | |
Plymouth MN COP Intermediate School District # 287 Series A (Lease Revenue) | | | 5.00 | | | | 02/01/2024 | | | | 250,000 | | | | 287,653 | |
Robbinsdale MN Independent School District #281 Series A (Tax Revenue, South Dakota Credit Program Insured) | | | 5.00 | | | | 02/01/2018 | | | | 1,520,000 | | | | 1,882,778 | |
Robbinsdale MN Independent School District #281 Series A (Tax Revenue, South Dakota Credit Program Insured) | | | 5.00 | | | | 02/01/2019 | | | | 1,715,000 | | | | 2,163,867 | |
Rochester MN Series C (Utilities Revenue) | | | 5.00 | | | | 12/01/2030 | | | | 1,000,000 | | | | 1,076,590 | |
Shakopee MN St. Francis Regional Medical Center (Health Revenue) | | | 5.00 | | | | 09/01/2017 | | | | 1,500,000 | | | | 1,584,930 | |
Shakopee MN St. Francis Regional Medical Center (Health Revenue) | | | 5.25 | | | | 09/01/2034 | | | | 950,000 | | | | 952,271 | |
South St. Paul MN Housing & RDA Airport Project (IDR, Assured Guaranty Insured) | | | 4.70 | | | | 09/01/2019 | | | | 550,000 | | | | 589,369 | |
South St. Paul MN Housing & RDA Airport Project (IDR, Assured Guaranty Insured) | | | 5.13 | | | | 09/01/2029 | | | | 500,000 | | | | 513,635 | |
Southern Minnesota Municipal Power Agency Capital Appreciation Series A (Utilities Revenue, NATL-RE Insured)±§ | | | 3.78 | | | | 01/01/2015 | | | | 1,030,000 | | | | 1,016,826 | |
Southern Minnesota Municipal Power Agency Capital Appreciation Series A (Utilities Revenue, NATL-RE Insured)(z) | | | 3.05 | | | | 01/01/2020 | | | | 5,000,000 | | | | 3,918,150 | |
Southern Minnesota Municipal Power Agency Series A (Utilities Revenue) | | | 5.25 | | | | 01/01/2030 | | | | 2,000,000 | | | | 2,193,580 | |
St. Cloud MN Centracare Health System Series A (Health Revenue) | | | 5.13 | | | | 05/01/2030 | | | | 1,000,000 | | | | 1,052,930 | |
St. Louis Park MN Nicollett Health Services (Health Revenue) | | | 5.50 | | | | 07/01/2029 | | | | 1,000,000 | | | | 1,044,310 | |
St. Michael MN Independent School District # 885 (Tax Revenue, AGM SD Credit Program Insured) | | | 5.00 | | | | 02/01/2018 | | | | 1,050,000 | | | | 1,053,875 | |
St. Michael MN Independent School District # 885 (Tax Revenue, AGM SD Credit Program Insured) | | | 5.00 | | | | 02/01/2019 | | | | 2,000,000 | | | | 2,007,380 | |
St. Paul MN Housing & RDA Allina Health Systems Series A1 (Health Revenue) | | | 5.00 | | | | 11/15/2024 | | | | 2,000,000 | | | | 2,154,320 | |
St. Paul MN Housing & RDA Charter School Nova Classical Academy Series A (Lease Revenue) | | | 6.63 | | | | 09/01/2042 | | | | 865,000 | | | | 878,269 | |
St. Paul MN Housing & RDA Community Peace Academy Project Series A (Miscellaneous Revenue) | | | 5.00 | | | | 12/01/2036 | | | | 1,500,000 | | | | 1,228,845 | |
| | | | |
| 12 | | Wells Fargo Advantage Minnesota Tax-Free Fund | | Portfolio of Investments—December 31, 2011 (Unaudited) |
| | | | | | | | | | | | | | | | |
| Security Name | | Interest Rate | | | Maturity Date | | | Principal | | | Value | |
| | | | | | | | | | | | | | | | |
| | | | |
| Minnesota (continued) | | | | | | | | | | | | | | | | |
St. Paul MN Housing & RDA Community Peace Academy Project Series A (Miscellaneous Revenue) | | | 4.35 | % | | | 12/01/2014 | | | $ | 600,000 | | | $ | 598,356 | |
St. Paul MN Housing & RDA Gillette Childrens Specialty (Health Revenue) | | | 5.00 | | | | 02/01/2012 | | | | 225,000 | | | | 225,340 | |
St. Paul MN Housing & RDA Gillette Childrens Specialty (Health Revenue) | | | 5.00 | | | | 02/01/2013 | | | | 200,000 | | | | 203,888 | |
St. Paul MN Housing & RDA Gillette Childrens Specialty (Health Revenue) | | | 5.00 | | | | 02/01/2014 | | | | 225,000 | | | | 232,304 | |
St. Paul MN Housing & RDA Gillette Childrens Specialty (Health Revenue) | | | 5.00 | | | | 02/01/2015 | | | | 200,000 | | | | 208,162 | |
St. Paul MN Housing & RDA Gillette Childrens Specialty (Health Revenue) | | | 5.00 | | | | 02/01/2021 | | | | 500,000 | | | | 517,730 | |
St. Paul MN Housing & RDA Hmong Academy Project Series A (Miscellaneous Revenue) | | | 5.75 | | | | 09/01/2026 | | | | 650,000 | | | | 593,385 | |
St. Paul MN Housing & RDA Hmong Academy Project Series A (Miscellaneous Revenue) | | | 6.00 | | | | 09/01/2036 | | | | 500,000 | | | | 440,010 | |
St. Paul MN Housing & RDA Hope Community Academy Project Series A (Miscellaneous Revenue) | | | 6.25 | | | | 12/01/2019 | | | | 450,000 | | | | 433,143 | |
St. Paul MN Housing & RDA Parking Facilities Project Series A (Transportation Revenue) | | | 5.00 | | | | 08/01/2035 | | | | 875,000 | | | | 914,716 | |
St. Paul MN Housing & RDA Regions Hospital Project (Health Revenue) | | | 5.25 | | | | 05/15/2018 | | | | 1,700,000 | | | | 1,702,992 | |
St. Paul MN Housing & RDA Regions Hospital Project (Health Revenue) | | | 5.30 | | | | 05/15/2028 | | | | 3,000,000 | | | | 3,000,840 | |
St. Paul MN Housing & RDA St. Paul Academy & Summit (Education Revenue) | | | 5.00 | | | | 10/01/2024 | | | | 2,000,000 | | | | 2,175,640 | |
St. Paul MN Port Authority District Heating Series 14-S (IDR, Deutsche Bank AG LOC)±§ | | | 0.18 | | | | 12/01/2028 | | | | 3,000,000 | | | | 3,000,000 | |
Stillwater MN Private School Facilities Various Catholic Finance Corporation Project (Education Revenue)±§ | | | 0.25 | | | | 12/01/2022 | | | | 55,000 | | | | 55,000 | |
Tobacco Securitization Authority Minnesota Tobacco Settlement Series B (Tobacco Revenue) | | | 3.50 | | | | 03/01/2019 | | | | 525,000 | | | | 541,842 | |
Tobacco Securitization Authority Minnesota Tobacco Settlement Series B (Tobacco Revenue) | | | 4.00 | | | | 03/01/2017 | | | | 500,000 | | | | 543,255 | |
Tobacco Securitization Authority Minnesota Tobacco Settlement Series B (Tobacco Revenue) | | | 5.25 | | | | 03/01/2031 | | | | 2,500,000 | | | | 2,571,275 | |
Tobacco Securitization Authority Minnesota Tobacco Settlement Series B (Tobacco Revenue) | | | 5.00 | | | | 03/01/2019 | | | | 500,000 | | | | 564,090 | |
Todd Morrison Cass & Wadena Counties MN United Hospital District Lakewood (Tax Revenue) | | | 5.13 | | | | 12/01/2024 | | | | 1,000,000 | | | | 1,054,360 | |
University of Minnesota Series A (Education Revenue, GO of University Insured) | | | 5.00 | | | | 04/01/2021 | | | | 1,180,000 | | | | 1,428,756 | |
University of Minnesota Series A (Education Revenue, GO of University Insured) | | | 5.13 | | | | 04/01/2034 | | | | 1,000,000 | | | | 1,108,780 | |
University of Minnesota Series C (Education Revenue) | | | 5.00 | | | | 12/01/2020 | | | | 1,275,000 | | | | 1,557,961 | |
University of Minnesota State Supported Biomed Science (Education Revenue) | | | 5.00 | | | | 08/01/2036 | | | | 1,000,000 | | | | 1,078,120 | |
University of Minnesota State Supported Stadium Debt (Education Revenue) | | | 5.00 | | | | 08/01/2025 | | | | 5,000,000 | | | | 5,671,850 | |
Virginia MN Housing & RDA Healthcare Facility (Lease Revenue) | | | 5.25 | | | | 10/01/2025 | | | | 2,085,000 | | | | 2,122,655 | |
Washington County MN Capital Improvement Plan Series A (Tax Revenue) | | | 5.00 | | | | 02/01/2021 | | | | 2,495,000 | | | | 2,924,839 | |
Western Minnesota Municipal Power Agency (Utilities Revenue, NATL-RE Insured) | | | 9.75 | | | | 01/01/2016 | | | | 280,000 | | | | 362,040 | |
Western Minnesota Municipal Power Agency Series B (Utilities Revenue, NATL-RE Insured) | | | 5.00 | | | | 01/01/2015 | | | | 500,000 | | | | 559,490 | |
| | | | |
| | | | | | | | | | | | | | | 150,627,391 | |
| | | | | | | | | | | | | | | | |
| | | | |
| Puerto Rico: 0.35% | | | | | | | | | | | | | | | | |
Puerto Rico Electric Power Authority Series II Prerefunded (Utilities Revenue, XLCA Insured) | | | 5.25 | | | | 07/01/2022 | | | | 25,000 | | | | 25,883 | |
University of Puerto Rico Series Q (Education Revenue) | | | 5.00 | | | | 06/01/2016 | | | | 500,000 | | | | 533,635 | |
| | | | |
| | | | | | | | | | | | | | | 559,518 | |
| | | | | | | | | | | | | | | | |
| | | | | | |
| Portfolio of Investments—December 31, 2011 (Unaudited) | | Wells Fargo Advantage Minnesota Tax-Free Fund | | | 13 | |
| | | | | | | | | | | | | | | | |
| Security Name | | Interest Rate | | | Maturity Date | | | Principal | | | Value | |
| | | | | | | | | | | | | | | | |
| | | | |
| Virgin Islands: 2.91% | | | | | | | | | | | | | | | | |
Virgin Islands PFA Matching Fund Loan Notes Senior Lien Series A (Water & Sewer Revenue) | | | 5.00 | % | | | 10/01/2014 | | | $ | 750,000 | | | $ | 799,755 | |
Virgin Islands PFA Matching Fund Loan Notes Senior Lien Series A (Tax Revenue) | | | 5.00 | | | | 10/01/2029 | | | | 1,120,000 | | | | 1,142,187 | |
Virgin Islands PFA Matching Fund Loan Notes Senior Lien Series A (Tax Revenue) | | | 6.75 | | | | 10/01/2037 | | | | 650,000 | | | | 707,837 | |
Virgin Islands PFA Subordinated Matching Fund Loan Notes Series A (Miscellaneous Revenue) | | | 6.00 | | | | 10/01/2039 | | | | 1,000,000 | | | | 1,041,350 | |
Virgin Islands PFA Matching Fund Loan Series A (Tax Revenue) | | | 5.00 | | | | 10/01/2025 | | | | 1,000,000 | | | | 1,042,384 | |
| | | | |
| | | | | | | | | | | | | | | 4,733,513 | |
| | | | | | | | | | | | | | | | |
| | | | |
Total Municipal Bonds and Notes (Cost $151,403,625) | | | | | | | | | | | | | | | 160,500,230 | |
| | | | | | | | | | | | | | | | |
| | | | |
| | | Yield | | | | | | | | | | |
| Short-Term Investments: 0.03% | | | | | | | | | | | | | | | | |
| | | | |
| U.S. Treasury Securities: 0.03% | | | | | | | | | | | | | | | | |
U.S. Treasury Bill# | | | 0.02 | | | | 03/29/2012 | | | | 50,000 | | | | 49,998 | |
| | | | | | | | | | | | | | | | |
| | | | |
Total Short-Term Investments (Cost $49,998) | | | | | | | | | | | | | | | 49,998 | |
| | | | | | | | | | | | | | | | |
| | | | | | | | |
Total Investments in Securities
(Cost $151,453,623)* | | | 98.81 | % | | | 160,550,228 | |
Other Assets and Liabilities, Net | | | 1.19 | | | | 1,941,036 | |
| | | | | | | | |
| Total Net Assets | | | 100.00 | % | | $ | 162,491,264 | |
| | | | | | | | |
| ± | Variable rate investment. |
| § | These securities are subject to a demand feature which reduces the effective maturity. |
| (a) | Security is fair valued by the Management Valuation Team, and in certain instances by the Board of Trustees, in accordance with procedures approved by the Board of Trustees. |
| (m) | An auction-rate security whose interest rate resets at predetermined short-term intervals through a Dutch auction; rate shown represents the rate in effect at period-end. |
| (n) | Auction to set interest rate on security failed at period end due to insufficient investor interest; failed auction does not itself cause a default. |
| (z) | Zero coupon security. Rate represents yield to maturity. |
| # | All or a portion of this security is segregated as collateral for investments in derivative instruments. |
| * | Cost for federal income tax purposes is $151,446,896 and net unrealized appreciation (depreciation) consists of: |
| | | | |
Gross unrealized appreciation | | $ | 9,688,567 | |
Gross unrealized depreciation | | | (585,235 | ) |
| | | | |
Net unrealized appreciation | | $ | 9,103,332 | |
The accompanying notes are an integral part of these financial statements.
| | | | |
| 14 | | Wells Fargo Advantage Minnesota Tax-Free Fund | | Statement of Assets and Liabilities—December 31, 2011 (Unaudited) |
| | | | |
| | | | |
| |
Assets | | | | |
Investments in unaffiliated securities, at value (see cost below) | | $ | 160,550,228 | |
Cash | | | 113,552 | |
Receivable for investments sold | | | 340,694 | |
Receivable for Fund shares sold | | | 192,928 | |
Receivable for interest | | | 2,272,416 | |
Prepaid expenses and other assets | | | 10,168 | |
| | | | |
Total assets | | | 163,479,986 | |
| | | | |
| |
Liabilities | | | | |
Distributions payable | | | 234,720 | |
Payable for investments purchased | | | 566,351 | |
Payable for Fund shares redeemed | | | 68,909 | |
Payable for daily variation margin on open futures contracts | | | 6,703 | |
Advisory fee payable | | | 30,443 | |
Distribution fees payable | | | 5,808 | |
Due to other related parties | | | 24,923 | |
Accrued expenses and other liabilities | | | 50,865 | |
| | | | |
Total liabilities | | | 988,722 | |
| | | | |
Total net assets | | $ | 162,491,264 | |
| | | | |
| |
NET ASSETS CONSIST OF | | | | |
Paid-in capital | | $ | 153,075,986 | |
Undistributed net investment income | | | 458,421 | |
Accumulated net realized losses on investments | | | (118,346 | ) |
Net unrealized gains on investments | | | 9,075,203 | |
| | | | |
Total net assets | | $ | 162,491,264 | |
| | | | |
| |
COMPUTATION OF NET ASSET VALUE AND OFFERING PRICE PER SHARE1 | | | | |
Net assets – Class A | | $ | 53,873,173 | |
Shares outstanding – Class A | | | 4,953,428 | |
Net asset value per share – Class A | | | $10.88 | |
Maximum offering price per share – Class A2 | | | $11.39 | |
Net assets – Class B | | $ | 402,004 | |
Shares outstanding – Class B | | | 36,960 | |
Net asset value per share – Class B | | | $10.88 | |
Net assets – Class C | | $ | 8,306,629 | |
Shares outstanding – Class C | | | 763,810 | |
Net asset value per share – Class C | | | $10.88 | |
Net assets – Administrator Class | | $ | 99,909,458 | |
Shares outstanding – Administrator Class | | | 9,189,170 | |
Net asset value per share – Administrator Class | | | $10.87 | |
| |
Investments in unaffiliated securities, at cost | | $ | 151,453,623 | |
| | | | |
| 1. | The Fund has an unlimited number of authorized shares. |
| 2. | Maximum offering price is computed as 100/95.50 of net asset value. On investments of $50,000 or more, the offering price is reduced. |
The accompanying notes are an integral part of these financial statements.
| | | | | | |
| Statement of Operations—Six Months Ended December 31, 2011 (Unaudited) | | Wells Fargo Advantage Minnesota Tax-Free Fund | | | 15 | |
| | | | |
| | | | |
| |
Investment income | | | | |
Interest | | $ | 3,602,511 | |
Income from affiliated securities | | | 354 | |
| | | | |
Total investment income | | | 3,602,865 | |
| | | | |
| |
Expenses | | | | |
Advisory fee | | | 287,962 | |
Administration fees | | | | |
Fund level | | | 41,137 | |
Class A | | | 42,853 | |
Class B | | | 390 | |
Class C | | | 6,429 | |
Administrator Class | | | 51,230 | |
Shareholder servicing fees | | | | |
Class A | | | 66,957 | |
Class B | | | 609 | |
Class C | | | 10,046 | |
Administrator Class | | | 128,075 | |
Distribution fees | | | | |
Class B | | | 1,827 | |
Class C | | | 30,138 | |
Custody and accounting fees | | | 7,350 | |
Professional fees | | | 17,551 | |
Registration fees | | | 11,233 | |
Shareholder report expenses | | | 7,470 | |
Trustees’ fees and expenses | | | 5,390 | |
Other fees and expenses | | | 4,681 | |
| | | | |
Total expenses | | | 721,328 | |
Less: Fee waivers and/or expense reimbursements | | | (118,102 | ) |
| | | | |
Net expenses | | | 603,226 | |
| | | | |
Net investment income | | | 2,999,639 | |
| | | | |
| |
REALIZED AND UNREALIZED GAINS (LOSSES) ON INVESTMENTS | | | | |
| |
Net realized gains (losses) on: | | | | |
Unaffiliated securities | | | 2,651,265 | |
Futures transactions | | | (137,101 | ) |
| | | | |
Net realized gains on investments | | | 2,514,164 | |
| | | | |
| |
Net change in unrealized gains (losses) on: | | | | |
Unaffiliated securities | | | 2,843,761 | |
Futures transactions | | | (21,402 | ) |
| | | | |
Net change in unrealized gains (losses) on investments | | | 2,822,359 | |
| | | | |
Net realized and unrealized gains (losses) on investments | | | 5,336,523 | |
| | | | |
Net increase in net assets resulting from operations | | $ | 8,336,162 | |
| | | | |
The accompanying notes are an integral part of these financial statements.
| | | | |
| 16 | | Wells Fargo Advantage Minnesota Tax-Free Fund | | Statements of Changes in Net Assets |
| | | | | | | | | | | | | | | | |
| | | Six Months Ended
December 31, 2011
(Unaudited) | | | Year Ended
June 30, 2011 | |
| | | | |
Operations | | | | | | | | | | | | | | | | |
Net investment income | | | | | | $ | 2,999,639 | | | | | | | $ | 7,049,473 | |
Net realized gains (losses) on investments | | | | | | | 2,514,164 | | | | | | | | (73,874 | ) |
Net change in unrealized gains (losses) on investments | | | | | | | 2,822,359 | | | | | | | | (1,061,208 | ) |
| | | | | | | | | | | | | | | | |
Net increase in net assets resulting from operations | | | | | | | 8,336,162 | | | | | | | | 5,914,391 | |
| | | | | | | | | | | | | | | | |
| | | | |
Distributions to shareholders from | | | | | | | | | | | | | | | | |
Net investment income | | | | | | | | | | | | | | | | |
Class A | | | | | | | (945,597 | ) | | | | | | | (2,100,561 | ) |
Class B | | | | | | | (6,770 | ) | | | | | | | (21,260 | ) |
Class C | | | | | | | (111,473 | ) | | | | | | | (228,355 | ) |
Administrator Class | | | | | | | (1,935,799 | ) | | | | | | | (4,698,740 | ) |
Net realized gains | | | | | | | | | | | | | | | | |
Class A | | | | | | | (749,551 | ) | | | | | | | (132,602 | ) |
Class B | | | | | | | (5,639 | ) | | | | | | | (1,533 | ) |
Class C | | | | | | | (115,202 | ) | | | | | | | (17,760 | ) |
Administrator Class | | | | | | | (1,412,406 | ) | | | | | | | (260,936 | ) |
| | | | | | | | | | | | | | | | |
Total distributions to shareholders | | | | | | | (5,282,437 | ) | | | | | | | (7,461,747 | ) |
| | | | | | | | | | | | | | | | |
| | | | |
Capital share transactions | | | Shares | | | | | | | | Shares | | | | | |
Proceeds from shares sold | | | | | | | | | | | | | | | | |
Class A | | | 257,753 | | | | 2,799,138 | | | | 629,880 | | | | 6,751,548 | |
Class B | | | 0 | | | | 0 | | | | 1,684 | | | | 18,048 | |
Class C | | | 82,441 | | | | 895,134 | | | | 180,460 | | | | 1,947,702 | |
Administrator Class | | | 436,972 | | | | 4,742,445 | | | | 2,270,666 | | | | 24,045,069 | |
| | | | | | | | | | | | | | | | |
| | | | | | | 8,436,717 | | | | | | | | 32,762,367 | |
| | | | | | | | | | | | | | | | |
Reinvestment of distributions | | | | | | | | | | | | | | | | |
Class A | | | 125,625 | | | | 1,361,028 | | | | 159,394 | | | | 1,696,383 | |
Class B | | | 823 | | | | 8,909 | | | | 1,685 | | | | 17,970 | |
Class C | | | 18,008 | | | | 195,044 | | | | 19,376 | | | | 205,969 | |
Administrator Class | | | 157,998 | | | | 1,710,319 | | | | 208,711 | | | | 2,221,264 | |
| | | | | | | | | | | | | | | | |
| | | | | | | 3,275,300 | | | | | | | | 4,141,586 | |
| | | | | | | | | | | | | | | | |
Payment for shares redeemed | | | | | | | | | | | | | | | | |
Class A | | | (358,258 | ) | | | (3,876,162 | ) | | | (1,153,299 | ) | | | (12,143,307 | ) |
Class B | | | (14,294 | ) | | | (155,126 | ) | | | (46,443 | ) | | | (500,384 | ) |
Class C | | | (54,953 | ) | | | (593,624 | ) | | | (85,298 | ) | | | (899,217 | ) |
Administrator Class | | | (1,373,646 | ) | | | (14,898,164 | ) | | | (4,824,780 | ) | | | (51,257,818 | ) |
| | | | | | | | | | | | | | | | |
| | | | | | | (19,523,076 | ) | | | | | | | (64,800,726 | ) |
| | | | | | | | | | | | | | | | |
Net decrease in net assets resulting
from capital share transactions | | | | | | | (7,811,059 | ) | | | | | | | (27,896,773 | ) |
| | | | | | | | | | | | | | | | |
Total decrease in net assets | | | | | | | (4,757,334 | ) | | | | | | | (29,444,129 | ) |
| | | | | | | | | | | | | | | | |
| | | | |
Net assets | | | | | | | | | | | | | | | | |
Beginning of period | | | | | | | 167,248,598 | | | | | | | | 196,692,727 | |
| | | | | | | | | | | | | | | | |
End of period | | | | | | $ | 162,491,264 | | | | | | | $ | 167,248,598 | |
| | | | | | | | | | | | | | | | |
Undistributed net investment income | | | | | | $ | 458,421 | | | | | | | $ | 458,421 | |
| | | | | | | | | | | | | | | | |
The accompanying notes are an integral part of these financial statements.
| | | | | | |
| Financial Highlights | | Wells Fargo Advantage Minnesota Tax-Free Fund | | | 17 | |
(For a share outstanding throughout each period)
| | | | | | | | | | | | | | | | | | | | | | | | |
| | | Six Months Ended
December 31, 2011 (Unaudited) | | | Year Ended June 30, | |
| Class A | | | 2011 | | | 2010 | | | 2009 | | | 2008 | | | 2007 | |
Net asset value, beginning of period | | $ | 10.68 | | | $ | 10.75 | | | $ | 10.36 | | | $ | 10.56 | | | $ | 10.70 | | | $ | 10.74 | |
Net investment income | | | 0.19 | 1 | | | 0.40 | | | | 0.43 | 1 | | | 0.44 | 1 | | | 0.45 | 1 | | | 0.45 | |
Net realized and unrealized gains (losses) on investments | | | 0.35 | | | | (0.05 | ) | | | 0.40 | | | | (0.19 | ) | | | (0.10 | ) | | | (0.01 | ) |
| | | | | | | | | | | | | | | | | | | | | | | | |
Total from investment operations | | | 0.54 | | | | 0.35 | | | | 0.83 | | | | 0.25 | | | | 0.35 | | | | 0.44 | |
Distributions to shareholders from | | | | | | | | | | | | | | | | | | | | | | | | |
Net investment income | | | (0.19 | ) | | | (0.40 | ) | | | (0.43 | ) | | | (0.44 | ) | | | (0.46 | ) | | | (0.45 | ) |
Net realized gains | | | (0.15 | ) | | | (0.02 | ) | | | (0.01 | ) | | | (0.01 | ) | | | (0.03 | ) | | | (0.03 | ) |
| | | | | | | | | | | | | | | | | | | | | | | | |
Total distributions to shareholders | | | (0.34 | ) | | | (0.42 | ) | | | (0.44 | ) | | | (0.45 | ) | | | (0.49 | ) | | | (0.48 | ) |
Net asset value, end of period | | $ | 10.88 | | | $ | 10.68 | | | $ | 10.75 | | | $ | 10.36 | | | $ | 10.56 | | | $ | 10.70 | |
Total return2 | | | 5.17 | % | | | 3.39 | % | | | 8.11 | % | | | 2.49 | % | | | 3.32 | % | | | 4.14 | % |
Ratios to average net assets (annualized) | | | | | | | | | | | | | | | | | | | | | | | | |
Gross expenses | | | 0.88 | % | | | 0.86 | % | | | 0.89 | % | | | 0.94 | % | | | 1.06 | % | | | 1.07 | % |
Net expenses | | | 0.85 | % | | | 0.85 | % | | | 0.85 | % | | | 0.85 | % | | | 0.85 | % | | | 0.85 | % |
Net investment income | | | 3.53 | % | | | 3.76 | % | | | 3.97 | % | | | 4.32 | % | | | 4.26 | % | | | 4.18 | % |
Supplemental data | | | | | | | | | | | | | | | | | | | | | | | | |
Portfolio turnover rate | | | 18 | % | | | 25 | % | | | 25 | % | | | 28 | % | | | 39 | % | | | 19 | % |
Net assets, end of period (000’s omitted) | | | $53,873 | | | | $52,628 | | | | $56,885 | | | | $48,905 | | | | $43,617 | | | | $37,897 | |
| 1. | Calculated based upon average shares outstanding. |
| 2. | Total return calculations do not include any sales charges. Returns for periods of less than one year are not annualized. |
The accompanying notes are an integral part of these financial statements.
| | | | |
| 18 | | Wells Fargo Advantage Minnesota Tax-Free Fund | | Financial Highlights |
(For a share outstanding throughout each period)
| | | | | | | | | | | | | | | | | | | | | | | | |
| | | Six Months Ended
December 31, 2011 (Unaudited) | | | Year Ended June 30, | |
| Class B | | | 2011 | | | 2010 | | | 2009 | | | 2008 | | | 2007 | |
Net asset value, beginning of period | | $ | 10.68 | | | $ | 10.75 | | | $ | 10.36 | | | $ | 10.56 | | | $ | 10.69 | | | $ | 10.74 | |
Net investment income | | | 0.15 | 1 | | | 0.32 | 1 | | | 0.35 | 1 | | | 0.37 | 1 | | | 0.38 | 1 | | | 0.38 | |
Net realized and unrealized gains (losses) on investments | | | 0.35 | | | | (0.05 | ) | | | 0.40 | | | | (0.19 | ) | | | (0.10 | ) | | | (0.03 | ) |
| | | | | | | | | | | | | | | | | | | | | | | | |
Total from investment operations | | | 0.50 | | | | 0.27 | | | | 0.75 | | | | 0.18 | | | | 0.28 | | | | 0.35 | |
Distributions to shareholders from | | | | | | | | | | | | | | | | | | | | | | | | |
Net investment income | | | (0.15 | ) | | | (0.32 | ) | | | (0.35 | ) | | | (0.37 | ) | | | (0.38 | ) | | | (0.37 | ) |
Net realized gains | | | (0.15 | ) | | | (0.02 | ) | | | (0.01 | ) | | | (0.01 | ) | | | (0.03 | ) | | | (0.03 | ) |
| | | | | | | | | | | | | | | | | | | | | | | | |
Total distributions to shareholders | | | (0.30 | ) | | | (0.34 | ) | | | (0.36 | ) | | | (0.38 | ) | | | (0.41 | ) | | | (0.40 | ) |
Net asset value, end of period | | $ | 10.88 | | | $ | 10.68 | | | $ | 10.75 | | | $ | 10.36 | | | $ | 10.56 | | | $ | 10.69 | |
Total return2 | | | 4.78 | % | | | 2.62 | % | | | 7.30 | % | | | 1.72 | % | | | 2.64 | % | | | 3.27 | % |
Ratios to average net assets (annualized) | | | | | | | | | | | | | | | | | | | | | | | | |
Gross expenses | | | 1.62 | % | | | 1.61 | % | | | 1.65 | % | | | 1.69 | % | | | 1.82 | % | | | 1.82 | % |
Net expenses | | | 1.60 | % | | | 1.60 | % | | | 1.60 | % | | | 1.60 | % | | | 1.60 | % | | | 1.60 | % |
Net investment income | | | 2.78 | % | | | 3.00 | % | | | 3.24 | % | | | 3.58 | % | | | 3.51 | % | | | 3.43 | % |
Supplemental data | | | | | | | | | | | | | | | | | | | | | | | | |
Portfolio turnover rate | | | 18 | % | | | 25 | % | | | 25 | % | | | 28 | % | | | 39 | % | | | 19 | % |
Net assets, end of period (000’s omitted) | | | $402 | | | | $539 | | | | $1,005 | | | | $2,166 | | | | $4,166 | | | | $6,200 | |
| 1. | Calculated based upon average shares outstanding. |
| 2. | Total return calculations do not include any sales charges. Returns for periods of less than one year are not annualized. |
The accompanying notes are an integral part of these financial statements.
| | | | | | |
| Financial Highlights | | Wells Fargo Advantage Minnesota Tax-Free Fund | | | 19 | |
(For a share outstanding throughout each period)
| | | | | | | | | | | | | | | | | | | | | | | | |
| | | Six Months Ended
December 31, 2011 (Unaudited) | | | Year Ended June 30, | |
| Class C | | | 2011 | | | 2010 | | | 2009 | | | 2008 | | | 2007 | |
Net asset value, beginning of period | | $ | 10.68 | | | $ | 10.75 | | | $ | 10.36 | | | $ | 10.56 | | | $ | 10.69 | | | $ | 10.73 | |
Net investment income | | | 0.15 | 1 | | | 0.32 | | | | 0.35 | 1 | | | 0.36 | 1 | | | 0.37 | 1 | | | 0.36 | |
Net realized and unrealized gains (losses) on investments | | | 0.35 | | | | (0.05 | ) | | | 0.40 | | | | (0.18 | ) | | | (0.10 | ) | | | (0.01 | ) |
| | | | | | | | | | | | | | | | | | | | | | | | |
Total from investment operations | | | 0.50 | | | | 0.27 | | | | 0.75 | | | | 0.18 | | | | 0.27 | | | | 0.35 | |
Distributions to shareholders from | | | | | | | | | | | | | | | | | | | | | | | | |
Net investment income | | | (0.15 | ) | | | (0.32 | ) | | | (0.35 | ) | | | (0.37 | ) | | | (0.37 | ) | | | (0.36 | ) |
Net realized gains | | | (0.15 | ) | | | (0.02 | ) | | | (0.01 | ) | | | (0.01 | ) | | | (0.03 | ) | | | (0.03 | ) |
| | | | | | | | | | | | | | | | | | | | | | | | |
Total distributions to shareholders | | | (0.30 | ) | | | (0.34 | ) | | | (0.36 | ) | | | (0.38 | ) | | | (0.40 | ) | | | (0.39 | ) |
Net asset value, end of period | | $ | 10.88 | | | $ | 10.68 | | | $ | 10.75 | | | $ | 10.36 | | | $ | 10.56 | | | $ | 10.69 | |
Total return2 | | | 4.78 | % | | | 2.62 | % | | | 7.30 | % | | | 1.73 | % | | | 2.63 | % | | | 3.35 | % |
Ratios to average net assets (annualized) | | | | | | | | | | | | | | | | | | | | | | | | |
Gross expenses | | | 1.63 | % | | | 1.61 | % | | | 1.64 | % | | | 1.65 | % | | | 1.79 | % | | | 1.82 | % |
Net expenses | | | 1.60 | % | | | 1.60 | % | | | 0.60 | % | | | 1.59 | % | | | 1.60 | % | | | 1.60 | % |
Net investment income | | | 2.77 | % | | | 3.01 | % | | | 3.19 | % | | | 3.55 | % | | | 3.49 | % | | | 3.41 | % |
Supplemental data | | | | | | | | | | | | | | | | | | | | | | | | |
Portfolio turnover rate | | | 18 | % | | | 25 | % | | | 25 | % | | | 28 | % | | | 39 | % | | | 19 | % |
Net assets, end of period (000’s omitted) | | | $8,307 | | | | $7,670 | | | | $6,489 | | | | $4,163 | | | | $2,103 | | | | $1,245 | |
| 1. | Calculated based upon average shares outstanding. |
| 2. | Total return calculations do not include any sales charges. Returns for periods of less than one year are not annualized. |
The accompanying notes are an integral part of these financial statements.
| | | | |
| 20 | | Wells Fargo Advantage Minnesota Tax-Free Fund | | Financial Highlights |
(For a share outstanding throughout each period)
| | | | | | | | | | | | | | | | | | | | | | | | |
| | | Six Months Ended
December 31, 2011 (Unaudited) | | | Year Ended June 30, | |
| Administrator Class | | | 2011 | | | 2010 | | | 20091 | | | 20081 | | | 20071 | |
Net asset value, beginning of period | | $ | 10.68 | | | $ | 10.75 | | | $ | 10.36 | | | $ | 10.56 | | | $ | 10.69 | | | $ | 10.73 | |
Net investment income | | | 0.21 | 2 | | | 0.43 | 2 | | | 0.45 | 2 | | | 0.47 | 2 | | | 0.48 | 2 | | | 0.48 | |
Net realized and unrealized gains (losses) on investments | | | 0.34 | | | | (0.05 | ) | | | 0.40 | | | | (0.19 | ) | | | (0.10 | ) | | | (0.01 | ) |
| | | | | | | | | | | | | | | | | | | | | | | | |
Total from investment operations | | | 0.55 | | | | 0.38 | | | | 0.85 | | | | 0.28 | | | | 0.38 | | | | 0.47 | |
Distributions to shareholders from | | | | | | | | | | | | | | | | | | | | | | | | |
Net investment income | | | (0.21 | ) | | | (0.43 | ) | | | (0.45 | ) | | | (0.47 | ) | | | (0.48 | ) | | | (0.48 | ) |
Net realized gains | | | (0.15 | ) | | | (0.02 | ) | | | (0.01 | ) | | | (0.01 | ) | | | (0.03 | ) | | | (0.03 | ) |
| | | | | | | | | | | | | | | | | | | | | | | | |
Total distributions to shareholders | | | (0.36 | ) | | | (0.45 | ) | | | (0.46 | ) | | | (0.48 | ) | | | (0.51 | ) | | | (0.51 | ) |
Net asset value, end of period | | $ | 10.87 | | | $ | 10.68 | | | $ | 10.75 | | | $ | 10.36 | | | $ | 10.56 | | | $ | 10.69 | |
Total return3 | | | 5.21 | % | | | 3.65 | % | | | 8.37 | % | | | 2.74 | % | | | 3.67 | % | | | 4.40 | % |
Ratios to average net assets (annualized) | | | | | | | | | | | | | | | | | | | | | | | | |
Gross expenses | | | 0.82 | % | | | 0.80 | % | | | 0.82 | % | | | 0.86 | % | | | 0.89 | % | | | 0.89 | % |
Net expenses | | | 0.60 | % | | | 0.60 | % | | | 0.60 | % | | | 0.60 | % | | | 0.60 | % | | | 0.60 | % |
Net investment income | | | 3.78 | % | | | 4.00 | % | | | 4.22 | % | | | 4.57 | % | | | 4.49 | % | | | 4.43 | % |
Supplemental data | | | | | | | | | | | | | | | | | | | | | | | | |
Portfolio turnover rate | | | 18 | % | | | 25 | % | | | 25 | % | | | 28 | % | | | 39 | % | | | 19 | % |
Net assets, end of period (000’s omitted) | | | $99,909 | | | | $106,412 | | | | $132,313 | | | | $122,749 | | | | $111,194 | | | | $115,134 | |
| 1. | On July 18, 2008, Class Z was converted to Administrator Class. |
| 2. | Calculated based upon average shares outstanding. |
| 3. | Returns for periods of less than one year are not annualized. |
The accompanying notes are an integral part of these financial statements.
| | | | | | |
| Notes to Financial Statements (Unaudited) | | Wells Fargo Advantage Minnesota Tax-Free Fund | | | 21 | |
1. ORGANIZATION
Wells Fargo Funds Trust (the “Trust”), a Delaware statutory trust organized on March 10, 1999, is an open-end management investment company registered under the Investment Company Act of 1940, as amended (the “1940 Act”). These financial statements report on Wells Fargo Advantage Minnesota Tax-Free Fund (the “Fund”) which is a non-diversified series of the Trust.
2. SIGNIFICANT ACCOUNTING POLICIES
The following significant accounting policies, which are consistently followed in the preparation of the financial statements of the Fund, are in conformity with U.S. generally accepted accounting principles which require management to make estimates and assumptions that affect the reported amounts of assets and liabilities, disclosure of contingent assets and liabilities at the date of the financial statements, and the reported amounts of revenues and expenses during the reporting period. Actual results could differ from those estimates.
Securities valuation
Fixed income securities with maturities exceeding 60 days are valued based on available evaluated prices received from an independent pricing service approved by the Board of Trustees which may utilize both transaction data and market information such as yield, prices of securities of comparable quality, coupon rate, maturity, type of issue, trading characteristics and other market data. If valuations are not available from the pricing service or values received are deemed not representative of market value, values will be obtained from a third party broker-dealer or determined based on the Fund’s Fair Value Procedures.
Debt securities of sufficient credit quality with original maturities of 60 days or less generally are valued at amortized cost which approximates fair value. The amortized cost method involves valuing a security at its cost, plus accretion of discount or minus amortization of premium over the period until maturity.
Investments in open-end mutual funds and non-registered investment companies are generally valued at net asset value.
Investments which are not valued using any of the methods discussed above, are valued at their fair value, as determined by procedures established in good faith and approved by the Board of Trustees.
When-issued transactions
The Fund may purchase securities on a forward commitment or ‘when-issued’ basis. The Fund records a when-issued transaction on the trade date and will segregate assets to cover its obligation by confirming the availability of qualifying assets having a value sufficient to make payment for the securities purchased. Securities purchased on a when-issued basis are marked-to-market daily and the Fund begins earning interest on the settlement date. Losses may arise due to changes in the market value of the underlying securities or if the counterparty does not perform under the contract.
Futures contracts
The Fund may be subject to interest rate risk in the normal course of pursuing its investment objectives. The Fund may buy and sell futures contracts in order to gain exposure to, or protect against, changes in security values and interest rates. The primary risks associated with the use of futures contracts are the imperfect correlation between changes in market values of securities held by the Fund and the prices of futures contracts, and the possibility of an illiquid market.
Futures contracts are valued based upon their quoted daily settlement prices when available. The aggregate principal amounts of the contracts are not recorded in the financial statements. Fluctuations in the value of the contracts are recorded in the Statement of Assets and Liabilities as an asset or liability and in the Statement of Operations as unrealized gains or losses until the contracts are closed, at which point they are recorded as net realized gains or losses on futures contracts. With futures contracts, there is minimal counterparty risk to the Fund since futures are exchange traded and the exchange’s clearinghouse, as counterparty to all exchange traded futures, guarantees the futures against default.
Security transactions and income recognition
Securities transactions are recorded on a trade date basis. Realized gains or losses are reported on the basis of identified cost of securities delivered.
Interest income is accrued daily and bond discounts are accreted and premiums are amortized daily based on the effective interest method. To the extent debt obligations are placed on non-accrual status, any related interest income
| | | | |
| 22 | | Wells Fargo Advantage Minnesota Tax-Free Fund | | Notes to Financial Statements (Unaudited) |
may be reduced by writing off interest receivables when the collection of all or a portion of interest has become doubtful based on consistently applied procedures. If the issuer subsequently resumes interest payments or when the collectability of interest is reasonably assured, the debt obligation is removed from non-accrual status.
Distributions to shareholders
Distributions to shareholders from net investment income are accrued daily and paid monthly. Distributions from net realized gains, if any, are recorded on the ex-dividend date. Such distributions are determined in conformity with income tax regulations, which may differ from generally accepted accounting principles.
Federal and other taxes
The Fund intends to continue to qualify as a regulated investment company by distributing substantially all of its investment company taxable and tax-exempt income and any net realized capital gains (after reduction for capital loss carryforwards) sufficient to relieve it from all, or substantially all, federal income taxes. Accordingly, no provision for federal income taxes was required.
The Fund’s income and federal excise tax returns and all financial records supporting those returns for the prior three fiscal years are subject to examination by the federal and Delaware revenue authorities.
Under the recently enacted Regulated Investment Company Modernization Act of 2010, the Fund is permitted to carry forward capital losses incurred in taxable years which began after December 22, 2010 for an unlimited period. However, any losses incurred are required to be utilized prior to the losses incurred in pre-enactment taxable years. As a result of this ordering rule, pre-enactment capital loss carryforwards may be more likely to expire unused. Additionally, post-enactment capital losses that are carried forward will retain their character as either short-term or long-term capital losses rather than being considered all short-term as under previous law.
As of June 30, 2011, the Fund had $241,355 of current year deferred post-October capital losses, which would be treated as realized for tax purposes on the first day of the succeeding year.
Class allocations
The separate classes of shares offered by the Fund differ principally in applicable sales charges, distribution, shareholder servicing and administration fees. Shareholders of each class bear certain expenses that pertain to that particular class. All shareholders bear the common expenses of the Fund, earn income from the portfolio, and are allocated unrealized gains and losses pro rata based on the average daily net assets of each class, without distinction between share classes. Dividends are determined separately for each class based on income and expenses allocable to each class. Realized gains and losses are allocated to each class pro rata based upon the net assets of each class on the date realized. Differences in per share dividend rates generally result from the relative weightings of pro rata income and realized gain allocations and from differences in separate class expenses, including distribution, shareholder servicing and administration fees.
3. FAIR VALUATION MEASUREMENTS
Fair value measurements of investments are determined within a framework that has established a fair value hierarchy based upon the various data inputs utilized in determining the value of the Fund’s investments. The three-level hierarchy gives the highest priority to significant unadjusted quoted prices in active markets for identical assets or liabilities (Level 1) and the lowest priority to unobservable inputs (Level 3). The Fund’s investments are classified within the fair value hierarchy based on the lowest level of input that is significant to the fair value measurement. The inputs are summarized into three broad levels as follows:
| n | | Level 1 – quoted prices in active markets for identical securities |
| n | | Level 2 – other significant observable inputs (including quoted prices for similar securities, interest rates, prepayment speeds, credit risk, etc.) |
| n | | Level 3 – significant unobservable inputs (including the Fund’s own assumptions in determining the fair value of investments) |
The inputs or methodologies used for valuing securities are not necessarily an indication of the risk associated with investing in those securities.
| | | | | | |
| Notes to Financial Statements (Unaudited) | | Wells Fargo Advantage Minnesota Tax-Free Fund | | | 23 | |
As of December 31, 2011, the inputs used in valuing the Fund’s assets, which are carried at fair value, were as follows:
| | | | | | | | | | | | | | | | |
| Investments in Securities | | Quoted Prices (Level 1) | | | Significant Other
Observable Inputs (Level 2) | | | Significant Unobservable Inputs (Level 3) | | | Total | |
Municipal bonds and notes | | $ | 0 | | | $ | 159,386,056 | | | $ | 1,114,174 | | | $ | 160,500,230 | |
Short-term investments | | | | | | | | | | | | | | | | |
U.S. Treasury securities | | | 49,998 | | | | 0 | | | | 0 | | | | 49,998 | |
| | | $ | 49,998 | | | $ | 159,386,056 | | | $ | 1,114,174 | | | $ | 160,550,228 | |
As of December 31, 2011, the inputs used in valuing the Fund’s other financial instruments, which are carried at fair value, were as follows:
| | | | | | | | | | | | | | | | |
| Other financial instruments | | Quoted Prices (Level 1) | | | Significant Other
Observable Inputs (Level 2) | | | Significant Unobservable Inputs (Level 3) | | | Total | |
Futures contracts+ | | $ | (21,402 | ) | | $ | 0 | | | $ | 0 | | | $ | (21,402 | ) |
| + | Futures contracts are presented at the unrealized gains or losses on the instrument. |
Further details on the major security types listed above can be found in the Portfolio of Investments.
Transfers in and transfers out are recognized at the end of the reporting period. For the six months ended December 31, 2011, the Fund did not have any significant transfers into/out of Level 1 and Level 2.
The following is a reconciliation of assets in which significant unobservable inputs (Level 3) were used in determining fair value:
| | | | |
| | | Municipal
bonds and
notes | |
Balance as of June 30, 2011 | | $ | 1,105,833 | |
Accrued discounts (premiums) | | | 0 | |
Realized gains (losses) | | | 0 | |
Change in unrealized gains (losses) | | | 8,341 | |
Purchases | | | 0 | |
Sales | | | 0 | |
Transfers into Level 3 | | | 0 | |
Transfers out of Level 3 | | | 0 | |
Balance as of December 31, 2011 | | $ | 1,114,174 | |
Change in unrealized gains (losses)
relating to securities still held at December 31, 2011 | | $ | 8,341 | |
4. TRANSACTIONS WITH AFFILIATES AND OTHER EXPENSES
Advisory fee
The Trust has entered into an advisory contract with Wells Fargo Funds Management, LLC (“Funds Management”), an indirect wholly owned subsidiary of Wells Fargo & Company (“Wells Fargo”). The adviser is responsible for implementing investment policies and guidelines and for supervising the sub-adviser, who is responsible for day-to-day portfolio management of the Fund.
Pursuant to the contract, Funds Management is entitled to receive an annual advisory fee starting at 0.35% and declining to 0.25% as the average daily net assets of the Fund increase. For the six months ended December 31, 2011, the advisory fee was equivalent to an annual rate of 0.35% of the Fund’s average daily net assets.
Funds Management may retain the services of certain sub-advisers to provide daily portfolio management to the Fund. The fees related to sub-advisory services are borne directly by Funds Management and do not increase the overall fees paid by the Fund. Wells Capital Management Incorporated (“Wells Capital Management”), an affiliate of Funds Management, is the sub-adviser to the Fund and is entitled to receive a fee from Funds Management at an annual rate starting at 0.20% and declining to 0.10% as the average daily net assets of the Fund increase.
| | | | |
| 24 | | Wells Fargo Advantage Minnesota Tax-Free Fund | | Notes to Financial Statements (Unaudited) |
Administration and transfer agent fees
The Trust has entered into an administration agreement with Funds Management. Under this agreement, for providing administrative services, which includes paying fees and expenses for services provided by the transfer agent, sub-transfer agents, omnibus account servicers and record-keepers, Funds Management is entitled to receive from the Fund an annual fund level administration fee starting at 0.05% and declining to 0.03% as the average daily net assets of the Fund increase and a class level administration fee which is calculated based on the average daily net assets of each class as follows:
| | | | |
| | | Class Level Administration Fee | |
Class A, Class B, Class C | | | 0.16 | % |
Administrator Class | | | 0.10 | |
Funds Management has contractually waived and/or reimbursed advisory and administration fees to the extent necessary to maintain certain net operating expense ratios for the Fund. Waiver of fees and/or reimbursement of expenses by Funds Management were made first from fund level expenses on a proportionate basis and then from class specific expenses.
Distribution fees
The Trust has adopted a Distribution Plan for Class B and Class C shares of the Fund pursuant to Rule 12b-1 under the 1940 Act. Distribution fees are charged to Class B and Class C shares and paid to Wells Fargo Funds Distributor, LLC, the principal underwriter, at an annual rate of 0.75% of the average daily net assets of Class B and Class C shares.
For the six months ended December 31, 2011, Wells Fargo Funds Distributor, LLC received $4,264 from the sale of Class A shares and $74 and $25 in contingent deferred sales charges from redemptions of Class A and Class C shares, respectively.
Shareholder servicing fees
The Trust has entered into contracts with one or more shareholder servicing agents, whereby each class of the Fund is charged a fee at an annual rate of 0.25% of the average daily net assets of each respective class.
A portion of these total shareholder servicing fees were paid to affiliates of Wells Fargo.
5. INVESTMENT PORTFOLIO TRANSACTIONS
Purchases and sales of investments, excluding U.S. Government obligations (if any) and short-term securities (securities with maturities of one year or less at purchase date), for the six months ended December 31, 2011 were $28,980,697 and $37,499,401, respectively.
6. DERIVATIVE TRANSACTIONS
During the six months ended December 31, 2011, the Fund entered into futures contracts to take advantage of the differences between municipal and treasury yields and to help shorten duration of the portfolios.
At December 31, 2011, the Fund had short futures contracts outstanding as follows:
| | | | | | | | | | | | |
| Expiration Date | | Contracts | | Type | | Contract Value at December 31, 2011 | | | Net
Unrealized
Gains (Losses) | |
| March 2012 | | 39 Short | | 5-Year U.S. Treasury Note | | $ | 4,807,055 | | | $ | (21,402 | ) |
The Fund had an average notional amount of $4,219,182 in short futures contracts during the six months ended December 31, 2011.
On December 31, 2011, the cumulative unrealized losses on futures contracts in the amount of $21,402 is reflected in net unrealized gains on investments on the Statement of Assets and Liabilities. The payable for daily variation margin on open futures contracts reflected in the Statement of Assets and Liabilities only represents the current day’s variation margin. The realized losses and change in unrealized gains (losses) on futures contracts are reflected in the Statement of Operations.
| | | | | | |
| Notes to Financial Statements (Unaudited) | | Wells Fargo Advantage Minnesota Tax-Free Fund | | | 25 | |
7. BANK BORROWINGS
The Trust (excluding the money market funds) and Wells Fargo Variable Trust are parties to a $150,000,000 revolving credit agreement with State Street Bank and Trust Company, whereby the Fund is permitted to use bank borrowings for temporary or emergency purposes, such as to fund shareholder redemption requests. Interest under the credit agreement is charged to the Fund based on a borrowing rate equal to the higher of the Federal Funds rate in effect on that day plus 1.25% or the overnight LIBOR rate in effect on that day plus 1.25%. In addition, under the credit agreement, the Fund pays an annual commitment fee equal to 0.10% of the unused balance, which is allocated pro rata. Prior to September 6, 2011, the revolving credit agreement was for $125,000,000 and the annual commitment fee paid by the Fund was 0.125% of the unused balance. For the six months ended December 31, 2011, the Fund paid $120 in commitment fees.
For the six months ended December 31, 2011, there were no borrowings by the Fund under the agreement.
8. CONCENTRATION RISK
The Fund invests a substantial portion of its assets in issuers of municipal debt securities located in a single state, therefore, it may be more affected by economic and political developments in that state or region than would be a comparable general tax-exempt mutual fund.
9. INDEMNIFICATION
Under the Trust’s organizational documents, the officers and directors are indemnified against certain liabilities that may arise out of performance of their duties to the Trust. Additionally, in the normal course of business, the Trust may enter into contracts with service providers that contain a variety of indemnification clauses. The Trust’s maximum exposure under these arrangements is dependent on future claims that may be made against the Fund and, therefore, cannot be estimated.
10. NEW ACCOUNTING PRONOUNCEMENTS
In May 2011, the Financial Accounting Standards Board (“FASB”) issued Accounting Standards Update (“ASU”) No. 2011-04 “Amendments to Achieve Common Fair Value Measurement and Disclosure Requirements in U.S. GAAP and IFRSs”. ASU No. 2011-04 amends FASB ASC Topic 820, Fair Value Measurements and Disclosures, to establish common requirements for measuring fair value and for disclosing information about fair value measurements in accordance with GAAP. The ASU is effective prospectively for interim and annual periods beginning after December 15, 2011. Management expects that adoption of the ASU will result in additional disclosures in the financial statements, as applicable.
In April 2011, FASB issued ASU No. 2011-03 “Reconsideration of Effective Control for Repurchase Agreements”. ASU No. 2011-03 amends FASB ASC Topic 860, Transfers and Servicing, specifically the criteria required to determine whether a repurchase agreement (repo) and similar agreements should be accounted for as sales of financial assets or secured borrowings with commitments. ASU No. 2011-03 changes the assessment of effective control by focusing on the transferor’s contractual rights and obligations and removing the criterion to assess its ability to exercise those rights or honor those obligations. This could result in changes to the way entities account for certain transactions including repurchase agreements, mortgage dollar rolls and reverse repurchase agreements. The ASU will become effective on a prospective basis for new transfers and modifications to existing transactions as of the beginning of the first interim or annual period beginning on or after December 15, 2011. Management has evaluated the impact of adopting the ASU and expects no significant changes.
| | | | |
| 26 | | Wells Fargo Advantage Minnesota Tax-Free Fund | | Other Information (Unaudited) |
PROXY VOTING INFORMATION
A description of the policies and procedures that the Fund uses to determine how to vote proxies relating to portfolio securities is available without charge, upon request, by calling 1-800-222-8222, visiting our Web site at www.wellsfargo.com/advantagefunds, or visiting the SEC Web site at www.sec.gov. Information regarding how the Fund voted proxies relating to portfolio securities during the most recent 12-month period ended June 30 is available without charge on the Fund’s Web site at www.wellsfargo.com/advantagefunds or by visiting the SEC Web site at www.sec.gov.
PORTFOLIO HOLDINGS INFORMATION
The complete portfolio holdings for the Fund are publicly available on the Fund’s Web site (www.wellsfargo.com/advantagefunds) on a monthly, 30-day or more delayed basis. In addition, top ten holdings information for the Fund is publicly available on the Fund’s Web site on a monthly, seven-day or more delayed basis. The Fund files its complete schedule of portfolio holdings with the SEC for the first and third quarters of each fiscal year on Form N-Q, which is available without charge by visiting the SEC Web site at www.sec.gov. In addition, the Fund’s Form N-Q may be reviewed and copied at the SEC’s Public Reference Room in Washington, DC, and at regional offices in New York City, at 233 Broadway, and in Chicago, at 175 West Jackson Boulevard, Suite 900. Information about the Public Reference Room may be obtained by calling 1-800-SEC-0330.
| | | | | | |
| Other Information (Unaudited) | | Wells Fargo Advantage Minnesota Tax-Free Fund | | | 27 | |
BOARD OF TRUSTEES
The following table provides basic information about the Board of Trustees (the “Trustees”) of the Trust and Officers of the Trust. This table should be read in conjunction with the Prospectus and the Statement of Additional Information1 of the Fund. Each of the Trustees and Officers listed below acts in identical capacities for the Wells Fargo Advantage family of funds, which consists of 138 funds comprising the Wells Fargo Funds Trust, Wells Fargo Variable Trust, Wells Fargo Master Trust and four closed-end funds (collectively the “Fund Complex”). All of the Trustees are also Members of the Audit and Governance Committees of each Trust in the Fund Complex. The mailing address of each Trustee and Officer is 525 Market Street, 12th Floor, San Francisco, CA 94105. Each Trustee and Officer serves an indefinite term, however, each Trustee serves such term until reaching the mandatory retirement age established by the Trustees.
Independent Trustees
| | | | | | |
Name and Year of Birth | | Position Held and Length of Service | | Principal Occupations During Past Five Years | | Other Directorships During
Past Five Years |
Peter G. Gordon
(Born 1942) | | Trustee, since 1998; Chairman, since 2005 (Lead Trustee since 2001) | | Co-Founder, Retired Chairman, President and CEO of Crystal Geyser Water Company. Trustee Emeritus, Colby College | | Asset Allocation Trust |
Isaiah Harris, Jr.
(Born 1952) | | Trustee, since 2009 | | Retired. Prior thereto, President and CEO of BellSouth Advertising and Publishing Corp. from 2005 to 2007, President and CEO of BellSouth Enterprises from 2004 to 2005 and President of BellSouth Consumer Services from 2000 to 2003. Emeritus member of the Iowa State University Foundation Board of Governors. Emeritus Member of the Advisory Board of Iowa State University School of Business. Mr. Harris is a certified public accountant. | | CIGNA Corporation; Deluxe Corporation; Asset Allocation Trust |
Judith M. Johnson
(Born 1949) | | Trustee, since 2008 | | Retired. Prior thereto, Chief Executive Officer and Chief Investment Officer of Minneapolis Employees Retirement Fund from 1996 to 2008. Ms. Johnson is an attorney, certified public accountant and a certified managerial accountant. | | Asset Allocation Trust |
Leroy Keith, Jr.
(Born 1939) | | Trustee, since 2010 | | Chairman, Bloc Global Services (development and construction). Trustee of the Evergreen Funds from 1983 to 2010. Former Managing Director, Almanac Capital Management (commodities firm), former Partner, Stonington Partners, Inc. (private equity fund), former Director, Obagi Medical Products Co. and former Director, Lincoln Educational Services. | | Trustee, Virtus Fund Complex (consisting of 40 portfolios as of 12/31/11); Asset Allocation Trust |
David F. Larcker
(Born 1950) | | Trustee, since 2009 | | James Irvin Miller Professor of Accounting at the Graduate School of Business, Stanford University, Director of Corporate Governance Research Program and Senior Faculty of The Rock Center for Corporate Governance since 2006. From 2005 to 2008, Professor of Accounting at the Graduate School of Business, Stanford University. Prior thereto, Ernst & Young Professor of Accounting at The Wharton School, University of Pennsylvania from 1985 to 2005. | | Asset Allocation Trust |
Olivia S. Mitchell
(Born 1953) | | Trustee, since 2006 | | International Foundation of Employee Benefit Plans Professor, Wharton School of the University of Pennsylvania since 1993. Director of Wharton’s Pension Research Council and Boettner Center on Pensions & Retirement Research, and Research Associate at the National Bureau of Economic Research. Previously, Cornell University Professor from 1978 to 1993. | | Asset Allocation Trust |
| | | | |
| 28 | | Wells Fargo Advantage Minnesota Tax-Free Fund | | Other Information (Unaudited) |
| | | | | | |
Name and Year of Birth | | Position Held and Length of Service | | Principal Occupations During Past Five Years | | Other Directorships During
Past Five Years |
Timothy J. Penny
(Born 1951) | | Trustee, since 1996 | | President and CEO of Southern Minnesota Initiative Foundation, a non-profit organization, since 2007 and Senior Fellow at the Humphrey Institute Policy Forum at the University of Minnesota since 1995. Member of the Board of Trustees of NorthStar Education Finance, Inc., a non-profit organization, since 2007. | | Asset Allocation Trust |
Michael S. Scofield
(Born 1943) | | Trustee, since 2010 | | Served on the Investment Company Institute’s Board of Governors and Executive Committee from 2008-2011 as well the Governing Council of the Independent Directors Council from 2006-2011 and the Independent Directors Council Executive Committee from 2008-2011. Chairman of the IDC from 2008-2010. Institutional Investor (Fund Directions) Trustee of Year in 2007. Trustee of the Evergreen Funds (and its predecessors) from 1984 to 2010. Chairman of the Evergreen Funds from 2000-2010. Former Trustee of the Mentor Funds. Retired Attorney, Law Offices of Michael S. Scofield and former Director and Chairman, Branded Media Corporation (multi-media branding company). | | Asset Allocation Trust |
Donald C. Willeke
(Born 1940) | | Trustee, since 1996 | | Principal of the law firm of Willeke & Daniels. General Counsel of the Minneapolis Employees Retirement Fund from 1984 until its consolidation into the Minnesota Public Employees Retirement Association on June 30, 2010. Director and Vice Chair of The Free Trust (non-profit corporation). Director of the American Chestnut Foundation (non-profit corporation). | | Asset Allocation Trust |
Officers
| | | | | | |
Name and Year of Birth | | Position Held and
Length of Service | | Principal Occupations During Past Five Years | | |
Karla M. Rabusch
(Born 1959) | | President, since 2003 | | Executive Vice President of Wells Fargo Bank, N.A. and President of Wells Fargo Funds Management, LLC since 2003. Senior Vice President and Chief Administrative Officer of Wells Fargo Funds Management, LLC from 2001 to 2003. | | |
C. David Messman
(Born 1960) | | Secretary, since 2000; Chief Legal Counsel, since 2003 | | Senior Vice President and Secretary of Wells Fargo Funds Management, LLC since 2001. Vice President and Managing Senior Counsel of Wells Fargo Bank, N.A. since 1996. | | |
Kasey Phillips
(Born 1970) | | Treasurer, since 2009 | | Senior Vice President of Wells Fargo Funds Management, LLC since 2009. Senior Vice President of Evergreen Investment Management Company, LLC from 2006 to 2010. Treasurer of the Evergreen Funds from 2005 to 2010. | | |
David Berardi
(Born 1975) | | Assistant Treasurer, since 2009 | | Vice President of Wells Fargo Funds Management, LLC since 2009. Vice President of Evergreen Investment Management Company, LLC from 2008 to 2010. Assistant Vice President of Evergreen Investment Services, Inc. from 2004 to 2008. Manager of Fund Reporting and Control for Evergreen Investment Management Company, LLC from 2004 to 2010. | | |
Jeremy DePalma
(Born 1974) | | Assistant Treasurer, since 2009 | | Senior Vice President of Wells Fargo Funds Management, LLC since 2009. Senior Vice President of Evergreen Investment Management Company, LLC from 2008 to 2010. Vice President, Evergreen Investment Services, Inc. from 2004 to 2007. Head of the Fund Reporting and Control Team within Fund Administration from 2005 to 2010. | | |
Debra Ann Early
(Born 1964) | | Chief Compliance Officer, since 2007 | | Chief Compliance Officer of Wells Fargo Funds Management, LLC since 2007. Chief Compliance Officer of Parnassus Investments from 2005 to 2007. Chief Financial Officer of Parnassus Investments from 2004 to 2007 and Senior Audit Manager of PricewaterhouseCoopers LLP from 1998 to 2004. | | |
| 1. | The Statement of Additional Information includes additional information about the Trustees and is available, without charge, upon request, by calling 1-800-222-8222 or by visiting the Web site at www.wellsfargo.com/advantagefunds. |
| | | | | | |
| List of Abbreviations | | Wells Fargo Advantage Minnesota Tax-Free Fund | | | 29 | |
The following is a list of common abbreviations for terms and entities which may have appeared in this report.
| ACB | — Agricultural Credit Bank |
| ADR | — American Depository Receipt |
| ADS | — American Depository Shares |
| AGC-ICC | — Assured Guaranty Corporation - Insured Custody Certificates |
| AGM | — Assured Guaranty Municipal |
| AMBAC | — American Municipal Bond Assurance Corporation |
| AMT | — Alternative Minimum Tax |
| BAN | — Bond Anticipation Notes |
| BHAC | — Berkshire Hathaway Assurance Corporation |
| CAB | — Capital Appreciation Bond |
| CCAB | — Convertible Capital Appreciation Bond |
| CDA | — Community Development Authority |
| CDO | — Collateralized Debt Obligation |
| COP | — Certificate of Participation |
| DRIVER | — Derivative Inverse Tax-Exempt Receipts |
| DW&P | — Department of Water & Power |
| DWR | — Department of Water Resources |
| ECFA | — Educational & Cultural Facilities Authority |
| EDA | — Economic Development Authority |
| EDFA | — Economic Development Finance Authority |
| ETF | — Exchange-Traded Fund |
| FFCB | — Federal Farm Credit Bank |
| FGIC | — Financial Guaranty Insurance Corporation |
| FHA | — Federal Housing Authority |
| FHLB | — Federal Home Loan Bank |
| FHLMC | — Federal Home Loan Mortgage Corporation |
| FNMA | — Federal National Mortgage Association |
| GDR | — Global Depository Receipt |
| GNMA | — Government National Mortgage Association |
| HCFR | — Healthcare Facilities Revenue |
| HEFA | — Health & Educational Facilities Authority |
| HEFAR | — Higher Education Facilities Authority Revenue |
| HFA | — Housing Finance Authority |
| HFFA | — Health Facilities Financing Authority |
| IBC | — Insured Bond Certificate |
| IDA | — Industrial Development Authority |
| IDAG | — Industrial Development Agency |
| IDR | — Industrial Development Revenue |
| KRW | — Republic of Korea Won |
| LIBOR | — London Interbank Offered Rate |
| LLC | — Limited Liability Company |
| LLP | — Limited Liability Partnership |
| MBIA | — Municipal Bond Insurance Association |
| MFHR | — Multi-Family Housing Revenue |
| MUD | — Municipal Utility District |
| NATL-RE | — National Public Finance Guarantee Corporation |
| PCFA | — Pollution Control Finance Authority |
| PCR | — Pollution Control Revenue |
| PFA | — Public Finance Authority |
| PFFA | — Public Facilities Financing Authority |
| PFOTER | — Puttable Floating Option Tax-Exempt Receipts |
| plc | — Public Limited Company |
| PUTTER | — Puttable Tax-Exempt Receipts |
| R&D | — Research & Development |
| RDA | — Redevelopment Authority |
| RDFA | — Redevelopment Finance Authority |
| REIT | — Real Estate Investment Trust |
| ROC | — Reset Option Certificates |
| SAVRS | — Select Auction Variable Rate Securities |
| SBA | — Small Business Authority |
| SFHR | — Single Family Housing Revenue |
| SFMR | — Single Family Mortgage Revenue |
| SPDR | — Standard & Poor’s Depositary Receipts |
| TAN | — Tax Anticipation Notes |
| TIPS | — Treasury Inflation-Protected Securities |
| TRAN | — Tax Revenue Anticipation Notes |
| TCR | — Transferable Custody Receipts |
| TTFA | — Transportation Trust Fund Authority |
| TVA | — Tennessee Valley Authority |
| XLCA | — XL Capital Assurance |
This page is intentionally left blank.


FOR MORE INFORMATION
More information about Wells Fargo Advantage Funds is available free upon request. To obtain literature, please write, e-mail, visit the Fund’s Web site, or call:
Wells Fargo Advantage Funds
P.O. Box 8266
Boston, MA 02266-8266
E-mail: wfaf@wellsfargo.com
Web site: www.wellsfargo.com/advantagefunds
Individual investors: 1-800-222-8222
Retail investment professionals: 1-888-877-9275
Institutional investment professionals: 1-866-765-0778
This report and the financial statements contained herein are submitted for the general information of the shareholders of Wells Fargo Advantage Funds. If this report is used for promotional purposes, distribution of the report must be accompanied or preceded by a current prospectus. For a prospectus containing more complete information, including charges and expenses, call 1-800-222-8222 or visit the Fund’s Web site at www.wellsfargo.com/advantagefunds. Please consider the investment objectives, risks, charges, and expenses of the investment carefully before investing. This and other information about Wells Fargo Advantage Funds can be found in the current prospectus. Read the prospectus carefully before you invest or send money.
Wells Fargo Funds Management, LLC, a wholly owned subsidiary of Wells Fargo & Company, provides investment advisory and administrative services for Wells Fargo Advantage Funds. Other affiliates of Wells Fargo & Company provide subadvisory and other services for the Funds. The Funds are distributed by Wells Fargo Funds Distributor, LLC, Member FINRA/SIPC, an affiliate of Wells Fargo & Company.
NOT FDIC INSURED ¡ NO BANK GUARANTEE ¡ MAY LOSE VALUE
© 2012 Wells Fargo Funds Management, LLC. All rights reserved.
| | |
 | | 207586 02-12 SA252/SAR252 12-11 |

Wells Fargo Advantage Municipal Bond Fund

Semi-Annual Report
December 31, 2011

Reduce clutter. Save trees.
Sign up for electronic delivery of prospectuses and shareholder reports at www.wellsfargo.com/advantagedelivery
Contents
The views expressed and any forward-looking statements are as of December 31, 2011, unless otherwise noted, and are those of the Fund managers and/or Wells Fargo Funds Management, LLC. Discussions of individual securities, or the markets generally, or any Wells Fargo Advantage Fund are not intended as individual recommendations. Future events or results may vary significantly from those expressed in any forward-looking statements; the views expressed are subject to change at any time in response to changing circumstances in the market. Wells Fargo Funds Management, LLC, disclaims any obligation to publicly update or revise any views expressed or forward-looking statements.
NOT FDIC INSURED ¡ NO BANK GUARANTEE ¡ MAY LOSE VALUE

WELLS FARGO INVESTMENT HISTORY
| | |
| |
| 1932 | | Keystone creates one of the first mutual fund families. |
| |
| 1971 | | Wells Fargo & Company introduces one of the first institutional index funds. |
| |
| 1978 | | Wells Fargo applies Markowitz and Sharpe’s research on Modern Portfolio Theory to introduce one of the industry’s first Tactical Asset Allocation (TAA) models in institutional separately managed accounts. |
| |
| 1984 | | Wells Fargo Stagecoach Funds launches its first asset allocation fund. |
| |
| 1989 | | The Tactical Asset Allocation (TAA) Model is first applied to Wells Fargo’s asset allocation mutual funds. |
| |
| 1994 | | Wells Fargo introduces the LifePath Funds, one of the first suites of target date funds (now the Wells Fargo Advantage Dow Jones Target Date FundsSM ). |
| |
| 1996 | | Evergreen Investments and Keystone Funds merge. |
| |
| 1997 | | Wells Fargo launches Wells Fargo Advantage WealthBuilder PortfoliosSM, a fund-of-funds suite of products that includes the use of quantitative models to shift assets among investment styles. |
| |
| 1999 | | Norwest Advantage Funds and Stagecoach Funds are reorganized into Wells Fargo Funds after the merger of Norwest and Wells Fargo. |
| |
| 2002 | | Evergreen Retail and Evergreen Institutional companies form the umbrella asset management company, Evergreen Investments. |
| |
| 2005 | | The integration of Strong Funds with Wells Fargo Funds creates Wells Fargo Advantage Funds, resulting in one of the top 20 mutual fund companies in the United States. |
| |
| 2006 | | Wells Fargo Advantage Funds relaunches the target date product line as Wells Fargo Advantage Dow Jones Target Date Funds. |
| |
| 2010 | | The mergers and reorganizations of Evergreen and Wells Fargo Advantage mutual funds are completed, unifying the families under the brand of Wells Fargo Advantage Funds. |
Wells Fargo Advantage Funds®
��
Wells Fargo Advantage Funds skillfully guides institutions, financial advisors, and individuals through the investment terrain to help them reach their financial objectives. Everything we do on behalf of investors is backed by our unique combination of qualifications.
Strength
Our organization is built on the standards of integrity and service established by our parent company—Wells Fargo & Company—more than 150 years ago. And, because we’re part of a highly diversified financial enterprise, we offer the depth of resources to help investors succeed.
Expertise
Our multi-boutique model offers investors access to the independent thinking of premier investment managers that have been chosen for their time-tested strategies. While each team specializes in a specific investment strategy, collectively they provide investors a wide choice of distinct investment styles. Our dedication to investment excellence doesn’t end with our expertise in manager selection—risk management, analysis, and rigorous ongoing review seek to ensure each manager’s investment process remains consistent.
Partnership
Our collaborative approach is built around understanding the needs and goals of our clients. By adhering to core principles of sound judgment and steady guidance, we support you through every stage of the investment decision process.
Carefully consider a fund’s investment objectives, risks, charges, and expenses before investing. For a current prospectus and, if available, a summary prospectus, containing this and other information, visit wellsfargo.com/advantagefunds. Read it carefully before investing.
Wells Fargo Funds Management, LLC, a wholly owned subsidiary of Wells Fargo & Company, provides investment advisory and administrative services for Wells Fargo Advantage Funds®. Other affiliates of Wells Fargo & Company provide subadvisory and other services for the Funds. The Funds are distributed by Wells Fargo Funds Distributor, LLC, Member FINRA/SIPC, an affiliate of Wells Fargo & Company.
“Dow Jones®” and “Dow Jones Target Date IndexesSM” are service marks of Dow Jones Trademark Holdings, LLC (“Dow Jones”), have been licensed to CME Group Index Services LLC (“CME Indexes”) and have been sublicensed for use for certain purposes by Global Index Advisors, Inc, and Wells Fargo Funds Management, LLC. The Wells Fargo Advantage Dow Jones Target Date FundsSM based on the Dow Jones Target Date IndexesSM, are not sponsored, endorsed, sold or promoted by Dow Jones, CME Indexes or their respective affiliates and none of them makes any representation regarding the advisability of investing in such product(s).
NOT FDIC INSURED ¡ NO BANK GUARANTEE ¡ MAY LOSE VALUE
Not part of the semi-annual report.
Wells Fargo Advantage Funds offers more than 110 mutual funds across a wide range of asset classes, representing over $216 billion in assets under management, as of December 31, 2011.
| | | | |
| Equity Funds | | | | |
Asia Pacific Fund | | Global Opportunities Fund | | Premier Large Company Growth Fund |
C&B Large Cap Value Fund | | Growth Fund | | Small Cap Opportunities Fund |
C&B Mid Cap Value Fund | | Health Care Fund | | Small Cap Value Fund |
Capital Growth Fund | | Index Fund | | Small Company Growth Fund |
Common Stock Fund | | International Equity Fund | | Small Company Value Fund |
Disciplined U.S. Core Fund | | International Value Fund | | Small/Mid Cap Core Fund |
Discovery Fund† | | Intrinsic Small Cap Value Fund | | Small/Mid Cap Value Fund |
Diversified Equity Fund | | Intrinsic Value Fund | | Social Sustainability Fund† |
Diversified International Fund | | Intrinsic World Equity Fund | | Special Mid Cap Value Fund |
Diversified Small Cap Fund | | Large Cap Core Fund | | Special Small Cap Value Fund |
Emerging Growth Fund | | Large Cap Growth Fund | | Specialized Technology Fund |
Emerging Markets Equity Fund | | Large Company Value Fund | | Strategic Large Cap Growth Fund |
Endeavor Select Fund† | | Omega Growth Fund | | Traditional Small Cap Growth Fund |
Enterprise Fund† | | Opportunity Fund† | | Utility and Telecommunications Fund |
Equity Value Fund | | Precious Metals Fund | | |
| Bond Funds | | | | |
Adjustable Rate Government Fund | | Inflation-Protected Bond Fund | | Short-Term Bond Fund |
California Limited-Term Tax-Free Fund | | Intermediate Tax/AMT-Free Fund | | Short-Term High Yield Bond Fund |
California Tax-Free Fund | | International Bond Fund | | Short-Term Municipal Bond Fund |
Colorado Tax-Free Fund | | Minnesota Tax-Free Fund | | Strategic Municipal Bond Fund |
Government Securities Fund | | Municipal Bond Fund | | Total Return Bond Fund |
High Income Fund | | North Carolina Tax-Free Fund | | Ultra Short-Term Income Fund |
High Yield Bond Fund | | Pennsylvania Tax-Free Fund | | Ultra Short-Term Municipal Income Fund |
Income Plus Fund | | Short Duration Government Bond Fund | | Wisconsin Tax-Free Fund |
| Asset Allocation Funds | | | | |
Asset Allocation Fund | | WealthBuilder Equity Portfolio† | | Target 2020 Fund† |
Conservative Allocation Fund | | WealthBuilder Growth Allocation Portfolio† | | Target 2025 Fund† |
Diversified Capital Builder Fund | | WealthBuilder Growth Balanced Portfolio† | | Target 2030 Fund† |
Diversified Income Builder Fund | | WealthBuilder Moderate Balanced Portfolio† | | Target 2035 Fund† |
Growth Balanced Fund | | WealthBuilder Tactical Equity Portfolio† | | Target 2040 Fund† |
Index Asset Allocation Fund | | Target Today Fund† | | Target 2045 Fund† |
Moderate Balanced Fund | | Target 2010 Fund† | | Target 2050 Fund† |
WealthBuilder Conservative Allocation Portfolio† | | Target 2015 Fund† | | Target 2055 Fund† |
| Money Market Funds | | | | |
100% Treasury Money Market Fund | | Heritage Money Market Fund† | | National Tax-Free Money Market Fund |
California Municipal Money Market Fund | | Money Market Fund | | Prime Investment Money Market Fund |
Cash Investment Money Market Fund | | Municipal Cash Management Money Market Fund | | Treasury Plus Money Market Fund |
Government Money Market Fund | | Municipal Money Market Fund | | |
| Variable Trust Funds1 | | | | |
VT Discovery Fund† | | VT Intrinsic Value Fund | | VT Small Cap Growth Fund |
VT Index Asset Allocation Fund | | VT Omega Growth Fund | | VT Small Cap Value Fund |
VT International Equity Fund | | VT Opportunity Fund† | | VT Total Return Bond Fund |
An investment in a money market fund is not insured or guaranteed by the Federal Deposit Insurance Corporation or any other government agency. Although the Wells Fargo Advantage Money Market Funds seek to preserve the value of your investment at $1.00 per share, it is possible to lose money by investing in a money market fund.
| 1. | The Variable Trust Funds are generally available only through insurance company variable contracts. |
| † | In this report, the Wells Fargo Advantage Discovery FundSM, Wells Fargo Advantage Endeavor Select FundSM, Wells Fargo Advantage Enterprise FundSM, Wells Fargo Advantage Opportunity FundSM, Wells Fargo Advantage Social Sustainability FundSM, Wells Fargo Advantage WealthBuilder Conservative Allocation PortfolioSM, Wells Fargo Advantage WealthBuilder Equity PortfolioSM, Wells Fargo Advantage WealthBuilder Growth Allocation PortfolioSM, Wells Fargo Advantage WealthBuilder Growth Balanced PortfolioSM, Wells Fargo Advantage WealthBuilder Moderate Balanced PortfolioSM, Wells Fargo Advantage WealthBuilder Tactical Equity PortfolioSM, Wells Fargo Advantage Dow Jones Target Today FundSM, Wells Fargo Advantage Dow Jones Target 2010 FundSM, Wells Fargo Advantage Dow Jones Target 2015 FundSM, Wells Fargo Advantage Dow Jones Target 2020 FundSM, Wells Fargo Advantage Dow Jones Target 2025 FundSM, Wells Fargo Advantage Dow Jones Target 2030 FundSM, Wells Fargo Advantage Dow Jones Target 2035 FundSM, Wells Fargo Advantage Dow Jones Target 2040 FundSM, Wells Fargo Advantage Dow Jones Target 2045 FundSM, Wells Fargo Advantage Dow Jones Target 2050 FundSM, Wells Fargo Advantage Dow Jones Target 2055 FundSM, Wells Fargo Advantage Heritage Money Market FundSM, Wells Fargo Advantage VT Discovery FundSM, and Wells Fargo Advantage VT Opportunity FundSM are referred to as the Discovery Fund, Endeavor Select Fund, Enterprise Fund, Opportunity Fund, Social Sustainability Fund, WealthBuilder Conservative Allocation Portfolio, WealthBuilder Equity Portfolio, WealthBuilder Growth Allocation Portfolio, WealthBuilder Growth Balanced Portfolio, WealthBuilder Moderate Balanced Portfolio, WealthBuilder Tactical Equity Portfolio, Target Today Fund, Target 2010 Fund, Target 2015 Fund, Target 2020 Fund, Target 2025 Fund, Target 2030 Fund, Target 2035 Fund, Target 2040 Fund, Target 2045 Fund, Target 2050 Fund, Target 2055 Fund, Heritage Money Market Fund, VT Discovery Fund, and VT Opportunity Fund, respectively. |
Not part of the semi-annual report.
| | | | |
| 2 | | Wells Fargo Advantage Municipal Bond Fund | | Letter to Shareholders |

Karla M. Rabusch,
President
Wells Fargo Advantage Funds
For the entire six-month period, most of the major fixed-income indexes posted solid positive returns. However, the market’s six-month return figures mask the uneven path that the financial markets traced since the summer as investors had to contend with a variety of global and domestic headwinds.
Dear Valued Shareholder:
We’re pleased to offer you this semi-annual report for the Wells Fargo Advantage Municipal Bond Fund for the six-month period that ended December 31, 2011. Upon reviewing the report, you may notice a few changes from past reports, the most significant of which is the change from a multi-fund report to a single-fund report. We made this change to make it easier for you to find your fund information.
For the entire six-month period, most of the major fixed-income indexes posted solid positive returns. However, the market’s six-month return figures mask the uneven path that the financial markets traced since the summer as investors had to contend with a variety of global and domestic headwinds. Whatever the future holds, we continue to believe that most investors can benefit from adhering to a well-diversified investment strategy. Over the long-term, such a strategy may allow you to balance risks and opportunities as you pursue your financial goals in a dynamic market landscape.
The economic recovery gained traction as the year progressed.
The U.S. economic recovery that began in mid-2009 has experienced a few slow patches along the way. However, the recovery regained some upward momentum during the six-month period, yet the rate of growth remained subpar compared with most previous recovery cycles.
In September 2011, it was reported that U.S. gross domestic product (GDP) grew at a mere 1.3% annual rate in the second quarter of 2011, following anemic growth at an annual rate of 0.4% in the first quarter. According to the December estimate, GDP growth accelerated to an annual rate of 1.8% in the third quarter, reigniting hopes for a sustainable recovery. Those hopes were buoyed by widespread anticipation of even stronger GDP growth in the fourth quarter. By year-end, few economists believed that the U.S. economy was in danger of sliding back into recession, although many expected a sluggish growth environment in 2012.
The struggling housing and labor markets slowed growth.
As has been the case throughout the recovery, the housing and labor markets continued to restrain economic momentum during 2011.
The beleaguered housing market has arguably exerted the biggest drag on growth. Despite intermittent signs of improvement, ongoing weakness in sales of both new and existing homes has put considerable downward pressure on prices. On the other hand, the labor market took a decided turn for the better during the final months of 2011: initial unemployment claims have eased, and the private sector has been steadily adding jobs. The pace of hiring, while not brisk, was sufficient to push the U.S. unemployment rate down to 8.5% as of December 2011—still well above its historical average but at its lowest level since February 2009. Many observers expect the unemployment rate to decline further in 2012, which could act as a tailwind for consumer spending—widely viewed as one of the keys to long-term economic growth.
| | | | | | |
| Letter to Shareholders | | Wells Fargo Advantage Municipal Bond Fund | | | 3 | |
The Federal Reserve announced that it will keep rates low until 2013.
Consumers have already demonstrated some resilience in their spending—even in the face of higher energy costs. Oil prices skyrocketed in early 2011 before retreating later in the year, only to spike again during the fourth quarter. Yet “core” inflation, which excludes volatile energy and food prices, remained fairly benign throughout the year.
With inflation in check, the Federal Reserve (Fed) held its target range for the federal funds rate—a proxy for short-term interest rates—steady at 0% to 0.25%. Following its August 9, 2011 meeting, the Federal Open Market Committee issued a statement explaining that economic conditions were likely to warrant exceptionally low levels for the federal funds rate through at least mid-2013. In September, the Fed launched yet another stimulus program—dubbed “Operation Twist”—that is designed to keep intermediate- and longer-term yields relatively low. The goal with keeping longer-term rates low is to encourage lending activity to spark business investments and home purchases, which, in turn, may provide support for a more sustainable economic recovery.
Market volatility was a dominant theme during the final six-months of the year
Early on in the period, market climate shifted to one of anxiety over the increasingly fragile state of the U.S. and global economies. In addition, investors not only worried that the U.S. might be on the brink of recession, they also feared that Europe’s sovereign debt problems could spiral out of control if a Greek default triggered financial contagion across the continent. In July and August, investor sentiment was further undermined by partisan wrangling over the federal debt ceiling and the downgrade of the U.S. credit rating by Standard & Poor’s. The barrage of unsettling headlines led to heightened market volatility and an increase in risk aversion, which translated into sharply falling stock prices and higher demand for “safer” assets such as Treasuries and municipals in the third quarter of 2011. Although volatility persisted into the fourth quarter, the financial markets were able to rebound amid improved U.S. economic data and hopes for a resolution to the European crisis.
For the entire six-month period, the Barclays Capital U.S. Aggregate Bond Index1, which represents the universe of investment-grade bonds, and the Barclays Capital U.S. Treasury Index2 added 4.98% and 7.43%, respectively. By comparison, the Barclays Capital Municipal Bond Index3 gained 6.02% over the last half of the year.
Recent events have not altered our message to shareholders.
The market turmoil of 2011 and an uncertain outlook going forward have left many investors questioning their resolve—and their investments. Yet, it is precisely at such times that the market may present opportunities—as well as challenges—for prudent investors. Bear in mind that many investors who indiscriminately sold their equity investments during the severe market downturn of 2008 to 2009 missed out on the impressive two-year rally that followed. In our
| 1. | The Barclays Capital U.S. Aggregate Bond Index is composed of the Barclays Capital Government/Credit Index and the Mortgage-Backed Securities Index and includes U.S. Treasury issues, agency issues, corporate bond issues, and mortgage-backed securities. You cannot invest directly in an index. |
| 2. | The Barclays Capital U.S. Treasury Index is an index of U.S. Treasury Securities. You cannot invest directly in an index. |
| 3. | The Barclays Capital Municipal Bond Index is an unmanaged index composed of long-term tax-exempt bonds with a minimum credit rating of Baa. You cannot invest directly in an index. |
Although volatility persisted into the fourth quarter, the financial markets were able to rebound amid improved U.S. economic data and hopes for a resolution to the European crisis.
| | | | |
| 4 | | Wells Fargo Advantage Municipal Bond Fund | | Letter to Shareholders |
opinion, the lesson to be learned from these dramatic market events is that, for many investors, simply building and maintaining a well-diversified4 investment plan is the best long-term strategy.
Thank you for choosing to invest with Wells Fargo Advantage Funds. We appreciate your confidence in us and remain committed to helping you meet your financial needs. For current information about your fund investments, contact your investment professional, visit our website at www.wellsfargo.com/advantagefunds, or call us directly at 1-800-222-8222. We are available 24 hours a day, 7 days a week.
Sincerely,

Karla M. Rabusch
President
Wells Fargo Advantage Funds
| 4. | Diversification does not assure or guarantee better performance and cannot eliminate the risk of investment losses. |
| | | | | | |
| Letter to Shareholders | | Wells Fargo Advantage Municipal Bond Fund | | | 5 | |
|
|
Notice to Shareholders Effective April 1, 2012, the Fund may invest up to 10% of its total assets in inverse floaters to seek enhanced returns. Inverse floaters are derivative debt instruments created by depositing a municipal security in a trust. They pay interest at rates that generally vary inversely with specified short-term interest rates. The interest payment received on inverse floaters generally will decrease when specified short-term interest rates increase. Inverse floaters involve leverage, which may magnify the Fund’s gains or losses, and exhibit greater price and income volatility than bonds with similar maturities. We intend to limit leverage created by the Fund’s investment in inverse floaters to an amount equal to 10% of the Fund’s total assets. Inverse floaters are also subject to the risks associated with derivatives and municipal securities. |
|
|
Notice to Shareholders The Board of Trustees for Wells Fargo Advantage Funds has unanimously approved the following modifications to certain net asset value (NAV) waiver privileges and commission schedules: n Effective May 1, 2012, automatic investment plan (AIP) purchases and proceeds received from systematic withdrawals will no longer qualify for NAV repurchase privileges. n Effective May 1, 2012, discretionary rights to waive the upfront commission for Class C and “jumbo” Class A share purchases will no longer be granted to broker/dealers. However, we will continue to waive the Class C shares contingent deferred sales charge for redemptions by employer-sponsored retirement plans where the dealer of record waived its commission at the time of purchase. n Effective July 31, 2012, NAV purchase privileges for former Evergreen Class IS and Class R shareholders are being modified to remove the ability to purchase Class A shares at NAV unless those shares are held directly with the fund on or after July 31, 2012. |
| | | | |
| 6 | | Wells Fargo Advantage Municipal Bond Fund | | Performance Highlights (Unaudited) |
INVESTMENT OBJECTIVE
The Fund seeks current income exempt from federal income tax.
ADVISER
Wells Fargo Funds Management, LLC
SUB-ADVISER
Wells Capital Management Incorporated
PORTFOLIO MANAGERS
Lyle J. Fitterer, CFA, CPA
Robert J. Miller
FUND INCEPTION
October 23, 1986
| | |
CREDIT QUALITY1 (AS OF DECEMBER 31, 2011) |
|
 |
|
EFFECTIVE MATURITY DISTRIBUTION2
(AS OF DECEMBER 31, 2011) |
|
 |
| 1. | The ratings indicated are from Standard & Poor’s, Moody’s Investors Service, and/or Fitch Ratings Ltd. Credit Quality Ratings: Credit quality ratings apply to underlying holdings of the Fund and not the Fund itself. Standard and Poor’s rates the creditworthiness of bonds, ranging from AAA (highest) to D (lowest). Ratings from A to CCC may be modified by the addition of a plus (+) or minus (–) sign to show relative standing within the rating categories. Standard & Poor’s rates the creditworthiness of short-term notes from SP-1 (highest) to SP-3 (lowest). Ratings from A to CCC may be modified by the addition of a plus (+) or minus (–) sign to show relative standing within the rating categories. Moody’s rates the creditworthiness of bonds, ranging from Aaa (highest) to C (lowest). Ratings Aa to B may be modified by the addition of a number 1 (highest) to 3 (lowest) to show relative standing within the ratings categories. Moody’s rates the creditworthiness of short-term U.S. tax-exempt municipal securities from MIG 1/VMIG 1 (highest) to SG (lowest). Fitch rates the creditworthiness of bonds, ranging from AAA (highest) to D (lowest). If a security was rated by all three rating agencies, the middle rating was utilized. If rated by two of three rating agencies, the lower rating was utilized and if rated by one of the agencies that rating was utilized. Credit quality is subject to change and is calculated based on the total investments of the Fund. We generally define higher quality bonds as bonds that have a rating of BBB/Baa and above and lower quality bonds as bonds with a rating below BBB/Baa. |
| 2. | Effective maturity is calculated based on the total long-term investments of the Fund. It is subject to change and may have changed since the date specified. |
| | | | | | |
| Performance Highlights (Unaudited) | | Wells Fargo Advantage Municipal Bond Fund | | | 7 | |
AVERAGE ANNUAL TOTAL RETURN3 (%) (AS OF DECEMBER 31, 2011)
| | | | | | | | | | | | | | | | | | | | | | | | | | | | | | | | | | | | | | | | | | | | |
| | | | | | Including Sales Charge | | | Excluding Sales Charge | | | Expense Ratios4 | |
| | | Inception Date | | | 6 Months* | | | 1 Year | | | 5 Year | | | 10 Year | | | 6 Months* | | | 1 Year | | | 5 Year | | | 10 Year | | | Gross | | | Net5 | |
Class A (WMFAX) | | | 04/08/2005 | | | | 0.21 | | | | 5.13 | | | | 4.13 | | | | 5.45 | | | | 4.94 | | | | 10.11 | | | | 5.09 | | | | 5.94 | | | | 0.83% | | | | 0.77% | |
Class B (WMFBX)** | | | 04/08/2005 | | | | (0.35 | ) | | | 4.29 | | | | 3.98 | | | | 5.41 | | | | 4.65 | | | | 9.29 | | | | 4.32 | | | | 5.41 | | | | 1.58% | | | | 1.52% | |
Class C (WMFCX) | | | 04/08/2005 | | | | 3.66 | | | | 8.29 | | | | 4.30 | | | | 5.17 | | | | 4.66 | | | | 9.29 | | | | 4.30 | | | | 5.17 | | | | 1.58% | | | | 1.52% | |
Administrator Class (WMFDX) | | | 04/08/2005 | | | | | | | | | | | | | | | | | | | | 5.13 | | | | 10.27 | | | | 5.31 | | | | 6.13 | | | | 0.77% | | | | 0.62% | |
Institutional Class (WMBIX) | | | 03/31/2008 | | | | | | | | | | | | | | | | | | | | 5.09 | | | | 10.41 | | | | 5.33 | | | | 6.08 | | | | 0.50% | | | | 0.50% | |
Investor Class (SXFIX) | | | 10/23/1986 | | | | | | | | | | | | | | | | | | | | 5.03 | | | | 10.08 | | | | 5.07 | | | | 5.95 | | | | 0.86% | | | | 0.80% | |
Barclays Capital Municipal Bond Index6 | | | | | | | | | | | | | | | | | | | | | | | 6.02 | | | | 10.70 | | | | 5.22 | | | | 5.38 | | | | | | | | | |
| * | Returns for periods of less than one year are not annualized. |
| ** | Class B shares are closed to investment, except in connection with the reinvestment of any distributions and permitted exchanges. |
Figures quoted represent past performance, which is no guarantee of future results and do not reflect the deduction of taxes that a shareholder may pay on fund distributions or the redemption of fund shares. Investment return and principal value of an investment will fluctuate so that an investor’s shares, when redeemed, may be worth more or less than their original cost. Performance shown without sales charges would be lower if sales charges were reflected. Current performance may be lower or higher than the performance data quoted and assumes the reinvestment of dividends and capital gains. Current month-end performance is available on the Fund’s Web site – www.wellsfargo.com/advantagefunds.
Index returns do not include transaction costs associated with buying and selling securities, any mutual fund fees or expenses or any taxes. It is not possible to invest directly in an index.
For Class A shares, the maximum front-end sales charge is 4.50%. For Class B shares, the maximum contingent deferred sales charge is 5.00%. For Class C shares, the maximum contingent deferred sales charge is 1.00%. Performance including sales charge assumes the sales charge for the corresponding time period. Administrator Class, Institutional Class, and Investor Class shares are sold without a front-end sales charge or contingent deferred sales charge.
Bond fund values fluctuate in response to the financial condition of individual issuers, general market and economic conditions, and changes in interest rates. In general, when interest rates rise, bond fund values fall and investors may lose principal value. The use of derivatives may reduce returns and/or increase volatility. Certain investment strategies tend to increase the total risk of an investment (relative to the broader market). This Fund is exposed to high-yield securities risk, and municipal securities risk. Consult the Fund’s prospectus for additional information on these and other risks. A portion of the Fund’s income may be subject to federal, state, and/or local income taxes or the alternative minimum tax (AMT). Any capital gains distributions may be taxable.
| 3. | Historical performance shown for Class B and Class C shares prior to their inception reflects the performance of the Investor Class shares, adjusted to reflect the higher expenses applicable to Class B and Class C shares. Historical performance shown for Class A shares prior to their inception reflects the performance of the Investor Class shares, and includes the higher expenses applicable to the Investor Class shares (except during those periods in which expenses of Class A shares would have been higher than those of the Investor Class no such adjustment is reflected). If these expenses had not been included, returns would be higher. Historical performance shown for the Administrator Class and Institutional Class shares prior to their inception reflects the performance of the Investor Class shares, and includes the higher expenses applicable to the Investor Class shares. If these expenses had not been included, returns would be higher. |
| 4. | Reflects the expense ratios as stated in the most recent prospectuses. |
| 5. | The Adviser has committed through July 11, 2013 to waive fees and/or reimburse expenses to the extent necessary to cap the Fund’s Total Annual Fund Operating Expenses After Fee Waiver, excluding certain expenses, at 0.75% for Class A, 1.50% for Class B, 1.50% for Class C, 0.60% for Administrator Class, 0.50% for Institutional Class, and 0.78% for Investor Class shares . Without this cap, the Fund’s returns would have been lower. |
| 6. | The Barclays Capital Municipal Bond Index is an unmanaged index composed of long-term tax-exempt bonds with a minimum credit rating of Baa. You cannot invest directly in an index. |
| | | | |
| 8 | | Wells Fargo Advantage Municipal Bond Fund | | Fund Expenses (Unaudited) |
As a shareholder of the Fund, you incur two types of costs: (1) transaction costs, including sales charges (loads) on purchase payments and contingent deferred sales charges (if any) on redemptions and (2) ongoing costs, including management fees; distribution (12b-1) and/or shareholder service fees; and other Fund expenses. This example is intended to help you understand your ongoing costs (in dollars) of investing in the Fund and to compare these costs with the ongoing costs of investing in other mutual funds.
The example is based on an investment of $1,000 invested at the beginning of the six-month period and held for the entire period from July 1, 2011 to December 31, 2011.
Actual Expenses
The “Actual” line of the table below provides information about actual account values and actual expenses. You may use the information in this line, together with the amount you invested, to estimate the expenses that you paid over the period. Simply divide your account value by $1,000 (for example, an $8,600 account value divided by $1,000 = 8.6), then multiply the result by the number in the “Actual” line under the heading entitled “Expenses Paid During Period” for your applicable class of shares to estimate the expenses you paid on your account during this period.
Hypothetical Example for Comparison Purposes
The “Hypothetical” line of the table below provides information about hypothetical account values and hypothetical expenses based on the Fund’s actual expense ratio and an assumed rate of return of 5% per year before expenses, which is not the Fund’s actual return. The hypothetical account values and expenses may not be used to estimate the actual ending account balance or expenses you paid for the period. You may use this information to compare the ongoing costs of investing in the Fund and other funds. To do so, compare this 5% hypothetical example with the 5% hypothetical examples that appear in the shareholder reports of the other funds.
Please note that the expenses shown in the table are meant to highlight your ongoing costs only and do not reflect any transactional costs, such as sales charges (loads) and contingent deferred sales charges. Therefore, the “Hypothetical” line of the table is useful in comparing ongoing costs only, and will not help you determine the relative total costs of owning different funds. In addition, if these transactional costs were included, your costs would have been higher.
| | | | | | | | | | | | | | | | |
| | | Beginning
Account Value
07-01-2011 | | | Ending
Account Value
12-31-2011 | | | Expenses
Paid During
the Period1 | | | Net Annual
Expense Ratio | |
Class A | | | | | | | | | | | | | | | | |
Actual | | $ | 1,000.00 | | | $ | 1,049.39 | | | $ | 3.92 | | | | 0.76 | % |
Hypothetical (5% return before expenses) | | $ | 1,000.00 | | | $ | 1,021.32 | | | $ | 3.86 | | | | 0.76 | % |
Class B | | | | | | | | | | | | | | | | |
Actual | | $ | 1,000.00 | | | $ | 1,046.52 | | | $ | 7.77 | | | | 1.51 | % |
Hypothetical (5% return before expenses) | | $ | 1,000.00 | | | $ | 1,017.55 | | | $ | 7.66 | | | | 1.51 | % |
Class C | | | | | | | | | | | | | | | | |
Actual | | $ | 1,000.00 | | | $ | 1,046.56 | | | $ | 7.77 | | | | 1.51 | % |
Hypothetical (5% return before expenses) | | $ | 1,000.00 | | | $ | 1,017.55 | | | $ | 7.66 | | | | 1.51 | % |
Administrator Class | | | | | | | | | | | | | | | | |
Actual | | $ | 1,000.00 | | | $ | 1,051.26 | | | $ | 3.15 | | | | 0.61 | % |
Hypothetical (5% return before expenses) | | $ | 1,000.00 | | | $ | 1,022.07 | | | $ | 3.10 | | | | 0.61 | % |
Institutional Class | | | | | | | | | | | | | | | | |
Actual | | $ | 1,000.00 | | | $ | 1,050.85 | | | $ | 2.42 | | | | 0.47 | % |
Hypothetical (5% return before expenses) | | $ | 1,000.00 | | | $ | 1,022.77 | | | $ | 2.39 | | | | 0.47 | % |
Investor Class | | | | | | | | | | | | | | | | |
Actual | | $ | 1,000.00 | | | $ | 1,050.34 | | | $ | 4.07 | | | | 0.79 | % |
Hypothetical (5% return before expenses) | | $ | 1,000.00 | | | $ | 1,021.17 | | | $ | 4.01 | | | | 0.79 | % |
| 1. | Expenses paid is equal to the annualized expense ratio of each class multiplied by the average account value over the period, multiplied by the number of days in the most recent fiscal half-year divided by the number of days in the fiscal year (to reflect the one-half year period). |
| | | | | | |
| Portfolio of Investments—December 31, 2011 (Unaudited) | | Wells Fargo Advantage Municipal Bond Fund | | | 9 | |
| | | | | | | | | | | | | | | | |
| Security Name | | Interest Rate | | | Maturity Date | | | Principal | | | Value | |
| | | | | | | | | | | | | | | | |
| | | | |
Municipal Bonds and Notes: 98.51% | | | | | | | | | | | | | | | | |
| | | | |
| Alabama: 0.76% | | | | | | | | | | | | | | | | |
Alabama Drinking Water Finance Authority Series A (Water & Sewer Revenue, AMBAC Insured) | | | 5.13 | % | | | 08/15/2016 | | | $ | 1,075,000 | | | $ | 1,079,365 | |
Alabama Drinking Water Finance Revolving Federal Loan Series A (Water & Sewer Revenue, AMBAC Insured) | | | 4.85 | | | | 08/15/2022 | | | | 800,000 | | | | 801,184 | |
Jefferson County AL Limited Obligation School District Series A (Tax Revenue) | | | 5.25 | | | | 01/01/2020 | | | | 3,000,000 | | | | 2,790,450 | |
Jefferson County AL Limited Obligation Series A (Tax Revenue, AGM-CR Insured) | | | 5.25 | | | | 01/01/2018 | | | | 775,000 | | | | 771,218 | |
Jefferson County AL Limited Obligation Subseries A-1 (Tax Revenue, AMBAC Insured)±§(m)(n) | | | 0.80 | | | | 01/01/2027 | | | | 1,675,000 | | | | 1,072,000 | |
Jefferson County AL Limited Obligation Subseries A-2 (Tax Revenue, AMBAC Insured)±§(m)(n) | | | 0.82 | | | | 01/01/2027 | | | | 2,350,000 | | | | 1,504,000 | |
Jefferson County AL Limited Obligation Subseries A-3 (Tax Revenue, AMBAC Insured)±§(m)(n) | | | 0.75 | | | | 01/01/2027 | | | | 2,175,000 | | | | 1,392,000 | |
Jefferson County AL Limited Obligation Subseries A-4 (Tax Revenue, AMBAC Insured)±§(m)(n) | | | 0.76 | | | | 01/01/2027 | | | | 175,000 | | | | 112,000 | |
Jefferson County AL Series B8 (Water & Sewer Revenue, AGM Insured) | | | 5.25 | | | | 02/01/2014 | | | | 2,860,000 | | | | 2,833,488 | |
Jefferson County AL Series B8 (Water & Sewer Revenue, AGM Insured) | | | 5.25 | | | | 02/01/2015 | | | | 460,000 | | | | 451,752 | |
Jefferson County AL Series C10 (Water & Sewer Revenue, AGM Insured)±(m)(n) | | | 0.41 | | | | 02/01/2042 | | | | 750,000 | | | | 465,000 | |
Jefferson County AL Series C2 (Water & Sewer Revenue, FGIC Insured)±(m)(n) | | | 0.76 | | | | 02/01/2042 | | | | 2,500,000 | | | | 1,475,000 | |
Jefferson County AL Series C9 (Water & Sewer Revenue, AGM Insured)±(m)(n) | | | 0.44 | | | | 02/01/2042 | | | | 700,000 | | | | 434,000 | |
Jefferson County AL Subseries B1A (Water & Sewer Revenue, FGIC Insured)±(m)(n) | | | 0.88 | | | | 02/01/2042 | | | | 3,000,000 | | | | 1,770,000 | |
Jefferson County AL Subseries B1E (Water & Sewer Revenue, FGIC Insured)±(m)(n) | | | 0.85 | | | | 02/01/2042 | | | | 2,500,000 | | | | 1,475,000 | |
| | | | |
| | | | | | | | | | | | | | | 18,426,457 | |
| | | | | | | | | | | | | | | | |
| | | | |
| Alaska: 0.12% | | | | | | | | | | | | | | | | |
Alaska Industrial Development & Export Authority Lake Dorothy Hydro-Electric Project (Utilities Revenue, AMBAC Insured) | | | 5.25 | | | | 12/01/2021 | | | | 3,000,000 | | | | 3,000,660 | |
| | | | | | | | | | | | | | | | |
| | | | |
| Arizona: 4.36% | | | | | | | | | | | | | | | | |
Arizona Health Facilities Authority Banner Health Series B (Health Revenue)±§ | | | 1.06 | | | | 01/01/2037 | | | | 72,495,000 | | | | 47,396,506 | |
Arizona Health Facilities Authority Phoenix Children’s Hospital Series A (Health Revenue)±§ | | | 1.10 | | | | 02/01/2042 | | | | 7,730,000 | | | | 7,212,399 | |
Arizona Health Facilities Authority Phoenix Children’s Hospital Series B (Health Revenue)±§ | | | 0.95 | | | | 02/01/2042 | | | | 4,045,000 | | | | 3,791,823 | |
Arizona School Facilities Board Refunding Revenue State School Trust (Miscellaneous Revenue, AMBAC Insured) | | | 4.00 | | | | 07/01/2015 | | | | 1,100,000 | | | | 1,148,840 | |
Arizona School Facilities Board Refunding Revenue State School Trust (Miscellaneous Revenue, AMBAC Insured) | | | 5.00 | | | | 07/01/2017 | | | | 1,865,000 | | | | 2,046,968 | |
Arizona School Facilities Board Refunding Revenue State School Trust (Miscellaneous Revenue, AMBAC Insured) | | | 5.00 | | | | 07/01/2018 | | | | 1,690,000 | | | | 1,849,773 | |
Arizona Sports & Tourism Authority Multipurpose Stadium Facility Project A (Tax Revenue, NATL-RE Insured) | | | 5.00 | | | | 07/01/2019 | | | | 3,200,000 | | | | 3,570,720 | |
Fort McDowell AZ Yavapai Nation Gaming (Miscellaneous Revenue)§ | | | 7.75 | | | | 05/01/2024 | | | | 13,000,000 | | | | 13,414,960 | |
Maricopa County AZ Stadium Project (Miscellaneous Revenue, AMBAC Insured) | | | 5.38 | | | | 06/01/2017 | | | | 2,770,000 | | | | 2,667,372 | |
| | | | |
| 10 | | Wells Fargo Advantage Municipal Bond Fund | | Portfolio of Investments—December 31, 2011 (Unaudited) |
| | | | | | | | | | | | | | | | |
| Security Name | | Interest Rate | | | Maturity Date | | | Principal | | | Value | |
| | | | | | | | | | | | | | | | |
| | | | |
| Arizona (continued) | | | | | | | | | | | | | | | | |
Pima County AZ IDA Acclaim Charter School Project (Miscellaneous Revenue) | | | 5.60 | % | | | 12/01/2016 | | | $ | 600,000 | | | $ | 593,838 | |
Pima County AZ IDA Constellation School Project (Lease Revenue) | | | 7.00 | | | | 01/01/2038 | | | | 2,000,000 | | | | 1,881,980 | |
Pima County AZ IDA Global Water Resources LLC Project (Water & Sewer Revenue) | | | 5.45 | | | | 12/01/2017 | | | | 100,000 | | | | 100,371 | |
Pima County AZ IDA Legacy Traditional School Project (Miscellaneous Revenue) | | | 8.50 | | | | 07/01/2039 | | | | 4,750,000 | | | | 4,985,553 | |
Pima County AZ IDA Series A (Education Revenue)§ | | | 7.75 | | | | 07/01/2035 | | | | 7,515,000 | | | | 7,658,912 | |
Pima County AZ IDA Series A (Education Revenue)§ | | | 8.13 | | | | 07/01/2041 | | | | 4,435,000 | | | | 4,464,094 | |
Tucson AZ Airport Authority Incorporated (Port Authority Revenue, NATL-RE Insured) | | | 5.00 | | | | 12/01/2017 | | | | 1,000,000 | | | | 1,103,430 | |
Verrado AZ Community Facilities District # 1 (Tax Revenue) | | | 6.00 | | | | 07/15/2013 | | | | 1,465,000 | | | | 1,507,910 | |
| | | | |
| | | | | | | | | | | | | | | 105,395,449 | |
| | | | | | | | | | | | | | | | |
| | | | |
| Arkansas: 0.54% | | | | | | | | | | | | | | | | |
Pulaski AR Technical College Student Tuition & Fee Capital (Education Revenue)§ | | | 5.00 | | | | 04/01/2041 | | | | 12,685,000 | | | | 13,149,905 | |
| | | | | | | | | | | | | | | | |
| | | | |
| California: 15.06% | | | | | | | | | | | | | | | | |
Access to Loans for Learning Student Loan Corporation California Student Loan Program Series D2 (Education Revenue, Guaranteed Student Loans Insured) | | | 7.85 | | | | 07/01/2025 | | | | 2,500,000 | | | | 2,320,025 | |
Alameda CA Corridor Transportation Authority CAB Sub Lien Series A (Transportation Revenue, AMBAC Insured)(z) | | | 4.26 | | | | 10/01/2018 | | | | 9,180,000 | | | | 6,896,842 | |
Alameda CA Corridor Transportation Authority CAB Sub Lien Series A (Transportation Revenue, AMBAC Insured)(z) | | | 4.49 | | | | 10/01/2019 | | | | 12,000,000 | | | | 8,496,600 | |
Alameda CA Corridor Transportation Authority CAB Sub Lien Series A (Transportation Revenue, AMBAC Insured)(z) | | | 4.74 | | | | 10/01/2020 | | | | 7,150,000 | | | | 4,739,664 | |
Alameda CA Unified School District CAB Series A (Tax Revenue, AGM Insured)(z) | | | 3.30 | | | | 08/01/2018 | | | | 3,000,000 | | | | 2,414,640 | |
Alameda County CA COP (Lease Revenue, NATL-RE Insured)(z) | | | 5.63 | | | | 06/15/2019 | | | | 1,400,000 | | | | 924,910 | |
Alhambra CA Unified School District CAB Election 2008 Series B (Tax Revenue, AGM Insured)(z) | | | 6.07 | | | | 08/01/2031 | | | | 2,175,000 | | | | 674,250 | |
Alhambra CA Unified School District CAB Election 2008 Series B (Tax Revenue, AGM Insured)(z) | | | 6.12 | | | | 08/01/2032 | | | | 3,795,000 | | | | 1,097,135 | |
Alhambra CA Unified School District CAB Election 2008 Series B (Tax Revenue, AGM Insured)(z) | | | 6.16 | | | | 08/01/2034 | | | | 5,000,000 | | | | 1,270,150 | |
Alhambra CA Unified School District CAB Election 2008 Series B (Tax Revenue, AGM Insured)(z) | | | 6.16 | | | | 08/01/2035 | | | | 6,700,000 | | | | 1,601,769 | |
Alhambra CA Unified School District CAB Series B (Tax Revenue, Assured Guaranty Insured)(z) | | | 5.86 | | | | 08/01/2031 | | | | 7,500,000 | | | | 2,419,725 | |
Anaheim CA PFA Public Improvements Project Series C (Lease Revenue, AGM Insured)(z) | | | 5.14 | | | | 09/01/2022 | | | | 1,250,000 | | | | 726,600 | |
Bass Lake CA Unified Elementary School District CAB (Tax Revenue, AGM Insured)(z) | | | 6.29 | | | | 08/01/2037 | | | | 1,305,000 | | | | 267,564 | |
Bass Lake CA Unified Elementary School District CAB (Tax Revenue, AGM Insured)(z) | | | 6.35 | | | | 08/01/2038 | | | | 1,900,000 | | | | 361,475 | |
Bass Lake CA Unified Elementary School District CAB (Tax Revenue, AGM Insured)(z) | | | 6.38 | | | | 08/01/2039 | | | | 2,005,000 | | | | 355,507 | |
California HFA MFHR Series B (Housing Revenue, AMBAC FHA Insured) | | | 6.05 | | | | 08/01/2016 | | | | 590,000 | | | | 590,667 | |
California HFFA Community Program for Persons with Developmental Disabilities Series 2011-A (Miscellaneous Revenue, California Mortgages Insured) | | | 6.25 | | | | 02/01/2026 | | | | 2,400,000 | | | | 2,642,568 | |
| | | | | | |
| Portfolio of Investments—December 31, 2011 (Unaudited) | | Wells Fargo Advantage Municipal Bond Fund | | | 11 | |
| | | | | | | | | | | | | | | | |
| Security Name | | Interest Rate | | | Maturity Date | | | Principal | | | Value | |
| | | | | | | | | | | | | | | | |
| | | | |
| California (continued) | | | | | | | | | | | | | | | | |
California HFFA Providence Health Services Series C (Health Revenue)±144A(h) | | | 6.50 | % | | | 10/01/2016 | | | $ | 10,050,000 | | | $ | 11,459,412 | |
California Infrastructure & Economic Development Bank California Independent System Operator Series A (Utilities Revenue) | | | 5.75 | | | | 02/01/2039 | | | | 4,000,000 | | | | 4,213,040 | |
California Public Works Department of General Services Buildings 8 & 9A (Lease Revenue)§ | | | 6.25 | | | | 04/01/2034 | | | | 4,000,000 | | | | 4,364,160 | |
California Statewide CDA Aspire Public Schools (Miscellaneous Revenue) | | | 5.00 | | | | 07/01/2020 | | | | 1,000,000 | | | | 1,001,750 | |
California Statewide CDA Catholic Health Care West Series D (Health Revenue) | | | 5.50 | | | | 07/01/2031 | | | | 1,690,000 | | | | 1,771,576 | |
California Statewide CDA COP SAVRS (Health Revenue, ACA Radian Insured)±§(m)(n)(a) | | | 0.81 | | | | 05/15/2029 | | | | 1,900,000 | | | | 1,767,874 | |
California Statewide CDA Sutter Health Series A (Health Revenue) | | | 6.00 | | | | 08/15/2042 | | | | 4,900,000 | | | | 5,405,582 | |
Castaic Lake Water Agency California Water System Improvement Project (Water & Sewer Revenue, AMBAC Insured)(z) | | | 4.50 | | | | 08/01/2021 | | | | 10,300,000 | | | | 6,710,553 | |
Colton CA Unified School District CAB Series B (Tax Revenue, AGM Insured)(z) | | | 5.86 | | | | 08/01/2031 | | | | 1,000,000 | | | | 322,630 | |
Colton CA Unified School District CAB Series B (Tax Revenue, AGM Insured)(z) | | | 5.93 | | | | 08/01/2032 | | | | 1,000,000 | | | | 300,290 | |
Colton CA Unified School District CAB Series B (Tax Revenue, AGM Insured)(z) | | | 5.95 | | | | 08/01/2033 | | | | 1,000,000 | | | | 282,060 | |
Colton CA Unified School District CAB Series B (Tax Revenue, AGM Insured)(z) | | | 6.08 | | | | 08/01/2037 | | | | 15,000,000 | | | | 3,240,000 | |
Colton CA Unified School District CAB Series B (Tax Revenue, AGM Insured)(z) | | | 6.13 | | | | 08/01/2042 | | | | 35,000,000 | | | | 5,521,250 | |
Corona-Norca CA Unified School District CAB Election 2006 Series C (Tax Revenue, AGM Insured)§(z) | | | 0.61 | | | | 08/01/2039 | | | | 2,920,000 | | | | 2,463,750 | |
Elk Grove CA Unified School District Special Tax Refunding Community Facilities District Project (Tax Revenue, AMBAC Insured) | | | 6.50 | | | | 12/01/2024 | | | | 500,000 | | | | 549,675 | |
Escondido CA Unified School District CAB Series A (Tax Revenue, Assured Guaranty Insured)(z) | | | 5.79 | | | | 08/01/2029 | | | | 5,340,000 | | | | 1,957,057 | |
Evergreen CA Unified Elementary School District CAB (Tax Revenue, Assured Guaranty Insured)(z) | | | 5.19 | | | | 08/01/2025 | | | | 2,570,000 | | | | 1,279,140 | |
Evergreen CA Unified Elementary School District CAB (Tax Revenue, Assured Guaranty Insured)(z) | | | 5.44 | | | | 08/01/2026 | | | | 6,635,000 | | | | 3,028,479 | |
Evergreen CA Unified Elementary School District CAB (Tax Revenue, Assured Guaranty Insured)(z) | | | 5.51 | | | | 08/01/2027 | | | | 6,130,000 | | | | 2,623,456 | |
Gilroy CA Unified School District CAB Series A (Tax Revenue, Assured Guaranty Insured)(z) | | | 5.93 | | | | 08/01/2032 | | | | 9,800,000 | | | | 2,942,842 | |
Golden West School Financing Authority CAB Series A (Miscellaneous Revenue, NATL-RE Insured)(z) | | | 6.08 | | | | 08/01/2019 | | | | 2,650,000 | | | | 1,682,273 | |
Golden West School Financing Authority CAB Series A (Miscellaneous Revenue, NATL-RE Insured)(z) | | | 6.26 | | | | 08/01/2020 | | | | 2,755,000 | | | | 1,622,750 | |
Hawthorne CA School District CAB Series C (Tax Revenue, NATL-RE Insured)(z) | | | 5.81 | | | | 11/01/2025 | | | | 1,265,000 | | | | 572,729 | |
Little Lake CA City School District CAB Series D (Tax Revenue)(z) | | | 5.24 | | | | 07/01/2027 | | | | 1,265,000 | | | | 566,480 | |
Little Lake CA City School District CAB Series D (Tax Revenue)(z) | | | 5.77 | | | | 07/01/2029 | | | | 1,470,000 | | | | 543,165 | |
M-S-R Energy Authority California Series B (Utilities Revenue)§ | | | 6.13 | | | | 11/01/2029 | | | | 30,000,000 | | | | 32,324,700 | |
M-S-R Energy Authority California Series B (Utilities Revenue) | | | 6.50 | | | | 11/01/2039 | | | | 7,000,000 | | | | 7,947,310 | |
M-S-R Energy Authority California Series C (Utilities Revenue) | | | 7.00 | | | | 11/01/2034 | | | | 2,370,000 | | | | 2,832,363 | |
Madera County CA COP Valley Children’s Hospital (Health Revenue, NATL-RE Insured) | | | 6.50 | | | | 03/15/2015 | | | | 450,000 | | | | 477,320 | |
Merced CA City School District CAB (Tax Revenue, NATL-RE FGIC Insured)(z) | | | 5.36 | | | | 08/01/2024 | | | | 1,375,000 | | | | 706,173 | |
| | | | |
| 12 | | Wells Fargo Advantage Municipal Bond Fund | | Portfolio of Investments—December 31, 2011 (Unaudited) |
| | | | | | | | | | | | | | | | |
| Security Name | | Interest Rate | | | Maturity Date | | | Principal | | | Value | |
| | | | | | | | | | | | | | | | |
| | | | |
| California (continued) | | | | | | | | | | | | | | | | |
Merced CA Union High School District CAB Series A (Tax Revenue, NATL-RE FGIC Insured)(z) | | | 4.03 | % | | | 08/01/2020 | | | $ | 1,695,000 | | | $ | 1,201,518 | |
Modesto CA High School District CAB Series A (Tax Revenue, NATL-RE FGIC Insured)(z) | | | 5.12 | | | | 08/01/2024 | | | | 2,215,000 | | | | 1,170,118 | |
Modesto CA Irrigation District Financing Water Project (Water & Sewer Revenue, NATL-RE Insured)±§ | | | 0.93 | | | | 09/01/2027 | | | | 11,685,000 | | | | 7,930,493 | |
Morongo Band of Mission Indians California Enterprise Casino Series B (Miscellaneous Revenue)144A | | | 6.50 | | | | 03/01/2028 | | | | 2,000,000 | | | | 1,926,660 | |
Northern California Gas Authority # 1 LIBOR (Utilities Revenue)±§ | | | 0.85 | | | | 07/01/2017 | | | | 13,560,000 | | | | 11,824,184 | |
Northern California Gas Authority # 1 LIBOR (Utilities Revenue)±§ | | | 0.88 | | | | 07/01/2019 | | | | 13,265,000 | | | | 10,479,748 | |
Northern California Gas Authority # 1 LIBOR (Energy Revenue)±§ | | | 0.96 | | | | 07/01/2027 | | | | 41,660,000 | | | | 29,615,261 | |
Norwalk-La Mirada CA Unified School District CAB Election 2002 Series E (Tax Revenue, Assured Guaranty Insured)(z) | | | 5.82 | | | | 08/01/2030 | | | | 195,000 | | | | 67,137 | |
Norwalk-La Mirada CA Unified School District CAB Election 2002 Series E (Tax Revenue, Assured Guaranty Insured)(z) | | | 6.22 | | | | 08/01/2038 | | | | 30,000,000 | | | | 5,886,900 | |
Oak Grove CA School District CAB Series A (Tax Revenue)(z) | | | 5.51 | | | | 08/01/2027 | | | | 6,250,000 | | | | 2,674,813 | |
Oak Grove CA School District CAB Series A (Tax Revenue)(z) | | | 5.79 | | | | 08/01/2029 | | | | 6,650,000 | | | | 2,437,159 | |
Oakland CA Unified School District Alameda County Election 2006 Series A (Tax Revenue) | | | 6.50 | | | | 08/01/2024 | | | | 1,000,000 | | | | 1,164,640 | |
Oakland CA Unified School District Alameda County Election of 2006 Series A (Tax Revenue) | | | 6.13 | | | | 08/01/2029 | | | | 5,000,000 | | | | 5,473,350 | |
Ontario Montclair CA School District CAB (Tax Revenue, Assured Guaranty Insured)(z) | | | 4.98 | | | | 08/01/2028 | | | | 1,500,000 | | | | 662,310 | |
Ontario Montclair CA School District CAB (Tax Revenue, Assured Guaranty Insured)(z) | | | 5.91 | | | | 08/01/2030 | | | | 2,000,000 | | | | 677,480 | |
Palo Alto CA Unified School District CAB Election 2008 (Tax Revenue)(z) | | | 4.87 | | | | 08/01/2031 | | | | 9,325,000 | | | | 3,624,068 | |
Palomar CA College District CAB Election 2006 Series B (Tax Revenue)(z) | | | 5.23 | | | | 08/01/2024 | | | | 5,125,000 | | | | 2,674,379 | |
Palomar CA College District CAB Election 2006 Series B (Tax Revenue)(z) | | | 5.30 | | | | 08/01/2025 | | | | 2,000,000 | | | | 981,060 | |
Palomar CA College District CAB Election 2006 Series B (Tax Revenue)(z) | | | 5.74 | | | | 08/01/2027 | | | | 1,720,000 | | | | 711,977 | |
Palomar CA College District CAB Election 2006 Series B (Tax Revenue)(z) | | | 5.84 | | | | 08/01/2028 | | | | 2,420,000 | | | | 931,482 | |
Palomar CA College District CAB Election 2006 Series B (Tax Revenue)(z) | | | 5.90 | | | | 08/01/2029 | | | | 3,345,000 | | | | 1,203,096 | |
Palomar CA College District CAB Election 2006 Series B (Tax Revenue)(z) | | | 6.12 | | | | 08/01/2032 | | | | 1,740,000 | | | | 503,034 | |
Palomar CA Pomerado Health CAB Election 2004 (Tax Revenue)(z) | | | 6.47 | | | | 08/01/2039 | | | | 18,915,000 | | | | 3,274,187 | |
Palomar CA Pomerado Health CAB Election 2004 Series A (Tax Revenue, NATL-RE Insured)(z) | | | 4.34 | | | | 08/01/2019 | | | | 4,340,000 | | | | 3,130,963 | |
Palomar CA Pomerado Health CAB Election 2004 Series A (Tax Revenue)(z) | | | 6.46 | | | | 08/01/2038 | | | | 10,000,000 | | | | 1,849,400 | |
Palomar CA Pomerado Health CAB Election 2004 Series B (Tax Revenue)(z) | | | 6.38 | | | | 08/01/2034 | | | | 12,575,000 | | | | 3,050,821 | |
Palomar CA Pomerado Health CAB Election 2004 Series B (Tax Revenue)(z) | | | 6.41 | | | | 08/01/2035 | | | | 13,880,000 | | | | 3,141,183 | |
Palomar CA Pomerado Health CAB Election 2004 Series B (Tax Revenue)(z) | | | 6.43 | | | | 08/01/2036 | | | | 6,615,000 | | | | 1,398,940 | |
Palomar CA Pomerado Health CAB Election 2004 Series B (Tax Revenue)(z) | | | 6.45 | | | | 08/01/2037 | | | | 5,000,000 | | | | 987,750 | |
Pasadena CA PFA CAB Rose Bowl Series A (Lease Revenue)(z) | | | 5.74 | | | | 03/01/2027 | | | | 2,095,000 | | | | 887,882 | |
Pasadena CA PFA CAB Rose Bowl Series A (Lease Revenue)(z) | | | 5.84 | | | | 03/01/2028 | | | | 4,450,000 | | | | 1,754,413 | |
Pasadena CA PFA CAB Rose Bowl Series A (Lease Revenue)(z) | | | 5.90 | | | | 03/01/2029 | | | | 4,520,000 | | | | 1,665,575 | |
Pasadena CA PFA CAB Rose Bowl Series A (Lease Revenue)(z) | | | 5.95 | | | | 03/01/2030 | | | | 6,725,000 | | | | 2,317,570 | |
Pasadena CA PFA CAB Rose Bowl Series A (Lease Revenue)(z) | | | 5.97 | | | | 03/01/2031 | | | | 2,185,000 | | | | 707,481 | |
Pico Rivera CA Water Authority Series A (Water & Sewer Revenue) | | | 5.75 | | | | 12/01/2012 | | | | 130,000 | | | | 132,941 | |
Port Hueneme CA Redevelopment Agency Central Community Project (Tax Revenue, AMBAC Insured) | | | 5.50 | | | | 05/01/2014 | | | | 915,000 | | | | 925,486 | |
Rialto CA Unified School District CAB Series A (Tax Revenue, NATL-RE FGIC Insured)(z) | | | 5.89 | | | | 06/01/2025 | | | | 11,685,000 | | | | 5,363,298 | |
Richmond CA Joint Powers Financing Authority Civic Center Project Series A (Lease Revenue, Assured Guaranty Insured) | | | 5.88 | | | | 08/01/2037 | | | | 3,845,000 | | | | 4,166,019 | |
| | | | | | |
| Portfolio of Investments—December 31, 2011 (Unaudited) | | Wells Fargo Advantage Municipal Bond Fund | | | 13 | |
| | | | | | | | | | | | | | | | |
| Security Name | | Interest Rate | | | Maturity Date | | | Principal | | | Value | |
| | | | | | | | | | | | | | | | |
| | | | |
| California (continued) | | | | | | | | | | | | | | | | |
Richmond CA Joint Powers Financing Authority Point Potrero Series A (Lease Revenue) | | | 6.25 | % | | | 07/01/2024 | | | $ | 5,420,000 | | | $ | 6,000,482 | |
Rowland CA Unified School District CAB Series B (Tax Revenue)(z) | | | 6.09 | | | | 08/01/2039 | | | | 20,600,000 | | | | 3,936,866 | |
Sacramento County CA Sanitation District Financing Authority Regulation B (Water & Sewer Revenue, NATL-RE FGIC Insured)± | | | 0.88 | | | | 12/01/2035 | | | | 24,000,000 | | | | 15,087,360 | |
San Bernardino CA Unified School District CAB Series D (Tax Revenue, AGM Insured)(z) | | | 6.16 | | | | 08/01/2035 | | | | 5,900,000 | | | | 1,410,513 | |
San Bernardino CA Unified School District CAB Series D (Tax Revenue, AGM Insured)(z) | | | 6.30 | | | | 08/01/2036 | | | | 5,000,000 | | | | 1,088,050 | |
San Buenaventura CA Community Mental Health System (Health Revenue) | | | 6.00 | | | | 12/01/2019 | | | | 1,040,000 | | | | 1,063,587 | |
San Buenaventura CA Community Mental Health System (Health Revenue) | | | 6.25 | | | | 12/01/2020 | | | | 2,000,000 | | | | 2,063,980 | |
San Buenaventura CA Community Mental Health System (Health Revenue) | | | 6.50 | | | | 12/01/2021 | | | | 2,585,000 | | | | 2,705,978 | |
San Buenaventura CA Community Mental Health System (Health Revenue)§ | | | 6.50 | | | | 12/01/2022 | | | | 2,500,000 | | | | 2,597,950 | |
San Buenaventura CA Community Mental Health System (Health Revenue)§ | | | 7.50 | | | | 12/01/2041 | | | | 4,000,000 | | | | 4,303,920 | |
San Buenaventura CA Community Mental Health System (Health Revenue)§ | | | 8.00 | | | | 12/01/2031 | | | | 1,500,000 | | | | 1,687,050 | |
San Diego CA Unified School District CAB Series A (Tax Revenue)(z) | | | 5.30 | | | | 07/01/2027 | | | | 2,350,000 | | | | 1,042,860 | |
San Diego CA Unified School District CAB Series A (Tax Revenue)(z) | | | 5.40 | | | | 07/01/2028 | | | | 2,800,000 | | | | 1,160,292 | |
San Diego CA Unified School District CAB Series A (Tax Revenue)(z) | | | 5.45 | | | | 07/01/2029 | | | | 1,830,000 | | | | 712,822 | |
San Diego CA Unified School District CAB Series A (Tax Revenue)(z) | | | 5.61 | | | | 07/01/2030 | | | | 3,085,000 | | | | 1,108,317 | |
San Diego CA Unified School District CAB Series C (Tax Revenue)(z) | | | 5.61 | | | | 07/01/2030 | | | | 2,750,000 | | | | 987,965 | |
San Diego CA Unified School District CAB Series C (Tax Revenue)(z) | | | 5.64 | | | | 07/01/2031 | | | | 2,000,000 | | | | 675,980 | |
San Diego CA Unified School District CAB Series C (Tax Revenue)(z) | | | 5.78 | | | | 07/01/2032 | | | | 1,500,000 | | | | 466,365 | |
San Diego CA Unified School District CAB Series C (Tax Revenue)(z) | | | 5.81 | | | | 07/01/2033 | | | | 1,000,000 | | | | 291,850 | |
San Diego CA Unified School District CAB Series C (Tax Revenue)(z) | | | 5.84 | | | | 07/01/2034 | | | | 2,000,000 | | | | 547,600 | |
San Diego CA Unified School District CAB Series C (Tax Revenue)(z) | | | 5.86 | | | | 07/01/2035 | | | | 1,500,000 | | | | 385,965 | |
San Diego CA Unified School District CAB Series C (Tax Revenue)(z) | | | 5.87 | | | | 07/01/2036 | | | | 14,395,000 | | | | 3,487,765 | |
San Jose CA MFHR Lenzen Housing Series B (Housing Revenue, GNMA Insured) | | | 5.45 | | | | 02/20/2043 | | | | 1,000,000 | | | | 1,001,010 | |
San Rafael CA City High School District CAB Series B (Tax Revenue, NATL-RE FGIC Insured)(z) | | | 5.19 | | | | 08/01/2025 | | | | 2,905,000 | | | | 1,445,877 | |
Santa Ana CA Finance Authority Police Administrative & Holding Facilities Project Series A (Lease Revenue, NATL-RE Insured) | | | 6.25 | | | | 07/01/2015 | | | | 300,000 | | | | 331,980 | |
Santa Ana CA Finance Authority Police Administrative & Holding Facilities Project Series A (Lease Revenue, NATL-RE Insured) | | | 6.25 | | | | 07/01/2018 | | | | 4,285,000 | | | | 4,842,736 | |
Santa Monica CA Community College District 2002 Election Series E (Tax Revenue)(z) | | | 4.53 | | | | 08/01/2023 | | | | 2,285,000 | | | | 1,358,158 | |
Santa Monica CA Community College District 2002 Election Series E (Tax Revenue)(z) | | | 4.73 | | | | 08/01/2024 | | | | 2,265,000 | | | | 1,255,263 | |
Santa Monica CA Community College District 2002 Election Series E (Tax Revenue)(z) | | | 4.87 | | | | 08/01/2025 | | | | 2,165,000 | | | | 1,124,241 | |
Santa Monica CA Community College District 2002 Election Series E (Tax Revenue)(z) | | | 5.00 | | | | 08/01/2026 | | | | 1,525,000 | | | | 740,998 | |
South Pasadena CA Unified School District CAB (Tax Revenue)(z) | | | 5.42 | | | | 08/01/2029 | | | | 425,000 | | | | 165,652 | |
Student Education Loan Marketing Corporation California Series IV D1 (Education Revenue, Guaranteed Student Loans Insured) | | | 5.88 | | | | 01/01/2018 | | | | 4,975,000 | | | | 4,409,243 | |
Sylvan CA Unified School District CAB (Tax Revenue, AGM Insured)(z) | | | 6.29 | | | | 08/01/2037 | | | | 1,085,000 | | | | 222,458 | |
Tahoe-Truckee CA Unified School District CAB #2-A (Tax Revenue, NATL-RE FGIC Insured)(z) | | | 5.23 | | | | 08/01/2024 | | | | 2,965,000 | | | | 1,547,226 | |
Union Elementary School District California CAB Series A (Tax Revenue, NATL-RE FGIC Insured)(z) | | | 3.54 | | | | 09/01/2019 | | | | 1,750,000 | | | | 1,335,373 | |
| | | | |
| 14 | | Wells Fargo Advantage Municipal Bond Fund | | Portfolio of Investments—December 31, 2011 (Unaudited) |
| | | | | | | | | | | | | | | | |
| Security Name | | Interest Rate | | | Maturity Date | | | Principal | | | Value | |
| | | | | | | | | | | | | | | | |
| | | | |
| California (continued) | | | | | | | | | | | | | | | | |
Union Elementary School District California CAB Series A (Tax Revenue, NATL-RE FGIC Insured)(z) | | | 4.55 | % | | | 09/01/2022 | | | $ | 1,610,000 | | | $ | 994,143 | |
Union Elementary School District California CAB Series A (Tax Revenue, NATL-RE FGIC Insured)(z) | | | 4.92 | | | | 09/01/2024 | | | | 2,800,000 | | | | 1,510,712 | |
West Contra Costa CA Unified School District 2005 Series C-1 (Tax Revenue, Assured Guaranty Insured)(z) | | | 5.94 | | | | 08/01/2028 | | | | 11,355,000 | | | | 4,300,706 | |
West Contra Costa CA Unified School District 2005 Series C-1 (Tax Revenue, Assured Guaranty Insured)(z) | | | 6.12 | | | | 08/01/2032 | | | | 10,000,000 | | | | 2,891,000 | |
West Contra Costa CA Unified School District CAB Series D-2 (Tax Revenue, AGM Insured)(z) | | | 6.18 | | | | 08/01/2036 | | | | 20,000,000 | | | | 4,478,600 | |
Wiseburn CA School District CAB 2010 Election Series B (Tax Revenue, AGM Insured)(z) | | | 6.26 | | | | 08/01/2034 | | | | 2,000,000 | | | | 497,040 | |
| | | | |
| | | | | | | | | | | | | | | 364,120,639 | |
| | | | | | | | | | | | | | | | |
| | | | |
| Colorado: 2.31% | | | | | | | | | | | | | | | | |
Aurora CO Housing Authority MFHR 6th Avenue Project Series A (Housing Revenue, U.S. Bank NA LOC) | | | 5.70 | | | | 12/01/2018 | | | | 3,800,000 | | | | 3,806,156 | |
Colorado ECFA Charter School American Academy Project (Miscellaneous Revenue, Moral Obligation Insured) | | | 7.13 | | | | 12/01/2033 | | | | 2,200,000 | | | | 2,569,468 | |
Colorado ECFA Charter School Banning Lewis (Miscellaneous Revenue)144A | | | 6.13 | | | | 12/15/2035 | | | | 4,230,000 | | | | 3,731,706 | |
Colorado ECFA Charter School Community Leadership (Miscellaneous Revenue) | | | 5.75 | | | | 07/01/2019 | | | | 1,295,000 | | | | 1,232,141 | |
Colorado ECFA Charter School Monument Academy Project (Miscellaneous Revenue) | | | 5.50 | | | | 10/01/2017 | | | | 335,000 | | | | 344,437 | |
Colorado ECFA Charter School Monument Academy Project Series A (Miscellaneous Revenue) | | | 7.25 | | | | 10/01/2039 | | | | 500,000 | | | | 513,170 | |
Colorado ECFA Charter School Series A (Lease Revenue) | | | 6.25 | | | | 11/01/2040 | | | | 4,285,000 | | | | 4,565,796 | |
Colorado ECFA Charter School Series B (Lease Revenue) | | | 7.25 | | | | 11/01/2034 | | | | 4,330,000 | | | | 4,464,490 | |
Colorado ECFA Twin Peaks Charter Academy (Lease Revenue, Moral Obligation Insured)§ | | | 6.50 | | | | 03/15/2043 | | | | 1,290,000 | | | | 1,377,668 | |
Colorado ECFA Union Colony Charter School Project (Miscellaneous Revenue)144A | | | 5.75 | | | | 12/01/2037 | | | | 1,605,000 | | | | 1,317,240 | |
Colorado HFA Catholic Health Initiatives Series D (Health Revenue) | | | 6.25 | | | | 10/01/2033 | | | | 4,000,000 | | | | 4,455,120 | |
Colorado HFA Series A2 (Housing Revenue, NATL-RE-IBC Insured) | | | 6.50 | | | | 08/01/2031 | | | | 530,000 | | | | 548,767 | |
Colorado HFA Series B2 (Housing Revenue)§ | | | 7.10 | | | | 04/01/2017 | | | | 110,000 | | | | 113,928 | |
Colorado HFA Series B3 (Housing Revenue, AGM-CR Insured) | | | 6.70 | | | | 08/01/2017 | | | | 465,000 | | | | 496,304 | |
Colorado HFA SFHR Series D-2 (Housing Revenue) | | | 6.90 | | | | 04/01/2029 | | | | 200,000 | | | | 211,452 | |
Colorado PFA Charter School Highline Academy Project (Miscellaneous Revenue) | | | 6.25 | | | | 12/15/2020 | | | | 475,000 | | | | 500,949 | |
Colorado PFA Charter School Highline Academy Project (Miscellaneous Revenue) | | | 6.75 | | | | 12/15/2025 | | | | 455,000 | | | | 475,962 | |
Colorado PFA Charter School Highline Academy Project (Miscellaneous Revenue) | | | 7.38 | | | | 12/15/2040 | | | | 3,905,000 | | | | 4,058,388 | |
Denver CO Health & Hospital Authority Health Care Series A (Health Revenue) | | | 5.00 | | | | 12/01/2017 | | | | 3,655,000 | | | | 3,899,337 | |
Denver CO Health & Hospital Authority Health Care Series A (Health Revenue) | | | 5.00 | | | | 12/01/2020 | | | | 3,730,000 | | | | 3,878,566 | |
E-470 Public Highway Authority Colorado CAB Senior Lien Series B (Transportation Revenue, NATL-RE Insured)(z) | | | 4.70 | | | | 09/01/2016 | | | | 4,460,000 | | | | 3,587,981 | |
E-470 Public Highway Authority Colorado CAB Series B (Miscellaneous Revenue, NATL-RE Insured)(z) | | | 5.57 | | | | 09/01/2020 | | | | 2,500,000 | | | | 1,552,200 | |
| | | | | | |
| Portfolio of Investments—December 31, 2011 (Unaudited) | | Wells Fargo Advantage Municipal Bond Fund | | | 15 | |
| | | | | | | | | | | | | | | | |
| Security Name | | Interest Rate | | | Maturity Date | | | Principal | | | Value | |
| | | | | | | | | | | | | | | | |
| | | | |
| Colorado (continued) | | | | | | | | | | | | | | | | |
Eagle County CO Airport Terminal Corporation Airport Terminal Improvement Project Series A (Port Authority Revenue) | | | 5.15 | % | | | 05/01/2017 | | | $ | 2,290,000 | | | $ | 2,297,763 | |
Eagle County CO Airport Terminal Corporation Airport Terminal Improvement Project Series B (Port Authority Revenue) | | | 5.05 | | | | 05/01/2015 | | | | 390,000 | | | | 392,410 | |
Eagle County CO Airport Terminal Corporation Airport Terminal Improvement Project Series B (Port Authority Revenue) | | | 5.25 | | | | 05/01/2020 | | | | 290,000 | | | | 282,518 | |
Larimer County CO School District # 1 (Tax Revenue, NATL-RE-IBC Insured) | | | 7.00 | | | | 12/15/2016 | | | | 2,250,000 | | | | 2,757,285 | |
Public Authority for Colorado Energy Natural Gas (Utilities Revenue) | | | 5.75 | | | | 11/15/2018 | | | | 2,210,000 | | | | 2,366,424 | |
| | | | |
| | | | | | | | | | | | | | | 55,797,626 | |
| | | | | | | | | | | | | | | | |
| | | | |
| Connecticut: 0.56% | | | | | | | | | | | | | | | | |
Connecticut Development Authority Water Facilities (IDR, AMBAC-TCRS Insured) | | | 6.15 | | | | 04/01/2035 | | | | 1,000,000 | | | | 1,000,120 | |
Connecticut HEFA Eastern Connecticut Health Network Series A (Health Revenue, Radian Insured) | | | 6.38 | | | | 07/01/2016 | | | | 900,000 | | | | 902,025 | |
Connecticut HEFA University of Hartford Series G (Education Revenue, Radian Insured) | | | 5.25 | | | | 07/01/2026 | | | | 850,000 | | | | 866,354 | |
Connecticut HFA Special Needs Housing Series 2 (Health Revenue, AMBAC Insured) | | | 5.25 | | | | 06/15/2022 | | | | 2,000,000 | | | | 2,033,840 | |
Eastern Connecticut Resource Recovery Authority Solid Waste Wheelabrator Lisbon Incorporated Project Series A (Resource Recovery Revenue) | | | 5.50 | | | | 01/01/2014 | | | | 3,755,000 | | | | 3,765,364 | |
Eastern Connecticut Resource Recovery Authority Solid Waste Wheelabrator Lisbon Incorporated Project Series A (Resource Recovery Revenue) | | | 5.50 | | | | 01/01/2015 | | | | 5,000,000 | | | | 5,012,950 | |
New Haven CT Escrowed to Maturity Series C (Tax Revenue, NATL-RE Insured) | | | 5.00 | | | | 11/01/2019 | | | | 5,000 | | | | 5,241 | |
| | | | |
| | | | | | | | | | | | | | | 13,585,894 | |
| | | | | | | | | | | | | | | | |
| | | | |
| District of Columbia: 0.40% | | | | | | | | | | | | | | | | |
District of Columbia Cesar Chavez Public Charter School (Education Revenue) | | | 6.50 | | | | 11/15/2021 | | | | 6,095,000 | | | | 6,382,928 | |
District of Columbia HFA SFHR Series B (Housing Revenue, GNMA/FNMA Insured) | | | 5.85 | | | | 12/01/2018 | | | | 590,000 | | | | 607,328 | |
District of Columbia Tobacco Settlement Financing Corporation Asset-Backed Bonds (Tobacco Revenue) | | | 5.70 | | | | 05/15/2012 | | | | 205,000 | | | | 207,669 | |
District of Columbia Water & Sewer Authority Public Utilities Series A (Water & Sewer Revenue) | | | 6.00 | | | | 10/01/2035 | | | | 2,000,000 | | | | 2,395,340 | |
| | | | |
| | | | | | | | | | | | | | | 9,593,265 | |
| | | | | | | | | | | | | | | | |
| | | | |
| Florida: 6.99% | | | | | | | | | | | | | | | | |
Alachua County FL Health Facilities Authority Shands Teaching Hospital Series A (Health Revenue, NATL-RE Insured) | | | 6.25 | | | | 12/01/2016 | | | | 4,000,000 | | | | 4,426,360 | |
Broward County FL Professional Sports Facilities Project Series A (Tax Revenue, AMBAC Insured) | | | 5.00 | | | | 09/01/2021 | | | | 2,200,000 | | | | 2,338,006 | |
Championsgate FL Community Development District Capital Improvement Series A (Miscellaneous Revenue) | | | 6.25 | | | | 05/01/2020 | | | | 2,080,000 | | | | 1,923,147 | |
Collier County FL School Board Refunding COP (Lease Revenue, AGM Insured) | | | 5.25 | | | | 02/15/2021 | | | | 1,000,000 | | | | 1,196,140 | |
Connerton FL West Community Development District Series B (Miscellaneous Revenue)^^(i) | | | 5.13 | | | | 05/01/2016 | | | | 3,275,000 | | | | 1,314,421 | |
Escambia County FL Health Facilities Authority Ascension Health Series C (Health Revenue) | | | 5.75 | | | | 11/15/2032 | | | | 5,000,000 | | | | 5,115,150 | |
| | | | |
| 16 | | Wells Fargo Advantage Municipal Bond Fund | | Portfolio of Investments—December 31, 2011 (Unaudited) |
| | | | | | | | | | | | | | | | |
| Security Name | | Interest Rate | | | Maturity Date | | | Principal | | | Value | |
| | | | | | | | | | | | | | | | |
| | | | |
| Florida (continued) | | | | | | | | | | | | | | | | |
Florida Housing Finance Corporation Journet Place Apartments Series 1 (Housing Revenue) | | | 7.60 | % | | | 12/15/2047 | | | $ | 1,760,000 | | | $ | 1,853,509 | |
Florida Housing Finance Corporation Villa Capri Phase III (Housing Revenue) | | | 7.60 | | | | 12/15/2042 | | | | 2,815,000 | | | | 2,918,311 | |
Florida State Development Finance Corporation Renaissance Charter School Series A (Miscellaneous Revenue) | | | 6.00 | | | | 09/15/2030 | | | | 4,750,000 | | | | 4,712,618 | |
Florida State Development Finance Corporation Renaissance Charter School Series A (Miscellaneous Revenue) | | | 6.00 | | | | 09/15/2040 | | | | 4,000,000 | | | | 3,805,600 | |
Florida State Development Finance Corporation Renaissance Charter School Series A (Miscellaneous Revenue)§ | | | 7.50 | | | | 06/15/2033 | | | | 5,775,000 | | | | 5,947,904 | |
Florida State Development Finance Corporation Renaissance Charter School Series A (Miscellaneous Revenue)§ | | | 7.63 | | | | 06/15/2041 | | | | 5,000,000 | | | | 5,149,600 | |
Gulf Breeze FL Miami Beach Local Government Series B (Miscellaneous Revenue, FGIC Insured)±§ | | | 4.75 | | | | 12/01/2015 | | | | 145,000 | | | | 146,698 | |
Heritage Harbor FL Community Development District (Miscellaneous Revenue) | | | 7.75 | | | | 05/01/2023 | | | | 565,000 | | | | 368,527 | |
Heritage Isles FL Community Development District (Miscellaneous Revenue)^^(i) | | | 7.10 | | | | 10/01/2023 | | | | 2,150,000 | | | | 405,275 | |
Hollywood FL Community Redevelopment Agency (IDR) | | | 5.13 | | | | 03/01/2014 | | | | 2,110,000 | | | | 2,166,421 | |
Indigo FL Community Development District Series C (Miscellaneous Revenue) | | | 1.40 | | | | 05/01/2030 | | | | 2,700,000 | | | | 2,017,602 | |
Jacksonville FL Economic Development Commission ID Metropolitan Parking Solutions Project (IDR, ACA Insured) | | | 5.75 | | | | 10/01/2024 | | | | 10,000,000 | | | | 10,294,200 | |
Jacksonville FL Economic Development Commission ID Metropolitan Parking Solutions Project (IDR, ACA Insured) | | | 5.88 | | | | 06/01/2025 | | | | 5,000,000 | | | | 5,175,350 | |
Jacksonville FL HCFR Jacksonville Medical Center Series A (Health Revenue) | | | 7.00 | | | | 10/01/2029 | | | | 3,470,000 | | | | 3,350,077 | |
Jacksonville FL Port Authority (Port Authority Revenue, Assured Guaranty Insured) | | | 6.00 | | | | 11/01/2038 | | | | 5,000,000 | | | | 5,063,400 | |
Lakeside Plantation FL Community Development District Series A (Miscellaneous Revenue) | | | 6.95 | | | | 05/01/2031 | | | | 1,371,508 | | | | 1,365,555 | |
Marshall Creek FL Community Development District (Miscellaneous Revenue) | | | 6.63 | | | | 05/01/2032 | | | | 2,700,000 | | | | 2,388,690 | |
Marshall Creek FL Community Development District Series A (Miscellaneous Revenue) | | | 7.65 | | | | 05/01/2032 | | | | 1,765,000 | | | | 1,765,018 | |
Miami FL Special Obligation Series A (Miscellaneous Revenue, AGM Insured)§ | | | 5.75 | | | | 02/01/2026 | | | | 3,055,000 | | | | 3,382,740 | |
Miami FL Special Obligation Series A (Miscellaneous Revenue, AGM Insured)§ | | | 5.75 | | | | 02/01/2027 | | | | 5,355,000 | | | | 5,887,180 | |
Miami FL Special Obligation Series A (Miscellaneous Revenue, AGM Insured)§ | | | 6.00 | | | | 02/01/2028 | | | | 2,180,000 | | | | 2,438,831 | |
Miami FL Special Obligation Series A (Miscellaneous Revenue, AGM Insured)§ | | | 6.00 | | | | 02/01/2029 | | | | 4,000,000 | | | | 4,468,560 | |
Miami FL Special Obligation Series A (Miscellaneous Revenue, AGM Insured)§ | | | 6.00 | | | | 02/01/2030 | | | | 2,000,000 | | | | 2,224,780 | |
Miami FL Special Obligation Series A (Miscellaneous Revenue, AGM Insured)§ | | | 6.00 | | | | 02/01/2031 | | | | 2,000,000 | | | | 2,209,060 | |
Miami-Dade County FL Educational Facilities University of Miami Series A (Education Revenue) | | | 5.75 | | | | 04/01/2028 | | | | 1,200,000 | | | | 1,289,064 | |
Miami-Dade County FL IDA Airis Miami II LLC Project (IDR, AMBAC Insured) | | | 6.00 | | | | 10/15/2025 | | | | 1,715,000 | | | | 1,528,442 | |
Miami-Dade County FL IDA Series C (IDR)±§ | | | 3.00 | | | | 07/01/2032 | | | | 5,000,000 | | | | 5,000,000 | |
North Springs FL Improvement District Series B (Miscellaneous Revenue) | | | 7.00 | | | | 05/01/2019 | | | | 1,117,000 | | | | 1,117,424 | |
North Sumter County FL Utility Dependent District (Water & Sewer Revenue) | | | 5.00 | | | | 10/01/2020 | | | | 6,285,000 | | | | 6,735,320 | |
| | | | | | |
| Portfolio of Investments—December 31, 2011 (Unaudited) | | Wells Fargo Advantage Municipal Bond Fund | | | 17 | |
| | | | | | | | | | | | | | | | |
| Security Name | | Interest Rate | | | Maturity Date | | | Principal | | | Value | |
| | | | | | | | | | | | | | | | |
| | | | |
| Florida (continued) | | | | | | | | | | | | | | | | |
Palm Beach County FL Health Facilities Authority John F. Kennedy Memorial Hospital Incorporated Project Series C (Health Revenue) | | | 9.50 | % | | | 08/01/2013 | | | $ | 630,000 | | | $ | 683,487 | |
Palm Beach County FL Public Improvement Series 2 (Miscellaneous Revenue) | | | 5.38 | | | | 11/01/2028 | | | | 2,000,000 | | | | 2,218,440 | |
Poinciana FL Community Development District Series A (Miscellaneous Revenue) | | | 7.13 | | | | 05/01/2031 | | | | 2,800,000 | | | | 2,800,504 | |
Saint John’s County FL IDA Health Care Glenmoor Project Series B (Health Revenue)±§ | | | 4.75 | | | | 01/01/2041 | | | | 1,000,000 | | | | 999,980 | |
Saint Petersburg FL Health Facilities Authority All Children’s Project Series A (Health Revenue) | | | 6.50 | | | | 11/15/2039 | | | | 5,500,000 | | | | 6,091,580 | |
Seminole County FL IDA Choices in Learning Series A (Miscellaneous Revenue) | | | 6.20 | | | | 11/15/2026 | | | | 2,375,000 | | | | 2,394,119 | |
Seminole County FL IDA Choices in Learning Series A (Miscellaneous Revenue) | | | 7.38 | | | | 11/15/2041 | | | | 3,525,000 | | | | 3,695,786 | |
Seminole Tribe Florida Series 2010A Gaming Division Series A (Miscellaneous Revenue)144A | | | 5.13 | | | | 10/01/2017 | | | | 2,950,000 | | | | 2,995,725 | |
Seminole Tribe Florida Special Obligation Series A (Miscellaneous Revenue)§144A | | | 5.50 | | | | 10/01/2024 | | | | 14,315,000 | | | | 13,651,213 | |
Seminole Tribe Florida Special Obligation Series A (Miscellaneous Revenue)144A | | | 5.75 | | | | 10/01/2022 | | | | 6,400,000 | | | | 6,391,744 | |
South Miami FL Health Facilities Baptist Health (Health Revenue) | | | 5.00 | | | | 08/15/2023 | | | | 3,060,000 | | | | 3,311,899 | |
Stoneybrook FL Community Development District (Miscellaneous Revenue)^^(i) | | | 7.00 | | | | 10/01/2022 | | | | 7,605,000 | | | | 2,293,972 | |
Sunrise FL CAB Series B (Tax Revenue, NATL-RE Insured)(z) | | | 4.29 | | | | 10/01/2016 | | | | 3,965,000 | | | | 3,238,652 | |
Viera East FL Community Development District Water Management Project (Water & Sewer Revenue, NATL-RE Insured) | | | 5.75 | | | | 05/01/2020 | | | | 2,020,000 | | | | 2,123,081 | |
Viera East FL Community Development District Water Management Project (Water & Sewer Revenue, NATL-RE Insured) | | | 5.75 | | | | 05/01/2021 | | | | 2,140,000 | | | | 2,248,626 | |
Viera East FL Community Development District Water Management Project (Water & Sewer Revenue, NATL-RE Insured) | | | 5.75 | | | | 05/01/2022 | | | | 2,265,000 | | | | 2,357,933 | |
| | | | |
| | | | | | | | | | | | | | | 168,985,721 | |
| | | | | | | | | | | | | | | | |
| | | | |
| Georgia: 1.69% | | | | | | | | | | | | | | | | |
Athens GA Housing Authority Student Housing Lease University of Georgia East Campus (Housing Revenue, AMBAC Insured) | | | 5.25 | | | | 12/01/2020 | | | | 1,315,000 | | | | 1,373,925 | |
Atlanta GA Development Authority TUFF Advanced Technology Development Center Project Series A (IDR) | | | 5.63 | | | | 07/01/2018 | | | | 2,640,000 | | | | 2,683,428 | |
Brunswick & Glynn County GA Memorial Hospital Authority 2005 Anticipation Certificates Southeast Georgia Health Systems Incorporated Project (Health Revenue, NATL-RE Insured) | | | 6.00 | | | | 08/01/2016 | | | | 510,000 | | | | 511,346 | |
Cartersville GA GO School Bonds (GO-Local) | | | 6.70 | | | | 01/01/2012 | | | | 30,000 | | | | 30,005 | |
Cobb & Marietta GA Coliseum & Exhibit Hall Authority (Tax Revenue, NATL-RE Insured) | | | 5.50 | | | | 10/01/2012 | | | | 340,000 | | | | 348,099 | |
Forsyth County GA Hospital Authority Anticipation Certificates Georgia Baptist Health Care System Project (Health Revenue) | | | 6.38 | | | | 10/01/2028 | | | | 465,000 | | | | 602,542 | |
Gainesville & Hall County GA Development Authority Senior Living Facilities Lanier Village Estates Series C (Health Revenue) | | | 7.25 | | | | 11/15/2029 | | | | 6,000,000 | | | | 6,008,940 | |
Georgia HFA SFHR Series B-2 (Housing Revenue, GO of Authority Insured) | | | 5.35 | | | | 12/01/2022 | | | | 2,085,000 | | | | 2,086,751 | |
Georgia Municipal Association COP City Court Atlanta Project (Lease Revenue, AMBAC Insured) | | | 5.50 | | | | 12/01/2016 | | | | 2,175,000 | | | | 2,226,156 | |
Georgia Municipal Association COP City Court Atlanta Project (Lease Revenue, AMBAC Insured) | | | 5.50 | | | | 12/01/2017 | | | | 2,220,000 | | | | 2,270,461 | |
| | | | |
| 18 | | Wells Fargo Advantage Municipal Bond Fund | | Portfolio of Investments—December 31, 2011 (Unaudited) |
| | | | | | | | | | | | | | | | |
| Security Name | | Interest Rate | | | Maturity Date | | | Principal | | | Value | |
| | | | | | | | | | | | | | | | |
| | | | |
| Georgia (continued) | | | | | | | | | | | | | | | | |
Georgia Municipal Association COP City Court Atlanta Project (Lease Revenue, AMBAC Insured) | | | 5.50 | % | | | 12/01/2018 | | | $ | 2,500,000 | | | $ | 2,554,625 | |
Georgia Municipal Electric Authority Power Series EE (Utilities Revenue, AMBAC Insured) | | | 7.25 | | | | 01/01/2024 | | | | 400,000 | | | | 556,516 | |
Georgia Municipal Electric Authority Power Unrefunded Revenue (Utilities Revenue, NATL-RE IBC Bank of New York Insured) | | | 6.50 | | | | 01/01/2017 | | | | 450,000 | | | | 515,372 | |
Main Street Natural Gas Incorporated of Georgia Gas Project Series A (Energy Revenue) | | | 5.00 | | | | 03/15/2018 | | | | 1,750,000 | | | | 1,910,038 | |
Main Street Natural Gas Incorporated of Georgia Gas Project Series A (Energy Revenue) | | | 5.00 | | | | 03/15/2022 | | | | 4,675,000 | | | | 4,947,179 | |
Main Street Natural Gas Incorporated of Georgia Gas Project Series A (Energy Revenue) | | | 5.50 | | | | 09/15/2022 | | | | 3,230,000 | | | | 3,365,111 | |
Main Street Natural Gas Incorporated of Georgia Gas Project Series B (Energy Revenue) | | | 5.00 | | | | 03/15/2016 | | | | 1,685,000 | | | | 1,730,579 | |
Main Street Natural Gas Incorporated of Georgia Gas Project Series B (Energy Revenue) | | | 5.00 | | | | 03/15/2018 | | | | 3,000,000 | | | | 3,073,740 | |
Richmond County GA Development Authority Student Housing Facilities Augusta State University LLC Project Series A (Education Revenue) | | | 5.38 | | | | 02/01/2025 | | | | 3,870,000 | | | | 3,982,385 | |
| | | | |
| | | | | | | | | | | | | | | 40,777,198 | |
| | | | | | | | | | | | | | | | |
| | | | |
| Guam: 0.63% | | | | | | | | | | | | | | | | |
Guam Government Hotel Occupancy Series A (Tax Revenue) | | | 6.50 | | | | 11/01/2040 | | | | 11,300,000 | | | | 12,365,929 | |
Guam Government Waterworks Authority (Water & Sewer Revenue) | | | 4.25 | | | | 07/01/2017 | | | | 905,000 | | | | 883,950 | |
Guam Government Waterworks Authority (Water & Sewer Revenue) | | | 5.00 | | | | 07/01/2019 | | | | 450,000 | | | | 447,084 | |
Guam Housing Corporation Guaranteed Mortgage-Backed Securities Series A (Housing Revenue, FHLMC Insured) | | | 5.75 | | | | 09/01/2031 | | | | 60,000 | | | | 67,693 | |
Guam Power Authority Series A (Utilities Revenue, AMBAC Insured) | | | 5.00 | | | | 10/01/2018 | | | | 1,400,000 | | | | 1,389,220 | |
| | | | |
| | | | | | | | | | | | | | | 15,153,876 | |
| | | | | | | | | | | | | | | | |
| | | | |
| Hawaii: 0.00% | | | | | | | | | | | | | | | | |
Hawaii State Housing Finance & Development Corporation Series A (Housing Revenue, FNMA Insured) | | | 5.75 | | | | 07/01/2030 | | | | 20,000 | | | | 20,148 | |
| | | | | | | | | | | | | | | | |
| | | | |
| Idaho: 0.72% | | | | | | | | | | | | | | | | |
Boise-Kuna ID Irrigation District Arrowrock Hydroelectric Project (Utilities Revenue) | | | 7.38 | | | | 06/01/2040 | | | | 6,300,000 | | | | 7,190,568 | |
Idaho Health Facilities Authority Trinity Health Credit Group Series B (Health Revenue) | | | 6.25 | | | | 12/01/2033 | | | | 3,000,000 | | | | 3,363,960 | |
Idaho Housing & Finance Association Idaho Arts Charter School Incorporated Series A (Miscellaneous Revenue) | | | 6.50 | | | | 12/01/2038 | | | | 1,500,000 | | | | 1,468,200 | |
Idaho Housing & Finance Association Liberty Charter School Series A (Miscellaneous Revenue) | | | 6.00 | | | | 06/01/2038 | | | | 500,000 | | | | 480,785 | |
Idaho Housing & Finance Association North Star Charter School Project Series A (Miscellaneous Revenue) | | | 9.50 | | | | 07/01/2039 | | | | 2,500,000 | | | | 2,629,550 | |
Idaho Housing & Finance Association Series A (Miscellaneous Revenue) | | | 6.13 | | | | 07/01/2038 | | | | 1,500,000 | | | | 1,385,010 | |
Idaho Housing & Finance Association Series C2 (Housing Revenue) | | | 6.35 | | | | 07/01/2015 | | | | 30,000 | | | | 30,066 | |
Idaho Housing & Finance Association Series E Class I (Housing Revenue) | | | 3.60 | | | | 07/01/2033 | | | | 290,000 | | | | 290,023 | |
Idaho Housing & Finance Association Series H2 (Housing Revenue, FHA VA Mortgages Insured) | | | 6.15 | | | | 01/01/2028 | | | | 70,000 | | | | 70,322 | |
Idaho Housing & Finance Association SFHR Series B-2 (Housing Revenue) | | | 6.00 | | | | 07/01/2014 | | | | 205,000 | | | | 208,758 | |
Idaho Housing & Finance Association SFHR Series D (Housing Revenue) | | | 6.30 | | | | 07/01/2025 | | | | 420,000 | | | | 420,580 | |
| | | | |
| | | | | | | | | | | | | | | 17,537,822 | |
| | | | | | | | | | | | | | | | |
| | | | | | |
| Portfolio of Investments—December 31, 2011 (Unaudited) | | Wells Fargo Advantage Municipal Bond Fund | | | 19 | |
| | | | | | | | | | | | | | | | |
| Security Name | | Interest Rate | | | Maturity Date | | | Principal | | | Value | |
| | | | | | | | | | | | | | | | |
| | | | |
| Illinois: 11.80% | | | | | | | | | | | | | | | | |
Aurora IL Series B (Tax Revenue) | | | 5.85 | % | | | 12/30/2013 | | | $ | 2,740,000 | | | $ | 2,821,104 | |
Chicago IL Board of Education CAB School Reform Series A (Tax Revenue, NATL-RE FGIC Insured)(z) | | | 3.55 | | | | 12/01/2020 | | | | 1,000,000 | | | | 729,470 | |
Chicago IL Board of Education CAB School Reform Series B-1 (Tax Revenue, NATL-RE FGIC Insured)(z) | | | 3.77 | | | | 12/01/2021 | | | | 39,635,000 | | | | 27,310,893 | |
Chicago IL Board of Education CAB School Reform Series B-1 (Tax Revenue, NATL-RE FGIC Insured)(z) | | | 3.93 | | | | 12/01/2022 | | | | 10,000,000 | | | | 6,521,800 | |
Chicago IL Board of Education Series D (Tax Revenue, AGM Insured) | | | 5.00 | | | | 12/01/2025 | | | | 1,000,000 | | | | 1,059,240 | |
Chicago IL CAB Project & Refunding Series A (Tax Revenue, NATL-RE Insured)±§ | | | 5.56 | | | | 01/01/2021 | | | | 3,060,000 | | | | 3,436,043 | |
Chicago IL Series D (Miscellaneous Revenue, AGM Insured)±§ | | | 4.00 | | | | 01/01/2040 | | | | 6,000,000 | | | | 6,000,000 | |
DeKalb-Kane-Lasalle Counties IL Kishwaukee Community College District #523 Series B (Miscellaneous Revenue)(z) | | | 3.26 | | | | 02/01/2019 | | | | 500,000 | | | | 396,885 | |
DeKalb-Kane-Lasalle Counties IL Kishwaukee Community College District #523 Series B (Miscellaneous Revenue)§(z) | | | 4.09 | | | | 02/01/2022 | | | | 1,000,000 | | | | 663,510 | |
DuPage County IL Community Unit School District # 46 School Building (Tax Revenue, AMBAC Insured)(z) | | | 4.28 | | | | 01/01/2023 | | | | 23,450,000 | | | | 14,684,156 | |
DuPage County IL Special Service Area # 31 Monarch Landing Project (Tax Revenue) | | | 5.40 | | | | 03/01/2016 | | | | 160,000 | | | | 157,530 | |
Eureka IL Eureka College Project 1998 Series B (Education Revenue)±§ | | | 7.00 | | | | 01/01/2019 | | | | 2,390,000 | | | | 2,393,561 | |
Illinois Development Finance Authority Balance Community Rehabilitation Series A (Health Revenue) | | | 7.88 | | | | 07/01/2020 | | | | 125,195 | | | | 90,004 | |
Illinois Finance Authority Advocate Healthcare Network Series D (Health Revenue) | | | 6.50 | | | | 11/01/2038 | | | | 5,000,000 | | | | 5,582,500 | |
Illinois Finance Authority Medical District Commission Project A (Health Revenue, CIFC Insured) | | | 4.13 | | | | 09/01/2018 | | | | 1,315,000 | | | | 1,356,107 | |
Illinois Finance Authority New Money Community Rehabilitation Series A (Health Revenue, GO of Participants Insured) | | | 5.35 | | | | 07/01/2027 | | | | 305,000 | | | | 221,814 | |
Illinois Finance Authority Northwestern Memorial Hospital Project Series A (Health Revenue) | | | 6.00 | | | | 08/15/2039 | | | | 5,000,000 | | | | 5,543,900 | |
Illinois Finance Authority Student Housing (Education Revenue) | | | 5.13 | | | | 10/01/2020 | | | | 5,000,000 | | | | 5,207,150 | |
Illinois Finance Authority Student Housing Illinois State University (Education Revenue) | | | 6.75 | | | | 04/01/2031 | | | | 8,000,000 | | | | 8,464,000 | |
Illinois Health Facilities Authority Edward Hospital Obligated Group A Series 2001-A (Health Revenue, AGM Insured) | | | 5.50 | | | | 02/15/2014 | | | | 2,830,000 | | | | 2,842,792 | |
Illinois Health Facilities Authority Edward Hospital Obligated Group A Series 2001-A (Health Revenue, AGM Insured) | | | 5.50 | | | | 02/15/2015 | | | | 1,730,000 | | | | 1,737,353 | |
Illinois Housing Development Authority Series A-1 (Housing Revenue, GNMA Insured) | | | 5.80 | | | | 12/20/2041 | | | | 6,520,000 | | | | 6,701,973 | |
Illinois Sports Facilities Authority State Tax Supported CAB (Tax Revenue, AMBAC Insured)(z) | | | 4.24 | | | | 06/15/2021 | | | | 9,595,000 | | | | 6,443,714 | |
Illinois Sports Facilities Authority State Tax Supported CAB (Tax Revenue, AMBAC Insured)(z) | | | 4.42 | | | | 06/15/2022 | | | | 9,150,000 | | | | 5,785,820 | |
Illinois Sports Facilities Authority State Tax Supported CAB (Tax Revenue, AMBAC Insured)(z) | | | 4.64 | | | | 06/15/2023 | | | | 7,500,000 | | | | 4,428,075 | |
Illinois Sports Facilities Authority State Tax Supported CAB (Tax Revenue, AMBAC Insured)(z) | | | 4.96 | | | | 06/15/2025 | | | | 7,500,000 | | | | 3,874,200 | |
Illinois State (Tax Revenue, AMBAC Insured) | | | 5.00 | | | | 04/01/2020 | | | | 5,905,000 | | | | 6,327,444 | |
Illinois State (Tax Revenue, AMBAC Insured) | | | 5.00 | | | | 11/01/2025 | | | | 4,900,000 | | | | 5,016,669 | |
Illinois State (Tax Revenue, AMBAC Insured) | | | 5.00 | | | | 04/01/2027 | | | | 7,475,000 | | | | 7,663,744 | |
Illinois State (Tax Revenue, AMBAC Insured) | | | 5.00 | | | | 04/01/2028 | | | | 6,705,000 | | | | 6,853,784 | |
Illinois State (Tax Revenue) | | | 5.50 | | | | 01/01/2030 | | | | 2,900,000 | | | | 3,270,591 | |
| | | | |
| 20 | | Wells Fargo Advantage Municipal Bond Fund | | Portfolio of Investments—December 31, 2011 (Unaudited) |
| | | | | | | | | | | | | | | | |
| Security Name | | Interest Rate | | | Maturity Date | | | Principal | | | Value | |
| | | | | | | | | | | | | | | | |
| | | | |
| Illinois (continued) | | | | | | | | | | | | | | | | |
Illinois State Finance Authority Charter Schools Series A (Miscellaneous Revenue)§ | | | 6.88 | % | | | 10/01/2031 | | | $ | 2,000,000 | | | $ | 2,034,080 | |
Illinois State Finance Authority Charter Schools Series A (Miscellaneous Revenue)§ | | | 7.13 | | | | 10/01/2041 | | | | 1,300,000 | | | | 1,321,515 | |
Illinois State Series 1 (Miscellaneous Revenue, NATL-RE FGIC Insured) | | | 6.00 | | | | 11/01/2026 | | | | 3,000,000 | | | | 3,643,680 | |
Kane & De Kalb County IL Community Unit School District # 302 School Building (Tax Revenue, AGM Insured) | | | 5.50 | | | | 02/01/2025 | | | | 1,265,000 | | | | 1,448,033 | |
Kane & De Kalb County IL Community Unit School District # 302 School Building (Tax Revenue, AGM Insured) | | | 5.50 | | | | 02/01/2026 | | | | 3,610,000 | | | | 4,123,125 | |
Kendall Kane & Will County IL CAB Bonds #308 (Tax Revenue, AGM Insured)(z) | | | 5.00 | | | | 02/01/2026 | | | | 5,000,000 | | | | 2,490,350 | |
Kendall Kane & Will County IL CAB Bonds #308 (Tax Revenue, AGM Insured)(z) | | | 5.08 | | | | 02/01/2027 | | | | 12,050,000 | | | | 5,645,064 | |
Lake County IL Community Consolidated School District # 24 Millburn CAB Bonds (Tax Revenue, NATL-RE FGIC Insured)(z) | | | 3.06 | | | | 12/01/2015 | | | | 1,745,000 | | | | 1,548,042 | |
Lake County IL Community Consolidated School District # 38 CAB Bonds (Tax Revenue, AMBAC Insured)(z) | | | 5.86 | | | | 02/01/2024 | | | | 5,435,000 | | | | 2,702,554 | |
Lake County IL Community High School District #117 Antioch CAB Series B (Tax Revenue, NATL-RE FGIC Insured)(z) | | | 3.81 | | | | 12/01/2016 | | | | 3,080,000 | | | | 2,555,507 | |
Lake County IL School District #38 Big Hollow CAB (Tax Revenue, AMBAC Insured)(z) | | | 4.35 | | | | 02/01/2016 | | | | 795,000 | | | | 666,329 | |
Lake County IL School District #38 Big Hollow CAB (Tax Revenue, AMBAC Insured)(z) | | | 4.49 | | | | 02/01/2017 | | | | 325,000 | | | | 259,028 | |
Lake County IL School District #38 Big Hollow CAB (Tax Revenue, AMBAC Insured)(z) | | | 4.66 | | | | 02/01/2018 | | | | 3,925,000 | | | | 2,962,904 | |
Lake County IL School District #38 Big Hollow CAB (Tax Revenue, AMBAC Insured)(z) | | | 4.86 | | | | 02/01/2019 | | | | 675,000 | | | | 479,783 | |
Lake County IL School District #38 Big Hollow CAB (Tax Revenue, AMBAC Insured)(z) | | | 5.10 | | | | 02/01/2020 | | | | 1,250,000 | | | | 831,025 | |
Lake County IL School District #38 Big Hollow CAB (Tax Revenue, AMBAC Insured)(z) | | | 5.30 | | | | 02/01/2021 | | | | 600,000 | | | | 372,690 | |
Lake County IL Township High School District # 126 Zion-Benton CAB (Tax Revenue, NATL-RE FGIC Insured)(z) | | | 3.70 | | | | 02/01/2020 | | | | 910,000 | | | | 675,302 | |
McHenry & Kane Counties IL Community Consolidated School District # 158 Huntley CAB (Tax Revenue, NATL-RE FGIC Insured)(z) | | | 4.28 | | | | 01/01/2019 | | | | 765,000 | | | | 567,898 | |
McHenry & Kane Counties IL Community School District # 158 CAB (Tax Revenue, NATL-RE FGIC Insured)(z) | | | 4.77 | | | | 01/01/2021 | | | | 2,000,000 | | | | 1,306,040 | |
Metropolitan Pier & Exposition Authority Illinois CAB McCormick Series A (Tax Revenue, NATL-RE Insured)(z) | | | 4.63 | | | | 12/15/2024 | | | | 6,850,000 | | | | 3,777,159 | |
Metropolitan Pier & Exposition Authority Illinois CAB McCormick Series A (Tax Revenue, NATL-RE Insured)(z) | | | 4.77 | | | | 12/15/2025 | | | | 6,600,000 | | | | 3,413,850 | |
Metropolitan Pier & Exposition Authority Illinois CAB McCormick Series B (Tax Revenue, AGM Insured)(z) | | | 4.96 | | | | 06/15/2027 | | | | 7,400,000 | | | | 3,464,606 | |
Metropolitan Pier & Exposition Authority Illinois CAB McCormick Series PJ (Tax Revenue, NATL-RE Insured)(z) | | | 5.11 | | | | 06/15/2028 | | | | 29,980,000 | | | | 13,045,797 | |
Metropolitan Pier & Exposition Authority Illinois CAB McCormick Series PJ (Tax Revenue, NATL-RE FGIC Insured)(z) | | | 5.26 | | | | 06/15/2029 | | | | 20,400,000 | | | | 8,226,708 | |
Railsplitter Tobacco Settlement Authority (Tobacco Revenue) | | | 5.50 | | | | 06/01/2023 | | | | 9,375,000 | | | | 10,376,250 | |
Railsplitter Tobacco Settlement Authority (Tobacco Revenue) | | | 6.25 | | | | 06/01/2024 | | | | 16,695,000 | | | | 18,258,821 | |
Regional Transportation Authority Illinois (Miscellaneous Revenue, AGM GO of Authority Insured) | | | 5.75 | | | | 06/01/2023 | | | | 400,000 | | | | 497,956 | |
Riverdale IL (Miscellaneous Revenue)§ | | | 8.00 | | | | 10/01/2036 | | | | 4,400,000 | | | | 4,577,232 | |
| | | | | | |
| Portfolio of Investments—December 31, 2011 (Unaudited) | | Wells Fargo Advantage Municipal Bond Fund | | | 21 | |
| | | | | | | | | | | | | | | | |
| Security Name | | Interest Rate | | | Maturity Date | | | Principal | | | Value | |
| | | | | | | | | | | | | | | | |
| | | | |
| Illinois (continued) | | | | | | | | | | | | | | | | |
Southwestern Illinois Development Authority Local Government Program Collinsville Limited (Tax Revenue) | | | 5.00 | % | | | 03/01/2025 | | | $ | 2,525,000 | | | $ | 2,040,478 | |
Southwestern Illinois Development Finance Authority Local Government Program Collinsville Limited (Tax Revenue) | | | 5.35 | | | | 03/01/2031 | | | | 1,500,000 | | | | 1,149,600 | |
Tazewell County IL School District # 51 (Tax Revenue, NATL-RE FGIC Insured) | | | 9.00 | | | | 12/01/2023 | | | | 555,000 | | | | 851,159 | |
Town of Cicero IL Series A (Tax Revenue, XLCA Insured) | | | 5.25 | | | | 01/01/2016 | | | | 2,000,000 | | | | 2,102,440 | |
University of Illinois Auxiliary Facilities Systems Series A (Education Revenue, NATL-RE Insured)(z) | | | 4.68 | | | | 04/01/2025 | | | | 765,000 | | | | 413,582 | |
University of Illinois Auxiliary Facilities Systems Series A (Education Revenue, NATL-RE Insured)(z) | | | 4.81 | | | | 04/01/2026 | | | | 2,355,000 | | | | 1,194,480 | |
University of Illinois Auxiliary Facilities Systems Series A (Education Revenue, NATL-RE Insured)(z) | | | 4.90 | | | | 04/01/2027 | | | | 2,435,000 | | | | 1,161,933 | |
University of Illinois Auxiliary Facilities Systems Series A (Education Revenue) | | | 5.75 | | | | 04/01/2038 | | | | 14,000,000 | | | | 15,297,940 | |
Will County IL Community Unified School District # 201 U Crete-Monee CAB (Tax Revenue, NATL-RE FGIC Insured)(z) | | | 3.76 | | | | 11/01/2019 | | | | 7,370,000 | | | | 5,496,178 | |
Will County IL Community Unified School District # 201 U Crete-Monee CAB (Tax Revenue, NATL-RE FGIC Insured)(z) | | | 4.66 | | | | 11/01/2023 | | | | 1,500,000 | | | | 867,750 | |
| | | | |
| | | | | | | | | | | | | | | 285,432,694 | |
| | | | | | | | | | | | | | | | |
| | | | |
| Indiana: 0.38% | | | | | | | | | | | | | | | | |
Indiana Bond Bank Special Program BMA Index Series B2 (Energy Revenue)±§ | | | 0.76 | | | | 10/15/2022 | | | | 3,600,000 | | | | 2,859,552 | |
Indiana Finance Authority Environmental Duke Energy Series B (IDR) | | | 6.00 | | | | 08/01/2039 | | | | 2,000,000 | | | | 2,223,480 | |
Indiana HEFA Clarian Health Series B (Health Revenue) | | | 5.00 | | | | 02/15/2022 | | | | 3,050,000 | | | | 3,223,362 | |
Indianapolis IN Local Public Improvement Series B (Miscellaneous Revenue) | | | 6.00 | | | | 01/10/2020 | | | | 40,000 | | | | 46,562 | |
Valparaiso IN Economic Development Valparaiso Family YMCA Project (Miscellaneous Revenue) | | | 6.00 | | | | 12/01/2036 | | | | 1,000,000 | | | | 869,620 | |
| | | | |
| | | | | | | | | | | | | | | 9,222,576 | |
| | | | | | | | | | | | | | | | |
| | | | |
| Iowa: 0.28% | | | | | | | | | | | | | | | | |
Iowa Xenia Rural Water District (Water & Sewer Revenue, CIFC Insured) | | | 4.50 | | | | 12/01/2031 | | | | 1,400,000 | | | | 1,224,846 | |
Iowa Xenia Rural Water District (Water & Sewer Revenue, CIFC Insured) | | | 5.00 | | | | 12/01/2041 | | | | 6,295,000 | | | | 5,546,965 | |
| | | | |
| | | | | | | | | | | | | | | 6,771,811 | |
| | | | | | | | | | | | | | | | |
| | | | |
| Kansas: 1.43% | | | | | | | | | | | | | | | | |
Kansas Development Finance Authority Health Facilities Hartford
Series B-1 (Health Revenue, ACA Insured) | | | 6.13 | | | | 04/01/2012 | | | | 75,000 | | | | 75,090 | |
Olathe KS Special Obligation West Village Center Project (Tax Revenue) | | | 5.50 | | | | 09/01/2026 | | | | 1,165,000 | | | | 768,970 | |
Sedgwick & Shawnee Counties KS Mortgage-Backed Securities
Series A2 (Housing Revenue, GNMA Insured)± | | | 6.70 | | | | 06/01/2029 | | | | 210,000 | | | | 213,534 | |
Sedgwick & Shawnee Counties KS Mortgage-Backed Securities
Series A5 (Housing Revenue, GNMA/FNMA Insured) | | | 5.70 | | | | 12/01/2036 | | | | 405,000 | | | | 428,972 | |
Wyandotte County & Kansas City KS Unified Government Special Obligation Second Lien Series A (Tax Revenue)(z) | | | 4.87 | | | | 06/01/2021 | | | | 33,400,000 | | | | 21,208,666 | |
Wyandotte County & Kansas City KS Unified Government Special Obligation Second Lien Series B (Tax Revenue) | | | 5.00 | | | | 12/01/2020 | | | | 9,365,000 | | | | 9,812,085 | |
Wyandotte County & Kansas City KS Unified Government Transportation Development District Legends Village West Project (Tax Revenue) | | | 4.88 | | | | 10/01/2028 | | | | 2,525,000 | | | | 1,980,358 | |
| | | | |
| | | | | | | | | | | | | | | 34,487,675 | |
| | | | | | | | | | | | | | | | |
| | | | |
| 22 | | Wells Fargo Advantage Municipal Bond Fund | | Portfolio of Investments—December 31, 2011 (Unaudited) |
| | | | | | | | | | | | | | | | |
| Security Name | | Interest Rate | | | Maturity Date | | | Principal | | | Value | |
| | | | | | | | | | | | | | | | |
| | | | |
| Kentucky: 1.90% | | | | | | | | | | | | | | | | |
Kentucky Asset / Liability Commission General Fund Series A (Miscellaneous Revenue, NATL-RE FGIC Insured)±§ | | | 0.82 | % | | | 11/01/2027 | | | $ | 21,110,000 | | | $ | 17,649,860 | |
Kentucky Asset / Liability Commission General Fund Series B (Miscellaneous Revenue, NATL-RE FGIC Insured)±§ | | | 0.84 | | | | 11/01/2025 | | | | 16,825,000 | | | | 12,975,440 | |
Kentucky EDFA Balance Norton Series B (Health Revenue, NATL-RE Insured)(z) | | | 5.04 | | | | 10/01/2023 | | | | 4,270,000 | | | | 2,375,572 | |
Kentucky EDFA Balance Norton Series B (Health Revenue, NATL-RE Insured)(z) | | | 6.06 | | | | 10/01/2028 | | | | 4,800,000 | | | | 1,765,584 | |
Kentucky EDFA Norton Hospital Center Incorporated Series B (Health Revenue, NATL-RE Insured)(z) | | | 4.50 | | | | 10/01/2020 | | | | 9,300,000 | | | | 6,292,752 | |
Kentucky EDFA Unrefunded Balance Norton Series C (Health Revenue, NATL-RE Insured)±§ | | | 5.95 | | | | 10/01/2017 | | | | 4,580,000 | | | | 4,858,327 | |
| | | | |
| | | | | | | | | | | | | | | 45,917,535 | |
| | | | | | | | | | | | | | | | |
| | | | |
| Louisiana: 0.72% | | | | | | | | | | | | | | | | |
Louisiana Local Government Environmental Facilities (Miscellaneous Revenue, AMBAC Insured) | | | 5.25 | | | | 12/01/2018 | | | | 2,715,000 | | | | 2,867,855 | |
Louisiana PFA Black & Gold Facilities Project Series A (Housing Revenue, CIFC Insured) | | | 4.50 | | | | 07/01/2038 | | | | 385,000 | | | | 258,085 | |
Louisiana PFA Black & Gold Facilities Project Series A (Housing Revenue, CIFC Insured) | | | 5.00 | | | | 07/01/2030 | | | | 700,000 | | | | 548,086 | |
Louisiana State Citizens Property Insurance Corporation Series B (Miscellaneous Revenue, AMBAC Insured) | | | 5.00 | | | | 06/01/2019 | | | | 535,000 | | | | 571,535 | |
Louisiana State Tobacco Settlement Financing Corporation Series 2001B (Tobacco Revenue) | | | 5.50 | | | | 05/15/2030 | | | | 1,885,000 | | | | 1,886,904 | |
New Orleans LA (Tax Revenue, FGIC Insured) | | | 5.50 | | | | 12/01/2021 | | | | 1,700,000 | | | | 1,947,044 | |
New Orleans LA Aviation Board Gulf Opportunity Zone Consolidated Rental Car Series A (Port Authority Revenue) | | | 6.50 | | | | 01/01/2040 | | | | 5,950,000 | | | | 6,366,798 | |
New Orleans LA Aviation Board Restructuring Series A-1 (Port Authority Revenue, Assured Guaranty Insured) | | | 6.00 | | | | 01/01/2023 | | | | 420,000 | | | | 497,885 | |
New Orleans LA Sewer Service (Water & Sewer Revenue, Assured Guaranty Insured) | | | 5.75 | | | | 06/01/2018 | | | | 770,000 | | | | 881,519 | |
New Orleans LA Sewer Service (Water & Sewer Revenue, Assured Guaranty Insured) | | | 6.00 | | | | 06/01/2019 | | | | 320,000 | | | | 374,032 | |
New Orleans LA Sewer Service (Water & Sewer Revenue, Assured Guaranty Insured) | | | 6.00 | | | | 06/01/2024 | | | | 1,000,000 | | | | 1,130,480 | |
| | | | |
| | | | | | | | | | | | | | | 17,330,223 | |
| | | | | | | | | | | | | | | | |
| | | | |
| Maine: 0.47% | | | | | | | | | | | | | | | | |
Maine Educational Loan Authority Student Loan Series A-3 Class A (Education Revenue, Assured Guaranty Insured) | | | 5.88 | | | | 12/01/2039 | | | | 10,465,000 | | | | 11,322,607 | |
| | | | | | | | | | | | | | | | |
| | | | |
| Maryland: 0.20% | | | | | | | | | | | | | | | | |
Howard County MD COP Agricultural Land Preservation # 90-23 Series A (Lease Revenue) | | | 8.00 | | | | 08/15/2020 | | | | 302,000 | | | | 409,980 | |
Maryland CDA Department of Housing & Community Development Series A (Housing Revenue) | | | 5.50 | | | | 07/01/2022 | | | | 1,000,000 | | | | 1,006,350 | |
Maryland CDA Department of Housing & Community Development Series A (Miscellaneous Revenue) | | | 5.88 | | | | 07/01/2021 | | | | 500,000 | | | | 500,715 | |
Maryland CDA Department of Housing & Community Development Series B (Housing Revenue) | | | 5.50 | | | | 09/01/2031 | | | | 575,000 | | | | 598,196 | |
Maryland Energy Finance Administration Recycling Office Paper Systems Project Series A (IDR) | | | 7.50 | | | | 09/01/2015 | | | | 2,285,000 | | | | 2,350,671 | |
| | | | |
| | | | | | | | | | | | | | | 4,865,912 | |
| | | | | | | | | | | | | | | | |
| | | | | | |
| Portfolio of Investments—December 31, 2011 (Unaudited) | | Wells Fargo Advantage Municipal Bond Fund | | | 23 | |
| | | | | | | | | | | | | | | | |
| Security Name | | Interest Rate | | | Maturity Date | | | Principal | | | Value | |
| | | | | | | | | | | | | | | | |
| | | | |
| Massachusetts: 2.44% | | | | | | | | | | | | | | | | |
Massachusetts Development Finance Agency Sabis International Charter Series A (Miscellaneous Revenue) | | | 8.00 | % | | | 04/15/2031 | | | $ | 2,510,000 | | | $ | 2,879,020 | |
Massachusetts Development Finance Agency Sabis International Charter Series A (Miscellaneous Revenue) | | | 8.00 | | | | 04/15/2039 | | | | 3,900,000 | | | | 4,415,580 | |
Massachusetts Educational Finance Authority Series 1 (Education Revenue) | | | 6.00 | | | | 01/01/2028 | | | | 3,445,000 | | | | 3,847,893 | |
Massachusetts Educational Finance Authority Series B (Education Revenue) | | | 5.38 | | | | 01/01/2020 | | | | 3,450,000 | | | | 3,796,932 | |
Massachusetts Educational Finance Authority Series E (Education Revenue, AMBAC Insured) | | | 5.30 | | | | 01/01/2016 | | | | 1,315,000 | | | | 1,317,564 | |
Massachusetts HEFA Partners Healthcare Series G-6 (Health Revenue)±§ | | | 0.98 | | | | 07/01/2038 | | | | 25,000,000 | | | | 24,666,500 | |
Massachusetts Housing Finance Agency MFHR Series F (Housing Revenue) | | | 5.13 | | | | 12/01/2034 | | | | 100,000 | | | | 100,158 | |
Massachusetts Industrial Finance Agency Ogden Haverhill Project Series A (Resource Recovery Revenue) | | | 5.60 | | | | 12/01/2019 | | | | 5,425,000 | | | | 5,442,686 | |
Massachusetts State Port Authority Delta Airlines Incorporated Project Series A (Lease Revenue, AMBAC Insured) | | | 5.50 | | | | 01/01/2013 | | | | 800,000 | | | | 792,648 | |
Massachusetts State Water Resources Series D Class 6 (Water & Sewer Revenue, FSA Insured, Dexia Credit LOC)±§ | | | 2.00 | | | | 08/01/2025 | | | | 11,650,000 | | | | 11,650,000 | |
| | | | |
| | | | | | | | | | | | | | | 58,908,981 | |
| | | | | | | | | | | | | | | | |
| | | | |
| Michigan: 4.37% | | | | | | | | | | | | | | | | |
Cesar Chavez Academy Michigan Incorporated COP (Lease Revenue) | | | 8.00 | | | | 02/01/2033 | | | | 1,400,000 | | | | 1,440,460 | |
Detroit MI Capital Improvement Limited Tax Series A-1 (Tax Revenue) | | | 5.00 | | | | 04/01/2015 | | | | 5,855,000 | | | | 5,270,847 | |
Detroit MI City School District Series A (Tax Revenue, AGM Q-SBLF Insured) | | | 5.00 | | | | 05/01/2019 | | | | 7,575,000 | | | | 8,067,375 | |
Detroit MI Distribution of State Aid (Tax Revenue) | | | 5.00 | | | | 11/01/2030 | | | | 3,150,000 | | | | 3,293,987 | |
Detroit MI Sewage Disposal Refunding Revenue Second Lien Series C (Water & Sewer Revenue, NATL-RE Insured)§ | | | 5.00 | | | | 07/01/2020 | | | | 5,000,000 | | | | 5,237,650 | |
Detroit MI Sewage Disposal Refunding Revenue Senior Lien Series B (Water & Sewer Revenue, AGM Insured)§ | | | 7.50 | | | | 07/01/2033 | | | | 6,085,000 | | | | 7,396,500 | |
Detroit MI Sewage Disposal Refunding Revenue Senior Lien Series C (Water & Sewer Revenue, NATL-RE FGIC Insured) | | | 5.25 | | | | 07/01/2016 | | | | 1,355,000 | | | | 1,477,153 | |
Detroit MI Sewage Disposal Refunding Revenue Senior Lien Series C-2 (Water & Sewer Revenue)§ | | | 5.25 | | | | 07/01/2029 | | | | 5,000,000 | | | | 5,313,600 | |
Detroit MI Water Supply System Senior Lien Series B (Water & Sewer Revenue)§ | | | 5.00 | | | | 07/01/2022 | | | | 1,500,000 | | | | 1,567,845 | |
Detroit MI Water Supply System Senior Lien Series C (Water & Sewer Revenue, NATL-RE Insured)§ | | | 5.25 | | | | 07/01/2019 | | | | 2,540,000 | | | | 2,616,378 | |
Jackson MI CAB Downtown Development (Tax Revenue, AGM Insured)(z) | | | 5.92 | | | | 06/01/2026 | | | | 2,710,000 | | | | 1,167,712 | |
Michigan Finance Authority Educational Facilities Series A (Lease Revenue) | | | 7.38 | | | | 10/01/2020 | | | | 1,000,000 | | | | 1,089,160 | |
Michigan Finance Authority Educational Facilities Series A (Lease Revenue) | | | 8.00 | | | | 10/01/2030 | | | | 1,000,000 | | | | 1,074,960 | |
Michigan Finance Authority Educational Facilities Series A (Lease Revenue) | | | 8.50 | | | | 10/01/2045 | | | | 8,000,000 | | | | 8,692,320 | |
Michigan Finance Authority Limited Obligation Holly Academy (Miscellaneous Revenue) | | | 6.50 | | | | 10/01/2020 | | | | 225,000 | | | | 233,633 | |
Michigan Finance Authority Limited Obligation Holly Academy (Miscellaneous Revenue) | | | 8.00 | | | | 10/01/2040 | | | | 1,175,000 | | | | 1,244,924 | |
Michigan Finance Authority Limited Obligation Hope Academy (Miscellaneous Revenue) | | | 8.13 | | | | 04/01/2041 | | | | 2,385,000 | | | | 2,539,190 | |
Michigan Finance Authority Limited Obligation Series A (Miscellaneous Revenue) | | | 7.50 | | | | 12/01/2020 | | | | 490,000 | | | | 501,446 | |
Michigan Finance Authority Limited Obligation Series A (Miscellaneous Revenue) | | | 8.00 | | | | 12/01/2030 | | | | 1,135,000 | | | | 1,150,005 | |
Michigan Finance Authority Limited Obligation Series A (Miscellaneous Revenue) | | | 8.25 | | | | 12/01/2039 | | | | 2,220,000 | | | | 2,242,022 | |
| | | | |
| 24 | | Wells Fargo Advantage Municipal Bond Fund | | Portfolio of Investments—December 31, 2011 (Unaudited) |
| | | | | | | | | | | | | | | | |
| Security Name | | Interest Rate | | | Maturity Date | | | Principal | | | Value | |
| | | | | | | | | | | | | | | | |
| | | | |
| Michigan (continued) | | | | | | | | | | | | | | | | |
Michigan Finance Authority Public School Academy Old Redford Series A (Miscellaneous Revenue) | | | 5.25 | % | | | 12/01/2020 | | | $ | 1,635,000 | | | $ | 1,566,395 | |
Michigan Finance Authority Public School Academy Old Redford Series A (Miscellaneous Revenue) | | | 5.90 | | | | 12/01/2030 | | | | 2,000,000 | | | | 1,817,760 | |
Michigan Finance Authority Public School Academy University Learning (Miscellaneous Revenue) | | | 5.25 | | | | 11/01/2015 | | | | 250,000 | | | | 250,843 | |
Michigan Finance Authority Public School Academy University Learning (Miscellaneous Revenue) | | | 6.25 | | | | 11/01/2020 | | | | 440,000 | | | | 450,138 | |
Michigan Finance Authority Public School Academy University Learning (Miscellaneous Revenue) | | | 7.38 | | | | 11/01/2030 | | | | 2,920,000 | | | | 3,025,441 | |
Michigan Finance Authority Public School Academy University Learning (Miscellaneous Revenue) | | | 7.50 | | | | 11/01/2040 | | | | 4,145,000 | | | | 4,254,594 | |
Michigan Municipal Bond Authority Revenue Local Government Loan Program Series A (Miscellaneous Revenue, AMBAC Insured) | | | 4.00 | | | | 11/01/2021 | | | | 150,000 | | | | 133,178 | |
Michigan Municipal Bond Authority Revenue Local Government Loan Program Series A (Miscellaneous Revenue, AMBAC Insured) | | | 4.80 | | | | 11/01/2015 | | | | 150,000 | | | | 150,015 | |
Michigan Municipal Bond Authority Revenue Local Government Loan Program Series A (Miscellaneous Revenue, AMBAC Insured) | | | 5.00 | | | | 05/01/2017 | | | | 450,000 | | | | 465,719 | |
Michigan Municipal Bond Authority Revenue Local Government Loan Program Series B-Group A (Miscellaneous Revenue, AMBAC Insured) | | | 4.25 | | | | 12/01/2016 | | | | 2,770,000 | | | | 2,782,133 | |
Michigan Municipal Bond Authority Revenue Local Government Loan Program Series B-Group A (Miscellaneous Revenue, AMBAC Insured) | | | 5.00 | | | | 12/01/2015 | | | | 1,480,000 | | | | 1,550,108 | |
Michigan Municipal Bond Authority Revenue Local Government Loan Program Series B-Group A (Miscellaneous Revenue, AMBAC Insured) | | | 5.00 | | | | 12/01/2017 | | | | 2,475,000 | | | | 2,562,714 | |
Michigan Municipal Bond Authority Revenue Local Government Loan Program Series B-Group A (Miscellaneous Revenue, AMBAC Insured) | | | 5.25 | | | | 12/01/2023 | | | | 1,185,000 | | | | 1,165,388 | |
Michigan Municipal Bond Authority Revenue Local Government Loan Program Series C (Miscellaneous Revenue, AMBAC Insured) | | | 3.63 | | | | 05/01/2016 | | | | 1,000,000 | | | | 971,200 | |
Michigan Municipal Bond Authority Revenue Local Government Loan Program Series C (Miscellaneous Revenue, AMBAC Insured) | | | 3.75 | | | | 05/01/2017 | | | | 450,000 | | | | 430,830 | |
Michigan Municipal Bond Authority Revenue Local Government Loan Program Series C (Miscellaneous Revenue, AMBAC Insured) | | | 4.00 | | | | 05/01/2019 | | | | 100,000 | | | | 93,975 | |
Michigan Municipal Bond Authority Revenue Local Government Loan Program Series G (Miscellaneous Revenue, AMBAC Insured)(z) | | | 3.62 | | | | 05/01/2016 | | | | 175,000 | | | | 149,686 | |
Michigan Municipal Bond Authority Revenue Local Government Loan Program Series G (Miscellaneous Revenue, AMBAC Insured)(z) | | | 3.81 | | | | 05/01/2017 | | | | 230,000 | | | | 187,848 | |
Michigan Municipal Bond Authority Revenue Local Government Loan Program Series G (Miscellaneous Revenue, AMBAC Insured)(z) | | | 4.16 | | | | 05/01/2019 | | | | 75,000 | | | | 55,396 | |
Michigan Municipal Bond Authority Revenue Local Government Loan Program Series G (Miscellaneous Revenue, AMBAC Insured)(z) | | | 4.39 | | | | 05/01/2020 | | | | 50,000 | | | | 34,758 | |
Michigan Municipal Bond Authority School District of Detroit (Miscellaneous Revenue, AGM Insured) | | | 5.00 | | | | 06/01/2019 | | | | 3,000,000 | | | | 3,151,170 | |
Michigan Public Educational Facilities Authority Bradford Academy Project (Miscellaneous Revenue) | | | 8.75 | | | | 09/01/2039 | | | | 3,500,000 | | | | 3,111,710 | |
Michigan Public Educational Facilities Authority Limited Obligation Bradford Academy Project (Miscellaneous Revenue)§144A | | | 6.50 | | | | 09/01/2037 | | | | 2,000,000 | | | | 1,366,220 | |
Michigan Public Educational Facilities Authority Limited Obligation Bradford Academy Project (Miscellaneous Revenue)§ | | | 8.50 | | | | 09/01/2029 | | | | 1,500,000 | | | | 1,330,530 | |
Michigan Public Educational Facilities Authority Limited Obligation Crescent (Miscellaneous Revenue, Q-SBLF Insured) | | | 7.00 | | | | 10/01/2036 | | | | 1,222,500 | | | | 1,138,453 | |
Michigan Public Educational Facilities Authority Limited Obligation Nataki Talibah (Miscellaneous Revenue) | | | 6.25 | | | | 10/01/2023 | | | | 975,000 | | | | 887,845 | |
Michigan Public Educational Facilities Authority Madison Academy Project (Miscellaneous Revenue) | | | 8.38 | | | | 12/01/2030 | | | | 2,085,000 | | | | 2,187,394 | |
| | | | | | |
| Portfolio of Investments—December 31, 2011 (Unaudited) | | Wells Fargo Advantage Municipal Bond Fund | | | 25 | |
| | | | | | | | | | | | | | | | |
| Security Name | | Interest Rate | | | Maturity Date | | | Principal | | | Value | |
| | | | | | | | | | | | | | | | |
| | | | |
| Michigan (continued) | | | | | | | | | | | | | | | | |
Michigan Public Educational Facilities Authority Madison Academy Project (Miscellaneous Revenue) | | | 8.63 | % | | | 12/01/2039 | | | $ | 4,170,000 | | | $ | 4,359,944 | |
Michigan State Hospital Finance Authority Trinity Health Series A (Health Revenue) | | | 5.00 | | | | 12/01/2014 | | | | 500,000 | | | | 548,715 | |
Michigan State Strategic Fund Limited Detroit Education (Utilities Revenue) | | | 5.63 | | | | 07/01/2020 | | | | 1,200,000 | | | | 1,432,380 | |
Michigan State Strategic Fund Series A (Lease Revenue, Assured Guaranty Insured) | | | 5.25 | | | | 10/15/2021 | | | | 40,000 | | | | 44,895 | |
Star International Academy Michigan COP (Lease Revenue) | | | 6.13 | | | | 03/01/2037 | | | | 1,170,000 | | | | 1,085,900 | |
Wayne County MI Airport Authority Junior Lien (Port Authority Revenue, NATL-RE FGIC Insured) | | | 5.00 | | | | 12/01/2016 | | | | 1,115,000 | | | | 1,207,456 | |
| | | | |
| | | | | | | | | | | | | | | 105,567,898 | |
| | | | | | | | | | | | | | | | |
| | | | |
| Minnesota: 0.45% | | | | | | | | | | | | | | | | |
Baytown Township MN St. Croix Preparatory Academy Series A (Miscellaneous Revenue) | | | 7.00 | | | | 08/01/2038 | | | | 750,000 | | | | 748,140 | |
Becker MN PCR Northern States Power Series A (IDR)±§ | | | 8.50 | | | | 09/01/2019 | | | | 550,000 | | | | 581,669 | |
Falcon Height MN Kaleidoscope Charter School Series A (Miscellaneous Revenue) | | | 6.00 | | | | 11/01/2037 | | | | 900,000 | | | | 788,229 | |
Minnesota Tobacco Securitization Authority Tobacco Settlement Series B (Tobacco Revenue)§ | | | 5.25 | | | | 03/01/2031 | | | | 7,000,000 | | | | 7,199,570 | |
Woodbury MN Math Science Academy Project Series A (Miscellaneous Revenue) | | | 7.50 | | | | 12/01/2031 | | | | 1,500,000 | | | | 1,520,160 | |
| | | | |
| | | | | | | | | | | | | | | 10,837,768 | |
| | | | | | | | | | | | | | | | |
| | | |
| Mississippi: 0.02% | | | | | | | | | | | | | |
Gulfport-Biloxi MS Regional Airport Authority Passenger Facilities Series A (Port Authority Revenue, ACA Insured) | | | 5.00 | | | | 10/01/2022 | | | | 450,000 | | | | 388,251 | |
| | | | | | | | | | | | | | | | |
| | | |
| Missouri: 1.38% | | | | | | | | | | | | | |
Chesterfield Valley MO Transportation Development District (Tax Revenue, CIFC Insured) | | | 4.00 | | | | 04/15/2026 | | | | 3,000,000 | | | | 1,984,740 | |
Desloge MO US Highway 67 State Street Redevelopment Project (Tax Revenue) | | | 5.20 | | | | 04/15/2020 | | | | 95,000 | | | | 90,788 | |
Fenton MO Gravois Bluffs Redevelopment Project (Tax Revenue) | | | 4.50 | | | | 04/01/2021 | | | | 345,000 | | | | 354,453 | |
Independence MO Thirty-Ninth Street Transportation District Improvement Development Road Improvement Project (Tax Revenue) | | | 6.88 | | | | 09/01/2032 | | | | 4,600,000 | | | | 4,497,788 | |
Lake of the Ozarks MO Community Bridge Corporation (Transportation Revenue) | | | 5.25 | | | | 12/01/2014 | | | | 1,910,000 | | | | 1,808,579 | |
Manchester MO Highway 141 Manchester Road Project (Tax Revenue) | | | 6.00 | | | | 11/01/2025 | | | | 3,000,000 | | | | 3,090,930 | |
Missouri HEFA Rockhurst University Series A (Education Revenue) | | | 6.50 | | | | 10/01/2035 | | | | 2,000,000 | | | | 2,153,900 | |
Ozark MO COP Community Center Project (Lease Revenue) | | | 5.00 | | | | 09/01/2026 | | | | 460,000 | | | | 466,389 | |
Sikeston MO (Utilities Revenue, NATL-RE Insured) | | | 6.00 | | | | 06/01/2015 | | | | 500,000 | | | | 553,105 | |
Sikeston MO (Utilities Revenue, NATL-RE Insured) | | | 6.00 | | | | 06/01/2016 | | | | 1,500,000 | | | | 1,695,195 | |
St. Louis MO IDA Convention Center Hotel (IDR, AMBAC Insured)(z) | | | 6.17 | | | | 07/15/2019 | | | | 4,375,000 | | | | 2,768,631 | |
St. Louis MO Lambert St. Louis International Airport Series A-1 (Port Authority Revenue) | | | 6.25 | | | | 07/01/2029 | | | | 2,000,000 | | | | 2,190,140 | |
St. Louis MO Lambert St. Louis International Airport Series A-1 (Port Authority Revenue) | | | 6.63 | | | | 07/01/2034 | | | | 2,000,000 | | | | 2,194,700 | |
St. Louis MO Municipal Finance Corporation Convention Centre Series A (Lease Revenue, AGM Insured)(z) | | | 5.99 | | | | 07/15/2032 | | | | 5,000,000 | | | | 1,487,450 | |
St. Louis MO Municipal Finance Corporation Convention Centre Series A (Lease Revenue, AGM Insured)(z) | | | 6.05 | | | | 07/15/2034 | | | | 6,750,000 | | | | 1,761,210 | |
| | | | |
| 26 | | Wells Fargo Advantage Municipal Bond Fund | | Portfolio of Investments—December 31, 2011 (Unaudited) |
| | | | | | | | | | | | | | | | |
| Security Name | | Interest Rate | | | Maturity Date | | | Principal | | | Value | |
| | | | | | | | | | | | | | | | |
| | | | |
| Missouri (continued) | | | | | | | | | | | | | | | | |
St. Louis MO Municipal Finance Corporation Convention Centre Series A (Lease Revenue, AGM Insured)(z) | | | 6.06 | % | | | 07/15/2037 | | | $ | 3,000,000 | | | $ | 652,980 | |
St. Louis MO Municipal Finance Corporation Leasehold Convention Center Project Series A (Lease Revenue, AGM Insured)(z) | | | 5.83 | | | | 07/15/2031 | | | | 5,000,000 | | | | 1,626,550 | |
St. Louis MO Municipal Finance Corporation Leasehold Convention Center Project Series A (Lease Revenue, AGM Insured)(z) | | | 6.02 | | | | 07/15/2033 | | | | 6,250,000 | | | | 1,741,750 | |
St. Louis MO Municipal Finance Corporation Leasehold Convention Center Project Series A (Lease Revenue, AGM Insured)(z) | | | 6.05 | | | | 07/15/2036 | | | | 3,500,000 | | | | 810,600 | |
St. Louis MO Municipal Finance Corporation Leasehold Convention Center Project Series A (Lease Revenue, AGM Insured)(z) | | | 6.06 | | | | 07/15/2035 | | | | 5,790,000 | | | | 1,420,055 | |
| | | | |
| | | | | | | | | | | | | | | 33,349,933 | |
| | | | | | | | | | | | | | | | |
| | | | |
| Nevada: 0.33% | | | | | | | | | | | | | | | | |
Clark County NV Airport Jet Project Series C (Airport Revenue, AMBAC Insured) | | | 5.38 | | | | 07/01/2019 | | | | 3,000,000 | | | | 3,109,800 | |
Director of The State of Nevada Department of Business & Industry Republic Services Incorporate Project (Resource Recovery Revenue)±§ | | | 5.63 | | | | 12/01/2026 | | | | 300,000 | | | | 333,858 | |
Reno-Sparks NV Indian Colony Governmental (Miscellaneous Revenue, U.S. Bank NA LOC) | | | 5.00 | | | | 06/01/2024 | | | | 2,500,000 | | | | 2,562,600 | |
Reno-Sparks NV Indian Colony Governmental (Miscellaneous Revenue, U.S. Bank NA LOC) | | | 5.13 | | | | 06/01/2027 | | | | 1,900,000 | | | | 1,922,743 | |
| | | | |
| | | | | | | | | | | | | | | 7,929,001 | |
| | | | | | | | | | | | | | | | |
| | | |
| New Hampshire: 0.04% | | | | | | | | | | | | | |
Manchester NH Housing & Redevelopment Authority CAB Series B (Miscellaneous Revenue, ACA Insured)(z) | | | 9.79 | | | | 01/01/2021 | | | | 2,375,000 | | | | 1,011,441 | |
Manchester NH Housing & Redevelopment Authority CAB Series B (Miscellaneous Revenue, ACA Insured)(z) | | | 10.00 | | | | 01/01/2025 | | | | 250,000 | | | | 71,080 | |
| | | | |
| | | | | | | | | | | | | | | 1,082,521 | |
| | | | | | | | | | | | | | | | |
| | | | |
| New Jersey: 3.89% | | | | | | | | | | | | | | | | |
Camden County NJ Improvement Authority Health Care Redevelopment Cooper Health Systems Obligation Group A (Health Revenue) | | | 5.25 | | | | 02/15/2020 | | | | 5,000,000 | | | | 5,137,250 | |
Lakewood Township NJ School District (Tax Revenue, AMBAC Insured) | | | 6.25 | | | | 02/15/2012 | | | | 400,000 | | | | 402,764 | |
Mercer County NJ Improvement Authority Special Services School District Series A (Lease Revenue, County Guaranty Insured) | | | 5.95 | | | | 12/15/2012 | | | | 135,000 | | | | 141,101 | |
New Jersey COP Equipment Lease Purchase Series A (Lease Revenue) | | | 5.25 | | | | 06/15/2027 | | | | 7,000,000 | | | | 7,494,060 | |
New Jersey EDA School Facilities Series C (Miscellaneous Revenue, State Appropriations Insured)±§ | | | 1.90 | | | | 02/01/2018 | | | | 3,000,000 | | | | 3,011,580 | |
New Jersey EDFA Department of Human Services Series A (Health Revenue) | | | 5.70 | | | | 07/01/2012 | | | | 355,000 | | | | 359,803 | |
New Jersey HEFAR Student Loan Series A-2 (Education Revenue)± | | | 1.48 | | | | 06/01/2036 | | | | 17,000,000 | | | | 16,167,340 | |
New Jersey HFFA Burdette Tomlin Memorial Hospital (Health Revenue) | | | 5.60 | | | | 07/01/2019 | | | | 2,825,000 | | | | 2,830,820 | |
New Jersey Housing & Mortgage Finance Agency MFHR Series A (Housing Revenue, AMBAC FHA Insured) | | | 5.40 | | | | 11/01/2017 | | | | 1,125,000 | | | | 1,126,384 | |
New Jersey Housing & Mortgage Finance Agency MFHR Series B (Housing Revenue, AGM Insured) | | | 6.05 | | | | 11/01/2017 | | | | 815,000 | | | | 817,127 | |
New Jersey Housing & Mortgage Finance Agency MFHR Series E-1 (Housing Revenue, AGM Insured) | | | 5.35 | | | | 11/01/2013 | | | | 2,530,000 | | | | 2,537,160 | |
New Jersey Housing & Mortgage Finance Agency MFHR Series E-1 (Housing Revenue, AGM Insured) | | | 5.45 | | | | 11/01/2014 | | | | 840,000 | | | | 842,663 | |
New Jersey Housing & Mortgage Finance Agency MFHR Series E-1 (Housing Revenue, AGM Insured) | | | 5.70 | | | | 05/01/2020 | | | | 185,000 | | | | 185,311 | |
| | | | | | |
| Portfolio of Investments—December 31, 2011 (Unaudited) | | Wells Fargo Advantage Municipal Bond Fund | | | 27 | |
| | | | | | | | | | | | | | | | |
| Security Name | | Interest Rate | | | Maturity Date | | | Principal | | | Value | |
| | | | | | | | | | | | | | | | |
| | | | |
| New Jersey (continued) | | | | | | | | | | | | | | | | |
New Jersey Housing & Mortgage Finance Agency MFHR Series E-2 (Housing Revenue, AGM Insured) | | | 5.70 | % | | | 11/01/2020 | | | $ | 340,000 | | | $ | 340,571 | |
New Jersey State HEFAR Series 1A (Education Revenue) | | | 4.75 | | | | 12/01/2029 | | | | 1,705,000 | | | | 1,731,274 | |
New Jersey State HEFAR Series A (Education Revenue) | | | 5.00 | | | | 06/01/2027 | | | | 6,575,000 | | | | 6,765,478 | |
New Jersey State HEFAR Series A (Education Revenue) | | | 5.63 | | | | 06/01/2030 | | | | 2,900,000 | | | | 3,134,117 | |
New Jersey State Transportation System Series A (Transportation Revenue, NATL-RE FGIC Insured) | | | 5.75 | | | | 06/15/2025 | | | | 10,000,000 | | | | 12,193,300 | |
New Jersey State Transportation Trust Fund Authority (Transportation Revenue) | | | 6.00 | | | | 12/15/2038 | | | | 10,425,000 | | | | 11,734,172 | |
New Jersey State Turnpike Authority Series C-2 (Transportation Revenue, AGM Insured)±§ | | | 1.00 | | | | 01/01/2024 | | | | 17,000,000 | | | | 17,000,000 | |
Stony Brook NJ Regional Sewer Authority Series B (Water & Sewer Revenue, GO of Authority Insured) | | | 5.45 | | | | 12/01/2012 | | | | 110,000 | | | | 114,148 | |
West Windsor Township NJ Parking Authority (Transportation Revenue, Municipal Government Guaranty GO of Authority Insured) | | | 6.10 | | | | 12/01/2012 | | | | 50,000 | | | | 50,241 | |
| | | | |
| | | | | | | | | | | | | | | 94,116,664 | |
| | | | | | | | | | | | | | | | |
| | | | |
| New Mexico: 0.09% | | | | | | | | | | | | | | | | |
New Mexico Mortgage Finance Authority SFMR Class I (GO-State, GNMA FNMA FHLMC Insured) | | | 5.35 | | | | 03/01/2030 | | | | 1,400,000 | | | | 1,529,724 | |
Otero County NM Jail Project (Miscellaneous Revenue) | | | 5.50 | | | | 04/01/2013 | | | | 725,000 | | | | 714,952 | |
| | | | |
| | | | | | | | | | | | | | | 2,244,676 | |
| | | | | | | | | | | | | | | | |
| | | | |
| New York: 6.69% | | | | | | | | | | | | | | | | |
Genesee County NY IDA United Memorial Medical Center Project (Health Revenue) | | | 4.75 | | | | 12/01/2014 | | | | 1,640,000 | | | | 1,639,934 | |
Hempstead Town NY Local Development The Academy Charter School Series A (Miscellaneous Revenue) | | | 8.25 | | | | 02/01/2041 | | | | 10,005,000 | | | | 10,339,067 | |
Metropolitan Transportation Authority NY Series 2008-C (Transportation Revenue) | | | 6.50 | | | | 11/15/2028 | | | | 8,000,000 | | | | 9,535,680 | |
Metropolitan Transportation Authority NY Series B (Tax Revenue, AGM Insured)±§ | | | 1.25 | | | | 11/01/2022 | | | | 30,800,000 | | | | 30,800,000 | |
Metropolitan Transportation Authority NY Services Contract Series 7 (Miscellaneous Revenue) | | | 5.63 | | | | 07/01/2016 | | | | 10,000,000 | | | | 10,715,800 | |
New York City NY Municipal Water Finance Authority Series C (Water & Sewer Revenue)±§ | | | 0.76 | | | | 06/15/2033 | | | | 10,000,000 | | | | 10,000,000 | |
New York NY Municipal Finance Authority 2nd General Resolution Series DD (Water & Sewer Revenue) | | | 6.00 | | | | 06/15/2040 | | | | 11,625,000 | | | | 13,488,371 | |
New York NY Municipal Finance Authority Series 2009-A (Water & Sewer Revenue) | | | 5.75 | | | | 06/15/2040 | | | | 5,000,000 | | | | 5,704,100 | |
New York NY Transitional Finance Authority Building Aid Fiscal Year 2009 Series S-4 (Miscellaneous Revenue, State Aid Withholding Insured) | | | 5.75 | | | | 01/15/2039 | | | | 2,500,000 | | | | 2,820,050 | |
New York State Dormitory Authority North Shore Jewish Series B (Health Revenue)±§ | | | 1.02 | | | | 05/01/2018 | | | | 6,455,000 | | | | 6,052,595 | |
New York State Dormitory Authority Series B (Tax Revenue) | | | 5.75 | | | | 03/15/2036 | | | | 10,000,000 | | | | 11,463,100 | |
New York State Energy R&D Authority Brooklyn Union Gas Company Series B (Energy Revenue)±§(x) | | | 13.37 | | | | 07/01/2026 | | | | 4,300,000 | | | | 4,318,404 | |
New York State Energy R&D Authority Linked SAVRS & Residual Interest Bonds Brooklyn (Energy Revenue)§ | | | 6.95 | | | | 07/01/2026 | | | | 2,600,000 | | | | 2,605,564 | |
New York Urban Development Corporation (Housing Revenue) | | | 5.88 | | | | 02/01/2013 | | | | 12,000,000 | | | | 12,035,880 | |
New York Urban Development Corporation Sub Lien (Housing Revenue, Housing & Urban Development 236 GO of Corporation Insured) | | | 5.50 | | | | 07/01/2016 | | | | 6,115,000 | | | | 6,139,338 | |
| | | | |
| 28 | | Wells Fargo Advantage Municipal Bond Fund | | Portfolio of Investments—December 31, 2011 (Unaudited) |
| | | | | | | | | | | | | | | | |
| Security Name | | Interest Rate | | | Maturity Date | | | Principal | | | Value | |
| | | | | | | | | | | | | | | | |
| | | | |
| New York (continued) | | | | | | | | | | | | | | | | |
Niagara County NY IDA Solid Waste Disposal Series B (Resource Recovery Revenue)±§ | | | 5.55 | % | | | 11/15/2024 | | | $ | 905,000 | | | $ | 914,358 | |
Niagara County NY IDA Solid Waste Disposal Series C (Resource Recovery Revenue)±§ | | | 5.63 | | | | 11/15/2024 | | | | 2,500,000 | | | | 2,527,950 | |
Niagara Falls NY Public Improvement Project (Tax Revenue, NATL-RE Insured) | | | 7.50 | | | | 03/01/2014 | | | | 915,000 | | | | 1,024,553 | |
Niagara Falls NY Public Improvement Project (Tax Revenue, NATL-RE Insured) | | | 7.50 | | | | 03/01/2016 | | | | 685,000 | | | | 823,452 | |
Niagara Falls NY Public Improvement Project (Tax Revenue, NATL-RE Insured) | | | 7.50 | | | | 03/01/2016 | | | | 65,000 | | | | 82,648 | |
Port Authority of New York & New Jersey Special Obligation JFK International Airport Terminal 6 (Port Authority Revenue, NATL-RE Insured) | | | 5.75 | | | | 12/01/2025 | | | | 4,000,000 | | | | 3,999,600 | |
Seneca County NY IDA Solid Waste Disposal Seneca Meadows Incorporated Project (IDR)±§144A | | | 6.63 | | | | 10/01/2035 | | | | 10,000,000 | | | | 10,059,100 | |
Westchester NY Tobacco Asset (Tobacco Revenue) | | | 5.00 | | | | 06/01/2026 | | | | 1,000,000 | | | | 942,070 | |
Yonkers NY IDA Civic Facilities Sarah Lawrence College Project Series A (Education Revenue) | | | 5.75 | | | | 06/01/2024 | | | | 2,380,000 | | | | 2,667,718 | |
Yonkers NY IDA Civic Facilities Sarah Lawrence College Project Series A (Education Revenue) | | | 6.00 | | | | 06/01/2041 | | | | 1,000,000 | | | | 1,072,830 | |
| | | | |
| | | | | | | | | | | | | | | 161,772,162 | |
| | | | | | | | | | | | | | | | |
| | | | |
| North Carolina: 0.41% | | | | | | | | | | | | | | | | |
North Carolina Eastern Municipal Power Agency Series A (Utilities Revenue) | | | 5.50 | | | | 01/01/2026 | | | | 1,250,000 | | | | 1,404,900 | |
North Carolina Eastern Municipal Power Agency Series C (Utilities Revenue) | | | 6.75 | | | | 01/01/2024 | | | | 2,000,000 | | | | 2,445,080 | |
North Carolina Medical Care Commission First Mortgage Series A (Housing Revenue) | | | 5.75 | | | | 10/01/2037 | | | | 2,000,000 | | | | 1,674,320 | |
North Carolina Turnpike Authority Triangle Expressway Systems Series A (Transportation Revenue, Assured Guaranty Insured) | | | 5.75 | | | | 01/01/2039 | | | | 4,000,000 | | | | 4,362,640 | |
| | | | |
| | | | | | | | | | | | | | | 9,886,940 | |
| | | | | | | | | | | | | | | | |
| | | | |
| Ohio: 1.20% | | | | | | | | | | | | | | | | |
Adams & Highland Counties OH Valley Local School District (Tax Revenue, NATL-RE Insured) | | | 7.00 | | | | 12/01/2015 | | | | 1,435,000 | | | | 1,595,562 | |
Akron OH Sewer System (Water & Sewer Revenue, AMBAC Insured) | | | 5.00 | | | | 12/01/2016 | | | | 1,500,000 | | | | 1,636,515 | |
Allen County OH Catholic Healthcare Series B (Health Revenue)§ | | | 5.25 | | | | 09/01/2027 | | | | 3,995,000 | | | | 4,243,249 | |
Kings OH Local School District (Tax Revenue, NATL-RE FGIC Insured) | | | 7.50 | | | | 12/01/2016 | | | | 890,000 | | | | 1,079,757 | |
Montgomery County OH Hospital Kettering Medical Center (Health Revenue, NATL-RE Insured) | | | 6.25 | | | | 04/01/2020 | | | | 2,500,000 | | | | 2,967,250 | |
Ohio Enterprise Bond Toledo Series 2A (IDR) | | | 5.50 | | | | 12/01/2019 | | | | 3,525,000 | | | | 4,092,067 | |
Ohio Municipal Electric Generation Agency Refunding Joint Venture 5 Certificates of Beneficial Interest (Utilities Revenue, AMBAC Insured) | | | 5.00 | | | | 02/15/2018 | | | | 4,020,000 | | | | 4,286,687 | |
Ohio State Air Quality Development Authority U.S. Steel Corporation Project (IDR) | | | 5.38 | | | | 11/01/2015 | | | | 7,200,000 | | | | 7,244,496 | |
RiverSouth Authority Ohio Revenue Lazarus Building Redevelopment Series A (Lease Revenue) | | | 5.75 | | | | 12/01/2027 | | | | 1,900,000 | | | | 1,771,427 | |
| | | | |
| | | | | | | | | | | | | | | 28,917,010 | |
| | | | | | | | | | | | | | | | |
| | | | |
| Oklahoma: 0.56% | | | | | | | | | | | | | | | | |
Comanche County OK Independent School District # 4 Geronimo (Education Revenue) | | | 6.25 | | | | 08/15/2014 | | | | 2,509,341 | | | | 2,617,393 | |
McAlester OK Public Works Authority Series A (Lease Revenue, FSA Insured) | | | 5.75 | | | | 02/01/2020 | | | | 965,000 | | | | 1,019,503 | |
| | | | | | |
| Portfolio of Investments—December 31, 2011 (Unaudited) | | Wells Fargo Advantage Municipal Bond Fund | | | 29 | |
| | | | | | | | | | | | | | | | |
| Security Name | | Interest Rate | | | Maturity Date | | | Principal | | | Value | |
| | | | | | | | | | | | | | | | |
| | | | |
| Oklahoma (continued) | | | | | | | | | | | | | | | | |
McGee Creek Authority Oklahoma Water Revenue (Water & Sewer Revenue, NATL-RE Insured) | | | 6.00 | % | | | 01/01/2023 | | | $ | 5,000,000 | | | $ | 5,735,500 | |
Oklahoma City OK Industrial & Cultural Facilities Series B (Health Revenue, NATL-RE Insured)±§(m)(n)(a) | | | 0.46 | | | | 06/01/2019 | | | | 4,700,000 | | | | 4,258,035 | |
| | | | |
| | | | | | | | | | | | | | | 13,630,431 | |
| | | | | | | | | | | | | | | | |
| | | | |
| Oregon: 0.20% | | | | | | | | | | | | | | | | |
Oregon State Health Housing ECFA Aspen Foundation II Series A (Housing Revenue)§^^(i) | | | 6.13 | | | | 04/15/2029 | | | | 1,370,000 | | | | 551,809 | |
Western Generation Agency of Oregon Wauna Cogeneration Project Series B (Utilities Revenue) | | | 5.00 | | | | 01/01/2012 | | | | 395,000 | | | | 395,004 | |
Western Generation Agency of Oregon Wauna Cogeneration Project Series B (Utilities Revenue) | | | 5.00 | | | | 01/01/2013 | | | | 2,855,000 | | | | 2,857,227 | |
Western Generation Agency of Oregon Wauna Cogeneration Project Series B (Utilities Revenue) | | | 5.00 | | | | 01/01/2014 | | | | 1,100,000 | | | | 1,094,731 | |
| | | | |
| | | | | | | | | | | | | | | 4,898,771 | |
| | | | | | | | | | | | | | | | |
| | | | |
| Pennsylvania: 4.93% | | | | | | | | | | | | | | | | |
Allegheny County PA Airport Authority Pittsburg International Airport (Port Authority Revenue, NATL-RE-IBC FGIC Insured)± | | | 5.00 | | | | 01/01/2016 | | | | 1,410,000 | | | | 1,471,744 | |
Allegheny County PA Hospital Development Authority University of Pittsburgh Medical Center Series A (Health Revenue) | | | 5.63 | | | | 08/15/2039 | | | | 5,000,000 | | | | 5,346,100 | |
Allegheny County PA Hospital Development Authority University of Pittsburgh Medical Center Series A-1 (Health Revenue)±§ | | | 1.01 | | | | 02/01/2021 | | | | 9,000,000 | | | | 8,201,520 | |
Allegheny County PA IDA Propel Schools Homestead Project Series A (Miscellaneous Revenue) | | | 7.50 | | | | 12/15/2029 | | | | 2,235,000 | | | | 2,283,969 | |
Allegheny County PA Series C-59B (Tax Revenue, AGM Insured)± | | | 0.84 | | | | 11/01/2026 | | | | 14,675,000 | | | | 11,646,227 | |
Chester County PA IDA Renaissance Academy Project Series A (Miscellaneous Revenue) | | | 5.63 | | | | 10/01/2015 | | | | 1,275,000 | | | | 1,274,885 | |
Delaware County PA IDA Resource Recovery Facility Series A (Resource Recovery Revenue) | | | 6.10 | | | | 07/01/2013 | | | | 845,000 | | | | 847,924 | |
Delaware County PA IDA Resource Recovery Facility Series A (Resource Recovery Revenue) | | | 6.20 | | | | 07/01/2019 | | | | 2,110,000 | | | | 2,109,747 | |
Delaware Valley PA Regional Financial Authority Local Government Public Improvements Project (Miscellaneous Revenue) | | | 5.75 | | | | 07/01/2032 | | | | 12,500,000 | | | | 13,727,750 | |
Delaware Valley PA Regional Financial Authority Local Government Series A (Miscellaneous Revenue, AMBAC Insured) | | | 5.50 | | | | 08/01/2028 | | | | 13,575,000 | | | | 14,766,614 | |
Delaware Valley PA Regional Financial Authority Local Government Series C (Miscellaneous Revenue, AMBAC Insured) | | | 7.75 | | | | 07/01/2027 | | | | 2,480,000 | | | | 3,332,525 | |
Delaware Valley PA Regional Financial Authority Series A (Miscellaneous Revenue, Bayerische Landesbank LOC)±§ | | | 1.25 | | | | 12/01/2019 | | | | 9,100,000 | | | | 9,100,000 | |
Delaware Valley PA Regional Financial Authority Series C (Miscellaneous Revenue)± | | | 1.00 | | | | 06/01/2027 | | | | 5,100,000 | | | | 3,528,282 | |
Harrisburg PA Authority Resource Recovery Facility Series D-1 (Resource Recovery Revenue, AGM Insured)±§ | | | 5.25 | | | | 12/01/2033 | | | | 10,000,000 | | | | 9,960,300 | |
Harrisburg PA Authority Resources Guaranteed Subordinated Series D-2 (Resource Recovery Revenue, AGM Insured)±§ | | | 5.00 | | | | 12/01/2033 | | | | 4,875,000 | | | | 4,866,713 | |
Latrobe PA IDA College Street Vincent College Project (Education Revenue) | | | 5.35 | | | | 05/01/2015 | | | | 1,165,000 | | | | 1,179,982 | |
Luzerne County PA Series C (Tax Revenue, FSA Insured) | | | 7.00 | | | | 11/01/2018 | | | | 665,000 | | | | 795,872 | |
Luzerne County PA Series E (Tax Revenue, FSA Insured) | | | 8.00 | | | | 11/01/2027 | | | | 135,000 | | | | 163,856 | |
Penn Hills Municipality PA Compound Interest Bonds Series B (Tax Revenue, AMBAC Insured)(z) | | | 2.70 | | | | 12/01/2017 | | | | 1,000,000 | | | | 852,060 | |
| | | | |
| 30 | | Wells Fargo Advantage Municipal Bond Fund | | Portfolio of Investments—December 31, 2011 (Unaudited) |
| | | | | | | | | | | | | | | | |
| Security Name | | Interest Rate | | | Maturity Date | | | Principal | | | Value | |
| | | | | | | | | | | | | | | | |
| | | | |
| Pennsylvania (continued) | | | | | | | | | | | | | | | | |
Pennsylvania EDFA 30th Street Station Garage Project (Transportation Revenue, ACA Insured) | | | 5.80 | % | | | 06/01/2023 | | | $ | 4,000,000 | | | $ | 4,095,680 | |
Pennsylvania EDFA Colver Project Series F (Resource Recovery Revenue, AMBAC Insured) | | | 5.00 | | | | 12/01/2012 | | | | 4,000,000 | | | | 4,045,000 | |
Pennsylvania EDFA Colver Project Series F (Resource Recovery Revenue, AMBAC Insured) | | | 5.00 | | | | 12/01/2015 | | | | 5,750,000 | | | | 5,804,740 | |
Philadelphia PA Authority For Industrial Development Cultural & Commercial Corridors Series PG A (Miscellaneous Revenue, NATL-RE FGIC Insured) | | | 5.00 | | | | 12/01/2015 | | | | 1,625,000 | | | | 1,769,788 | |
Philadelphia PA Authority For Industrial Development Cultural & Commercial Corridors Series PG A (Miscellaneous Revenue, NATL-RE FGIC Insured) | | | 5.00 | | | | 12/01/2016 | | | | 680,000 | | | | 753,073 | |
Philadelphia PA Gas Works Revenue Refunding 8th-1998 General Ordinance Series A (Energy Revenue) | | | 5.25 | | | | 08/01/2017 | | | | 3,340,000 | | | | 3,790,666 | |
Philadelphia PA Municipal Authority (Lease Revenue) | | | 4.70 | | | | 04/01/2015 | | | | 470,000 | | | | 497,890 | |
Scranton PA School District Prerefunded (Tax Revenue, AMBAC State Aid Withholding Insured) | | | 5.00 | | | | 04/01/2017 | | | | 2,155,000 | | | | 2,163,297 | |
Washington County PA Hospital Authority Monongahela Valley Hospital Project (Health Revenue) | | | 6.25 | | | | 06/01/2022 | | | | 750,000 | | | | 776,453 | |
| | | | |
| | | | | | | | | | | | | | | 119,152,657 | |
| | | | | | | | | | | | | | | | |
| | | | |
| Puerto Rico: 0.69% | | | | | | | | | | | | | | | | |
Puerto Rico Electric Power Authority Refunding LIBOR Series UU (Utilities Revenue)±§ | | | 0.95 | | | | 07/01/2031 | | | | 4,235,000 | | | | 2,648,315 | |
Puerto Rico Electric Power Authority Series UU (Utilities Revenue, AGM Insured)±§ | | | 0.77 | | | | 07/01/2029 | | | | 14,000,000 | | | | 9,083,900 | |
Puerto Rico Highway & Transportation Authority Series Z (Transportation Revenue, AGM Insured) | | | 6.00 | | | | 07/01/2018 | | | | 1,070,000 | | | | 1,333,327 | |
Puerto Rico Highway & Transportation Authority Series Z (Transportation Revenue, AMBAC Insured) | | | 6.00 | | | | 07/01/2018 | | | | 930,000 | | | | 1,088,333 | |
Puerto Rico Sales Tax Financing Corporation First Subseries A (Tax Revenue) | | | 6.38 | | | | 08/01/2039 | | | | 1,845,000 | | | | 2,094,333 | |
University of Puerto Rico Series Q (Education Revenue) | | | 5.00 | | | | 06/01/2016 | | | | 460,000 | | | | 490,944 | |
| | | | |
| | | | | | | | | | | | | | | 16,739,152 | |
| | | | | | | | | | | | | | | | |
| | | |
| Rhode Island: 0.14% | | | | | | | | | | | | | |
Rhode Island Clean Water Finance Agency Cranston Wastewater Treatment System (Lease Revenue, NATL-RE Insured) | | | 5.80 | | | | 09/01/2022 | | | | 3,295,000 | | | | 3,298,163 | |
| | | | | | | | | | | | | | | | |
| | | | | | | | | | | | | | | | |
| | | |
| South Carolina: 2.42% | | | | | | | | | | | | | |
Allendale County SC School District Energy Savings Special Obligation (Lease Revenue, State Aid Withholding Insured) | | | 7.00 | | | | 12/01/2013 | | | | 565,000 | | | | 585,877 | |
Allendale County SC School District Energy Savings Special Obligation (Lease Revenue, State Aid Withholding Insured) | | | 8.50 | | | | 12/01/2018 | | | | 1,780,000 | | | | 1,917,968 | |
Berkeley County SC School District Installment Lease Securing Assets for Education (Lease Revenue) | | | 5.25 | | | | 12/01/2024 | | | | 1,760,000 | | | | 1,835,627 | |
Calhoun County SC Solid Waste Disposal Facilities Eastman Kodak Company Project (IDR) | | | 6.75 | | | | 05/01/2017 | | | | 400,000 | | | | 508,096 | |
Charleston SC Educational Excellence Finance Corporation Charleston County School District Project (Lease Revenue)±(h) | | | 5.25 | | | | 12/01/2013 | | | | 15,000,000 | | | | 16,638,450 | |
Cherokee County SC Scago Educational Facilities Corporation Cherokee School District # 1 Series B (Lease Revenue, AGM Insured) | | | 5.00 | | | | 12/01/2026 | | | | 2,295,000 | | | | 2,428,018 | |
| | | | | | |
| Portfolio of Investments—December 31, 2011 (Unaudited) | | Wells Fargo Advantage Municipal Bond Fund | | | 31 | |
| | | | | | | | | | | | | | | | |
| Security Name | | Interest Rate | | | Maturity Date | | | Principal | | | Value | |
| | | | | | | | | | | | | | | | |
| | | |
| South Carolina (continued) | | | | | | | | | | | | | |
Columbia SC Parking Facilities (Transportation Revenue, AMBAC Insured) | | | 5.88 | % | | | 12/01/2013 | | | $ | 1,055,000 | | | $ | 1,059,188 | |
Connector 2000 Association Incorporated CAB Series A (Transportation Revenue)(z) | | | 7.48 | | | | 01/01/2012 | | | | 56,254 | | | | 56,254 | |
Connector 2000 Association Incorporated CAB Series A (Transportation Revenue)(z) | | | 8.03 | | | | 01/01/2013 | | | | 96,519 | | | | 89,213 | |
Connector 2000 Association Incorporated CAB Series A (Transportation Revenue)(z) | | | 8.61 | | | | 01/01/2014 | | | | 100,958 | | | | 85,358 | |
Connector 2000 Association Incorporated CAB Series A (Transportation Revenue)(z) | | | 9.40 | | | | 01/01/2015 | | | | 109,160 | | | | 83,023 | |
Connector 2000 Association Incorporated CAB Series A (Transportation Revenue)(z) | | | 9.52 | | | | 07/22/2051 | | | | 609,859 | | | | 15,869 | |
Connector 2000 Association Incorporated CAB Series A (Transportation Revenue)(z) | | | 9.66 | | | | 01/01/2042 | | | | 1,054,839 | | | | 63,765 | |
Connector 2000 Association Incorporated CAB Series A (Transportation Revenue)(z) | | | 10.47 | | | | 01/01/2032 | | | | 1,361,800 | | | | 180,656 | |
Connector 2000 Association Incorporated CAB Series A (Transportation Revenue)(z) | | | 14.03 | | | | 01/01/2022 | | | | 270,213 | | | | 71,298 | |
Connector 2000 Association Incorporated CAB Series A (Transportation Revenue)(z) | | | 14.91 | | | | 01/01/2021 | | | | 255,522 | | | | 71,768 | |
Connector 2000 Association Incorporated CAB Series A (Transportation Revenue)(z) | | | 15.74 | | | | 01/01/2020 | | | | 215,428 | | | | 65,744 | |
Connector 2000 Association Incorporated CAB Series A (Transportation Revenue)(z) | | | 17.14 | | | | 01/01/2019 | | | | 198,059 | | | | 64,357 | |
Connector 2000 Association Incorporated CAB Series A (Transportation Revenue)(z) | | | 18.71 | | | | 01/01/2018 | | | | 181,929 | | | | 64,006 | |
Connector 2000 Association Incorporated CAB Series A (Transportation Revenue)(z) | | | 20.68 | | | | 01/01/2017 | | | | 164,621 | | | | 63,384 | |
Connector 2000 Association Incorporated CAB Series A (Transportation Revenue)(z) | | | 24.14 | | | | 01/01/2016 | | | | 121,679 | | | | 50,566 | |
Connector 2000 Association Incorporated CAB Series B (Transportation Revenue)(z) | | | 12.68 | | | | 07/22/2051 | | | | 236,623 | | | | 1,964 | |
Connector 2000 Association Incorporated CAB Series B (Transportation Revenue)(z) | | | 15.54 | | | | 01/01/2032 | | | | 470,285 | | | | 25,085 | |
Kershaw County SC Public School District Kershaw County School District Installment Purchase Project (Lease Revenue, CIFC Insured) | | | 5.00 | | | | 12/01/2024 | | | | 7,415,000 | | | | 7,815,039 | |
Kershaw County SC Public School District Kershaw County School District Installment Purchase Project (Lease Revenue, CIFC Insured) | | | 5.00 | | | | 12/01/2026 | | | | 3,420,000 | | | | 3,548,045 | |
Kershaw County SC Public Schools Foundation Installment Power Revenue (Lease Revenue, CIFC Insured) | | | 5.00 | | | | 12/01/2018 | | | | 250,000 | | | | 278,073 | |
Kershaw County SC Public Schools Kershaw County School District Project (Lease Revenue, CIFC Insured) | | | 5.00 | | | | 12/01/2021 | | | | 2,870,000 | | | | 3,100,892 | |
Kershaw County SC Public Schools Kershaw County School District Project (Lease Revenue, CIFC Insured) | | | 5.00 | | | | 12/01/2022 | | | | 1,405,000 | | | | 1,505,415 | |
Kershaw County SC Public Schools Kershaw County School District Project (Lease Revenue, CIFC Insured) | | | 5.00 | | | | 12/01/2023 | | | | 6,950,000 | | | | 7,394,244 | |
Lee County SC School Facilities Incorporated Series 2006 (Lease Revenue, Radian Insured) | | | 6.00 | | | | 12/01/2031 | | | | 2,890,000 | | | | 2,981,122 | |
Newberry SC Newberry County School District Project (Lease Revenue) | | | 5.25 | | | | 12/01/2017 | | | | 760,000 | | | | 833,500 | |
Piedmont SC Municipal Power Agency (Utilities Revenue, FGIC Insured) | | | 6.75 | | | | 01/01/2019 | | | | 210,000 | | | | 281,707 | |
Piedmont SC Municipal Power Agency Series A (Utilities Revenue, FGIC Insured) | | | 6.50 | | | | 01/01/2014 | | | | 290,000 | | | | 323,765 | |
Scago Educational Facilities Corporation for Colleton School District (Lease Revenue, Assured Guaranty Insured) | | | 5.00 | | | | 12/01/2015 | | | | 150,000 | | | | 167,741 | |
| | | | |
| 32 | | Wells Fargo Advantage Municipal Bond Fund | | Portfolio of Investments—December 31, 2011 (Unaudited) |
| | | | | | | | | | | | | | | | |
| Security Name | | Interest Rate | | | Maturity Date | | | Principal | | | Value | |
| | | | | | | | | | | | | | | | |
| | | |
| South Carolina (continued) | | | | | | | | | | | | | |
South Carolina Education Assistance Authority Student Loan Series I (Education Revenue) | | | 5.10 | % | | | 10/01/2029 | | | $ | 2,795,000 | | | $ | 2,990,343 | |
South Carolina Housing Finance & Development Authority Mortgage Series A-2 (Housing Revenue, AGM Insured) | | | 6.35 | | | | 07/01/2019 | | | | 75,000 | | | | 76,055 | |
South Carolina Housing Finance & Development Authority Mortgage Series B-1 (Housing Revenue, AGM Insured) | | | 5.75 | | | | 07/01/2015 | | | | 205,000 | | | | 205,935 | |
Three Rivers SC Solid Waste Authority CAB Landfill Gas Project (Resource Recovery Revenue)(z) | | | 4.83 | | | | 10/01/2030 | | | | 980,000 | | | | 399,703 | |
Three Rivers SC Solid Waste Authority CAB Landfill Gas Project (Resource Recovery Revenue)(z) | | | 4.87 | | | | 10/01/2031 | | | | 1,835,000 | | | | 707,998 | |
| | | | |
| | | | | | | | | | | | | | | 58,635,111 | |
| | | | | | | | | | | | | | | | |
| | | | |
| South Dakota: 0.52% | | | | | | | | | | | | | | | | |
Lower Brule Sioux Tribe South Dakota Series B (Tax Revenue) | | | 5.50 | | | | 05/01/2019 | | | | 2,000,000 | | | | 1,643,480 | |
Lower Brule Sioux Tribe South Dakota Series B (Tax Revenue) | | | 5.60 | | | | 05/01/2020 | | | | 1,440,000 | | | | 1,158,336 | |
Rapid City SD Series A (Airport Revenue) | | | 6.75 | | | | 12/01/2031 | | | | 1,020,000 | | | | 1,119,430 | |
Rapid City SD Series A (Airport Revenue) | | | 7.00 | | | | 12/01/2035 | | | | 750,000 | | | | 821,903 | |
Sisseton-Wahpeton Sioux Tribe South Dakota Lake Traverse Reservation (Miscellaneous Revenue)(i) | | | 7.00 | | | | 11/01/2013 | | | | 170,000 | | | | 160,441 | |
Sisseton-Wahpeton Sioux Tribe South Dakota Lake Traverse Reservation (Miscellaneous Revenue)(i) | | | 7.00 | | | | 11/01/2023 | | | | 1,290,000 | | | | 955,658 | |
South Dakota EDFA Pooled Loan Program Angus Incorporated Project Series A (Utilities Revenue, LaSalle Bank NA LOC) | | | 5.25 | | | | 04/01/2012 | | | | 300,000 | | | | 303,453 | |
South Dakota EDFA Pooled Loan Program Angus Incorporated Project Series A (Utilities Revenue, LaSalle Bank NA LOC) | | | 5.25 | | | | 04/01/2013 | | | | 320,000 | | | | 335,142 | |
South Dakota EDFA Pooled Loan Program McEleeg Project Series B (IDR) | | | 5.00 | | | | 04/01/2014 | | | | 370,000 | | | | 394,812 | |
South Dakota EDFA Pooled Loan Program Spearfish Forest Series A (Miscellaneous Revenue) | | | 5.88 | | | | 04/01/2028 | | | | 2,350,000 | | | | 2,461,578 | |
South Dakota Education Loans Incorporated (GO-State, Guaranteed Student Loans Insured)§ | | | 5.45 | | | | 06/01/2020 | | | | 3,250,000 | | | | 3,151,785 | |
| | | | |
| | | | | | | | | | | | | | | 12,506,018 | |
| | | | | | | | | | | | | | | | |
| | | | |
| Tennessee: 1.49% | | | | | | | | | | | | | | | | |
Metropolitan Nashville Airport Authority Aero Nashville LLC Project (Port Authority Revenue) | | | 5.20 | | | | 07/01/2026 | | | | 750,000 | | | | 710,498 | |
Tennessee Energy Acquisition Corporation Gas Series C (Energy Revenue) | | | 5.00 | | | | 02/01/2021 | | | | 7,000,000 | | | | 6,959,330 | |
Tennessee Energy Acquisition Corporation Gas Series C (Energy Revenue) | | | 5.00 | | | | 02/01/2025 | | | | 5,000,000 | | | | 4,845,700 | |
Tennessee Energy Acquisition Corporation Series A (Utilities Revenue) | | | 5.00 | | | | 09/01/2015 | | | | 500,000 | | | | 513,040 | |
Tennessee Energy Acquisition Corporation Series A (Energy Revenue) | | | 5.00 | | | | 09/01/2016 | | | | 3,015,000 | | | | 3,072,707 | |
Tennessee Energy Acquisition Corporation Series A (Energy Revenue) | | | 5.00 | | | | 02/01/2022 | | | | 2,000,000 | | | | 1,979,640 | |
Tennessee Energy Acquisition Corporation Series A (Utilities Revenue) | | | 5.25 | | | | 09/01/2017 | | | | 1,935,000 | | | | 1,985,658 | |
Tennessee Energy Acquisition Corporation Series A (Energy Revenue) | | | 5.25 | | | | 09/01/2018 | | | | 3,200,000 | | | | 3,255,552 | |
Tennessee Energy Acquisition Corporation Series C (Utilities Revenue) | | | 5.00 | | | | 02/01/2018 | | | | 3,575,000 | | | | 3,589,729 | |
Tennessee Energy Acquisition Corporation Series C (Energy Revenue) | | | 5.00 | | | | 02/01/2019 | | | | 9,200,000 | | | | 9,188,776 | |
| | | | |
| | | | | | | | | | | | | | | 36,100,630 | |
| | | | | | | | | | | | | | | | |
| | | | |
| Texas: 7.78% | | | | | | | | | | | | | | | | |
Beasley TX Higher Education Finance Corporation Focus Learning Academy Series A (Miscellaneous Revenue) | | | 7.25 | | | | 08/15/2026 | | | | 550,000 | | | | 566,236 | |
Beasley TX Higher Education Finance Corporation Focus Learning Academy Series A (Miscellaneous Revenue) | | | 7.75 | | | | 08/15/2041 | | | | 2,000,000 | | | | 2,063,280 | |
Central Texas Regional Mobility Authority CAB (Transportation Revenue)(z) | | | 6.03 | | | | 01/01/2026 | | | | 3,000,000 | | | | 1,305,690 | |
| | | | | | |
| Portfolio of Investments—December 31, 2011 (Unaudited) | | Wells Fargo Advantage Municipal Bond Fund | | | 33 | |
| | | | | | | | | | | | | | | | |
| Security Name | | Interest Rate | | | Maturity Date | | | Principal | | | Value | |
| | | | | | | | | | | | | | | | |
| | | | |
| Texas (continued) | | | | | | | | | | | | | | | | |
Central Texas Regional Mobility Authority CAB (Transportation Revenue)(z) | | | 6.10 | % | | | 01/01/2027 | | | $ | 3,000,000 | | | $ | 1,217,880 | |
Central Texas Regional Mobility Authority CAB (Transportation Revenue)(z) | | | 6.38 | | | | 01/01/2031 | | | | 4,000,000 | | | | 1,214,920 | |
Central Texas Regional Mobility Authority CAB (Transportation Revenue)(z) | | | 6.61 | | | | 01/01/2040 | | | | 1,000,000 | | | | 162,290 | |
Central Texas Regional Mobility Authority Senior Lien (Transportation Revenue, NATL-RE FGIC Insured)±(z) | | | 1.84 | | | | 01/01/2016 | | | | 440,000 | | | | 408,544 | |
Central Texas Regional Mobility Authority Senior Lien (Transportation Revenue)(z) | | | 5.34 | | | | 01/01/2023 | | | | 3,455,000 | | | | 1,932,692 | |
Central Texas Regional Mobility Authority Senior Lien (Transportation Revenue)(z) | | | 5.71 | | | | 01/01/2025 | | | | 5,000,000 | | | | 2,404,600 | |
Central Texas Regional Mobility Authority Senior Lien (Transportation Revenue) | | | 5.75 | | | | 01/01/2025 | | | | 2,000,000 | | | | 2,098,600 | |
Central Texas Regional Mobility Authority Senior Lien (Transportation Revenue)(z) | | | 6.17 | | | | 01/01/2028 | | | | 2,225,000 | | | | 841,406 | |
Central Texas Regional Mobility Authority Senior Lien (Transportation Revenue)(z) | | | 6.24 | | | | 01/01/2029 | | | | 4,000,000 | | | | 1,407,120 | |
Dallas TX Independent School District School Building (Tax Revenue, PSF-GTD Insured) | | | 6.38 | | | | 02/15/2034 | | | | 10,000,000 | | | | 12,209,500 | |
Dallas-Fort Worth TX International Airport Series B (Port Authority Revenue, NATL-RE Insured) | | | 6.25 | | | | 11/01/2028 | | | | 1,130,000 | | | | 1,134,452 | |
Garza County TX Public Facilities Corporation (Lease Revenue) | | | 5.25 | | | | 10/01/2016 | | | | 1,200,000 | | | | 1,256,328 | |
Garza County TX Public Facilities Corporation (Lease Revenue) | | | 5.25 | | | | 10/01/2017 | | | | 755,000 | | | | 784,143 | |
Garza County TX Public Facilities Corporation (Lease Revenue) | | | 5.50 | | | | 10/01/2016 | | | | 825,000 | | | | 872,537 | |
Garza County TX Public Facilities Corporation (Lease Revenue) | | | 5.50 | | | | 10/01/2019 | | | | 1,400,000 | | | | 1,446,508 | |
Garza County TX Public Facilities Corporation (Lease Revenue) | | | 5.75 | | | | 10/01/2025 | | | | 1,750,000 | | | | 1,776,670 | |
Harris County TX Health Facilities Development Corporation Hospital Memorial Hermann Health Care Systems Series B (Health Revenue) | | | 7.25 | | | | 12/01/2035 | | | | 11,000,000 | | | | 12,619,090 | |
Harris County TX Health Facilities Development Corporation Memorial Hospital Systems Project Series A (Health Revenue, NATL-RE Insured) | | | 6.00 | | | | 06/01/2013 | | | | 500,000 | | | | 533,215 | |
Houston TX Airport System Series C (Port Authority Revenue, XLCA Insured)±§(m)(n)(a) | | | 0.59 | | | | 07/01/2032 | | | | 7,400,000 | | | | 6,664,118 | |
Houston TX Water Conveyance COP Series H (Lease Revenue, AMBAC Insured) | | | 7.50 | | | | 12/15/2015 | | | | 1,400,000 | | | | 1,606,794 | |
Houston TX Water Conveyance Systems COP Series H (Lease Revenue, AMBAC Insured) | | | 7.50 | | | | 12/15/2014 | | | | 1,000,000 | | | | 1,113,010 | |
La Vernia TX Higher Education Finance Corporation Series A (Miscellaneous Revenue) | | | 6.25 | | | | 02/15/2017 | | | | 750,000 | | | | 814,073 | |
La Vernia TX Higher Education Finance Lifeschools of Dallas Series A (Miscellaneous Revenue) | | | 6.25 | | | | 08/15/2021 | | | | 6,165,000 | | | | 6,461,043 | |
La Vernia TX Higher Education Finance Lifeschools of Dallas Series A (Miscellaneous Revenue) | | | 7.50 | | | | 08/15/2041 | | | | 6,500,000 | | | | 6,825,585 | |
Lewisville TX Combination Special Assessment Capital Improvement District 4 (Miscellaneous Revenue) | | | 6.75 | | | | 10/01/2032 | | | | 2,310,000 | | | | 2,355,992 | |
Lower Colorado TX River Authority Series A (Miscellaneous Revenue) | | | 6.50 | | | | 05/15/2037 | | | | 5,000,000 | | | | 5,527,550 | |
Lower Colorado TX River Authority Unrefunded Balance (Miscellaneous Revenue) | | | 7.25 | | | | 05/15/2037 | | | | 95,000 | | | | 107,286 | |
San Leanna TX Education Facilities Corporation Street Edwards University Project (Education Revenue) | | | 5.13 | | | | 06/01/2022 | | | | 1,735,000 | | | | 1,862,922 | |
San Leanna TX Education Facilities Corporation Street Edwards University Project (Education Revenue) | | | 5.13 | | | | 06/01/2023 | | | | 1,000,000 | | | | 1,064,520 | |
San Leanna TX Education Facilities Corporation Street Edwards University Project (Education Revenue) | | | 5.13 | | | | 06/01/2024 | | | | 750,000 | | | | 790,463 | |
| | | | |
| 34 | | Wells Fargo Advantage Municipal Bond Fund | | Portfolio of Investments—December 31, 2011 (Unaudited) |
| | | | | | | | | | | | | | | | |
| Security Name | | Interest Rate | | | Maturity Date | | | Principal | | | Value | |
| | | | | | | | | | | | | | | | |
| | | | |
| Texas (continued) | | | | | | | | | | | | | | | | |
Southeast Texas Housing Finance Corporation Mortgage-Backed Securities PG Series B (Housing Revenue, GNMA/FNMA Insured) | | | 6.30 | % | | | 10/01/2035 | | | $ | 401,148 | | | $ | 406,868 | |
Southeast Texas Housing Finance Corporation Mortgage-Backed Securities Series B (Housing Revenue, GNMA/FNMA Insured) | | | 6.00 | | | | 02/01/2036 | | | | 745,990 | | | | 749,347 | |
Tarrant County TX Cultural Education Facilities Finance Corporation (Health Revenue)^^(i) | | | 6.38 | | | | 11/01/2036 | | | | 8,400,000 | | | | 2,939,076 | |
Tarrant County TX Cultural Education Facilities Finance Corporation Air Force Village Obligation Group (Health Revenue) | | | 5.00 | | | | 05/15/2017 | | | | 1,400,000 | | | | 1,481,130 | |
Tarrant County TX Cultural Education Facilities Finance Corporation Retirement Facilities (Health Revenue) | | | 6.50 | | | | 11/15/2014 | | | | 1,230,000 | | | | 1,229,963 | |
Tarrant County TX Cultural Education Facilities Finance Corporation Texas Health Resources Series A (Health Revenue) | | | 5.00 | | | | 02/15/2023 | | | | 9,900,000 | | | | 10,750,410 | |
Texas Gas Supply SA Energy Acquisition Public Facilities Corporation (Energy Revenue) | | | 5.50 | | | | 08/01/2021 | | | | 5,915,000 | | | | 6,146,927 | |
Texas Gas Supply SA Energy Acquisition Public Facilities Corporation (Energy Revenue) | | | 5.50 | | | | 08/01/2023 | | | | 7,810,000 | | | | 8,094,206 | |
Texas Municipal Gas Acquisition & Supply Corporation Senior Lien Series A (Energy Revenue) | | | 5.00 | | | | 12/15/2016 | | | | 450,000 | | | | 466,178 | |
Texas Municipal Gas Acquisition & Supply Corporation Senior Lien Series A (Energy Revenue) | | | 5.25 | | | | 12/15/2019 | | | | 1,045,000 | | | | 1,072,996 | |
Texas Municipal Gas Acquisition & Supply Corporation Senior Lien Series A (Energy Revenue) | | | 5.25 | | | | 12/15/2024 | | | | 4,760,000 | | | | 4,742,198 | |
Texas Municipal Gas Acquisition & Supply Corporation Senior Lien Series D (Utilities Revenue) | | | 5.63 | | | | 12/15/2017 | | | | 6,230,000 | | | | 6,629,779 | |
Texas Municipal Gas Acquisition & Supply Corporation Series A (Energy Revenue)±§ | | | 0.65 | | | | 09/15/2027 | | | | 5,000,000 | | | | 3,861,050 | |
Texas Municipal Gas Acquisition & Supply Corporation Series A (Utilities Revenue)±§ | | | 1.07 | | | | 09/15/2017 | | | | 6,165,000 | | | | 5,863,655 | |
Texas Municipal Gas Acquisition & Supply Corporation Series B (Utilities Revenue)±§ | | | 0.57 | | | | 09/15/2017 | | | | 22,895,000 | | | | 21,810,464 | |
Texas Municipal Gas Acquisition & Supply Corporation Series D (Energy Revenue) | | | 6.25 | | | | 12/15/2026 | | | | 19,400,000 | | | | 21,097,694 | |
Texas Municipal Gas Acquisition & Supply Corporation Sub Lien Series C (Energy Revenue)±§ | | | 1.82 | | | | 12/15/2026 | | | | 1,250,000 | | | | 862,638 | |
Texas Municipal Gas Acquisition & Various Senior Lien Series B (Energy Revenue)±§ | | | 1.07 | | | | 12/15/2026 | | | | 3,500,000 | | | | 2,452,450 | |
Texas Municipal Power Agency (Utilities Revenue, NATL-RE Insured)(z) | | | 0.93 | | | | 09/01/2015 | | | | 40,000 | | | | 38,651 | |
Texas State PFA Charter School Finance Corporation Uplift Education Series A (Miscellaneous Revenue) | | | 5.75 | | | | 12/01/2027 | | | | 185,000 | | | | 188,141 | |
Texas State PFA Charter School Finance Corporation Uplift Education Series A (Miscellaneous Revenue) | | | 5.88 | | | | 12/01/2036 | | | | 880,000 | | | | 885,843 | |
Texas State PFA Cosmos Foundation Series A (Miscellaneous Revenue) | | | 5.00 | | | | 02/15/2018 | | | | 2,025,000 | | | | 2,055,294 | |
Travis County TX Housing Finance Corporation Series A (Housing Revenue, GNMA Insured)±§ | | | 6.35 | | | | 10/01/2034 | | | | 847,327 | | | | 900,005 | |
| | | | |
| | | | | | | | | | | | | | | 188,174,020 | |
| | | | | | | | | | | | | | | | |
| | | | |
| Utah: 0.89% | | | | | | | | | | | | | | | | |
Spanish Fork City UT Charter School American Leadership Academy (Miscellaneous Revenue) 144A | | | 5.55 | | | | 11/15/2021 | | | | 1,470,000 | | | | 1,385,607 | |
Utah County UT Charter School Ronald Wilson Reagan Series A (Miscellaneous Revenue) | | | 5.75 | | | | 02/15/2022 | | | | 900,000 | | | | 837,162 | |
Utah County UT ECFA U.S. Steel Corporation Project (IDR) | | | 5.38 | | | | 11/01/2015 | | | | 4,500,000 | | | | 4,522,230 | |
| | | | | | |
| Portfolio of Investments—December 31, 2011 (Unaudited) | | Wells Fargo Advantage Municipal Bond Fund | | | 35 | |
| | | | | | | | | | | | | | | | |
| Security Name | | Interest Rate | | | Maturity Date | | | Principal | | | Value | |
| | | | | | | | | �� | | | | | | | |
| | | | |
| Utah (continued) | | | | | | | | | | | | | | | | |
Utah Housing Finance Agency SFHR Series C-2 (Housing Revenue, FHA VA Mortgages Insured) | | | 5.75 | % | | | 07/01/2021 | | | $ | 10,000 | | | $ | 10,001 | |
Utah Housing Finance Agency SFHR Series E-1 (Housing Revenue, FHA VA Mortgages Insured) | | | 5.38 | | | | 07/01/2018 | | | | 10,000 | | | | 10,075 | |
Utah State Charter School Finance Authority Early Light Academy Project (Miscellaneous Revenue) | | | 8.50 | | | | 07/15/2046 | | | | 6,480,000 | | | | 6,820,459 | |
Utah State Charter School Finance Authority Oquirrh Mountain Charter School Project (Miscellaneous Revenue) | | | 8.00 | | | | 07/15/2030 | | | | 2,135,000 | | | | 2,234,149 | |
Utah State Charter School Finance Authority Oquirrh Mountain Charter School Project (Miscellaneous Revenue) | | | 8.00 | | | | 07/15/2041 | | | | 3,910,000 | | | | 4,026,518 | |
West Valley City UT Charter School Monticello Academy (Miscellaneous Revenue)144A | | | 6.38 | | | | 06/01/2037 | | | | 1,945,000 | | | | 1,681,336 | |
| | | | |
| | | | | | | | | | | | | | | 21,527,537 | |
| | | | | | | | | | | | | | | | |
| | | | |
| Virgin Islands: 1.36% | | | | | | | | | | | | | | | | |
Virgin Islands PFA Matching Fund Loan Notes Senior Lien Series A (Tax Revenue) | | | 6.75 | | | | 10/01/2037 | | | | 5,750,000 | | | | 6,261,635 | |
Virgin Islands PFA Senior Lien Series A (Water & Sewer Revenue) | | | 5.25 | | | | 10/01/2018 | | | | 435,000 | | | | 459,382 | |
Virgin Islands PFA Senior Lien Series A (Water & Sewer Revenue) | | | 5.25 | | | | 10/01/2019 | | | | 300,000 | | | | 315,096 | |
Virgin Islands PFA Series B (Tax Revenue) | | | 5.00 | | | | 10/01/2025 | | | | 5,850,000 | | | | 6,003,914 | |
Virgin Islands PFA Series C (Miscellaneous Revenue) | | | 5.00 | | | | 10/01/2018 | | | | 8,860,000 | | | | 9,794,553 | |
Virgin Islands PFA Sub Lien Series C (Miscellaneous Revenue) | | | 5.00 | | | | 10/01/2022 | | | | 5,500,000 | | | | 5,872,625 | |
Virgin Islands PFA Sub Matching Fund Loan Series A (Tax Revenue) | | | 5.00 | | | | 10/01/2025 | | | | 4,000,000 | | | | 4,169,560 | |
| | | | |
| | | | | | | | | | | | | | | 32,876,765 | |
| | | | | | | | | | | | | | | | |
| | | | |
| Virginia: 1.36% | | | | | | | | | | | | | | | | |
Dulles Town VA CDA Special Assessment Tax (Miscellaneous Revenue) | | | 6.25 | | | | 03/01/2026 | | | | 8,480,000 | | | | 8,482,714 | |
Fairfax County VA Redevelopment & Housing Authority Housing for the Elderly Series A (Housing Revenue, FHA Insured) | | | 6.00 | | | | 09/01/2016 | | | | 500,000 | | | | 501,405 | |
King & Queen County VA IDA Authority Public Facilities Lease King & Queen Courts Complex Series A (Lease Revenue, RADIAN Insured) | | | 5.63 | | | | 07/15/2017 | | | | 1,000,000 | | | | 1,001,550 | |
Marquis VA CDA (Miscellaneous Revenue)(i) | | | 5.63 | | | | 09/01/2018 | | | | 1,855,000 | | | | 1,345,988 | |
Montgomery County VA IDA (Lease Revenue, AMBAC Insured) | | | 5.50 | | | | 01/15/2020 | | | | 1,120,000 | | | | 1,133,675 | |
Reynolds Crossing VA CDA Reynolds Crossing Project (Miscellaneous Revenue) | | | 5.10 | | | | 03/01/2021 | | | | 3,774,000 | | | | 3,775,245 | |
Richmond VA IDA Student Housing University Real Estate Foundation (Education Revenue) | | | 5.45 | | | | 01/01/2021 | | | | 1,000,000 | | | | 1,010,150 | |
Roanoke VA IDA Hospital Carilion Health Systems Series A (Health Revenue, NATL-RE Insured) | | | 5.50 | | | | 07/01/2018 | | | | 3,670,000 | | | | 3,739,510 | |
Suffolk VA Redevelopment & Housing Authority MFHR Hope Village Apartments Project (Housing Revenue) | | | 5.10 | | | | 02/01/2014 | | | | 470,000 | | | | 480,284 | |
Virginia HDA Commonwealth Mortgage Series A1 (Housing Revenue) | | | 4.85 | | | | 04/01/2019 | | | | 3,100,000 | | | | 3,249,265 | |
Virginia HDA Commonwealth Mortgage Series A1 (Housing Revenue) | | | 4.85 | | | | 10/01/2019 | | | | 3,100,000 | | | | 3,243,189 | |
Virginia State Resources Authority Unrefunded Balance 2010 (Utilities Revenue, NATL-RE Insured) | | | 5.50 | | | | 05/01/2016 | | | | 30,000 | | | | 30,423 | |
Watkins Centre VA CDA (Miscellaneous Revenue) | | | 5.40 | | | | 03/01/2020 | | | | 1,118,000 | | | | 1,133,820 | |
Winchester VA IDA Winchester Medical Center Incorporated (Health Revenue, AMBAC Insured)±§ | | | 5.50 | | | | 01/01/2015 | | | | 2,030,000 | | | | 2,153,383 | |
Winchester VA IDA Winchester Medical Center Incorporated (Health Revenue, AMBAC Insured)±§ | | | 5.50 | | | | 01/01/2015 | | | | 1,460,000 | | | | 1,548,739 | |
| | | | |
| | | | | | | | | | | | | | | 32,829,340 | |
| | | | | | | | | | | | | | | | |
| | | | |
| 36 | | Wells Fargo Advantage Municipal Bond Fund | | Portfolio of Investments���December 31, 2011 (Unaudited) |
| | | | | | | | | | | | | | | | |
| Security Name | | Interest Rate | | | Maturity Date | | | Principal | | | Value | |
| | | | | | | | | | | | | | | | |
| | | | |
| Washington: 1.39% | | | | | | | | | | | | | | | | |
Ocean Shores WA Local Improvement # 2007-01 (Miscellaneous Revenue) | | | 7.25 | % | | | 02/01/2031 | | | $ | 5,000,000 | | | $ | 5,610,200 | |
Port of Sunnyside WA (Port Authority Revenue) | | | 6.63 | | | | 12/01/2021 | | | | 2,250,000 | | | | 2,442,375 | |
Seattle WA Housing Authority (Housing Revenue, AGM Insured)§ | | | 5.15 | | | | 11/01/2027 | | | | 5,255,000 | | | | 5,345,964 | |
Tobacco Settlement Authority Washington Asset-Backed (Tobacco Revenue) | | | 5.50 | | | | 06/01/2012 | | | | 250,000 | | | | 253,843 | |
Tobacco Settlement Authority Washington Asset-Backed (Tobacco Revenue) | | | 6.50 | | | | 06/01/2026 | | | | 19,585,000 | | | | 20,046,423 | |
| | | | |
| | | | | | | | | | | | | | | 33,698,805 | |
| | | | | | | | | | | | | | | | |
| | | |
| West Virginia: 0.01% | | | | | | | | | | | | | |
Ohio County WV Fort Henry Center Financing District Series A (Tax Revenue) | | | 5.00 | | | | 06/01/2015 | | | | 215,000 | | | | 219,388 | |
| | | | | | | | | | | | | | | | |
| | | |
| Wisconsin: 1.69% | | | | | | | | | | | | | |
Milwaukee WI RDA Science Education Consortium Project Series A (Miscellaneous Revenue) | | | 5.13 | | | | 08/01/2015 | | | | 385,000 | | | | 385,116 | |
Milwaukee WI RDA Science Education Consortium Project Series A (Miscellaneous Revenue) | | | 5.63 | | | | 08/01/2025 | | | | 1,765,000 | | | | 1,694,506 | |
Milwaukee WI RDA Science Education Consortium Project Series A (Miscellaneous Revenue) | | | 5.75 | | | | 08/01/2035 | | | | 1,565,000 | | | | 1,415,558 | |
Oneida Tribe of Indians Wisconsin (Tax Revenue) 144A | | | 5.50 | | | | 02/01/2021 | | | | 7,300,000 | | | | 8,218,486 | |
Waukesha County WI Housing Authority The Arboretum Project (Housing Revenue)±§ | | | 5.00 | | | | 12/01/2027 | | | | 2,800,000 | | | | 2,834,860 | |
Wisconsin State HEFA Aurora Health Care Incorporated A (Health Revenue) | | | 5.25 | | | | 04/15/2024 | | | | 1,000,000 | | | | 1,051,070 | |
Wisconsin State HEFA Aurora Medical Group Incorporated Project (Health Revenue, AGM Insured) | | | 5.75 | | | | 11/15/2025 | | | | 1,205,000 | | | | 1,207,068 | |
Wisconsin State HEFA Children’s Hospital Wisconsin B (Health Revenue) | | | 5.38 | | | | 08/15/2024 | | | | 500,000 | | | | 565,780 | |
Wisconsin State HEFA Fort Health Care Incorporated Project (Health Revenue) | | | 6.10 | | | | 05/01/2034 | | | | 3,715,000 | | | | 3,751,556 | |
Wisconsin State HEFA Marshfield Clinic (Health Revenue, NATL-RE Insured) | | | 5.75 | | | | 02/15/2027 | | | | 9,870,000 | | | | 9,873,553 | |
Wisconsin State HEFA Marshfield Clinic Series B (Health Revenue) | | | 6.00 | | | | 02/15/2025 | | | | 2,000,000 | | | | 2,002,540 | |
Wisconsin State HEFA Ministry Health Care Series A (Health Revenue, NATL-RE Insured) | | | 5.13 | | | | 02/15/2022 | | | | 1,300,000 | | | | 1,317,810 | |
Wisconsin State HEFA Series M (Health Revenue, NATL-RE Insured)±§(m)(n)(a) | | | 0.46 | | | | 06/01/2019 | | | | 7,000,000 | | | | 6,651,385 | |
| | | | |
| | | | | | | | | | | | | | | 40,969,288 | |
| | | | | | | | | | | | | | | | |
| | | | |
| Wyoming: 0.45% | | | | | | | | | | | | | | | | |
Evansville WY Polypipe Incorporated Project (IDR, JPMorgan Chase & Company LOC) | | | 4.65 | | | | 12/01/2016 | | | | 3,940,000 | | | | 4,133,651 | |
West Park Hospital District WY Series A (Hospital Revenue) | | | 6.38 | | | | 06/01/2026 | | | | 2,000,000 | | | | 2,265,540 | |
West Park Hospital District WY Series A (Hospital Revenue) | | | 6.50 | | | | 06/01/2031 | | | | 1,000,000 | | | | 1,121,920 | |
West Park Hospital District WY Series B (Hospital Revenue) | | | 6.50 | | | | 06/01/2027 | | | | 500,000 | | | | 567,435 | |
West Park Hospital District WY Series B (Hospital Revenue) | | | 7.00 | | | | 06/01/2035 | | | | 1,085,000 | | | | 1,235,869 | |
Wyoming CDA (Housing Revenue)§ | | | 6.50 | | | | 07/01/2043 | | | | 1,600,000 | | | | 1,665,536 | |
| | | | |
| | | | | | | | | | | | | | | 10,989,951 | |
| | | | | | | | | | | | | | | | |
| | | |
Total Municipal Bonds and Notes (Cost $2,304,687,956) | | | | | | | | | | | | 2,382,143,525 | |
| | | | | | | | | | | | | | | | |
| | | | | | |
| Portfolio of Investments—December 31, 2011 (Unaudited) | | Wells Fargo Advantage Municipal Bond Fund | | | 37 | |
| | | | | | | | | | | | | | | | |
| Security Name | | Yield | | | Maturity Date | | | Shares | | | Value | |
| | | | | | | | | | | | | | | | |
| | | |
Short-Term Investments: 0.52% | | | | | | | | | | | | | |
| | | | |
| Investment Companies: 0.38% | | | | | | | | | | | | | | | | |
Wells Fargo Advantage National Tax-Free Money Market Fund, Institutional Class(l)(u) | | | 0.01 | % | | | | | | | 9,112,265 | | | $ | 9,112,265 | |
| | | | | | | | | | | | | | | | |
| | | | |
| | | | | | | | | Principal | | | | |
| | | | |
| U.S. Treasury Securities: 0.14% | | | | | | | | | | | | | | | | |
U.S. Treasury Bill# | | | 0.01 | | | | 03/29/2012 | | | $ | 3,500,000 | | | | 3,499,874 | |
| | | | | | | | | | | | | | | | |
| | | | |
Total Short-Term Investments (Cost $12,612,165) | | | | | | | | | | | | | | | 12,612,139 | |
| | | | | | | | | | | | | | | | |
| | | | | | | | |
| Total Investments in Securities | | | | | | | | |
| (Cost $2,317,300,121)* | | | 99.03 | % | | | 2,394,755,664 | |
Other Assets and Liabilities, Net | | | 0.97 | | | | 23,532,684 | |
| | | | | | | | |
| Total Net Assets | | | 100.00 | % | | $ | 2,418,288,348 | |
| | | | | | | | |
| ± | Variable rate investment. |
| § | These securities are subject to a demand feature which reduces the effective maturity. |
| (m) | An auction-rate security whose interest rate resets at predetermined short-term intervals through a Dutch auction; rate shown represents the rate in effect at period-end. |
| (n) | Auction to set interest rate on security failed at period end due to insufficient investor interest; failed auction does not itself cause a default. |
| (z) | Zero coupon security. Rate represents yield to maturity. |
| 144A | Security that may be resold to “qualified institutional buyers” under Rule 144A or security offered pursuant to Section 4(2) of the Securities Act of 1933, as amended. |
| (h) | Underlying security in inverse floater structure. |
| (a) | Security is fair valued by the Management Valuation Team, and in certain instances by the Board of Trustees, in accordance with procedures approved by the Board of Trustees. |
| ^^ | Security is currently in default with regards to scheduled interest and/or principal payments. The Fund has stopped accruing interest on this security. |
| (x) | Inverse floating rate security. |
| (l) | Investment in an affiliate. |
| (u) | Rate shown is the 7-day annualized yield at period end. |
| # | All or a portion of this security is segregated as collateral for investments in derivative instruments. |
| * | Cost for federal income tax purposes is $2,320,798,501 and net unrealized appreciation (depreciation) consists of: |
| | | | |
Gross unrealized appreciation | | $ | 112,101,785 | |
Gross unrealized depreciation | | | (38,144,622 | ) |
| | | | |
Net unrealized appreciation | | $ | 73,957,163 | |
The accompanying notes are an integral part of these financial statements.
| | | | |
| 38 | | Wells Fargo Advantage Municipal Bond Fund | | Statement of Assets and Liabilities—December 31, 2011 (Unaudited) |
| | | | |
| | | | |
| |
Assets | | | | |
Investments | | | | |
In unaffiliated securities, at value | | $ | 2,385,643,399 | |
In affiliated securities, at value | | | 9,112,265 | |
| | | | |
Total investments, at value (see cost below) | | | 2,394,755,664 | |
Receivable for investments sold | | | 17,133,124 | |
Receivable for Fund shares sold | | | 3,910,174 | |
Receivable for interest | | | 23,922,610 | |
Prepaid expenses and other assets | | | 426,866 | |
| | | | |
Total assets | | | 2,440,148,438 | |
| | | | |
| |
Liabilities | | | | |
Distributions payable | | | 2,840,334 | |
Payable for floating-rate notes issued | | | 12,525,000 | |
Payable for Fund shares redeemed | | | 4,367,365 | |
Payable for daily variation margin on open futures contracts | | | 375,040 | |
Advisory fee payable | | | 548,650 | |
Distribution fees payable | | | 108,366 | |
Due to other related parties | | | 420,817 | |
Accrued expenses and other liabilities | | | 674,518 | |
| | | | |
Total liabilities | | | 21,860,090 | |
| | | | |
Total net assets | | $ | 2,418,288,348 | |
| | | | |
| |
NET ASSETS CONSIST OF | | | | |
Paid-in capital | | $ | 2,437,608,604 | |
Overdistributed net investment income | | | (423,252 | ) |
Accumulated net realized losses on investments | | | (95,076,178 | ) |
Net unrealized gains on investments | | | 76,179,174 | |
| | | | |
Total net assets | | $ | 2,418,288,348 | |
| | | | |
| |
COMPUTATION OF NET ASSET VALUE AND OFFERING PRICE PER SHARE1 | | | | |
Net assets – Class A | | $ | 1,550,554,492 | |
Shares outstanding – Class A | | | 158,158,282 | |
Net asset value per share – Class A | | | $9.80 | |
Maximum offering price per share – Class A2 | | | $10.26 | |
Net assets – Class B | | $ | 17,691,908 | |
Shares outstanding – Class B | | | 1,803,957 | |
Net asset value per share – Class B | | | $9.81 | |
Net assets – Class C | | $ | 144,863,286 | |
Shares outstanding – Class C | | | 14,779,479 | |
Net asset value per share – Class C | | | $9.80 | |
Net assets – Administrator Class | | $ | 107,746,516 | |
Shares outstanding – Administrator Class | | | 10,982,859 | |
Net asset value per share – Administrator Class | | | $9.81 | |
Net assets – Institutional Class | | $ | 209,312,437 | |
Shares outstanding – Institutional Class | | | 21,349,102 | |
Net asset value per share – Institutional Class | | | $9.80 | |
Net assets – Investor Class | | $ | 388,119,709 | |
Shares outstanding – Investor Class | | | 39,596,264 | |
Net asset value per share – Investor Class | | | $9.80 | |
| |
Total investments, at cost | | $ | 2,317,300,121 | |
| | | | |
| 1. | The Fund has an unlimited number of authorized shares. |
| 2. | Maximum offering price is computed as 100/95.50 of net asset value. On investments of $50,000 or more, the offering price is reduced. |
The accompanying notes are an integral part of these financial statements.
| | | | | | |
| Statement of Operations—Six Months Ended December 31, 2011 (Unaudited) | | Wells Fargo Advantage Municipal Bond Fund | | | 39 | |
| | | | |
| | | | |
| |
Investment income | | | | |
Interest | | $ | 61,278,819 | |
Income from affiliated securities | | | 628 | |
| | | | |
Total investment income | | | 61,279,447 | |
| | | | |
| |
Expenses | | | | |
Advisory fee | | | 3,900,995 | |
Administration fees | | | | |
Fund level | | | 618,404 | |
Class A | | | 1,236,873 | |
Class B | | | 16,134 | |
Class C | | | 109,930 | |
Administrator Class | | | 46,279 | |
Institutional Class | | | 127,135 | |
Investor Class | | | 341,570 | |
Shareholder servicing fees | | | | |
Class A | | | 1,932,615 | |
Class B | | | 25,210 | |
Class C | | | 171,765 | |
Administrator Class | | | 111,128 | |
Investor Class | | | 445,072 | |
Distribution fees | | | | |
Class B | | | 75,630 | |
Class C | | | 515,296 | |
Custody and accounting fees | | | 61,811 | |
Professional fees | | | 48,774 | |
Registration fees | | | 88,038 | |
Shareholder report expenses | | | 91,038 | |
Trustees’ fees and expenses | | | 9,455 | |
Other fees and expenses | | | 98,124 | |
| | | | |
Total expenses | | | 10,071,276 | |
Less: Fee waivers and/or expense reimbursements | | | (594,316 | ) |
| | | | |
Net expenses | | | 9,476,960 | |
| | | | |
Net investment income | | | 51,802,487 | |
| | | | |
| |
REALIZED AND UNREALIZED GAINS (LOSSES) ON INVESTMENTS | | | | |
| |
Net realized gains (losses) on: | | | | |
Unaffiliated securities | | | 22,572,879 | |
Futures transactions | | | (14,791,660 | ) |
| | | | |
Net realized gains on investments | | | 7,781,219 | |
| | | | |
| |
Net change in unrealized gains (losses) on: | | | | |
Unaffiliated securities | | | 63,404,173 | |
Futures transactions | | | (2,906,402 | ) |
| | | | |
Net change in unrealized gains (losses) on investments | | | 60,497,771 | |
| | | | |
Net realized and unrealized gains (losses) on investments | | | 68,278,990 | |
| | | | |
Net increase in net assets resulting from operations | | $ | 120,081,477 | |
| | | | |
The accompanying notes are an integral part of these financial statements.
| | | | |
| 40 | | Wells Fargo Advantage Municipal Bond Fund | | Statements of Changes in Net Assets |
| | | | | | | | | | | | | | | | |
| | | Six Months Ended December 31, 2011 (Unaudited) | | | Year Ended June 30, 2011 | |
| | |
Operations | | | | | | | | |
Net investment income | | | | | | $ | 51,802,487 | | | | | | | $ | 101,384,959 | |
Net realized gains on investments | | | | | | | 7,781,219 | | | | | | | | 18,845,954 | |
Net change in unrealized gains (losses) on investments | | | | | | | 60,497,771 | | | | | | | | (15,582,609 | ) |
| | | | | | | | | | | | | | | | |
Net increase in net assets resulting from operations | | | | | | | 120,081,477 | | | | | | | | 104,648,304 | |
| | | | | | | | | | | | | | | | |
| | |
Distributions to shareholders from | | | | | | | | |
Net investment income | | | | | | | | |
Class A | | | | | | | (32,494,310 | ) | | | | | | | (59,060,027 | ) |
Class B | | | | | | | (347,688 | ) | | | | | | | (1,162,353 | ) |
Class C | | | | | | | (2,370,309 | ) | | | | | | | (4,173,587 | ) |
Administrator Class | | | | | | | (2,018,334 | ) | | | | | | | (3,916,012 | ) |
Institutional Class | | | | | | | (7,077,202 | ) | | | | | | | (19,430,866 | ) |
Investor Class | | | | | | | (7,500,722 | ) | | | | | | | (13,598,496 | ) |
Net realized gains | | | | | | | | |
Class A | | | | | | | (401,460 | ) | | | | | | | (1,575,542 | ) |
Class B | | | | | | | (4,634 | ) | | | | | | | (39,434 | ) |
Class C | | | | | | | (37,511 | ) | | | | | | | (138,575 | ) |
Administrator Class | | | | | | | (27,662 | ) | | | | | | | (65,150 | ) |
Institutional Class | | | | | | | (56,312 | ) | | | | | | | (535,124 | ) |
Investor Class | | | | | | | (98,949 | ) | | | | | | | (344,183 | ) |
| | | | | | | | | | | | | | | | |
Total distributions to shareholders | | | | | | | (52,435,093 | ) | | | | | | | (104,039,349 | ) |
| | | | | | | | | | | | | | | | |
| | | | |
Capital share transactions | | | Shares | | | | | | | | Shares | | | | | |
Proceeds from shares sold | | | | | | | | |
Class A | | | 16,291,670 | | | | 157,500,064 | | | | 51,835,801 | | | | 490,169,016 | |
Class B | | | 29,711 | | | | 288,067 | | | | 51,817 | | | | 496,010 | |
Class C | | | 2,426,240 | | | | 23,446,963 | | | | 3,660,076 | | | | 34,803,259 | |
Administrator Class | | | 4,983,036 | | | | 48,232,518 | | | | 6,142,044 | | | | 57,801,479 | |
Institutional Class | | | 2,629,478 | | | | 25,375,925 | | | | 24,713,320 | | | | 237,143,444 | |
Investor Class | | | 9,235,630 | | | | 89,275,556 | | | | 14,408,715 | | | | 135,840,580 | |
| | | | | | | | | | | | | | | | |
| | | | | | | 344,119,093 | | | | | | | | 956,253,788 | |
| | | | | | | | | | | | | | | | |
Reinvestment of distributions | | | | | | | | |
Class A | | | 2,547,652 | | | | 24,662,598 | | | | 4,609,967 | | | | 43,539,414 | |
Class B | | | 21,603 | | | | 209,184 | | | | 77,580 | | | | 734,774 | |
Class C | | | 147,220 | | | | 1,425,305 | | | | 255,976 | | | | 2,418,353 | |
Administrator Class | | | 161,341 | | | | 1,564,064 | | | | 222,047 | | | | 2,097,291 | |
Institutional Class | | | 131,881 | | | | 1,276,988 | | | | 271,664 | | | | 2,566,694 | |
Investor Class | | | 668,383 | | | | 6,470,424 | | | | 1,232,498 | | | | 11,652,764 | |
| | | | | | | | | | | | | | | | |
| | | | | | | 35,608,563 | | | | | | | | 63,009,290 | |
| | | | | | | | | | | | | | | | |
Payment for shares redeemed | | | | | | | | |
Class A | | | (18,318,059 | ) | | | (176,996,144 | ) | | | (37,155,536 | ) | | | (349,795,422 | ) |
Class B | | | (767,313 | ) | | | (7,399,814 | ) | | | (2,302,819 | ) | | | (21,692,645 | ) |
Class C | | | (1,044,983 | ) | | | (10,092,509 | ) | | | (3,386,290 | ) | | | (31,813,638 | ) |
Administrator Class | | | (2,424,587 | ) | | | (23,469,208 | ) | | | (18,781,216 | ) | | | (181,345,798 | ) |
Institutional Class | | | (26,242,401 | ) | | | (253,547,469 | ) | | | (20,355,452 | ) | | | (191,385,954 | ) |
Investor Class | | | (5,441,869 | ) | | | (52,586,634 | ) | | | (15,308,057 | ) | | | (144,380,304 | ) |
| | | | | | | | | | | | | | | | |
| | | | | | | (524,091,778 | ) | | | | | | | (920,413,761 | ) |
| | | | | | | | | | | | | | | | |
| | | | | | |
| Statements of Changes in Net Assets | | Wells Fargo Advantage Municipal Bond Fund | | | 41 | |
| | | | | | | | | | | | | | | | |
| | | Six Months Ended December 31, 2011 (Unaudited) | | | Year Ended June 30, 2011 | |
| | | | |
| | | Shares | | | | | | Shares | | | | |
| | | | |
Capital share transactions (continued) | | | | | | | | | | | | | | | | |
Net asset value of shares issued in acquisitions | | | | | | | | | | | | | | | | |
Class A | | | 0 | | | $ | 0 | | | | 98,040,074 | | | $ | 935,406,444 | |
Class B | | | 0 | | | | 0 | | | | 4,332,007 | | | | 41,345,567 | |
Class C | | | 0 | | | | 0 | | | | 9,158,549 | | | | 87,366,580 | |
Administrator Class | | | 0 | | | | 0 | | | | 1,039,978 | | | | 9,919,279 | |
Institutional Class | | | 0 | | | | 0 | | | | 39,905,138 | | | | 380,736,995 | |
| | | | | | | | | | | | | | | | |
| | | | | | | 0 | | | | | | | | 1,454,774,865 | |
| | | | | | | | | | | | | | | | |
Net increase (decrease) in net assets resulting
from capital share transactions | | | | | | | (144,364,122 | ) | | | | | | | 1,553,624,182 | |
| | | | | | | | | | | | | | | | |
Total increase (decrease) in net assets | | | | | | | (76,717,738 | ) | | | | | | | 1,554,233,137 | |
| | | | | | | | | | | | | | | | |
| | | | |
Net assets | | | | | | | | | | | | | | | | |
Beginning of period | | | | | | | 2,495,006,086 | | | | | | | | 940,772,949 | |
| | | | | | | | | | | | | | | | |
End of period | | | | | | $ | 2,418,288,348 | | | | | | | $ | 2,495,006,086 | |
| | | | | | | | | | | | | | | | |
Overdistributed net investment income | | | | | | $ | (423,252 | ) | | | | | | $ | (417,174 | ) |
| | | | | | | | | | | | | | | | |
The accompanying notes are an integral part of these financial statements.
| | | | |
| 42 | | Wells Fargo Advantage Municipal Bond Fund | | Financial Highlights |
(For a share outstanding throughout each period)
| | | | | | | | | | | | | | | | | | | | | | | | |
| | | Six Months Ended
December 31, 2011 (Unaudited) | | | Year Ended June 30, | |
| Class A | | | 2011 | | | 2010 | | | 2009 | | | 2008 | | | 2007 | |
Net asset value, beginning of period | | $ | 9.54 | | | $ | 9.51 | | | $ | 8.74 | | | $ | 9.21 | | | $ | 9.50 | | | $ | 9.41 | |
Net investment income | | | 0.21 | | | | 0.40 | | | | 0.41 | | | | 0.45 | | | | 0.42 | | | | 0.40 | |
Net realized and unrealized gains (losses) on investments | | | 0.25 | | | | 0.03 | | | | 0.84 | | | | (0.47 | ) | | | (0.29 | ) | | | 0.11 | |
| | | | | | | | | | | | | | | | | | | | | | | | |
Total from investment operations | | | 0.46 | | | | 0.43 | | | | 1.25 | | | | ( 0.02 | ) | | | 0.13 | | | | 0.51 | |
Distributions to shareholders from | | | | | | | | | | | | | | | | | | | | | | | | |
Net investment income | | | (0.20 | ) | | | (0.39 | ) | | | (0.41 | ) | | | (0.45 | ) | | | (0.42 | ) | | | (0.40 | ) |
Net realized gains | | | (0.00 | )1 | | | (0.01 | ) | | | (0.07 | ) | | | 0.00 | | | | 0.00 | | | | (0.02 | ) |
| | | | | | | | | | | | | | | | | | | | | | | | |
Total distributions to shareholders | | | (0.20 | ) | | | (0.40 | ) | | | (0.48 | ) | | | (0.45 | ) | | | (0.42 | ) | | | (0.42 | ) |
Net asset value, end of period | | $ | 9.80 | | | $ | 9.54 | | | $ | 9.51 | | | $ | 8.74 | | | $ | 9.21 | | | $ | 9.50 | |
Total return2 | | | 4.94 | % | | | 4.70 | % | | | 14.28 | % | | | (0.04 | )% | | | 1.38 | % | | | 5.38 | % |
Ratios to average net assets (annualized) | | | | | | | | | | | | | | | | | | | | | | | | |
Gross expenses | | | 0.81 | %3 | | | 0.83 | %3 | | | 0.86 | %3 | | | 0.89 | %3 | | | 1.04 | %3 | | | 1.07 | %3 |
Net expenses | | | 0.76 | %3 | | | 0.77 | %3 | | | 0.75 | %3 | | | 0.75 | %3 | | | 0.82 | %3 | | | 0.85 | %3 |
Net investment income | | | 4.20 | % | | | 4.18 | % | | | 4.37 | % | | | 5.19 | % | | | 4.44 | % | | | 4.11 | % |
Supplemental data | | | | | | | | | | | | | | | | | | | | | | | | |
Portfolio turnover rate | | | 21 | % | | | 69 | % | | | 84 | % | | | 152 | % | | | 144 | % | | | 107 | % |
Net assets, end of period (000’s omitted) | | | $1,550,554 | | | | $1,503,256 | | | | $383,203 | | | | $220,711 | | | | $115,830 | | | | $127,411 | |
| 1. | Amount is less than $0.005. |
| 2. | Total return calculations do not include any sales charges. Returns for periods of less than one year are not annualized. |
| 3. | Ratios include interest and fee expense relating to inverse floating-rate obligations as follows: |
| | | | |
Six months ended December 31, 2011 (Unaudited) | | | 0.01 | % |
Year ended June 30, 2011 | | | 0.02 | % |
Year ended June 30, 2010 | | | 0.03 | % |
Year ended June 30, 2009 | | | 0.06 | % |
Year ended June 30, 2008 | | | 0.07 | % |
Year ended June 30, 2007 | | | 0.14 | % |
The accompanying notes are an integral part of these financial statements.
| | | | | | |
| Financial Highlights | | Wells Fargo Advantage Municipal Bond Fund | | | 43 | |
(For a share outstanding throughout each period)
| | | | | | | | | | | | | | | | | | | | | | | | |
| | | Six Months Ended
December 31, 2011 (Unaudited) | | | Year Ended June 30, | |
| Class B | | | 2011 | | | 2010 | | | 2009 | | | 2008 | | | 2007 | |
Net asset value, beginning of period | | $ | 9.54 | | | $ | 9.51 | | | $ | 8.72 | | | $ | 9.21 | | | $ | 9.50 | | | $ | 9.41 | |
Net investment income | | | 0.17 | | | | 0.33 | | | | 0.35 | | | | 0.38 | | | | 0.35 | | | | 0.32 | |
Net realized and unrealized gains (losses) on investments | | | 0.27 | | | | 0.03 | | | | 0.85 | | | | (0.49 | ) | | | (0.29 | ) | | | 0.11 | |
| | | | | | | | | | | | | | | | | | | | | | | | |
Total from investment operations | | | 0.44 | | | | 0.36 | | | | 1.20 | | | | (0.11 | ) | | | 0.06 | | | | 0.43 | |
Distributions to shareholders from | | | | | | | | | | | | | | | | | | | | | | | | |
Net investment income | | | (0.17 | ) | | | (0.32 | ) | | | (0.34 | ) | | | (0.38 | ) | | | (0.35 | ) | | | (0.32 | ) |
Net realized gains | | | (0.00 | )1 | | | (0.01 | ) | | | (0.07 | ) | | | 0.00 | | | | 0.00 | | | | (0.02 | ) |
| | | | | | | | | | | | | | | | | | | | | | | | |
Total distributions to shareholders | | | (0.17 | ) | | | (0.33 | ) | | | (0.41 | ) | | | (0.38 | ) | | | (0.35 | ) | | | (0.34 | ) |
Net asset value, end of period | | $ | 9.81 | | | $ | 9.54 | | | $ | 9.51 | | | $ | 8.72 | | | $ | 9.21 | | | $ | 9.50 | |
Total return2 | | | 4.65 | % | | | 3.92 | % | | | 13.43 | % | | | (1.01 | )% | | | 0.62 | % | | | 4.59 | % |
Ratios to average net assets (annualized) | | | | | | | | | | | | | | | | | | | | | | | | |
Gross expenses | | | 1.56 | %3 | | | 1.57 | %3 | | | 1.61 | %3 | | | 1.64 | %3 | | | 1.79 | %3 | | | 1.82 | %3 |
Net expenses | | | 1.51 | %3 | | | 1.52 | %3 | | | 1.50 | %3 | | | 1.50 | %3 | | | 1.57 | %3 | | | 1.60 | %3 |
Net investment income | | | 3.45 | % | | | 3.39 | % | | | 3.71 | % | | | 4.40 | % | | | 3.67 | % | | | 3.36 | % |
Supplemental data | | | | | | | | | | | | | | | | | | | | | | | | |
Portfolio turnover rate | | | 21 | % | | | 69 | % | | | 84 | % | | | 152 | % | | | 144 | % | | | 107 | % |
Net assets, end of period (000’s omitted) | | | $17,692 | | | | $24,040 | | | | $3,437 | | | | $6,436 | | | | $6,070 | | | | $8,642 | |
| 1. | Amount is less than $0.005. |
| 2. | Total return calculations do not include any sales charges. Returns for periods of less than one year are not annualized. |
| 3. | Ratios include interest and fee expense relating to inverse floating-rate obligations as follows: |
| | | | |
Six months ended December 31, 2011 (Unaudited) | | | 0.01 | % |
Year ended June 30, 2011 | | | 0.02 | % |
Year ended June 30, 2010 | | | 0.03 | % |
Year ended June 30, 2009 | | | 0.06 | % |
Year ended June 30, 2008 | | | 0.07 | % |
Year ended June 30, 2007 | | | 0.14 | % |
The accompanying notes are an integral part of these financial statements.
| | | | |
| 44 | | Wells Fargo Advantage Municipal Bond Fund | | Financial Highlights |
(For a share outstanding throughout each period)
| | | | | | | | | | | | | | | | | | | | | | | | |
| | | Six Months Ended
December 31, 2011 (Unaudited) | | | Year Ended June 30, | |
| Class C | | | 2011 | | | 2010 | | | 2009 | | | 2008 | | | 2007 | |
Net asset value, beginning of period | | $ | 9.53 | | | $ | 9.51 | | | $ | 8.74 | | | $ | 9.21 | | | $ | 9.50 | | | $ | 9.41 | |
Net investment income | | | 0.17 | | | | 0.32 | | | | 0.33 | | | | 0.38 | | | | 0.35 | | | | 0.32 | |
Net realized and unrealized gains (losses) on investments | | | 0.27 | | | | 0.03 | | | | 0.85 | | | | (0.47 | ) | | | (0.29 | ) | | | 0.11 | |
| | | | | | | | | | | | | | | | | | | | | | | | |
Total from investment operations | | | 0.44 | | | | 0.35 | | | | 1.18 | | | | (0.09 | ) | | | 0.06 | | | | 0.43 | |
Distributions to shareholders from | | | | | | | | | | | | | | | | | | | | | | | | |
Net investment income | | | (0.17 | ) | | | (0.32 | ) | | | (0.34 | ) | | | (0.38 | ) | | | (0.35 | ) | | | (0.32 | ) |
Net realized gains | | | (0.00 | )1 | | | (0.01 | ) | | | (0.07 | ) | | | 0.00 | | | | 0.00 | | | | (0.02 | ) |
| | | | | | | | | | | | | | | | | | | | | | | | |
Total distributions to shareholders | | | (0.17 | ) | | | (0.33 | ) | | | (0.41 | ) | | | (0.38 | ) | | | (0.35 | ) | | | (0.34 | ) |
Net asset value, end of period | | $ | 9.80 | | | $ | 9.53 | | | $ | 9.51 | | | $ | 8.74 | | | $ | 9.21 | | | $ | 9.50 | |
Total return2 | | | 4.66 | % | | | 3.81 | % | | | 13.43 | % | | | (0.79 | )% | | | 0.62 | % | | | 4.59 | % |
Ratios to average net assets (annualized) | | | | | | | | | | | | | | | | | | | | | | | | |
Gross expenses | | | 1.56 | %3 | | | 1.58 | %3 | | | 1.61 | %3 | | | 1.63 | %3 | | | 1.77 | %3 | | | 1.82 | %3 |
Net expenses | | | 1.51 | %3 | | | 1.52 | %3 | | | 1.50 | %3 | | | 1.50 | %3 | | | 1.57 | %3 | | | 1.60 | %3 |
Net investment income | | | 3.45 | % | | | 3.42 | % | | | 3.59 | % | | | 4.44 | % | | | 3.67 | % | | | 3.36 | % |
Supplemental data | | | | | | | | | | | | | | | | | | | | | | | | |
Portfolio turnover rate | | | 21 | % | | | 69 | % | | | 84 | % | | | 152 | % | | | 144 | % | | | 107 | % |
Net assets, end of period (000’s omitted) | | | $144,863 | | | | $126,338 | | | | $33,864 | | | | $12,509 | | | | $2,384 | | | | $2,146 | |
| 1. | Amount is less than $0.005. |
| 2. | Total return calculations do not include any sales charges. Returns for periods of less than one year are not annualized. |
| 3. | Ratios include interest and fee expense relating to inverse floating-rate obligations as follows: |
| | | | |
Six months ended December 31, 2011 (Unaudited) | | | 0.01 | % |
Year ended June 30, 2011 | | | 0.02 | % |
Year ended June 30, 2010 | | | 0.03 | % |
Year ended June 30, 2009 | | | 0.06 | % |
Year ended June 30, 2008 | | | 0.07 | % |
Year ended June 30, 2007 | | | 0.14 | % |
The accompanying notes are an integral part of these financial statements.
| | | | | | |
| Financial Highlights | | Wells Fargo Advantage Municipal Bond Fund | | | 45 | |
(For a share outstanding throughout each period)
| | | | | | | | | | | | | | | | | | | | | | | | |
| | | Six Months Ended
December 31, 2011 (Unaudited) | | | Year Ended June 30, | |
| Administrator Class | | | 2011 | | | 2010 | | | 2009 | | | 2008 | | | 2007 | |
Net asset value, beginning of period | | $ | 9.54 | | | $ | 9.50 | | | $ | 8.73 | | | $ | 9.21 | | | $ | 9.50 | | | $ | 9.41 | |
Net investment income | | | 0.22 | | | | 0.40 | | | | 0.42 | | | | 0.46 | | | | 0.44 | | | | 0.43 | |
Net realized and unrealized gains (losses) on investments | | | 0.26 | | | | 0.06 | | | | 0.85 | | | | (0.48 | ) | | | (0.29 | ) | | | 0.11 | |
| | | | | | | | | | | | | | | | | | | | | | | | |
Total from investment operations | | | 0.48 | | | | 0.46 | | | | 1.27 | | | | (0.02 | ) | | | 0.15 | | | | 0.54 | |
Distributions to shareholders from | | | | | | | | | | | | | | | | | | | | | | | | |
Net investment income | | | (0.21 | ) | | | (0.41 | ) | | | (0.43 | ) | | | (0.46 | ) | | | (0.44 | ) | | | (0.43 | ) |
Net realized gains | | | (0.00 | )1 | | | (0.01 | ) | | | (0.07 | ) | | | 0.00 | | | | 0.00 | | | | (0.02 | ) |
| | | | | | | | | | | | | | | | | | | | | | | | |
Total distributions to shareholders | | | (0.21 | ) | | | (0.42 | ) | | | (0.50 | ) | | | (0.46 | ) | | | (0.44 | ) | | | (0.45 | ) |
Net asset value, end of period | | $ | 9.81 | | | $ | 9.54 | | | $ | 9.50 | | | $ | 8.73 | | | $ | 9.21 | | | $ | 9.50 | |
Total return2 | | | 5.13 | % | | | 4.96 | % | | | 14.33 | % | | | 0.00 | % | | | 1.65 | % | | | 5.77 | % |
Ratios to average net assets (annualized) | | | | | | | | | | | | | | | | | | | | | | | | |
Gross expenses | | | 0.74 | %3 | | | 0.75 | %3 | | | 0.78 | %3 | | | 0.81 | %3 | | | 0.87 | %3 | | | 0.89 | %3 |
Net expenses | | | 0.61 | %3 | | | 0.62 | %3 | | | 0.60 | %3 | | | 0.60 | %3 | | | 0.56 | %3 | | | 0.48 | %3 |
Net investment income | | | 4.36 | % | | | 4.26 | % | | | 4.55 | % | | | 5.34 | % | | | 4.71 | % | | | 4.48 | % |
Supplemental data | | | | | | | | | | | | | | | | | | | | | | | | |
Portfolio turnover rate | | | 21 | % | | | 69 | % | | | 84 | % | | | 152 | % | | | 144 | % | | | 107 | % |
Net assets, end of period (000’s omitted) | | | $107,747 | | | | $78,861 | | | | $186,661 | | | | $157,287 | | | | $26,793 | | | | $15,926 | |
| 1. | Amount is less than $0.005. |
| 2. | Returns for periods of less than one year are not annualized. |
| 3. | Ratios include interest and fee expense relating to inverse floating-rate obligations as follows: |
| | | | |
Six months ended December 31, 2011 (Unaudited) | | | 0.01 | % |
Year ended June 30, 2011 | | | 0.02 | % |
Year ended June 30, 2010 | | | 0.03 | % |
Year ended June 30, 2009 | | | 0.06 | % |
Year ended June 30, 2008 | | | 0.07 | % |
Year ended June 30, 2007 | | | 0.14 | % |
The accompanying notes are an integral part of these financial statements.
| | | | |
| 46 | | Wells Fargo Advantage Municipal Bond Fund | | Financial Highlights |
(For a share outstanding throughout each period)
| | | | | | | | | | | | | | | | | | | | |
| | | Six Months Ended
December 31, 2011 (Unaudited) | | | Year Ended June 30, | |
| Institutional Class | | | 2011 | | | 2010 | | | 2009 | | | 20081 | |
Net asset value, beginning of period | | $ | 9.54 | | | $ | 9.51 | | | $ | 8.73 | | | $ | 9.21 | | | $ | 9.19 | |
Net investment income | | | 0.22 | | | | 0.42 | | | | 0.41 | | | | 0.47 | | | | 0.11 | |
Net realized and unrealized gains (losses) on investments | | | 0.26 | | | | 0.04 | | | | 0.88 | | | | (0.48 | ) | | | 0.02 | |
| | | | | | | | | | | | | | | | | | | | |
Total from investment operations | | | 0.48 | | | | 0.46 | | | | 1.29 | | | | (0.01 | ) | | | 0.13 | |
Distributions to shareholders from | | | | | | | | | | | | | | | | | | | | |
Net investment income | | | (0.22 | ) | | | (0.42 | ) | | | (0.44 | ) | | | (0.47 | ) | | | (0.11 | ) |
Net realized gains | | | (0.00 | )2 | | | (0.01 | ) | | | (0.07 | ) | | | 0.00 | | | | 0.00 | |
| | | | | | | | | | | | | | | | | | | | |
Total distributions to shareholders | | | (0.22 | ) | | | (0.43 | ) | | | (0.51 | ) | | | (0.47 | ) | | | (0.11 | ) |
Net asset value, end of period | | $ | 9.80 | | | $ | 9.54 | | | $ | 9.51 | | | $ | 8.73 | | | $ | 9.21 | |
Total return3 | | | 5.09 | % | | | 4.99 | % | | | 14.73 | % | | | 0.17 | % | | | 1.45 | % |
Ratios to average net assets (annualized) | | | | | | | | | | | | | | | | | | | | |
Gross expenses | | | 0.47 | %4 | | | 0.50 | %4 | | | 0.50 | %4 | | | 0.51 | %4 | | | 0.56 | %4 |
Net expenses | | | 0.47 | %4 | | | 0.49 | %4 | | | 0.50 | %4 | | | 0.42 | %4 | | | 0.44 | %4 |
Net investment income | | | 4.45 | % | | | 4.46 | % | | | 4.42 | % | | | 5.50 | % | | | 5.02 | % |
Supplemental data | | | | | | | | | | | | | | | | | | | | |
Portfolio turnover rate | | | 21 | % | | | 69 | % | | | 84 | % | | | 152 | % | | | 144 | % |
Net assets, end of period (000’s omitted) | | | $209,312 | | | | $427,525 | | | | $2,809 | | | | $10 | | | | $10 | |
| 1. | For the period from March 31, 2008 (commencement of class operations) to June 30, 2008. |
| 2. | Amount is less than $0.005. |
| 3. | Returns for periods of less than one year are not annualized. |
| 4. | Ratios include interest and fee expense relating to inverse floating-rate obligations as follows: |
| | | | |
Six months ended December 31, 2011 (Unaudited) | | | 0.01 | % |
Year ended June 30, 2011 | | | 0.02 | % |
Year ended June 30, 2010 | | | 0.03 | % |
Year ended June 30, 2009 | | | 0.06 | % |
Year ended June 30, 2008 | | | 0.07 | % |
The accompanying notes are an integral part of these financial statements.
| | | | | | |
| Financial Highlights | | Wells Fargo Advantage Municipal Bond Fund | | | 47 | |
(For a share outstanding throughout each period)
| | | | | | | | | | | | | | | | | | | | | | | | |
| | | Six Months Ended
December 31, 2011 (Unaudited) | | | Year Ended June 30, | |
| Investor Class | | | 2011 | | | 2010 | | | 2009 | | | 2008 | | | 2007 | |
Net asset value, beginning of period | | $ | 9.53 | | | $ | 9.51 | | | $ | 8.74 | | | $ | 9.21 | | | $ | 9.50 | | | $ | 9.41 | |
Net investment income | | | 0.21 | | | | 0.39 | | | | 0.41 | | | | 0.44 | | | | 0.42 | | | | 0.40 | |
Net realized and unrealized gains (losses) on investments | | | 0.26 | | | | 0.03 | | | | 0.84 | | | | (0.47 | ) | | | (0.29 | ) | | | 0.11 | |
| | | | | | | | | | | | | | | | | | | | | | | | |
Total from investment operations | | | 0.47 | | | | 0.42 | | | | 1.25 | | | | (0.03 | ) | | | 0.13 | | | | 0.51 | |
Distributions to shareholders from | | | | | | | | | | | | | | | | | | | | | | | | |
Net investment income | | | (0.20 | ) | | | (0.39 | ) | | | (0.41 | ) | | | (0.44 | ) | | | (0.42 | ) | | | (0.40 | ) |
Net realized gains | | | (0.00 | )1 | | | (0.01 | ) | | | (0.07 | ) | | | 0.00 | | | | 0.00 | | | | (0.02 | ) |
| | | | | | | | | | | | | | | | | | | | | | | | |
Total distributions to shareholders | | | (0.20 | ) | | | (0.40 | ) | | | (0.48 | ) | | | (0.44 | ) | | | (0.42 | ) | | | (0.42 | ) |
Net asset value, end of period | | $ | 9.80 | | | $ | 9.53 | | | $ | 9.51 | | | $ | 8.74 | | | $ | 9.21 | | | $ | 9.50 | |
Total return2 | | | 5.03 | % | | | 4.56 | % | | | 14.23 | % | | | (0.09 | )% | | | 1.41 | % | | | 5.43 | % |
Ratios to average net assets (annualized) | | | | | | | | | | | | | | | | | | | | | | | | |
Gross expenses | | | 0.84 | %3 | | | 0.86 | %3 | | | 0.91 | %3 | | | 0.94 | %3 | | | 1.16 | %3 | | | 1.24 | %3 |
Net expenses | | | 0.79 | %3 | | | 0.80 | %3 | | | 0.80 | %3 | | | 0.80 | %3 | | | 0.80 | %3 | | | 0.80 | %3 |
Net investment income | | | 4.17 | % | | | 4.13 | % | | | 4.35 | % | | | 5.12 | % | | | 4.46 | % | | | 4.16 | % |
Supplemental data | | | | | | | | | | | | | | | | | | | | | | | | |
Portfolio turnover rate | | | 21 | % | | | 69 | % | | | 84 | % | | | 152 | % | | | 144 | % | | | 107 | % |
Net assets, end of period (000’s omitted) | | | $388,120 | | | | $334,987 | | | | $330,799 | | | | $249,015 | | | | $248,426 | | | | $248,692 | |
| 1. | Amount is less than $0.005. |
| 2. | Returns for periods of less than one year are not annualized. |
| 3. | Ratios include interest and fee expense relating to inverse floating-rate obligations as follows: |
| | | | |
Six months ended December 31, 2011 (Unaudited) | | | 0.01 | % |
Year ended June 30, 2011 | | | 0.02 | % |
Year ended June 30, 2010 | | | 0.03 | % |
Year ended June 30, 2009 | | | 0.06 | % |
Year ended June 30, 2008 | | | 0.07 | % |
Year ended June 30, 2007 | | | 0.14 | % |
The accompanying notes are an integral part of these financial statements.
| | | | |
| 48 | | Wells Fargo Advantage Municipal Bond Fund | | Notes to Financial Statements (Unaudited) |
1. ORGANIZATION
Wells Fargo Funds Trust (the “Trust”), a Delaware statutory trust organized on March 10, 1999, is an open-end management investment company registered under the Investment Company Act of 1940, as amended (the “1940 Act”). These financial statements report on Wells Fargo Advantage Municipal Bond Fund (the “Fund”) which is a diversified series of the Trust.
2. SIGNIFICANT ACCOUNTING POLICIES
The following significant accounting policies, which are consistently followed in the preparation of the financial statements of the Fund, are in conformity with U.S. generally accepted accounting principles which require management to make estimates and assumptions that affect the reported amounts of assets and liabilities, disclosure of contingent assets and liabilities at the date of the financial statements, and the reported amounts of revenues and expenses during the reporting period. Actual results could differ from those estimates.
Securities valuation
Fixed income securities with maturities exceeding 60 days are valued based on available evaluated prices received from an independent pricing service approved by the Board of Trustees which may utilize both transaction data and market information such as yield, prices of securities of comparable quality, coupon rate, maturity, type of issue, trading characteristics and other market data. If valuations are not available from the pricing service or values received are deemed not representative of market value, values will be obtained from a third party broker-dealer or determined based on the Fund’s Fair Value Procedures.
Debt securities of sufficient credit quality with original maturities of 60 days or less generally are valued at amortized cost which approximates fair value. The amortized cost method involves valuing a security at its cost, plus accretion of discount or minus amortization of premium over the period until maturity.
Investments in open-end mutual funds and non-registered investment companies are generally valued at net asset value.
Investments which are not valued using any of the methods discussed above, are valued at their fair value, as determined by procedures established in good faith and approved by the Board of Trustees.
When-issued transactions
The Fund may purchase securities on a forward commitment or ‘when-issued’ basis. The Fund records a when-issued transaction on the trade date and will segregate assets to cover its obligation by confirming the availability of qualifying assets having a value sufficient to make payment for the securities purchased. Securities purchased on a when-issued basis are marked-to-market daily and the Fund begins earning interest on the settlement date. Losses may arise due to changes in the market value of the underlying securities or if the counterparty does not perform under the contract.
Futures contracts
The Fund may be subject to interest rate risk in the normal course of pursuing its investment objectives. The Fund may buy and sell futures contracts in order to gain exposure to, or protect against changes in, security values and interest rates. The primary risks associated with the use of futures contracts are the imperfect correlation between changes in market values of securities held by the Fund and the prices of futures contracts, and the possibility of an illiquid market.
Futures contracts are valued based upon their quoted daily settlement prices when available. The aggregate principal amounts of the contracts are not recorded in the financial statements. Fluctuations in the value of the contracts are recorded in the Statement of Assets and Liabilities as an asset or liability and in the Statement of Operations as unrealized gains or losses until the contracts are closed, at which point they are recorded as net realized gains or losses on futures contracts. With futures contracts, there is minimal counterparty risk to the Fund since futures are exchange traded and the exchange’s clearinghouse, as counterparty to all exchange traded futures, guarantees the futures against default.
Inverse floating-rate obligations
The Fund may participate in inverse floating-rate obligation (“Inverse Floater”) structures whereby a fixed-rate bond (“Fixed-Rate Bond”) purchased by the Fund is transferred to a tender option bond trust (“TOB Trust”). The TOB Trust issues floating-rate notes (“Floating-Rate Notes”) to third-parties, which are collateralized by the Fixed-Rate Bond, and the Fund buys a residual interest in the TOB Trust’s assets and cash flows. The Inverse Floater held by the Fund gives the Fund the right (1) to cause the holders of the Floating-Rate Notes to tender their notes at par, and (2) to have the Fixed-Rate Bond
| | | | | | |
| Notes to Financial Statements (Unaudited) | | Wells Fargo Advantage Municipal Bond Fund | | | 49 | |
held by the TOB Trust transferred back to the Fund, thereby collapsing the TOB Trust. The Fund accounts for the transaction described above as a secured borrowing by including the Fixed-Rate Bond in its Portfolio of Investments, and by recording the Floating-Rate Notes as a liability in the Statement of Assets and Liabilities. The Fund also records the interest paid on Floating-Rate Notes as interest expense. The Floating-Rate Notes have interest rates that generally reset weekly and their holders have the option to tender their notes for redemption at par at each reset date. Inverse Floaters held by the Fund are securities exempt from registration under Rule 144A of the Securities Act of 1933, as amended.
Security transactions and income recognition
Securities transactions are recorded on a trade date basis. Realized gains or losses are reported on the basis of identified cost of securities delivered.
Interest income is accrued daily and bond discounts are accreted and premiums are amortized daily based on the effective interest method. To the extent debt obligations are placed on non-accrual status, any related interest income may be reduced by writing off interest receivables when the collection of all or a portion of interest has become doubtful based on consistently applied procedures. If the issuer subsequently resumes interest payments or when the collectability of interest is reasonably assured, the debt obligation is removed from non-accrual status.
Distributions to shareholders
Distributions to shareholders from net investment income are accrued daily and paid monthly. Distributions from net realized gains, if any, are recorded on the ex-dividend date. Such distributions are determined in conformity with income tax regulations, which may differ from generally accepted accounting principles.
Federal and other taxes
The Fund intends to continue to qualify as a regulated investment company by distributing substantially all of its investment company taxable and tax-exempt income and any net realized capital gains (after reduction for capital loss carryforwards) sufficient to relieve it from all, or substantially all, federal income taxes. Accordingly, no provision for federal income taxes was required.
The Fund’s income and federal excise tax returns and all financial records supporting those returns for the prior three fiscal years are subject to examination by the federal and Delaware revenue authorities.
Under the recently enacted Regulated Investment Company Modernization Act of 2010, the Fund is permitted to carry forward capital losses incurred in taxable years which began after December 22, 2010 for an unlimited period. However, any losses incurred are required to be utilized prior to the losses incurred in pre-enactment taxable years. As a result of this ordering rule, pre-enactment capital loss carryforwards may be more likely to expire unused. Additionally, post-enactment capital losses that are carried forward will retain their character as either short-term or long-term capital losses rather than being considered all short-term as under previous law.
At June 30, 2011, net capital loss carryforwards, which were available to offset future net realized capital gains, were as follows:
| | | | | | | | | | |
| Expiration |
| 2012 | | 2013 | | 2015 | | 2016 | | 2017 | | 2018 |
| $1,390,042 | | $2,156,251 | | $6,506,524 | | $43,928,997 | | $34,601,109 | | $10,765,388 |
Class allocations
The separate classes of shares offered by the Fund differ principally in applicable sales charges, distribution, shareholder servicing and administration fees. Shareholders of each class bear certain expenses that pertain to that particular class. All shareholders bear the common expenses of the Fund, earn income from the portfolio, and are allocated unrealized gains and losses pro rata based on the average daily net assets of each class, without distinction between share classes. Dividends are determined separately for each class based on income and expenses allocable to each class. Realized gains and losses are allocated to each class pro rata based upon the net assets of each class on the date realized. Differences in per share dividend rates generally result from the relative weightings of pro rata income and realized gain allocations and from differences in separate class expenses, including distribution, shareholder servicing and administration fees.
| | | | |
| 50 | | Wells Fargo Advantage Municipal Bond Fund | | Notes to Financial Statements (Unaudited) |
3. FAIR VALUATION MEASUREMENTS
Fair value measurements of investments are determined within a framework that has established a fair value hierarchy based upon the various data inputs utilized in determining the value of the Fund’s investments. The three-level hierarchy gives the highest priority to unadjusted quoted prices in active markets for identical assets or liabilities (Level 1) and the lowest priority to significant unobservable inputs (Level 3). The Fund’s investments are classified within the fair value hierarchy based on the lowest level of input that is significant to the fair value measurement. The inputs are summarized into three broad levels as follows:
| n | | Level 1 – quoted prices in active markets for identical securities |
| n | | Level 2 – other significant observable inputs (including quoted prices for similar securities, interest rates, prepayment speeds, credit risk, etc.) |
| n | | Level 3 – significant unobservable inputs (including the Fund’s own assumptions in determining the fair value of investments) |
The inputs or methodologies used for valuing securities are not necessarily an indication of the risk associated with investing in those securities.
As of December 31, 2011, the inputs used in valuing the Fund’s assets, which are carried at fair value, were as follows:
| | | | | | | | | | | | | | | | |
| Investments in Securities | | Quoted Prices (Level 1) | | | Significant Other
Observable Inputs (Level 2) | | | Significant Unobservable Inputs (Level 3) | | | Total | |
Municipal bonds and notes | | $ | 0 | | | $ | 2,353,103,113 | | | $ | 29,040,412 | | | $ | 2,382,143,525 | |
| | | | |
Short-term investments | | | | | | | | | | | | | | | | |
Investment companies | | | 9,112,265 | | | | 0 | | | | 0 | | | | 9,112,265 | |
U.S. Treasury securities | | | 3,499,874 | | | | 0 | | | | 0 | | | | 3,499,874 | |
| | | $ | 12,612,139 | | | $ | 2,353,103,113 | | | $ | 29,040,412 | | | $ | 2,394,755,664 | |
Further details on the major security types listed above can be found in the Portfolio of Investments.
As of December 31, 2011, the inputs used in valuing the Fund’s other financial instruments, which are carried at fair value, were as follows:
| | | | | | | | | | | | | | | | |
| Other Financial Instruments | | Quoted Prices (Level 1) | | | Significant Other
Observable Inputs (Level 2) | | | Significant Unobservable Inputs (Level 3) | | | Total | |
Futures contracts+ | | $ | (1,276,369 | ) | | $ | 0 | | | $ | 0 | | | $ | (1,276,369 | ) |
| + | Futures contracts are presented at the unrealized gains or losses on the instrument. |
Transfers in and transfers out are recognized at the end of the reporting period. For the six months ended December 31, 2011, the Fund did not have any significant transfers into/out of Level 1 and Level 2.
| | | | | | |
| Notes to Financial Statements (Unaudited) | | Wells Fargo Advantage Municipal Bond Fund | | | 51 | |
The following is a reconciliation of assets in which significant unobservable inputs (Level 3) were used in determining fair value:
| | | | |
| | | Municipal
bonds and
notes | |
Balance as of June 30, 2011 | | $ | 23,633,772 | |
Accrued discounts (premiums) | | | 143,495 | |
Realized gains (losses) | | | 250,078 | |
Change in unrealized gains (losses) | | | (1,435,620 | ) |
Purchases | | | 9,735,750 | |
Sales | | | (3,287,063 | ) |
Transfers into Level 3 | | | 0 | |
Transfers out of Level 3 | | | 0 | |
Balance as of December 31, 2011 | | $ | 29,040,412 | |
Change in unrealized gains (losses)
relating to securities still held at December 31, 2011 | | $ | (1,435,620 | ) |
4. TRANSACTIONS WITH AFFILIATES AND OTHER EXPENSES
Advisory fee
The Trust has entered into an advisory contract with Wells Fargo Funds Management, LLC (“Funds Management”), an indirect wholly owned subsidiary of Wells Fargo & Company (“Wells Fargo”). The adviser is responsible for implementing investment policies and guidelines and for supervising the sub-adviser, who is responsible for day-to-day portfolio management of the Fund.
Pursuant to the contract, Funds Management is entitled to receive an annual advisory fee starting at 0.35% and declining to 0.25% as the average daily net assets of the Fund increase. For the six months ended December 31, 2011, the advisory fee was equivalent to an annual rate of 0.32% of the Fund’s average daily net assets.
Funds Management may retain the services of certain sub-advisers to provide daily portfolio management to the Fund. The fees related to sub-advisory services are borne directly by Funds Management and do not increase the overall fees paid by the Fund. Wells Capital Management Incorporated, an affiliate of Funds Management, is the sub-adviser to the Fund and is entitled to receive a fee from Funds Management at an annual rate starting at 0.20% and declining to 0.10% as the average daily net assets of the Fund increase.
Administration and transfer agent fees
The Trust has entered into an administration agreement with Funds Management. Under this agreement, for providing administrative services, which includes paying fees and expenses for services provided by the transfer agent, sub-transfer agents, omnibus account servicers and record-keepers, Funds Management is entitled to receive from the Fund an annual fund level administration fee starting at 0.05% and declining to 0.03% as the average daily net assets of the Fund increase and a class level administration fee which is calculated based on the average daily net assets of each class as follows:
| | | | |
| | | Class Level Administration Fee | |
Class A, Class B, Class C | | | 0.16 | % |
Administrator Class | | | 0.10 | |
Institutional Class | | | 0.08 | |
Investor Class | | | 0.19 | |
Funds Management has contractually waived and/or reimbursed advisory and administration fees to the extent necessary to maintain certain net operating expense ratios for the Fund. Waiver of fees and/or reimbursement of expenses by Funds Management were made first from fund level expenses on a proportionate basis and then from class specific expenses.
| | | | |
| 52 | | Wells Fargo Advantage Municipal Bond Fund | | Notes to Financial Statements (Unaudited) |
Distribution fees
The Trust has adopted a Distribution Plan for Class B, Class C shares of the Fund pursuant to Rule 12b-1 under the 1940 Act. Distribution fees are charged to Class B, Class C shares and paid to Wells Fargo Funds Distributor, LLC, the principal underwriter, at an annual rate of 0.75% of the average daily net assets of Class B and Class C shares.
For the six months ended December 31, 2011, Wells Fargo Funds Distributor, LLC received $77,155 from the sale of Class A shares and $9,861 and $2,548 in contingent deferred sales charges from redemptions of Class B and Class C shares, respectively.
Shareholder servicing fees
The Trust has entered into contracts with one or more shareholder servicing agents, whereby Class A, Class B, Class C, Administrator Class and Investor Class of the Fund is charged a fee at an annual rate of 0.25% of the average daily net assets of each respective class.
A portion of these total shareholder servicing fees were paid to affiliates of Wells Fargo.
5. INVESTMENT PORTFOLIO TRANSACTIONS
Purchases and sales of investments, excluding U.S. Government obligations (if any) and short-term securities (securities with maturities of one year or less at purchase date), for the six months ended December 31, 2011 were $498,649,183 and $680,382,653, respectively.
6. DERIVATIVE TRANSACTIONS
During the six months ended December 31, 2011, the Fund entered into futures contracts to take advantage of the differences between municipal and treasury yields and to help shorten duration of the portfolio.
At December 31, 2011, the Fund had short futures contracts outstanding as follows:
| | | | | | | | | | | | |
| Expiration Date | | Contracts | | Type | | Contract
Value at December 31, 2011 | | | Net Unrealized
Gains
(Losses) | |
March 2012 | | 750 Short | | 10-Year U.S. Treasury Notes | | $ | 98,343,750 | | | $ | (886,190 | ) |
March 2012 | | 1,048 Short | | 30-Year U.S. Treasury Bonds | | | 151,763,500 | | | | (390,179 | ) |
The Fund had an average notional amount of $180,476,324 in short futures contracts during the six months ended December 31, 2011.
On December 31, 2011, the cumulative unrealized losses on futures contracts in the amount of $1,276,369 is reflected in net unrealized gains on investments on the Statement of Assets and Liabilities. The payable for daily variation margin on open futures contracts reflected in the Statement of Assets and Liabilities only represents the current day’s variation margin. The realized losses and change in unrealized gains (losses) on futures contracts are reflected in the Statement of Operations.
7. ACQUISITIONS
After the close of business on July 9, 2010, the Fund acquired the net assets of Evergreen High Income Municipal Bond Fund and Evergreen Municipal Bond Fund. The purpose of the transactions was to combine three funds with similar investment objectives and strategies. The acquisitions were accomplished by a tax-free exchange of all of the shares of Evergreen High Income Municipal Bond Fund and Evergreen Municipal Bond Fund. Shareholders holding Class A, Class B and Class C shares of Evergreen High Income Municipal Bond Fund and Evergreen Municipal Bond Fund received Class A, Class B and Class C shares, respectively, of the Fund in the reorganizations. Class I shares of Evergreen High Income Municipal Bond Fund received Administrator Class shares of the Fund. Class I shares of Evergreen Municipal Bond Fund received Institutional Class shares of the Fund. The investment portfolio of Evergreen High Income Municipal Bond Fund and Evergreen Municipal Bond Fund with fair values of $145,927,536 and $1,295,221,490, respectively, and identified costs of $159,171,399 and $1,255,268,128, respectively, at July 9, 2010, were the principal assets acquired by the Fund. For financial reporting purposes, assets received and shares issued by the Fund were recorded at fair value; however, the cost basis of the investments received from Evergreen High Income Municipal Bond Fund and Evergreen Municipal Bond Fund were carried forward to align ongoing reporting of the Fund’s realized and unrealized gains and losses with
| | | | | | |
| Notes to Financial Statements (Unaudited) | | Wells Fargo Advantage Municipal Bond Fund | | | 53 | |
amounts distributable to shareholders for tax purposes. The value of net assets acquired, unrealized appreciation acquired, exchange ratio and number of shares issued were as follows:
| | | | | | | | | | | | | | | | | | |
| Acquired Fund | | Value of Net
Assets Acquired | | | Unrealized
Gains (Losses) | | | Exchange
Ratio | | | Number of Shares Issued |
Evergreen High Income Municipal Bond Fund | | $ | 147,746,775 | | | $ | (13,243,864 | ) | | | 0.80 | | | | 11,451,915 | | | Class A |
| | | | | | | | | | | 0.80 | | | | 1,074,850 | | | Class B |
| | | | | | | | | | | 0.80 | | | | 1,918,914 | | | Class C |
| | | | | | | | | | | 0.80 | | | | 1,039,978 | | | Administrator Class |
| | | | | |
Evergreen Municipal Bond Fund | | | 1,307,028,090 | | | | 39,953,362 | | | | 0.77 | | | | 86,588,159 | | | Class A |
| | | | | | | | | | | 0.77 | | | | 3,257,157 | | | Class B |
| | | | | | | | | | | 0.77 | | | | 7,239,635 | | | Class C |
| | | | | | | | | | | 0.77 | | | | 39,905,138 | | | Institutional Class |
The aggregate net assets of the Fund immediately before and after the acquisitions were $952,402,812 and $2,407,177,677, respectively.
Assuming the acquisitions had been completed July 1, 2010, the beginning of the annual reporting period for the Fund, the pro forma results of operations for the year ended June 30, 2011 would have been:
| | | | |
Net investment income | | $ | 113,779,200 | |
Net realized and unrealized gains (losses) on investments | | $ | 20,446,621 | |
Net increase in net assets resulting from operations | | $ | 134,225,821 | |
8. BORROWINGS
The Trust (excluding the money market funds) and Wells Fargo Variable Trust are parties to a $150,000,000 revolving credit agreement with State Street Bank and Trust Company, whereby the Fund is permitted to use bank borrowings for temporary or emergency purposes, such as to fund shareholder redemption requests. Interest under the credit agreement is charged to the Fund based on a borrowing rate equal to the higher of the Federal Funds rate in effect on that day plus 1.25% or the overnight LIBOR rate in effect on that day plus 1.25%. In addition, under the credit agreement, the Fund pays an annual commitment fee equal to 0.10% of the unused balance, which is allocated pro rata. Prior to September 6, 2011, the revolving credit agreement was for $125,000,000 and the annual commitment fee paid by the Fund was 0.125% of the unused balance. For the six months ended December 31, 2011, the Fund paid $1,804 in commitment fees.
For the six months ended December 31, 2011, there were no borrowings by the Fund under the agreement.
During the six months ended December 31, 2011, the Fund held Floating-Rate Notes that had an average daily balance outstanding of $12,525,000 (on an annualized basis) and incurred interest and fee expense in the amount of $72,110.
At December 31, 2011, the Fund had the following Floating-Rate Notes outstanding:
| | | | | | | | |
Floating-Rate Notes | | Collateral for
Floating-Rate Notes
Outstanding | | Rate of
Interest
Expense |
Amount
Outstanding | | Maturity Date | | Interest
Rate | | |
| $7,500,000 | | 12/01/2013 | | 8.53% | | $15,000,000 | | 4.78% |
| $5,025,000 | | 10/01/2016 | | 10.50% | | $10,050,000 | | 4.00% |
9. INDEMNIFICATION
Under the Trust’s organizational documents, the officers and directors are indemnified against certain liabilities that may arise out of performance of their duties to the Trust. Additionally, in the normal course of business, the Trust may enter into contracts with service providers that contain a variety of indemnification clauses. The Trust’s maximum exposure under these arrangements is dependent on future claims that may be made against the Fund and, therefore, cannot be estimated.
| | | | |
| 54 | | Wells Fargo Advantage Municipal Bond Fund | | Notes to Financial Statements (Unaudited) |
10. NEW ACCOUNTING PRONOUNCEMENTS
In May 2011, the Financial Accounting Standards Board (“FASB”) issued Accounting Standards Update (“ASU”) No. 2011-04 “Amendments to Achieve Common Fair Value Measurement and Disclosure Requirements in U.S. GAAP and IFRSs”. ASU No. 2011-04 amends FASB ASC Topic 820, Fair Value Measurements and Disclosures, to establish common requirements for measuring fair value and for disclosing information about fair value measurements in accordance with GAAP. The ASU is effective prospectively for interim and annual periods beginning after December 15, 2011. Management expects that adoption of the ASU will result in additional disclosures in the financial statements, as applicable.
In April 2011, FASB issued ASU No. 2011-03 “Reconsideration of Effective Control for Repurchase Agreements”. ASU No. 2011-03 amends FASB ASC Topic 860, Transfers and Servicing, specifically the criteria required to determine whether a repurchase agreement (repo) and similar agreements should be accounted for as sales of financial assets or secured borrowings with commitments. ASU No. 2011-03 changes the assessment of effective control by focusing on the transferor’s contractual rights and obligations and removing the criterion to assess its ability to exercise those rights or honor those obligations. This could result in changes to the way entities account for certain transactions including repurchase agreements, mortgage dollar rolls and reverse repurchase agreements. The ASU will become effective on a prospective basis for new transfers and modifications to existing transactions as of the beginning of the first interim or annual period beginning on or after December 15, 2011. Management has evaluated the impact of adopting the ASU and expects no significant changes.
| | | | | | |
| Other Information (Unaudited) | | Wells Fargo Advantage Municipal Bond Fund | | | 55 | |
PROXY VOTING INFORMATION
A description of the policies and procedures that the Fund uses to determine how to vote proxies relating to portfolio securities is available without charge, upon request, by calling 1-800-222-8222, visiting our Web site at www.wellsfargo.com/advantagefunds, or visiting the SEC Web site at www.sec.gov. Information regarding how the Fund voted proxies relating to portfolio securities during the most recent 12-month period ended June 30 is available without charge on the Fund’s Web site at www.wellsfargo.com/advantagefunds or by visiting the SEC Web site at www.sec.gov.
PORTFOLIO HOLDINGS INFORMATION
The complete portfolio holdings for the Fund are publicly available on the Fund’s Web site (www.wellsfargo.com/advantagefunds) on a monthly, 30-day or more delayed basis. In addition, top ten holdings information for the Fund is publicly available on the Fund’s Web site on a monthly, seven-day or more delayed basis. The Fund files its complete schedule of portfolio holdings with the SEC for the first and third quarters of each fiscal year on Form N-Q, which is available without charge by visiting the SEC Web site at www.sec.gov. In addition, the Fund’s Form N-Q may be reviewed and copied at the SEC’s Public Reference Room in Washington, DC, and at regional offices in New York City, at 233 Broadway, and in Chicago, at 175 West Jackson Boulevard, Suite 900. Information about the Public Reference Room may be obtained by calling 1-800-SEC-0330.
| | | | |
| 56 | | Wells Fargo Advantage Municipal Bond Fund | | Other Information (Unaudited) |
BOARD OF TRUSTEES
The following table provides basic information about the Board of Trustees (the “Trustees”) of the Trust and Officers of the Trust. This table should be read in conjunction with the Prospectus and the Statement of Additional Information1 of the Fund. Each of the Trustees and Officers listed below acts in identical capacities for the Wells Fargo Advantage family of funds, which consists of 138 funds comprising the Wells Fargo Funds Trust, Wells Fargo Variable Trust, Wells Fargo Master Trust and four closed-end funds (collectively the “Fund Complex”). All of the Trustees are also Members of the Audit and Governance Committees of each Trust in the Fund Complex. The mailing address of each Trustee and Officer is 525 Market Street, 12th Floor, San Francisco, CA 94105. Each Trustee and Officer serves an indefinite term, however, each Trustee serves such term until reaching the mandatory retirement age established by the Trustees.
Independent Trustees
| | | | | | |
Name and Year of Birth | | Position Held and Length of Service | | Principal Occupations During Past Five Years | | Other Directorships During
Past Five Years |
Peter G. Gordon
(Born 1942) | | Trustee, since 1998; Chairman, since 2005 (Lead Trustee since 2001) | | Co-Founder, Retired Chairman, President and CEO of Crystal Geyser Water Company. Trustee Emeritus, Colby College | | Asset Allocation Trust |
Isaiah Harris, Jr.
(Born 1952) | | Trustee, since 2009 | | Retired. Prior thereto, President and CEO of BellSouth Advertising and Publishing Corp. from 2005 to 2007, President and CEO of BellSouth Enterprises from 2004 to 2005 and President of BellSouth Consumer Services from 2000 to 2003. Emeritus member of the Iowa State University Foundation Board of Governors. Emeritus Member of the Advisory Board of Iowa State University School of Business. Mr. Harris is a certified public accountant. | | CIGNA Corporation; Deluxe Corporation; Asset Allocation Trust |
Judith M. Johnson
(Born 1949) | | Trustee, since 2008 | | Retired. Prior thereto, Chief Executive Officer and Chief Investment Officer of Minneapolis Employees Retirement Fund from 1996 to 2008. Ms. Johnson is an attorney, certified public accountant and a certified managerial accountant. | | Asset Allocation Trust |
Leroy Keith, Jr.
(Born 1939) | | Trustee, since 2010 | | Chairman, Bloc Global Services (development and construction). Trustee of the Evergreen Funds from 1983 to 2010. Former Managing Director, Almanac Capital Management (commodities firm), former Partner, Stonington Partners, Inc. (private equity fund), former Director, Obagi Medical Products Co. and former Director, Lincoln Educational Services. | | Trustee, Virtus Fund Complex (consisting of 40 portfolios as of 12/31/11); Asset Allocation Trust |
David F. Larcker
(Born 1950) | | Trustee, since 2009 | | James Irvin Miller Professor of Accounting at the Graduate School of Business, Stanford University, Director of Corporate Governance Research Program and Senior Faculty of The Rock Center for Corporate Governance since 2006. From 2005 to 2008, Professor of Accounting at the Graduate School of Business, Stanford University. Prior thereto, Ernst & Young Professor of Accounting at The Wharton School, University of Pennsylvania from 1985 to 2005. | | Asset Allocation Trust |
Olivia S. Mitchell
(Born 1953) | | Trustee, since 2006 | | International Foundation of Employee Benefit Plans Professor, Wharton School of the University of Pennsylvania since 1993. Director of Wharton’s Pension Research Council and Boettner Center on Pensions & Retirement Research, and Research Associate at the National Bureau of Economic Research. Previously, Cornell University Professor from 1978 to 1993. | | Asset Allocation Trust |
| | | | | | |
| Other Information (Unaudited) | | Wells Fargo Advantage Municipal Bond Fund | | | 57 | |
| | | | | | |
Name and Year of Birth | | Position Held and Length of Service | | Principal Occupations During Past Five Years | | Other Directorships During
Past Five Years |
Timothy J. Penny
(Born 1951) | | Trustee, since 1996 | | President and CEO of Southern Minnesota Initiative Foundation, a non-profit organization, since 2007 and Senior Fellow at the Humphrey Institute Policy Forum at the University of Minnesota since 1995. Member of the Board of Trustees of NorthStar Education Finance, Inc., a non-profit organization, since 2007. | | Asset Allocation Trust |
Michael S. Scofield
(Born 1943) | | Trustee, since 2010 | | Served on the Investment Company Institute’s Board of Governors and Executive Committee from 2008-2011 as well the Governing Council of the Independent Directors Council from 2006-2011 and the Independent Directors Council Executive Committee from 2008-2011. Chairman of the IDC from 2008-2010. Institutional Investor (Fund Directions) Trustee of Year in 2007. Trustee of the Evergreen Funds (and its predecessors) from 1984 to 2010. Chairman of the Evergreen Funds from 2000-2010. Former Trustee of the Mentor Funds. Retired Attorney, Law Offices of Michael S. Scofield and former Director and Chairman, Branded Media Corporation (multi-media branding company). | | Asset Allocation Trust |
Donald C. Willeke
(Born 1940) | | Trustee, since 1996 | | Principal of the law firm of Willeke & Daniels. General Counsel of the Minneapolis Employees Retirement Fund from 1984 until its consolidation into the Minnesota Public Employees Retirement Association on June 30, 2010. Director and Vice Chair of The Free Trust (non-profit corporation). Director of the American Chestnut Foundation (non-profit corporation). | | Asset Allocation Trust |
Officers
| | | | | | |
Name and Year of Birth | | Position Held and
Length of Service | | Principal Occupations During Past Five Years | | |
Karla M. Rabusch
(Born 1959) | | President, since 2003 | | Executive Vice President of Wells Fargo Bank, N.A. and President of Wells Fargo Funds Management, LLC since 2003. Senior Vice President and Chief Administrative Officer of Wells Fargo Funds Management, LLC from 2001 to 2003. | | |
C. David Messman
(Born 1960) | | Secretary, since 2000; Chief Legal Counsel, since 2003 | | Senior Vice President and Secretary of Wells Fargo Funds Management, LLC since 2001. Vice President and Managing Senior Counsel of Wells Fargo Bank, N.A. since 1996. | | |
Kasey Phillips
(Born 1970) | | Treasurer, since 2009 | | Senior Vice President of Wells Fargo Funds Management, LLC since 2009. Senior Vice President of Evergreen Investment Management Company, LLC from 2006 to 2010. Treasurer of the Evergreen Funds from 2005 to 2010. | | |
David Berardi
(Born 1975) | | Assistant Treasurer, since 2009 | | Vice President of Wells Fargo Funds Management, LLC since 2009. Vice President of Evergreen Investment Management Company, LLC from 2008 to 2010. Assistant Vice President of Evergreen Investment Services, Inc. from 2004 to 2008. Manager of Fund Reporting and Control for Evergreen Investment Management Company, LLC from 2004 to 2010. | | |
Jeremy DePalma
(Born 1974) | | Assistant Treasurer, since 2009 | | Senior Vice President of Wells Fargo Funds Management, LLC since 2009. Senior Vice President of Evergreen Investment Management Company, LLC from 2008 to 2010. Vice President, Evergreen Investment Services, Inc. from 2004 to 2007. Head of the Fund Reporting and Control Team within Fund Administration from 2005 to 2010. | | |
Debra Ann Early
(Born 1964) | | Chief Compliance Officer, since 2007 | | Chief Compliance Officer of Wells Fargo Funds Management, LLC since 2007. Chief Compliance Officer of Parnassus Investments from 2005 to 2007. Chief Financial Officer of Parnassus Investments from 2004 to 2007 and Senior Audit Manager of PricewaterhouseCoopers LLP from 1998 to 2004. | | |
| 1. | The Statement of Additional Information includes additional information about the Trustees and is available, without charge, upon request, by calling 1-800-222-8222 or by visiting the Web site at www.wellsfargo.com/advantagefunds. |
| | | | |
| 58 | | Wells Fargo Advantage Municipal Bond Fund | | List of Abbreviations |
The following is a list of common abbreviations for terms and entities which may have appeared in this report.
| ACB | — Agricultural Credit Bank |
| ADR | — American Depository Receipt |
| ADS | — American Depository Shares |
| AGC-ICC | — Assured Guaranty Corporation - Insured Custody Certificates |
| AGM | — Assured Guaranty Municipal |
| AMBAC | — American Municipal Bond Assurance Corporation |
| AMT | — Alternative Minimum Tax |
| BAN | — Bond Anticipation Notes |
| BHAC | — Berkshire Hathaway Assurance Corporation |
| CAB | — Capital Appreciation Bond |
| CCAB | — Convertible Capital Appreciation Bond |
| CDA | — Community Development Authority |
| CDO | — Collateralized Debt Obligation |
| COP | — Certificate of Participation |
| DRIVER | — Derivative Inverse Tax-Exempt Receipts |
| DW&P | — Department of Water & Power |
| DWR | — Department of Water Resources |
| ECFA | — Educational & Cultural Facilities Authority |
| EDA | — Economic Development Authority |
| EDFA | — Economic Development Finance Authority |
| ETF | — Exchange-Traded Fund |
| FFCB | — Federal Farm Credit Bank |
| FGIC | — Financial Guaranty Insurance Corporation |
| FHA | — Federal Housing Authority |
| FHLB | — Federal Home Loan Bank |
| FHLMC | — Federal Home Loan Mortgage Corporation |
| FNMA | — Federal National Mortgage Association |
| GDR | — Global Depository Receipt |
| GNMA | — Government National Mortgage Association |
| HCFR | — Healthcare Facilities Revenue |
| HEFA | — Health & Educational Facilities Authority |
| HEFAR | — Higher Education Facilities Authority Revenue |
| HFA | — Housing Finance Authority |
| HFFA | — Health Facilities Financing Authority |
| IBC | — Insured Bond Certificate |
| IDA | — Industrial Development Authority |
| IDAG | — Industrial Development Agency |
| IDR | — Industrial Development Revenue |
| KRW | — Republic of Korea Won |
| LIBOR | — London Interbank Offered Rate |
| LLC | — Limited Liability Company |
| LLP | — Limited Liability Partnership |
| MBIA | — Municipal Bond Insurance Association |
| MFHR | — Multi-Family Housing Revenue |
| MUD | — Municipal Utility District |
| NATL-RE | — National Public Finance Guarantee Corporation |
| PCFA | — Pollution Control Finance Authority |
| PCR | — Pollution Control Revenue |
| PFA | — Public Finance Authority |
| PFFA | — Public Facilities Financing Authority |
| PFOTER | — Puttable Floating Option Tax-Exempt Receipts |
| plc | — Public Limited Company |
| PUTTER | — Puttable Tax-Exempt Receipts |
| R&D | — Research & Development |
| RDA | — Redevelopment Authority |
| RDFA | — Redevelopment Finance Authority |
| REIT | — Real Estate Investment Trust |
| ROC | — Reset Option Certificates |
| SAVRS | — Select Auction Variable Rate Securities |
| SBA | — Small Business Authority |
| SFHR | — Single Family Housing Revenue |
| SFMR | — Single Family Mortgage Revenue |
| SPDR | — Standard & Poor’s Depositary Receipts |
| TAN | — Tax Anticipation Notes |
| TIPS | — Treasury Inflation-Protected Securities |
| TRAN | — Tax Revenue Anticipation Notes |
| TCR | — Transferable Custody Receipts |
| TTFA | — Transportation Trust Fund Authority |
| TVA | — Tennessee Valley Authority |
| XLCA | — XL Capital Assurance |


FOR MORE INFORMATION
More information about Wells Fargo Advantage Funds is available free upon request. To obtain literature, please write, e-mail, visit the Fund’s Web site, or call:
Wells Fargo Advantage Funds
P.O. Box 8266
Boston, MA 02266-8266
E-mail: wfaf@wellsfargo.com
Web site: www.wellsfargo.com/advantagefunds
Individual investors: 1-800-222-8222
Retail investment professionals: 1-888-877-9275
Institutional investment professionals: 1-866-765-0778
This report and the financial statements contained herein are submitted for the general information of the shareholders of Wells Fargo Advantage Funds. If this report is used for promotional purposes, distribution of the report must be accompanied or preceded by a current prospectus. For a prospectus containing more complete information, including charges and expenses, call 1-800-222-8222 or visit the Fund’s Web site at www.wellsfargo.com/advantagefunds. Please consider the investment objectives, risks, charges, and expenses of the investment carefully before investing. This and other information about Wells Fargo Advantage Funds can be found in the current prospectus. Read the prospectus carefully before you invest or send money.
Wells Fargo Funds Management, LLC, a wholly owned subsidiary of Wells Fargo & Company, provides investment advisory and administrative services for Wells Fargo Advantage Funds. Other affiliates of Wells Fargo & Company provide subadvisory and other services for the Funds. The Funds are distributed by Wells Fargo Funds Distributor, LLC, Member FINRA/SIPC, an affiliate of Wells Fargo & Company.
NOT FDIC INSURED ¡ NO BANK GUARANTEE ¡ MAY LOSE VALUE
© 2012 Wells Fargo Funds Management, LLC. All rights reserved.
| | |
 | | 207587 02-12 SA253/SAR253 12-11 |

Wells Fargo Advantage North Carolina Tax-Free Fund

Semi-Annual Report
December 31, 2011

Reduce clutter. Save trees.
Sign up for electronic delivery of prospectuses and shareholder reports at www.wellsfargo.com/advantagedelivery
Contents
The views expressed and any forward-looking statements are as of December 31, 2011, unless otherwise noted, and are those of the Fund managers and/or Wells Fargo Funds Management, LLC. Discussions of individual securities, or the markets generally, or any Wells Fargo Advantage Fund are not intended as individual recommendations. Future events or results may vary significantly from those expressed in any forward-looking statements; the views expressed are subject to change at any time in response to changing circumstances in the market. Wells Fargo Funds Management, LLC, disclaims any obligation to publicly update or revise any views expressed or forward-looking statements.
NOT FDIC INSURED ¡ NO BANK GUARANTEE ¡ MAY LOSE VALUE

WELLS FARGO INVESTMENT HISTORY
| | |
| |
| 1932 | | Keystone creates one of the first mutual fund families. |
| |
| 1971 | | Wells Fargo & Company introduces one of the first institutional index funds. |
| |
| 1978 | | Wells Fargo applies Markowitz and Sharpe’s research on Modern Portfolio Theory to introduce one of the industry’s first Tactical Asset Allocation (TAA) models in institutional separately managed accounts. |
| |
| 1984 | | Wells Fargo Stagecoach Funds launches its first asset allocation fund. |
| |
| 1989 | | The Tactical Asset Allocation (TAA) Model is first applied to Wells Fargo’s asset allocation mutual funds. |
| |
| 1994 | | Wells Fargo introduces the LifePath Funds, one of the first suites of target date funds (now the Wells Fargo Advantage Dow Jones Target Date FundsSM ). |
| |
| 1996 | | Evergreen Investments and Keystone Funds merge. |
| |
| 1997 | | Wells Fargo launches Wells Fargo Advantage WealthBuilder PortfoliosSM, a fund-of-funds suite of products that includes the use of quantitative models to shift assets among investment styles. |
| |
| 1999 | | Norwest Advantage Funds and Stagecoach Funds are reorganized into Wells Fargo Funds after the merger of Norwest and Wells Fargo. |
| |
| 2002 | | Evergreen Retail and Evergreen Institutional companies form the umbrella asset management company, Evergreen Investments. |
| |
| 2005 | | The integration of Strong Funds with Wells Fargo Funds creates Wells Fargo Advantage Funds, resulting in one of the top 20 mutual fund companies in the United States. |
| |
| 2006 | | Wells Fargo Advantage Funds relaunches the target date product line as Wells Fargo Advantage Dow Jones Target Date Funds. |
| |
| 2010 | | The mergers and reorganizations of Evergreen and Wells Fargo Advantage mutual funds are completed, unifying the families under the brand of Wells Fargo Advantage Funds. |
Wells Fargo Advantage Funds®
Wells Fargo Advantage Funds skillfully guides institutions, financial advisors, and individuals through the investment terrain to help them reach their financial objectives. Everything we do on behalf of investors is backed by our unique combination of qualifications.
Strength
Our organization is built on the standards of integrity and service established by our parent company—Wells Fargo & Company—more than 150 years ago. And, because we’re part of a highly diversified financial enterprise, we offer the depth of resources to help investors succeed.
Expertise
Our multi-boutique model offers investors access to the independent thinking of premier investment managers that have been chosen for their time-tested strategies. While each team specializes in a specific investment strategy, collectively they provide investors a wide choice of distinct investment styles. Our dedication to investment excellence doesn’t end with our expertise in manager selection—risk management, analysis, and rigorous ongoing review seek to ensure each manager’s investment process remains consistent.
Partnership
Our collaborative approach is built around understanding the needs and goals of our clients. By adhering to core principles of sound judgment and steady guidance, we support you through every stage of the investment decision process.
Carefully consider a fund’s investment objectives, risks, charges, and expenses before investing. For a current prospectus and, if available, a summary prospectus, containing this and other information, visit wellsfargo.com/advantagefunds. Read it carefully before investing.
Wells Fargo Funds Management, LLC, a wholly owned subsidiary of Wells Fargo & Company, provides investment advisory and administrative services for Wells Fargo Advantage Funds®. Other affiliates of Wells Fargo & Company provide subadvisory and other services for the Funds. The Funds are distributed by Wells Fargo Funds Distributor, LLC, Member FINRA/SIPC, an affiliate of Wells Fargo & Company.
“Dow Jones®” and “Dow Jones Target Date IndexesSM” are service marks of Dow Jones Trademark Holdings, LLC (“Dow Jones”), have been licensed to CME Group Index Services LLC (“CME Indexes”) and have been sublicensed for use for certain purposes by Global Index Advisors, Inc, and Wells Fargo Funds Management, LLC. The Wells Fargo Advantage Dow Jones Target Date FundsSM based on the Dow Jones Target Date IndexesSM, are not sponsored, endorsed, sold or promoted by Dow Jones, CME Indexes or their respective affiliates and none of them makes any representation regarding the advisability of investing in such product(s).
NOT FDIC INSURED ¡ NO BANK GUARANTEE ¡ MAY LOSE VALUE
Not part of the semi-annual report.
Wells Fargo Advantage Funds offers more than 110 mutual funds across a wide range of asset classes, representing over $216 billion in assets under management, as of December 31, 2011.
| | | | |
| Equity Funds | | | | |
Asia Pacific Fund | | Global Opportunities Fund | | Premier Large Company Growth Fund |
C&B Large Cap Value Fund | | Growth Fund | | Small Cap Opportunities Fund |
C&B Mid Cap Value Fund | | Health Care Fund | | Small Cap Value Fund |
Capital Growth Fund | | Index Fund | | Small Company Growth Fund |
Common Stock Fund | | International Equity Fund | | Small Company Value Fund |
Disciplined U.S. Core Fund | | International Value Fund | | Small/Mid Cap Core Fund |
Discovery Fund† | | Intrinsic Small Cap Value Fund | | Small/Mid Cap Value Fund |
Diversified Equity Fund | | Intrinsic Value Fund | | Social Sustainability Fund† |
Diversified International Fund | | Intrinsic World Equity Fund | | Special Mid Cap Value Fund |
Diversified Small Cap Fund | | Large Cap Core Fund | | Special Small Cap Value Fund |
Emerging Growth Fund | | Large Cap Growth Fund | | Specialized Technology Fund |
Emerging Markets Equity Fund | | Large Company Value Fund | | Strategic Large Cap Growth Fund |
Endeavor Select Fund† | | Omega Growth Fund | | Traditional Small Cap Growth Fund |
Enterprise Fund† | | Opportunity Fund† | | Utility and Telecommunications Fund |
Equity Value Fund | | Precious Metals Fund | | |
| Bond Funds | | | | |
Adjustable Rate Government Fund | | Inflation-Protected Bond Fund | | Short-Term Bond Fund |
California Limited-Term Tax-Free Fund | | Intermediate Tax/AMT-Free Fund | | Short-Term High Yield Bond Fund |
California Tax-Free Fund | | International Bond Fund | | Short-Term Municipal Bond Fund |
Colorado Tax-Free Fund | | Minnesota Tax-Free Fund | | Strategic Municipal Bond Fund |
Government Securities Fund | | Municipal Bond Fund | | Total Return Bond Fund |
High Income Fund | | North Carolina Tax-Free Fund | | Ultra Short-Term Income Fund |
High Yield Bond Fund | | Pennsylvania Tax-Free Fund | | Ultra Short-Term Municipal Income Fund |
Income Plus Fund | | Short Duration Government Bond Fund | | Wisconsin Tax-Free Fund |
| Asset Allocation Funds | | | | |
Asset Allocation Fund | | WealthBuilder Equity Portfolio† | | Target 2020 Fund† |
Conservative Allocation Fund | | WealthBuilder Growth Allocation Portfolio† | | Target 2025 Fund† |
Diversified Capital Builder Fund | | WealthBuilder Growth Balanced Portfolio† | | Target 2030 Fund† |
Diversified Income Builder Fund | | WealthBuilder Moderate Balanced Portfolio† | | Target 2035 Fund† |
Growth Balanced Fund | | WealthBuilder Tactical Equity Portfolio† | | Target 2040 Fund† |
Index Asset Allocation Fund | | Target Today Fund† | | Target 2045 Fund† |
Moderate Balanced Fund | | Target 2010 Fund† | | Target 2050 Fund† |
WealthBuilder Conservative Allocation Portfolio† | | Target 2015 Fund† | | Target 2055 Fund† |
| Money Market Funds | | | | |
100% Treasury Money Market Fund | | Heritage Money Market Fund† | | National Tax-Free Money Market Fund |
California Municipal Money Market Fund | | Money Market Fund | | Prime Investment Money Market Fund |
Cash Investment Money Market Fund | | Municipal Cash Management Money Market Fund | | Treasury Plus Money Market Fund |
Government Money Market Fund | | Municipal Money Market Fund | | |
| Variable Trust Funds1 | | | | |
VT Discovery Fund† | | VT Intrinsic Value Fund | | VT Small Cap Growth Fund |
VT Index Asset Allocation Fund | | VT Omega Growth Fund | | VT Small Cap Value Fund |
VT International Equity Fund | | VT Opportunity Fund† | | VT Total Return Bond Fund |
An investment in a money market fund is not insured or guaranteed by the Federal Deposit Insurance Corporation or any other government agency. Although the Wells Fargo Advantage Money Market Funds seek to preserve the value of your investment at $1.00 per share, it is possible to lose money by investing in a money market fund.
| 1. | The Variable Trust Funds are generally available only through insurance company variable contracts. |
| † | In this report, the Wells Fargo Advantage Discovery FundSM, Wells Fargo Advantage Endeavor Select FundSM, Wells Fargo Advantage Enterprise FundSM, Wells Fargo Advantage Opportunity FundSM, Wells Fargo Advantage Social Sustainability FundSM, Wells Fargo Advantage WealthBuilder Conservative Allocation PortfolioSM, Wells Fargo Advantage WealthBuilder Equity PortfolioSM, Wells Fargo Advantage WealthBuilder Growth Allocation PortfolioSM, Wells Fargo Advantage WealthBuilder Growth Balanced PortfolioSM, Wells Fargo Advantage WealthBuilder Moderate Balanced PortfolioSM, Wells Fargo Advantage WealthBuilder Tactical Equity PortfolioSM, Wells Fargo Advantage Dow Jones Target Today FundSM, Wells Fargo Advantage Dow Jones Target 2010 FundSM, Wells Fargo Advantage Dow Jones Target 2015 FundSM, Wells Fargo Advantage Dow Jones Target 2020 FundSM, Wells Fargo Advantage Dow Jones Target 2025 FundSM, Wells Fargo Advantage Dow Jones Target 2030 FundSM, Wells Fargo Advantage Dow Jones Target 2035 FundSM, Wells Fargo Advantage Dow Jones Target 2040 FundSM, Wells Fargo Advantage Dow Jones Target 2045 FundSM, Wells Fargo Advantage Dow Jones Target 2050 FundSM, Wells Fargo Advantage Dow Jones Target 2055 FundSM, Wells Fargo Advantage Heritage Money Market FundSM, Wells Fargo Advantage VT Discovery FundSM, and Wells Fargo Advantage VT Opportunity FundSM are referred to as the Discovery Fund, Endeavor Select Fund, Enterprise Fund, Opportunity Fund, Social Sustainability Fund, WealthBuilder Conservative Allocation Portfolio, WealthBuilder Equity Portfolio, WealthBuilder Growth Allocation Portfolio, WealthBuilder Growth Balanced Portfolio, WealthBuilder Moderate Balanced Portfolio, WealthBuilder Tactical Equity Portfolio, Target Today Fund, Target 2010 Fund, Target 2015 Fund, Target 2020 Fund, Target 2025 Fund, Target 2030 Fund, Target 2035 Fund, Target 2040 Fund, Target 2045 Fund, Target 2050 Fund, Target 2055 Fund, Heritage Money Market Fund, VT Discovery Fund, and VT Opportunity Fund, respectively. |
Not part of the semi-annual report.
| | | | |
| 2 | | Wells Fargo Advantage North Carolina Tax-Free Fund | | Letter to Shareholders |

Karla M. Rabusch,
President
Wells Fargo Advantage Funds
For the entire six-month period, most of the major fixed-income indexes posted solid positive returns. However, the market’s six-month return figures mask the uneven path that the financial markets traced since the summer as investors had to contend with a variety of global and domestic headwinds.
Dear Valued Shareholder:
We’re pleased to offer you this semi-annual report for the Wells Fargo Advantage North Carolina Tax-Free Fund for the six-month period that ended December 31, 2011. Upon reviewing the report, you may notice a few changes from past reports, the most significant of which is the change from a multi-fund report to a single-fund report. We made this change to make it easier for you to find your fund information.
For the entire six-month period, most of the major fixed-income indexes posted solid positive returns. However, the market’s six-month return figures mask the uneven path that the financial markets traced since the summer as investors had to contend with a variety of global and domestic headwinds. Whatever the future holds, we continue to believe that most investors can benefit from adhering to a well-diversified investment strategy. Over the long-term, such a strategy may allow you to balance risks and opportunities as you pursue your financial goals in a dynamic market landscape.
The economic recovery gained traction as the year progressed.
The U.S. economic recovery that began in mid-2009 has experienced a few slow patches along the way. However, the recovery regained some upward momentum during the six-month period, yet the rate of growth remained subpar compared with most previous recovery cycles.
In September 2011, it was reported that U.S. gross domestic product (GDP) grew at a mere 1.3% annual rate in the second quarter of 2011, following anemic growth at an annual rate of 0.4% in the first quarter. According to the December estimate, GDP growth accelerated to an annual rate of 1.8% in the third quarter, reigniting hopes for a sustainable recovery. Those hopes were buoyed by widespread anticipation of even stronger GDP growth in the fourth quarter. By year-end, few economists believed that the U.S. economy was in danger of sliding back into recession, although many expected a sluggish growth environment in 2012.
The struggling housing and labor markets slowed growth.
As has been the case throughout the recovery, the housing and labor markets continued to restrain economic momentum during 2011.
The beleaguered housing market has arguably exerted the biggest drag on growth. Despite intermittent signs of improvement, ongoing weakness in sales of both new and existing homes has put considerable downward pressure on prices. On the other hand, the labor market took a decided turn for the better during the final months of 2011: initial unemployment claims have eased, and the private sector has been steadily adding jobs. The pace of hiring, while not brisk, was sufficient to push the U.S. unemployment rate down to 8.5% as of December 2011—still well above its historical average but at its lowest level since February 2009. Many observers expect the unemployment rate to decline further in 2012, which could act as a tailwind for consumer spending—widely viewed as one of the keys to long-term economic growth.
The Federal Reserve announced that it will keep rates low until 2013.
Consumers have already demonstrated some resilience in their spending—even in the face of higher energy costs. Oil prices skyrocketed in early 2011 before
| | | | | | |
| Letter to Shareholders | | Wells Fargo Advantage North Carolina Tax-Free Fund | | | 3 | |
retreating later in the year, only to spike again during the fourth quarter. Yet “core” inflation, which excludes volatile energy and food prices, remained fairly benign throughout the year.
With inflation in check, the Federal Reserve (Fed) held its target range for the federal funds rate—a proxy for short-term interest rates—steady at 0% to 0.25%. Following its August 9, 2011 meeting, the Federal Open Market Committee issued a statement explaining that economic conditions were likely to warrant exceptionally low levels for the federal funds rate through at least mid-2013. In September, the Fed launched yet another stimulus program—dubbed “Operation Twist”—that is designed to keep intermediate- and longer-term yields relatively low. The goal with keeping longer-term rates low is to encourage lending activity to spark business investments and home purchases, which, in turn, may provide support for a more sustainable economic recovery.
Market volatility was a dominant theme during the final six-months of the year
Early on in the period, market climate shifted to one of anxiety over the increasingly fragile state of the U.S. and global economies. In addition, investors not only worried that the U.S. might be on the brink of recession, they also feared that Europe’s sovereign debt problems could spiral out of control if a Greek default triggered financial contagion across the continent. In July and August, investor sentiment was further undermined by partisan wrangling over the federal debt ceiling and the downgrade of the U.S. credit rating by Standard & Poor’s. The barrage of unsettling headlines led to heightened market volatility and an increase in risk aversion, which translated into sharply falling stock prices and higher demand for “safer” assets such as Treasuries and municipals in the third quarter of 2011. Although volatility persisted into the fourth quarter, the financial markets were able to rebound amid improved U.S. economic data and hopes for a resolution to the European crisis.
For the entire six-month period, the Barclays Capital U.S. Aggregate Bond Index1, which represents the universe of investment-grade bonds, and the Barclays Capital U.S. Treasury Index2 added 4.98% and 7.43%, respectively. By comparison, the Barclays Capital Municipal Bond Index3 gained 6.02% over the last half of the year
Recent events have not altered our message to shareholders.
The market turmoil of 2011 and an uncertain outlook going forward have left many investors questioning their resolve—and their investments. Yet, it is precisely at such times that the market may present opportunities—as well as challenges—for prudent investors. Bear in mind that many investors who indiscriminately sold their equity investments during the severe market downturn of 2008 to 2009 missed out on the impressive two-year rally that followed. In our
| 1. | The Barclays Capital U.S. Aggregate Bond Index is composed of the Barclays Capital Government/Credit Index and the Mortgage-Backed Securities Index and includes U.S. Treasury issues, agency issues, corporate bond issues, and mortgage-backed securities. You cannot invest directly in an index. |
| 2. | The Barclays Capital U.S. Treasury Index is an index of U.S. Treasury Securities. You cannot invest directly in an index. |
| 3. | The Barclays Capital Municipal Bond Index is an unmanaged index composed of long-term tax-exempt bonds with a minimum credit rating of Baa. You cannot invest directly in an index. |
Although volatility persisted into the fourth quarter, the financial markets were able to rebound amid improved U.S. economic data and hopes for a resolution to the European crisis.
| | | | |
| 4 | | Wells Fargo Advantage North Carolina Tax-Free Fund | | Letter to Shareholders |
opinion, the lesson to be learned from these dramatic market events is that, for
many investors, simply building and maintaining a well-diversified4 investment plan is the best long-term strategy.
Thank you for choosing to invest with Wells Fargo Advantage Funds. We appreciate your confidence in us and remain committed to helping you meet your financial needs. For current information about your fund investments, contact your investment professional, visit our website at www.wellsfargo.com/advantagefunds, or call us directly at 1-800-222-8222. We are available 24 hours a day, 7 days a week.
Sincerely,

Karla M. Rabusch
President
Wells Fargo Advantage Funds
| 4. | Diversification does not assure or guarantee better performance and cannot eliminate the risk of investment losses. |
| | | | | | |
| Letter to Shareholders | | Wells Fargo Advantage North Carolina Tax-Free Fund | | | 5 | |
|
|
Notice to Shareholders Effective April 1, 2012, the Fund may invest up to 10% of its total assets in inverse floaters to seek enhanced returns. Inverse floaters are derivative debt instruments created by depositing a municipal security in a trust. They pay interest at rates that generally vary inversely with specified short-term interest rates. The interest payment received on inverse floaters generally will decrease when specified short-term interest rates increase. Inverse floaters involve leverage, which may magnify the Fund’s gains or losses, and exhibit greater price and income volatility than bonds with similar maturities. We intend to limit leverage created by the Fund’s investment in inverse floaters to an amount equal to 10% of the Fund’s total assets. Inverse floaters are also subject to the risks associated with derivatives and municipal securities. |
|
|
Notice to Shareholders The Board of Trustees for Wells Fargo Advantage Funds has unanimously approved the following modifications to certain net asset value (NAV) waiver privileges and commission schedules: n Effective May 1, 2012, automatic investment plan (AIP) purchases and proceeds received from systematic withdrawals will no longer qualify for NAV repurchase privileges. n Effective May 1, 2012, discretionary rights to waive the upfront commission for Class C and “jumbo” Class A share purchases will no longer be granted to broker/dealers. However, we will continue to waive the Class C shares contingent deferred sales charge for redemptions by employer-sponsored retirement plans where the dealer of record waived its commission at the time of purchase. n Effective July 31, 2012, NAV purchase privileges for former Evergreen Class IS and Class R shareholders are being modified to remove the ability to purchase Class A shares at NAV unless those shares are held directly with the fund on or after July 31, 2012. |
| | | | |
| 6 | | Wells Fargo Advantage North Carolina Tax-Free Fund | | Performance Highlights (Unaudited) |
INVESTMENT OBJECTIVE
The Fund seeks current income exempt from federal income tax and North Carolina individual income tax.
ADVISER
Wells Fargo Funds Management, LLC
SUB-ADVISER
Wells Capital Management Incorporated
PORTFOLIO MANAGERS
Robert J. Miller
Bruce R. Johns
FUND INCEPTION
January 11, 1993
| | |
CREDIT QUALITY1 (AS OF DECEMBER 31, 2011) | | |
|
 |
| | |
EFFECTIVE MATURITY DISTRIBUTION2 (AS OF DECEMBER 31, 2011) | | |
|
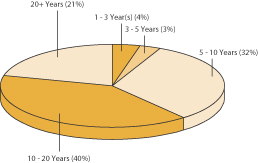 |
| 1. | The ratings indicated are from Standard & Poor’s, Moody’s Investors Service, and/or Fitch Ratings Ltd. Credit Quality Ratings: Credit quality ratings apply to underlying holdings of the Fund and not the Fund itself. Standard and Poor’s rates the creditworthiness of bonds, ranging from AAA (highest) to D (lowest). Ratings from A to CCC may be modified by the addition of a plus (+) or minus (–) sign to show relative standing within the rating categories. Standard & Poor’s rates the creditworthiness of short-term notes from SP-1 (highest) to SP-3 (lowest). Ratings from A to CCC may be modified by the addition of a plus (+) or minus (–) sign to show relative standing within the rating categories. Moody’s rates the creditworthiness of bonds, ranging from Aaa (highest) to C (lowest). Ratings Aa to B may be modified by the addition of a number 1 (highest) to 3 (lowest) to show relative standing within the ratings categories. Moody’s rates the creditworthiness of short-term U.S. tax-exempt municipal securities from MIG 1/VMIG 1 (highest) to SG (lowest). Fitch rates the creditworthiness of bonds, ranging from AAA (highest) to D (lowest). If a security was rated by all three rating agencies, the middle rating was utilized. If rated by two of three rating agencies, the lower rating was utilized and if rated by one of the agencies that rating was utilized. Credit quality is subject to change and is calculated based on the total investments of the Fund. We generally define higher quality bonds as bonds that have a rating of BBB/Baa and above and lower quality bonds as bonds with a rating below BBB/Baa. |
| 2. | Effective maturity is calculated based on the total long-term investments of the Fund. It is subject to change and may have changed since the date specified. |
| | | | | | |
| Performance Highlights (Unaudited) | | Wells Fargo Advantage North Carolina Tax-Free Fund | | | 7 | |
AVERAGE ANNUAL TOTAL RETURN3 (%) (AS OF DECEMBER 31, 2011)
| | | | | | | | | | | | | | | | | | | | | | | | | | | | | | | | | | | | | | | | | | | | |
| | | | | | Including Sales Charge | | | Excluding Sales Charge | | | Expense Ratios4 | |
| | | Inception Date | | | 6 Months* | | | 1 Year | | | 5 Year | | | 10 Year | | | 6 Months* | | | 1 Year | | | 5 Year | | | 10 Year | | | Gross | | | Net5 | |
Class A (ENCMX) | | | 01/11/1993 | | | | 1.06 | | | | 4.61 | | | | 2.58 | | | | 3.50 | | | | 5.85 | | | | 9.54 | | | | 3.53 | | | | 3.98 | | | | 0.91% | | | | 0.85% | |
Class C (ENCCX) | | | 03/27/2002 | | | | 4.45 | | | | 7.73 | | | | 2.76 | | | | 3.22 | | | | 5.45 | | | | 8.73 | | | | 2.76 | | | | 3.22 | | | | 1.66% | | | | 1.60% | |
Institutional Class (ENCYX) | | | 02/28/1994 | | | | | | | | | | | | | | | | | | | | 6.01 | | | | 9.88 | | | | 3.81 | | | | 4.26 | | | | 0.58% | | | | 0.54% | |
Barclays Capital Municipal Bond Index6 | | | | | | | | | | | | | | | | | | | | | | | 6.02 | | | | 10.70 | | | | 5.22 | | | | 5.38 | | | | | | | | | |
Barclays Capital North Carolina Municipal Bond Index7 | | | | | | | | | | | | | | | | | | | | | | | 5.86 | | | | 10.13 | | | | 5.58 | | | | 5.49 | | | | | | | | | |
| * | Returns for periods of less than one year are not annualized. |
Figures quoted represent past performance, which is no guarantee of future results and do not reflect the deduction of taxes that a shareholder may pay on fund distributions or the redemption of fund shares. Investment return and principal value of an investment will fluctuate so that an investor’s shares, when redeemed, may be worth more or less than their original cost. Performance shown without sales charges would be lower if sales charges were reflected. Current performance may be lower or higher than the performance data quoted and assumes the reinvestment of dividends and capital gains. Current month-end performance is available on the Fund’s Web site – www.wellsfargo.com/advantagefunds.
Index returns do not include transaction costs associated with buying and selling securities, any mutual fund fees or expenses or any taxes. It is not possible to invest directly in an index.
For Class A shares, the maximum front-end sales charge is 4.50%. For Class C shares, the maximum contingent deferred sales charge is 1.00%. Performance including sales charge assumes the sales charge for the corresponding time period. Institutional Class shares are sold without a front-end sales charge or contingent deferred sales charge.
Bond fund values fluctuate in response to the financial condition of individual issuers, general market and economic conditions, and changes in interest rates. In general, when interest rates rise, bond fund values fall and investors may lose principal value. The use of derivatives may reduce returns and/or increase volatility. Certain investment strategies tend to increase the total risk of an investment (relative to the broader market). This Fund is exposed to North Carolina municipal securities risk, high-yield securities risk, and non-diversification risk. Consult the Fund’s prospectus for additional information on these and other risks. A portion of the Fund’s income may be subject to federal, state, and/or local income taxes or the alternative minimum tax (AMT). Any capital gains distributions may be taxable.
| 3. | Historical performance shown for Class C shares prior to their inception reflects the performance of Class A shares, adjusted to reflect the higher expenses applicable to Class C shares. Historical performance shown for all classes of the Fund prior to July 12, 2010 is based on the performance of the Fund’s predecessor, Evergreen North Carolina Municipal Bond Fund. |
| 4. | Reflects the expense ratios as stated in the most recent prospectuses. |
| 5. | The Adviser has committed through July 11, 2013 to waive fees and/or reimburse expenses to the extent necessary to cap the Fund’s Total Annual Fund Operating Expenses After Fee Waiver, excluding certain expenses, at the amounts shown above. Without this cap, the Fund’s returns would have been lower. |
| 6. | The Barclays Capital Municipal Bond Index is an unmanaged index composed of long-term tax-exempt bonds with a minimum credit rating of Baa. You cannot invest directly in an index. |
| 7. | The Barclays Capital North Carolina Municipal Bond Index is the North Carolina component of the Barclays Capital Municipal Bond Index. You cannot invest directly in an index. |
| | | | |
| 8 | | Wells Fargo Advantage North Carolina Tax-Free Fund | | Fund Expenses (Unaudited) |
As a shareholder of the Fund, you incur two types of costs: (1) transaction costs, including sales charges (loads) on purchase payments and contingent deferred sales charges (if any) on redemptions and (2) ongoing costs, including management fees; distribution (12b-1) and/or shareholder service fees; and other Fund expenses. This example is intended to help you understand your ongoing costs (in dollars) of investing in the Fund and to compare these costs with the ongoing costs of investing in other mutual funds.
The example is based on an investment of $1,000 invested at the beginning of the six-month period and held for the entire period from July 1, 2011 to December 31, 2011.
Actual Expenses
The “Actual” line of the table below provides information about actual account values and actual expenses. You may use the information in this line, together with the amount you invested, to estimate the expenses that you paid over the period. Simply divide your account value by $1,000 (for example, an $8,600 account value divided by $1,000 = 8.6), then multiply the result by the number in the “Actual” line under the heading entitled “Expenses Paid During Period” for your applicable class of shares to estimate the expenses you paid on your account during this period.
Hypothetical Example for Comparison Purposes
The “Hypothetical” line of the table below provides information about hypothetical account values and hypothetical expenses based on the Fund’s actual expense ratio and an assumed rate of return of 5% per year before expenses, which is not the Fund’s actual return. The hypothetical account values and expenses may not be used to estimate the actual ending account balance or expenses you paid for the period. You may use this information to compare the ongoing costs of investing in the Fund and other funds. To do so, compare this 5% hypothetical example with the 5% hypothetical examples that appear in the shareholder reports of the other funds.
Please note that the expenses shown in the table are meant to highlight your ongoing costs only and do not reflect any transactional costs, such as sales charges (loads) and contingent deferred sales charges. Therefore, the “Hypothetical” line of the table is useful in comparing ongoing costs only, and will not help you determine the relative total costs of owning different funds. In addition, if these transactional costs were included, your costs would have been higher.
| | | | | | | | | | | | | | | | |
| | | Beginning
Account Value
07-01-2011 | | | Ending Account Value
12-31-2011 | | | Expenses
Paid During
the Period¹ | | | Net Annual
Expense Ratio | |
Class A | | | | | | | | | | | | | | | | |
Actual | | $ | 1,000.00 | | | $ | 1,058.47 | | | $ | 4.40 | | | | 0.85 | % |
Hypothetical (5% return before expenses) | | $ | 1,000.00 | | | $ | 1,020.86 | | | $ | 4.32 | | | | 0.85 | % |
Class C | | | | | | | | | | | | | | | | |
Actual | | $ | 1,000.00 | | | $ | 1,054.51 | | | $ | 8.26 | | | | 1.60 | % |
Hypothetical (5% return before expenses) | | $ | 1,000.00 | | | $ | 1,017.09 | | | $ | 8.11 | | | | 1.60 | % |
Institutional Class | | | | | | | | | | | | | | | | |
Actual | | $ | 1,000.00 | | | $ | 1,060.11 | | | $ | 2.80 | | | | 0.54 | % |
Hypothetical (5% return before expenses) | | $ | 1,000.00 | | | $ | 1,022.42 | | | $ | 2.75 | | | | 0.54 | % |
| 1. | Expenses paid is equal to the annualized expense ratio of each class multiplied by the average account value over the period, multiplied by the number of days in the most recent fiscal half-year divided by the number of days in the fiscal year (to reflect the one-half year period). |
| | | | | | |
| Portfolio of Investments—December 31, 2011 (Unaudited) | | Wells Fargo Advantage North Carolina Tax-Free Fund | | | 9 | |
| | | | | | | | | | | | | | | | |
| Security Name | | Interest Rate | | | Maturity Date | | | Principal | | | Value | |
| | | | | | | | | | | | | | | | |
| | | | |
Municipal Bonds and Notes: 99.94% | | | | | | | | | | | | | | | | |
| | | | |
| Guam: 2.24% | | | | | | | | | | | | | | | | |
Guam Government Hotel Occupancy Series A (Tax Revenue) | | | 6.00 | % | | | 11/01/2026 | | | $ | 2,000,000 | | | $ | 2,210,440 | |
Guam Government Privilege Tax Series A (Tax Revenue) | | | 5.00 | | | | 01/01/2031 | | | | 1,000,000 | | | | 1,057,250 | |
| | | | |
| | | | | | | | | | | | | | | 3,267,690 | |
| | | | | | | | | | | | | | | | |
| | | | |
| North Carolina: 83.71% | | | | | | | | | | | | | | | | |
Cape Fear NC Public Utility Authority (Water & Sewer Revenue) | | | 5.00 | | | | 08/01/2035 | | | | 5,000,000 | | | | 5,343,550 | |
Charlotte NC AMT Series B (Airport Revenue) | | | 5.00 | | | | 07/01/2020 | | | | 1,480,000 | | | | 1,675,760 | |
Charlotte NC AMT Series B (Airport Revenue) | | | 5.50 | | | | 07/01/2024 | | | | 810,000 | | | | 899,003 | |
Charlotte NC Certifications Partner Series E (Lease Revenue) | | | 5.00 | | | | 06/01/2023 | | | | 3,650,000 | | | | 4,203,778 | |
Charlotte NC COP Series A (Lease Revenue) | | | 5.00 | | | | 12/01/2026 | | | | 1,160,000 | | | | 1,341,575 | |
Charlotte NC Douglas Airport Series A (Airport Revenue) | | | 5.00 | | | | 07/01/2025 | | | | 1,645,000 | | | | 1,867,207 | |
Charlotte NC Series A (Airport Revenue) | | | 5.50 | | | | 07/01/2034 | | | | 2,500,000 | | | | 2,726,650 | |
Charlotte-Mecklenburg NC Hospital Authority (Health Revenue) | | | 5.00 | | | | 01/15/2027 | | | | 1,885,000 | | | | 2,030,824 | |
Columbus County NC Industrial Facilities & Pollution Control Financing Authority Series A (IDR) | | | 5.85 | | | | 12/01/2020 | | | | 3,450,000 | | | | 3,452,450 | |
Cumberland County NC Limited Obligation Series B (Lease Revenue) | | | 5.00 | | | | 12/01/2019 | | | | 790,000 | | | | 966,399 | |
Cumberland County NC Limited Obligation Series B (Lease Revenue) | | | 5.00 | | | | 11/01/2025 | | | | 1,000,000 | | | | 1,169,170 | |
Cumberland County NC Limited Obligation Series B (Lease Revenue) | | | 5.00 | | | | 11/01/2026 | | | | 1,000,000 | | | | 1,158,090 | |
Fayetteville NC Public Work Commission Series B (Utilities Revenue) | | | 5.00 | | | | 03/01/2023 | | | | 600,000 | | | | 706,278 | |
Forsyth County NC Public Facilities & Equipment Project (Miscellaneous Revenue) | | | 5.00 | | | | 10/01/2017 | | | | 3,745,000 | | | | 4,282,333 | |
Johnston NC Memorial Hospital Authority (Health Revenue) | | | 5.25 | | | | 10/01/2036 | | | | 2,000,000 | | | | 2,113,180 | |
Mecklenburg County NC COP Series B (Lease Revenue) | | | 5.00 | | | | 02/01/2018 | | | | 700,000 | | | | 842,121 | |
Mecklenburg County NC Public Facilities Corporation (Miscellaneous Revenue) | | | 5.00 | | | | 03/01/2022 | | | | 1,035,000 | | | | 1,235,448 | |
New Hanover County NC New Hanover Regional Medical Center (Health Revenue) | | | 5.00 | | | | 10/01/2028 | | | | 3,000,000 | | | | 3,175,470 | |
New Hanover County NC New Hanover Regional Medical Center (Health Revenue, AGM Insured) | | | 5.13 | | | | 10/01/2031 | | | | 1,800,000 | | | | 1,910,304 | |
North Carolina Capital Improvement Limited Series A (Miscellaneous Revenue, State Appropriations Insured) | | | 5.00 | | | | 05/01/2026 | | | | 4,455,000 | | | | 5,003,767 | |
North Carolina Eastern Municipal Power Agency Series A (Utilities Revenue) | | | 5.00 | | | | 01/01/2021 | | | | 3,000,000 | | | | 3,805,980 | |
North Carolina Grant Anticipation (Miscellaneous Revenue)± | | | 4.00 | | | | 03/01/2023 | | | | 3,000,000 | | | | 3,405,180 | |
North Carolina Grant Anticipation Department of State Treasury (Miscellaneous Revenue) | | | 5.00 | | | | 03/01/2021 | | | | 3,700,000 | | | | 4,438,409 | |
North Carolina Housing Finance Agency Series 25-A (Housing Revenue) | | | 4.65 | | | | 07/01/2021 | | | | 2,925,000 | | | | 3,002,630 | |
North Carolina Housing Finance Agency Series 8-A (Housing Revenue) | | | 6.10 | | | | 07/01/2013 | | | | 145,000 | | | | 145,407 | |
North Carolina Housing Finance Agency Series B (Housing Revenue) | | | 4.25 | | | | 01/01/2028 | | | | 5,070,000 | | | | 5,347,532 | |
North Carolina Limited Obligation Series B (Miscellaneous Revenue) | | | 5.00 | | | | 11/01/2018 | | | | 4,000,000 | | | | 4,935,880 | |
North Carolina Medical Care Commission Baptist Hospital Project (Health Revenue) | | | 5.25 | | | | 06/01/2029 | | | | 2,000,000 | | | | 2,174,180 | |
North Carolina Medical Care Commision Healthcare Facilities (Health Revenue) | | | 5.00 | | | | 01/01/2018 | | | | 500,000 | | | | 564,515 | |
North Carolina Medical Care Commission Hugh Chatam Memorial Hospital Project (Health Revenue, Radian Insured) | | | 5.50 | | | | 10/01/2020 | | | | 1,095,000 | | | | 1,110,593 | |
North Carolina Medical Care Commission Presbyterian Homes Project (Health Revenue) | | | 5.40 | | | | 10/01/2027 | | | | 1,000,000 | | | | 972,020 | |
North Carolina Medical Care Commission Presbyterian Homes Project (Health Revenue) | | | 5.50 | | | | 10/01/2031 | | | | 2,000,000 | | | | 1,925,240 | |
North Carolina Medical Care Commission Presbyterian Homes Project (Health Revenue) | | | 5.60 | | | | 10/01/2036 | | | | 1,500,000 | | | | 1,430,415 | |
| | | | |
| 10 | | Wells Fargo Advantage North Carolina Tax-Free Fund | | Portfolio of Investments—December 31, 2011 (Unaudited) |
| | | | | | | | | | | | | | | | |
| Security Name | | Interest Rate | | | Maturity Date | | | Principal | | | Value | |
| | | | | | | | | | | | | | | | |
| | | | |
| North Carolina (continued) | | | | | | | | | | | | | | | | |
North Carolina Medical Care Commission Southeastern Regional Medical Center Project (Health Revenue) | | | 5.50 | % | | | 06/01/2015 | | | $ | 2,365,000 | | | $ | 2,419,419 | |
North Carolina Medical Care Commission Stanley Memorial Hospital Project (Health Revenue) | | | 5.00 | | | | 07/01/2033 | | | | 1,000,000 | | | | 973,030 | |
North Carolina Medical Care Commission Stanley Memorial Hospital Project (Health Revenue, AMBAC Insured) | | | 5.38 | | | | 10/01/2014 | | | | 2,485,000 | | | | 2,489,796 | |
North Carolina Municipal Power Agency #1 Catawba Nuclear Power Project Series A (Utilities Revenue) | | | 5.00 | | | | 01/01/2021 | | | | 2,720,000 | | | | 3,225,621 | |
North Carolina Municipal Power Agency #1 Catawba Nuclear Power Project Series A (Utilities Revenue) | | | 5.00 | | | | 01/01/2030 | | | | 1,550,000 | | | | 1,665,398 | |
North Carolina Port Authority Series B (Airport Revenue) | | | 5.00 | | | | 02/01/2025 | | | | 3,540,000 | | | | 3,795,022 | |
North Carolina Raleigh Durham Airport Authority Series B-1 (Airport Revenue) | | | 5.00 | | | | 11/01/2028 | | | | 2,500,000 | | | | 2,791,975 | |
North Carolina Turnpike Authority Series A (Transportation Revenue, Assured Guaranty Insured) | | | 5.75 | | | | 01/01/2039 | | | | 3,500,000 | | | | 3,817,310 | |
Orange Country NC Public Facilities Company Limited Obligation (Miscellaneous Revenue) | | | 5.00 | | | | 10/01/2026 | | | | 1,000,000 | | | | 1,142,520 | |
Raleigh NC Series A (Water & Sewer Revenue) | | | 5.00 | | | | 03/01/2036 | | | | 5,000,000 | | | | 5,388,850 | |
University of North Carolina at Chapel Hill Series A (Education Revenue) | | | 5.00 | | | | 12/01/2034 | | | | 3,100,000 | | | | 3,291,022 | |
University of North Carolina Wilmington Student Housing Project COP (Education Revenue, NATL-RE FGIC Insured) | | | 5.00 | | | | 06/01/2022 | | | | 1,000,000 | | | | 1,079,000 | |
University of North Carolina Wilmington Student Housing Project COP (Education Revenue, Assured Guaranty Insured) | | | 5.00 | | | | 06/01/2032 | | | | 2,910,000 | | | | 3,066,500 | |
Wake County NC Industrial Facilities & PCFA (IDR) | | | 5.38 | | | | 02/01/2017 | | | | 5,000,000 | | | | 5,069,250 | |
Wilmington NC COP (Lease Revenue) | | | 5.00 | | | | 06/01/2029 | | | | 2,580,000 | | | | 2,789,909 | |
| | | | |
| | | | | | | | | | | | | | | 122,365,960 | |
| | | | | | | | | | | | | | | | |
| | | | |
| Puerto Rico: 4.97% | | | | | | | | | | | | | | | | |
Puerto Rico Electric Power Authority Series UU (Utilities Revenue, AGM Insured)± | | | 0.77 | | | | 07/01/2029 | | | | 6,000,000 | | | | 3,893,100 | |
Puerto Rico Highway & Transporation Authority Highway Series AA-1 (Tax Revenue) | | | 4.95 | | | | 07/01/2026 | | | | 1,765,000 | | | | 1,845,978 | |
Puerto Rico Municipal Finance Agency Series A (Miscellaneous Revenue, AGM Insured) | | | 5.25 | | | | 08/01/2014 | | | | 1,500,000 | | | | 1,530,570 | |
| | | | |
| | | | | | | | | | | | | | | 7,269,648 | |
| | | | | | | | | | | | | | | | |
| | | | |
| Tennessee: 2.05% | | | | | | | | | | | | | | | | |
Tennessee Energy Acquisition Corporation Series A (Utilities Revenue) | | | 5.25 | | | | 09/01/2026 | | | | 1,020,000 | | | | 1,005,567 | |
Tennessee Energy Acquisition Corporation Series C (Utilities Revenue) | | | 5.00 | | | | 02/01/2021 | | | | 2,000,000 | | | | 1,988,380 | |
| | | | |
| | | | | | | | | | | | | | | 2,993,947 | |
| | | | | | | | | | | | | | | | |
| | | | |
| Texas: 1.19% | | | | | | | | | | | | | | | | |
Texas Municipal Gas Acquisition & Supply Corporation Series D (Utilities Revenue) | | | 5.63 | | | | 12/15/2017 | | | | 1,635,000 | | | | 1,739,918 | |
| | | | | | | | | | | | | | | | |
| | | | |
| Virgin Islands: 5.78% | | | | | | | | | | | | | | | | |
Virgin Islands PFA (Miscellaneous Revenue) | | | 6.75 | | | | 10/01/2019 | | | | 3,500,000 | | | | 3,916,500 | |
Virgin Islands PFA Series A (Miscellaneous Revenue) | | | 6.75 | | | | 10/01/2037 | | | | 2,500,000 | | | | 2,722,450 | |
Virgin Islands PFA Series C (Miscellaneous Revenue) | | | 5.00 | | | | 10/01/2014 | | | | 1,710,000 | | | | 1,818,034 | |
| | | | |
| | | | | | | | | | | | | | | 8,456,984 | |
| | | | | | | | | | | | | | | | |
| | | | |
Total Municipal Bonds and Notes (Cost $138,647,853) | | | | | | | | | | | | | | | 146,094,147 | |
| | | | | | | | | | | | | | | | |
| | | | | | |
| Portfolio of Investments—December 31, 2011 (Unaudited) | | Wells Fargo Advantage North Carolina Tax-Free Fund | | | 11 | |
| | | | | | | | | | | | | | | | |
| Security Name | | Yield | | | Maturity Date | | | Principal | | | Value | |
| | | | | | | | | | | | | | | | |
| | | | |
Short-Term Investments: 0.05% | | | | | | | | | | | | | | | | |
| | | | |
| U.S. Treasury Securities: 0.05% | | | | | | | | | | | | | | | | |
U.S. Treasury Bill# | | | 0.01 | % | | | 03/29/2012 | | | $ | 80,000 | | | $ | 79,997 | |
| | | | | | | | | | | | | | | | |
| | | | |
Total Short-Term Investments (Cost $79,998) | | | | | | | | | | | | | | | 79,997 | |
| | | | | | | | | | | | | | | | |
| | | | | | | | |
| Total Investments in Securities | | | | | | | | |
| (Cost $138,727,851) | | | 99.99 | % | | | 146,174,144 | |
Other Assets and Liabilities, Net | | | 0.01 | | | | 11,717 | |
| | | | | | | | |
| Total Net Assets* | | | 100.00 | % | | $ | 146,185,861 | |
| | | | | | | | |
| ± | Variable rate investment. |
| # | All or a portion of this security is segregated as collateral for investments in derivative instruments. |
| * | Cost for federal income tax purposes is $138,727,851 and net unrealized appreciation (depreciation) consists of: |
| | | | |
Gross unrealized appreciation | | $ | 8,061,572 | |
Gross unrealized depreciation | | | (615,279 | ) |
| | | | |
Net unrealized appreciation | | $ | 7,446,293 | |
The accompanying notes are an integral part of these financial statements.
| | | | |
| 12 | | Wells Fargo Advantage North Carolina Tax-Free Fund | | Statement of Assets and Liabilities—December 31, 2011 (Unaudited) |
| | | | |
| | | | |
| |
Assets | | | | |
Investment in unaffiliated securities, at value (see cost below) | | $ | 146,174,144 | |
Cash | | | 3,763 | |
Receivable for Fund shares sold | | | 820 | |
Receivable for interest | | | 1,860,371 | |
Prepaid expenses and other assets | | | 40,296 | |
| | | | |
Total assets | | | 148,079,394 | |
| | | | |
| |
Liabilities | | | | |
Dividends payable | | | 324,751 | |
Payable for investments purchased | | | 1,331,808 | |
Payable for Fund shares redeemed | | | 58,869 | |
Payable for daily variation margin on open futures contracts | | | 13,063 | |
Advisory fee payable | | | 42,787 | |
Distribution fees payable | | | 3,945 | |
Due to other related parties | | | 21,698 | |
Accrued expenses and other liabilities | | | 96,612 | |
| | | | |
Total liabilities | | | 1,893,533 | |
| | | | |
Total net assets | | $ | 146,185,861 | |
| | | | |
| |
NET ASSETS CONSIST OF | | | | |
Paid-in capital | | $ | 152,437,416 | |
Overdistributed net investment income | | | (59,341 | ) |
Accumulated net realized losses on investments | | | (13,596,800 | ) |
Net unrealized gains on investments | | | 7,404,586 | |
| | | | |
Total net assets | | $ | 146,185,861 | |
| | | | |
| |
COMPUTATION OF NET ASSET VALUE AND OFFERING PRICE PER SHARE1 | | | | |
Net assets – Class A | | $ | 44,975,133 | |
Shares outstanding – Class A | | | 4,454,501 | |
Net asset value per share – Class A | | | $10.10 | |
Maximum offering price per share – Class A2 | | | $10.58 | |
Net assets – Class C | | $ | 5,506,070 | |
Shares outstanding – Class C | | | 545,279 | |
Net asset value per share – Class C | | | $10.10 | |
Net assets – Institutional Class | | $ | 95,704,658 | |
Shares outstanding – Institutional Class | | | 9,478,280 | |
Net asset value per share – Institutional Class | | | $10.10 | |
| |
Investment is unaffiliated securities, at cost | | $ | 138,727,851 | |
| | | | |
| 1. | The Fund has an unlimited number of authorized shares. |
| 2. | Maximum offering price is computed as 100/95.50 of net asset value. On investments of $50,000 or more, the offering price is reduced. |
The accompanying notes are an integral part of these financial statements.
| | | | | | |
| Statement of Operations—Six Months Ended December 31, 2011 (Unaudited) | | Wells Fargo Advantage North Carolina Tax-Free Fund | | | 13 | |
| | | | |
| | | | |
| |
Investment income | | | | |
Interest | | $ | 3,360,759 | |
| | | | |
| |
Expenses | | | | |
Advisory fee | | | 271,641 | |
Administration fees | | | | |
Fund level | | | 38,806 | |
Class A | | | 37,461 | |
Class C | | | 4,573 | |
Institutional Class | | | 41,072 | |
Shareholder servicing fees | | | | |
Class A | | | 58,532 | |
Class C | | | 7,146 | |
Distribution fees | | | | |
Class C | | | 21,437 | |
Custody and accounting fees | | | 4,710 | |
Professional fees | | | 22,072 | |
Registration fees | | | 16,847 | |
Shareholder report expenses | | | 15,967 | |
Trustees' fees and expenses | | | 5,461 | |
Other fees and expenses | | | 4,861 | |
| | | | |
Total expenses | | | 550,586 | |
Less: Fee waivers and/or expense reimbursements | | | (28,605 | ) |
| | | | |
Net expenses | | | 521,981 | |
| | | | |
Net investment income | | | 2,838,778 | |
| | | | |
| |
REALIZED AND UNREALIZED GAINS (LOSSES) ON INVESTMENTS | | | | |
| |
Net realized gains (losses) on: | | | | |
Unaffiliated securities | | | 3,244,081 | |
Futures transactions | | | (290,080 | ) |
| | | | |
Net realized gains on investments | | | 2,954,001 | |
| | | | |
| |
Net change in unrealized gains (losses) on: | | | | |
Unaffiliated securities | | | 3,025,749 | |
Futures transactions | | | (51,237 | ) |
| | | | |
Net change in unrealized gains (losses) on investments | | | 2,974,512 | |
| | | | |
Net realized and unrealized gains (losses) on investments | | | 5,928,513 | |
| | | | |
Net increase in net assets resulting from operations | | $ | 8,767,291 | |
| | | | |
The accompanying notes are an integral part of these financial statements.
| | | | |
| 14 | | Wells Fargo Advantage North Carolina Tax-Free Fund | | Statements of Changes in Net Assets |
| | | | | | | | | | | | | | | | | | | | | | | | |
| | | Six Months Ended
December 31, 2011
(Unaudited) | | | Year Ended
June 30, 20111 | | | Year Ended
August 31, 20102 | |
| | | | | | |
Operations | | | | | | | | | | | | | | | | | | | | | | | | |
Net investment income | | | | | | $ | 2,838,778 | | | | | | | $ | 6,003,281 | | | | | | | $ | 8,961,673 | |
Net realized gains (losses) on investments | | | | | | | 2,954,001 | | | | | | | | (180,664 | ) | | | | | | | 5,773,186 | |
Net change in unrealized gains (losses) on investments | | | | | | | 2,974,512 | | | | | | | | (9,148,928 | ) | | | | | | | 4,837,406 | |
| | | | | | | | | | | | | | | | | | | | | | | | |
Net increase (decrease) in net assets resulting from operations | | | | | | | 8,767,291 | | | | | | | | (3,326,311 | ) | | | | | | | 19,572,265 | |
| | | | | | | | | | | | | | | | | | | | | | | | |
| | | | | | |
Distributions to shareholders from | | | | | | | | | | | | | | | | | | | | | | | | |
Net investment income | | | | | | | | | | | | | | | | | | | | | | | | |
Class A | | | | | | | (816,010 | ) | | | | | | | (1,567,666 | ) | | | | | | | (2,178,772 | ) |
Class B | | | | | | | NA | | | | | | | | NA | | | | | | | | (67,960 | )3 |
Class C | | | | | | | (78,147 | ) | | | | | | | (167,540 | ) | | | | | | | (221,328 | ) |
Institutional Class | | | | | | | (1,944,621 | ) | | | | | | | (4,265,609 | ) | | | | | | | (6,670,963 | ) |
| | | | | | | | | | | | | | | | | | | | | | | | |
Total distributions to shareholders | | | | | | | (2,838,778 | ) | | | | | | | (6,000,815 | ) | | | | | | | (9,139,023 | ) |
| | | | | | | | | | | | | | | | | | | | | | | | |
| | | | | | |
Capital share transactions | | | Shares | | | | | | | | Shares | | | | | | | | Shares | | | | | |
Proceeds from shares sold | | | | | | | | | | | | | | | | | | | | | | | | |
Class A | | | 34,873 | | | | 346,473 | | | | 146,740 | | | | 1,453,614 | | | | 713,447 | | | | 7,007,074 | |
Class B | | | NA | | | | NA | | | | NA | | | | NA | | | | 185 | 3 | | | 1,928 | 3 |
Class C | | | 5,818 | | | | 57,493 | | | | 92,146 | | | | 903,592 | | | | 345,990 | | | | 3,394,282 | |
Institutional Class | | | 161,753 | | | | 1,600,280 | | | | 521,375 | | | | 5,074,633 | | | | 1,491,632 | | | | 14,595,901 | |
| | | | | | | | | | | | | | | | | | | | | | | | |
| | | | | | | 2,004,246 | | | | | | | | 7,431,839 | | | | | | | | 24,999,185 | |
| | | | | | | | | | | | | | | | | | | | | | | | |
Reinvestment of distributions | | | | | | | | | | | | | | | | | | | | | | | | |
Class A | | | 51,233 | | | | 508,238 | | | | 94,796 | | | | 919,172 | | | | 136,217 | | | | 1,338,770 | |
Class B | | | NA | | | | NA | | | | NA | | | | NA | | | | 2,855 | 3 | | | 27,966 | 3 |
Class C | | | 5,876 | | | | 58,288 | | | | 11,978 | | | | 116,155 | | | | 14,542 | | | | 142,981 | |
Institutional Class | | | 20,102 | | | | 199,456 | | | | 40,552 | | | | 393,140 | | | | 52,562 | | | | 516,705 | |
| | | | | | | | | | | | | | | | | | | | | | | | |
| | | | | | | 765,982 | | | | | | | | 1,428,467 | | | | | | | | 2,026,422 | |
| | | | | | | | | | | | | | | | | | | | | | | | |
Payment for shares redeemed | | | | | | | | | | | | | | | | | | | | | | | | |
Class A | | | (568,293 | ) | | | (5,627,451 | ) | | | (887,232 | ) | | | (8,604,120 | ) | | | (561,591 | ) | | | (5,516,010 | ) |
Class B | | | NA | | | | NA | | | | NA | | | | NA | | | | (281,556 | )3 | | | (2,774,633 | )3 |
Class C | | | (62,341 | ) | | | (616,865 | ) | | | (266,018 | ) | | | (2,543,123 | ) | | | (101,213 | ) | | | (991,298 | ) |
Institutional Class | | | (1,818,265 | ) | | | (17,983,755 | ) | | | (4,283,508 | ) | | | (41,034,046 | ) | | | (2,593,874 | ) | | | (25,446,131 | ) |
| | | | | | | | | | | | | | | | | | | | | | | | |
| | | | | | | (24,228,071 | ) | | | | | | | (52,181,289 | ) | | | | | | | (34,728,072 | ) |
| | | | | | | | | | | | | | | | | | | | | | | | |
Net decrease in net assets resulting
from capital share transactions | | | | | | | (21,457,843 | ) | | | | | | | (43,320,983 | ) | | | | | | | (7,702,465 | ) |
| | | | | | | | | | | | | | | | | | | | | | | | |
Total increase (decrease) in net assets | | | | | | | (15,529,330 | ) | | | | | | | (52,648,109 | ) | | | | | | | 2,730,777 | |
| | | | | | | | | | | | | | | | | | | | | | | | |
| | | | | | |
Net assets | | | | | | | | | | | | | | | | | | | | | | | | |
Beginning of period | | | | | | | 161,715,191 | | | | | | | | 214,363,300 | | | | | | | | 211,632,523 | |
| | | | | | | | | | | | | | | | | | | | | | | | |
End of period | | | | | | $ | 146,185,861 | | | | | | | $ | 161,715,191 | | | | | | | $ | 214,363,300 | |
| | | | | | | | | | | | | | | | | | | | | | | | |
Overdistributed net investment income | | | | | | $ | (59,341 | ) | | | | | | $ | (59,341 | ) | | | | | | $ | (61,807 | ) |
| | | | | | | | | | | | | | | | | | | | | | | | |
| 1. | For the ten months ended June 30, 2011. The Fund changed its fiscal year end from August 31 to June 30, effective June 30, 2011. |
| 2. | After the close of business on July 9, 2010, the Fund acquired the net assets of Evergreen North Carolina Municipal Bond Fund which became the accounting and performance survivor in the transaction. The information for the period prior to July 12, 2010 is that of Evergreen North Carolina Municipal Bond Fund. |
| 3. | Class B shares of Evergreen North Carolina Municipal Bond Fund became Class A shares on July 12, 2010. |
The accompanying notes are an integral part of these financial statements.
| | | | | | |
| Financial Highlights | | Wells Fargo Advantage North Carolina Tax-Free Fund | | | 15 | |
(For a share outstanding throughout each period)
| | | | | | | | | | | | | | | | | | | | | | | | | | | | |
| | | Six Months Ended
December 31, 2011 (Unaudited) | | | Year Ended
June 30, 20111 | | | Year Ended August 31, | |
| Class A | | | | 20102 | | | 20092 | | | 20082 | | | 20072 | | | 20062 | |
Net asset value, beginning of period | | $ | 9.71 | | | $ | 10.12 | | | $ | 9.64 | | | $ | 9.80 | | | $ | 10.00 | | | $ | 10.30 | | | $ | 10.44 | |
Net investment income | | | 0.18 | | | | 0.30 | | | | 0.39 | 3 | | | 0.39 | | | | 0.39 | | | | 0.38 | | | | 0.39 | |
Net realized and unrealized gains (losses) on investments | | | 0.38 | | | | (0.41 | ) | | | 0.49 | | | | (0.15 | ) | | | (0.20 | ) | | | (0.30 | ) | | | (0.14 | ) |
| | | | | | | | | | | | | | | | | | | | | | | | | | | | |
Total from investment operations | | | 0.56 | | | | (0.11 | ) | | | 0.88 | | | | 0.24 | | | | 0.19 | | | | 0.08 | | | | 0.25 | |
Distributions to shareholders from | | | | | | | | | | | | | | | | | | | | | | | | | | | | |
Net investment income | | | (0.17 | ) | | | (0.30 | ) | | | (0.40 | ) | | | (0.40 | ) | | | (0.39 | ) | | | (0.38 | ) | | | (0.38 | ) |
Net realized gains | | | 0.00 | | | | 0.00 | | | | 0.00 | | | | 0.00 | | | | 0.00 | | | | 0.00 | | | | (0.01 | ) |
| | | | | | | | | | | | | | | | | | | | | | | | | | | | |
Total distributions to shareholders | | | (0.17 | ) | | | (0.30 | ) | | | (0.40 | ) | | | (0.40 | ) | | | (0.39 | ) | | | (0.38 | ) | | | (0.39 | ) |
Net asset value, end of period | | $ | 10.10 | | | $ | 9.71 | | | $ | 10.12 | | | $ | 9.64 | | | $ | 9.80 | | | $ | 10.00 | | | $ | 10.30 | |
Total return4 | | | 5.85 | % | | | (1.05 | )% | | | 9.38 | % | | | 2.63 | % | | | 1.90 | % | | | 0.67 | % | | | 2.54 | % |
Ratios to average net assets (annualized) | | | | | | | | | | | | | | | | | | | | | | | | | | | | |
Gross expenses | | | 0.90 | % | | | 0.91 | % | | | 0.90 | % | | | 0.87 | % | | | 0.92 | %5 | | | 0.98 | %5 | | | 0.92 | %5 |
Net expenses | | | 0.85 | % | | | 0.85 | % | | | 0.88 | % | | | 0.87 | % | | | 0.89 | %5 | | | 0.93 | %5 | | | 0.87 | %5 |
Net investment income | | | 3.49 | % | | | 3.72 | % | | | 4.03 | % | | | 4.22 | % | | | 3.88 | %5 | | | 3.71 | %5 | | | 3.78 | %5 |
Supplemental data | | | | | | | | | | | | | | | | | | | | | | | | | | | | |
Portfolio turnover rate | | | 38 | % | | | 44 | % | | | 63 | % | | | 48 | % | | | 78 | % | | | 72 | % | | | 83 | % |
Net assets, end of period (000's omitted) | | | $44,975 | | | | $47,954 | | | | $56,508 | | | | $51,028 | | | | $54,680 | | | | $59,828 | | | | $66,176 | |
| 1. | For the ten months ended June 30, 2011. The Fund changed its fiscal year end from August 31 to June 30, effective June 30, 2011. |
| 2. | After the close of business on July 9, 2010, the Fund acquired the net assets of Evergreen North Carolina Municipal Bond Fund which became the accounting and performance survivor in the transaction. The information for the periods prior to July 12, 2010 is that of Class A of Evergreen North Carolina Municipal Bond Fund. |
| 3. | Calculated based upon average shares outstanding |
| 4. | Total return calculations do not include any sales charges. Returns for periods of less than one year are not annualized. |
| 5. | Ratios include interest and fee expense relating to inverse floating-rate obligations as follows: |
| | | | |
Year ended August 31, 2008 | | | 0.05 | % |
Year ended August 31, 2007 | | | 0.09 | % |
Year ended August 31, 2006 | | | 0.03 | % |
The accompanying notes are an integral part of these financial statements.
| | | | |
| 16 | | Wells Fargo Advantage North Carolina Tax-Free Fund | | Financial Highlights |
(For a share outstanding throughout each period)
| | | | | | | | | | | | | | | | | | | | | | | | | | | | |
| | | Six Months Ended
December 31, 2011 (Unaudited) | | | Year Ended
June 30, 20111 | | | Year Ended August 31, | |
| Class C | | | | 20102 | | | 20092 | | | 20082 | | | 20072 | | | 20062 | |
Net asset value, beginning of period | | $ | 9.71 | | | $ | 10.12 | | | $ | 9.64 | | | $ | 9.80 | | | $ | 10.00 | | | $ | 10.30 | | | $ | 10.44 | |
Net investment income | | | 0.14 | | | | 0.24 | | | | 0.32 | 3 | | | 0.32 | | | | 0.31 | | | | 0.30 | | | | 0.31 | |
Net realized and unrealized gains (losses) on investments | | | 0.39 | | | | (0.41 | ) | | | 0.49 | | | | (0.15 | ) | | | (0.20 | ) | | | (0.29 | ) | | | (0.13 | ) |
| | | | | | | | | | | | | | | | | | | | | | | | | | | | |
Total from investment operations | | | 0.53 | | | | (0.17 | ) | | | 0.81 | | | | 0.17 | | | | 0.11 | | | | 0.01 | | | | 0.18 | |
Distributions to shareholders from | | | | | | | | | | | | | | | | | | | | | | | | | | | | |
Net investment income | | | (0.14 | ) | | | (0.24 | ) | | | (0.33 | ) | | | (0.33 | ) | | | (0.31 | ) | | | (0.31 | ) | | | (0.31 | ) |
Net realized gains | | | 0.00 | | | | 0.00 | | | | 0.00 | | | | 0.00 | | | | 0.00 | | | | 0.00 | | | | (0.01 | ) |
| | | | | | | | | | | | | | | | | | | | | | | | | | | | |
Total distributions to shareholders | | | (0.14 | ) | | | (0.24 | ) | | | (0.33 | ) | | | (0.33 | ) | | | (0.31 | ) | | | (0.31 | ) | | | (0.32 | ) |
Net asset value, end of period | | $ | 10.10 | | | $ | 9.71 | | | $ | 10.12 | | | $ | 9.64 | | | $ | 9.80 | | | $ | 10.00 | | | $ | 10.30 | |
Total return4 | | | 5.45 | % | | | (1.66 | )% | | | 8.57 | % | | | 1.87 | % | | | 1.13 | % | | | (0.08 | )% | | | 1.82 | % |
Ratios to average net assets (annualized) | | | | | | | | | | | | | | | | | | | | | | | | | | | | |
Gross expenses | | | 1.65 | % | | | 1.66 | % | | | 1.65 | % | | | 1.62 | % | | | 1.64 | %5 | | | 1.68 | %5 | | | 1.61 | %5 |
Net expenses | | | 1.60 | % | | | 1.60 | % | | | 1.63 | % | | | 1.62 | % | | | 1.64 | %5 | | | 1.68 | %5 | | | 1.61 | %5 |
Net investment income | | | 2.73 | % | | | 2.96 | % | | | 3.26 | % | | | 3.47 | % | | | 3.12 | %5 | | | 2.96 | %5 | | | 3.03 | %5 |
Supplemental data | | | | | | | | | | | | | | | | | | | | | | | | | | | | |
Portfolio turnover rate | | | 38 | % | | | 44 | % | | | 63 | % | | | 48 | % | | | 78 | % | | | 72 | % | | | 83 | % |
Net assets, end of period (000's omitted) | | | $5,506 | | | | $5,789 | | | | $7,671 | | | | $4,805 | | | | $5,239 | | | | $5,734 | | | | $5,744 | |
| 1. | For the ten months ended June 30, 2011. The Fund changed its fiscal year end from August 31 to June 30, effective June 30, 2011. |
| 2. | After the close of business on July 9, 2010, the Fund acquired the net assets of Evergreen North Carolina Municipal Bond Fund which became the accounting and performance survivor in the transaction. The information for the periods prior to July 12, 2010 is that of Class C of Evergreen North Carolina Municipal Bond Fund. |
| 3. | Calculated based upon average shares outstanding |
| 4. | Total return calculations do not include any sales charges. Returns for periods of less than one year are not annualized. |
| 5. | Ratios include interest and fee expense relating to inverse floating-rate obligations as follows: |
| | | | |
Year ended August 31, 2008 | | | 0.05 | % |
Year ended August 31, 2007 | | | 0.09 | % |
Year ended August 31, 2006 | | | 0.03 | % |
The accompanying notes are an integral part of these financial statements.
| | | | | | |
| Financial Highlights | | Wells Fargo Advantage North Carolina Tax-Free Fund | | | 17 | |
(For a share outstanding throughout each period)
| | | | | | | | | | | | | | | | | | | | | | | | | | | | |
| | | Six Months Ended
December 31, 2011 (Unaudited) | | | Year Ended
June 30, 20111 | | | Year Ended August 31, | |
| Institutional Class | | | | 20102 | | | 20092 | | | 20082 | | | 20072 | | | 20062 | |
Net asset value, beginning of period | | $ | 9.71 | | | $ | 10.12 | | | $ | 9.64 | | | $ | 9.80 | | | $ | 10.00 | | | $ | 10.30 | | | $ | 10.44 | |
Net investment income | | | 0.19 | | | | 0.32 | | | | 0.42 | 3 | | | 0.42 | | | | 0.41 | | | | 0.41 | | | | 0.41 | |
Net realized and unrealized gains (losses) on investments | | | 0.39 | | | | (0.41 | ) | | | 0.49 | | | | (0.16 | ) | | | (0.20 | ) | | | (0.30 | ) | | | (0.13 | ) |
| | | | | | | | | | | | | | | | | | | | | | | | | | | | |
Total from investment operations | | | 0.58 | | | | (0.09 | ) | | | 0.91 | | | | 0.26 | | | | 0.21 | | | | 0.11 | | | | 0.28 | |
Distributions to shareholders from | | | | | | | | | | | | | | | | | | | | | | | | | | | | |
Net investment income | | | (0.19 | ) | | | (0.32 | ) | | | (0.43 | ) | | | (0.42 | ) | | | (0.41 | ) | | | (0.41 | ) | | | (0.41 | ) |
Net realized gains | | | 0.00 | | | | 0.00 | | | | 0.00 | | | | 0.00 | | | | 0.00 | | | | 0.00 | | | | (0.01 | ) |
| | | | | | | | | | | | | | | | | | | | | | | | | | | | |
Total distributions to shareholders | | | (0.19 | ) | | | (0.32 | ) | | | (0.43 | ) | | | (0.42 | ) | | | (0.41 | ) | | | (0.41 | ) | | | (0.42 | ) |
Net asset value, end of period | | $ | 10.10 | | | $ | 9.71 | | | $ | 10.12 | | | $ | 9.64 | | | $ | 9.80 | | | $ | 10.00 | | | $ | 10.30 | |
Total return4 | | | 6.01 | % | | | (0.79 | )% | | | 9.66 | % | | | 2.89 | % | | | 2.15 | % | | | 0.92 | % | | | 2.85 | % |
Ratios to average net assets (annualized) | | | | | | | | | | | | | | | | | | | | | | | | | | | | |
Gross expenses | | | 0.57 | % | | | 0.58 | % | | | 0.64 | % | | | 0.62 | % | | | 0.64 | %5 | | | 0.68 | %5 | | | 0.61 | %5 |
Net expenses | | | 0.54 | % | | | 0.54 | % | | | 0.63 | % | | | 0.62 | % | | | 0.64 | %5 | | | 0.68 | %5 | | | 0.61 | %5 |
Net investment income | | | 3.79 | % | | | 4.02 | % | | | 4.29 | % | | | 4.47 | % | | | 4.12 | %5 | | | 3.96 | %5 | | | 4.03 | %5 |
Supplemental data | | | | | | | | | | | | | | | | | | | | | | | | | | | | |
Portfolio turnover rate | | | 38 | % | | | 44 | % | | | 63 | % | | | 48 | % | | | 78 | % | | | 72 | % | | | 83 | % |
Net assets, end of period (000's omitted) | | | $95,705 | | | | $107,972 | | | | $150,184 | | | | $153,115 | | | | $275,112 | | | | $444,672 | | | | $555,403 | |
| 1. | For the ten months ended June 30, 2011. The Fund changed its fiscal year end from August 31 to June 30, effective June 30, 2011. |
| 2. | After the close of business on July 9, 2010, the Fund acquired the net assets of Evergreen North Carolina Municipal Bond Fund which became the accounting and performance survivor in the transaction. The information for the periods prior to July 12, 2010 is that of Class I of Evergreen North Carolina Municipal Bond Fund. |
| 3. | Calculated based upon average shares outstanding |
| 4. | Returns for periods of less than one year are not annualized. |
| 5. | Ratios include interest and fee expense relating to inverse floating-rate obligations as follows: |
| | | | |
Year ended August 31, 2008 | | | 0.05 | % |
Year ended August 31, 2007 | | | 0.09 | % |
Year ended August 31, 2006 | | | 0.03 | % |
The accompanying notes are an integral part of these financial statements.
| | | | |
| 18 | | Wells Fargo Advantage North Carolina Tax-Free Fund | | Notes to Financial Statements (Unaudited) |
1. ORGANIZATION
Wells Fargo Funds Trust (the “Trust”), a Delaware statutory trust organized on March 10, 1999, is an open-end management investment company registered under the Investment Company Act of 1940, as amended (the “1940 Act”). These financial statements report on Wells Fargo Advantage North Carolina Tax-Free Fund (the “Fund”) which is a non-diversified series of the Trust.
2. SIGNIFICANT ACCOUNTING POLICIES
The following significant accounting policies, which are consistently followed in the preparation of the financial statements of the Fund, are in conformity with U.S. generally accepted accounting principles which require management to make estimates and assumptions that affect the reported amounts of assets and liabilities, disclosure of contingent assets and liabilities at the date of the financial statements, and the reported amounts of revenues and expenses during the reporting period. Actual results could differ from those estimates.
Securities valuation
Fixed income securities with maturities exceeding 60 days are valued based on available evaluated prices received from an independent pricing service approved by the Board of Trustees which may utilize both transaction data and market information such as yield, prices of securities of comparable quality, coupon rate, maturity, type of issue, trading characteristics and other market data. If valuations are not available from the pricing service or values received are deemed not representative of market value, values will be obtained from a third party broker-dealer or determined based on the Fund’s Fair Value Procedures.
Debt securities of sufficient credit quality with original maturities of 60 days or less generally are valued at amortized cost which approximates fair value. The amortized cost method involves valuing a security at its cost, plus accretion of discount or minus amortization of premium over the period until maturity.
Investments in open-end mutual funds and non-registered investment companies are generally valued at net asset value.
Investments which are not valued using any of the methods discussed above, are valued at their fair value, as determined by procedures established in good faith and approved by the Board of Trustees.
When-issued transactions
The Fund may purchase securities on a forward commitment or ‘when-issued’ basis. The Fund records a when-issued transaction on the trade date and will segregate assets to cover its obligation by confirming the availability of qualifying assets having a value sufficient to make payment for the securities purchased. Securities purchased on a when-issued basis are marked-to-market daily and the Fund begins earning interest on the settlement date. Losses may arise due to changes in the market value of the underlying securities or if the counterparty does not perform under the contract.
Futures contracts
The Fund may be subject to interest rate risk in the normal course of pursuing its investment objectives. The Fund may buy and sell futures contracts in order to gain exposure to, or protect against, changes in security values and interest rates. The primary risks associated with the use of futures contracts are the imperfect correlation between changes in market values of securities held by the Fund and the prices of futures contracts, and the possibility of an illiquid market.
Futures contracts are valued based upon their quoted daily settlement prices when available. The aggregate principal amounts of the contracts are not recorded in the financial statements. Fluctuations in the value of the contracts are recorded in the Statement of Assets and Liabilities as an asset or liability and in the Statement of Operations as unrealized gains or losses until the contracts are closed, at which point they are recorded as net realized gains or losses on futures contracts. With futures contracts, there is minimal counterparty risk to the Fund since futures are exchange traded and the exchange’s clearinghouse, as counterparty to all exchange traded futures, guarantees the futures against default.
Security transactions and income recognition
Securities transactions are recorded on a trade date basis. Realized gains or losses are reported on the basis of identified cost of securities delivered.
Interest income is accrued daily and bond discounts are accreted and premiums are amortized daily based on the effective interest method. To the extent debt obligations are placed on non-accrual status, any related interest income may be reduced by writing off interest receivables when the collection of all or a portion of interest has become doubtful
| | | | | | |
| Notes to Financial Statements (Unaudited) | | Wells Fargo Advantage North Carolina Tax-Free Fund | | | 19 | |
based on consistently applied procedures. If the issuer subsequently resumes interest payments or when the collectability of interest is reasonably assured, the debt obligation is removed from non-accrual status.
Distributions to shareholders
Distributions to shareholders from net investment income are accrued daily and paid monthly. Distributions from net realized gains, if any, are recorded on the ex-dividend date. Such distributions are determined in conformity with income tax regulations, which may differ from generally accepted accounting principles.
Federal and other taxes
The Fund intends to continue to qualify as a regulated investment company by distributing substantially all of its investment company taxable and tax-exempt income and any net realized capital gains (after reduction for capital loss carryforwards) sufficient to relieve it from all, or substantially all, federal income taxes. Accordingly, no provision for federal income taxes was required.
The Fund’s income and federal excise tax returns and all financial records supporting those returns for the prior three fiscal years are subject to examination by the federal and Delaware revenue authorities.
Under the recently enacted Regulated Investment Company Modernization Act of 2010, the Fund is permitted to carry forward capital losses incurred in taxable years which began after December 22, 2010 for an unlimited period. However, any losses incurred are required to be utilized prior to the losses incurred in pre-enactment taxable years. As a result of this ordering rule, pre-enactment capital loss carryforwards may be more likely to expire unused. Additionally, post-enactment capital losses that are carried forward will retain their character as either short-term or long-term capital losses rather than being considered all short-term as under previous law.
At June 30, 2011, net capital loss carryforwards, which were available to offset future net realized capital gains, were as follows:
| | | | | | | | | | | | | | |
| Expiration | |
| 2015 | | | 2016 | | | 2017 | | | 2018 | |
| $ | 603,188 | | | $ | 1,458,697 | | | $ | 10,534,854 | | | $ | 3,623,438 | |
As of June 30, 2011, the Fund had $321,094 of current year deferred post–October capital losses which would be treated as realized for tax purposes on the first day of the succeeding year.
Class allocations
The separate classes of shares offered by the Fund differ principally in applicable sales charges, distribution, shareholder servicing and administration fees. Shareholders of each class bear certain expenses that pertain to that particular class. All shareholders bear the common expenses of the Fund, earn income from the portfolio, and are allocated unrealized gains and losses pro rata based on the average daily net assets of each class, without distinction between share classes. Dividends are determined separately for each class based on income and expenses allocable to each class. Realized gains and losses are allocated to each class pro rata based upon the net assets of each class on the date realized. Differences in per share dividend rates generally result from the relative weightings of pro rata income and realized gain allocations and from differences in separate class expenses, including distribution, shareholder servicing and administration fees.
3. FAIR VALUATION MEASUREMENTS
Fair value measurements of investments are determined within a framework that has established a fair value hierarchy based upon the various data inputs utilized in determining the value of the Fund’s investments. The three-level hierarchy gives the highest priority to unadjusted quoted prices in active markets for identical assets or liabilities (Level 1) and the lowest priority to significant unobservable inputs (Level 3). The Fund’s investments are classified within the fair value hierarchy based on the lowest level of input that is significant to the fair value measurement. The inputs are summarized into three broad levels as follows:
| n | | Level 1 – quoted prices in active markets for identical securities |
| n | | Level 2 – other significant observable inputs (including quoted prices for similar securities, interest rates, prepayment speeds, credit risk, etc.) |
| | | | |
| 20 | | Wells Fargo Advantage North Carolina Tax-Free Fund | | Notes to Financial Statements (Unaudited) |
| n | | Level 3 – significant unobservable inputs (including the Fund’s own assumptions in determining the fair value of investments) |
The inputs or methodologies used for valuing securities are not necessarily an indication of the risk associated with investing in those securities.
As of December 31, 2011, the inputs used in valuing the Fund’s assets, which are carried at fair value, were as follows:
| | | | | | | | | | | | | | | | |
| Investments in Securities | | Quoted Prices (Level 1) | | | Significant Other
Observable Inputs (Level 2) | | | Significant Unobservable Inputs (Level 3) | | | Total | |
Municipal bonds and notes | | $ | 0 | | | $ | 146,094,147 | | | $ | 0 | | | $ | 146,094,147 | |
Short-term investments | | | | | | | | | | | | | | | | |
U.S. Treasury securities | | | 79,997 | | | | 0 | | | | 0 | | | | 79,997 | |
| | | $ | 79,997 | | | $ | 146,094,147 | | | $ | 0 | | | $ | 146,174,144 | |
Further details on the major security types listed above can be found in the Portfolio of Investments.
As of December 31, 2011, the inputs used in valuing the Fund’s other financial instruments, which are carried at fair value, were as follows:
| | | | | | | | | | | | | | | | |
| Other financial instruments | | Quoted Prices (Level 1) | | | Significant Other
Observable Inputs (Level 2) | | | Significant Unobservable Inputs (Level 3) | | | Total | |
Futures contracts+ | | $ | (41,707 | ) | | $ | 0 | | | $ | 0 | | | $ | (41,707 | ) |
| + | Futures contracts are presented at the unrealized gains or losses on the instrument. |
Transfers in and transfers out are recognized at the end of the reporting period. For the six months ended December 31, 2011, the Fund did not have any significant transfers into/out of Level 1 and Level 2.
4. TRANSACTIONS WITH AFFILIATES AND OTHER EXPENSES
Advisory fee
The Trust has entered into an advisory contract with Wells Fargo Funds Management, LLC (“Funds Management”) an indirect wholly owned subsidiary of Wells Fargo & Company (“Wells Fargo”). The adviser is responsible for implementing investment policies and guidelines and for supervising the sub-adviser, who is responsible for day-to-day portfolio management of the Fund.
Pursuant to the contract, Funds Management is entitled to receive an annual advisory fee starting at 0.35% and declining to 0.25% as the average daily net assets of the Fund increase. For the six months ended December 31, 2011, the advisory fee was equivalent to an annual rate of 0.35% of the Fund’s average daily net assets.
Funds Management may retain the services of certain sub-advisers to provide daily portfolio management to the Fund. The fees related to sub-advisory services are borne directly by Funds Management and do not increase the overall fees paid by the Fund. Wells Capital Management Incorporated, affiliate of Funds Management, is the sub-adviser to the Fund and is entitled to receive a fee from Funds Management at an annual rate starting at 0.20% and declining to 0.10% as the average daily net assets of the Fund increase.
| | | | | | |
| Notes to Financial Statements (Unaudited) | | Wells Fargo Advantage North Carolina Tax-Free Fund | | | 21 | |
Administration and transfer agent fees
The Trust has entered into an administration agreement with Funds Management. Under this agreement, for providing administrative services, which includes paying fees and expenses for services provided by the transfer agent, sub-transfer agents, omnibus account servicers and record-keepers, Funds Management is entitled to receive from the Fund an annual fund level administration fee starting at 0.05% and declining to 0.03% as the average daily net assets of the Fund increase and a class level administration fee which is calculated based on the average daily net assets of each class as follows:
| | | | |
| | | Class Level Administration Fee | |
Class A, Class C | | | 0.16 | % |
Institutional Class | | | 0.08 | |
Funds Management has contractually waived and/or reimbursed advisory and administration fees to the extent necessary to maintain certain net operating expense ratios for the Fund. Waiver of fees and/or reimbursement of expenses by Funds Management were made first from fund level expenses on a proportionate basis and then from class specific expenses.
Distribution fees
The Trust has adopted a Distribution Plan for Class C shares of the Fund pursuant to Rule 12b-1 under the 1940 Act. Distribution fees are charged to Class C shares and paid to Wells Fargo Funds Distributor, LLC, the principal underwriter, at an annual rate of 0.75% of the average daily net assets of Class C shares.
For the six months ended December 31, 2011, Wells Fargo Funds Distributor, LLC received $486 from the sale of Class A shares.
Shareholder servicing fees
The Trust has entered into contracts with one or more shareholder servicing agents, whereby Class A and Class C of the Fund is charged a fee at an annual rate of 0.25% of the average daily net assets of each respective class.
A portion of these total shareholder servicing fees were paid to affiliates of Wells Fargo.
5. INVESTMENT PORTFOLIO TRANSACTIONS
Purchases and sales of investments, excluding U.S. Government obligations (if any) and short-term securities (securities with maturities of one year or less at purchase date), for the six months ended December 31, 2011, were $56,623,516 and $75,897,987, respectively.
6. DERIVATIVE TRANSACTIONS
During the six months ended December 31, 2011, the Fund entered into futures contracts to take advantage of the differences between municipal and treasury yields and to help shorten duration of the portfolios.
At December 31, 2011, the Fund had short futures contracts outstanding as follows:
| | | | | | | | | | | | |
| Expiration Date | | Contracts | | Type | | Contract Value at December 31,
2011 | | | Unrealized
Gains (Losses) | |
| March 2012 | | 76 Short | | 5-Year U.S. Treasury Note | | $ | 9,367,594 | | | $ | (41,707 | ) |
The Fund had an average notional amount of $8,471,781 in short futures contracts during the six months ended December 31, 2011.
On December 31, 2011, the cumulative unrealized losses on futures contracts in the amount of $41,707 is reflected in net unrealized gains on investments on the Statement of Assets and Liabilities. The payable for daily variation margin on open futures contracts reflected in the Statement of Assets and Liabilities only represents the current day's variation margin. The realized losses and change in unrealized gains (losses) on futures contracts are reflected in the Statement of Operations.
| | | | |
| 22 | | Wells Fargo Advantage North Carolina Tax-Free Fund | | Notes to Financial Statements (Unaudited) |
7. BANK BORROWINGS
The Trust (excluding the money market funds) and Wells Fargo Variable Trust are parties to a $150,000,000 revolving credit agreement with State Street Bank and Trust Company, whereby the Fund is permitted to use bank borrowings for temporary or emergency purposes, such as to fund shareholder redemption requests. Interest under the credit agreement is charged to the Fund based on a borrowing rate equal to the higher of the Federal Funds rate in effect on that day plus 1.25% or the overnight LIBOR rate in effect on that day plus 1.25%. In addition, under the credit agreement, the Fund pays an annual commitment fee equal to 0.10% of the unused balance, which is allocated pro rata. Prior to September 6, 2011, the revolving credit agreement was for $125,000,000 and the annual commitment fee paid by the Fund was 0.125% of the unused balance. For the six months ended December 31, 2011, the Fund paid $119 in commitment fees.
For the six months ended December 31, 2011, there were no borrowings by the Fund under the agreement.
8. CONCENTRATION RISK
The Fund invests a substantial portion of its assets in issuers of municipal debt securities located in a single state, therefore, it may be more affected by economic and political developments in that state or region than would be a comparable general tax-exempt mutual fund.
9. INDEMNIFICATION
Under the Trust’s organizational documents, the officers and directors are indemnified against certain liabilities that may arise out of performance of their duties to the Trust. Additionally, in the normal course of business, the Trust may enter into contracts with service providers that contain a variety of indemnification clauses. The Trust’s maximum exposure under these arrangements is dependent on future claims that may be made against the Fund and, therefore, cannot be estimated.
10. NEW ACCOUNTING PRONOUNCEMENTS
In May 2011, the Financial Accounting Standards Board (“FASB”) issued Accounting Standards Update (“ASU”) No. 2011-04 “Amendments to Achieve Common Fair Value Measurement and Disclosure Requirements in U.S. GAAP and IFRSs”. ASU No. 2011-04 amends FASB ASC Topic 820, Fair Value Measurements and Disclosures, to establish common requirements for measuring fair value and for disclosing information about fair value measurements in accordance with GAAP. The ASU is effective prospectively for interim and annual periods beginning after December 15, 2011. Management expects that adoption of the ASU will result in additional disclosures in the financial statements, as applicable.
In April 2011, FASB issued ASU No. 2011-03 “Reconsideration of Effective Control for Repurchase Agreements”. ASU No. 2011-03 amends FASB ASC Topic 860, Transfers and Servicing, specifically the criteria required to determine whether a repurchase agreement (repo) and similar agreements should be accounted for as sales of financial assets or secured borrowings with commitments. ASU No. 2011-03 changes the assessment of effective control by focusing on the transferor’s contractual rights and obligations and removing the criterion to assess its ability to exercise those rights or honor those obligations. This could result in changes to the way entities account for certain transactions including repurchase agreements, mortgage dollar rolls and reverse repurchase agreements. The ASU will become effective on a prospective basis for new transfers and modifications to existing transactions as of the beginning of the first interim or annual period beginning on or after December 15, 2011. Management has evaluated the impact of adopting the ASU and expects no significant changes.
| | | | | | |
| Other Information (Unaudited) | | Wells Fargo Advantage North Carolina Tax-Free Fund | | | 23 | |
PROXY VOTING INFORMATION
A description of the policies and procedures that the Fund uses to determine how to vote proxies relating to portfolio securities is available without charge, upon request, by calling 1-800-222-8222, visiting our Web site at www.wellsfargo.com/advantagefunds, or visiting the SEC Web site at www.sec.gov. Information regarding how the Fund voted proxies relating to portfolio securities during the most recent 12-month period ended June 30 is available without charge on the Fund’s Web site at www.wellsfargo.com/advantagefunds or by visiting the SEC Web site at www.sec.gov.
PORTFOLIO HOLDINGS INFORMATION
The complete portfolio holdings for the Fund are publicly available on the Fund’s Web site (www.wellsfargo.com/advantagefunds) on a monthly, 30-day or more delayed basis. In addition, top ten holdings information for the Fund is publicly available on the Fund’s Web site on a monthly, seven-day or more delayed basis. The Fund files its complete schedule of portfolio holdings with the SEC for the first and third quarters of each fiscal year on Form N-Q, which is available without charge by visiting the SEC Web site at www.sec.gov. In addition, the Fund’s Form N-Q may be reviewed and copied at the SEC’s Public Reference Room in Washington, DC, and at regional offices in New York City, at 233 Broadway, and in Chicago, at 175 West Jackson Boulevard, Suite 900. Information about the Public Reference Room may be obtained by calling 1-800-SEC-0330.
| | | | |
| 24 | | Wells Fargo Advantage North Carolina Tax-Free Fund | | Other Information (Unaudited) |
BOARD OF TRUSTEES
The following table provides basic information about the Board of Trustees (the “Trustees”) of the Trust and Officers of the Trust. This table should be read in conjunction with the Prospectus and the Statement of Additional Information1 of the Fund. Each of the Trustees and Officers listed below acts in identical capacities for the Wells Fargo Advantage family of funds, which consists of 138 funds comprising the Wells Fargo Funds Trust, Wells Fargo Variable Trust, Wells Fargo Master Trust and four closed-end funds (collectively the “Fund Complex”). All of the Trustees are also Members of the Audit and Governance Committees of each Trust in the Fund Complex. The mailing address of each Trustee and Officer is 525 Market Street, 12th Floor, San Francisco, CA 94105. Each Trustee and Officer serves an indefinite term, however, each Trustee serves such term until reaching the mandatory retirement age established by the Trustees.
Independent Trustees
| | | | | | |
Name and Year of Birth | | Position Held and Length of Service | | Principal Occupations During Past Five Years | | Other Directorships During
Past Five Years |
Peter G. Gordon
(Born 1942) | | Trustee, since 1998; Chairman, since 2005 (Lead Trustee since 2001) | | Co-Founder, Retired Chairman, President and CEO of Crystal Geyser Water Company. Trustee Emeritus, Colby College | | Asset Allocation Trust |
Isaiah Harris, Jr.
(Born 1952) | | Trustee, since 2009 | | Retired. Prior thereto, President and CEO of BellSouth Advertising and Publishing Corp. from 2005 to 2007, President and CEO of BellSouth Enterprises from 2004 to 2005 and President of BellSouth Consumer Services from 2000 to 2003. Emeritus member of the Iowa State University Foundation Board of Governors. Emeritus Member of the Advisory Board of Iowa State University School of Business. Mr. Harris is a certified public accountant. | | CIGNA Corporation; Deluxe Corporation; Asset Allocation Trust |
Judith M. Johnson
(Born 1949) | | Trustee, since 2008 | | Retired. Prior thereto, Chief Executive Officer and Chief Investment Officer of Minneapolis Employees Retirement Fund from 1996 to 2008. Ms. Johnson is an attorney, certified public accountant and a certified managerial accountant. | | Asset Allocation Trust |
Leroy Keith, Jr.
(Born 1939) | | Trustee, since 2010 | | Chairman, Bloc Global Services (development and construction). Trustee of the Evergreen Funds from 1983 to 2010. Former Managing Director, Almanac Capital Management (commodities firm), former Partner, Stonington Partners, Inc. (private equity fund), former Director, Obagi Medical Products Co. and former Director, Lincoln Educational Services. | | Trustee, Virtus Fund Complex (consisting of 40 portfolios as of 12/31/11); Asset Allocation Trust |
David F. Larcker
(Born 1950) | | Trustee, since 2009 | | James Irvin Miller Professor of Accounting at the Graduate School of Business, Stanford University, Director of Corporate Governance Research Program and Senior Faculty of The Rock Center for Corporate Governance since 2006. From 2005 to 2008, Professor of Accounting at the Graduate School of Business, Stanford University. Prior thereto, Ernst & Young Professor of Accounting at The Wharton School, University of Pennsylvania from 1985 to 2005. | | Asset Allocation Trust |
Olivia S. Mitchell
(Born 1953) | | Trustee, since 2006 | | International Foundation of Employee Benefit Plans Professor, Wharton School of the University of Pennsylvania since 1993. Director of Wharton’s Pension Research Council and Boettner Center on Pensions & Retirement Research, and Research Associate at the National Bureau of Economic Research. Previously, Cornell University Professor from 1978 to 1993. | | Asset Allocation Trust |
| | | | | | |
| Other Information (Unaudited) | | Wells Fargo Advantage North Carolina Tax-Free Fund | | | 25 | |
| | | | | | |
Name and Year of Birth | | Position Held and Length of Service | | Principal Occupations During Past Five Years | | Other Directorships During
Past Five Years |
Timothy J. Penny
(Born 1951) | | Trustee, since 1996 | | President and CEO of Southern Minnesota Initiative Foundation, a non-profit organization, since 2007 and Senior Fellow at the Humphrey Institute Policy Forum at the University of Minnesota since 1995. Member of the Board of Trustees of NorthStar Education Finance, Inc., a non-profit organization, since 2007. | | Asset Allocation Trust |
Michael S. Scofield
(Born 1943) | | Trustee, since 2010 | | Served on the Investment Company Institute’s Board of Governors and Executive Committee from 2008-2011 as well the Governing Council of the Independent Directors Council from 2006-2011 and the Independent Directors Council Executive Committee from 2008-2011. Chairman of the IDC from 2008-2010. Institutional Investor (Fund Directions) Trustee of Year in 2007. Trustee of the Evergreen Funds (and its predecessors) from 1984 to 2010. Chairman of the Evergreen Funds from 2000-2010. Former Trustee of the Mentor Funds. Retired Attorney, Law Offices of Michael S. Scofield and former Director and Chairman, Branded Media Corporation (multi-media branding company). | | Asset Allocation Trust |
Donald C. Willeke
(Born 1940) | | Trustee, since 1996 | | Principal of the law firm of Willeke & Daniels. General Counsel of the Minneapolis Employees Retirement Fund from 1984 until its consolidation into the Minnesota Public Employees Retirement Association on June 30, 2010. Director and Vice Chair of The Free Trust (non-profit corporation). Director of the American Chestnut Foundation (non-profit corporation). | | Asset Allocation Trust |
Officers
| | | | | | |
Name and Year of Birth | | Position Held and
Length of Service | | Principal Occupations During Past Five Years | | |
Karla M. Rabusch
(Born 1959) | | President, since 2003 | | Executive Vice President of Wells Fargo Bank, N.A. and President of Wells Fargo Funds Management, LLC since 2003. Senior Vice President and Chief Administrative Officer of Wells Fargo Funds Management, LLC from 2001 to 2003. | | |
C. David Messman
(Born 1960) | | Secretary, since 2000; Chief Legal Counsel, since 2003 | | Senior Vice President and Secretary of Wells Fargo Funds Management, LLC since 2001. Vice President and Managing Senior Counsel of Wells Fargo Bank, N.A. since 1996. | | |
Kasey Phillips
(Born 1970) | | Treasurer, since 2009 | | Senior Vice President of Wells Fargo Funds Management, LLC since 2009. Senior Vice President of Evergreen Investment Management Company, LLC from 2006 to 2010. Treasurer of the Evergreen Funds from 2005 to 2010. | | |
David Berardi
(Born 1975) | | Assistant Treasurer, since 2009 | | Vice President of Wells Fargo Funds Management, LLC since 2009. Vice President of Evergreen Investment Management Company, LLC from 2008 to 2010. Assistant Vice President of Evergreen Investment Services, Inc. from 2004 to 2008. Manager of Fund Reporting and Control for Evergreen Investment Management Company, LLC from 2004 to 2010. | | |
Jeremy DePalma
(Born 1974) | | Assistant Treasurer, since 2009 | | Senior Vice President of Wells Fargo Funds Management, LLC since 2009. Senior Vice President of Evergreen Investment Management Company, LLC from 2008 to 2010. Vice President, Evergreen Investment Services, Inc. from 2004 to 2007. Head of the Fund Reporting and Control Team within Fund Administration from 2005 to 2010. | | |
Debra Ann Early
(Born 1964) | | Chief Compliance Officer, since 2007 | | Chief Compliance Officer of Wells Fargo Funds Management, LLC since 2007. Chief Compliance Officer of Parnassus Investments from 2005 to 2007. Chief Financial Officer of Parnassus Investments from 2004 to 2007 and Senior Audit Manager of PricewaterhouseCoopers LLP from 1998 to 2004. | | |
| 1. | The Statement of Additional Information includes additional information about the Trustees and is available, without charge, upon request, by calling 1-800-222-8222 or by visiting the Web site at www.wellsfargo.com/advantagefunds. |
| | | | |
| 26 | | Wells Fargo Advantage North Carolina Tax-Free Fund | | List of Abbreviations |
The following is a list of common abbreviations for terms and entities which may have appeared in this report.
| ACB | — Agricultural Credit Bank |
| ADR | — American Depository Receipt |
| ADS | — American Depository Shares |
| AGC-ICC | — Assured Guaranty Corporation - Insured Custody Certificates |
| AGM | — Assured Guaranty Municipal |
| AMBAC | — American Municipal Bond Assurance Corporation |
| AMT | — Alternative Minimum Tax |
| BAN | — Bond Anticipation Notes |
| BHAC | — Berkshire Hathaway Assurance Corporation |
| CAB | — Capital Appreciation Bond |
| CCAB | — Convertible Capital Appreciation Bond |
| CDA | — Community Development Authority |
| CDO | — Collateralized Debt Obligation |
| COP | — Certificate of Participation |
| DRIVER | — Derivative Inverse Tax-Exempt Receipts |
| DW&P | — Department of Water & Power |
| DWR | — Department of Water Resources |
| ECFA | — Educational & Cultural Facilities Authority |
| EDA | — Economic Development Authority |
| EDFA | — Economic Development Finance Authority |
| ETF | — Exchange-Traded Fund |
| FFCB | — Federal Farm Credit Bank |
| FGIC | — Financial Guaranty Insurance Corporation |
| FHA | — Federal Housing Authority |
| FHLB | — Federal Home Loan Bank |
| FHLMC | — Federal Home Loan Mortgage Corporation |
| FNMA | — Federal National Mortgage Association |
| GDR | — Global Depository Receipt |
| GNMA | — Government National Mortgage Association |
| HCFR | — Healthcare Facilities Revenue |
| HEFA | — Health & Educational Facilities Authority |
| HEFAR | — Higher Education Facilities Authority Revenue |
| HFA | — Housing Finance Authority |
| HFFA | — Health Facilities Financing Authority |
| IBC | — Insured Bond Certificate |
| IDA | — Industrial Development Authority |
| IDAG | — Industrial Development Agency |
| IDR | — Industrial Development Revenue |
| KRW | — Republic of Korea Won |
| LIBOR | — London Interbank Offered Rate |
| LLC | — Limited Liability Company |
| LLP | — Limited Liability Partnership |
| MBIA | — Municipal Bond Insurance Association |
| MFHR | — Multi-Family Housing Revenue |
| MUD | — Municipal Utility District |
| NATL-RE | — National Public Finance Guarantee Corporation |
| PCFA | — Pollution Control Finance Authority |
| PCR | — Pollution Control Revenue |
| PFA | — Public Finance Authority |
| PFFA | — Public Facilities Financing Authority |
| PFOTER | — Puttable Floating Option Tax-Exempt Receipts |
| plc | — Public Limited Company |
| PUTTER | — Puttable Tax-Exempt Receipts |
| R&D | — Research & Development |
| RDA | — Redevelopment Authority |
| RDFA | — Redevelopment Finance Authority |
| REIT | — Real Estate Investment Trust |
| ROC | — Reset Option Certificates |
| SAVRS | — Select Auction Variable Rate Securities |
| SBA | — Small Business Authority |
| SFHR | — Single Family Housing Revenue |
| SFMR | — Single Family Mortgage Revenue |
| SPDR | — Standard & Poor’s Depositary Receipts |
| TAN | — Tax Anticipation Notes |
| TIPS | — Treasury Inflation-Protected Securities |
| TRAN | — Tax Revenue Anticipation Notes |
| TCR | — Transferable Custody Receipts |
| TTFA | — Transportation Trust Fund Authority |
| TVA | — Tennessee Valley Authority |
| XLCA | — XL Capital Assurance |


FOR MORE INFORMATION
More information about Wells Fargo Advantage Funds is available free upon request. To obtain literature, please write, e-mail, visit the Fund’s Web site, or call:
Wells Fargo Advantage Funds
P.O. Box 8266
Boston, MA 02266-8266
E-mail: wfaf@wellsfargo.com
Web site: www.wellsfargo.com/advantagefunds
Individual investors: 1-800-222-8222
Retail investment professionals: 1-888-877-9275
Institutional investment professionals: 1-866-765-0778
This report and the financial statements contained herein are submitted for the general information of the shareholders of Wells Fargo Advantage Funds. If this report is used for promotional purposes, distribution of the report must be accompanied or preceded by a current prospectus. For a prospectus containing more complete information, including charges and expenses, call 1-800-222-8222 or visit the Fund’s Web site at www.wellsfargo.com/advantagefunds. Please consider the investment objectives, risks, charges, and expenses of the investment carefully before investing. This and other information about Wells Fargo Advantage Funds can be found in the current prospectus. Read the prospectus carefully before you invest or send money.
Wells Fargo Funds Management, LLC, a wholly owned subsidiary of Wells Fargo & Company, provides investment advisory and administrative services for Wells Fargo Advantage Funds. Other affiliates of Wells Fargo & Company provide subadvisory and other services for the Funds. The Funds are distributed by Wells Fargo Funds Distributor, LLC, Member FINRA/SIPC, an affiliate of Wells Fargo & Company.
NOT FDIC INSURED ¡ NO BANK GUARANTEE ¡ MAY LOSE VALUE
© 2012 Wells Fargo Funds Management, LLC. All rights reserved.
| | |
 | | 207588 02-12 SA254/SAR254 12-11 |

Wells Fargo Advantage Pennsylvania Tax-Free Fund

Semi-Annual Report
December 31, 2011

Reduce clutter. Save trees.
Sign up for electronic delivery of prospectuses and shareholder reports at www.wellsfargo.com/advantagedelivery
Contents
The views expressed and any forward-looking statements are as of December 31, 2011, unless otherwise noted, and are those of the Fund managers and/or Wells Fargo Funds Management, LLC. Discussions of individual securities, or the markets generally, or any Wells Fargo Advantage Fund are not intended as individual recommendations. Future events or results may vary significantly from those expressed in any forward-looking statements; the views expressed are subject to change at any time in response to changing circumstances in the market. Wells Fargo Funds Management, LLC, disclaims any obligation to publicly update or revise any views expressed or forward-looking statements.
NOT FDIC INSURED ¡ NO BANK GUARANTEE ¡ MAY LOSE VALUE

WELLS FARGO INVESTMENT HISTORY
| | |
| |
| 1932 | | Keystone creates one of the first mutual fund families. |
| |
| 1971 | | Wells Fargo & Company introduces one of the first institutional index funds. |
| |
| 1978 | | Wells Fargo applies Markowitz and Sharpe’s research on Modern Portfolio Theory to introduce one of the industry’s first Tactical Asset Allocation (TAA) models in institutional separately managed accounts. |
| |
| 1984 | | Wells Fargo Stagecoach Funds launches its first asset allocation fund. |
| |
| 1989 | | The Tactical Asset Allocation (TAA) Model is first applied to Wells Fargo’s asset allocation mutual funds. |
| |
| 1994 | | Wells Fargo introduces the LifePath Funds, one of the first suites of target date funds (now the Wells Fargo Advantage Dow Jones Target Date FundsSM ). |
| |
| 1996 | | Evergreen Investments and Keystone Funds merge. |
| |
| 1997 | | Wells Fargo launches Wells Fargo Advantage WealthBuilder PortfoliosSM, a fund-of-funds suite of products that includes the use of quantitative models to shift assets among investment styles. |
| |
| 1999 | | Norwest Advantage Funds and Stagecoach Funds are reorganized into Wells Fargo Funds after the merger of Norwest and Wells Fargo. |
| |
| 2002 | | Evergreen Retail and Evergreen Institutional companies form the umbrella asset management company, Evergreen Investments. |
| |
| 2005 | | The integration of Strong Funds with Wells Fargo Funds creates Wells Fargo Advantage Funds, resulting in one of the top 20 mutual fund companies in the United States. |
| |
| 2006 | | Wells Fargo Advantage Funds relaunches the target date product line as Wells Fargo Advantage Dow Jones Target Date Funds. |
| |
| 2010 | | The mergers and reorganizations of Evergreen and Wells Fargo Advantage mutual funds are completed, unifying the families under the brand of Wells Fargo Advantage Funds. |
Wells Fargo Advantage Funds®
Wells Fargo Advantage Funds skillfully guides institutions, financial advisors, and individuals through the investment terrain to help them reach their financial objectives. Everything we do on behalf of investors is backed by our unique combination of qualifications.
Strength
Our organization is built on the standards of integrity and service established by our parent company—Wells Fargo & Company—more than 150 years ago. And, because we’re part of a highly diversified financial enterprise, we offer the depth of resources to help investors succeed.
Expertise
Our multi-boutique model offers investors access to the independent thinking of premier investment managers that have been chosen for their time-tested strategies. While each team specializes in a specific investment strategy, collectively they provide investors a wide choice of distinct investment styles. Our dedication to investment excellence doesn’t end with our expertise in manager selection—risk management, analysis, and rigorous ongoing review seek to ensure each manager’s investment process remains consistent.
Partnership
Our collaborative approach is built around understanding the needs and goals of our clients. By adhering to core principles of sound judgment and steady guidance, we support you through every stage of the investment decision process.
Carefully consider a fund’s investment objectives, risks, charges, and expenses before investing. For a current prospectus and, if available, a summary prospectus, containing this and other information, visit wellsfargo.com/advantagefunds. Read it carefully before investing.
Wells Fargo Funds Management, LLC, a wholly owned subsidiary of Wells Fargo & Company, provides investment advisory and administrative services for Wells Fargo Advantage Funds®. Other affiliates of Wells Fargo & Company provide subadvisory and other services for the Funds. The Funds are distributed by Wells Fargo Funds Distributor, LLC, Member FINRA/SIPC, an affiliate of Wells Fargo & Company.
“Dow Jones®” and “Dow Jones Target Date IndexesSM” are service marks of Dow Jones Trademark Holdings, LLC (“Dow Jones”), have been licensed to CME Group Index Services LLC (“CME Indexes”) and have been sublicensed for use for certain purposes by Global Index Advisors, Inc, and Wells Fargo Funds Management, LLC. The Wells Fargo Advantage Dow Jones Target Date FundsSM based on the Dow Jones Target Date IndexesSM, are not sponsored, endorsed, sold or promoted by Dow Jones, CME Indexes or their respective affiliates and none of them makes any representation regarding the advisability of investing in such product(s).
NOT FDIC INSURED ¡ NO BANK GUARANTEE ¡ MAY LOSE VALUE
Not part of the semi-annual report.
Wells Fargo Advantage Funds offers more than 110 mutual funds across a wide range of asset classes, representing over $216 billion in assets under management, as of December 31, 2011.
| | | | |
| Equity Funds | | | | |
Asia Pacific Fund | | Global Opportunities Fund | | Premier Large Company Growth Fund |
C&B Large Cap Value Fund | | Growth Fund | | Small Cap Opportunities Fund |
C&B Mid Cap Value Fund | | Health Care Fund | | Small Cap Value Fund |
Capital Growth Fund | | Index Fund | | Small Company Growth Fund |
Common Stock Fund | | International Equity Fund | | Small Company Value Fund |
Disciplined U.S. Core Fund | | International Value Fund | | Small/Mid Cap Core Fund |
Discovery Fund† | | Intrinsic Small Cap Value Fund | | Small/Mid Cap Value Fund |
Diversified Equity Fund | | Intrinsic Value Fund | | Social Sustainability Fund† |
Diversified International Fund | | Intrinsic World Equity Fund | | Special Mid Cap Value Fund |
Diversified Small Cap Fund | | Large Cap Core Fund | | Special Small Cap Value Fund |
Emerging Growth Fund | | Large Cap Growth Fund | | Specialized Technology Fund |
Emerging Markets Equity Fund | | Large Company Value Fund | | Strategic Large Cap Growth Fund |
Endeavor Select Fund† | | Omega Growth Fund | | Traditional Small Cap Growth Fund |
Enterprise Fund† | | Opportunity Fund† | | Utility and Telecommunications Fund |
Equity Value Fund | | Precious Metals Fund | | |
| Bond Funds | | | | |
Adjustable Rate Government Fund | | Inflation-Protected Bond Fund | | Short-Term Bond Fund |
California Limited-Term Tax-Free Fund | | Intermediate Tax/AMT-Free Fund | | Short-Term High Yield Bond Fund |
California Tax-Free Fund | | International Bond Fund | | Short-Term Municipal Bond Fund |
Colorado Tax-Free Fund | | Minnesota Tax-Free Fund | | Strategic Municipal Bond Fund |
Government Securities Fund | | Municipal Bond Fund | | Total Return Bond Fund |
High Income Fund | | North Carolina Tax-Free Fund | | Ultra Short-Term Income Fund |
High Yield Bond Fund | | Pennsylvania Tax-Free Fund | | Ultra Short-Term Municipal Income Fund |
Income Plus Fund | | Short Duration Government Bond Fund | | Wisconsin Tax-Free Fund |
| Asset Allocation Funds | | | | |
Asset Allocation Fund | | WealthBuilder Equity Portfolio† | | Target 2020 Fund† |
Conservative Allocation Fund | | WealthBuilder Growth Allocation Portfolio† | | Target 2025 Fund† |
Diversified Capital Builder Fund | | WealthBuilder Growth Balanced Portfolio† | | Target 2030 Fund† |
Diversified Income Builder Fund | | WealthBuilder Moderate Balanced Portfolio† | | Target 2035 Fund† |
Growth Balanced Fund | | WealthBuilder Tactical Equity Portfolio† | | Target 2040 Fund† |
Index Asset Allocation Fund | | Target Today Fund† | | Target 2045 Fund† |
Moderate Balanced Fund | | Target 2010 Fund† | | Target 2050 Fund† |
WealthBuilder Conservative Allocation Portfolio† | | Target 2015 Fund† | | Target 2055 Fund† |
| Money Market Funds | | | | |
100% Treasury Money Market Fund | | Heritage Money Market Fund† | | National Tax-Free Money Market Fund |
California Municipal Money Market Fund | | Money Market Fund | | Prime Investment Money Market Fund |
Cash Investment Money Market Fund | | Municipal Cash Management Money Market Fund | | Treasury Plus Money Market Fund |
Government Money Market Fund | | Municipal Money Market Fund | | |
| Variable Trust Funds1 | | | | |
VT Discovery Fund† | | VT Intrinsic Value Fund | | VT Small Cap Growth Fund |
VT Index Asset Allocation Fund | | VT Omega Growth Fund | | VT Small Cap Value Fund |
VT International Equity Fund | | VT Opportunity Fund† | | VT Total Return Bond Fund |
An investment in a money market fund is not insured or guaranteed by the Federal Deposit Insurance Corporation or any other government agency. Although the Wells Fargo Advantage Money Market Funds seek to preserve the value of your investment at $1.00 per share, it is possible to lose money by investing in a money market fund.
| 1. | The Variable Trust Funds are generally available only through insurance company variable contracts. |
| † | In this report, the Wells Fargo Advantage Discovery FundSM, Wells Fargo Advantage Endeavor Select FundSM, Wells Fargo Advantage Enterprise FundSM, Wells Fargo Advantage Opportunity FundSM, Wells Fargo Advantage Social Sustainability FundSM, Wells Fargo Advantage WealthBuilder Conservative Allocation PortfolioSM, Wells Fargo Advantage WealthBuilder Equity PortfolioSM, Wells Fargo Advantage WealthBuilder Growth Allocation PortfolioSM, Wells Fargo Advantage WealthBuilder Growth Balanced PortfolioSM, Wells Fargo Advantage WealthBuilder Moderate Balanced PortfolioSM, Wells Fargo Advantage WealthBuilder Tactical Equity PortfolioSM, Wells Fargo Advantage Dow Jones Target Today FundSM, Wells Fargo Advantage Dow Jones Target 2010 FundSM, Wells Fargo Advantage Dow Jones Target 2015 FundSM, Wells Fargo Advantage Dow Jones Target 2020 FundSM, Wells Fargo Advantage Dow Jones Target 2025 FundSM, Wells Fargo Advantage Dow Jones Target 2030 FundSM, Wells Fargo Advantage Dow Jones Target 2035 FundSM, Wells Fargo Advantage Dow Jones Target 2040 FundSM, Wells Fargo Advantage Dow Jones Target 2045 FundSM, Wells Fargo Advantage Dow Jones Target 2050 FundSM, Wells Fargo Advantage Dow Jones Target 2055 FundSM, Wells Fargo Advantage Heritage Money Market FundSM, Wells Fargo Advantage VT Discovery FundSM, and Wells Fargo Advantage VT Opportunity FundSM are referred to as the Discovery Fund, Endeavor Select Fund, Enterprise Fund, Opportunity Fund, Social Sustainability Fund, WealthBuilder Conservative Allocation Portfolio, WealthBuilder Equity Portfolio, WealthBuilder Growth Allocation Portfolio, WealthBuilder Growth Balanced Portfolio, WealthBuilder Moderate Balanced Portfolio, WealthBuilder Tactical Equity Portfolio, Target Today Fund, Target 2010 Fund, Target 2015 Fund, Target 2020 Fund, Target 2025 Fund, Target 2030 Fund, Target 2035 Fund, Target 2040 Fund, Target 2045 Fund, Target 2050 Fund, Target 2055 Fund, Heritage Money Market Fund, VT Discovery Fund, and VT Opportunity Fund, respectively. |
Not part of the semi-annual report.
| | | | |
| 2 | | Wells Fargo Advantage Pennsylvania Tax-Free Fund | | Letter to Shareholders |

Karla M. Rabusch,
President
Wells Fargo Advantage Funds
For the entire six-month period, most of the major fixed-income indexes posted solid positive returns. However, the market’s six-month return figures mask the uneven path that the financial markets traced since the summer as investors had to contend with a variety of global and domestic headwinds.
Dear Valued Shareholder:
We’re pleased to offer you this semi-annual report for the Wells Fargo Advantage Pennsylvania Tax-Free Fund for the six-month period that ended December 31, 2011. Upon reviewing the report, you may notice a few changes from past reports, the most significant of which is the change from a multi-fund report to a single-fund report. We made this change to make it easier for you to find your fund information.
For the entire six-month period, most of the major fixed-income indexes posted solid positive returns. However, the market’s six-month return figures mask the uneven path that the financial markets traced since the summer as investors had to contend with a variety of global and domestic headwinds. Whatever the future holds, we continue to believe that most investors can benefit from adhering to a well-diversified investment strategy. Over the long-term, such a strategy may allow you to balance risks and opportunities as you pursue your financial goals in a dynamic market landscape.
The economic recovery gained traction as the year progressed.
The U.S. economic recovery that began in mid-2009 has experienced a few slow patches along the way. However, the recovery regained some upward momentum during the six-month period, yet the rate of growth remained subpar compared with most previous recovery cycles.
In September 2011, it was reported that U.S. gross domestic product (GDP) grew at a mere 1.3% annual rate in the second quarter of 2011, following anemic growth at an annual rate of 0.4% in the first quarter. According to the December estimate, GDP growth accelerated to an annual rate of 1.8% in the third quarter, reigniting hopes for a sustainable recovery. Those hopes were buoyed by widespread anticipation of even stronger GDP growth in the fourth quarter. By year-end, few economists believed that the U.S. economy was in danger of sliding back into recession, although many expected a sluggish growth environment in 2012.
The struggling housing and labor markets slowed growth.
As has been the case throughout the recovery, the housing and labor markets continued to restrain economic momentum during 2011.
The beleaguered housing market has arguably exerted the biggest drag on growth. Despite intermittent signs of improvement, ongoing weakness in sales of both new and existing homes has put considerable downward pressure on prices. On the other hand, the labor market took a decided turn for the better during the final months of 2011: initial unemployment claims have eased, and the private sector has been steadily adding jobs. The pace of hiring, while not brisk, was sufficient to push the U.S. unemployment rate down to 8.5% as of December 2011—still well above its historical average but at its lowest level since February 2009. Many observers expect the unemployment rate to decline further in 2012, which could act as a tailwind for consumer spending—widely viewed as one of the keys to long-term economic growth.
The Federal Reserve announced that it will keep rates low until 2013.
Consumers have already demonstrated some resilience in their spending—even in the face of higher energy costs. Oil prices skyrocketed in early 2011 before
| | | | | | |
| Letter to Shareholders | | Wells Fargo Advantage Pennsylvania Tax-Free Fund | | | 3 | |
retreating later in the year, only to spike again during the fourth quarter. Yet “core” inflation, which excludes volatile energy and food prices, remained fairly benign throughout the year.
With inflation in check, the Federal Reserve (Fed) held its target range for the federal funds rate—a proxy for short-term interest rates—steady at 0% to 0.25%. Following its August 9, 2011 meeting, the Federal Open Market Committee issued a statement explaining that economic conditions were likely to warrant exceptionally low levels for the federal funds rate through at least mid-2013. In September, the Fed launched yet another stimulus program—dubbed “Operation Twist”—that is designed to keep intermediate- and longer-term yields relatively low. The goal with keeping longer-term rates low is to encourage lending activity to spark business investments and home purchases, which, in turn, may provide support for a more sustainable economic recovery.
Market volatility was a dominant theme during the final six-months of the year
Early on in the period, market climate shifted to one of anxiety over the increasingly fragile state of the U.S. and global economies. In addition, investors not only worried that the U.S. might be on the brink of recession, they also feared that Europe’s sovereign debt problems could spiral out of control if a Greek default triggered financial contagion across the continent. In July and August, investor sentiment was further undermined by partisan wrangling over the federal debt ceiling and the downgrade of the U.S. credit rating by Standard & Poor’s. The barrage of unsettling headlines led to heightened market volatility and an increase in risk aversion, which translated into sharply falling stock prices and higher demand for “safer” assets such as Treasuries and municipals in the third quarter of 2011. Although volatility persisted into the fourth quarter, the financial markets were able to rebound amid improved U.S. economic data and hopes for a resolution to the European crisis.
For the entire six-month period, the Barclays Capital U.S. Aggregate Bond Index1, which represents the universe of investment-grade bonds, and the Barclays Capital U.S. Treasury Index2 added 4.98% and 7.43%, respectively. By comparison, the Barclays Capital Municipal Bond Index3 gained 6.02% over the last half of the year.
Recent events have not altered our message to shareholders.
The market turmoil of 2011 and an uncertain outlook going forward have left many investors questioning their resolve—and their investments. Yet, it is precisely at such times that the market may present opportunities—as well as challenges—for prudent investors. Bear in mind that many investors who indiscriminately sold their equity investments during the severe market downturn of 2008 to 2009 missed out on the impressive two-year rally that followed. In our
| 1. | The Barclays Capital U.S. Aggregate Bond Index is composed of the Barclays Capital Government/Credit Index and the Mortgage-Backed Securities Index and includes U.S. Treasury issues, agency issues, corporate bond issues, and mortgage-backed securities. You cannot invest directly in an index. |
| 2. | The Barclays Capital U.S. Treasury Index is an index of U.S. Treasury Securities. You cannot invest directly in an index. |
| 3. | The Barclays Capital Municipal Bond Index is an unmanaged index composed of long-term tax-exempt bonds with a minimum credit rating of Baa. You cannot invest directly in an index. |
Although volatility persisted into the fourth quarter, the financial markets were able to rebound amid improved U.S. economic data and hopes for a resolution to the European crisis.
| | | | |
| 4 | | Wells Fargo Advantage Pennsylvania Tax-Free Fund | | Letter to Shareholders |
opinion, the lesson to be learned from these dramatic market events is that, for many investors, simply building and maintaining a well-diversified4 investment plan is the best long-term strategy.
Thank you for choosing to invest with Wells Fargo Advantage Funds. We appreciate your confidence in us and remain committed to helping you meet your financial needs. For current information about your fund investments, contact your investment professional, visit our website at www.wellsfargo.com/advantagefunds, or call us directly at 1-800-222-8222. We are available 24 hours a day, 7 days a week.
Sincerely,

Karla M. Rabusch
President
Wells Fargo Advantage Funds
| 4. | Diversification does not assure or guarantee better performance and cannot eliminate the risk of investment losses. |
| | | | | | |
| Letter to Shareholders | | Wells Fargo Advantage Pennsylvania Tax-Free Fund | | | 5 | |
|
|
Notice to Shareholders Effective April 1, 2012, the Fund may invest up to 10% of its total assets in inverse floaters to seek enhanced returns. Inverse floaters are derivative debt instruments created by depositing a municipal security in a trust. They pay interest at rates that generally vary inversely with specified short-term interest rates. The interest payment received on inverse floaters generally will decrease when specified short-term interest rates increase. Inverse floaters involve leverage, which may magnify the Fund’s gains or losses, and exhibit greater price and income volatility than bonds with similar maturities. We intend to limit leverage created by the Fund’s investment in inverse floaters to an amount equal to 10% of the Fund’s total assets. Inverse floaters are also subject to the risks associated with derivatives and municipal securities. |
|
|
Notice to Shareholders The Board of Trustees for Wells Fargo Advantage Funds has unanimously approved the following modifications to certain net asset value (NAV) waiver privileges and commission schedules: n Effective May 1, 2012, automatic investment plan (AIP) purchases and proceeds received from systematic withdrawals will no longer qualify for NAV repurchase privileges. n Effective May 1, 2012, discretionary rights to waive the upfront commission for Class C and “jumbo” Class A share purchases will no longer be granted to broker/dealers. However, we will continue to waive the Class C shares contingent deferred sales charge for redemptions by employer-sponsored retirement plans where the dealer of record waived its commission at the time of purchase. n Effective July 31, 2012, NAV purchase privileges for former Evergreen Class IS and Class R shareholders are being modified to remove the ability to purchase Class A shares at NAV unless those shares are held directly with the fund on or after July 31, 2012. |
| | | | |
| 6 | | Wells Fargo Advantage Pennsylvania Tax-Free Fund | | Performance Highlights (Unaudited) |
INVESTMENT OBJECTIVE
The Fund seeks current income exempt from federal income tax and Pennsylvania individual income tax.
ADVISER
Wells Fargo Funds Management, LLC
SUB-ADVISER
Wells Capital Management Incorporated
PORTFOLIO MANAGERS
Robert J. Miller
Bruce R. Johns
FUND INCEPTION
December 27, 1990
| | |
CREDIT QUALITY1 (AS OF DECEMBER 31, 2011) | | |
|
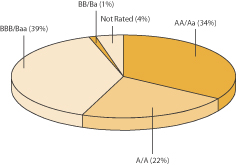 |
| | |
EFFECTIVE MATURITY DISTRIBUTION2 (AS OF DECEMBER 31, 2011) | | |
|
 |
| 1. | The ratings indicated are from Standard & Poor’s, Moody’s Investors Service, and/or Fitch Ratings Ltd. Credit Quality Ratings: Credit quality ratings apply to underlying holdings of the Fund and not the Fund itself. Standard and Poor’s rates the creditworthiness of bonds, ranging from AAA (highest) to D (lowest). Ratings from A to CCC may be modified by the addition of a plus (+) or minus (–) sign to show relative standing within the rating categories. Standard & Poor’s rates the creditworthiness of short-term notes from SP-1 (highest) to SP-3 (lowest). Ratings from A to CCC may be modified by the addition of a plus (+) or minus (–) sign to show relative standing within the rating categories. Moody’s rates the creditworthiness of bonds, ranging from Aaa (highest) to C (lowest). Ratings Aa to B may be modified by the addition of a number 1 (highest) to 3 (lowest) to show relative standing within the ratings categories. Moody’s rates the creditworthiness of short-term U.S. tax-exempt municipal securities from MIG 1/VMIG 1 (highest) to SG (lowest). Fitch rates the creditworthiness of bonds, ranging from AAA (highest) to D (lowest). If a security was rated by all three rating agencies, the middle rating was utilized. If rated by two of three rating agencies, the lower rating was utilized and if rated by one of the agencies that rating was utilized. Credit quality is subject to change and is calculated based on the total investments of the Fund. We generally define higher quality bonds as bonds that have a rating of BBB/Baa and above and lower quality bonds as bonds with a rating below BBB/Baa. |
| 2. | Effective maturity is calculated based on the total long-term investments of the Fund. It is subject to change and may have changed since the date specified. |
| | | | | | |
| Performance Highlights (Unaudited) | | Wells Fargo Advantage Pennsylvania Tax-Free Fund | | | 7 | |
AVERAGE ANNUAL TOTAL RETURN3 (%) (AS OF DECEMBER 31, 2011)
| | | | | | | | | | | | | | | | | | | | | | | | | | | | | | | | | | | | | | | | | | | | |
| | | | | | Including Sales Charge | | | Excluding Sales Charge | | | Expense Ratios4 | |
| | | Inception Date | | | 6 Months* | | | 1 Year | | | 5 Year | | | 10 Year | | | 6 Months* | | | 1 Year | | | 5 Year | | | 10 Year | | | Gross | | | Net5 | |
Class A (EKVAX) | | | 12/27/1990 | | | | 1.01 | | | | 5.62 | | | | 3.39 | | | | 3.97 | | | | 5.82 | | | | 10.57 | | | | 4.34 | | | | 4.45 | | | | 0.88% | | | | 0.74% | |
Class B (EKVBX)** | | | 02/01/1993 | | | | 0.34 | | | | 4.68 | | | | 3.19 | | | | 3.96 | | | | 5.34 | | | | 9.68 | | | | 3.54 | | | | 3.96 | | | | 1.63% | | | | 1.49% | |
Class C (EKVCX) | | | 02/01/1993 | | | | 4.34 | | | | 8.67 | | | | 3.54 | | | | 3.72 | | | | 5.34 | | | | 9.67 | | | | 3.54 | | | | 3.72 | | | | 1.63% | | | | 1.49% | |
Institutional Class (EKVYX) | | | 11/24/1997 | | | | | | | | | | | | | | | | | | | | 5.95 | | | | 10.85 | | | | 4.60 | | | | 4.73 | | | | 0.55% | | | | 0.49% | |
Barclays Capital Municipal Bond Index6 | | | | | | | | | | | | | | | | | | | | | | | 6.02 | | | | 10.70 | | | | 5.22 | | | | 5.38 | | | | | | | | | |
Barclays Capital Pennsylvania Municipal Bond Index7 | | | | | | | | | | | | | | | | | | | | | | | 6.18 | | | | 10.47 | | | | 5.43 | | | | 5.43 | | | | | | | | | |
| * | Returns for periods of less than one year are not annualized. |
| ** | Class B shares are closed to investment, except in connection with the reinvestment of any distributions and permitted exchanges. |
Figures quoted represent past performance, which is no guarantee of future results and do not reflect the deduction of taxes that a shareholder may pay on fund distributions or the redemption of fund shares. Investment return and principal value of an investment will fluctuate so that an investor’s shares, when redeemed, may be worth more or less than their original cost. Performance shown without sales charges would be lower if sales charges were reflected. Current performance may be lower or higher than the performance data quoted and assumes the reinvestment of dividends and capital gains. Current month-end performance is available on the Fund’s Web site – www.wellsfargo.com/advantagefunds.
Index returns do not include transaction costs associated with buying and selling securities, any mutual fund fees or expenses or any taxes. It is not possible to invest directly in an index.
For Class A shares, the maximum front-end sales charge is 4.50%. For Class B shares, the maximum contingent deferred sales charge is 5.00%. For Class C shares, the maximum contingent deferred sales charge is 1.00%. Performance including sales charge assumes the sales charge for the corresponding time period. Institutional Class shares are sold without a front-end sales charge or contingent deferred sales charge.
Bond fund values fluctuate in response to the financial condition of individual issuers, general market and economic conditions, and changes in interest rates. In general, when interest rates rise, bond fund values fall and investors may lose principal value. The use of derivatives may reduce returns and/or increase volatility. Certain investment strategies tend to increase the total risk of an investment (relative to the broader market). This Fund is exposed to Pennsylvania municipal securities risk, high-yield securities risk, and non-diversification risk. Consult the Fund’s prospectus for additional information on these and other risks. A portion of the Fund’s income may be subject to federal, state, and/or local income taxes or the alternative minimum tax (AMT). Any capital gains distributions may be taxable.
| 3. | Historical performance shown for all classes of the Fund prior to July 12, 2010 is based on the performance of the Fund’s predecessor, Evergreen Pennsylvania Municipal Bond Fund. |
| 4. | Reflects the expense ratios as stated in the most recent prospectuses. |
| 5. | The Adviser has committed through July 11, 2013 to waive fees and/or reimburse expenses to the extent necessary to cap the Fund’s Total Annual Fund Operating Expenses After Fee Waiver, excluding certain expenses, at the amounts shown above. Without this cap, the Fund’s returns would have been lower. |
| 6. | The Barclays Capital Municipal Bond Index is an unmanaged index composed of long-term tax-exempt bonds with a minimum credit rating of Baa. You cannot invest directly in an index. |
| 7. | The Barclays Capital Pennsylvania Municipal Bond Index is the Pennsylvania component of the Barclays Capital Municipal Bond Index. You cannot invest directly in an index. |
| | | | |
| 8 | | Wells Fargo Advantage Pennsylvania Tax-Free Fund | | Fund Expenses (Unaudited) |
As a shareholder of the Fund, you incur two types of costs: (1) transaction costs, including sales charges (loads) on purchase payments and contingent deferred sales charges (if any) on redemptions and (2) ongoing costs, including management fees; distribution (12b-1) and/or shareholder service fees; and other Fund expenses. This example is intended to help you understand your ongoing costs (in dollars) of investing in the Fund and to compare these costs with the ongoing costs of investing in other mutual funds.
The example is based on an investment of $1,000 invested at the beginning of the six-month period and held for the entire period from July 1, 2011 to December 31, 2011.
Actual Expenses
The “Actual” line of the table below provides information about actual account values and actual expenses. You may use the information in this line, together with the amount you invested, to estimate the expenses that you paid over the period. Simply divide your account value by $1,000 (for example, an $8,600 account value divided by $1,000 = 8.6), then multiply the result by the number in the “Actual” line under the heading entitled “Expenses Paid During Period” for your applicable class of shares to estimate the expenses you paid on your account during this period.
Hypothetical Example for Comparison Purposes
The “Hypothetical” line of the table below provides information about hypothetical account values and hypothetical expenses based on the Fund’s actual expense ratio and an assumed rate of return of 5% per year before expenses, which is not the Fund’s actual return. The hypothetical account values and expenses may not be used to estimate the actual ending account balance or expenses you paid for the period. You may use this information to compare the ongoing costs of investing in the Fund and other funds. To do so, compare this 5% hypothetical example with the 5% hypothetical examples that appear in the shareholder reports of the other funds.
Please note that the expenses shown in the table are meant to highlight your ongoing costs only and do not reflect any transactional costs, such as sales charges (loads) and contingent deferred sales charges. Therefore, the “Hypothetical” line of the table is useful in comparing ongoing costs only, and will not help you determine the relative total costs of owning different funds. In addition, if these transactional costs were included, your costs would have been higher.
| | | | | | | | | | | | | | | | |
| | | Beginning
Account Value
07-01-2011 | | | Ending
Account Value
12-31-2011 | | | Expenses
Paid During
the Period1 | | | Net Annual
Expense Ratio | |
Class A | | | | | | | | | | | | | | | | |
Actual | | $ | 1,000.00 | | | $ | 1,058.19 | | | $ | 3.88 | | | | 0.75 | % |
Hypothetical (5% return before expenses) | | $ | 1,000.00 | | | $ | 1,021.37 | | | $ | 3.81 | | | | 0.75 | % |
Class B | | | | | | | | | | | | | | | | |
Actual | | $ | 1,000.00 | | | $ | 1,053.43 | | | $ | 7.74 | | | | 1.50 | % |
Hypothetical (5% return before expenses) | | $ | 1,000.00 | | | $ | 1,017.60 | | | $ | 7.61 | | | | 1.50 | % |
Class C | | | | | | | | | | | | | | | | |
Actual | | $ | 1,000.00 | | | $ | 1,053.37 | | | $ | 7.74 | | | | 1.50 | % |
Hypothetical (5% return before expenses) | | $ | 1,000.00 | | | $ | 1,017.60 | | | $ | 7.61 | | | | 1.50 | % |
Institutional Class | | | | | | | | | | | | | | | | |
Actual | | $ | 1,000.00 | | | $ | 1,059.51 | | | $ | 2.59 | | | | 0.50 | % |
Hypothetical (5% return before expenses) | | $ | 1,000.00 | | | $ | 1,022.62 | | | $ | 2.54 | | | | 0.50 | % |
| 1. | Expenses paid is equal to the annualized expense ratio of each class multiplied by the average account value over the period, multiplied by the number of days in the most recent fiscal half-year divided by the number of days in the fiscal year (to reflect the one-half year period). |
| | | | | | |
| Portfolio of Investments—December 31, 2011 (Unaudited) | | Wells Fargo Advantage Pennsylvania Tax-Free Fund | | | 9 | |
| | | | | | | | | | | | | | | | |
| Security Name | | Interest Rate | | | Maturity Date | | | Principal | | | Value | |
| | | | | | | | | | | | | | | | |
| | | | |
Municipal Bonds and Notes: 98.54% | | | | | | | | | | | | | | | | |
| | | | |
| Florida: 0.41% | | | | | | | | | | | | | | | | |
Jacksonville FL Economic Development AMT Metropolitan Parking Solutions Project (IDR, ACA Insured) | | | 5.50 | % | | | 10/01/2030 | | | $ | 1,000,000 | | | $ | 1,012,400 | |
| | | | | | | | | | | | | | | | |
| | | | |
| Pennsylvania: 90.87% | | | | | | | | | | | | | | | | |
Allegheny County PA Airport AMT Pittsburgh International Airport Series A (Airport Revenue, AGM Insured) | | | 5.00 | | | | 01/01/2017 | | | | 1,145,000 | | | | 1,251,199 | |
Allegheny County PA Higher Education Building Authority Chatham College Series A (Education Revenue) | | | 5.38 | | | | 09/01/2028 | | | | 5,000,000 | | | | 5,000,250 | |
Allegheny County PA Hospital Development Authority University of Pittsburgh Medical Center Health System Series A (Health Revenue) | | | 5.00 | | | | 09/01/2018 | | | | 1,000,000 | | | | 1,184,150 | |
Allegheny County PA Hospital Development Authority University of Pittsburgh Medical Center Series A-1 (Health Revenue)± | | | 1.01 | | | | 02/01/2021 | | | | 4,000,000 | | | | 3,645,120 | |
Allegheny County PA Port Authority Refunding Transportation (Tax Revenue) | | | 5.75 | | | | 03/01/2029 | | | | 3,000,000 | | | | 3,404,430 | |
Allegheny County PA Sanitation Authority (Water & Sewer Revenue, AGM Insured) | | | 5.00 | | | | 06/01/2030 | | | | 1,880,000 | | | | 2,068,677 | |
Allegheny County PA Series C-65 (GO - Local) | | | 5.50 | | | | 05/01/2024 | | | | 4,675,000 | | | | 5,332,773 | |
Berks County PA Municipal Hospital Authority Reading Hospital & Medical Center Project (Health Revenue, NATL-RE Insured) | | | 5.70 | | | | 10/01/2014 | | | | 1,145,000 | | | | 1,217,547 | |
Bethlehem PA Water Authority (Water & Sewer Revenue) | | | 5.00 | | | | 11/15/2016 | | | | 1,500,000 | | | | 1,620,975 | |
Bucks County PA IDA Lane Charter School Project Series A (Education Revenue) 144A | | | 4.88 | | | | 03/15/2027 | | | | 1,700,000 | | | | 1,533,604 | |
Chester County PA IDA Avon Grove Charter School Project Series A (Education Revenue) | | | 5.65 | | | | 12/15/2017 | | | | 695,000 | | | | 703,451 | |
Chester County PA IDA Avon Grove Charter School Project Series A (Education Revenue) | | | 6.25 | | | | 12/15/2027 | | | | 2,370,000 | | | | 2,264,108 | |
Chester County PA IDA Renaissance Academy Project Series A (Miscellaneous Revenue) | | | 5.63 | | | | 10/01/2015 | | | | 1,565,000 | | | | 1,564,859 | |
Cumberland County PA Municipal Authority Diakon Lutheran Ministries Project (Health Revenue) | | | 5.00 | | | | 01/01/2036 | | | | 5,000,000 | | | | 4,650,150 | |
Cumberland County PA Municipal Authority Dickinson College Series HH1 (Education Revenue) | | | 5.00 | | | | 11/01/2039 | | | | 1,200,000 | | | | 1,272,516 | |
Dauphin County PA (GO - Local, XLCA Insured) | | | 5.00 | | | | 11/15/2022 | | | | 1,000,000 | | | | 1,102,270 | |
Dauphin County PA General Authority Office & Parking Riverfront Office Project (Lease Revenue) | | | 6.00 | | | | 01/01/2025 | | | | 3,845,000 | | | | 3,095,917 | |
Delaware County PA IDA Chester Community Charter School Series A (Education Revenue) | | | 5.00 | | | | 08/15/2020 | | | | 1,795,000 | | | | 1,760,428 | |
Delaware Valley PA Regional Finance Series B (Miscellaneous Revenue)± | | | 2.15 | | | | 06/01/2042 | | | | 1,000,000 | | | | 1,000,000 | |
Delaware Valley PA Regional Financial Authority Local Government Series A (Miscellaneous Revenue, AMBAC Insured) | | | 5.50 | | | | 08/01/2028 | | | | 4,050,000 | | | | 4,405,509 | |
Delaware Valley PA Regional Financial Authority Local Government Series B (Miscellaneous Revenue, AMBAC Insured) | | | 5.60 | | | | 07/01/2017 | | | | 2,000,000 | | | | 2,291,440 | |
General Authority of South Central Pennsylvania Association of Independent Colleges and Universities (Education Revenue) | | | 6.00 | | | | 11/01/2031 | | | | 2,500,000 | | | | 2,803,375 | |
Harrisburg PA Authority Resource Recovery Facility Series D-1 (Resource Recovery Revenue, AGM Insured)± | | | 5.25 | | | | 12/01/2033 | | | | 1,500,000 | | | | 1,494,045 | |
Latrobe PA IDA Saint Vincent College Project (Education Revenue) | | | 5.38 | | | | 05/01/2024 | | | | 1,280,000 | | | | 1,281,050 | |
Lebanon County PA Health Facilities Authority Pleasant View Retirement Series A (Health Revenue) | | | 5.00 | | | | 12/15/2014 | | | | 1,130,000 | | | | 1,124,768 | |
Lebanon County PA Health Facilities Authority Pleasant View Retirement Series A (Health Revenue) | | | 5.00 | | | | 12/15/2015 | | | | 1,085,000 | | | | 1,071,210 | |
Lehigh County PA General Purpose Authority Cedar Crest College (Education Revenue, Radian Insured) | | | 5.00 | | | | 04/01/2021 | | | | 2,185,000 | | | | 2,229,246 | |
| | | | |
| 10 | | Wells Fargo Advantage Pennsylvania Tax-Free Fund | | Portfolio of Investments—December 31, 2011 (Unaudited) |
| | | | | | | | | | | | | | | | |
| Security Name | | Interest Rate | | | Maturity Date | | | Principal | | | Value | |
| | | | | | | | | | | | | | | | |
| | | | |
| Pennsylvania (continued) | | | | | | | | | | | | | | | | |
Lehigh County PA General Purpose Authority Lehigh Valley Hospital Incorporated Series A (Health Revenue, NATL-RE GO of Hospital Insured) | | | 7.00 | % | | | 07/01/2016 | | | $ | 1,900,000 | | | $ | 2,142,839 | |
Lycoming County PA Education Authority Pennsylvania College of Technology Project (Education Revenue) | | | 5.50 | | | | 07/01/2026 | | | | 3,000,000 | | | | 3,370,500 | |
McKeesport PA Municipal Authority (Water & Sewer Revenue) | | | 5.50 | | | | 12/15/2027 | | | | 2,405,000 | | | | 2,747,737 | |
Montgomery County PA HEFA Abington Memorial Hospital Series A (Health Revenue) | | | 5.00 | | | | 06/01/2022 | | | | 7,000,000 | | | | 7,341,670 | |
Montgomery County PA HEFA Arcadia University (Education Revenue, Radian Insured) | | | 5.00 | | | | 04/01/2027 | | | | 4,960,000 | | | | 5,016,395 | |
Montgomery County PA IDA ACTS Retirement Community Series B (Health Revenue) | | | 5.00 | | | | 11/15/2016 | | | | 2,500,000 | | | | 2,683,425 | |
Montgomery County PA IDA ACTS Retirement Community Series B (Health Revenue) | | | 5.00 | | | | 11/15/2022 | | | | 6,000,000 | | | | 6,131,820 | |
Montgomery County PA IDA New Regulatory Medical Center Project (Health Revenue, FHA Insured) | | | 5.00 | | | | 08/01/2020 | | | | 985,000 | | | | 1,150,322 | |
Mount Lebanon PA Hospital Authority Saint Clair Memorial Hospital Series A (Health Revenue) | | | 5.50 | | | | 07/01/2022 | | | | 4,400,000 | | | | 4,436,256 | |
New Morgan PA Municipal Authority Commonwealth Office Project Series A (Miscellaneous Revenue) | | | 6.50 | | | | 06/01/2025 | | | | 2,560,000 | | | | 2,346,138 | |
Pennsylvania EDFA 30th Street Station Garage Project (Transportation Revenue, ACA Insured) | | | 5.00 | | | | 06/01/2013 | | | | 1,980,000 | | | | 2,041,182 | |
Pennsylvania EDFA 30th Street Station Garage Project (Transportation Revenue, ACA Insured) | | | 5.80 | | | | 06/01/2023 | | | | 3,515,000 | | | | 3,599,079 | |
Pennsylvania EDFA Colver Project Series G (Resource Recovery Revenue) | | | 5.13 | | | | 12/01/2015 | | | | 1,150,000 | | | | 1,136,039 | |
Pennsylvania EDFA Dr. Gertrude A. Barber Center (Health Revenue, Radian Insured) | | | 5.90 | | | | 12/01/2030 | | | | 1,000,000 | | | | 1,000,270 | |
Pennsylvania HEFAR Allegheny Delaware Valley Obligation Series B (Health Revenue, NATL-RE Insured) | | | 5.88 | | | | 11/15/2021 | | | | 1,130,000 | | | | 1,089,365 | |
Pennsylvania HEFAR Association of Independent Colleges & University Series FF2 (Education Revenue, Radian Insured) | | | 5.00 | | | | 12/15/2024 | | | | 3,070,000 | | | | 3,157,526 | |
Pennsylvania HEFAR Lasalle University Series A (Education Revenue) | | | 5.25 | | | | 05/01/2027 | | | | 5,250,000 | | | | 5,463,465 | |
Pennsylvania HEFAR Shippensburg University Project (Education Revenue) | | | 5.00 | | | | 10/01/2020 | | | | 1,410,000 | | | | 1,451,186 | |
Pennsylvania HEFAR Shippensburg University Project (Education Revenue) | | | 6.00 | | | | 10/01/2031 | | | | 3,000,000 | | | | 3,095,760 | |
Pennsylvania HEFAR Shippensburg University Project (Education Revenue) | | | 6.25 | | | | 10/01/2043 | | | | 1,380,000 | | | | 1,422,504 | |
Pennsylvania HEFAR Widener University (Education Revenue) | | | 5.25 | | | | 07/15/2024 | | | | 2,000,000 | | | | 2,044,200 | |
Pennsylvania HEFAR Widener University (Education Revenue) | | | 5.40 | | | | 07/15/2036 | | | | 4,500,000 | | | | 4,546,890 | |
Pennsylvania HFA Single Family Series 106-B (Housing Revenue, GO of Agency Insured) | | | 4.50 | | | | 10/01/2024 | | | | 5,010,000 | | | | 5,239,959 | |
Pennsylvania Housing Finance Agency Single Family Series 108-B (Housing Revenue) | | | 4.50 | | | | 10/01/2024 | | | | 1,825,000 | | | | 1,907,508 | |
Pennsylvania Housing Finance Agency Single Family Series 108-B (Housing Revenue) | | | 4.75 | | | | 10/01/2028 | | | | 1,025,000 | | | | 1,054,387 | |
Pennsylvania Housing Finance Agency Single Family Series 112 (Housing Revenue) | | | 5.00 | | | | 04/01/2028 | | | | 4,890,000 | | | | 5,349,562 | |
Pennsylvania State University Series A (Education Revenue, GO of University Insured) | | | 5.00 | | | | 03/01/2023 | | | | 3,000,000 | | | | 3,461,490 | |
Pennsylvania Turnpike Commission Series A (Miscellaneous Revenue, AGM Insured) | | | 5.25 | | | | 07/15/2021 | | | | 3,545,000 | | | | 4,386,973 | |
Pennsylvania Turnpike Commission Series A (Transportation Revenue, AMBAC Insured) | | | 5.50 | | | | 12/01/2031 | | | | 2,000,000 | | | | 2,151,360 | |
Pennsylvania Turnpike Commission Series C (Transportation Revenue, Assured Guaranty Insured) | | | 6.25 | | | | 06/01/2038 | | | | 10,000,000 | | | | 11,594,000 | |
Philadelphia PA IDA First Philadelphia Charter Series A (Education Revenue) | | | 5.30 | | | | 08/15/2017 | | | | 845,000 | | | | 855,596 | |
| | | | | | |
| Portfolio of Investments—December 31, 2011 (Unaudited) | | Wells Fargo Advantage Pennsylvania Tax-Free Fund | | | 11 | |
| | | | | | | | | | | | | | | | |
| Security Name | | Interest Rate | | | Maturity Date | | | Principal | | | Value | |
| | | | | | | | | | | | | | | | |
| | | | |
| Pennsylvania (continued) | | | | | | | | | | | | | | | | |
Philadelphia PA IDA First Philadelphia Charter Series A (Education Revenue) | | | 5.63 | % | | | 08/15/2025 | | | $ | 3,540,000 | | | $ | 3,317,192 | |
Philadelphia PA IDA Global Leadership Academy Project (Miscellaneous Revenue) | | | 5.13 | | | | 11/15/2020 | | | | 2,000,000 | | | | 1,936,180 | |
Philadelphia PA IDA Global Leadership Academy Project (Miscellaneous Revenue) | | | 5.75 | | | | 11/15/2030 | | | | 250,000 | | | | 230,523 | |
Philadelphia PA IDA Series A (Miscellaneous Revenue) | | | 5.30 | | | | 09/15/2027 | | | | 5,150,000 | | | | 4,565,321 | |
Philadelphia PA IDA West Philadelphia Achievement Charter Elementary School Project (Miscellaneous Revenue) | | | 7.50 | | | | 05/01/2031 | | | | 1,285,000 | | | | 1,321,237 | |
Philadelphia PA Municipal Authority Series B (Lease Revenue, AGM Insured) | | | 5.25 | | | | 11/15/2016 | | | | 2,400,000 | | | | 2,527,560 | |
Philadelphia PA Redevelopment Authority Neighborhood Transformation Series A (Miscellaneous Revenue, NATL-RE FGIC Insured) | | | 5.50 | | | | 04/15/2016 | | | | 1,000,000 | | | | 1,013,250 | |
Philadelphia PA Redevelopment Authority Neighborhood Transformation Series A (Miscellaneous Revenue, NATL-RE FGIC Insured) | | | 5.50 | | | | 04/15/2022 | | | | 500,000 | | | | 504,900 | |
Philadelphia PA School District Series C (Education Revenue, State Aid Withholding Insured) | | | 5.00 | | | | 09/01/2018 | | | | 3,000,000 | | | | 3,410,610 | |
Philadelphia PA School District Series C (Education Revenue, State Aid Withholding Insured) | | | 5.00 | | | | 09/01/2021 | | | | 1,395,000 | | | | 1,597,359 | |
Philadelphia PA School District Series E (Education Revenue, State Aid Withholding Insured) | | | 5.00 | | | | 09/01/2020 | | | | 1,000,000 | | | | 1,137,730 | |
Philadelphia PA Water & Wastewater Series C (Water & Sewer Revenue, AGM Insured) | | | 5.00 | | | | 08/01/2019 | | | | 1,000,000 | | | | 1,200,350 | |
Pittsburgh & Allegheny County PA Sports & Exhibition Authority (Tax Revenue, AGM Insured) | | | 5.00 | | | | 02/01/2020 | | | | 1,900,000 | | | | 2,205,767 | |
Pittsburgh & Allegheny County PA Sports & Exhibition Authority (Tax Revenue, AGM Insured) | | | 5.00 | | | | 02/01/2031 | | | | 3,000,000 | | | | 3,207,090 | |
Pittsburgh PA Public Parking Authority Series A (Miscellaneous Revenue, NATL-RE FGIC Insured) | | | 5.00 | | | | 12/01/2025 | | | | 2,500,000 | | | | 2,577,875 | |
Reading PA Series A (GO - Local, AGM Insured) | | | 5.00 | | | | 11/15/2018 | | | | 2,155,000 | | | | 2,379,314 | |
Red Lion PA Area School District (Tax Revenue, FSA State Aid Withholding Insured) | | | 5.00 | | | | 05/01/2023 | | | | 2,495,000 | | | | 2,836,391 | |
Scranton PA School District (Tax Revenue, AGM State Aid Withholding Insured) | | | 4.00 | | | | 04/01/2018 | | | | 1,020,000 | | | | 1,153,283 | |
Southeastern Pennsylvania Transportation Authority (Transportation Revenue) | | | 5.00 | | | | 06/01/2028 | | | | 4,000,000 | | | | 4,353,840 | |
St. Marys Hospital Authority Catholic Health East Project Series B (Health Revenue) | | | 5.00 | | | | 11/15/2016 | | | | 975,000 | | | | 1,047,472 | |
St. Marys Hospital Authority Catholic Health East Project Series B (Health Revenue) | | | 5.00 | | | | 11/15/2017 | | | | 1,025,000 | | | | 1,096,309 | |
State Public School Building Authority Chester Upland School Project Series C (Lease Revenue, AGM State Aid Withholding Insured) | | | 5.00 | | | | 09/15/2026 | | | | 875,000 | | | | 967,024 | |
State Public School Building Authority Northampton County Area Community College Project (Education Revenue) | | | 5.50 | | | | 03/01/2031 | | | | 5,000,000 | | | | 5,466,250 | |
Washington County PA Hospital Authority Monongahela Valley Hospital Project (Health Revenue) | | | 5.50 | | | | 06/01/2017 | | | | 2,385,000 | | | | 2,461,630 | |
Washington County PA Hospital Authority Monongahela Valley Hospital Project (Health Revenue) | | | 6.25 | | | | 06/01/2022 | | | | 1,750,000 | | | | 1,811,723 | |
Wilkes-Barre PA Finance Authority University of Scranton (Education Revenue) | | | 5.00 | | | | 11/01/2020 | | | | 1,005,000 | | | | 1,199,980 | |
Wilkes-Barre PA Finance Authority Wilkes University Project (Education Revenue) | | | 5.00 | | | | 03/01/2027 | | | | 2,600,000 | | | | 2,608,034 | |
| | | | |
| | | | | | | | | | | | | | | 221,922,664 | |
| | | | | | | | | | | | | | | | |
| | | | |
| 12 | | Wells Fargo Advantage Pennsylvania Tax-Free Fund | | Portfolio of Investments—December 31, 2011 (Unaudited) |
| | | | | | | | | | | | | | | | |
| Security Name | | Interest Rate | | | Maturity Date | | | Principal | | | Value | |
| | | | | | | | | | | | | | | | |
| | | | |
| Puerto Rico: 2.10% | | | | | | | | | | | | | | | | |
Puerto Rico Electric Power Authority LIBOR Series UU (Utilities Revenue, AGM Insured)± | | | 0.77 | % | | | 07/01/2029 | | | $ | 6,000,000 | | | $ | 3,893,100 | |
Puerto Rico Highway & Transportation Authority Series AA-1 (Transportation Revenue) | | | 4.95 | | | | 07/01/2026 | | | | 1,175,000 | | | | 1,228,909 | |
| | | | |
| | | | | | | | | | | | | | | 5,122,009 | |
| | | | | | | | | | | | | | | | |
| | | | |
| South Carolina: 1.47% | | | | | | | | | | | | | | | | |
Charleston SC Educational Excellence Finance Corporation (Lease Revenue)±(h) | | | 5.25 | | | | 12/01/2025 | | | | 3,230,000 | | | | 3,582,813 | |
| | | | | | | | | | | | | | | | |
| | | | |
| Tennessee: 1.16% | | | | | | | | | | | | | | | | |
Tennessee Energy Acquisition Corporation Series C (Energy Revenue) | | | 5.00 | | | | 02/01/2020 | | | | 2,850,000 | | | | 2,829,308 | |
| | | | | | | | | | | | | | | | |
| | | | |
| Virgin Islands: 2.53% | | | | | | | | | | | | | | | | |
Virgin Islands PFA Senior Lien Series A (Tax Revenue) | | | 5.00 | | | | 10/01/2029 | | | | 2,000,000 | | | | 2,039,620 | |
Virgin Islands PFA Senior Lien Series B (Tax Revenue) | | | 5.00 | | | | 10/01/2025 | | | | 4,000,000 | | | | 4,153,280 | |
| | | | |
| | | | | | | | | | | | | | | 6,192,900 | |
| | | | | | | | | | | | | | | | |
| | | | |
Total Municipal Bonds and Notes (Cost $233,674,476) | | | | | | | | | | | | | | | 240,662,094 | |
| | | | | | | | | | | | | | | | |
| | | | |
| | | Yield | | | | | | Shares | | | | |
| | | | |
Short-Term Investments: 0.38% | | | | | | | | | | | | | | | | |
| | | | |
| Investment Companies: 0.34% | | | | | | | | | | | | | | | | |
Wells Fargo Advantage National Tax-Free Money Market Fund, Institutional Class(l)(u) | | | 0.01 | | | | | | | | 828,004 | | | | 828,004 | |
| | | | | | | | | | | | | | | | |
| | | | |
| | | | | | | | | Principal | | | | |
| | | | |
| U.S. Treasury Securities: 0.04% | | | | | | | | | | | | | | | | |
U.S. Treasury Bill# | | | 0.02 | | | | 03/29/2012 | | | $ | 100,000 | | | | 99,996 | |
| | | | | | | | | | | | | | | | |
| | | | |
Total Short-Term Investments (Cost $928,001) | | | | | | | | | | | | | | | 928,000 | |
| | | | | | | | | | | | | | | | |
| | | | | | | | |
| Total Investments in Securities | | | | | | | | |
| (Cost $234,602,477)* | | | 98.92 | % | | | 241,590,094 | |
Other Assets and Liabilities, Net | | | 1.08 | | | | 2,635,931 | |
| | | | | | | | |
| Total Net Assets | | | 100.00 | % | | $ | 244,226,025 | |
| | | | | | | | |
| ± | Variable rate investment. |
| 144A | Security that may be resold to “qualified institutional buyers” under Rule 144A or security offered pursuant to Section 4(2) of the Securities Act of 1933, as amended. |
| (h) | Underlying security in inverse floater structure. |
| (l) | Investment in an affiliate. |
| (u) | Rate shown is the 7-day annualized yield at period end. |
| # | All or a portion of this security is segregated as collateral for investments in derivative instruments. |
| * | Cost for federal income tax purposes is $234,721,100 and net unrealized appreciation (depreciation) consists of: |
| | | | |
Gross unrealized appreciation | | $ | 9,729,346 | |
Gross unrealized depreciation | | | (2,860,352 | ) |
| | | | |
Net unrealized appreciation | | $ | 6,868,994 | |
The accompanying notes are an integral part of these financial statements.
| | | | | | |
| Statement of Assets and Liabilities—December 31, 2011 (Unaudited) | | Wells Fargo Advantage Pennsylvania Tax-Free Fund | | | 13 | |
| | | | |
| | | | |
| |
Assets | | | | |
Investments | | | | |
In unaffiliated securities, at value | | $ | 240,762,090 | |
In affiliated securities, at value | | | 828,004 | |
| | | | |
Total investments, at value (see cost below) | | | 241,590,094 | |
Receivable for investments sold | | | 2,246,185 | |
Receivable for Fund shares sold | | | 14,649 | |
Receivable for interest | | | 2,948,763 | |
Prepaid expenses and other assets | | | 48,019 | |
| | | | |
Total assets | | | 246,847,710 | |
| | | | |
| |
Liabilities | | | | |
Dividends payable | | | 746,585 | |
Payable for floating-rate notes issued | | | 1,615,000 | |
Payable for Fund shares redeemed | | | 70,522 | |
Payable for daily variation margin on open futures contracts | | | 10,828 | |
Advisory fee payable | | | 59,565 | |
Distribution fees payable | | | 8,229 | |
Due to other related parties | | | 34,106 | |
Accrued expenses and other liabilities | | | 76,850 | |
| | | | |
Total liabilities | | | 2,621,685 | |
| | | | |
Total net assets | | $ | 244,226,025 | |
| | | | |
| |
NET ASSETS CONSIST OF | | | | |
Paid-in capital | | $ | 253,256,360 | |
Overdistributed net investment income | | | (345,731 | ) |
Accumulated net realized losses on investments | | | (15,637,648 | ) |
Net unrealized gains on investments | | | 6,953,044 | |
| | | | |
Total net assets | | $ | 244,226,025 | |
| | | | |
| |
COMPUTATION OF NET ASSET VALUE AND OFFERING PRICE PER SHARE1 | | | | |
Net assets – Class A | | $ | 43,988,740 | |
Shares outstanding – Class A | | | 3,880,697 | |
Net asset value per share – Class A | | | $11.34 | |
Maximum offering price per share – Class A2 | | | $11.87 | |
Net assets – Class B | | $ | 2,815,878 | |
Shares outstanding – Class B | | | 249,345 | |
Net asset value per share – Class B | | | $11.29 | |
Net assets – Class C | | $ | 8,986,678 | |
Shares outstanding – Class C | | | 794,283 | |
Net asset value per share – Class C | | | $11.31 | |
Net assets – Institutional Class | | $ | 188,434,729 | |
Shares outstanding – Institutional Class | | | 16,623,936 | |
Net asset value per share – Institutional Class | | | $11.34 | |
| |
Total investments, at cost | | $ | 234,602,477 | |
| | | | |
| 1. | The Fund has an unlimited number of authorized shares. |
| 2. | Maximum offering price is computed as 100/95.50 of net asset value. On investments of $50,000 or more, the offering price is reduced. |
The accompanying notes are an integral part of these financial statements.
| | | | |
| 14 | | Wells Fargo Advantage Pennsylvania Tax-Free Fund | | Statement of Operations—Six Months Ended December 31, 2011 (Unaudited) |
| | | | |
| | | | |
| |
Investment income | | | | |
Interest | | $ | 6,099,682 | |
Income from affiliated securities | | | 83 | |
| | | | |
Total investment income | | | 6,099,765 | |
| | | | |
| |
Expenses | | | | |
Advisory fee | | | 456,166 | |
Administration fees | | | | |
Fund level | | | 65,167 | |
Class A | | | 35,318 | |
Class B | | | 2,533 | |
Class C | | | 7,061 | |
Institutional Class | | | 81,810 | |
Shareholder servicing fees | | | | |
Class A | | | 55,184 | |
Class B | | | 3,959 | |
Class C | | | 11,033 | |
Distribution fees | | | | |
Class B | | | 11,876 | |
Class C | | | 33,098 | |
Custody and accounting fees | | | 7,888 | |
Professional fees | | | 16,056 | |
Registration fees | | | 30,082 | |
Shareholder report expenses | | | 8,067 | |
Trustees’ fees and expenses | | | 7,293 | |
Other fees and expenses | | | 12,502 | |
| | | | |
Total expenses | | | 845,093 | |
Less: Fee waivers and/or expense reimbursements | | | (84,478 | ) |
| | | | |
Net expenses | | | 760,615 | |
| | | | |
Net investment income | | | 5,339,150 | |
| | | | |
| |
REALIZED AND UNREALIZED GAINS (LOSSES) ON INVESTMENTS | | | | |
| |
Net realized gains (losses) on: | | | | |
Unaffiliated securities | | | 3,648,924 | |
Futures transactions | | | (221,471 | ) |
| | | | |
Net realized gains on investments | | | 3,427,453 | |
| | | | |
| |
Net change in unrealized gains (losses) on: | | | | |
Unaffiliated securities | | | 5,980,731 | |
Futures transactions | | | (34,573 | ) |
| | | | |
Net change in unrealized gains (losses) on investments | | | 5,946,158 | |
| | | | |
Net realized and unrealized gains (losses) on investments | | | 9,373,611 | |
| | | | |
Net increase in net assets resulting from operations | | $ | 14,712,761 | |
| | | | |
| |
The accompanying notes are an integral part of these financial statements.
| | | | | | |
| Statements of Changes in Net Assets | | Wells Fargo Advantage Pennsylvania Tax-Free Fund | | | 15 | |
| | | | | | | | | | | | | | | | | | | | | | | | |
| | | Six Months Ended
December 31, 2011
(Unaudited) | | | Year Ended
June 30, 20111 | | | Year Ended
March 31, 20112 | |
| | | | | | |
Operations | | | | | | | | | | | | | | | | | | | | | | | | |
Net investment income | | | | | | $ | 5,339,150 | | | | | | | $ | 2,826,209 | | | | | | | $ | 13,409,281 | |
Net realized gains (losses) on investments | | | | | | | 3,427,453 | | | | | | | | 483,337 | | | | | | | | (1,490,996 | ) |
Net change in unrealized gains (losses) on investments | | | | | | | 5,946,158 | | | | | | | | 7,115,976 | | | | | | | | (5,509,676 | ) |
| | | | | | | | | | | | | | | | | | | | | | | | |
Net increase in net assets resulting from operations | | | | | | | 14,712,761 | | | | | | | | 10,425,522 | | | | | | | | 6,408,609 | |
| | | | | | | | | | | | | | | | | | | | | | | | |
| | | | | | |
Distributions to shareholders from | | | | | | | | | | | | | | | | | | | | | | | | |
Net investment income | | | | | | | | | | | | | | | | | | | | | | | | |
Class A | | | | | | | (869,953 | ) | | | | | | | (423,813 | ) | | | | | | | (1,821,744 | ) |
Class B | | | | | | | (50,401 | ) | | | | | | | (35,506 | ) | | | | | | | (213,257 | ) |
Class C | | | | | | | (140,784 | ) | | | | | | | (66,109 | ) | | | | | | | (289,525 | ) |
Institutional Class | | | | | | | (4,278,014 | ) | | | | | | | (2,300,914 | ) | | | | | | | (11,059,183 | )3 |
| | | | | | | | | | | | | | | | | | | | | | | | |
Total distributions to shareholders | | | | | | | (5,339,152 | ) | | | | | | | (2,826,342 | ) | | | | | | | (13,383,709 | ) |
| | | | | | | | | | | | | | | | | | | | | | | | |
| | | | | | |
| | | Shares | | | | | | | | Shares | | | | | | | | Shares | | | | | |
Proceeds from shares sold | | | | | | | | | | | | | | | | | | | | | | | | |
Class A | | | 180,833 | | | | 2,011,046 | | | | 124,291 | | | | 887,038 | | | | 254,426 | | | | 2,757,822 | |
Class B | | | 1,063 | | | | 11,998 | | | | 23 | | | | 244 | | | | 7,872 | | | | 87,060 | |
Class C | | | 70,107 | | | | 778,224 | | | | 19,773 | | | | 215,513 | | | | 80,413 | | | | 875,881 | |
Institutional Class | | | 291,216 | | | | 3,243,878 | | | | 302,140 | | | | 3,280,594 | | | | 660,469 | 3 | | | 7,169,202 | 3 |
| | | | | | | | | | | | | | | | | | | | | | | | |
| | | | | | | 6,045,146 | | | | | | | | 4,383,389 | | | | | | | | 10,889,965 | |
| | | | | | | | | | | | | | | | | | | | | | | | |
Reinvestment of distributions | | | | | | | | | | | | | | | | | | | | | | | | |
Class A | | | 44,584 | | | | 498,044 | | | | 21,531 | | | | 233,976 | | | | 90,114 | | | | 986,254 | |
Class B | | | 2,471 | | | | 27,484 | | | | 1,917 | | | | 20,745 | | | | 12,389 | | | | 135,340 | |
Class C | | | 8,006 | | | | 89,272 | | | | 3,856 | | | | 41,826 | | | | 16,292 | | | | 177,989 | |
Institutional Class | | | 24,011 | | | | 268,220 | | | | 12,526 | | | | 136,104 | | | | 46,6163 | | | | 509,650 | 3 |
| | | | | | | | | | | | | | | | | | | | | | | | |
| | | | | | | 883,020 | | | | | | | | 432,651 | | | | | | | | 1,809,233 | |
| | | | | | | | | | | | | | | | | | | | | | | | |
Payment for shares redeemed | | | | | | | | | | | | | | | | | | | | | | | | |
Class A | | | (296,711 | ) | | | (3,298,747 | ) | | | (129,349 | ) | | | (1,401,843 | ) | | | (882,623 | ) | | | (9,626,252 | ) |
Class B | | | (117,527 | ) | | | (1,294,948 | ) | | | (104,359 | ) | | | (662,908 | ) | | | (251,881 | ) | | | (2,732,130 | ) |
Class C | | | (47,555 | ) | | | (527,808 | ) | | | (25,076 | ) | | | (269,367 | ) | | | (160,655 | ) | | | (1,715,892 | ) |
Institutional Class | | | (3,122,097 | ) | | | (34,769,504 | ) | | | (1,722,167 | ) | | | (18,647,560 | ) | | | (6,528,096 | )3 | | | (71,209,768 | )3 |
| | | | | | | | | | | | | | | | | | | | | | | | |
| | | | | | | (39,891,007 | ) | | | | | | | (20,981,678 | ) | | | | | | | (85,284,042 | ) |
| | | | | | | | | | | | | | | | | | | | | | | | |
Net decrease in net assets resulting
from capital share transactions | | | | | | | (32,962,841 | ) | | | | | | | (16,165,638 | ) | | | | | | | (72,584,844 | ) |
| | | | | | | | | | | | | | | | | | | | | | | | |
Total decrease in net assets | | | | | | | (23,589,232 | ) | | | | | | | (8,566,458 | ) | | | | | | | (79,559,944 | ) |
| | | | | | | | | | | | | | | | | | | | | | | | |
| | | | | | |
Net assets | | | | | | | | | | | | | | | | | | | | | | | | |
Beginning of period | | | | | | | 267,815,257 | | | | | | | | 276,381,715 | | | | | | | | 355,941,659 | |
| | | | | | | | | | | | | | | | | | | | | | | | |
End of period | | | | | | $ | 244,226,025 | | | | | | | $ | 267,815,257 | | | | | | | $ | 276,381,715 | |
| | | | | | | | | | | | | | | | | | | | | | | | |
Overdistributed net investment income | | | | | | $ | (345,731 | ) | | | | | | $ | (345,729 | ) | | | | | | $ | (345,596 | ) |
| | | | | | | | | | | | | | | | | | | | | | | | |
| 1. | For the three months ended June 30, 2011. The Fund changed its fiscal year end from March 31 to June 30, effective June 30, 2011. |
| 2. | After the close of business on July 9, 2010, the Fund acquired the net assets of Evergreen Pennsylvania Municipal Bond Fund which became the accounting and performance survivor in the transaction. The information for the period prior to July 12, 2010 is that of Evergreen Pennsylvania Municipal Bond Fund. |
| 3. | Class I shares of Evergreen Pennsylvania Municipal Bond Fund became Institutional Class shares on July 12, 2010. |
The accompanying notes are an integral part of these financial statements.
| | | | |
| 16 | | Wells Fargo Advantage Pennsylvania Tax-Free Fund | | Financial Highlights |
(For a share outstanding throughout each period)
| | | | | | | | | | | | | | | | | | | | | | | | | | | | |
| | | Six Months Ended
December 31, 2011 (Unaudited) | | | Year Ended June 30, 20111 | | | Year Ended March 31, | |
| Class A | | | | 20112 | | | 20102 | | | 20092 | | | 20082 | | | 20072 | |
Net asset value, beginning of period | | | $10.93 | | | | $10.63 | | | | $10.90 | | | | $ 9.95 | | | | $10.84 | | | | $11.32 | | | | $11.25 | |
Net investment income | | | 0.22 | | | | 0.11 | | | | 0.44 | | | | 0.46 | | | | 0.48 | | | | 0.48 | | | | 0.47 | |
Net realized and unrealized gains (losses) on investments | | | 0.41 | | | | 0.30 | | | | (0.28 | ) | | | 0.95 | | | | (0.89 | ) | | | (0.49 | ) | | | 0.07 | |
| | | | | | | | | | | | | | | | | | | | | | | | | | | | |
Total from investment operations | | | 0.63 | | | | 0.41 | | | | 0.16 | | | | 1.41 | | | | (0.41 | ) | | | (0.01 | ) | | | 0.54 | |
Distributions to shareholders from | | | | | | | | | | | | | | | | | | | | | | | | | | | | |
Net investment income | | | (0.22 | ) | | | (0.11 | ) | | | (0.43 | ) | | | (0.46 | ) | | | (0.48 | ) | | | (0.47 | ) | | | (0.47 | ) |
Net asset value, end of period | | $ | 11.34 | | | $ | 10.93 | | | $ | 10.63 | | | $ | 10.90 | | | $ | 9.95 | | | $ | 10.84 | | | $ | 11.32 | |
Total return3 | | | 5.82 | % | | | 3.84 | % | | | 1.56 | % | | | 14.41 | % | | | (3.79 | )% | | | (0.05 | )% | | | 4.86 | % |
Ratios to average net assets (annualized) | | | | | | | | | | | | | | | | | | | | | | | | | | | | |
Gross expenses | | | 0.87 | %4 | | | 0.87 | %4 | | | 0.84 | %4 | | | 0.76 | % | | | 0.73 | %4 | | | 0.76 | %4 | | | 0.79 | %3 |
Net expenses | | | 0.75 | %4 | | | 0.74 | %4 | | | 0.75 | %4 | | | 0.76 | % | | | 0.73 | %4 | | | 0.71 | %4 | | | 0.74 | %3 |
Net investment income | | | 3.94 | % | | | 3.98 | % | | | 3.99 | % | | | 4.35 | % | | | 4.67 | % | | | 4.27 | % | | | 4.13 | % |
Supplemental data | | | | | | | | | | | | | | | | | | | | | | | | | | | | |
Portfolio turnover rate | | | 13 | % | | | 10 | % | | | 46 | % | | | 45 | % | | | 35 | % | | | 21 | % | | | 33 | % |
Net assets, end of period (000’s omitted) | | | $43,989 | | | | $43,188 | | | | $41,832 | | | | $48,762 | | | | $45,158 | | | | $48,045 | | | | $55,565 | |
| 1. | For the three months ended June 30, 2011. The Fund changed its fiscal year end from March 31 to June 30, effective June 30, 2011. |
| 2. | After the close of business on July 9, 2010, the Fund acquired the net assets of Evergreen Pennsylvania Municipal Bond Fund which became the accounting and performance survivor in the transaction. The information for the periods prior to July 12, 2010 is that of Class A of Evergreen Pennsylvania Municipal Bond Fund. |
| 3. | Total return calculations do not include any sales charges. Returns for periods of less than one year are not annualized. |
| 4. | Ratios include interest and fee expense relating to inverse floating-rate obligations as follows: |
| | | | |
Six months ended December 31, 2011 (Unaudited) | | | 0.01 | % |
Year ended June 30, 2011 | | | 0.01 | % |
Year ended March 31, 2011 | | | 0.01 | % |
Year ended March 31, 2009 | | | 0.01 | % |
Year ended March 31, 2008 | | | 0.03 | % |
Year ended March 31, 2007 | | | 0.08 | % |
The accompanying notes are an integral part of these financial statements.
| | | | | | |
| Financial Highlights | | Wells Fargo Advantage Pennsylvania Tax-Free Fund | | | 17 | |
(For a share outstanding throughout each period)
| | | | | | | | | | | | | | | | | | | | | | | | | | | | |
| | | Six Months Ended
December 31, 2011 (Unaudited) | | | Year Ended June 30, 20111 | | | Year Ended March 31, | |
| Class B | | | | 20112 | | | 20102 | | | 20092 | | | 20082 | | | 20072 | |
Net asset value, beginning of period | | | $10.89 | | | | $10.59 | | | | $10.86 | | | | $ 9.91 | | | | $10.80 | | | | $11.27 | | | | $11.21 | |
Net investment income | | | 0.18 | 3 | | | 0.09 | 3 | | | 0.35 | 3 | | | 0.38 | 3 | | | 0.40 | 3 | | | 0.37 | | | | 0.36 | |
Net realized and unrealized gains (losses) on investments | | | 0.40 | | | | 0.30 | | | | (0.27 | ) | | | 0.95 | | | | (0.89 | ) | | | (0.45 | ) | | | 0.07 | |
| | | | | | | | | | | | | | | | | | | | | | | | | | | | |
Total from investment operations | | | 0.58 | | | | 0.39 | | | | 0.08 | | | | 1.33 | | | | (0.49 | ) | | | (0.08 | ) | | | 0.44 | |
Distributions to shareholders from | | | | | | | | | | | | | | | | | | | | | | | | | | | | |
Net investment income | | | (0.18 | ) | | | (0.09 | ) | | | (0.35 | ) | | | (0.38 | ) | | | (0.40 | ) | | | (0.39 | ) | | | (0.38 | ) |
Net asset value, end of period | | $ | 11.29 | | | $ | 10.89 | | | $ | 10.59 | | | $ | 10.86 | | | $ | 9.91 | | | $ | 10.80 | | | $ | 11.27 | |
Total return4 | | | 5.34 | % | | | 3.66 | % | | | 0.80 | % | | | 13.60 | % | | | (4.54 | )% | | | (0.73 | )% | | | 4.00 | % |
Ratios to average net assets (annualized) | | | | | | | | | | | | | | | | | | | | | | | | | | | | |
Gross expenses | | | 1.62 | %5 | | | 1.62 | %5 | | | 1.60 | %5 | | | 1.51 | % | | | 1.47 | %5 | | | 1.46 | %5 | | | 1.49 | %5 |
Net expenses | | | 1.50 | %5 | | | 1.49 | %5 | | | 1.50 | %5 | | | 1.51 | % | | | 1.47 | %5 | | | 1.46 | %5 | | | 1.49 | %5 |
Net investment income | | | 3.18 | % | | | 3.22 | % | | | 3.23 | % | | | 3.63 | % | | | 3.89 | % | | | 3.51 | % | | | 3.38 | % |
Supplemental data | | | | | | | | | | | | | | | | | | | | | | | | | | | | |
Portfolio turnover rate | | | 13 | % | | | 10 | % | | | 46 | % | | | 45 | % | | | 35 | % | | | 21 | % | | | 33 | % |
Net assets, end of period (000’s omitted) | | | $2,816 | | | | $3,956 | | | | $4,932 | | | | $7,573 | | | | $11,287 | | | | $18,324 | | | | $24,725 | |
| 1. | For the three months ended June 30, 2011. The Fund changed its fiscal year end from March 31 to June 30, effective June 30, 2011. |
| 2. | After the close of business on July 9, 2010, the Fund acquired the net assets of Evergreen Pennsylvania Municipal Bond Fund which became the accounting and performance survivor in the transaction. The information for the periods prior to July 12, 2010 is that of Class B of Evergreen Pennsylvania Municipal Bond Fund. |
| 3. | Calculated based upon average shares outstanding. |
| 4. | Total return calculations do not include any sales charges. Returns for periods of less than one year are not annualized. |
| 5. | Ratios include interest and fee expense relating to inverse floating-rate obligations as follows: |
| | | | |
Six months ended December 31, 2011 (Unaudited) | | | 0.01 | % |
Year ended June 30, 2011 | | | 0.01 | % |
Year ended March 31, 2011 | | | 0.01 | % |
Year ended March 31, 2009 | | | 0.01 | % |
Year ended March 31, 2008 | | | 0.03 | % |
Year ended March 31, 2007 | | | 0.08 | % |
The accompanying notes are an integral part of these financial statements.
| | | | |
| 18 | | Wells Fargo Advantage Pennsylvania Tax-Free Fund | | Financial Highlights |
(For a share outstanding throughout each period)
| | | | | | | | | | | | | | | | | | | | | | | | | | | | |
| | | Six Months Ended
December 31, 2011 (Unaudited) | | | Year Ended June 30, 20111 | | | Year Ended March 31, | |
| Class C | | | | 20112 | | | 20102 | | | 20092 | | | 20082 | | | 20072 | |
Net asset value, beginning of period | | | $10.91 | | | | $10.61 | | | | $10.88 | | | | $ 9.93 | | | | $10.82 | | | | $11.29 | | | | $11.23 | |
Net investment income | | | 0.18 | | | | 0.09 | | | | 0.35 | | | | 0.38 | | | | 0.40 | | | | 0.38 | | | | 0.37 | |
Net realized and unrealized gains (losses) on investments | | | 0.40 | | | | 0.30 | | | | (0.27 | ) | | | 0.95 | | | | (0.88 | ) | | | (0.46 | ) | | | 0.07 | |
| | | | | | | | | | | | | | | | | | | | | | | | | | | | |
Total from investment operations | | | 0.58 | | | | 0.39 | | | | 0.08 | | | | 1.33 | | | | (0.48 | ) | | | (0.08 | ) | | | 0.44 | |
Distributions to shareholders from | | | | | | | | | | | | | | | | | | | | | | | | | | | | |
Net investment income | | | (0.18 | ) | | | (0.09 | ) | | | (0.35 | ) | | | (0.38 | ) | | | (0.41 | ) | | | (0.39 | ) | | | (0.38 | ) |
Net asset value, end of period | | $ | 11.31 | | | $ | 10.91 | | | $ | 10.61 | | | $ | 10.88 | | | $ | 9.93 | | | $ | 10.82 | | | $ | 11.29 | |
Total return3 | | | 5.34 | % | | | 3.65 | % | | | 0.80 | % | | | 13.58 | % | | | (4.52 | )% | | | (0.72 | )% | | | 4.00 | % |
Ratios to average net assets (annualized) | | | | | | | | | | | | | | | | | | | | | | | | | | | | |
Gross expenses | | | 1.62 | %4 | | | 1.62 | %4 | | | 1.59 | %4 | | | 1.51 | % | | | 1.48 | %4 | | | 1.46 | %4 | | | 1.49 | %4 |
Net expenses | | | 1.50 | %4 | | | 1.49 | %4 | | | 1.50 | %4 | | | 1.51 | % | | | 1.48 | %4 | | | 1.46 | %4 | | | 1.49 | %4 |
Net investment income | | | 3.19 | % | | | 3.23 | % | | | 3.23 | % | | | 3.61 | % | | | 3.91 | % | | | 3.52 | % | | | 3.38 | % |
Supplemental data | | | | | | | | | | | | | | | | | | | | | | | | | | | | |
Portfolio turnover rate | | | 13 | % | | | 10 | % | | | 46 | % | | | 45 | % | | | 35 | % | | | 21 | % | | | 33 | % |
Net assets, end of period (000’s omitted) | | | $8,987 | | | | $8,331 | | | | $8,118 | | | | $9,020 | | | | $8,387 | | | | $9,896 | | | | $11,539 | |
| 1. | For the three months ended June 30, 2011. The Fund changed its fiscal year end from March 31 to June 30, effective June 30, 2011. |
| 2. | After the close of business on July 9, 2010, the Fund acquired the net assets of Evergreen Pennsylvania Municipal Bond Fund which became the accounting and performance survivor in the transaction. The information for the periods prior to July 12, 2010 is that of Class C of Evergreen Pennsylvania Municipal Bond Fund. |
| 3. | Total return calculations do not include any sales charges. Returns for periods of less than one year are not annualized. |
| 4. | Ratios include interest and fee expense relating to inverse floating-rate obligations as follows: |
| | | | |
Six months ended December 31, 2011 (Unaudited) | | | 0.01 | % |
Year ended June 30, 2011 | | | 0.01 | % |
Year ended March 31, 2011 | | | 0.01 | % |
Year ended March 31, 2009 | | | 0.01 | % |
Year ended March 31, 2008 | | | 0.03 | % |
Year ended March 31, 2007 | | | 0.08 | % |
The accompanying notes are an integral part of these financial statements.
| | | | | | |
| Financial Highlights | | Wells Fargo Advantage Pennsylvania Tax-Free Fund | | | 19 | |
(For a share outstanding throughout each period)
| | | | | | | | | | | | | | | | | | | | | | | | | | | | |
| | | Six Months Ended
December 31, 2011 (Unaudited) | | | Year Ended
June 30, 20111 | | | Year Ended March 31, | |
| Institutional Class | | | | 20112 | | | 20102 | | | 20092 | | | 20082 | | | 20072 | |
Net asset value, beginning of period | | | $10.93 | | | | $10.63 | | | | $10.90 | | | | $ 9.95 | | | | $10.84 | | | | $11.31 | | | | $11.25 | |
Net investment income | | | 0.24 | | | | 0.11 | | | | 0.46 | | | | 0.49 | | | | 0.51 | | | | 0.50 | | | | 0.49 | |
Net realized and unrealized gains (losses) on investments | | | 0.40 | | | | 0.30 | | | | (0.27 | ) | | | 0.95 | | | | (0.89 | ) | | | (0.47 | ) | | | 0.07 | |
| | | | | | | | | | | | | | | | | | | | | | | | | | | | |
Total from investment operations | | | 0.64 | | | | 0.41 | | | | 0.19 | | | | 1.44 | | | | (0.38 | ) | | | 0.03 | | | | 0.56 | |
Distributions to shareholders from | | | | | | | | | | | | | | | | | | | | | | | | | | | | |
Net investment income | | | (0.23 | ) | | | (0.11 | ) | | | (0.46 | ) | | | (0.49 | ) | | | (0.51 | ) | | | (0.50 | ) | | | (0.50 | ) |
Net asset value, end of period | | $ | 11.34 | | | $ | 10.93 | | | $ | 10.63 | | | $ | 10.90 | | | $ | 9.95 | | | $ | 10.84 | | | $ | 11.31 | |
Total return3 | | | 5.95 | % | | | 3.91 | % | | | 1.82 | % | | | 14.69 | % | | | (3.55 | )% | | | 0.29 | % | | | 5.04 | % |
Ratios to average net assets (annualized) | | | | | | | | | | | | | | | | | | | | | | | | | | | | |
Gross expenses | | | 0.54 | %4 | | | 0.55 | %4 | | | 0.54 | %4 | | | 0.51 | % | | | 0.47 | %4 | | | 0.45 | %4 | | | 0.49 | %4 |
Net expenses | | | 0.50 | %4 | | | 0.49 | %4 | | | 0.50 | %4 | | | 0.51 | % | | | 0.47 | %4 | | | 0.45 | %4 | | | 0.49 | %4 |
Net investment income | | | 4.18 | % | | | 4.22 | % | | | 4.23 | % | | | 4.61 | % | | | 4.88 | % | | | 4.51 | % | | | 4.38 | % |
Supplemental data | | | | | | | | | | | | | | | | | | | | | | | | | | | | |
Portfolio turnover rate | | | 13 | % | | | 10 | % | | | 46 | % | | | 45 | % | | | 35 | % | | | 21 | % | | | 33 | % |
Net assets, end of period (000’s omitted) | | | $188,435 | | | | $212,341 | | | | $221,498 | | | | $290,586 | | | | $332,597 | | | | $555,535 | | | | $730,018 | |
| 1. | For the three months ended June 30, 2011. The Fund changed its fiscal year end from March 31 to June 30, effective June 30, 2011. |
| 2. | After the close of business on July 9, 2010, the Fund acquired the net assets of Evergreen Pennsylvania Municipal Bond Fund which became the accounting and performance survivor in the transaction. The information for the periods prior to July 12, 2010 is that of Class I of Evergreen Pennsylvania Municipal Bond Fund. |
| 3. | Returns for periods of less than one year are not annualized. |
| 4. | Ratios include interest and fee expense relating to inverse floating-rate obligations as follows: |
| | | | |
Six months ended December 31, 2011 (Unaudited) | | | 0.01 | % |
Year ended June 30, 2011 | | | 0.01 | % |
Year ended March 31, 2011 | | | 0.01 | % |
Year ended March 31, 2009 | | | 0.01 | % |
Year ended March 31, 2008 | | | 0.03 | % |
Year ended March 31, 2007 | | | 0.08 | % |
The accompanying notes are an integral part of these financial statements.
| | | | |
| 20 | | Wells Fargo Advantage Pennsylvania Tax-Free Fund | | Notes to Financial Statements (Unaudited) |
1. ORGANIZATION
Wells Fargo Funds Trust (the “Trust”), a Delaware statutory trust organized on March 10, 1999, is an open-end management investment company registered under the Investment Company Act of 1940, as amended (the “1940 Act”). These financial statements report on Wells Fargo Advantage Pennsylvania Tax-Free Fund (the “Fund”) which is a non-diversified series of the Trust.
2. SIGNIFICANT ACCOUNTING POLICIES
The following significant accounting policies, which are consistently followed in the preparation of the financial statements of the Fund, are in conformity with U.S. generally accepted accounting principles which require management to make estimates and assumptions that affect the reported amounts of assets and liabilities, disclosure of contingent assets and liabilities at the date of the financial statements, and the reported amounts of revenues and expenses during the reporting period. Actual results could differ from those estimates.
Securities valuation
Fixed income securities with maturities exceeding 60 days are valued based on available evaluated prices received from an independent pricing service approved by the Board of Trustees which may utilize both transaction data and market information such as yield, prices of securities of comparable quality, coupon rate, maturity, type of issue, trading characteristics and other market data. If valuations are not available from the pricing service or values received are deemed not representative of market value, values will be obtained from a third party broker-dealer or determined based on the Fund’s Fair Value Procedures.
Debt securities of sufficient credit quality with original maturities of 60 days or less generally are valued at amortized cost which approximates fair value. The amortized cost method involves valuing a security at its cost, plus accretion of discount or minus amortization of premium over the period until maturity.
Investments in open-end mutual funds and non-registered investment companies are generally valued at net asset value.
Investments which are not valued using any of the methods discussed above, are valued at their fair value, as determined by procedures established in good faith and approved by the Board of Trustees.
When-issued transactions
The Fund may purchase securities on a forward commitment or ‘when-issued’ basis. The Fund records a when-issued transaction on the trade date and will segregate assets to cover its obligation by confirming the availability of qualifying assets having a value sufficient to make payment for the securities purchased. Securities purchased on a when-issued basis are marked-to-market daily and the Fund begins earning interest on the settlement date. Losses may arise due to changes in the market value of the underlying securities or if the counterparty does not perform under the contract.
Futures contracts
The Fund may be subject to interest rate risk in the normal course of pursuing its investment objectives. The Fund may buy and sell futures contracts in order to gain exposure to, or protect against changes in, security values and interest rates. The primary risks associated with the use of futures contracts are the imperfect correlation between changes in market values of securities held by the Fund and the prices of futures contracts, and the possibility of an illiquid market.
Futures contracts are valued based upon their quoted daily settlement prices when available. The aggregate principal amounts of the contracts are not recorded in the financial statements. Fluctuations in the value of the contracts are recorded in the Statement of Assets and Liabilities as an asset or liability and in the Statement of Operations as unrealized gains or losses until the contracts are closed, at which point they are recorded as net realized gains or losses on futures contracts. With futures contracts, there is minimal counterparty risk to the Fund since futures are exchange traded and the exchange’s clearinghouse, as counterparty to all exchange traded futures, guarantees the futures against default.
Inverse floating-rate obligations
The Fund may participate in inverse floating-rate obligation (“Inverse Floater”) structures whereby a fixed-rate bond (“Fixed-Rate Bond”) purchased by the Fund is transferred to a tender option bond trust (“TOB Trust”). The TOB Trust issues floating-rate notes (“Floating-Rate Notes”) to third-parties, which are collateralized by the Fixed-Rate Bond, and the Fund buys a residual interest in the TOB Trust’s assets and cash flows. The Inverse Floater held by the Fund gives the Fund the right (1) to cause the holders of the Floating-Rate Notes to tender their notes at par, and (2) to have the Fixed-Rate Bond
| | | | | | |
| Notes to Financial Statements (Unaudited) | | Wells Fargo Advantage Pennsylvania Tax-Free Fund | | | 21 | |
held by the TOB Trust transferred back to the Fund, thereby collapsing the TOB Trust. The Fund accounts for the transaction described above as a secured borrowing by including the Fixed-Rate Bond in its Portfolio of Investments, and by recording the Floating-Rate Notes as a liability in the Statement of Assets and Liabilities. The Fund also records the interest paid on Floating-Rate Notes as interest expense. The Floating-Rate Notes have interest rates that generally reset weekly and their holders have the option to tender their notes for redemption at par at each reset date. Inverse Floaters held by the Fund are securities exempt from registration under Rule 144A of the Securities Act of 1933, as amended.
Security transactions and income recognition
Securities transactions are recorded on a trade date basis. Realized gains or losses are reported on the basis of identified cost of securities delivered.
Interest income is accrued daily and bond discounts are accreted and premiums are amortized daily based on the effective interest method. To the extent debt obligations are placed on non-accrual status, any related interest income may be reduced by writing off interest receivables when the collection of all or a portion of interest has become doubtful based on consistently applied procedures. If the issuer subsequently resumes interest payments or when the collectability of interest is reasonably assured, the debt obligation is removed from non-accrual status.
Distributions to shareholders
Distributions to shareholders from net investment income are accrued daily and paid monthly. Distributions from net realized gains, if any, are recorded on the ex-dividend date. Such distributions are determined in conformity with income tax regulations, which may differ from generally accepted accounting principles.
Federal and other taxes
The Fund intends to continue to qualify as a regulated investment company by distributing substantially all of its investment company taxable and tax-exempt income and any net realized capital gains (after reduction for capital loss carryforwards) sufficient to relieve it from all, or substantially all, federal income taxes. Accordingly, no provision for federal income taxes was required.
The Fund’s income and federal excise tax returns and all financial records supporting those returns for the prior three fiscal years are subject to examination by the federal and Delaware revenue authorities.
Under the recently enacted Regulated Investment Company Modernization Act of 2010, the Fund is permitted to carry forward capital losses incurred in taxable years which began after December 22, 2010 for an unlimited period. However, any losses incurred are required to be utilized prior to the losses incurred in pre-enactment taxable years. As a result of this ordering rule, pre-enactment capital loss carry forwards may be more likely to expire unused. Additionally, post-enactment capital losses that are carried forward will retain their character as either short-term or long-term capital losses rather than being considered all short-term as under previous law.
At June 30, 2011, net capital loss carryforwards, which were available to offset future net realized capital gains, were as follows:
| | | | | | | | | | | | | | | | | | | | | | | | |
Pre-enactment Capital Loss Expiration | | | Post-enactment Capital Losses | |
| 2012 | | 2013 | | | 2015 | | | 2016 | | | 2017 | | | Short-Term | | | Long-Term | |
| $1,438,502 | | $ | 894,209 | | | $ | 3,458,446 | | | $ | 4,324,935 | | | $ | 5,875,768 | | | $ | 801,174 | | | $ | 2,137,669 | |
Class allocations
The separate classes of shares offered by the Fund differ principally in applicable sales charges, distribution, shareholder servicing and administration fees. Shareholders of each class bear certain expenses that pertain to that particular class. All shareholders bear the common expenses of the Fund, earn income from the portfolio, and are allocated unrealized gains and losses pro rata based on the average daily net assets of each class, without distinction between share classes. Dividends are determined separately for each class based on income and expenses allocable to each class. Realized gains and losses are allocated to each class pro rata based upon the net assets of each class on the date realized. Differences in per share dividend rates generally result from the relative weightings of pro rata income and realized gain allocations and from differences in separate class expenses, including distribution, shareholder servicing and administration fees.
| | | | |
| 22 | | Wells Fargo Advantage Pennsylvania Tax-Free Fund | | Notes to Financial Statements (Unaudited) |
3. FAIR VALUATION MEASUREMENTS
Fair value measurements of investments are determined within a framework that has established a fair value hierarchy based upon the various data inputs utilized in determining the value of the Fund’s investments. The three-level hierarchy gives the highest priority to unadjusted quoted prices in active markets for identical assets or liabilities (Level 1) and the lowest priority to significant unobservable inputs (Level 3). The Fund’s investments are classified within the fair value hierarchy based on the lowest level of input that is significant to the fair value measurement. The inputs are summarized into three broad levels as follows:
| n | | Level 1 – quoted prices in active markets for identical securities |
| n | | Level 2 – other significant observable inputs (including quoted prices for similar securities, interest rates, prepayment speeds, credit risk, etc.) |
| n | | Level 3 – significant unobservable inputs (including the Fund’s own assumptions in determining the fair value of investments) |
The inputs or methodologies used for valuing securities are not necessarily an indication of the risk associated with investing in those securities.
As of December 31, 2011, the inputs used in valuing the Fund’s assets, which are carried at fair value, were as follows:
| | | | | | | | | | | | | | | | |
| Investments in Securities | | Quoted Prices (Level 1) | | | Significant Other
Observable Inputs (Level 2) | | | Significant Unobservable Inputs (Level 3) | | | Total | |
Municipal bonds and notes | | $ | 0 | | | $ | 240,662,094 | | | $ | 0 | | | $ | 240,662,094 | |
Short-term investments | | | | | | | | | | | | | | | | |
Investment companies | | | 828,004 | | | | 0 | | | | 0 | | | | 828,004 | |
U.S. Treasury securities | | | 99,996 | | | | 0 | | | | 0 | | | | 99,996 | |
| | | $ | 928,000 | | | $ | 240,662,094 | | | $ | 0 | | | $ | 241,590,094 | |
Further details on the major security types listed above can be found in the Portfolio of Investments.
As of December 31, 2011, the inputs used in valuing the Fund’s other financial instruments, which are carried at fair value, were as follows:
| | | | | | | | | | | | | | | | |
| Other financial instruments | | Quoted Prices (Level 1) | | | Significant Other
Observable Inputs (Level 2) | | | Significant Unobservable Inputs (Level 3) | | | Total | |
Futures contracts+ | | $ | (34,573 | ) | | $ | 0 | | | $ | 0 | | | $ | (34,573 | ) |
| + | Futures contracts are presented at the unrealized gains or losses on the instrument. |
Transfers in and transfers out are recognized at the end of the reporting period. For the six months ended December 31, 2011, the Fund did not have any significant transfers into/out of Level 1 and Level 2.
4. TRANSACTIONS WITH AFFILIATES AND OTHER EXPENSES
Advisory fee
The Trust has entered into an advisory contract with Wells Fargo Funds Management, LLC (“Funds Management”), an indirect wholly owned subsidiary of Wells Fargo & Company (“Wells Fargo”). The adviser is responsible for implementing investment policies and guidelines and for supervising the sub-adviser, who is responsible for day-to-day portfolio management of the Fund.
Pursuant to the contract, Funds Management is entitled to receive an annual advisory fee starting at 0.35% and declining to 0.25% as the average daily net assets of the Fund increase. For the six months ended December 31, 2011, the advisory fee was equivalent to an annual rate of 0.35% of the Fund’s average daily net assets.
Funds Management may retain the services of certain sub-advisers to provide daily portfolio management to the Fund. The fees related to sub-advisory services are borne directly by Funds Management and do not increase the overall fees
| | | | | | |
| Notes to Financial Statements (Unaudited) | | Wells Fargo Advantage Pennsylvania Tax-Free Fund | | | 23 | |
paid by the Fund. Wells Capital Management Incorporated, an affiliate of Funds Management, is the sub-adviser to the Fund and is entitled to receive a fee from Funds Management at an annual rate starting at 0.20% and declining to 0.10% as the average daily net assets of the Fund increase.
Administration and transfer agent fees
The Trust has entered into an administration agreement with Funds Management. Under this agreement, for providing administrative services, which includes paying fees and expenses for services provided by the transfer agent, sub-transfer agents, omnibus account servicers and record-keepers, Funds Management is entitled to receive from the Fund an annual fund level administration fee starting at 0.05% and declining to 0.03% as the average daily net assets of the Fund increase and a class level administration fee which is calculated based on the average daily net assets of each class as follows:
| | | | |
| | | Class Level Administration Fee | |
Class A, Class B, Class C | | | 0.16 | % |
Institutional Class | | | 0.08 | |
Funds Management has contractually waived and/or reimbursed advisory and administration fees to the extent necessary to maintain certain net operating expense ratios for the Fund. Waiver of fees and/or reimbursement of expenses by Funds Management were made first from fund level expenses on a proportionate basis and then from class specific expenses.
Distribution fees
The Trust has adopted a Distribution Plan for Class B and Class C shares of the Fund pursuant to Rule 12b-1 under the 1940 Act. Distribution fees are charged to Class B and Class C shares paid to Wells Fargo Funds Distributor, LLC, the principal underwriter, at an annual rate of 0.75% of the average daily net assets of Class B and Class C shares.
For the six months ended December 31, 2011, Wells Fargo Funds Distributor, LLC received $3,107 from the sale of Class A shares and $133 in contingent deferred sales charges from redemptions of Class B shares, respectively.
Shareholder servicing fees
The Trust has entered into contracts with one or more shareholder servicing agents, whereby Class A, Class B and Class C of the Fund is charged a fee at an annual rate of 0.25% of the average daily net assets of each respective class.
A portion of these total shareholder servicing fees were paid to affiliates of Wells Fargo.
5. INVESTMENT PORTFOLIO TRANSACTIONS
Purchases and sales of investments, excluding U.S. Government obligations (if any) and short-term securities (securities with maturities of one year or less at purchase date), for the six months ended December 31, 2011 were $33,726,643 and $68,956,328, respectively.
6. DERIVATIVE TRANSACTIONS
During the six months ended December 31, 2011, the Fund entered into futures contracts to take advantage of the differences between municipal and treasury yields and to help shorten duration of the portfolio.
At December 31, 2011, the Fund had short futures contracts outstanding as follows:
| | | | | | | | | | | | |
| Expiration Date | | Contracts | | Type | | Contract Value at
December 31,
2011 | | | Net Unrealized
Gains (Losses) | |
| March 2012 | | 63 Short | | 5-Year U.S. Treasury Notes | | $ | 7,765,242 | | | $ | (34,573 | ) |
The Fund had an average notional amount of $6,815,602 in short futures contracts during the six months December 31, 2011.
On December 31, 2011, the cumulative unrealized losses on futures contracts in the amount of $34,573 is reflected in net unrealized gains on investments on the Statement of Assets and Liabilities. The payable for daily variation margin on open futures contracts reflected in the Statement of Assets and Liabilities only represents the current day’s variation margin. The realized losses and change in unrealized gains (losses) on futures contracts are reflected in the Statement of Operations.
| | | | |
| 24 | | Wells Fargo Advantage Pennsylvania Tax-Free Fund | | Notes to Financial Statements (Unaudited) |
7. BORROWINGS
The Trust (excluding the money market funds) and Wells Fargo Variable Trust are parties to a $150,000,000 revolving credit agreement with State Street Bank and Trust Company, whereby the Fund is permitted to use bank borrowings for temporary or emergency purposes, such as to fund shareholder redemption requests. Interest under the credit agreement is charged to the Fund based on a borrowing rate equal to the higher of the Federal Funds rate in effect on that day plus 1.25% or the overnight LIBOR rate in effect on that day plus 1.25%. In addition, under the credit agreement, the Fund pays an annual commitment fee equal to 0.10% of the unused balance, which is allocated pro rata. Prior to September 6, 2011, the revolving credit agreement was for $125,000,000 and the annual commitment fee paid by the Fund was 0.125% of the unused balance. For the six months ended December 31, 2011, the Fund paid $196 in commitment fees.
For the six months ended December 31, 2011, there were no borrowings by the Fund under the agreement.
During the six months ended December 31, 2011, the Fund held Floating-Rate Notes that had an average daily balance outstanding of $1,615,000 (on an annualized basis) and incurred interest and fee expense in the amount of $6,831.
At December 31, 2011, the Fund had the following Floating-Rate Notes outstanding:
| | | | | | | | | | | | | | | | |
Floating-Rate Notes | | | Collateral for
Floating-Rate Notes
Outstanding | | | Rate of
Interest
Expense | |
Amount
Outstanding | | Maturity
Date | | | Interest
Rate | | | |
| $1,615,000 | | | 12/01/2013 | | | | 4.78 | % | | $ | 3,582,813 | | | | 0.01 | % |
8. CONCENTRATION RISK
The Fund invests a substantial portion of its assets in issuers of municipal debt securities located in a single state, therefore, it may be more affected by economic and political developments in that state or region than would be a comparable general tax-exempt mutual fund.
9. INDEMNIFICATION
Under the Trust’s organizational documents, the officers and directors are indemnified against certain liabilities that may arise out of performance of their duties to the Trust. Additionally, in the normal course of business, the Trust may enter into contracts with service providers that contain a variety of indemnification clauses. The Trust’s maximum exposure under these arrangements is dependent on future claims that may be made against the Fund and, therefore, cannot be estimated.
10. NEW ACCOUNTING PRONOUNCEMENTS
In May 2011, the Financial Accounting Standards Board (“FASB”) issued Accounting Standards Update (“ASU”) No. 2011-04 “Amendments to Achieve Common Fair Value Measurement and Disclosure Requirements in U.S. GAAP and IFRSs”. ASU No. 2011-04 amends FASB ASC Topic 820, Fair Value Measurements and Disclosures, to establish common requirements for measuring fair value and for disclosing information about fair value measurements in accordance with GAAP. The ASU is effective prospectively for interim and annual periods beginning after December 15, 2011. Management expects that adoption of the ASU will result in additional disclosures in the financial statements, as applicable.
In April 2011, FASB issued ASU No. 2011-03 “Reconsideration of Effective Control for Repurchase Agreements”. ASU No. 2011-03 amends FASB ASC Topic 860, Transfers and Servicing, specifically the criteria required to determine whether a repurchase agreement (repo) and similar agreements should be accounted for as sales of financial assets or secured borrowings with commitments. ASU No. 2011-03 changes the assessment of effective control by focusing on the transferor’s contractual rights and obligations and removing the criterion to assess its ability to exercise those rights or honor those obligations. This could result in changes to the way entities account for certain transactions including repurchase agreements, mortgage dollar rolls and reverse repurchase agreements. The ASU will become effective on a prospective basis for new transfers and modifications to existing transactions as of the beginning of the first interim or annual period beginning on or after December 15, 2011. Management has evaluated the impact of adopting the ASU and expects no significant changes.
| | | | | | |
| Other Information (Unaudited) | | Wells Fargo Advantage Pennsylvania Tax-Free Fund | | | 25 | |
PROXY VOTING INFORMATION
A description of the policies and procedures that the Fund uses to determine how to vote proxies relating to portfolio securities is available without charge, upon request, by calling 1-800-222-8222, visiting our Web site at www.wellsfargo.com/advantagefunds, or visiting the SEC Web site at www.sec.gov. Information regarding how the Fund voted proxies relating to portfolio securities during the most recent 12-month period ended June 30 is available without charge on the Fund’s Web site at www.wellsfargo.com/advantagefunds or by visiting the SEC Web site at www.sec.gov.
PORTFOLIO HOLDINGS INFORMATION
The complete portfolio holdings for the Fund are publicly available on the Fund’s Web site (www.wellsfargo.com/advantagefunds) on a monthly, 30-day or more delayed basis. In addition, top ten holdings information for the Fund is publicly available on the Fund’s Web site on a monthly, seven-day or more delayed basis. The Fund files its complete schedule of portfolio holdings with the SEC for the first and third quarters of each fiscal year on Form N-Q, which is available without charge by visiting the SEC Web site at www.sec.gov. In addition, the Fund’s Form N-Q may be reviewed and copied at the SEC’s Public Reference Room in Washington, DC, and at regional offices in New York City, at 233 Broadway, and in Chicago, at 175 West Jackson Boulevard, Suite 900. Information about the Public Reference Room may be obtained by calling 1-800-SEC-0330.
| | | | |
| 26 | | Wells Fargo Advantage Pennsylvania Tax-Free Fund | | Other Information (Unaudited) |
BOARD OF TRUSTEES
The following table provides basic information about the Board of Trustees (the “Trustees”) of the Trust and Officers of the Trust. This table should be read in conjunction with the Prospectus and the Statement of Additional Information1 of the Fund. Each of the Trustees and Officers listed below acts in identical capacities for the Wells Fargo Advantage family of funds, which consists of 138 funds comprising the Wells Fargo Funds Trust, Wells Fargo Variable Trust, Wells Fargo Master Trust and four closed-end funds (collectively the “Fund Complex”). All of the Trustees are also Members of the Audit and Governance Committees of each Trust in the Fund Complex. The mailing address of each Trustee and Officer is 525 Market Street, 12th Floor, San Francisco, CA 94105. Each Trustee and Officer serves an indefinite term, however, each Trustee serves such term until reaching the mandatory retirement age established by the Trustees.
Independent Trustees
| | | | | | |
Name and Year of Birth | | Position Held and Length of Service | | Principal Occupations During Past Five Years | | Other Directorships During
Past Five Years |
Peter G. Gordon
(Born 1942) | | Trustee, since 1998; Chairman, since 2005 (Lead Trustee since 2001) | | Co-Founder, Retired Chairman, President and CEO of Crystal Geyser Water Company. Trustee Emeritus, Colby College | | Asset Allocation Trust |
Isaiah Harris, Jr.
(Born 1952) | | Trustee, since 2009 | | Retired. Prior thereto, President and CEO of BellSouth Advertising and Publishing Corp. from 2005 to 2007, President and CEO of BellSouth Enterprises from 2004 to 2005 and President of BellSouth Consumer Services from 2000 to 2003. Emeritus member of the Iowa State University Foundation Board of Governors. Emeritus Member of the Advisory Board of Iowa State University School of Business. Mr. Harris is a certified public accountant. | | CIGNA Corporation; Deluxe Corporation; Asset Allocation Trust |
Judith M. Johnson
(Born 1949) | | Trustee, since 2008 | | Retired. Prior thereto, Chief Executive Officer and Chief Investment Officer of Minneapolis Employees Retirement Fund from 1996 to 2008. Ms. Johnson is an attorney, certified public accountant and a certified managerial accountant. | | Asset Allocation Trust |
Leroy Keith, Jr.
(Born 1939) | | Trustee, since 2010 | | Chairman, Bloc Global Services (development and construction). Trustee of the Evergreen Funds from 1983 to 2010. Former Managing Director, Almanac Capital Management (commodities firm), former Partner, Stonington Partners, Inc. (private equity fund), former Director, Obagi Medical Products Co. and former Director, Lincoln Educational Services. | | Trustee, Virtus Fund Complex (consisting of 40 portfolios as of 12/31/11); Asset Allocation Trust |
David F. Larcker
(Born 1950) | | Trustee, since 2009 | | James Irvin Miller Professor of Accounting at the Graduate School of Business, Stanford University, Director of Corporate Governance Research Program and Senior Faculty of The Rock Center for Corporate Governance since 2006. From 2005 to 2008, Professor of Accounting at the Graduate School of Business, Stanford University. Prior thereto, Ernst & Young Professor of Accounting at The Wharton School, University of Pennsylvania from 1985 to 2005. | | Asset Allocation Trust |
Olivia S. Mitchell
(Born 1953) | | Trustee, since 2006 | | International Foundation of Employee Benefit Plans Professor, Wharton School of the University of Pennsylvania since 1993. Director of Wharton’s Pension Research Council and Boettner Center on Pensions & Retirement Research, and Research Associate at the National Bureau of Economic Research. Previously, Cornell University Professor from 1978 to 1993. | | Asset Allocation Trust |
| | | | | | |
| Other Information (Unaudited) | | Wells Fargo Advantage Pennsylvania Tax-Free Fund | | | 27 | |
| | | | | | |
Name and Year of Birth | | Position Held and Length of Service | | Principal Occupations During Past Five Years | | Other Directorships During
Past Five Years |
Timothy J. Penny
(Born 1951) | | Trustee, since 1996 | | President and CEO of Southern Minnesota Initiative Foundation, a non-profit organization, since 2007 and Senior Fellow at the Humphrey Institute Policy Forum at the University of Minnesota since 1995. Member of the Board of Trustees of NorthStar Education Finance, Inc., a non-profit organization, since 2007. | | Asset Allocation Trust |
Michael S. Scofield
(Born 1943) | | Trustee, since 2010 | | Served on the Investment Company Institute’s Board of Governors and Executive Committee from 2008-2011 as well the Governing Council of the Independent Directors Council from 2006-2011 and the Independent Directors Council Executive Committee from 2008-2011. Chairman of the IDC from 2008-2010. Institutional Investor (Fund Directions) Trustee of Year in 2007. Trustee of the Evergreen Funds (and its predecessors) from 1984 to 2010. Chairman of the Evergreen Funds from 2000-2010. Former Trustee of the Mentor Funds. Retired Attorney, Law Offices of Michael S. Scofield and former Director and Chairman, Branded Media Corporation (multi-media branding company). | | Asset Allocation Trust |
Donald C. Willeke
(Born 1940) | | Trustee, since 1996 | | Principal of the law firm of Willeke & Daniels. General Counsel of the Minneapolis Employees Retirement Fund from 1984 until its consolidation into the Minnesota Public Employees Retirement Association on June 30, 2010. Director and Vice Chair of The Free Trust (non-profit corporation). Director of the American Chestnut Foundation (non-profit corporation). | | Asset Allocation Trust |
Officers
| | | | | | |
Name and Year of Birth | | Position Held and
Length of Service | | Principal Occupations During Past Five Years | | |
Karla M. Rabusch
(Born 1959) | | President, since 2003 | | Executive Vice President of Wells Fargo Bank, N.A. and President of Wells Fargo Funds Management, LLC since 2003. Senior Vice President and Chief Administrative Officer of Wells Fargo Funds Management, LLC from 2001 to 2003. | | |
C. David Messman
(Born 1960) | | Secretary, since 2000; Chief Legal Counsel, since 2003 | | Senior Vice President and Secretary of Wells Fargo Funds Management, LLC since 2001. Vice President and Managing Senior Counsel of Wells Fargo Bank, N.A. since 1996. | | |
Kasey Phillips
(Born 1970) | | Treasurer, since 2009 | | Senior Vice President of Wells Fargo Funds Management, LLC since 2009. Senior Vice President of Evergreen Investment Management Company, LLC from 2006 to 2010. Treasurer of the Evergreen Funds from 2005 to 2010. | | |
David Berardi
(Born 1975) | | Assistant Treasurer, since 2009 | | Vice President of Wells Fargo Funds Management, LLC since 2009. Vice President of Evergreen Investment Management Company, LLC from 2008 to 2010. Assistant Vice President of Evergreen Investment Services, Inc. from 2004 to 2008. Manager of Fund Reporting and Control for Evergreen Investment Management Company, LLC from 2004 to 2010. | | |
Jeremy DePalma
(Born 1974) | | Assistant Treasurer, since 2009 | | Senior Vice President of Wells Fargo Funds Management, LLC since 2009. Senior Vice President of Evergreen Investment Management Company, LLC from 2008 to 2010. Vice President, Evergreen Investment Services, Inc. from 2004 to 2007. Head of the Fund Reporting and Control Team within Fund Administration from 2005 to 2010. | | |
Debra Ann Early
(Born 1964) | | Chief Compliance Officer, since 2007 | | Chief Compliance Officer of Wells Fargo Funds Management, LLC since 2007. Chief Compliance Officer of Parnassus Investments from 2005 to 2007. Chief Financial Officer of Parnassus Investments from 2004 to 2007 and Senior Audit Manager of PricewaterhouseCoopers LLP from 1998 to 2004. | | |
| 1. | The Statement of Additional Information includes additional information about the Trustees and is available, without charge, upon request, by calling 1-800-222-8222 or by visiting the Web site at www.wellsfargo.com/advantagefunds. |
| | | | |
| 28 | | Wells Fargo Advantage Pennsylvania Tax-Free Fund | | List of Abbreviations |
The following is a list of common abbreviations for terms and entities which may have appeared in this report.
| ACB | — Agricultural Credit Bank |
| ADR | — American Depository Receipt |
| ADS | — American Depository Shares |
| AGC-ICC | — Assured Guaranty Corporation - Insured Custody Certificates |
| AGM | — Assured Guaranty Municipal |
| AMBAC | — American Municipal Bond Assurance Corporation |
| AMT | — Alternative Minimum Tax |
| BAN | — Bond Anticipation Notes |
| BHAC | — Berkshire Hathaway Assurance Corporation |
| CAB | — Capital Appreciation Bond |
| CCAB | — Convertible Capital Appreciation Bond |
| CDA | — Community Development Authority |
| CDO | — Collateralized Debt Obligation |
| COP | — Certificate of Participation |
| DRIVER | — Derivative Inverse Tax-Exempt Receipts |
| DW&P | — Department of Water & Power |
| DWR | — Department of Water Resources |
| ECFA | — Educational & Cultural Facilities Authority |
| EDA | — Economic Development Authority |
| EDFA | — Economic Development Finance Authority |
| ETF | — Exchange-Traded Fund |
| FFCB | — Federal Farm Credit Bank |
| FGIC | — Financial Guaranty Insurance Corporation |
| FHA | — Federal Housing Authority |
| FHLB | — Federal Home Loan Bank |
| FHLMC | — Federal Home Loan Mortgage Corporation |
| FNMA | — Federal National Mortgage Association |
| GDR | — Global Depository Receipt |
| GNMA | — Government National Mortgage Association |
| HCFR | — Healthcare Facilities Revenue |
| HEFA | — Health & Educational Facilities Authority |
| HEFAR | — Higher Education Facilities Authority Revenue |
| HFA | — Housing Finance Authority |
| HFFA | — Health Facilities Financing Authority |
| IBC | — Insured Bond Certificate |
| IDA | — Industrial Development Authority |
| IDAG | — Industrial Development Agency |
| IDR | — Industrial Development Revenue |
| KRW | — Republic of Korea Won |
| LIBOR | — London Interbank Offered Rate |
| LLC | — Limited Liability Company |
| LLP | — Limited Liability Partnership |
| MBIA | — Municipal Bond Insurance Association |
| MFHR | — Multi-Family Housing Revenue |
| MUD | — Municipal Utility District |
| NATL-RE | — National Public Finance Guarantee Corporation |
| PCFA | — Pollution Control Finance Authority |
| PCR | — Pollution Control Revenue |
| PFA | — Public Finance Authority |
| PFFA | — Public Facilities Financing Authority |
| PFOTER | — Puttable Floating Option Tax-Exempt Receipts |
| plc | — Public Limited Company |
| PUTTER | — Puttable Tax-Exempt Receipts |
| R&D | — Research & Development |
| RDA | — Redevelopment Authority |
| RDFA | — Redevelopment Finance Authority |
| REIT | — Real Estate Investment Trust |
| ROC | — Reset Option Certificates |
| SAVRS | — Select Auction Variable Rate Securities |
| SBA | — Small Business Authority |
| SFHR | — Single Family Housing Revenue |
| SFMR | — Single Family Mortgage Revenue |
| SPDR | — Standard & Poor’s Depositary Receipts |
| TAN | — Tax Anticipation Notes |
| TIPS | — Treasury Inflation-Protected Securities |
| TRAN | — Tax Revenue Anticipation Notes |
| TCR | — Transferable Custody Receipts |
| TTFA | — Transportation Trust Fund Authority |
| TVA | — Tennessee Valley Authority |
| XLCA | — XL Capital Assurance |
This page is intentionally left blank.
This page is intentionally left blank.


FOR MORE INFORMATION
More information about Wells Fargo Advantage Funds is available free upon request. To obtain literature, please write, e-mail, visit the Fund’s Web site, or call:
Wells Fargo Advantage Funds
P.O. Box 8266
Boston, MA 02266-8266
E-mail: wfaf@wellsfargo.com
Web site: www.wellsfargo.com/advantagefunds
Individual investors: 1-800-222-8222
Retail investment professionals: 1-888-877-9275
Institutional investment professionals: 1-866-765-0778
This report and the financial statements contained herein are submitted for the general information of the shareholders of Wells Fargo Advantage Funds. If this report is used for promotional purposes, distribution of the report must be accompanied or preceded by a current prospectus. For a prospectus containing more complete information, including charges and expenses, call 1-800-222-8222 or visit the Fund’s Web site at www.wellsfargo.com/advantagefunds. Please consider the investment objectives, risks, charges, and expenses of the investment carefully before investing. This and other information about Wells Fargo Advantage Funds can be found in the current prospectus. Read the prospectus carefully before you invest or send money.
Wells Fargo Funds Management, LLC, a wholly owned subsidiary of Wells Fargo & Company, provides investment advisory and administrative services for Wells Fargo Advantage Funds. Other affiliates of Wells Fargo & Company provide subadvisory and other services for the Funds. The Funds are distributed by Wells Fargo Funds Distributor, LLC, Member FINRA/SIPC, an affiliate of Wells Fargo & Company.
NOT FDIC INSURED ¡ NO BANK GUARANTEE ¡ MAY LOSE VALUE
© 2012 Wells Fargo Funds Management, LLC. All rights reserved.
| | |
 | | 207589 02-12 SA255/SAR255 12-11 |

Wells Fargo Advantage Short-Term Municipal Bond Fund

Semi-Annual Report
December 31, 2011

Reduce clutter. Save trees.
Sign up for electronic delivery of prospectuses and shareholder reports at www.wellsfargo.com/advantagedelivery
Contents
The views expressed and any forward-looking statements are as of December 31, 2011, unless otherwise noted, and are those of the Fund managers and/or Wells Fargo Funds Management, LLC. Discussions of individual securities, or the markets generally, or any Wells Fargo Advantage Fund are not intended as individual recommendations. Future events or results may vary significantly from those expressed in any forward-looking statements; the views expressed are subject to change at any time in response to changing circumstances in the market. Wells Fargo Funds Management, LLC, disclaims any obligation to publicly update or revise any views expressed or forward-looking statements.
NOT FDIC INSURED ¡ NO BANK GUARANTEE ¡ MAY LOSE VALUE

WELLS FARGO INVESTMENT HISTORY
| | |
| |
| 1932 | | Keystone creates one of the first mutual fund families. |
| |
| 1971 | | Wells Fargo & Company introduces one of the first institutional index funds. |
| |
| 1978 | | Wells Fargo applies Markowitz and Sharpe’s research on Modern Portfolio Theory to introduce one of the industry’s first Tactical Asset Allocation (TAA) models in institutional separately managed accounts. |
| |
| 1984 | | Wells Fargo Stagecoach Funds launches its first asset allocation fund. |
| |
| 1989 | | The Tactical Asset Allocation (TAA) Model is first applied to Wells Fargo’s asset allocation mutual funds. |
| |
| 1994 | | Wells Fargo introduces the LifePath Funds, one of the first suites of target date funds (now the Wells Fargo Advantage Dow Jones Target Date FundsSM ). |
| |
| 1996 | | Evergreen Investments and Keystone Funds merge. |
| |
| 1997 | | Wells Fargo launches Wells Fargo Advantage WealthBuilder PortfoliosSM, a fund-of-funds suite of products that includes the use of quantitative models to shift assets among investment styles. |
| |
| 1999 | | Norwest Advantage Funds and Stagecoach Funds are reorganized into Wells Fargo Funds after the merger of Norwest and Wells Fargo. |
| |
| 2002 | | Evergreen Retail and Evergreen Institutional companies form the umbrella asset management company, Evergreen Investments. |
| |
| 2005 | | The integration of Strong Funds with Wells Fargo Funds creates Wells Fargo Advantage Funds, resulting in one of the top 20 mutual fund companies in the United States. |
| |
| 2006 | | Wells Fargo Advantage Funds relaunches the target date product line as Wells Fargo Advantage Dow Jones Target Date Funds. |
| |
| 2010 | | The mergers and reorganizations of Evergreen and Wells Fargo Advantage mutual funds are completed, unifying the families under the brand of Wells Fargo Advantage Funds. |
Wells Fargo Advantage Funds®
Wells Fargo Advantage Funds skillfully guides institutions, financial advisors, and individuals through the investment terrain to help them reach their financial objectives. Everything we do on behalf of investors is backed by our unique combination of qualifications.
Strength
Our organization is built on the standards of integrity and service established by our parent company—Wells Fargo & Company—more than 150 years ago. And, because we’re part of a highly diversified financial enterprise, we offer the depth of resources to help investors succeed.
Expertise
Our multi-boutique model offers investors access to the independent thinking of premier investment managers that have been chosen for their time-tested strategies. While each team specializes in a specific investment strategy, collectively they provide investors a wide choice of distinct investment styles. Our dedication to investment excellence doesn’t end with our expertise in manager selection—risk management, analysis, and rigorous ongoing review seek to ensure each manager’s investment process remains consistent.
Partnership
Our collaborative approach is built around understanding the needs and goals of our clients. By adhering to core principles of sound judgment and steady guidance, we support you through every stage of the investment decision process.
Carefully consider a fund’s investment objectives, risks, charges, and expenses before investing. For a current prospectus and, if available, a summary prospectus, containing this and other information, visit wellsfargo.com/advantagefunds. Read it carefully before investing.
Wells Fargo Funds Management, LLC, a wholly owned subsidiary of Wells Fargo & Company, provides investment advisory and administrative services for Wells Fargo Advantage Funds®. Other affiliates of Wells Fargo & Company provide subadvisory and other services for the Funds. The Funds are distributed by Wells Fargo Funds Distributor, LLC, Member FINRA/SIPC, an affiliate of Wells Fargo & Company.
“Dow Jones®” and “Dow Jones Target Date IndexesSM” are service marks of Dow Jones Trademark Holdings, LLC (“Dow Jones”), have been licensed to CME Group Index Services LLC (“CME Indexes”) and have been sublicensed for use for certain purposes by Global Index Advisors, Inc, and Wells Fargo Funds Management, LLC. The Wells Fargo Advantage Dow Jones Target Date FundsSM based on the Dow Jones Target Date IndexesSM, are not sponsored, endorsed, sold or promoted by Dow Jones, CME Indexes or their respective affiliates and none of them makes any representation regarding the advisability of investing in such product(s).
NOT FDIC INSURED ¡ NO BANK GUARANTEE ¡ MAY LOSE VALUE
Not part of the semi-annual report.
Wells Fargo Advantage Funds offers more than 110 mutual funds across a wide range of asset classes, representing over $216 billion in assets under management, as of December 31, 2011.
| | | | |
| Equity Funds | | | | |
Asia Pacific Fund | | Global Opportunities Fund | | Premier Large Company Growth Fund |
C&B Large Cap Value Fund | | Growth Fund | | Small Cap Opportunities Fund |
C&B Mid Cap Value Fund | | Health Care Fund | | Small Cap Value Fund |
Capital Growth Fund | | Index Fund | | Small Company Growth Fund |
Common Stock Fund | | International Equity Fund | | Small Company Value Fund |
Disciplined U.S. Core Fund | | International Value Fund | | Small/Mid Cap Core Fund |
Discovery Fund† | | Intrinsic Small Cap Value Fund | | Small/Mid Cap Value Fund |
Diversified Equity Fund | | Intrinsic Value Fund | | Social Sustainability Fund† |
Diversified International Fund | | Intrinsic World Equity Fund | | Special Mid Cap Value Fund |
Diversified Small Cap Fund | | Large Cap Core Fund | | Special Small Cap Value Fund |
Emerging Growth Fund | | Large Cap Growth Fund | | Specialized Technology Fund |
Emerging Markets Equity Fund | | Large Company Value Fund | | Strategic Large Cap Growth Fund |
Endeavor Select Fund† | | Omega Growth Fund | | Traditional Small Cap Growth Fund |
Enterprise Fund† | | Opportunity Fund† | | Utility and Telecommunications Fund |
Equity Value Fund | | Precious Metals Fund | | |
| Bond Funds | | | | |
Adjustable Rate Government Fund | | Inflation-Protected Bond Fund | | Short-Term Bond Fund |
California Limited-Term Tax-Free Fund | | Intermediate Tax/AMT-Free Fund | | Short-Term High Yield Bond Fund |
California Tax-Free Fund | | International Bond Fund | | Short-Term Municipal Bond Fund |
Colorado Tax-Free Fund | | Minnesota Tax-Free Fund | | Strategic Municipal Bond Fund |
Government Securities Fund | | Municipal Bond Fund | | Total Return Bond Fund |
High Income Fund | | North Carolina Tax-Free Fund | | Ultra Short-Term Income Fund |
High Yield Bond Fund | | Pennsylvania Tax-Free Fund | | Ultra Short-Term Municipal Income Fund |
Income Plus Fund | | Short Duration Government Bond Fund | | Wisconsin Tax-Free Fund |
| Asset Allocation Funds | | | | |
Asset Allocation Fund | | WealthBuilder Equity Portfolio† | | Target 2020 Fund† |
Conservative Allocation Fund | | WealthBuilder Growth Allocation Portfolio† | | Target 2025 Fund† |
Diversified Capital Builder Fund | | WealthBuilder Growth Balanced Portfolio† | | Target 2030 Fund† |
Diversified Income Builder Fund | | WealthBuilder Moderate Balanced Portfolio† | | Target 2035 Fund† |
Growth Balanced Fund | | WealthBuilder Tactical Equity Portfolio† | | Target 2040 Fund† |
Index Asset Allocation Fund | | Target Today Fund† | | Target 2045 Fund† |
Moderate Balanced Fund | | Target 2010 Fund† | | Target 2050 Fund† |
WealthBuilder Conservative Allocation Portfolio† | | Target 2015 Fund† | | Target 2055 Fund† |
| Money Market Funds | | | | |
100% Treasury Money Market Fund | | Heritage Money Market Fund† | | National Tax-Free Money Market Fund |
California Municipal Money Market Fund | | Money Market Fund | | Prime Investment Money Market Fund |
Cash Investment Money Market Fund | | Municipal Cash Management Money Market Fund | | Treasury Plus Money Market Fund |
Government Money Market Fund | | Municipal Money Market Fund | | |
| Variable Trust Funds1 | | | | |
VT Discovery Fund† | | VT Intrinsic Value Fund | | VT Small Cap Growth Fund |
VT Index Asset Allocation Fund | | VT Omega Growth Fund | | VT Small Cap Value Fund |
VT International Equity Fund | | VT Opportunity Fund† | | VT Total Return Bond Fund |
An investment in a money market fund is not insured or guaranteed by the Federal Deposit Insurance Corporation or any other government agency. Although the Wells Fargo Advantage Money Market Funds seek to preserve the value of your investment at $1.00 per share, it is possible to lose money by investing in a money market fund.
| 1. | The Variable Trust Funds are generally available only through insurance company variable contracts. |
| † | In this report, the Wells Fargo Advantage Discovery FundSM, Wells Fargo Advantage Endeavor Select FundSM, Wells Fargo Advantage Enterprise FundSM, Wells Fargo Advantage Opportunity FundSM, Wells Fargo Advantage Social Sustainability FundSM, Wells Fargo Advantage WealthBuilder Conservative Allocation PortfolioSM, Wells Fargo Advantage WealthBuilder Equity PortfolioSM, Wells Fargo Advantage WealthBuilder Growth Allocation PortfolioSM, Wells Fargo Advantage WealthBuilder Growth Balanced PortfolioSM, Wells Fargo Advantage WealthBuilder Moderate Balanced PortfolioSM, Wells Fargo Advantage WealthBuilder Tactical Equity PortfolioSM, Wells Fargo Advantage Dow Jones Target Today FundSM, Wells Fargo Advantage Dow Jones Target 2010 FundSM, Wells Fargo Advantage Dow Jones Target 2015 FundSM, Wells Fargo Advantage Dow Jones Target 2020 FundSM, Wells Fargo Advantage Dow Jones Target 2025 FundSM, Wells Fargo Advantage Dow Jones Target 2030 FundSM, Wells Fargo Advantage Dow Jones Target 2035 FundSM, Wells Fargo Advantage Dow Jones Target 2040 FundSM, Wells Fargo Advantage Dow Jones Target 2045 FundSM, Wells Fargo Advantage Dow Jones Target 2050 FundSM, Wells Fargo Advantage Dow Jones Target 2055 FundSM, Wells Fargo Advantage Heritage Money Market FundSM, Wells Fargo Advantage VT Discovery FundSM, and Wells Fargo Advantage VT Opportunity FundSM are referred to as the Discovery Fund, Endeavor Select Fund, Enterprise Fund, Opportunity Fund, Social Sustainability Fund, WealthBuilder Conservative Allocation Portfolio, WealthBuilder Equity Portfolio, WealthBuilder Growth Allocation Portfolio, WealthBuilder Growth Balanced Portfolio, WealthBuilder Moderate Balanced Portfolio, WealthBuilder Tactical Equity Portfolio, Target Today Fund, Target 2010 Fund, Target 2015 Fund, Target 2020 Fund, Target 2025 Fund, Target 2030 Fund, Target 2035 Fund, Target 2040 Fund, Target 2045 Fund, Target 2050 Fund, Target 2055 Fund, Heritage Money Market Fund, VT Discovery Fund, and VT Opportunity Fund, respectively. |
Not part of the semi-annual report.
| | | | |
| 2 | | Wells Fargo Advantage Short-Term Municipal Bond Fund | | Letter to Shareholders |

Karla M. Rabusch,
President
Wells Fargo Advantage Funds
For the entire six-month period, most of the major fixed-income indexes posted solid positive returns. However, the market’s six-month return figures mask the uneven path that the financial markets traced since the summer as investors had to contend with a variety of global and domestic headwinds.
Dear Valued Shareholder:
We’re pleased to offer you this semi-annual report for the Wells Fargo Advantage Short-Term Municipal Bond Fund for the six-month period that ended December 31, 2011. Upon reviewing the report, you may notice a few changes from past reports, the most significant of which is the change from a multi-fund report to a single-fund report. We made this change to make it easier for you to find your fund information.
For the entire six-month period, most of the major fixed-income indexes posted solid positive returns. However, the market’s six-month return figures mask the uneven path that the financial markets traced since the summer as investors had to contend with a variety of global and domestic headwinds. Whatever the future holds, we continue to believe that most investors can benefit from adhering to a well-diversified investment strategy. Over the long-term, such a strategy may allow you to balance risks and opportunities as you pursue your financial goals in a dynamic market landscape.
The economic recovery gained traction as the year progressed.
The U.S. economic recovery that began in mid-2009 has experienced a few slow patches along the way. However, the recovery regained some upward momentum during the six-month period, yet the rate of growth remained subpar compared with most previous recovery cycles.
In September 2011, it was reported that U.S. gross domestic product (GDP) grew at a mere 1.3% annual rate in the second quarter of 2011, following anemic growth at an annual rate of 0.4% in the first quarter. According to the December estimate, GDP growth accelerated to an annual rate of 1.8% in the third quarter, reigniting hopes for a sustainable recovery. Those hopes were buoyed by widespread anticipation of even stronger GDP growth in the fourth quarter. By year-end, few economists believed that the U.S. economy was in danger of sliding back into recession, although many expected a sluggish growth environment in 2012.
The struggling housing and labor markets slowed growth.
As has been the case throughout the recovery, the housing and labor markets continued to restrain economic momentum during 2011.
The beleaguered housing market has arguably exerted the biggest drag on growth. Despite intermittent signs of improvement, ongoing weakness in sales of both new and existing homes has put considerable downward pressure on prices. On the other hand, the labor market took a decided turn for the better during the final months of 2011: initial unemployment claims have eased, and the private sector has been steadily adding jobs. The pace of hiring, while not brisk, was sufficient to push the U.S. unemployment rate down to 8.5% as of December 2011—still well above its historical average but at its lowest level since February 2009. Many observers expect the unemployment rate to decline further in 2012, which could act as a tailwind for consumer spending—widely viewed as one of the keys to long-term economic growth.
| | | | | | |
| Letter to Shareholders | | Wells Fargo Advantage Short-Term Municipal Bond Fund | | | 3 | |
The Federal Reserve announced that it will keep rates low until 2013.
Consumers have already demonstrated some resilience in their spending—even in the face of higher energy costs. Oil prices skyrocketed in early 2011 before retreating later in the year, only to spike again during the fourth quarter. Yet “core” inflation, which excludes volatile energy and food prices, remained fairly benign throughout the year.
With inflation in check, the Federal Reserve (Fed) held its target range for the federal funds rate—a proxy for short-term interest rates—steady at 0% to 0.25%. Following its August 9, 2011 meeting, the Federal Open Market Committee issued a statement explaining that economic conditions were likely to warrant exceptionally low levels for the federal funds rate through at least mid-2013. In September, the Fed launched yet another stimulus program—dubbed “Operation Twist”—that is designed to keep intermediate- and longer-term yields relatively low. The goal with keeping longer-term rates low is to encourage lending activity to spark business investments and home purchases, which, in turn, may provide support for a more sustainable economic recovery.
Market volatility was a dominant theme during the final six-months of the year.
Early on in the period, market climate shifted to one of anxiety over the increasingly fragile state of the U.S. and global economies. In addition, investors not only worried that the U.S. might be on the brink of recession, they also feared that Europe’s sovereign debt problems could spiral out of control if a Greek default triggered financial contagion across the continent. In July and August, investor sentiment was further undermined by partisan wrangling over the federal debt ceiling and the downgrade of the U.S. credit rating by Standard & Poor’s. The barrage of unsettling headlines led to heightened market volatility and an increase in risk aversion, which translated into sharply falling stock prices and higher demand for “safer” assets such as Treasuries and municipals in the third quarter of 2011. Although volatility persisted into the fourth quarter, the financial markets were able to rebound amid improved U.S. economic data and hopes for a resolution to the European crisis.
For the entire six-month period, the Barclays Capital U.S. Aggregate Bond Index1, which represents the universe of investment-grade bonds, and the Barclays Capital U.S. Treasury Index2 added 4.98% and 7.43%, respectively. By comparison, the Barclays Capital Municipal Bond Index3 gained 6.02% over the last half of the year
Recent events have not altered our message to shareholders.
The market turmoil of 2011 and an uncertain outlook going forward have left many investors questioning their resolve—and their investments. Yet, it is precisely at such times that the market may present opportunities—as well as
| 1. | The Barclays Capital U.S. Aggregate Bond Index is composed of the Barclays Capital Government/Credit Index and the Mortgage-Backed Securities Index and includes U.S. Treasury issues, agency issues, corporate bond issues, and mortgage-backed securities. You cannot invest directly in an index. |
| 2. | The Barclays Capital U.S. Treasury Index is an index of U.S. Treasury Securities. You cannot invest directly in an index. |
| 3. | The Barclays Capital Municipal Bond Index is an unmanaged index composed of long-term tax-exempt bonds with a minimum credit rating of Baa. You cannot invest directly in an index. |
Although volatility persisted into the fourth quarter, the financial markets were able to rebound amid improved U.S. economic data and hopes for a resolution to the European crisis.
| | | | |
| 4 | | Wells Fargo Advantage Short-Term Municipal Bond Fund | | Letter to Shareholders |
challenges—for prudent investors. Bear in mind that many investors who indiscriminately sold their equity investments during the severe market downturn of 2008 to 2009 missed out on the impressive two-year rally that followed. In our opinion, the lesson to be learned from these dramatic market events is that, for many investors, simply building and maintaining a well-diversified4 investment plan is the best long-term strategy.
Thank you for choosing to invest with Wells Fargo Advantage Funds. We appreciate your confidence in us and remain committed to helping you meet your financial needs. For current information about your fund investments, contact your investment professional, visit our website at www.wellsfargo.com/advantagefunds, or call us directly at 1-800-222-8222. We are available 24 hours a day, 7 days a week.
Sincerely,

Karla M. Rabusch
President
Wells Fargo Advantage Funds
| 4. | Diversification does not assure or guarantee better performance and cannot eliminate the risk of investment losses. |
| | | | | | |
| Letter to Shareholders | | Wells Fargo Advantage Short-Term Municipal Bond Fund | | | 5 | |
|
|
Notice to Shareholders Effective April 1, 2012, the Fund may invest up to 10% of its total assets in inverse floaters to seek enhanced returns. Inverse floaters are derivative debt instruments created by depositing a municipal security in a trust. They pay interest at rates that generally vary inversely with specified short-term interest rates. The interest payment received on inverse floaters generally will decrease when specified short-term interest rates increase. Inverse floaters involve leverage, which may magnify the Fund’s gains or losses, and exhibit greater price and income volatility than bonds with similar maturities. We intend to limit leverage created by the Fund’s investment in inverse floaters to an amount equal to 10% of the Fund’s total assets. Inverse floaters are also subject to the risks associated with derivatives and municipal securities. |
|
|
Notice to Shareholders The Board of Trustees for Wells Fargo Advantage Funds has unanimously approved the following modifications to certain net asset value (NAV) waiver privileges and commission schedules: n Effective May 1, 2012, automatic investment plan (AIP) purchases and proceeds received from systematic withdrawals will no longer qualify for NAV repurchase privileges. n Effective May 1, 2012, discretionary rights to waive the upfront commission for Class C and “jumbo” Class A share purchases will no longer be granted to broker/dealers. However, we will continue to waive the Class C shares contingent deferred sales charge for redemptions by employer-sponsored retirement plans where the dealer of record waived its commission at the time of purchase. n Effective July 31, 2012, NAV purchase privileges for former Evergreen Class IS and Class R shareholders are being modified to remove the ability to purchase Class A shares at NAV unless those shares are held directly with the fund on or after July 31, 2012. |
| | | | |
| 6 | | Wells Fargo Advantage Short-Term Municipal Bond Fund | | Performance Highlights (Unaudited) |
INVESTMENT OBJECTIVE
The Fund seeks current income exempt from federal income tax consistent with capital preservation.
ADVISER
Wells Fargo Funds Management, LLC
SUB-ADVISER
Wells Capital Management Incorporated
PORTFOLIO MANAGERS
Wendy Casetta
Lyle J. Fitterer, CFA, CPA
FUND INCEPTION
December 31, 1991
| | |
CREDIT QUALITY1
(AS OF DECEMBER 31, 2011) |
|
 |
| | |
EFFECTIVE MATURITY DISTRIBUTION2
(AS OF DECEMBER 31, 2011) |
|
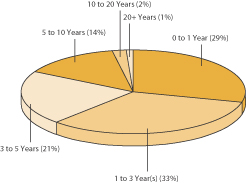 |
| 1. | The ratings indicated are from Standard & Poor’s, Moody’s Investors Service, and/or Fitch Ratings Ltd. Credit Quality Ratings: Credit quality ratings apply to underlying holdings of the Fund and not the Fund itself. Standard and Poor’s rates the creditworthiness of bonds, ranging from AAA (highest) to D (lowest). Ratings from A to CCC may be modified by the addition of a plus (+) or minus (–) sign to show relative standing within the rating categories. Standard & Poor’s rates the creditworthiness of short-term notes from SP-1 (highest) to SP-3 (lowest). Ratings from A to CCC may be modified by the addition of a plus (+) or minus (–) sign to show relative standing within the rating categories. Moody’s rates the creditworthiness of bonds, ranging from Aaa (highest) to C (lowest). Ratings Aa to B may be modified by the addition of a number 1 (highest) to 3 (lowest) to show relative standing within the ratings categories. Moody’s rates the creditworthiness of short-term U.S. tax-exempt municipal securities from MIG 1/VMIG 1 (highest) to SG (lowest). Fitch rates the creditworthiness of bonds, ranging from AAA (highest) to D (lowest). If a security was rated by all three rating agencies, the middle rating was utilized. If rated by two of three rating agencies, the lower rating was utilized and if rated by one of the agencies that rating was utilized. Credit quality is subject to change and is calculated based on the total investments of the Fund. We generally define higher quality bonds as bonds that have a rating of BBB/Baa and above and lower quality bonds as bonds with a rating below BBB/Baa. |
| 2. | Effective maturity is calculated based on the total long-term investments of the Fund. It is subject to change and may have changed since the date specified. |
| | | | | | |
| Performance Highlights (Unaudited) | | Wells Fargo Advantage Short-Term Municipal Bond Fund | | | 7 | |
AVERAGE ANNUAL TOTAL RETURN3 (%) (AS OF DECEMBER 31, 2011)
| | | | | | | | | | | | | | | | | | | | | | | | | | | | | | | | | | | | | | | | | | | | |
| | | | | | Including Sales Charge | | | Excluding Sales Charge | | | Expense Ratios4 | |
| | | Inception Date | | | 6 Months* | | | 1 Year | | | 5 Year | | | 10 Year | | | 6 Months* | | | 1 Year | | | 5 Year | | | 10 Year | | | Gross | | | Net5 | |
Class A (WSMAX) | | | 07/18/2008 | | | | (0.79 | ) | | | 1.17 | | | | 3.30 | | | | 3.51 | | | | 1.23 | | | | 3.24 | | | | 3.72 | | | | 3.72 | | | | 0.79% | | | | 0.60% | |
Class C (WSSCX) | | | 01/31/2003 | | | | (0.15 | ) | | | 1.47 | | | | 2.90 | | | | 2.74 | | | | 0.85 | | | | 2.47 | | | | 2.90 | | | | 2.74 | | | | 1.54% | | | | 1.35% | |
Administrator Class (WSTMX) | | | 07/30/2010 | | | | | | | | | | | | | | | | | | | | 1.23 | | | | 3.24 | | | | 3.69 | | | | 3.60 | | | | 0.73% | | | | 0.60% | |
Institutional Class (WSBIX) | | | 03/31/2008 | | | | | | | | | | | | | | | | | | | | 1.23 | | | | 3.34 | | | | 3.88 | | | | 3.80 | | | | 0.46% | | | | 0.40% | |
Investor Class (STSMX) | | | 12/31/1991 | | | | | | | | | | | | | �� | | | | | | | 1.22 | | | | 3.21 | | | | 3.69 | | | | 3.71 | | | | 0.82% | | | | 0.63% | |
Barclays Capital Composite 1- and 3-Year Municipal Bond Index6 | | | | | | | | | | | | | | | | | | | | | | | 0.91 | | | | 2.51 | | | | 3.67 | | | | 3.15 | | | | | | | | | |
| * | Returns for periods of less than one year are not annualized. |
Figures quoted represent past performance, which is no guarantee of future results and do not reflect the deduction of taxes that a shareholder may pay on fund distributions or the redemption of fund shares. Investment return and principal value of an investment will fluctuate so that an investor’s shares, when redeemed, may be worth more or less than their original cost. Performance shown without sales charges would be lower if sales charges were reflected. Current performance may be lower or higher than the performance data quoted and assumes the reinvestment of dividends and capital gains. Current month-end performance is available on the Fund’s Web site – www.wellsfargo.com/advantagefunds.
Index returns do not include transaction costs associated with buying and selling securities, any mutual fund fees or expenses or any taxes. It is not possible to invest directly in an index.
For Class A shares, the maximum front-end sales charge is 2.00%. For Class C shares, the maximum contingent deferred sales charge is 1.00%. Performance including sales charge assumes the sales charge for the corresponding time period. Administrator Class, Institutional Class, and Investor Class shares are sold without a front-end sales charge or contingent deferred sales charge.
Bond fund values fluctuate in response to the financial condition of individual issuers, general market and economic conditions, and changes in interest rates. In general, when interest rates rise, bond fund values fall and investors may lose principal value. The use of derivatives may reduce returns and/or increase volatility. Certain investment strategies tend to increase the total risk of an investment (relative to the broader market). This Fund is exposed to high-yield securities risk, and municipal securities risk. Consult the Fund’s prospectus for additional information on these and other risks. A portion of the Fund’s income may be subject to federal, state, and/or local income taxes or the alternative minimum tax (AMT). Any capital gains distributions may be taxable.
| 3. | Historical performance shown for Class C shares prior to their inception reflects the performance of the Investor Class shares, adjusted to reflect the higher expenses applicable to Class C shares. Historical performance shown for Class A shares prior to their inception reflects the performance of the Investor Class shares, and includes the higher expenses applicable to the Investor Class shares (except during those periods in which expenses of Class A shares would have been higher than those of the Investor Class no such adjustment is reflected). If these expenses had not been included, returns would be higher. Historical performance shown for the Institutional Class shares prior to their inception reflects the performance of the Investor Class shares, and includes the higher expenses applicable to the Investor Class shares. If these expenses had not been included, returns would be higher. Historical performance shown for the Administrator Class shares prior to their inception reflects the performance of the Institutional Class shares, adjusted to reflect the higher expenses applicable to the Administrator Class shares. |
| 4. | Reflects the expense ratios as stated in the most recent prospectuses. |
| 5. | The Adviser has committed through July 11, 2013 to waive fees and/or reimburse expenses to the extent necessary to cap the Fund’s Total Annual Fund Operating Expenses After Fee Waiver, excluding certain expenses, at the amounts shown above. Without this cap, the Fund’s returns would have been lower. |
| 6. | The Barclays Capital Composite 1- and 3-Year Municipal Bond Index is a blended index weighted 50% in the Barclays Capital 1-Year Municipal Bond Index (the 1-2 year component of the Barclays Capital Municipal Bond Index, which is an unmanaged index composed of long-term tax exempt bonds with a minimum credit rating of Baa), and 50% in the Barclays Capital 3-Year Municipal Bond Index (the 2-4 year component of the Barclays Capital Municipal Bond Index). You cannot invest directly in an index. |
| | | | |
| 8 | | Wells Fargo Advantage Short-Term Municipal Bond Fund | | Fund Expenses (Unaudited) |
As a shareholder of the Fund, you incur two types of costs: (1) transaction costs, including sales charges (loads) on purchase payments and contingent deferred sales charges (if any) on redemptions and (2) ongoing costs, including management fees; distribution (12b-1) and/or shareholder service fees; and other Fund expenses. This example is intended to help you understand your ongoing costs (in dollars) of investing in the Fund and to compare these costs with the ongoing costs of investing in other mutual funds.
The example is based on an investment of $1,000 invested at the beginning of the six-month period and held for the entire period from July 1, 2011 to December 31, 2011.
Actual Expenses
The “Actual” line of the table below provides information about actual account values and actual expenses. You may use the information in this line, together with the amount you invested, to estimate the expenses that you paid over the period. Simply divide your account value by $1,000 (for example, an $8,600 account value divided by $1,000 = 8.6), then multiply the result by the number in the “Actual” line under the heading entitled “Expenses Paid During Period” for your applicable class of shares to estimate the expenses you paid on your account during this period.
Hypothetical Example for Comparison Purposes
The “Hypothetical” line of the table below provides information about hypothetical account values and hypothetical expenses based on the Fund’s actual expense ratio and an assumed rate of return of 5% per year before expenses, which is not the Fund’s actual return. The hypothetical account values and expenses may not be used to estimate the actual ending account balance or expenses you paid for the period. You may use this information to compare the ongoing costs of investing in the Fund and other funds. To do so, compare this 5% hypothetical example with the 5% hypothetical examples that appear in the shareholder reports of the other funds.
Please note that the expenses shown in the table are meant to highlight your ongoing costs only and do not reflect any transactional costs, such as sales charges (loads) and contingent deferred sales charges. Therefore, the “Hypothetical” line of the table is useful in comparing ongoing costs only, and will not help you determine the relative total costs of owning different funds. In addition, if these transactional costs were included, your costs would have been higher.
| | | | | | | | | | | | | | | | |
| | | Beginning
Account Value
07-01-2011 | | | Ending
Account Value
12-31-2011 | | | Expenses
Paid During
the Period1 | | | Net Annual
Expense Ratio | |
Class A | | | | | | | | | | | | | | | | |
Actual | | $ | 1,000.00 | | | $ | 1,012.30 | | | $ | 3.03 | | | | 0.60 | % |
Hypothetical (5% return before expenses) | | $ | 1,000.00 | | | $ | 1,022.12 | | | $ | 3.05 | | | | 0.60 | % |
Class C | | | | | | | | | | | | | | | | |
Actual | | $ | 1,000.00 | | | $ | 1,008.50 | | | $ | 6.82 | | | | 1.35 | % |
Hypothetical (5% return before expenses) | | $ | 1,000.00 | | | $ | 1,018.35 | | | $ | 6.85 | | | | 1.35 | % |
Administrator Class | | | | | | | | | | | | | | | | |
Actual | | $ | 1,000.00 | | | $ | 1,012.30 | | | $ | 3.03 | | | | 0.60 | % |
Hypothetical (5% return before expenses) | | $ | 1,000.00 | | | $ | 1,022.12 | | | $ | 3.05 | | | | 0.60 | % |
Institutional Class | | | | | | | | | | | | | | | | |
Actual | | $ | 1,000.00 | | | $ | 1,012.31 | | | $ | 2.02 | | | | 0.40 | % |
Hypothetical (5% return before expenses) | | $ | 1,000.00 | | | $ | 1,023.13 | | | $ | 2.03 | | | | 0.40 | % |
Investor Class | | | | | | | | | | | | | | | | |
Actual | | $ | 1,000.00 | | | $ | 1,012.15 | | | $ | 3.19 | | | | 0.63 | % |
Hypothetical (5% return before expenses) | | $ | 1,000.00 | | | $ | 1,021.97 | | | $ | 3.20 | | | | 0.63 | % |
| 1. | Expenses paid is equal to the annualized expense ratio of each class multiplied by the average account value over the period, multiplied by the number of days in the most recent fiscal half-year divided by the number of days in the fiscal year (to reflect the one-half year period). |
| | | | | | |
| Portfolio of Investments—December 31, 2011 (Unaudited) | | Wells Fargo Advantage Short-Term Municipal Bond Fund | | | 9 | |
| | | | | | | | | | | | | | | | |
| Security Name | | Interest Rate | | | Maturity Date | | | Principal | | | Value | |
| | | | | | | | | | | | | | | | |
| | | | |
Municipal Bonds and Notes: 95.29% | | | | | | | | | | | | | | | | |
| | | | |
| Alabama: 1.42% | | | | | | | | | | | | | | | | |
Birmingham AL Airport Authority (Miscellaneous Revenue) | | | 3.00 | % | | | 07/01/2013 | | | $ | 1,245,000 | | | $ | 1,273,299 | |
Chatom AL Industrial Development Board Power South Energy Cooperative Projects Series A (Utilities Revenue)± | | | 0.95 | | | | 11/15/2038 | | | | 15,750,000 | | | | 15,763,545 | |
Chatom AL Industrial Development Board Solid Refunding PowerSouth Energy (Utilities Revenue) | | | 4.00 | | | | 08/01/2014 | | | | 5,840,000 | | | | 6,174,866 | |
Chatom AL Industrial Development Board Solid Refunding PowerSouth Energy (Utilities Revenue) | | | 4.00 | | | | 08/01/2015 | | | | 2,890,000 | | | | 3,093,051 | |
Courtland AL Industrial Development Board International Paper Company Project Series A (IDR) | | | 5.00 | | | | 11/01/2013 | | | | 4,000,000 | | | | 4,199,080 | |
East Alabama Health Care Authority Series B (Health Revenue) | | | 4.63 | | | | 09/01/2012 | | | | 1,150,000 | | | | 1,166,422 | |
Fairfield AL Industrial Development Board (IDR) | | | 5.38 | | | | 06/01/2015 | | | | 11,905,000 | | | | 11,972,620 | |
Huntsville AL Solid Waste Disposal Authority (Resource Recovery Revenue, NATL-RE Insured) | | | 5.75 | | | | 10/01/2012 | | | | 3,000,000 | | | | 3,012,480 | |
Jefferson County AL Series B8 (Water & Sewer Revenue, AGM Insured) | | | 5.25 | | | | 02/01/2016 | | | | 500,000 | | | | 491,340 | |
Mobile AL Industrial Development Board PCR Alabama Power Company Barry Series A (IDR)± | | | 4.75 | | | | 06/01/2034 | | | | 9,755,000 | | | | 9,846,502 | |
Mobile AL Industrial Development Board PCR Alabama Power Company Barry Series B (IDR)± | | | 4.88 | | | | 06/01/2034 | | | | 1,500,000 | | | | 1,572,570 | |
University of Alabama at Birmingham Hospital Series A (Health Revenue) | | | 5.00 | | | | 09/01/2012 | | | | 800,000 | | | | 820,152 | |
University of Alabama at Birmingham Hospital Series A (Health Revenue) | | | 5.00 | | | | 09/01/2013 | | | | 380,000 | | | | 401,231 | |
Wedowee Chimney Cove AL Improvement District Chimney Cove Project (Miscellaneous Revenue, West Georgia National Bank LOC)±(s) | | | 5.00 | | | | 07/01/2037 | | | | 3,245,000 | | | | 1,949,434 | |
| | | | |
| | | | | | | | | | | | | | | 61,736,592 | |
| | | | | | | | | | | | | | | | |
| | | | |
| Alaska: 0.10% | | | | | | | | | | | | | | | | |
Alaska Energy Authority (Utilities Revenue, FSA Insured) | | | 6.60 | | | | 07/01/2015 | | | | 3,200,000 | | | | 3,463,200 | |
Alaska Industrial Development & Export Authority Snettisham Hydroelectric Project (Utilities Revenue, AMBAC Insured) | | | 6.00 | �� | | | 01/01/2015 | | | | 460,000 | | | | 461,164 | |
Alaska Student Loan Corporation (Education Revenue) | | | 5.00 | | | | 06/01/2014 | | | | 500,000 | | | | 542,780 | |
| | | | |
| | | | | | | | | | | | | | | 4,467,144 | |
| | | | | | | | | | | | | | | | |
| | | | |
| Arizona: 2.33% | | | | | | | | | | | | | | | | |
Arizona Health Facilities Authority (Health Revenue) | | | 6.25 | | | | 07/01/2022 | | | | 3,000,000 | | | | 3,051,990 | |
Arizona Health Facilities Authority Phoenix Catholic Healthcare West Series E (Health Revenue)± | | | 5.00 | | | | 07/01/2029 | | | | 2,570,000 | | | | 2,628,596 | |
Arizona Health Facilities Authority Phoenix Children’s Hospital Series A (Health Revenue)± | | | 1.10 | | | | 02/01/2042 | | | | 21,515,000 | | | | 20,074,356 | |
Arizona Health Facilities Authority Phoenix Children’s Hospital Series B (Health Revenue)± | | | 0.95 | | | | 02/01/2042 | | | | 15,175,000 | | | | 14,225,197 | |
Arizona School Facilities Board State School Trust (Miscellaneous Revenue, AMBAC Insured) | | | 4.25 | | | | 07/01/2015 | | | | 4,225,000 | | | | 4,447,700 | |
Arizona School Facilities Board State School Trust Series A (Miscellaneous Revenue, AMBAC Insured) | | | 5.50 | | | | 07/01/2014 | | | | 4,590,000 | | | | 4,919,195 | |
Arizona Sports & Tourism Authority (Tax Revenue, Compass Bank LOC)±§ | | | 0.70 | | | | 07/01/2036 | | | | 14,050,000 | | | | 14,050,000 | |
Arizona Sports & Tourism Authority Multipurpose Stadium Facility Project (Miscellaneous Revenue, NATL-RE Insured) | | | 5.25 | | | | 07/01/2015 | | | | 2,300,000 | | | | 2,397,566 | |
Arizona State (Lease Revenue, AGM Insured) | | | 5.00 | | | | 10/01/2013 | | | | 1,750,000 | | | | 1,872,728 | |
Fort McDowell AZ Yavapai Nation Gaming (Miscellaneous Revenue) | | | 7.75 | | | | 05/01/2024 | | | | 18,525,000 | | | | 19,116,318 | |
Gilbert AZ Water Reserve Municipal Property Corporation Sub Lien (Water & Sewer Revenue) | | | 4.75 | | | | 10/01/2032 | | | | 2,370,000 | | | | 2,372,536 | |
| | | | |
| 10 | | Wells Fargo Advantage Short-Term Municipal Bond Fund | | Portfolio of Investments—December 31, 2011 (Unaudited) |
| | | | | | | | | | | | | | | | |
| Security Name | | Interest Rate | | | Maturity Date | | | Principal | | | Value | |
| | | | | | | | | | | | | | | | |
| | | | |
| Arizona (continued) | | | | | | | | | | | | | | | | |
Maricopa County AZ IDA Catholic Healthcare West Series A (Health Revenue) | | | 5.00 | % | | | 07/01/2013 | | | $ | 2,000,000 | | | $ | 2,107,320 | |
Maricopa County AZ IDA Catholic Healthcare West Series B (Health Revenue)± | | | 5.00 | | | | 07/01/2025 | | | | 635,000 | | | | 648,919 | |
Pima County AZ IDA Constellation Schools Project (Lease Revenue) | | | 6.38 | | | | 01/01/2019 | | | | 2,660,000 | | | | 2,675,109 | |
Pima County AZ IDA Global Water Research LLC Project (IDR) | | | 5.50 | | | | 12/01/2013 | | | | 1,120,000 | | | | 1,121,456 | |
Verrado AZ Community Facilities District # 1 (Tax Revenue) | | | 4.85 | | | | 07/15/2014 | | | | 1,165,000 | | | | 1,177,058 | |
Watson AZ Community Facilities Distribution (Miscellaneous Revenue) | | | 5.10 | | | | 07/01/2012 | | | | 1,166,000 | | | | 1,171,760 | |
Watson AZ Community Facilities Distribution (Miscellaneous Revenue) | | | 5.20 | | | | 07/01/2013 | | | | 1,225,000 | | | | 1,236,050 | |
Watson AZ Community Facilities Distribution (Miscellaneous Revenue) | | | 5.30 | | | | 07/01/2014 | | | | 1,391,000 | | | | 1,403,950 | |
White Mountain AZ Apache Tribe Fort Apache Indian Reservation Fort Apache Timber Equipment Lease (Miscellaneous Revenue)(s) | | | 6.25 | | | | 03/04/2012 | | | | 600,747 | | | | 387,320 | |
| | | | |
| | | | | | | | | | | | | | | 101,085,124 | |
| | | | | | | | | | | | | | | | |
| | | | |
| Arkansas: 0.00% | | | | | | | | | | | | | | | | |
Arkansas State Development Financial Authority Public Health Laboratory Project (Health Revenue, AMBAC Insured) | | | 3.90 | | | | 12/01/2024 | | | | 185,000 | | | | 185,072 | |
| | | | | | | | | | | | | | | | |
| | | | |
| California: 7.61% | | | | | | | | | | | | | | | | |
ABAG Finance Authority for Nonprofit Corporation California Georgiana Bruce Kirby Preparatory School (Education Revenue, Comerica Bank LOC)± | | | 3.85 | | | | 02/01/2037 | | | | 2,190,000 | | | | 2,194,227 | |
Alameda County CA COP CAB (Lease Revenue, NATL-RE Insured)(z) | | | 4.51 | | | | 06/15/2014 | | | | 2,185,000 | | | | 1,957,498 | |
Alameda County CA Refunding COP Series A (Lease Revenue, NATL-RE Insured) | | | 5.38 | | | | 12/01/2014 | | | | 3,500,000 | | | | 3,543,645 | |
Alhambra CA City Elementary School Project Series D (Tax Revenue, AGM Insured)(z) | | | 1.47 | | | | 09/01/2014 | | | | 1,570,000 | | | | 1,509,006 | |
Branch Banking & Trust Municipal Trust Various States (Miscellaneous Revenue)±144A | | | 0.97 | | | | 08/01/2014 | | | | 34,000,000 | | | | 33,989,120 | |
California Floaters Series DCL-011 (Miscellaneous Revenue, Dexia Credit Local LOC, FSA Insured)±§ | | | 2.25 | | | | 08/01/2027 | | | | 33,980,000 | | | | 33,980,000 | |
California HFA AMT Home Mortgage Series L (Housing Revenue, FGIC FHA VA Guaranty Insured) | | | 4.05 | | | | 02/01/2014 | | | | 1,000,000 | | | | 992,950 | |
California HFFA Catholic Healthcare Series A (Health Revenue) | | | 4.00 | | | | 03/01/2014 | | | | 3,375,000 | | | | 3,544,830 | |
California HFFA Catholic Healthcare West Series F (Health Revenue)± | | | 5.00 | | | | 07/01/2027 | | | | 6,025,000 | | | | 6,496,276 | |
California MSTR Class A (Miscellaneous Revenue, Societe Generale LOC)±§ | | | 1.00 | | | | 06/01/2032 | | | | 15,000,000 | | | | 15,000,000 | |
California Municipal Finance Authority Waste Management Incorporated Project Series A (Resource Recovery Revenue)± | | | 2.38 | | | | 02/01/2039 | | | | 10,000,000 | | | | 10,089,500 | |
California PCFA Solid Waste Disposal Browning Ferris Industries (Resource Recovery Revenue, FGIC Insured) | | | 4.55 | | | | 02/01/2015 | | | | 2,670,000 | | | | 2,693,683 | |
California PCFA Waste Management Incorporated Project Series A (Resource Recovery Revenue)± | | | 5.00 | | | | 11/01/2038 | | | | 5,000,000 | | | | 5,240,750 | |
California PCFA West Company Series A (Resource Recovery Revenue, Bank of America NA LOC) | | | 5.13 | | | | 01/01/2014 | | | | 875,000 | | | | 877,144 | |
California Statewide CDA Disposal Republic Services Series A (Resource Recovery Revenue) | | | 4.95 | | | | 12/01/2012 | | | | 1,250,000 | | | | 1,292,738 | |
California Statewide CDA International School Peninsula Project (Education Revenue) | | | 4.60 | | | | 11/01/2013 | | | | 335,000 | | | | 338,802 | |
California Statewide CDA Proposition 1A Receivables Program (Miscellaneous Revenue) | | | 5.00 | | | | 06/15/2013 | | | | 1,000,000 | | | | 1,059,320 | |
Centinela Valley California Union High CAB BAN (Tax Revenue)(z) | | | 2.86 | | | | 12/01/2013 | | | | 4,755,000 | | | | 4,501,035 | |
Centinela Valley California Union High CAB BAN (Tax Revenue) | | | 4.00 | | | | 12/01/2013 | | | | 5,670,000 | | | | 5,924,526 | |
Chino Ontario Upland CA Water Facilities Authority COP Agua de Lejos Project (Water & Sewer Revenue, NATL-RE FGIC Insured) | | | 5.20 | | | | 10/01/2015 | | | | 615,000 | | | | 617,847 | |
| | | | | | |
| Portfolio of Investments—December 31, 2011 (Unaudited) | | Wells Fargo Advantage Short-Term Municipal Bond Fund | | | 11 | |
| | | | | | | | | | | | | | | | |
| Security Name | | Interest Rate | | | Maturity Date | | | Principal | | | Value | |
| | | | | | | | | | | | | | | | |
| | | | |
| California (continued) | | | | | | | | | | | | | | | | |
Culver City CA RDFA (Tax Revenue, AMBAC Insured) | | | 5.50 | % | | | 11/01/2014 | | | $ | 1,455,000 | | | $ | 1,499,043 | |
Delano CA Financing Authority Lease Police Station & Capital Improvements Series A (Lease Revenue) | | | 3.00 | | | | 12/01/2013 | | | | 940,000 | | | | 953,517 | |
Eureka CA Unified School District Series A (Tax Revenue, NATL-RE FGIC Insured)(z) | | | 3.39 | | | | 08/01/2018 | | | | 6,520,000 | | | | 5,217,304 | |
Gilroy CA Unified School District CAB BAN (Tax Revenue) | | | 5.00 | | | | 04/01/2013 | | | | 1,210,000 | | | | 1,281,523 | |
Golden Empire Schools Financing Authority (Lease Revenue) | | | 4.00 | | | | 05/01/2012 | | | | 15,000,000 | | | | 15,169,800 | |
Golden State Tobacco Securitization Corporation California Enhanced Asset-Backed Series A (Tobacco Revenue, AMBAC Insured) | | | 5.00 | | | | 06/01/2013 | | | | 5,575,000 | | | | 5,785,847 | |
Inland Valley CA Development Agency Series B (Tax Revenue)± | | | 4.25 | | | | 03/01/2041 | | | | 35,100,000 | | | | 35,723,376 | |
Inland Valley CA Development Agency Series C (Tax Revenue)± | | | 4.50 | | | | 03/01/2041 | | | | 17,700,000 | | | | 18,090,462 | |
Kern CA Community College District COP (Lease Revenue) | | | 4.00 | | | | 04/01/2014 | | | | 16,000,000 | | | | 16,568,320 | |
Kirkwood Meadows CA Public Utility District (Utilities Revenue) | | | 4.50 | | | | 05/01/2013 | | | | 6,715,000 | | | | 6,740,114 | |
Long Beach CA Bond Finance Authority Natural Gas Purchase Revenue Series A (Utilities Revenue) | | | 5.00 | | | | 11/15/2014 | | | | 800,000 | | | | 831,464 | |
Los Angeles CA Regional Airports Authority (Miscellaneous Revenue, AGM Insured) | | | 5.00 | | | | 01/01/2015 | | | | 1,120,000 | | | | 1,211,997 | |
Monterey County CA COP Refinancing Project (Lease Revenue, AGM Insured) | | | 4.00 | | | | 08/01/2013 | | | | 800,000 | | | | 832,304 | |
Northern California Gas Authority # 1 LIBOR (Utilities Revenue)± | | | 0.85 | | | | 07/01/2017 | | | | 17,745,000 | | | | 15,473,463 | |
Northern California Gas Authority # 1 LIBOR (Utilities Revenue)± | | | 0.88 | | | | 07/01/2019 | | | | 18,025,000 | | | | 14,240,291 | |
Oakland CA Unified School District (Tax Revenue, NATL-RE FGIC Insured) | | | 5.00 | | | | 08/01/2016 | | | | 2,810,000 | | | | 3,092,686 | |
Port Hueneme CA Redevelopment Agency Central Community Project (Tax Revenue, AMBAC Insured) | | | 5.50 | | | | 05/01/2014 | | | | 1,270,000 | | | | 1,284,554 | |
Port of Oakland CA Series N AMT (Port Authority Revenue, NATL-RE Insured) | | | 5.00 | | | | 11/01/2014 | | | | 4,090,000 | | | | 4,198,590 | |
Poway CA Community Facilities District # 88-1 Parkway Business (Tax Revenue) | | | 3.50 | | | | 08/15/2013 | | | | 3,070,000 | | | | 3,101,007 | |
Sacramento CA City Financing Authority Series A (Lease Revenue, AMBAC Insured) | | | 5.38 | | | | 11/01/2014 | | | | 4,365,000 | | | | 4,556,493 | |
Sacramento CA City Financing Authority Series B (Lease Revenue) | | | 5.00 | | | | 11/01/2014 | | | | 1,135,000 | | | | 1,177,063 | |
San Bernardino County CA COP Arrowhead Project Series A (Lease Revenue) | | | 5.00 | | | | 08/01/2012 | | | | 1,315,000 | | | | 1,345,916 | |
San Buenaventura CA Community Memorial Health System (Health Revenue) | | | 5.00 | | | | 12/01/2016 | | | | 1,730,000 | | | | 1,736,661 | |
San Diego CA PFFA Ballpark Series A (Lease Revenue, AMBAC Insured)144A | | | 5.00 | | | | 02/15/2014 | | | | 4,310,000 | | | | 4,639,207 | |
San Diego CA PFFA Ballpark Series A (Lease Revenue, AMBAC Insured)144A | | | 5.00 | | | | 02/15/2015 | | | | 4,525,000 | | | | 4,976,052 | |
San Francisco CA Building Authority Civic Center Project Series A (Lease Revenue) | | | 5.00 | | | | 12/01/2013 | | | | 1,000,000 | | | | 1,072,540 | |
San Francisco CA City & County Redevelopment Agency Hotel Occupancy (Tax Revenue, AGM Insured) | | | 3.00 | | | | 06/01/2014 | | | | 790,000 | | | | 815,549 | |
San Francisco CA City & County Redevelopment Agency Hotel Occupancy (Tax Revenue, AGM Insured) | | | 4.00 | | | | 06/01/2015 | | | | 2,515,000 | | | | 2,689,365 | |
San Jose CA Airport Authority Series A-1 (Airport Revenue) | | | 3.50 | | | | 03/01/2014 | | | | 1,000,000 | | | | 1,044,750 | |
San Manuel CA Entertainment Authority Series 2004-C (Tax Revenue)144A | | | 4.50 | | | | 12/01/2016 | | | | 6,900,000 | | | | 6,798,156 | |
Savanna CA Elementary School District BAN (Tax Revenue) | | | 4.00 | | | | 05/01/2012 | | | | 900,000 | | | | 908,397 | |
Savanna CA Elementary School District CAB (Tax Revenue)(z) | | | 1.90 | | | | 05/01/2012 | | | | 2,000,000 | | | | 1,987,260 | |
Sierra CA Joint Community College District School Facilities Improvement District # 2 CAB Series B (Tax Revenue, NATL-RE Insured)(z) | | | 1.72 | | | | 08/01/2015 | | | | 500,000 | | | | 469,915 | |
Upland CA COP San Antonio Community Hospital Project (Lease Revenue) | | | 5.00 | | | | 01/01/2015 | | | | 1,915,000 | | | | 2,063,030 | |
Washington Township CA Health Care District Election 2004 Series A (Tax Revenue) | | | 6.50 | | | | 08/01/2013 | | | | 750,000 | | | | 809,978 | |
| | | | |
| 12 | | Wells Fargo Advantage Short-Term Municipal Bond Fund | | Portfolio of Investments—December 31, 2011 (Unaudited) |
| | | | | | | | | | | | | | | | |
| Security Name | | Interest Rate | | | Maturity Date | | | Principal | | | Value | |
| | | | | | | | | | | | | | | | |
| | | | |
| California (continued) | | | | | | | | | | | | | | | | |
Washington Township CA Health Care District Election 2004 Series A (Tax Revenue) | | | 6.50 | % | | | 08/01/2014 | | | $ | 1,000,000 | | | $ | 1,120,030 | |
Washington Township CA Health Care District Series A (Health Revenue) | | | 5.00 | | | | 07/01/2012 | | | | 300,000 | | | | 305,499 | |
Washington Township CA Health Care District Series A (Health Revenue) | | | 5.00 | | | | 07/01/2014 | | | | 1,000,000 | | | | 1,070,350 | |
Whittier CA Health Facility Revenue Presbyterian Intercommunity Hospital D (Health Revenue) | | | 5.00 | | | | 06/01/2013 | | | | 3,000,000 | | | | 3,147,090 | |
| | | | |
| | | | | | | | | | | | | | | 329,871,860 | |
| | | | | | | | | | | | | | | | |
| | | | |
| Colorado: 0.29% | | | | | | | | | | | | | | | | |
Colorado ECFA Twin Peaks Charter School (Miscellaneous Revenue) | | | 5.75 | | | | 11/15/2018 | | | | 180,000 | | | | 192,506 | |
Colorado Health Facilities Authority Catholic Health Series C-2 (Health Revenue)± | | | 4.00 | | | | 10/01/2040 | | | | 3,000,000 | | | | 3,315,690 | |
Public Authority for Colorado Energy Natural Gas (Utilities Revenue) | | | 5.75 | | | | 11/15/2018 | | | | 8,375,000 | | | | 8,967,783 | |
| | | | |
| | | | | | | | | | | | | | | 12,475,979 | |
| | | | | | | | | | | | | | | | |
| | | | |
| Connecticut: 2.05% | | | | | | | | | | | | | | | | |
Connecticut Series A (Miscellaneous Revenue)± | | | 0.87 | | | | 05/15/2017 | | | | 17,000,000 | | | | 17,000,000 | |
Connecticut Series A (Miscellaneous Revenue)± | | | 1.02 | | | | 05/15/2018 | | | | 17,740,000 | | | | 17,740,000 | |
Connecticut Series A (Miscellaneous Revenue)±§ | | | 1.05 | | | | 03/01/2017 | | | | 12,295,000 | | | | 12,294,508 | |
Connecticut Series A (Miscellaneous Revenue)±§ | | | 1.30 | | | | 03/01/2018 | | | | 13,500,000 | | | | 13,499,460 | |
Connecticut Series A (Miscellaneous Revenue)±§ | | | 1.45 | | | | 03/01/2019 | | | | 21,500,000 | | | | 21,523,650 | |
Connecticut Series C (Miscellaneous Revenue)± | | | 0.75 | | | | 05/15/2016 | | | | 5,000,000 | | | | 4,989,550 | |
Eastern Connecticut Resource Recovery Authority Solid Waste Wheelabrator Lisbon Incorporated Project Series A (Resource Recovery Revenue) | | | 5.50 | | | | 01/01/2014 | | | | 1,655,000 | | | | 1,659,568 | |
Naugatuck CT COP Incineration Facility Project Series A (Lease Revenue, AMBAC Insured) | | | 5.00 | | | | 06/15/2015 | | | | 305,000 | | | | 308,770 | |
| | | | |
| | | | | | | | | | | | | | | 89,015,506 | |
| | | | | | | | | | | | | | | | |
| | | | |
| District of Columbia: 0.55% | | | | | | | | | | | | | | | | |
District of Columbia (Tax Revenue)± | | | 0.85 | | | | 12/01/2017 | | | | 13,000,000 | | | | 13,001,690 | |
District of Columbia BAN Pilot Arthur (Tax Revenue) | | | 4.00 | | | | 12/01/2012 | | | | 2,900,000 | | | | 2,965,192 | |
District of Columbia Convention Center Authority Series A (Tax Revenue, AMBAC Insured) | | | 5.00 | | | | 10/01/2012 | | | | 1,980,000 | | | | 2,042,132 | |
District of Columbia HFA Series B (Housing Revenue) | | | 5.63 | | | | 06/01/2035 | | | | 725,000 | | | | 741,523 | |
District of Columbia Tobacco Settlement Financing Corporation Asset-Backed Bonds (Tobacco Revenue) | | | 5.70 | | | | 05/15/2012 | | | | 5,000,000 | | | | 5,065,100 | |
| | | | |
| | | | | | | | | | | | | | | 23,815,637 | |
| | | | | | | | | | | | | | | | |
| | | | |
| Florida: 6.25% | | | | | | | | | | | | | | | | |
Arcadia FL Housing Authority Arcadia Oaks Association Limited Project (Housing Revenue) | | | 4.25 | | | | 01/01/2012 | | | | 2,800,000 | | | | 2,800,168 | |
Boynton Beach FL Utility System Refunding (Water & Sewer Revenue, NATL-RE FGIC Insured) | | | 5.00 | | | | 11/01/2012 | | | | 140,000 | | | | 142,853 | |
Citizens Property Insurance Corporation of Florida (Miscellaneous Revenue, AGM Insured)± | | | 1.75 | | | | 06/01/2014 | | | | 31,000,000 | | | | 31,108,810 | |
Citrus County FL COP (Lease Revenue, Assured Guaranty Insured) | | | 4.00 | | | | 04/01/2013 | | | | 2,170,000 | | | | 2,242,955 | |
Connerton FL West Community Development District Series B (Miscellaneous Revenue)(s) | | | 5.13 | | | | 05/01/2016 | | | | 1,400,000 | | | | 561,890 | |
Cooper City FL Utility System (Water & Sewer Revenue, AMBAC Insured)(z) | | | 6.88 | | | | 10/01/2013 | | | | 805,000 | | | | 715,170 | |
Emerald Coast FL Utilities Authority Revenue Series B (Utilities Revenue, NATL-RE-IBC FGIC Insured) | | | 6.25 | | | | 01/01/2013 | | | | 1,000,000 | | | | 1,048,740 | |
| | | | | | |
| Portfolio of Investments—December 31, 2011 (Unaudited) | | Wells Fargo Advantage Short-Term Municipal Bond Fund | | | 13 | |
| | | | | | | | | | | | | | | | |
| Security Name | | Interest Rate | | | Maturity Date | | | Principal | | | Value | |
| | | | | | | | | | | | | | | | |
| | | | |
| Florida (continued) | | | | | | | | | | | | | | | | |
Escambia County FL Utilities Authority (Utilities Revenue, NATL-RE FGIC Insured) | | | 6.25 | % | | | 01/01/2015 | | | $ | 1,290,000 | | | $ | 1,382,441 | |
Florida Housing Finance Corporation (Housing Revenue) | | | 4.25 | | | | 12/15/2012 | | | | 6,740,000 | | | | 6,747,347 | |
Florida Housing Finance Corporation Series 2 (Housing Revenue) | | | 5.00 | | | | 01/01/2035 | | | | 365,000 | | | | 365,489 | |
Florida State Department of Corrections COP Okeechobee Correctional Facility Project (Lease Revenue, AMBAC Insured) | | | 5.00 | | | | 03/01/2014 | | | | 1,000,000 | | | | 1,068,950 | |
Florida State Development Finance Corporation Renaissance Charter School Series A (Education Revenue) | | | 6.50 | | | | 06/15/2021 | | | | 2,000,000 | | | | 2,055,340 | |
Gulf Breeze FL Local Government Loan Series B (Miscellaneous Revenue)± | | | 3.00 | | | | 12/01/2020 | | | | 12,000,000 | | | | 11,914,920 | |
Gulf Breeze FL Local Government Series B (Miscellaneous Revenue, FGIC Insured)± | | | 4.00 | | | | 12/01/2020 | | | | 1,135,000 | | | | 1,119,905 | |
Gulf Breeze FL Local Government Series B (Miscellaneous Revenue, FGIC Insured)± | | | 5.30 | | | | 12/01/2015 | | | | 100,000 | | | | 100,289 | |
Gulf Breeze FL Series B (Miscellaneous Revenue, FGIC Insured)± | | | 4.25 | | | | 12/01/2020 | | | | 2,050,000 | | | | 2,036,614 | |
Gulf Breeze FL Series C (Miscellaneous Revenue, FGIC Insured)± | | | 4.00 | | | | 12/01/2020 | | | | 1,070,000 | | | | 1,071,980 | |
Halifax FL Hospital Medical Center (Health Revenue) | | | 5.25 | | | | 06/01/2016 | | | | 1,000,000 | | | | 1,092,150 | |
Highlands County FL Health Facilities Authority Health Series I (Health Revenue) | | | 4.50 | | | | 11/15/2015 | | | | 4,625,000 | | | | 5,121,031 | |
Hillsborough County FL IDA (Tax Revenue, AMBAC Insured) | | | 5.00 | | | | 10/01/2013 | | | | 1,000,000 | | | | 1,045,860 | |
Hillsborough County FL IDA (Tax Revenue, AMBAC Insured) | | | 5.00 | | | | 10/01/2015 | | | | 3,365,000 | | | | 3,627,706 | |
Hillsborough County FL IDA (Tax Revenue, AMBAC Insured) | | | 5.00 | | | | 10/01/2016 | | | | 7,325,000 | | | | 7,885,509 | |
Hillsborough County FL IDA (Tax Revenue) | | | 5.25 | | | | 10/01/2015 | | | | 2,790,000 | | | | 2,986,416 | |
Hillsborough County FL Port District Series A (Port Authority Revenue, NATL-RE Insured) | | | 5.75 | | | | 06/01/2016 | | | | 1,060,000 | | | | 1,085,525 | |
Lakeland FL Energy System Revenue (Utilities Revenue)± | | | 1.20 | | | | 10/01/2014 | | | | 42,000,000 | | | | 42,181,020 | |
Lee County FL Airport Refunding Series A (Port Authority Revenue, AGM Insured) | | | 5.00 | | | | 10/01/2014 | | | | 3,000,000 | | | | 3,229,080 | |
Lee County FL Memorial Health System Series A (Health Revenue, AGM Insured) | | | 5.75 | | | | 04/01/2013 | | | | 2,700,000 | | | | 2,735,316 | |
Manatee County FL HFA Single Family Sub-Series 2 (Housing Revenue, GNMA Insured) | | | 6.50 | | | | 11/01/2023 | | | | 85,000 | | | | 86,477 | |
Marion County FL School Board Series B (Lease Revenue, AMBAC Insured) | | | 5.00 | | | | 06/01/2014 | | | | 325,000 | | | | 351,150 | |
Miami Gardens FL COP Series A-1 (Lease Revenue) | | | 4.00 | | | | 06/01/2013 | | | | 1,055,000 | | | | 1,091,830 | |
Miami Gardens FL COP Series A-1 (Lease Revenue) | | | 5.00 | | | | 06/01/2014 | | | | 1,095,000 | | | | 1,173,369 | |
Miami-Dade County FL (Health Revenue) | | | 4.00 | | | | 08/01/2013 | | | | 480,000 | | | | 495,456 | |
Miami-Dade County FL (Health Revenue) | | | 4.00 | | | | 08/01/2014 | | | | 500,000 | | | | 519,960 | |
Miami-Dade County FL (Health Revenue) | | | 4.00 | | | | 08/01/2015 | | | | 615,000 | | | | 642,614 | |
Miami-Dade County FL Aviation (Port Authority Revenue, NATL-RE Insured) | | | 5.25 | | | | 10/01/2014 | | | | 1,000,000 | | | | 1,002,560 | |
Miami-Dade County FL Educational Facilities Authority University of Miami Series A (Education Revenue) | | | 5.25 | | | | 04/01/2016 | | | | 1,000,000 | | | | 1,121,760 | |
Miami-Dade County FL Health Facilities Authority Miami Children’s Series A-2 (Health Revenue, NATL-RE Insured)± | | | 4.55 | | | | 08/01/2046 | | | | 1,850,000 | | | | 1,927,330 | |
Miami-Dade County FL IDA Dolphins Stadium Project Series D (IDR)±§ | | | 3.00 | | | | 07/01/2032 | | | | 17,000,000 | | | | 17,000,000 | |
Miami-Dade County FL IDA Series C (IDR)±§ | | | 3.00 | | | | 07/01/2032 | | | | 1,000,000 | | | | 1,000,000 | |
Miami-Dade County FL School Board COP (Lease Revenue, Assured Guaranty Insured) | | | 5.00 | | | | 05/01/2016 | | | | 1,400,000 | | | | 1,591,870 | |
Miami-Dade County FL School Board COP (Lease Revenue)± | | | 5.00 | | | | 05/01/2032 | | | | 17,000,000 | | | | 18,716,490 | |
Miami-Dade County FL School Board COP (Lease Revenue, NATL-RE FGIC Insured) | | | 5.25 | | | | 10/01/2015 | | | | 4,000,000 | | | | 4,321,440 | |
Miami-Dade County FL School Board COP Series A (Lease Revenue, NATL-RE FGIC Insured) | | | 5.00 | | | | 05/01/2012 | | | | 7,760,000 | | | | 7,885,014 | |
| | | | |
| 14 | | Wells Fargo Advantage Short-Term Municipal Bond Fund | | Portfolio of Investments—December 31, 2011 (Unaudited) |
| | | | | | | | | | | | | | | | |
| Security Name | | Interest Rate | | | Maturity Date | | | Principal | | | Value | |
| | | | | | | | | | | | | | | | |
| | | | |
| Florida (continued) | | | | | | | | | | | | | | | | |
Miami-Dade County FL School Board COP Series A (Lease Revenue, AMBAC Insured) | | | 5.00 | % | | | 08/01/2012 | | | $ | 1,600,000 | | | $ | 1,639,248 | |
Miami-Dade County FL School Board Master Equipment Lease 2 (Lease Revenue) | | | 3.59 | | | | 03/03/2016 | | | | 10,864,563 | | | | 11,262,532 | |
North Sumter County FL Utility Dependent District (Water & Sewer Revenue) | | | 4.00 | | | | 10/01/2012 | | | | 1,165,000 | | | | 1,187,578 | |
North Sumter County FL Utility Dependent District (Water & Sewer Revenue) | | | 4.00 | | | | 10/01/2013 | | | | 1,000,000 | | | | 1,041,480 | |
North Sumter County FL Utility Dependent District (Water & Sewer Revenue) | | | 5.00 | | | | 10/01/2014 | | | | 1,710,000 | | | | 1,846,202 | |
North Sumter County FL Utility Dependent District (Water & Sewer Revenue) | | | 5.00 | | | | 10/01/2015 | | | | 1,905,000 | | | | 2,084,546 | |
Orange County FL Health Facilities Authority Orlando Health Incorporated (Health Revenue) | | | 5.00 | | | | 10/01/2013 | | | | 1,450,000 | | | | 1,533,027 | |
Orange County FL Health Facilities Authority Orlando Health Incorporated (Health Revenue) | | | 5.00 | | | | 10/01/2014 | | | | 1,000,000 | | | | 1,071,170 | |
Polk County FL School Board COP Series A (Lease Revenue, AGM Insured) | | | 3.00 | | | | 01/01/2014 | | | | 535,000 | | | | 550,884 | |
Polk County FL School Board COP Series A (Lease Revenue, AGM Insured) | | | 3.00 | | | | 01/01/2015 | | | | 1,935,000 | | | | 2,011,220 | |
Polk County FL School Board COP Series B (Lease Revenue, AGM Insured) | | | 3.00 | | | | 01/01/2015 | | | | 1,235,000 | | | | 1,283,647 | |
Sarasota County FL Educational Facilities School Arts & Sciences Project (Miscellaneous Revenue) | | | 5.20 | | | | 07/01/2017 | | | | 880,000 | | | | 889,134 | |
Seminole Tribe Florida Series 2010A Gaming Division Series A (Miscellaneous Revenue)144A | | | 5.13 | | | | 10/01/2017 | | | | 1,400,000 | | | | 1,421,700 | |
South Lake County FL Hospital District (Health Revenue) | | | 4.00 | | | | 10/01/2014 | | | | 835,000 | | | | 869,335 | |
South Lake County FL Hospital District (Health Revenue) | | | 5.00 | | | | 10/01/2015 | | | | 920,000 | | | | 996,029 | |
St. Johns County FL Water & Sewer Authority Series A (Tax Revenue, NATL-RE Insured)(z) | | | 2.08 | | | | 06/01/2013 | | | | 2,600,000 | | | | 2,524,210 | |
St. Johns County FL Water & Sewer Authority Series A (Tax Revenue, NATL-RE Insured)(z) | | | 2.36 | | | | 06/01/2014 | | | | 1,645,000 | | | | 1,553,587 | |
St. Lucie County FL School Board Certificates Series A (Lease Revenue) | | | 3.50 | | | | 07/01/2014 | | | | 2,780,000 | | | | 2,914,663 | |
St. Lucie County FL School Board Certificates Series A (Lease Revenue) | | | 4.00 | | | | 07/01/2015 | | | | 4,835,000 | | | | 5,204,056 | |
Tampa Bay FL Water Regional Water Refunding (Water & Sewer Revenue) | | | 5.00 | | | | 10/01/2012 | | | | 2,000,000 | | | | 2,070,700 | |
Tampa Bay FL Water Regional Water Refunding (Water & Sewer Revenue) | | | 5.00 | | | | 10/01/2013 | | | | 1,000,000 | | | | 1,079,070 | |
Tampa Bay FL Water Regional Water Refunding (Water & Sewer Revenue) | | | 5.00 | | | | 10/01/2015 | | | | 2,500,000 | | | | 2,874,075 | |
Volusia County FL School Board (Tax Revenue) | | | 5.00 | | | | 10/01/2015 | | | | 12,905,000 | | | | 14,169,948 | |
Volusia County FL School Board (Tax Revenue) | | | 5.00 | | | | 10/01/2016 | | | | 10,000,000 | | | | 11,147,600 | |
Volusia County FL School Board (Tax Revenue, NATL-RE Insured) | | | 5.00 | | | | 10/01/2016 | | | | 1,000,000 | | | | 1,053,680 | |
| | | | |
| | | | | | | | | | | | | | | 270,680,115 | |
| | | | | | | | | | | | | | | | |
| | | | |
| Georgia: 0.82% | | | | | | | | | | | | | | | | |
Atlanta GA Water & Wastewater System Series A (Water & Sewer Revenue, NATL-RE FGIC Insured) | | | 5.50 | | | | 11/01/2012 | | | | 8,500,000 | | | | 8,852,325 | |
Dalton GA School District Equipment Lease Purchase # 996-021203 (GO-Local) | | | 4.20 | | | | 08/01/2013 | | | | 711,062 | | | | 713,487 | |
Dalton GA School District Equipment Lease Purchase # 996-021203 Series B (GO - Local) | | | 4.20 | | | | 08/01/2013 | | | | 263,369 | | | | 263,827 | |
Fulton County GA Residential Care Facilities Authority Lenbrook Project Series A (Health Revenue) | | | 5.00 | | | | 07/01/2017 | | | | 4,000,000 | | | | 3,740,120 | |
Georgia Environmental Facilities (Miscellaneous Revenue) | | | 2.40 | | | | 03/15/2016 | | | | 5,500,000 | | | | 5,715,490 | |
Georgia Municipal Electric Authority Prerefunded Balance Class A (Utilities Revenue, Societe Generale LOC, NATL-RE IBC Bank of New York Insured)±144A | | | 1.05 | | | | 01/01/2018 | | | | 2,145,000 | | | | 2,145,000 | |
Henry County GA Master State Municipal Loan (Lease Revenue) | | | 4.09 | | | | 04/24/2016 | | | | 3,748,623 | | | | 3,800,579 | |
| | | | | | |
| Portfolio of Investments—December 31, 2011 (Unaudited) | | Wells Fargo Advantage Short-Term Municipal Bond Fund | | | 15 | |
| | | | | | | | | | | | | | | | |
| Security Name | | Interest Rate | | | Maturity Date | | | Principal | | | Value | |
| | | | | | | | | | | | | | | | |
| | | | |
| Georgia (continued) | | | | | | | | | | | | | | | | |
Kane & De Kalb County IL Community Parks & Greenspace Project (Tax Revenue) | | | 5.00 | % | | | 12/01/2014 | | | $ | 1,495,000 | | | $ | 1,614,570 | |
Pike County GA School District (Tax Revenue, AMBAC State Aid Withholding Insured) | | | 5.70 | | | | 02/01/2016 | | | | 1,000,000 | | | | 1,070,110 | |
Public Gas Partners Incorporated GA Series A (Utilities Revenue) | | | 5.00 | | | | 10/01/2013 | | | | 1,825,000 | | | | 1,937,730 | |
Public Gas Partners Incorporated GA Series A (Utilities Revenue) | | | 5.00 | | | | 10/01/2014 | | | | 3,000,000 | | | | 3,263,640 | |
Putnam County GA School District (Miscellaneous Revenue) | | | 4.20 | | | | 03/01/2013 | | | | 100,600 | | | | 100,786 | |
Richmond County GA Development Authority (IDR) | | | 5.15 | | | | 03/01/2015 | | | | 2,000,000 | | | | 2,137,120 | |
| | | | |
| | | | | | | | | | | | | | | 35,354,784 | |
| | | | | | | | | | | | | | | | |
| | | | |
| Guam: 0.11% | | | | | | | | | | | | | | | | |
Guam Department of Education John F. Kennedy High School Project Series A COP (Lease Revenue) | | | 5.50 | | | | 12/01/2015 | | | | 455,000 | | | | 466,725 | |
Guam Government Hotel Occupancy Series A (Tax Revenue) | | | 3.75 | | | | 11/01/2014 | | | | 1,845,000 | | | | 1,890,239 | |
Guam Government Hotel Occupancy Series A (Tax Revenue) | | | 4.13 | | | | 11/01/2015 | | | | 750,000 | | | | 780,420 | |
Guam Government Limited Obligation Section 30 Series A (Miscellaneous Revenue) | | | 5.00 | | | | 12/01/2012 | | | | 500,000 | | | | 512,870 | |
Guam Government Waterworks Authority (Water & Sewer Revenue) | | | 4.00 | | | | 07/01/2015 | | | | 980,000 | | | | 969,436 | |
| | | | |
| | | | | | | | | | | | | | | 4,619,690 | |
| | | | | | | | | | | | | | | | |
| | | | |
| Hawaii: 0.12% | | | | | | | | | | | | | | | | |
Hawaii Department of Budget & Finance Hawaiian Electric Company Series A (Utilities Revenue, NATL-RE Insured) | | | 4.95 | | | | 04/01/2012 | | | | 4,545,000 | | | | 4,564,680 | |
Hawaii Harbor Systems Series A (Port Authority Revenue, AGM Insured) | | | 5.00 | | | | 01/01/2013 | | | | 645,000 | | | | 671,006 | |
| | | | |
| | | | | | | | | | | | | | | 5,235,686 | |
| | | | | | | | | | | | | | | | |
| | | | |
| Idaho: 0.02% | | | | | | | | | | | | | | | | |
Idaho Housing & Finance Association Series A (Housing Revenue) | | | 6.25 | | | | 07/01/2038 | | | | 700,000 | | | | 735,392 | |
| | | | | | | | | | | | | | | | |
| | | | |
| Illinois: 8.41% | | | | | | | | | | | | | | | | |
Chicago IL (Airport Revenue, BHAC-CR AMBAC Insured) | | | 5.50 | | | | 01/01/2016 | | | | 60,000 | | | | 60,191 | |
Chicago IL Charter School Project (Miscellaneous Revenue) | | | 4.50 | | | | 12/01/2012 | | | | 600,000 | | | | 611,004 | |
Chicago IL Charter School Project (Miscellaneous Revenue) | | | 5.00 | | | | 12/01/2014 | | | | 360,000 | | | | 378,634 | |
Chicago IL Housing Authority (Housing Revenue, AGM Housing & Urban Development Loan Insured) | | | 5.00 | | | | 07/01/2013 | | | | 2,580,000 | | | | 2,727,163 | |
Chicago IL Housing Authority (Housing Revenue, AGM Housing & Urban Development Loan Insured) | | | 5.00 | | | | 07/01/2014 | | | | 2,265,000 | | | | 2,457,842 | |
Chicago IL Motor Fuel Tax Revenue (Tax Revenue, AMBAC Insured) | | | 5.38 | | | | 01/01/2014 | | | | 645,000 | | | | 670,568 | |
Chicago IL O’Hare International Airport Second Lien General Airport (Airport Revenue, AMBAC Insured) | | | 5.50 | | | | 01/01/2018 | | | | 15,875,000 | | | | 15,918,656 | |
Chicago IL O’Hare International Airport (Airport Revenue) | | | 5.00 | | | | 01/01/2017 | | | | 2,265,000 | | | | 2,597,411 | |
Chicago IL Series A (Tax Revenue, NATL-RE Insured) | | | 5.38 | | | | 01/01/2013 | | | | 800,000 | | | | 813,592 | |
Chicago IL Series A2 (Tax Revenue, AMBAC Insured) | | | 5.50 | | | | 01/01/2018 | | | | 32,080,000 | | | | 36,695,991 | |
Chicago IL Series D (Miscellaneous Revenue, AGM Insured)±§ | | | 4.00 | | | | 01/01/2040 | | | | 47,000,000 | | | | 47,000,000 | |
Chicago IL Series DCL 2008-068 (Tax Revenue, Dexia Credit Local LOC, FSA-CR AMBAC Insured)±§144A | | | 2.25 | | | | 01/01/2022 | | | | 9,980,000 | | | | 9,980,000 | |
Chicago IL Series E (Tax Revenue)±§ | | | 0.80 | | | | 01/01/2042 | | | | 9,000,000 | | | | 9,000,000 | |
Chicago IL Series G (Tax Revenue)±§ | | | 0.80 | | | | 01/01/2042 | | | | 8,000,000 | | | | 8,000,000 | |
Chicago IL Transit Authority (Miscellaneous Revenue, AMBAC Insured) | | | 5.25 | | | | 06/01/2013 | | | | 2,430,000 | | | | 2,559,106 | |
Cicero IL Series A (Tax Revenue, XLCA Insured) | | | 5.00 | | | | 01/01/2014 | | | | 1,335,000 | | | | 1,389,428 | |
Cicero IL Series A (Tax Revenue, XLCA Insured) | | | 5.00 | | | | 01/01/2015 | | | | 2,725,000 | | | | 2,866,755 | |
| | | | |
| 16 | | Wells Fargo Advantage Short-Term Municipal Bond Fund | | Portfolio of Investments—December 31, 2011 (Unaudited) |
| | | | | | | | | | | | | | | | |
| Security Name | | Interest Rate | | | Maturity Date | | | Principal | | | Value | |
| | | | | | | | | | | | | | | | |
| | | | |
| Illinois (continued) | | | | | | | | | | | | | | | | |
Cook & Will County IL High School District 206 (Tax Revenue, Assured Guaranty Insured) | | | 4.00 | % | | | 12/15/2012 | | | $ | 380,000 | | | $ | 386,912 | |
Cook & Will County IL High School District 206 (Tax Revenue, Assured Guaranty Insured) | | | 4.00 | | | | 12/15/2013 | | | | 4,195,000 | | | | 4,338,343 | |
Cook & Will County IL High School District 206 (Tax Revenue, Assured Guaranty Insured) | | | 4.50 | | | | 12/15/2014 | | | | 2,540,000 | | | | 2,685,898 | |
Cook County IL Series A (Tax Revenue, NATL-RE Insured) | | | 6.25 | | | | 11/15/2012 | | | | 2,000,000 | | | | 2,104,640 | |
Illinois Development Finance Authority Adventist Health System (Health Revenue) | | | 4.00 | | | | 02/15/2013 | | | | 3,035,000 | | | | 3,098,310 | |
Illinois Development Finance Authority Adventist Health System (Health Revenue, AGM Insured) | | | 5.00 | | | | 05/15/2014 | | | | 4,500,000 | | | | 4,747,140 | |
Illinois Development Finance Authority Adventist Health System (Health Revenue) | | | 5.00 | | | | 02/15/2015 | | | | 2,500,000 | | | | 2,669,425 | |
Illinois Development Finance Authority Adventist Health System (Health Revenue, NATL-RE Insured)± | | | 5.50 | | | | 11/15/2013 | | | | 200,000 | | | | 215,564 | |
Illinois Educational Facilities Authority (Education Revenue) | | | 5.00 | | | | 10/01/2014 | | | | 1,000,000 | | | | 1,018,410 | |
Illinois Finance Authority Advocate Health Subseries C3B (Health Revenue)± | | | 4.38 | | | | 11/01/2038 | | | | 3,500,000 | | | | 3,750,740 | |
Illinois Finance Authority New Money Community Rehabilitation Series A (Health Revenue, GO of Participants Insured) | | | 4.85 | | | | 07/01/2012 | | | | 990,000 | | | | 979,516 | |
Illinois Finance Authority Prairie Power Series A (Resource Recovery Revenue)± | | | 3.00 | | | | 07/01/2042 | | | | 4,000,000 | | | | 4,115,960 | |
Illinois Finance Authority Revenue Alexian Brothers Health System (Health Revenue) | | | 5.00 | | | | 02/15/2014 | | | | 3,500,000 | | | | 3,679,130 | |
Illinois Finance Authority Revenue Memorial Health System (Health Revenue) | | | 4.00 | | | | 04/01/2013 | | | | 670,000 | | | | 690,314 | |
Illinois Finance Authority Revenue Memorial Health System (Health Revenue) | | | 4.00 | | | | 04/01/2014 | | | | 655,000 | | | | 683,407 | |
Illinois Finance Authority Revenue Memorial Health System (Health Revenue) | | | 4.00 | | | | 04/01/2015 | | | | 555,000 | | | | 584,659 | |
Illinois Finance Authority Revenue Resurrection Health (Health Revenue) | | | 5.00 | | | | 05/15/2013 | | | | 8,000,000 | | | | 8,228,720 | |
Illinois Finance Authority Revenue Resurrection Health (Health Revenue) | | | 5.00 | | | | 05/15/2014 | | | | 3,250,000 | | | | 3,371,940 | |
Illinois Finance Authority Revenue Roosevelt University Project (Education Revenue) | | | 5.00 | | | | 04/01/2015 | | | | 900,000 | | | | 942,246 | |
Illinois Finance Authority Revenue University of Chicago System (Health Revenue, NATL-RE Insured) | | | 5.00 | | | | 08/15/2015 | | | | 1,430,000 | | | | 1,434,576 | |
Illinois GO (Tax Revenue) | | | 5.00 | | | | 09/01/2015 | | | | 1,885,000 | | | | 2,033,783 | |
Illinois GO (Tax Revenue, AGM Insured) | | | 5.00 | | | | 09/01/2015 | | | | 10,000,000 | | | | 11,093,500 | |
Illinois GO (Tax Revenue) | | | 5.00 | | | | 09/01/2016 | | | | 10,000,000 | | | | 10,759,500 | |
Illinois GO (Miscellaneous Revenue, AGM Insured) | | | 5.38 | | | | 12/01/2014 | | | | 5,000,000 | | | | 5,220,100 | |
Illinois GO (Miscellaneous Revenue, AGM Insured) | | | 5.50 | | | | 05/01/2015 | | | | 4,500,000 | | | | 5,029,065 | |
Illinois Housing Development Authority (Housing Revenue) | | | 5.00 | | | | 08/01/2028 | | | | 3,300,000 | | | | 3,525,819 | |
Illinois Series A (Miscellaneous Revenue) | | | 5.00 | | | | 10/01/2016 | | | | 5,000,000 | | | | 5,296,150 | |
Illinois Series B (Miscellaneous Revenue)± | | | 3.00 | | | | 10/01/2033 | | | | 64,700,000 | | | | 64,700,000 | |
Knox & Warren Counties IL (Tax Revenue) | | | 3.50 | | | | 01/01/2015 | | | | 500,000 | | | | 526,090 | |
Lake County IL Community Consolidated School District (Tax Revenue, NATL-RE Insured) | | | 8.70 | | | | 01/01/2016 | | | | 1,075,000 | | | | 1,260,825 | |
Lake County IL Forest Preservation District Series A (Tax Revenue)± | | | 0.82 | | | | 12/15/2016 | | | | 1,865,000 | | | | 1,794,969 | |
Metropolitan Pier & Exposition Authority (Tax Revenue)±§ | | | 1.05 | | | | 12/15/2028 | | | | 17,500,000 | | | | 17,500,000 | |
Regional Transportation Authority Illinois (Tax Revenue, GO of Authority Insured)±§ | | | 0.90 | | | | 06/01/2025 | | | | 17,660,000 | | | | 17,660,000 | |
Southern Illinois State University Housing & Auxiliary Facilities System Series A (Education Revenue) | | | 4.00 | | | | 04/01/2014 | | | | 1,565,000 | | | | 1,649,541 | |
| | | | | | |
| Portfolio of Investments—December 31, 2011 (Unaudited) | | Wells Fargo Advantage Short-Term Municipal Bond Fund | | | 17 | |
| | | | | | | | | | | | | | | | |
| Security Name | | Interest Rate | | | Maturity Date | | | Principal | | | Value | |
| | | | | | | | | | | | | | | | |
| | | | |
| Illinois (continued) | | | | | | | | | | | | | | | | |
Southern Illinois State University Housing & Auxiliary Facilities System Series A (Education Revenue) | | | 4.00 | % | | | 04/01/2015 | | | $ | 1,090,000 | | | $ | 1,161,951 | |
Southern Illinois State University Housing & Auxiliary Facilities System Series A (Education Revenue) | | | 4.00 | | | | 04/01/2016 | | | | 635,000 | | | | 687,540 | |
University of Illinois COP Infrastructure Project (Lease Revenue, AMBAC Insured) | | | 5.00 | | | | 08/15/2013 | | | | 5,800,000 | | | | 6,067,380 | |
University of Illinois COP Infrastructure Project (Lease Revenue, AMBAC Insured) | | | 5.00 | | | | 08/15/2014 | | | | 6,275,000 | | | | 6,678,232 | |
Will & Kendall Counties IL Community Consolidated School District # 202 (Tax Revenue) | | | 4.00 | | | | 01/01/2014 | | | | 925,000 | | | | 974,404 | |
Will & Kendall Counties IL Community Consolidated School District # 202 (Tax Revenue) | | | 4.00 | | | | 01/01/2015 | | | | 1,800,000 | | | | 1,932,192 | |
Winnebago & Boone Counties IL School Districts (Tax Revenue, AGM Insured)(z) | | | 2.42 | | | | 02/01/2015 | | | | 500,000 | | | | 463,915 | |
Winnebago & Boone Counties IL School Districts (Tax Revenue, AMBAC Insured) | | | 5.00 | | | | 02/01/2014 | | | | 1,250,000 | | | | 1,326,438 | |
Winnebago County IL School District Prerefunded Balance CAB (Tax Revenue, AGM Insured)(z) | | | 1.13 | | | | 01/01/2014 | | | | 1,290,000 | | | | 1,260,962 | |
Winnebago County IL School District Prerefunded Balance CAB (Tax Revenue, AGM Insured)(z) | | | 2.26 | | | | 01/01/2014 | | | | 2,310,000 | | | | 2,207,459 | |
| | | | |
| | | | | | | | | | | | | | | 364,262,006 | |
| | | | | | | | | | | | | | | | |
| | | | |
| Indiana: 2.85% | | | | | | | | | | | | | | | | |
Beech Grove IN School Building Corporation First Mortgage (Lease Revenue, NATL-RE State Aid Withholding Insured) | | | 6.25 | | | | 07/05/2016 | | | | 600,000 | | | | 662,064 | |
Boone County IN Redevelopment District BAN (Tax Revenue) | | | 4.00 | | | | 05/15/2013 | | | | 4,325,000 | | | | 4,329,066 | |
Indiana Bond Bank Common School Fund Advance Purchase Funding Series B (Miscellaneous Revenue, NATL-RE Insured) | | | 5.00 | | | | 02/01/2013 | | | | 2,150,000 | | | | 2,226,261 | |
Indiana Bond Bank Common School Fund Advance Purchase Funding Series B (Miscellaneous Revenue, NATL-RE Insured) | | | 5.00 | | | | 08/01/2013 | | | | 2,000,000 | | | | 2,101,400 | |
Indiana Education Facilities Authority (Education Revenue, NATL-RE Insured)(z) | | | 3.17 | | | | 02/01/2015 | | | | 400,000 | | | | 362,748 | |
Indiana Finance Authority HEFA Ascension Health Series B-2 (Health Revenue) | | | 5.00 | | | | 03/01/2015 | | | | 1,895,000 | | | | 2,031,914 | |
Indiana Finance Authority Hospital Floyd Memorial Hospital & Health Refunding (Health Revenue) | | | 5.00 | | | | 03/01/2014 | | | | 1,810,000 | | | | 1,909,007 | |
Indiana Finance Authority Jackson County Schneck Hospital (Health Revenue) | | | 4.00 | | | | 02/15/2013 | | | | 680,000 | | | | 691,730 | |
Indiana Finance Authority Jackson County Schneck Hospital (Health Revenue) | | | 4.00 | | | | 02/15/2014 | | | | 1,000,000 | | | | 1,028,930 | |
Indiana Finance Authority Jackson County Schneck Hospital (Health Revenue) | | | 4.00 | | | | 02/15/2015 | | | | 1,230,000 | | | | 1,275,301 | |
Indiana Finance Authority Water Utilities (Water & Sewer Revenue) | | | 3.00 | | | | 10/01/2014 | | | | 4,500,000 | | | | 4,660,290 | |
Indiana HEFA Ascension Health Series B3 (Health Revenue)± | | | 1.74 | | | | 11/15/2031 | | | | 70,710,000 | | | | 70,653,432 | |
Jasper County IN PCR Northern Series B (IDR, NATL-RE Insured) | | | 5.20 | | | | 06/01/2013 | | | | 4,500,000 | | | | 4,698,765 | |
Jeffersonville IN Building Corporation Series A (Lease Revenue) | | | 4.00 | | | | 08/15/2012 | | | | 140,000 | | | | 142,258 | |
Jeffersonville IN Building Corporation Series B (Lease Revenue) | | | 4.00 | | | | 08/15/2012 | | | | 70,000 | | | | 71,129 | |
Plainfield IN Redevelopment District Ronald Reagan Corridor Project (Tax Revenue)± | | | 4.88 | | | | 02/01/2035 | | | | 10,000,000 | | | | 10,183,200 | |
University of Southern Indiana Auxiliary System (Education Revenue, AMBAC Insured) | | | 5.50 | | | | 10/01/2015 | | | | 5,000,000 | | | | 5,017,100 | |
| | | | |
| 18 | | Wells Fargo Advantage Short-Term Municipal Bond Fund | | Portfolio of Investments—December 31, 2011 (Unaudited) |
| | | | | | | | | | | | | | | | |
| Security Name | | Interest Rate | | | Maturity Date | | | Principal | | | Value | |
| | | | | | | | | | | | | | | | |
| | | | |
| Indiana (continued) | | | | | | | | | | | | | | | | |
Zionsville IN Community Schools Building Corporation Series DCL 047 (Miscellaneous Revenue)± | | | 1.98 | % | | | 01/15/2025 | | | $ | 11,475,000 | | | $ | 11,475,000 | |
| | | | |
| | | | | | | | | | | | | | | 123,519,595 | |
| | | | | | | | | | | | | | | | |
| | | | |
| Iowa: 0.60% | | | | | | | | | | | | | | | | |
Iowa Finance Authority Health Facilities (Health Revenue, Assured Guaranty Insured) | | | 3.13 | | | | 08/15/2014 | | | | 1,000,000 | | | | 1,040,740 | |
Iowa Student Loan Liquidity Corporation Series 1 (Education Revenue) | | | 4.00 | | | | 12/01/2013 | | | | 4,300,000 | | | | 4,482,621 | |
Iowa Student Loan Liquidity Corporation Series 3 (Education Revenue) | | | 5.25 | | | | 12/01/2024 | | | | 20,000,000 | | | | 20,480,000 | |
| | | | |
| | | | | | | | | | | | | | | 26,003,361 | |
| | | | | | | | | | | | | | | | |
| | | | |
| Kansas: 0.74% | | | | | | | | | | | | | | | | |
Burlington KS Environmental Impact Kansas City Power & Light Series A (IDR, XLCA Insured)± | | | 5.25 | | | | 12/01/2023 | | | | 12,500,000 | | | | 13,103,250 | |
Burlington KS Environmental Impact Kansas City Power & Light Series B (IDR, FGIC Insured)± | | | 5.38 | | | | 09/01/2035 | | | | 5,000,000 | | | | 5,249,050 | |
Kansas Development Finance Authority Series F (Health Revenue) | | | 3.00 | | | | 11/15/2013 | | | | 250,000 | | | | 258,058 | |
Kansas Development Finance Authority Series F (Health Revenue) | | | 3.00 | | | | 11/15/2014 | | | | 650,000 | | | | 672,770 | |
Olathe KS Special Obligation West Village Center Project (Tax Revenue) | | | 5.00 | | | | 03/01/2012 | | | | 100,000 | | | | 99,064 | |
Olathe KS Special Obligation West Village Center Project (Tax Revenue) | | | 5.00 | | | | 09/01/2012 | | | | 100,000 | | | | 96,542 | |
Wichita KS Facilities Improvement Series III A (Health Revenue) | | | 5.00 | | | | 11/15/2013 | | | | 1,750,000 | | | | 1,873,760 | |
Wichita KS Hospital Revenue Via Christi Health System (Health Revenue) | | | 5.00 | | | | 11/15/2013 | | | | 2,280,000 | | | | 2,441,242 | |
Wyandotte County & Kansas City KS Unified Government Special Obligation Second Lien Series A (Tax Revenue)(z) | | | 4.87 | | | | 06/01/2021 | | | | 9,000,000 | | | | 5,714,910 | |
Wyandotte County & Kansas City KS Unified Government Special Obligation Second Lien Series B (Tax Revenue) | | | 5.00 | | | | 12/01/2020 | | | | 2,305,000 | | | | 2,415,041 | |
| | | | |
| | | | | | | | | | | | | | | 31,923,687 | |
| | | | | | | | | | | | | | | | |
| | | | |
| Kentucky: 0.32% | | | | | | | | | | | | | | | | |
Ashland KY Ashland Hospital Corporation Series B (Health Revenue) | | | 4.00 | | | | 02/01/2014 | | | | 1,000,000 | | | | 1,044,830 | |
Kenton County KY Airport Board Cincinnati Northern Kentucky Series A (Airport Revenue, NATL-RE Insured) | | | 5.63 | | | | 03/01/2014 | | | | 1,975,000 | | | | 1,990,089 | |
Kenton County KY Airport Board Cincinnati Northern Kentucky Series A (Airport Revenue, NATL-RE Insured) | | | 5.63 | | | | 03/01/2015 | | | | 2,710,000 | | | | 2,729,214 | |
Kentucky EDFA Series Saint Elizabeth Series A (Health Revenue) | | | 4.00 | | | | 05/01/2013 | | | | 1,500,000 | | | | 1,557,465 | |
Louisville & Jefferson County KY (Water & Sewer Revenue) | | | 4.00 | | | | 05/15/2013 | | | | 5,360,000 | | | | 5,610,902 | |
Louisville & Jefferson County KY Metro Government Environmental Facilities Louisville Gas & Electric Company Project (Utilities Revenue)± | | | 5.63 | | | | 06/01/2033 | | | | 1,000,000 | | | | 1,037,320 | |
| | | | |
| | | | | | | | | | | | | | | 13,969,820 | |
| | | | | | | | | | | | | | | | |
| | | | |
| Louisiana: 3.59% | | | | | | | | | | | | | | | | |
East Baton Rouge Parish LA Sewerage Commission Series A (Water & Sewer Revenue)± | | | 0.99 | | | | 02/01/2046 | | | | 46,000,000 | | | | 45,944,800 | |
England LA Sub District # 1 (Lease Revenue, NATL-RE FGIC Insured) | | | 5.00 | | | | 08/15/2013 | | | | 1,130,000 | | | | 1,199,224 | |
Louisiana Citizens Property Insurance Corporation Series B (Miscellaneous Revenue, AMBAC Insured) | | | 5.00 | | | | 06/01/2012 | | | | 3,750,000 | | | | 3,805,800 | |
Louisiana Gas & Fuels Tax Second Lien Series A1 (Tax Revenue)± | | | 0.85 | | | | 05/01/2043 | | | | 40,500,000 | | | | 40,556,700 | |
Louisiana Local Government Environmental & Community Development Authority Series A (Education Revenue) | | | 4.00 | | | | 10/01/2013 | | | | 1,500,000 | | | | 1,575,150 | |
Louisiana Local Government Environmental & Community Development Authority Series A (Education Revenue) | | | 4.00 | | | | 10/01/2014 | | | | 1,500,000 | | | | 1,607,040 | |
| | | | | | |
| Portfolio of Investments—December 31, 2011 (Unaudited) | | Wells Fargo Advantage Short-Term Municipal Bond Fund | | | 19 | |
| | | | | | | | | | | | | | | | |
| Security Name | | Interest Rate | | | Maturity Date | | | Principal | | | Value | |
| | | | | | | | | | | | | | | | |
| | | | |
| Louisiana (continued) | | | | | | | | | | | | | | | | |
Louisiana PFA Christus Health C3 (Health Revenue, AGM Insured) | | | 5.00 | % | | | 07/01/2013 | | | $ | 4,445,000 | | | $ | 4,676,007 | |
Louisiana PFA Franciscan Series B (Health Revenue) | | | 5.00 | | | | 07/01/2013 | | | | 2,830,000 | | | | 2,952,058 | |
New Orleans LA Aviation Board Gulf Opportunity Zone Consolidated Rental Car-A (Airport Revenue) | | | 4.63 | | | | 01/01/2015 | | | | 1,120,000 | | | | 1,187,435 | |
New Orleans LA Aviation Board Series A Refunding (Airport Revenue, AGM Insured) | | | 5.00 | | | | 01/01/2015 | | | | 1,000,000 | | | | 1,091,600 | |
New Orleans LA Aviation Board Series B-2 Refunding (Airport Revenue, AGM Insured) | | | 5.00 | | | | 01/01/2015 | | | | 1,845,000 | | | | 2,014,002 | |
New Orleans LA Master Lease (Lease Revenue) | | | 5.25 | | | | 01/01/2018 | | | | 17,781,091 | | | | 17,810,964 | |
Parish of DeSoto LA PCR Southwestern Electrical Power (Utilities Revenue)± | | | 3.25 | | | | 01/01/2019 | | | | 28,000,000 | | | | 28,973,560 | |
Port of New Orleans LA Board Commerce Special Project CG Railway Incorporated (Port Authority Revenue, NATL-RE Insured) | | | 5.25 | | | | 08/15/2013 | | | | 910,000 | | | | 933,496 | |
Tangipahoa Parish LA Hospital Service District # 1 North Oaks Medical Center Project A (Health Revenue) | | | 5.00 | | | | 02/01/2012 | | | | 1,000,000 | | | | 1,003,150 | |
| | | | |
| | | | | | | | | | | | | | | 155,330,986 | |
| | | | | | | | | | | | | | | | |
| | | | |
| Maine: 0.20% | | | | | | | | | | | | | | | | |
Bucksport ME Solid Waste Disposal International Paper Series A (IDR) | | | 4.00 | | | | 03/01/2014 | | | | 3,135,000 | | | | 3,230,273 | |
Maine Educational Loan Authority Class A Series A-1 (Education Revenue, Assured Guaranty Insured) | | | 4.63 | | | | 12/01/2013 | | | | 3,230,000 | | | | 3,406,197 | |
Maine Educational Loan Authority Class A Series A-1 (Education Revenue, Assured Guaranty Insured) | | | 4.95 | | | | 12/01/2014 | | | | 2,075,000 | | | | 2,241,083 | |
| | | | |
| | | | | | | | | | | | | | | 8,877,553 | |
| | | | | | | | | | | | | | | | |
| | | | |
| Maryland: 1.24% | | | | | | | | | | | | | | | | |
Baltimore MD Consolidated Public Improvement Series A (Tax Revenue, AGM Insured)±(a)(m)(n) | | | 0.21 | | | | 10/15/2020 | | | | 12,635,000 | | | | 11,839,820 | |
Baltimore MD Consolidated Public Improvement Series A (Tax Revenue, FGIC Insured)±(a)(m)(n) | | | 0.21 | | | | 10/01/2022 | | | | 26,000,000 | | | | 23,840,040 | |
County of Baltimore MD EDA (IDR, BNP Paribas LOC)±§ | | | 1.00 | | | | 12/01/2017 | | | | 5,000,000 | | | | 5,000,000 | |
Maryland Community Development Administration Residential Series H (Housing Revenue) | | | 4.55 | | | | 09/01/2012 | | | | 400,000 | | | | 400,864 | |
Maryland HEFA (Health Revenue)± | | | 1.33 | | | | 05/15/2042 | | | | 12,500,000 | | | | 12,519,125 | |
| | | | |
| | | | | | | | | | | | | | | 53,599,849 | |
| | | | | | | | | | | | | | | | |
| | | | |
| Massachusetts: 1.92% | | | | | | | | | | | | | | | | |
Massachusetts Development Finance Agency Series A (Utilities Revenue)± | | | 2.25 | | | | 12/01/2041 | | | | 2,500,000 | | | | 2,539,575 | |
Massachusetts Educational Financing Authority Issue I Series A (Education Revenue) | | | 2.25 | | | | 01/01/2013 | | | | 3,035,000 | | | | 3,062,710 | |
Massachusetts Educational Financing Authority Issue I Series A (Education Revenue) | | | 2.75 | | | | 01/01/2014 | | | | 2,585,000 | | | | 2,642,180 | |
Massachusetts Educational Financing Authority Issue I Series A (Education Revenue) | | | 3.15 | | | | 01/01/2015 | | | | 2,150,000 | | | | 2,234,474 | |
Massachusetts HEFA Care Group Series E-2 (Health Revenue) | | | 5.00 | | | | 07/01/2012 | | | | 1,500,000 | | | | 1,531,545 | |
Massachusetts HEFA Caritas Christian Obligation Series B (Health Revenue) | | | 6.50 | | | | 07/01/2012 | | | | 600,000 | | | | 617,004 | |
Massachusetts HEFA Health System Catholic East (Health Revenue) | | | 5.00 | | | | 11/15/2013 | | | | 1,680,000 | | | | 1,793,282 | |
Massachusetts HEFA Massachusetts Eye & Ear Infirmary Series C (Health Revenue) | | | 5.00 | | | | 07/01/2015 | | | | 700,000 | | | | 747,425 | |
Massachusetts HEFA Northeastern University Series T-2 (Education Revenue)± | | | 4.10 | | | | 10/01/2037 | | | | 3,000,000 | | | | 3,034,410 | |
Massachusetts HEFA Partners Healthcare Series G-6 (Health Revenue)± | | | 0.98 | | | | 07/01/2038 | | | | 40,000,000 | | | | 39,466,400 | |
| | | | |
| 20 | | Wells Fargo Advantage Short-Term Municipal Bond Fund | | Portfolio of Investments—December 31, 2011 (Unaudited) |
| | | | | | | | | | | | | | | | |
| Security Name | | Interest Rate | | | Maturity Date | | | Principal | | | Value | |
| | | | | | | | | | | | | | | | |
| | | | |
| Massachusetts (continued) | | | | | | | | | | | | | | | | |
Massachusetts Municipal Securitization Trust Receipts Class A (Miscellaneous Revenue, Societe Generale LOC, FGIC Insured)±§ | | | 0.98 | % | | | 05/01/2037 | | | $ | 7,845,000 | | | $ | 7,845,000 | |
Massachusetts Series A (Miscellaneous Revenue)± | | | 0.63 | | | | 02/01/2014 | | | | 12,070,000 | | | | 12,079,294 | |
Massachusetts Series A (Tax Revenue)±§ | | | 0.76 | | | | 02/01/2015 | | | | 3,350,000 | | | | 3,350,000 | |
Massachusetts Water Resources Authority Series B (Water & Sewer Revenue, AMBAD-TCRS GO of Authority Insured) | | | 5.25 | | | | 12/01/2015 | | | | 1,840,000 | | | | 2,025,748 | |
| | | | |
| | | | | | | | | | | | | | | 82,969,047 | |
| | | | | | | | | | | | | | | | |
| | | | |
| Michigan: 3.76% | | | | | | | | | | | | | | | | |
Detroit MI Capital Improvement Limited Tax Series A-1 (Tax Revenue) | | | 5.00 | | | | 04/01/2013 | | | | 4,500,000 | | | | 4,345,380 | |
Detroit MI City School District (Tax Revenue, AGM Q-SBLF Insured) | | | 5.00 | | | | 05/01/2014 | | | | 1,000,000 | | | | 1,069,700 | |
Detroit MI City School District Floater Series DCL 045 (Tax Revenue, FSA Q-SBLF Insured, Dexia Credit Local LOC)± | | | 1.98 | | | | 05/01/2030 | | | | 15,000,000 | | | | 15,000,000 | |
Detroit MI City School District School Building & Site Improvement Series A (Tax Revenue, FGIC Q-SBLF Insured) | | | 5.00 | | | | 05/01/2013 | | | | 2,750,000 | | | | 2,868,718 | |
Detroit MI Convention Facilities Cobo Hall (Tobacco Revenue, NATL-RE Insured) | | | 5.00 | | | | 09/30/2012 | | | | 4,350,000 | | | | 4,456,749 | |
Detroit MI Convention Facilities Cobo Hall (Tobacco Revenue, NATL-RE Insured) | | | 5.00 | | | | 09/30/2013 | | | | 4,220,000 | | | | 4,433,532 | |
Detroit MI GO Series B (Tax Revenue, AGM Insured) | | | 5.00 | | | | 04/01/2015 | | | | 1,120,000 | | | | 1,179,629 | |
Detroit MI Sewer Disposal System (Water & Sewer Revenue, AGM Insured) | | | 5.00 | | | | 07/01/2014 | | | | 5,000,000 | | | | 5,355,550 | |
Detroit MI Sewer Disposal System (Water & Sewer Revenue, NATL-RE Insured) | | | 6.00 | | | | 07/01/2014 | | | | 585,000 | | | | 643,658 | |
Detroit MI Sewer Disposal System Senior Lien A Refunding (Water & Sewer Revenue, NATL-RE Insured) | | | 5.00 | | | | 07/01/2016 | | | | 2,000,000 | | | | 2,149,300 | |
Detroit MI Sewer Disposal System Senior Lien A Refunding (Water & Sewer Revenue, NATL-RE Insured) | | | 5.00 | | | | 07/01/2017 | | | | 3,975,000 | | | | 4,249,076 | |
Detroit MI Sewer Disposal System Senior Lien A Refunding (Water & Sewer Revenue, NATL-RE Insured)± | | | 5.50 | | | | 07/01/2013 | | | | 2,655,000 | | | | 2,770,758 | |
Detroit MI Sewer Disposal System Senior Lien A Refunding (Water & Sewer Revenue, NATL-RE Insured)± | | | 5.50 | | | | 07/01/2013 | | | | 450,000 | | | | 469,620 | |
Detroit MI Sewer Disposal System Senior Lien A Refunding (Water & Sewer Revenue)± | | | 5.50 | | | | 07/01/2016 | | | | 1,000,000 | | | | 1,097,940 | |
Detroit MI Water Supply System (Water & Sewer Revenue, NATL-RE FGIC Insured) | | | 5.00 | | | | 07/01/2013 | | | | 1,235,000 | | | | 1,296,540 | |
Detroit MI Water Supply System (Water & Sewer Revenue, AGM Insured) | | | 5.00 | | | | 07/01/2013 | | | | 1,265,000 | | | | 1,330,350 | |
Detroit MI Water Supply System (Water & Sewer Revenue, NATL-RE Insured) | | | 5.25 | | | | 07/01/2016 | | | | 1,000,000 | | | | 1,043,330 | |
Detroit MI Water Supply System (Water & Sewer Revenue, NATL-RE FGIC Insured) | | | 6.50 | | | | 07/01/2015 | | | | 1,000,000 | | | | 1,104,080 | |
Detroit MI Water Supply System Series C (Water & Sewer Revenue, NATL-RE FGIC Insured) | | | 5.00 | | | | 07/01/2018 | | | | 5,000,000 | | | | 5,375,850 | |
Detroit MI Water Supply Systems Senior Lien Series B (Water & Sewer Revenue, NATL-RE Insured)± | | | 5.00 | | | | 07/01/2013 | | | | 6,405,000 | | | | 6,724,161 | |
Flint MI International Academy (Miscellaneous Revenue) | | | 5.00 | | | | 10/01/2017 | | | | 1,405,000 | | | | 1,389,011 | |
Huron Valley MI School District (Tax Revenue, NATL-RE Q-SBLF Insured) | | | 5.00 | | | | 05/01/2015 | | | | 2,965,000 | | | | 3,310,007 | |
Kent MI Hospital Finance Authority Spectrum Health Series A (Health Revenue)± | | | 5.25 | | | | 01/15/2047 | | | | 3,000,000 | | | | 3,247,860 | |
Michigan Finance Authority Limited Obligation Series A (Miscellaneous Revenue) | | | 5.00 | | | | 06/01/2014 | | | | 18,070,000 | | | | 18,989,040 | |
Michigan Finance Authority State Aid Notes Series A2 (Miscellaneous Revenue) | | | 6.65 | | | | 03/20/2012 | | | | 10,000,000 | | | | 10,092,200 | |
Michigan Municipal Bond Authority City of Detroit School District (Miscellaneous Revenue, AGM Insured) | | | 5.00 | | | | 06/01/2015 | | | | 11,860,000 | | | | 12,739,063 | |
| | | | | | |
| Portfolio of Investments—December 31, 2011 (Unaudited) | | Wells Fargo Advantage Short-Term Municipal Bond Fund | | | 21 | |
| | | | | | | | | | | | | | | | |
| Security Name | | Interest Rate | | | Maturity Date | | | Principal | | | Value | |
| | | | | | | | | | | | | | | | |
| | | | |
| Michigan (continued) | | | | | | | | | | | | | | | | |
Michigan Municipal Bond Authority Local Government Loan Program Series A (Miscellaneous Revenue, AMBAC Insured) | | | 4.25 | % | | | 05/01/2015 | | | $ | 990,000 | | | $ | 1,002,860 | |
Michigan Municipal Bond Authority Local Government Loan Program Series A (Miscellaneous Revenue, AMBAC Insured) | | | 5.00 | | | | 05/01/2013 | | | | 275,000 | | | | 281,740 | |
Michigan Municipal Bond Authority Local Government Loan Program Series A (Miscellaneous Revenue, AMBAC Insured) | | | 5.00 | | | | 05/01/2016 | | | | 105,000 | | | | 109,264 | |
Michigan Municipal Bond Authority Local Government Loan Program Series B (Miscellaneous Revenue, AMBAC Insured) | | | 5.00 | | | | 12/01/2013 | | | | 225,000 | | | | 232,859 | |
Michigan Municipal Bond Authority Local Government Loan Program Series B Group A (Miscellaneous Revenue, AMBAC Insured) | | | 5.00 | | | | 12/01/2012 | | | | 1,425,000 | | | | 1,453,614 | |
Michigan Municipal Bond Authority Local Government Loan Program Series B Group A (Miscellaneous Revenue, AMBAC Insured) | | | 5.75 | | | | 12/01/2014 | | | | 3,555,000 | | | | 3,780,138 | |
Michigan Municipal Bond Authority Local Government Loan Program Series C (Miscellaneous Revenue, AMBAC Insured) | | | 3.50 | | | | 05/01/2014 | | | | 80,000 | | | | 79,324 | |
Michigan Municipal Bond Authority Local Government Loan Program Series C (Miscellaneous Revenue, AMBAC Insured) | | | 5.00 | | | | 05/01/2013 | | | | 300,000 | | | | 307,353 | |
Michigan State Building Authority Series I (Lease Revenue, AGM Insured) | | | 5.25 | | | | 10/15/2014 | | | | 2,500,000 | | | | 2,693,050 | |
Michigan State Hospital Finance Authority (Health Revenue) | | | 5.50 | | | | 11/01/2016 | | | | 5,025,000 | | | | 5,331,927 | |
Michigan State Hospital Finance Authority McLaren Health Care (Health Revenue) | | | 5.00 | | | | 05/15/2013 | | | | 1,435,000 | | | | 1,502,732 | |
Michigan State Hospital Finance Authority Sparrow Hospital Obligation (Health Revenue) | | | 5.00 | | | | 11/15/2015 | | | | 1,000,000 | | | | 1,106,890 | |
Michigan State Housing Development Authority Limited Greenwood Villa Project (Housing Revenue, AGM Insured) | | | 4.75 | | | | 09/15/2017 | | | | 3,520,000 | | | | 3,784,141 | |
Michigan State Strategic Fund Limited Obligation Detroit Edition (Utilities Revenue)± | | | 3.05 | | | | 08/01/2024 | | | | 4,000,000 | | | | 4,071,800 | |
Michigan State Strategic Fund Obligation Dow Chemical B-2 (IDR) | | | 6.25 | | | | 06/01/2014 | | | | 6,000,000 | | | | 6,599,100 | |
Wayne County MI Airport Authority (Airport Revenue) | | | 4.00 | | | | 12/01/2013 | | | | 5,000,000 | | | | 5,219,000 | |
Wayne County MI Airport Authority (Airport Revenue) | | | 5.00 | | | | 12/01/2015 | | | | 1,290,000 | | | | 1,409,364 | |
Wayne County MI Detroit Metropolitan Airport Junior Lien (Airport Revenue, NATL-RE FGIC Insured) | | | 5.00 | | | | 12/01/2012 | | | | 1,500,000 | | | | 1,536,660 | |
Wayne County MI Detroit Metropolitan Airport Junior Lien (Airport Revenue, NATL-RE FGIC Insured) | | | 5.00 | | | | 12/01/2013 | | | | 3,365,000 | | | | 3,505,724 | |
Wayne County MI Detroit Metropolitan Airport MBIA (Airport Revenue, AGC-ICC MBIA-RE FGIC Insured) | | | 5.00 | | | | 12/01/2015 | | | | 1,110,000 | | | | 1,210,588 | |
Western Townships MI Utilities Authority Sewage Disposal Systems (Tax Revenue) | | | 4.00 | | | | 01/01/2013 | | | | 1,075,000 | | | | 1,109,841 | |
| | | | |
| | | | | | | | | | | | | | | 163,059,071 | |
| | | | | | | | | | | | | | | | |
| | | | |
| Minnesota: 1.65% | | | | | | | | | | | | | | | | |
Becker MN PCR Northern States Power Series A (IDR)± | | | 8.50 | | | | 03/01/2019 | | | | 4,745,000 | | | | 5,018,217 | |
Becker MN PCR Northern States Power Series B (IDR)± | | | 8.50 | | | | 09/01/2019 | | | | 8,400,000 | | | | 8,883,672 | |
Chaska MN Independent School District # 112 COP Series B (Lease Revenue) | | | 3.00 | | | | 12/01/2012 | | | | 500,000 | | | | 509,995 | |
Chaska MN Independent School District # 112 COP Series B (Lease Revenue) | | | 3.00 | | | | 12/01/2013 | | | | 515,000 | | | | 535,291 | |
Chaska MN Independent School District # 112 COP Series B (Lease Revenue) | | | 3.00 | | | | 12/01/2014 | | | | 530,000 | | | | 559,431 | |
Minneapolis & St. Paul MN Housing & RDA Children’s Health Care Facilities Series A (Health Revenue) | | | 4.00 | | | | 08/15/2014 | | | | 1,200,000 | | | | 1,274,304 | |
Minneapolis & St. Paul MN Housing & RDA Children’s Health Care Facilities Series A1 (Health Revenue, AGM Insured) | | | 4.00 | | | | 08/15/2015 | | | | 750,000 | | | | 812,588 | |
Minneapolis & St. Paul MN Housing & RDA Children’s Health Care Facilities Series B (Health Revenue, AGM Insured)± | | | 5.00 | | | | 08/15/2015 | | | | 600,000 | | | | 672,006 | |
Minneapolis & St. Paul MN Housing & RDA HealthSpan Series B (Health Revenue, AMBAC Insured)±(a)(m)(n) | | | 0.18 | | | | 11/15/2017 | | | | 8,900,000 | | | | 7,627,810 | |
| | | | |
| 22 | | Wells Fargo Advantage Short-Term Municipal Bond Fund | | Portfolio of Investments—December 31, 2011 (Unaudited) |
| | | | | | | | | | | | | | | | |
| Security Name | | Interest Rate | | | Maturity Date | | | Principal | | | Value | |
| | | | | | | | | | | | | | | | |
| | | | |
| Minnesota (continued) | | | | | | | | | | | | | | | | |
Minneapolis MN Fairview Health Services Series A (Health Revenue) | | | 5.13 | % | | | 11/15/2013 | | | $ | 1,935,000 | | | $ | 2,063,619 | |
Minneapolis MN Health Care System Fairview Health Services Series B (Health Revenue, NATL-RE Insured) | | | 5.50 | | | | 05/15/2016 | | | | 2,200,000 | | | | 2,247,960 | |
Minnesota Agricultural & Economic Development Board Essential Health Series A (Health Revenue) | | | 4.75 | | | | 02/15/2015 | | | | 14,455,000 | | | | 14,853,669 | |
Minnesota Municipal Power Agency (Utilities Revenue) | | | 4.00 | | | | 10/01/2013 | | | | 3,530,000 | | | | 3,555,381 | |
Seaway Port Authority of Duluth MN Industrial Development Dock & Wharf Revenue Cargill Incorporated Project (IDR) | | | 4.20 | | | | 05/01/2013 | | | | 900,000 | | | | 935,424 | |
Tobacco Securitization Authority Minnesota (Tobacco Revenue) | | | 5.00 | | | | 03/01/2016 | | | | 6,500,000 | | | | 7,290,595 | |
Tobacco Securitization Authority Minnesota (Tobacco Revenue) | | | 5.00 | | | | 03/01/2017 | | | | 8,000,000 | | | | 9,080,720 | |
Tobacco Securitization Authority Minnesota (Tobacco Revenue) | | | 5.00 | | | | 03/01/2018 | | | | 5,000,000 | | | | 5,673,950 | |
| | | | |
| | | | | | | | | | | | | | | 71,594,632 | |
| | | | | | | | | | | | | | | | |
| | | | |
| Mississippi: 0.12% | | | | | | | | | | | | | | | | |
Mississippi Business Finance Corporation Gulf Opportunity Zone Series A (Utilities Revenue) | | | 3.25 | | | | 05/01/2014 | | | | 2,740,000 | | | | 2,767,181 | |
Mississippi Development Bank Special Obligation Limited Tax Note Singing River Hospital System Series B1 (Health Revenue, Assured Guaranty Insured) | | | 2.00 | | | | 07/01/2012 | | | | 1,360,000 | | | | 1,371,193 | |
Mississippi Hospital Equipment & Facilities Authority Mississippi Baptist Health System Incorporated Series A (Health Revenue) | | | 5.00 | | | | 08/15/2012 | | | | 1,000,000 | | | | 1,023,270 | |
| | | | |
| | | | | | | | | | | | | | | 5,161,644 | |
| | | | | | | | | | | | | | | | |
| | | | |
| Missouri: 1.20% | | | | | | | | | | | | | | | | |
Chesterfield Valley MO Transportation Development District (Tax Revenue, CIFC Insured) | | | 4.00 | | | | 04/15/2026 | | | | 4,250,000 | | | | 2,811,715 | |
Fenton MO Gravois Bluffs Redevelopment Project (Tax Revenue) | | | 4.50 | | | | 04/01/2021 | | | | 565,000 | | | | 580,481 | |
Jackson County MO Special Obligation (Tax Revenue, NATL-RE Insured) | | | 5.50 | | | | 12/01/2015 | | | | 2,865,000 | | | | 2,994,412 | |
Lake of the Ozarks MO Community Bridge Corporation (Transportation Revenue) | | | 5.25 | | | | 12/01/2014 | | | | 1,105,000 | | | | 1,046,325 | |
Missouri Development Finance Board Independence Missouri Centerpoint Series F (Lease Revenue) | | | 4.00 | | | | 04/01/2012 | | | | 475,000 | | | | 478,325 | |
Missouri Development Finance Board Independence Missouri Centerpoint Series F (Lease Revenue) | | | 4.25 | | | | 04/01/2013 | | | | 500,000 | | | | 516,865 | |
Missouri Environmental Improvement & Energy Resources Authority Kansas City Power & Light Corporation Project (IDR)± | | | 4.90 | | | | 05/01/2038 | | | | 2,000,000 | | | | 2,085,140 | |
Missouri Environmental Improvement & Energy Resources Authority Kansas City Power & Light Corporation Project (IDR, XLCA Insured)± | | | 5.25 | | | | 07/01/2017 | | | | 1,100,000 | | | | 1,151,260 | |
Missouri Housing Development Single Family Home Ownership Series B (Housing Revenue, GNMA/FNMA Insured) | | | 5.80 | | | | 09/01/2035 | | | | 1,215,000 | | | | 1,285,786 | |
Missouri Joint Municipal Electric Utility Commission (Utilities Revenue) | | | 5.00 | | | | 01/01/2014 | | | | 1,295,000 | | | | 1,387,554 | |
Missouri Joint Municipal Electric Utility Commission (Utilities Revenue) | | | 5.00 | | | | 01/01/2015 | | | | 1,380,000 | | | | 1,520,015 | |
Missouri Joint Municipal Electric Utility Commission (Utilities Revenue) | | | 5.00 | | | | 01/01/2016 | | | | 1,910,000 | | | | 2,149,743 | |
Sikeston MO Electrical Revenue (Utilities Revenue, NATL-RE Insured) | | | 6.00 | | | | 06/01/2013 | | | | 2,145,000 | | | | 2,268,616 | |
St. Louis MO Series 004 (Miscellaneous Revenue)± | | | 1.98 | | | | 07/01/2026 | | | | 17,970,000 | | | | 17,970,000 | |
St. Louis MO Lambert St. Louis International Airport Series B (Airport Revenue, NATL-RE FGIC Insured) | | | 6.00 | | | | 07/01/2013 | | | | 1,915,000 | | | | 2,025,936 | |
St. Louis MO Municipal Finance Corporation (Lease Revenue) | | | 5.00 | | | | 02/15/2015 | | | | 1,000,000 | | | | 1,098,080 | |
St. Louis MO Municipal Finance Corporation (Lease Revenue) | | | 5.00 | | | | 02/15/2016 | | | | 1,000,000 | | | | 1,115,420 | |
St. Louis MO Municipal Finance Corporation (Lease Revenue, AMBAC Insured) | | | 5.25 | | | | 02/15/2015 | | | | 3,840,000 | | | | 3,863,731 | |
| | | | | | |
| Portfolio of Investments—December 31, 2011 (Unaudited) | | Wells Fargo Advantage Short-Term Municipal Bond Fund | | | 23 | |
| | | | | | | | | | | | | | | | |
| Security Name | | Interest Rate | | | Maturity Date | | | Principal | | | Value | |
| | | | | | | | | | | | | | | | |
| | | | |
| Missouri (continued) | | | | | | | | | | | | | | | | |
St. Louis MO Municipal Finance Corporation Convention Centre Series B (Lease Revenue, AGM Insured)(z) | | | 2.65 | % | | | 07/15/2014 | | | $ | 5,835,000 | | | $ | 5,455,317 | |
| | | | |
| | | | | | | | | | | | | | | 51,804,721 | |
| | | | | | | | | | | | | | | | |
| | | | |
| Montana: 0.01% | | | | | | | | | | | | | | | | |
Flathead MT Municipal Airport Authority Montana Glacier Park International Airport Series A (Airport Revenue) | | | 5.00 | | | | 06/01/2012 | | | | 310,000 | | | | 313,798 | |
Flathead MT Municipal Airport Authority Montana Glacier Park International Airport Series B (Airport Revenue) | | | 5.00 | | | | 06/01/2012 | | | | 150,000 | | | | 151,838 | |
Montana Board Housing Series A2 (Housing Revenue, GO of Board Insured) | | | 4.20 | | | | 12/01/2013 | | | | 140,000 | | | | 144,612 | |
| | | | |
| | | | | | | | | | | | | | | 610,248 | |
| | | | | | | | | | | | | | | | |
| | | | |
| Nebraska: 0.30% | | | | | | | | | | | | | | | | |
Central Plains Nebraska Energy Project # 1 Series A (Utilities Revenue) | | | 5.00 | | | | 12/01/2014 | | | | 2,000,000 | | | | 2,091,140 | |
Central Plains Nebraska Energy Project # 1 Series A (Utilities Revenue) | | | 5.00 | | | | 12/01/2015 | | | | 10,560,000 | | | | 10,853,040 | |
O’Neill NE St. Anthony’s Project (Health Revenue) | | | 6.25 | | | | 09/01/2012 | | | | 170,000 | | | | 173,069 | |
| | | | |
| | | | | | | | | | | | | | | 13,117,249 | |
| | | | | | | | | | | | | | | | |
| | | | |
| Nevada: 0.43% | | | | | | | | | | | | | | | | |
Clark County NV Airport (Airport Revenue)±§144A | | | 0.30 | | | | 01/01/2018 | | | | 11,250,000 | | | | 11,250,000 | |
Henderson NV Health Care Facilities Catholic Healthcare West Series B (Health Revenue) | | | 5.00 | | | | 07/01/2013 | | | | 2,000,000 | | | | 2,096,600 | |
Reno NV Washoe Medical Center Series A (Health Revenue, AMBAC Insured) | | | 5.25 | | | | 06/01/2012 | | | | 1,195,000 | | | | 1,207,966 | |
Reno NV Washoe Medical Center Series A (Health Revenue, AMBAC Insured) | | | 5.25 | | | | 06/01/2013 | | | | 1,225,000 | | | | 1,264,286 | |
Sparks NV Redevelopment Agency Tax Increment Area # 1 (Tax Revenue) | | | 4.00 | | | | 01/15/2014 | | | | 1,260,000 | | | | 1,275,221 | |
Sparks NV Redevelopment Agency Tax Increment Area # 1 (Tax Revenue) | | | 4.00 | | | | 01/15/2015 | | | | 1,520,000 | | | | 1,540,718 | |
| | | | |
| | | | | | | | | | | | | | | 18,634,791 | |
| | | | | | | | | | | | | | | | |
| | | | |
| New Hampshire: 0.12% | | | | | | | | | | | | | | | | |
New Hampshire HFA SFMR Series B (Housing Revenue) | | | 5.00 | | | | 07/01/2027 | | | | 5,020,000 | | | | 5,288,168 | |
| | | | | | | | | | | | | | | | |
| | | | |
| New Jersey: 4.67% | | | | | | | | | | | | | | | | |
Gloucester County NJ Improvement Authority Waste Management Incorporated Project Series A (Resource Recovery Revenue)± | | | 2.63 | | | | 12/01/2029 | | | | 2,705,000 | | | | 2,741,355 | |
New Jersey EDA (Tobacco Revenue, FGIC Insured) | | | 5.00 | | | | 06/15/2012 | | | | 2,000,000 | | | | 2,025,180 | |
New Jersey EDA (Tobacco Revenue, Radian-IBCC Insured) | | | 5.38 | | | | 06/15/2014 | | | | 3,500,000 | | | | 3,710,910 | |
New Jersey EDA (Tobacco Revenue, Radian-IBCC Insured) | | | 5.38 | | | | 06/15/2015 | | | | 8,325,000 | | | | 8,924,483 | |
New Jersey EDA Motor Vehicle Commission Series A (Miscellaneous Revenue, NATL-RE State Appropriations Insured)(z) | | | 2.48 | | | | 07/01/2014 | | | | 1,810,000 | | | | 1,700,875 | |
New Jersey EDA Motor Vehicle Series A (Miscellaneous Revenue, NATL-RE Insured) | | | 5.25 | | | | 07/01/2016 | | | | 2,190,000 | | | | 2,361,521 | |
New Jersey EDA School Facilities Series C (Miscellaneous Revenue, State Appropriations Insured)± | | | 1.90 | | | | 02/01/2018 | | | | 39,000,000 | | | | 39,150,540 | |
New Jersey HEFAR Series 1A (Education Revenue) | | | 4.75 | | | | 12/01/2029 | | | | 850,000 | | | | 863,099 | |
New Jersey HEFAR Student Loan Series 2 (Education Revenue) | | | 4.50 | | | | 12/01/2029 | | | | 10,115,000 | | | | 10,108,526 | |
New Jersey HFFA Catholic Health East (Health Revenue) | | | 5.00 | | | | 11/15/2013 | | | | 2,000,000 | | | | 2,116,100 | |
New Jersey Higher Education Assistance Authority Series 1B (Education Revenue) | | | 3.00 | | | | 12/01/2013 | | | | 10,340,000 | | | | 10,628,486 | |
| | | | |
| 24 | | Wells Fargo Advantage Short-Term Municipal Bond Fund | | Portfolio of Investments—December 31, 2011 (Unaudited) |
| | | | | | | | | | | | | | | | |
| Security Name | | Interest Rate | | | Maturity Date | | | Principal | | | Value | |
| | | | | | | | | | | | | | | | |
| | | | |
| New Jersey (continued) | | | | | | | | | | | | | | | | |
New Jersey Higher Education Assistance Authority Series 1B (Education Revenue) | | | 5.00 | % | | | 12/01/2013 | | | $ | 5,000,000 | | | $ | 5,325,000 | |
New Jersey Higher Education Assistance Authority Series A (Education Revenue) | | | 5.00 | | | | 06/01/2013 | | | | 1,285,000 | | | | 1,341,694 | |
New Jersey Higher Education Assistance Authority Series A (Education Revenue) | | | 5.00 | | | | 06/01/2014 | | | | 5,555,000 | | | | 5,927,852 | |
New Jersey Tobacco Settlement Financing Corporation Series 1A (Tobacco Revenue) | | | 5.00 | | | | 06/01/2014 | | | | 2,500,000 | | | | 2,637,950 | |
New Jersey Tobacco Settlement Financing Corporation Series 1A (Tobacco Revenue) | | | 5.00 | | | | 06/01/2015 | | | | 1,000,000 | | | | 1,058,840 | |
New Jersey Transportation Corporation Series A (Lease Revenue, NATL-RE FGIC Insured) | | | 5.00 | | | | 09/15/2016 | | | | 3,195,000 | | | | 3,465,233 | |
New Jersey Turnpike Authority (Transportation Revenue, AGM Insured)±§ | | | 1.00 | | | | 01/01/2024 | | | | 23,000,000 | | | | 23,000,000 | |
New Jersey Turnpike Authority Series C-2 (Transportation Revenue, AGM Insured)±§ | | | 1.00 | | | | 01/01/2024 | | | | 21,250,000 | | | | 21,250,000 | |
New Jersey Turnpike Authority Series D (Miscellaneous Revenue, Societe Generale LOC, NATL-RE FGIC Insured)±§ | | | 1.85 | | | | 01/01/2018 | | | | 46,200,000 | | | | 46,200,000 | |
Newark NJ Housing Authority (Housing Revenue) | | | 5.00 | | | | 01/01/2015 | | | | 1,450,000 | | | | 1,499,764 | |
Newark NJ Housing Authority (Housing Revenue) | | | 5.00 | | | | 01/01/2016 | | | | 560,000 | | | | 583,470 | |
Newark NJ Housing Authority (Housing Revenue) | | | 5.00 | | | | 01/01/2016 | | | | 1,070,000 | | | | 1,114,844 | |
Newark NJ Housing Authority (Housing Revenue) | | | 5.00 | | | | 01/01/2017 | | | | 3,200,000 | | | | 3,367,488 | |
North Jersey District Water Supply Series C (Water & Sewer Revenue, NATL-RE Insured) | | | 5.25 | | | | 07/01/2015 | | | | 1,000,000 | | | | 1,037,850 | |
| | | | |
| | | | | | | | | | | | | | | 202,141,060 | |
| | | | | | | | | | | | | | | | |
| | | | |
| New Mexico: 0.36% | | | | | | | | | | | | | | | | |
Clayton NM Jail Project Revenue (Miscellaneous Revenue, CIFC Insured) | | | 5.00 | | | | 11/01/2014 | | | | 1,250,000 | | | | 1,329,525 | |
Clayton NM Jail Project Revenue (Miscellaneous Revenue, CIFC Insured) | | | 5.00 | | | | 11/01/2015 | | | | 875,000 | | | | 943,136 | |
New Mexico Educational Assistance Foundation Series A-2 (Education Revenue, Guaranteed Student Loans Insured)± | | | 1.22 | | | | 12/01/2028 | | | | 12,500,000 | | | | 12,439,000 | |
New Mexico Mortgage Finance Authority SFMR Class IA2 (Housing Revenue, GNMA/FNMA Insured) | | | 5.60 | | | | 01/01/2039 | | | | 710,000 | | | | 762,334 | |
New Mexico Mortgage Finance Authority SFMR Class ID2 (Housing Revenue, GNMA FNMA FHLMC Insured) | | | 4.05 | | | | 07/01/2026 | | | | 270,000 | | | | 270,478 | |
| | | | |
| | | | | | | | | | | | | | | 15,744,473 | |
| | | | | | | | | | | | | | | | |
| | | | |
| New York: 12.29% | | | | | | | | | | | | | | | | |
Buffalo NY Sewer Authority Series F (Water & Sewer Revenue, NATL-RE FGIC Insured) | | | 6.00 | | | | 07/01/2013 | | | | 690,000 | | | | 716,558 | |
County of Suffolk NY TAN Series I (Tax Revenue) | | | 2.00 | | | | 07/12/2012 | | | | 105,000,000 | | | | 105,436,800 | |
Dutchess County NY Local Development Corporation (Health Revenue) | | | 4.00 | | | | 07/01/2013 | | | | 1,295,000 | | | | 1,334,912 | |
Dutchess County NY Local Development Corporation (Health Revenue, AGM Insured) | | | 5.00 | | | | 07/01/2014 | | | | 1,085,000 | | | | 1,167,384 | |
JPMorgan Chase PUTTER/DRIVER Trust Series 3925 (Tax Revenue)±§144A | | | 0.24 | | | | 04/30/2012 | | | | 15,000,000 | | | | 15,000,000 | |
Long Island NY Power Authority Series D (Airport Revenue, AGM Insured)±§ | | | 0.75 | | | | 12/01/2029 | | | | 11,005,000 | | | | 11,005,000 | |
Long Island NY Power Authority Series I (Utilities Revenue, AGM Insured)±§ | | | 1.25 | | | | 12/01/2029 | | | | 28,000,000 | | | | 28,000,000 | |
Long Island NY Power Authority Series L (Utilities Revenue, FSA Insured)± | | | 1.15 | | | | 12/01/2029 | | | | 10,000,000 | | | | 10,000,000 | |
Long Island NY Power Authority Series N (Utilities Revenue, FSA Insured)±§ | | | 0.80 | | | | 12/01/2029 | | | | 15,565,000 | | | | 15,565,000 | |
| | | | | | |
| Portfolio of Investments—December 31, 2011 (Unaudited) | | Wells Fargo Advantage Short-Term Municipal Bond Fund | | | 25 | |
| | | | | | | | | | | | | | | | |
| Security Name | | Interest Rate | | | Maturity Date | | | Principal | | | Value | |
| | | | | | | | | | | | | | | | |
| | | | |
| New York (continued) | | | | | | | | | | | | | | | | |
Long Island NY Power Authority Series O (Utilities Revenue, AGM Insured)±§ | | | 1.25 | % | | | 12/01/2029 | | | $ | 12,500,000 | | | $ | 12,500,000 | |
Metropitian Transportation Authority NY Sub Series E-2 (Transportation Revenue, BNP Paribas LOC)±§ | | | 0.56 | | | | 11/01/2035 | | | | 21,200,000 | | | | 21,200,000 | |
Metropolitan Transportation Authority NY Series B (Tax Revenue, AGM Insured)±§ | | | 1.25 | | | | 11/01/2022 | | | | 69,800,000 | | | | 69,800,000 | |
Monroe County NY Airport Authority Greater Rochester International Airport (Airport Revenue, NATL-RE Insured) | | | 5.75 | | | | 01/01/2014 | | | | 4,010,000 | | | | 4,252,525 | |
Monroe County NY Airport Authority Greater Rochester International Airport (Airport Revenue, NATL-RE Insured) | | | 5.75 | | | | 01/01/2015 | | | | 5,030,000 | | | | 5,469,622 | |
Monroe County NY Airport Authority Greater Rochester International Airport (Airport Revenue, NATL-RE Insured) | | | 5.88 | | | | 01/01/2016 | | | | 3,830,000 | | | | 4,256,930 | |
New York City NY Housing Development Corporation MFHR Series L-2 (Housing Revenue)± | | | 2.00 | | | | 05/01/2045 | | | | 13,000,000 | | | | 13,176,670 | |
New York City NY IDAG Yankee Stadium (Miscellaneous Revenue, Assured Guaranty Insured)(z) | | | 0.90 | | | | 03/01/2012 | | | | 1,070,000 | | | | 1,068,384 | |
New York City NY IDAG Yankee Stadium (Miscellaneous Revenue, Assured Guaranty Insured)(z) | | | 1.48 | | | | 03/01/2013 | | | | 2,755,000 | | | | 2,707,366 | |
New York City NY Municipal Water Finance Authority Series AA-2 (Water & Sewer Revenue)±§ | | | 0.76 | | | | 06/15/2032 | | | | 4,800,000 | | | | 4,800,000 | |
New York City NY Municipal Water Finance Authority Series C (Water & Sewer Revenue)±§ | | | 0.76 | | | | 06/15/2033 | | | | 46,100,000 | | | | 46,100,000 | |
New York City NY Transit Authority Triborough Bridge & Tunnel (Lease Revenue, AMBAC Insured) | | | 5.30 | | | | 01/01/2012 | | | | 1,000,000 | | | | 1,000,120 | |
New York Dormitory Authority (Miscellaneous Revenue) | | | 5.00 | | | | 07/01/2014 | | | | 1,200,000 | | | | 1,305,576 | |
New York Dormitory Authority North Shore Jewish Series B (Health Revenue)± | | | 1.02 | | | | 05/01/2018 | | | | 9,895,000 | | | | 9,278,146 | |
New York Energy R&D Authority Electric and Gas Corporation Series A (Utilities Revenue) | | | 2.13 | | | | 03/15/2015 | | | | 19,500,000 | | | | 19,493,760 | |
New York Environmental Facilities Corporation Waste Management Project Series A (IDR)± | | | 4.55 | | | | 05/01/2012 | | | | 3,000,000 | | | | 3,016,710 | |
New York Local Government (Tax Revenue)±(a) | | | 0.05 | | | | 04/01/2017 | | | | 31,850,000 | | | | 29,944,758 | |
New York NY Sub Series F-2 (Tax Revenue)± | | | 4.40 | | | | 12/15/2017 | | | | 19,720,000 | | | | 20,869,282 | |
New York NY Sub Series L-5 (GO-Local)±§ | | | 0.55 | | | | 04/01/2035 | | | | 20,000,000 | | | | 20,000,000 | |
New York Urban Development Corporation (Housing Revenue) | | | 5.88 | | | | 02/01/2013 | | | | 14,000,000 | | | | 14,041,860 | |
Niagara County NY IDA Solid Waste Disposal Series C (Resource Recovery Revenue)± | | | 5.63 | | | | 11/15/2024 | | | | 7,250,000 | | | | 7,331,055 | |
Niagara Falls NY Bridge Commission Series B (Transportation Revenue, NATL-RE FGIC Insured) | | | 5.25 | | | | 10/01/2015 | | | | 970,000 | | | | 1,022,584 | |
Seneca County NY IDA Solid Waste Disposal Seneca Meadows Incorporated Project (IDR)±144A | | | 6.63 | | | | 10/01/2035 | | | | 10,450,000 | | | | 10,511,760 | |
Suffolk County NY Economic Development Corporation (Health Revenue) | | | 5.00 | | | | 07/01/2016 | | | | 1,000,000 | | | | 1,116,230 | |
Syracuse NY Public Improvement Series B (Tax Revenue, Assured Guaranty Insured) | | | 4.00 | | | | 04/15/2014 | | | | 850,000 | | | | 907,503 | |
Troy NY Capital Resource Corporation Series B (Education Revenue) | | | 5.00 | | | | 09/01/2015 | | | | 2,000,000 | | | | 2,220,200 | |
Westchester County NY (Health Revenue) | | | 4.00 | | | | 11/01/2014 | | | | 1,700,000 | | | | 1,800,793 | |
Westchester County NY (Health Revenue) | | | 5.00 | | | | 11/01/2014 | | | | 4,815,000 | | | | 5,232,894 | |
Westchester County NY (Health Revenue) | | | 5.00 | | | | 11/01/2015 | | | | 3,000,000 | | | | 3,309,630 | |
Yonkers NY IDA (Tax Revenue) | | | 5.00 | | | | 10/01/2014 | | | | 1,500,000 | | | | 1,616,970 | |
Yonkers NY IDA (Tax Revenue) | | | 5.00 | | | | 10/01/2015 | | | | 2,295,000 | | | | 2,510,432 | |
Yonkers NY IDA (Tax Revenue) | | | 5.00 | | | | 10/01/2016 | | | | 2,000,000 | | | | 2,217,480 | |
| | | | |
| | | | | | | | | | | | | | | 532,304,894 | |
| | | | | | | | | | | | | | | | |
| | | | |
| 26 | | Wells Fargo Advantage Short-Term Municipal Bond Fund | | Portfolio of Investments—December 31, 2011 (Unaudited) |
| | | | | | | | | | | | | | | | |
| Security Name | | Interest Rate | | | Maturity Date | | | Principal | | | Value | |
| | | | | | | | | | | | | | | | |
| | | | |
| North Carolina: 0.66% | | | | | | | | | | | | | | | | |
North Carolina Eastern Municipal Power Agency Series C (Utilities Revenue, NATL-RE-IBC Insured) | | | 7.00 | % | | | 01/01/2013 | | | $ | 1,105,000 | | | $ | 1,118,426 | |
North Carolina Medical Care Commission University Health System Series E1 (Health Revenue)± | | | 5.75 | | | | 12/01/2036 | | | | 8,865,000 | | | | 9,519,237 | |
Winston-Salem NC Waterworks & Sewer System (Water & Sewer Revenue)±§ | | | 1.05 | | | | 06/01/2037 | | | | 17,760,000 | | | | 17,760,000 | |
| | | | |
| | | | | | | | | | | | | | | 28,397,663 | |
| | | | | | | | | | | | | | | | |
| | | | |
| North Dakota: 0.14% | | | | | | | | | | | | | | | | |
Fargo ND Health System (Health Revenue) | | | 4.00 | | | | 11/01/2015 | | | | 4,115,000 | | | | 4,412,638 | |
Ward County ND HCFA (Health Revenue) | | | 5.25 | | | | 07/01/2015 | | | | 1,375,000 | | | | 1,479,514 | |
| | | | |
| | | | | | | | | | | | | | | 5,892,152 | |
| | | | | | | | | | | | | | | | |
| | | | |
| Ohio: 2.39% | | | | | | | | | | | | | | | | |
Akron OH Sewer System (Water & Sewer Revenue, AMBAC Insured) | | | 5.00 | | | | 12/01/2014 | | | | 2,175,000 | | | | 2,309,894 | |
Cleveland OH Airport System (Airport Revenue) | | | 4.00 | | | | 01/01/2015 | | | | 5,245,000 | | | | 5,530,380 | |
Cleveland OH Municipal School District (Tax Revenue) | | | 4.00 | | | | 12/01/2015 | | | | 1,640,000 | | | | 1,774,382 | |
Cleveland OH Municipal School District (Tax Revenue) | | | 5.00 | | | | 12/01/2016 | | | | 1,705,000 | | | | 1,946,411 | |
Garfield Heights OH Reform & Improvement Project (Tax Revenue, AGM Insured) | | | 3.00 | | | | 12/01/2016 | | | | 3,840,000 | | | | 3,966,682 | |
Montgomery County OH Catholic Health Initiatives Series A (Health Revenue) | | | 4.00 | | | | 05/01/2015 | | | | 1,625,000 | | | | 1,715,464 | |
Montgomery County OH Catholic Health Initiatives Series D2 (Health Revenue)± | | | 5.25 | | | | 10/01/2038 | | | | 5,500,000 | | | | 5,940,220 | |
Montgomery County OH Water Revenue Refunding System Greater Moraine Beaver (Water & Sewer Revenue, AMBAC Insured) | | | 5.38 | | | | 11/15/2015 | | | | 2,650,000 | | | | 2,721,842 | |
Ohio Air Quality Development Authority (IDR) | | | 5.70 | | | | 02/01/2014 | | | | 2,500,000 | | | | 2,689,950 | |
Ohio Air Quality Development Authority Columbus Southern Power Corporation Series A (Utilities Revenue)± | | | 3.88 | | | | 12/01/2038 | | | | 2,000,000 | | | | 2,069,300 | |
Ohio Air Quality Development Authority First Energy Series B (IDR)± | | | 3.00 | | | | 10/01/2033 | | | | 2,900,000 | | | | 2,909,222 | |
Ohio Air Quality Development Authority PCR Series A (IDR)± | | | 2.25 | | | | 12/01/2023 | | | | 33,300,000 | | | | 33,414,219 | |
Ohio Higher Educational Facility Commission Hospital Cleveland Clinic Health Series A (Health Revenue) | | | 4.00 | | | | 01/01/2013 | | | | 1,750,000 | | | | 1,805,825 | |
Ohio Higher Educational Facility Commission Series B University Hospital Health System (Health Revenue)± | | | 3.75 | | | | 01/15/2025 | | | | 7,500,000 | | | | 7,690,800 | |
Ohio Higher Educational Facility Commission University Hospital Health System Series A (Health Revenue) | | | 4.00 | | | | 01/15/2013 | | | | 150,000 | | | | 153,572 | |
Ohio Higher Educational Facility Commission University Hospital Health System Series A (Health Revenue) | | | 5.00 | | | | 01/15/2014 | | | | 1,750,000 | | | | 1,850,345 | |
Ohio Higher Educational Facility Commission University Hospital Health System Series C (Health Revenue)± | | | 4.88 | | | | 01/15/2039 | | | | 2,050,000 | | | | 2,258,280 | |
Ohio Higher Educational Facility Commission University of Dayton Project Series B (Education Revenue)± | | | 1.35 | | | | 07/01/2016 | | | | 10,000,000 | | | | 10,008,500 | |
Ohio Water Development Authority Waste Management Project (Resource Recovery Revenue)± | | | 2.63 | | | | 07/01/2021 | | | | 3,300,000 | | | | 3,337,257 | |
Princeton OH School District MSTR (GO-Local, NATL-RE Insured)±§ | | | 0.85 | | | | 12/01/2030 | | | | 9,480,000 | | | | 9,480,000 | |
| | | | |
| | | | | | | | | | | | | | | 103,572,545 | |
| | | | | | | | | | | | | | | | |
| | | | |
| Oklahoma: 0.89% | | | | | | | | | | | | | | | | |
Cleveland County OK Public Facilities Authority Educational Facilities Norman Public Schools Project (Lease Revenue) | | | 4.00 | | | | 06/01/2014 | | | | 2,000,000 | | | | 2,137,300 | |
| | | | | | |
| Portfolio of Investments—December 31, 2011 (Unaudited) | | Wells Fargo Advantage Short-Term Municipal Bond Fund | | | 27 | |
| | | | | | | | | | | | | | | | |
| Security Name | | Interest Rate | | | Maturity Date | | | Principal | | | Value | |
| | | | | | | | | | | | | | | | |
| | | | |
| Oklahoma (continued) | | | | | | | | | | | | | | | | |
Comanche County OK Independent School District # 4 Geronimo (Education Revenue) | | | 6.25 | % | | | 08/15/2014 | | | $ | 574,542 | | | $ | 599,281 | |
Kingfisher OK Public Schools Project (Lease Revenue) | | | 4.50 | | | | 09/01/2016 | | | | 3,065,000 | | | | 3,332,513 | |
McClain County OK Economic Development Authority Educational Facilities Blanchard Public Schools Project (Lease Revenue) | | | 4.25 | | | | 09/01/2014 | | | | 1,865,000 | | | | 1,986,691 | |
Oklahoma City OK Industrial & Cultural Facilities Series B (Health Revenue, NATL-RE Insured)±(a)(m)(n) | | | 0.46 | | | | 06/01/2019 | | | | 17,000,000 | | | | 15,401,404 | |
Oklahoma County OK Finance Authority Putnam City Public Schools Project (Lease Revenue) | | | 4.00 | | | | 03/01/2014 | | | | 3,405,000 | | | | 3,598,268 | |
Oklahoma County OK Finance Authority Western Heights Public Schools Project (Lease Revenue) | | | 3.25 | | | | 09/01/2012 | | | | 840,000 | | | | 851,735 | |
Oklahoma Development Finance Authority Department of Human Services Community Office (Lease Revenue, AMBAC Insured) | | | 5.25 | | | | 02/01/2015 | | | | 1,090,000 | | | | 1,092,529 | |
Oklahoma Development Finance Authority PCR Public Service Company Oklahoma Project (IDR) | | | 5.25 | | | | 06/01/2014 | | | | 2,400,000 | | | | 2,561,544 | |
Okmulgee OK Municipal Utility System Series A (Utilities Revenue) | | | 2.00 | | | | 12/01/2012 | | | | 1,130,000 | | | | 1,140,780 | |
Tulsa OK Airports Improvement Trust Series A (Airport Revenue) | | | 3.00 | | | | 06/01/2012 | | | | 1,035,000 | | | | 1,040,599 | |
Tulsa OK Airports Improvement Trust Series A (Airport Revenue) | | | 4.00 | | | | 06/01/2017 | | | | 4,600,000 | | | | 4,783,540 | |
| | | | |
| | | | | | | | | | | | | | | 38,526,184 | |
| | | | | | | | | | | | | | | | |
| | | | |
| Oregon: 0.04% | | | | | | | | | | | | | | | | |
Oregon Facilities Authority Legacy Health System (Health Revenue) | | | 5.00 | | | | 03/15/2013 | | | | 1,000,000 | | | | 1,044,440 | |
Oregon Facilities Authority Legacy Health System (Health Revenue) | | | 5.00 | | | | 03/15/2014 | | | | 750,000 | | | | 802,320 | |
Oregon Housing & Community Services Department Series H (Housing Revenue) | | | 5.13 | | | | 01/01/2029 | | | | 10,000 | | | | 10,286 | |
| | | | |
| | | | | | | | | | | | | | | 1,857,046 | |
| | | | | | | | | | | | | | | | |
| | | | |
| Pennsylvania: 9.24% | | | | | | | | | | | | | | | | |
Allegheny County PA Airport Authority Pittsburgh International Airport (Airport Revenue, NATL-RE Insured) | | | 5.00 | | | | 01/01/2013 | | | | 1,410,000 | | | | 1,447,379 | |
Allegheny County PA Airport Authority Pittsburgh International Airport (Airport Revenue, AGM Insured) | | | 5.00 | | | | 01/01/2014 | | | | 1,350,000 | | | | 1,412,019 | |
Allegheny County PA Airport Authority Pittsburgh International Airport (Airport Revenue, AGM Insured) | | | 5.00 | | | | 01/01/2015 | | | | 1,000,000 | | | | 1,060,270 | |
Allegheny County PA Airport Authority Pittsburgh International Airport (Airport Revenue, NATL-RE Insured) | | | 5.75 | | | | 01/01/2013 | | | | 700,000 | | | | 725,151 | |
Allegheny County PA Airport Authority Pittsburgh International Airport (Airport Revenue, NATL-RE Insured) | | | 5.75 | | | | 01/01/2014 | | | | 1,000,000 | | | | 1,059,280 | |
Allegheny County PA Hospital Development Authority University of Pittsburgh Medical Center Series A-1 (Health Revenue)± | | | 1.01 | | | | 02/01/2021 | | | | 29,405,000 | | | | 26,796,188 | |
Allegheny County PA Hospital Development Authority University of Pittsburgh Medical Center Series B (Health Revenue) | | | 5.00 | | | | 06/15/2014 | | | | 1,475,000 | | | | 1,613,193 | |
Allegheny County PA Hospital Development Authority University of Pittsburgh Medical Centre Series F (Health Revenue)± | | | 1.15 | | | | 05/15/2038 | | | | 13,000,000 | | | | 13,001,820 | |
Allegheny County PA IDAG Duquesne Light PCR Series A (Utilities Revenue, AMBAC Insured)± | | | 4.35 | | | | 12/01/2013 | | | | 1,460,000 | | | | 1,527,350 | |
Allegheny County PA University of Pittsburgh Medical Center Series B (Health Revenue) | | | 5.00 | | | | 06/15/2014 | | | | 2,585,000 | | | | 2,827,189 | |
Beaver County PA IDA PCR First Energy Series B (IDR)± | | | 3.00 | | | | 10/01/2047 | | | | 5,100,000 | | | | 5,119,686 | |
Chester County PA IDA Renaissance Academy Project Series A (Miscellaneous Revenue) | | | 5.63 | | | | 10/01/2015 | | | | 1,565,000 | | | | 1,564,859 | |
| | | | |
| 28 | | Wells Fargo Advantage Short-Term Municipal Bond Fund | | Portfolio of Investments—December 31, 2011 (Unaudited) |
| | | | | | | | | | | | | | | | |
| Security Name | | Interest Rate | | | Maturity Date | | | Principal | | | Value | |
| | | | | | | | | | | | | | | | |
| | | | |
| Pennsylvania (continued) | | | | | | | | | | | | | | | | |
Cumberland County PA Municipal Authority Diakon Lutheran (Health Revenue) | | | 3.75 | % | | | 01/01/2013 | | | $ | 650,000 | | | $ | 656,838 | |
Cumberland County PA Municipal Authority Diakon Lutheran (Health Revenue) | | | 5.00 | | | | 01/01/2015 | | | | 2,310,000 | | | | 2,439,683 | |
Delaware County PA IDA Resource Recovery Facility Series A (Resource Recovery Revenue) | | | 6.10 | | | | 07/01/2013 | | | | 2,240,000 | | | | 2,247,750 | |
Delaware County PA IDA Resource Recovery Facility Series A (Resource Recovery Revenue) | | | 6.20 | | | | 07/01/2019 | | | | 3,800,000 | | | | 3,799,544 | |
Delaware Valley PA Regional Financial Authority Series D (Miscellaneous Revenue)±§ | | | 1.25 | | | | 12/01/2020 | | | | 24,900,000 | | | | 24,900,000 | |
Delaware Valley PA Regional Financing Authority (Miscellaneous Revenue)±§ | | | 2.15 | | | | 06/01/2042 | | | | 21,000,000 | | | | 21,000,000 | |
Delaware Valley PA Regional Financing Authority (Miscellaneous Revenue) | | | 5.75 | | | | 07/01/2017 | | | | 20,750,000 | | | | 23,931,598 | |
Gallery Certificate Trust Pennsylvania (Transportation Revenue, FSA Insured) | | | 4.50 | | | | 02/15/2013 | | | | 1,185,000 | | | | 1,188,662 | |
Harrisburg PA Authority Resource Recovery Facility Series D-1 (Resource Recovery Revenue, AGM Insured)± | | | 5.25 | | | | 12/01/2033 | | | | 8,880,000 | | | | 8,844,746 | |
Harrisburg PA Authority Resources Guaranteed Subordinated Series D-2 (Resource Recovery Revenue, AGM Insured)± | | | 5.00 | | | | 12/01/2033 | | | | 14,795,000 | | | | 14,769,849 | |
Luzerne County PA Series C (Tax Revenue, FSA Insured) | | | 7.00 | | | | 11/01/2018 | | | | 2,130,000 | | | | 2,549,184 | |
Lycoming County PA Health System Susquehanna Health System Project A (Health Revenue) | | | 5.00 | | | | 07/01/2014 | | | | 2,000,000 | | | | 2,107,620 | |
McKeesport PA Area School District (Tax Revenue, AMBAC State Aid Withholding Insured)(z) | | | 3.10 | | | | 10/01/2014 | | | | 2,000,000 | | | | 1,836,620 | |
Montgomery County PA IDA (Health Revenue, FHA Insured) | | | 5.00 | | | | 02/01/2014 | | | | 1,880,000 | | | | 2,025,550 | |
Montgomery County PA IDA (Health Revenue, FHA Insured) | | | 5.00 | | | | 08/01/2014 | | | | 2,955,000 | | | | 3,233,952 | |
Montgomery County PA IDA (Health Revenue, FHA Insured) | | | 5.00 | | | | 08/01/2015 | | | | 2,505,000 | | | | 2,799,813 | |
Northampton County PA General Purpose Hospital Authority Saint Lukes Hospital Project Series C (Health Revenue)± | | | 4.50 | | | | 08/15/2032 | | | | 1,425,000 | | | | 1,533,984 | |
Pennsylvania EDFA Albert Einstein Healthcare Series A (Health Revenue) | | | 5.00 | | | | 10/15/2013 | | | | 6,135,000 | | | | 6,315,001 | |
Pennsylvania EDFA Albert Einstein Healthcare Series A (Health Revenue) | | | 5.25 | | | | 10/15/2014 | | | | 900,000 | | | | 936,963 | |
Pennsylvania EDFA Colver Project Series F (Resource Recovery Revenue, AMBAC Insured) | | | 5.00 | | | | 12/01/2013 | | | | 4,215,000 | | | | 4,287,329 | |
Pennsylvania EDFA Colver Project Series F (Resource Recovery Revenue, AMBAC Insured) | | | 5.00 | | | | 12/01/2014 | | | | 2,250,000 | | | | 2,288,993 | |
Pennsylvania EDFA Colver Project Series F (Resource Recovery Revenue, AMBAC Insured) | | | 5.00 | | | | 12/01/2015 | | | | 1,675,000 | | | | 1,690,946 | |
Pennsylvania EDFA Main Line Health (Hospital Revenue)± | | | 0.50 | | | | 10/01/2027 | | | | 11,785,000 | | | | 11,660,433 | |
Pennsylvania EDFA Solid Waste Disposal Waste Management Incorporated Project (Resource Recovery Revenue)± | | | 2.75 | | | | 09/01/2013 | | | | 4,250,000 | | | | 4,333,683 | |
Pennsylvania EDFA Solid Waste Disposal Waste Management Incorporated Project (Resource Recovery Revenue) | | | 5.13 | | | | 12/01/2015 | | | | 305,000 | | | | 301,297 | |
Pennsylvania EDFA Waste Management Project (Resource Recovery Revenue)± | | | 2.63 | | | | 12/01/2033 | | | | 6,500,000 | | | | 6,587,360 | |
Pennsylvania Finance Authority Community College Beaver County Project (Education Revenue, NATL-RE State Aid Withholding Insured) | | | 4.65 | | | | 12/01/2013 | | | | 1,085,000 | | | | 1,088,667 | |
Pennsylvania HEFAR Foundation Indiana University PA Series A (Education Revenue, XLCA Insured)± | | | 0.70 | | | | 07/01/2017 | | | | 4,350,000 | | | | 4,041,498 | |
Pennsylvania HEFAR University of Pittsburgh Medical Center Series E (Health Revenue) | | | 5.00 | | | | 05/15/2014 | | | | 3,970,000 | | | | 4,330,555 | |
Pennsylvania HEFAR University of The Arts (Education Revenue, Radian State Aid Withholding Insured) | | | 5.50 | | | | 03/15/2013 | | | | 940,000 | | | | 941,993 | |
| | | | | | |
| Portfolio of Investments—December 31, 2011 (Unaudited) | | Wells Fargo Advantage Short-Term Municipal Bond Fund | | | 29 | |
| | | | | | | | | | | | | | | | |
| Security Name | | Interest Rate | | | Maturity Date | | | Principal | | | Value | |
| | | | | | | | | | | | | | | | |
| | | | |
| Pennsylvania (continued) | | | | | | | | | | | | | | | | |
Pennsylvania Public School Building Project (Miscellaneous Revenue, Dexia Credit Local LOC, FSA State Aid Withholding Insured)±§ | | | 2.25 | % | | | 06/01/2023 | | | $ | 15,920,000 | | | $ | 15,920,000 | |
Pennsylvania Turnpike Commission (Transportation Revenue)± | | | 0.87 | | | | 06/01/2015 | | | | 13,770,000 | | | | 13,788,314 | |
Pennsylvania Turnpike Commission Series C (Transportation Revenue)± | | | 0.98 | | | | 12/01/2013 | | | | 15,000,000 | | | | 15,105,600 | |
Pennsylvania Turnpike Commission Series C (Transportation Revenue)± | | | 1.15 | | | | 12/01/2014 | | | | 20,000,000 | | | | 20,160,400 | |
Philadelphia PA 4th Series 1998 General Ordinance (Utilities Revenue, AGM Insured) | | | 5.25 | | | | 08/01/2015 | | | | 1,150,000 | | | | 1,212,503 | |
Philadelphia PA 7th Series 1998 General Ordinance (Utilities Revenue, AMBAC Insured) | | | 5.00 | | | | 10/01/2013 | | | | 3,225,000 | | | | 3,424,208 | |
Philadelphia PA 8th Series 1998 General Ordinance (Utilities Revenue) | | | 5.00 | | | | 08/01/2013 | | | | 1,000,000 | | | | 1,056,330 | |
Philadelphia PA 8th Series General Ordinance (Utilities Revenue) | | | 5.00 | | | | 08/01/2014 | | | | 4,045,000 | | | | 4,371,310 | |
Philadelphia PA Gas Works 18th Series (Utilities Revenue, CIFC Insured) | | | 5.00 | | | | 08/01/2014 | | | | 2,000,000 | | | | 2,156,600 | |
Philadelphia PA Gas Works 1998 General Ordinance Series A (Utilities Revenue) | | | 5.00 | | | | 08/01/2015 | | | | 2,000,000 | | | | 2,191,120 | |
Philadelphia PA GO (Tax Revenue) | | | 4.00 | | | | 08/01/2013 | | | | 12,670,000 | | | | 13,169,325 | |
Philadelphia PA GO (Tax Revenue) | | | 5.00 | | | | 08/01/2014 | | | | 4,030,000 | | | | 4,348,531 | |
Philadelphia PA GO (Tax Revenue, CIFC Insured) | | | 5.00 | | | | 08/01/2014 | | | | 2,320,000 | | | | 2,501,656 | |
Philadelphia PA Housing Authority (Housing Revenue, AGM Housing & Urban Development Loan Insured) | | | 5.25 | | | | 12/01/2017 | | | | 2,335,000 | | | | 2,419,550 | |
Philadelphia PA IDA Series A (Lease Revenue, NATL-RE FGIC Insured) | | | 5.00 | | | | 10/01/2012 | | | | 8,000,000 | | | | 8,219,040 | |
Philadelphia PA IDA Series A (Lease Revenue, NATL-RE FGIC Insured) | | | 5.00 | | | | 10/01/2013 | | | | 5,625,000 | | | | 5,902,931 | |
Philadelphia PA Municipal Authority (Lease Revenue) | | | 4.00 | | | | 04/01/2012 | | | | 780,000 | | | | 784,321 | |
Philadelphia PA Municipal Authority (Lease Revenue) | | | 4.00 | | | | 04/01/2013 | | | | 1,290,000 | | | | 1,319,464 | |
Philadelphia PA Municipal Authority (Lease Revenue, AGM Insured) | | | 5.25 | | | | 05/15/2013 | | | | 1,365,000 | | | | 1,435,775 | |
Philadelphia PA Municipal Authority (Lease Revenue, AGM Insured) | | | 5.25 | | | | 11/15/2015 | | | | 2,850,000 | | | | 3,012,251 | |
Philadelphia PA Municipal Authority Series B (Lease Revenue, AGM Insured) | | | 5.25 | | | | 11/15/2016 | | | | 1,280,000 | | | | 1,348,032 | |
Philadelphia PA Parking Authority (Airport Revenue) | | | 5.00 | | | | 09/01/2012 | | | | 2,265,000 | | | | 2,322,033 | |
Philadelphia PA School District (Tax Revenue, AMBAC State Aid Withholding Insured) | | | 5.00 | | | | 08/01/2013 | | | | 2,955,000 | | | | 3,133,659 | |
Philadelphia PA School District (Tax Revenue) | | | 5.00 | | | | 06/01/2015 | | | | 4,655,000 | | | | 5,166,585 | |
Philadelphia PA School District Series A (Tax Revenue, AMBAC State Aid Withholding Insured) | | | 5.00 | | | | 08/01/2015 | | | | 10,105,000 | | | | 11,181,385 | |
Philadelphia PA School District Series C (Tax Revenue, State Aid Withholding Insured) | | | 5.00 | | | | 09/01/2013 | | | | 7,500,000 | | | | 7,975,575 | |
Philadelphia PA Series A (Tax Revenue, AGM Insured) | | | 5.25 | | | | 08/01/2016 | | | | 6,530,000 | | | | 7,471,169 | |
Pittsburgh PA Water & Sewer Authority Series C (Water & Sewer Revenue, Assured Guaranty Insured)± | | | 2.63 | | | | 09/01/2035 | | | | 6,250,000 | | | | 6,308,000 | |
St. Mary Hospital Authority Pennsylvania Catholic Healthcare East Series B (Health Revenue) | | | 5.00 | | | | 11/15/2013 | | | | 2,000,000 | | | | 2,129,100 | |
Westmoreland County PA (Tax Revenue, NATL-RE Insured)(z) | | | 2.35 | | | | 06/01/2013 | | | | 1,170,000 | | | | 1,131,601 | |
Westmoreland County PA IDA Excela Health Project (Health Revenue) | | | 4.00 | | | | 07/01/2014 | | | | 1,380,000 | | | | 1,437,077 | |
Westmoreland County PA IDA Excela Health Project (Health Revenue) | | | 4.00 | | | | 07/01/2015 | | | | 1,435,000 | | | | 1,504,798 | |
| | | | |
| | | | | | | | | | | | | | | 400,432,738 | |
| | | | | | | | | | | | | | | | |
| | | | |
| Puerto Rico: 2.16% | | | | | | | | | | | | | | | | |
Puerto Rico Commonwealth (Miscellaneous Revenue)±§ | | | 2.50 | | | | 07/01/2025 | | | | 20,075,000 | | | | 20,075,000 | |
Puerto Rico Commonwealth Highway & Transportation Authority Floaters Series DCL 019 (Transportation Revenue, Dexia Credit Local LOC, FSA Insured)±§ | | | 2.25 | | | | 01/01/2029 | | | | 595,000 | | | | 595,000 | |
Puerto Rico Commonwealth Highway & Transportation Authority Series W MBIA (Transportation Revenue, NATL-RE-IBC Insured) | | | 5.50 | | | | 07/01/2013 | | | | 2,700,000 | | | | 2,821,014 | |
| | | | |
| 30 | | Wells Fargo Advantage Short-Term Municipal Bond Fund | | Portfolio of Investments—December 31, 2011 (Unaudited) |
| | | | | | | | | | | | | | | | |
| Security Name | | Interest Rate | | | Maturity Date | | | Principal | | | Value | |
| | | | | | | | | | | | | | | | |
| | | | |
| Puerto Rico (continued) | | | | | | | | | | | | | | | | |
Puerto Rico Commonwealth Refinance Series C-4 (Miscellaneous Revenue, AGM Insured)±§ | | | 2.50 | % | | | 07/01/2018 | | | $ | 5,000,000 | | | $ | 5,000,000 | |
Puerto Rico Government Development Bank Senior Note Series D (Miscellaneous Revenue) | | | 1.00 | | | | 11/08/2012 | | | | 45,000,000 | | | | 44,829,900 | |
Puerto Rico Highway & Transportation Series W (Tax Revenue) | | | 5.50 | | | | 07/01/2013 | | | | 1,620,000 | | | | 1,745,696 | |
Puerto Rico Highway & Transportation Series W (Tax Revenue) | | | 5.50 | | | | 07/01/2013 | | | | 295,000 | | | | 306,260 | |
Puerto Rico Highway & Transportation Series W (Tax Revenue) | | | 5.50 | | | | 07/01/2013 | | | | 995,000 | | | | 1,046,322 | |
Puerto Rico Public Finance Corporation Commonwealth Series A (Miscellaneous Revenue, Government Development Bank for Puerto Rico LOC)± | | | 5.75 | | | | 08/01/2027 | | | | 17,000,000 | | | | 17,057,970 | |
| | | | |
| | | | | | | | | | | | | | | 93,477,162 | |
| | | | | | | | | | | | | | | | |
| | | | |
| Rhode Island: 0.07% | | | | | | | | | | | | | | | | |
Providence RI GO Series A (Tax Revenue, AGM Insured) | | | 4.00 | | | | 01/15/2014 | | | | 1,830,000 | | | | 1,907,482 | |
Rhode Island Health & Educational Building Corporation Providence Public Schools Program Series A (Miscellaneous Revenue, AGM Insured) | | | 5.00 | | | | 05/15/2014 | | | | 1,175,000 | | | | 1,258,343 | |
| | | | |
| | | | | | | | | | | | | | | 3,165,825 | |
| | | | | | | | | | | | | | | | |
| | | | |
| South Carolina: 0.63% | | | | | | | | | | | | | | | | |
Berkeley County SC Pollution Control Facilities Generating Company Project (Utilities Revenue) | | | 4.88 | | | | 10/01/2014 | | | | 2,860,000 | | | | 3,043,669 | |
Connector 2000 Association Incorporated CAB Series A (Transportation Revenue)(z) | | | 0.00 | | | | 01/01/2012 | | | | 61,376 | | | | 61,376 | |
Connector 2000 Association Incorporated CAB Series A (Transportation Revenue)(z) | | | 8.03 | | | | 01/01/2013 | | | | 105,306 | | | | 97,335 | |
Connector 2000 Association Incorporated CAB Series A (Transportation Revenue)(z) | | | 8.61 | | | | 01/01/2014 | | | | 110,149 | | | | 93,129 | |
Connector 2000 Association Incorporated CAB Series A (Transportation Revenue)(z) | | | 9.40 | | | | 01/01/2015 | | | | 119,099 | | | | 90,582 | |
Connector 2000 Association Incorporated CAB Series A (Transportation Revenue)(z) | | | 9.52 | | | | 07/22/2051 | | | | 665,372 | | | | 17,313 | |
Connector 2000 Association Incorporated CAB Series A (Transportation Revenue)(z) | | | 9.66 | | | | 01/01/2042 | | | | 1,150,857 | | | | 69,569 | |
Connector 2000 Association Incorporated CAB Series A (Transportation Revenue)(z) | | | 10.47 | | | | 01/01/2032 | | | | 1,485,756 | | | | 197,100 | |
Connector 2000 Association Incorporated CAB Series A (Transportation Revenue)(z) | | | 14.03 | | | | 01/01/2022 | | | | 294,812 | | | | 77,789 | |
Connector 2000 Association Incorporated CAB Series A (Transportation Revenue)(z) | | | 14.91 | | | | 01/01/2021 | | | | 278,784 | | | | 78,302 | |
Connector 2000 Association Incorporated CAB Series A (Transportation Revenue)(z) | | | 15.74 | | | | 01/01/2020 | | | | 235,042 | | | | 71,730 | |
Connector 2000 Association Incorporated CAB Series A (Transportation Revenue)(z) | | | 17.14 | | | | 01/01/2019 | | | | 216,089 | | | | 70,216 | |
Connector 2000 Association Incorporated CAB Series A (Transportation Revenue)(z) | | | 18.71 | | | | 01/01/2018 | | | | 198,490 | | | | 69,833 | |
Connector 2000 Association Incorporated CAB Series A (Transportation Revenue)(z) | | | 20.68 | | | | 01/01/2017 | | | | 179,606 | | | | 69,154 | |
Connector 2000 Association Incorporated CAB Series A (Transportation Revenue)(z) | | | 24.14 | | | | 01/01/2016 | | | | 132,758 | | | | 55,170 | |
Connector 2000 Association Incorporated CAB Series B (Transportation Revenue)(z) | | | 12.68 | | | | 07/22/2051 | | | | 258,161 | | | | 2,143 | |
Connector 2000 Association Incorporated CAB Series B (Transportation Revenue)(z) | | | 15.54 | | | | 01/01/2032 | | | | 513,093 | | | | 27,368 | |
| | | | | | |
| Portfolio of Investments—December 31, 2011 (Unaudited) | | Wells Fargo Advantage Short-Term Municipal Bond Fund | | | 31 | |
| | | | | | | | | | | | | | | | |
| Security Name | | Interest Rate | | | Maturity Date | | | Principal | | | Value | |
| | | | | | | | | | | | | | | | |
| | | | |
| South Carolina (continued) | | | | | | | | | | | | | | | | |
Georgetown County SC Environmental Improvement International Paper Company Project Series A (IDR) | | | 5.95 | % | | | 03/15/2014 | | | $ | 2,300,000 | | | $ | 2,475,789 | |
Lexington County SC Health Services Incorporate (Health Revenue) | | | 5.00 | | | | 11/01/2014 | | | | 500,000 | | | | 547,615 | |
Newberry SC Investing in Newberry County School District Project (Lease Revenue) | | | 5.25 | | | | 12/01/2014 | | | | 1,000,000 | | | | 1,085,980 | |
Orangeburg County SC Joint Government Action Authority (Tax Revenue, NATL-RE Insured) | | | 5.00 | | | | 10/01/2013 | | | | 1,100,000 | | | | 1,142,603 | |
Piedmont Municipal Power Agency South Carolina Unrefunded Balance 2004 Series A (Utilities Revenue, FGIC Insured) | | | 6.50 | | | | 01/01/2016 | | | | 1,860,000 | | | | 2,212,805 | |
Richland County SC Series A (Resource Recovery Revenue) | | | 4.60 | | | | 09/01/2012 | | | | 1,500,000 | | | | 1,531,080 | |
South Carolina Jobs EDA Anmed Health Project (Health Revenue) | | | 3.00 | | | | 02/01/2015 | | | | 225,000 | | | | 233,420 | |
South Carolina Jobs EDA Anmed Health Project (Health Revenue) | | | 5.00 | | | | 02/01/2015 | | | | 1,145,000 | | | | 1,256,340 | |
South Carolina Jobs EDA Palmetto Health (Health Revenue)± | | | 0.85 | | | | 08/01/2039 | | | | 9,590,000 | | | | 9,456,795 | |
Tobacco Settlement Revenue Management Authority South Carolina (Tobacco Revenue) | | | 5.00 | | | | 06/01/2018 | | | | 3,240,000 | | | | 3,243,629 | |
| | | | |
| | | | | | | | | | | | | | | 27,377,834 | |
| | | | | | | | | | | | | | | | |
| | | | |
| South Dakota: 0.04% | | | | | | | | | | | | | | | | |
Lower Brule Sioux Tribe of South Dakota Series B (Tax Revenue) | | | 5.15 | | | | 05/01/2014 | | | | 830,000 | | | | 772,191 | |
South Dakota Housing Development Authority Series F (Housing Revenue) | | | 5.25 | | | | 05/01/2028 | | | | 1,070,000 | | | | 1,097,167 | |
| | | | |
| | | | | | | | | | | | | | | 1,869,358 | |
| | | | | | | | | | | | | | | | |
| | | | |
| Tennessee: 2.84% | | | | | | | | | | | | | | | | |
Chattanooga-Hamilton County TN Hospital Authority (Health Revenue, AGM Insured) | | | 5.00 | | | | 10/01/2013 | | | | 1,850,000 | | | | 1,965,699 | |
Chattanooga-Hamilton County TN Hospital Authority (Health Revenue, AGM Insured) | | | 5.00 | | | | 10/01/2013 | | | | 4,200,000 | | | | 4,462,668 | |
Chattanooga-Hamilton County TN Hospital Authority (Health Revenue, AGM Insured) | | | 5.00 | | | | 10/01/2014 | | | | 1,650,000 | | | | 1,799,523 | |
Chattanooga-Hamilton County TN Hospital Authority (Health Revenue, AGM Insured) | | | 5.00 | | | | 10/01/2014 | | | | 4,085,000 | | | | 4,455,183 | |
Elizabethton TN Health & Educational Facilities Board Hospital Series B MBIA (Health Revenue, NATL-RE-IBC Insured) | | | 7.75 | | | | 07/01/2029 | | | | 1,200,000 | | | | 1,270,932 | |
Johnson City TN Health & Educational Facilities Board 1st Mortgage Mountain States (Health Revenue) | | | 3.00 | | | | 07/01/2013 | | | | 3,535,000 | | | | 3,568,194 | |
Johnson City TN Health & Educational Facilities Board 1st Mortgage Mountain States Health Series A (Health Revenue) | | | 7.50 | | | | 07/01/2033 | | | | 10,700,000 | | | | 11,319,744 | |
Johnson City TN Health & Educational Facilities Board 1st Mortgage Mountain States Series A MBIA (Health Revenue, NATL-RE-IBC Insured) | | | 7.50 | | | | 07/01/2033 | | | | 8,750,000 | | | | 9,256,800 | |
Knox County TN Health Educational & Housing Facilities Board Fort Sanders Alliance (Health Revenue, NATL-RE Insured) | | | 5.75 | | | | 01/01/2012 | | | | 7,000,000 | | | | 7,000,840 | |
Knox County TN Health Educational & Housing Facilities Board Series A (Health Revenue, AGM Insured)(z) | | | 4.72 | | | | 01/01/2016 | | | | 2,330,000 | | | | 1,932,339 | |
Lewisburg TN Industrial Development Board Waste Management Incorporated Project (Resource Recovery Revenue)± | | | 2.50 | | | | 07/01/2012 | | | | 1,750,000 | | | | 1,756,283 | |
Metropolitan Nashville & Davidson County TN County HEFA Meharry Medical College (Health Revenue, AMBAC Insured) | | | 6.00 | | | | 12/01/2012 | | | | 710,000 | | | | 729,355 | |
Shelby County TN Health Educational & Housing Facilities Series 2004A (Health Revenue) | | | 5.00 | | | | 09/01/2015 | | | | 2,750,000 | | | | 3,086,050 | |
Tennessee Energy Acquisition Corporation Gas Series 2006A (Utilities Revenue) | | | 5.25 | | | | 09/01/2019 | | | | 2,835,000 | | | | 2,872,280 | |
Tennessee Energy Acquisition Corporation Series A (Energy Revenue) | | | 5.00 | | | | 09/01/2014 | | | | 9,210,000 | | | | 9,571,032 | |
| | | | |
| 32 | | Wells Fargo Advantage Short-Term Municipal Bond Fund | | Portfolio of Investments—December 31, 2011 (Unaudited) |
| | | | | | | | | | | | | | | | |
| Security Name | | Interest Rate | | | Maturity Date | | | Principal | | | Value | |
| | | | | | | | | | | | | | | | |
| | | | |
| Tennessee (continued) | | | | | | | | | | | | | | | | |
Tennessee Energy Acquisition Corporation Series A (Energy Revenue) | | | 5.00 | % | | | 09/01/2015 | | | $ | 19,040,000 | | | $ | 19,536,563 | |
Tennessee Energy Acquisition Corporation Series A (Energy Revenue) | | | 5.00 | | | | 09/01/2016 | | | | 7,130,000 | | | | 7,266,468 | |
Tennessee Energy Acquisition Corporation Series A (Utilities Revenue) | | | 5.25 | | | | 09/01/2017 | | | | 10,275,000 | | | | 10,544,000 | |
Tennessee Energy Acquisition Corporation Series C (Utilities Revenue) | | | 5.00 | | | | 02/01/2015 | | | | 12,135,000 | | | | 12,445,171 | |
Tennessee Energy Acquisition Corporation Series C (Utilities Revenue) | | | 5.00 | | | | 02/01/2018 | | | | 4,280,000 | | | | 4,297,634 | |
Tennessee Energy Acquisition Corporation Series C (Energy Revenue) | | | 5.00 | | | | 02/01/2019 | | | | 4,085,000 | | | | 4,080,016 | |
| | | | |
| | | | | | | | | | | | | | | 123,216,774 | |
| | | | | | | | | | | | | | | | |
| | | | |
| Texas: 5.68% | | | | | | | | | | | | | | | | |
Arlington TX Special Obligation Dallas Cowboys Series A (Tax Revenue, NATL-RE Insured) | | | 5.00 | | | | 08/15/2034 | | | | 5,710,000 | | | | 5,943,254 | |
Central Texas Regional Mobility Authority (Transportation Revenue) | | | 5.75 | | | | 01/01/2017 | | | | 500,000 | | | | 541,675 | |
Dallas Fort Worth TX International Airport Series B (Airport Revenue, NATL-RE Insured) | | | 5.75 | | | | 11/01/2018 | | | | 2,255,000 | | | | 2,262,960 | |
Garza County TX Public Facilities Corporation (Lease Revenue) | | | 5.00 | | | | 10/01/2012 | | | | 10,000 | | | | 10,146 | |
Harris County TX Cultural Education Facilities Finance Corporation (Health Revenue)± | | | 2.75 | | | | 06/01/2014 | | | | 2,380,000 | | | | 2,422,602 | |
Harris County TX Cultural Education Facilities Finance Corporation (Health Revenue) | | | 3.13 | | | | 06/01/2015 | | | | 2,290,000 | | | | 2,358,242 | |
Harris County TX Cultural Education Facilities Finance Corporation Methodist Hospital System Series B (Health Revenue) | | | 5.25 | | | | 12/01/2013 | | | | 3,000,000 | | | | 3,263,280 | |
Harris County TX Health Facilities Development Corporation Memorial Hospital Systems Project Series A (Health Revenue, NATL-RE Insured) | | | 6.00 | | | | 06/01/2012 | | | | 1,250,000 | | | | 1,277,163 | |
Houston TX Beneficial Ownership Series 14 (Housing Revenue)§ | | | 5.75 | | | | 11/01/2034 | | | | 1,505,000 | | | | 1,508,251 | |
Houston TX Hotel Occupancy (Tax Revenue, AMBAC Insured)(z) | | | 3.68 | | | | 09/01/2016 | | | | 4,000,000 | | | | 3,370,040 | |
Houston TX Housing Finance Corporation Series A (Housing Revenue, GNMA/FNMA Insured) | | | 6.75 | | | | 06/01/2033 | | | | 605,000 | | | | 625,909 | |
Laredo TX Public Property Finance Contractual Obligation (GO-Local) | | | 3.88 | | | | 02/15/2018 | | | | 4,525,000 | | | | 4,932,341 | |
Lewisville TX Combination Contract (Miscellaneous Revenue) | | | 5.75 | | | | 09/01/2012 | | | | 10,000 | | | | 10,363 | |
Lewisville TX Combination Contract (Miscellaneous Revenue) | | | 5.75 | | | | 09/01/2012 | | | | 115,000 | | | | 116,638 | |
Lower Colorado River Authority Texas Unrefunded Balance 2010 Series A (Miscellaneous Revenue, AGM Insured) | | | 5.88 | | | | 05/15/2015 | | | | 1,510,000 | | | | 1,516,282 | |
Lubbock TX Health Facilities Development Corporation St. Joseph Health Systems Series A (Hospital Revenue)± | | | 3.05 | | | | 07/01/2030 | | | | 3,325,000 | | | | 3,373,911 | |
Mission TX Economic Development Corporation Solid Waste Disposal Allied Waste Incorporated Project Series A (Resource Recovery Revenue) | | | 5.20 | | | | 04/01/2018 | | | | 6,300,000 | | | | 6,334,902 | |
North Texas Health Facilities Development Corporation United Regional Health Care System (Health Revenue, AGM Insured) | | | 5.00 | | | | 09/01/2017 | | | | 850,000 | | | | 974,372 | |
North Texas Higher Education Authority Incorporated Student Loan Series 1 Class A-1 (Education Revenue)± | | | 0.77 | | | | 07/01/2019 | | | | 17,935,000 | | | | 17,874,559 | |
North Texas Higher Education Authority Series 2 Class A (Education Revenue)± | | | 1.37 | | | | 04/01/2037 | | | | 15,890,000 | | | | 15,746,196 | |
North Texas Tollway Authority First Tier Series L-2 (Transportation Revenue)±§ | | | 6.00 | | | | 01/01/2038 | | | | 15,500,000 | | | | 16,285,695 | |
North Texas Tollway Authority Series A (Transportation Revenue) | | | 3.00 | | | | 01/01/2012 | | | | 2,000,000 | | | | 2,000,140 | |
Tarrant County TX Cultural Education Facilities (Health Revenue) | | | 5.00 | | | | 05/15/2013 | | | | 1,000,000 | | | | 1,024,530 | |
Texas Affordable Housing Corporation (Housing Revenue, GNMA/FNMA Insured) | | | 5.50 | | | | 09/01/2038 | | | | 265,000 | | | | 273,589 | |
Texas Municipal Gas Acquisition & Supply Corporation Senior Lien Series D (Utilities Revenue) | | | 5.63 | | | | 12/15/2017 | | | | 55,210,000 | | | | 58,752,826 | |
Texas Municipal Gas Acquisition & Supply Corporation Series A (Utilities Revenue)± | | | 1.07 | | | | 09/15/2017 | | | | 8,120,000 | | | | 7,723,094 | |
| | | | | | |
| Portfolio of Investments—December 31, 2011 (Unaudited) | | Wells Fargo Advantage Short-Term Municipal Bond Fund | | | 33 | |
| | | | | | | | | | | | | | | | |
| Security Name | | Interest Rate | | | Maturity Date | | | Principal | | | Value | |
| | | | | | | | | | | | | | | | |
| | | | |
| Texas (continued) | | | | | | | | | | | | | | | | |
Texas Municipal Gas Acquisition & Supply Corporation Series A (Utilities Revenue) | | | 5.00 | % | | | 12/15/2012 | | | $ | 600,000 | | | $ | 624,144 | |
Texas Municipal Gas Acquisition & Supply Corporation Series B (Utilities Revenue)± | | | 0.57 | | | | 09/15/2017 | | | | 60,555,000 | | | | 57,686,510 | |
Texas Municipal Gas Acquisition & Supply Corporation Series B (Utilities Revenue)± | | | 0.92 | | | | 12/15/2017 | | | | 1,210,000 | | | | 1,091,904 | |
Texas PFA (Miscellaneous Revenue) | | | 2.60 | | | | 07/01/2020 | | | | 25,880,000 | | | | 25,973,168 | |
| | | | |
| | | | | | | | | | | | | | | 245,898,686 | |
| | | | | | | | | | | | | | | | |
| | | | |
| Utah: 0.26% | | | | | | | | | | | | | | | | |
Utah Charter School Finance Authority North Davis Preparatory (Miscellaneous Revenue) | | | 5.00 | | | | 07/15/2015 | | | | 655,000 | | | | 662,821 | |
Utah Charter School Finance Authority Summit Academy Series A (Miscellaneous Revenue) | | | 5.13 | | | | 06/15/2017 | | | | 1,710,000 | | | | 1,721,269 | |
Utah County UT ECFA U.S. Steel Corporation Project (IDR) | | | 5.38 | | | | 11/01/2015 | | | | 8,700,000 | | | | 8,742,978 | |
| | | | |
| | | | | | | | | | | | | | | 11,127,068 | |
| | | | | | | | | | | | | | | | |
| | | | |
| Vermont: 0.24% | | | | | | | | | | | | | | | | |
Burlington VT Airport Authority (Airport Revenue) | | | 6.50 | | | | 12/15/2012 | | | | 8,500,000 | | | | 8,504,420 | |
Burlington VT Electric Series A (Utilities Revenue, AMBAC Insured) | | | 5.38 | | | | 07/01/2013 | | | | 605,000 | | | | 616,670 | |
Burlington VT Electric Series A (Utilities Revenue, AMBAC Insured) | | | 5.38 | | | | 07/01/2014 | | | | 1,145,000 | | | | 1,164,763 | |
| | | | |
| | | | | | | | | | | | | | | 10,285,853 | |
| | | | | | | | | | | | | | | | |
| | | | |
| Virgin Islands: 0.67% | | | | | | | | | | | | | | | | |
Virgin Islands PFA Matching Fund Loan Diago Series A (Miscellaneous Revenue) | | | 6.00 | | | | 10/01/2014 | | | | 2,100,000 | | | | 2,281,104 | |
Virgin Islands PFA Matching Fund Loan Notes Senior Lien Series A (Water & Sewer Revenue) | | | 5.00 | | | | 10/01/2014 | | | | 895,000 | | | | 954,374 | |
Virgin Islands PFA Senior Lien Series B (Miscellaneous Revenue) | | | 5.00 | | | | 10/01/2013 | | | | 2,500,000 | | | | 2,620,500 | |
Virgin Islands PFA Senior Lien Series B (Miscellaneous Revenue) | | | 5.00 | | | | 10/01/2014 | | | | 500,000 | | | | 533,170 | |
Virgin Islands PFA Series C (Miscellaneous Revenue) | | | 5.00 | | | | 10/01/2016 | | | | 7,500,000 | | | | 8,160,150 | |
Virgin Islands PFA Sub Lien Series C (Miscellaneous Revenue) | | | 5.00 | | | | 10/01/2013 | | | | 3,250,000 | | | | 3,397,388 | |
Virgin Islands PFA Sub Lien Series C (Miscellaneous Revenue) | | | 5.00 | | | | 10/01/2014 | | | | 2,250,000 | | | | 2,392,155 | |
Virgin Islands PFA Sub Matching Fund Loan Notes Diago Series A (Miscellaneous Revenue) | | | 3.00 | | | | 10/01/2012 | | | | 465,000 | | | | 467,823 | |
Virgin Islands PFA Sub Matching Fund Loan Notes Diago Series A (Tax Revenue) | | | 4.00 | | | | 10/01/2014 | | | | 600,000 | | | | 623,940 | |
Virgin Islands PFA Sub Matching Fund Loan Notes Diago Series A (Miscellaneous Revenue) | | | 5.00 | | | | 10/01/2013 | | | | 605,000 | | | | 632,437 | |
Virgin Islands PFA Sub Matching Fund Loan Notes Diago Series A (Tax Revenue) | | | 5.00 | | | | 10/01/2015 | | | | 620,000 | | | | 671,696 | |
Virgin Islands Water & Power Authority Series A (Utilities Revenue) | | | 4.00 | | | | 07/01/2013 | | | | 3,500,000 | | | | 3,593,975 | |
Virgin Islands Water & Power Authority Series A (Utilities Revenue) | | | 4.00 | | | | 07/01/2014 | | | | 2,500,000 | | | | 2,591,050 | |
| | | | |
| | | | | | | | | | | | | | | 28,919,762 | |
| | | | | | | | | | | | | | | | |
| | | | |
| Virginia: 0.31% | | | | | | | | | | | | | | | | |
Louisa VA IDA Electric & Power Company Project Series A (Utilities Revenue)± | | | 5.38 | | | | 11/01/2035 | | | | 2,000,000 | | | | 2,144,740 | |
Marquis County VA IDA (Miscellaneous Revenue) | | | 5.10 | | | | 09/01/2013 | | | | 3,072,000 | | | | 2,528,594 | |
Richmond VA Government Facilities (Lease Revenue, AMBAC Insured) | | | 5.00 | | | | 07/15/2013 | | | | 360,000 | | | | 375,592 | |
Smyth County VA IDA Mountain States Health Alliance (Health Revenue) | | | 5.00 | | | | 07/01/2013 | | | | 3,670,000 | | | | 3,827,186 | |
| | | | |
| 34 | | Wells Fargo Advantage Short-Term Municipal Bond Fund | | Portfolio of Investments—December 31, 2011 (Unaudited) |
| | | | | | | | | | | | | | | | |
| Security Name | | Interest Rate | | | Maturity Date | | | Principal | | | Value | |
| | | | | | | | | | | | | | | | |
| | | | |
| Virginia (continued) | | | | | | | | | | | | | | | | |
Virginia College Building Authority Regent University Project (Education Revenue) | | | 4.50 | % | | | 06/01/2012 | | | $ | 395,000 | | | $ | 399,701 | |
Virginia College Building Authority Regent University Project (Education Revenue) | | | 5.00 | | | | 06/01/2014 | | | | 535,000 | | | | 569,315 | |
Virginia Housing Development Authority Series A-5 (Housing Revenue, GO of Authority Insured) | | | 3.90 | | | | 01/01/2013 | | | | 750,000 | | | | 761,978 | |
Virginia Housing Development Authority Series A-5 (Housing Revenue, GO of Authority Insured) | | | 3.90 | | | | 07/01/2013 | | | | 600,000 | | | | 613,830 | |
Virginia Housing Development Authority Series A-5 (Housing Revenue, GO of Authority Insured) | | | 4.20 | | | | 07/01/2014 | | | | 750,000 | | | | 777,068 | |
Virginia Housing Development Authority Sub Series C (Housing Revenue) | | | 4.25 | | | | 07/01/2013 | | | | 1,500,000 | | | | 1,542,960 | |
| | | | |
| | | | | | | | | | | | | | | 13,540,964 | |
| | | | | | | | | | | | | | | | |
| | | | |
| Washington: 0.92% | | | | | | | | | | | | | | | | |
Clark County WA School District # 114 (Tax Revenue, AGM Insured) | | | 5.25 | | | | 12/01/2012 | | | | 2,675,000 | | | | 2,798,906 | |
Energy Northwest WA Electric Project Series A (Utilities Revenue) | | | 5.00 | | | | 07/01/2014 | | | | 3,410,000 | | | | 3,696,645 | |
King County WA Public Hospital District # 001 Series A (Health Revenue) | | | 5.00 | | | | 06/15/2013 | | | | 1,070,000 | | | | 1,112,961 | |
King County WA Public Hospital District # 001 Series A (Health Revenue) | | | 5.00 | | | | 06/15/2014 | | | | 1,520,000 | | | | 1,607,324 | |
Port Kalama WA Series B (Port Authority Revenue) | | | 5.25 | | | | 12/01/2015 | | | | 500,000 | | | | 548,085 | |
Port Moses Lake WA Series A (Tax Revenue, XLCA Insured) | | | 4.25 | | | | 12/01/2012 | | | | 200,000 | | | | 206,186 | |
Port Moses Lake WA Series A (Tax Revenue, XLCA Insured) | | | 4.25 | | | | 12/01/2013 | | | | 185,000 | | | | 195,384 | |
Skagit County WA Public Hospital District #1 (Health Revenue) | | | 5.50 | | | | 12/01/2013 | | | | 500,000 | | | | 527,265 | |
Tobacco Settlement Authority Washington Asset-Backed (Tobacco Revenue) | | | 6.50 | | | | 06/01/2026 | | | | 16,890,000 | | | | 17,287,928 | |
Washington EDFA Remarketed 09-01-11 (Resource Recovery Revenue)± | | | 2.00 | | | | 11/01/2017 | | | | 3,000,000 | | | | 3,008,460 | |
Washington HCFA Series A (Health Revenue) | | | 5.00 | | | | 08/15/2012 | | | | 2,000,000 | | | | 2,043,740 | |
Washington Health Care Facilities Authority Series A (Health Revenue) | | | 5.00 | | | | 08/15/2013 | | | | 1,250,000 | | | | 1,311,650 | |
Washington Health Care Facilities Authority Series A (Health Revenue) | | | 5.00 | | | | 08/15/2014 | | | | 1,500,000 | | | | 1,601,295 | |
Washington HEFAR Whitworth University Project (Education Revenue) | | | 4.00 | | | | 10/01/2012 | | | | 710,000 | | | | 720,835 | |
Washington HEFAR Whitworth University Project (Education Revenue) | | | 4.00 | | | | 10/01/2013 | | | | 630,000 | | | | 648,390 | |
Washington HEFAR Whitworth University Project (Education Revenue) | | | 4.00 | | | | 10/01/2014 | | | | 790,000 | | | | 821,956 | |
Washington Housing Financing Commission Skyline at First Hill Project Series B (Health Revenue) | | | 5.10 | | | | 01/01/2013 | | | | 2,000,000 | | | | 1,901,600 | |
| | | | |
| | | | | | | | | | | | | | | 40,038,610 | |
| | | | | | | | | | | | | | | | |
| | | | |
| West Virginia: 0.20% | | | | | | | | | | | | | | | | |
Berkeley County WV Public Sewer Series A (Miscellaneous Revenue) | | | 4.55 | | | | 10/01/2014 | | | | 545,000 | | | | 565,699 | |
West Virginia Economic Development Authority PCR Series D (Utilities Revenue)± | | | 4.85 | | | | 05/01/2019 | | | | 7,600,000 | | | | 7,986,916 | |
| | | | |
| | | | | | | | | | | | | | | 8,552,615 | |
| | | | | | | | | | | | | | | | |
| | | | |
| Wisconsin: 1.46% | | | | | | | | | | | | | | | | |
Badger WI Tobacco Asset Securitization Corporation Asset-Backed Prerefunded Balance (Tobacco Revenue) | | | 6.13 | | | | 06/01/2027 | | | | 5,355,000 | | | | 5,486,465 | |
Kenosha WI Unified School District # 1 Series A (Tax Revenue) | | | 4.00 | | | | 04/01/2013 | | | | 2,130,000 | | | | 2,209,470 | |
Kimberly WI Area School District Refunding (Tax Revenue, AGM Insured) | | | 4.35 | | | | 03/01/2013 | | | | 1,000,000 | | | | 1,006,620 | |
Winsconsin PFOTER 628 (Health Revenue, NATL-RE LOC)±§144A | | | 0.56 | | | | 08/15/2023 | | | | 12,000,000 | | | | 12,000,000 | |
Wisconsin HEFA (Health Revenue) | | | 4.00 | | | | 12/01/2013 | | | | 1,295,000 | | | | 1,352,822 | |
Wisconsin HEFA (Health Revenue) | | | 4.00 | | | | 12/01/2015 | | | | 1,310,000 | | | | 1,387,945 | |
Wisconsin HEFA (Health Revenue) | | | 5.00 | | | | 07/15/2014 | | | | 6,000,000 | | | | 6,363,420 | |
Wisconsin HEFA (Health Revenue) | | | 5.00 | | | | 12/01/2014 | | | | 1,350,000 | | | | 1,460,957 | |
| | | | | | |
| Portfolio of Investments—December 31, 2011 (Unaudited) | | Wells Fargo Advantage Short-Term Municipal Bond Fund | | | 35 | |
| | | | | | | | | | | | | | | | |
| Security Name | | Interest Rate | | | Maturity Date | | | Principal | | | Value | |
| | | | | | | | | | | | | | | | |
| | | | |
| Wisconsin (continued) | | | | | | | | | | | | | | | | |
Wisconsin HEFA Aurora Healthcare Incorporated Series A (Health Revenue) | | | 5.00 | % | | | 04/15/2012 | | | $ | 555,000 | | | $ | 560,472 | |
Wisconsin HEFA Aurora Healthcare Incorporated Series A (Health Revenue) | | | 5.00 | | | | 04/15/2014 | | | | 1,500,000 | | | | 1,583,445 | |
Wisconsin HEFA Froedtert & Community Healthcare (Health Revenue) | | | 4.00 | | | | 04/01/2014 | | | | 1,250,000 | | | | 1,325,100 | |
Wisconsin HEFA Mercy Alliance Incorporated Project Series A (Health Revenue) | | | 5.00 | | | | 06/01/2019 | | | | 6,000,000 | | | | 6,327,360 | |
Wisconsin HEFA Ministry Healthcare Series A (Health Revenue) | | | 4.00 | | | | 08/15/2014 | | | | 1,000,000 | | | | 1,051,880 | |
Wisconsin HEFA Ministry Healthcare Series A (Health Revenue) | | | 5.00 | | | | 08/15/2015 | | | | 1,750,000 | | | | 1,914,850 | |
Wisconsin HEFA ThedaCare Incorporated (Health Revenue) | | | 5.00 | | | | 12/15/2014 | | | | 1,060,000 | | | | 1,153,577 | |
Wisconsin HEFA ThedaCare Incorporated Series A (Health Revenue) | | | 5.00 | | | | 12/15/2014 | | | | 1,730,000 | | | | 1,884,800 | |
Wisconsin HEFA ThedaCare Incorporated Series B (Health Revenue) | | | 4.00 | | | | 12/15/2014 | | | | 3,405,000 | | | | 3,600,038 | |
Wisconsin HEFA Wheaton Healthcare Series B (Health Revenue)± | | | 4.75 | | | | 08/15/2025 | | | | 10,750,000 | | | | 11,497,770 | |
Wisconsin HEFA Wheaton Healthcare Series B (Health Revenue) | | | 5.00 | | | | 08/15/2012 | | | | 860,000 | | | | 872,461 | |
| | | | |
| | | | | | | | | | | | | | | 63,039,452 | |
| | | | | | | | | | | | | | | | |
| | | | |
Total Municipal Bonds and Notes (Cost $4,096,041,208) | | | | | | | | | | | | | | | 4,128,383,727 | |
| | | | | | | | | | | | | | | | |
| | | | |
| | | Yield | | | | | | Shares | | | | |
| Short-Term Investments: 0.64% | | | | | | | | | | | | | | | | |
| | | | |
| Investment Companies: 0.61% | | | | | | | | | | | | | | | | |
Wells Fargo Advantage National Tax-Free Money Market Fund, Institutional Class (l)(u) | | | 0.01 | | | | | | | | 26,609,751 | | | | 26,609,751 | |
| | | | | | | | | | | | | | | | |
| | | | |
| | | | | | | | | Principal | | | | |
| U.S. Treasury Securities: 0.03% | | | | | | | | | | | | | | | | |
U.S. Treasury Bill# | | | 0.01 | | | | 03/29/2012 | | | $ | 1,400,000 | | | | 1,399,950 | |
| | | | | | | | | | | | | | | | |
| | | | |
Total Short-Term Investments (Cost $28,009,711) | | | | | | | | | | | | | | | 28,009,701 | |
| | | | | | | | | | | | | | | | |
| | | | | | | | |
| Total Investments in Securities | | | | | | | | |
| (Cost $4,124,050,919)* | | | 95.93 | % | | | 4,156,393,428 | |
Other Assets and Liabilities, Net | | | 4.07 | | | | 176,154,771 | |
| | | | | | | | |
| Total Net Assets | | | 100.00 | % | | $ | 4,332,548,199 | |
| | | | | | | | |
| ± | Variable rate investment. |
| (s) | Security is currently in default with regards to scheduled interest and/or principal payments. The Fund has stopped accruing interest on this security. |
| § | These securities are subject to a demand feature which reduces the effective maturity. |
| (z) | Zero coupon security. Rate represents yield to maturity. |
| 144A | Security that may be resold to “qualified institutional buyers” under Rule 144A or security offered pursuant to Section 4(2) of the Securities Act of 1933, as amended. |
| (a) | Security is fair valued by the Management Valuation Team, and in certain instances by the Board of Trustees, in accordance with procedures approved by the Board of Trustees. |
| (m) | An auction-rate security whose interest rate resets at predetermined short-term intervals through a Dutch auction; rate shown represents the rate in effect at period-end. |
| (n) | Auction to set interest rate on security failed at period end due to insufficient investor interest; failed auction does not itself cause a default. |
| (l) | Investment in an affiliate. |
| (u) | Rate shown is the 7-day annualized yield at period end. |
| # | All or a portion of this security is segregated as collateral for investments in derivative instruments. |
| * | Cost for federal income tax purposes is $4,125,463,631 and net unrealized appreciation (depreciation) consists of: |
| | | | |
Gross unrealized appreciation | | $ | 47,804,257 | |
Gross unrealized depreciation | | | (16,874,460 | ) |
| | | | |
Net unrealized appreciation | | $ | 30,929,797 | |
The accompanying notes are an integral part of these financial statements.
| | | | |
| 36 | | Wells Fargo Advantage Short-Term Municipal Bond Fund | | Statement of Assets and Liabilities—December 31, 2011 (Unaudited) |
| | | | |
| | | | |
| |
Assets | | | | |
Investments | | | | |
In unaffiliated securities, at value | | $ | 4,129,783,677 | |
In affiliated securities, at value | | | 26,609,751 | |
| | | | |
Total investments, at value (see cost below) | | | 4,156,393,428 | |
Receivable for investments sold | | | 144,452,741 | |
Principal paydown receivable | | | 44,638 | |
Receivable for Fund shares sold | | | 22,129,256 | |
Receivable for interest | | | 32,948,874 | |
Prepaid expenses and other assets | | | 34,334 | |
| | | | |
Total assets | | | 4,356,003,271 | |
| | | | |
| |
Liabilities | | | | |
Distributions payable | | | 2,303,068 | |
Payable for investments purchased | | | 12,144,530 | |
Payable for Fund shares redeemed | | | 6,367,321 | |
Payable for daily variation margin on open futures contracts | | | 254,375 | |
Advisory fee payable | | | 608,902 | |
Distribution fees payable | | | 136,026 | |
Due to other related parties | | | 783,793 | |
Accrued expenses and other liabilities | | | 857,057 | |
| | | | |
Total liabilities | | | 23,455,072 | |
| | | | |
Total net assets | | $ | 4,332,548,199 | |
| | | | |
| |
NET ASSETS CONSIST OF | | | | |
Paid-in capital | | $ | 4,300,434,495 | |
Overdistributed net investment income | | | (166,626 | ) |
Accumulated net realized gains on investments | | | 750,008 | |
Net unrealized gains on investments | | | 31,530,322 | |
| | | | |
Total net assets | | $ | 4,332,548,199 | |
| | | | |
| |
COMPUTATION OF NET ASSET VALUE AND OFFERING PRICE PER SHARE1 | | | | |
Net assets – Class A | | $ | 1,310,043,902 | |
Shares outstanding – Class A | | | 131,843,846 | |
Net asset value per share – Class A | | | $9.94 | |
Maximum offering price per share – Class A2 | | | $10.14 | |
Net assets – Class C | | $ | 201,595,054 | |
Shares outstanding – Class C | | | 20,287,446 | |
Net asset value per share – Class C | | | $9.94 | |
Net assets – Administrator Class | | $ | 84,578,678 | |
Shares outstanding – Administrator Class | | | 8,492,743 | |
Net asset value per share – Administrator Class | | | $9.96 | |
Net assets – Institutional Class | | $ | 822,825,755 | |
Shares outstanding – Institutional Class | | | 82,658,702 | |
Net asset value per share – Institutional Class | | | $9.95 | |
Net assets – Investor Class | | $ | 1,913,504,810 | |
Shares outstanding – Investor Class | | | 192,373,362 | |
Net asset value per share – Investor Class | | | $9.95 | |
| |
Total investments, at cost | | $ | 4,124,050,919 | |
| | | | |
| 1. | The Fund has an unlimited number of authorized shares. |
| 2. | Maximum offering price is computed as 100/98 of net asset value. On investments of $50,000 or more, the offering price is reduced. |
The accompanying notes are an integral part of these financial statements.
| | | | | | |
| Statement of Operations—Six Months Ended December 31, 2011 (Unaudited) | | Wells Fargo Advantage Short-Term Municipal Bond Fund | | | 37 | |
| | | | |
| | | | |
| |
Investment income | | | | |
Interest | | $ | 58,167,451 | |
Income from affiliated securities | | | 2,121 | |
| | | | |
Total investment income | | | 58,169,572 | |
| | | | |
| |
Expenses | | | | |
Advisory fee | | | 6,220,683 | |
Administration fees | | | | |
Fund level | | | 1,027,084 | |
Class A | | | 979,456 | |
Class C | | | 163,513 | |
Administrator Class | | | 36,227 | |
Institutional Class | | | 297,584 | |
Investor Class | | | 1,770,050 | |
Shareholder servicing fees | | | | |
Class A | | | 1,530,401 | |
Class C | | | 255,489 | |
Administrator Class | | | 90,568 | |
Investor Class | | | 2,329,013 | |
Distribution fees | | | | |
Class C | | | 766,467 | |
Custody and accounting fees | | | 106,533 | |
Professional fees | | | 21,710 | |
Registration fees | | | 170,835 | |
Shareholder report expenses | | | 80,095 | |
Trustees’ fees and expenses | | | 6,235 | |
Other fees and expenses | | | 34,051 | |
| | | | |
Total expenses | | | 15,885,994 | |
Less: Fee waivers and/or expense reimbursements | | | (3,258,997 | ) |
| | | | |
Net expenses | | | 12,626,997 | |
| | | | |
Net investment income | | | 45,542,575 | |
| | | | |
| |
REALIZED AND UNREALIZED GAINS (LOSSES) ON INVESTMENTS | | | | |
| |
Net realized gains (losses) on: | | | | |
Unaffiliated securities | | | 10,224,941 | |
Futures transactions | | | (6,651,013 | ) |
| | | | |
Net realized gains on investments | | | 3,573,928 | |
| | | | |
| |
Net change in unrealized gains (losses) on: | | | | |
Unaffiliated securities | | | 193,761 | |
Futures transactions | | | (1,280,547 | ) |
| | | | |
Net change in unrealized gains (losses) on investments | | | (1,086,786 | ) |
| | | | |
Net realized and unrealized gains (losses) on investments | | | 2,487,142 | |
| | | | |
Net increase in net assets resulting from operations | | $ | 48,029,717 | |
| | | | |
The accompanying notes are an integral part of these financial statements.
| | | | |
| 38 | | Wells Fargo Advantage Short-Term Municipal Bond Fund | | Statements of Changes in Net Assets |
| | | | | | | | | | | | | | | | |
| | | Six Months Ended December 31, 2011 (Unaudited) | | | Year Ended June 30, 2011 | |
| | | | |
Operations | | | | | | | | | | | | | | | | |
Net investment income | | | | | | $ | 45,542,575 | | | | | | | $ | 91,117,261 | |
Net realized gains on investments | | | | | | | 3,573,928 | | | | | | | | 10,391,806 | |
Net change in unrealized gains (losses) on investments | | | | | | | (1,086,786 | ) | | | | | | | 9,106,880 | |
| | | | | | | | | | | | | | | | |
Net increase in net assets resulting from operations | | | | | | | 48,029,717 | | | | | | | | 110,615,947 | |
| | | | | | | | | | | | | | | | |
| | | | |
Distributions to shareholders from | | | | | | | | | | | | | | | | |
Net investment income | | | | | | | | | | | | | | | | |
Class A | | | | | | | (13,631,220 | ) | | | | | | | (23,647,477 | ) |
Class C | | | | | | | (1,518,219 | ) | | | | | | | (3,643,850 | ) |
Administrator Class | | | | | | | (808,267 | ) | | | | | | | (921,665 | )1 |
Institutional Class | | | | | | | (9,060,741 | ) | | | | | | | (16,580,998 | ) |
Investor Class | | | | | | | (20,534,464 | ) | | | | | | | (46,326,202 | ) |
Net realized gains | | | | | | | | | | | | | | | | |
Class A | | | | | | | (1,279,665 | ) | | | | | | | (635,264 | ) |
Class C | | | | | | | (199,138 | ) | | | | | | | (149,077 | ) |
Administrator Class | | | | | | | (78,071 | ) | | | | | | | (41,525 | )1 |
Institutional Class | | | | | | | (755,454 | ) | | | | | | | (482,288 | ) |
Investor Class | | | | | | | (1,868,820 | ) | | | | | | | (1,291,311 | ) |
| | | | | | | | | | | | | | | | |
Total distributions to shareholders | | | | | | | (49,734,059 | ) | | | | | | | (93,719,657 | ) |
| | | | | | | | | | | | | | | | |
| | | | |
Capital share transactions | | | Shares | | | | | | | | Shares | | | | | |
Proceeds from shares sold | | | | | | | | | | | | | | | | |
Class A | | | 49,092,066 | | | | 488,819,191 | | | | 75,240,742 | | | | 746,286,970 | |
Class C | | | 2,433,332 | | | | 24,217,654 | | | | 6,663,576 | | | | 66,091,034 | |
Administrator Class | | | 3,542,217 | | | | 35,345,524 | | | | 9,622,166 | 1 | | | 95,475,199 | 1 |
Institutional Class | | | 30,435,157 | | | | 303,334,790 | | | | 78,634,207 | | | | 780,942,753 | |
Investor Class | | | 37,625,608 | | | | 374,781,617 | | | | 73,264,656 | | | | 726,434,331 | |
| | | | | | | | | | | | | | | | |
| | | | | | | 1,226,498,776 | | | | | | | | 2,415,230,287 | |
| | | | | | | | | | | | | | | | |
Reinvestment of distributions | | | | | | | | | | | | | | | | |
Class A | | | 1,280,447 | | | | 12,741,911 | | | | 1,894,689 | | | | 18,767,374 | |
Class C | | | 125,644 | | | | 1,250,279 | | | | 270,604 | | | | 2,680,019 | |
Administrator Class | | | 14,396 | | | | 143,537 | | | | 7,243 | 1 | | | 71,822 | 1 |
Institutional Class | | | 380,764 | | | | 3,795,057 | | | | 884,982 | | | | 8,782,642 | |
Investor Class | | | 1,949,615 | | | | 19,421,467 | | | | 4,094,138 | | | | 40,601,036 | |
| | | | | | | | | | | | | | | | |
| | | | | | | 37,352,251 | | | | | | | | 70,902,893 | |
| | | | | | | | | | | | | | | | |
Payment for shares redeemed | | | | | | | | | | | | | | | | |
Class A | | | (21,927,662 | ) | | | (218,248,480 | ) | | | (73,022,947 | ) | | | (723,655,270 | ) |
Class C | | | (2,582,171 | ) | | | (25,699,808 | ) | | | (7,030,133 | ) | | | (69,580,109 | ) |
Administrator Class | | | (1,211,845 | ) | | | (12,086,824 | ) | | | (3,481,434 | )1 | | | (34,388,718 | )1 |
Institutional Class | | | (18,857,768 | ) | | | (188,080,771 | ) | | | (45,092,382 | ) | | | (446,842,456 | ) |
Investor Class | | | (26,495,750 | ) | | | (264,003,295 | ) | | | (99,383,382 | ) | | | (984,706,842 | ) |
| | | | | | | | | | | | | | | | |
| | | | | | | (708,119,178 | ) | | | | | | | (2,259,173,395 | ) |
| | | | | | | | | | | | | | | | |
Net asset value of shares issued in acquisition | | | | | | | | | | | | | | | | |
Class A | | | 0 | | | | 0 | | | | 18,887,347 | | | | 186,998,133 | |
Class C | | | 0 | | | | 0 | | | | 1,703,061 | | | | 16,862,434 | |
| | | | | | | | | | | | | | | | |
| | | | | | | 0 | | | | | | | | 203,860,567 | |
| | | | | | | | | | | | | | | | |
Net increase in net assets resulting
from capital share transactions | | | | | | | 555,731,849 | | | | | | | | 430,820,352 | |
| | | | | | | | | | | | | | | | |
Total increase in net assets | | | | | | | 554,027,507 | | | | | | | | 447,716,642 | |
| | | | | | | | | | | | | | | | |
| | | | |
Net assets | | | | | | | | | | | | | | | | |
Beginning of period | | | | | | | 3,778,520,692 | | | | | | | | 3,330,804,050 | |
| | | | | | | | | | | | | | | | |
End of period | | | | | | $ | 4,332,548,199 | | | | | | | $ | 3,778,520,692 | |
| | | | | | | | | | | | | | | | |
Overdistributed net investment income | | | | | | $ | (166,626 | ) | | | | | | $ | (156,290 | ) |
| | | | | | | | | | | | | | | | |
| 1. | Class commenced operations on July 30, 2010. |
The accompanying notes are an integral part of these financial statements.
| | | | | | |
| Financial Highlights | | Wells Fargo Advantage Short-Term Municipal Bond Fund | | | 39 | |
(For a share outstanding throughout each period)
| | | | | | | | | | | | | | | | |
| | | Six Months Ended
December 31, 2011 (Unaudited) | | | Year Ended June 30, | |
| Class A | | | 2011 | | | 2010 | | | 20091 | |
Net asset value, beginning of period | | $ | 9.94 | | | $ | 9.88 | | | $ | 9.64 | | | $ | 9.70 | |
Net investment income | | | 0.11 | | | | 0.25 | | | | 0.27 | | | | 0.38 | |
Net realized and unrealized gains (losses) on investments | | | 0.01 | | | | 0.07 | | | | 0.24 | | | | (0.06 | ) |
| | | | | | | | | | | | | | | | |
Total from investment operations | | | 0.12 | | | | 0.32 | | | | 0.51 | | | | 0.32 | |
Distributions to shareholders from | | | | | | | | | | | | | | | | |
Net investment income | | | (0.11 | ) | | | (0.25 | ) | | | (0.27 | ) | | | (0.38 | ) |
Net realized gains | | | (0.01 | ) | | | (0.01 | ) | | | 0.00 | | | | 0.00 | |
| | | | | | | | | | | | | | | | |
Total distributions to shareholders | | | (0.12 | ) | | | (0.26 | ) | | | (0.27 | ) | | | (0.38 | ) |
Net asset value, end of period | | $ | 9.94 | | | $ | 9.94 | | | $ | 9.88 | | | $ | 9.64 | |
Total return2 | | | 1.23 | % | | | 3.21 | % | | | 5.37 | % | | | 3.39 | % |
Ratios to average net assets (annualized) | | | | | | | | | | | | | | | | |
Gross expenses | | | 0.78 | % | | | 0.79 | % | | | 0.80 | % | | | 0.87 | % |
Net expenses | | | 0.60 | % | | | 0.60 | % | | | 0.60 | % | | | 0.60 | % |
Net investment income | | | 2.23 | % | | | 2.48 | % | | | 2.59 | % | | | 4.14 | % |
Supplemental data | | | | | | | | | | | | | | | | |
Portfolio turnover rate | | | 46 | % | | | 75 | % | | | 78 | % | | | 101 | % |
Net assets, end of period (000’s omitted) | | | $1,310,044 | | | | $1,027,653 | | | | $794,709 | | | | $135,320 | |
| 1. | For the period from July 18, 2008 (commencement of class operations) to June 30, 2009. |
| 2. | Total return calculations do not include any sales charges. Returns for periods of less than one year are not annualized. |
The accompanying notes are an integral part of these financial statements.
| | | | |
| 40 | | Wells Fargo Advantage Short-Term Municipal Bond Fund | | Financial Highlights |
(For a share outstanding throughout each period)
| | | | | | | | | | | | | | | | | | | | | | | | |
| | | Six Months Ended
December 31, 2011 (Unaudited) | | | Year Ended June 30, | |
| Class C | | | 2011 | | | 2010 | | | 2009 | | | 2008 | | | 2007 | |
Net asset value, beginning of period | | $ | 9.94 | | | $ | 9.89 | | | $ | 9.64 | | | $ | 9.66 | | | $ | 9.73 | | | $ | 9.73 | |
Net investment income | | | 0.08 | | | | 0.17 | | | | 0.20 | | | | 0.32 | | | | 0.31 | | | | 0.28 | |
Net realized and unrealized gains (losses) on investments | | | 0.01 | | | | 0.06 | | | | 0.25 | | | | (0.02 | ) | | | (0.07 | ) | | | 0.00 | |
| | | | | | | | | | | | | | | | | | | | | | | | |
Total from investment operations | | | 0.09 | | | | 0.23 | | | | 0.45 | | | | 0.30 | | | | 0.24 | | | | 0.28 | |
Distributions to shareholders from | | | | | | | | | | | | | | | | | | | | | | | | |
Net investment income | | | (0.08 | ) | | | (0.17 | ) | | | (0.20 | ) | | | (0.32 | ) | | | (0.31 | ) | | | (0.28 | ) |
Net realized gains | | | (0.01 | ) | | | (0.01 | ) | | | 0.00 | | | | 0.00 | | | | 0.00 | | | | 0.00 | |
| | | | | | | | | | | | | | | | | | | | | | | | |
Total distributions to shareholders | | | (0.09 | ) | | | (0.18 | ) | | | (0.20 | ) | | | (0.32 | ) | | | (0.31 | ) | | | (0.28 | ) |
Net asset value, end of period | | $ | 9.94 | | | $ | 9.94 | | | $ | 9.89 | | | $ | 9.64 | | | $ | 9.66 | | | $ | 9.73 | |
Total return1 | | | 0.85 | % | | | 2.34 | % | | | 4.67 | % | | | 3.25 | % | | | 2.50 | % | | | 2.85 | % |
Ratios to average net assets (annualized) | | | | | | | | | | | | | | | | | | | | | | | | |
Gross expenses | | | 1.53 | % | | | 1.54 | % | | | 1.56 | % | | | 1.61 | % | | | 1.71 | % | | | 1.73 | % |
Net expenses | | | 1.35 | % | | | 1.35 | % | | | 1.35 | % | | | 1.36 | % | | | 1.55 | % | | | 1.55 | % |
Net investment income | | | 1.49 | % | | | 1.74 | % | | | 1.80 | % | | | 3.36 | % | | | 3.15 | % | | | 2.81 | % |
Supplemental data | | | | | | | | | | | | | | | | | | | | | | | | |
Portfolio turnover rate | | | 46 | % | | | 75 | % | | | 78 | % | | | 101 | % | | | 94 | % | | | 126 | % |
Net assets, end of period (000’s omitted) | | | $201,595 | | | | $201,870 | | | | $184,885 | | | | $21,599 | | | | $5,656 | | | | $2,847 | |
| 1. | Total return calculations do not include any sales charges. Returns for periods of less than one year are not annualized. |
The accompanying notes are an integral part of these financial statements.
| | | | | | |
| Financial Highlights | | Wells Fargo Advantage Short-Term Municipal Bond Fund | | | 41 | |
(For a share outstanding throughout each period)
| | | | | | | | |
| Administrator Class | | Six Months Ended
December 31, 2011
(Unaudited) | | | Year Ended
June 30, 20111 | |
Net asset value, beginning of period | | $ | 9.96 | | | $ | 9.94 | |
Net investment income | | | 0.11 | | | | 0.23 | |
Net realized and unrealized gains (losses) on investments | | | 0.01 | | | | 0.03 | |
| | | | | | | | |
Total from investment operations | | | 0.12 | | | | 0.26 | |
Distributions to shareholders from | | | | | | | | |
Net investment income | | | (0.11 | ) | | | (0.23 | ) |
Net realized gains | | | (0.01 | ) | | | (0.01 | ) |
| | | | | | | | |
Total distributions to shareholders | | | (0.12 | ) | | | (0.24 | ) |
Net asset value, end of period | | $ | 9.96 | | | $ | 9.96 | |
Total return2 | | | 1.23 | % | | | 2.58 | % |
Ratios to average net assets (annualized) | | | | | | | | |
Gross expenses | | | 0.72 | % | | | 0.65 | % |
Net expenses | | | 0.60 | % | | | 0.60 | % |
Net investment income | | | 2.23 | % | | | 2.56 | % |
Supplemental data | | | | | | | | |
Portfolio turnover rate | | | 46 | % | | | 75 | % |
Net assets, end of period (000’s omitted) | | | $84,579 | | | | $61,238 | |
| 1. | For the period from July 30, 2010 (commencement of class operations) to June 30, 2011. |
| 2. | Returns for periods of less than one year are not annualized. |
The accompanying notes are an integral part of these financial statements.
| | | | |
| 42 | | Wells Fargo Advantage Short-Term Municipal Bond Fund | | Financial Highlights |
(For a share outstanding throughout each period)
| | | | | | | | | | | | | | | | | | | | |
| | | Six Months Ended
December 31, 2011 (Unaudited) | | | Year Ended June 30, | |
| Institutional Class | | | 2011 | | | 2010 | | | 2009 | | | 20081 | |
Net asset value, beginning of period | | $ | 9.96 | | | $ | 9.90 | | | $ | 9.66 | | | $ | 9.68 | | | $ | 9.72 | |
Net investment income | | | 0.12 | | | | 0.27 | | | | 0.29 | | | | 0.41 | | | | 0.10 | |
Net realized and unrealized gains (losses) on investments | | | 0.00 | | | | 0.07 | | | | 0.24 | | | | (0.02 | ) | | | (0.04 | ) |
| | | | | | | | | | | | | | | | | | | | |
Total from investment operations | | | 0.12 | | | | 0.34 | | | | 0.53 | | | | 0.39 | | | | 0.06 | |
Distributions to shareholders from | | | | | | | | | | | | | | | | | | | | |
Net investment income | | | (0.12 | ) | | | (0.27 | ) | | | (0.29 | ) | | | (0.41 | ) | | | (0.10 | ) |
Net realized gains | | | (0.01 | ) | | | (0.01 | ) | | | 0.00 | | | | 0.00 | | | | 0.00 | |
| | | | | | | | | | | | | | | | | | | | |
Total distributions to shareholders | | | (0.13 | ) | | | (0.28 | ) | | | (0.29 | ) | | | (0.41 | ) | | | (0.10 | ) |
Net asset value, end of period | | $ | 9.95 | | | $ | 9.96 | | | $ | 9.90 | | | $ | 9.66 | | | $ | 9.68 | |
Total return2 | | | 1.23 | % | | | 3.41 | % | | | 5.58 | % | | | 4.21 | % | | | 0.66 | % |
Ratios to average net assets (annualized) | | | | | | | | | | | | | | | | | | | | |
Gross expenses | | | 0.45 | % | | | 0.46 | % | | | 0.46 | % | | | 0.55 | % | | | 0.54 | % |
Net expenses | | | 0.40 | % | | | 0.40 | % | | | 0.39 | % | | | 0.40 | % | | | 0.41 | % |
Net investment income | | | 2.44 | % | | | 2.70 | % | | | 2.76 | % | | | 4.15 | % | | | 4.35 | % |
Supplemental data | | | | | | | | | | | | | | | | | | | | |
Portfolio turnover rate | | | 46 | % | | | 75 | % | | | 78 | % | | | 101 | % | | | 94 | % |
Net assets, end of period (000’s omitted) | | | $822,826 | | | | $703,955 | | | | $359,155 | | | | $6,123 | | | | $10 | |
| 1. | For the period from March 31, 2008 (commencement of class operations) to June 30, 2008. |
| 2. | Returns for periods of less than one year are not annualized. |
The accompanying notes are an integral part of these financial statements.
| | | | | | |
| Financial Highlights | | Wells Fargo Advantage Short-Term Municipal Bond Fund | | | 43 | |
(For a share outstanding throughout each period)
| | | | | | | | | | | | | | | | | | | | | | | | |
| | | Six Months Ended
December 31, 2011 (Unaudited) | | | Year Ended June 30, | |
| Investor Class | | | 2011 | | | 2010 | | | 2009 | | | 2008 | | | 2007 | |
Net asset value, beginning of period | | $ | 9.95 | | | $ | 9.90 | | | $ | 9.65 | | | $ | 9.67 | | | $ | 9.74 | | | $ | 9.74 | |
Net investment income | | | 0.11 | | | | 0.24 | | | | 0.27 | | | | 0.39 | | | | 0.40 | | | | 0.36 | |
Net realized and unrealized gains (losses) on investments | | | 0.01 | | | | 0.06 | | | | 0.25 | | | | (0.02 | ) | | | (0.07 | ) | | | 0.00 | |
| | | | | | | | | | | | | | | | | | | | | | | | |
Total from investment operations | | | 0.12 | | | | 0.30 | | | | 0.52 | | | | 0.37 | | | | 0.33 | | | | 0.36 | |
Distributions to shareholders from | | | | | | | | | | | | | | | | | | | | | | | | |
Net investment income | | | (0.11 | ) | | | (0.24 | ) | | | (0.27 | ) | | | (0.39 | ) | | | (0.40 | ) | | | (0.36 | ) |
Net realized gains | | | (0.01 | ) | | | (0.01 | ) | | | 0.00 | | | | 0.00 | | | | 0.00 | | | | 0.00 | |
| | | | | | | | | | | | | | | | | | | | | | | | |
Total distributions to shareholders | | | (0.12 | ) | | | (0.25 | ) | | | (0.27 | ) | | | (0.39 | ) | | | (0.40 | ) | | | (0.36 | ) |
Net asset value, end of period | | $ | 9.95 | | | $ | 9.95 | | | $ | 9.90 | | | $ | 9.65 | | | $ | 9.67 | | | $ | 9.74 | |
Total return1 | | | 1.22 | % | | | 3.07 | % | | | 5.41 | % | | | 3.98 | % | | | 3.43 | % | | | 3.76 | % |
Ratios to average net assets (annualized) | | | | | | | | | | | | | | | | | | | | | | | | |
Gross expenses | | | 0.81 | % | | | 0.82 | % | | | 0.86 | % | | | 0.92 | % | | | 1.10 | % | | | 1.15 | % |
Net expenses | | | 0.63 | % | | | 0.63 | % | | | 0.66 | % | | | 0.66 | % | | | 0.66 | % | | | 0.66 | % |
Net investment income | | | 2.20 | % | | | 2.45 | % | | | 2.63 | % | | | 4.10 | % | | | 4.06 | % | | | 3.70 | % |
Supplemental data | | | | | | | | | | | | | | | | | | | | | | | | |
Portfolio turnover rate | | | 46 | % | | | 75 | % | | | 78 | % | | | 101 | % | | | 94 | % | | | 126 | % |
Net assets, end of period (000’s omitted) | | | $1,913,505 | | | | $1,783,805 | | | | $1,992,055 | | | | $1,019,054 | | | | $796,199 | | | | $674,631 | |
| 1. | Returns for periods of less than one year are not annualized. |
The accompanying notes are an integral part of these financial statements.
| | | | |
| 44 | | Wells Fargo Advantage Short-Term Municipal Bond Fund | | Notes to Financial Statements (Unaudited) |
1. ORGANIZATION
Wells Fargo Funds Trust (the “Trust”), a Delaware statutory trust organized on March 10, 1999, is an open-end management investment company registered under the Investment Company Act of 1940, as amended (the “1940 Act”). These financial statements report on Wells Fargo Advantage Short-Term Municipal Bond Fund (the “Fund”) which is a diversified series of the Trust.
2. SIGNIFICANT ACCOUNTING POLICIES
The following significant accounting policies, which are consistently followed in the preparation of the financial statements of the Fund, are in conformity with U.S. generally accepted accounting principles which require management to make estimates and assumptions that affect the reported amounts of assets and liabilities, disclosure of contingent assets and liabilities at the date of the financial statements, and the reported amounts of revenues and expenses during the reporting period. Actual results could differ from those estimates.
Securities valuation
Fixed income securities with maturities exceeding 60 days are valued based on available evaluated prices received from an independent pricing service approved by the Board of Trustees which may utilize both transaction data and market information such as yield, prices of securities of comparable quality, coupon rate, maturity, type of issue, trading characteristics and other market data. If valuations are not available from the pricing service or values received are deemed not representative of market value, values will be obtained from a third party broker-dealer or determined based on the Fund’s Fair Value Procedures.
Debt securities of sufficient credit quality with original maturities of 60 days or less generally are valued at amortized cost which approximates fair value. The amortized cost method involves valuing a security at its cost, plus accretion of discount or minus amortization of premium over the period until maturity.
Investments in open-end mutual funds and non-registered investment companies are generally valued at net asset value.
Investments which are not valued using any of the methods discussed above, are valued at their fair value, as determined by procedures established in good faith and approved by the Board of Trustees.
When-issued transactions
The Fund may purchase securities on a forward commitment or ‘when-issued’ basis. The Fund records a when-issued transaction on the trade date and will segregate assets to cover its obligation by confirming the availability of qualifying assets having a value sufficient to make payment for the securities purchased. Securities purchased on a when-issued basis are marked-to-market daily and the Fund begins earning interest on the settlement date. Losses may arise due to changes in the market value of the underlying securities or if the counterparty does not perform under the contract.
Futures contracts
The Fund may be subject to interest rate risk in the normal course of pursuing its investment objectives. The Fund may buy and sell futures contracts in order to gain exposure to, or protect against, changes in security values and interest rates. The primary risks associated with the use of futures contracts are the imperfect correlation between changes in market values of securities held by the Fund and the prices of futures contracts, and the possibility of an illiquid market.
Futures contracts are valued based upon their quoted daily settlement prices when available. The aggregate principal amounts of the contracts are not recorded in the financial statements. Fluctuations in the value of the contracts are recorded in the Statement of Assets and Liabilities as an asset or liability and in the Statement of Operations as unrealized gains or losses until the contracts are closed, at which point they are recorded as net realized gains or losses on futures contracts. With futures contracts, there is minimal counterparty risk to the Fund since futures are exchange traded and the exchange’s clearinghouse, as counterparty to all exchange traded futures, guarantees the futures against default.
Security transactions and income recognition
Securities transactions are recorded on a trade date basis. Realized gains or losses are reported on the basis of identified cost of securities delivered.
Interest income is accrued daily and bond discounts are accreted and premiums are amortized daily based on the effective interest method. To the extent debt obligations are placed on non-accrual status, any related interest income
| | | | | | |
| Notes to Financial Statements (Unaudited) | | Wells Fargo Advantage Short-Term Municipal Bond Fund | | | 45 | |
may be reduced by writing off interest receivables when the collection of all or a portion of interest has become doubtful based on consistently applied procedures. If the issuer subsequently resumes interest payments or when the collectability of interest is reasonably assured, the debt obligation is removed from non-accrual status.
Distributions to shareholders
Distributions to shareholders from net investment income are accrued daily and paid monthly. Distributions from net realized gains, if any, are recorded on the ex-dividend date. Such distributions are determined in conformity with income tax regulations, which may differ from generally accepted accounting principles.
Federal and other taxes
The Fund intends to continue to qualify as a regulated investment company by distributing substantially all of its investment company taxable and tax-exempt income and any net realized capital gains (after reduction for capital loss carryforwards) sufficient to relieve it from all, or substantially all, federal income taxes. Accordingly, no provision for federal income taxes was required.
The Fund’s income and federal excise tax returns and all financial records supporting those returns for the prior three fiscal years are subject to examination by the federal and Delaware revenue authorities.
Under the recently enacted Regulated Investment Company Modernization Act of 2010, the Fund is permitted to carry forward capital losses incurred in taxable years which began after December 22, 2010 for an unlimited period. However, any losses incurred are required to be utilized prior to the losses incurred in pre-enactment taxable years. As a result of this ordering rule, pre-enactment capital loss carryforwards may be more likely to expire unused. Additionally, post-enactment capital losses that are carried forward will retain their character as either short-term or long-term capital losses rather than being considered all short-term as under previous law.
As of June 30, 2011, the Fund had net capital loss carryforwards, which were available to offset future net realized capital gains, in the amount of $1,603,258 with $1,165,493 expiring in 2016 and $437,765 expiring in 2017.
Class allocations
The separate classes of shares offered by the Fund differ principally in applicable sales charges, distribution, shareholder servicing and administration fees. Shareholders of each class bear certain expenses that pertain to that particular class. All shareholders bear the common expenses of the Fund, earn income from the portfolio, and are allocated unrealized gains and losses pro rata based on the average daily net assets of each class, without distinction between share classes. Dividends are determined separately for each class based on income and expenses allocable to each class. Realized gains and losses are allocated to each class pro rata based upon the net assets of each class on the date realized. Differences in per share dividend rates generally result from the relative weightings of pro rata income and realized gain allocations and from differences in separate class expenses, including distribution, shareholder servicing and administration fees.
3. FAIR VALUATION MEASUREMENTS
Fair value measurements of investments are determined within a framework that has established a fair value hierarchy based upon the various data inputs utilized in determining the value of the Fund’s investments. The three-level hierarchy gives the highest priority to unadjusted quoted prices in active markets for identical assets or liabilities (Level 1) and the lowest priority to significant unobservable inputs (Level 3). The Fund’s investments are classified within the fair value hierarchy based on the lowest level of input that is significant to the fair value measurement. The inputs are summarized into three broad levels as follows:
| n | | Level 1 – quoted prices in active markets for identical securities |
| n | | Level 2 – other significant observable inputs (including quoted prices for similar securities, interest rates, prepayment speeds, credit risk, etc.) |
| n | | Level 3 – significant unobservable inputs (including the Fund’s own assumptions in determining the fair value of investments) |
The inputs or methodologies used for valuing securities are not necessarily an indication of the risk associated with investing in those securities.
| | | | |
| 46 | | Wells Fargo Advantage Short-Term Municipal Bond Fund | | Notes to Financial Statements (Unaudited) |
As of December 31, 2011, the inputs used in valuing the Fund’s assets, which are carried at fair value, were as follows:
| | | | | | | | | | | | | | | | |
| Investments in Securities | | Quoted Prices (Level 1) | | | Significant Other
Observable Inputs (Level 2) | | | Significant Unobservable Inputs (Level 3) | | | Total | |
Municipal bonds and notes | | $ | 0 | | | $ | 4,039,342,574 | | | $ | 89,041,153 | | | $ | 4,128,383,727 | |
Short-term investments | | | | | | | | | | | | | | | | |
Investment companies | | | 26,609,751 | | | | 0 | | | | 0 | | | | 26,609,751 | |
U.S. Treasury securities | | | 1,399,950 | | | | 0 | | | | 0 | | | | 1,399,950 | |
| | | $ | 28,009,701 | | | $ | 4,039,342,574 | | | $ | 89,041,153 | | | $ | 4,156,393,428 | |
Further details on the major security types can be found in the Portfolio of Investments.
As of December 31, 2011, the inputs used in valuing the Fund’s other financial instruments, which are carried at fair value, were as follows:
| | | | | | | | | | | | | | | | |
| Other financial instruments | | Quoted Prices (Level 1) | | | Significant Other
Observable Inputs (Level 2) | | | Significant Unobservable Inputs (Level 3) | | | Total | |
Futures contracts+ | | $ | (812,187 | ) | | $ | 0 | | | $ | 0 | | | $ | (812,187 | ) |
| + | Futures contracts are presented at the unrealized gains or losses on the instrument. |
Transfers in and transfers out are recognized at the end of the reporting period. For the six months ended December 31, 2011, the Fund did not have any significant transfers into/out of Level 1 and Level 2.
The following is a reconciliation of assets in which significant unobservable inputs (Level 3) were used in determining fair value:
| | | | |
| | | Municipal
bonds and
notes | |
Balance as of June 30, 2011 | | $ | 64,186,304 | |
Accrued discounts (premiums) | | | 249,917 | |
Realized gains (losses) | | | 812,874 | |
Change in unrealized gains (losses) | | | (328,067 | ) |
Purchases | | | 53,540,125 | |
Sales | | | (29,420,000 | ) |
Transfers into Level 3 | | | 0 | |
Transfers out of Level 3 | | | 0 | |
Balance as of December 31, 2011 | | $ | 89,041,153 | |
Change in unrealized gains (losses)
relating to securities still held at December 31, 2011 | | $ | 329,724 | |
4. TRANSACTIONS WITH AFFILIATES AND OTHER EXPENSES
Advisory fee
The Trust has entered into an advisory contract with Wells Fargo Funds Management, LLC (“Funds Management”), an indirect wholly owned subsidiary of Wells Fargo & Company (“Wells Fargo”). The adviser is responsible for implementing investment policies and guidelines and for supervising the sub-adviser, who is responsible for day-to-day portfolio management of the Fund.
Pursuant to the contract, Funds Management is entitled to receive an annual advisory fee starting at 0.35% and declining to 0.25% as the average daily net assets of the Fund increase. For the six months ended December 31, 2011, the advisory fee was equivalent to an annual rate of 0.30% of the Fund’s average daily net assets.
Funds Management may retain the services of certain sub-advisers to provide daily portfolio management to the Fund. The fees related to sub-advisory services are borne directly by Funds Management and do not increase the overall fees
| | | | | | |
| Notes to Financial Statements (Unaudited) | | Wells Fargo Advantage Short-Term Municipal Bond Fund | | | 47 | |
paid by the Fund. Wells Capital Management Incorporated, an affiliate of Funds Management, is the sub-adviser to the Fund and is entitled to receive a fee from Funds Management at an annual rate starting at 0.15% and declining to 0.05% as the average daily net assets of the Fund increase.
Administration and transfer agent fees
The Trust has entered into an administration agreement with Funds Management. Under this agreement, for providing administrative services, which includes paying fees and expenses for services provided by the transfer agent, sub-transfer agents, omnibus account servicers and record-keepers, Funds Management is entitled to receive from the Fund an annual fund level administration fee starting at 0.05% and declining to 0.03% as the average daily net assets of the Fund increase and a class level administration fee which is calculated based on the average daily net assets of each class as follows:
| | | | |
| | | Class Level Administration Fee | |
Class A, Class C | | | 0.16 | % |
Administrator Class | | | 0.10 | |
Institutional Class | | | 0.08 | |
Investor Class | | | 0.19 | |
Funds Management has contractually waived and/or reimbursed advisory and administration fees to the extent necessary to maintain certain net operating expense ratios for the Fund. Waiver of fees and/or reimbursement of expenses by Funds Management were made first from fund level expenses on a proportionate basis and then from class specific expenses.
Distribution fees
The Trust has adopted a Distribution Plan for Class C shares of the Fund pursuant to Rule 12b-1 under the 1940 Act. Distribution fees are charged to Class C shares and paid to Wells Fargo Funds Distributor, LLC, the principal underwriter, at an annual rate of 0.75% of the average daily net assets of Class C shares.
For the six months ended December 31, 2011, Wells Fargo Funds Distributor, LLC received $10,711 from the sale of Class A shares and $11,822 and $10,178 in contingent deferred sales charges from redemptions of Class A and Class C shares, respectively.
Shareholder servicing fees
The Trust has entered into contracts with one or more shareholder servicing agents, whereby Class A, Class C, Administrator Class and Investor Class of the Fund is charged a fee at an annual rate of 0.25% of the average daily net assets of each respective class.
A portion of these total shareholder servicing fees were paid to affiliates of Wells Fargo.
5. INVESTMENT PORTFOLIO TRANSACTIONS
Purchases and sales of investments, excluding U.S. Government obligations (if any) and short-term securities (securities with maturities of one year or less at purchase date), for the six months ended December 31, 2011 were $2,320,831,880 and $1,827,332,739, respectively.
6. DERIVATIVE TRANSACTIONS
During the six months ended December 31, 2011, the Fund entered into futures contracts to take advantage of the differences between municipal and treasury yields and to help shorten duration of the portfolio.
At December 31, 2011, the Fund had short futures contracts outstanding as follows:
| | | | | | | | | | | | |
| Expiration Date | | Contracts | | Type | | Contract Value at December 31,
2011 | | | Unrealized
Gains (Losses) | |
| March 2012 | | 1,480 Short | | 5-Year U.S. Treasury Notes | | $ | 182,421,563 | | | $ | (812,187 | ) |
| | | | |
| 48 | | Wells Fargo Advantage Short-Term Municipal Bond Fund | | Notes to Financial Statements (Unaudited) |
The Fund had an average notional amount of $180,961,861 in short futures contracts during the six months ended December 31, 2011.
On December 31, 2011, the cumulative unrealized losses on futures contracts in the amount of $812,187 is reflected in net unrealized gains on investments on the Statement of Assets and Liabilities. The payable for daily variation margin on open futures contracts reflected in the Statement of Assets and Liabilities only represents the current day’s variation margin. The realized losses and change in unrealized gains (losses) on futures contracts are reflected in the Statement of Operations.
7. ACQUISITION
After the close of business on July 9, 2010, the Fund acquired the net assets of Evergreen Short-Intermediate Municipal Bond Fund. The purpose of the transaction was to combine two funds with similar investment objectives and strategies. Shareholders holding Class A, Class B, Class C and Class I shares of Evergreen Short Intermediate Municipal Bond Fund received Class A, Class A, Class C and Class A shares, respectively, of the Fund in the reorganization. The acquisition was accomplished by a tax-free exchange of all of the shares of Evergreen Short-Intermediate Municipal Bond Fund for 20,590,408 shares of the Fund valued at $203,860,567 at an exchange ratio of 1.02 for each class of shares. The investment portfolio of Evergreen Short-Intermediate Municipal Bond Fund with a fair value of $202,048,984, identified cost of $199,475,675 and unrealized gains of $2,573,309 at July 9, 2010 were the principal assets acquired by the Fund. The aggregate net assets of Evergreen Short-Intermediate Municipal Bond Fund and the Fund immediately prior to the acquisition were $203,860,567 and $3,383,261,471, respectively. The aggregate net assets of the Fund immediately after the acquisition were $3,587,122,038. For financial reporting purposes, assets received and shares issued by the Fund were recorded at fair value; however, the cost basis of the investments received from Evergreen Short-Intermediate Municipal Bond Fund was carried forward to align ongoing reporting of the Fund’s realized and unrealized gains and losses with amounts distributable to shareholders for tax purposes.
Assuming the acquisition had been completed July 1, 2010, the beginning of the annual reporting period for the Fund, the pro forma results of operations for the year ended June 30, 2011 would have been:
| | | | |
Net investment income | | $ | 91,282,996 | |
Net realized and unrealized gains (losses) on investments | | $ | 17,298,866 | |
Net increase in net assets resulting from operations | | $ | 108,581,862 | |
8. BANK BORROWINGS
The Trust (excluding the money market funds) and Wells Fargo Variable Trust are parties to a $150,000,000 revolving credit agreement with State Street Bank and Trust Company, whereby the Fund is permitted to use bank borrowings for temporary or emergency purposes, such as to fund shareholder redemption requests. Interest under the credit agreement is charged to the Fund based on a borrowing rate equal to the higher of the Federal Funds rate in effect on that day plus 1.25% or the overnight LIBOR rate in effect on that day plus 1.25%. In addition, under the credit agreement, the Fund pays an annual commitment fee equal to 0.10% of the unused balance, which is allocated pro rata. Prior to September 6, 2011, the revolving credit agreement was for $125,000,000 and the annual commitment fee paid by the Fund was 0.125% of the unused balance. For the six months ended December 31, 2011, the Fund paid $2,745 in commitment fees.
For the six months ended December 31, 2011, there were no borrowings by the Fund under the agreement.
9. INDEMNIFICATION
Under the Trust’s organizational documents, the officers and directors are indemnified against certain liabilities that may arise out of performance of their duties to the Trust. Additionally, in the normal course of business, the Trust may enter into contracts with service providers that contain a variety of indemnification clauses. The Trust’s maximum exposure under these arrangements is dependent on future claims that may be made against the Fund and, therefore, cannot be estimated.
| | | | | | |
| Notes to Financial Statements (Unaudited) | | Wells Fargo Advantage Short-Term Municipal Bond Fund | | | 49 | |
10. NEW ACCOUNTING PRONOUNCEMENTS
In May 2011, the Financial Accounting Standards Board (“FASB”) issued Accounting Standards Update (“ASU”) No. 2011-04 “Amendments to Achieve Common Fair Value Measurement and Disclosure Requirements in U.S. GAAP and IFRSs”. ASU No. 2011-04 amends FASB ASC Topic 820, Fair Value Measurements and Disclosures, to establish common requirements for measuring fair value and for disclosing information about fair value measurements in accordance with GAAP. The ASU is effective prospectively for interim and annual periods beginning after December 15, 2011. Management expects that adoption of the ASU will result in additional disclosures in the financial statements, as applicable.
In April 2011, FASB issued ASU No. 2011-03 “Reconsideration of Effective Control for Repurchase Agreements”. ASU No. 2011-03 amends FASB ASC Topic 860, Transfers and Servicing, specifically the criteria required to determine whether a repurchase agreement (repo) and similar agreements should be accounted for as sales of financial assets or secured borrowings with commitments. ASU No. 2011-03 changes the assessment of effective control by focusing on the transferor’s contractual rights and obligations and removing the criterion to assess its ability to exercise those rights or honor those obligations. This could result in changes to the way entities account for certain transactions including repurchase agreements, mortgage dollar rolls and reverse repurchase agreements. The ASU will become effective on a prospective basis for new transfers and modifications to existing transactions as of the beginning of the first interim or annual period beginning on or after December 15, 2011. Management has evaluated the impact of adopting the ASU and expects no significant changes.
| | | | |
| 50 | | Wells Fargo Advantage Short-Term Municipal Bond Fund | | Other Information (Unaudited) |
PROXY VOTING INFORMATION
A description of the policies and procedures that the Fund uses to determine how to vote proxies relating to portfolio securities is available without charge, upon request, by calling 1-800-222-8222, visiting our Web site at www.wellsfargo.com/advantagefunds, or visiting the SEC Web site at www.sec.gov. Information regarding how the Fund voted proxies relating to portfolio securities during the most recent 12-month period ended June 30 is available without charge on the Fund’s Web site at www.wellsfargo.com/advantagefunds or by visiting the SEC Web site at www.sec.gov.
PORTFOLIO HOLDINGS INFORMATION
The complete portfolio holdings for the Fund are publicly available on the Fund’s Web site (www.wellsfargo.com/advantagefunds) on a monthly, 30-day or more delayed basis. In addition, top ten holdings information for the Fund is publicly available on the Fund’s Web site on a monthly, seven-day or more delayed basis. The Fund files its complete schedule of portfolio holdings with the SEC for the first and third quarters of each fiscal year on Form N-Q, which is available without charge by visiting the SEC Web site at www.sec.gov. In addition, the Fund’s Form N-Q may be reviewed and copied at the SEC’s Public Reference Room in Washington, DC, and at regional offices in New York City, at 233 Broadway, and in Chicago, at 175 West Jackson Boulevard, Suite 900. Information about the Public Reference Room may be obtained by calling 1-800-SEC-0330.
| | | | | | |
| Other Information (Unaudited) | | Wells Fargo Advantage Short-Term Municipal Bond Fund | | | 51 | |
BOARD OF TRUSTEES
The following table provides basic information about the Board of Trustees (the “Trustees”) of the Trust and Officers of the Trust. This table should be read in conjunction with the Prospectus and the Statement of Additional Information1 of the Fund. Each of the Trustees and Officers listed below acts in identical capacities for the Wells Fargo Advantage family of funds, which consists of 138 funds comprising the Wells Fargo Funds Trust, Wells Fargo Variable Trust, Wells Fargo Master Trust and four closed-end funds (collectively the “Fund Complex”). All of the Trustees are also Members of the Audit and Governance Committees of each Trust in the Fund Complex. The mailing address of each Trustee and Officer is 525 Market Street, 12th Floor, San Francisco, CA 94105. Each Trustee and Officer serves an indefinite term, however, each Trustee serves such term until reaching the mandatory retirement age established by the Trustees.
Independent Trustees
| | | | | | |
Name and Year of Birth | | Position Held and Length of Service | | Principal Occupations During Past Five Years | | Other Directorships During
Past Five Years |
Peter G. Gordon
(Born 1942) | | Trustee, since 1998; Chairman, since 2005 (Lead Trustee since 2001) | | Co-Founder, Retired Chairman, President and CEO of Crystal Geyser Water Company. Trustee Emeritus, Colby College | | Asset Allocation Trust |
Isaiah Harris, Jr.
(Born 1952) | | Trustee, since 2009 | | Retired. Prior thereto, President and CEO of BellSouth Advertising and Publishing Corp. from 2005 to 2007, President and CEO of BellSouth Enterprises from 2004 to 2005 and President of BellSouth Consumer Services from 2000 to 2003. Emeritus member of the Iowa State University Foundation Board of Governors. Emeritus Member of the Advisory Board of Iowa State University School of Business. Mr. Harris is a certified public accountant. | | CIGNA Corporation; Deluxe Corporation; Asset Allocation Trust |
Judith M. Johnson
(Born 1949) | | Trustee, since 2008 | | Retired. Prior thereto, Chief Executive Officer and Chief Investment Officer of Minneapolis Employees Retirement Fund from 1996 to 2008. Ms. Johnson is an attorney, certified public accountant and a certified managerial accountant. | | Asset Allocation Trust |
Leroy Keith, Jr.
(Born 1939) | | Trustee, since 2010 | | Chairman, Bloc Global Services (development and construction). Trustee of the Evergreen Funds from 1983 to 2010. Former Managing Director, Almanac Capital Management (commodities firm), former Partner, Stonington Partners, Inc. (private equity fund), former Director, Obagi Medical Products Co. and former Director, Lincoln Educational Services. | | Trustee, Virtus Fund Complex (consisting of 40 portfolios as of 12/31/11); Asset Allocation Trust |
David F. Larcker
(Born 1950) | | Trustee, since 2009 | | James Irvin Miller Professor of Accounting at the Graduate School of Business, Stanford University, Director of Corporate Governance Research Program and Senior Faculty of The Rock Center for Corporate Governance since 2006. From 2005 to 2008, Professor of Accounting at the Graduate School of Business, Stanford University. Prior thereto, Ernst & Young Professor of Accounting at The Wharton School, University of Pennsylvania from 1985 to 2005. | | Asset Allocation Trust |
Olivia S. Mitchell
(Born 1953) | | Trustee, since 2006 | | International Foundation of Employee Benefit Plans Professor, Wharton School of the University of Pennsylvania since 1993. Director of Wharton’s Pension Research Council and Boettner Center on Pensions & Retirement Research, and Research Associate at the National Bureau of Economic Research. Previously, Cornell University Professor from 1978 to 1993. | | Asset Allocation Trust |
| | | | |
| 52 | | Wells Fargo Advantage Short-Term Municipal Bond Fund | | Other Information (Unaudited) |
| | | | | | |
Name and Year of Birth | | Position Held and Length of Service | | Principal Occupations During Past Five Years | | Other Directorships During
Past Five Years |
Timothy J. Penny
(Born 1951) | | Trustee, since 1996 | | President and CEO of Southern Minnesota Initiative Foundation, a non-profit organization, since 2007 and Senior Fellow at the Humphrey Institute Policy Forum at the University of Minnesota since 1995. Member of the Board of Trustees of NorthStar Education Finance, Inc., a non-profit organization, since 2007. | | Asset Allocation Trust |
Michael S. Scofield
(Born 1943) | | Trustee, since 2010 | | Served on the Investment Company Institute’s Board of Governors and Executive Committee from 2008-2011 as well the Governing Council of the Independent Directors Council from 2006-2011 and the Independent Directors Council Executive Committee from 2008-2011. Chairman of the IDC from 2008-2010. Institutional Investor (Fund Directions) Trustee of Year in 2007. Trustee of the Evergreen Funds (and its predecessors) from 1984 to 2010. Chairman of the Evergreen Funds from 2000-2010. Former Trustee of the Mentor Funds. Retired Attorney, Law Offices of Michael S. Scofield and former Director and Chairman, Branded Media Corporation (multi-media branding company). | | Asset Allocation Trust |
Donald C. Willeke
(Born 1940) | | Trustee, since 1996 | | Principal of the law firm of Willeke & Daniels. General Counsel of the Minneapolis Employees Retirement Fund from 1984 until its consolidation into the Minnesota Public Employees Retirement Association on June 30, 2010. Director and Vice Chair of The Free Trust (non-profit corporation). Director of the American Chestnut Foundation (non-profit corporation). | | Asset Allocation Trust |
Officers
| | | | | | |
Name and Year of Birth | | Position Held and
Length of Service | | Principal Occupations During Past Five Years | | |
Karla M. Rabusch
(Born 1959) | | President, since 2003 | | Executive Vice President of Wells Fargo Bank, N.A. and President of Wells Fargo Funds Management, LLC since 2003. Senior Vice President and Chief Administrative Officer of Wells Fargo Funds Management, LLC from 2001 to 2003. | | |
C. David Messman
(Born 1960) | | Secretary, since 2000; Chief Legal Counsel, since 2003 | | Senior Vice President and Secretary of Wells Fargo Funds Management, LLC since 2001. Vice President and Managing Senior Counsel of Wells Fargo Bank, N.A. since 1996. | | |
Kasey Phillips
(Born 1970) | | Treasurer, since 2009 | | Senior Vice President of Wells Fargo Funds Management, LLC since 2009. Senior Vice President of Evergreen Investment Management Company, LLC from 2006 to 2010. Treasurer of the Evergreen Funds from 2005 to 2010. | | |
David Berardi
(Born 1975) | | Assistant Treasurer, since 2009 | | Vice President of Wells Fargo Funds Management, LLC since 2009. Vice President of Evergreen Investment Management Company, LLC from 2008 to 2010. Assistant Vice President of Evergreen Investment Services, Inc. from 2004 to 2008. Manager of Fund Reporting and Control for Evergreen Investment Management Company, LLC from 2004 to 2010. | | |
Jeremy DePalma
(Born 1974) | | Assistant Treasurer, since 2009 | | Senior Vice President of Wells Fargo Funds Management, LLC since 2009. Senior Vice President of Evergreen Investment Management Company, LLC from 2008 to 2010. Vice President, Evergreen Investment Services, Inc. from 2004 to 2007. Head of the Fund Reporting and Control Team within Fund Administration from 2005 to 2010. | | |
Debra Ann Early
(Born 1964) | | Chief Compliance Officer, since 2007 | | Chief Compliance Officer of Wells Fargo Funds Management, LLC since 2007. Chief Compliance Officer of Parnassus Investments from 2005 to 2007. Chief Financial Officer of Parnassus Investments from 2004 to 2007 and Senior Audit Manager of PricewaterhouseCoopers LLP from 1998 to 2004. | | |
| 1. | The Statement of Additional Information includes additional information about the Trustees and is available, without charge, upon request, by calling 1-800-222-8222 or by visiting the Web site at www.wellsfargo.com/advantagefunds. |
| | | | | | |
| List of Abbreviations | | Wells Fargo Advantage Short-Term Municipal Bond Fund | | | 53 | |
The following is a list of common abbreviations for terms and entities which may have appeared in this report.
| ACB | — Agricultural Credit Bank |
| ADR | — American Depository Receipt |
| ADS | — American Depository Shares |
| AGC-ICC | — Assured Guaranty Corporation - Insured Custody Certificates |
| AGM | — Assured Guaranty Municipal |
| AMBAC | — American Municipal Bond Assurance Corporation |
| AMT | — Alternative Minimum Tax |
| BAN | — Bond Anticipation Notes |
| BHAC | — Berkshire Hathaway Assurance Corporation |
| CAB | — Capital Appreciation Bond |
| CCAB | — Convertible Capital Appreciation Bond |
| CDA | — Community Development Authority |
| CDO | ��� Collateralized Debt Obligation |
| COP | — Certificate of Participation |
| DRIVER | — Derivative Inverse Tax-Exempt Receipts |
| DW&P | — Department of Water & Power |
| DWR | — Department of Water Resources |
| ECFA | — Educational & Cultural Facilities Authority |
| EDA | — Economic Development Authority |
| EDFA | — Economic Development Finance Authority |
| ETF | — Exchange-Traded Fund |
| FFCB | — Federal Farm Credit Bank |
| FGIC | — Financial Guaranty Insurance Corporation |
| FHA | — Federal Housing Authority |
| FHLB | — Federal Home Loan Bank |
| FHLMC | — Federal Home Loan Mortgage Corporation |
| FNMA | — Federal National Mortgage Association |
| GDR | — Global Depository Receipt |
| GNMA | — Government National Mortgage Association |
| HCFR | — Healthcare Facilities Revenue |
| HEFA | — Health & Educational Facilities Authority |
| HEFAR | — Higher Education Facilities Authority Revenue |
| HFA | — Housing Finance Authority |
| HFFA | — Health Facilities Financing Authority |
| IBC | — Insured Bond Certificate |
| IDA | — Industrial Development Authority |
| IDAG | — Industrial Development Agency |
| IDR | — Industrial Development Revenue |
| KRW | — Republic of Korea Won |
| LIBOR | — London Interbank Offered Rate |
| LLC | — Limited Liability Company |
| LLP | — Limited Liability Partnership |
| MBIA | — Municipal Bond Insurance Association |
| MFHR | — Multi-Family Housing Revenue |
| MSTR | — Municipal Securities Trust Receipts |
| MUD | — Municipal Utility District |
| NATL-RE | — National Public Finance Guarantee Corporation |
| PCFA | — Pollution Control Finance Authority |
| PCR | — Pollution Control Revenue |
| PFA | — Public Finance Authority |
| PFFA | — Public Facilities Financing Authority |
| PFOTER | — Puttable Floating Option Tax-Exempt Receipts |
| plc | — Public Limited Company |
| PUTTER | — Puttable Tax-Exempt Receipts |
| R&D | — Research & Development |
| RDA | — Redevelopment Authority |
| RDFA | — Redevelopment Finance Authority |
| REIT | — Real Estate Investment Trust |
| ROC | — Reset Option Certificates |
| SAVRS | — Select Auction Variable Rate Securities |
| SBA | — Small Business Authority |
| SFHR | — Single Family Housing Revenue |
| SFMR | — Single Family Mortgage Revenue |
| SPDR | — Standard & Poor’s Depositary Receipts |
| TAN | — Tax Anticipation Notes |
| TIPS | — Treasury Inflation-Protected Securities |
| TRAN | — Tax Revenue Anticipation Notes |
| TCR | — Transferable Custody Receipts |
| TTFA | — Transportation Trust Fund Authority |
| TVA | — Tennessee Valley Authority |
| XLCA | — XL Capital Assurance |
This page is intentionally left blank.


FOR MORE INFORMATION
More information about Wells Fargo Advantage Funds is available free upon request. To obtain literature, please write, e-mail, visit the Fund’s Web site, or call:
Wells Fargo Advantage Funds
P.O. Box 8266
Boston, MA 02266-8266
E-mail: wfaf@wellsfargo.com
Web site: www.wellsfargo.com/advantagefunds
Individual investors: 1-800-222-8222
Retail investment professionals: 1-888-877-9275
Institutional investment professionals: 1-866-765-0778
This report and the financial statements contained herein are submitted for the general information of the shareholders of Wells Fargo Advantage Funds. If this report is used for promotional purposes, distribution of the report must be accompanied or preceded by a current prospectus. For a prospectus containing more complete information, including charges and expenses, call 1-800-222-8222 or visit the Fund’s Web site at www.wellsfargo.com/advantagefunds. Please consider the investment objectives, risks, charges, and expenses of the investment carefully before investing. This and other information about Wells Fargo Advantage Funds can be found in the current prospectus. Read the prospectus carefully before you invest or send money.
Wells Fargo Funds Management, LLC, a wholly owned subsidiary of Wells Fargo & Company, provides investment advisory and administrative services for Wells Fargo Advantage Funds. Other affiliates of Wells Fargo & Company provide subadvisory and other services for the Funds. The Funds are distributed by Wells Fargo Funds Distributor, LLC, Member FINRA/SIPC, an affiliate of Wells Fargo & Company.
NOT FDIC INSURED ¡ NO BANK GUARANTEE ¡ MAY LOSE VALUE
© 2012 Wells Fargo Funds Management, LLC. All rights reserved.
| | |
 | | 207590 02-12 SA256/SAR256 12-11 |

Wells Fargo Advantage Strategic Municipal Bond Fund

Semi-Annual Report
December 31, 2011

Reduce clutter. Save trees.
Sign up for electronic delivery of prospectuses and shareholder reports at www.wellsfargo.com/advantagedelivery
Contents
The views expressed and any forward-looking statements are as of December 31, 2011, unless otherwise noted, and are those of the Fund managers and/or Wells Fargo Funds Management, LLC. Discussions of individual securities, or the markets generally, or any Wells Fargo Advantage Fund are not intended as individual recommendations. Future events or results may vary significantly from those expressed in any forward-looking statements; the views expressed are subject to change at any time in response to changing circumstances in the market. Wells Fargo Funds Management, LLC, disclaims any obligation to publicly update or revise any views expressed or forward-looking statements.
NOT FDIC INSURED ¡ NO BANK GUARANTEE ¡ MAY LOSE VALUE

WELLS FARGO INVESTMENT HISTORY
| | |
| |
| 1932 | | Keystone creates one of the first mutual fund families. |
| |
| 1971 | | Wells Fargo & Company introduces one of the first institutional index funds. |
| |
| 1978 | | Wells Fargo applies Markowitz and Sharpe’s research on Modern Portfolio Theory to introduce one of the industry’s first Tactical Asset Allocation (TAA) models in institutional separately managed accounts. |
| |
| 1984 | | Wells Fargo Stagecoach Funds launches its first asset allocation fund. |
| |
| 1989 | | The Tactical Asset Allocation (TAA) Model is first applied to Wells Fargo’s asset allocation mutual funds. |
| |
| 1994 | | Wells Fargo introduces the LifePath Funds, one of the first suites of target date funds (now the Wells Fargo Advantage Dow Jones Target Date FundsSM ). |
| |
| 1996 | | Evergreen Investments and Keystone Funds merge. |
| |
| 1997 | | Wells Fargo launches Wells Fargo Advantage WealthBuilder PortfoliosSM, a fund-of-funds suite of products that includes the use of quantitative models to shift assets among investment styles. |
| |
| 1999 | | Norwest Advantage Funds and Stagecoach Funds are reorganized into Wells Fargo Funds after the merger of Norwest and Wells Fargo. |
| |
| 2002 | | Evergreen Retail and Evergreen Institutional companies form the umbrella asset management company, Evergreen Investments. |
| |
| 2005 | | The integration of Strong Funds with Wells Fargo Funds creates Wells Fargo Advantage Funds, resulting in one of the top 20 mutual fund companies in the United States. |
| |
| 2006 | | Wells Fargo Advantage Funds relaunches the target date product line as Wells Fargo Advantage Dow Jones Target Date Funds. |
| |
| 2010 | | The mergers and reorganizations of Evergreen and Wells Fargo Advantage mutual funds are completed, unifying the families under the brand of Wells Fargo Advantage Funds. |
Wells Fargo Advantage Funds®
Wells Fargo Advantage Funds skillfully guides institutions, financial advisors, and individuals through the investment terrain to help them reach their financial objectives. Everything we do on behalf of investors is backed by our unique combination of qualifications.
Strength
Our organization is built on the standards of integrity and service established by our parent company—Wells Fargo & Company—more than 150 years ago. And, because we’re part of a highly diversified financial enterprise, we offer the depth of resources to help investors succeed.
Expertise
Our multi-boutique model offers investors access to the independent thinking of premier investment managers that have been chosen for their time-tested strategies. While each team specializes in a specific investment strategy, collectively they provide investors a wide choice of distinct investment styles. Our dedication to investment excellence doesn’t end with our expertise in manager selection—risk management, analysis, and rigorous ongoing review seek to ensure each manager’s investment process remains consistent.
Partnership
Our collaborative approach is built around understanding the needs and goals of our clients. By adhering to core principles of sound judgment and steady guidance, we support you through every stage of the investment decision process.
Carefully consider a fund’s investment objectives, risks, charges, and expenses before investing. For a current prospectus and, if available, a summary prospectus, containing this and other information, visit wellsfargo.com/advantagefunds. Read it carefully before investing.
Wells Fargo Funds Management, LLC, a wholly owned subsidiary of Wells Fargo & Company, provides investment advisory and administrative services for Wells Fargo Advantage Funds®. Other affiliates of Wells Fargo & Company provide subadvisory and other services for the Funds. The Funds are distributed by Wells Fargo Funds Distributor, LLC, Member FINRA/SIPC, an affiliate of Wells Fargo & Company.
“Dow Jones®” and “Dow Jones Target Date IndexesSM” are service marks of Dow Jones Trademark Holdings, LLC (“Dow Jones”), have been licensed to CME Group Index Services LLC (“CME Indexes”) and have been sublicensed for use for certain purposes by Global Index Advisors, Inc, and Wells Fargo Funds Management, LLC. The Wells Fargo Advantage Dow Jones Target Date FundsSM based on the Dow Jones Target Date IndexesSM, are not sponsored, endorsed, sold or promoted by Dow Jones, CME Indexes or their respective affiliates and none of them makes any representation regarding the advisability of investing in such product(s).
NOT FDIC INSURED ¡ NO BANK GUARANTEE ¡ MAY LOSE VALUE
Not part of the semi-annual report.
Wells Fargo Advantage Funds offers more than 110 mutual funds across a wide range of asset classes, representing over $216 billion in assets under management, as of December 31, 2011.
| | | | |
| Equity Funds | | | | |
Asia Pacific Fund | | Global Opportunities Fund | | Premier Large Company Growth Fund |
C&B Large Cap Value Fund | | Growth Fund | | Small Cap Opportunities Fund |
C&B Mid Cap Value Fund | | Health Care Fund | | Small Cap Value Fund |
Capital Growth Fund | | Index Fund | | Small Company Growth Fund |
Common Stock Fund | | International Equity Fund | | Small Company Value Fund |
Disciplined U.S. Core Fund | | International Value Fund | | Small/Mid Cap Core Fund |
Discovery Fund† | | Intrinsic Small Cap Value Fund | | Small/Mid Cap Value Fund |
Diversified Equity Fund | | Intrinsic Value Fund | | Social Sustainability Fund† |
Diversified International Fund | | Intrinsic World Equity Fund | | Special Mid Cap Value Fund |
Diversified Small Cap Fund | | Large Cap Core Fund | | Special Small Cap Value Fund |
Emerging Growth Fund | | Large Cap Growth Fund | | Specialized Technology Fund |
Emerging Markets Equity Fund | | Large Company Value Fund | | Strategic Large Cap Growth Fund |
Endeavor Select Fund† | | Omega Growth Fund | | Traditional Small Cap Growth Fund |
Enterprise Fund† | | Opportunity Fund† | | Utility and Telecommunications Fund |
Equity Value Fund | | Precious Metals Fund | | |
| Bond Funds | | | | |
Adjustable Rate Government Fund | | Inflation-Protected Bond Fund | | Short-Term Bond Fund |
California Limited-Term Tax-Free Fund | | Intermediate Tax/AMT-Free Fund | | Short-Term High Yield Bond Fund |
California Tax-Free Fund | | International Bond Fund | | Short-Term Municipal Bond Fund |
Colorado Tax-Free Fund | | Minnesota Tax-Free Fund | | Strategic Municipal Bond Fund |
Government Securities Fund | | Municipal Bond Fund | | Total Return Bond Fund |
High Income Fund | | North Carolina Tax-Free Fund | | Ultra Short-Term Income Fund |
High Yield Bond Fund | | Pennsylvania Tax-Free Fund | | Ultra Short-Term Municipal Income Fund |
Income Plus Fund | | Short Duration Government Bond Fund | | Wisconsin Tax-Free Fund |
| Asset Allocation Funds | | | | |
Asset Allocation Fund | | WealthBuilder Equity Portfolio† | | Target 2020 Fund† |
Conservative Allocation Fund | | WealthBuilder Growth Allocation Portfolio† | | Target 2025 Fund† |
Diversified Capital Builder Fund | | WealthBuilder Growth Balanced Portfolio† | | Target 2030 Fund† |
Diversified Income Builder Fund | | WealthBuilder Moderate Balanced Portfolio† | | Target 2035 Fund† |
Growth Balanced Fund | | WealthBuilder Tactical Equity Portfolio† | | Target 2040 Fund† |
Index Asset Allocation Fund | | Target Today Fund† | | Target 2045 Fund† |
Moderate Balanced Fund | | Target 2010 Fund† | | Target 2050 Fund† |
WealthBuilder Conservative Allocation Portfolio† | | Target 2015 Fund† | | Target 2055 Fund† |
| Money Market Funds | | | | |
100% Treasury Money Market Fund | | Heritage Money Market Fund† | | National Tax-Free Money Market Fund |
California Municipal Money Market Fund | | Money Market Fund | | Prime Investment Money Market Fund |
Cash Investment Money Market Fund | | Municipal Cash Management Money Market Fund | | Treasury Plus Money Market Fund |
Government Money Market Fund | | Municipal Money Market Fund | | |
| Variable Trust Funds1 | | | | |
VT Discovery Fund† | | VT Intrinsic Value Fund | | VT Small Cap Growth Fund |
VT Index Asset Allocation Fund | | VT Omega Growth Fund | | VT Small Cap Value Fund |
VT International Equity Fund | | VT Opportunity Fund† | | VT Total Return Bond Fund |
An investment in a money market fund is not insured or guaranteed by the Federal Deposit Insurance Corporation or any other government agency. Although the Wells Fargo Advantage Money Market Funds seek to preserve the value of your investment at $1.00 per share, it is possible to lose money by investing in a money market fund.
| 1. | The Variable Trust Funds are generally available only through insurance company variable contracts. |
| † | In this report, the Wells Fargo Advantage Discovery FundSM, Wells Fargo Advantage Endeavor Select FundSM, Wells Fargo Advantage Enterprise FundSM, Wells Fargo Advantage Opportunity FundSM, Wells Fargo Advantage Social Sustainability FundSM, Wells Fargo Advantage WealthBuilder Conservative Allocation PortfolioSM, Wells Fargo Advantage WealthBuilder Equity PortfolioSM, Wells Fargo Advantage WealthBuilder Growth Allocation PortfolioSM, Wells Fargo Advantage WealthBuilder Growth Balanced PortfolioSM, Wells Fargo Advantage WealthBuilder Moderate Balanced PortfolioSM, Wells Fargo Advantage WealthBuilder Tactical Equity PortfolioSM, Wells Fargo Advantage Dow Jones Target Today FundSM, Wells Fargo Advantage Dow Jones Target 2010 FundSM, Wells Fargo Advantage Dow Jones Target 2015 FundSM, Wells Fargo Advantage Dow Jones Target 2020 FundSM, Wells Fargo Advantage Dow Jones Target 2025 FundSM, Wells Fargo Advantage Dow Jones Target 2030 FundSM, Wells Fargo Advantage Dow Jones Target 2035 FundSM, Wells Fargo Advantage Dow Jones Target 2040 FundSM, Wells Fargo Advantage Dow Jones Target 2045 FundSM, Wells Fargo Advantage Dow Jones Target 2050 FundSM, Wells Fargo Advantage Dow Jones Target 2055 FundSM, Wells Fargo Advantage Heritage Money Market FundSM, Wells Fargo Advantage VT Discovery FundSM, and Wells Fargo Advantage VT Opportunity FundSM are referred to as the Discovery Fund, Endeavor Select Fund, Enterprise Fund, Opportunity Fund, Social Sustainability Fund, WealthBuilder Conservative Allocation Portfolio, WealthBuilder Equity Portfolio, WealthBuilder Growth Allocation Portfolio, WealthBuilder Growth Balanced Portfolio, WealthBuilder Moderate Balanced Portfolio, WealthBuilder Tactical Equity Portfolio, Target Today Fund, Target 2010 Fund, Target 2015 Fund, Target 2020 Fund, Target 2025 Fund, Target 2030 Fund, Target 2035 Fund, Target 2040 Fund, Target 2045 Fund, Target 2050 Fund, Target 2055 Fund, Heritage Money Market Fund, VT Discovery Fund, and VT Opportunity Fund, respectively. |
Not part of the semi-annual report.
| | | | |
| 2 | | Wells Fargo Advantage Strategic Municipal Bond Fund | | Letter to Shareholders |

Karla M. Rabusch,
President
Wells Fargo Advantage Funds
For the entire six-month period, most of the major fixed-income indexes posted solid positive returns. However, the market’s six-month return figures mask the uneven path that the financial markets traced since the summer as investors had to contend with a variety of global and domestic headwinds.
Dear Valued Shareholder:
We’re pleased to offer you this semi-annual report for the Wells Fargo Advantage Strategic Municipal Bond Fund for the six-month period that ended December 31, 2011. Upon reviewing the report, you may notice a few changes from past reports, the most significant of which is the change from a multi-fund report to a single-fund report. We made this change to make it easier for you to find your fund information.
For the entire six-month period, most of the major fixed-income indexes posted solid positive returns. However, the market’s six-month return figures mask the uneven path that the financial markets traced since the summer as investors had to contend with a variety of global and domestic headwinds. Whatever the future holds, we continue to believe that most investors can benefit from adhering to a well-diversified investment strategy. Over the long-term, such a strategy may allow you to balance risks and opportunities as you pursue your financial goals in a dynamic market landscape.
The economic recovery gained traction as the year progressed.
The U.S. economic recovery that began in mid-2009 has experienced a few slow patches along the way. However, the recovery regained some upward momentum during the six-month period, yet the rate of growth remained subpar compared with most previous recovery cycles.
In September 2011, it was reported that U.S. gross domestic product (GDP) grew at a mere 1.3% annual rate in the second quarter of 2011, following anemic growth at an annual rate of 0.4% in the first quarter. According to the December estimate, GDP growth accelerated to an annual rate of 1.8% in the third quarter, reigniting hopes for a sustainable recovery. Those hopes were buoyed by widespread anticipation of even stronger GDP growth in the fourth quarter. By year-end, few economists believed that the U.S. economy was in danger of sliding back into recession, although many expected a sluggish growth environment in 2012.
The struggling housing and labor markets slowed growth.
As has been the case throughout the recovery, the housing and labor markets continued to restrain economic momentum during 2011.
The beleaguered housing market has arguably exerted the biggest drag on growth. Despite intermittent signs of improvement, ongoing weakness in sales of both new and existing homes has put considerable downward pressure on prices. On the other hand, the labor market took a decided turn for the better during the final months of 2011: initial unemployment claims have eased, and the private sector has been steadily adding jobs. The pace of hiring, while not brisk, was sufficient to push the U.S. unemployment rate down to 8.5% as of December 2011—still well above its historical average but at its lowest level since February 2009. Many observers expect the unemployment rate to decline further in 2012, which could act as a tailwind for consumer spending—widely viewed as one of the keys to long-term economic growth.
The Federal Reserve announced that it will keep rates low until 2013.
Consumers have already demonstrated some resilience in their spending—even in the face of higher energy costs. Oil prices skyrocketed in early 2011 before
| | | | | | |
| Letter to Shareholders | | Wells Fargo Advantage Strategic Municipal Bond Fund | | | 3 | |
retreating later in the year, only to spike again during the fourth quarter. Yet “core” inflation, which excludes volatile energy and food prices, remained fairly benign throughout the year. With inflation in check, the Federal Reserve (Fed) held its target range for the federal funds rate—a proxy for short-term interest rates—steady at 0% to 0.25%. Following its August 9, 2011 meeting, the Federal Open Market Committee issued a statement explaining that economic conditions were likely to warrant exceptionally low levels for the federal funds rate through at least mid-2013. In September, the Fed launched yet another stimulus program—dubbed “Operation Twist”—that is designed to keep intermediate- and longer-term yields relatively low. The goal with keeping longer-term rates low is to encourage lending activity to spark business investments and home purchases, which, in turn, may provide support for a more sustainable economic recovery.
Market volatility was a dominant theme during the final six-months of the year
Early on in the period, market climate shifted to one of anxiety over the increasingly fragile state of the U.S. and global economies. In addition, investors not only worried that the U.S. might be on the brink of recession, they also feared that Europe’s sovereign debt problems could spiral out of control if a Greek default triggered financial contagion across the continent. In July and August, investor sentiment was further undermined by partisan wrangling over the federal debt ceiling and the downgrade of the U.S. credit rating by Standard & Poor’s. The barrage of unsettling headlines led to heightened market volatility and an increase in risk aversion, which translated into sharply falling stock prices and higher demand for “safer” assets such as Treasuries and municipals in the third quarter of 2011. Although volatility persisted into the fourth quarter, the financial markets were able to rebound amid improved U.S. economic data and hopes for a resolution to the European crisis.
For the entire six-month period, the Barclays Capital U.S. Aggregate Bond Index1, which represents the universe of investment-grade bonds, and the Barclays Capital U.S. Treasury Index2 added 4.98% and 7.43%, respectively. By comparison, the Barclays Capital Municipal Bond Index3 gained 6.02% over the last half of the year
Recent events have not altered our message to shareholders.
The market turmoil of 2011 and an uncertain outlook going forward have left many investors questioning their resolve—and their investments. Yet, it is precisely at such times that the market may present opportunities—as well as challenges—for prudent investors. Bear in mind that many investors who indiscriminately sold their equity investments during the severe market downturn of 2008 to 2009 missed out on the impressive two-year rally that followed. In our opinion, the lesson to be learned from these dramatic market events is that, for
| 1. | The Barclays Capital U.S. Aggregate Bond Index is composed of the Barclays Capital Government/Credit Index and the Mortgage-Backed Securities Index and includes U.S. Treasury issues, agency issues, corporate bond issues, and mortgage-backed securities. You cannot invest directly in an index. |
| 2. | The Barclays Capital U.S. Treasury Index is an index of U.S. Treasury Securities. You cannot invest directly in an index. |
| 3. | The Barclays Capital Municipal Bond Index is an unmanaged index composed of long-term tax-exempt bonds with a minimum credit rating of Baa. You cannot invest directly in an index. |
Although volatility persisted into the fourth quarter, the financial markets were able to rebound amid improved U.S. economic data and hopes for a resolution to the European crisis.
| | | | |
| 4 | | Wells Fargo Advantage Strategic Municipal Bond Fund | | Letter to Shareholders |
many investors, simply building and maintaining a well-diversified4 investment plan is the best long-term strategy.
Thank you for choosing to invest with Wells Fargo Advantage Funds. We appreciate your confidence in us and remain committed to helping you meet your financial needs. For current information about your fund investments, contact your investment professional, visit our website at www.wellsfargo.com/advantagefunds, or call us directly at 1-800-222-8222. We are available 24 hours a day, 7 days a week.
Sincerely,

Karla M. Rabusch
President
Wells Fargo Advantage Funds
| 4. | Diversification does not assure or guarantee better performance and cannot eliminate the risk of investment losses. |
| | | | | | |
| Letter to Shareholders | | Wells Fargo Advantage Strategic Municipal Bond Fund | | | 5 | |
|
|
Notice to Shareholders Effective April 1, 2012, the Fund may invest up to 10% of its total assets in inverse floaters to seek enhanced returns. Inverse floaters are derivative debt instruments created by depositing a municipal security in a trust. They pay interest at rates that generally vary inversely with specified short-term interest rates. The interest payment received on inverse floaters generally will decrease when specified short-term interest rates increase. Inverse floaters involve leverage, which may magnify the Fund’s gains or losses, and exhibit greater price and income volatility than bonds with similar maturities. We intend to limit leverage created by the Fund’s investment in inverse floaters to an amount equal to 10% of the Fund’s total assets. Inverse floaters are also subject to the risks associated with derivatives and municipal securities. |
|
|
Notice to Shareholders The Board of Trustees for Wells Fargo Advantage Funds has unanimously approved the following modifications to certain net asset value (NAV) waiver privileges and commission schedules: n Effective May 1, 2012, automatic investment plan (AIP) purchases and proceeds received from systematic withdrawals will no longer qualify for NAV repurchase privileges. n Effective May 1, 2012, discretionary rights to waive the upfront commission for Class C and “jumbo” Class A share purchases will no longer be granted to broker/dealers. However, we will continue to waive the Class C shares contingent deferred sales charge for redemptions by employer-sponsored retirement plans where the dealer of record waived its commission at the time of purchase. n Effective July 31, 2012, NAV purchase privileges for former Evergreen Class IS and Class R shareholders are being modified to remove the ability to purchase Class A shares at NAV unless those shares are held directly with the fund on or after July 31, 2012. |
| | | | |
| 6 | | Wells Fargo Advantage Strategic Municipal Bond Fund | | Performance Highlights (Unaudited) |
INVESTMENT OBJECTIVE
The Fund seeks current income exempt from regular federal income tax.
ADVISER
Wells Fargo Funds Management, LLC
SUB-ADVISER
Wells Capital Management Incorporated
PORTFOLIO MANAGERS
Wendy Casetta
Lyle J. Fitterer, CFA, CPA
Robert J. Miller
FUND INCEPTION
March 21, 1985
| | |
CREDIT QUALITY1
(AS OF DECEMBER 31, 2011) |
|
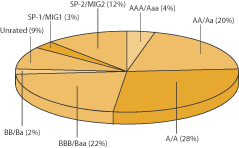 |
| | |
EFFECTIVE MATURITY DISTRIBUTION2
(AS OF DECEMBER 31, 2011) |
|
 |
| 1. | The ratings indicated are from Standard & Poor’s, Moody’s Investors Service, and/or Fitch Ratings Ltd. Credit Quality Ratings: Credit quality ratings apply to underlying holdings of the Fund and not the Fund itself. Standard and Poor’s rates the creditworthiness of bonds, ranging from AAA (highest) to D (lowest). Ratings from A to CCC may be modified by the addition of a plus (+) or minus (–) sign to show relative standing within the rating categories. Standard & Poor’s rates the creditworthiness of short-term notes from SP-1 (highest) to SP-3 (lowest). Ratings from A to CCC may be modified by the addition of a plus (+) or minus (–) sign to show relative standing within the rating categories. Moody’s rates the creditworthiness of bonds, ranging from Aaa (highest) to C (lowest). Ratings Aa to B may be modified by the addition of a number 1 (highest) to 3 (lowest) to show relative standing within the ratings categories. Moody’s rates the creditworthiness of short-term U.S. tax-exempt municipal securities from MIG 1/VMIG 1 (highest) to SG (lowest). Fitch rates the creditworthiness of bonds, ranging from AAA (highest) to D (lowest). If a security was rated by all three rating agencies, the middle rating was utilized. If rated by two of three rating agencies, the lower rating was utilized and if rated by one of the agencies that rating was utilized. Credit quality is subject to change and is calculated based on the total investments of the Fund. We generally define higher quality bonds as bonds that have a rating of BBB/Baa and above and lower quality bonds as bonds with a rating below BBB/Baa. |
| 2. | Effective maturity is calculated based on the total long-term investments of the Fund. It is subject to change and may have changed since the date specified. |
| | | | | | |
| Performance Highlights (Unaudited) | | Wells Fargo Advantage Strategic Municipal Bond Fund | | | 7 | |
AVERAGE ANNUAL TOTAL RETURN3 (%) (AS OF DECEMBER 31, 2011)
| | | | | | | | | | | | | | | | | | | | | | | | | | | | | | | | | | | | | | | | | | | | |
| | | | | | Including Sales Charge | | | Excluding Sales Charge | | | Expense Ratios4 | |
| | | Inception Date | | | 6 Months* | | | 1 Year | | | 5 Year | | | 10 Year | | | 6 Months* | | | 1 Year | | | 5 Year | | | 10 Year | | | Gross | | | Net5 | |
Class A (VMPAX) | | | 12/01/1994 | | | | (2.59 | ) | | | 0.34 | | | | 2.49 | | | | 2.97 | | | | 1.97 | | | | 5.10 | | | | 3.43 | | | | 3.45 | | | | 0.84% | | | | 0.84% | |
Class B (VMPIX)** | | | 03/21/1985 | | | | (3.41 | ) | | | (0.68 | ) | | | 2.30 | | | | 2.94 | | | | 1.59 | | | | 4.32 | | | | 2.66 | | | | 2.94 | | | | 1.59% | | | | 1.59% | |
Class C (DHICX) | | | 08/18/1997 | | | | 0.58 | | | | 3.31 | | | | 2.66 | | | | 2.70 | | | | 1.58 | | | | 4.31 | | | | 2.66 | | | | 2.70 | | | | 1.59% | | | | 1.59% | |
Administrator Class (VMPYX) | | | 10/06/1997 | | | | | | | | | | | | | | | | | | | | 2.16 | | | | 5.26 | | | | 3.67 | | | | 3.72 | | | | 0.78% | | | | 0.68% | |
Barclays Capital Municipal Bond Index6 | | | | | | | | | | | | | | | | | | | | | | | 6.02 | | | | 10.70 | | | | 5.22 | | | | 5.38 | | | | | | | | | |
| * | Returns for periods of less than one year are not annualized. |
| ** | Class B shares are closed to investment, except in connection with the reinvestment of any distributions and permitted exchanges. |
Figures quoted represent past performance, which is no guarantee of future results and do not reflect the deduction of taxes that a shareholder may pay on fund distributions or the redemption of fund shares. Investment return and principal value of an investment will fluctuate so that an investor’s shares, when redeemed, may be worth more or less than their original cost. Performance shown without sales charges would be lower if sales charges were reflected. Current performance may be lower or higher than the performance data quoted and assumes the reinvestment of dividends and capital gains. Current month-end performance is available on the Fund’s Web site – www.wellsfargo.com/advantagefunds.
Index returns do not include transaction costs associated with buying and selling securities, any mutual fund fees or expenses or any taxes. It is not possible to invest directly in an index.
For Class A shares, the maximum front-end sales charge is 4.50%. For Class B shares, the maximum contingent deferred sales charge is 5.00%. For Class C shares, the maximum contingent deferred sales charge is 1.00%. Performance including sales charge assumes the sales charge for the corresponding time period. Administrator Class shares are sold without a front-end sales charge or contingent deferred sales charge.
Bond fund values fluctuate in response to the financial condition of individual issuers, general market and economic conditions, and changes in interest rates. In general, when interest rates rise, bond fund values fall and investors may lose principal value. High-yield securities have a greater risk of default and tend to be more volatile than higher-rated debt securities. The use of derivatives may reduce returns and/or increase volatility. Certain investment strategies tend to increase the total risk of an investment (relative to the broader market). This Fund is exposed to municipal securities risk. Consult the Fund’s prospectus for additional information on these and other risks. A portion of the Fund’s income may be subject to federal, state, and/or local income taxes or the alternative minimum tax (AMT). Any capital gains distributions may be taxable.
| 3. | Historical performance shown for all classes of the Fund prior to July 12, 2010 is based on the performance of the Fund’s predecessor, Evergreen Strategic Municipal Bond Fund. |
| 4. | Reflects the expense ratios as stated in the most recent prospectuses. |
| 5. | The Adviser has committed through July 11, 2013 to waive fees and/or reimburse expenses to the extent necessary to cap the Fund’s Total Annual Fund Operating Expenses After Fee Waiver, excluding certain expenses, at 0.86% for Class A, 1.61% for Class B, 1.61% for Class C, and 0.68% for Administrator Class shares . Without this cap, the Fund’s returns would have been lower. |
| 6. | The Barclays Capital Municipal Bond Index is an unmanaged index composed of long-term tax-exempt bonds with a minimum credit rating of Baa. You cannot invest directly in an index. |
| | | | |
| 8 | | Wells Fargo Advantage Strategic Municipal Bond Fund | | Fund Expenses (Unaudited) |
As a shareholder of the Fund, you incur two types of costs: (1) transaction costs, including sales charges (loads) on purchase payments and contingent deferred sales charges (if any) on redemptions and (2) ongoing costs, including management fees; distribution (12b-1) and/or shareholder service fees; and other Fund expenses. This example is intended to help you understand your ongoing costs (in dollars) of investing in the Fund and to compare these costs with the ongoing costs of investing in other mutual funds.
The example is based on an investment of $1,000 invested at the beginning of the six-month period and held for the entire period from July 1, 2011 to December 31, 2011.
Actual Expenses
The “Actual” line of the table below provides information about actual account values and actual expenses. You may use the information in this line, together with the amount you invested, to estimate the expenses that you paid over the period. Simply divide your account value by $1,000 (for example, an $8,600 account value divided by $1,000 = 8.6), then multiply the result by the number in the “Actual” line under the heading entitled “Expenses Paid During Period” for your applicable class of shares to estimate the expenses you paid on your account during this period.
Hypothetical Example for Comparison Purposes
The “Hypothetical” line of the table below provides information about hypothetical account values and hypothetical expenses based on the Fund’s actual expense ratio and an assumed rate of return of 5% per year before expenses, which is not the Fund’s actual return. The hypothetical account values and expenses may not be used to estimate the actual ending account balance or expenses you paid for the period. You may use this information to compare the ongoing costs of investing in the Fund and other funds. To do so, compare this 5% hypothetical example with the 5% hypothetical examples that appear in the shareholder reports of the other funds.
Please note that the expenses shown in the table are meant to highlight your ongoing costs only and do not reflect any transactional costs, such as sales charges (loads) and contingent deferred sales charges. Therefore, the “Hypothetical” line of the table is useful in comparing ongoing costs only, and will not help you determine the relative total costs of owning different funds. In addition, if these transactional costs were included, your costs would have been higher.
| | | | | | | | | | | | | | | | |
| | | Beginning
Account Value
07-01-2011 | | | Ending
Account Value
12-31-2011 | | | Expenses
Paid During
the Period1 | | | Net Annual
Expense Ratio | |
Class A | | | | | | | | | | | | | | | | |
Actual | | $ | 1,000.00 | | | $ | 1,019.69 | | | $ | 4.21 | | | | 0.83 | % |
Hypothetical (5% return before expenses) | | $ | 1,000.00 | | | $ | 1,020.96 | | | $ | 4.22 | | | | 0.83 | % |
Class B | | | | | | | | | | | | | | | | |
Actual | | $ | 1,000.00 | | | $ | 1,015.87 | | | $ | 8.01 | | | | 1.58 | % |
Hypothetical (5% return before expenses) | | $ | 1,000.00 | | | $ | 1,017.19 | | | $ | 8.01 | | | | 1.58 | % |
Class C | | | | | | | | | | | | | | | | |
Actual | | $ | 1,000.00 | | | $ | 1,015.84 | | | $ | 8.01 | | | | 1.58 | % |
Hypothetical (5% return before expenses) | | $ | 1,000.00 | | | $ | 1,017.19 | | | $ | 8.01 | | | | 1.58 | % |
Administrator Class | | | | | | | | | | | | | | | | |
Actual | | $ | 1,000.00 | | | $ | 1,021.64 | | | $ | 3.46 | | | | 0.68 | % |
Hypothetical (5% return before expenses) | | $ | 1,000.00 | | | $ | 1,021.72 | | | $ | 3.46 | | | | 0.68 | % |
| 1. | Expenses paid is equal to the annualized expense ratio of each class multiplied by the average account value over the period, multiplied by the number of days in the most recent fiscal half-year divided by the number of days in the fiscal year (to reflect the one-half year period). |
| | | | | | |
| Portfolio of Investments—December 31, 2011 (Unaudited) | | Wells Fargo Advantage Strategic Municipal Bond Fund | | | 9 | |
| | | | | | | | | | | | | | | | |
| Security Name | | Interest Rate | | | Maturity Date | | | Principal | | | Value | |
| | | | | | | | | | | | | | | | |
| | | | |
Municipal Bonds and Notes: 95.61% | | | | | | | | | | | | | | | | |
| | | | |
| Alabama: 0.64% | | | | | | | | | | | | | | | | |
Alabama 21st Century Authority Tobacco Settlement Revenue (Tobacco Revenue) | | | 5.50 | % | | | 12/01/2013 | | | $ | 2,500,000 | | | $ | 2,532,025 | |
Chatom AL Industrial Development Board Solid Waste Disposal (Utilities Revenue) | | | 4.00 | | | | 08/01/2016 | | | | 1,875,000 | | | | 2,031,750 | |
Jefferson County AL Sewer Series C-5 (Water & Sewer Revenue, FGIC Insured)± | | | 0.74 | | | | 02/01/2042 | | | | 1,900,000 | | | | 1,121,000 | |
| | | | |
| | | | | | | | | | | | | | | 5,684,775 | |
| | | | | | | | | | | | | | | | |
| | | | |
| Alaska: 0.13% | | | | | | | | | | | | | | | | |
Alaska Industrial Development & Export Authority Snettisham Hydroelectric (Utilities Revenue, AMBAC Insured) | | | 6.00 | | | | 01/01/2014 | | | | 1,165,000 | | | | 1,168,285 | |
| | | | | | | | | | | | | | | | |
| | | | |
| Arizona: 3.14% | | | | | | | | | | | | | | | | |
Arizona Health Facilities Authority Banner Health Series B (Health Revenue)± | | | 1.06 | | | | 01/01/2037 | | | | 17,200,000 | | | | 11,245,188 | |
Arizona Health Facilities Authority Phoenix Children’s Hospital Series B (Health Revenue)±§ | | | 0.95 | | | | 02/01/2042 | | | | 5,800,000 | | | | 5,436,978 | |
Fort McDowell AZ Yavapai Nation Gaming Revenue (Tax Revenue) | | | 7.75 | | | | 05/01/2024 | | | | 3,000,000 | | | | 3,095,760 | |
Maricopa County AZ Stadium District Revenue (Tax Revenue, AMBAC Insured) | | | 5.38 | | | | 06/01/2013 | | | | 3,260,000 | | | | 3,228,574 | |
Scottsdale AZ IDA Hospital (IDR) | | | 5.00 | | | | 09/01/2012 | | | | 1,615,000 | | | | 1,652,064 | |
University of Arizona Medical Center Corporation (Health Revenue, GO of Corporation Insured) | | | 5.00 | | | | 07/01/2014 | | | | 1,360,000 | | | | 1,442,334 | |
University of Arizona Medical Center Corporation (Health Revenue, GO of Corporation Insured) | | | 5.00 | | | | 07/01/2015 | | | | 1,660,000 | | | | 1,786,210 | |
| | | | |
| | | | | | | | | | | | | | | 27,887,108 | |
| | | | | | | | | | | | | | | | |
| | | | |
| California: 9.72% | | | | | | | | | | | | | | | | |
Alameda Corridor Transportation Authority (Transportation Revenue, AMBAC Insured)(z) | | | 3.44 | | | | 10/01/2014 | | | | 500,000 | | | | 455,005 | |
Alameda Corridor Transportation Authority (Transportation Revenue, AMBAC Insured)(z) | | | 4.06 | | | | 10/01/2017 | | | | 555,000 | | | | 440,004 | |
Alameda Corridor Transportation Authority (Transportation Revenue, NATL-RE Insured) | | | 5.13 | | | | 10/01/2018 | | | | 2,000,000 | | | | 2,005,300 | |
Alameda County CA COP Medical Center Project (Lease Revenue, NATL-RE Insured) | | | 5.38 | | | | 06/01/2014 | | | | 115,000 | | | | 121,340 | |
Antelope Valley CA Health Care District Series A (Health Revenue)±§ | | | 5.25 | | | | 09/01/2017 | | | | 1,200,000 | | | | 1,197,000 | |
California (Miscellaneous Revenue, Dexia Credit Local LOC, FSA Insured)±§ | | | 2.25 | | | | 08/01/2027 | | | | 10,000,000 | | | | 10,000,000 | |
California GO (Tax Revenue, FGIC Insured) | | | 6.00 | | | | 08/01/2014 | | | | 755,000 | | | | 758,518 | |
California GO (GO - State) | | | 6.25 | | | | 10/01/2019 | | | | 15,000 | | | | 15,189 | |
California Housing Finance Agency (Housing Revenue, AGM Insured) | | | 4.00 | | | | 02/01/2015 | | | | 680,000 | | | | 687,086 | |
California Housing Finance Agency (Housing Revenue, AGM Insured) | | | 4.00 | | | | 08/01/2015 | | | | 1,585,000 | | | | 1,601,421 | |
California Housing Finance Agency Multifamily Housing Series A (Housing Revenue, NATL-RE GO of Agency Insured) | | | 5.95 | | | | 08/01/2028 | | | | 625,000 | | | | 624,306 | |
California Housing Finance Agency Multifamily Housing Series B (Housing Revenue, AMBAC FHA Insured) | | | 6.15 | | | | 08/01/2022 | | | | 150,000 | | | | 150,228 | |
California Public Works Board Lease California State University Project Series C (Lease Revenue, NATL-RE-IBC Insured) | | | 5.38 | | | | 10/01/2016 | | | | 500,000 | | | | 501,330 | |
California Public Works Board Lease Community College Project Series B (Lease Revenue, AMBAC Insured) | | | 5.63 | | | | 03/01/2016 | | | | 215,000 | | | | 215,634 | |
California Public Works Board Lease State University Project Series A (Lease Revenue) | | | 5.25 | | | | 12/01/2013 | | | | 40,000 | | | | 40,130 | |
| | | | |
| 10 | | Wells Fargo Advantage Strategic Municipal Bond Fund | | Portfolio of Investments—December 31, 2011 (Unaudited) |
| | | | | | | | | | | | | | | | |
| Security Name | | Interest Rate | | | Maturity Date | | | Principal | | | Value | |
| | | | | | | | | | | | | | | | |
| | | | |
| California (continued) | | | | | | | | | | | | | | | | |
California Public Works Board Lease State University Project Series A (Lease Revenue, AMBAC Insured) | | | 5.40 | % | | | 12/01/2016 | | | $ | 1,050,000 | | | $ | 1,052,793 | |
California Public Works Board Lease State University Project Series C (Lease Revenue, NATL-RE-IBC Insured) | | | 5.25 | | | | 10/01/2013 | | | | 100,000 | | | | 100,343 | |
California Public Works Board Lease State University Project Series C (Lease Revenue, NATL-RE-IBC Insured) | | | 5.40 | | | | 10/01/2022 | | | | 700,000 | | | | 702,352 | |
California Rural Home Mortgage Authority SFHR Series B (Housing Revenue, GNMA/FNMA Insured) | | | 7.30 | | | | 06/01/2031 | | | | 115,000 | | | | 118,207 | |
California State (GO - State, Dexia Credit Local LOC, FSA Insured)±§ | | | 2.25 | | | | 08/01/2027 | | | | 14,780,000 | | | | 14,780,000 | |
California State Statewide CDA (Lease Revenue) | | | 6.00 | | | | 10/01/2023 | | | | 2,500,000 | | | | 2,599,250 | |
California Statewide CDA SAVRS (Miscellaneous Revenue, ACA Radian Insured)±§(a)(m)(n) | | | 0.81 | | | | 05/15/2029 | | | | 2,750,000 | | | | 2,558,766 | |
California Tobacco Securitization Corporation Series A (Tobacco Revenue) | | | 5.00 | | | | 06/01/2017 | | | | 250,000 | | | | 250,153 | |
Delhi CA Unified School District (Tax Revenue, AMBAC Insured)(z) | | | 4.24 | | | | 08/01/2019 | | | | 2,500,000 | | | | 1,815,775 | |
Dixon CA Unified School District Election of 2002 GO (GO - Local, NATL-RE FGIC Insured)(z) | | | 6.46 | | | | 08/01/2037 | | | | 1,100,000 | | | | 216,502 | |
Fontana CA Redevelopment Agency Mortgage College Village Drive Apartments (Housing Revenue, GNMA Insured) | | | 5.45 | | | | 05/20/2027 | | | | 1,000,000 | | | | 1,022,450 | |
Fontana CA Redevelopment Agency Mortgage College Village Drive Apartments Series A (Housing Revenue, GNMA Insured) | | | 5.25 | | | | 05/20/2017 | | | | 1,145,000 | | | | 1,170,602 | |
Inland Valley Development Agency California Tax Allocation (Tax Revenue)±§ | | | 4.25 | | | | 03/01/2041 | | | | 4,400,000 | | | | 4,478,144 | |
Inland Valley Development Agency California Tax Allocation (Tax Revenue)±§ | | | 4.50 | | | | 03/01/2041 | | | | 4,300,000 | | | | 4,394,858 | |
Kirkwood Meadows CA Public Utility District (Utilities Revenue) | | | 4.50 | | | | 05/01/2013 | | | | 2,000,000 | | | | 2,007,480 | |
Los Angeles CA Multifamily Housing Colorado Terrace LP Project Series H (Housing Revenue, GNMA Insured) | | | 4.35 | | | | 11/20/2012 | | | | 110,000 | | | | 112,251 | |
Los Angeles County CA COP Disney Parking Project (Lease Revenue)(z) | | | 3.04 | | | | 03/01/2016 | | | | 4,170,000 | | | | 3,674,354 | |
Los Angeles County CA Schools Regionalized Business Services Series A (Education Revenue, AMBAC Insured)(z) | | | 4.45 | | | | 08/01/2016 | | | | 1,945,000 | | | | 1,588,579 | |
Northern California Gas Authority # 1 LIBOR (Energy Revenue)± | | | 0.85 | | | | 07/01/2017 | | | | 1,040,000 | | | | 906,870 | |
Northern California Gas Authority # 1 LIBOR (Energy Revenue)± | | | 0.96 | | | | 07/01/2027 | | | | 15,380,000 | | | | 10,933,334 | |
Oxnard CA Harbor District Series A (Port Authority Revenue) | | | 3.00 | | | | 08/01/2013 | | | | 1,560,000 | | | | 1,559,501 | |
Oxnard CA Harbor District Series A (Port Authority Revenue) | | | 5.00 | | | | 08/01/2014 | | | | 615,000 | | | | 640,074 | |
Palmdale CA Civic Authority Civic Center Refinancing Series A (Tax Revenue, NATL-RE Insured) | | | 5.60 | | | | 07/01/2015 | | | | 100,000 | | | | 100,170 | |
Palomar Pomerado CA Health (Health Revenue, NATL-RE Insured)(z) | | | 4.72 | | | | 08/01/2021 | | | | 1,385,000 | | | | 884,752 | |
San Buenaventura CA Community Memorial Health System (Health Revenue) | | | 5.25 | | | | 12/01/2017 | | | | 1,455,000 | | | | 1,458,594 | |
San Buenaventura CA Community Memorial Health System (Health Revenue) | | | 5.75 | | | | 12/01/2018 | | | | 2,110,000 | | | | 2,142,937 | |
San Jose CA Redevelopment Agency Series A (Tax Revenue) | | | 5.00 | | | | 08/01/2015 | | | | 3,070,000 | | | | 3,185,033 | |
Santa Ana CA Financing Authority (Lease Revenue) | | | 3.50 | | | | 07/01/2012 | | | | 2,655,000 | | | | 2,670,957 | |
Santa Clara CA Redevelopment Agency Tax Allocation Bayshore North Project (Tax Revenue, NATL-RE Insured) | | | 5.00 | | | | 06/01/2016 | | | | 250,000 | | | | 252,295 | |
| | | | |
| | | | | | | | | | | | | | | 86,189,867 | |
| | | | | | | | | | | | | | | | |
| | | | |
| Colorado: 0.87% | | | | | | | | | | | | | | | | |
Colorado Health Facilities Authority Total Long Term Care Incorporated (Health Revenue) | | | 4.25 | | | | 11/15/2015 | | | | 570,000 | | | | 572,765 | |
Colorado HFA Series E-2 (Housing Revenue) | | | 7.00 | | | | 02/01/2030 | | | | 770,000 | | | | 789,766 | |
Colorado HFA SFHR (Housing Revenue)(z) | | | 5.62 | | | | 11/01/2029 | | | | 1,405,000 | | | | 522,477 | |
Denver CO City & County Airport Series C (Airport Revenue, NATL-RE-IBC Insured) | | | 6.13 | | | | 11/15/2025 | | | | 115,000 | | | | 115,462 | |
| | | | | | |
| Portfolio of Investments—December 31, 2011 (Unaudited) | | Wells Fargo Advantage Strategic Municipal Bond Fund | | | 11 | |
| | | | | | | | | | | | | | | | |
| Security Name | | Interest Rate | | | Maturity Date | | | Principal | | | Value | |
| | | | | | | | | | | | | | | | |
| | | | |
| Colorado (continued) | | | | | | | | | | | | | | | | |
Glendale CO COP (Lease Revenue, XLCA Insured) | | | 5.75 | % | | | 12/01/2013 | | | $ | 685,000 | | | $ | 743,985 | |
Public Authority For Colorado Energy Natural Gas (Energy Revenue) | | | 5.75 | | | | 11/15/2018 | | | | 895,000 | | | | 958,348 | |
Public Highway Authority Colorado Series B (Transportation Revenue, NATL-RE Insured)(z) | | | 4.70 | | | | 09/01/2016 | | | | 5,000,000 | | | | 4,022,400 | |
| | | | |
| | | | | | | | | | | | | | | 7,725,203 | |
| | | | | | | | | | | | | | | | |
| | | | |
| Connecticut: 1.46% | | | | | | | | | | | | | | | | |
Connecticut GO (Tax Revenue, FGIC-TCRS Insured) | | | 5.65 | | | | 03/15/2012 | | | | 270,000 | | | | 271,212 | |
Connecticut HEFA Bridgeport Hospital Series A (Health Revenue, NATL-RE Insured) | | | 6.63 | | | | 07/01/2018 | | | | 200,000 | | | | 201,578 | |
Connecticut Resource Recovery Authority Mid-Connecticut System Series A (Resource Recovery Revenue, NATL-RE GO of Authority Insured) | | | 5.50 | | | | 11/15/2012 | | | | 920,000 | | | | 923,827 | |
Connecticut State (GO - State)± | | | 1.30 | | | | 03/01/2018 | | | | 2,500,000 | | | | 2,499,900 | |
Connecticut State (GO - State)±§ | | | 1.45 | | | | 03/01/2019 | | | | 4,050,000 | | | | 4,054,455 | |
Connecticut State Series A (GO - State)±§ | | | 0.87 | | | | 05/15/2017 | | | | 3,000,000 | | | | 3,000,000 | |
Connecticut State Series A (GO - State)±§ | | | 1.02 | | | | 05/15/2018 | | | | 2,000,000 | | | | 2,000,000 | |
| | | | |
| | | | | | | | | | | | | | | 12,950,972 | |
| | | | | | | | | | | | | | | | |
| | | | |
| District of Columbia: 0.01% | | | | | | | | | | | | | | | | |
District of Columbia HFA Residential Seniors Center Series 1 (Housing Revenue, FGIC FHA Private Mortgages Insured) | | | 7.75 | | | | 09/01/2016 | | | | 57,500 | | | | 57,717 | |
| | | | | | | | | | | | | | | | |
| | | | |
| Florida: 7.40% | | | | | | | | | | | | | | | | |
Baker FL Correctional Development First Mortgage Detention Center Project (Lease Revenue) | | | 6.00 | | | | 02/01/2013 | | | | 355,000 | | | | 325,453 | |
Broward County FL Airport System Series E (Airport Revenue, NATL-RE Insured) | | | 5.25 | | | | 10/01/2012 | | | | 4,000,000 | | | | 4,015,480 | |
Citizens Property Insurance Corporation Florida (Miscellaneous Revenue, AGM Insured)±§ | | | 1.75 | | | | 06/01/2014 | | | | 5,000,000 | | | | 5,017,550 | |
Dade County FL Resource Recovery Facilities Revenue (Resource Recovery Revenue, AMBAC Insured) | | | 5.50 | | | | 10/01/2013 | | | | 335,000 | | | | 336,142 | |
Dade County FL Seaport (Airport Revenue, NATL-RE Insured) | | | 5.50 | | | | 10/01/2026 | | | | 370,000 | | | | 371,121 | |
Dade County FL Seaport Series 95 (Airport Revenue, NATL-RE Insured) | | | 5.75 | | | | 10/01/2015 | | | | 390,000 | | | | 391,665 | |
Escambia County FL School Board (Lease Revenue) | | | 5.00 | | | | 02/01/2020 | | | | 4,525,000 | | | | 4,766,771 | |
Florida Correctional Privatization Commission COP 350 Bed Youthful Polk County Series B (Lease Revenue, AMBAC Insured) | | | 5.00 | | | | 08/01/2017 | | | | 70,000 | | | | 70,171 | |
Florida Development Finance Corporation (Education Revenue) | | | 6.50 | | | | 06/15/2021 | | | | 3,000,000 | | | | 3,083,010 | |
Florida HFA (Housing Revenue, AGM Insured)(z) | | | 6.40 | | | | 12/01/2029 | | | | 4,980,000 | | | | 1,611,877 | |
Florida HFA Brittany of Rosemont Series G1 (Housing Revenue, AMBAC FHA Insured) | | | 6.25 | | | | 07/01/2035 | | | | 675,000 | | | | 666,812 | |
Florida Housing Finance Corporation Hampton Center Apartments Series D-1 (Housing Revenue, FNMA Insured) | | | 5.60 | | | | 03/01/2032 | | | | 185,000 | | | | 185,122 | |
Florida Housing Finance Corporation Multifamily Housing Series 2 (Housing Revenue) | | | 4.25 | | | | 12/15/2012 | | | | 1,000,000 | | | | 1,001,090 | |
Florida Mid-Bay Bridge Authority Series A (Transportation Revenue, AMBAC Insured) | | | 5.95 | | | | 10/01/2022 | | | | 1,685,000 | | | | 1,686,078 | |
Florida Municipal Loan Council Series A (Miscellaneous Revenue, NATL-RE Insured) | | | 5.25 | | | | 11/01/2015 | | | | 635,000 | | | | 643,052 | |
Florida Refunding GO Senior Lien Jacksonville Transportation (GO - State) | | | 5.00 | | | | 07/01/2012 | | | | 350,000 | | | | 351,400 | |
Gulf Breeze FL City Hall Series FG&H (Miscellaneous Revenue)±§ | | | 3.00 | | | | 12/01/2020 | | | | 5,000,000 | | | | 4,964,550 | |
Gulf Breeze FL Local Government (Miscellaneous Revenue) | | | 4.50 | | | | 12/01/2013 | | | | 180,000 | | | | 180,000 | |
Gulf Breeze FL Revenue (Miscellaneous Revenue)±§ | | | 1.35 | | | | 12/01/2020 | | | | 5,000,000 | | | | 4,996,850 | |
| | | | |
| 12 | | Wells Fargo Advantage Strategic Municipal Bond Fund | | Portfolio of Investments—December 31, 2011 (Unaudited) |
| | | | | | | | | | | | | | | | |
| Security Name | | Interest Rate | | | Maturity Date | | | Principal | | | Value | |
| | | | | | | | | | | | | | | | |
| | | | |
| Florida (continued) | | | | | | | | | | | | | | | | |
Hillsborough County FL IDA Cigarette Tax Allocation Series A (Tobacco Revenue, AMBAC Insured) | | | 5.50 | % | | | 09/01/2016 | | | $ | 735,000 | | | $ | 749,274 | |
Hillsborough County FL IDA Tampa General Hospital Project Series A (Hospital Revenue) | | | 5.00 | | | | 10/01/2018 | | | | 4,795,000 | | | | 4,978,840 | |
Hillsborough County FL School District (Tax Revenue, AMBAC Insured) | | | 5.00 | | | | 10/01/2014 | | | | 1,000,000 | | | | 1,062,850 | |
Lee County FL HFA (Housing Revenue)(i) | | | 4.50 | | | | 09/15/2012 | | | | 6,470,000 | | | | 6,470,324 | |
Manatee County FL HFA SFHR Series A (Housing Revenue, GNMA/FNMA Insured) | | | 6.57 | | | | 05/01/2039 | | | | 90,000 | | | | 91,865 | |
Miami Dade County FL HFA Multifamily Housing Sunset Bay Apartments Project Series 5A (Housing Revenue, AGM Insured) | | | 6.05 | | | | 01/01/2041 | | | | 200,000 | | | | 202,048 | |
Miami FL Special Obligation (GO - Local, AGM Insured) | | | 5.00 | | | | 02/01/2017 | | | | 1,000,000 | | | | 1,093,570 | |
Miami FL Special Obligation (GO - Local, AGM Insured) | | | 5.00 | | | | 02/01/2018 | | | | 2,905,000 | | | | 3,194,193 | |
Mid-Bay Bridge Authority Florida Series B (Transportation Revenue) | | | 5.00 | | | | 10/01/2016 | | | | 2,000,000 | | | | 2,038,880 | |
Orange County FL Tourist Development Tax (Miscellaneous Revenue, AMBAC MBIA-IBC Insured) | | | 6.00 | | | | 10/01/2016 | | | | 285,000 | | | | 310,091 | |
Orlando FL Housing Authority West Oaks Apartments Projects Puttable (Housing Revenue, FNMA Insured) | | | 5.05 | | | | 08/01/2033 | | | | 3,500,000 | | | | 3,726,695 | |
Seminole Tribe FL Series 2010A (Miscellaneous Revenue) 144A | | | 5.13 | | | | 10/01/2017 | | | | 3,450,000 | | | | 3,503,475 | |
Tampa FL Home Mortgage (Housing Revenue)(z) | | | 9.16 | | | | 10/01/2014 | | | | 475,000 | | | | 148,575 | |
Volusia County FL School Board (Tax Revenue) | | | 5.00 | | | | 10/01/2016 | | | | 3,055,000 | | | | 3,405,592 | |
| | | | |
| | | | | | | | | | | | | | | 65,640,466 | |
| | | | | | | | | | | | | | | | |
| | | | |
| Georgia: 2.37% | | | | | | | | | | | | | | | | |
Augusta GA Multifamily Housing Ashton Bon Air LP (Housing Revenue, GNMA Insured) | | | 4.90 | | | | 11/20/2024 | | | | 1,040,000 | | | | 991,827 | |
Cherokee County GA Water & Sewer (Water & Sewer Revenue, NATL-RE Insured) | | | 6.90 | | | | 08/01/2018 | | | | 5,000 | | | | 5,022 | |
De Kalb County GA Series B (GO - Local) | | | 4.00 | | | | 01/01/2016 | | | | 1,025,000 | | | | 1,054,653 | |
Fulton County GA Residential Care Facilities Authority Lenbrook Project Series A (Hospital Revenue) | | | 5.00 | | | | 07/01/2017 | | | | 1,500,000 | | | | 1,402,545 | |
Main Street Natural Gas Incorporated of Georgia Gas Project Series B (Energy Revenue) | | | 5.00 | | | | 03/15/2015 | | | | 685,000 | | | | 707,516 | |
Main Street Natural Gas Incorporated of Georgia Gas Project Series B (Energy Revenue) | | | 5.00 | | | | 03/15/2016 | | | | 1,405,000 | | | | 1,443,005 | |
Main Street Natural Gas Incorporated of Georgia Gas Project Series B (Energy Revenue) | | | 5.00 | | | | 03/15/2017 | | | | 5,300,000 | | | | 5,423,914 | |
Metropolitan Atlanta Rapid Transportation Authority Sales Tax Series P (Tax Revenue, Societe Generale LOC, AMBAC Insured)±§144A | | | 1.05 | | | | 07/01/2020 | | | | 10,000,000 | | | | 10,000,000 | |
| | | | |
| | | | | | | | | | | | | | | 21,028,482 | |
| | | | | | | | | | | | | | | | |
| | | | |
| Guam: 0.48% | | | | | | | | | | | | | | | | |
Guam Department of Education John F. Kennedy High School Project Series A COP (Lease Revenue) | | | 5.50 | | | | 12/01/2015 | | | | 1,370,000 | | | | 1,405,305 | |
Guam Government Hotel Occupancy Tax (Tax Revenue, Tax Revenue) | | | 5.00 | | | | 11/01/2017 | | | | 500,000 | | | | 546,015 | |
Guam Government Hotel Occupancy Tax Series A (Tax Revenue, Tax Revenue) | | | 5.00 | | | | 11/01/2016 | | | | 1,000,000 | | | | 1,087,400 | |
Guam Government Waterworks Authority Water & Wastewater System (Water & Sewer Revenue) | | | 4.00 | | | | 07/01/2016 | | | | 1,255,000 | | | | 1,227,930 | |
| | | | |
| | | | | | | | | | | | | | | 4,266,650 | |
| | | | | | | | | | | | | | | | |
| | | | |
| Hawaii: 0.05% | | | | | | | | | | | | | | | | |
Hawaii Department of Budget & Finance Hawaiian Electric Company Project (Utilities Revenue, NATL-RE Insured) | | | 5.45 | | | | 11/01/2023 | | | | 415,000 | | | | 414,959 | |
| | | | | | | | | | | | | | | | |
| | | | | | |
| Portfolio of Investments—December 31, 2011 (Unaudited) | | Wells Fargo Advantage Strategic Municipal Bond Fund | | | 13 | |
| | | | | | | | | | | | | | | | |
| Security Name | | Interest Rate | | | Maturity Date | | | Principal | | | Value | |
| | | | | | | | | | | | | | | | |
| | | | |
| Illinois: 12.31% | | | | | | | | | | | | | | | | |
Chicago IL (GO - Local, NATL-RE FGIC Insured)(z) | | | 3.25 | % | | | 01/01/2019 | | | $ | 2,400,000 | | | $ | 1,912,344 | |
Chicago IL (GO - Local, NATL-RE Insured)±§ | | | 5.50 | | | | 01/01/2019 | | | | 2,840,000 | | | | 3,182,561 | |
Chicago IL DCL 2008-068 (, Dexia Credit Local LOC, FSA-CR AMBAC Insured)±§144A | | | 2.25 | | | | 01/01/2022 | | | | 6,355,000 | | | | 6,355,000 | |
Chicago IL Midway Airport Series B (Airport Revenue)±§ | | | 5.00 | | | | 01/01/2034 | | | | 5,000,000 | | | | 5,453,400 | |
Chicago IL Midway Airport Series B (Airport Revenue, NATL-RE Insured) | | | 5.63 | | | | 01/01/2029 | | | | 340,000 | | | | 340,218 | |
Chicago IL O’Hare International Airport (Airport Revenue, AMBAC Insured) | | | 5.75 | | | | 01/01/2017 | | | | 2,440,000 | | | | 2,447,222 | |
Chicago IL O’Hare International Airport (Airport Revenue, AGM Insured) | | | 5.75 | | | | 01/01/2020 | | | | 1,000,000 | | | | 1,067,760 | |
Chicago IL O’Hare International Airport Series A (Airport Revenue, AMBAC Insured) | | | 5.50 | | | | 01/01/2016 | | | | 2,515,000 | | | | 2,522,998 | |
Chicago IL Series A-2 (GO - Local, AMBAC Insured) | | | 5.50 | | | | 01/01/2018 | | | | 5,000,000 | | | | 5,719,450 | |
Chicago IL Series D (GO - Local, AGM Insured)±§ | | | 4.00 | | | | 01/01/2040 | | | | 13,000,000 | | | | 13,000,000 | |
Cook & Du Page Counties IL Combined School District #113A Lemont (Tax Revenue, AGM Insured)(z) | | | 4.41 | | | | 12/01/2018 | | | | 1,505,000 | | | | 1,111,834 | |
Cook County IL GO Community College District #510 South Suburban College (Tax Revenue, AGM Insured)(z) | | | 2.17 | | | | 12/01/2015 | | | | 1,090,000 | | | | 1,000,696 | |
Cook County IL School District #122 Ridgeland (Tax Revenue, NATL-RE FGIC Insured)(z) | | | 3.64 | | | | 12/01/2019 | | | | 4,210,000 | | | | 3,157,921 | |
Du Page County IL Community High School District (Tax Revenue, AGM Insured) | | | 5.60 | | | | 01/01/2021 | | | | 2,085,000 | | | | 2,168,066 | |
Huntley IL Special Service Area Number 6 (Tax Revenue) | | | 4.60 | | | | 03/01/2017 | | | | 1,244,000 | | | | 1,265,447 | |
Illinois Development Finance Authority Pollution Power Company Project Series A (IDR, NATL-RE Insured) | | | 5.70 | | | | 02/01/2024 | | | | 250,000 | | | | 250,280 | |
Illinois Development Finance Authority Provena Health Series A (Health Revenue, NATL-RE Insured) | | | 5.25 | | | | 05/15/2012 | | | | 1,000,000 | | | | 1,001,470 | |
Illinois Educational Facilities Authority Series A (Education Revenue) | | | 5.63 | | | | 10/01/2022 | | | | 3,325,000 | | | | 3,353,096 | |
Illinois Finance Authority Student Housing Northern Il University Project (Education Revenue) | | | 5.13 | | | | 10/01/2020 | | | | 4,805,000 | | | | 5,004,071 | |
Illinois GO (Tax Revenue) | | | 5.15 | | | | 07/01/2015 | | | | 1,055,000 | | | | 1,058,629 | |
Illinois GO (Tax Revenue, NATL-RE FGIC Insured) | | | 5.25 | | | | 07/01/2022 | | | | 150,000 | | | | 150,408 | |
Illinois GO (Tax Revenue, AGM Insured) | | | 5.00 | | | | 09/01/2015 | | | | 2,000,000 | | | | 2,218,700 | |
Illinois GO (Tax Revenue) | | | 5.00 | | | | 09/01/2016 | | | | 1,400,000 | | | | 1,506,330 | |
Illinois GO (Tax Revenue) | | | 5.00 | | | | 01/01/2017 | | | | 1,250,000 | | | | 1,410,525 | |
Illinois GO First Series (Tax Revenue) | | | 5.25 | | | | 10/01/2015 | | | | 1,750,000 | | | | 1,809,518 | |
Illinois Series A (Miscellaneous Revenue, NATL-RE Insured) | | | 5.00 | | | | 03/01/2016 | | | | 1,000,000 | | | | 1,063,020 | |
Illinois Series B (GO - State)±§ | | | 3.00 | | | | 10/01/2033 | | | | 17,200,000 | | | | 17,200,000 | |
Illinois Health Facilities Authority Western Medical Facilities Foundation (Health Revenue, NATL-RE Insured) | | | 5.00 | | | | 11/15/2018 | | | | 4,375,000 | | | | 4,379,944 | |
Illinois Housing Development Authority Morningside North Development (Housing Revenue, AGM Housing & Urban Development Section 8 Insured) | | | 5.25 | | | | 01/01/2021 | | | | 7,590,000 | | | | 7,600,247 | |
Kane McHenry Cook & De Kalb Counties IL Unit School District #300 (Tax Revenue, AMBAC Insured)(z) | | | 3.77 | | | | 12/01/2019 | | | | 2,090,000 | | | | 1,551,950 | |
Kendall Kane & Will Counties IL Community Unit School District Series C (Tax Revenue, AGM Insured)(z) | | | 2.97 | | | | 10/01/2017 | | | | 1,350,000 | | | | 1,138,104 | |
Lake County IL Community High School District (Education Revenue, NATL-RE FGIC Insured)(z) | | | 4.04 | | | | 12/01/2017 | | | | 540,000 | | | | 425,660 | |
Lake County IL Community School District (Education Revenue, AMBAC Insured)(z) | | | 3.91 | | | | 02/01/2013 | | | | 340,000 | | | | 325,876 | |
McHenry & Kane Counties IL Community Consolidated School District #158 (Tax Revenue, NATL-RE FGIC Insured)(z) | | | 4.08 | | | | 01/01/2018 | | | | 4,000,000 | | | | 3,135,120 | |
McHenry County IL Community High School District #154 (Tax Revenue)(z) | | | 3.00 | | | | 01/01/2017 | | | | 1,190,000 | | | | 1,024,293 | |
Saint Clair County IL School District Series B (Tax Revenue, NATL-RE FGIC Insured) | | | 4.75 | | | | 01/01/2018 | | | | 655,000 | | | | 716,786 | |
| | | | |
| 14 | | Wells Fargo Advantage Strategic Municipal Bond Fund | | Portfolio of Investments—December 31, 2011 (Unaudited) |
| | | | | | | | | | | | | | | | |
| Security Name | | Interest Rate | | | Maturity Date | | | Principal | | | Value | |
| | | | | | | | | | | | | | | | |
| | | | |
| Illinois (continued) | | | | | | | | | | | | | | | | |
Saint Clair County IL School District Series B (Tax Revenue, NATL-RE FGIC Insured) | | | 4.75 | % | | | 01/01/2019 | | | $ | 775,000 | | | $ | 848,811 | |
Will & Kendall Counties IL Community Consolidated School District # 202 (Tax Revenue, NATL-RE FGIC Insured) | | | 5.00 | | | | 01/01/2017 | | | | 1,270,000 | | | | 1,333,475 | |
| | | | |
| | | | | | | | | | | | | | | 109,211,230 | |
| | | | | | | | | | | | | | | | |
| | | | |
| Indiana: 1.73% | | | | | | | | | | | | | | | | |
Delaware County IN Industrial Corporation Lease Rental (Lease Revenue, NATL-RE Insured) | | | 5.00 | | | | 12/01/2012 | | | | 5,000 | | �� | | 5,009 | |
Indiana Bond Bank Special Program BMA Index Series B2 (Energy Revenue)±§ | | | 0.76 | | | | 10/15/2022 | | | | 4,430,000 | | | | 3,518,838 | |
Indiana HEFA Ascension Health Project Series B3 (Health Revenue)±§ | | | 1.74 | | | | 11/15/2031 | | | | 11,000,000 | | | | 10,991,200 | |
Indiana HFFA Ancilla System Incorporated (Health Revenue, NATL-RE Insured) | | | 5.25 | | | | 07/01/2022 | | | | 325,000 | | | | 326,290 | |
Madison County IN Hospital Authority Facilities Community Hospital of Anderson Series A (Health Revenue, NATL-RE Insured) | | | 8.00 | | | | 01/01/2014 | | | | 490,000 | | | | 492,450 | |
| | | | |
| | | | | | | | | | | | | | | 15,333,787 | |
| | | | | | | | | | | | | | | | |
| | | | |
| Iowa: 0.46% | | | | | | | | | | | | | | | | |
Iowa State Student Loan Liquidity Corporation Series A1 (Education Revenue) | | | 3.88 | | | | 12/01/2016 | | | | 3,050,000 | | | | 3,075,773 | |
Iowa State Student Loan Liquidity Corporation Series A1 (Education Revenue) | | | 4.13 | | | | 12/01/2017 | | | | 1,000,000 | | | | 1,011,240 | |
| | | | |
| | | | | | | | | | | | | | | 4,087,013 | |
| | | | | | | | | | | | | | | | |
| | | | |
| Kansas: 1.73% | | | | | | | | | | | | | | | | |
Burlington KS Environmental Impact Kansas City Power & Light Series B (IDR, FGIC Insured)±§ | | | 5.38 | | | | 09/01/2035 | | | | 5,275,000 | | | | 5,537,748 | |
Kansas State Development Finance Authority (Lease Revenue) | | | 5.00 | | | | 11/15/2015 | | | | 500,000 | | | | 555,415 | |
Wyandotte County & Kansas City KS Unified Government Special Obligation International Speedway (Tax Revenue, NATL-RE Insured)(z) | | | 4.67 | | | | 12/01/2014 | | | | 1,465,000 | | | | 1,279,868 | |
Wyandotte County & Kansas City KS United Government Special Obligation Sales Tax Second Lien Series A (Tax Revenue)(z) | | | 4.87 | | | | 06/01/2021 | | | | 12,500,000 | | | | 7,937,375 | |
| | | | |
| | | | | | | | | | | | | | | 15,310,406 | |
| | | | | | | | | | | | | | | | |
| | | | |
| Kentucky: 0.56% | | | | | | | | | | | | | | | | |
Christian County KY Hospital (Hospital Revenue, Assured Guaranty Insured) | | | 5.25 | | | | 02/01/2018 | | | | 1,520,000 | | | | 1,651,647 | |
Kentucky EDFA (Lease Revenue) | | | 5.25 | | | | 05/15/2017 | | | | 2,000,000 | | | | 2,003,980 | |
Pikeville KY Hospital (Hospital Revenue) | | | 4.00 | | | | 03/01/2015 | | | | 750,000 | | | | 779,888 | |
Pikeville KY Hospital (Hospital Revenue) | | | 5.00 | | | | 03/01/2016 | | | | 500,000 | | | | 544,900 | |
| | | | |
| | | | | | | | | | | | | | | 4,980,415 | |
| | | | | | | | | | | | | | | | |
| | | | |
| Louisiana: 1.55% | | | | | | | | | | | | | | | | |
East Baton Rouge LA Sewer Commission Revenue (Utilities Revenue)±§ | | | 0.99 | | | | 02/01/2046 | | | | 8,000,000 | | | | 7,990,400 | |
Louisiana Government Environmental Facilities CDA Series A (Miscellaneous Revenue, AMBAC Insured) | | | 6.30 | | | | 07/01/2030 | | | | 3,800,000 | | | | 3,875,126 | |
Louisiana HFA SFHR AMT Series A-2 (Housing Revenue, GNMA/FNMA Insured) | | | 6.30 | | | | 12/01/2019 | | | | 90,000 | | | | 91,840 | |
Louisiana HFA SFHR AMT Series B-2 (Housing Revenue, GNMA/FNMA Insured) | | | 5.55 | | | | 06/01/2019 | | | | 390,000 | | | | 399,762 | |
Louisiana HFA SFHR AMT Series C (Housing Revenue, GNMA/FNMA Insured)±§ | | | 6.30 | | | | 06/01/2020 | | | | 50,000 | | | | 51,022 | |
Louisiana HFA SFHR Home Owner Series C-2 (Housing Revenue, GNMA Insured) | | | 5.55 | | | | 06/01/2035 | | | | 220,000 | | | | 229,236 | |
Terrebonne Parish LA Hospital Service District #1 Hospital (Health Revenue) | | | 4.00 | | | | 04/01/2015 | | | | 600,000 | | | | 630,714 | |
Terrebonne Parish LA Hospital Service District #1 Hospital (Health Revenue) | | | 4.00 | | | | 04/01/2016 | | | | 500,000 | | | | 530,065 | |
| | | | |
| | | | | | | | | | | | | | | 13,798,165 | |
| | | | | | | | | | | | | | | | |
| | | | | | |
| Portfolio of Investments—December 31, 2011 (Unaudited) | | Wells Fargo Advantage Strategic Municipal Bond Fund | | | 15 | |
| | | | | | | | | | | | | | | | |
| Security Name | | Interest Rate | | | Maturity Date | | | Principal | | | Value | |
| | | | | | | | | | | | | | | | |
| | | | |
| Maine: 0.04% | | | | | | | | | | | | | | | | |
Maine Municipal Bond Bank Series B (Miscellaneous Revenue, GO of Bond Bank Insured) | | | 5.85 | % | | | 11/01/2020 | | | $ | 360,000 | | | $ | 361,537 | |
| | | | | | | | | | | | | | | | |
| | | | |
| Maryland: 1.30% | | | | | | | | | | | | | | | | |
Baltimore MD Consolidated Public Improvement Series A (Tax Revenue, FGIC Insured)±(a)(m)(n) | | | 0.21 | | | | 10/01/2022 | | | | 6,125,000 | | | | 5,616,163 | |
Baltimore MD Consolidated Public Improvement Series A (Tax Revenue, AGM Insured)±(a)(m)(n) | | | 0.21 | | | | 10/15/2020 | | | | 4,300,000 | | | | 4,029,381 | |
Maryland Community Development Administration Department Housing & Community Development Series 2001B (Housing Revenue, FHA GNMA Housing & Urban Development MHF Insured) | | | 5.10 | | | | 07/01/2016 | | | | 285,000 | | | | 285,348 | |
Maryland Community Development Administration Department Housing & Community Development Series D (Housing Revenue) | | | 5.38 | | | | 09/01/2024 | | | | 500,000 | | | | 500,350 | |
Maryland State Health & Higher Educational Facilities Revenue (Health Revenue) | | | 5.00 | | | | 08/15/2014 | | | | 1,000,000 | | | | 1,086,450 | |
| | | | |
| | | | | | | | | | | | | | | 11,517,692 | |
| | | | | | | | | | | | | | | | |
| | | | |
| Massachusetts: 1.26% | | | | | | | | | | | | | | | | |
Massachusetts Port Authority US Airways Project (IDR, NATL-RE Insured) | | | 5.25 | | | | 09/01/2012 | | | | 935,000 | | | | 927,707 | |
Massachusetts Port Authority US Airways Project (IDR, NATL-RE Insured) | | | 5.25 | | | | 09/01/2013 | | | | 1,610,000 | | | | 1,577,381 | |
Massachusetts Port Authority US Airways Project Series A (IDR, NATL-RE Insured) | | | 5.88 | | | | 09/01/2023 | | | | 3,355,000 | | | | 2,977,328 | |
Massachusetts Port Authority US Airways Project Series A (IDR, NATL-RE Insured) | | | 6.00 | | | | 09/01/2021 | | | | 2,500,000 | | | | 2,329,500 | |
Massachusetts State HEFASeries E-2 (Health Revenue) | | | 5.00 | | | | 07/01/2016 | | | | 3,035,000 | | | | 3,415,437 | |
| | | | |
| | | | | | | | | | | | | | | 11,227,353 | |
| | | | | | | | | | | | | | | | |
| | | | |
| Michigan: 4.26% | | | | | | | | | | | | | | | | |
Detroit MI Sewage Disposal Refunding Revenue Senior Lien Series C (Water & Sewer Revenue, NATL-RE FGIC Insured) | | | 5.25 | | | | 07/01/2016 | | | | 1,145,000 | | | | 1,248,222 | |
Detroit MI Sewer Disposal System Revenue Series A (Water & Sewer Revenue, NATL-RE FGIC Insured)(z) | | | 3.88 | | | | 07/01/2018 | | | | 4,000,000 | | | | 3,111,560 | |
Detroit MI Sewer Disposal System Revenue Series C (Water & Sewer Revenue, NATL-RE Insured) | | | 5.00 | | | | 07/01/2020 | | | | 2,355,000 | | | | 2,466,933 | |
Detroit MI Sewer Disposal System Revenue Series C (Water & Sewer Revenue, NATL-RE Insured) | | | 5.00 | | | | 07/01/2019 | | | | 5,255,000 | | | | 5,543,762 | |
Detroit MI Water Supply System Second Lien Series A (Water & Sewer Revenue, NATL-RE FGIC Insured) | | | 5.00 | | | | 07/01/2021 | | | | 5,000,000 | | | | 5,276,450 | |
Detroit MI Water Supply System Series A (Water & Sewer Revenue, NATL-RE Insured)±§ | | | 5.25 | | | | 07/01/2020 | | | | 3,405,000 | | | | 3,653,463 | |
Detroit MI Water Supply System Series C (Water & Sewer Revenue, NATL-RE FGIC Insured) | | | 5.00 | | | | 07/01/2018 | | | | 3,235,000 | | | | 3,478,175 | |
Grand Haven MI Electric Revenue (Electric Utilities, NATL-RE Insured) | | | 5.50 | | | | 07/01/2016 | | | | 1,000,000 | | | | 1,109,010 | |
Michigan HFA St. John Health System Series A (Health Revenue, AMBAC Insured) | | | 5.00 | | | | 05/15/2018 | | | | 300,000 | | | | 301,122 | |
Michigan Housing Development Authority SFHR Bond Series A (Housing Revenue) | | | 3.95 | | | | 12/01/2012 | | | | 660,000 | | | | 671,378 | |
Michigan Municipal Bond Authority (Miscellaneous Revenue, AMBAC Insured) | | | 4.13 | | | | 05/01/2020 | | | | 500,000 | | | | 463,185 | |
Michigan Municipal Bond Authority (Miscellaneous Revenue, AMBAC Insured) | | | 5.00 | | | | 11/01/2015 | | | | 150,000 | | | | 156,962 | |
Michigan Municipal Bond Authority (Miscellaneous Revenue, AMBAC Insured) | | | 5.00 | | | | 05/01/2018 | | | | 595,000 | | | | 607,977 | |
Michigan Municipal Bond Authority Department of Treasury (Miscellaneous Revenue, AMBAC Insured)(z) | | | 2.93 | | | | 05/01/2013 | | | | 500,000 | | | | 480,860 | |
| | | | |
| 16 | | Wells Fargo Advantage Strategic Municipal Bond Fund | | Portfolio of Investments—December 31, 2011 (Unaudited) |
| | | | | | | | | | | | | | | | |
| Security Name | | Interest Rate | | | Maturity Date | | | Principal | | | Value | |
| | | | | | | | | | | | | | | | |
| | | | |
| Michigan (continued) | | | | | | | | | | | | | | | | |
Michigan Municipal Bond Authority Detroit City School District (Education Revenue, AGM Insured) | | | 5.00 | % | | | 06/01/2016 | | | $ | 1,170,000 | | | $ | 1,251,572 | |
Michigan Municipal Bond Authority Government Loan Program Series C (Miscellaneous Revenue, AMBAC Insured) | | | 3.75 | | | | 05/01/2012 | | | | 100,000 | | | | 100,229 | |
Michigan State Finance Authority Revenue (Miscellaneous Revenue) | | | 5.00 | | | | 06/01/2014 | | | | 3,300,000 | | | | 3,467,838 | |
Michigan State Hospital Finance Authority (Health Revenue) | | | 5.50 | | | | 11/01/2016 | | | | 2,450,000 | | | | 2,599,646 | |
Saginaw County MI Economic Development Corporation Limited Obligation Lease (Lease Revenue) | | | 3.00 | | | | 12/01/2015 | | | | 905,000 | | | | 927,335 | |
Wayne County MI GO Building Authority Capital Series A (Tax Revenue, NATL-RE Insured) | | | 5.25 | | | | 06/01/2016 | | | | 855,000 | | | | 858,275 | |
| | | | |
| | | | | | | | | | | | | | | 37,773,954 | |
| | | | | | | | | | | | | | | | |
| | | | |
| Minnesota: 1.72% | | | | | | | | | | | | | | | | |
Minnesota Agricultural��& Economic Development Board Health Care Facilities (Hospital Revenue) | | | 4.75 | | | | 02/15/2015 | | | | 2,500,000 | | | | 2,568,950 | |
Minnesota Tobacco Securitization Authority Series B (Tobacco Revenue) | | | 5.00 | | | | 03/01/2019 | | | | 9,000,000 | | | | 10,153,620 | |
St. Paul MN Housing & Redevelopment Authority Health Care (Health Revenue) | | | 3.00 | | | | 02/01/2012 | | | | 1,250,000 | | | | 1,251,900 | |
St. Paul MN Port Authority IDA Series K (IDR, FGIC-TCR Insured) | | | 9.50 | | | | 12/01/2014 | | | | 155,000 | | | | 89,900 | |
St. Paul MN Port Authority IDA Series N (IDR, FGIC-TCR Insured) | | | 10.00 | | | | 12/01/2014 | | | | 165,000 | | | | 95,700 | |
Washington County MN Housing & Redevelopment Authority Hospital Facility (Health Revenue) | | | 5.25 | | | | 11/15/2012 | | | | 1,100,000 | | | | 1,100,308 | |
| | | | |
| | | | | | | | | | | | | | | 15,260,378 | |
| | | | | | | | | | | | | | | | |
| | | | |
| Mississippi: 0.28% | | | | | | | | | | | | | | | | |
Biloxi MS Multifamily Housing Pass Pointe Apartments Series A (Housing Revenue, FHA Insured) | | | 5.65 | | | | 12/01/2017 | | | | 2,145,000 | | | | 2,235,626 | |
Gulfport MS Hospital Facilities Gulfport Memorial Hospital Series A (Health Revenue, NATL-RE Insured) | | | 6.20 | | | | 07/01/2018 | | | | 200,000 | | | | 200,498 | |
Jackson MS Multifamily Housing Forest Park Apartments Series A (Housing Revenue, GNMA FHA Housing & Urban Development Section 8 Insured) | | | 6.10 | | | | 04/20/2032 | | | | 55,000 | | | | 57,938 | |
| | | | |
| | | | | | | | | | | | | | | 2,494,062 | |
| | | | | | | | | | | | | | | | |
| | | | |
| Missouri: 1.25% | | | | | | | | | | | | | | | | |
Kansas City MO IDA Transportation Improvements (Transportation Revenue) | | | 4.00 | | | | 09/01/2013 | | | | 1,100,000 | | | | 1,120,141 | |
Kansas City MO IDA Transportation Improvements (Transportation Revenue) | | | 4.00 | | | | 09/01/2014 | | | | 685,000 | | | | 697,433 | |
Missouri State Environmental Improvement & Energy Resources Authority Kansas City Power & Light Corporation Project (IDR)±§ | | | 4.90 | | | | 05/01/2038 | | | | 360,000 | | | | 375,325 | |
Sikeston MO Electric (Utilities Revenue, NATL-RE Insured) | | | 5.00 | | | | 06/01/2012 | | | | 470,000 | | | | 471,401 | |
Sikeston MO Electric (Utilities Revenue, NATL-RE Insured) | | | 6.00 | | | | 06/01/2015 | | | | 3,000,000 | | | | 3,318,630 | |
St. Louis MO Series 004 (Airport Revenue, FSA Insured, Dexia Credit Local LOC)± | | | 1.98 | | | | 07/01/2026 | | | | 3,365,000 | | | | 3,365,000 | |
St. Louis MO Municipal Finance Corporation (Lease Revenue, AMBAC Insured) | | | 5.25 | | | | 02/15/2016 | | | | 1,725,000 | | | | 1,735,661 | |
| | | | |
| | | | | | | | | | | | | | | 11,083,591 | |
| | | | | | | | | | | | | | | | |
| | | | |
| Nebraska: 0.38% | | | | | | | | | | | | | | | | |
Central Plains NE Energy Project # 1 Series A (Energy Revenue) | | | 5.00 | | | | 12/01/2013 | | | | 100,000 | | | | 104,066 | |
Central Plains NE Energy Project # 1 Series A (Energy Revenue) | | | 5.25 | | | | 12/01/2018 | | | | 1,000,000 | | | | 1,017,940 | |
Nebraska Higher Education Loan (Education Revenue, NATL-RE GO of Corporation Insured)(z) | | | 7.31 | | | | 12/15/2015 | | | | 2,970,000 | | | | 2,237,539 | |
| | | | |
| | | | | | | | | | | | | | | 3,359,545 | |
| | | | | | | | | | | | | | | | |
| | | | | | |
| Portfolio of Investments—December 31, 2011 (Unaudited) | | Wells Fargo Advantage Strategic Municipal Bond Fund | | | 17 | |
| | | | | | | | | | | | | | | | |
| Security Name | | Interest Rate | | | Maturity Date | | | Principal | | | Value | |
| | | | | | | | | | | | | | | | |
| | | | |
| Nevada: 0.56% | | | | | | | | | | | | | | | | |
Clark County NV Jet Aviation Fuel Tax Series C (Airport Revenue, AMBAC Insured) | | | 5.38 | % | | | 07/01/2016 | | | $ | 1,820,000 | | | $ | 1,901,791 | |
Clark County NV Jet Aviation Fuel Tax Series C (Airport Revenue, AMBAC Insured) | | | 5.38 | | | | 07/01/2018 | | | | 2,000,000 | | | | 2,079,480 | |
Reno NV Redevelopment Agency Tax Allocation Lien F (Tax Revenue, NATL-RE Insured) | | | 5.00 | | | | 09/01/2012 | | | | 1,000,000 | | | | 1,001,620 | |
| | | | |
| | | | | | | | | | | | | | | 4,982,891 | |
| | | | | | | | | | | | | | | | |
| | | | |
| New Hampshire: 0.40% | | | | | | | | | | | | | | | | |
New Hampshire HEFA Covenant Health Project Series B (Health Revenue) | | | 5.00 | | | | 07/01/2016 | | | | 945,000 | | | | 1,031,127 | |
New Hampshire HFA SFHR Mortgage Acquisition AMT Series B (Housing Revenue) | | | 4.85 | | | | 07/01/2015 | | | | 390,000 | | | | 402,004 | |
New Hampshire HFA SFHR Mortgage Acquisition Series E (Housing Revenue) | | | 4.65 | | | | 07/01/2014 | | | | 320,000 | | | | 328,704 | |
New Hampshire Higher Education & Health Facilities Authority Cheshire Medical Center (Health Revenue) | | | 5.13 | | | | 07/01/2018 | | | | 1,795,000 | | | | 1,798,339 | |
| | | | |
| | | | | | | | | | | | | | | 3,560,174 | |
| | | | | | | | | | | | | | | | |
| | | | |
| New Jersey: 3.96% | | | | | | | | | | | | | | | | |
New Jersey Casino Reinvestment Development Authority (Tax Revenue, AMBAC Insured) | | | 5.00 | | | | 01/01/2013 | | | | 2,190,000 | | | | 2,232,946 | |
New Jersey EDA Elite Pharmaceuticals Project Series A (IDR) | | | 6.50 | | | | 09/01/2030 | | | | 700,000 | | | | 350,077 | |
New Jersey EDA Series C (Miscellaneous Revenue, State Appropriations Insured)±§ | | | 1.90 | | | | 02/01/2018 | | | | 6,500,000 | | | | 6,525,090 | |
New Jersey EDA Series E (Miscellaneous Revenue, State Appropriations Insured)±§ | | | 1.78 | | | | 02/01/2016 | | | | 5,600,000 | | | | 5,649,168 | |
New Jersey Housing & Mortgage Finance Agency Multifamily Housing Series A (Housing Revenue, AMBAC FHA Insured) | | | 5.55 | | | | 05/01/2027 | | | | 225,000 | | | | 225,025 | |
New Jersey State Turnpike Authority Series C-3 (Transportation Revenue, AGM Insured)± | | | 1.00 | | | | 01/01/2024 | | | | 7,000,000 | | | | 7,000,000 | |
New Jersey State Turnpike Authority Series C-2 (Transportation Revenue, AGM Insured)± | | | 1.00 | | | | 01/01/2024 | | | | 10,000,000 | | | | 10,000,000 | |
Newark NJ Housing Authority (Lease Revenue, NATL-RE Insured) | | | 5.25 | | | | 01/01/2019 | | | | 2,995,000 | | | | 3,165,475 | |
| | | | |
| | | | | | | | | | | | | | | 35,147,781 | |
| | | | | | | | | | | | | | | | |
| | | | |
| New Mexico: 1.14% | | | | | | | | | | | | | | | | |
Albuquerque NM IDR Manor Nursing Series A (Health Revenue, GNMA Insured) | | | 4.80 | | | | 05/20/2014 | | | | 755,000 | | | | 757,137 | |
Dona Ana County NM Tax Revenue (Tax Revenue, AMBAC Insured) | | | 5.50 | | | | 06/01/2016 | | | | 250,000 | | | | 273,255 | |
Dona Ana County NM Tax Revenue Receipts (Tax Revenue, AMBAC Insured) | | | 5.50 | | | | 06/01/2015 | | | | 1,000,000 | | | | 1,075,520 | |
New Mexico Educational Assistance Foundation Series A-2 (Education Revenue, Guaranteed Student Loans Insured)±§ | | | 1.22 | | | | 12/01/2028 | | | | 8,060,000 | | | | 8,020,667 | |
| | | | |
| | | | | | | | | | | | | | | 10,126,579 | |
| | | | | | | | | | | | | | | | |
| | | | |
| New York: 9.59% | | | | | | | | | | | | | | | | |
Metropolitan Transportation Authority New York Dedicated Tax Fund (Transportation Revenue, AGM Insured)±§ | | | 1.25 | | | | 11/01/2022 | | | | 13,200,000 | | | | 13,200,000 | |
Metropolitan Transportation Authority New York Commuter Facilities Series D (Transportation Revenue, NATL-RE Insured) | | | 5.00 | | | | 07/01/2012 | | | | 100,000 | | | | 101,858 | |
Metropolitan Transportation Authority New York Series B-2 (Miscellaneous Revenue, AGM Insured)±§(a)(m) | | | 0.59 | | | | 11/01/2022 | | | | 5,000,000 | | | | 4,272,744 | |
Monroe County NY Industrial Development Corporation Unity Hospital Rochester Project (Health Revenue, FHA Insured) | | | 4.20 | | | | 08/15/2025 | | | | 7,195,000 | | | | 7,346,167 | |
New York City NY Municipal Water Finance Authority Series C (Water & Sewer Revenue)± | | | 0.76 | | | | 06/15/2033 | | | | 500,000 | | | | 500,000 | |
| | | | |
| 18 | | Wells Fargo Advantage Strategic Municipal Bond Fund | | Portfolio of Investments—December 31, 2011 (Unaudited) |
| | | | | | | | | | | | | | | | |
| Security Name | | Interest Rate | | | Maturity Date | | | Principal | | | Value | |
| | | | | | | | | | | | | | | | |
| | | | |
| New York (continued) | | | | | | | | | | | | | | | | |
New York Dormitory Authority Ellis Hospital Mortgage Project (Health Revenue, NATL-RE FHA Insured) | | | 5.50 | % | | | 08/01/2015 | | | $ | 1,275,000 | | | $ | 1,278,749 | |
New York Environmental Facilities Corporation Spring Valley Water Series A (Water & Sewer Revenue, AMBAC Insured) | | | 6.30 | | | | 08/01/2024 | | | | 900,000 | | | | 901,269 | |
New York NY Sub Series F-2 (Tax Revenue)±§ | | | 4.40 | | | | 12/15/2017 | | | | 4,000,000 | | | | 4,233,120 | |
New York NY City Housing Authority Lease Purchase Agreement (Housing Revenue)(i) | | | 4.78 | | | | 01/06/2016 | | | | 3,427,327 | | | | 3,478,737 | |
New York NY GO Sub-Series A1 (Tax Revenue)±§ | | | 5.75 | | | | 08/01/2014 | | | | 75,000 | | | | 75,325 | |
New York State Dormitory Authority Revenues (Education Revenue, NATL-RE FGIC FHA Insured) | | | 5.00 | | | | 08/01/2016 | | | | 1,000,000 | | | | 1,097,870 | |
New York State Dormitory Authority Revenues (Education Revenue) | | | 5.25 | | | | 08/15/2015 | | | | 1,910,000 | | | | 2,071,605 | |
New York State Energy Research & New York State Power (Utilities Revenue) | | | 2.13 | | | | 03/15/2015 | | | | 3,500,000 | | | | 3,498,880 | |
New York State Local Government Assistance Corporation (Tax Revenue)±§(a) | | | 0.05 | | | | 04/01/2017 | | | | 7,500,000 | | | | 7,051,356 | |
New York Urban Development Corporation Sub Lien (Housing Revenue, Housing & Urban Development 236 GO of Corporation Insured) | | | 5.50 | | | | 07/01/2016 | | | | 310,000 | | | | 311,234 | |
Newburgh NY (Tax Revenue) | | | 5.00 | | | | 11/02/2012 | | | | 2,532,824 | | | | 2,534,040 | |
Niagara County NY IDA Solid Waste Disposal (Resource Recovery Revenue)±§ | | | 5.55 | | | | 11/15/2024 | | | | 3,905,000 | | | | 3,945,378 | |
Peregrines Landing LLC Facilities Series A (Miscellaneous Revenue, GNMA Insured) | | | 7.00 | | | | 05/20/2044 | | | | 5,680,000 | | | | 6,004,782 | |
Suffolk County NY Series I (Tax Revenue) | | | 2.00 | | | | 07/12/2012 | | | | 22,000,000 | | | | 22,091,520 | |
Suffolk County NY Economic Development Corporation (Tax Revenue) | | | 5.00 | | | | 07/01/2017 | | | | 1,000,000 | | | | 1,129,430 | |
| | | | |
| | | | | | | | | | | | | | | 85,124,064 | |
| | | | | | | | | | | | | | | | |
| | | | |
| North Carolina: 0.06% | | | | | | | | | | | | | | | | |
North Carolina Capital Facilities Financing Agency Waste Management of Carolinas Project (Resource Recovery Revenue)±§ | | | 3.38 | | | | 08/01/2014 | | | | 540,000 | | | | 556,821 | |
| | | | | | | | | | | | | | | | |
| | | | |
| Ohio: 3.15% | | | | | | | | | | | | | | | | |
Akron OH Sewer System Revenue (Water & Sewer Revenue, AMBAC Insured) | | | 5.00 | | | | 12/01/2017 | | | | 750,000 | | | | 821,490 | |
Akron Ohio Income Tax Revenue Community Learning Centers Series A (Tax Revenue, NATL-RE FGIC Insured) | | | 5.25 | | | | 12/01/2017 | | | | 4,970,000 | | | | 5,328,834 | |
Franklin County OH Hospital Ohio Health Corporation Series C (Hospital Revenue) | | | 5.00 | | | | 05/15/2019 | | | | 4,925,000 | | | | 5,114,662 | |
Ohio Housing Finance Agency SFHR Bond (Housing Revenue, FGIC FHA VA Private Mortgages Insured)(z) | | | 8.11 | | | | 01/15/2015 | | | | 15,000 | | | | 11,792 | |
Ohio State Air Quality Development Authority (IDR) | | | 5.38 | | | | 11/01/2015 | | | | 2,460,000 | | | | 2,475,203 | |
Ohio State Air Quality Development Authority PCR Series A (IDR)±§ | | | 2.25 | | | | 12/01/2023 | | | | 8,055,000 | | | | 8,082,629 | |
Ohio State Water Development Authority Solid Waste Management Incorporated Project (Resource Recovery Revenue)±§ | | | 1.75 | | | | 06/01/2013 | | | | 2,000,000 | | | | 2,014,860 | |
Ohio State Water Development Authority Solid Waste Revenue (Resource Recovery Revenue) | | | 5.15 | | | | 07/15/2015 | | | | 3,500,000 | | | | 3,560,235 | |
Woodridge OH Local School District (Tax Revenue, AMBAC Insured) | | | 6.80 | | | | 12/01/2014 | | | | 475,000 | | | | 511,124 | |
| | | | |
| | | | | | | | | | | | | | | 27,920,829 | |
| | | | | | | | | | | | | | | | |
| | | | |
| Oklahoma: 0.22% | | | | | | | | | | | | | | | | |
Tulsa OK Airports Improvement Trust (Airport Revenue) | | | 4.75 | | | | 06/01/2018 | | | | 325,000 | | | | 342,232 | |
Tulsa OK Airports Improvement Trust (Airport Revenue) | | | 5.00 | | | | 06/01/2019 | | | | 1,500,000 | | | | 1,582,020 | |
| | | | |
| | | | | | | | | | | | | | | 1,924,252 | |
| | | | | | | | | | | | | | | | |
| | | | | | |
| Portfolio of Investments—December 31, 2011 (Unaudited) | | Wells Fargo Advantage Strategic Municipal Bond Fund | | | 19 | |
| | | | | | | | | | | | | | | | |
| Security Name | | Interest Rate | | | Maturity Date | | | Principal | | | Value | |
| | | | | | | | | | | | | | | | |
| | | | |
| Oregon: 0.33% | | | | | | | | | | | | | | | | |
Oregon Board Bank Oregon Economic Community Development Department Series A (Miscellaneous Revenue, NATL-RE Insured) | | | 5.50 | % | | | 01/01/2019 | | | $ | 420,000 | | | $ | 420,063 | |
Port of Astoria OR PCR James River Project (IDR) | | | 6.55 | | | | 02/01/2015 | | | | 2,500,000 | | | | 2,502,750 | |
| | | | |
| | | | | | | | | | | | | | | 2,922,813 | |
| | | | | | | | | | | | | | | | |
| | | | |
| Other: 0.89% | | | | | | | | | | | | | | | | |
Branch Banking & Trust Municipal Trust (Miscellaneous Revenue)±§144A | | | 0.97 | | | | 08/01/2014 | | | | 6,430,000 | | | | 6,427,942 | |
San Manuel Entertainment Authority Series 2004-C (Tax Revenue) 144A | | | 4.50 | | | | 12/01/2016 | | | | 1,500,000 | | | | 1,477,860 | |
| | | | |
| | | | | | | | | | | | | | | 7,905,802 | |
| | | | | | | | | | | | | | | | |
| | | | |
| Pennsylvania: 3.23% | | | | | | | | | | | | | | | | |
Allentown PA School District (Education Revenue, NATL-RE FGIC State Aid Withholding Insured)(z) | | | 2.97 | | | | 02/15/2014 | | | | 500,000 | | | | 469,430 | |
Delaware County PA IDA Chester Community Charter School (Miscellaneous Revenue) | | | 4.50 | | | | 08/15/2017 | | | | 5,535,000 | | | | 5,534,723 | |
Delaware Valley PA Regional Finance Authority (Miscellaneous Revenue) | | | 5.75 | | | | 07/01/2017 | | | | 5,026,000 | | | | 5,796,637 | |
Harrisburg PA Authority Resource Recovery Facility Series D-1 (Resource Recovery Revenue, AGM Insured)±§ | | | 5.25 | | | | 12/01/2033 | | | | 2,000,000 | | | | 1,992,060 | |
Harrisburg PA Authority Resources Guaranteed Subordinated Series D-2 (Resource Recovery Revenue, AGM Insured)±§ | | | 5.00 | | | | 12/01/2033 | | | | 2,260,000 | | | | 2,256,158 | |
Northampton County PA Hospital Saint Luke’s Hospital Project Series A (Health Revenue) | | | 4.00 | | | | 08/15/2012 | | | | 1,085,000 | | | | 1,098,747 | |
Pennsylvania EDFA Colver Project Series F (Resource Recovery Revenue, AMBAC Insured) | | | 5.00 | | | | 12/01/2012 | | | | 1,425,000 | | | | 1,441,031 | |
Pennsylvania EDFA Colver Project Series F (Resource Recovery Revenue, AMBAC Insured) | | | 5.00 | | | | 12/01/2014 | | | | 1,000,000 | | | | 1,017,330 | |
Pennsylvania State HEFAR Saint Joseph’s University (Education Revenue, Radian Insured) | | | 5.25 | | | | 12/15/2017 | | | | 1,025,000 | | | | 1,048,801 | |
Pennsylvania State IDA (Miscellaneous Revenue, AMBAC Insured) | | | 5.50 | | | | 07/01/2018 | | | | 5,000,000 | | | | 5,157,000 | |
Reading PA Series A (GO - Local) | | | 4.00 | | | | 11/15/2014 | | | | 1,780,000 | | | | 1,848,103 | |
Saint Mary Hospital Authority Pennsylvania Health System Catholic Health East Series B (Health Revenue) | | | 5.00 | | | | 11/15/2015 | | | | 930,000 | | | | 1,002,084 | |
| | | | |
| | | | | | | | | | | | | | | 28,662,104 | |
| | | | | | | | | | | | | | | | |
| | | | |
| Puerto Rico: 2.61% | | | | | | | | | | | | | | | | |
Puerto Rico Commonwealth (Tax Revenue, AGM Insured)±§ | | | 2.50 | | | | 07/01/2018 | | | | 6,000,000 | | | | 6,000,000 | |
Puerto Rico Commonwealth (Tax Revenue, AGM Insured) | | | 5.00 | | | | 07/01/2015 | | | | 1,695,000 | | | | 1,815,142 | |
Puerto Rico Commonwealth Government Development Bank (Miscellaneous Revenue) | | | 1.00 | | | | 11/08/2012 | | | | 6,500,000 | | | | 6,475,430 | |
Puerto Rico Electric Power Authority (Utilities Revenue)±§ | | | 0.93 | | | | 07/01/2025 | | | | 6,200,000 | | | | 4,402,558 | |
Puerto Rico Public Finance Corporation Commonwealth Series A (Miscellaneous Revenue, Government Development Bank for Puerto Rico LOC, AMBAC Insured)±§ | | | 5.25 | | | | 08/01/2030 | | | | 945,000 | | | | 947,816 | |
Puerto Rico Public Finance Corporation Commonwealth Series A (Miscellaneous Revenue, Government Development Bank for Puerto Rico LOC)±§ | | | 5.75 | | | | 08/01/2027 | | | | 3,500,000 | | | | 3,511,935 | |
| | | | |
| | | | | | | | | | | | | | | 23,152,881 | |
| | | | | | | | | | | | | | | | |
| | | | |
| Rhode Island: 0.11% | | | | | | | | | | | | | | | | |
Rhode Island Clean Water Finance Agency Wastewater Treatment System (Lease Revenue, NATL-RE Insured) | | | 5.80 | | | | 09/01/2022 | | | | 950,000 | | | | 950,912 | |
Rhode Island Housing & Mortgage Finance (Housing Revenue) | | | 6.50 | | | | 04/01/2027 | | | | 25,000 | | | | 25,043 | |
| | | | |
| | | | | | | | | | | | | | | 975,955 | |
| | | | | | | | | | | | | | | | |
| | | | |
| 20 | | Wells Fargo Advantage Strategic Municipal Bond Fund | | Portfolio of Investments—December 31, 2011 (Unaudited) |
| | | | | | | | | | | | | | | | |
| Security Name | | Interest Rate | | | Maturity Date | | | Principal | | | Value | |
| | | | | | | | | | | | | | | | |
| | | | |
| South Carolina: 0.80% | | | | | | | | | | | | | | | | |
Berkeley County SC PCR Facilities Generating Company Project (Utilities Revenue) | | | 4.88 | % | | | 10/01/2014 | | | $ | 640,000 | | | $ | 681,101 | |
South Carolina State Jobs & EDA Ebenezer Nursing Home Incorporated (Health Revenue, GNMA Insured) | | | 6.90 | | | | 01/20/2037 | | | | 3,040,000 | | | | 3,075,963 | |
South Carolina State Jobs & EDA (Resource Recovery Revenue) | | | 2.88 | | | | 02/01/2015 | | | | 2,000,000 | | | | 2,009,740 | |
Tobacco Settlement Revenue Management Authority (Tobacco Revenue) | | | 5.00 | | | | 06/01/2018 | | | | 1,300,000 | | | | 1,301,456 | |
| | | | |
| | | | | | | | | | | | | | | 7,068,260 | |
| | | | | | | | | | | | | | | | |
| | | | |
| Tennessee: 2.83% | | | | | | | | | | | | | | | | |
Johnson City TN Health & Educational Facilities Board 1st Mortgage Mountain States (Health Revenue)§ | | | 7.50 | | | | 07/01/2033 | | | | 7,300,000 | | | | 7,722,816 | |
Tennessee Energy Acquisition Corporation Series A (Energy Revenue) | | | 5.25 | | | | 09/01/2018 | | | | 4,000,000 | | | | 4,069,440 | |
Tennessee Energy Acquisition Corporation Series A (Utilities Revenue) | | | 5.25 | | | | 09/01/2017 | | | | 1,500,000 | | | | 1,539,270 | |
Tennessee Energy Acquisition Corporation Series A (Energy Revenue) | | | 5.25 | | | | 09/01/2020 | | | | 4,000,000 | | | | 4,044,120 | |
Tennessee Energy Acquisition Corporation Series C (Energy Revenue) | | | 5.00 | | | | 02/01/2018 | | | | 3,700,000 | | | | 3,715,244 | |
Tennessee Energy Acquisition Corporation Series C (Energy Revenue) | | | 5.00 | | | | 02/01/2019 | | | | 1,000,000 | | | | 998,780 | |
Tennessee Energy Acquisition Corporation Series C (Energy Revenue) | | | 5.00 | | | | 02/01/2020 | | | | 3,000,000 | | | | 2,978,220 | |
| | | | |
| | | | | | | | | | | | | | | 25,067,890 | |
| | | | | | | | | | | | | | | | |
| | | | |
| Texas: 6.64% | | | | | | | | | | | | | | | | |
Austin TX Housing Finance Corporation SFHR (Housing Revenue, Verex Pool Insured)(z) | | | 10.75 | | | | 02/01/2016 | | | | 1,540,000 | | | | 23,208 | |
Bexar County TX Housing Finance Corporation Multifamily Housing Stablewood Farms (Housing Revenue, GNMA Insured) | | | 6.25 | | | | 07/20/2043 | | | | 3,610,000 | | | | 3,794,002 | |
Coastal Water Authority Texas Conveyance System (Water & Sewer Revenue, FGIC Insured) | | | 7.50 | | | | 12/15/2016 | | | | 20,000 | | | | 20,117 | |
Dallas TX Finance Corporation Multifamily Housing Towne Center Apartments Series A (Housing Revenue, GNMA Insured) | | | 6.75 | | | | 10/20/2032 | | | | 939,000 | | | | 959,217 | |
Dallas TX Fort Worth International Airport Series A (Airport Revenue, NATL-RE FGIC Insured) | | | 6.00 | | | | 11/01/2028 | | | | 295,000 | | | | 295,552 | |
Galveston TX Wharves & Terminal Revenue (Port Authority Revenue) | | | 4.00 | | | | 02/01/2016 | | | | 765,000 | | | | 797,344 | |
Galveston TX Wharves & Terminal Revenue (Port Authority Revenue) | | | 5.00 | | | | 02/01/2017 | | | | 1,100,000 | | | | 1,200,210 | |
Galveston TX Wharves & Terminal Revenue (Port Authority Revenue) | | | 5.00 | | | | 02/01/2018 | | | | 1,680,000 | | | | 1,842,389 | |
Houston TX Hotel Occupancy Series B (Tax Revenue, AMBAC Insured)(z) | | | 3.68 | | | | 09/01/2016 | | | | 3,000,000 | | | | 2,527,530 | |
Lubbock TX Health Facilities Development Corporation Lutheran Retirement (Housing Revenue, GNMA Insured) | | | 6.00 | | | | 03/20/2029 | | | | 1,000,000 | | | | 1,014,030 | |
Midtown TX Redevelopment Authority (Lease Revenue) | | | 4.00 | | | | 01/01/2014 | | | | 250,000 | | | | 260,823 | |
Midtown TX Redevelopment Authority (Lease Revenue) | | | 4.00 | | | | 01/01/2016 | | | | 1,980,000 | | | | 2,100,998 | |
Midtown TX Redevelopment Authority (Lease Revenue) | | | 5.00 | | | | 01/01/2017 | | | | 2,270,000 | | | | 2,533,048 | |
North Texas Higher Education Authority Incorporated (Education Revenue)±§ | | | 1.37 | | | | 04/01/2037 | | | | 4,635,000 | | | | 4,593,053 | |
Tarrant County TX Cultural Education Facilities Finance Corporation Retirement Facilities (Health Revenue) | | | 6.50 | | | | 11/15/2014 | | | | 1,500,000 | | | | 1,499,955 | |
Tarrant County TX Cultural Education Facilities Finance Corporation Retirement Facilities Series A-1 (Housing Revenue, GNMA Insured) | | | 5.25 | | | | 09/20/2023 | | | | 175,000 | | | | 187,527 | |
Texas Municipal Gas Acquisition & Supply Corporation I Senior Lien Series D (Energy Revenue) | | | 5.63 | | | | 12/15/2017 | | | | 5,590,000 | | | | 5,948,710 | |
Texas Municipal Gas Acquisition & Supply Corporation II BMA Index Rate (Energy Revenue)±§ | | | 0.57 | | | | 09/15/2017 | | | | 12,175,000 | | | | 11,598,270 | |
Texas Southern University Series A-1 (Education Revenue, NATL-RE Insured) | | | 4.50 | | | | 11/01/2012 | | | | 1,000,000 | | | | 1,001,000 | |
Texas Southern University Series A-1 (Education Revenue, NATL-RE Insured) | | | 4.60 | | | | 11/01/2013 | | | | 1,275,000 | | | | 1,276,109 | |
Texas State Public Finance Authority Unemployment Compensation Series C (Miscellaneous Revenue) | | | 2.60 | | | | 07/01/2020 | | | | 4,310,000 | | | | 4,325,516 | |
| | | | | | |
| Portfolio of Investments—December 31, 2011 (Unaudited) | | Wells Fargo Advantage Strategic Municipal Bond Fund | | | 21 | |
| | | | | | | | | | | | | | | | |
| Security Name | | Interest Rate | | | Maturity Date | | | Principal | | | Value | |
| | | | | | | | | | | | | | | | |
| | | | |
| Texas (continued) | | | | | | | | | | | | | | | | |
Texas Water Development Board Revolving Fund Series A (Miscellaneous Revenue) | | | 5.00 | % | | | 07/15/2017 | | | $ | 8,320,000 | | | $ | 8,351,366 | |
Wood Glen TX Housing Finance Corporation Mortgage Copperwood Project Series A (Miscellaneous Revenue, NATL-RE FHA Insured) | | | 7.65 | | | | 07/01/2022 | | | | 2,125,000 | | | | 2,719,490 | |
| | | | |
| | | | | | | | | | | | | | | 58,869,464 | |
| | | | | | | | | | | | | | | | |
| | | | |
| Utah: 1.40% | | | | | | | | | | | | | | | | |
Intermountain Power Agency Utah Power Supply Series A (Utilities Revenue) | | | 6.15 | | | | 07/01/2014 | | | | 9,270,000 | | | | 9,781,148 | |
Utah County UT Environmental Improvement Marathon Oil Project (IDR)§ | | | 5.38 | | | | 11/01/2015 | | | | 1,800,000 | | | | 1,808,892 | |
Utah HFA RHA Community Services Project Series A (Health Revenue) | | | 6.88 | | | | 07/01/2027 | | | | 860,000 | | | | 832,979 | |
| | | | |
| | | | | | | | | | | | | | | 12,423,019 | |
| | | | | | | | | | | | | | | | |
| | | | |
| Vermont: 0.17% | | | | | | | | | | | | | | | | |
Burlington VT Airport (Airport Revenue) | | | 6.50 | | | | 12/15/2012 | | | | 1,500,000 | | | | 1,500,780 | |
| | | | | | | | | | | | | | | | |
| | | | |
| Virgin Islands: 0.17% | | | | | | | | | | | | | | | | |
Virgin Islands PFA Sub Lien Series C (Miscellaneous Revenue) | | | 5.00 | | | | 10/01/2017 | | | | 1,390,000 | | | | 1,530,029 | |
| | | | | | | | | | | | | | | | |
| | | | |
| Virginia: 0.24% | | | | | | | | | | | | | | | | |
Caroline County VA IDR (Lease Revenue) | | | 4.00 | | | | 08/01/2016 | | | | 2,100,000 | | | | 2,125,263 | |
| | | | | | | | | | | | | | | | |
| | | | |
| Washington: 0.88% | | | | | | | | | | | | | | | | |
King County WA Public Hospital District #01 Valley Medical Center Series A (Health Revenue) | | | 4.00 | | | | 06/15/2015 | | | | 1,185,000 | | | | 1,220,811 | |
King County WA Public Hospital District #01 Valley Medical Center Series A (Health Revenue) | | | 4.00 | | | | 06/15/2016 | | | | 1,480,000 | | | | 1,535,796 | |
Redmond WA Library Capital Facilities Area GO (Tax Revenue) | | | 5.00 | | | | 12/01/2017 | | | | 200,000 | | | | 200,758 | |
Tobacco Settlement Authority Washington (Tobacco Revenue) | | | 6.50 | | | | 06/01/2026 | | | | 4,715,000 | | | | 4,826,085 | |
| | | | |
| | | | | | | | | | | | | | | 7,783,450 | |
| | | | | | | | | | | | | | | | |
| | | | |
| West Virginia: 0.79% | | | | | | | | | | | | | | | | |
Mason County WV PCR (Resource Recovery Revenue)±§ | | | 2.00 | | | | 10/01/2022 | | | | 7,000,000 | | | | 6,994,330 | |
| | | | | | | | | | | | | | | | |
| | | | |
| Wisconsin: 0.34% | | | | | | | | | | | | | | | | |
Wisconsin State HEFA Beloit Health System Incorporation (Health Revenue) | | | 4.00 | | | | 04/01/2014 | | | | 650,000 | | | | 663,962 | |
Wisconsin State HEFA Beloit Health System Incorporation (Health Revenue) | | | 5.00 | | | | 04/01/2015 | | | | 320,000 | | | | 338,202 | |
Wisconsin State HEFA Ministry Health Care Series A (Health Revenue, NATL-RE Insured) | | | 5.13 | | | | 02/15/2022 | | | | 2,000,000 | | | | 2,027,389 | |
| | | | |
| | | | | | | | | | | | | | | 3,029,553 | |
| | | | | | | | | | | | | | | | |
| | | | |
Total Municipal Bonds and Notes (Cost $842,381,444) | | | | | | | | | | | | | | | 848,168,596 | |
| | | | | | | | | | | | | | | | |
| | | | |
Yankee Corporate Bonds and Notes: 0.02% | | | | | | | | | | | | | | | | |
| | | | |
Financials: 0.02% | | | | | | | | | | | | | | | | |
| | | | |
| Diversified Financial Services: 0.02% | | | | | | | | | | | | | | | | |
Banco Do Brasil | | | 3.88 | | | | 01/23/2017 | | | | 200,000 | | | | 197,800 | |
| | | | | | | | | | | | | | | | |
| | | | |
Total Yankee Corporate Bonds and Notes (Cost $198,826) | | | | | | | | | | | | | | | 197,800 | |
| | | | | | | | | | | | | | | | |
| | | | |
| 22 | | Wells Fargo Advantage Strategic Municipal Bond Fund | | Portfolio of Investments—December 31, 2011 (Unaudited) |
| | | | | | | | | | | | | | | | |
| Security Name | | Yield | | | Maturity Date | | | Shares | | | Value | |
| | | | | | | | | | | | | | | | |
| | | |
Short-Term Investments: 0.45% | | | | | | | | | | | | | |
| | | |
| Investment Companies: 0.37% | | | | | | | | | | | | | |
Wells Fargo Advantage National Tax-Free Money Market Fund, Institutional Class(l)(u) | | | 0.01 | % | | | | | | | 3,286,510 | | | $ | 3,286,510 | |
| | | | | | | | | | | | | | | | |
| | | | |
| | | | | | | | | Principal | | | | |
| | | |
| U.S. Treasury Securities: 0.08% | | | | | | | | | | | | | |
U.S. Treasury Bill# | | | 0.01 | | | | 03/29/2012 | | | $ | 700,000 | | | | 699,975 | |
| | | | | | | | | | | | | | | | |
| | | |
Total Short-Term Investments (Cost $3,986,494) | | | | | | | | | | | | 3,986,485 | |
| | | | | | | | | | | | | | | | |
| | | | | | | | |
| Total Investments in Securities | | | | | | | | |
| (Cost $846,566,764)* | | | 96.08 | % | | | 852,352,881 | |
Other Assets and Liabilities, Net | | | 3.92 | | | | 34,758,452 | |
| | | | | | | | |
| Total Net Assets | | | 100.00 | % | | $ | 887,111,333 | |
| | | | | | | | |
| ± | Variable rate investment. |
| § | These securities are subject to a demand feature which reduces the effective maturity. |
| (z) | Zero coupon security. Rate represents yield to maturity. |
| (a) | Security is fair valued by the Management Valuation Team, and in certain instances by the Board of Trustees, in accordance with procedures approved by the Board of Trustees. |
| (n) | Auction to set interest rate on security failed at period end due to insufficient investor interest; failed auction does not itself cause a default. |
| (m) | An auction-rate security whose interest rate resets at predetermined short-term intervals through a Dutch auction; rate shown represents the rate in effect at period-end. |
| 144A | Security that may be resold to “qualified institutional buyers” under Rule 144A or security offered pursuant to Section 4(2) of the Securities Act of 1933, as amended. |
| (l) | Investment in an affiliate. |
| (u) | Rate shown is the 7-day annualized yield at period end. |
| # | All or a portion of this security is segregated as collateral for investments in derivative instruments. |
| * | Cost for federal income tax purposes is $847,179,387 and net unrealized appreciation (depreciation) consists of: |
| | | | |
Gross unrealized appreciation | | $ | 8,899,478 | |
Gross unrealized depreciation | | | (3,725,984 | ) |
| | | | |
Net unrealized appreciation | | $ | 5,173,494 | |
The accompanying notes are an integral part of these financial statements.
| | | | | | |
| Statement of Assets and Liabilities—December 31, 2011 (Unaudited) | | Wells Fargo Advantage Strategic Municipal Bond Fund | | | 23 | |
| | | | |
| | | | |
| |
Assets | | | | |
Investments | | | | |
In unaffiliated securities, at value | | $ | 849,066,371 | |
In affiliated securities, at value | | | 3,286,510 | |
| | | | |
Total investments, at value (see cost below) | | | 852,352,881 | |
Receivable for investments sold | | | 34,443,050 | |
Receivable for Fund shares sold | | | 2,888,984 | |
Receivable for interest | | | 8,785,806 | |
Prepaid expenses and other assets | | | 151,744 | |
| | | | |
Total assets | | | 898,622,465 | |
| | | | |
| |
Liabilities | | | | |
Distributions payable | | | 465,288 | |
Payable for investments purchased | | | 8,481,313 | |
Payable for Fund shares redeemed | | | 1,685,898 | |
Payable for daily variation margin on open futures contracts | | | 75,424 | |
Advisory fee payable | | | 255,234 | |
Distribution fees payable | | | 92,288 | |
Due to other related parties | | | 152,228 | |
Accrued expenses and other liabilities | | | 302,959 | |
| | | | |
Total liabilities | | | 11,510,632 | |
| | | | |
Total net assets | | $ | 887,111,833 | |
| | | | |
| |
NET ASSETS CONSIST OF | | | | |
Paid-in capital | | $ | 881,744,749 | |
Overdistributed net investment income | | | (87,265 | ) |
Accumulated net realized losses on investments | | | (61,258 | ) |
Net unrealized gains on investments | | | 5,515,607 | |
| | | | |
Total net assets | | $ | 887,111,833 | |
| | | | |
| |
COMPUTATION OF NET ASSET VALUE AND OFFERING PRICE PER SHARE1 | | | | |
Net assets – Class A | | $ | 445,468,263 | |
Shares outstanding – Class A | | | 50,573,734 | |
Net asset value per share – Class A | | | $8.81 | |
Maximum offering price per share – Class A2 | | | $9.23 | |
Net assets – Class B | | $ | 4,705,395 | |
Shares outstanding – Class B | | | 535,423 | |
Net asset value per share – Class B | | | $8.79 | |
Net assets – Class C | | $ | 128,595,055 | |
Shares outstanding – Class C | | | 14,549,026 | |
Net asset value per share – Class C | | | $8.84 | |
Net assets – Administrator Class | | $ | 308,343,120 | |
Shares outstanding – Administrator Class | | | 35,011,512 | |
Net asset value per share – Administrator Class | | | $8.81 | |
| |
Total investments, at cost | | $ | 846,566,764 | |
| | | | |
| 1. | The Fund has an unlimited number of authorized shares. |
| 2. | Maximum offering price is computed as 100/95.50 of net asset value. On investments of $50,000 or more, the offering price is reduced. |
The accompanying notes are an integral part of these financial statements.
| | | | |
| 24 | | Wells Fargo Advantage Strategic Municipal Bond Fund | | Statement of Operations—Six Months Ended December 31, 2011 (Unaudited) |
| | | | |
| | | | |
| |
Investment income | | | | |
Interest | | $ | 14,001,529 | |
Income from affiliated securities | | | 556 | |
| | | | |
Total investment income | | | 14,002,085 | |
| | | | |
| |
Expenses | | | | |
Advisory fee | | | 1,323,792 | |
Administration fees | | | | |
Fund level | | | 193,887 | |
Class A | | | 327,949 | |
Class B | | | 4,327 | |
Class C | | | 98,172 | |
Administrator Class | | | 118,745 | |
Shareholder servicing fees | | | | |
Class A | | | 512,419 | |
Class B | | | 6,761 | |
Class C | | | 153,394 | |
Administrator Class | | | 259,343 | |
Distribution fees | | | | |
Class B | | | 20,282 | |
Class C | | | 460,181 | |
Custody and accounting fees | | | 18,418 | |
Professional fees | | | 25,135 | |
Registration fees | | | 31,472 | |
Shareholder report expenses | | | 25,115 | |
Trustees’ fees and expenses | | | 6,073 | |
Other fees and expenses | | | 6,656 | |
| | | | |
Total expenses | | | 3,592,121 | |
Less: Fee waivers and/or expense reimbursements | | | (69,999 | ) |
| | | | |
Net expenses | | | 3,522,122 | |
| | | | |
Net investment income | | | 10,479,963 | |
| | | | |
| |
REALIZED AND UNREALIZED GAINS (LOSSES) ON INVESTMENTS | | | | |
| |
Net realized gains (losses) on: | | | | |
Unaffiliated securities | | | (358,568 | ) |
Futures transactions | | | 519,595 | |
| | | | |
Net realized gains on investments | | | 161,027 | |
| | | | |
| |
Net change in unrealized gains (losses) on: | | | | |
Unaffiliated securities | | | 4,675,581 | |
Futures transactions | | | (225,525 | ) |
| | | | |
Net change in unrealized gains (losses) on investments | | | 4,450,056 | |
| | | | |
Net realized and unrealized gains (losses) on investments | | | 4,611,083 | |
| | | | |
Net increase in net assets resulting from operations | | $ | 15,091,046 | |
| | | | |
The accompanying notes are an integral part of these financial statements.
| | | | | | |
| Statements of Changes in Net Assets | | Wells Fargo Advantage Strategic Municipal Bond Fund | | | 25 | |
| | | | | | | | | | | | | | | | | | | | | | | | |
| | | Six Months Ended December 31, 2011 (Unaudited) | | | Year Ended June 30, 20111 | | | Year Ended May 31, 20112 | |
| | | | | | |
Operations | | | | | | | | | | | | | | | | | | | | | | | | |
Net investment income | | | | | | $ | 10,479,963 | | | | | | | $ | 1,532,344 | | | | | | | $ | 16,287,580 | |
Net realized gains (losses) on investments | | | | | | | 161,027 | | | | | | | | (241,940 | ) | | | | | | | 5,666,685 | |
Net change in unrealized gains (losses) on investments | | | | | | | 4,450,056 | | | | | | | | 1,520,520 | | | | | | | | (928,780 | ) |
| | | | | | | | | | | | | | | | | | | | | | | | |
Net increase in net assets resulting from operations | | | | | | | 15,091,046 | | | | | | | | 2,810,924 | | | | | | | | 21,025,485 | |
| | | | | | | | | | | | | | | | | | | | | | | | |
| | | | | | |
Distributions to shareholders from | | | | | | | | | | | | | | | | | | | | | | | | |
Net investment income | | | | | | | | | | | | | | | | | | | | | | | | |
Class A | | | | | | | (5,705,351 | ) | | | | | | | (880,587 | ) | | | | | | | (9,486,602 | ) |
Class B | | | | | | | (55,652 | ) | | | | | | | (13,686 | ) | | | | | | | (270,760 | ) |
Class C | | | | | | | (1,250,066 | ) | | | | | | | (222,593 | ) | | | | | | | (2,703,112 | ) |
Administrator Class | | | | | | | (3,468,894 | ) | | | | | | | (410,161 | ) | | | | | | | (3,776,581 | )3 |
Net realized gains | | | | | | | | | | | | | | | | | | | | | | | | |
Class A | | | | | | | (397,431 | ) | | | | | | | 0 | | | | | | | | 0 | |
Class B | | | | | | | (4,233 | ) | | | | | | | 0 | | | | | | | | 0 | |
Class C | | | | | | | (114,928 | ) | | | | | | | 0 | | | | | | | | 0 | |
Administrator Class | | | | | | | (274,579 | ) | | | | | | | 0 | | | | | | | | 0 | 3 |
| | | | | | | | | | | | | | | | | | | | | | | | |
Total distributions to shareholders | | | | | | | (11,271,134 | ) | | | | | | | (1,527,027 | ) | | | | | | | (16,237,055 | ) |
| | | | | | | | | | | | | | | | | | | | | | | | |
| | | | | | |
Capital share transactions | | | Shares | | | | | | | | Shares | | | | | | | | Shares | | | | | |
Proceeds from shares sold | | | | | | | | | | | | | | | | | | | | | | | | |
Class A | | | 14,372,265 | | | | 126,243,832 | | | | 3,135,281 | | | | 27,457,215 | | | | 16,163,958 | | | | 140,462,918 | |
Class B | | | 10,553 | | | | 92,552 | | | | 31 | | | | 274 | | | | 29,349 | | | | 254,752 | |
Class C | | | 2,440,682 | | | | 21,511,340 | | | | 354,768 | | | | 3,117,852 | | | | 2,147,570 | | | | 18,739,353 | |
Administrator Class | | | 20,404,482 | | | | 179,122,339 | | | | 1,850,825 | | | | 16,205,699 | | | | 12,736,323 | 3 | | | 110,659,140 | 3 |
| | | | | | | | | | | | | | | | | | | | | | | | |
| | | | | | | 326,970,063 | | | | | | | | 46,781,040 | | | | | | | | 270,116,163 | |
| | | | | | | | | | | | | | | | | | | | | | | | |
Reinvestment of distributions | | | | | | | | | | | | | | | | | | | | | | | | |
Class A | | | 533,739 | | | | 4,690,584 | | | | 74,027 | | | | 649,218 | | | | 736,702 | | | | 6,406,029 | |
Class B | | | 4,461 | | | | 39,114 | | | | 1,023 | | | | 8,947 | | | | 21,400 | | | | 185,630 | |
Class C | | | 101,606 | | | | 895,941 | | | | 16,339 | | | | 143,786 | | | | 193,040 | | | | 1,684,116 | |
Administrator Class | | | 376,067 | | | | 3,304,509 | | | | 41,683 | | | | 365,139 | | | | 391,924 | 3 | | | 3,406,436 | 3 |
| | | | | | | | | | | | | | | | | | | | | | | | |
| | | | | | | 8,930,148 | | | | | | | | 1,167,090 | | | | | | | | 11,682,211 | |
| | | | | | | | | | | | | | | | | | | | | | | | |
Payment for shares redeemed | | | | | | | | | | | | | | | | | | | | | | | | |
Class A | | | (4,660,836 | ) | | | (40,932,742 | ) | | | (708,022 | ) | | | (6,199,121 | ) | | | (17,055,958 | ) | | | (148,159,192 | ) |
Class B | | | (250,392 | ) | | | (2,194,083 | ) | | | (93,047 | ) | | | (812,523 | ) | | | (1,050,905 | ) | | | (9,102,624 | ) |
Class C | | | (921,975 | ) | | | (8,125,794 | ) | | | (285,902 | ) | | | (2,513,103 | ) | | | (4,521,223 | ) | | | (39,410,628 | ) |
Administrator Class | | | (3,915,496 | ) | | | (34,384,444 | ) | | | (456,231 | ) | | | (3,994,961 | ) | | | (13,899,155 | )3 | | | (120,606,584 | )3 |
| | | | | | | | | | | | | | | | | | | | | | | | |
| | | | | | | (85,637,063 | ) | | | | | | | (13,519,708 | ) | | | | | | | (317,279,028 | ) |
| | | | | | | | | | | | | | | | | | | | | | | | |
Net increase (decrease) in net assets resulting from capital share transactions | | | | | | | 250,263,148 | | | | | | | | 34,428,422 | | | | | | | | (35,480,654 | ) |
| | | | | | | | | | | | | | | | | | | | | | | | |
Total increase (decrease) in net assets | | | | | | | 254,083,060 | | | | | | | | 35,712,319 | | | | | | | | (30,692,224 | ) |
| | | | | | | | | | | | | | | | | | | | | | | | |
| | | | | | |
Net assets | | | | | | | | | | | | | | | | | | | | | | | | |
Beginning of period | | | | | | | 633,028,773 | | | | | | | | 597,316,454 | | | | | | | | 628,008,678 | |
| | | | | | | | | | | | | | | | | | | | | | | | |
End of period | | | | | | $ | 887,111,833 | | | | | | | $ | 633,028,773 | | | | | | | $ | 597,316,494 | |
| | | | | | | | | | | | | | | | | | | | | | | | |
Overdistributed net investment income | | | | | | $ | (87,265 | ) | | | | | | $ | (87,265 | ) | | | | | | $ | (92,582 | ) |
| | | | | | | | | | | | | | | | | | | | | | | | |
| 1. | For the one month ended June 30, 2011. The Fund changed its fiscal year end from May 31 to June 30, effective June 30, 2011. |
| 2. | After the close of business on July 9, 2010, the Fund acquired the net assets of Evergreen Strategic Municipal Bond Fund which became the accounting and performance survivor in the transaction. The information for the period prior to July 12, 2010 is that of Evergreen Strategic Municipal Bond Fund. |
| 3. | Class I of Evergreen Strategic Municipal Bond Fund became Administrator Class on July 12, 2010. |
The accompanying notes are an integral part of these financial statements.
| | | | |
| 26 | | Wells Fargo Advantage Strategic Municipal Bond Fund | | Financial Highlights |
(For a share outstanding throughout each period)
| | | | | | | | | | | | | | | | | | | | | | | | | | | | |
| Class A | | Six Months Ended
December 31, 2011 (Unaudited) | | | Year Ended June 30, 20111 | | | Year Ended May 31, | |
| | | | 20112 | | | 20102 | | | 20092 | | | 20082 | | | 20072 | |
Net asset value, beginning of period | | $ | 8.77 | | | $ | 8.75 | | | $ | 8.67 | | | $ | 8.59 | | | $ | 8.70 | | | $ | 8.78 | | | $ | 8.75 | |
Net investment income | | | 0.12 | | | | 0.02 | | | | 0.26 | | | | 0.25 | | | | 0.31 | | | | 0.33 | | | | 0.32 | |
Net realized and unrealized gains (losses)
on investments | | | 0.05 | | | | 0.02 | | | | 0.08 | | | | 0.08 | | | | (0.11 | ) | | | (0.08 | ) | | | 0.01 | |
| | | | | | | | | | | | | | | | | | | | | | | | | | | | |
Total from investment operations | | | 0.17 | | | | 0.04 | | | | 0.34 | | | | 0.33 | | | | 0.20 | | | | 0.25 | | | | 0.33 | |
Distributions to shareholders from | | | | | | | | | | | | | | | | | | | | | | | | | | | | |
Net investment income | | | (0.12 | ) | | | (0.02 | ) | | | (0.26 | ) | | | (0.25 | ) | | | (0.31 | ) | | | (0.33 | ) | | | (0.30 | ) |
Net realized gains | | | (0.01 | ) | | | 0.00 | | | | 0.00 | | | | 0.00 | | | | 0.00 | | | | 0.00 | | | | 0.00 | |
| | | | | | | | | | | | | | | | | | | | | | | | | | | | |
Total distributions to shareholders | | | (0.13 | ) | | | (0.02 | ) | | | (0.26 | ) | | | (0.25 | ) | | | (0.31 | ) | | | (0.33 | ) | | | (0.30 | ) |
Net asset value, end of period | | $ | 8.81 | | | $ | 8.77 | | | $ | 8.75 | | | $ | 8.67 | | | $ | 8.59 | | | $ | 8.70 | | | $ | 8.78 | |
Total return3 | | | 1.97 | % | | | 0.49 | % | | | 4.01 | % | | | 3.76 | % | | | 2.54 | % | | | 2.90 | % | | | 3.86 | % |
Ratios to average net assets (annualized) | | | | | | | | | | | | | | | | | | | | | | | | | | | | |
Gross expenses | | | 0.83 | % | | | 0.83 | % | | | 0.88 | % | | | 0.99 | % | | | 1.01 | % | | | 1.05 | % | | | 1.05 | % |
Net expenses | | | 0.83 | % | | | 0.83 | % | | | 0.87 | % | | | 0.99 | % | | | 1.01 | % | | | 1.01 | % | | | 1.00 | % |
Net investment income | | | 2.78 | % | | | 3.15 | % | | | 3.02 | % | | | 2.85 | % | | | 3.64 | % | | | 3.76 | % | | | 3.60 | % |
Supplemental data | | | | | | | | | | | | | | | | | | | | | | | | | | | | |
Portfolio turnover rate | | | 42 | % | | | 12 | % | | | 130 | % | | | 40 | % | | | 53 | % | | | 59 | % | | | 55 | % |
Net assets, end of period (000’s omitted) | | | $445,468 | | | | $353,518 | | | | $330,896 | | | | $329,475 | | | | $333,901 | | | | $287,472 | | | | $286,672 | |
| 1. | For the one month ended June 30, 2011. The Fund changed its fiscal year end from May 31 to June 30, effective June 30, 2011. |
| 2. | After the close of business on July 9, 2010, the Fund acquired the net assets of Evergreen Strategic Municipal Bond Fund which became the accounting and performance survivor in the transaction. The information for the periods prior to July 12, 2010 is that of Class A of Evergreen Strategic Municipal Bond Fund. |
| 3. | Total return calculations do not include any sales charges. Returns for periods of less than one year are not annualized. |
The accompanying notes are an integral part of these financial statements.
| | | | | | |
| Financial Highlights | | Wells Fargo Advantage Strategic Municipal Bond Fund | | | 27 | |
(For a share outstanding throughout each period)
| | | | | | | | | | | | | | | | | | | | | | | | | | | | |
| Class B | | Six Months Ended
December 31, 2011 (Unaudited) | | | Year Ended June 30, 20111 | | | Year Ended May 31, | |
| | | | 20112 | | | 20102 | | | 20092 | | | 20082 | | | 20072 | |
Net asset value, beginning of period | | $ | 8.75 | | | $ | 8.73 | | | $ | 8.65 | | | $ | 8.57 | | | $ | 8.68 | | | $ | 8.76 | | | $ | 8.73 | |
Net investment income | | | 0.09 | | | | 0.02 | 3 | | | 0.19 | 3 | | | 0.19 | 3 | | | 0.25 | 3 | | | 0.25 | | | | 0.25 | 3 |
Net realized and unrealized gains (losses)
on investments | | | 0.05 | | | | 0.02 | | | | 0.09 | | | | 0.07 | | | | (0.11 | ) | | | (0.07 | ) | | | 0.02 | |
| | | | | | | | | | | | | | | | | | | | | | | | | | | | |
Total from investment operations | | | 0.14 | | | | 0.04 | | | | 0.28 | | | | 0.26 | | | | 0.14 | | | | 0.18 | | | | 0.27 | |
Distributions to shareholders from | | | | | | | | | | | | | | | | | | | | | | | | | | | | |
Net investment income | | | (0.09 | ) | | | (0.02 | ) | | | (0.20 | ) | | | (0.18 | ) | | | (0.25 | ) | | | (0.26 | ) | | | (0.24 | ) |
Net realized gains | | | (0.01 | ) | | | 0.00 | | | | 0.00 | | | | 0.00 | | | | 0.00 | | | | 0.00 | | | | 0.00 | |
| | | | | | | | | | | | | | | | | | | | | | | | | | | | |
Total distributions to shareholders | | | (0.10 | ) | | | (0.02 | ) | | | (0.20 | ) | | | (0.18 | ) | | | (0.25 | ) | | | (0.26 | ) | | | (0.24 | ) |
Net asset value, end of period | | $ | 8.79 | | | $ | 8.75 | | | $ | 8.73 | | | $ | 8.65 | | | $ | 8.57 | | | $ | 8.68 | | | $ | 8.76 | |
Total return4 | | | 1.59 | % | | | 0.43 | % | | | 3.23 | % | | | 2.99 | % | | | 1.78 | % | | | 2.13 | % | | | 3.09 | % |
Ratios to average net assets (annualized) | | | | | | | | | | | | | | | | | | | | | | | | | | | | |
Gross expenses | | | 1.58 | % | | | 1.58 | % | | | 1.64 | % | | | 1.74 | % | | | 1.76 | % | | | 1.76 | % | | | 1.75 | % |
Net expenses | | | 1.58 | % | | | 1.58 | % | | | 1.63 | % | | | 1.74 | % | | | 1.76 | % | | | 1.76 | % | | | 1.75 | % |
Net investment income | | | 2.06 | % | | | 2.40 | % | | | 2.20 | % | | | 2.20 | % | | | 2.91 | % | | | 3.02 | % | | | 2.85 | % |
Supplemental data | | | | | | | | | | | | | | | | | | | | | | | | | | | | |
Portfolio turnover rate | | | 42 | % | | | 12 | % | | | 130 | % | | | 40 | % | | | 53 | % | | | 59 | % | | | 55 | % |
Net assets, end of period (000’s omitted) | | | $4,705 | | | | $6,741 | | | | $7,531 | | | | $16,123 | | | | $31,991 | | | | $50,872 | | | | $78,158 | |
| 1. | For the one month ended June 30, 2011. The Fund changed its fiscal year end from May 31 to June 30, effective June 30, 2011. |
| 2. | After the close of business on July 9, 2010, the Fund acquired the net assets of Evergreen Strategic Municipal Bond Fund which became the accounting and performance survivor in this transaction. The information for the periods prior to July 12, 2010 is that of Class B of Evergreen Strategic Municipal Bond Fund. |
| 3. | Calculated based upon average shares outstanding. |
| 4. | Total return calculations do not include any sales charges. Returns for periods of less than one year are not annualized. |
The accompanying notes are an integral part of these financial statements.
| | | | |
| 28 | | Wells Fargo Advantage Strategic Municipal Bond Fund | | Financial Highlights |
(For a share outstanding throughout each period)
| | | | | | | | | | | | | | | | | | | | | | | | | | | | |
| Class C | | Six Months Ended
December 31, 2011 (Unaudited) | | | Year Ended June 30, 20111 | | | Year Ended May 31, | |
| | | | 20112 | | | 20102 | | | 20092 | | | 20082 | | | 20072 | |
Net asset value, beginning of period | | $ | 8.80 | | | $ | 8.78 | | | $ | 8.70 | | | $ | 8.62 | | | $ | 8.73 | | | $ | 8.81 | | | $ | 8.78 | |
Net investment income | | | 0.09 | | | | 0.02 | | | | 0.20 | | | | 0.18 | | | | 0.24 | | | | 0.27 | | | | 0.25 | |
Net realized and unrealized gains (losses)
on investments | | | 0.05 | | | | 0.02 | | | | 0.08 | | | | 0.09 | | | | (0.10 | ) | | | (0.08 | ) | | | 0.02 | |
| | | | | | | | | | | | | | | | | | | | | | | | | | | | |
Total from investment operations | | | 0.14 | | | | 0.04 | | | | 0.28 | | | | 0.27 | | | | 0.14 | | | | 0.19 | | | | 0.27 | |
Distributions to shareholders from | | | | | | | | | | | | | | | | | | | | | | | | | | | | |
Net investment income | | | (0.09 | ) | | | (0.02 | ) | | | (0.20 | ) | | | (0.19 | ) | | | (0.25 | ) | | | (0.27 | ) | | | (0.24 | ) |
Net realized gains | | | (0.01 | ) | | | 0.00 | | | | 0.00 | | | | 0.00 | | | | 0.00 | | | | 0.00 | | | | 0.00 | |
| | | | | | | | | | | | | | | | | | | | | | | | | | | | |
Total distributions to shareholders | | | (0.10 | ) | | | (0.02 | ) | | | (0.20 | ) | | | (0.19 | ) | | | (0.25 | ) | | | (0.27 | ) | | | (0.24 | ) |
Net asset value, end of period | | $ | 8.84 | | | $ | 8.80 | | | $ | 8.78 | | | $ | 8.70 | | | $ | 8.62 | | | $ | 8.73 | | | $ | 8.81 | |
Total return3 | | | 1.58 | % | | | 0.42 | % | | | 3.23 | % | | | 2.99 | % | | | 1.78 | % | | | 2.13 | % | | | 3.09 | % |
Ratios to average net assets (annualized) | | | | | | | | | | | | | | | | | | | | | | | | | | | | |
Gross expenses | | | 1.58 | % | | | 1.58 | % | | | 1.63 | % | | | 1.74 | % | | | 1.76 | % | | | 1.76 | % | | | 1.75 | % |
Net expenses | | | 1.58 | % | | | 1.58 | % | | | 1.62 | % | | | 1.74 | % | | | 1.76 | % | | | 1.76 | % | | | 1.75 | % |
Net investment income | | | 2.04 | % | | | 2.40 | % | | | 2.26 | % | | | 2.08 | % | | | 2.88 | % | | | 3.01 | % | | | 2.85 | % |
Supplemental data | | | | | | | | | | | | | | | | | | | | | | | | | | | | |
Portfolio turnover rate | | | 42 | % | | | 12 | % | | | 130 | % | | | 40 | % | | | 53 | % | | | 59 | % | | | 55 | % |
Net assets, end of period (000’s omitted) | | | $128,595 | | | | $113,724 | | | | $112,740 | | | | $130,775 | | | | $109,379 | | | | $88,638 | | | | $93,474 | |
| 1. | For the one month ended June 30, 2011. The Fund changed its fiscal year end from May 31 to June 30, effective June 30, 2011. |
| 2. | After the close of business on July 9, 2010, the Fund acquired the net assets of Evergreen Strategic Municipal Bond Fund which became the accounting and performance survivor in the transaction. The information for the periods prior to July 12, 2010 is that of Class C of Evergreen Strategic Municipal Bond Fund. |
| 3. | Total return calculations do not include any sales charges. Returns for periods of less than one year are not annualized. |
The accompanying notes are an integral part of these financial statements.
| | | | | | |
| Financial Highlights | | Wells Fargo Advantage Strategic Municipal Bond Fund | | | 29 | |
(For a share outstanding throughout each period)
| | | | | | | | | | | | | | | | | | | | | | | | | | | | |
| Administrator Class | | Six Months Ended
December 31, 2011 (Unaudited) | | | Year Ended June 30, 20111 | | | Year Ended May 31, | |
| | | | 20112 | | | 20102 | | | 20092 | | | 20082 | | | 20072 | |
Net asset value, beginning of period | | $ | 8.76 | | | $ | 8.75 | | | $ | 8.67 | | | $ | 8.59 | | | $ | 8.70 | | | $ | 8.78 | | | $ | 8.75 | |
Net investment income | | | 0.13 | | | | 0.02 | | | | 0.28 | | | | 0.27 | | | | 0.33 | | | | 0.35 | | | | 0.34 | |
Net realized and unrealized gains (losses)
on investments | | | 0.06 | | | | 0.01 | | | | 0.08 | | | | 0.08 | | | | (0.10 | ) | | | (0.08 | ) | | | 0.02 | |
| | | | | | | | | | | | | | | | | | | | | | | | | | | | |
Total from investment operations | | | 0.19 | | | | 0.03 | | | | 0.36 | | | | 0.35 | | | | 0.23 | | | | 0.27 | | | | 0.36 | |
Distributions to shareholders from | | | | | | | | | | | | | | | | | | | | | | | | | | | | |
Net investment income | | | (0.13 | ) | | | (0.02 | ) | | | (0.28 | ) | | | (0.27 | ) | | | (0.34 | ) | | | (0.35 | ) | | | (0.33 | ) |
Net realized gains | | | (0.01 | ) | | | 0.00 | | | | 0.00 | | | | 0.00 | | | | 0.00 | | | | 0.00 | | | | 0.00 | |
| | | | | | | | | | | | | | | | | | | | | | | | | | | | |
Total distributions to shareholders | | | (0.14 | ) | | | (0.02 | ) | | | (0.28 | ) | | | (0.27 | ) | | | (0.34 | ) | | | (0.35 | ) | | | (0.33 | ) |
Net asset value, end of period | | $ | 8.81 | | | $ | 8.76 | | | $ | 8.75 | | | $ | 8.67 | | | $ | 8.59 | | | $ | 8.70 | | | $ | 8.78 | |
Total return3 | | | 2.16 | % | | | 0.39 | % | | | 4.20 | % | | | 4.02 | % | | | 2.80 | % | | | 3.16 | % | | | 4.13 | % |
Ratios to average net assets (annualized) | | | | | | | | | | | | | | | | | | | | | | | | | | | | |
Gross expenses | | | 0.74 | % | | | 0.77 | % | | | 0.77 | % | | | 0.75 | % | | | 0.76 | % | | | 0.76 | % | | | 0.75 | % |
Net expenses | | | 0.68 | % | | | 0.68 | % | | | 0.69 | % | | | 0.75 | % | | | 0.76 | % | | | 0.76 | % | | | 0.75 | % |
Net investment income | | | 2.92 | % | | | 3.32 | % | | | 3.23 | % | | | 3.03 | % | | | 3.89 | % | | | 4.01 | % | | | 3.86 | % |
Supplemental data | | | | | | | | | | | | | | | | | | | | | | | | | | | | |
Portfolio turnover rate | | | 42 | % | | | 12 | % | | | 130 | % | | | 40 | % | | | 53 | % | | | 59 | % | | | 55 | % |
Net assets, end of period (000’s omitted) | | | $308,343 | | | | $159,045 | | | | $146,149 | | | | $151,636 | | | | $73,002 | | | | $72,118 | | | | $48,449 | |
| 1. | For the one month ended June 30, 2011. The Fund changed its fiscal year end from May 31 to June 30, effective June 30, 2011. |
| 2. | After the close of business on July 9, 2010, the Fund acquired the net assets of Evergreen Strategic Municipal Bond Fund which became the accounting and performance survivor in this transaction. The information for the periods prior to July 12, 2010 is that of Class I of Evergreen Strategic Municipal Bond Fund. |
| 3. | Returns for periods of less than one year are not annualized. |
The accompanying notes are an integral part of these financial statements.
| | | | |
| 30 | | Wells Fargo Advantage Strategic Municipal Bond Fund | | Notes to Financial Statements (Unaudited) |
1. ORGANIZATION
Wells Fargo Funds Trust (the “Trust”), a Delaware statutory trust organized on March 10, 1999, is an open-end management investment company registered under the Investment Company Act of 1940, as amended (the “1940 Act”). These financial statements report on Wells Fargo Advantage Strategic Municipal Bond Fund (the “Fund”) which is a diversified series of the Trust.
2. SIGNIFICANT ACCOUNTING POLICIES
The following significant accounting policies, which are consistently followed in the preparation of the financial statements of the Fund, are in conformity with U.S. generally accepted accounting principles which require management to make estimates and assumptions that affect the reported amounts of assets and liabilities, disclosure of contingent assets and liabilities at the date of the financial statements, and the reported amounts of revenues and expenses during the reporting period. Actual results could differ from those estimates.
Securities valuation
Fixed income securities with maturities exceeding 60 days are valued based on available evaluated prices received from an independent pricing service approved by the Board of Trustees which may utilize both transaction data and market information such as yield, prices of securities of comparable quality, coupon rate, maturity, type of issue, trading characteristics and other market data. If valuations are not available from the pricing service or values received are deemed not representative of market value, values will be obtained from a third party broker-dealer or determined based on the Fund’s Fair Value Procedures.
Debt securities of sufficient credit quality with original maturities of 60 days or less generally are valued at amortized cost which approximates fair value. The amortized cost method involves valuing a security at its cost, plus accretion of discount or minus amortization of premium over the period until maturity.
Investments in open-end mutual funds and non-registered investment companies are generally valued at net asset value.
Investments which are not valued using any of the methods discussed above, are valued at their fair value, as determined by procedures established in good faith and approved by the Board of Trustees.
When-issued transactions
The Fund may purchase securities on a forward commitment or ‘when-issued’ basis. The Fund records a when-issued transaction on the trade date and will segregate assets to cover its obligation by confirming the availability of qualifying assets having a value sufficient to make payment for the securities purchased. Securities purchased on a when-issued basis are marked-to-market daily and the Fund begins earning interest on the settlement date. Losses may arise due to changes in the market value of the underlying securities or if the counterparty does not perform under the contract.
Futures contracts
The Fund may be subject to interest rate risk in the normal course of pursuing its investment objectives. The Fund may buy and sell futures contracts in order to gain exposure to, or protect against, changes in security values and interest rates. The primary risks associated with the use of futures contracts are the imperfect correlation between changes in market values of securities held by the Fund and the prices of futures contracts, and the possibility of an illiquid market.
Futures contracts are valued based upon their quoted daily settlement prices when available. The aggregate principal amounts of the contracts are not recorded in the financial statements. Fluctuations in the value of the contracts are recorded in the Statement of Assets and Liabilities as an asset or liability and in the Statement of Operations as unrealized gains or losses until the contracts are closed, at which point they are recorded as net realized gains or losses on futures contracts. With futures contracts, there is minimal counterparty risk to the Fund since futures are exchange traded and the exchange’s clearinghouse, as counterparty to all exchange traded futures, guarantees the futures against default.
Security transactions and income recognition
Securities transactions are recorded on a trade date basis. Realized gains or losses are reported on the basis of identified cost of securities delivered.
Interest income is accrued daily and bond discounts are accreted and premiums are amortized daily based on the effective interest method. To the extent debt obligations are placed on non-accrual status, any related interest income
| | | | | | |
| Notes to Financial Statements (Unaudited) | | Wells Fargo Advantage Strategic Municipal Bond Fund | | | 31 | |
may be reduced by writing off interest receivables when the collection of all or a portion of interest has become doubtful based on consistently applied procedures. If the issuer subsequently resumes interest payments or when the collectability of interest is reasonably assured, the debt obligation is removed from non-accrual status.
Distributions to shareholders
Distributions to shareholders from net investment income are accrued daily and paid monthly. Distributions from net realized gains, if any, are recorded on the ex-dividend date. Such distributions are determined in conformity with income tax regulations, which may differ from generally accepted accounting principles.
Federal and other taxes
The Fund intends to continue to qualify as a regulated investment company by distributing substantially all of its investment company taxable and tax-exempt income and any net realized capital gains (after reduction for capital loss carryforwards) sufficient to relieve it from all, or substantially all, federal income taxes. Accordingly, no provision for federal income taxes was required.
The Fund’s income and federal excise tax returns and all financial records supporting those returns for the prior three fiscal years are subject to examination by the federal and Delaware revenue authorities.
Under the recently enacted Regulated Investment Company Modernization Act of 2010, the Fund is permitted to carry forward capital losses incurred in taxable years which began after December 22, 2010 for an unlimited period. However, any losses incurred are required to be utilized prior to the losses incurred in pre-enactment taxable years. As a result of this ordering rule, pre-enactment capital loss carryforwards may be more likely to expire unused. Additionally, post-enactment capital losses that are carried forward will retain their character as either short-term or long-term capital losses rather than being considered all short-term as under previous law.
As of June 30, 2011, the Fund had post-enactment long-term capital loss carryforwards, in the amount of $240,457, which were available to offset future net realized capital gains.
Class allocations
The separate classes of shares offered by the Fund differ principally in applicable sales charges, distribution, shareholder servicing and administration fees. Shareholders of each class bear certain expenses that pertain to that particular class. All shareholders bear the common expenses of the Fund, earn income from the portfolio, and are allocated unrealized gains and losses pro rata based on the average daily net assets of each class, without distinction between share classes. Dividends are determined separately for each class based on income and expenses allocable to each class. Realized gains and losses are allocated to each class pro rata based upon the net assets of each class on the date realized. Differences in per share dividend rates generally result from the relative weightings of pro rata income and realized gain allocations and from differences in separate class expenses, including distribution, shareholder servicing and administration fees.
3. FAIR VALUATION MEASUREMENTS
Fair value measurements of investments are determined within a framework that has established a fair value hierarchy based upon the various data inputs utilized in determining the value of the Fund’s investments. The three-level hierarchy gives the highest priority to unadjusted quoted prices in active markets for identical assets or liabilities (Level 1) and the lowest priority to significant unobservable inputs (Level 3). The Fund’s investments are classified within the fair value hierarchy based on the lowest level of input that is significant to the fair value measurement. The inputs are summarized into three broad levels as follows:
| n | | Level 1 – quoted prices in active markets for identical securities |
| n | | Level 2 – other significant observable inputs (including quoted prices for similar securities, interest rates, prepayment speeds, credit risk, etc.) |
| n | | Level 3 – significant unobservable inputs (including the Fund’s own assumptions in determining the fair value of investments) |
The inputs or methodologies used for valuing securities are not necessarily an indication of the risk associated with investing in those securities.
| | | | |
| 32 | | Wells Fargo Advantage Strategic Municipal Bond Fund | | Notes to Financial Statements (Unaudited) |
As of December 31, 2011, the inputs used in valuing the Fund’s assets, which are carried at fair value, were as follows:
| | | | | | | | | | | | | | | | |
| Investments in Securities | | Quoted Prices (Level 1) | | | Significant Other
Observable Inputs (Level 2) | | | Significant Unobservable Inputs (Level 3) | | | Total | |
Municipal bonds and notes | | $ | 0 | | | $ | 820,040,449 | | | $ | 28,128,147 | | | $ | 848,168,596 | |
Yankee corporate bonds and notes | | | 0 | | | | 197,800 | | | | 0 | | | | 197,800 | |
Short-term investments | | | | | | | | | | | | | | | | |
Investment companies | | | 3,268,510 | | | | 0 | | | | 0 | | | | 3,286,510 | |
U.S. Treasury securities | | | 699,975 | | | | 0 | | | | 0 | | | | 699,975 | |
| | | $ | 3,986,485 | | | $ | 820,238,249 | | | $ | 28,128,147 | | | $ | 852,352,881 | |
Further details on the major security types listed above can be found in the Portfolio of Investments.
| | | | | | | | | | | | | | | | |
| Other financial instruments | | Quoted Prices (Level 1) | | | Significant Other
Observable Inputs (Level 2) | | | Significant Unobservable Inputs (Level 3) | | | Total | |
Futures contracts+ | | $ | (270,510 | ) | | $ | 0 | | | $ | 0 | | | $ | (270,510 | ) |
| + | Futures contracts are presented at the unrealized gains or losses on the instrument. |
Transfers in and transfers out are recognized at the end of the reporting period. For the six months ended December 31, 2011, the Fund did not have any significant transfers into/out of Level 1 and Level 2.
The following is a reconciliation of assets in which significant unobservable inputs (Level 3) were used in determining fair value:
| | | | |
| | | Municipal
bonds and
notes | |
Balance as of June 30, 2011 | | $ | 13,959,727 | |
Accrued discounts (premiums) | | | 81,993 | |
Realized gains (losses) | | | 42,048 | |
Change in unrealized gains (losses) | | | (187,576 | ) |
Purchases | | | 15,307,625 | |
Sales | | | (1,075,670 | ) |
Transfers into Level 3 | | | 0 | |
Transfers out of Level 3 | | | 0 | |
Balance as of December 31, 2011 | | $ | 28,128,147 | |
Change in unrealized gains (losses)
relating to securities still held at December 31, 2011 | | $ | (173,510 | ) |
4. TRANSACTIONS WITH AFFILIATES AND OTHER EXPENSES
Advisory fee
The Trust has entered into an advisory contract with Wells Fargo Funds Management, LLC (“Funds Management”), an indirect wholly owned subsidiary of Wells Fargo & Company (“Wells Fargo”). The adviser is responsible for implementing investment policies and guidelines and for supervising the sub-adviser, who is responsible for day-to-day portfolio management of the Fund.
Pursuant to the contract, Funds Management is entitled to receive an annual advisory fee starting at 0.35% and declining to 0.25% as the average daily net assets of the Fund increase. For the six months ended December 31, 2011, the advisory fee was equivalent to an annual rate of 0.34% of the Fund’s average daily net assets.
Funds Management may retain the services of certain sub-advisers to provide daily portfolio management to the Fund. The fees related to sub-advisory services are borne directly by Funds Management and do not increase the overall fees paid by the Fund. Wells Capital Management Incorporated, an affiliate of Funds Management, is the sub-adviser to the Fund and is entitled to receive a fee from Funds Management at an annual rate starting at 0.20% and declining to 0.10% as the average daily net assets of the Fund increase.
| | | | | | |
| Notes to Financial Statements (Unaudited) | | Wells Fargo Advantage Strategic Municipal Bond Fund | | | 33 | |
Administration and transfer agent fees
The Trust has entered into an administration agreement with Funds Management. Under this agreement, for providing administrative services, which includes paying fees and expenses for services provided by the transfer agent, sub-transfer agents, omnibus account servicers and record-keepers, Funds Management is entitled to receive from the Fund an annual fund level administration fee starting at 0.05% and declining to 0.03% as the average daily net assets of the Fund increase and a class level administration fee which is calculated based on the average daily net assets of each class as follows:
| | | | |
| | | Class Level Administration Fee | |
Class A, Class B, Class C | | | 0.16 | % |
Administrator Class | | | 0.10 | |
Funds Management has contractually waived and/or reimbursed advisory and administration fees to the extent necessary to maintain certain net operating expense ratios for the Fund. Waiver of fees and/or reimbursement of expenses by Funds Management were made first from fund level expenses on a proportionate basis and then from class specific expenses.
Distribution fees
The Trust has adopted a Distribution Plan for Class B and Class C shares of the Fund pursuant to Rule 12b-1 under the 1940 Act. Distribution fees are charged to Class B and Class C shares and paid to Wells Fargo Funds Distributor, LLC, the principal underwriter, at an annual rate of 0.75% of the average daily net assets of Class B and Class C shares.
For the six months ended December 31, 2011, Wells Fargo Funds Distributor, LLC received $25,064 from the sale of Class A shares and $117, $729 and $4,420 in contingent deferred sales charges from redemptions of Class A, Class B and Class C shares, respectively.
Shareholder servicing fees
The Trust has entered into contracts with one or more shareholder servicing agents, whereby each class of the Fund is charged a fee at an annual rate of 0.25% of the average daily net assets of each respective class.
A portion of these total shareholder servicing fees were paid to affiliates of Wells Fargo.
5. INVESTMENT PORTFOLIO TRANSACTIONS
Purchases and sales of investments, excluding U.S. Government obligations (if any) and short-term securities (securities with maturities of one year or less at purchase date), for the six months ended December 31, 2011 were $544,423,712 and $317,373,136, respectively.
6. DERIVATIVE TRANSACTIONS
During the six months ended December 31, 2011, the Fund entered into futures contracts to take advantage of the differences between municipal and treasury yields and to help shorten duration of the portfolio.
At December 31, 2011, the Fund had short futures contracts outstanding as follows:
| | | | | | | | | | | | |
| Expiration Date | | Contracts | | Type | | Contract
Value at
November 30,
2011 | | | Net Unrealized
Gains
(Losses) | |
March 2012 | | 265 Short | | 5-Year U.S. Treasury Notes | | $ | 32,663,320 | | | $ | (145,426 | ) |
March 2012 | | 50 Short | | 10-Year U.S. Treasury Notes | | | 6,556,250 | | | | (59,079 | ) |
March 2012 | | 200 Short | | 30-Year U.S. Treasury Bonds | | | 28,962,500 | | | | (66,005 | ) |
The Fund had an average notional amount of $40,573,666 in short futures contracts during the six months ended December 31, 2011.
On December 31, 2011, the cumulative unrealized losses on futures contracts in the amount of $270,510 is reflected in net unrealized gains on investments on the Statement of Assets and Liabilities. The payable for daily variation margin on
| | | | |
| 34 | | Wells Fargo Advantage Strategic Municipal Bond Fund | | Notes to Financial Statements (Unaudited) |
open futures contracts reflected in the Statement of Assets and Liabilities only represents the current day’s variation margin. The realized gains and change in unrealized gains (losses) on futures contracts are reflected in the Statement of Operations.
7. BANK BORROWINGS
The Trust (excluding the money market funds) and Wells Fargo Variable Trust are parties to a $150,000,000 revolving credit agreement with State Street Bank and Trust Company, whereby the Fund is permitted to use bank borrowings for temporary or emergency purposes, such as to fund shareholder redemption requests. Interest under the credit agreement is charged to the Fund based on a borrowing rate equal to the higher of the Federal Funds rate in effect on that day plus 1.25% or the overnight LIBOR rate in effect on that day plus 1.25%. In addition, under the credit agreement, the Fund pays an annual commitment fee equal to 0.10% of the unused balance, which is allocated pro rata. Prior to September 6, 2011, the revolving credit agreement was for $125,000,000 and the annual commitment fee paid by the Fund was 0.125% of the unused balance. For the six months ended December 31, 2011, the Fund paid $457 in commitment fees.
For the six months ended December 31, 2011, there were no borrowings by the Fund under the agreement.
8. INDEMNIFICATION
Under the Trust’s organizational documents, the officers and directors are indemnified against certain liabilities that may arise out of performance of their duties to the Trust. Additionally, in the normal course of business, the Trust may enter into contracts with service providers that contain a variety of indemnification clauses. The Trust’s maximum exposure under these arrangements is dependent on future claims that may be made against the Fund and, therefore, cannot be estimated.
9. NEW ACCOUNTING PRONOUNCEMENTS
In May 2011, the Financial Accounting Standards Board (“FASB”) issued Accounting Standards Update (“ASU”) No. 2011-04 “Amendments to Achieve Common Fair Value Measurement and Disclosure Requirements in U.S. GAAP and IFRSs”. ASU No. 2011-04 amends FASB ASC Topic 820, Fair Value Measurements and Disclosures, to establish common requirements for measuring fair value and for disclosing information about fair value measurements in accordance with GAAP. The ASU is effective prospectively for interim and annual periods beginning after December 15, 2011. Management expects that adoption of the ASU will result in additional disclosures in the financial statements, as applicable.
In April 2011, FASB issued ASU No. 2011-03 “Reconsideration of Effective Control for Repurchase Agreements”. ASU No. 2011-03 amends FASB ASC Topic 860, Transfers and Servicing, specifically the criteria required to determine whether a repurchase agreement (repo) and similar agreements should be accounted for as sales of financial assets or secured borrowings with commitments. ASU No. 2011-03 changes the assessment of effective control by focusing on the transferor’s contractual rights and obligations and removing the criterion to assess its ability to exercise those rights or honor those obligations. This could result in changes to the way entities account for certain transactions including repurchase agreements, mortgage dollar rolls and reverse repurchase agreements. The ASU will become effective on a prospective basis for new transfers and modifications to existing transactions as of the beginning of the first interim or annual period beginning on or after December 15, 2011. Management has evaluated the impact of adopting the ASU and expects no significant changes.
| | | | | | |
| Other Information (Unaudited) | | Wells Fargo Advantage Strategic Municipal Bond Fund | | | 35 | |
PROXY VOTING INFORMATION
A description of the policies and procedures that the Fund uses to determine how to vote proxies relating to portfolio securities is available without charge, upon request, by calling 1-800-222-8222, visiting our Web site at www.wellsfargo.com/advantagefunds, or visiting the SEC Web site at www.sec.gov. Information regarding how the Fund voted proxies relating to portfolio securities during the most recent 12-month period ended June 30 is available without charge on the Fund’s Web site at www.wellsfargo.com/advantagefunds or by visiting the SEC Web site at www.sec.gov.
PORTFOLIO HOLDINGS INFORMATION
The complete portfolio holdings for the Fund are publicly available on the Fund’s Web site (www.wellsfargo.com/advantagefunds) on a monthly, 30-day or more delayed basis. In addition, top ten holdings information for the Fund is publicly available on the Fund’s Web site on a monthly, seven-day or more delayed basis. The Fund files its complete schedule of portfolio holdings with the SEC for the first and third quarters of each fiscal year on Form N-Q, which is available without charge by visiting the SEC Web site at www.sec.gov. In addition, the Fund’s Form N-Q may be reviewed and copied at the SEC’s Public Reference Room in Washington, DC, and at regional offices in New York City, at 233 Broadway, and in Chicago, at 175 West Jackson Boulevard, Suite 900. Information about the Public Reference Room may be obtained by calling 1-800-SEC-0330.
| | | | |
| 36 | | Wells Fargo Advantage Strategic Municipal Bond Fund | | Other Information (Unaudited) |
BOARD OF TRUSTEES
The following table provides basic information about the Board of Trustees (the “Trustees”) of the Trust and Officers of the Trust. This table should be read in conjunction with the Prospectus and the Statement of Additional Information1 of the Fund. Each of the Trustees and Officers listed below acts in identical capacities for the Wells Fargo Advantage family of funds, which consists of 138 funds comprising the Wells Fargo Funds Trust, Wells Fargo Variable Trust, Wells Fargo Master Trust and four closed-end funds (collectively the “Fund Complex”). All of the Trustees are also Members of the Audit and Governance Committees of each Trust in the Fund Complex. The mailing address of each Trustee and Officer is 525 Market Street, 12th Floor, San Francisco, CA 94105. Each Trustee and Officer serves an indefinite term, however, each Trustee serves such term until reaching the mandatory retirement age established by the Trustees.
Independent Trustees
| | | | | | |
Name and Year of Birth | | Position Held and Length of Service | | Principal Occupations During Past Five Years | | Other Directorships During
Past Five Years |
Peter G. Gordon
(Born 1942) | | Trustee, since 1998; Chairman, since 2005 (Lead Trustee since 2001) | | Co-Founder, Retired Chairman, President and CEO of Crystal Geyser Water Company. Trustee Emeritus, Colby College | | Asset Allocation Trust |
Isaiah Harris, Jr.
(Born 1952) | | Trustee, since 2009 | | Retired. Prior thereto, President and CEO of BellSouth Advertising and Publishing Corp. from 2005 to 2007, President and CEO of BellSouth Enterprises from 2004 to 2005 and President of BellSouth Consumer Services from 2000 to 2003. Emeritus member of the Iowa State University Foundation Board of Governors. Emeritus Member of the Advisory Board of Iowa State University School of Business. Mr. Harris is a certified public accountant. | | CIGNA Corporation; Deluxe Corporation; Asset Allocation Trust |
Judith M. Johnson
(Born 1949) | | Trustee, since 2008 | | Retired. Prior thereto, Chief Executive Officer and Chief Investment Officer of Minneapolis Employees Retirement Fund from 1996 to 2008. Ms. Johnson is an attorney, certified public accountant and a certified managerial accountant. | | Asset Allocation Trust |
Leroy Keith, Jr.
(Born 1939) | | Trustee, since 2010 | | Chairman, Bloc Global Services (development and construction). Trustee of the Evergreen Funds from 1983 to 2010. Former Managing Director, Almanac Capital Management (commodities firm), former Partner, Stonington Partners, Inc. (private equity fund), former Director, Obagi Medical Products Co. and former Director, Lincoln Educational Services. | | Trustee, Virtus Fund Complex (consisting of 40 portfolios as of 12/31/11); Asset Allocation Trust |
David F. Larcker
(Born 1950) | | Trustee, since 2009 | | James Irvin Miller Professor of Accounting at the Graduate School of Business, Stanford University, Director of Corporate Governance Research Program and Senior Faculty of The Rock Center for Corporate Governance since 2006. From 2005 to 2008, Professor of Accounting at the Graduate School of Business, Stanford University. Prior thereto, Ernst & Young Professor of Accounting at The Wharton School, University of Pennsylvania from 1985 to 2005. | | Asset Allocation Trust |
Olivia S. Mitchell
(Born 1953) | | Trustee, since 2006 | | International Foundation of Employee Benefit Plans Professor, Wharton School of the University of Pennsylvania since 1993. Director of Wharton’s Pension Research Council and Boettner Center on Pensions & Retirement Research, and Research Associate at the National Bureau of Economic Research. Previously, Cornell University Professor from 1978 to 1993. | | Asset Allocation Trust |
| | | | | | |
| Other Information (Unaudited) | | Wells Fargo Advantage Strategic Municipal Bond Fund | | | 37 | |
| | | | | | |
Name and Year of Birth | | Position Held and Length of Service | | Principal Occupations During Past Five Years | | Other Directorships During
Past Five Years |
Timothy J. Penny
(Born 1951) | | Trustee, since 1996 | | President and CEO of Southern Minnesota Initiative Foundation, a non-profit organization, since 2007 and Senior Fellow at the Humphrey Institute Policy Forum at the University of Minnesota since 1995. Member of the Board of Trustees of NorthStar Education Finance, Inc., a non-profit organization, since 2007. | | Asset Allocation Trust |
Michael S. Scofield
(Born 1943) | | Trustee, since 2010 | | Served on the Investment Company Institute’s Board of Governors and Executive Committee from 2008-2011 as well the Governing Council of the Independent Directors Council from 2006-2011 and the Independent Directors Council Executive Committee from 2008-2011. Chairman of the IDC from 2008-2010. Institutional Investor (Fund Directions) Trustee of Year in 2007. Trustee of the Evergreen Funds (and its predecessors) from 1984 to 2010. Chairman of the Evergreen Funds from 2000-2010. Former Trustee of the Mentor Funds. Retired Attorney, Law Offices of Michael S. Scofield and former Director and Chairman, Branded Media Corporation (multi-media branding company). | | Asset Allocation Trust |
Donald C. Willeke
(Born 1940) | | Trustee, since 1996 | | Principal of the law firm of Willeke & Daniels. General Counsel of the Minneapolis Employees Retirement Fund from 1984 until its consolidation into the Minnesota Public Employees Retirement Association on June 30, 2010. Director and Vice Chair of The Free Trust (non-profit corporation). Director of the American Chestnut Foundation (non-profit corporation). | | Asset Allocation Trust |
Officers
| | | | | | |
Name and Year of Birth | | Position Held and
Length of Service | | Principal Occupations During Past Five Years | | |
Karla M. Rabusch
(Born 1959) | | President, since 2003 | | Executive Vice President of Wells Fargo Bank, N.A. and President of Wells Fargo Funds Management, LLC since 2003. Senior Vice President and Chief Administrative Officer of Wells Fargo Funds Management, LLC from 2001 to 2003. | | |
C. David Messman
(Born 1960) | | Secretary, since 2000; Chief Legal Counsel, since 2003 | | Senior Vice President and Secretary of Wells Fargo Funds Management, LLC since 2001. Vice President and Managing Senior Counsel of Wells Fargo Bank, N.A. since 1996. | | |
Kasey Phillips
(Born 1970) | | Treasurer, since 2009 | | Senior Vice President of Wells Fargo Funds Management, LLC since 2009. Senior Vice President of Evergreen Investment Management Company, LLC from 2006 to 2010. Treasurer of the Evergreen Funds from 2005 to 2010. | | |
David Berardi
(Born 1975) | | Assistant Treasurer, since 2009 | | Vice President of Wells Fargo Funds Management, LLC since 2009. Vice President of Evergreen Investment Management Company, LLC from 2008 to 2010. Assistant Vice President of Evergreen Investment Services, Inc. from 2004 to 2008. Manager of Fund Reporting and Control for Evergreen Investment Management Company, LLC from 2004 to 2010. | | |
Jeremy DePalma
(Born 1974) | | Assistant Treasurer, since 2009 | | Senior Vice President of Wells Fargo Funds Management, LLC since 2009. Senior Vice President of Evergreen Investment Management Company, LLC from 2008 to 2010. Vice President, Evergreen Investment Services, Inc. from 2004 to 2007. Head of the Fund Reporting and Control Team within Fund Administration from 2005 to 2010. | | |
Debra Ann Early
(Born 1964) | | Chief Compliance Officer, since 2007 | | Chief Compliance Officer of Wells Fargo Funds Management, LLC since 2007. Chief Compliance Officer of Parnassus Investments from 2005 to 2007. Chief Financial Officer of Parnassus Investments from 2004 to 2007 and Senior Audit Manager of PricewaterhouseCoopers LLP from 1998 to 2004. | | |
| 1. | The Statement of Additional Information includes additional information about the Trustees and is available, without charge, upon request, by calling 1-800-222-8222 or by visiting the Web site at www.wellsfargo.com/advantagefunds. |
| | | | |
| 38 | | Wells Fargo Advantage Strategic Municipal Bond Fund | | List of Abbreviations |
The following is a list of common abbreviations for terms and entities which may have appeared in this report.
| ACB | — Agricultural Credit Bank |
| ADR | — American Depository Receipt |
| ADS | — American Depository Shares |
| AGC-ICC | — Assured Guaranty Corporation - Insured Custody Certificates |
| AGM | — Assured Guaranty Municipal |
| AMBAC | — American Municipal Bond Assurance Corporation |
| AMT | — Alternative Minimum Tax |
| BAN | — Bond Anticipation Notes |
| BHAC | — Berkshire Hathaway Assurance Corporation |
| CAB | — Capital Appreciation Bond |
| CCAB | — Convertible Capital Appreciation Bond |
| CDA | — Community Development Authority |
| CDO | — Collateralized Debt Obligation |
| COP | — Certificate of Participation |
| DRIVER | — Derivative Inverse Tax-Exempt Receipts |
| DW&P | — Department of Water & Power |
| DWR | — Department of Water Resources |
| ECFA | — Educational & Cultural Facilities Authority |
| EDA | — Economic Development Authority |
| EDFA | — Economic Development Finance Authority |
| ETF | — Exchange-Traded Fund |
| FFCB | — Federal Farm Credit Bank |
| FGIC | — Financial Guaranty Insurance Corporation |
| FHA | — Federal Housing Authority |
| FHLB | — Federal Home Loan Bank |
| FHLMC | — Federal Home Loan Mortgage Corporation |
| FNMA | — Federal National Mortgage Association |
| GDR | — Global Depository Receipt |
| GNMA | — Government National Mortgage Association |
| HCFR | — Healthcare Facilities Revenue |
| HEFA | — Health & Educational Facilities Authority |
| HEFAR | — Higher Education Facilities Authority Revenue |
| HFA | — Housing Finance Authority |
| HFFA | — Health Facilities Financing Authority |
| IBC | — Insured Bond Certificate |
| IDA | — Industrial Development Authority |
| IDAG | — Industrial Development Agency |
| IDR | — Industrial Development Revenue |
| KRW | — Republic of Korea Won |
| LIBOR | — London Interbank Offered Rate |
| LLC | — Limited Liability Company |
| LLP | — Limited Liability Partnership |
| MBIA | — Municipal Bond Insurance Association |
| MFHR | — Multi-Family Housing Revenue |
| MUD | — Municipal Utility District |
| NATL-RE | — National Public Finance Guarantee Corporation |
| PCFA | — Pollution Control Finance Authority |
| PCR | — Pollution Control Revenue |
| PFA | — Public Finance Authority |
| PFFA | — Public Facilities Financing Authority |
| PFOTER | — Puttable Floating Option Tax-Exempt Receipts |
| plc | — Public Limited Company |
| PUTTER | — Puttable Tax-Exempt Receipts |
| R&D | — Research & Development |
| RDA | — Redevelopment Authority |
| RDFA | — Redevelopment Finance Authority |
| REIT | — Real Estate Investment Trust |
| ROC | — Reset Option Certificates |
| SAVRS | — Select Auction Variable Rate Securities |
| SBA | — Small Business Authority |
| SFHR | — Single Family Housing Revenue |
| SFMR | — Single Family Mortgage Revenue |
| SPDR | — Standard & Poor’s Depositary Receipts |
| TAN | — Tax Anticipation Notes |
| TIPS | — Treasury Inflation-Protected Securities |
| TRAN | — Tax Revenue Anticipation Notes |
| TCR | — Transferable Custody Receipts |
| TTFA | — Transportation Trust Fund Authority |
| TVA | — Tennessee Valley Authority |
| XLCA | — XL Capital Assurance |


FOR MORE INFORMATION
More information about Wells Fargo Advantage Funds is available free upon request. To obtain literature, please write, e-mail, visit the Fund’s Web site, or call:
Wells Fargo Advantage Funds
P.O. Box 8266
Boston, MA 02266-8266
E-mail: wfaf@wellsfargo.com
Web site: www.wellsfargo.com/advantagefunds
Individual investors: 1-800-222-8222
Retail investment professionals: 1-888-877-9275
Institutional investment professionals: 1-866-765-0778
This report and the financial statements contained herein are submitted for the general information of the shareholders of Wells Fargo Advantage Funds. If this report is used for promotional purposes, distribution of the report must be accompanied or preceded by a current prospectus. For a prospectus containing more complete information, including charges and expenses, call 1-800-222-8222 or visit the Fund’s Web site at www.wellsfargo.com/advantagefunds. Please consider the investment objectives, risks, charges, and expenses of the investment carefully before investing. This and other information about Wells Fargo Advantage Funds can be found in the current prospectus. Read the prospectus carefully before you invest or send money.
Wells Fargo Funds Management, LLC, a wholly owned subsidiary of Wells Fargo & Company, provides investment advisory and administrative services for Wells Fargo Advantage Funds. Other affiliates of Wells Fargo & Company provide subadvisory and other services for the Funds. The Funds are distributed by Wells Fargo Funds Distributor, LLC, Member FINRA/SIPC, an affiliate of Wells Fargo & Company.
NOT FDIC INSURED ¡ NO BANK GUARANTEE ¡ MAY LOSE VALUE
© 2012 Wells Fargo Funds Management, LLC. All rights reserved.
| | |
 | | 207591 02-12 SA257/SAR257 12-11 |

Wells Fargo Advantage Ultra Short-Term Municipal Income Fund

Semi-Annual Report
December 31, 2011

Reduce clutter. Save trees.
Sign up for electronic delivery of prospectuses and shareholder reports at www.wellsfargo.com/advantagedelivery
Contents
The views expressed and any forward-looking statements are as of December 31, 2011, unless otherwise noted, and are those of the Fund managers and/or Wells Fargo Funds Management, LLC. Discussions of individual securities, or the markets generally, or any Wells Fargo Advantage Fund are not intended as individual recommendations. Future events or results may vary significantly from those expressed in any forward-looking statements; the views expressed are subject to change at any time in response to changing circumstances in the market. Wells Fargo Funds Management, LLC, disclaims any obligation to publicly update or revise any views expressed or forward-looking statements.
NOT FDIC INSURED ¡ NO BANK GUARANTEE ¡ MAY LOSE VALUE

WELLS FARGO INVESTMENT HISTORY
| | |
| |
| 1932 | | Keystone creates one of the first mutual fund families. |
| |
| 1971 | | Wells Fargo & Company introduces one of the first institutional index funds. |
| |
| 1978 | | Wells Fargo applies Markowitz and Sharpe’s research on Modern Portfolio Theory to introduce one of the industry’s first Tactical Asset Allocation (TAA) models in institutional separately managed accounts. |
| |
| 1984 | | Wells Fargo Stagecoach Funds launches its first asset allocation fund. |
| |
| 1989 | | The Tactical Asset Allocation (TAA) Model is first applied to Wells Fargo’s asset allocation mutual funds. |
| |
| 1994 | | Wells Fargo introduces the LifePath Funds, one of the first suites of target date funds (now the Wells Fargo Advantage Dow Jones Target Date FundsSM ). |
| |
| 1996 | | Evergreen Investments and Keystone Funds merge. |
| |
| 1997 | | Wells Fargo launches Wells Fargo Advantage WealthBuilder PortfoliosSM, a fund-of-funds suite of products that includes the use of quantitative models to shift assets among investment styles. |
| |
| 1999 | | Norwest Advantage Funds and Stagecoach Funds are reorganized into Wells Fargo Funds after the merger of Norwest and Wells Fargo. |
| |
| 2002 | | Evergreen Retail and Evergreen Institutional companies form the umbrella asset management company, Evergreen Investments. |
| |
| 2005 | | The integration of Strong Funds with Wells Fargo Funds creates Wells Fargo Advantage Funds, resulting in one of the top 20 mutual fund companies in the United States. |
| |
| 2006 | | Wells Fargo Advantage Funds relaunches the target date product line as Wells Fargo Advantage Dow Jones Target Date Funds. |
| |
| 2010 | | The mergers and reorganizations of Evergreen and Wells Fargo Advantage mutual funds are completed, unifying the families under the brand of Wells Fargo Advantage Funds. |
Wells Fargo Advantage Funds®
Wells Fargo Advantage Funds skillfully guides institutions, financial advisors, and individuals through the investment terrain to help them reach their financial objectives. Everything we do on behalf of investors is backed by our unique combination of qualifications.
Strength
Our organization is built on the standards of integrity and service established by our parent company—Wells Fargo & Company—more than 150 years ago. And, because we’re part of a highly diversified financial enterprise, we offer the depth of resources to help investors succeed.
Expertise
Our multi-boutique model offers investors access to the independent thinking of premier investment managers that have been chosen for their time-tested strategies. While each team specializes in a specific investment strategy, collectively they provide investors a wide choice of distinct investment styles. Our dedication to investment excellence doesn’t end with our expertise in manager selection—risk management, analysis, and rigorous ongoing review seek to ensure each manager’s investment process remains consistent.
Partnership
Our collaborative approach is built around understanding the needs and goals of our clients. By adhering to core principles of sound judgment and steady guidance, we support you through every stage of the investment decision process.
Carefully consider a fund’s investment objectives, risks, charges, and expenses before investing. For a current prospectus and, if available, a summary prospectus, containing this and other information, visit wellsfargo.com/advantagefunds. Read it carefully before investing.
Wells Fargo Funds Management, LLC, a wholly owned subsidiary of Wells Fargo & Company, provides investment advisory and administrative services for Wells Fargo Advantage Funds®. Other affiliates of Wells Fargo & Company provide subadvisory and other services for the Funds. The Funds are distributed by Wells Fargo Funds Distributor, LLC, Member FINRA/SIPC, an affiliate of Wells Fargo & Company.
“Dow Jones®” and “Dow Jones Target Date IndexesSM” are service marks of Dow Jones Trademark Holdings, LLC (“Dow Jones”), have been licensed to CME Group Index Services LLC (“CME Indexes”) and have been sublicensed for use for certain purposes by Global Index Advisors, Inc, and Wells Fargo Funds Management, LLC. The Wells Fargo Advantage Dow Jones Target Date FundsSM based on the Dow Jones Target Date IndexesSM, are not sponsored, endorsed, sold or promoted by Dow Jones, CME Indexes or their respective affiliates and none of them makes any representation regarding the advisability of investing in such product(s).
NOT FDIC INSURED ¡ NO BANK GUARANTEE ¡ MAY LOSE VALUE
Not part of the semi-annual report.
Wells Fargo Advantage Funds offers more than 110 mutual funds across a wide range of asset classes, representing over $216 billion in assets under management, as of December 31, 2011.
| | | | |
| Equity Funds | | | | |
Asia Pacific Fund | | Global Opportunities Fund | | Premier Large Company Growth Fund |
C&B Large Cap Value Fund | | Growth Fund | | Small Cap Opportunities Fund |
C&B Mid Cap Value Fund | | Health Care Fund | | Small Cap Value Fund |
Capital Growth Fund | | Index Fund | | Small Company Growth Fund |
Common Stock Fund | | International Equity Fund | | Small Company Value Fund |
Disciplined U.S. Core Fund | | International Value Fund | | Small/Mid Cap Core Fund |
Discovery Fund† | | Intrinsic Small Cap Value Fund | | Small/Mid Cap Value Fund |
Diversified Equity Fund | | Intrinsic Value Fund | | Social Sustainability Fund† |
Diversified International Fund | | Intrinsic World Equity Fund | | Special Mid Cap Value Fund |
Diversified Small Cap Fund | | Large Cap Core Fund | | Special Small Cap Value Fund |
Emerging Growth Fund | | Large Cap Growth Fund | | Specialized Technology Fund |
Emerging Markets Equity Fund | | Large Company Value Fund | | Strategic Large Cap Growth Fund |
Endeavor Select Fund† | | Omega Growth Fund | | Traditional Small Cap Growth Fund |
Enterprise Fund† | | Opportunity Fund† | | Utility and Telecommunications Fund |
Equity Value Fund | | Precious Metals Fund | | |
| Bond Funds | | | | |
Adjustable Rate Government Fund | | Inflation-Protected Bond Fund | | Short-Term Bond Fund |
California Limited-Term Tax-Free Fund | | Intermediate Tax/AMT-Free Fund | | Short-Term High Yield Bond Fund |
California Tax-Free Fund | | International Bond Fund | | Short-Term Municipal Bond Fund |
Colorado Tax-Free Fund | | Minnesota Tax-Free Fund | | Strategic Municipal Bond Fund |
Government Securities Fund | | Municipal Bond Fund | | Total Return Bond Fund |
High Income Fund | | North Carolina Tax-Free Fund | | Ultra Short-Term Income Fund |
High Yield Bond Fund | | Pennsylvania Tax-Free Fund | | Ultra Short-Term Municipal Income Fund |
Income Plus Fund | | Short Duration Government Bond Fund | | Wisconsin Tax-Free Fund |
| Asset Allocation Funds | | | | |
Asset Allocation Fund | | WealthBuilder Equity Portfolio† | | Target 2020 Fund† |
Conservative Allocation Fund | | WealthBuilder Growth Allocation Portfolio† | | Target 2025 Fund† |
Diversified Capital Builder Fund | | WealthBuilder Growth Balanced Portfolio† | | Target 2030 Fund† |
Diversified Income Builder Fund | | WealthBuilder Moderate Balanced Portfolio† | | Target 2035 Fund† |
Growth Balanced Fund | | WealthBuilder Tactical Equity Portfolio† | | Target 2040 Fund† |
Index Asset Allocation Fund | | Target Today Fund† | | Target 2045 Fund† |
Moderate Balanced Fund | | Target 2010 Fund† | | Target 2050 Fund† |
WealthBuilder Conservative Allocation Portfolio† | | Target 2015 Fund† | | Target 2055 Fund† |
| Money Market Funds | | | | |
100% Treasury Money Market Fund | | Heritage Money Market Fund† | | National Tax-Free Money Market Fund |
California Municipal Money Market Fund | | Money Market Fund | | Prime Investment Money Market Fund |
Cash Investment Money Market Fund | | Municipal Cash Management Money Market Fund | | Treasury Plus Money Market Fund |
Government Money Market Fund | | Municipal Money Market Fund | | |
| Variable Trust Funds1 | | | | |
VT Discovery Fund† | | VT Intrinsic Value Fund | | VT Small Cap Growth Fund |
VT Index Asset Allocation Fund | | VT Omega Growth Fund | | VT Small Cap Value Fund |
VT International Equity Fund | | VT Opportunity Fund† | | VT Total Return Bond Fund |
An investment in a money market fund is not insured or guaranteed by the Federal Deposit Insurance Corporation or any other government agency. Although the Wells Fargo Advantage Money Market Funds seek to preserve the value of your investment at $1.00 per share, it is possible to lose money by investing in a money market fund.
| 1. | The Variable Trust Funds are generally available only through insurance company variable contracts. |
| † | In this report, the Wells Fargo Advantage Discovery FundSM, Wells Fargo Advantage Endeavor Select FundSM, Wells Fargo Advantage Enterprise FundSM, Wells Fargo Advantage Opportunity FundSM, Wells Fargo Advantage Social Sustainability FundSM, Wells Fargo Advantage WealthBuilder Conservative Allocation PortfolioSM, Wells Fargo Advantage WealthBuilder Equity PortfolioSM, Wells Fargo Advantage WealthBuilder Growth Allocation PortfolioSM, Wells Fargo Advantage WealthBuilder Growth Balanced PortfolioSM, Wells Fargo Advantage WealthBuilder Moderate Balanced PortfolioSM, Wells Fargo Advantage WealthBuilder Tactical Equity PortfolioSM, Wells Fargo Advantage Dow Jones Target Today FundSM, Wells Fargo Advantage Dow Jones Target 2010 FundSM, Wells Fargo Advantage Dow Jones Target 2015 FundSM, Wells Fargo Advantage Dow Jones Target 2020 FundSM, Wells Fargo Advantage Dow Jones Target 2025 FundSM, Wells Fargo Advantage Dow Jones Target 2030 FundSM, Wells Fargo Advantage Dow Jones Target 2035 FundSM, Wells Fargo Advantage Dow Jones Target 2040 FundSM, Wells Fargo Advantage Dow Jones Target 2045 FundSM, Wells Fargo Advantage Dow Jones Target 2050 FundSM, Wells Fargo Advantage Dow Jones Target 2055 FundSM, Wells Fargo Advantage Heritage Money Market FundSM, Wells Fargo Advantage VT Discovery FundSM, and Wells Fargo Advantage VT Opportunity FundSM are referred to as the Discovery Fund, Endeavor Select Fund, Enterprise Fund, Opportunity Fund, Social Sustainability Fund, WealthBuilder Conservative Allocation Portfolio, WealthBuilder Equity Portfolio, WealthBuilder Growth Allocation Portfolio, WealthBuilder Growth Balanced Portfolio, WealthBuilder Moderate Balanced Portfolio, WealthBuilder Tactical Equity Portfolio, Target Today Fund, Target 2010 Fund, Target 2015 Fund, Target 2020 Fund, Target 2025 Fund, Target 2030 Fund, Target 2035 Fund, Target 2040 Fund, Target 2045 Fund, Target 2050 Fund, Target 2055 Fund, Heritage Money Market Fund, VT Discovery Fund, and VT Opportunity Fund, respectively. |
Not part of the semi-annual report.
| | | | |
| 2 | | Wells Fargo Advantage Ultra Short-Term Municipal Income Fund | | Letter to Shareholders |

Karla M. Rabusch,
President
Wells Fargo Advantage Funds
For the entire six-month period, most of the major fixed-income indexes posted solid positive returns. However, the market’s six-month return figures mask the uneven path that the financial markets traced since the summer as investors had to contend with a variety of global and domestic headwinds.
Dear Valued Shareholder:
We’re pleased to offer you this semi-annual report for the Wells Fargo Advantage Ultra Short-Term Municipal Income Fund for the six-month period that ended December 31, 2011. Upon reviewing the report, you may notice a few changes from past reports, the most significant of which is the change from a multi-fund report to a single-fund report. We made this change to make it easier for you to find your fund information.
For the entire six-month period, most of the major fixed-income indexes posted solid positive returns. However, the market’s six-month return figures mask the uneven path that the financial markets traced since the summer as investors had to contend with a variety of global and domestic headwinds. Whatever the future holds, we continue to believe that most investors can benefit from adhering to a well-diversified investment strategy. Over the long-term, such a strategy may allow you to balance risks and opportunities as you pursue your financial goals in a dynamic market landscape.
The economic recovery gained traction as the year progressed.
The U.S. economic recovery that began in mid-2009 has experienced a few slow patches along the way. However, the recovery regained some upward momentum during the six-month period, yet the rate of growth remained subpar compared with most previous recovery cycles.
In September 2011, it was reported that U.S. gross domestic product (GDP) grew at a mere 1.3% annual rate in the second quarter of 2011, following anemic growth at an annual rate of 0.4% in the first quarter. According to the December estimate, GDP growth accelerated to an annual rate of 1.8% in the third quarter, reigniting hopes for a sustainable recovery. Those hopes were buoyed by widespread anticipation of even stronger GDP growth in the fourth quarter. By year-end, few economists believed that the U.S. economy was in danger of sliding back into recession, although many expected a sluggish growth environment in 2012.
The struggling housing and labor markets slowed growth.
As has been the case throughout the recovery, the housing and labor markets continued to restrain economic momentum during 2011.
The beleaguered housing market has arguably exerted the biggest drag on growth. Despite intermittent signs of improvement, ongoing weakness in sales of both new and existing homes has put considerable downward pressure on prices. On the other hand, the labor market took a decided turn for the better during the final months of 2011: initial unemployment claims have eased, and the private sector has been steadily adding jobs. The pace of hiring, while not brisk, was sufficient to push the U.S. unemployment rate down to 8.5% as of December 2011—still well above its historical average but at its lowest level since February 2009. Many observers expect the unemployment rate to decline further in 2012, which could act as a tailwind for consumer spending—widely viewed as one of the keys to long-term economic growth.
The Federal Reserve announced that it will keep rates low until 2013.
Consumers have already demonstrated some resilience in their spending—even in the face of higher energy costs. Oil prices skyrocketed in early 2011 before
| | | | | | |
| Letter to Shareholders | | Wells Fargo Advantage Ultra Short-Term Municipal Income Fund | | | 3 | |
retreating later in the year, only to spike again during the fourth quarter. Yet “core” inflation, which excludes volatile energy and food prices, remained fairly benign throughout the year.
With inflation in check, the Federal Reserve (Fed) held its target range for the federal funds rate—a proxy for short-term interest rates—steady at 0% to 0.25%. Following its August 9, 2011 meeting, the Federal Open Market Committee issued a statement explaining that economic conditions were likely to warrant exceptionally low levels for the federal funds rate through at least mid-2013. In September, the Fed launched yet another stimulus program—dubbed “Operation Twist”—that is designed to keep intermediate- and longer-term yields relatively low. The goal with keeping longer-term rates low is to encourage lending activity to spark business investments and home purchases, which, in turn, may provide support for a more sustainable economic recovery.
Market volatility was a dominant theme during the final six-months of the year
Early on in the period, market climate shifted to one of anxiety over the increasingly fragile state of the U.S. and global economies. In addition, investors not only worried that the U.S. might be on the brink of recession, they also feared that Europe’s sovereign debt problems could spiral out of control if a Greek default triggered financial contagion across the continent. In July and August, investor sentiment was further undermined by partisan wrangling over the federal debt ceiling and the downgrade of the U.S. credit rating by Standard & Poor’s. The barrage of unsettling headlines led to heightened market volatility and an increase in risk aversion, which translated into sharply falling stock prices and higher demand for “safer” assets such as Treasuries and municipals in the third quarter of 2011. Although volatility persisted into the fourth quarter, the financial markets were able to rebound amid improved U.S. economic data and hopes for a resolution to the European crisis.
For the entire six-month period, the Barclays Capital U.S. Aggregate Bond Index1, which represents the universe of investment-grade bonds, and the Barclays Capital U.S. Treasury Index2 added 4.98% and 7.43%, respectively. By comparison, the Barclays Capital Municipal Bond Index3 gained 6.02% over the last half of the year.
Recent events have not altered our message to shareholders.
The market turmoil of 2011 and an uncertain outlook going forward have left many investors questioning their resolve—and their investments. Yet, it is precisely at such times that the market may present opportunities—as well as challenges—for prudent investors. Bear in mind that many investors who indiscriminately sold their equity investments during the severe market downturn of 2008 to 2009 missed out on the impressive two-year rally that followed. In our
| 1. | The Barclays Capital U.S. Aggregate Bond Index is composed of the Barclays Capital Government/Credit Index and the Mortgage-Backed Securities Index and includes U.S. Treasury issues, agency issues, corporate bond issues, and mortgage-backed securities. You cannot invest directly in an index. |
| 2. | The Barclays Capital U.S. Treasury Index is an index of U.S. Treasury Securities. You cannot invest directly in an index. |
| 3. | The Barclays Capital Municipal Bond Index is an unmanaged index composed of long-term tax-exempt bonds with a minimum credit rating of Baa. You cannot invest directly in an index. |
Although volatility persisted into the fourth quarter, the financial markets were able to rebound amid improved U.S. economic data and hopes for a resolution to the European crisis.
| | | | |
| 4 | | Wells Fargo Advantage Ultra Short-Term Municipal Income Fund | | Letter to Shareholders |
opinion, the lesson to be learned from these dramatic market events is that, for many investors, simply building and maintaining a well-diversified4 investment plan is the best long-term strategy.
Thank you for choosing to invest with Wells Fargo Advantage Funds. We appreciate your confidence in us and remain committed to helping you meet your financial needs. For current information about your fund investments, contact your investment professional, visit our website at www.wellsfargo.com/advantagefunds, or call us directly at 1-800-222-8222. We are available 24 hours a day, 7 days a week.
Sincerely,

Karla M. Rabusch
President
Wells Fargo Advantage Funds
| 4. | Diversification does not assure or guarantee better performance and cannot eliminate the risk of investment losses. |
| | | | | | |
| Letter to Shareholders | | Wells Fargo Advantage Ultra Short-Term Municipal Income Fund | | | 5 | |
|
|
Notice to Shareholders The Board of Trustees for Wells Fargo Advantage Funds has unanimously approved the following modifications to certain net asset value (NAV) waiver privileges and commission schedules: n Effective May 1, 2012, automatic investment plan (AIP) purchases and proceeds received from systematic withdrawals will no longer qualify for NAV repurchase privileges. n Effective May 1, 2012, discretionary rights to waive the upfront commission for Class C and “jumbo” Class A share purchases will no longer be granted to broker/dealers. However, we will continue to waive the Class C shares contingent deferred sales charge for redemptions by employer-sponsored retirement plans where the dealer of record waived its commission at the time of purchase. n Effective July 31, 2012, NAV purchase privileges for former Evergreen Class IS and Class R shareholders are being modified to remove the ability to purchase Class A shares at NAV unless those shares are held directly with the fund on or after July 31, 2012. |
| | | | |
| 6 | | Wells Fargo Advantage Ultra Short-Term Municipal Income Fund | | Performance Highlights (Unaudited) |
INVESTMENT OBJECTIVE
The Fund seeks current income exempt from federal income tax consistent with capital preservation.
ADVISER
Wells Fargo Funds Management, LLC
SUB-ADVISER
Wells Capital Management Incorporated
PORTFOLIO MANAGERS
Wendy Casetta
Lyle J. Fitterer, CFA, CPA
FUND INCEPTION
November 30, 1995
| | |
CREDIT QUALITY1 (AS OF DECEMBER 31, 2011) | | |
|
 |
| | |
EFFECTIVE MATURITY DISTRIBUTION2 (AS OF DECEMBER 31, 2011) | | |
|
 |
| 1. | The ratings indicated are from Standard & Poor’s, Moody’s Investors Service, and/or Fitch Ratings Ltd. Credit Quality Ratings: Credit quality ratings apply to underlying holdings of the Fund and not the Fund itself. Standard and Poor’s rates the creditworthiness of bonds, ranging from AAA (highest) to D (lowest). Ratings from A to CCC may be modified by the addition of a plus (+) or minus (–) sign to show relative standing within the rating categories. Standard & Poor’s rates the creditworthiness of short-term notes from SP-1 (highest) to SP-3 (lowest). Ratings from A to CCC may be modified by the addition of a plus (+) or minus (–) sign to show relative standing within the rating categories. Moody’s rates the creditworthiness of bonds, ranging from Aaa (highest) to C (lowest). Ratings Aa to B may be modified by the addition of a number 1 (highest) to 3 (lowest) to show relative standing within the ratings categories. Moody’s rates the creditworthiness of short-term U.S. tax-exempt municipal securities from MIG 1/VMIG 1 (highest) to SG (lowest). Fitch rates the creditworthiness of bonds, ranging from AAA (highest) to D (lowest). If a security was rated by all three rating agencies, the middle rating was utilized. If rated by two of three rating agencies, the lower rating was utilized and if rated by one of the agencies that rating was utilized. Credit quality is subject to change and is calculated based on the total investments of the Fund. We generally define higher quality bonds as bonds that have a rating of BBB/Baa and above and lower quality bonds as bonds with a rating below BBB/Baa. |
| 2. | Effective maturity is calculated based on the total long-term investments of the Fund. It is subject to change and may have changed since the date specified. |
| | | | | | |
| Performance Highlights (Unaudited) | | Wells Fargo Advantage Ultra Short-Term Municipal Income Fund | | | 7 | |
AVERAGE ANNUAL TOTAL RETURN3 (%) (AS OF DECEMBER 31, 2011)
| | | | | | | | | | | | | | | | | | | | | | | | | | | | | | | | | | | | | | | | | | | | |
| | | | | | Including Sales Charge | | | Excluding Sales Charge | | | Expense Ratios4 | |
| | | Inception Date | | | 6 Months* | | | 1 Year | | | 5 Year | | | 10 Year | | | 6 Months* | | | 1 Year | | | 5 Year | | | 10 Year | | | Gross | | | Net5 | |
Class A (SMAVX) | | | 10/02/2000 | | | | (1.61 | ) | | | (0.74 | ) | | | 2.54 | | | | 2.25 | | | | 0.40 | | | | 1.29 | | | | 2.95 | | | | 2.45 | | | | 0.76% | | | | 0.67% | |
Class C (WFUSX) | | | 03/31/2008 | | | | (0.77 | ) | | | (0.26 | ) | | | 2.21 | | | | 1.86 | | | | 0.23 | | | | 0.74 | | | | 2.21 | | | | 1.86 | | | | 1.51% | | | | 1.42% | |
Administrator Class (WUSMX) | | | 07/30/2010 | | | | | | | | | | | | | | | | | | | | 0.44 | | | | 1.36 | | | | 3.06 | | | | 2.74 | | | | 0.70% | | | | 0.60% | |
Institutional Class (SMAIX) | | | 07/31/2000 | | | | | | | | | | | | | | | | | | | | 0.55 | | | | 1.59 | | | | 3.28 | | | | 2.95 | | | | 0.43% | | | | 0.37% | |
Investor Class (SMUAX) | | | 11/30/1995 | | | | | | | | | | | | | | | | | | | | 0.59 | | | | 1.47 | | | | 2.97 | | | | 2.60 | | | | 0.79% | | | | 0.70% | |
Barclays Capital 1-Year Municipal Bond Index6 | | | | | | | | | | | | | | | | | | | | | | | 0.55 | | | | 1.58 | | | | 3.03 | | | | 2.64 | | | | | | | | | |
| * | Returns for periods of less than one year are not annualized. |
Figures quoted represent past performance, which is no guarantee of future results and do not reflect the deduction of taxes that a shareholder may pay on fund distributions or the redemption of fund shares. Investment return and principal value of an investment will fluctuate so that an investor’s shares, when redeemed, may be worth more or less than their original cost. Performance shown without sales charges would be lower if sales charges were reflected. Current performance may be lower or higher than the performance data quoted and assumes the reinvestment of dividends and capital gains. Current month-end performance is available on the Fund’s Web site – www.wellsfargo.com/advantagefunds.
Index returns do not include transaction costs associated with buying and selling securities, any mutual fund fees or expenses or any taxes. It is not possible to invest directly in an index.
For Class A shares, the maximum front-end sales charge is 2.00%. For Class C shares, the maximum contingent deferred sales charge is 1.00%. Performance including sales charge assumes the sales charge for the corresponding time period. Administrator Class, Institutional Class, and Investor Class shares are sold without a front-end sales charge or contingent deferred sales charge.
Bond fund values fluctuate in response to the financial condition of individual issuers, general market and economic conditions, and changes in interest rates. In general, when interest rates rise, bond fund values fall and investors may lose principal value. The use of derivatives may reduce returns and/or increase volatility. Certain investment strategies tend to increase the total risk of an investment (relative to the broader market). This Fund is exposed to high-yield securities risk, and municipal securities risk. Consult the Fund’s prospectus for additional information on these and other risks. A portion of the Fund’s income may be subject to federal, state, and/or local income taxes or the alternative minimum tax (AMT). Any capital gains distributions may be taxable.
| 3. | Effective June 20, 2008, the Advisor Class was renamed Class A and modified to assume the features and attributes of Class A. Performance shown for the Class A shares through June 19, 2008 includes Advisor Class expenses. Historical performance shown for Class C shares prior to their inception reflects the performance of Class A shares, adjusted to reflect the higher expenses applicable to Class C shares. Historical performance shown for the Administrator Class shares prior to their inception reflects the performance of the Institutional Class shares, adjusted to reflect the higher expenses applicable to the Administrator Class shares. |
| 4. | Reflects the expense ratios as stated in the most recent prospectuses. |
| 5. | The Adviser has committed through October 31, 2012 to waive fees and/or reimburse expenses to the extent necessary to cap the Fund’s Total Annual Fund Operating Expenses After Fee Waiver, excluding certain expenses, at the amounts shown above. Without this cap, the Fund’s returns would have been lower. |
| 6. | The Barclays Capital 1-Year Municipal Bond Index is the 1-year component of the Barclays Capital Municipal Bond Index, which is an unmanaged index composed of long-term tax-exempt bonds with a minimum credit rating of Baa. You cannot invest directly in an index. |
| | | | |
| 8 | | Wells Fargo Advantage Ultra Short-Term Municipal Income Fund | | Fund Expenses (Unaudited) |
As a shareholder of the Fund, you incur two types of costs: (1) transaction costs, including sales charges (loads) on purchase payments and contingent deferred sales charges (if any) on redemptions and (2) ongoing costs, including management fees; distribution (12b-1) and/or shareholder service fees; and other Fund expenses. This example is intended to help you understand your ongoing costs (in dollars) of investing in the Fund and to compare these costs with the ongoing costs of investing in other mutual funds.
The example is based on an investment of $1,000 invested at the beginning of the six-month period and held for the entire period from July 1, 2011 to December 31, 2011.
Actual Expenses
The “Actual” line of the table below provides information about actual account values and actual expenses. You may use the information in this line, together with the amount you invested, to estimate the expenses that you paid over the period. Simply divide your account value by $1,000 (for example, an $8,600 account value divided by $1,000 = 8.6), then multiply the result by the number in the “Actual” line under the heading entitled “Expenses Paid During Period” for your applicable class of shares to estimate the expenses you paid on your account during this period.
Hypothetical Example for Comparison Purposes
The “Hypothetical” line of the table below provides information about hypothetical account values and hypothetical expenses based on the Fund’s actual expense ratio and an assumed rate of return of 5% per year before expenses, which is not the Fund’s actual return. The hypothetical account values and expenses may not be used to estimate the actual ending account balance or expenses you paid for the period. You may use this information to compare the ongoing costs of investing in the Fund and other funds. To do so, compare this 5% hypothetical example with the 5% hypothetical examples that appear in the shareholder reports of the other funds.
Please note that the expenses shown in the table are meant to highlight your ongoing costs only and do not reflect any transactional costs, such as sales charges (loads) and contingent deferred sales charges. Therefore, the “Hypothetical” line of the table is useful in comparing ongoing costs only, and will not help you determine the relative total costs of owning different funds. In addition, if these transactional costs were included, your costs would have been higher.
| | | | | | | | | | | | | | | | |
| | | Beginning
Account Value
07-01-2011 | | | Ending
Account Value
12-31-2011 | | | Expenses
Paid During
the Period1 | | | Net Annual
Expense Ratio | |
Class A | | | | | | | | | | | | | | | | |
Actual | | $ | 1,000.00 | | | $ | 1,004.01 | | | $ | 3.38 | | | | 0.67 | % |
Hypothetical (5% return before expenses) | | $ | 1,000.00 | | | $ | 1,021.77 | | | $ | 3.40 | | | | 0.67 | % |
Class C | | | | | | | | | | | | | | | | |
Actual | | $ | 1,000.00 | | | $ | 1,002.32 | | | $ | 7.15 | | | | 1.42 | % |
Hypothetical (5% return before expenses) | | $ | 1,000.00 | | | $ | 1,018.00 | | | $ | 7.20 | | | | 1.42 | % |
Administrator Class | | | | | | | | | | | | | | | | |
Actual | | $ | 1,000.00 | | | $ | 1,004.36 | | | $ | 3.02 | | | | 0.60 | % |
Hypothetical (5% return before expenses) | | $ | 1,000.00 | | | $ | 1,022.12 | | | $ | 3.05 | | | | 0.60 | % |
Institutional Class | | | | | | | | | | | | | | | | |
Actual | | $ | 1,000.00 | | | $ | 1,005.52 | | | $ | 1.87 | | | | 0.37 | % |
Hypothetical (5% return before expenses) | | $ | 1,000.00 | | | $ | 1,023.28 | | | $ | 1.88 | | | | 0.37 | % |
Investor Class | | | | | | | | | | | | | | | | |
Actual | | $ | 1,000.00 | | | $ | 1,005.94 | | | $ | 3.53 | | | | 0.70 | % |
Hypothetical (5% return before expenses) | | $ | 1,000.00 | | | $ | 1,021.62 | | | $ | 3.56 | | | | 0.70 | % |
| 1. | Expenses paid is equal to the annualized expense ratio of each class multiplied by the average account value over the period, multiplied by the number of days in the most recent fiscal half-year divided by the number of days in the fiscal year (to reflect the one-half year period). |
| | | | | | |
| Portfolio of Investments—December 31, 2011 (Unaudited) | | Wells Fargo Advantage Ultra Short-Term Municipal Income Fund | | | 9 | |
| | | | | | | | | | | | | | | | |
| Security Name | | Interest Rate | | | Maturity Date | | | Principal | | | Value | |
| | | | | | | | | | | | | | | | |
| | | | |
Municipal Bonds and Notes: 95.05% | | | | | | | | | | | | | | | | |
| | | | |
| Alabama: 1.31% | | | | | | | | | | | | | | | | |
Alabama Health Care Authority for Baptist Health (Health Revenue, Assured Guaranty GO of Authority Insured)±§(m) | | | 1.00 | % | | | 11/15/2037 | | | $ | 11,500,000 | | | $ | 11,500,000 | |
Alabama Health Care Authority for Baptist Health (Health Revenue, GO of Authority Insured)±§ | | | 6.13 | | | | 11/15/2036 | | | | 2,900,000 | | | | 2,946,545 | |
Chatom AL Industrial Development Board Alabama Electric Series A Remarketing (Utilities Revenue)±§ | | | 0.75 | | | | 08/01/2037 | | | | 10,500,000 | | | | 10,502,520 | |
Chatom AL Industrial Development Board Gulf Adjusted Power South Energy Cooperative Projects Series A (Utilities Revenue)±§ | | | 0.95 | | | | 11/15/2038 | | | | 50,000,000 | | | | 50,043,000 | |
Chatom AL Industrial Development Board Solid Refunding Power South Energy Series B (Utilities Revenue) | | | 4.00 | | | | 08/01/2013 | | | | 5,845,000 | | | | 6,077,982 | |
Huntsville AL Solid Waste Disposal Authority (Resource Recovery Revenue, NATL-RE Insured)§ | | | 5.50 | | | | 10/01/2014 | | | | 4,680,000 | | | | 4,693,010 | |
Huntsville AL Solid Waste Disposal Authority (Resource Recovery Revenue, NATL-RE Insured)§ | | | 5.75 | | | | 10/01/2012 | | | | 3,550,000 | | | | 3,564,768 | |
Jefferson County AL Series B-8 (Water & Sewer Revenue, AGM Insured)§ | | | 5.25 | | | | 02/01/2012 | | | | 2,380,000 | | | | 2,377,406 | |
Mobile AL Industrial Development Board PCR Alabama Power Company Barry Series B (IDR)±§ | | | 4.88 | | | | 06/01/2034 | | | | 775,000 | | | | 812,495 | |
Mobile AL Infirmary Health System Special Care Facilities Financing Authority Series A (Health Revenue) | | | 5.00 | | | | 02/01/2012 | | | | 500,000 | | | | 501,650 | |
Mobile AL Infirmary Health System Special Care Facilities Financing Authority Series A (Health Revenue) | | | 5.00 | | | | 02/01/2013 | | | | 1,000,000 | | | | 1,037,010 | |
| | | | |
| | | | | | | | | | | | | | | 94,056,386 | |
| | | | | | | | | | | | | | | | |
| | | | |
| Alaska: 0.11% | | | | | | | | | | | | | | | | |
Alaska Energy Authority (Utilities Revenue, FSA Insured)§ | | | 6.60 | | | | 07/01/2015 | | | | 7,400,000 | | | | 8,008,650 | |
| | | | | | | | | | | | | | | | |
| | | | |
| Arizona: 3.13% | | | | | | | | | | | | | | | | |
Arizona Health Facilities Authority Phoenix Catholic Healthcare West Series E (Health Revenue)±§ | | | 5.00 | | | | 07/01/2029 | | | | 9,000,000 | | | | 9,205,200 | |
Arizona Health Facilities Authority Phoenix Children’s Hospital Series A (Health Revenue)±§ | | | 1.10 | | | | 02/01/2042 | | | | 64,410,000 | | | | 60,097,106 | |
Arizona Health Facilities Authority Phoenix Children’s Hospital Series B (Health Revenue)±§ | | | 0.95 | | | | 02/01/2042 | | | | 43,300,000 | | | | 40,589,853 | |
Arizona Sports & Tourism Authority (Tax Revenue, Compass Bank LOC)±§ | | | 0.70 | | | | 07/01/2036 | | | | 39,000,000 | | | | 39,000,000 | |
Coconino County AZ Pollution Control Corporation Series A (Utilities Revenue)±§ | | | 3.63 | | | | 10/01/2029 | | | | 8,500,000 | | | | 8,705,445 | |
Maricopa County AZ IDA Catholic Healthcare West Series B (Health Revenue)±§ | | | 5.00 | | | | 07/01/2025 | | | | 5,520,000 | | | | 5,640,998 | |
Maricopa County AZ Pollution Control Corporation Series E (IDR)±§ | | | 6.00 | | | | 05/01/2029 | | | | 1,000,000 | | | | 1,090,510 | |
Mohave County AZ IDA Mohave Prison LLC Expansion Project (Miscellaneous Revenue)§ | | | 6.75 | | | | 05/01/2012 | | | | 2,580,000 | | | | 2,599,221 | |
Phoenix AZ IDA (Housing Revenue)§ | | | 1.38 | | | | 06/01/2014 | | | | 6,000,000 | | | | 6,007,020 | |
Scottsdale AZ IDA Healthcare Series F (Health Revenue, AGM Insured)±§(m) | | | 1.00 | | | | 09/01/2045 | | | | 49,950,000 | | | | 49,950,000 | |
Tempe AZ IDA University ASU Foundation Project (Lease Revenue, AMBAC Insured) | | | 5.00 | | | | 07/01/2013 | | | | 975,000 | | | | 1,017,569 | |
| | | | |
| | | | | | | | | | | | | | | 223,902,922 | |
| | | | | | | | | | | | | | | | |
| | | | |
| Arkansas: 0.03% | | | | | | | | | | | | | | | | |
Baxter County AR Hospital Revenue Refunding (Health Revenue) | | | 3.00 | | | | 09/01/2012 | | | | 1,555,000 | | | | 1,566,740 | |
Springdale AR Sales and Use Tax Refunding and Improvement (Tax Revenue, AGM Insured)§ | | | 4.00 | | | | 07/01/2027 | | | | 400,000 | | | | 407,428 | |
| | | | |
| | | | | | | | | | | | | | | 1,974,168 | |
| | | | | | | | | | | | | | | | |
| | | | |
| 10 | | Wells Fargo Advantage Ultra Short-Term Municipal Income Fund | | Portfolio of Investments—December 31, 2011 (Unaudited) |
| | | | | | | | | | | | | | | | |
| Security Name | | Interest Rate | | | Maturity Date | | | Principal | | | Value | |
| | | | | | | | | | | | | | | | |
| | | | |
| California: 9.57% | | | | | | | | | | | | | | | | |
Alameda County CA Tobacco Securitzation Agency (Tobacco Revenue) | | | 4.75 | % | | | 06/01/2012 | | | $ | 2,905,000 | | | $ | 2,936,897 | |
California Floaters Series DCL-011 (Miscellaneous Revenue, Dexia Credit Local LOC, FSA Insured)±§ | | | 2.25 | | | | 08/01/2027 | | | | 6,000,000 | | | | 6,000,000 | |
California HFA AMT Home Mortgage Series E (Housing Revenue, FGIC Insured)§ | | | 5.00 | | | | 02/01/2014 | | | | 2,625,000 | | | | 2,659,834 | |
California HFFA San Diego Hospital Series A (Health Revenue, NATL-RE Insured)±§(m)(a)(n) | | | 0.20 | | | | 07/15/2018 | | | | 5,800,000 | | | | 5,421,518 | |
California Infrastructure & Economic Development Bank (Miscellaneous Revenue)±§ | | | 0.60 | | | | 04/01/2038 | | | | 19,950,000 | | | | 19,949,601 | |
California Infrastructure & Economic Development Bank (Miscellaneous Revenue)±§ | | | 0.60 | | | | 04/01/2038 | | | | 10,200,000 | | | | 10,199,796 | |
California Infrastructure& Economic Development Bank (Miscellaneous Revenue)±§ | | | 0.60 | | | | 04/01/2038 | | | | 38,400,000 | | | | 38,399,232 | |
California MSTR Class A (Miscellaneous Revenue, Societe Generale LOC)±§ | | | 1.00 | | | | 06/01/2032 | | | | 44,000,000 | | | | 44,000,000 | |
California PCFA Refinance Republic Services Series B (Resource Recovery Revenue)±§144A | | | 0.70 | | | | 08/01/2024 | | | | 5,000,000 | | | | 5,000,150 | |
California PCFA Waste Management Incorporated Project Series A (Resource Recovery Revenue)±§ | | | 5.00 | | | | 11/01/2038 | | | | 6,000,000 | | | | 6,288,900 | |
California PCFA Waste Management Incorporated Project Series A1 (Resource Recovery Revenue)±§ | | | 4.70 | | | | 04/01/2025 | | | | 2,500,000 | | | | 2,520,100 | |
California State Economic Recovery (GO - State, BNP Paribas LOC)±§ | | | 0.38 | | | | 07/01/2023 | | | | 12,560,000 | | | | 12,560,000 | |
California State PFOTER 4369 (Miscellaneous Revenue, FSA Insured)±§ | | | 2.50 | | | | 08/01/2032 | | | | 10,620,000 | | | | 10,620,000 | |
California State PFOTER 690 (Miscellaneous Revenue, NATL-RE Insured)±§144A | | | 0.52 | | | | 07/16/2023 | | | | 20,000,000 | | | | 20,000,000 | |
California State Series DCL 009 (Miscellaneous Revenue, Dexia Credit Local LOC, FSA Insured)±§ | | | 2.25 | | | | 08/01/2027 | | | | 81,535,000 | | | | 81,535,000 | |
California State Various Purposes (Tax Revenue)§ | | | 6.25 | | | | 09/01/2012 | | | | 1,080,000 | | | | 1,122,779 | |
California Statewide CDA Disposal Republic Services Series A (Resource Recovery Revenue) | | | 4.95 | | | | 12/01/2012 | | | | 1,250,000 | | | | 1,292,738 | |
California Statewide CDA Health Facilities Catholic Series D (Health Revenue, AGM Insured)±§(m) | | | 0.85 | | | | 07/01/2041 | | | | 51,775,000 | | | | 51,775,000 | |
California Statewide CDA Health Facilities Catholic Series E (Health Revenue, AGM Insured)±§(m) | | | 0.90 | | | | 07/01/2040 | | | | 39,450,000 | | | | 39,450,000 | |
California Statewide CDA Health Facilities Catholic Series F (Health Revenue, AGM Insured)±§(m) | | | 0.90 | | | | 07/01/2040 | | | | 14,100,000 | | | | 14,100,000 | |
California Statewide CDA Proposition 1A Receivables Program (Miscellaneous Revenue) | | | 5.00 | | | | 06/15/2013 | | | | 5,745,000 | | | | 6,085,793 | |
El Monte CA Union High School District (Education Revenue) | | | 5.00 | | | | 06/01/2013 | | | | 5,000,000 | | | | 5,293,850 | |
Golden Empire Schools Financing Authority (Lease Revenue) | | | 4.00 | | | | 05/01/2012 | | | | 13,830,000 | | | | 13,986,556 | |
Golden State Tobacco Securitization Corporation (Tobacco Revenue, AMBAC Insured) | | | 4.00 | | | | 06/01/2014 | | | | 1,000,000 | | | | 1,032,200 | |
Hemet CA Unified School District COP (Lease Revenue)±§ | | | 1.60 | | | | 10/01/2036 | | | | 11,705,000 | | | | 11,702,893 | |
Inland Valley CA Development Agency (Tax Revenue)±§ | | | 4.00 | | | | 03/01/2041 | | | | 56,000,000 | | | | 56,659,680 | |
Kirkwood Meadows CA Public Utility District (Energy Revenue)§ | | | 4.50 | | | | 05/01/2013 | | | | 9,370,000 | | | | 9,405,044 | |
Long Beach CA Bond Finance Authority Natural Gas Purchase Series A (Utilities Revenue)§ | | | 5.00 | | | | 11/15/2013 | | | | 1,250,000 | | | | 1,296,500 | |
Long Beach CA Bond Finance Authority Natural Gas Purchase Series A (Utilities Revenue)§ | | | 5.00 | | | | 11/15/2014 | | | | 2,340,000 | | | | 2,432,032 | |
Northern California Gas Authority # 1 LIBOR (Utilities Revenue)±§ | | | 0.70 | | | | 07/01/2013 | | | | 10,000,000 | | | | 9,728,100 | |
Northern California Gas Authority # 1 LIBOR (Utilities Revenue)±§ | | | 0.85 | | | | 07/01/2017 | | | | 5,225,000 | | | | 4,556,148 | |
Norwalk La Mirada CA Unified School District (Tax Revenue, FGIC Insured)±§ | | | 0.80 | | | | 08/01/2027 | | | | 8,000,000 | | | | 8,000,000 | |
Palomar Pomerado CA Health Care District COP Series A (Health Revenue, AGM Insured)±§(m) | | | 1.00 | | | | 11/01/2036 | | | | 34,800,000 | | | | 34,800,000 | |
| | | | | | |
| Portfolio of Investments—December 31, 2011 (Unaudited) | | Wells Fargo Advantage Ultra Short-Term Municipal Income Fund | | | 11 | |
| | | | | | | | | | | | | | | | |
| Security Name | | Interest Rate | | | Maturity Date | | | Principal | | | Value | |
| | | | | | | | | | | | | | | | |
| | | | |
| California (continued) | | | | | | | | | | | | | | | | |
Palomar Pomerado CA Health Care District COP Series B (Health Revenue, AGM Insured)±§(m) | | | 1.10 | % | | | 11/01/2036 | | | $ | 26,000,000 | | | $ | 26,000,000 | |
Palomar Pomerado CA Health Care District COP Series C (Health Revenue, AGM Insured)±§(m) | | | 1.10 | | | | 11/01/2036 | | | | 14,750,000 | | | | 14,750,000 | |
Poway CA Community Facilities District # 88-1 Parkway Business (Tax Revenue) | | | 3.25 | | | | 08/15/2012 | | | | 2,980,000 | | | | 2,991,920 | |
Sacramento CA Unified School District COP Series A (Lease Revenue, AGM Insured)±§ | | | 3.10 | | | | 03/01/2040 | | | | 23,000,000 | | | | 22,889,830 | |
Sacramento County CA ROC RR II R-11977 (Airport Revenue, AGM Insured)±§144A | | | 0.11 | | | | 04/01/2012 | | | | 8,800,000 | | | | 8,800,000 | |
Sacramento County CA SFMR 2327 (Housing Revenue, FNMA GNMA Insured)± | | | 2.41 | | | | 10/01/2023 | | | | 8,550,000 | | | | 8,550,000 | |
San Diego CA PFFA Ballpark Series A (Lease Revenue, AMBAC Insured) 144A | | | 5.00 | | | | 02/15/2012 | | | | 1,000,000 | | | | 1,005,560 | |
San Diego CA PFFA Ballpark Series A (Lease Revenue, AMBAC Insured) 144A | | | 5.00 | | | | 02/15/2013 | | | | 4,110,000 | | | | 4,294,416 | |
San Diego County CA Certificates Registered Linked Yield Curve Notes (Lease Revenue, AMBAC Insured)§(m) | | | 5.63 | | | | 09/01/2012 | | | | 900,000 | | | | 924,471 | |
Southern California Public Power Authority Magnolia Power Project Series 2009-1-A (Utilities Revenue, KBC Bank NV LOC)±§ | | | 1.05 | | | | 07/01/2036 | | | | 46,100,000 | | | | 46,100,000 | |
Upland CA San Antonio Community Hospital (Lease Revenue) | | | 3.00 | | | | 01/01/2013 | | | | 1,790,000 | | | | 1,811,068 | |
Washington Township CA Health Care District 2004 Election Series A (Tax Revenue) | | | 6.00 | | | | 08/01/2012 | | | | 1,730,000 | | | | 1,782,419 | |
Washington Township CA Health Care District Series A (Health Revenue) | | | 4.50 | | | | 07/01/2012 | | | | 285,000 | | | | 289,512 | |
Washington Township CA Health Care District Series A (Health Revenue) | | | 4.50 | | | | 07/01/2013 | | | | 290,000 | | | | 301,997 | |
Washington Township CA Health Care District Series A (Health Revenue) | | | 5.00 | | | | 07/01/2014 | | | | 305,000 | | | | 326,457 | |
William S. Hart CA Union High School District MSTR Series SGC 59 Class A (Tax Revenue)±§144A | | | 1.00 | | | | 09/01/2027 | | | | 4,000,000 | | | | 4,000,000 | |
| | | | |
| | | | | | | | | | | | | | | 685,627,991 | |
| | | | | | | | | | | | | | | | |
| | | | |
| Colorado: 1.55% | | | | | | | | | | | | | | | | |
Arapahoe County CO Certificates IDK Partners I Trust Series A Class A (Housing Revenue, GNMA Insured) | | | 5.25 | | | | 11/01/2019 | | | | 53,288 | | | | 53,751 | |
Colorado Health Facilities Authority Catholic Health D-2 Project Unrefined Balance (Health Revenue)±§ | | | 5.25 | | | | 10/01/2038 | | | | 2,935,000 | | | | 3,181,335 | |
Colorado Springs CO Utilities Series B (Utilities Revenue)±§ | | | 0.45 | | | | 11/01/2036 | | | | 41,550,000 | | | | 41,550,000 | |
Denver CO City & County Airport Subordinated Series F2 (Airport Revenue, Assured Guaranty Insured)±§(m) | | | 0.90 | | | | 11/15/2025 | | | | 9,350,000 | | | | 9,350,000 | |
University of Colorado Enterprise Systems Series 2007-A (Education Revenue, NATL-RE Insured)±§ | | | 2.30 | | | | 06/01/2026 | | | | 6,775,000 | | | | 6,775,000 | |
University of Colorado Hospital Authority Series B (Education Revenue)±§ | | | 0.85 | | | | 11/15/2035 | | | | 50,000,000 | | | | 50,000,000 | |
| | | | |
| | | | | | | | | | | | | | | 110,910,086 | |
| | | | | | | | | | | | | | | | |
| | | | |
| Connecticut: 0.63% | | | | | | | | | | | | | | | | |
Connecticut State Development Authority PCR (Utilities Revenue)±§ | | | 1.25 | | | | 09/01/2028 | | | | 9,000,000 | | | | 9,003,420 | |
Connecticut State Series A (Miscellaneous Revenue)±§ | | | 0.80 | | | | 03/01/2016 | | | | 25,000,000 | | | | 24,975,750 | |
Connecticut Transmission Municipal Electric Cooperative (Energy Revenue)±§ | | | 0.95 | | | | 01/01/2029 | | | | 10,895,000 | | | | 10,900,012 | |
| | | | |
| | | | | | | | | | | | | | | 44,879,182 | |
| | | | | | | | | | | | | | | | |
| | | | |
| Delaware: 0.42% | | | | | | | | | | | | | | | | |
Delaware PFOTER (Miscellaneous Revenue)±§ | | | 0.86 | | | | 07/01/2047 | | | | 11,115,000 | | | | 11,115,000 | |
Delaware State EDA (Utilities Revenue)±§ | | | 0.75 | | | | 05/01/2026 | | | | 5,000,000 | | | | 5,005,350 | |
Delaware State EDA (Utilities Revenue)±§ | | | 1.80 | | | | 07/01/2025 | | | | 7,000,000 | | | | 7,021,700 | |
| | | | |
| 12 | | Wells Fargo Advantage Ultra Short-Term Municipal Income Fund | | Portfolio of Investments—December 31, 2011 (Unaudited) |
| | | | | | | | | | | | | | | | |
| Security Name | | Interest Rate | | | Maturity Date | | | Principal | | | Value | |
| | | | | | | | | | | | | | | | |
| | | | |
| Delaware (continued) | | | | | | | | | | | | | | | | |
Wilmington DE Multi-Family Housing Lincoln Towers Series A (Housing Revenue, Local or Guaranty Housing Insured) | | | 4.00 | % | | | 07/15/2013 | | | $ | 7,000,000 | | | $ | 7,023,800 | |
| | | | |
| | | | | | | | | | | | | | | 30,165,850 | |
| | | | | | | | | | | | | | | | |
| | | | |
| District of Columbia: 0.87% | | | | | | | | | | | | | | | | |
District of Columbia American College of Cardiology (Education Revenue, SunTrust Bank LOC)±§ | | | 0.45 | | | | 06/01/2040 | | | | 12,000,000 | | | | 12,000,000 | |
District of Columbia BAN Pilot Arthur (Tax Revenue) | | | 4.00 | | | | 12/01/2012 | | | | 6,000,000 | | | | 6,134,880 | |
District of Columbia Children’s Research Center (Miscellaneous Revenue, SunTrust Bank LOC)±§ | | | 0.45 | | | | 04/01/2038 | | | | 6,135,000 | | | | 6,135,000 | |
District of Columbia Income Tax Refunding Secured Series B (Tax Revenue)±§ | | | 0.70 | | | | 12/01/2015 | | | | 30,000,000 | | | | 30,002,100 | |
District of Columbia Income Tax Refunding Secured Series E (Tax Revenue)±§ | | | 0.70 | | | | 12/01/2015 | | | | 5,000,000 | | | | 5,000,350 | |
District of Columbia Thomas B Fordham Foundation (Miscellaneous Revenue, SunTrust Bank LOC)±§ | | | 0.45 | | | | 10/01/2037 | | | | 3,000,000 | | | | 3,000,000 | |
| | | | |
| | | | | | | | | | | | | | | 62,272,330 | |
| | | | | | | | | | | | | | | | |
| | | | |
| Florida: 5.58% | | | | | | | | | | | | | | | | |
Alachua County FL Health Facilities Authority Shands Healthcare Series B (Health Revenue) | | | 3.00 | | | | 12/01/2012 | | | | 500,000 | | | | 506,650 | |
Alachua County FL Health Facilities Authority Shands Healthcare Series B (Health Revenue) | | | 5.00 | | | | 12/01/2013 | | | | 4,340,000 | | | | 4,592,848 | |
Arcadia FL Housing Authority Arcadia Oaks Association Limited Project (Housing Revenue)§ | | | 4.25 | | | | 01/01/2012 | | | | 2,000,000 | | | | 2,000,120 | |
Bay County FL PCR (IDR) | | | 5.10 | | | | 09/01/2012 | | | | 2,000,000 | | | | 2,041,680 | |
Broward County FL Series E (Airport Revenue, NATL-RE Insured)§ | | | 5.25 | | | | 10/01/2012 | | | | 1,300,000 | | | | 1,305,031 | |
Citizens Property Insurance Corporation of Florida (Miscellaneous Revenue, AGM Insured)± | | | 1.75 | | | | 06/01/2014 | | | | 54,500,000 | | | | 54,691,295 | |
Citrus County FL COP Series B (Lease Revenue, Assured Guaranty Insured) | | | 4.00 | | | | 04/01/2012 | | | | 2,180,000 | | | | 2,197,789 | |
Collier County FL IDA NCH Healthcare System Project (Health Revenue) | | | 4.00 | | | | 10/01/2013 | | | | 1,065,000 | | | | 1,110,497 | |
Florida Higher Educational Facilities Financial Authority (Education Revenue) | | | 3.00 | | | | 04/01/2012 | | | | 500,000 | | | | 500,845 | |
Florida Higher Educational Facilities Financial Authority (Education Revenue) | | | 4.00 | | | | 04/01/2013 | | | | 1,125,000 | | | | 1,150,414 | |
Florida Housing Finance Corporation (Housing Revenue) | | | 3.25 | | | | 12/15/2012 | | | | 9,435,000 | | | | 9,461,041 | |
Florida State Board of Education Series A (Miscellaneous Revenue) | | | 5.00 | | | | 07/01/2012 | | | | 3,095,000 | | | | 3,167,949 | |
Florida State Board of Education Series C (Miscellaneous Revenue) | | | 3.00 | | | | 07/01/2012 | | | | 5,350,000 | | | | 5,422,386 | |
Florida State Board of Education Series C (Miscellaneous Revenue) | | | 5.00 | | | | 07/01/2012 | | | | 1,215,000 | | | | 1,243,638 | |
Gulf Breeze FL local Government Loan Series FG & H Remarketing 12/01/2011 (Miscellaneous Revenue)±§ | | | 1.35 | | | | 12/01/2020 | | | | 13,280,000 | | | | 13,271,634 | |
Gulf Breeze FL Local Government Loan Series B (Miscellaneous Revenue)±§ | | | 3.00 | | | | 12/01/2020 | | | | 20,975,000 | | | | 20,826,287 | |
Highlands County FL Health Facilities Authority Adventist Sunbelt Series E (Health Revenue) | | | 4.50 | | | | 11/15/2012 | | | | 1,395,000 | | | | 1,441,342 | |
Highlands County FL Health Facilities Authority Adventist Series E (Health Revenue)±§ | | | 0.50 | | | | 11/15/2035 | | | | 36,475,000 | | | | 36,475,000 | |
Hillsborough County FL IDA (Utilities Revenue)§ | | | 5.10 | | | | 10/01/2013 | | | | 1,130,000 | | | | 1,158,420 | |
Hillsborough County FL School Board COP Master Lease Program Series A (Lease Revenue, NATL-RE Insured) | | | 5.50 | | | | 07/01/2012 | | | | 2,045,000 | | | | 2,093,569 | |
Lakeland FL Energy System Revenue (Utilities Revenue)±§ | | | 0.85 | | | | 10/01/2012 | | | | 13,700,000 | | | | 13,732,743 | |
Lakeland FL Energy System Revenue (Utilities Revenue)±§ | | | 1.20 | | | | 10/01/2014 | | | | 13,075,000 | | | | 13,131,353 | |
Lee County FL Refunding Series A (Airport Revenue, AGM Insured) | | | 5.00 | | | | 10/01/2012 | | | | 1,750,000 | | | | 1,805,843 | |
Lee County FL Refunding Series A (Airport Revenue, AGM Insured) | | | 5.00 | | | | 10/01/2013 | | | | 4,140,000 | | | | 4,385,585 | |
| | | | | | |
| Portfolio of Investments—December 31, 2011 (Unaudited) | | Wells Fargo Advantage Ultra Short-Term Municipal Income Fund | | | 13 | |
| | | | | | | | | | | | | | | | |
| Security Name | | Interest Rate | | | Maturity Date | | | Principal | | | Value | |
| | | | | | | | | | | | | | | | |
| | | | |
| Florida (continued) | | | | | | | | | | | | | | | | |
Marion County FL IDA Waste 2 Water Incorporated Project (IDR, SunTrust Bank LOC)±§ | | | 0.70 | % | | | 10/01/2026 | | | $ | 835,000 | | | $ | 835,000 | |
Miami-Dade County FL Expressway Authority (Transportation Revenue, Assured Guaranty Insured)±§144A | | | 0.25 | | | | 07/01/2018 | | | | 1,450,000 | | | | 1,450,000 | |
Miami-Dade County FL HFA Siesta Pointe Apartments Series A (Housing Revenue, AGM Insured)§ | | | 5.50 | | | | 09/01/2012 | | | | 310,000 | | | | 310,856 | |
Miami-Dade County FL IDA Dolphins Stadium Project Series A (IDR)±§ | | | 3.00 | | | | 07/01/2032 | | | | 19,075,000 | | | | 19,075,000 | |
Miami-Dade County FL IDA Dolphins Stadium Project Series B (IDR)±§ | | | 3.00 | | | | 07/01/2032 | | | | 19,075,000 | | | | 19,075,000 | |
Miami-Dade County FL IDA Series C (IDR)±§ | | | 3.00 | | | | 07/01/2032 | | | | 6,850,000 | | | | 6,850,000 | |
Miami-Dade County FL International Airport Aviation Series 34 (Airport Revenue, Societe Generale LOC)±§ | | | 1.05 | | | | 10/01/2029 | | | | 11,870,000 | | | | 11,870,000 | |
Miami-Dade County FL School Board Master Equipment Lease Purchase A (Lease Revenue)144A | | | 3.59 | | | | 03/03/2016 | | | | 12,050,515 | | | | 12,410,946 | |
Miami-Dade County FL School Board Series A (Lease Revenue)±§ | | | 5.00 | | | | 05/01/2031 | | | | 17,000,000 | | | | 18,217,200 | |
North Miami FL Johnston & Wales University Project Series A (Education Revenue, XLCA Insured) | | | 5.00 | | | | 04/01/2012 | | | | 1,455,000 | | | | 1,467,426 | |
Okeechobee County FL Disposal Waste Management Landfill Series A (Resource Recovery Revenue)±§ | | | 2.63 | | | | 07/01/2039 | | | | 6,690,000 | | | | 6,786,269 | |
Orange County FL IDR (Education Revenue, SunTrust Bank LOC)±§ | | | 0.45 | | | | 06/01/2029 | | | | 7,095,000 | | | | 7,095,000 | |
Orange County FL Independent Blood & Tissue Services (IDR, SunTrust Bank LOC)±§ | | | 0.45 | | | | 10/01/2027 | | | | 12,365,000 | | | | 12,365,000 | |
Orlando & Orange County FL Expressway Authority Sub Series B-2 (Transportation Revenue, SunTrust Bank LOC)±§ | | | 0.42 | | | | 07/01/2040 | | | | 15,445,000 | | | | 15,445,000 | |
Osceola County FL School Board (Tax Revenue, AGM Insured) | | | 5.00 | | | | 06/01/2013 | | | | 1,400,000 | | | | 1,477,672 | |
Palm Beach County FL Public Improvement COP (Miscellaneous Revenue) 144A | | | 3.04 | | | | 02/01/2014 | | | | 18,336,192 | | | | 18,508,369 | |
Palm Beach County FL South Florida Blood Banks Project (IDR, SunTrust Bank LOC)±§ | | | 0.45 | | | | 12/01/2022 | | | | 5,670,000 | | | | 5,670,000 | |
Pasco County FL School Board (Lease Revenue, AMBAC Insured)±§(m) | | | 0.89 | | | | 08/01/2030 | | | | 23,150,000 | | | | 23,150,000 | |
Pinellas County FL YMCA Suncoast Incorporated Project (IDR, SunTrust Bank LOC)±§ | | | 0.45 | | | | 05/01/2027 | | | | 5,280,000 | | | | 5,280,000 | |
Saint Petersburg FL Health Facilities Authority All Childrens Series B (Health Revenue, AMBAC Insured)±§(m) | | | 0.85 | | | | 11/15/2034 | | | | 50,000 | | | | 50,000 | |
South Lake County FL South Lake Hospital Incorporated (Health Revenue) | | | 4.00 | | | | 10/01/2012 | | | | 455,000 | | | | 462,922 | |
South Lake County FL South Lake Hospital Incorporated (Health Revenue) | | | 4.00 | | | | 10/01/2013 | | | | 900,000 | | | | 930,591 | |
South Lake County FL South Lake Hospital Incorporated (Health Revenue)§ | | | 5.50 | | | | 10/01/2013 | | | | 660,000 | | | | 676,916 | |
Volusia County FL School Board (Tax Revenue, AMG Insured) | | | 5.00 | | | | 10/01/2014 | | | | 9,500,000 | | | | 10,256,675 | |
Volusia County FL School Board (Tax Revenue, AGM Insured) | | | 5.25 | | | | 10/01/2012 | | | | 1,905,000 | | | | 1,951,349 | |
| | | | |
| | | | | | | | | | | | | | | 399,381,150 | |
| | | | | | | | | | | | | | | | |
| | | | |
| Georgia: 0.68% | | | | | | | | | | | | | | | | |
Atlanta GA Airport Passenger Facilities ROC RR II R-517X (Airport Revenue, FSA Insured)±§ | | | 0.22 | | | | 07/01/2012 | | | | 3,020,000 | | | | 3,020,000 | |
Atlanta GA Airport Passenger Facilities Putters Series 3027 (Airport Revenue, FSA Insured)±§ | | | 0.23 | | | | 01/01/2013 | | | | 7,430,000 | | | | 7,430,000 | |
Burke County GA Development Authority (Miscellaneous Revenue)±§ | | | 2.50 | | | | 01/01/2040 | | | | 17,000,000 | | | | 17,257,210 | |
Fulton County GA Development Authority Healthcare System Catholic East (Health Revenue) | | | 5.00 | | | | 11/15/2013 | | | | 5,180,000 | | | | 5,533,328 | |
Georgia Public Gas Partners Incorporated Series A (Energy Revenue)§ | | | 5.00 | | | | 10/01/2012 | | | | 2,050,000 | | | | 2,112,279 | |
Gwinnett County GA Hospital Authority KMD Group LLC Project (IDR, SunTrust Bank LOC)±§ | | | 0.55 | | | | 02/01/2032 | | | | 2,710,000 | | | | 2,710,000 | |
Main Street Natural Gas Incorporated Georgia Series B (Utilities Revenue)§ | | | 5.00 | | | | 03/15/2014 | | | | 1,000,000 | | | | 1,032,710 | |
Metropolitan Atlanta Rapid Transit Authority Georgia Series P (Tax Revenue, AMBAC Insured)§ | | | 6.00 | | | | 07/01/2013 | | | | 1,325,000 | | | | 1,389,779 | |
| | | | |
| 14 | | Wells Fargo Advantage Ultra Short-Term Municipal Income Fund | | Portfolio of Investments—December 31, 2011 (Unaudited) |
| | | | | | | | | | | | | | | | |
| Security Name | | Interest Rate | | | Maturity Date | | | Principal | | | Value | |
| | | | | | | | | | | | | | | | |
| | | | |
| Georgia (continued) | | | | | | | | | | | | | | | | |
Metropolitan Atlanta Rapid Transportation Authority Georgia Sales Tax Series P (Tax Revenue, Societe Generale LOC, AMBAC Insured)±§144A | | | 1.05 | % | | | 07/01/2020 | | | $ | 8,605,000 | | | $ | 8,605,000 | |
| | | | |
| | | | | | | | | | | | | | | 49,090,306 | |
| | | | | | | | | | | | | | | | |
| | | | |
| Guam: 0.02% | | | | | | | | | | | | | | | | |
Guam Government Hotel Occupancy Series A (Tax Revenue) | | | 2.00 | | | | 11/01/2012 | | | | 1,740,000 | | | | 1,752,859 | |
| | | | | | | | | | | | | | | | |
| | | | |
| Illinois: 7.04% | | | | | | | | | | | | | | | | |
Broadview IL Tax Increment Revenue (Tax Revenue)§ | | | 5.25 | | | | 07/01/2012 | | | | 850,000 | | | | 850,961 | |
Chicago IL Finance Authority Columbia College (Education Revenue) | | | 4.00 | | | | 12/01/2014 | | | | 1,560,000 | | | | 1,631,152 | |
Chicago IL Finance Authority Columbia College (Education Revenue) | | | 5.00 | | | | 12/01/2013 | | | | 1,485,000 | | | | 1,567,388 | |
Chicago IL State University Revenue (Education Revenue, NATL-RE Insured)§ | | | 4.60 | | | | 12/01/2012 | | | | 1,020,000 | | | | 1,022,927 | |
Chicago IL Various Refunding Project Series D (Miscellaneous Revenue, AGM Insured)±§ | | | 4.00 | | | | 01/01/2040 | | | | 85,490,000 | | | | 85,490,000 | |
Chicago IL Various Refunding Series E Remarketing 10/21/2008 (Tax Revenue)±§ | | | 0.80 | | | | 01/01/2042 | | | | 72,500,000 | | | | 72,500,000 | |
Chicago IL Various Refunding Series G Remarketing 10/21/2008 (Tax Revenue)±§ | | | 0.80 | | | | 01/01/2042 | | | | 12,000,000 | | | | 12,000,000 | |
Chicago IL Wastewater Transmission Refunding (Water & Sewer Revenue, NATL-RE FGIC Insured)§ | | | 5.38 | | | | 01/01/2013 | | | | 475,000 | | | | 480,486 | |
Clinton Bond Fayette Jefferson et cetera Counties IL Community College District # 501 Kaskaskia (Tax Revenue)§ | | | 3.25 | | | | 12/01/2031 | | | | 950,000 | | | | 950,171 | |
Clinton Bond Fayette Jefferson et cetera Counties IL Community College District #501 Kaskaskia (Tax Revenue)§ | | | 3.25 | | | | 12/01/2018 | | | | 530,000 | | | | 530,069 | |
Clinton Bond Fayette Jefferson et cetera Counties IL Community College District #501 Kaskaskia (Tax Revenue)§ | | | 3.25 | | | | 12/01/2012 | | | | 130,000 | | | | 130,003 | |
Clinton Bond Fayette Jefferson et cetera Counties IL Community College District #501 Kaskaskia (Tax Revenue)§ | | | 3.25 | | | | 12/01/2015 | | | | 460,000 | | | | 460,046 | |
Clinton Bond Fayette Jefferson et cetera Counties IL Community College District #501 Kaskaskia (Tax Revenue)§ | | | 3.25 | | | | 12/01/2017 | | | | 505,000 | | | | 505,076 | |
Clinton Bond Fayette Jefferson et cetera Counties IL Community College District #501 Kaskaskia (Tax Revenue)§ | | | 3.25 | | | | 12/01/2019 | | | | 550,000 | | | | 550,077 | |
Clinton Bond Fayette Jefferson et cetera Counties IL Community College District #501 Kaskaskia (Tax Revenue)§ | | | 3.25 | | | | 12/01/2020 | | | | 580,000 | | | | 580,087 | |
Clinton Bond Fayette Jefferson et cetera Counties IL Community College District #501 Kaskaskia (Tax Revenue)§ | | | 3.25 | | | | 12/01/2021 | | | | 605,000 | | | | 605,085 | |
Clinton Bond Fayette Jefferson et cetera Counties IL Community College District #501 Kaskaskia (Tax Revenue)§ | | | 3.25 | | | | 12/01/2022 | | | | 630,000 | | | | 630,095 | |
Clinton Bond Fayette Jefferson et cetera Counties IL Community College District #501 Kaskaskia (Tax Revenue)§ | | | 3.25 | | | | 12/01/2023 | | | | 660,000 | | | | 660,099 | |
Clinton Bond Fayette Jefferson et cetera Counties IL Community College District #501 Kaskaskia (Tax Revenue)§ | | | 3.25 | | | | 12/01/2024 | | | | 690,000 | | | | 690,104 | |
Clinton Bond Fayette Jefferson et cetera Counties IL Community College District #501 Kaskaskia (Tax Revenue)§ | | | 3.25 | | | | 12/01/2025 | | | | 725,000 | | | | 725,102 | |
Clinton Bond Fayette Jefferson et cetera Counties IL Community College District #501 Kaskaskia (Tax Revenue)§ | | | 3.25 | | | | 12/01/2026 | | | | 755,000 | | | | 755,106 | |
Clinton Bond Fayette Jefferson et cetera Counties IL Community College District #501 Kaskaskia (Tax Revenue)§ | | | 3.25 | | | | 12/01/2027 | | | | 790,000 | | | | 790,119 | |
Clinton Bond Fayette Jefferson et cetera Counties IL Community College District #501 Kaskaskia (Tax Revenue)§ | | | 3.25 | | | | 12/01/2028 | | | | 830,000 | | | | 830,133 | |
Clinton Bond Fayette Jefferson et cetera Counties IL Community College District #501 Kaskaskia (Tax Revenue)§ | | | 3.25 | | | | 12/01/2029 | | | | 865,000 | | | | 865,147 | |
| | | | | | |
| Portfolio of Investments—December 31, 2011 (Unaudited) | | Wells Fargo Advantage Ultra Short-Term Municipal Income Fund | | | 15 | |
| | | | | | | | | | | | | | | | |
| Security Name | | Interest Rate | | | Maturity Date | | | Principal | | | Value | |
| | | | | | | | | | | | | | | | |
| | | | |
| Illinois (continued) | | | | | | | | | | | | | | | | |
Clinton Bond Fayette Jefferson et cetera Counties IL Community College District #501 Kaskaskia (Tax Revenue)§ | | | 3.25 | % | | | 12/01/2030 | | | $ | 905,000 | | | $ | 905,154 | |
Clinton Bond Fayette Jefferson et cetera Counties IL Community College District #501 Kaskaskia (Tax Revenue)§ | | | 3.25 | | | | 12/01/2014 | | | | 440,000 | | | | 440,018 | |
Clinton Bond Fayette Jefferson et cetera Counties IL Community College District #501 Kaskaskia (Tax Revenue)§ | | | 3.25 | | | | 12/01/2013 | | | | 420,000 | | | | 420,017 | |
Clinton Bond Fayette Jefferson et cetera Counties IL Community College District #501 Kaskaskia (Tax Revenue)§ | | | 3.25 | | | | 12/01/2016 | | | | 480,000 | | | | 480,072 | |
Cook & Will County IL Township High School District # 206 (Tax Revenue, XLCA Insured) | | | 4.00 | | | | 12/01/2012 | | | | 1,155,000 | | | | 1,181,761 | |
Cook County IL School District # 130 (Tax Revenue, XLCA Insured) | | | 4.25 | | | | 06/01/2012 | | | | 585,000 | | | | 590,534 | |
Cook County IL School District # 130 (Tax Revenue, XLCA Insured) | | | 4.25 | | | | 12/01/2012 | | | | 1,110,000 | | | | 1,131,967 | |
Cook County IL School District # 130 (Tax Revenue, XLCA Insured) | | | 4.25 | | | | 06/01/2013 | | | | 435,000 | | | | 447,580 | |
Illinois Finance Authority Alexion Brothers Health System (Health Revenue) | | | 4.00 | | | | 02/15/2012 | | | | 1,200,000 | | | | 1,203,384 | |
Illinois Finance Authority Insured Covenant Series A (Housing Revenue, Radian Insured)§ | | | 4.60 | | | | 12/01/2012 | | | | 510,000 | | | | 513,733 | |
Illinois Finance Authority Memorial Health System (Health Revenue) | | | 4.00 | | | | 04/01/2012 | | | | 875,000 | | | | 881,291 | |
Illinois Finance Authority Resurrection Health (Health Revenue) | | | 4.00 | | | | 05/15/2012 | | | | 9,315,000 | | | | 9,382,813 | |
Illinois Finance Authority Swedish Covenant Series A (Health Revenue) | | | 4.00 | | | | 08/15/2012 | | | | 1,270,000 | | | | 1,283,233 | |
Illinois Finance Authority Swedish Covenant Series A (Health Revenue) | | | 4.00 | | | | 08/15/2013 | | | | 1,405,000 | | | | 1,434,112 | |
Illinois Regional Transit Authority MSTR Series 55 Class A (Tax Revenue, Societe Generale LOC, FGIC GO of Authority Insured)±§ | | | 1.05 | | | | 11/01/2021 | | | | 9,675,000 | | | | 9,675,000 | |
Illinois State ROC RR II R-11526 (Miscellaneous Revenue, NATL-RE Insured)±§ | | | 0.60 | | | | 04/01/2014 | | | | 3,750,000 | | | | 3,750,000 | |
Illinois State Series B (Miscellaneous Revenue)±§ | | | 3.00 | | | | 10/01/2033 | | | | 198,970,000 | | | | 198,970,000 | |
Macon Christian Dewitt et cetera Counties IL Community College District #537 Richland Limited Tax Debt Certificates (Miscellaneous Revenue)±§ | | | 3.25 | | | | 08/01/2012 | | | | 200,000 | | | | 202,330 | |
Macon Christian Dewitt et cetera Counties IL Community College District #537 Richland Limited Tax Debt Certificates (Miscellaneous Revenue)±§ | | | 3.25 | | | | 08/01/2013 | | | | 515,000 | | | | 530,007 | |
Macon Christian Dewitt et cetera Counties IL Community College District #537 Richland Limited Tax Debt Certificates (Miscellaneous Revenue)±§ | | | 3.25 | | | | 08/01/2014 | | | | 540,000 | | | | 540,896 | |
Macon Christian Dewitt et cetera Counties IL Community College District #537 Richland Limited Tax Debt Certificates (Miscellaneous Revenue)±§ | | | 3.25 | | | | 08/01/2015 | | | | 570,000 | | | | 571,379 | |
Macon Christian Dewitt et cetera Counties IL Community College District #537 Richland Limited Tax Debt Certificates (Miscellaneous Revenue)±§ | | | 3.25 | | | | 08/01/2016 | | | | 595,000 | | | | 598,261 | |
Macon Christian Dewitt et cetera Counties IL Community College District #537 Richland Limited Tax Debt Certificates (Miscellaneous Revenue)±§ | | | 3.25 | | | | 08/01/2017 | | | | 630,000 | | | | 635,777 | |
Macon Christian Dewitt et cetera Counties IL Community College District #537 Richland Limited Tax Debt Certificates (Miscellaneous Revenue)±§ | | | 3.25 | | | | 08/01/2018 | | | | 660,000 | | | | 667,986 | |
Macon Christian Dewitt et cetera Counties IL Community College District #537 Richland Limited Tax Debt Certificates (Miscellaneous Revenue)±§ | | | 3.25 | | | | 08/01/2019 | | | | 695,000 | | | | 705,022 | |
Macon Christian Dewitt et cetera Counties IL Community College District #537 Richland Limited Tax Debt Certificates (Miscellaneous Revenue)±§ | | | 3.25 | | | | 08/01/2020 | | | | 730,000 | | | | 740,870 | |
Macon Christian Dewitt et cetera Counties IL Community College District #537 Richland Limited Tax Debt Certificates (Miscellaneous Revenue)±§ | | | 3.25 | | | | 08/01/2021 | | | | 765,000 | | | | 775,557 | |
Macon Christian Dewitt et cetera Counties IL Community College District #537 Richland Limited Tax Debt Certificates (Miscellaneous Revenue)±§ | | | 3.25 | | | | 08/01/2022 | | | | 805,000 | | | | 815,859 | |
Macon Christian Dewitt et cetera Counties IL Community College District #537 Richland Limited Tax Debt Certificates (Miscellaneous Revenue)±§ | | | 3.25 | | | | 08/01/2023 | | | | 845,000 | | | | 856,796 | |
Macon Christian Dewitt et cetera Counties IL Community College District #537 Richland Limited Tax Debt Certificates (Miscellaneous Revenue)±§ | | | 3.25 | | | | 08/01/2024 | | | | 890,000 | | | | 901,597 | |
Macon Christian Dewitt et cetera Counties IL Community College District #537 Richland Limited Tax Debt Certificates (Miscellaneous Revenue)±§ | | | 3.25 | | | | 08/01/2025 | | | | 935,000 | | | | 945,874 | |
| | | | |
| 16 | | Wells Fargo Advantage Ultra Short-Term Municipal Income Fund | | Portfolio of Investments—December 31, 2011 (Unaudited) |
| | | | | | | | | | | | | | | | |
| Security Name | | Interest Rate | | | Maturity Date | | | Principal | | | Value | |
| | | | | | | | | | | | | | | | |
| | | | |
| Illinois (continued) | | | | | | | | | | | | | | | | |
Macon Christian Dewitt et cetera Counties IL Community College District #537 Richland Limited Tax Debt Certificates (Miscellaneous Revenue)±§ | | | 3.25 | % | | | 08/01/2026 | | | $ | 625,000 | | | $ | 631,788 | |
McHenry & Lake Counties IL Community Consolidated School District # 15 (Tax Revenue, NATL-RE FGIC Insured)§ | | | 4.40 | | | | 01/01/2012 | | | | 15,000 | | | | 15,001 | |
Regional Transportation Authority Illinois (Tax Revenue, GO of Authority Insured)±§ | | | 0.90 | | | | 06/01/2025 | | | | 50,950,000 | | | | 50,950,000 | |
Rock Island County IL Metropolitan Airport Authority Refunding Series A (Tax Revenue, Assured Guaranty Insured)§ | | | 3.80 | | | | 12/01/2015 | | | | 3,280,000 | | | | 3,451,511 | |
University of Illinois Auxilary Facilities CAB (Education Revenue)(z) | | | 0.38 | | | | 04/01/2012 | | | | 3,990,000 | | | | 3,986,090 | |
University of Illinois COP Utilities Infrastructure Projects (Lease Revenue, AMBAC Insured) | | | 5.00 | | | | 08/15/2012 | | | | 4,475,000 | | | | 4,570,586 | |
Will & Kendall Counties IL GO Community Consolidated School District # 202 Plainfield (Tax Revenue) | | | 3.00 | | | | 01/01/2012 | | | | 5,575,000 | | | | 5,575,335 | |
Will & Kendall Counties IL GO Community Consolidated School District # 202 Plainfield (Tax Revenue) | | | 3.00 | | | | 01/01/2013 | | | | 3,000,000 | | | | 3,060,030 | |
Will & Kendall Counties IL GO Community Consolidated School District # 202 Plainfield (Tax Revenue) | | | 3.00 | | | | 01/01/2013 | | | | 3,170,000 | | | | 3,232,449 | |
Will County IL Township High School District # 205 Lockport (Tax Revenue, AGM Insured)(z) | | | 1.23 | | | | 12/01/2012 | | | | 1,080,000 | | | | 1,067,796 | |
| | | | |
| | | | | | | | | | | | | | | 504,518,899 | |
| | | | | | | | | | | | | | | | |
| | | | |
| Indiana: 0.34% | | | | | | | | | | | | | | | | |
Hammond IN Local Public Improvement Bond Bank (Miscellaneous Revenue, Fifth Third Bank LOC) | | | 3.00 | | | | 01/03/2012 | | | | 18,000,000 | | | | 18,002,520 | |
Indiana Finance Authority Ascension Health Series CR-E-4 (Health Revenue)±§ | | | 1.25 | | | | 11/15/2033 | | | | 300,000 | | | | 300,969 | |
Indiana Finance Authority Floyd Memorial Hospital & Health Refunding (Health Revenue) | | | 4.00 | | | | 03/01/2012 | | | | 1,660,000 | | | | 1,666,773 | |
Indiana Finance Authority Floyd Memorial Hospital & Health Refunding (Health Revenue) | | | 4.00 | | | | 03/01/2013 | | | | 1,730,000 | | | | 1,770,050 | |
Seymour IN Union Camp Corporation Project (IDR) | | | 6.25 | | | | 07/01/2012 | | | | 2,420,000 | | | | 2,477,669 | |
| | | | |
| | | | | | | | | | | | | | | 24,217,981 | |
| | | | | | | | | | | | | | | | |
| | | | |
| Iowa: 0.19% | | | | | | | | | | | | | | | | |
Iowa Finance Authority Health Facilities Series F (Health Revenue)±§ | | | 5.00 | | | | 08/15/2039 | | | | 10,000,000 | | | | 10,278,800 | |
Iowa Student Loan Liquidity Corporation Series 1 (Education Revenue) | | | 3.25 | | | | 12/01/2012 | | | | 1,650,000 | | | | 1,672,919 | |
Iowa Student Loan Liquidity Corporation Series 1 (Education Revenue) | | | 4.00 | | | | 12/01/2012 | | | | 1,500,000 | | | | 1,535,490 | |
| | | | |
| | | | | | | | | | | | | | | 13,487,209 | |
| | | | | | | | | | | | | | | | |
| | | | |
| Kentucky: 1.66% | | | | | | | | | | | | | | | | |
Kenton County KY Airport Board Cincinnati Northern Kentucky Refunding Series A (Airport Revenue, NATL-RE Insured)§ | | | 5.63 | | | | 03/01/2013 | | | | 2,000,000 | | | | 2,013,820 | |
Kenton County KY Airport Board Cincinnati Northern Kentucky Series A (Airport Revenue, XLCA Insured) | | | 5.00 | | | | 03/01/2012 | | | | 2,000,000 | | | | 2,012,100 | |
Kenton County KY Airport Board Cincinnati Northern Kentucky Series A (Airport Revenue, XLCA Insured) | | | 5.00 | | | | 03/01/2013 | | | | 2,740,000 | | | | 2,838,092 | |
Kenton County KY Airport Board Cincinnati Northern Kentucky Series A (Airport Revenue, NATL-RE Insured)§ | | | 5.63 | | | | 03/01/2015 | | | | 2,000,000 | | | | 2,014,180 | |
Kentucky EDFA (Resource Recovery Revenue)±§ | | | 0.70 | | | | 04/01/2031 | | | | 12,500,000 | | | | 12,500,875 | |
Kentucky Higher Education Student Loan Corporation Series 1 Class A-1 (Education Revenue, Guaranteed Student Loans Insured)± | | | 0.93 | | | | 05/01/2020 | | | | 6,560,000 | | | | 6,528,118 | |
| | | | | | |
| Portfolio of Investments—December 31, 2011 (Unaudited) | | Wells Fargo Advantage Ultra Short-Term Municipal Income Fund | | | 17 | |
| | | | | | | | | | | | | | | | |
| Security Name | | Interest Rate | | | Maturity Date | | | Principal | | | Value | |
| | | | | | | | | | | | | | | | |
| | | | |
| Kentucky (continued) | | | | | | | | | | | | | | | | |
Louisville/Jefferson County KY Metropolitan Government (Energy Revenue)±§ | | | 1.90 | % | | | 06/01/2033 | | | $ | 15,115,000 | | | $ | 15,158,682 | |
Louisville/Jefferson County KY PCR Louisville Gas & Electric Project Series A (Energy Revenue)±§ | | | 1.90 | | | | 10/01/2033 | | | | 27,250,000 | | | | 27,334,203 | |
Northern Kentucky Water Service District BAN (Water & Sewer Revenue)§ | | | 2.00 | | | | 09/01/2013 | | | | 19,240,000 | | | | 19,304,454 | |
Pikeville KY Hospital Revenue BAN Improvement Pikeville (Health Revenue) | | | 3.00 | | | | 09/01/2013 | | | | 25,000,000 | | | | 25,727,000 | |
Pulaski County KY Waste Disposal (Resource Recovery Revenue)±§ | | | 1.00 | | | | 08/15/2023 | | | | 3,450,000 | | | | 3,451,449 | |
| | | | |
| | | | | | | | | | | | | | | 118,882,973 | |
| | | | | | | | | | | | | | | | |
| | | | |
| Louisiana: 4.02% | | | | | | | | | | | | | | | | |
Ascension Parish Louisiana Industrial Development Board Incorporated Impala Warehousing Series U (IDR, Natixis LOC)±§ | | | 1.85 | | | | 12/01/2041 | | | | 30,000,000 | | | | 30,000,000 | |
East Baton Rouge Parish Louisiana Sewerage Commission Series A (Water & Sewer Revenue)±§ | | | 0.99 | | | | 02/01/2046 | | | | 82,170,000 | | | | 82,071,396 | |
Louisiana Gas & Fuels Tax Second Lien Series A1 (Tax Revenue)±§ | | | 0.85 | | | | 05/01/2043 | | | | 31,450,000 | | | | 31,494,030 | |
Louisiana Offshore Terminal Authority (Airport Revenue)±§ | | | 1.60 | | | | 10/01/2037 | | | | 8,000,000 | | | | 8,041,280 | |
Louisiana PFA Christus Healthcare (Health Revenue, AGM Insured) | | | 5.00 | | | | 07/01/2012 | | | | 3,550,000 | | | | 3,618,870 | |
Louisiana PFA Franciscan Series B (Health Revenue) | | | 5.00 | | | | 07/01/2012 | | | | 2,185,000 | | | | 2,221,271 | |
Louisiana State Gas & Fuels Tax Second Lien Series A (Tax Revenue)±§ | | | 0.85 | | | | 05/01/2043 | | | | 73,625,000 | | | | 73,728,075 | |
Louisiana State Series B (Miscellaneous Revenue)±§ | | | 0.99 | | | | 07/15/2014 | | | | 10,030,000 | | | | 10,034,012 | |
Morehouse Parish LA PCR International Paper Company Project Series A (Resource Recovery Revenue) | | | 5.25 | | | | 11/15/2013 | | | | 6,000,000 | | | | 6,328,740 | |
Orleans Parish LA Parishwide School District (Tax Revenue, FGIC Insured)§(z) | | | 5.51 | | | | 02/01/2015 | | | | 21,600,000 | | | | 18,259,992 | |
St. Tammany Parish LA Development District Rooms To Go (IDR, SunTrust Bank LOC)±§ | | | 0.45 | | | | 07/01/2038 | | | | 22,400,000 | | | | 22,400,000 | |
| | | | |
| | | | | | | | | | | | | | | 288,197,666 | |
| | | | | | | | | | | | | | | | |
| | | | |
| Maine: 0.59% | | | | | | | | | | | | | | | | |
Maine Educational Loan Authority Series A-1 Class A (Education Revenue, Assured Guaranty Insured) | | | 4.30 | | | | 12/01/2012 | | | | 2,340,000 | | | | 2,406,760 | |
Maine State Housing Authority Series E-1 (Housing Revenue)±§ | | | 1.85 | | | | 11/15/2030 | | | | 9,585,000 | | | | 9,585,000 | |
Maine State Housing Authority Series E-1 (Housing Revenue)± | | | 1.85 | | | | 11/15/2032 | | | | 30,000,000 | | | | 30,000,000 | |
| | | | |
| | | | | | | | | | | | | | | 41,991,760 | |
| | | | | | | | | | | | | | | | |
| | | | |
| Maryland: 0.37% | | | | | | | | | | | | | | | | |
Baltimore County MD EDA (IDR, BNP Paribas LOC)±§ | | | 1.00 | | | | 12/01/2017 | | | | 4,600,000 | | | | 4,600,000 | |
Maryland State Economic Development Corporation American Urological Association (Miscellaneous Revenue, SunTrust Bank LOC)±§ | | | 0.45 | | | | 09/01/2032 | | | | 4,565,000 | | | | 4,565,000 | |
Maryland State HEFA Sheppard Pratt Series B (Miscellaneous Revenue, SunTrust Bank LOC)±§ | | | 0.45 | | | | 07/01/2028 | | | | 17,200,000 | | | | 17,200,000 | |
| | | | |
| | | | | | | | | | | | | | | 26,365,000 | |
| | | | | | | | | | | | | | | | |
| | | | |
| Massachusetts: 2.34% | | | | | | | | | | | | | | | | |
Massachusetts State Refinance Series A (Tax Revenue)±§ | | | 0.40 | | | | 02/01/2013 | | | | 19,000,000 | | | | 19,000,000 | |
Massachusetts State Refinance Series A (Tax Revenue)±§ | | | 0.58 | | | | 02/01/2014 | | | | 14,000,000 | | | | 14,000,000 | |
Massachusetts Educational Financing Authority (Education Revenue, AMBAC Insured)§ | | | 5.00 | | | | 01/01/2013 | | | | 1,875,000 | | | | 1,879,144 | |
Massachusetts HEFA Caritas Christian Obligation Series B (Health Revenue)§ | | | 6.50 | | | | 07/01/2012 | | | | 970,000 | | | | 997,490 | |
Massachusetts HEFA Northeastern University Series T-2 (Education Revenue)±§ | | | 4.10 | | | | 10/01/2037 | | | | 5,250,000 | | | | 5,310,218 | |
| | | | |
| 18 | | Wells Fargo Advantage Ultra Short-Term Municipal Income Fund | | Portfolio of Investments—December 31, 2011 (Unaudited) |
| | | | | | | | | | | | | | | | |
| Security Name | | Interest Rate | | | Maturity Date | | | Principal | | | Value | |
| | | | | | | | | | | | | | | | |
| | | | |
| Massachusetts (continued) | | | | | | | | | | | | | | | | |
Massachusetts HEFA Partners Healthcare Series G-2 (Health Revenue, AGM Insured)±§(m) | | | 0.71 | % | | | 07/01/2042 | | | $ | 24,255,000 | | | $ | 24,255,000 | |
Massachusetts HEFA Series G (Health Revenue) | | | 4.00 | | | | 07/01/2013 | | | | 3,800,000 | | | | 3,910,808 | |
Massachusetts HEFA Series SGB-42-A (Education Revenue)±§ | | | 0.85 | | | | 07/15/2037 | | | | 35,780,000 | | | | 35,780,000 | |
Massachusetts State Development Finance Agency Partners Healthcare Series K-3 (Health Revenue)±§ | | | 0.75 | | | | 07/01/2038 | | | | 33,015,000 | | | | 33,015,330 | |
Massachusetts State Development Finance Agency Sabis International Charter Series A (Miscellaneous Revenue) | | | 4.65 | | | | 04/15/2012 | | | | 390,000 | | | | 392,434 | |
Massachusetts State Development Finance Agency Semass Systems Series A (Resource Recovery Revenue, NATL-RE Insured) | | | 5.63 | | | | 01/01/2012 | | | | 2,900,000 | | | | 2,900,290 | |
Massachusetts State Water Resources Authority Series DCL 005 (Water & Sewer Revenue, FSA Insured, Dexia Credit Local LOC)±§ | | | 2.00 | | | | 08/01/2025 | | | | 26,085,000 | | | | 26,085,000 | |
| | | | |
| | | | | | | | | | | | | | | 167,525,714 | |
| | | | | | | | | | | | | | | | |
| | | | |
| Michigan: 1.76% | | | | | | | | | | | | | | | | |
Bishop International Airport Authority Michigan (Airport Revenue) | | | 2.50 | | | | 12/01/2012 | | | | 1,090,000 | | | | 1,089,281 | |
Bishop International Airport Authority Michigan (Airport Revenue) | | | 2.50 | | | | 12/01/2013 | | | | 1,105,000 | | | | 1,099,431 | |
Detroit MI Capital Improvement Limited Tax Series A-1 (Tax Revenue) | | | 5.00 | | | | 04/01/2013 | | | | 700,000 | | | | 675,948 | |
Detroit MI City School District Floater Series DCL 045 (Tax Revenue, FSA Q-SBLF Insured, Dexia Credit Local LOC)±§ | | | 1.98 | | | | 05/01/2030 | | | | 12,675,000 | | | | 12,675,000 | |
Detroit MI City School District Floaters Series DC8032 (Tax Revenue, FSA Q-SBLF Insured, Dexia Credit Local LOC)±§ | | | 1.75 | | | | 05/01/2029 | | | | 11,410,000 | | | | 11,410,000 | |
Detroit MI City School District School Building & Site Improvement Series A (Tax Revenue, FGIC Q-SBLF Insured) | | | 5.00 | | | | 05/01/2013 | | | | 1,935,000 | | | | 2,018,534 | |
Detroit MI Convention Facilities Cobo Hall (Tobacco Revenue, NATL-RE Insured) | | | 5.00 | | | | 09/30/2012 | | | | 1,100,000 | | | | 1,126,994 | |
Detroit MI Refinance Senior Lien Series D (Water & Sewer Revenue, AGM Insured) | | | 4.00 | | | | 07/01/2012 | | | | 1,705,000 | | | | 1,729,296 | |
Detroit MI Refinance Series B (Water & Sewer Revenue, NATL-RE Insured) | | | 5.55 | | | | 07/01/2012 | | | | 2,000,000 | | | | 2,042,080 | |
Detroit MI Senior Lien Series A (Water & Sewer Revenue, AGM Insured) | | | 5.00 | | | | 07/01/2013 | | | | 800,000 | | | | 841,328 | |
Detroit MI Sewer Disposal Senior Lien Series A (Water & Sewer Revenue, AGM Insured) | | | 5.00 | | | | 07/01/2012 | | | | 3,000,000 | | | | 3,054,060 | |
Detroit MI Water Supply System Senior Lien Series A (Water & Sewer Revenue, NATL-RE Insured) | | | 5.75 | | | | 07/01/2012 | | | | 2,010,000 | | | | 2,065,195 | |
Detroit MI Water Supply System Senior Lien Series B (Water & Sewer Revenue, NATL-RE Insured)± | | | 4.00 | | | | 07/01/2012 | | | | 850,000 | | | | 861,594 | |
Kent MI Hospital Finance Authority Spectrum Health Series B2 (Health Revenue)±§ | | | 0.40 | | | | 01/15/2047 | | | | 6,715,000 | | | | 6,715,000 | |
Michigan State Comprehensive Transition (Miscellaneous Revenue, FSA Insured)±§ | | | 2.34 | | | | 05/15/2023 | | | | 1,085,000 | | | | 1,085,000 | |
Michigan State Finance Authority Detroit School District (Miscellaneous Revenue) | | | 5.00 | | | | 06/01/2013 | | | | 10,000,000 | | | | 10,359,100 | |
Michigan State Finance Authority Detroit Schools Series A1 (Miscellaneous Revenue) | | | 6.45 | | | | 02/20/2012 | | | | 10,800,000 | | | | 10,859,508 | |
Michigan State Hospital Finance Authority Oakwood Obligated Group (Health Revenue) | | | 5.50 | | | | 11/01/2012 | | | | 3,645,000 | | | | 3,779,282 | |
Michigan State Hospital Finance Authority Oakwood Obligated Group (Health Revenue) | | | 5.50 | | | | 11/01/2013 | | | | 6,040,000 | | | | 6,484,121 | |
Michigan State Strategic Fund Limited Obligation Detroit Edition (Utilities Revenue)±§ | | | 3.05 | | | | 08/01/2024 | | | | 8,130,000 | | | | 8,275,934 | |
Michigan State Strategic Fund Limited Obligation Waste Management (Solid Waste Revenue)±§ | | | 2.80 | | | | 12/01/2013 | | | | 1,000,000 | | | | 1,017,830 | |
Waterford MI School District State Aid Anticipation Notes (Tax Revenue) | | | 1.00 | | | | 09/21/2012 | | | | 12,500,000 | | | | 12,513,125 | |
| | | | | | |
| Portfolio of Investments—December 31, 2011 (Unaudited) | | Wells Fargo Advantage Ultra Short-Term Municipal Income Fund | | | 19 | |
| | | | | | | | | | | | | | | | |
| Security Name | | Interest Rate | | | Maturity Date | | | Principal | | | Value | |
| | | | | | | | | | | | | | | | |
| | | | |
| Michigan (continued) | | | | | | | | | | | | | | | | |
Wayne County MI Airport Authority Revenue AMT Refinance Detroit Metropolitan Airport Series A (Airport Revenue) | | | 3.00 | % | | | 12/01/2012 | | | $ | 14,995,000 | | | $ | 15,231,321 | |
Wayne County MI Airport Authority Revenue Refinance Detroit Metropolitan airport Series C (Airport Revenue) | | | 5.00 | | | | 12/01/2013 | | | | 3,830,000 | | | | 4,064,702 | |
Wayne County MI Airport Authority Revenue Series B (Airport Revenue) | | | 5.00 | | | | 12/01/2013 | | | | 3,710,000 | | | | 3,937,349 | |
Western Townships MI Utilities Authority (Tax Revenue) | | | 3.00 | | | | 01/01/2012 | | | | 1,000,000 | | | | 1,000,070 | |
| | | | |
| | | | | | | | | | | | | | | 126,011,083 | |
| | | | | | | | | | | | | | | | |
| | | | |
| Minnesota: 0.22% | | | | | | | | | | | | | | | | |
Minneapolis & St. Paul MN Housing & RDA HealthSpan Series B (Health Revenue, AMBAC Insured)±§(m)(a)(n) | | | 0.18 | | | | 11/15/2017 | | | | 10,800,000 | | | | 9,256,218 | |
Minnesota HEFA (Education Revenue) | | | 3.00 | | | | 10/01/2012 | | | | 500,000 | | | | 505,230 | |
Minnesota HEFA (Education Revenue) | | | 3.00 | | | | 10/01/2013 | | | | 500,000 | | | | 509,515 | |
Roseville MN Northwestern College Project (Education Revenue, BMO Harris Bank LOC)±§ | | | 0.12 | | | | 11/01/2022 | | | | 1,945,000 | | | | 1,945,000 | |
St. Paul MN Housing & RDA Allina Health System Series A-1 (Health Revenue) | | | 5.00 | | | | 11/15/2012 | | | | 1,400,000 | | | | 1,451,632 | |
St. Paul MN Housing & RDA Allina Health System Series A-1 (Health Revenue) | | | 5.00 | | | | 11/15/2013 | | | | 1,500,000 | | | | 1,605,495 | |
St. Paul MN Port Authority District Heating Series 7-Q (IDR, Deutsche Bank AG LOC)±§ | | | 0.18 | | | | 12/01/2028 | | | | 500,000 | | | | 500,000 | |
| | | | |
| | | | | | | | | | | | | | | 15,773,090 | |
| | | | | | | | | | | | | | | | |
| | | | |
| Mississippi: 0.13% | | | | | | | | | | | | | | | | |
Mississippi Business Finance Corporation (Utilities Revenue)±§ | | | 2.25 | | | | 12/01/2040 | | | | 9,070,000 | | | | 9,143,467 | |
| | | | | | | | | | | | | | | | |
| | | | |
| Missouri: 0.30% | | | | | | | | | | | | | | | | |
Kansas City MO CAB Series E (Tax Revenue)(z) | | | 1.20 | | | | 02/01/2012 | | | | 1,000,000 | | | | 998,940 | |
Kansas City MO School District (Lease Revenue, NATL-RE FGIC Insured) | | | 5.00 | | | | 02/01/2012 | | | | 6,000,000 | | | | 6,017,520 | |
Missouri Illinois Bi-State Development Agency Metropolitan Refunding (Tax Revenue) | | | 4.00 | | | | 10/15/2013 | | | | 14,035,000 | | | | 14,629,102 | |
| | | | |
| | | | | | | | | | | | | | | 21,645,562 | |
| | | | | | | | | | | | | | | | |
| | | | |
| Nebraska: 0.48% | | | | | | | | | | | | | | | | |
Central Plains NE Energy Project # 1 Series A (Utilities Revenue)§ | | | 5.00 | | | | 12/01/2012 | | | | 7,140,000 | | | | 7,370,051 | |
Central Plains NE Energy Project # 1 Series A (Utilities Revenue)§ | | | 5.00 | | | | 12/01/2013 | | | | 19,280,000 | | | | 20,063,925 | |
Central Plains Nebraska Energy Project # 1 Series A (Utilities Revenue)§ | | | 5.00 | | | | 12/01/2014 | | | | 6,600,000 | | | | 6,900,762 | |
| | | | |
| | | | | | | | | | | | | | | 34,334,738 | |
| | | | | | | | | | | | | | | | |
| | | | |
| Nevada: 0.48% | | | | | | | | | | | | | | | | |
Clark County NV Airport ROC RR II R-11823 (Airport Revenue)±§144A | | | 0.30 | | | | 01/01/2018 | | | | 8,250,000 | | | | 8,250,000 | |
Clark County NV Airport Sub Lien Series A-1 (Airport Revenue) | | | 5.00 | | | | 07/01/2012 | | | | 11,000,000 | | | | 11,235,290 | |
Clark County NV School District (Tax Revenue, AGM Insured) | | | 5.25 | | | | 06/15/2013 | | | | 6,410,000 | | | | 6,843,572 | |
Clark County NV Sub Lien Series A-1 (Airport Revenue, AMBAC Insured) | | | 5.00 | | | | 07/01/2012 | | | | 1,000,000 | | | | 1,020,390 | |
Clark County NV Sub Lien Series A-1 (Airport Revenue, NATL-RE FGIC Insured) | | | 5.25 | | | | 07/01/2012 | | | | 1,000,000 | | | | 1,021,640 | |
Henderson NV Catholic Healthcare West-Series B (Health Revenue) | | | 4.00 | | | | 07/01/2012 | | | | 3,500,000 | | | | 3,547,390 | |
Sparks NV Redevelopment Agency Tax Increment Area # 1 (Tax Revenue) | | | 4.00 | | | | 01/15/2012 | | | | 750,000 | | | | 750,240 | |
Sparks NV Redevelopment Agency Tax Increment Area # 1 (Tax Revenue) | | | 4.00 | | | | 01/15/2013 | | | | 1,405,000 | | | | 1,416,057 | |
| | | | |
| | | | | | | | | | | | | | | 34,084,579 | |
| | | | | | | | | | | | | | | | |
| | | | |
| New Hampshire: 0.41% | | | | | | | | | | | | | | | | |
New Hampshire State Business Finance Authority Refunding The United Illuminating Project Series A (Miscellaneous Revenue)±§ | | | 6.88 | | | | 12/01/2029 | | | | 6,000,000 | | | | 6,029,100 | |
| | | | |
| 20 | | Wells Fargo Advantage Ultra Short-Term Municipal Income Fund | | Portfolio of Investments—December 31, 2011 (Unaudited) |
| | | | | | | | | | | | | | | | |
| Security Name | | Interest Rate | | | Maturity Date | | | Principal | | | Value | |
| | | | | | | | | | | | | | | | |
| | | | |
| New Hampshire (continued) | | | | | | | | | | | | | | | | |
New Hampshire State Business Finance Authority The United Illuminating Company Project (Lease Revenue)±§ | | | 7.13 | % | | | 07/01/2027 | | | $ | 20,215,000 | | | $ | 20,301,116 | |
New Hampshire State Turnpike System (Transportation Revenue) | | | 4.00 | | | | 10/01/2013 | | | | 3,085,000 | | | | 3,257,945 | |
| | | | |
| | | | | | | | | | | | | | | 29,588,161 | |
| | | | | | | | | | | | | | | | |
| | | | |
| New Jersey: 6.31% | | | | | | | | | | | | | | | | |
Aberdeen Township NJ BAN (Tax Revenue) | | | 1.50 | | | | 03/14/2012 | | | | 16,037,561 | | | | 16,059,051 | |
Camden County NJ Improvement Authority Series A (Lease Revenue, Assured Guaranty Insured) | | | 4.00 | | | | 12/01/2012 | | | | 1,825,000 | | | | 1,883,619 | |
Casino Reinvestment Development Authority New Jersey Series A (Miscellaneous Revenue, NATL-RE Insured) | | | 5.00 | | | | 06/01/2013 | | | | 5,330,000 | | | | 5,525,504 | |
Gloucester County NJ Improvement Authority Waste Management Incorporated Project Series B (Resource Recovery Revenue)±§ | | | 3.38 | | | | 12/01/2029 | | | | 1,210,000 | | | | 1,230,981 | |
Long Branch NJ TAN (Miscellaneous Revenue) | | | 2.00 | | | | 02/29/2012 | | | | 4,000,000 | | | | 4,006,560 | |
Merrill Lynch PFOTER (Miscellaneous Revenue)±§144A | | | 0.50 | | | | 02/01/2018 | | | | 45,990,000 | | | | 45,990,000 | |
Monmouth County NJ Improvement Authority (Miscellaneous Revenue, AMBAC Insured) | | | 5.00 | | | | 12/01/2012 | | | | 1,000,000 | | | | 1,029,680 | |
New Jersey EDA (Miscellaneous Revenue, Dexia Credit Local LOC, AMBAC Insured)±§ | | | 1.98 | | | | 12/15/2020 | | | | 10,655,000 | | | | 10,655,000 | |
New Jersey EDA El Dorado Series A (IDR)±§ | | | 0.70 | | | | 12/01/2021 | | | | 7,000,000 | | | | 6,999,790 | |
New Jersey EDA Series E (Miscellaneous Revenue, State Appropriations Insured)±§ | | | 1.80 | | | | 02/01/2016 | | | | 72,540,000 | | | | 73,176,901 | |
New Jersey HCFR (Health Revenue) | | | 4.00 | | | | 01/01/2013 | | | | 910,000 | | | | 928,801 | |
New Jersey Health Care Facilities Financing Authority (Health Revenue) | | | 4.75 | | | | 07/01/2012 | | | | 1,000,000 | | | | 1,012,780 | |
New Jersey HFFA Catholic Healthcare East (Health Revenue) | | | 5.00 | | | | 11/15/2012 | | | | 1,490,000 | | | | 1,536,726 | |
New Jersey Sports & Exposition Authority Series A (Miscellaneous Revenue) | | | 5.00 | | | | 03/01/2013 | | | | 2,225,000 | | | | 2,328,552 | |
New Jersey State Health Care Facilities Authority Barnabas Health Series A (Health Revenue) | | | 5.00 | | | | 07/01/2014 | | | | 14,820,000 | | | | 15,580,711 | |
New Jersey State Health Care Facilities Finance Authority Barnabas Health Series A (Health Revenue) | | | 5.00 | | | | 07/01/2013 | | | | 1,035,000 | | | | 1,072,778 | |
New Jersey State Higher Education Assistance Authority Student Loan Series FFELP Class A-1 (Education Revenue)± | | | 0.83 | | | | 06/01/2020 | | | | 20,225,000 | | | | 20,074,931 | |
New Jersey State Transportation Trust Fund Authority ROC RR II R-11939 (Transportation Revenue)±§144A | | | 0.45 | | | | 12/15/2020 | | | | 6,700,000 | | | | 6,700,000 | |
New Jersey Transit Corporation Sub-Federal Transit Administration Grants Series B (Lease Revenue)§ | | | 5.75 | | | | 09/15/2013 | | | | 10,000,000 | | | | 10,257,900 | |
New Jersey TTFA (Transportation Revenue, NATL-RE Insured) | | | 5.25 | | | | 12/15/2012 | | | | 2,300,000 | | | | 2,402,718 | |
New Jersey TTFA (Transportation Revenue) | | | 5.63 | | | | 06/15/2012 | | | | 5,665,000 | | | | 5,798,637 | |
New Jersey Turnpike Authority Series C-2 (Transportation Revenue, AGM Insured)±§ | | | 1.00 | | | | 01/01/2024 | | | | 106,195,000 | | | | 106,195,000 | |
New Jersey Turnpike Authority Series C-3 (Transportation Revenue, AGM Insured)±§ | | | 1.00 | | | | 01/01/2024 | | | | 18,150,000 | | | | 18,150,000 | |
New Jersey Turnpike Authority Series D (Miscellaneous Revenue, Societe Generale LOC, NATL-RE FGIC Insured)±§ | | | 1.85 | | | | 01/01/2018 | | | | 70,000,000 | | | | 70,000,000 | |
Paterson City NJ General Improvement (Tax Revenue, AGM State Aid Withholding Insured) | | | 4.25 | | | | 06/15/2012 | | | | 1,600,000 | | | | 1,619,168 | |
Township of Belleville NJ BAN (Tax Revenue) | | | 2.50 | | | | 01/06/2012 | | | | 2,800,000 | | | | 2,800,504 | |
Township of Cranford NJ TAN (Tax Revenue) | | | 1.50 | | | | 02/15/2012 | | | | 4,850,000 | | | | 4,855,093 | |
Township of Jackson NJ TAN (Tax Revenue) | | | 1.50 | | | | 02/16/2012 | | | | 11,100,000 | | | | 11,111,877 | |
Township of Wall NJ TAN (Tax Revenue) | | | 3.75 | | | | 04/13/2012 | | | | 2,700,000 | | | | 2,712,474 | |
| | | | |
| | | | | | | | | | | | | | | 451,695,736 | |
| | | | | | | | | | | | | | | | |
| | | | | | |
| Portfolio of Investments—December 31, 2011 (Unaudited) | | Wells Fargo Advantage Ultra Short-Term Municipal Income Fund | | | 21 | |
| | | | | | | | | | | | | | | | |
| Security Name | | Interest Rate | | | Maturity Date | | | Principal | | | Value | |
| | | | | | | | | | | | | | | | |
| | | | |
New Mexico: 0.11%
| | | | | | | | | | | | | | | | |
New Mexico Mortgage Finance Authority Villa Alegre Series A (Housing Revenue, FHA Insured)§ | | | 1.75 | % | | | 09/01/2012 | | | $ | 790,000 | | | $ | 795,238 | |
Pueblo of Sandia NM Series A (Miscellaneous Revenue)±§ | | | 1.60 | | | | 03/01/2015 | | | | 7,250,000 | | | | 7,250,000 | |
| | | | |
| | | | | | | | | | | | | | | 8,045,238 | |
| | | | | | | | | | | | | | | | |
| | | | |
| New York: 17.12% | | | | | | | | | | | | | | | | |
Board of Cooperative Educational Services New York Sole Supervisory District (Miscellaneous Revenue, GO of BRD Insured) | | | 1.75 | | | | 07/27/2012 | | | | 16,000,000 | | | | 16,048,960 | |
Branch Banking & Trust Municipal Trust Class A Certificates (Miscellaneous Revenue, Rabobank Nederland LOC)±§144A | | | 0.53 | | | | 08/27/2012 | | | | 44,530,000 | | | | 44,521,985 | |
Greater Southern Tier New York Board of Cooperative Educational Services District (Miscellaneous Revenue, GO of Board Insured) | | | 2.25 | | | | 06/29/2012 | | | | 12,000,000 | | | | 12,067,200 | |
Guilderland NY IDA Wildwood Project Series A (Miscellaneous Revenue, KeyBank NA LOC)±§ | | | 0.29 | | | | 07/01/2032 | | | | 2,605,000 | | | | 2,605,000 | |
JPMorgan Chase PUTTER/DRIVER Trust Series 3925 (Tax Revenue)±§144A | | | 0.24 | | | | 04/30/2012 | | | | 24,595,000 | | | | 24,595,000 | |
Long Island NY Power Authority Series I (Utilities Revenue, AGM Insured)±§ | | | 1.25 | | | | 12/01/2029 | | | | 25,000,000 | | | | 25,000,000 | |
Long Island NY Power Authority Series J (Utilities Revenue, AGM Insured)±§ | | | 1.30 | | | | 12/01/2029 | | | | 37,700,000 | | | | 37,700,000 | |
Long Island NY Power Authority Series L (Utilities Revenue, FSA Insured)±§ | | | 1.15 | | | | 12/01/2029 | | | | 24,430,000 | | | | 24,430,000 | |
Long Island NY Power Authority Series N (Utilities Revenue, FSA Insured)±§ | | | 0.80 | | | | 12/01/2029 | | | | 21,000,000 | | | | 21,000,000 | |
Long Island NY Power Authority Series O (Utilities Revenue, AGM Insured)±§ | | | 1.25 | | | | 12/01/2029 | | | | 5,000,000 | | | | 5,000,000 | |
Metropolitan Transportation Authority New York Series B (Tax Revenue, AGM Insured)±§ | | | 1.25 | | | | 11/01/2022 | | | | 98,825,000 | | | | 98,825,000 | |
Metropolitan Transportation Authority New York Series D-1 (Transportation Revenue, AGM Insured)±§ | | | 0.30 | | | | 11/01/2029 | | | | 90,560,000 | | | | 90,560,000 | |
Metropolitan Transportation Authority New York Sub Series B-3B (Miscellaneous Revenue)±§ | | | 0.67 | | | | 11/01/2030 | | | | 13,720,000 | | | | 13,719,726 | |
Metropolitan Transportation Authority New York Sub Series E-2 (Transportation Revenue, BNP Paribas LOC)±§ | | | 0.50 | | | | 11/01/2035 | | | | 51,100,000 | | | | 51,100,000 | |
Metropolitan Transportation Authority New York Sub Series E-2 (Transportation Revenue, BNP Paribas LOC)±§ | | | 0.56 | | | | 11/01/2035 | | | | 27,900,000 | | | | 27,900,000 | |
Nassau County NY Interim Finance Authority (Tax Revenue)±§ | | | 1.25 | | | | 11/15/2021 | | | | 41,350,000 | | | | 41,350,000 | |
Nassau County NY TAN Series A (Tax Revenue) | | | 2.50 | | | | 09/30/2012 | | | | 25,000,000 | | | | 25,253,500 | |
Nassau County NY TAN Series B (Tax Revenue) | | | 2.50 | | | | 10/31/2012 | | | | 27,000,000 | | | | 27,328,050 | |
New York City NY Adjusted Fiscal 2008 Subordinated Series J-11 (Tax Revenue)±§ | | | 1.00 | | | | 08/01/2027 | | | | 12,700,000 | | | | 12,700,000 | |
New York City NY Adjusted Series H Subordinated Series H-6 (Tax Revenue, NATL-RE Insured)±§ | | | 0.85 | | | | 08/01/2013 | | | | 6,400,000 | | | | 6,400,000 | |
New York City NY Fiscal 2008 Subordinated Series A-4 (Tax Revenue, AGM Insured)±§(m) | | | 0.70 | | | | 08/01/2026 | | | | 28,425,000 | | | | 28,425,000 | |
New York City NY Fiscal 2008 Subordinated Series C-4 (Tax Revenue, Assured Guaranty Insured)±§(m) | | | 0.74 | | | | 10/01/2027 | | | | 55,800,000 | | | | 55,800,000 | |
New York City NY Series J Subordinated Series J-2 (Tax Revenue, AGM Insured)±§(m) | | | 0.70 | | | | 06/01/2036 | | | | 13,550,000 | | | | 13,550,000 | |
New York City NY Series J Subordinated Series J-3 (Tax Revenue, AGM Insured)±§(m) | | | 0.30 | | | | 06/01/2036 | | | | 26,175,000 | | | | 26,175,000 | |
New York City NY Housing Development Corporation Multi-Family-The Crest Series A (Housing Revenue, Landesbank Hessen LOC)±§ | | | 0.38 | | | | 12/01/2036 | | | | 5,100,000 | | | | 5,100,000 | |
New York City NY Municipal Water Finance Authority Series C (Water & Sewer Revenue)±§ | | | 0.76 | | | | 06/15/2033 | | | | 2,000,000 | | | | 2,000,000 | |
New York City NY Various Series-B2 Subordinated Series B8 (Tax Revenue, Bayerische Landesbank LOC)±§ | | | 0.30 | | | | 08/15/2024 | | | | 5,100,000 | | | | 5,100,000 | |
New York City NY Various Subordinated Series H-7 (Tax Revenue, KBC Bank NV LOC)±§ | | | 0.76 | | | | 03/01/2034 | | | | 13,955,000 | | | | 13,955,000 | |
| | | | |
| 22 | | Wells Fargo Advantage Ultra Short-Term Municipal Income Fund | | Portfolio of Investments—December 31, 2011 (Unaudited) |
| | | | | | | | | | | | | | | | |
| Security Name | | Interest Rate | | | Maturity Date | | | Principal | | | Value | |
| | | | | | | | | | | | | | | | |
| | | | |
| New York (continued) | | | | | | | | | | | | | | | | |
New York Environmental Facilities Corporation Waste Management Project Series A (IDR)± | | | 4.55 | % | | | 05/01/2012 | | | $ | 1,900,000 | | | $ | 1,910,583 | |
New York State Dormitory Authority (Education Revenue, AMBAC Insured)±§ | | | 5.25 | | | | 11/15/2026 | | | | 925,000 | | | | 941,484 | |
New York State Dormitory Authority (Education Revenue, NATL-RE FGIC Insured)±§ | | | 5.25 | | | | 11/15/2029 | | | | 10,000,000 | | | | 10,178,200 | |
New York State Dormitory Authority (Education Revenue, XLCA Insured)±§ | | | 5.25 | | | | 07/01/2032 | | | | 1,700,000 | | | | 1,813,577 | |
New York State Dormitory Authority Series B (Education Revenue) | | | 5.00 | | | | 07/01/2012 | | | | 1,000,000 | | | | 1,021,720 | |
New York State Dormitory Authority Series B (Education Revenue) | | | 5.00 | | | | 07/01/2013 | | | | 1,750,000 | | | | 1,850,643 | |
New York State Dormitory Authority Series B (Education Revenue) | | | 5.00 | | | | 07/01/2015 | | | | 1,000,000 | | | | 1,111,580 | |
New York State Dormitory Authority Series B (Education Revenue)±§ | | | 5.25 | | | | 11/15/2023 | | | | 5,260,000 | | | | 5,353,733 | |
New York State Energy R&D Authority Electric & Gas Corporation Series B (Utilities Revenue)±§ | | | 3.00 | | | | 02/01/2029 | | | | 3,000,000 | | | | 3,055,770 | |
New York State Energy R&D Authority Niagara Series A (Resource Recovery Revenue, AMBAC Insured)±§(m)(a)(n) | | | 0.69 | | | | 10/01/2013 | | | | 21,010,000 | | | | 20,638,512 | |
New York State Energy R&D Authority PCR Keyspan Generation Series A (IDR, AMBAC Insured)±§(m) | | | 2.24 | | | | 10/01/2028 | | | | 1,325,000 | | | | 1,325,000 | |
New York State Good Samaritan Hospital Medical Center Series A (Health Revenue, NATL-RE Insured)§ | | | 5.70 | | | | 07/01/2013 | | | | 3,025,000 | | | | 3,033,258 | |
New York State Local Government Assistance Corporation Refinance Sub Lien-Series A-10V (Tax Revenue, AGM GO Corporation Insured)±§(m)(a)(n) | | | 0.05 | | | | 04/01/2017 | | | | 19,500,000 | | | | 18,146,287 | |
New York Urban Development Corporation (Housing Revenue)§ | | | 5.88 | | | | 02/01/2013 | | | | 35,830,000 | | | | 35,937,132 | |
Newburgh NY BAN (Tax Revenue) | | | 4.75 | | | | 06/29/2012 | | | | 5,000,000 | | | | 5,001,800 | |
Newburgh NY BAN Series B (Tax Revenue) | | | 4.75 | | | | 08/29/2012 | | | | 8,900,000 | | | | 8,909,968 | |
Niagara County NY IDA Solid Waste Disposal Series A Refunding (Resource Recovery Revenue)±§ | | | 5.45 | | | | 11/15/2026 | | | | 3,450,000 | | | | 3,488,606 | |
Niagara County NY IDA Solid Waste Disposal Series B (Resource Recovery Revenue)±§ | | | 5.55 | | | | 11/15/2024 | | | | 2,020,000 | | | | 2,040,887 | |
Rockland County NY Revenue Anticipation Note (Tax Revenue) | | | 3.00 | | | | 03/08/2012 | | | | 11,750,000 | | | | 11,797,235 | |
Rockland County NY BAN (Tax Revenue) | | | 1.75 | | | | 08/31/2012 | | | | 9,816,000 | | | | 9,820,319 | |
Rockland County NY GO (Tax Revenue) | | | 1.75 | | | | 06/22/2012 | | | | 7,720,000 | | | | 7,723,320 | |
Rockland County NY TAN (Tax Revenue) | | | 3.00 | | | | 03/08/2012 | | | | 42,150,000 | | | | 42,359,486 | |
Salmon River NY Central School District (Tax Revenue, State Aid Withholding Insured) | | | 2.00 | | | | 06/22/2012 | | | | 6,150,000 | | | | 6,178,659 | |
Schenectady NY BAN (Tax Revenue) | | | 1.75 | | | | 05/18/2012 | | | | 33,770,594 | | | | 33,865,152 | |
Schenectady NY Refinance Public Improvement (Tax Revenue, Assured Guaranty Insured) | | | 3.00 | | | | 04/01/2012 | | | | 1,085,000 | | | | 1,090,805 | |
Suffolk County NY TAN (Tax Revenue) | | | 1.50 | | | | 09/13/2012 | | | | 11,750,000 | | | | 11,796,765 | |
Suffolk County NY TAN (Tax Revenue) | | | 2.00 | | | | 09/13/2012 | | | | 50,000,000 | | | | 50,214,500 | |
Suffolk County NY TAN Series I (Tax Revenue) | | | 2.00 | | | | 07/12/2012 | | | | 113,000,000 | | | | 113,470,080 | |
Suffolk County NY Water Authority BAN Series B (Water & Sewer Revenue)±§ | | | 0.50 | | | | 04/01/2014 | | | | 25,850,000 | | | | 25,824,150 | |
Tompkins Seneca Tioga NY Board of Cooperative Educational Services (Miscellaneous Revenue, GO of BRD Insured) | | | 2.00 | | | | 06/29/2012 | | | | 16,300,000 | | | | 16,347,107 | |
Utica NY IDAG Utica College Project Series B (Education Revenue, Citizens Bank LOC)±§ | | | 0.16 | | | | 10/01/2034 | | | | 7,715,000 | | | | 7,715,000 | |
Westchester County NY Health Senior Lien Series B (Health Revenue) | | | 5.00 | | | | 11/01/2012 | | | | 1,000,000 | | | | 1,030,530 | |
Westchester County NY Health Senior Lien Series B (Health Revenue) | | | 5.00 | | | | 11/01/2013 | | | | 2,500,000 | | | | 2,658,450 | |
| | | | |
| | | | | | | | | | | | | | | 1,225,859,719 | |
| | | | | | | | | | | | | | | | |
| | | | |
| North Carolina: 0.09% | | | | | | | | | | | | | | | | |
North Carolina Eastern Municipal Power Agency Series C (Utilities Revenue, NATL-RE-IBC Insured)§ | | | 7.00 | | | | 01/01/2013 | | | | 1,440,000 | | | | 1,457,496 | |
| | | | | | |
| Portfolio of Investments—December 31, 2011 (Unaudited) | | Wells Fargo Advantage Ultra Short-Term Municipal Income Fund | | | 23 | |
| | | | | | | | | | | | | | | | |
| Security Name | | Interest Rate | | | Maturity Date | | | Principal | | | Value | |
| | | | | | | | | | | | | | | | |
| | | | |
| North Carolina (continued) | | | | | | | | | | | | | | | | |
North Carolina Medical Care Commission Catholic Health East (Health Revenue) | | | 4.00 | % | | | 11/15/2012 | | | $ | 1,085,000 | | | $ | 1,114,610 | |
North Carolina Medical Care Commission First Health Carolina Series C (Health Revenue) | | | 3.00 | | | | 10/01/2012 | | | | 3,205,000 | | | | 3,249,902 | |
North Carolina Medical Care Commission Moses Cone Health System (Health Revenue) | | | 5.00 | | | | 10/01/2015 | | | | 500,000 | | | | 558,470 | |
| | | | |
| | | | | | | | | | | | | | | 6,380,478 | |
| | | | | | | | | | | | | | | | |
| | | | |
| North Dakota: 0.09% | | | | | | | | | | | | | | | | |
Fargo City ND Health System Revenue Sanford (Health Revenue) | | | 4.00 | | | | 11/01/2014 | | | | 4,485,000 | | | | 4,761,141 | |
Mercer County ND PCR Antelope Valley Station (Utilities Revenue, AMBAC Insured)§ | | | 7.20 | | | | 06/30/2013 | | | | 1,555,000 | | | | 1,612,613 | |
| | | | |
| | | | | | | | | | | | | | | 6,373,754 | |
| | | | | | | | | | | | | | | | |
| | | | |
| Ohio: 1.94% | | | | | | | | | | | | | | | | |
Akron OH BAN (Tax Revenue) | | | 2.00 | | | | 03/15/2012 | | | | 11,000,000 | | | | 11,020,350 | |
Akron OH Refinance and Improvement Mortgage (Water & Sewer Revenue, NATL-RE Insured) | | | 5.00 | | | | 03/01/2012 | | | | 1,000,000 | | | | 1,006,960 | |
Cleveland OH Municipal School District Refinance & School Improvement (Tax Revenue, SD Credit Program Insured) | | | 3.00 | | | | 12/01/2013 | | | | 1,535,000 | | | | 1,586,023 | |
Cleveland OH Municipal School District Refinance & School Improvement (Tax Revenue, SD Credit Program Insured) | | | 4.00 | | | | 12/01/2014 | | | | 1,580,000 | | | | 1,688,325 | |
Cleveland OH Sub Lien Notes (Miscellaneous Revenue) | | | 1.00 | | | | 07/26/2012 | | | | 14,500,000 | | | | 14,548,575 | |
Cuyahoga County OH Doan Classroom Apartments Project (Miscellaneous Revenue) | | | 1.05 | | | | 10/15/2012 | | | | 5,700,000 | | | | 5,718,525 | |
Cuyahoga County OH Hawks Landing Apartments Project (Housing Revenue) | | | 0.85 | | | | 04/30/2013 | | | | 5,490,000 | | | | 5,491,208 | |
Knox County OH Hospital Facilities Revenue (Health Revenue, RADIAN Insured)§ | | | 5.00 | | | | 06/01/2012 | | | | 1,615,000 | | | | 1,631,941 | |
Lake County OH Port Authority Mary Rose Estate Apartments Project (Miscellaneous Revenue) | | | 0.80 | | | | 07/15/2013 | | | | 3,500,000 | | | | 3,498,985 | |
Lorain OH BAN (Tax Revenue) | | | 3.88 | | | | 09/20/2012 | | | | 1,115,000 | | | | 1,122,192 | |
Oakwood Village OH BAN (Tax Revenue) | | | 1.50 | | | | 10/04/2012 | | | | 5,345,000 | | | | 5,367,449 | |
Ohio State Air Quality Development Authority PCR Series A (IDR)±§ | | | 2.25 | | | | 12/01/2023 | | | | 55,500,000 | | | | 55,690,365 | |
Ohio State Air Quality Development Authority Modal-Timken Project (IDR, Fifth Third Bank LOC)±§ | | | 0.30 | | | | 11/01/2025 | | | | 460,000 | | | | 460,000 | |
Ohio State Water Development Authority PCR First Energy Series A (Energy Revenue)±§ | | | 4.75 | | | | 08/01/2029 | | | | 5,900,000 | | | | 6,000,536 | |
Ohio State Water Development Authority PCR First Energy Series B (Energy Revenue)±§ | | | 3.00 | | | | 10/01/2033 | | | | 5,500,000 | | | | 5,517,490 | |
Ohio Water Development Authority Waste Management Project (Resource Recovery Revenue)±§ | | | 2.63 | | | | 07/01/2021 | | | | 310,000 | | | | 313,500 | |
Scioto County OH Refinance Norfolk Southern Corporation Project (IDR)±§ | | | 5.30 | | | | 08/15/2013 | | | | 3,000,000 | | | | 3,008,070 | |
Steubenville City OH Refinance Trinity Health System (Health Revenue) | | | 2.00 | | | | 10/01/2012 | | | | 1,000,000 | | | | 998,530 | |
Warrensville Height OH City School District School Improvement (Tax Revenue, NATL-RE FGIC Insured) | | | 7.00 | | | | 12/01/2014 | | | | 1,150,000 | | | | 1,289,173 | |
Warrensville Heights OH COP (Miscellaneous Revenue) | | | 4.00 | | | | 02/28/2012 | | | | 11,200,000 | | | | 11,228,224 | |
Waterville OH BAN (Miscellaneous Revenue) | | | 2.50 | | | | 08/02/2012 | | | | 2,000,000 | | | | 2,008,940 | |
| | | | |
| | | | | | | | | | | | | | | 139,195,361 | |
| | | | | | | | | | | | | | | | |
| | | | |
| Oklahoma: 0.20% | | | | | | | | | | | | | | | | |
Cleveland County OK Public Facilities Authority Educational Facilities Norman Public Schools Project (Lease Revenue) | | | 3.50 | | | | 06/01/2012 | | | | 2,000,000 | | | | 2,024,920 | |
| | | | |
| 24 | | Wells Fargo Advantage Ultra Short-Term Municipal Income Fund | | Portfolio of Investments—December 31, 2011 (Unaudited) |
| | | | | | | | | | | | | | | | |
| Security Name | | Interest Rate | | | Maturity Date | | | Principal | | | Value | |
| | | | | | | | | | | | | | | | |
| | | | |
| Oklahoma (continued) | | | | | | | | | | | | | | | | |
Oklahoma School Districts & County Revenue Anticipation Program (Miscellaneous Revenue) | | | 0.75 | % | | | 06/29/2012 | | | $ | 10,495,000 | | | $ | 10,497,204 | |
Oklahoma State Municipal Power Authority (Utilities Revenue, FSA Insured)±§ | | | 3.85 | | | | 01/01/2027 | | | | 1,545,000 | | | | 1,545,139 | |
| | | | |
| | | | | | | | | | | | | | | 14,067,263 | |
| | | | | | | | | | | | | | | | |
| | | | |
| Pennsylvania: 5.21% | | | | | | | | | | | | | | | | |
Allegheny County PA Airport Authority Series A (Airport Revenue, AGM Insured) | | | 5.00 | | | | 01/01/2015 | | | | 9,620,000 | | | | 10,199,797 | |
Allegheny County PA Hospital Development Authority Health Care-Dialysis Clinic (Health Revenue, SunTrust Bank LOC)±§ | | | 0.45 | | | | 09/01/2027 | | | | 6,100,000 | | | | 6,100,000 | |
Allegheny County PA Hospital Development Authority Health System Series A (Health Revenue) | | | 5.00 | | | | 11/15/2012 | | | | 1,340,000 | | | | 1,328,047 | |
Allegheny County PA Hospital Development Authority University of Pittsburgh Medical Centre Series A (Health Revenue) | | | 4.00 | | | | 05/15/2012 | | | | 6,275,000 | | | | 6,356,889 | |
Allegheny County PA Hospital Development Authority University of Pittsburgh Medical Centre Series A (Health Revenue) | | | 5.00 | | | | 05/15/2013 | | | | 1,735,000 | | | | 1,834,433 | |
Allegheny County PA Hospital Development Authority University of Pittsburgh Medical Centre Series F (Health Revenue)±§ | | | 1.15 | | | | 05/15/2038 | | | | 21,000,000 | | | | 21,002,940 | |
Allegheny County PA IDA Animal Friends Incorporated Project (IDR, PNC Bank NA LOC)±§ | | | 0.47 | | | | 07/01/2025 | | | | 1,935,000 | | | | 1,936,664 | |
Allegheny County PA IDA Western Pennsylvania School For Blind (Education Revenue)±§ | | | 0.50 | | | | 07/01/2031 | | | | 4,500,000 | | | | 4,503,150 | |
Beaver County PA IDA PCR First Energy Series B (IDR)±§ | | | 3.00 | | | | 10/01/2047 | | | | 3,650,000 | | | | 3,664,089 | |
Blair County PA Hospital Authority Revenue Altoona Regional Health System (Health Revenue) | | | 4.00 | | | | 11/15/2012 | | | | 2,865,000 | | | | 2,927,744 | |
Blair County PA Hospital Authority Revenue Altoona Regional Health System (Health Revenue) | | | 4.00 | | | | 11/15/2013 | | | | 1,315,000 | | | | 1,364,944 | |
Butler County PA General Authority MSTR Butler Area School District Project Series 2007 Class A (GO - Local, Societe Generale LOC, GO of District Insured)±§ | | | 0.88 | | | | 10/01/2034 | | | | 18,300,000 | | | | 18,300,000 | |
Delaware County PA Authority University Revenue (Education Revenue) | | | 3.00 | | | | 10/01/2012 | | | | 350,000 | | | | 353,126 | |
Delaware County PA Authority University Revenue (Education Revenue) | | | 3.00 | | | | 10/01/2013 | | | | 495,000 | | | | 503,044 | |
Delaware County PA IDA Resource Recovery Facility Series A (Resource Recovery Revenue)§ | | | 6.10 | | | | 07/01/2013 | | | | 2,500,000 | | | | 2,508,650 | |
Delaware Valley PA Regional Financial Authority (Miscellaneous Revenue)±§144A | | | 0.36 | | | | 07/01/2017 | | | | 7,500,000 | | | | 7,500,000 | |
Delaware Valley PA Regional Financial Authority Mode 1 (Miscellaneous Revenue, Bayerische Landesbank LOC)±§ | | | 1.75 | | | | 08/01/2016 | | | | 36,250,000 | | | | 36,250,000 | |
Delaware Valley PA Regional Financial Authority MSTR Series SGC 62 Class A (Miscellaneous Revenue, Societe Generale LOC)±§144A | | | 0.98 | | | | 06/01/2027 | | | | 17,155,000 | | | | 17,155,000 | |
Delaware Valley PA Regional Financial Authority MSTR Series SGC 63 Class A (Miscellaneous Revenue, Societe Generale LOC)±§144A | | | 0.98 | | | | 06/01/2037 | | | | 14,165,000 | | | | 14,165,000 | |
Delaware Valley PA Regional Financial Authority Series A (Miscellaneous Revenue, Bayerische Landesbank LOC)±§ | | | 1.25 | | | | 12/01/2017 | | | | 4,500,000 | | | | 4,500,000 | |
Delaware Valley PA Regional Financial Authority Series A (Miscellaneous Revenue, Bayerische Landesbank LOC)±§ | | | 1.25 | | | | 12/01/2020 | | | | 9,300,000 | | | | 9,300,000 | |
Gallery Certificate Trust Pennsylvania (Transportation Revenue, FSA Insured)§ | | | 4.50 | | | | 02/15/2013 | | | | 1,125,000 | | | | 1,128,476 | |
Harrisburg PA Authority Resources Guaranteed Subordinated Series D-2 (Resource Recovery Revenue, AGM Insured)±§ | | | 5.00 | | | | 12/01/2033 | | | | 4,700,000 | | | | 4,692,010 | |
Lycoming County PA Susquehanna Health System Project A (Health Revenue) | | | 4.00 | | | | 07/01/2012 | | | | 890,000 | | | | 898,864 | |
Pennsylvania EDFA Albert Einstein Healthcare Series A (Health Revenue) | | | 5.00 | | | | 10/15/2012 | | | | 4,075,000 | | | | 4,129,198 | |
| | | | | | |
| Portfolio of Investments—December 31, 2011 (Unaudited) | | Wells Fargo Advantage Ultra Short-Term Municipal Income Fund | | | 25 | |
| | | | | | | | | | | | | | | | |
| Security Name | | Interest Rate | | | Maturity Date | | | Principal | | | Value | |
| | | | | | | | | | | | | | | | |
| | | | |
| Pennsylvania (continued) | | | | | | | | | | | | | | | | |
Pennsylvania EDFA Colver Project Series F (Resource Recovery Revenue, AMBAC Insured) | | | 5.00 | % | | | 12/01/2012 | | | $ | 8,755,000 | | | $ | 8,853,494 | |
Pennsylvania EDFA Colver Project Series F (Resource Recovery Revenue, AMBAC Insured) | | | 5.00 | | | | 12/01/2013 | | | | 9,150,000 | | | | 9,307,014 | |
Pennsylvania EDFA Exelon Generation Series A (Utilities Revenue)±§ | | | 5.00 | | | | 12/01/2042 | | | | 2,000,000 | | | | 2,034,440 | |
Pennsylvania EDFA Main Line Health (Hospital Revenue)±§ | | | 0.50 | | | | 10/01/2027 | | | | 10,285,000 | | | | 10,176,288 | |
Pennsylvania EDFA Solid Waste Disposal Waste Management Incorporated Project (Resource Recovery Revenue)± | | | 2.75 | | | | 09/01/2013 | | | | 3,055,000 | | | | 3,115,153 | |
Pennsylvania EDFA Thomas Jefferson University Hospital System (Tax Revenue)±§ | | | 0.50 | | | | 10/01/2037 | | | | 65,000,000 | | | | 64,312,950 | |
Pennsylvania EDFA Various Refunding Republic Services Incorporated B (Resource Recovery Revenue)±§ | | | 0.95 | | | | 12/01/2030 | | | | 1,000,000 | | | | 1,000,000 | |
Pennsylvania EDFA Waste Management Project (Resource Recovery Revenue)±§ | | | 2.63 | | | | 12/01/2033 | | | | 7,700,000 | | | | 7,803,488 | |
Pennsylvania State HEFAR Associated Independent Colleges Series 13 (Education Revenue)±§ | | | 2.13 | | | | 11/01/2031 | | | | 3,040,000 | | | | 3,053,194 | |
Pennsylvania State HEFAR University of Pittsburgh Medical Centre Series E (Health Revenue) | | | 3.50 | | | | 05/15/2012 | | | | 3,000,000 | | | | 3,032,970 | |
Pennsylvania State HEFAR University of Pittsburgh Medical Centre Series E (Health Revenue) | | | 3.50 | | | | 05/15/2013 | | | | 7,905,000 | | | | 8,196,220 | |
Pennsylvania State IDA Unrefunded Balance Economic Development (IDR, AMBAC Insured)§ | | | 5.50 | | | | 07/01/2014 | | | | 2,260,000 | | | | 2,338,987 | |
Pennsylvania State Turnpike Commission Series B (Transportation Revenue)±§ | | | 0.75 | | | | 06/01/2014 | | | | 6,770,000 | | | | 6,769,797 | |
Pennsylvania State Turnpike Commission Series C (Transportation Revenue)±§ | | | 0.72 | | | | 12/01/2012 | | | | 14,675,000 | | | | 14,706,992 | |
Pennsylvania Turnpike Commission Series C (Transportation Revenue)±§ | | | 1.00 | | | | 12/01/2013 | | | | 22,170,000 | | | | 22,326,077 | |
Philadelphia PA GO Series 2011 (Tax Revenue) | | | 4.00 | | | | 08/01/2012 | | | | 4,325,000 | | | | 4,400,688 | |
Philadelphia PA 1998 8th General Ordinance Series A (Energy Revenue) | | | 5.00 | | | | 08/01/2012 | | | | 1,705,000 | | | | 1,743,311 | |
Philadelphia PA 7th Series 1998 General Ordinance (Utilities Revenue, AMBAC Insured) | | | 5.00 | | | | 10/01/2013 | | | | 500,000 | | | | 530,885 | |
Philadelphia PA Gas Works CAB Series C (Energy Revenue, AMBAC Insured)(z) | | | 4.73 | | | | 01/01/2012 | | | | 130,000 | | | | 130,000 | |
Philadelphia PA School District Series A (Tax Revenue, State Aid Withholding Insured) | | | 3.00 | | | | 06/01/2012 | | | | 1,120,000 | | | | 1,132,824 | |
Philadelphia PA School District Series C (Tax Revenue, State Aid Withholding Insured) | | | 5.00 | | | | 09/01/2012 | | | | 7,400,000 | | | | 7,610,826 | |
Reading City PA Series A (Tax Revenue) | | | 4.00 | | | | 11/15/2013 | | | | 2,000,000 | | | | 2,061,780 | |
Scranton PA School District Series A (Tax Revenue, AGM State Aid Withholding Insured) | | | 2.00 | | | | 04/01/2012 | | | | 400,000 | | | | 401,680 | |
Scranton PA School District Series A (Tax Revenue, AGM State Aid Withholding Insured) | | | 2.00 | | | | 04/01/2013 | | | | 1,000,000 | | | | 1,017,510 | |
Washington County PA Hospital Authority (Health Revenue, PNC Bank NA LOC)±§ | | | 0.47 | | | | 07/01/2031 | | | | 3,500,000 | | | | 3,503,010 | |
Westmoreland County PA IDA Excela Health Project (Health Revenue) | | | 3.00 | | | | 07/01/2012 | | | | 1,040,000 | | | | 1,048,466 | |
| | | | |
| | | | | | | | | | | | | | | 373,210,109 | |
| | | | | | | | | | | | | | | | |
| | | | |
| Puerto Rico: 3.13% | | | | | | | | | | | | | | | | |
Puerto Rico Commonwealth (Tax Revenue, NATL-RE Insured) | | | 6.25 | | | | 07/01/2012 | | | | 3,945,000 | | | | 4,041,850 | |
Puerto Rico Commonwealth Highway & Transportation Authority Series DCL 008 (Transportation Revenue, Dexia Credit Local LOC, FSA Insured)± | | | 2.25 | | | | 07/01/2030 | | | | 970,000 | | | | 970,000 | |
Puerto Rico Commonwealth Highway & Transportation Authority Series A (Transportation Revenue, AMBAC Insured) | | | 5.50 | | | | 07/01/2013 | | | | 730,000 | | | | 769,603 | |
| | | | |
| 26 | | Wells Fargo Advantage Ultra Short-Term Municipal Income Fund | | Portfolio of Investments—December 31, 2011 (Unaudited) |
| | | | | | | | | | | | | | | | |
| Security Name | | Interest Rate | | | Maturity Date | | | Principal | | | Value | |
| | | | | | | | | | | | | | | | |
| | | | |
| Puerto Rico (continued) | | | | | | | | | | | | | | | | |
Puerto Rico Commonwealth Infrastructure Financing Authority Series C (Tax Revenue, AMBAC Insured) | | | 5.50 | % | | | 07/01/2012 | | | $ | 2,300,000 | | | $ | 2,340,664 | |
Puerto Rico Commonwealth Refinance Series B-3 (Miscellaneous Revenue, AGM Insured)±§ | | | 2.50 | | | | 07/01/2026 | | | | 26,175,000 | | | | 26,175,000 | |
Puerto Rico Commonwealth Refinance Series C-4 (Miscellaneous Revenue, AGM Insured)±§ | | | 2.50 | | | | 07/01/2018 | | | | 13,135,000 | | | | 13,135,000 | |
Puerto Rico Commonwealth Series A (Tax Revenue)±§ | | | 5.00 | | | | 07/01/2030 | | | | 2,175,000 | | | | 2,208,800 | |
Puerto Rico Electric Power Authority MSTR Series SGC 64 (Utilities Revenue, Societe Generale LOC)±§(a)144A | | | 0.78 | | | | 07/01/2029 | | | | 11,200,000 | | | | 11,200,000 | |
Puerto Rico Electric Power Authority MSTR Serires SGC-57 Class A (Utilities Revenue, Societe Generale LOC, FSA Insured)±§ | | | 0.68 | | | | 07/01/2029 | | | | 28,160,000 | | | | 28,160,000 | |
Puerto Rico Government Development Bank Senior Note Series D (Miscellaneous Revenue)§ | | | 1.00 | | | | 11/08/2012 | | | | 27,500,000 | | | | 27,396,050 | |
Puerto Rico HFA (Housing Revenue) | | | 5.00 | | | | 12/01/2012 | | | | 6,315,000 | | | | 6,505,460 | |
Puerto Rico Highway & Transportation Authority (Tax Revenue, AMBAC Insured) | | | 5.50 | | | | 07/01/2012 | | | | 2,580,000 | | | | 2,633,664 | |
Puerto Rico Highway & Transportation Authority (Tax Revenue, FGIC Insured) | | | 5.50 | | | | 07/01/2012 | | | | 3,120,000 | | | | 3,184,896 | |
Puerto Rico Highway & Transportation Authority Series DCL-007 (Tax Revenue, Dexia Credit Local LOC, FSA Insured)±§ | | | 2.25 | | | | 01/01/2028 | | | | 6,635,000 | | | | 6,635,000 | |
Puerto Rico Highway & Transportation Authority Series K (Transportation Revenue) | | | 5.00 | | | | 07/01/2012 | | | | 1,000,000 | | | | 1,018,300 | |
Puerto Rico Highway & Transportation Authority Series Y (Tax Revenue) | | | 6.25 | | | | 07/01/2013 | | | | 1,000,000 | | | | 1,066,090 | |
Puerto Rico Industrial Medical & Environmental Pollution Control (IDR)±§ | | | 1.05 | | | | 03/01/2013 | | | | 135,000 | | | | 135,089 | |
Puerto Rico Industrial Medical & Environmental Pollution Control (IDR)±§ | | | 1.05 | | | | 03/01/2013 | | | | 7,705,000 | | | | 7,710,085 | |
Puerto Rico Municipal Finance Agency (Miscellaneous Revenue, AGM Insured) | | | 6.00 | | | | 07/01/2012 | | | | 950,000 | | | | 973,760 | |
Puerto Rico Public Buildings Authority Revenue Guaranteed Refinance Government Facilities Series H (Lease Revenue) | | | 5.25 | | | | 07/01/2012 | | | | 2,815,000 | | | | 2,868,907 | |
Puerto Rico Public Buildings Authority (Miscellaneous Revenue, Commonwealth Guaranty Insured)±§ | | | 5.00 | | | | 07/01/2028 | | | | 10,850,000 | | | | 11,009,821 | |
Puerto Rico Public Buildings Authority Government Facilities Series J (Miscellaneous Revenue, AMBAC Insured)±§ | | | 5.00 | | | | 07/01/2036 | | | | 1,415,000 | | | | 1,435,843 | |
Puerto Rico Public Finance Authority Series A (Miscellaneous Revenue, Government Development Bank for Puerto Rico LOC, NATL-RE Insured)±§ | | | 4.10 | | | | 08/01/2029 | | | | 495,000 | | | | 495,906 | |
Puerto Rico Public Finance Corporation Commonwealth Appropriation Series A (Miscellaneous Revenue, Government Development Bank for Puerto Rico LOC, NATL-RE Insured)±§ | | | 5.25 | | | | 08/01/2029 | | | | 11,565,000 | | | | 11,597,498 | |
Puerto Rico Public Finance Corporation Commonwealth Series A (Miscellaneous Revenue, Government Development Bank for Puerto Rico LOC)±§ | | | 5.75 | | | | 08/01/2027 | | | | 38,705,000 | | | | 38,836,984 | |
Puerto Rico Public Finance Corporation Series A (Miscellaneous Revenue, Government Development Bank for Puerto Rico LOC, AMBAC Insured)±§ | | | 5.25 | | | | 08/01/2030 | | | | 11,415,000 | | | | 11,449,017 | |
| | | | |
| | | | | | | | | | | | | | | 223,953,287 | |
| | | | | | | | | | | | | | | | |
| | | | |
| Rhode Island: 0.42% | | | | | | | | | | | | | | | | |
Coventry RI BAN (Tax Revenue) | | | 2.50 | | | | 04/11/2012 | | | | 4,330,000 | | | | 4,348,619 | |
North Providence Town RI BAN (Tax Revenue) | | | 4.50 | | | | 06/28/2012 | | | | 2,645,000 | | | | 2,654,443 | |
Rhode Island Convention Center Authority (Miscellaneous Revenue, NATL-RE Insured)§ | | | 5.25 | | | | 05/15/2015 | | | | 17,115,000 | | | | 17,967,156 | |
Rhode Island State Health & Educational Building Corporation (Health Revenue, Assured Guaranty Insured)±§144A | | | 0.25 | | | | 05/15/2017 | | | | 5,500,000 | | | | 5,500,000 | |
| | | | |
| | | | | | | | | | | | | | | 30,470,218 | |
| | | | | | | | | | | | | | | | |
| | | | | | |
| Portfolio of Investments—December 31, 2011 (Unaudited) | | Wells Fargo Advantage Ultra Short-Term Municipal Income Fund | | | 27 | |
| | | | | | | | | | | | | | | | |
| Security Name | | Interest Rate | | | Maturity Date | | | Principal | | | Value | |
| | | | | | | | | | | | | | | | |
| | | | |
| South Carolina: 0.93% | | | | | | | | | | | | | | | | |
Piedmont SC Municipal Power Agency CAB 2004 Unrefunded Balance (Utilities Revenue, AMBAC Insured)§(z) | | | 5.40 | % | | | 01/01/2013 | | | $ | 6,065,000 | | | $ | 5,748,468 | |
Richland County SC Series A (Resource Recovery Revenue) | | | 4.60 | | | | 09/01/2012 | | | | 2,000,000 | | | | 2,041,440 | |
South Carolina Jobs EDA Anmed Health Project (Health Revenue) | | | 5.00 | | | | 02/01/2013 | | | | 1,000,000 | | | | 1,042,320 | |
South Carolina Jobs EDA Palmetto Health (Health Revenue)±§ | | | 0.85 | | | | 08/01/2039 | | | | 41,755,000 | | | | 41,175,023 | |
South Carolina Jobs EDA Palmetto Health Series A (Health Revenue, AGM Insured) | | | 2.75 | | | | 08/01/2014 | | | | 870,000 | | | | 884,416 | |
South Carolina Jobs EDA Palmetto Health Series A (Health Revenue, AGM Insured) | | | 4.00 | | | | 08/01/2013 | | | | 865,000 | | | | 897,005 | |
Tobacco Settlement Revenue Management Authority South Carolina (Tobacco Revenue)§ | | | 5.00 | | | | 06/01/2018 | | | | 14,715,000 | | | | 14,731,481 | |
| | | | |
| | | | | | | | | | | | | | | 66,520,153 | |
| | | | | | | | | | | | | | | | |
| | | | |
| South Dakota: 0.01% | | | | | | | | | | | | | | | | |
Minnehaha County SD Bethany Lutheran Home Project Series A (Health Revenue)§ | | | 7.00 | | | | 12/01/2023 | | | | 400,000 | | | | 423,524 | |
| | | | | | | | | | | | | | | | |
| | | | |
| Tennessee: 2.89% | | | | | | | | | | | | | | | | |
Chattanooga Hamilton County TN Refunding Erlanger Health Remarketing (Health Revenue, AGM Insured) | | | 5.00 | | | | 10/01/2012 | | | | 2,220,000 | | | | 2,287,000 | |
Chattanooga Hamilton County TN Refunding Erlanger Health Remarketing 11/24/2009 (Health Revenue, AGM Insured) | | | 5.00 | | | | 10/01/2012 | | | | 1,075,000 | | | | 1,107,444 | |
Clarksville Natural Gas Acquisition Corporation (Energy Revenue) | | | 5.00 | | | | 12/15/2013 | | | | 1,400,000 | | | | 1,470,784 | |
Elizabethton TN Health & Educational Facilities Board Hospital Series B MBIA (Health Revenue, NATL-RE-IBC Insured)§ | | | 7.75 | | | | 07/01/2029 | | | | 20,570,000 | | | | 21,785,893 | |
Jackson TN Energy Authority Electric System (Utilities Revenue, Fifth Third Bank LOC)±§ | | | 0.22 | | | | 04/01/2029 | | | | 1,330,000 | | | | 1,330,000 | |
Johnson City TN Health & Educational Facilities Board 1st Mortgage Mountain States Health Series A (Health Revenue)§ | | | 7.50 | | | | 07/01/2025 | | | | 8,960,000 | | | | 9,478,963 | |
Johnson City TN Health & Educational Facilities Board 1st Mortgage Mountain States Health Series A (Health Revenue)§ | | | 7.50 | | | | 07/01/2033 | | | | 6,000,000 | | | | 6,347,520 | |
Johnson City TN Health & Educational Facilities Board 1st Mortgage Mountain States Series A (Health Revenue, NATL-RE-IBC Insured)§ | | | 7.50 | | | | 07/01/2025 | | | | 8,000,000 | | | | 8,463,360 | |
Johnson City TN Health & Educational Facilities Board Mountain States Health Alliance (Health Revenue) | | | 5.00 | | | | 07/01/2012 | | | | 3,635,000 | | | | 3,690,216 | |
Johnson City TN Health & Educational Facilities Board Mountain States Health Series A (Health Revenue, NATL-RE Insured) | | | 6.00 | | | | 07/01/2012 | | | | 1,630,000 | | | | 1,665,192 | |
Johnson City TN PFOTER 682 (Miscellaneous Revenue)±§144A | | | 6.85 | | | | 07/01/2026 | | | | 20,635,000 | | | | 20,635,000 | |
Knox County TN Health Educational & Housing Facilities Board (Health Revenue, NATL-RE Insured) | | | 6.25 | | | | 01/01/2013 | | | | 3,000,000 | | | | 3,130,950 | |
Knox County TN Health Educational & Housing Facilities Board Fort Sanders Alliance (Health Revenue, NATL-RE Insured) | | | 5.75 | | | | 01/01/2012 | | | | 10,630,000 | | | | 10,631,276 | |
Memphis Shelby County TN Industrial Development Board Boys & Girls Club Series A (Miscellaneous Revenue, SunTrust Bank LOC)±§ | | | 0.45 | | | | 01/01/2028 | | | | 4,530,000 | | | | 4,530,000 | |
Metropolitan Government of Nashville & Davidson County TN (Water & Sewer Revenue, NATL-RE FGIC Insured)§ | | | 5.20 | | | | 01/01/2013 | | | | 1,640,000 | | | | 1,692,086 | |
Metropolitan Nashville TN Airport Authority (Airport Revenue, Societe Generale LOC)±§ | | | 0.85 | | | | 07/01/2019 | | | | 5,800,000 | | | | 5,800,000 | |
Tennessee Energy Acquisition Corporation Series A (Energy Revenue)§ | | | 5.00 | | | | 02/01/2012 | | | | 4,915,000 | | | | 4,934,611 | |
Tennessee Energy Acquisition Corporation Series A (Energy Revenue)§ | | | 5.00 | | | | 09/01/2012 | | | | 34,300,000 | | | | 35,334,145 | |
Tennessee Energy Acquisition Corporation Series A (Energy Revenue)§ | | | 5.00 | | | | 09/01/2013 | | | | 13,735,000 | | | | 14,224,103 | |
Tennessee Energy Acquisition Corporation Series A (Energy Revenue)§ | | | 5.00 | | | | 02/01/2014 | | | | 1,965,000 | | | | 2,062,484 | |
Tennessee Energy Acquisition Corporation Series A (Energy Revenue)§ | | | 5.00 | | | | 09/01/2014 | | | | 22,150,000 | | | | 23,018,280 | |
| | | | |
| 28 | | Wells Fargo Advantage Ultra Short-Term Municipal Income Fund | | Portfolio of Investments—December 31, 2011 (Unaudited) |
| | | | | | | | | | | | | | | | |
| Security Name | | Interest Rate | | | Maturity Date | | | Principal | | | Value | |
| | | | | | | | | | | | | | | | |
| | | |
| Tennessee (continued) | | | | | | | | | | | | | |
Tennessee Energy Acquisition Corporation Series A (Energy Revenue)§ | | | 5.00 | % | | | 09/01/2015 | | | $ | 15,245,000 | | | $ | 15,642,590 | |
Tennessee Energy Acquisition Corporation Series A (Energy Revenue)§ | | | 5.00 | | | | 09/01/2016 | | | | 1,000,000 | | | | 1,019,140 | |
Tennessee Energy Acquisition Corporation Series C (Energy Revenue)§ | | | 5.00 | | | | 02/01/2016 | | | | 6,480,000 | | | | 6,659,107 | |
| | | | |
| | | | | | | | | | | | | | | 206,940,144 | |
| | | | | | | | | | | | | | | | |
| | | | |
| Texas: 9.55% | | | | | | | | | | | | | | | | |
Arlington TX Special Obligation Dallas Cowboys Series A (Tax Revenue, NATL-RE Insured)§ | | | 5.00 | | | | 08/15/2034 | | | | 5,895,000 | | | | 6,135,811 | |
Austin TX Water and Wastewater Various Refunding (Utilities Revenue, AGM Insured)±§ | | | 0.30 | | | | 05/15/2024 | | | | 3,010,000 | | | | 3,010,000 | |
Brazos River TX Authority (IDR, NATL-RE FGIC Insured) | | | 3.63 | | | | 04/01/2012 | | | | 5,000,000 | | | | 5,024,600 | |
Central Texas Regional Mobility Authority (Transportation Revenue, NATL-RE FGIC Insured) | | | 5.00 | | | | 01/01/2013 | | | | 2,720,000 | | | | 2,784,192 | |
Coastal Bend Texas Health Facilities Development Corporation (Health Revenue, AGM Insured)±§(m) | | | 0.95 | | | | 07/01/2031 | | | | 9,400,000 | | | | 9,400,000 | |
Eagle Mountain & Saginaw TX Independent School District MSTR Series SGA 141 (Tax Revenue, PSF-GTD Insured)±§ | | | 0.73 | | | | 08/15/2030 | | | | 16,000,000 | | | | 16,000,000 | |
Eagle Mountain & Saginaw TX Independent Various School Building (Tax Revenue, PSF-GTD Insured)±§ | | | 2.50 | | | | 08/01/2050 | | | | 2,000,000 | | | | 2,072,220 | |
Harris County TX Health Facilities Development Corporation Series A3 (Health Revenue, AGM Insured)±§(m) | | | 1.00 | | | | 07/01/2031 | | | | 24,800,000 | | | | 24,800,000 | |
Harris County TX Health Facilities Development Corporation Series A4 (Health Revenue, AGM Insured)±§(m) | | | 0.90 | | | | 07/01/2031 | | | | 14,200,000 | | | | 14,200,000 | |
Harris County TX MSTR Series SGC 31-Class A (Miscellaneous Revenue, Societe Generale LOC)±§ | | | 0.98 | | | | 08/15/2035 | | | | 3,695,000 | | | | 3,695,000 | |
Houston TX Water Conveyance System Series J (Lease Revenue, AMBAC Insured) | | | 6.25 | | | | 12/15/2013 | | | | 3,500,000 | | | | 3,744,265 | |
Houston TX Independent School District (Tax Revenue, PSF-GTD Insured)±§ | | | 0.57 | | | | 06/15/2031 | | | | 40,000,000 | | | | 40,011,200 | |
Houston TX PFOTER 265 (Water & Sewer Revenue, FSA Insured)±§ | | | 2.37 | | | | 12/01/2028 | | | | 6,850,000 | | | | 6,850,000 | |
Houston TX Water & Sewer System (Water & Sewer Revenue, NATL-RE Insured)±§ | | | 0.22 | | | | 12/01/2023 | | | | 12,495,000 | | | | 12,495,000 | |
Lubbock TX Health Facilities Development Corporation St. Joseph Health Systems Series A (Hospital Revenue)±§ | | | 3.05 | | | | 07/01/2030 | | | | 10,420,000 | | | | 10,573,278 | |
Matagorda County TX Navigation District #1 (Utilities Revenue)±§ | | | 1.13 | | | | 06/01/2030 | | | | 7,150,000 | | | | 7,157,436 | |
Mission TX Economic Development Corporation Solid Waste Disposal Republic Services Incorporated Series A (Resource Recovery Revenue)±§ | | | 1.05 | | | | 01/01/2020 | | | | 8,300,000 | | | | 8,300,000 | |
North Central Texas Health Facility Development Corporation Children’s Medical Center Project (Health Revenue, NATL-RE Insured)§ | | | 5.75 | | | | 08/15/2013 | | | | 3,065,000 | | | | 3,076,310 | |
North Texas Higher Education Authority Incorporated Student Loan Series 1 Class A-1 (Education Revenue)± | | | 0.77 | | | | 07/01/2019 | | | | 40,720,000 | | | | 40,582,774 | |
North Texas Tollway Authority First Tier Series E-2 (Miscellaneous Revenue)±§ | | | 5.25 | | | | 01/01/2038 | | | | 15,000,000 | | | | 15,002,100 | |
North Texas Tollway Authority First Tier Series L-2 (Transportation Revenue)±§ | | | 6.00 | | | | 01/01/2038 | | | | 17,560,000 | | | | 18,450,116 | |
SA Energy Acquisition Public Facility Corporation TX (Energy Revenue)§ | | | 5.25 | | | | 08/01/2015 | | | | 1,780,000 | | | | 1,850,203 | |
Sabine River TX Industrial Northeast Texas National Rural Utility Company 84Q (IDR)±§ | | | 0.90 | | | | 08/15/2014 | | | | 1,230,000 | | | | 1,230,062 | |
Texas Municipal Gas Acquisition & Supply Corporation II (Energy Revenue)±§ | | | 0.53 | | | | 09/15/2018 | | | | 47,850,000 | | | | 47,850,000 | |
Texas Municipal Gas Acquisition & Supply Corporation Senior Lien Series D (Utilities Revenue)§ | | | 5.63 | | | | 12/15/2017 | | | | 99,160,000 | | | | 105,523,097 | |
Texas Municipal Gas Acquisition & Supply Corporation Series A (Utilities Revenue)±§ | | | 1.07 | | | | 09/15/2017 | | | | 44,950,000 | | | | 42,752,844 | |
| | | | | | |
| Portfolio of Investments—December 31, 2011 (Unaudited) | | Wells Fargo Advantage Ultra Short-Term Municipal Income Fund | | | 29 | |
| | | | | | | | | | | | | | | | |
| Security Name | | Interest Rate | | | Maturity Date | | | Principal | | | Value | |
| | | | | | | | | | | | | | | | |
| | | |
| Texas (continued) | | | | | | | | | | | | | |
Texas Municipal Gas Acquisition & Supply Corporation Series B (Utilities Revenue)±§ | | | 0.57 | % | | | 09/15/2017 | | | $ | 92,325,000 | | | $ | 87,951,565 | |
Texas Municipal Gas Acquisition & Supply Corporation Series B (Utilities Revenue)±§ | | | 0.92 | | | | 12/15/2017 | | | | 5,980,000 | | | | 5,396,352 | |
Texas PFA (Miscellaneous Revenue) | | | 2.60 | | | | 07/01/2020 | | | | 50,785,000 | | | | 50,967,826 | |
Texas State Mobility Fund Series B (Tax Revenue)±§ | | | 1.74 | | | | 04/01/2030 | | | | 57,355,000 | | | | 57,355,000 | |
Texas State Transportation Series B (Transportation Revenue)±§ | | | 0.50 | | | | 04/01/2026 | | | | 12,600,000 | | | | 12,600,000 | |
Weslaco TX Health Facilities Development Corporation (Health Revenue, Compass Bank LOC)±§ | | | 0.76 | | | | 06/01/2031 | | | | 8,920,000 | | | | 8,920,000 | |
Weslaco TX Health Facilities Development Knapp Medical Center Series A (Health Revenue, Compass Bank LOC)±§ | | | 0.76 | | | | 06/01/2038 | | | | 7,855,000 | | | | 7,855,000 | |
| | | | |
| | | | | | | | | | | | | | | 683,616,251 | |
| | | | | | | | | | | | | | | | |
| | | | |
| Virgin Islands: 0.27% | | | | | | | | | | | | | | | | |
Virgin Islands PFA Matching Funding Loan Note Senior Lien Series A (Tax Revenue) | | | 4.00 | | | | 10/01/2012 | | | | 300,000 | | | | 304,719 | |
Virgin Islands PFA Matching Funding Loan Note Senior Lien Series A (Tax Revenue) | | | 4.00 | | | | 10/01/2013 | | | | 400,000 | | | | 412,444 | |
Virgin Islands PFA Senior Lien Series B (Miscellaneous Revenue) | | | 5.00 | | | | 10/01/2012 | | | | 10,500,000 | | | | 10,743,180 | |
Virgin Islands PFA Sub Lien Series C (Miscellaneous Revenue) | | | 5.00 | | | | 10/01/2012 | | | | 6,675,000 | | | | 6,814,574 | |
Virgin Islands Water & Power Authority Series A (Utilities Revenue) | | | 4.00 | | | | 07/01/2012 | | | | 1,000,000 | | | | 1,012,320 | |
| | | | |
| | | | | | | | | | | | | | | 19,287,237 | |
| | | | | | | | | | | | | | | | |
| | | | |
| Virginia: 0.24% | | | | | | | | | | | | | | | | |
Alexandria VA IDA Various American Statistical Association (IDR, SunTrust Bank LOC)±§ | | | 0.45 | | | | 08/01/2030 | | | | 4,850,000 | | | | 4,850,000 | |
Pittsylvania County VA (Tax Revenue)§ | | | 3.50 | | | | 07/15/2013 | | | | 3,500,000 | | | | 3,509,485 | |
Smyth County VA IDA (Health Revenue) | | | 3.00 | | | | 07/01/2012 | | | | 3,560,000 | | | | 3,582,001 | |
Virginia Beach VA Residential Rental Silver Hill (Housing Revenue, SunTrust Bank LOC)±§ | | | 0.50 | | | | 05/01/2025 | | | | 3,400,000 | | | | 3,400,000 | |
Virginia State Biotechnology Research Partnership Authority VA Blood Services Project (Health Revenue, SunTrust Bank LOC)±§ | | | 0.45 | | | | 10/01/2028 | | | | 2,130,000 | | | | 2,130,000 | |
| | | | |
| | | | | | | | | | | | | | | 17,471,486 | |
| | | | | | | | | | | | | | | | |
| | | | |
| Washington: 0.52% | | | | | | | | | | | | | | | | |
Energy Northwest Washington Electric Revenue Refunding Project 1 Series A (Utilities Revenue) | | | 5.00 | | | | 07/01/2013 | | | | 5,000,000 | | | | 5,245,200 | |
Greater Wenatchee WA Regional Events Center Public Facilities District Special Tax BAN A (Miscellaneous Revenue, GO of district Insured) | | | 5.25 | | | | 12/01/2011 | | | | 560,000 | | | | 420,000 | |
Greater Wenatchee WA Regional Events Center Public Facilities District Revenue Limited Sales Tax BAN (Tax Revenue, GO of District Insured) | | | 5.00 | | | | 12/01/2011 | | | | 3,885,000 | | | | 3,457,650 | |
Washington EDFA (Resource Recovery Revenue)±§ | | | 2.00 | | | | 11/01/2017 | | | | 7,000,000 | | | | 7,019,740 | |
Washington HCFA Series A (Health Revenue) | | | 5.00 | | | | 08/15/2012 | | | | 1,000,000 | | | | 1,021,870 | |
Washington State HCFA Central Washington Health Services (Health Revenue) | | | 5.00 | | | | 07/01/2012 | | | | 560,000 | | | | 565,830 | |
Washington State MSTR Series SGB13 (Tax Revenue)±§ | | | 0.85 | | | | 05/01/2018 | | | | 19,665,000 | | | | 19,665,000 | |
| | | | |
| | | | | | | | | | | | | | | 37,395,290 | |
| | | | | | | | | | | | | | | | |
| | | | |
| West Virginia: 0.42% | | | | | | | | | | | | | | | | |
Mason County WV PCR Appalachian Power Company (Miscellaneous Revenue)±§ | | | 2.00 | | | | 10/01/2022 | | | | 20,000,000 | | | | 19,983,800 | |
West Virginia Solid Waste Disposal Facilities Amos Project Series A (Resource Recovery Revenue)±§ | | | 2.00 | | | | 01/01/2041 | | | | 10,000,000 | | | | 10,051,400 | |
| | | | |
| | | | | | | | | | | | | | | 30,035,200 | |
| | | | | | | | | | | | | | | | |
| | | | |
| 30 | | Wells Fargo Advantage Ultra Short-Term Municipal Income Fund | | Portfolio of Investments—December 31, 2011 (Unaudited) |
| | | | | | | | | | | | | | | | |
| Security Name | | Interest Rate | | | Maturity Date | | | Principal | | | Value | |
| | | | | | | | | | | | | | | | |
| | | | |
| Wisconsin: 1.37% | | | | | | | | | | | | | | | | |
Milwaukee County WI Airport (Airport Revenue) | | | 5.00 | % | | | 12/01/2012 | | | $ | 1,000,000 | | | $ | 1,038,770 | |
Wisconsin PFOTER 628 (Health Revenue, NATL-RE LOC)±§144A | | | 0.56 | | | | 08/15/2023 | | | | 77,600,000 | | | | 77,600,000 | |
Wisconsin State HEFA Agnesian Health Care Incorporated (Health Revenue) | | | 5.00 | | | | 07/01/2013 | | | | 735,000 | | | | 771,735 | |
Wisconsin State HEFA Aurora Health Care Obligated (Health Revenue, NATL-RE Insured)§ | | | 5.25 | | | | 08/15/2012 | | | | 3,720,000 | | | | 3,729,598 | |
Wisconsin State HEFA Aurora Health Care Series B (Health Revenue) | | | 4.00 | | | | 07/15/2012 | | | | 5,000,000 | | | | 5,063,550 | |
Wisconsin State HEFA Aurora Health Care Series B (Health Revenue) | | | 5.00 | | | | 07/15/2013 | | | | 6,000,000 | | | | 6,269,640 | |
Wisconsin State HEFA Bellin Memorial (Health Revenue, AMBAC Insured)§ | | | 5.63 | | | | 02/15/2013 | | | | 170,000 | | | | 173,352 | |
Wisconsin State HEFA Mercy Alliance Incorporate Series A (Health Revenue) | | | 4.00 | | | | 06/01/2012 | | | | 2,810,000 | | | | 2,841,416 | |
Wisconsin State HEFA Refunding Thedacare Incorporated (Health Revenue) | | | 3.00 | | | | 12/15/2012 | | | | 870,000 | | | | 881,456 | |
| | | | |
| | | | | | | | | | | | | | | 98,369,517 | |
| | | | | | | | | | | | | | | | |
| | | | |
Total Municipal Bonds and Notes (Cost $6,790,500,248) | | | | | | | | | | | | | | | 6,807,099,727 | |
| | | | | | | | | | | | | | | | |
| | | | |
| | | Yield | | | | | | Shares | | | | |
| Short-Term Investments: 0.73% | | | | | | | | | | | | | | | | |
| | | | |
| Investment Companies: 0.72% | | | | | | | | | | | | | | | | |
Wells Fargo Advantage National Tax-Free Money Market Fund, Institutional Class(l)(u) | | | 0.01 | | | | | | | | 51,096,652 | | | | 51,096,652 | |
| | | | | | | | | | | | | | | | |
| | | | |
| | | | | | | | | Principal | | | | |
| U.S. Treasury Securities: 0.01% | | | | | | | | | | | | | | | | |
U.S. Treasury Bill# | | | 0.01 | | | | 03/29/2012 | | | $ | 800,000 | | | | 799,971 | |
| | | | | | | | | | | | | | | | |
| | | | |
Total Short-Term Investments (Cost $51,896,629) | | | | | | | | | | | | | | | 51,896,623 | |
| | | | | | | | | | | | | | | | |
| | | | | | | | |
| Total Investments in Securities | | | | | | | | |
| (Cost $6,842,396,877)* | | | 95.78 | % | | | 6,858,996,350 | |
Other Assets and Liabilities, Net | | | 4.22 | | | | 302,270,468 | |
| | | | | | | | |
| Total Net Assets | | | 100.00 | % | | $ | 7,161,266,818 | |
| | | | | | | | |
| ± | Variable rate investment. |
| § | These securities are subject to a demand feature which reduces the effective maturity. |
| (m) | An auction-rate security whose interest rate resets at predetermined short-term intervals through a Dutch auction; rate shown represents the rate in effect at period-end. |
| (a) | Security is fair valued by the Management Valuation Team, and in certain instances by the Board of Trustees, in accordance with procedures approved by the Board of Trustees. |
| (n) | Auction to set interest rate on security failed at period end due to insufficient investor interest; failed auction does not itself cause a default. |
| 144A | Security that may be resold to “qualified institutional buyers” under Rule 144A or security offered pursuant to Section 4(2) of the Securities Act of 1933, as amended. |
| (z) | Zero coupon security. Rate represents yield to maturity. |
| (l) | Investment in an affiliate. |
| (u) | Rate shown is the 7-day annualized yield at period end. |
| # | All or a portion of this security is segregated as collateral for investments in derivative instruments. |
| * | Cost for federal income tax purposes is $6,844,271,778 and net unrealized appreciation (depreciation) consists of: |
| | | | |
Gross unrealized appreciation | | $ | 24,430,492 | |
Gross unrealized depreciation | | | (9,705,920 | ) |
| | | | |
Net unrealized appreciation | | $ | 14,724,572 | |
The accompanying notes are an integral part of these financial statements.
| | | | | | |
| Statement of Assets and Liabilities—December 31, 2011 (Unaudited) | | Wells Fargo Advantage Ultra Short-Term Municipal Income Fund | | | 31 | |
| | | | |
| | | | |
| |
Assets | | | | |
Investments | | | | |
In unaffiliated securities, at value | | $ | 6,807,899,698 | |
In affiliated securities, at value | | | 51,096,652 | |
| | | | |
Total investments, at value (see cost below) | | | 6,858,996,350 | |
Receivable for investments sold | | | 317,600,167 | |
Receivable for Fund shares sold | | | 99,099,016 | |
Receivable for interest | | | 35,083,319 | |
Prepaid expenses and other assets | | | 168,528 | |
| | | | |
Total assets | | | 7,310,947,380 | |
| | | | |
| |
Liabilities | | | | |
Dividends payable | | | 3,312,985 | |
Payable for investments purchased | | | 119,144,254 | |
Payable for Fund shares redeemed | | | 23,259,427 | |
Payable for daily variation margin on open futures contracts | | | 130,625 | |
Advisory fee payable | | | 1,343,671 | |
Distribution fees payable | | | 130,246 | |
Due to other related parties | | | 1,110,941 | |
Accrued expenses and other liabilities | | | 1,248,413 | |
| | | | |
Total liabilities | | | 149,680,562 | |
| | | | |
Total net assets | | $ | 7,161,266,818 | |
| | | | |
| |
NET ASSETS CONSIST OF | | | | |
Paid-in capital | | $ | 7,162,358,223 | |
Overdistributed net investment income | | | (419,383 | ) |
Accumulated net realized losses on investments | | | (16,854,426 | ) |
Net unrealized gains on investments | | | 16,182,404 | |
| | | | |
Total net assets | | $ | 7,161,266,818 | |
| | | | |
| |
COMPUTATION OF NET ASSET VALUE AND OFFERING PRICE PER SHARE1 | | | | |
Net assets – Class A | | $ | 2,719,375,250 | |
Shares outstanding – Class A | | | 565,061,671 | |
Net asset value per share – Class A | | | $4.81 | |
Maximum offering price per share – Class A2 | | | $4.91 | |
Net assets – Class C | | $ | 190,565,195 | |
Shares outstanding – Class C | | | 39,552,457 | |
Net asset value per share – Class C | | | $4.82 | |
Net assets – Administrator Class | | $ | 303,373,439 | |
Shares outstanding – Administrator Class | | | 63,073,537 | |
Net asset value per share – Administrator Class | | | $4.81 | |
Net assets – Institutional Class | | $ | 2,853,596,288 | |
Shares outstanding – Institutional Class | | | 593,069,480 | |
Net asset value per share – Institutional Class | | | $4.81 | |
Net assets – Investor Class | | $ | 1,094,356,646 | |
Shares outstanding – Investor Class | | | 227,196,467 | |
Net asset value per share – Investor Class | | | $4.82 | |
| |
Total investments, at cost | | $ | 6,842,396,877 | |
| | | | |
| 1. | The Fund has an unlimited number of authorized shares. |
| 2. | Maximum offering price is computed as 100/98 of net asset value. On investments of $50,000 or more, the offering price is reduced. |
The accompanying notes are an integral part of these financial statements.
| | | | |
| 32 | | Wells Fargo Advantage Ultra Short-Term Municipal Income Fund | | Statement of Operations—Six Months Ended December 31, 2011 (Unaudited) |
| | | | |
| | | | |
| |
Investment income | | | | |
Interest | | $ | 65,212,108 | |
Income from affiliated securities | | | 10,244 | |
| | | | |
Total investment income | | | 65,222,352 | |
| | | | |
| |
Expenses | | | | |
Advisory fee | | | 9,888,215 | |
Administration fees | | | | |
Fund level | | | 1,643,098 | |
Class A | | | 2,187,933 | |
Class C | | | 164,616 | |
Administrator Class | | | 144,096 | |
Institutional Class | | | 1,054,789 | |
Investor Class | | | 1,025,191 | |
Shareholder servicing fees | | | | |
Class A | | | 3,418,648 | |
Class C | | | 257,212 | |
Administrator Class | | | 313,835 | |
Investor Class | | | 1,348,935 | |
Distribution fees | | | | |
Class C | | | 771,636 | |
Custody and accounting fees | | | 151,344 | |
Professional fees | | | 19,887 | |
Registration fees | | | 159,872 | |
Shareholder report expenses | | | 130,491 | |
Trustees’ fees and expenses | | | 7,149 | |
Other fees and expenses | | | 120,704 | |
| | | | |
Total expenses | | | 22,807,651 | |
Less: Fee waivers and/or expense reimbursements | | | (2,664,722 | ) |
| | | | |
Net expenses | | | 20,142,929 | |
| | | | |
Net investment income | | | 45,079,423 | |
| | | | |
| |
REALIZED AND UNREALIZED GAINS (LOSSES) ON INVESTMENTS | | | | |
| |
Net realized gains (losses) on: | | | | |
Unaffiliated securities | | | 3,902,554 | |
Futures transactions | | | (2,069,442 | ) |
| | | | |
Net realized gains on investments | | | 1,833,112 | |
| | | | |
| |
Net change in unrealized gains (losses) on: | | | | |
Unaffiliated securities | | | (9,771,252 | ) |
Futures transactions | | | (465,549 | ) |
| | | | |
Net change in unrealized gains (losses) on investments | | | (10,236,801 | ) |
| | | | |
Net realized and unrealized gains (losses) on investments | | | (8,403,689 | ) |
| | | | |
Net increase in net assets resulting from operations | | $ | 36,675,734 | |
| | | | |
The accompanying notes are an integral part of these financial statements.
| | | | | | |
| Statements of Changes in Net Assets | | Wells Fargo Advantage Ultra Short-Term Municipal Income Fund | | | 33 | |
| | | | | | | | | | | | | | | | |
| | | Six Months Ended
December 31, 2011
(Unaudited) | | | Year Ended
June 30, 2011 | |
| | | | |
Operations | | | | | | | | | | | | | | | | |
Net investment income | | | | | | $ | 45,079,423 | | | | | | | $ | 93,459,122 | |
Net realized gains on investments | | | | | | | 1,833,112 | | | | | | | | 13,033,150 | |
Net change in unrealized gains (losses) on investments | | | | | | | (10,236,801 | ) | | | | | | | (730,784 | ) |
| | | | | | | | | | | | | | | | |
Net increase in net assets resulting from operations | | | | | | | 36,675,734 | | | | | | | | 105,761,488 | |
| | | | | | | | | | | | | | | | |
| | | | |
Distributions to shareholders from | | | | | | | | | | | | | | | | |
Net investment income | | | | | | | | | | | | | | | | |
Class A | | | | | | | (16,508,253 | ) | | | | | | | (38,719,469 | ) |
Class C | | | | | | | (474,156 | ) | | | | | | | (1,527,813 | ) |
Administrator Class | | | | | | | (1,841,873 | ) | | | | | | | (1,769,588 | )1 |
Institutional Class | | | | | | | (19,902,922 | ) | | | | | | | (35,363,397 | ) |
Investor Class | | | | | | | (6,352,717 | ) | | | | | | | (16,077,458 | ) |
| | | | | | | | | | | | | | | | |
Total distributions to shareholders | | | | | | | (45,079,921 | ) | | | | | | | (93,457,725 | ) |
| | | | | | | | | | | | | | | | |
| | | | |
Capital share transactions | | | Shares | | | | | | | | Shares | | | | | |
Proceeds from shares sold | | | | | | | | | | | | | | | | |
Class A | | | 213,349,499 | | | | 1,027,932,082 | | | | 438,772,808 | | | | 2,111,500,120 | |
Class C | | | 1,763,001 | | | | 8,505,843 | | | | 4,573,992 | | | | 22,030,623 | |
Administrator Class | | | 28,141,430 | | | | 135,501,392 | | | | 78,131,956 | 1 | | | 375,538,284 | 1 |
Institutional Class | | | 511,950,172 | | | | 2,466,077,731 | | | | 772,573,023 | | | | 3,718,542,902 | |
Investor Class | | | 52,866,152 | | | | 254,939,866 | | | | 97,548,819 | | | | 469,850,130 | |
| | | | | | | | | | | | | | | | |
| | | | | | | 3,892,956,914 | | | | | | | | 6,697,462,059 | |
| | | | | | | | | | | | | | | | |
Reinvestment of distributions | | | | | | | | | | | | | | | | |
Class A | | | 2,685,517 | | | | 12,935,585 | | | | 6,355,270 | | | | 30,583,819 | |
Class C | | | 69,609 | | | | 335,894 | | | | 212,091 | | | | 1,021,485 | |
Administrator Class | | | 328,018 | | | | 1,579,365 | | | | 304,717 | 1 | | | 1,465,213 | 1 |
Institutional Class | | | 1,540,009 | | | | 7,417,816 | | | | 3,652,268 | | | | 17,574,524 | |
Investor Class | | | 1,150,627 | | | | 5,551,927 | | | | 2,849,770 | | | | 13,726,048 | |
| | | | | | | | | | | | | | | | |
| | | | | | | 27,820,587 | | | | | | | | 64,371,089 | |
| | | | | | | | | | | | | | | | |
Payment for shares redeemed | | | | | | | | | | | | | | | | |
Class A | | | (209,568,199 | ) | | | (1,009,692,554 | ) | | | (607,442,942 | ) | | | (2,923,025,349 | ) |
Class C | | | (7,137,243 | ) | | | (34,436,190 | ) | | | (39,967,134 | ) | | | (192,531,300 | ) |
Administrator Class | | | (20,781,710 | ) | | | (100,050,592 | ) | | | (23,050,874 | )1 | | | (110,768,845 | )1 |
Institutional Class | | | (423,430,410 | ) | | | (2,039,943,911 | ) | | | (660,128,794 | ) | | | (3,176,940,612 | ) |
Investor Class | | | (48,318,222 | ) | | | (233,083,563 | ) | | | (196,432,683 | ) | | | (945,973,871 | ) |
| | | | | | | | | | | | | | | | |
| | | | | | | (3,417,206,810 | ) | | | | | | | (7,349,239,977 | ) |
| | | | | | | | | | | | | | | | |
Net increase (decrease) in net assets resulting
from capital share transactions | | | | | | | 503,570,691 | | | | | | | | (587,406,829 | ) |
| | | | | | | | | | | | | | | | |
Total increase (decrease) in net assets | | | | | | | 495,166,504 | | | | | | | | (575,103,066 | ) |
| | | | | | | | | | | | | | | | |
| | | | |
Net assets | | | | | | | | | | | | | | | | |
Beginning of period | | | | | | | 6,666,100,314 | | | | | | | | 7,241,203,380 | |
| | | | | | | | | | | | | | | | |
End of period | | | | | | $ | 7,161,266,818 | | | | | | | $ | 6,666,100,314 | |
| | | | | | | | | | | | | | | | |
Overdistributed net investment income | | | | | | $ | (419,383 | ) | | | | | | $ | (418,885 | ) |
| | | | | | | | | | | | | | | | |
| 1. | Class commenced operations on July 30, 2010. |
The accompanying notes are an integral part of these financial statements.
| | | | |
| 34 | | Wells Fargo Advantage Ultra Short-Term Municipal Income Fund | | Financial Highlights |
(For a share outstanding throughout each period)
| | | | | | | | | | | | | | | | | | | | | | | | |
| | | Six Months Ended
December 31, 2011
(Unaudited) | | | Year Ended June 30, | |
| Class A | | | 2011 | | | 2010 | | | 2009 | | | 20081 | | | 20071 | |
Net asset value, beginning of period | | $ | 4.82 | | | $ | 4.81 | | | $ | 4.78 | | | $ | 4.75 | | | $ | 4.76 | | | $ | 4.76 | |
Net investment income | | | 0.03 | | | | 0.06 | | | | 0.07 | | | | 0.20 | | | | 0.20 | | | | 0.17 | |
Net realized and unrealized gains (losses) on investments | | | (0.01 | ) | | | 0.01 | | | | 0.03 | | | | 0.03 | | | | (0.01 | ) | | | 0.00 | |
| | | | | | | | | | | | | | | | | | | | | | | | |
Total from investment operations | | | 0.02 | | | | 0.07 | | | | 0.10 | | | | 0.23 | | | | 0.19 | | | | 0.17 | |
Distributions to shareholders from | | | | | | | | | | | | | | | | | | | | | | | | |
Net investment income | | | (0.03 | ) | | | (0.06 | ) | | | (0.07 | ) | | | (0.20 | ) | | | (0.20 | ) | | | (0.17 | ) |
Net asset value, end of period | | $ | 4.81 | | | $ | 4.82 | | | $ | 4.81 | | | $ | 4.78 | | | $ | 4.75 | | | $ | 4.76 | |
Total return2 | | | 0.40 | % | | | 1.51 | % | | | 2.17 | % | | | 5.00 | % | | | 4.10 | % | | | 3.59 | % |
Ratios to average net assets (annualized) | | | | | | | | | | | | | | | | | | | | | | | | |
Gross expenses | | | 0.76 | % | | | 0.76 | % | | | 0.78 | % | | | 0.84 | % | | | 0.99 | % | | | 1.06 | % |
Net expenses | | | 0.67 | % | | | 0.67 | % | | | 0.67 | % | | | 0.67 | % | | | 0.70 | % | | | 0.72 | % |
Net investment income | | | 1.21 | % | | | 1.28 | % | | | 1.44 | % | | | 3.77 | % | | | 4.14 | % | | | 3.52 | % |
Supplemental data | | | | | | | | | | | | | | | | | | | | | | | | |
Portfolio turnover rate | | | 73 | % | | | 127 | % | | | 120 | % | | | 186 | % | | | 191 | % | | | 123 | % |
Net assets, end of period (000’s omitted) | | | $2,719,375 | | | | $2,691,449 | | | | $3,466,977 | | | | $2,227,869 | | | | $112,660 | | | | $9,670 | |
| 1. | Effective June 20, 2008, Advisor Class was renamed Class A. |
| 2. | Total return calculations do not include any sales changes. Returns for period of less than one year are not annualized. |
The accompanying notes are an integral part of these financial statements.
| | | | | | |
| Financial Highlights | | Wells Fargo Advantage Ultra Short-Term Municipal Income Fund | | | 35 | |
(For a share outstanding throughout each period)
| | | | | | | | | | | | | | | | | | | | |
| | | Six Months Ended
December 31, 2011 (Unaudited) | | | Year Ended June 30, | |
| Class C | | | 2011 | | | 2010 | | | 2009 | | | 20081 | |
Net asset value, beginning of period | | $ | 4.82 | | | $ | 4.81 | | | $ | 4.78 | | | $ | 4.76 | | | $ | 4.75 | |
Net investment income | | | 0.01 | | | | 0.03 | | | | 0.04 | | | | 0.16 | | | | 0.04 | |
Net realized and unrealized gains (losses) on investments | | | 0.00 | | | | 0.01 | | | | 0.03 | | | | 0.02 | | | | 0.01 | |
| | | | | | | | | | | | | | | | | | | | |
Total from investment operations | | | 0.01 | | | | 0.04 | | | | 0.07 | | | | 0.18 | | | | 0.05 | |
Distributions to shareholders from | | | | | | | | | | | | | | | | | | | | |
Net investment income | | | (0.01 | ) | | | (0.03 | ) | | | (0.04 | ) | | | (0.16 | ) | | | (0.04 | ) |
Net asset value, end of period | | $ | 4.82 | | | $ | 4.82 | | | $ | 4.81 | | | $ | 4.78 | | | $ | 4.76 | |
Total return2 | | | 0.23 | % | | | 0.76 | % | | | 1.40 | % | | | 3.95 | % | | | 1.00 | % |
Ratios to average net assets (annualized) | | | | | | | | | | | | | | | | | | | | |
Gross expenses | | | 1.51 | % | | | 1.51 | % | | | 1.53 | % | | | 1.58 | % | | | 1.63 | % |
Net expenses | | | 1.42 | % | | | 1.42 | % | | | 1.42 | % | | | 1.42 | % | | | 1.42 | % |
Net investment income | | | 0.46 | % | | | 0.54 | % | | | 0.70 | % | | | 2.79 | % | | | 2.93 | % |
Supplemental data | | | | | | | | | | | | | | | | | | | | |
Portfolio turnover rate | | | 73 | % | | | 127 | % | | | 120 | % | | | 186 | % | | | 191 | % |
Net assets, end of period (000’s omitted) | | | $190,565 | | | | $216,389 | | | | $385,331 | | | | $255,585 | | | | $2,276 | |
| 1. | For the period from March 31, 2008 (commencement of class operations) to June 30, 2008. |
| 2. | Total return calculations do not include any sales changes. Returns for period of less than one year are not annualized. |
The accompanying notes are an integral part of these financial statements.
| | | | |
| 36 | | Wells Fargo Advantage Ultra Short-Term Municipal Income Fund | | Financial Highlights |
(For a share outstanding throughout each period)
| | | | | | | | |
| Administrator Class | | Six Months Ended
December 31, 2011
(Unaudited) | | | Year Ended
June 30, 20111 | |
Net asset value, beginning of period | | $ | 4.82 | | | $ | 4.81 | |
Net investment income | | | 0.03 | | | | 0.06 | |
Net realized and unrealized gains (losses) on investments | | | (0.01 | ) | | | 0.01 | |
| | | | | | | | |
Total from investment operations | | | 0.02 | | | | 0.07 | |
Distributions to shareholders from | | | | | | | | |
Net investment income | | | (0.03 | ) | | | (0.06 | ) |
Net asset value, end of period | | $ | 4.81 | | | $ | 4.82 | |
Total return2 | | | 0.44 | % | | | 1.47 | % |
Ratios to average net assets (annualized) | | | | | | | | |
Gross expenses | | | 0.67 | % | | | 0.67 | % |
Net expenses | | | 0.60 | % | | | 0.60 | % |
Net investment income | | | 1.28 | % | | | 1.42 | % |
Supplemental data | | | | | | | | |
Portfolio turnover rate | | | 73 | % | | | 127 | % |
Net assets, end of period (000’s omitted) | | | $303,373 | | | | $266,710 | |
| 1. | For the period from July 30, 2010 (class of commencement operations) to June 30, 2011. |
| 2. | Returns for period of less than one year are not annualized. |
The accompanying notes are an integral part of these financial statements.
| | | | | | |
| Financial Highlights | | Wells Fargo Advantage Ultra Short-Term Municipal Income Fund | | | 37 | |
(For a share outstanding throughout each period)
| | | | | | | | | | | | | | | | | | | | | | | | |
| | | Six Months Ended
December 31, 2011 (Unaudited) | | | Year Ended June 30, | |
| Institutional Class | | | 2011 | | | 2010 | | | 2009 | | | 2008 | | | 2007 | |
Net asset value, beginning of period | | $ | 4.82 | | | $ | 4.81 | | | $ | 4.78 | | | $ | 4.75 | | | $ | 4.76 | | | $ | 4.76 | |
Net investment income | | | 0.04 | | | | 0.08 | | | | 0.09 | | | | 0.22 | | | | 0.22 | | | | 0.19 | |
Net realized and unrealized gains (losses) on investments | | | (0.01 | ) | | | 0.01 | | | | 0.03 | | | | 0.03 | | | | (0.01 | ) | | | 0.00 | |
| | | | | | | | | | | | | | | | | | | | | | | | |
Total from investment operations | | | 0.03 | | | | 0.09 | | | | 0.12 | | | | 0.25 | | | | 0.21 | | | | 0.19 | |
Distributions to shareholders from | | | | | | | | | | | | | | | | | | | | | | | | |
Net investment income | | | (0.04 | ) | | | (0.08 | ) | | | (0.09 | ) | | | (0.22 | ) | | | (0.22 | ) | | | (0.19 | ) |
Net asset value, end of period | | $ | 4.81 | | | $ | 4.82 | | | $ | 4.81 | | | $ | 4.78 | | | $ | 4.75 | | | $ | 4.76 | |
Total return1 | | | 0.55 | % | | | 1.82 | % | | | 2.48 | % | | | 5.32 | % | | | 4.47 | % | | | 3.95 | % |
Ratios to average net assets (annualized) | | | | | | | | | | | | | | | | | | | | | | | | |
Gross expenses | | | 0.43 | % | | | 0.43 | % | | | 0.43 | % | | | 0.50 | % | | | 0.61 | % | | | 0.61 | % |
Net expenses | | | 0.37 | % | | | 0.37 | % | | | 0.37 | % | | | 0.37 | % | | | 0.37 | % | | | 0.37 | % |
Net investment income | | | 1.51 | % | | | 1.60 | % | | | 1.67 | % | | | 4.28 | % | | | 4.57 | % | | | 3.87 | % |
Supplemental data | | | | | | | | | | | | | | | | | | | | | | | | |
Portfolio turnover rate | | | 73 | % | | | 127 | % | | | 120 | % | | | 186 | % | | | 191 | % | | | 123 | % |
Net assets, end of period (000’s omitted) | | | $2,853,596 | | | | $2,423,330 | | | | $1,860,538 | | | | $542,964 | | | | $95,113 | | | | $80,326 | |
| 1. | Returns for period of less than one year are not annualized. |
The accompanying notes are an integral part of these financial statements.
| | | | |
| 38 | | Wells Fargo Advantage Ultra Short-Term Municipal Income Fund | | Financial Highlights |
(For a share outstanding throughout each period)
| | | | | | | | | | | | | | | | | | | | | | | | |
| | | Six Months Ended
December 31, 2011 (Unaudited) | | | Year Ended June 30, | |
| Investor Class | | | 2011 | | | 2010 | | | 2009 | | | 2008 | | | 2007 | |
Net asset value, beginning of period | | $ | 4.82 | | | $ | 4.81 | | | $ | 4.78 | | | $ | 4.75 | | | $ | 4.76 | | | $ | 4.76 | |
Net investment income | | | 0.03 | | | | 0.06 | | | | 0.07 | | | | 0.20 | | | | 0.20 | | | | 0.16 | |
Net realized and unrealized gains (losses) on investments | | | 0.00 | | | | 0.01 | | | | 0.03 | | | | 0.03 | | | | (0.01 | ) | | | 0.01 | |
| | | | | | | | | | | | | | | | | | | | | | | | |
Total from investment operations | | | 0.03 | | | | 0.07 | | | | 0.10 | | | | 0.23 | | | | 0.19 | | | | 0.17 | |
Distributions to shareholders from | | | | | | | | | | | | | | | | | | | | | | | | |
Net investment income | | | (0.03 | ) | | | (0.06 | ) | | | (0.07 | ) | | | (0.20 | ) | | | (0.20 | ) | | | (0.17 | ) |
Net asset value, end of period | | $ | 4.82 | | | $ | 4.82 | | | $ | 4.81 | | | $ | 4.78 | | | $ | 4.75 | | | $ | 4.76 | |
Total return1 | | | 0.59 | % | | | 1.48 | % | | | 2.12 | % | | | 4.96 | % | | | 4.10 | % | | | 3.59 | % |
Ratios to average net assets (annualized) | | | | | | | | | | | | | | | | | | | | | | | | |
Gross expenses | | | 0.79 | % | | | 0.79 | % | | | 0.82 | % | | | 0.90 | % | | | 1.16 | % | | | 1.23 | % |
Net expenses | | | 0.70 | % | | | 0.70 | % | | | 0.72 | % | | | 0.72 | % | | | 0.72 | % | | | 0.72 | % |
Net investment income | | | 1.18 | % | | | 1.25 | % | | | 1.44 | % | | | 4.13 | % | | | 4.20 | % | | | 3.52 | % |
Supplemental data | | | | | | | | | | | | | | | | | | | | | | | | |
Portfolio turnover rate | | | 73 | % | | | 127 | % | | | 120 | % | | | 186 | % | | | 191 | % | | | 123 | % |
Net assets, end of period (000’s omitted) | | | $1,094,357 | | | | $1,068,221 | | | | $1,528,358 | | | | $1,334,323 | | | | $746,639 | | | | $340,682 | |
| 1. | Returns for period of less than one year are not annualized. |
The accompanying notes are an integral part of these financial statements.
| | | | | | |
| Notes to Financial Statements (Unaudited) | | Wells Fargo Advantage Ultra Short-Term Municipal Income Fund | | | 39 | |
1. ORGANIZATION
Wells Fargo Funds Trust (the “Trust”), a Delaware statutory trust organized on March 10, 1999, is an open-end management investment company registered under the Investment Company Act of 1940, as amended (the “1940 Act”). These financial statements report on Wells Fargo Advantage Ultra Short-Term Municipal Income Fund (the “Fund”) which is a diversified series of the Trust.
2. SIGNIFICANT ACCOUNTING POLICIES
The following significant accounting policies, which are consistently followed in the preparation of the financial statements of the Fund, are in conformity with U.S. generally accepted accounting principles which require management to make estimates and assumptions that affect the reported amounts of assets and liabilities, disclosure of contingent assets and liabilities at the date of the financial statements, and the reported amounts of revenues and expenses during the reporting period. Actual results could differ from those estimates.
Securities valuation
Fixed income securities with maturities exceeding 60 days are valued based on available evaluated prices received from an independent pricing service approved by the Board of Trustees which may utilize both transaction data and market information such as yield, prices of securities of comparable quality, coupon rate, maturity, type of issue, trading characteristics and other market data. If valuations are not available from the pricing service or values received are deemed not representative of market value, values will be obtained from a third party broker-dealer or determined based on the Fund’s Fair Value Procedures.
Debt securities of sufficient credit quality with original maturities of 60 days or less generally are valued at amortized cost which approximates fair value. The amortized cost method involves valuing a security at its cost, plus accretion of discount or minus amortization of premium over the period until maturity.
Investments in open-end mutual funds and non-registered investment companies are generally valued at net asset value.
Investments which are not valued using any of the methods discussed above, are valued at their fair value, as determined by procedures established in good faith and approved by the Board of Trustees.
When-issued transactions
The Fund may purchase securities on a forward commitment or ‘when-issued’ basis. The Fund records a when-issued transaction on the trade date and will segregate assets to cover its obligation by confirming the availability of qualifying assets having a value sufficient to make payment for the securities purchased. Securities purchased on a when-issued basis are marked-to-market daily and the Fund begins earning interest on the settlement date. Losses may arise due to changes in the market value of the underlying securities or if the counterparty does not perform under the contract.
Futures contracts
The Fund may be subject to interest rate risk in the normal course of pursuing its investment objectives. The Fund may buy and sell futures contracts in order to gain exposure to, or protect against, changes in security values and interest rates. The primary risks associated with the use of futures contracts are the imperfect correlation between changes in market values of securities held by the Fund and the prices of futures contracts, and the possibility of an illiquid market.
Futures contracts are valued based upon their quoted daily settlement prices when available. The aggregate principal amounts of the contracts are not recorded in the financial statements. Fluctuations in the value of the contracts are recorded in the Statement of Assets and Liabilities as an asset or liability and in the Statement of Operations as unrealized gains or losses until the contracts are closed, at which point they are recorded as net realized gains or losses on futures contracts. With futures contracts, there is minimal counterparty risk to the Fund since futures are exchange traded and the exchange’s clearinghouse, as counterparty to all exchange traded futures, guarantees the futures against default.
Security transactions and income recognition
Securities transactions are recorded on a trade date basis. Realized gains or losses are reported on the basis of identified cost of securities delivered.
Interest income is accrued daily and bond discounts are accreted and premiums are amortized daily based on the effective interest method. To the extent debt obligations are placed on non-accrual status, any related interest income
| | | | |
| 40 | | Wells Fargo Advantage Ultra Short-Term Municipal Income Fund | | Notes to Financial Statements (Unaudited) |
may be reduced by writing off interest receivables when the collection of all or a portion of interest has become doubtful based on consistently applied procedures. If the issuer subsequently resumes interest payments or when the collectability of interest is reasonably assured, the debt obligation is removed from non-accrual status.
Federal and other taxes
The Fund intends to continue to qualify as a regulated investment company by distributing substantially all of its investment company taxable and tax-exempt income and any net realized capital gains (after reduction for capital loss carryforwards) sufficient to relieve it from all, or substantially all, federal income taxes. Accordingly, no provision for federal income taxes was required.
The Fund’s income and federal excise tax returns and all financial records supporting those returns for the prior three fiscal years are subject to examination by the federal and Delaware revenue authorities.
Under the recently enacted Regulated Investment Company Modernization Act of 2010, the Fund is permitted to carry forward capital losses incurred in taxable years which began after December 22, 2010 for an unlimited period. However, any losses incurred are required to be utilized prior to the losses incurred in pre-enactment taxable years. As a result of this ordering rule, pre-enactment capital loss carryforwards may be more likely to expire unused. Additionally, post-enactment capital losses that are carried forward will retain their character as either short-term or long-term capital losses rather than being considered all short-term as under previous law.
As of June 30, 2011, the Fund had net capital loss carryforwards, which were available to offset future net realized capital gains, in the amount of $16,812,637 with $14,707,618 expiring in 2014 and $2,105,019 expiring in 2015.
Class allocations
The separate classes of shares offered by the Fund differ principally in applicable sales charges, distribution, shareholder servicing and administration fees. Shareholders of each class bear certain expenses that pertain to that particular class. All shareholders bear the common expenses of the Fund, earn income from the portfolio, and are allocated unrealized gains and losses pro rata based on the average daily net assets of each class, without distinction between share classes. Dividends are determined separately for each class based on income and expenses allocable to each class. Realized gains and losses are allocated to each class pro rata based upon the net assets of each class on the date realized. Differences in per share dividend rates generally result from the relative weightings of pro rata income and realized gain allocations and from differences in separate class expenses, including distribution, shareholder servicing and administration fees.
3. FAIR VALUATION MEASUREMENTS
Fair value measurements of investments are determined within a framework that has established a fair value hierarchy based upon the various data inputs utilized in determining the value of the Fund’s investments. The three-level hierarchy gives the highest priority to unadjusted quoted prices in active markets for identical assets or liabilities (Level 1) and the lowest priority to significant unobservable inputs (Level 3). The Fund’s investments are classified within the fair value hierarchy based on the lowest level of input that is significant to the fair value measurement. The inputs are summarized into three broad levels as follows:
| n | | Level 1 – quoted prices in active markets for identical securities |
| n | | Level 2 – other significant observable inputs (including quoted prices for similar securities, interest rates, prepayment speeds, credit risk, etc.) |
| n | | Level 3 – significant unobservable inputs (including the Fund’s own assumptions in determining the fair value of investments) |
The inputs or methodologies used for valuing securities are not necessarily an indication of the risk associated with investing in those securities.
| | | | | | |
| Notes to Financial Statements (Unaudited) | | Wells Fargo Advantage Ultra Short-Term Municipal Income Fund | | | 41 | |
As of December 31, 2011, the inputs used in valuing the Fund’s assets, which are carried at fair value, were as follows:
| | | | | | | | | | | | | | | | |
| Investments in Securities | | Quoted Prices (Level 1) | | | Significant Other
Observable Inputs (Level 2) | | | Significant Unobservable Inputs
(Level 3) | | | Total | |
Municipal bonds and notes | | $ | 0 | | | $ | 6,749,759,542 | | | $ | 57,340,185 | | | $ | 6,807,099,727 | |
Short-term investments | | | | | | | | | | | | | | | | |
Investment companies | | | 51,096,652 | | | | 0 | | | | 0 | | | | 51,096,652 | |
U.S. Treasury securities | | | 799,971 | | | | 0 | | | | 0 | | | | 799,971 | |
| | | $ | 51,896,623 | | | $ | 6,749,759,542 | | | $ | 57,340,185 | | | $ | 6,858,996,350 | |
Further details on the major security types listed above can be found in the Portfolio of Investments.
As of December 31, 2011, the inputs used in valuing the Fund’s other financial instruments, which are carried at fair value, were as follows:
| | | | | | | | | | | | | | | | |
| Other financial instruments | | Quoted Prices
(Level 1) | | | Significant Other
Observable Inputs
(Level 2) | | | Significant
Unobservable Inputs
(Level 3) | | | Total | |
Futures contracts+ | | $ | (417,069 | ) | | $ | 0 | | | $ | 0 | | | $ | (417,069 | ) |
| + | Futures contracts are presented at the unrealized gains or losses on the instrument. |
Transfers in and transfers out are recognized at the end of the reporting period. For the six months ended December 31, 2011, the Fund did not have any significant transfers into/out of Level 1 and Level 2.
The following is a reconciliation of assets in which significant unobservable inputs (Level 3) were used in determining fair value:
| | | | |
| | | Municipal
bonds and
notes | |
Balance as of June 30, 2011 | | $ | 45,221,514 | |
Accrued discounts (premiums) | | | 136,260 | |
Realized gains (losses) | | | 89,138 | |
Change in unrealized gains (losses) | | | 95,623 | |
Purchases | | | 19,020,000 | |
Sales | | | (11,100,000 | ) |
Transfers into Level 3 | | | 3,877,650 | |
Transfers out of Level 3 | | | 0 | |
Balance as of December 31, 2011 | | $ | 57,340,185 | |
Change in unrealized gains (losses)
relating to securities still held at December 31, 2011 | | $ | 96,115 | |
4. TRANSACTIONS WITH AFFILIATES AND OTHER EXPENSES
Advisory fee
The Trust has entered into an advisory contract with Wells Fargo Funds Management, LLC (“Funds Management”), an indirect wholly owned subsidiary of Wells Fargo & Company (“Wells Fargo”). The adviser is responsible for implementing investment policies and guidelines and for supervising the sub-adviser, who is responsible for day-to-day portfolio management of the Fund.
Pursuant to the contract, Funds Management is entitled to receive an annual advisory fee starting at 0.35% and declining to 0.25% as the average daily net assets of the Fund increase. For the six month ended December 31, 2011, the advisory fee was equivalent to an annual rate of 0.28% of the Fund’s average daily net assets.
Funds Management may retain the services of certain sub-advisers to provide daily portfolio management to the Fund. The fees related to sub-advisory services are borne directly by Funds Management and do not increase the overall fees paid by the Fund. Wells Capital Management Incorporated, an affiliate of Funds Management, is the sub-adviser to the Fund and is entitled to receive a fee from Funds Management at an annual rate starting at 0.15% and declining to 0.05% as the average daily net assets of the Fund increase.
| | | | |
| 42 | | Wells Fargo Advantage Ultra Short-Term Municipal Income Fund | | Notes to Financial Statements (Unaudited) |
Administration and transfer agent fees
The Trust has entered into an administration agreement with Funds Management. Under this agreement, for providing administrative services, which includes paying fees and expenses for services provided by the transfer agent, sub-transfer agents, omnibus account servicers and record-keepers, Funds Management is entitled to receive from the Fund an annual fund level administration fee starting at 0.05% and declining to 0.03% as the average daily net assets of the Fund increase and a class level administration fee which is calculated based on the average daily net assets of each class as follows:
| | | | |
| | | Class Level
Administration Fee | |
Class A, Class C | | | 0.16 | % |
Administrator Class | | | 0.10 | |
Institutional Class | | | 0.08 | |
Investor Class | | | 0.19 | |
Funds Management has contractually waived and/or reimbursed advisory and administration fees to the extent necessary to maintain certain net operating expense ratios for the Fund. Waiver of fees and/or reimbursement of expenses by Funds Management were made first from fund level expenses on a proportionate basis and then from class specific expenses.
Distribution fees
The Trust has adopted a Distribution Plan for Class C shares of the Fund pursuant to Rule 12b-1 under the 1940 Act. Distribution fees are charged to Class C shares and paid to Wells Fargo Funds Distributor, LLC, the principal underwriter, at an annual rate of 0.75% of the average daily net assets of Class C shares.
For the six months ended December 31, 2011, Wells Fargo Funds Distributor, LLC received $22,571 from the sale of Class A shares and $15,974 in contingent deferred sales charges from redemptions of Class C shares.
Shareholder servicing fees
The Trust has entered into contracts with one or more shareholder servicing agents, whereby Class A, Class C, Administrator Class and Investor Class of the Fund is charged a fee at an annual rate of 0.25% of the average daily net assets of each respective class.
A portion of these total shareholder servicing fees were paid to affiliates of Wells Fargo.
5. INVESTMENT PORTFOLIO TRANSACTIONS
Purchases and sales of investments, excluding U.S. Government obligations (if any) and short-term securities (securities with maturities of one year or less at purchase date), for the six months ended December 31, 2011 were $5,702,976,993 and $4,752,279,653, respectively.
6. DERIVATIVE TRANSACTIONS
During the six months ended December 31, 2011, the Fund entered into futures contracts to take advantage of the differences between municipal and treasury yields and to help shorten duration of the portfolio.
At December 31, 2011, the Fund had short futures contracts outstanding as follows:
| | | | | | | | | | | | |
| Expiration Date | | Contracts | | Type | | Contract Value at
December 31,
2011 | | | Net
Unrealized
Gains (Losses) | |
| March 2012 | | 760 Short | | 5-Year U.S. Treasury Notes | | $ | 93,675,938 | | | $ | (417,069 | ) |
The Fund had an average notional amount of $120,109,506 in short futures contracts during the six months ended December 31, 2011.
On December 31, 2011, the cumulative unrealized losses on futures contracts in the amount of $417,069 is reflected in net unrealized gains on investments on the Statement of Assets and Liabilities. The payable for daily variation margin on open futures contracts reflected in the Statement of Assets and Liabilities only represents the current day’s variation margin. The realized losses and change in unrealized gains (losses) on futures contracts are reflected in the Statement of Operations.
| | | | | | |
| Notes to Financial Statements (Unaudited) | | Wells Fargo Advantage Ultra Short-Term Municipal Income Fund | | | 43 | |
7. BANK BORROWINGS
The Trust (excluding the money market funds) and Wells Fargo Variable Trust are parties to a $150,000,000 revolving credit agreement with State Street Bank and Trust Company, whereby the Fund is permitted to use bank borrowings for temporary or emergency purposes, such as to fund shareholder redemption requests. Interest under the credit agreement is charged to the Fund based on a borrowing rate equal to the higher of the Federal Funds rate in effect on that day plus 1.25% or the overnight LIBOR rate in effect on that day plus 1.25%. In addition, under the credit agreement, the Fund pays an annual commitment fee equal to 0.10% of the unused balance, which is allocated pro rata. Prior to September 6, 2011, the revolving credit agreement was for $125,000,000 and the annual commitment fee paid by the Fund was 0.125% of the unused balance. For the six months ended December 31, 2011, the Fund paid $8,038 in commitment fees.
For the six months ended December 31, 2011, there were no borrowings by the Fund under the agreement.
8. INDEMNIFICATION
Under the Trust’s organizational documents, the officers and directors are indemnified against certain liabilities that may arise out of performance of their duties to the Trust. Additionally, in the normal course of business, the Trust may enter into contracts with service providers that contain a variety of indemnification clauses. The Trust’s maximum exposure under these arrangements is dependent on future claims that may be made against the Fund and, therefore, cannot be estimated.
9. NEW ACCOUNTING PRONOUNCEMENTS
In May 2011, the Financial Accounting Standards Board (“FASB”) issued Accounting Standards Update (“ASU”) No. 2011-04 “Amendments to Achieve Common Fair Value Measurement and Disclosure Requirements in U.S. GAAP and IFRSs”. ASU No. 2011-04 amends FASB ASC Topic 820, Fair Value Measurements and Disclosures, to establish common requirements for measuring fair value and for disclosing information about fair value measurements in accordance with GAAP. The ASU is effective prospectively for interim and annual periods beginning after December 15, 2011. Management expects that adoption of the ASU will result in additional disclosures in the financial statements, as applicable.
In April 2011, FASB issued ASU No. 2011-03 “Reconsideration of Effective Control for Repurchase Agreements”. ASU No. 2011-03 amends FASB ASC Topic 860, Transfers and Servicing, specifically the criteria required to determine whether a repurchase agreement (repo) and similar agreements should be accounted for as sales of financial assets or secured borrowings with commitments. ASU No. 2011-03 changes the assessment of effective control by focusing on the transferor’s contractual rights and obligations and removing the criterion to assess its ability to exercise those rights or honor those obligations. This could result in changes to the way entities account for certain transactions including repurchase agreements, mortgage dollar rolls and reverse repurchase agreements. The ASU will become effective on a prospective basis for new transfers and modifications to existing transactions as of the beginning of the first interim or annual period beginning on or after December 15, 2011. Management has evaluated the impact of adopting the ASU and expects no significant changes.
| | | | |
| 44 | | Wells Fargo Advantage Ultra Short-Term Municipal Income Fund | | Other Information (Unaudited) |
PROXY VOTING INFORMATION
A description of the policies and procedures that the Fund uses to determine how to vote proxies relating to portfolio securities is available without charge, upon request, by calling 1-800-222-8222, visiting our Web site at www.wellsfargo.com/advantagefunds, or visiting the SEC Web site at www.sec.gov. Information regarding how the Fund voted proxies relating to portfolio securities during the most recent 12-month period ended June 30 is available without charge on the Fund’s Web site at www.wellsfargo.com/advantagefunds or by visiting the SEC Web site at www.sec.gov.
PORTFOLIO HOLDINGS INFORMATION
The complete portfolio holdings for the Fund are publicly available on the Fund’s Web site (www.wellsfargo.com/advantagefunds) on a monthly, 30-day or more delayed basis. In addition, top ten holdings information for the Fund is publicly available on the Fund’s Web site on a monthly, seven-day or more delayed basis. The Fund files its complete schedule of portfolio holdings with the SEC for the first and third quarters of each fiscal year on Form N-Q, which is available without charge by visiting the SEC Web site at www.sec.gov. In addition, the Fund’s Form N-Q may be reviewed and copied at the SEC’s Public Reference Room in Washington, DC, and at regional offices in New York City, at 233 Broadway, and in Chicago, at 175 West Jackson Boulevard, Suite 900. Information about the Public Reference Room may be obtained by calling 1-800-SEC-0330.
| | | | | | |
| Other Information (Unaudited) | | Wells Fargo Advantage Ultra Short-Term Municipal Income Fund | | | 45 | |
BOARD OF TRUSTEES
The following table provides basic information about the Board of Trustees (the “Trustees”) of the Trust and Officers of the Trust. This table should be read in conjunction with the Prospectus and the Statement of Additional Information1 of the Fund. Each of the Trustees and Officers listed below acts in identical capacities for the Wells Fargo Advantage family of funds, which consists of 138 funds comprising the Wells Fargo Funds Trust, Wells Fargo Variable Trust, Wells Fargo Master Trust and four closed-end funds (collectively the “Fund Complex”). All of the Trustees are also Members of the Audit and Governance Committees of each Trust in the Fund Complex. The mailing address of each Trustee and Officer is 525 Market Street, 12th Floor, San Francisco, CA 94105. Each Trustee and Officer serves an indefinite term, however, each Trustee serves such term until reaching the mandatory retirement age established by the Trustees.
Independent Trustees
| | | | | | |
Name and Year of Birth | | Position Held and Length of Service | | Principal Occupations During Past Five Years | | Other Directorships During
Past Five Years |
Peter G. Gordon
(Born 1942) | | Trustee, since 1998; Chairman, since 2005 (Lead Trustee since 2001) | | Co-Founder, Retired Chairman, President and CEO of Crystal Geyser Water Company. Trustee Emeritus, Colby College | | Asset Allocation Trust |
Isaiah Harris, Jr.
(Born 1952) | | Trustee, since 2009 | | Retired. Prior thereto, President and CEO of BellSouth Advertising and Publishing Corp. from 2005 to 2007, President and CEO of BellSouth Enterprises from 2004 to 2005 and President of BellSouth Consumer Services from 2000 to 2003. Emeritus member of the Iowa State University Foundation Board of Governors. Emeritus Member of the Advisory Board of Iowa State University School of Business. Mr. Harris is a certified public accountant. | | CIGNA Corporation; Deluxe Corporation; Asset Allocation Trust |
Judith M. Johnson
(Born 1949) | | Trustee, since 2008 | | Retired. Prior thereto, Chief Executive Officer and Chief Investment Officer of Minneapolis Employees Retirement Fund from 1996 to 2008. Ms. Johnson is an attorney, certified public accountant and a certified managerial accountant. | | Asset Allocation Trust |
Leroy Keith, Jr.
(Born 1939) | | Trustee, since 2010 | | Chairman, Bloc Global Services (development and construction). Trustee of the Evergreen Funds from 1983 to 2010. Former Managing Director, Almanac Capital Management (commodities firm), former Partner, Stonington Partners, Inc. (private equity fund), former Director, Obagi Medical Products Co. and former Director, Lincoln Educational Services. | | Trustee, Virtus Fund Complex (consisting of 40 portfolios as of 12/31/11); Asset Allocation Trust |
David F. Larcker
(Born 1950) | | Trustee, since 2009 | | James Irvin Miller Professor of Accounting at the Graduate School of Business, Stanford University, Director of Corporate Governance Research Program and Senior Faculty of The Rock Center for Corporate Governance since 2006. From 2005 to 2008, Professor of Accounting at the Graduate School of Business, Stanford University. Prior thereto, Ernst & Young Professor of Accounting at The Wharton School, University of Pennsylvania from 1985 to 2005. | | Asset Allocation Trust |
Olivia S. Mitchell
(Born 1953) | | Trustee, since 2006 | | International Foundation of Employee Benefit Plans Professor, Wharton School of the University of Pennsylvania since 1993. Director of Wharton’s Pension Research Council and Boettner Center on Pensions & Retirement Research, and Research Associate at the National Bureau of Economic Research. Previously, Cornell University Professor from 1978 to 1993. | | Asset Allocation Trust |
| | | | |
| 46 | | Wells Fargo Advantage Ultra Short-Term Municipal Income Fund | | Other Information (Unaudited) |
| | | | | | |
Name and Year of Birth | | Position Held and Length of Service | | Principal Occupations During Past Five Years | | Other Directorships During
Past Five Years |
Timothy J. Penny
(Born 1951) | | Trustee, since 1996 | | President and CEO of Southern Minnesota Initiative Foundation, a non-profit organization, since 2007 and Senior Fellow at the Humphrey Institute Policy Forum at the University of Minnesota since 1995. Member of the Board of Trustees of NorthStar Education Finance, Inc., a non-profit organization, since 2007. | | Asset Allocation Trust |
Michael S. Scofield
(Born 1943) | | Trustee, since 2010 | | Served on the Investment Company Institute’s Board of Governors and Executive Committee from 2008-2011 as well the Governing Council of the Independent Directors Council from 2006-2011 and the Independent Directors Council Executive Committee from 2008-2011. Chairman of the IDC from 2008-2010. Institutional Investor (Fund Directions) Trustee of Year in 2007. Trustee of the Evergreen Funds (and its predecessors) from 1984 to 2010. Chairman of the Evergreen Funds from 2000-2010. Former Trustee of the Mentor Funds. Retired Attorney, Law Offices of Michael S. Scofield and former Director and Chairman, Branded Media Corporation (multi-media branding company). | | Asset Allocation Trust |
Donald C. Willeke
(Born 1940) | | Trustee, since 1996 | | Principal of the law firm of Willeke & Daniels. General Counsel of the Minneapolis Employees Retirement Fund from 1984 until its consolidation into the Minnesota Public Employees Retirement Association on June 30, 2010. Director and Vice Chair of The Free Trust (non-profit corporation). Director of the American Chestnut Foundation (non-profit corporation). | | Asset Allocation Trust |
Officers
| | | | | | |
Name and Year of Birth | | Position Held and
Length of Service | | Principal Occupations During Past Five Years | | |
Karla M. Rabusch
(Born 1959) | | President, since 2003 | | Executive Vice President of Wells Fargo Bank, N.A. and President of Wells Fargo Funds Management, LLC since 2003. Senior Vice President and Chief Administrative Officer of Wells Fargo Funds Management, LLC from 2001 to 2003. | | |
C. David Messman
(Born 1960) | | Secretary, since 2000; Chief Legal Counsel, since 2003 | | Senior Vice President and Secretary of Wells Fargo Funds Management, LLC since 2001. Vice President and Managing Senior Counsel of Wells Fargo Bank, N.A. since 1996. | | |
Kasey Phillips
(Born 1970) | | Treasurer, since 2009 | | Senior Vice President of Wells Fargo Funds Management, LLC since 2009. Senior Vice President of Evergreen Investment Management Company, LLC from 2006 to 2010. Treasurer of the Evergreen Funds from 2005 to 2010. | | |
David Berardi
(Born 1975) | | Assistant Treasurer, since 2009 | | Vice President of Wells Fargo Funds Management, LLC since 2009. Vice President of Evergreen Investment Management Company, LLC from 2008 to 2010. Assistant Vice President of Evergreen Investment Services, Inc. from 2004 to 2008. Manager of Fund Reporting and Control for Evergreen Investment Management Company, LLC from 2004 to 2010. | | |
Jeremy DePalma
(Born 1974) | | Assistant Treasurer, since 2009 | | Senior Vice President of Wells Fargo Funds Management, LLC since 2009. Senior Vice President of Evergreen Investment Management Company, LLC from 2008 to 2010. Vice President, Evergreen Investment Services, Inc. from 2004 to 2007. Head of the Fund Reporting and Control Team within Fund Administration from 2005 to 2010. | | |
Debra Ann Early
(Born 1964) | | Chief Compliance Officer, since 2007 | | Chief Compliance Officer of Wells Fargo Funds Management, LLC since 2007. Chief Compliance Officer of Parnassus Investments from 2005 to 2007. Chief Financial Officer of Parnassus Investments from 2004 to 2007 and Senior Audit Manager of PricewaterhouseCoopers LLP from 1998 to 2004. | | |
| 1. | The Statement of Additional Information includes additional information about the Trustees and is available, without charge, upon request, by calling 1-800-222-8222 or by visiting the Web site at www.wellsfargo.com/advantagefunds. |
| | | | | | |
| List of Abbreviations | | Wells Fargo Advantage Ultra Short-Term Municipal Income Fund | | | 47 | |
The following is a list of common abbreviations for terms and entities which may have appeared in this report.
| ACB | — Agricultural Credit Bank |
| ADR | — American Depository Receipt |
| ADS | — American Depository Shares |
| AGC-ICC | — Assured Guaranty Corporation - Insured Custody Certificates |
| AGM | — Assured Guaranty Municipal |
| AMBAC | — American Municipal Bond Assurance Corporation |
| AMT | — Alternative Minimum Tax |
| BAN | — Bond Anticipation Notes |
| BHAC | — Berkshire Hathaway Assurance Corporation |
| CAB | — Capital Appreciation Bond |
| CCAB | — Convertible Capital Appreciation Bond |
| CDA | — Community Development Authority |
| CDO | — Collateralized Debt Obligation |
| COP | — Certificate of Participation |
| DRIVER | — Derivative Inverse Tax-Exempt Receipts |
| DW&P | — Department of Water & Power |
| DWR | — Department of Water Resources |
| ECFA | — Educational & Cultural Facilities Authority |
| EDA | — Economic Development Authority |
| EDFA | — Economic Development Finance Authority |
| ETF | — Exchange-Traded Fund |
| FFCB | — Federal Farm Credit Bank |
| FGIC | — Financial Guaranty Insurance Corporation |
| FHA | — Federal Housing Authority |
| FHLB | — Federal Home Loan Bank |
| FHLMC | — Federal Home Loan Mortgage Corporation |
| FNMA | — Federal National Mortgage Association |
| GDR | — Global Depository Receipt |
| GNMA | — Government National Mortgage Association |
| HCFR | — Healthcare Facilities Revenue |
| HEFA | — Health & Educational Facilities Authority |
| HEFAR | — Higher Education Facilities Authority Revenue |
| HFA | — Housing Finance Authority |
| HFFA | — Health Facilities Financing Authority |
| IBC | — Insured Bond Certificate |
| IDA | — Industrial Development Authority |
| IDAG | — Industrial Development Agency |
| IDR | — Industrial Development Revenue |
| KRW | — Republic of Korea Won |
| LIBOR | — London Interbank Offered Rate |
| LLC | — Limited Liability Company |
| LLP | — Limited Liability Partnership |
| MBIA | — Municipal Bond Insurance Association |
| MFHR | — Multi-Family Housing Revenue |
| MSTR | — Municipal Securities Trust Receipts |
| MUD | — Municipal Utility District |
| NATL-RE | — National Public Finance Guarantee Corporation |
| PCFA | — Pollution Control Finance Authority |
| PCR | — Pollution Control Revenue |
| PFA | — Public Finance Authority |
| PFFA | — Public Facilities Financing Authority |
| PFOTER | — Puttable Floating Option Tax-Exempt Receipts |
| plc | — Public Limited Company |
| PUTTER | — Puttable Tax-Exempt Receipts |
| R&D | — Research & Development |
| RDA | — Redevelopment Authority |
| RDFA | — Redevelopment Finance Authority |
| REIT | — Real Estate Investment Trust |
| ROC | — Reset Option Certificates |
| SAVRS | — Select Auction Variable Rate Securities |
| SBA | — Small Business Authority |
| SFHR | — Single Family Housing Revenue |
| SFMR | — Single Family Mortgage Revenue |
| SPDR | — Standard & Poor’s Depositary Receipts |
| TAN | — Tax Anticipation Notes |
| TIPS | — Treasury Inflation-Protected Securities |
| TRAN | — Tax Revenue Anticipation Notes |
| TCR | — Transferable Custody Receipts |
| TTFA | — Transportation Trust Fund Authority |
| TVA | — Tennessee Valley Authority |
| XLCA | — XL Capital Assurance |
This page is intentionally left blank.
This page is intentionally left blank.
This page is intentionally left blank.


FOR MORE INFORMATION
More information about Wells Fargo Advantage Funds is available free upon request. To obtain literature, please write, e-mail, visit the Fund’s Web site, or call:
Wells Fargo Advantage Funds
P.O. Box 8266
Boston, MA 02266-8266
E-mail: wfaf@wellsfargo.com
Web site: www.wellsfargo.com/advantagefunds
Individual investors: 1-800-222-8222
Retail investment professionals: 1-888-877-9275
Institutional investment professionals: 1-866-765-0778
This report and the financial statements contained herein are submitted for the general information of the shareholders of Wells Fargo Advantage Funds. If this report is used for promotional purposes, distribution of the report must be accompanied or preceded by a current prospectus. For a prospectus containing more complete information, including charges and expenses, call 1-800-222-8222 or visit the Fund’s Web site at www.wellsfargo.com/advantagefunds. Please consider the investment objectives, risks, charges, and expenses of the investment carefully before investing. This and other information about Wells Fargo Advantage Funds can be found in the current prospectus. Read the prospectus carefully before you invest or send money.
Wells Fargo Funds Management, LLC, a wholly owned subsidiary of Wells Fargo & Company, provides investment advisory and administrative services for Wells Fargo Advantage Funds. Other affiliates of Wells Fargo & Company provide subadvisory and other services for the Funds. The Funds are distributed by Wells Fargo Funds Distributor, LLC, Member FINRA/SIPC, an affiliate of Wells Fargo & Company.
NOT FDIC INSURED ¡ NO BANK GUARANTEE ¡ MAY LOSE VALUE
© 2012 Wells Fargo Funds Management, LLC. All rights reserved.
| | |
 | | 207592 02-12 SA258/SAR258 12-11 |

Wells Fargo Advantage
Wisconsin Tax-Free Fund

Semi-Annual Report
December 31, 2011

Reduce clutter. Save trees.
Sign up for electronic delivery of prospectuses and shareholder reports at www.wellsfargo.com/advantagedelivery
Contents
The views expressed and any forward-looking statements are as of December 31, 2011, unless otherwise noted, and are those of the Fund managers and/or Wells Fargo Funds Management, LLC. Discussions of individual securities, or the markets generally, or any Wells Fargo Advantage Fund are not intended as individual recommendations. Future events or results may vary significantly from those expressed in any forward-looking statements; the views expressed are subject to change at any time in response to changing circumstances in the market. Wells Fargo Funds Management, LLC, disclaims any obligation to publicly update or revise any views expressed or forward-looking statements.
NOT FDIC INSURED ¡ NO BANK GUARANTEE ¡ MAY LOSE VALUE

WELLS FARGO INVESTMENT HISTORY
| | |
| |
| 1932 | | Keystone creates one of the first mutual fund families. |
| |
| 1971 | | Wells Fargo & Company introduces one of the first institutional index funds. |
| |
| 1978 | | Wells Fargo applies Markowitz and Sharpe’s research on Modern Portfolio Theory to introduce one of the industry’s first Tactical Asset Allocation (TAA) models in institutional separately managed accounts. |
| |
| 1984 | | Wells Fargo Stagecoach Funds launches its first asset allocation fund. |
| |
| 1989 | | The Tactical Asset Allocation (TAA) Model is first applied to Wells Fargo’s asset allocation mutual funds. |
| |
| 1994 | | Wells Fargo introduces the LifePath Funds, one of the first suites of target date funds (now the Wells Fargo Advantage Dow Jones Target Date FundsSM ). |
| |
| 1996 | | Evergreen Investments and Keystone Funds merge. |
| |
| 1997 | | Wells Fargo launches Wells Fargo Advantage WealthBuilder PortfoliosSM, a fund-of-funds suite of products that includes the use of quantitative models to shift assets among investment styles. |
| |
| 1999 | | Norwest Advantage Funds and Stagecoach Funds are reorganized into Wells Fargo Funds after the merger of Norwest and Wells Fargo. |
| |
| 2002 | | Evergreen Retail and Evergreen Institutional companies form the umbrella asset management company, Evergreen Investments. |
| |
| 2005 | | The integration of Strong Funds with Wells Fargo Funds creates Wells Fargo Advantage Funds, resulting in one of the top 20 mutual fund companies in the United States. |
| |
| 2006 | | Wells Fargo Advantage Funds relaunches the target date product line as Wells Fargo Advantage Dow Jones Target Date Funds. |
| |
| 2010 | | The mergers and reorganizations of Evergreen and Wells Fargo Advantage mutual funds are completed, unifying the families under the brand of Wells Fargo Advantage Funds. |
Wells Fargo Advantage Funds®
Wells Fargo Advantage Funds skillfully guides institutions, financial advisors, and individuals through the investment terrain to help them reach their financial objectives. Everything we do on behalf of investors is backed by our unique combination of qualifications.
Strength
Our organization is built on the standards of integrity and service established by our parent company—Wells Fargo & Company—more than 150 years ago. And, because we’re part of a highly diversified financial enterprise, we offer the depth of resources to help investors succeed.
Expertise
Our multi-boutique model offers investors access to the independent thinking of premier investment managers that have been chosen for their time-tested strategies. While each team specializes in a specific investment strategy, collectively they provide investors a wide choice of distinct investment styles. Our dedication to investment excellence doesn’t end with our expertise in manager selection—risk management, analysis, and rigorous ongoing review seek to ensure each manager’s investment process remains consistent.
Partnership
Our collaborative approach is built around understanding the needs and goals of our clients. By adhering to core principles of sound judgment and steady guidance, we support you through every stage of the investment decision process.
Carefully consider a fund’s investment objectives, risks, charges, and expenses before investing. For a current prospectus and, if available, a summary prospectus, containing this and other information, visit wellsfargo.com/advantagefunds. Read it carefully before investing.
Wells Fargo Funds Management, LLC, a wholly owned subsidiary of Wells Fargo & Company, provides investment advisory and administrative services for Wells Fargo Advantage Funds®. Other affiliates of Wells Fargo & Company provide subadvisory and other services for the Funds. The Funds are distributed by Wells Fargo Funds Distributor, LLC, Member FINRA/SIPC, an affiliate of Wells Fargo & Company.
“Dow Jones®” and “Dow Jones Target Date IndexesSM” are service marks of Dow Jones Trademark Holdings, LLC (“Dow Jones”), have been licensed to CME Group Index Services LLC (“CME Indexes”) and have been sublicensed for use for certain purposes by Global Index Advisors, Inc, and Wells Fargo Funds Management, LLC. The Wells Fargo Advantage Dow Jones Target Date FundsSM based on the Dow Jones Target Date IndexesSM, are not sponsored, endorsed, sold or promoted by Dow Jones, CME Indexes or their respective affiliates and none of them makes any representation regarding the advisability of investing in such product(s).
NOT FDIC INSURED ¡ NO BANK GUARANTEE ¡ MAY LOSE VALUE
Not part of the semi-annual report.
Wells Fargo Advantage Funds offers more than 110 mutual funds across a wide range of asset classes, representing over $216 billion in assets under management, as of December 31, 2011.
| | | | |
| Equity Funds | | | | |
Asia Pacific Fund | | Global Opportunities Fund | | Premier Large Company Growth Fund |
C&B Large Cap Value Fund | | Growth Fund | | Small Cap Opportunities Fund |
C&B Mid Cap Value Fund | | Health Care Fund | | Small Cap Value Fund |
Capital Growth Fund | | Index Fund | | Small Company Growth Fund |
Common Stock Fund | | International Equity Fund | | Small Company Value Fund |
Disciplined U.S. Core Fund | | International Value Fund | | Small/Mid Cap Core Fund |
Discovery Fund† | | Intrinsic Small Cap Value Fund | | Small/Mid Cap Value Fund |
Diversified Equity Fund | | Intrinsic Value Fund | | Social Sustainability Fund† |
Diversified International Fund | | Intrinsic World Equity Fund | | Special Mid Cap Value Fund |
Diversified Small Cap Fund | | Large Cap Core Fund | | Special Small Cap Value Fund |
Emerging Growth Fund | | Large Cap Growth Fund | | Specialized Technology Fund |
Emerging Markets Equity Fund | | Large Company Value Fund | | Strategic Large Cap Growth Fund |
Endeavor Select Fund† | | Omega Growth Fund | | Traditional Small Cap Growth Fund |
Enterprise Fund† | | Opportunity Fund† | | Utility and Telecommunications Fund |
Equity Value Fund | | Precious Metals Fund | | |
| Bond Funds | | | | |
Adjustable Rate Government Fund | | Inflation-Protected Bond Fund | | Short-Term Bond Fund |
California Limited-Term Tax-Free Fund | | Intermediate Tax/AMT-Free Fund | | Short-Term High Yield Bond Fund |
California Tax-Free Fund | | International Bond Fund | | Short-Term Municipal Bond Fund |
Colorado Tax-Free Fund | | Minnesota Tax-Free Fund | | Strategic Municipal Bond Fund |
Government Securities Fund | | Municipal Bond Fund | | Total Return Bond Fund |
High Income Fund | | North Carolina Tax-Free Fund | | Ultra Short-Term Income Fund |
High Yield Bond Fund | | Pennsylvania Tax-Free Fund | | Ultra Short-Term Municipal Income Fund |
Income Plus Fund | | Short Duration Government Bond Fund | | Wisconsin Tax-Free Fund |
| Asset Allocation Funds | | | | |
Asset Allocation Fund | | WealthBuilder Equity Portfolio† | | Target 2020 Fund† |
Conservative Allocation Fund | | WealthBuilder Growth Allocation Portfolio† | | Target 2025 Fund† |
Diversified Capital Builder Fund | | WealthBuilder Growth Balanced Portfolio† | | Target 2030 Fund† |
Diversified Income Builder Fund | | WealthBuilder Moderate Balanced Portfolio† | | Target 2035 Fund† |
Growth Balanced Fund | | WealthBuilder Tactical Equity Portfolio† | | Target 2040 Fund† |
Index Asset Allocation Fund | | Target Today Fund† | | Target 2045 Fund† |
Moderate Balanced Fund | | Target 2010 Fund† | | Target 2050 Fund† |
WealthBuilder Conservative Allocation Portfolio† | | Target 2015 Fund† | | Target 2055 Fund† |
| Money Market Funds | | | | |
100% Treasury Money Market Fund | | Heritage Money Market Fund† | | National Tax-Free Money Market Fund |
California Municipal Money Market Fund | | Money Market Fund | | Prime Investment Money Market Fund |
Cash Investment Money Market Fund | | Municipal Cash Management Money Market Fund | | Treasury Plus Money Market Fund |
Government Money Market Fund | | Municipal Money Market Fund | | |
| Variable Trust Funds1 | | | | |
VT Discovery Fund† | | VT Intrinsic Value Fund | | VT Small Cap Growth Fund |
VT Index Asset Allocation Fund | | VT Omega Growth Fund | | VT Small Cap Value Fund |
VT International Equity Fund | | VT Opportunity Fund† | | VT Total Return Bond Fund |
An investment in a money market fund is not insured or guaranteed by the Federal Deposit Insurance Corporation or any other government agency. Although the Wells Fargo Advantage Money Market Funds seek to preserve the value of your investment at $1.00 per share, it is possible to lose money by investing in a money market fund.
| 1. | The Variable Trust Funds are generally available only through insurance company variable contracts. |
| † | In this report, the Wells Fargo Advantage Discovery FundSM, Wells Fargo Advantage Endeavor Select FundSM, Wells Fargo Advantage Enterprise FundSM, Wells Fargo Advantage Opportunity FundSM, Wells Fargo Advantage Social Sustainability FundSM, Wells Fargo Advantage WealthBuilder Conservative Allocation PortfolioSM, Wells Fargo Advantage WealthBuilder Equity PortfolioSM, Wells Fargo Advantage WealthBuilder Growth Allocation PortfolioSM, Wells Fargo Advantage WealthBuilder Growth Balanced PortfolioSM, Wells Fargo Advantage WealthBuilder Moderate Balanced PortfolioSM, Wells Fargo Advantage WealthBuilder Tactical Equity PortfolioSM, Wells Fargo Advantage Dow Jones Target Today FundSM, Wells Fargo Advantage Dow Jones Target 2010 FundSM, Wells Fargo Advantage Dow Jones Target 2015 FundSM, Wells Fargo Advantage Dow Jones Target 2020 FundSM, Wells Fargo Advantage Dow Jones Target 2025 FundSM, Wells Fargo Advantage Dow Jones Target 2030 FundSM, Wells Fargo Advantage Dow Jones Target 2035 FundSM, Wells Fargo Advantage Dow Jones Target 2040 FundSM, Wells Fargo Advantage Dow Jones Target 2045 FundSM, Wells Fargo Advantage Dow Jones Target 2050 FundSM, Wells Fargo Advantage Dow Jones Target 2055 FundSM, Wells Fargo Advantage Heritage Money Market FundSM, Wells Fargo Advantage VT Discovery FundSM, and Wells Fargo Advantage VT Opportunity FundSM are referred to as the Discovery Fund, Endeavor Select Fund, Enterprise Fund, Opportunity Fund, Social Sustainability Fund, WealthBuilder Conservative Allocation Portfolio, WealthBuilder Equity Portfolio, WealthBuilder Growth Allocation Portfolio, WealthBuilder Growth Balanced Portfolio, WealthBuilder Moderate Balanced Portfolio, WealthBuilder Tactical Equity Portfolio, Target Today Fund, Target 2010 Fund, Target 2015 Fund, Target 2020 Fund, Target 2025 Fund, Target 2030 Fund, Target 2035 Fund, Target 2040 Fund, Target 2045 Fund, Target 2050 Fund, Target 2055 Fund, Heritage Money Market Fund, VT Discovery Fund, and VT Opportunity Fund, respectively. |
Not part of the semi-annual report.
| | | | |
| 2 | | Wells Fargo Advantage Wisconsin Tax-Free Fund | | Letter to Shareholders |

Karla M. Rabusch,
President
Wells Fargo Advantage Funds
For the entire six-month period, most of the major fixed-income indexes posted solid positive returns. However, the market’s six-month return figures mask the uneven path that the financial markets traced since the summer as investors had to contend with a variety of global and domestic headwinds.
Dear Valued Shareholder:
We’re pleased to offer you this semi-annual report for the Wells Fargo Advantage Wisconsin Tax-Free Fund for the six-month period that ended December 31, 2011. Upon reviewing the report, you may notice a few changes from past reports, the most significant of which is the change from a multi-fund report to a single-fund report. We made this change to make it easier for you to find your fund information.
For the entire six-month period, most of the major fixed-income indexes posted solid positive returns. However, the market’s six-month return figures mask the uneven path that the financial markets traced since the summer as investors had to contend with a variety of global and domestic headwinds. Whatever the future holds, we continue to believe that most investors can benefit from adhering to a well-diversified investment strategy. Over the long-term, such a strategy may allow you to balance risks and opportunities as you pursue your financial goals in a dynamic market landscape.
The economic recovery gained traction as the year progressed.
The U.S. economic recovery that began in mid-2009 has experienced a few slow patches along the way. However, the recovery regained some upward momentum during the six-month period, yet the rate of growth remained subpar compared with most previous recovery cycles.
In September 2011, it was reported that U.S. gross domestic product (GDP) grew at a mere 1.3% annual rate in the second quarter of 2011, following anemic growth at an annual rate of 0.4% in the first quarter. According to the December estimate, GDP growth accelerated to an annual rate of 1.8% in the third quarter, reigniting hopes for a sustainable recovery. Those hopes were buoyed by widespread anticipation of even stronger GDP growth in the fourth quarter. By year-end, few economists believed that the U.S. economy was in danger of sliding back into recession, although many expected a sluggish growth environment in 2012.
The struggling housing and labor markets slowed growth.
As has been the case throughout the recovery, the housing and labor markets continued to restrain economic momentum during 2011.
The beleaguered housing market has arguably exerted the biggest drag on growth. Despite intermittent signs of improvement, ongoing weakness in sales of both new and existing homes has put considerable downward pressure on prices. On the other hand, the labor market took a decided turn for the better during the final months of 2011: initial unemployment claims have eased, and the private sector has been steadily adding jobs. The pace of hiring, while not brisk, was sufficient to push the U.S. unemployment rate down to 8.5% as of December 2011—still well above its historical average but at its lowest level since February 2009. Many observers expect the unemployment rate to decline further in 2012, which could act as a tailwind for consumer spending—widely viewed as one of the keys to long-term economic growth.
The Federal Reserve announced that it will keep rates low until 2013.
Consumers have already demonstrated some resilience in their spending—even in the face of higher energy costs. Oil prices skyrocketed in early 2011 before
| | | | | | |
| Letter to Shareholders | | Wells Fargo Advantage Wisconsin Tax-Free Fund | | | 3 | |
retreating later in the year, only to spike again during the fourth quarter. Yet “core” inflation, which excludes volatile energy and food prices, remained fairly benign throughout the year.
With inflation in check, the Federal Reserve (Fed) held its target range for the federal funds rate—a proxy for short-term interest rates—steady at 0% to 0.25%. Following its August 9, 2011 meeting, the Federal Open Market Committee issued a statement explaining that economic conditions were likely to warrant exceptionally low levels for the federal funds rate through at least mid-2013. In September, the Fed launched yet another stimulus program—dubbed “Operation Twist”—that is designed to keep intermediate- and longer-term yields relatively low. The goal with keeping longer-term rates low is to encourage lending activity to spark business investments and home purchases, which, in turn, may provide support for a more sustainable economic recovery.
Market volatility was a dominant theme during the final six-months of the year
Early on in the period, market climate shifted to one of anxiety over the increasingly fragile state of the U.S. and global economies. In addition, investors not only worried that the U.S. might be on the brink of recession, they also feared that Europe’s sovereign debt problems could spiral out of control if a Greek default triggered financial contagion across the continent. In July and August, investor sentiment was further undermined by partisan wrangling over the federal debt ceiling and the downgrade of the U.S. credit rating by Standard & Poor’s. The barrage of unsettling headlines led to heightened market volatility and an increase in risk aversion, which translated into sharply falling stock prices and higher demand for “safer” assets such as Treasuries and municipals in the third quarter of 2011. Although volatility persisted into the fourth quarter, the financial markets were able to rebound amid improved U.S. economic data and hopes for a resolution to the European crisis.
For the entire six-month period, the Barclays Capital U.S. Aggregate Bond Index1, which represents the universe of investment-grade bonds, and the Barclays Capital U.S. Treasury Index2 added 4.98% and 7.43%, respectively. By comparison, the Barclays Capital Municipal Bond Index3 gained 6.02% over the last half of the year
Recent events have not altered our message to shareholders.
The market turmoil of 2011 and an uncertain outlook going forward have left many investors questioning their resolve—and their investments. Yet, it is precisely at such times that the market may present opportunities—as well as challenges—for prudent investors. Bear in mind that many investors who indiscriminately sold their equity investments during the severe market downturn of 2008 to 2009 missed out on the impressive two-year rally that followed. In our
| 1. | The Barclays Capital U.S. Aggregate Bond Index is composed of the Barclays Capital Government/Credit Index and the Mortgage-Backed Securities Index and includes U.S. Treasury issues, agency issues, corporate bond issues, and mortgage-backed securities. You cannot invest directly in an index. |
| 2. | The Barclays Capital U.S. Treasury Index is an index of U.S. Treasury Securities. You cannot invest directly in an index. |
| 3. | The Barclays Capital Municipal Bond Index is an unmanaged index composed of long-term tax-exempt bonds with a minimum credit rating of Baa. You cannot invest directly in an index. |
Although volatility persisted into the fourth quarter, the financial markets were able to rebound amid improved U.S. economic data and hopes for a resolution to the European crisis.
| | | | |
| 4 | | Wells Fargo Advantage Wisconsin Tax-Free Fund | | Letter to Shareholders |
opinion, the lesson to be learned from these dramatic market events is that, for many investors, simply building and maintaining a well-diversified4 investment plan is the best long-term strategy.
Thank you for choosing to invest with Wells Fargo Advantage Funds. We appreciate your confidence in us and remain committed to helping you meet your financial needs. For current information about your fund investments, contact your investment professional, visit our website at www.wellsfargo.com/advantagefunds, or call us directly at 1-800-222-8222. We are available 24 hours a day, 7 days a week.
Sincerely,

Karla M. Rabusch
President
Wells Fargo Advantage Funds
| 4. | Diversification does not assure or guarantee better performance and cannot eliminate the risk of investment losses. |
| | | | | | |
| Letter to Shareholders | | Wells Fargo Advantage Wisconsin Tax-Free Fund | | | 5 | |
|
|
Notice to Shareholders Effective April 1, 2012, the Fund may invest up to 10% of its total assets in inverse floaters to seek enhanced returns. Inverse floaters are derivative debt instruments created by depositing a municipal security in a trust. They pay interest at rates that generally vary inversely with specified short-term interest rates. The interest payment received on inverse floaters generally will decrease when specified short-term interest rates increase. Inverse floaters involve leverage, which may magnify the Fund’s gains or losses, and exhibit greater price and income volatility than bonds with similar maturities. We intend to limit leverage created by the Fund’s investment in inverse floaters to an amount equal to 10% of the Fund’s total assets. Inverse floaters are also subject to the risks associated with derivatives and municipal securities. |
|
|
Notice to Shareholders The Board of Trustees for Wells Fargo Advantage Funds has unanimously approved the following modifications to certain net asset value (NAV) waiver privileges and commission schedules: n Effective May 1, 2012, automatic investment plan (AIP) purchases and proceeds received from systematic withdrawals will no longer qualify for NAV repurchase privileges. n Effective May 1, 2012, discretionary rights to waive the upfront commission for Class C and “jumbo” Class A share purchases will no longer be granted to broker/dealers. However, we will continue to waive the Class C shares contingent deferred sales charge for redemptions by employer-sponsored retirement plans where the dealer of record waived its commission at the time of purchase. n Effective July 31, 2012, NAV purchase privileges for former Evergreen Class IS and Class R shareholders are being modified to remove the ability to purchase Class A shares at NAV unless those shares are held directly with the fund on or after July 31, 2012. |
| | | | |
| 6 | | Wells Fargo Advantage Wisconsin Tax-Free Fund | | Performance Highlights (Unaudited) |
INVESTMENT OBJECTIVE
The Fund seeks current income exempt from federal income tax and Wisconsin individual income tax.
ADVISER
Wells Fargo Funds Management, LLC
SUB-ADVISER
Wells Capital Management Incorporated
PORTFOLIO MANAGERS
Lyle J. Fitterer, CFA, CPA
Thomas Stoeckmann
FUND INCEPTION
April 6, 2001
|
CREDIT QUALITY1 (AS OF DECEMBER 31, 2011) |
|
 |
|
EFFECTIVE MATURITY DISTRIBUTION2 (AS OF DECEMBER 31, 2011) |
|
 |
| 1. | The ratings indicated are from Standard & Poor’s, Moody’s Investors Service, and/or Fitch Ratings Ltd. Credit Quality Ratings: Credit quality ratings apply to underlying holdings of the Fund and not the Fund itself. Standard and Poor’s rates the creditworthiness of bonds, ranging from AAA (highest) to D (lowest). Ratings from A to CCC may be modified by the addition of a plus (+) or minus (–) sign to show relative standing within the rating categories. Standard & Poor’s rates the creditworthiness of short-term notes from SP-1 (highest) to SP-3 (lowest). Ratings from A to CCC may be modified by the addition of a plus (+) or minus (–) sign to show relative standing within the rating categories. Moody’s rates the creditworthiness of bonds, ranging from Aaa (highest) to C (lowest). Ratings Aa to B may be modified by the addition of a number 1 (highest) to 3 (lowest) to show relative standing within the ratings categories. Moody’s rates the creditworthiness of short-term U.S. tax-exempt municipal securities from MIG 1/VMIG 1 (highest) to SG (lowest). Fitch rates the creditworthiness of bonds, ranging from AAA (highest) to D (lowest). If a security was rated by all three rating agencies, the middle rating was utilized. If rated by two of three rating agencies, the lower rating was utilized and if rated by one of the agencies that rating was utilized. Credit quality is subject to change and is calculated based on the total investments of the Fund. We generally define higher quality bonds as bonds that have a rating of BBB/Baa and above and lower quality bonds as bonds with a rating below BBB/Baa. |
| 2. | Effective maturity is calculated based on the total long-term investments of the Fund. It is subject to change and may have changed since the date specified. |
| | | | | | |
| Performance Highlights (Unaudited) | | Wells Fargo Advantage Wisconsin Tax-Free Fund | | | 7 | |
AVERAGE ANNUAL TOTAL RETURN3 (%) (AS OF DECEMBER 31, 2011)
| | | | | | | | | | | | | | | | | | | | | | | | | | | | | | | | | | | | | | | | | | | | |
| | | | | | Including Sales Charge | | | Excluding Sales Charge | | | Expense Ratios4 | |
| | | Inception Date | | | 6 Months* | | | 1 Year | | | 5 Year | | | 10 Year | | | 6 Months* | | | 1 Year | | | 5 Year | | | 10 Year | | | Gross | | | Net5 | |
Class A (WWTFX) | | | 03/31/2008 | | | | (0.40 | ) | | | 2.97 | | | | 3.50 | | | | 4.36 | | | | 4.27 | | | | 7.87 | | | | 4.46 | | | | 4.84 | | | | 0.92% | | | | 0.70% | |
Class C (WWTCX) | | | 12/26/2002 | | | | 2.87 | | | | 6.06 | | | | 3.65 | | | | 4.04 | | | | 3.87 | | | | 7.06 | | | | 3.65 | | | | 4.04 | | | | 1.67% | | | | 1.45% | |
Investor Class (SWFRX) | | | 04/06/2001 | | | | | | | | | | | | | | | | | | | | 4.25 | | | | 7.84 | | | | 4.42 | | | | 4.98 | | | | 0.95% | | | | 0.73% | |
Barclays Capital Municipal Bond Index6 | | | | | | | | | | | | | | | | | | | | | | | 6.02 | | | | 10.70 | | | | 5.22 | | | | 5.38 | | | | | | | | | |
Barclays Capital Wisconsin Municipal Bond Index7 | | | | | | | | | | | | | | | | | | | | | | | 5.36 | | | | 9.53 | | | | 5.67 | | | | 5.68 | | | | | | | | | |
| * | Returns for periods of less than one year are not annualized. |
Figures quoted represent past performance, which is no guarantee of future results and do not reflect the deduction of taxes that a shareholder may pay on fund distributions or the redemption of fund shares. Investment return and principal value of an investment will fluctuate so that an investor’s shares, when redeemed, may be worth more or less than their original cost. Performance shown without sales charges would be lower if sales charges were reflected. Current performance may be lower or higher than the performance data quoted and assumes the reinvestment of dividends and capital gains. Current month-end performance is available on the Fund’s Web site – www.wellsfargo.com/advantagefunds.
Index returns do not include transaction costs associated with buying and selling securities, any mutual fund fees or expenses or any taxes. It is not possible to invest directly in an index.
For Class A shares, the maximum front-end sales charge is 4.50%. For Class C shares, the maximum contingent deferred sales charge is 1.00%. Performance including sales charge assumes the sales charge for the corresponding time period. Investor Class shares are sold without a front-end sales charge or contingent deferred sales charge.
Bond fund values fluctuate in response to the financial condition of individual issuers, general market and economic conditions, and changes in interest rates. In general, when interest rates rise, bond fund values fall and investors may lose principal value. The use of derivatives may reduce returns and/or increase volatility. Certain investment strategies tend to increase the total risk of an investment (relative to the broader market). This Fund is exposed to Wisconsin and Puerto Rico municipal securities risk, and high-yield securities risk. Consult the Fund’s prospectus for additional information on these and other risks. A portion of the Fund’s income may be subject to federal, state, and/or local income taxes or the alternative minimum tax (AMT). Any capital gains distributions may be taxable.
| 3. | Historical performance shown for Class C shares prior to their inception reflects the performance of the Investor Class shares, adjusted to reflect the higher expenses applicable to Class C shares. Historical performance shown for Class A shares prior to their inception reflects the performance of the Investor Class shares, and includes the higher expenses applicable to the Investor Class shares (except during those periods in which expenses of Class A shares would have been higher than those of the Investor Class no such adjustment is reflected). If these expenses had not been included, returns would be higher. |
| 4. | Reflects the expense ratios as stated in the most recent prospectuses. |
| 5. | The Adviser has committed through October 31, 2012 to waive fees and/or reimburse expenses to the extent necessary to cap the Fund’s Total Annual Fund Operating Expenses After Fee Waiver, excluding certain expenses, at the amount showns above. Without this cap, the Fund’s returns would have been lower. |
| 6. | The Barclays Capital Municipal Bond Index is an unmanaged index composed of long-term tax-exempt bonds with a minimum credit rating of Baa. You cannot invest directly in an index. |
| 7. | The Barclays Capital Wisconsin Municipal Bond Index is the Wisconsin component of the Barclays Capital Municipal Bond Index. You cannot invest directly in an index. |
| | | | |
| 8 | | Wells Fargo Advantage Wisconsin Tax-Free Fund | | Fund Expenses (Unaudited) |
As a shareholder of the Fund, you incur two types of costs: (1) transaction costs, including sales charges (loads) on purchase payments and contingent deferred sales charges (if any) on redemptions and (2) ongoing costs, including management fees; distribution (12b-1) and/or shareholder service fees; and other Fund expenses. This example is intended to help you understand your ongoing costs (in dollars) of investing in the Fund and to compare these costs with the ongoing costs of investing in other mutual funds.
The example is based on an investment of $1,000 invested at the beginning of the six-month period and held for the entire period from July 1, 2011 to December 31, 2011.
Actual Expenses
The “Actual” line of the table below provides information about actual account values and actual expenses. You may use the information in this line, together with the amount you invested, to estimate the expenses that you paid over the period. Simply divide your account value by $1,000 (for example, an $8,600 account value divided by $1,000 = 8.6), then multiply the result by the number in the “Actual” line under the heading entitled “Expenses Paid During Period” for your applicable class of shares to estimate the expenses you paid on your account during this period.
Hypothetical Example for Comparison Purposes
The “Hypothetical” line of the table below provides information about hypothetical account values and hypothetical expenses based on the Fund’s actual expense ratio and an assumed rate of return of 5% per year before expenses, which is not the Fund’s actual return. The hypothetical account values and expenses may not be used to estimate the actual ending account balance or expenses you paid for the period. You may use this information to compare the ongoing costs of investing in the Fund and other funds. To do so, compare this 5% hypothetical example with the 5% hypothetical examples that appear in the shareholder reports of the other funds.
Please note that the expenses shown in the table are meant to highlight your ongoing costs only and do not reflect any transactional costs, such as sales charges (loads) and contingent deferred sales charges. Therefore, the “Hypothetical” line of the table is useful in comparing ongoing costs only, and will not help you determine the relative total costs of owning different funds. In addition, if these transactional costs were included, your costs would have been higher.
| | | | | | | | | | | | | | | | |
| | | Beginning
Account Value
07-01-2011 | | | Ending
Account Value
12-31-2011 | | | Expenses
Paid During
the Period1 | | | Net Annual
Expense Ratio | |
Class A | | | | | | | | | | | | | | | | |
Actual | | $ | 1,000.00 | | | $ | 1,042.65 | | | $ | 3.59 | | | | 0.70 | % |
Hypothetical (5% return before expenses) | | $ | 1,000.00 | | | $ | 1,021.62 | | | $ | 3.56 | | | | 0.70 | % |
Class C | | | | | | | | | | | | | | | | |
Actual | | $ | 1,000.00 | | | $ | 1,038.74 | | | $ | 7.43 | | | | 1.45 | % |
Hypothetical (5% return before expenses) | | $ | 1,000.00 | | | $ | 1,017.85 | | | $ | 7.35 | | | | 1.45 | % |
Investor Class | | | | | | | | | | | | | | | | |
Actual | | $ | 1,000.00 | | | $ | 1,042.50 | | | $ | 3.75 | | | | 0.73 | % |
Hypothetical (5% return before expenses) | | $ | 1,000.00 | | | $ | 1,021.47 | | | $ | 3.71 | | | | 0.73 | % |
| 1. | Expenses paid is equal to the annualized expense ratio of each class multiplied by the average account value over the period, multiplied by the number of days in the most recent fiscal half-year divided by the number of days in the fiscal year (to reflect the one-half year period). |
| | | | | | |
| Portfolio of Investments—December 31, 2011 (Unaudited) | | Wells Fargo Advantage Wisconsin Tax-Free Fund | | | 9 | |
| | | | | | | | | | | | | | | | |
| Security Name | | Interest Rate | | | Maturity Date | | | Principal | | | Value | |
| | | | | | | | | | | | | | | | |
| | | | |
Municipal Bonds and Notes: 96.52% | | | | | | | | | | | | | | | | |
| | | | |
| Guam: 7.50% | | | | | | | | | | | | | | | | |
Guam Government Business Privilege Series 2011A (Tax Revenue) | | | 5.25 | % | | | 01/01/2036 | | | $ | 2,000,000 | | | $ | 2,121,400 | |
Guam Government Hotel Occupancy Series A (Tax Revenue) | | | 6.50 | | | | 11/01/2040 | | | | 1,500,000 | | | | 1,641,495 | |
Guam Government Waterworks Authority (Water & Sewer Revenue) | | | 5.00 | | | | 07/01/2019 | | | | 650,000 | | | | 645,788 | |
Guam International Airport Authority Series B (Airport Revenue, NATL-RE Insured) | | | 5.25 | | | | 10/01/2016 | | | | 1,600,000 | | | | 1,664,800 | |
Guam International Airport Authority Series C (Airport Revenue, NATL-RE Insured) | | | 5.38 | | | | 10/01/2017 | | | | 500,000 | | | | 518,845 | |
Guam Limited Obligation Section 30 Series A (Miscellaneous Revenue) | | | 5.00 | | | | 12/01/2013 | | | | 500,000 | | | | 522,815 | |
Guam Limited Obligation Section 30 Series A (Miscellaneous Revenue) | | | 5.50 | | | | 12/01/2019 | | | | 1,000,000 | | | | 1,122,270 | |
Guam Power Authority Series A (Utilities Revenue, AMBAC Insured) | | | 5.00 | | | | 10/01/2018 | | | | 1,000,000 | | | | 992,300 | |
Guam Power Authority Series A (Utilities Revenue, AMBAC Insured) | | | 5.25 | | | | 10/01/2012 | | | | 1,000,000 | | | | 1,000,200 | |
Guam Power Authority Series A (Utilities Revenue, AMBAC Insured) | | | 5.25 | | | | 10/01/2013 | | | | 5,000 | | | | 5,000 | |
| | | | |
| | | | | | | | | | | | | | | 10,234,913 | |
| | | | | | | | | | | | | | | | |
| | | | |
| Puerto Rico: 32.28% | | | | | | | | | | | | | | | | |
Puerto Rico HFA Unrefunded Balance Capital Funding Program (Housing Revenue, HUD Loan Insured) | | | 5.00 | | | | 12/01/2015 | | | | 500,000 | | | | 532,335 | |
Puerto Rico HFA Unrefunded Balance Capital Funding Program (Housing Revenue, HUD Loan Insured) | | | 5.00 | | | | 12/01/2019 | | | | 335,000 | | | | 351,968 | |
Puerto Rico HFA Unrefunded Balance Capital Funding Program (Housing Revenue, HUD Loan Insured) | | | 5.00 | | | | 12/01/2020 | | | | 260,000 | | | | 272,888 | |
Children’s Trust Fund Puerto Rico Tobacco Settlement Asset-Backed Series 2002 (Tobacco Revenue) | | | 4.25 | | | | 05/15/2014 | | | | 500,000 | | | | 503,360 | |
Puerto Rico Aqueduct & Sewer Authority (Water & Sewer Revenue, NATL-RE-IBC Commonwealth Guaranty Insured) | | | 6.25 | | | | 07/01/2012 | | | | 25,000 | | | | 25,759 | |
Puerto Rico Commonwealth Highway & Transportation Authority Series DCL 008 (Transportation Revenue, Dexia Credit Local LOC, FSA Insured)±§ | | | 2.25 | | | | 07/01/2030 | | | | 800,000 | | | | 800,000 | |
Puerto Rico Commonwealth Highway & Transportation Authority Refunding Series L (Transportation Revenue, CIFC Insured) | | | 5.25 | | | | 07/01/2019 | | | | 1,000,000 | | | | 1,101,500 | |
Puerto Rico Commonwealth Highway & Transportation Authority Series A (Transportation Revenue, AMBAC Insured) | | | 5.50 | | | | 07/01/2013 | | | | 165,000 | | | | 173,951 | |
Puerto Rico Commonwealth Highway & Transportation Authority Series W (Transportation Revenue, AGM-CR Insured) | | | 5.50 | | | | 07/01/2013 | | | | 195,000 | | | | 203,740 | |
Puerto Rico Commonwealth Highway & Transportation Authority Series W (Transportation Revenue, NATL-RE-IBC Insured) | | | 5.50 | | | | 07/01/2013 | | | | 985,000 | | | | 1,029,148 | |
Puerto Rico Commonwealth Infrastructure Financing Authority Series C (Tax Revenue, AMBAC Insured) | | | 5.50 | | | | 07/01/2012 | | | | 2,500,000 | | | | 2,544,200 | |
Puerto Rico Commonwealth Public Imports Series A (Tax Revenue, AGM Insured) | | | 5.00 | | | | 07/01/2015 | | | | 1,750,000 | | | | 1,874,040 | |
Puerto Rico Commonwealth Public Improvement (Miscellaneous Revenue, AGM Insured) | | | 5.25 | | | | 07/01/2020 | | | | 100,000 | | | | 114,395 | |
Puerto Rico Commonwealth Refunding (Miscellaneous Revenue, FGIC Insured) | | | 5.50 | | | | 07/01/2013 | | | | 350,000 | | | | 368,988 | |
Puerto Rico Commonwealth Refunding Public Improvement Series A (Tax Revenue, NATL-RE Insured) | | | 5.50 | | | | 07/01/2016 | | | | 200,000 | | | | 220,868 | |
Puerto Rico Commonwealth Refunding Public Improvement Series A-AGC-ICC (Tax Revenue, Assured Guaranty Insured) | | | 5.50 | | | | 07/01/2018 | | | | 1,000,000 | | | | 1,140,990 | |
Puerto Rico Electric Power Authority MSTR Series SGC-57 Class A (Utilities Revenue, Societe Generale LOC, FSA Insured)±§ | | | 0.68 | | | | 07/01/2029 | | | | 5,000,000 | | | | 5,000,000 | |
Puerto Rico Electric Power Authority Series JJ (Utilities Revenue, XLCA Insured) | | | 5.25 | | | | 07/01/2012 | | | | 900,000 | | | | 919,062 | |
| | | | |
| 10 | | Wells Fargo Advantage Wisconsin Tax-Free Fund | | Portfolio of Investments—December 31, 2011 (Unaudited) |
| | | | | | | | | | | | | | | | |
| Security Name | | Interest Rate | | | Maturity Date | | | Principal | | | Value | |
| | | | | | | | | | | | | | | | |
| | | | |
| Puerto Rico (continued) | | | | | | | | | | | | | | | | |
Puerto Rico Electric Power Authority Series OO (Utilities Revenue, CIFC Assured Guaranty Insured) | | | 5.00 | % | | | 07/01/2013 | | | $ | 650,000 | | | $ | 683,495 | |
Puerto Rico Electric Power Authority Series UU (Utilities Revenue, AGM Insured)± | | | 0.77 | | | | 07/01/2029 | | | | 2,500,000 | | | | 1,622,125 | |
Puerto Rico Electric Power Authority Series WW (Utilities Revenue) | | | 5.25 | | | | 07/01/2033 | | | | 500,000 | | | | 511,600 | |
Puerto Rico HFA Sub-Capital Fund Modernization (Housing Revenue) | | | 5.13 | | | | 12/01/2027 | | | | 4,120,000 | | | | 4,377,129 | |
Puerto Rico HFA Sub-Capital Fund Modernization (Housing Revenue) | | | 5.50 | | | | 12/01/2018 | | | | 500,000 | | | | 576,085 | |
Puerto Rico HFA Unrefunded Balance Capital Funding Program (Housing Revenue, HUD Loan Insured) | | | 5.00 | | | | 12/01/2014 | | | | 265,000 | | | | 283,338 | |
Puerto Rico Highway & Transportation Authority Prerefunded Series W (Tax Revenue, NATL-RE-IBC Insured) | | | 5.50 | | | | 07/01/2015 | | | | 1,270,000 | | | | 1,437,259 | |
Puerto Rico Highway & Transportation Authority Series DCL-007 (Tax Revenue, Dexia Credit Local LOC, FSA Insured)§ | | | 2.25 | | | | 01/01/2028 | | | | 4,235,000 | | | | 4,235,000 | |
Puerto Rico Highway & Transportation Authority Unrefunded Series W (Tax Revenue) | | | 5.50 | | | | 07/01/2015 | | | | 525,000 | | | | 574,156 | |
Puerto Rico Industrial Tourist Educational Medical & Environmental Control Facilities Financing Authority Guaynabo Municipal Government Center Series A (IDR) | | | 5.63 | | | | 07/01/2022 | | | | 750,000 | | | | 751,373 | |
Puerto Rico Industrial Tourist Educational Medical & Environmental Control Facilities Financing Authority Hospital De La Concepcion Series A (Health Revenue) | | | 6.50 | | | | 11/15/2020 | | | | 25,000 | | | | 25,096 | |
Puerto Rico Industrial Tourist Educational Medical & Environmental Control Facilities University Plaza Project Series A (Education Revenue, NATL-RE Insured) | | | 5.63 | | | | 07/01/2013 | | | | 600,000 | | | | 610,218 | |
Puerto Rico Municipal Finance Agency Series B (Tax Revenue, CIFC Insured) | | | 5.25 | | | | 07/01/2017 | | | | 105,000 | | | | 116,005 | |
Puerto Rico Public Buildings Authority Government Facilities Prerefunded Series D (Lease Revenue, Commonwealth Guaranty Insured) | | | 5.13 | | | | 07/01/2024 | | | | 30,000 | | | | 30,728 | |
Puerto Rico Public Buildings Authority Government Facilities Unrefunded Balance Series D (Lease Revenue, Commonwealth Guaranty Insured) | | | 5.13 | | | | 07/01/2024 | | | | 10,000 | | | | 10,019 | |
Puerto Rico Public Buildings Authority Prerefunded CAB Series D Step Bond (Lease Revenue, AMBAC Insured)§ | | | 0.00 | | | | 07/01/2030 | | | | 1,465,000 | | | | 1,691,592 | |
Puerto Rico Public Finance Corporation Commonwealth Appropriation Series A (Miscellaneous Revenue, AMBAC Insured) | | | 5.13 | | | | 06/01/2024 | | | | 3,265,000 | | | | 3,890,084 | |
Puerto Rico Public Improvement Series A (Tax Revenue, NATL-RE Insured) | | | 6.25 | | | | 07/01/2013 | | | | 1,200,000 | | | | 1,278,384 | |
Puerto Rico Sales Tax Financing Corporation First Subseries A (Tax Revenue) | | | 4.63 | | | | 08/01/2019 | | | | 200,000 | | | | 229,064 | |
Puerto Rico Sales Tax Financing Corporation First Subseries A (Tax Revenue) | | | 6.38 | | | | 08/01/2039 | | | | 2,000,000 | | | | 2,270,280 | |
University of Puerto Rico Series P (Education Revenue) | | | 5.00 | | | | 06/01/2017 | | | | 1,085,000 | | | | 1,154,136 | |
University of Puerto Rico Series Q (Education Revenue) | | | 5.00 | | | | 06/01/2016 | | | | 500,000 | | | | 533,635 | |
| | | | |
| | | | | | | | | | | | | | | 44,067,993 | |
| | | | | | | | | | | | | | | | |
| | | | |
| Virgin Islands: 7.24% | | | | | | | | | | | | | | | | |
Virgin Islands PFA (Tax Revenue, NATL-RE FGIC Insured) | | | 5.00 | | | | 10/01/2014 | | | | 400,000 | | | | 426,536 | |
Virgin Islands PFA (Miscellaneous Revenue, AGM Insured) | | | 5.00 | | | | 10/01/2014 | | | | 590,000 | | | | 647,655 | |
Virgin Islands PFA (Tax Revenue, NATL-RE FGIC Insured) | | | 5.00 | | | | 10/01/2016 | | | | 250,000 | | | | 275,148 | |
Virgin Islands PFA Escrowed to Maturity Series A (Miscellaneous Revenue) | | | 7.30 | | | | 10/01/2018 | | | | 10,000 | | | | 12,359 | |
Virgin Islands PFA Gross Tax Receipts (Tax Revenue, NATL-RE FGIC Insured) | | | 5.00 | | | | 10/01/2012 | | | | 250,000 | | | | 255,790 | |
Virgin Islands PFA Matching Fund Loan Notes Diageo Series A (Miscellaneous Revenue) | | | 6.75 | | | | 10/01/2037 | | | | 1,850,000 | | | | 2,014,613 | |
Virgin Islands PFA Senior Lien Capital Projects Series A-1 (Tobacco Revenue) | | | 3.00 | | | | 10/01/2013 | | | | 500,000 | | | | 507,005 | |
Virgin Islands PFA Senior Lien Series A (Water & Sewer Revenue) | | | 5.25 | | | | 10/01/2019 | | | | 2,700,000 | | | | 2,835,864 | |
Virgin Islands PFA Sub-Matching Fund Loan Notes Series A (Miscellaneous Revenue) | | | 6.00 | | | | 10/01/2039 | | | | 1,000,000 | | | | 1,041,350 | |
| | | | | | |
| Portfolio of Investments—December 31, 2011 (Unaudited) | | Wells Fargo Advantage Wisconsin Tax-Free Fund | | | 11 | |
| | | | | | | | | | | | | | | | |
| Security Name | | Interest Rate | | | Maturity Date | | | Principal | | | Value | |
| | | | | | | | | | | | | | | | |
| | | | |
| Virgin Islands (continued) | | | | | | | | | | | | | | | | |
Virgin Islands Tobacco Settlement Financing Corporation Asset Backed Bonds (Tobacco Revenue)± | | | 4.95 | % | | | 05/15/2014 | | | $ | 750,000 | | | $ | 751,538 | |
Virgin Islands Water & Power Authority Series A (Utilities Revenue) | | | 5.00 | | | | 07/01/2018 | | | | 1,000,000 | | | | 1,110,190 | |
| | | | |
| | | | | | | | | | | | | | | 9,878,048 | |
| | | | | | | | | | | | | | | | |
| | | | |
| West Virginia: 0.30% | | | | | | | | | | | | | | | | |
Kanawha Mercer Nicholas Counties WV Single Family Prerefunded (Housing Revenue)(z) | | | 4.03 | | | | 02/01/2015 | | | | 470,000 | | | | 415,264 | |
| | | | | | | | | | | | | | | | |
| | | | |
| Wisconsin: 49.20% | | | | | | | | | | | | | | | | |
Ashwaubenon WI CDA Arena Project (Lease Revenue) | | | 4.80 | | | | 06/01/2016 | | | | 20,000 | | | | 20,312 | |
Ashwaubenon WI CDA Arena Project (Lease Revenue) | | | 5.05 | | | | 06/01/2019 | | | | 100,000 | | | | 101,708 | |
Ashwaubenon WI CDA Arena Project (Lease Revenue) | | | 5.10 | | | | 06/01/2020 | | | | 815,000 | | | | 829,091 | |
Brown County WI Housing Authority University Village Housing Incorporated Project Series B (Education Revenue) | | | 4.20 | | | | 04/01/2012 | | | | 50,000 | | | | 50,119 | |
Brown County WI Housing Authority University Village Housing Incorporated Project Series B (Education Revenue) | | | 4.50 | | | | 04/01/2014 | | | | 100,000 | | | | 100,211 | |
Cudahy WI CDA Redevelopment Refunding Series B (Lease Revenue) | | | 4.55 | | | | 06/01/2019 | | | | 1,540,000 | | | | 1,582,843 | |
Delafield WI CDA St. Johns Northwestern Military (Education Revenue, Town Bank LOC) | | | 4.60 | | | | 06/01/2030 | | | | 660,000 | | | | 722,403 | |
Delafield WI CDA St. Johns Northwestern Military (Education Revenue, Town Bank LOC) | | | 4.70 | | | | 06/01/2034 | | | | 500,000 | | | | 543,870 | |
Glendale WI CDA Bayshore Public Parking-A (Transportation Revenue) | | | 4.75 | | | | 10/01/2020 | | | | 100,000 | | | | 106,344 | |
Glendale WI CDA Series 2011A (Lease Revenue) | | | 3.50 | | | | 10/01/2017 | | | | 1,635,000 | | | | 1,778,749 | |
Glendale WI CDA Series 2011A (Lease Revenue) | | | 3.50 | | | | 10/01/2018 | | | | 1,700,000 | | | | 1,852,660 | |
Green Bay WI Housing Authority University Student Village Housing (Education Revenue) | | | 3.50 | | | | 04/01/2013 | | | | 225,000 | | | | 230,193 | |
Green Bay WI Housing Authority University Student Village Housing (Education Revenue) | | | 5.00 | | | | 04/01/2016 | | | | 1,445,000 | | | | 1,568,678 | |
Green Bay WI Housing Authority University Student Village Housing (Education Revenue) | | | 5.00 | | | | 04/01/2030 | | | | 1,235,000 | | | | 1,327,625 | |
Green Bay WI Housing Authority University Village Housing Project Series 2009 (Housing Revenue) | | | 4.38 | | | | 04/01/2022 | | | | 100,000 | | | | 109,734 | |
Green Bay WI RDA Bellin Memorial Hospital (Health Revenue) | | | 5.50 | | | | 12/01/2023 | | | | 250,000 | | | | 272,070 | |
Green Bay WI RDA Bellin Memorial Hospital Series A (Health Revenue) | | | 5.00 | | | | 02/15/2013 | | | | 20,000 | | | | 20,119 | |
Green Bay WI RDA Bellin Memorial Hospital Series A (Health Revenue) | | | 5.50 | | | | 02/15/2021 | | | | 10,000 | | | | 10,066 | |
Green Bay WI RDA Pine Street Parking Ramp Project (Lease Revenue) | | | 1.50 | | | | 04/01/2012 | | | | 100,000 | | | | 100,302 | |
Green Bay WI RDA Pine Street Parking Ramp Project (Lease Revenue) | | | 2.10 | | | | 04/01/2014 | | | | 320,000 | | | | 329,558 | |
Green Bay WI RDA Pine Street Parking Ramp Project (Lease Revenue) | | | 2.50 | | | | 04/01/2015 | | | | 125,000 | | | | 131,080 | |
Green Bay WI RDA Pine Street Parking Ramp Project (Lease Revenue) | | | 2.70 | | | | 04/01/2016 | | | | 405,000 | | | | 430,596 | |
Greenfield WI CDA Layton Terrace Project (Housing Revenue)±§ | | | 4.75 | | | | 09/01/2033 | | | | 500,000 | | | | 500,165 | |
Little Chute WI CDA (Lease Revenue) | | | 4.25 | | | | 03/01/2017 | | | | 200,000 | | | | 209,272 | |
Little Chute WI CDA (Lease Revenue) | | | 4.35 | | | | 03/01/2018 | | | | 200,000 | | | | 209,152 | |
Madison WI CDA Wisconsin Alumni Research Foundation (Education Revenue) | | | 5.00 | | | | 10/01/2039 | | | | 5,000,000 | | | | 5,469,600 | |
Milwaukee WI Housing Authority Veterans Housing Project (Housing Revenue, FNMA Insured) | | | 5.10 | | | | 07/01/2022 | | | | 1,000,000 | | | | 1,020,920 | |
Milwaukee WI RDA Milwaukee School Engineering Project Series B (Education Revenue, Marshall & Ilsley Bank LOC) | | | 5.05 | | | | 07/01/2019 | | | | 470,000 | | | | 479,414 | |
Milwaukee WI RDA Milwaukee School Engineering Project Series B (Education Revenue, Marshall & Ilsley Bank LOC) | | | 5.15 | | | | 07/01/2020 | | | | 470,000 | | | | 479,146 | |
| | | | |
| 12 | | Wells Fargo Advantage Wisconsin Tax-Free Fund | | Portfolio of Investments—December 31, 2011 (Unaudited) |
| | | | | | | | | | | | | | | | |
| Security Name | | Interest Rate | | | Maturity Date | | | Principal | | | Value | |
| | | | | | | | | | | | | | | | |
| | | | |
| Wisconsin (continued) | | | | | | | | | | | | | | | | |
Milwaukee WI RDA Milwaukee School Engineering Project Series B (Education Revenue, Marshall & Ilsley Bank LOC) | | | 5.20 | % | | | 07/01/2021 | | | $ | 470,000 | | | $ | 478,860 | |
Milwaukee WI RDA Milwaukee School Engineering Project Series B (Education Revenue, Marshall & Ilsley Bank LOC) | | | 5.30 | | | | 07/01/2022 | | | | 470,000 | | | | 478,643 | |
Milwaukee WI RDA Milwaukee School Engineering Project Series B (Education Revenue, Marshall & Ilsley Bank LOC) | | | 5.35 | | | | 07/01/2023 | | | | 470,000 | | | | 478,559 | |
Milwaukee WI RDA Public Neighborhood Schools Series A (Miscellaneous Revenue, AMBAC Insured) | | | 4.20 | | | | 08/01/2012 | | | | 100,000 | | | | 102,104 | |
Milwaukee WI RDA Public Schools (Miscellaneous Revenue, AMBAC Moral Obligation Insured) | | | 3.80 | | | | 08/01/2014 | | | | 50,000 | | | | 52,050 | |
Milwaukee WI RDA Public Schools (Miscellaneous Revenue, AMBAC Moral Obligation Insured) | | | 4.25 | | | | 08/01/2019 | | | | 550,000 | | | | 569,168 | |
Milwaukee WI RDA Science Education Consortium Project Series A (Miscellaneous Revenue) | | | 5.13 | | | | 08/01/2015 | | | | 615,000 | | | | 615,185 | |
Milwaukee WI RDA Science Education Consortium Project Series A (Miscellaneous Revenue) | | | 5.63 | | | | 08/01/2025 | | | | 300,000 | | | | 288,018 | |
Milwaukee WI RDA Science Education Consortium Project Series A (Miscellaneous Revenue) | | | 5.75 | | | | 08/01/2035 | | | | 1,000,000 | | | | 904,510 | |
Milwaukee WI RDA Summer Festival Project (Miscellaneous Revenue, Morgal Obligation Insured) | | | 4.60 | | | | 08/01/2024 | | | | 870,000 | | | | 955,869 | |
Milwaukee WI RDA Summer Festival Project (Miscellaneous Revenue, Morgal Obligation Insured) | | | 5.00 | | | | 08/01/2030 | | | | 3,000,000 | | | | 3,276,570 | |
Milwaukee WI RDA YMCA of Metropolitan Milwaukee Project Series 2010 (Miscellaneous Revenue)±§ | | | 0.11 | | | | 05/01/2028 | | | | 1,000,000 | | | | 1,000,000 | |
Monroe WI RDA Monroe Clinic Incorporated (Health Revenue) | | | 5.50 | | | | 02/15/2029 | | | | 1,000,000 | | | | 1,051,610 | |
Monroe WI RDA Monroe Clinic Incorporated (Health Revenue) | | | 5.88 | | | | 02/15/2039 | | | | 1,500,000 | | | | 1,592,520 | |
Neenah WI CDA Series A (Lease Revenue) | | | 4.13 | | | | 12/01/2018 | | | | 300,000 | | | | 320,772 | |
Neenah WI CDA Series A (Lease Revenue) | | | 5.13 | | | | 12/01/2023 | | | | 1,000,000 | | | | 1,064,920 | |
Osceola WI RDA (Lease Revenue) | | | 5.15 | | | | 12/01/2015 | | | | 235,000 | | | | 235,063 | |
Osceola WI RDA (Lease Revenue) | | | 5.38 | | | | 12/01/2020 | | | | 410,000 | | | | 410,119 | |
Southeast Wisconsin Professional Baseball Park District Junior Lien Series B (Tax Revenue, NATL-RE Insured) | | | 5.50 | | | | 12/15/2015 | | | | 1,545,000 | | | | 1,566,352 | |
Southeast Wisconsin Professional Baseball Park District Junior Lien Series B (Tax Revenue, NATL-RE Insured) | | | 5.50 | | | | 12/15/2017 | | | | 1,300,000 | | | | 1,317,888 | |
Southeast Wisconsin Professional Baseball Park District Series A (Tax Revenue, NATL-RE Insured) | | | 5.00 | | | | 12/15/2017 | | | | 100,000 | | | | 101,335 | |
Southeast Wisconsin Professional Baseball Park District Series A (Tax Revenue, NATL-RE Insured) | | | 5.50 | | | | 12/15/2015 | | | | 160,000 | | | | 184,758 | |
Southeast Wisconsin Professional Baseball Park District Series A (Tax Revenue, NATL-RE Insured) | | | 5.50 | | | | 12/15/2017 | | | | 1,765,000 | | | | 2,135,156 | |
Southeast Wisconsin Professional Baseball Park District Series A (Tax Revenue, NATL-RE Insured) | | | 5.50 | | | | 12/15/2018 | | | | 380,000 | | | | 475,657 | |
Southeast Wisconsin Professional Baseball Park District Series A (Tax Revenue, NATL-RE Insured) | | | 5.50 | | | | 12/15/2021 | | | | 240,000 | | | | 307,807 | |
Southeast Wisconsin Professional Baseball Park District Series A (Tax Revenue, NATL-RE Insured) | | | 5.50 | | | | 12/15/2023 | | | | 1,600,000 | | | | 1,951,840 | |
Southeast Wisconsin Professional Baseball Park District Series A (Tax Revenue, NATL-RE Insured) | | | 5.50 | | | | 12/15/2026 | | | | 2,205,000 | | | | 2,607,457 | |
St. Croix Falls WI CDA (Lease Revenue) | | | 4.85 | | | | 12/01/2014 | | | | 90,000 | | | | 93,703 | |
Sturgeon Bay WI Waterfront RDA (Lease Revenue) | | | 4.35 | | | | 10/01/2018 | | | | 150,000 | | | | 159,950 | |
Sturgeon Bay WI Waterfront RDA Refunded Series A (Lease Revenue) | | | 4.50 | | | | 10/01/2021 | | | | 175,000 | | | | 182,959 | |
Sun Prairie WI CDA Tax Incremental # 6 & 7 (Lease Revenue) | | | 3.80 | | | | 02/01/2018 | | | | 300,000 | | | | 325,563 | |
Sun Prairie WI CDA Tax Incremental # 6 & 7 (Lease Revenue) | | | 4.00 | | | | 02/01/2019 | | | | 220,000 | | | | 237,752 | |
| | | | | | |
| Portfolio of Investments—December 31, 2011 (Unaudited) | | Wells Fargo Advantage Wisconsin Tax-Free Fund | | | 13 | |
| | | | | | | | | | | | | | | | |
| Security Name | | Interest Rate | | | Maturity Date | | | Principal | | | Value | |
| | | | | | | | | | | | | | | | |
| | | | |
| Wisconsin (continued) | | | | | | | | | | | | | | | | |
Sun Prairie WI CDA Tax Incremental # 6 & 7 (Lease Revenue) | | | 4.50 | % | | | 02/01/2022 | | | $ | 250,000 | | | $ | 269,188 | |
Verona WI CDA (IDR) | | | 4.30 | | | | 02/01/2015 | | | | 100,000 | | | | 104,859 | |
Verona WI CDA (Lease Revenue) | | | 5.38 | | | | 12/01/2022 | | | | 775,000 | | | | 790,043 | |
Warrens WI CDA (Tax Revenue) | | | 3.70 | | | | 10/01/2014 | | | | 300,000 | | | | 240,195 | |
Warrens WI CDA (Lease Revenue) | | | 5.00 | | | | 11/01/2016 | | | | 70,000 | | | | 50,316 | |
Warrens WI CDA (Lease Revenue) | | | 5.10 | | | | 11/01/2020 | | | | 120,000 | | | | 73,476 | |
Waukesha County WI Housing Authority Steeple View Incorporated Project (Housing Revenue, Associated Bank NA LOC)±§ | | | 0.10 | | | | 12/01/2034 | | | | 100,000 | | | | 100,000 | |
Waukesha County WI Housing Authority The Arboretum Project (Housing Revenue)± | | | 5.00 | | | | 12/01/2027 | | | | 340,000 | | | | 344,233 | |
Waukesha WI Redevelopment Authority Welldall Manufacturing Incorporated Project (IDR, Harris NA LOC) | | | 2.30 | | | | 12/01/2016 | | | | 135,000 | | | | 141,055 | |
Waukesha WI Redevelopment Authority Welldall Manufacturing Incorporated Project (IDR, Harris NA LOC) | | | 2.65 | | | | 12/01/2017 | | | | 335,000 | | | | 356,195 | |
Waukesha WI Redevelopment Authority Welldall Manufacturing Incorporated Project (IDR, Harris NA LOC) | | | 4.00 | | | | 12/01/2023 | | | | 150,000 | | | | 160,125 | |
Waukesha WI Redevelopment Authority Welldall Manufacturing Incorporated Project (IDR, Harris NA LOC) | | | 4.20 | | | | 12/01/2024 | | | | 150,000 | | | | 159,756 | |
Waukesha WI Redevelopment Authority Welldall Manufacturing Incorporated Project (IDR, Harris NA LOC) | | | 4.25 | | | | 12/01/2025 | | | | 250,000 | | | | 263,683 | |
Weston WI CDA Series A (Lease Revenue) | | | 5.25 | | | | 10/01/2020 | | | | 720,000 | | | | 775,015 | |
Wisconsin Center District CAB (Tax Revenue, AGM Insured)(z) | | | 4.71 | | | | 12/15/2030 | | | | 1,415,000 | | | | 584,324 | |
Wisconsin Center District Junior Dedicated (Tax Revenue, AGM Moral Obligation Insured) | | | 5.25 | | | | 12/15/2015 | | | | 280,000 | | | | 314,101 | |
Wisconsin Center District Junior Dedicated (Tax Revenue, AGM Moral Obligation Insured) | | | 5.25 | | | | 12/15/2016 | | | | 385,000 | | | | 441,861 | |
Wisconsin Center District Junior Dedicated (Tax Revenue, AGM Moral Obligation Insured) | | | 5.25 | | | | 12/15/2018 | | | | 50,000 | | | | 58,756 | |
Wisconsin Center District Junior Dedicated (Tax Revenue, AGM Moral Obligation Insured) | | | 5.25 | | | | 12/15/2019 | | | | 2,000,000 | | | | 2,364,260 | |
Wisconsin Center District Junior Dedicated (Tax Revenue, AGM Moral Obligation Insured) | | | 5.25 | | | | 12/15/2023 | | | | 1,620,000 | | | | 1,885,405 | |
Wisconsin Center District Junior Dedicated (Tax Revenue, AGM Moral Obligation Insured) | | | 5.25 | | | | 12/15/2027 | | | | 230,000 | | | | 265,841 | |
Wisconsin HEFA Valley Packing Industries Incorporated (Miscellaneous Revenue)±§ | | | 0.20 | | | | 07/01/2035 | | | | 250,000 | | | | 250,000 | |
Wisconsin HFA (Housing Revenue, FHA Mortgages Insured) | | | 6.10 | | | | 06/01/2021 | | | | 115,000 | | | | 135,472 | |
Wisconsin Housing & Economic Development Authority AMT Series A (Housing Revenue, GO of Authority Insured) | | | 4.63 | | | | 11/01/2037 | | | | 25,000 | | | | 24,139 | |
Wisconsin Housing & Economic Development Authority AMT Series A (Housing Revenue, GO of Authority Insured) | | | 4.70 | | | | 05/01/2047 | | | | 290,000 | | | | 274,839 | |
Wisconsin Housing & Economic Development Authority AMT Series A (Housing Revenue, GO of Authority Insured) | | | 4.75 | | | | 05/01/2037 | | | | 310,000 | | | | 313,116 | |
Wisconsin Housing & Economic Development Authority Series A (Housing Revenue)± | | | 4.25 | | | | 12/01/2035 | | | | 1,960,000 | | | | 2,123,307 | |
Wisconsin Housing & Economic Development Authority Series A (Housing Revenue, GO of Authority Insured) | | | 5.75 | | | | 11/01/2043 | | | | 3,485,000 | | | | 3,651,444 | |
Wisconsin Housing & Economic Development Authority Series C (Housing Revenue)±§ | | | 0.20 | | | | 05/01/2037 | | | | 100,000 | | | | 100,000 | |
Wisconsin Housing & Economic Development Authority Series E (Housing Revenue, GO of Authority Insured) | | | 4.90 | | | | 11/01/2035 | | | | 2,015,000 | | | | 2,034,860 | |
| | | | |
| 14 | | Wells Fargo Advantage Wisconsin Tax-Free Fund | | Portfolio of Investments—December 31, 2011 (Unaudited) |
| | | | | | | | | | | | | | | | |
| Security Name | | Interest Rate | | | Maturity Date | | | Principal | | | Value | |
| | | | | | | | | | | | | | | | |
| | | | |
| Wisconsin (continued) | | | | | | | | | | | | | | | | |
Wisconsin State HEFA Alverno College Project (Education Revenue, Allied Irish Bank plc LOC)±§ | | | 0.08 | % | | | 11/01/2017 | | | $ | 2,400,000 | | | $ | 2,400,000 | |
| | | | |
| | | | | | | | | | | | | | | 67,158,581 | |
| | | | | | | | | | | | | | | | |
| | | | |
Total Municipal Bonds and Notes (Cost $125,744,311) | | | | | | | | | | | | | | | 131,754,799 | |
| | | | | | | | | | | | | | | | |
| | | | |
| | | Yield | | | | | | | | | | |
| Short-Term Investments: 0.07% | | | | | | | | | | | | | | | | |
| U.S. Treasury Securities: 0.07% | | | | | | | | | | | | | | | | |
U.S. Treasury Bill# | | | 0.02 | | | | 03/29/2012 | | | | 100,000 | | | | 99,996 | |
| | | | | | | | | | | | | | | | |
| | | | |
Total Short-Term Investments (Cost $99,997) | | | | | | | | | | | | | | | 99,996 | |
| | | | | | | | | | | | | | | | |
| | | | | | | | |
| Total Investments in Securities | | | | | | | | |
| (Cost $125,844,308)* | | | 96.59 | % | | | 131,854,795 | |
Other Assets and Liabilities, Net | | | 3.41 | | | | 4,652,475 | |
| | | | | | | | |
| Total Net Assets | | | 100.00 | % | | $ | 136,507,270 | |
| | | | | | | | |
| ± | Variable rate investment. |
| § | These securities are subject to a demand feature which reduces the effective maturity. |
| (z) | Zero coupon security. Rate represents yield to maturity. |
| # | All or a portion of this security is segregated as collateral for investments in derivative instruments. |
| * | Cost for federal income tax purposes is $125,840,241 and net unrealized appreciation (depreciation) consists of: |
| | | | |
Gross unrealized appreciation | | $ | 6,425,290 | |
Gross unrealized depreciation | | | (410,736 | ) |
| | | | |
Net unrealized appreciation | | $ | 6,014,554 | |
The accompanying notes are an integral part of these financial statements.
| | | | | | |
| Statement of Assets and Liabilities—December 31, 2011 (Unaudited) | | Wells Fargo Advantage Wisconsin Tax-Free Fund | | | 15 | |
| | | | |
| | | | |
| |
Assets | | | | |
Investments in unaffiliated securities, at value (see cost below) | | $ | 131,854,795 | |
Cash | | | 2,179,873 | |
Receivable for investments sold | | | 1,133,480 | |
Receivable for Fund shares sold | | | 140,056 | |
Receivable for interest | | | 1,464,036 | |
Prepaid expenses and other assets | | | 13,431 | |
| | | | |
Total assets | | | 136,785,671 | |
| | | | |
| |
Liabilities | | | | |
Dividends payable | | | 75,963 | |
Payable for Fund shares redeemed | | | 110,988 | |
Payable for daily variation margin on open futures contracts | | | 10,313 | |
Advisory fee payable | | | 19,681 | |
Distribution fees payable | | | 7,153 | |
Due to other related parties | | | 26,569 | |
Shareholder servicing fees payable | | | 27,734 | |
| | | | |
Total liabilities | | | 278,401 | |
| | | | |
Total net assets | | $ | 136,507,270 | |
| | | | |
| |
NET ASSETS CONSIST OF | | | | |
Paid-in capital | | $ | 130,585,801 | |
Overdistributed net investment income | | | (10,748 | ) |
Accumulated net realized losses on investments | | | (45,343 | ) |
Net unrealized gains on investments | | | 5,977,560 | |
| | | | |
Total net assets | | $ | 136,507,270 | |
| | | | |
| |
COMPUTATION OF NET ASSET VALUE AND OFFERING PRICE PER SHARE1 | | | | |
Net assets – Class A | | $ | 16,052,271 | |
Shares outstanding – Class A | | | 1,466,912 | |
Net asset value per share – Class A | | | $10.94 | |
Maximum offering price per share – Class A2 | | | $11.46 | |
Net assets – Class C | | $ | 10,815,350 | |
Shares outstanding – Class C | | | 988,363 | |
Net asset value per share – Class C | | | $10.94 | |
Net assets – Investor Class | | $ | 109,639,649 | |
Shares outstanding – Investor Class | | | 10,018,980 | |
Net asset value per share – Investor Class | | | $10.94 | |
| |
Investments in unaffiliated securities, at cost | | $ | 125,844,308 | |
| | | | |
| 1. | The Fund has an unlimited number of authorized shares. |
| 2. | Maximum offering price is computed as 100/95.50 of net asset value. On investments of $50,000 or more, the offering price is reduced. |
The accompanying notes are an integral part of these financial statements.
| | | | |
| 16 | | Wells Fargo Advantage Wisconsin Tax-Free Fund | | Statement of Operations—Six Months Ended December 31, 2011 (Unaudited) |
| | | | |
| | | | |
| |
Investment income | | | | |
Interest | | $ | 2,655,996 | |
| | | | |
| |
Expenses | | | | |
Advisory fee | | | 231,184 | |
Administration fees | | | | |
Fund level | | | 33,026 | |
Class A | | | 11,908 | |
Class C | | | 8,294 | |
Investor Class | | | 101,510 | |
Shareholder servicing fees | | | | |
Class A | | | 18,394 | |
Class C | | | 12,960 | |
Investor Class | | | 132,227 | |
Distribution fees | | | | |
Class C | | | 38,879 | |
Custody and accounting fees | | | 4,136 | |
Professional fees | | | 22,227 | |
Registration fees | | | 24,576 | |
Shareholder report expenses | | | 6,188 | |
Trustees’ fees and expenses | | | 6,986 | |
Other fees and expenses | | | 2,359 | |
| | | | |
Total expenses | | | 654,854 | |
Less: Fee waivers and/or expense reimbursements | | | (137,579 | ) |
| | | | |
Net expenses | | | 517,275 | |
| | | | |
Net investment income | | | 2,138,721 | |
| | | | |
| |
REALIZED AND UNREALIZED GAINS (LOSSES) ON INVESTMENTS | | | | |
| |
Net realized gains (losses) on: | | | | |
Unaffiliated securities | | | 130,818 | |
Futures transactions | | | (180,222 | ) |
| | | | |
Net realized losses on investments | | | (49,404 | ) |
| | | | |
| |
Net change in unrealized gains (losses) on: | | | | |
Unaffiliated securities | | | 3,343,521 | |
Futures transactions | | | (32,927 | ) |
| | | | |
Net change in unrealized gains (losses) on investments | | | 3,310,594 | |
| | | | |
Net realized and unrealized gains (losses) on investments | | | 3,261,190 | |
| | | | |
Net increase in net assets resulting from operations | | $ | 5,399,911 | |
| | | | |
The accompanying notes are an integral part of these financial statements.
| | | | | | |
| Statements of Changes in Net Assets | | Wells Fargo Advantage Wisconsin Tax-Free Fund | | | 17 | |
| | | | | | | | | | | | | | | | |
| | | Six Months Ended December 31, 2011 (Unaudited) | | | Year Ended June 30, 2011 | |
| | | | |
Operations | | | | | | | | | | | | | | | | |
Net investment income | | | | | | $ | 2,138,721 | | | | | | | $ | 4,108,998 | |
Net realized gains (losses) on investments | | | | | | | (49,404 | ) | | | | | | | 773,240 | |
Net change in unrealized gains (losses) on investments | | | | | | | 3,310,594 | | | | | | | | (749,579 | ) |
| | | | | | | | | | | | | | | | |
Net increase in net assets resulting from operations | | | | | | | 5,399,911 | | | | | | | | 4,132,659 | |
| | | | | | | | | | | | | | | | |
| | | | |
Distributions to shareholders from | | | | | | | | | | | | | | | | |
Net investment income | | | | | | | | | | | | | | | | |
Class A | | | | | | | (246,626 | ) | | | | | | | (355,936 | ) |
Class C | | | | | | | (133,121 | ) | | | | | | | (273,823 | ) |
Investor Class | | | | | | | (1,758,975 | ) | | | | | | | (3,479,134 | ) |
Net realized gains | | | | | | | | | | | | | | | | |
Class A | | | | | | | (16,477 | ) | | | | | | | 0 | |
Class C | | | | | | | (10,878 | ) | | | | | | | 0 | |
Investor Class | | | | | | | (113,156 | ) | | | | | | | 0 | |
| | | | | | | | | | | | | | | | |
Total distributions to shareholders | | | | | | | (2,279,233 | ) | | | | | | | (4,108,893 | ) |
| | | | | | | | | | | | | | | | |
| | | | |
Capital share transactions | | | Shares | | | | | | | | Shares | | | | | |
Proceeds from shares sold | | | | | | | | | | | | | | | | |
Class A | | | 508,283 | | | | 5,489,491 | | | | 645,536 | | | | 6,873,605 | |
Class C | | | 126,425 | | | | 1,367,019 | | | | 186,332 | | | | 1,990,635 | |
Investor Class | | | 906,096 | | | | 9,807,479 | | | | 1,893,567 | | | | 20,173,576 | |
| | | | | | | | | | | | | | | | |
| | | | | | | 16,663,989 | | | | | | | | 29,037,816 | |
| | | | | | | | | | | | | | | | |
Reinvestment of distributions | | | | | | | | | | | | | | | | |
Class A | | | 19,611 | | | | 212,523 | | | | 26,943 | | | | 286,133 | |
Class C | | | 11,732 | | | | 127,111 | | | | 21,531 | | | | 228,832 | |
Investor Class | | | 146,039 | | | | 1,582,214 | | | | 272,097 | | | | 2,893,588 | |
| | | | | | | | | | | | | | | | |
| | | | | | | 1,921,848 | | | | | | | | 3,408,553 | |
| | | | | | | | | | | | | | | | |
Payment for shares redeemed | | | | | | | | | | | | | | | | |
Class A | | | (141,236 | ) | | | (1,531,627 | ) | | | (298,470 | ) | | | (3,146,838 | ) |
Class C | | | (44,005 | ) | | | (476,712 | ) | | | (342,957 | ) | | | (3,619,570 | ) |
Investor Class | | | (469,594 | ) | | | (5,087,037 | ) | | | (2,884,626 | ) | | | (30,646,595 | ) |
| | | | | | | | | | | | | | | | |
| | | | | | | (7,095,376 | ) | | | | | | | (37,413,003 | ) |
| | | | | | | | | | | | | | | | |
Net increase (decrease) in net assets resulting
from capital share transactions | | | | | | | 11,490,461 | | | | | | | | (4,966,634 | ) |
| | | | | | | | | | | | | | | | |
Total increase (decrease) in net assets | | | | | | | 14,611,139 | | | | | | | | (4,942,868 | ) |
| | | | | | | | | | | | | | | | |
| | | | |
Net assets | | | | | | | | | | | | | | | | |
Beginning of period | | | | | | | 121,896,131 | | | | | | | | 126,838,999 | |
| | | | | | | | | | | | | | | | |
End of period | | | | | | $ | 136,507,270 | | | | | | | $ | 121,896,131 | |
| | | | | | | | | | | | | | | | |
Overdistributed net investment income | | | | | | $ | (10,748 | ) | | | | | | $ | (10,747 | ) |
| | | | | | | | | | | | | | | | |
The accompanying notes are an integral part of these financial statements.
| | | | |
| 18 | | Wells Fargo Advantage Wisconsin Tax-Free Fund | | Financial Highlights |
(For a share outstanding throughout each period)
| | | | | | | | | | | | | | | | | | | | |
| | | Six Months Ended
December 31, 2011 (Unaudited) | | | Year Ended June 30, | |
| Class A | | | 2011 | | | 2010 | | | 2009 | | | 20081 | |
Net asset value, beginning of period | | $ | 10.68 | | | $ | 10.67 | | | $ | 10.43 | | | $ | 10.37 | | | $ | 10.44 | |
Net investment income | | | 0.18 | | | | 0.36 | | | | 0.32 | | | | 0.38 | | | | 0.09 | |
Net realized and unrealized gains (losses) on investments | | | 0.27 | | | | 0.01 | | | | 0.35 | | | | 0.06 | | | | (0.07 | ) |
| | | | | | | | | | | | | | | | | | | | |
Total from investment operations | | | 0.45 | | | | 0.37 | | | | 0.67 | | | | 0.44 | | | | 0.02 | |
Distributions to shareholders from | | | | | | | | | | | | | | | | | | | | |
Net investment income | | | (0.18 | ) | | | (0.36 | ) | | | (0.32 | ) | | | (0.38 | ) | | | (0.09 | ) |
Net realized gains | | | (0.01 | ) | | | 0.00 | | | | (0.11 | ) | | | 0.00 | | | | 0.00 | |
| | | | | | | | | | | | | | | | | | | | |
Total distributions to shareholders | | | (0.19 | ) | | | (0.36 | ) | | | (0.43 | ) | | | (0.38 | ) | | | (0.09 | ) |
Net asset value, end of period | | $ | 10.94 | | | $ | 10.68 | | | $ | 10.67 | | | $ | 10.43 | | | $ | 10.37 | |
Total return2 | | | 4.27 | % | | | 3.52 | % | | | 6.52 | % | | | 4.38 | % | | | 0.21 | % |
Ratios to average net assets (annualized) | | | | | | | | | | | | | | | | | | | | |
Gross expenses | | | 0.91 | % | | | 0.92 | % | | | 0.93 | % | | | 0.97 | % | | | 0.99 | % |
Net expenses | | | 0.70 | % | | | 0.70 | % | | | 0.70 | % | | | 0.68 | % | | | 0.70 | % |
Net investment income | | | 3.32 | % | | | 3.43 | % | | | 3.00 | % | | | 3.71 | % | | | 3.34 | % |
Supplemental data | | | | | | | | | | | | | | | | | | | | |
Portfolio turnover rate | | | 11 | % | | | 60 | % | | | 48 | % | | | 126 | % | | | 102 | % |
Net assets, end of period (000’s omitted) | | | $16,052 | | | | $11,540 | | | | $7,535 | | | | $5,110 | | | | $331 | |
| 1. | For the period from March 31, 2008 (commencement of class operations) to June 30, 2008. |
| 2. | Total return calculations do not include any sales charges. Returns for periods of less than one year are not annualized. |
The accompanying notes are an integral part of these financial statements.
| | | | | | |
| Financial Highlights | | Wells Fargo Advantage Wisconsin Tax-Free Fund | | | 19 | |
(For a share outstanding throughout each period)
| | | | | | | | | | | | | | | | | | | | | | | | |
| | | Six Months Ended
December 31, 2011 (Unaudited) | | | Year Ended June 30, | |
| Class C | | | 2011 | | | 2010 | | | 2009 | | | 2008 | | | 2007 | |
Net asset value, beginning of period | | $ | 10.68 | | | $ | 10.67 | | | $ | 10.43 | | | $ | 10.37 | | | $ | 10.44 | | | $ | 10.38 | |
Net investment income | | | 0.14 | | | | 0.27 | | | | 0.23 | | | | 0.30 | | | | 0.30 | | | | 0.30 | |
Net realized and unrealized gains (losses) on investments | | | 0.27 | | | | 0.01 | | | | 0.35 | | | | 0.06 | | | | (0.05 | ) | | | 0.11 | |
| | | | | | | | | | | | | | | | | | | | | | | | |
Total from investment operations | | | 0.41 | | | | 0.28 | | | | 0.58 | | | | 0.36 | | | | 0.25 | | | | 0.41 | |
Distributions to shareholders from | | | | | | | | | | | | | | | | | | | | | | | | |
Net investment income | | | (0.14 | ) | | | (0.27 | ) | | | (0.23 | ) | | | (0.30 | ) | | | (0.30 | ) | | | (0.30 | ) |
Net realized gains | | | (0.01 | ) | | | 0.00 | | | | (0.11 | ) | | | 0.00 | | | | (0.02 | ) | | | (0.05 | ) |
| | | | | | | | | | | | | | | | | | | | | | | | |
Total distributions to shareholders | | | (0.15 | ) | | | (0.27 | ) | | | (0.34 | ) | | | (0.30 | ) | | | (0.32 | ) | | | (0.35 | ) |
Net asset value, end of period | | $ | 10.94 | | | $ | 10.68 | | | $ | 10.67 | | | $ | 10.43 | | | $ | 10.37 | | | $ | 10.44 | |
Total return1 | | | 3.87 | % | | | 2.71 | % | | | 5.67 | % | | | 3.54 | % | | | 2.40 | % | | | 3.99 | % |
Ratios to average net assets (annualized) | | | | | | | | | | | | | | | | | | | | | | | | |
Gross expenses | | | 1.66 | % | | | 1.67 | % | | | 1.68 | % | | | 1.73 | % | | | 1.82 | % | | | 1.88 | % |
Net expenses | | | 1.45 | % | | | 1.48 | % | | | 1.49 | % | | | 1.49 | % | | | 1.49 | % | | | 1.49 | % |
Net investment income | | | 2.57 | % | | | 2.56 | % | | | 2.20 | % | | | 2.89 | % | | | 2.82 | % | | | 2.87 | % |
Supplemental data | | | | | | | | | | | | | | | | | | | | | | | | |
Portfolio turnover rate | | | 11 | % | | | 60 | % | | | 48 | % | | | 126 | % | | | 102 | % | | | 51 | % |
Net assets, end of period (000’s omitted) | | | $10,815 | | | | $9,552 | | | | $10,979 | | | | $7,528 | | | | $5,123 | | | | $3,730 | |
| 1. | Total return calculations do not include any sales charges. Returns for periods of less than one year are not annualized. |
The accompanying notes are an integral part of these financial statements.
| | | | |
| 20 | | Wells Fargo Advantage Wisconsin Tax-Free Fund | | Financial Highlights |
(For a share outstanding throughout each period)
| | | | | | | | | | | | | | | | | | | | | | | | |
| | | Six Months Ended
December 31, 2011 (Unaudited) | | | Year Ended June 30, | |
| Investor Class | | | 2011 | | | 2010 | | | 2009 | | | 2008 | | | 2007 | |
Net asset value, beginning of period | | $ | 10.68 | | | $ | 10.67 | | | $ | 10.43 | | | $ | 10.37 | | | $ | 10.44 | | | $ | 10.38 | |
Net investment income | | | 0.18 | | | | 0.35 | | | | 0.31 | | | | 0.37 | | | | 0.38 | | | | 0.38 | |
Net realized and unrealized gains (losses) on investments | | | 0.27 | | | | 0.01 | | | | 0.35 | | | | 0.06 | | | | (0.05 | ) | | | 0.11 | |
| | | | | | | | | | | | | | | | | | | | | | | | |
Total from investment operations | | | 0.45 | | | | 0.36 | | | | 0.66 | | | | 0.43 | | | | 0.33 | | | | 0.49 | |
Distributions to shareholders from | | | | | | | | | | | | | | | | | | | | | | | | |
Net investment income | | | (0.18 | ) | | | (0.35 | ) | | | (0.31 | ) | | | (0.37 | ) | | | (0.38 | ) | | | (0.38 | ) |
Net realized gains | | | (0.01 | ) | | | 0.00 | | | | (0.11 | ) | | | 0.00 | | | | (0.02 | ) | | | (0.05 | ) |
| | | | | | | | | | | | | | | | | | | | | | | | |
Total distributions to shareholders | | | (0.19 | ) | | | (0.35 | ) | | | (0.42 | ) | | | (0.37 | ) | | | (0.40 | ) | | | (0.43 | ) |
Net asset value, end of period | | $ | 10.94 | | | $ | 10.68 | | | $ | 10.67 | | | $ | 10.43 | | | $ | 10.37 | | | $ | 10.44 | |
Total return1 | | | 4.25 | % | | | 3.49 | % | | | 6.46 | % | | | 4.31 | % | | | 2.95 | % | | | 4.77 | % |
Ratios to average net assets (annualized) | | | | | | | | | | | | | | | | | | | | | | | | |
Gross expenses | | | 0.94 | % | | | 0.95 | % | | | 0.99 | % | | | 1.05 | % | | | 1.22 | % | | | 1.30 | % |
Net expenses | | | 0.73 | % | | | 0.73 | % | | | 0.75 | % | | | 0.75 | % | | | 0.75 | % | | | 0.75 | % |
Net investment income | | | 3.29 | % | | | 3.32 | % | | | 2.94 | % | | | 3.64 | % | | | 3.57 | % | | | 3.61 | % |
Supplemental data | | | | | | | | | | | | | | | | | | | | | | | | |
Portfolio turnover rate | | | 11 | % | | | 60 | % | | | 48 | % | | | 126 | % | | | 102 | % | | | 51 | % |
Net assets, end of period (000’s omitted) | | | $109,640 | | | | $100,804 | | | | $108,326 | | | | $92,061 | | | | $88,130 | | | | $68,745 | |
| 1. | Returns for periods of less than one year are not annualized. |
The accompanying notes are an integral part of these financial statements.
| | | | | | |
| Notes to Financial Statements (Unaudited) | | Wells Fargo Advantage Wisconsin Tax-Free Fund | | | 21 | |
1. ORGANIZATION
Wells Fargo Funds Trust (the “Trust”), a Delaware statutory trust organized on March 10, 1999, is an open-end management investment company registered under the Investment Company Act of 1940, as amended (the “1940 Act”). These financial statements report on Wells Fargo Advantage Wisconsin Tax-Free Fund (the “Fund”) which is a diversified series of the Trust.
2. SIGNIFICANT ACCOUNTING POLICIES
The following significant accounting policies, which are consistently followed in the preparation of the financial statements of the Fund, are in conformity with U.S. generally accepted accounting principles which require management to make estimates and assumptions that affect the reported amounts of assets and liabilities, disclosure of contingent assets and liabilities at the date of the financial statements, and the reported amounts of revenues and expenses during the reporting period. Actual results could differ from those estimates.
Securities valuation
Fixed income securities with maturities exceeding 60 days are valued based on available evaluated prices received from an independent pricing service approved by the Board of Trustees which may utilize both transaction data and market information such as yield, prices of securities of comparable quality, coupon rate, maturity, type of issue, trading characteristics and other market data. If valuations are not available from the pricing service or values received are deemed not representative of market value, values will be obtained from a third party broker-dealer or determined based on the Fund’s Fair Value Procedures.
Debt securities of sufficient credit quality with original maturities of 60 days or less generally are valued at amortized cost which approximates fair value. The amortized cost method involves valuing a security at its cost, plus accretion of discount or minus amortization of premium over the period until maturity.
Investments which are not valued using any of the methods discussed above, are valued at their fair value, as determined by procedures established in good faith and approved by the Board of Trustees.
When-issued transactions
The Fund may purchase securities on a forward commitment or ‘when-issued’ basis. The Fund records a when-issued transaction on the trade date and will segregate assets to cover its obligation by confirming the availability of qualifying assets having a value sufficient to make payment for the securities purchased. Securities purchased on a when-issued basis are marked-to-market daily and the Fund begins earning interest on the settlement date. Losses may arise due to changes in the market value of the underlying securities or if the counterparty does not perform under the contract.
Futures contracts
The Fund may be subject to interest rate risk in the normal course of pursuing its investment objectives. The Fund may buy and sell futures contracts in order to gain exposure to, or protect against changes in, security values and interest rates. The primary risks associated with the use of futures contracts are the imperfect correlation between changes in market values of securities held by the Fund and the prices of futures contracts, and the possibility of an illiquid market.
Futures contracts are valued based upon their quoted daily settlement prices when available. The aggregate principal amounts of the contracts are not recorded in the financial statements. Fluctuations in the value of the contracts are recorded in the Statement of Assets and Liabilities as an asset or liability and in the Statement of Operations as unrealized gains or losses until the contracts are closed, at which point they are recorded as net realized gains or losses on futures contracts. With futures contracts, there is minimal counterparty risk to the Fund since futures are exchange traded and the exchange’s clearinghouse, as counterparty to all exchange traded futures, guarantees the futures against default.
Security transactions and income recognition
Securities transactions are recorded on a trade date basis. Realized gains or losses are reported on the basis of identified cost of securities delivered.
Interest income is accrued daily and bond discounts are accreted and premiums are amortized daily based on the effective interest method. To the extent debt obligations are placed on non-accrual status, any related interest income may be reduced by writing off interest receivables when the collection of all or a portion of interest has become doubtful based on consistently applied procedures. If the issuer subsequently resumes interest payments or when the collectability of interest is reasonably assured, the debt obligation is removed from non-accrual status.
| | | | |
| 22 | | Wells Fargo Advantage Wisconsin Tax-Free Fund | | Notes to Financial Statements (Unaudited) |
Distributions to shareholders
Distributions to shareholders from net investment income are accrued daily and paid monthly. Distributions from net realized gains, if any, are recorded on the ex-dividend date. Such distributions are determined in conformity with income tax regulations, which may differ from generally accepted accounting principles.
Federal and other taxes
The Fund intends to continue to qualify as a regulated investment company by distributing substantially all of its investment company taxable and tax-exempt income and any net realized capital gains (after reduction for capital loss carryforwards) sufficient to relieve it from all, or substantially all, federal income taxes. Accordingly, no provision for federal income taxes was required.
The Fund’s income and federal excise tax returns and all financial records supporting those returns for the prior three fiscal years are subject to examination by the federal and Delaware revenue authorities.
Under the recently enacted Regulated Investment Company Modernization Act of 2010, the Fund is permitted to carry forward capital losses incurred in taxable years which began after December 22, 2010 for an unlimited period. However, any losses incurred are required to be utilized prior to the losses incurred in pre-enactment taxable years. As a result of this ordering rule, pre-enactment capital loss carryforwards may be more likely to expire unused. Additionally, post-enactment capital losses that are carried forward will retain their character as either short-term or long-term capital losses rather than being considered all short-term as under previous law.
Class allocations
The separate classes of shares offered by the Fund differ principally in applicable sales charges, distribution, shareholder servicing and administration fees. Shareholders of each class bear certain expenses that pertain to that particular class. All shareholders bear the common expenses of the Fund, earn income from the portfolio, and are allocated unrealized gains and losses pro rata based on the average daily net assets of each class, without distinction between share classes. Dividends are determined separately for each class based on income and expenses allocable to each class. Realized gains and losses are allocated to each class pro rata based upon the net assets of each class on the date realized. Differences in per share dividend rates generally result from the relative weightings of pro rata income and realized gain allocations and from differences in separate class expenses, including distribution, shareholder servicing and administration fees.
3. FAIR VALUATION MEASUREMENTS
Fair value measurements of investments are determined within a framework that has established a fair value hierarchy based upon the various data inputs utilized in determining the value of the Fund’s investments. The three-level hierarchy gives the highest priority to unadjusted quoted prices in active markets for identical assets or liabilities (Level 1) and the lowest priority to significant unobservable inputs (Level 3). The Fund’s investments are classified within the fair value hierarchy based on the lowest level of input that is significant to the fair value measurement. The inputs are summarized into three broad levels as follows:
| n | | Level 1 – quoted prices in active markets for identical securities |
| n | | Level 2 – other significant observable inputs (including quoted prices for similar securities, interest rates, prepayment speeds, credit risk, etc.) |
| n | | Level 3 – significant unobservable inputs (including the Fund’s own assumptions in determining the fair value of investments) |
The inputs or methodologies used for valuing securities are not necessarily an indication of the risk associated with investing in those securities.
| | | | | | |
| Notes to Financial Statements (Unaudited) | | Wells Fargo Advantage Wisconsin Tax-Free Fund | | | 23 | |
As of December 31, 2011, the inputs used in valuing the Fund’s assets, which are carried at fair value, were as follows:
| | | | | | | | | | | | | | | | |
| Investments in Securities | | Quoted Prices (Level 1) | | | Significant Other
Observable Inputs (Level 2) | | | Significant Unobservable Inputs (Level 3) | | | Total | |
Municipal bonds and notes | | $ | 0 | | | $ | 131,754,799 | | | $ | 0 | | | $ | 131,754,799 | |
Short-term investments | | | | | | | | | | | | | | | | |
U.S. Treasury securities | | | 99,996 | | | | 0 | | | | 0 | | | | 99,996 | |
| | | $ | 99,996 | | | $ | 131,754,799 | | | $ | 0 | | | $ | 131,854,795 | |
Further details on the major security types listed above can be found in the Portfolio of Investments.
As of December 31, 2011, the inputs used in valuing the Fund’s other financial instruments, which are carried at fair value, were as follows:
| | | | | | | | | | | | | | | | |
| Other financial instruments | | Quoted Prices (Level 1) | | | Significant Other
Observable Inputs (Level 2) | | | Significant Unobservable Inputs (Level 3) | | | Total | |
Futures contracts+ | | $ | (32,927 | ) | | $ | 0 | | | $ | 0 | | | $ | (32,927 | ) |
| + | Futures contracts are presented at the unrealized gains or losses on the instrument. |
Transfers in and transfers out are recognized at the end of the reporting period. For the six months ended December 31, 2011, the Fund did not have any significant transfers into/out of Level 1 and Level 2.
The following is a reconciliation of assets in which significant unobservable inputs (Level 3) were used in determining fair value:
| | | | |
| | | Municipal bonds
and notes | |
Balance as of June 30, 2011 | | $ | 1,499,876 | |
Accrued discounts (premiums) | | | 0 | |
Realized gains (losses) | | | 0 | |
Change in unrealized gains (losses) | | | 124 | |
Purchases | | | 0 | |
Sales | | | (1,500,000 | ) |
Transfers into Level 3 | | | 0 | |
Transfers out of Level 3 | | | 0 | |
Balance as of December 31, 2011 | | $ | 0 | |
Change in unrealized gains (losses) relating
to securities still held at December 31, 2011 | | $ | 0 | |
4. TRANSACTIONS WITH AFFILIATES AND OTHER EXPENSES
Advisory fee
The Trust has entered into an advisory contract with Wells Fargo Funds Management, LLC (“Funds Management”), an indirect wholly owned subsidiary of Wells Fargo & Company (“Wells Fargo”). The adviser is responsible for implementing investment policies and guidelines and for supervising the sub-adviser, who is responsible for day-to-day portfolio management of the Fund.
Pursuant to the contract, Funds Management is entitled to receive an annual advisory fee starting at 0.35% and declining to 0.25% as the average daily net assets of the Fund increase. For the six months ended December 31, 2011, the advisory fee was equivalent to an annual rate of 0.35% of the Fund’s average daily net assets.
Funds Management may retain the services of certain sub-advisers to provide daily portfolio management to the Fund. The fees related to sub-advisory services are borne directly by Funds Management and do not increase the overall fees paid by the Fund. Wells Capital Management Incorporated, an affiliate of Funds Management, is the sub-adviser to the Fund and is entitled to receive a fee from Funds Management at an annual rate starting at 0.20% and declining to 0.10% as the average daily net assets of the Fund increase.
| | | | |
| 24 | | Wells Fargo Advantage Wisconsin Tax-Free Fund | | Notes to Financial Statements (Unaudited) |
Administration and transfer agent fees
The Trust has entered into an administration agreement with Funds Management. Under this agreement, for providing administrative services, which includes paying fees and expenses for services provided by the transfer agent, sub-transfer agents, omnibus account servicers and record-keepers, Funds Management is entitled to receive from the Fund an annual fund level administration fee starting at 0.05% and declining to 0.03% as the average daily net assets of the Fund increase and a class level administration fee which is calculated based on the average daily net assets of each class as follows:
| | | | |
| | | Class Level Administration Fee | |
Class A and Class C | | | 0.16 | % |
Investor Class | | | 0.19 | |
Funds Management has contractually waived and/or reimbursed advisory and administration fees to the extent necessary to maintain certain net operating expense ratios for the Fund. Waiver of fees and/or reimbursement of expenses by Funds Management were made first from fund level expenses on a proportionate basis and then from class specific expenses.
Distribution fees
The Trust has adopted a Distribution Plan for Class C shares of the Fund pursuant to Rule 12b-1 under the 1940 Act. Distribution fees are charged to Class C shares and paid to Wells Fargo Funds Distributor, LLC, the principal underwriter, at an annual rate of 0.75% of its average daily net assets.
For the six months ended December 31, 2011, Wells Fargo Funds Distributor, LLC received $3,957 from the sale of Class A shares and $20 in contingent deferred sales charges from redemptions of Class C shares.
Shareholder servicing fees
The Trust has entered into contracts with one or more shareholder servicing agents, whereby each class of the Fund is charged a fee at an annual rate of 0.25% of the average daily net assets of each respective class.
A portion of these total shareholder servicing fees were paid to affiliates of Wells Fargo.
5. INVESTMENT PORTFOLIO TRANSACTIONS
Purchases and sales of investments, excluding U.S. Government obligations (if any) and short-term securities (securities with maturities of one year or less at purchase date), for the six months ended December 31, 2011 were $23,087,888 and $13,701,617, respectively.
6. DERIVATIVE TRANSACTIONS
During the six months ended December 31, 2011, the Fund entered into futures contracts to take advantage of the differences between municipal and treasury yields and to help shorten duration of the portfolio.
At December 31, 2011, the Fund had short futures contracts outstanding as follows:
| | | | | | | | |
| Expiration Date | | Contracts | | Type | | Value at
December 31,
2011 | | Net Unrealized
Gains
(Losses) |
| March 2012 | | 60 Short | | 5-Year U.S. Treasury Notes | | $7,395,469 | | $(32,927) |
The Fund had an average notional amount of $6,299,283 in short futures contracts during the six months ended December 31, 2011.
On December 31, 2011, the cumulative unrealized losses on futures contracts in the amount of $32,927 is reflected in net unrealized gains on investments on the Statement of Assets and Liabilities. The payable for daily variation margin on open futures contracts reflected in the Statement of Assets and Liabilities only represents the current day’s variation margin. The realized losses and change in unrealized gains (losses) on futures contracts are reflected in the Statement of Operations.
| | | | | | |
| Notes to Financial Statements (Unaudited) | | Wells Fargo Advantage Wisconsin Tax-Free Fund | | | 25 | |
7. BANK BORROWINGS
The Trust (excluding the money market funds) and Wells Fargo Variable Trust are parties to a $150,000,000 revolving credit agreement with State Street Bank and Trust Company, whereby the Fund is permitted to use bank borrowings for temporary or emergency purposes, such as to fund shareholder redemption requests. Interest under the credit agreement is charged to the Fund based on a borrowing rate equal to the higher of the Federal Funds rate in effect on that day plus 1.25% or the overnight LIBOR rate in effect on that day plus 1.25%. In addition, under the credit agreement, the Fund pays an annual commitment fee equal to 0.10% of the unused balance, which is allocated pro rata. Prior to September 6, 2011, the revolving credit agreement was for $125,000,000 and the annual commitment fee paid by the Fund was 0.125% of the unused balance. For the six months ended December 31, 2011, the Fund paid $90 in commitment fees.
For the six months ended December 31, 2011, there were no borrowings by the Fund under the agreement.
8. CONCENTRATION RISK
The Fund invests a substantial portion of its assets in issuers of municipal debt securities located in a single state, therefore, it may be more affected by economic and political developments in that state or region than would be a comparable general tax-exempt mutual fund.
9. INDEMNIFICATION
Under the Trust’s organizational documents, the officers and directors are indemnified against certain liabilities that may arise out of performance of their duties to the Trust. Additionally, in the normal course of business, the Trust may enter into contracts with service providers that contain a variety of indemnification clauses. The Trust’s maximum exposure under these arrangements is dependent on future claims that may be made against the Fund and, therefore, cannot be estimated.
10. NEW ACCOUNTING PRONOUNCEMENTS
In May 2011, the Financial Accounting Standards Board (“FASB”) issued Accounting Standards Update (“ASU”) No. 2011-04 “Amendments to Achieve Common Fair Value Measurement and Disclosure Requirements in U.S. GAAP and IFRSs”. ASU No. 2011-04 amends FASB ASC Topic 820, Fair Value Measurements and Disclosures, to establish common requirements for measuring fair value and for disclosing information about fair value measurements in accordance with GAAP. The ASU is effective prospectively for interim and annual periods beginning after December 15, 2011. Management expects the adoption of the ASU will result in additional disclosures in the financial statements, as applicable.
In April 2011, FASB issued ASU No. 2011-03 “Reconsideration of Effective Control for Repurchase Agreements”. ASU No. 2011-03 amends FASB ASC Topic 860, Transfers and Servicing, specifically the criteria required to determine whether a repurchase agreement (repo) and similar agreements should be accounted for as sales of financial assets or secured borrowings with commitments. ASU No. 2011-03 changes the assessment of effective control by focusing on the transferor’s contractual rights and obligations and removing the criterion to assess its ability to exercise those rights or honor those obligations. This could result in changes to the way entities account for certain transactions including repurchase agreements, mortgage dollar rolls and reverse repurchase agreements. The ASU will become effective on a prospective basis for new transfers and modifications to existing transactions as of the beginning of the first interim or annual period beginning on or after December 15, 2011. Management has evaluated the impact of adopting the ASU and expects no significant changes.
| | | | |
| 26 | | Wells Fargo Advantage Wisconsin Tax-Free Fund | | Other Information (Unaudited) |
PROXY VOTING INFORMATION
A description of the policies and procedures that the Fund uses to determine how to vote proxies relating to portfolio securities is available without charge, upon request, by calling 1-800-222-8222, visiting our Web site at www.wellsfargo.com/advantagefunds, or visiting the SEC Web site at www.sec.gov. Information regarding how the Fund voted proxies relating to portfolio securities during the most recent 12-month period ended June 30 is available without charge on the Fund’s Web site at www.wellsfargo.com/advantagefunds or by visiting the SEC Web site at www.sec.gov.
PORTFOLIO HOLDINGS INFORMATION
The complete portfolio holdings for the Fund are publicly available on the Fund’s Web site (www.wellsfargo.com/advantagefunds) on a monthly, 30-day or more delayed basis. In addition, top ten holdings information for the Fund is publicly available on the Fund’s Web site on a monthly, seven-day or more delayed basis. The Fund files its complete schedule of portfolio holdings with the SEC for the first and third quarters of each fiscal year on Form N-Q, which is available without charge by visiting the SEC Web site at www.sec.gov. In addition, the Fund’s Form N-Q may be reviewed and copied at the SEC’s Public Reference Room in Washington, DC, and at regional offices in New York City, at 233 Broadway, and in Chicago, at 175 West Jackson Boulevard, Suite 900. Information about the Public Reference Room may be obtained by calling 1-800-SEC-0330.
| | | | | | |
| Other Information (Unaudited) | | Wells Fargo Advantage Wisconsin Tax-Free Fund | | | 27 | |
BOARD OF TRUSTEES
The following table provides basic information about the Board of Trustees (the “Trustees”) of the Trust and Officers of the Trust. This table should be read in conjunction with the Prospectus and the Statement of Additional Information1 of the Fund. Each of the Trustees and Officers listed below acts in identical capacities for the Wells Fargo Advantage family of funds, which consists of 138 funds comprising the Wells Fargo Funds Trust, Wells Fargo Variable Trust, Wells Fargo Master Trust and four closed-end funds (collectively the “Fund Complex”). All of the Trustees are also Members of the Audit and Governance Committees of each Trust in the Fund Complex. The mailing address of each Trustee and Officer is 525 Market Street, 12th Floor, San Francisco, CA 94105. Each Trustee and Officer serves an indefinite term, however, each Trustee serves such term until reaching the mandatory retirement age established by the Trustees.
Independent Trustees
| | | | | | |
Name and Year of Birth | | Position Held and Length of Service | | Principal Occupations During Past Five Years | | Other Directorships During
Past Five Years |
Peter G. Gordon
(Born 1942) | | Trustee, since 1998; Chairman, since 2005 (Lead Trustee since 2001) | | Co-Founder, Retired Chairman, President and CEO of Crystal Geyser Water Company. Trustee Emeritus, Colby College | | Asset Allocation Trust |
Isaiah Harris, Jr.
(Born 1952) | | Trustee, since 2009 | | Retired. Prior thereto, President and CEO of BellSouth Advertising and Publishing Corp. from 2005 to 2007, President and CEO of BellSouth Enterprises from 2004 to 2005 and President of BellSouth Consumer Services from 2000 to 2003. Emeritus member of the Iowa State University Foundation Board of Governors. Emeritus Member of the Advisory Board of Iowa State University School of Business. Mr. Harris is a certified public accountant. | | CIGNA Corporation; Deluxe Corporation; Asset Allocation Trust |
Judith M. Johnson
(Born 1949) | | Trustee, since 2008 | | Retired. Prior thereto, Chief Executive Officer and Chief Investment Officer of Minneapolis Employees Retirement Fund from 1996 to 2008. Ms. Johnson is an attorney, certified public accountant and a certified managerial accountant. | | Asset Allocation Trust |
Leroy Keith, Jr.
(Born 1939) | | Trustee, since 2010 | | Chairman, Bloc Global Services (development and construction). Trustee of the Evergreen Funds from 1983 to 2010. Former Managing Director, Almanac Capital Management (commodities firm), former Partner, Stonington Partners, Inc. (private equity fund), former Director, Obagi Medical Products Co. and former Director, Lincoln Educational Services. | | Trustee, Virtus Fund Complex (consisting of 40 portfolios as of 12/31/11); Asset Allocation Trust |
David F. Larcker
(Born 1950) | | Trustee, since 2009 | | James Irvin Miller Professor of Accounting at the Graduate School of Business, Stanford University, Director of Corporate Governance Research Program and Senior Faculty of The Rock Center for Corporate Governance since 2006. From 2005 to 2008, Professor of Accounting at the Graduate School of Business, Stanford University. Prior thereto, Ernst & Young Professor of Accounting at The Wharton School, University of Pennsylvania from 1985 to 2005. | | Asset Allocation Trust |
Olivia S. Mitchell
(Born 1953) | | Trustee, since 2006 | | International Foundation of Employee Benefit Plans Professor, Wharton School of the University of Pennsylvania since 1993. Director of Wharton’s Pension Research Council and Boettner Center on Pensions & Retirement Research, and Research Associate at the National Bureau of Economic Research. Previously, Cornell University Professor from 1978 to 1993. | | Asset Allocation Trust |
| | | | |
| 28 | | Wells Fargo Advantage Wisconsin Tax-Free Fund | | Other Information (Unaudited) |
| | | | | | |
Name and Year of Birth | | Position Held and Length of Service | | Principal Occupations During Past Five Years | | Other Directorships During
Past Five Years |
Timothy J. Penny
(Born 1951) | | Trustee, since 1996 | | President and CEO of Southern Minnesota Initiative Foundation, a non-profit organization, since 2007 and Senior Fellow at the Humphrey Institute Policy Forum at the University of Minnesota since 1995. Member of the Board of Trustees of NorthStar Education Finance, Inc., a non-profit organization, since 2007. | | Asset Allocation Trust |
Michael S. Scofield
(Born 1943) | | Trustee, since 2010 | | Served on the Investment Company Institute’s Board of Governors and Executive Committee from 2008-2011 as well the Governing Council of the Independent Directors Council from 2006-2011 and the Independent Directors Council Executive Committee from 2008-2011. Chairman of the IDC from 2008-2010. Institutional Investor (Fund Directions) Trustee of Year in 2007. Trustee of the Evergreen Funds (and its predecessors) from 1984 to 2010. Chairman of the Evergreen Funds from 2000-2010. Former Trustee of the Mentor Funds. Retired Attorney, Law Offices of Michael S. Scofield and former Director and Chairman, Branded Media Corporation (multi-media branding company). | | Asset Allocation Trust |
Donald C. Willeke
(Born 1940) | | Trustee, since 1996 | | Principal of the law firm of Willeke & Daniels. General Counsel of the Minneapolis Employees Retirement Fund from 1984 until its consolidation into the Minnesota Public Employees Retirement Association on June 30, 2010. Director and Vice Chair of The Free Trust (non-profit corporation). Director of the American Chestnut Foundation (non-profit corporation). | | Asset Allocation Trust |
Officers
| | | | | | |
Name and Year of Birth | | Position Held and
Length of Service | | Principal Occupations During Past Five Years | | |
Karla M. Rabusch
(Born 1959) | | President, since 2003 | | Executive Vice President of Wells Fargo Bank, N.A. and President of Wells Fargo Funds Management, LLC since 2003. Senior Vice President and Chief Administrative Officer of Wells Fargo Funds Management, LLC from 2001 to 2003. | | |
C. David Messman
(Born 1960) | | Secretary, since 2000; Chief Legal Counsel, since 2003 | | Senior Vice President and Secretary of Wells Fargo Funds Management, LLC since 2001. Vice President and Managing Senior Counsel of Wells Fargo Bank, N.A. since 1996. | | |
Kasey Phillips
(Born 1970) | | Treasurer, since 2009 | | Senior Vice President of Wells Fargo Funds Management, LLC since 2009. Senior Vice President of Evergreen Investment Management Company, LLC from 2006 to 2010. Treasurer of the Evergreen Funds from 2005 to 2010. | | |
David Berardi
(Born 1975) | | Assistant Treasurer, since 2009 | | Vice President of Wells Fargo Funds Management, LLC since 2009. Vice President of Evergreen Investment Management Company, LLC from 2008 to 2010. Assistant Vice President of Evergreen Investment Services, Inc. from 2004 to 2008. Manager of Fund Reporting and Control for Evergreen Investment Management Company, LLC from 2004 to 2010. | | |
Jeremy DePalma
(Born 1974) | | Assistant Treasurer, since 2009 | | Senior Vice President of Wells Fargo Funds Management, LLC since 2009. Senior Vice President of Evergreen Investment Management Company, LLC from 2008 to 2010. Vice President, Evergreen Investment Services, Inc. from 2004 to 2007. Head of the Fund Reporting and Control Team within Fund Administration from 2005 to 2010. | | |
Debra Ann Early
(Born 1964) | | Chief Compliance Officer, since 2007 | | Chief Compliance Officer of Wells Fargo Funds Management, LLC since 2007. Chief Compliance Officer of Parnassus Investments from 2005 to 2007. Chief Financial Officer of Parnassus Investments from 2004 to 2007 and Senior Audit Manager of PricewaterhouseCoopers LLP from 1998 to 2004. | | |
| 1. | The Statement of Additional Information includes additional information about the Trustees and is available, without charge, upon request, by calling 1-800-222-8222 or by visiting the Web site at www.wellsfargo.com/advantagefunds. |
| | | | | | |
| List of Abbreviations | | Wells Fargo Advantage Wisconsin Tax-Free Fund | | | 29 | |
The following is a list of common abbreviations for terms and entities which may have appeared in this report.
| ACB | — Agricultural Credit Bank |
| ADR | — American Depository Receipt |
| ADS | — American Depository Shares |
| AGC-ICC | — Assured Guaranty Corporation - Insured Custody Certificates |
| AGM | — Assured Guaranty Municipal |
| AMBAC | — American Municipal Bond Assurance Corporation |
| AMT | — Alternative Minimum Tax |
| BAN | — Bond Anticipation Notes |
| BHAC | — Berkshire Hathaway Assurance Corporation |
| CAB | — Capital Appreciation Bond |
| CCAB | — Convertible Capital Appreciation Bond |
| CDA | — Community Development Authority |
| CDO | — Collateralized Debt Obligation |
| COP | — Certificate of Participation |
| DRIVER | — Derivative Inverse Tax-Exempt Receipts |
| DW&P | — Department of Water & Power |
| DWR | — Department of Water Resources |
| ECFA | — Educational & Cultural Facilities Authority |
| EDA | — Economic Development Authority |
| EDFA | — Economic Development Finance Authority |
| ETF | — Exchange-Traded Fund |
| FFCB | — Federal Farm Credit Bank |
| FGIC | — Financial Guaranty Insurance Corporation |
| FHA | — Federal Housing Authority |
| FHLB | — Federal Home Loan Bank |
| FHLMC | — Federal Home Loan Mortgage Corporation |
| FNMA | — Federal National Mortgage Association |
| GDR | — Global Depository Receipt |
| GNMA | — Government National Mortgage Association |
| HCFR | — Healthcare Facilities Revenue |
| HEFA | — Health & Educational Facilities Authority |
| HEFAR | — Higher Education Facilities Authority Revenue |
| HFA | — Housing Finance Authority |
| HFFA | — Health Facilities Financing Authority |
| IBC | — Insured Bond Certificate |
| IDA | — Industrial Development Authority |
| IDAG | — Industrial Development Agency |
| IDR | — Industrial Development Revenue |
| KRW | — Republic of Korea Won |
| LIBOR | — London Interbank Offered Rate |
| LLC | — Limited Liability Company |
| LLP | — Limited Liability Partnership |
| MBIA | — Municipal Bond Insurance Association |
| MFHR | — Multi-Family Housing Revenue |
| MSTR | — Municipal Securities Trust Receipts |
| MUD | — Municipal Utility District |
| NATL-RE | — National Public Finance Guarantee Corporation |
| PCFA | — Pollution Control Finance Authority |
| PCR | — Pollution Control Revenue |
| PFA | — Public Finance Authority |
| PFFA | — Public Facilities Financing Authority |
| PFOTER | — Puttable Floating Option Tax-Exempt Receipts |
| plc | — Public Limited Company |
| PUTTER | — Puttable Tax-Exempt Receipts |
| R&D | — Research & Development |
| RDA | — Redevelopment Authority |
| RDFA | — Redevelopment Finance Authority |
| REIT | — Real Estate Investment Trust |
| ROC | — Reset Option Certificates |
| SAVRS | — Select Auction Variable Rate Securities |
| SBA | — Small Business Authority |
| SFHR | — Single Family Housing Revenue |
| SFMR | — Single Family Mortgage Revenue |
| SPDR | — Standard & Poor’s Depositary Receipts |
| TAN | — Tax Anticipation Notes |
| TIPS | — Treasury Inflation-Protected Securities |
| TRAN | — Tax Revenue Anticipation Notes |
| TCR | — Transferable Custody Receipts |
| TTFA | — Transportation Trust Fund Authority |
| TVA | — Tennessee Valley Authority |
| XLCA | — XL Capital Assurance |
This page is intentionally left blank.


FOR MORE INFORMATION
More information about Wells Fargo Advantage Funds is available free upon request. To obtain literature, please write, e-mail, visit the Fund’s Web site, or call:
Wells Fargo Advantage Funds
P.O. Box 8266
Boston, MA 02266-8266
E-mail: wfaf@wellsfargo.com
Web site: www.wellsfargo.com/advantagefunds
Individual investors: 1-800-222-8222
Retail investment professionals: 1-888-877-9275
Institutional investment professionals: 1-866-765-0778
This report and the financial statements contained herein are submitted for the general information of the shareholders of Wells Fargo Advantage Funds. If this report is used for promotional purposes, distribution of the report must be accompanied or preceded by a current prospectus. For a prospectus containing more complete information, including charges and expenses, call 1-800-222-8222 or visit the Fund’s Web site at www.wellsfargo.com/advantagefunds. Please consider the investment objectives, risks, charges, and expenses of the investment carefully before investing. This and other information about Wells Fargo Advantage Funds can be found in the current prospectus. Read the prospectus carefully before you invest or send money.
Wells Fargo Funds Management, LLC, a wholly owned subsidiary of Wells Fargo & Company, provides investment advisory and administrative services for Wells Fargo Advantage Funds. Other affiliates of Wells Fargo & Company provide subadvisory and other services for the Funds. The Funds are distributed by Wells Fargo Funds Distributor, LLC, Member FINRA/SIPC, an affiliate of Wells Fargo & Company.
NOT FDIC INSURED ¡ NO BANK GUARANTEE ¡ MAY LOSE VALUE
© 2012 Wells Fargo Funds Management, LLC. All rights reserved.
| | |
 | | 207593 02-12 SA259/SAR259 12-11 |
ITEM 2. CODE OF ETHICS
Not required in this filing
ITEM 3. AUDIT COMMITTEE FINANCIAL EXPERT
Not required in this filing.
ITEM 4. PRINCIPAL ACCOUNTANT FEES AND SERVICES
Not required in this filing.
ITEM 5. AUDIT COMMITTEE OF LISTED REGISTRANTS
Not required in this filing.
ITEM 6. SCHEDULE OF INVESTMENTS
The Schedule of Investments is included as part of the report to shareholders filed under Item 1 of this Form.
ITEM 7. DISCLOSURE OF PROXY VOTING POLICIES AND PROCEDURES FOR CLOSED-END MANAGEMENT INVESTMENT COMPANIES
Not applicable.
ITEM 8. PORTFOLIO MANAGERS OF CLOSED-END MANAGEMENT INVESTMENT COMPANIES
Not applicable.
ITEM 9. PURCHASES OF EQUITY SECURITIES BY CLOSED-END MANAGEMEENT INVESTMENT COMPANY AND AFFILIATED PURCHASES
Not applicable.
ITEM 10. SUBMISSION OF MATTERS TO A VOTE OF SECURITY HOLDERS
The Governance Committee (the “Committee”) of the Board of Trustees of the registrant (the “Trust”) has adopted procedures by which a shareholder of any series of the Trust may submit properly a nominee recommendation for the Committee’s consideration.
The shareholder must submit any such recommendation (a “Shareholder Recommendation”) in writing to the Trust, to the attention of the Trust’s Secretary, at the address of the principal executive offices of the Trust.
The Shareholder Recommendation must be delivered to, or mailed and received at, the principal executive offices of the Trust not less than forty-five (45) calendar days nor more than seventy-five (75) calendar days prior to the date of the Committee meeting at which the nominee would be considered.
The Shareholder Recommendation must include: (i) a statement in writing setting forth (A) the name, age, date of birth, business address, residence address and nationality of the person recommended by the shareholder (the “candidate”); (B) the series (and, if applicable, class) and number of all shares of the Trust owned of record or beneficially by the candidate, as reported to such shareholder by the candidate; (C) any other information regarding the candidate called for with respect to director nominees by paragraphs (a), (d), (e) and (f) of Item 401 of Regulation S-K or paragraph (b) of Item 22 of Rule 14a-101 (Schedule 14A) under the Securities Exchange Act of 1934, as amended (the “Exchange Act”), adopted by the Securities and Exchange Commission (or the corresponding provisions of any regulation or rule subsequently adopted by the Securities and Exchange Commission or any successor agency applicable to the Trust); (D) any other information regarding the candidate that would be required to be disclosed if the candidate were a nominee in a proxy statement or other filing required to be made in connection with solicitation of proxies for election of directors pursuant to Section 14 of the Exchange Act and the rules and regulations promulgated thereunder; and (E) whether the recommending shareholder believes that the candidate is or will be an “interested person” of the Trust (as defined in the Investment Company Act of 1940, as amended) and, if not an “interested person,” information regarding the candidate that will be sufficient for the Trust to make such determination; (ii) the written and signed consent of the candidate to be named as a nominee and to serve as a Trustee if elected; (iii) the recommending shareholder’s name as it appears on the Trust’s books; (iv) the series (and, if applicable, class) and number of all shares of the Trust owned beneficially and of record by the recommending shareholder; and (v) a description of all arrangements or understandings between the recommending shareholder and the candidate and any other person or persons (including their names) pursuant to which the recommendation is being made by the recommending shareholder. In addition, the Committee may require the candidate to interview in person and furnish such other information as it may reasonably require or deem necessary to determine the eligibility of such candidate to serve as a Trustee of the Trust.
ITEM 11. CONTROLS AND PROCEDURES
(a) The President and Treasurer have concluded that the Wells Fargo Funds Trust (the “Trust”) disclosure controls and procedures (as defined in Rule 30a-3(c) under the Investment Company Act of 1940) provide reasonable assurances that material information relating to the Trust is made known to them by the appropriate persons, based on their evaluation of these controls and procedures as of a date within 90 days of the filing of this report.
(b) There were no significant changes in the Trust’s internal controls over financial reporting (as defined in Rule 30a-3(d) under the Investment Company Act of 1940) that occurred during the second quarter of the period covered by this report that materially affected, or is reasonably likely to materially affect, the registrant’s internal control over financial reporting.
ITEM 12. EXHIBITS
(a)(1) Not required in this filing.
(a)(2) Certification pursuant to Rule 30a-2(a) under the Investment Company Act of 1940 (17 CFR 270.30a-2(a)) is filed and attached hereto as Exhibit 99.CERT.
(a)(3) Not applicable.
(b) Certification pursuant to Rule 30a-2(b) under the Investment Company Act of 1940 (17 CFR 270.30a-2(b)) is filed and attached hereto as Exhibit 99.906CERT.
SIGNATURES
Pursuant to the requirements of the Securities Exchange Act of 1934 and the Investment Company Act of 1940, the registrant has duly caused this report to be signed on its behalf by the undersigned, thereunto duly authorized.
| | |
| Wells Fargo Funds Trust |
| |
| By: | | |
| | /s/ Karla M. Rabusch |
| |
| | Karla M. Rabusch |
| | President |
| |
| Date: | | February 24, 2012 |
Pursuant to the requirements of the Securities Exchange Act of 1934 and the Investment Company Act of 1940, this report has been signed below by the following persons on behalf of the registrant and in the capacities and on the date indicated.
| | |
| By: | | |
| | /s/ Karla M. Rabusch |
| |
| | Karla M. Rabusch |
| | President |
| |
| Date: | | February 24, 2012 |
| | |
| By: | | |
| | /s/ Kasey L. Phillips |
| |
| | Kasey L. Phillips |
| | Treasurer |
| |
| Date: | | February 24, 2012 |