
UNITED STATES
SECURITIES AND EXCHANGE COMMISSION
Washington, D.C. 20549
FORM N-CSRS
CERTIFIED SHAREHOLDER REPORT OF REGISTERED
MANAGEMENT INVESTMENT COMPANIES
Investment Company Act file number: 811-09253
Wells Fargo Funds Trust
(Exact name of registrant as specified in charter)
525 Market St., San Francisco, CA 94105
(Address of principal executive offices) (Zip code)
C. David Messman
Wells Fargo Funds Management, LLC
525 Market St., San Francisco, CA 94105
(Name and address of agent for service)
Registrant’s telephone number, including area code: 800-222-8222
| | |
| Date of fiscal year end: | | July 31, 2011 |
| |
| Date of reporting period: | | January 31, 2012 |
ITEM 1. REPORT TO SHAREHOLDERS

Wells Fargo Advantage Capital Growth Fund

Semi-Annual Report
January 31, 2012

Reduce clutter. Save trees.
Sign up for electronic delivery of prospectuses and shareholder reports at wellsfargo.com/advantagedelivery
Contents
The views expressed and any forward-looking statements are as of January 31, 2012, unless otherwise noted, and are those of the Fund managers and/or Wells Fargo Funds Management, LLC. Discussions of individual securities, or the markets generally, or any Wells Fargo Advantage Fund are not intended as individual recommendations. Future events or results may vary significantly from those expressed in any forward-looking statements; the views expressed are subject to change at any time in response to changing circumstances in the market. Wells Fargo Funds Management, LLC, disclaims any obligation to publicly update or revise any views expressed or forward-looking statements.
NOT FDIC INSURED ¡ NO BANK GUARANTEE ¡ MAY LOSE VALUE

WELLS FARGO INVESTMENT HISTORY
| | |
| |
| 1932 | | Keystone creates one of the first mutual fund families. |
| |
| 1971 | | Wells Fargo & Company introduces one of the first institutional index funds. |
| |
| 1978 | | Wells Fargo applies Markowitz and Sharpe’s research on Modern Portfolio Theory to introduce one of the industry’s first Tactical Asset Allocation (TAA) models in institutional separately managed accounts. |
| |
| 1984 | | Wells Fargo Stagecoach Funds launches its first asset allocation fund. |
| |
| 1989 | | The Tactical Asset Allocation (TAA) Model is first applied to Wells Fargo’s asset allocation mutual funds. |
| |
| 1994 | | Wells Fargo introduces the LifePath Funds, one of the first suites of target date funds (now the Wells Fargo Advantage Dow Jones Target Date FundsSM). |
| |
| 1996 | | Evergreen Investments and Keystone Funds merge. |
| |
| 1997 | | Wells Fargo launches Wells Fargo Advantage WealthBuilder PortfoliosSM, a fund-of-funds suite of products that includes the use of quantitative models to shift assets among investment styles. |
| |
| 1999 | | Norwest Advantage Funds and Stagecoach Funds are reorganized into Wells Fargo Funds after the merger of Norwest and Wells Fargo. |
| |
| 2002 | | Evergreen Retail and Evergreen Institutional companies form the umbrella asset management company, Evergreen Investments. |
| |
| 2005 | | The integration of Strong Funds with Wells Fargo Funds creates Wells Fargo Advantage Funds, resulting in one of the top 20 mutual fund companies in the United States. |
| |
| 2006 | | Wells Fargo Advantage Funds relaunches the target date product line as Wells Fargo Advantage Dow Jones Target Date Funds. |
| |
| 2010 | | The mergers and reorganizations of Evergreen and Wells Fargo Advantage mutual funds are completed, unifying the families under the brand of Wells Fargo Advantage Funds. |
Wells Fargo Advantage Funds®
Wells Fargo Advantage Funds skillfully guides institutions, financial advisors, and individuals through the investment terrain to help them reach their financial objectives. Everything we do on behalf of investors is backed by our unique combination of qualifications.
Strength
Our organization is built on the standards of integrity and service established by our parent company—Wells Fargo & Company—more than 150 years ago. And, because we’re part of a highly diversified financial enterprise, we offer the depth of resources to help investors succeed.
Expertise
Our multi-boutique model offers investors access to the independent thinking of premier investment managers that have been chosen for their time-tested strategies. While each team specializes in a specific investment strategy, collectively they provide investors a wide choice of distinct investment styles. Our dedication to investment excellence doesn’t end with our expertise in manager selection—risk management, analysis, and rigorous ongoing review seek to ensure each manager’s investment process remains consistent.
Partnership
Our collaborative approach is built around understanding the needs and goals of our clients. By adhering to core principles of sound judgment and steady guidance, we support you through every stage of the investment decision process.
Carefully consider a fund’s investment objectives, risks, charges, and expenses before investing. For a current prospectus and, if available, a summary prospectus, containing this and other information, visit wellsfargoadvantagefunds.com. Read it carefully before investing.
Wells Fargo Funds Management, LLC, a wholly owned subsidiary of Wells Fargo & Company, provides investment advisory and administrative services for Wells Fargo Advantage Funds®. Other affiliates of Wells Fargo & Company provide subadvisory and other services for the Funds. The Funds are distributed by Wells Fargo Funds Distributor, LLC, Member FINRA/SIPC, an affiliate of Wells Fargo & Company.
“Dow Jones®” and “Dow Jones Target Date IndexesSM” are service marks of Dow Jones Trademark Holdings, LLC (“Dow Jones”), have been licensed to CME Group Index Services LLC (“CME Indexes”) and have been sublicensed for use for certain purposes by Global Index Advisors, Inc, and Wells Fargo Funds Management, LLC. The Wells Fargo Advantage Dow Jones Target Date FundsSM based on the Dow Jones Target Date IndexesSM, are not sponsored, endorsed, sold or promoted by Dow Jones, CME Indexes or their respective affiliates and none of them makes any representation regarding the advisability of investing in such product(s).
NOT FDIC INSURED ¡ NO BANK GUARANTEE ¡ MAY LOSE VALUE
Not part of the semi-annual report.
Wells Fargo Advantage Funds offers more than 110 mutual funds across a wide range of asset classes, representing over $217 billion in assets under management, as of January 31, 2012.
| | | | |
| Equity Funds | | | | |
Asia Pacific Fund | | Equity Value Fund | | Precious Metals Fund |
C&B Large Cap Value Fund | | Global Opportunities Fund | | Premier Large Company Growth Fund |
C&B Mid Cap Value Fund | | Growth Fund | | Small Cap Opportunities Fund |
Capital Growth Fund | | Index Fund | | Small Cap Value Fund |
Common Stock Fund | | International Equity Fund | | Small Company Growth Fund |
Disciplined U.S. Core Fund | | International Value Fund | | Small Company Value Fund |
Discovery Fund† | | Intrinsic Small Cap Value Fund | | Small/Mid Cap Core Fund |
Diversified Equity Fund | | Intrinsic Value Fund | | Small/Mid Cap Value Fund |
Diversified International Fund | | Intrinsic World Equity Fund | | Special Mid Cap Value Fund |
Diversified Small Cap Fund | | Large Cap Core Fund | | Special Small Cap Value Fund |
Emerging Growth Fund | | Large Cap Growth Fund | | Specialized Technology Fund |
Emerging Markets Equity Fund | | Large Company Value Fund | | Strategic Large Cap Growth Fund |
Endeavor Select Fund† | | Omega Growth Fund | | Traditional Small Cap Growth Fund |
Enterprise Fund† | | Opportunity Fund† | | Utility and Telecommunications Fund |
| Bond Funds | | | | |
Adjustable Rate Government Fund | | Inflation-Protected Bond Fund | | Short-Term Bond Fund |
California Limited-Term Tax-Free Fund | | Intermediate Tax/AMT-Free Fund | | Short-Term High Yield Bond Fund |
California Tax-Free Fund | | International Bond Fund | | Short-Term Municipal Bond Fund |
Colorado Tax-Free Fund | | Minnesota Tax-Free Fund | | Strategic Municipal Bond Fund |
Government Securities Fund | | Municipal Bond Fund | | Total Return Bond Fund |
High Income Fund | | North Carolina Tax-Free Fund | | Ultra Short-Term Income Fund |
High Yield Bond Fund | | Pennsylvania Tax-Free Fund | | Ultra Short-Term Municipal Income Fund |
Income Plus Fund | | Short Duration Government Bond Fund | | Wisconsin Tax-Free Fund |
| Asset Allocation Funds | | | | |
Absolute Return Fund | | WealthBuilder Equity Portfolio† | | Target 2020 Fund† |
Asset Allocation Fund | | WealthBuilder Growth Allocation Portfolio† | | Target 2025 Fund† |
Conservative Allocation Fund | | WealthBuilder Growth Balanced Portfolio† | | Target 2030 Fund† |
Diversified Capital Builder Fund | | WealthBuilder Moderate Balanced Portfolio† | | Target 2035 Fund† |
Diversified Income Builder Fund | | WealthBuilder Tactical Equity Portfolio† | | Target 2040 Fund† |
Growth Balanced Fund | | Target Today Fund† | | Target 2045 Fund† |
Index Asset Allocation Fund | | Target 2010 Fund† | | Target 2050 Fund† |
Moderate Balanced Fund | | Target 2015 Fund† | | Target 2055 Fund† |
WealthBuilder Conservative Allocation Portfolio† | | | | |
| Money Market Funds | | | | |
100% Treasury Money Market Fund | | Heritage Money Market Fund† | | National Tax-Free Money Market Fund |
California Municipal Money Market Fund | | Money Market Fund | | Prime Investment Money Market Fund |
Cash Investment Money Market Fund | | Municipal Cash Management Money Market Fund | | Treasury Plus Money Market Fund |
Government Money Market Fund | | Municipal Money Market Fund | | |
| Variable Trust Funds1 | | | | |
VT Discovery Fund† | | VT Intrinsic Value Fund | | VT Small Cap Growth Fund |
VT Index Asset Allocation Fund | | VT Omega Growth Fund | | VT Small Cap Value Fund |
VT International Equity Fund | | VT Opportunity Fund† | | VT Total Return Bond Fund |
An investment in a money market fund is not insured or guaranteed by the Federal Deposit Insurance Corporation or any other government agency. Although the Wells Fargo Advantage Money Market Funds seek to preserve the value of your investment at $1.00 per share, it is possible to lose money by investing in a money market fund.
| 1. | The Variable Trust Funds are generally available only through insurance company variable contracts. |
| † | In this report, the Wells Fargo Advantage Discovery FundSM, Wells Fargo Advantage Endeavor Select FundSM, Wells Fargo Advantage Enterprise FundSM, Wells Fargo Advantage Opportunity FundSM, Wells Fargo Advantage WealthBuilder Conservative Allocation PortfolioSM, Wells Fargo Advantage WealthBuilder Equity PortfolioSM, Wells Fargo Advantage WealthBuilder Growth Allocation PortfolioSM, Wells Fargo Advantage WealthBuilder Growth Balanced PortfolioSM, Wells Fargo Advantage WealthBuilder Moderate Balanced PortfolioSM, Wells Fargo Advantage WealthBuilder Tactical Equity PortfolioSM, Wells Fargo Advantage Dow Jones Target Today FundSM, Wells Fargo Advantage Dow Jones Target 2010 FundSM, Wells Fargo Advantage Dow Jones Target 2015 FundSM, Wells Fargo Advantage Dow Jones Target 2020 FundSM, Wells Fargo Advantage Dow Jones Target 2025 FundSM, Wells Fargo Advantage Dow Jones Target 2030 FundSM, Wells Fargo Advantage Dow Jones Target 2035 FundSM, Wells Fargo Advantage Dow Jones Target 2040 FundSM, Wells Fargo Advantage Dow Jones Target 2045 FundSM, Wells Fargo Advantage Dow Jones Target 2050 FundSM, Wells Fargo Advantage Dow Jones Target 2055 FundSM, Wells Fargo Advantage Heritage Money Market FundSM, Wells Fargo Advantage VT Discovery FundSM, and Wells Fargo Advantage VT Opportunity FundSM are referred to as the Discovery Fund, Endeavor Select Fund, Enterprise Fund, Opportunity Fund, WealthBuilder Conservative Allocation Portfolio, WealthBuilder Equity Portfolio, WealthBuilder Growth Allocation Portfolio, WealthBuilder Growth Balanced Portfolio, WealthBuilder Moderate Balanced Portfolio, WealthBuilder Tactical Equity Portfolio, Target Today Fund, Target 2010 Fund, Target 2015 Fund, Target 2020 Fund, Target 2025 Fund, Target 2030 Fund, Target 2035 Fund, Target 2040 Fund, Target 2045 Fund, Target 2050 Fund, Target 2055 Fund, Heritage Money Market Fund, VT Discovery Fund, and VT Opportunity Fund, respectively. |
Not part of the semi-annual report.
| | | | |
| 2 | | Wells Fargo Advantage Capital Growth Fund | | Letter to Shareholders |

Karla M. Rabusch,
President
Wells Fargo Advantage Funds
The period was marked by increased confidence that the U.S. economy was staging a fragile recovery, offset by continued concerns about the possible effect on the global economy of the ongoing European sovereign debt crisis—which began in Greece and later spread to the larger economies of Italy and Spain.
The slow-motion debt crisis in the eurozone was a major headwind to both domestic and global stock market indexes.
Dear Valued Shareholder:
We’re pleased to offer you this semi-annual report for the Wells Fargo Advantage Capital Growth Fund for the six-month period that ended January 31, 2012. The period was marked by increased confidence that the U.S. economy was staging a fragile recovery, offset by continued concerns about the possible effect on the global economy of the ongoing European sovereign debt crisis—which began in Greece and later spread to the larger economies of Italy and Spain. Most U.S. stock indexes posted gains for the period, even if only modest ones.
Worries gave way to guarded optimism for the U.S. economy.
The period began with worries that the U.S. economy was returning to recession. Revised figures for gross domestic product (GDP) indicated that the U.S. economy grew by an annualized rate of only 0.8% in the first half of 2011. Moreover, although the July 2011 Institute for Supply Management (ISM) manufacturing survey suggested that factories continued to expand, the rate of expansion was lower than in previous months. The prolonged debate over whether and how to raise the U.S. debt ceiling—which only ended on July 31, 2011—also depressed market sentiment by highlighting the country’s political divisions.
The stock market remained volatile throughout September. By late October, however, stronger economic data led to greater optimism and higher stock prices. Revised real GDP growth came in at 1.8% in the third quarter of 2011 and 2.8% in the fourth quarter, suggesting that the recovery was on firmer footing. Economic growth was not evenly distributed, though, as December 2011 retail same-store sales generally showed stronger growth for retailers targeting affluent customers than for those targeting the broad middle class. The reported unemployment rate also showed some signs of improvement, falling from 9.1% in August 2011 to 8.3% in January 2012. However, this decline in the unemployment rate was accompanied by an increase in the number of Americans not in the labor force, raising concerns about the economy’s ability to generate jobs.
The eurozone had continued trouble.
The slow-motion debt crisis in the eurozone was a major headwind to both domestic and global stock market indexes. The worsening debt and deficit numbers for Greece in late 2011 and early 2012 cast doubt on the country’s ability to service its debt under the plan put in place by the European Union and the International Monetary Fund and put the ongoing drama of the European sovereign debt crisis back on center stage. Investors became increasingly concerned that Greece would default on its debt, a scenario that only seemed more likely as many Greeks rioted in response to greater budgetary austerity and the discussion moved from whether private investors would take a loss on their Greek debt to how big the loss would be. Because many eurozone banks owned Greek debt and many U.S. banks had financial ties to eurozone banks, investors worried about the effect of such an event on the financial system and the global economy.
Even as the situation in Greece deteriorated, eurozone GDP numbers supported the case for a modest recovery in the global economy. Reported GDP growth for the 17 countries that comprise the eurozone was modest, rising 0.2% in the third quarter compared to the second quarter, and by 0.2% in the fourth quarter
| | | | | | |
| Letter to Shareholders | | Wells Fargo Advantage Capital Growth Fund | | | 3 | |
compared to the third quarter. However, the eurozone average concealed a wide variation between economies, with Germany’s growing by 0.5% in the third quarter of 2011 even as Greece’s GDP contracted.
Central banks continued to provide stimulus.
Throughout the reporting period, the Federal Open Market Committee (FOMC) kept its key interest rates effectively at zero in order to support the economy and financial system. Moreover, in response to extreme market volatility and signs of a weakening economy, in its August 2011 policy statement, the Federal Reserve (Fed) announced it would keep interest rates “exceptionally low” until at least mid-2013 as a way to support the economy. Market participants interpreted the Fed’s statement to mean that the central bankers believed the economy would remain weak over the next two years. However, the Fed also said that it was considering a “range of policy tools available to promote a stronger economic recovery” and “is prepared to employ these tools as appropriate.”
At the beginning of the period, the European Central Bank (ECB) had a key rate of 1.50% but lowered it to 1.25% in November 2011 and then to 1.00% in December 2011 in an attempt to support the sluggish eurozone recovery. To support the banking system, in late 2011, the ECB initiated a long-term refinancing operation (LTRO) in which it supplied three-year loans to banks against a wide range of collateral. The operation basically provided a near-unlimited amount of liquidity to banks, easing some investor concerns about the effect of an increasingly probable Greek default.
We use time-tested investment strategies, even as many variables are at work in the market.
Experience tells us that strict adherence to time-tested investment strategies has its rewards. As a whole, Wells Fargo Advantage Funds represents investments across a range of asset classes and investment styles, giving you an opportunity to create a diversified investment portfolio. While diversification may not prevent losses in a downturn, it does provide you with one way of managing risk.
Thank you for choosing to invest with Wells Fargo Advantage Funds. We appreciate your confidence in us and remain committed to helping you meet your financial needs. For current information about your fund investments, contact your investment professional, visit our website at wellsfargoadvantagefunds.com, or call us directly at 1-800-222-8222. We are available 24 hours a day, 7 days a week.
Sincerely,

Karla M. Rabusch
President
Wells Fargo Advantage Funds
| | | | |
| 4 | | Wells Fargo Advantage Capital Growth Fund | | Letter to Shareholders |
Notice to Shareholders
The Board of Trustees for Wells Fargo Advantage Funds has unanimously approved the following modifications to certain net asset value (NAV) waiver privileges and commission schedules:
| | n | | Effective May 1, 2012, automatic investment plan (AIP) purchases and proceeds received from systematic withdrawals will no longer qualify for NAV repurchase privileges. | |
| | n | | Effective May 1, 2012, discretionary rights to waive the upfront commission for Class C and “jumbo” Class A share purchases will no longer be granted to broker/dealers. However, we will continue to waive the Class C shares contingent deferred sales charge for redemptions by employer-sponsored retirement plans where the dealer of record waived its commission at the time of purchase. | |
| | n | | Effective July 31, 2012, NAV purchase privileges for former Evergreen Class IS and Class R shareholders are being modified to remove the ability to purchase Class A shares at NAV unless those shares are held directly with the Fund on or after July 31, 2012. | |
Please contact your investment professional or call us directly at 1-800-222-8222 if you have any questions on this Notice to Shareholders.
| | | | | | |
| Performance Highlights (Unaudited) | | Wells Fargo Advantage Capital Growth Fund | | | 5 | |
INVESTMENT OBJECTIVE
The Fund seeks long-term capital appreciation.
ADVISER
Wells Fargo Funds Management, LLC
SUB-ADVISER
Wells Capital Management Incorporated
PORTFOLIO MANAGERS
Thomas J. Pence, CFA
Michael T. Smith, CFA
FUND INCEPTION
November 3, 1997
| | | | |
TEN LARGEST EQUITY HOLDINGS1 (AS OF JANUARY 31, 2012) | |
Apple Incorporated | | | 7.97% | |
Google Incorporated Class A | | | 3.44% | |
QUALCOMM Incorporated | | | 2.86% | |
Amazon.com Incorporated | | | 2.33% | |
Monsanto Company | | | 2.22% | |
Costco Wholesale Corporation | | | 2.14% | |
Danaher Corporation | | | 2.06% | |
Occidental Petroleum Corporation | | | 2.03% | |
Pioneer Natural Resources Company | | | 1.99% | |
priceline.com Incorporated | | | 1.97% | |
| | |
SECTOR DISTRIBUTION2 (AS OF JANUARY 31, 2012) |
|
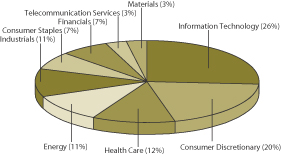 |
| 1. | The ten largest equity holdings are calculated based on the value of the securities divided by total net assets of the Fund. Holdings are subject to change and may have changed since the date specified. |
| 2. | Sector distribution is subject to change and is calculated based on the total long-term investments of the Fund. |
| | | | |
| 6 | | Wells Fargo Advantage Capital Growth Fund | | Performance Highlights (Unaudited) |
AVERAGE ANNUAL TOTAL RETURN3 (%) (AS OF JANUARY 31, 2012)
| | | | | | | | | | | | | | | | | | | | | | | | | | | | | | | | | | | | | | | | | | | | |
| | | | | | Including Sales Charge | | | Excluding Sales Charge | | | Expense Ratios4 | |
| | | Inception Date | | | 6 Months* | | | 1 Year | | | 5 Year | | | 10 Year | | | 6 Months* | | | 1 Year | | | 5 Year | | | 10 Year | | | Gross | | | Net5 | |
Class A (WFCGX) | | | 07/31/2007 | | | | (7.71 | ) | | | (6.47 | ) | | | (1.38 | ) | | | 3.08 | | | | (2.09 | ) | | | (0.75 | ) | | | (0.20 | ) | | | 3.69 | | | | 1.22% | | | | 1.20% | |
Class C (WFCCX) | | | 07/31/2007 | | | | (3.47 | ) | | | (2.47 | ) | | | (0.92 | ) | | | 3.03 | | | | (2.47 | ) | | | (1.47 | ) | | | (0.92 | ) | | | 3.03 | | | | 1.97% | | | | 1.95% | |
Administrator Class (WFCDX) | | | 06/30/2003 | | | | | | | | | | | | | | | | | | | | (1.97 | ) | | | (0.48 | ) | | | 0.09 | | | | 4.02 | | | | 1.06% | | | | 0.94% | |
Institutional Class (WWCIX) | | | 04/08/2005 | | | | | | | | | | | | | | | | | | | | (1.89 | ) | | | (0.24 | ) | | | 0.29 | | | | 4.16 | | | | 0.79% | | | | 0.70% | |
Investor Class (SLGIX) | | | 11/03/1997 | | | | | | | | | | | | | | | | | | | | (2.16 | ) | | | (0.81 | ) | | | (0.30 | ) | | | 3.64 | | | | 1.29% | | | | 1.27% | |
Russell 1000® Growth Index6 | | | | | | | | | | | | | | | | | | | | | | | 2.84 | | | | 6.07 | | | | 3.17 | | | | 3.38 | | | | | | | | | |
| * | Returns for periods of less than one year are not annualized. |
Figures quoted represent past performance, which is no guarantee of future results and do not reflect the deduction of taxes that a shareholder may pay on fund distributions or the redemption of fund shares. Investment return and principal value of an investment will fluctuate so that an investor’s shares, when redeemed, may be worth more or less than their original cost. Performance shown without sales charges would be lower if sales charges were reflected. Current performance may be lower or higher than the performance data quoted and assumes the reinvestment of dividends and capital gains. Current month-end performance is available on the Fund’s Web site – wellsfargoadvantagefunds.com.
Index returns do not include transaction costs associated with buying and selling securities, any mutual fund fees or expenses or any taxes. It is not possible to invest directly in an index.
For Class A shares, the maximum front-end sales charge is 5.75%. For Class C shares, the maximum contingent deferred sales charge is 1.00%. Performance including sales charge assumes the sales charge for the corresponding time period. Administrator Class, Institutional Class and Investor Class shares are sold without a front-end sales charge or contingent deferred sales charge.
Stock fund values fluctuate in response to the activities of individual companies and general market and economic conditions. Certain investment strategies tend to increase the total risk of an investment (relative to the broader market). This Fund is exposed to foreign investment risk. Consult the Fund’s prospectus for additional information on these and other risks.
| 3. | Historical performance shown for Class A and Administrator Class shares prior to their inception reflects the performance of the Investor Class shares, and includes the higher expenses applicable to the Investor Class shares. If these expenses had not been included, returns would be higher. Historical performance shown for Class C shares prior to their inception reflects the performance of the Investor Class shares, adjusted to reflect the higher expenses applicable to Class C shares. Historical performance shown for the Institutional Class shares prior to their inception reflects the performance of the Administrator Class shares, and includes the higher expenses applicable to the Administrator Class shares. If these expenses had not been included, returns would be higher. |
| 4. | Reflects the expense ratios as stated in the most recent prospectuses. |
| 5. | The Adviser has committed through July 18, 2013 to waive fees and/or reimburse expenses to the extent necessary to cap the Fund’s Total Annual Fund Operating Expenses After Fee Waiver, excluding certain expenses, at the amounts shown above. Without this cap, the Fund’s returns would have been lower. |
| 6. | The Russell 1000® Growth Index measures the performance of those Russell 1000 Growth Index companies with higher price-to-book ratios and higher forecasted growth values. You cannot invest directly in an index. |
| | | | | | |
| Fund Expenses (Unaudited) | | Wells Fargo Advantage Capital Growth Fund | | | 7 | |
As a shareholder of the Fund, you incur two types of costs: (1) transaction costs, including sales charges (loads) on purchase payments and contingent deferred sales charges (if any) on redemptions and (2) ongoing costs, including management fees; distribution (12b-1) and/or shareholder service fees; and other Fund expenses. This example is intended to help you understand your ongoing costs (in dollars) of investing in the Fund and to compare these costs with the ongoing costs of investing in other mutual funds.
The example is based on an investment of $1,000 invested at the beginning of the six-month period and held for the entire period from August 1, 2011 to January 31, 2012.
Actual Expenses
The “Actual” line of the table below provides information about actual account values and actual expenses. You may use the information in this line, together with the amount you invested, to estimate the expenses that you paid over the period. Simply divide your account value by $1,000 (for example, an $8,600 account value divided by $1,000 = 8.6), then multiply the result by the number in the “Actual” line under the heading entitled “Expenses Paid During Period” for your applicable class of shares to estimate the expenses you paid on your account during this period.
Hypothetical Example for Comparison Purposes
The “Hypothetical” line of the table below provides information about hypothetical account values and hypothetical expenses based on the Fund’s actual expense ratio and an assumed rate of return of 5% per year before expenses, which is not the Fund’s actual return. The hypothetical account values and expenses may not be used to estimate the actual ending account balance or expenses you paid for the period. You may use this information to compare the ongoing costs of investing in the Fund and other funds. To do so, compare this 5% hypothetical example with the 5% hypothetical examples that appear in the shareholder reports of the other funds.
Please note that the expenses shown in the table are meant to highlight your ongoing costs only and do not reflect any transactional costs, such as sales charges (loads) and contingent deferred sales charges. Therefore, the “Hypothetical” line of the table is useful in comparing ongoing costs only, and will not help you determine the relative total costs of owning different funds. In addition, if these transactional costs were included, your costs would have been higher.
| | | | | | | | | | | | | | | | |
| | | Beginning
Account Value
08-01-2011 | | | Ending
Account Value
01-31-2012 | | | Expenses
Paid During
the Period1 | | | Net Annual
Expense Ratio | |
Class A | | | | | | | | | | | | | | | | |
Actual | | $ | 1,000.00 | | | $ | 979.08 | | | $ | 5.97 | | | | 1.20 | % |
Hypothetical (5% return before expenses) | | $ | 1,000.00 | | | $ | 1,019.10 | | | $ | 6.09 | | | | 1.20 | % |
Class C | | | | | | | | | | | | | | | | |
Actual | | $ | 1,000.00 | | | $ | 975.27 | | | $ | 9.68 | | | | 1.95 | % |
Hypothetical (5% return before expenses) | | $ | 1,000.00 | | | $ | 1,015.33 | | | $ | 9.88 | | | | 1.95 | % |
Administrator Class | | | | | | | | | | | | | | | | |
Actual | | $ | 1,000.00 | | | $ | 980.32 | | | $ | 4.68 | | | | 0.94 | % |
Hypothetical (5% return before expenses) | | $ | 1,000.00 | | | $ | 1,020.41 | | | $ | 4.77 | | | | 0.94 | % |
Institutional Class | | | | | | | | | | | | | | | | |
Actual | | $ | 1,000.00 | | | $ | 981.13 | | | $ | 3.49 | | | | 0.70 | % |
Hypothetical (5% return before expenses) | | $ | 1,000.00 | | | $ | 1,021.62 | | | $ | 3.56 | | | | 0.70 | % |
Investor Class | | | | | | | | | | | | | | | | |
Actual | | $ | 1,000.00 | | | $ | 978.37 | | | $ | 6.32 | | | | 1.27 | % |
Hypothetical (5% return before expenses) | | $ | 1,000.00 | | | $ | 1,018.75 | | | $ | 6.44 | | | | 1.27 | % |
| 1. | Expenses paid is equal to the annualized expense ratio of each class multiplied by the average account value over the period, multiplied by the number of days in the most recent fiscal half-year divided by the number of days in the fiscal year (to reflect the one-half year period). |
| | | | |
| 8 | | Wells Fargo Advantage Capital Growth Fund | | Portfolio of Investments—January 31, 2012 (Unaudited) |
| | | | | | | | | | | | |
| Security Name | | | | | | Shares | | | Value | |
| | | | | | | | | | | | |
| | | |
Common Stocks: 98.44% | | | | | | | | | | |
| | | | |
Consumer Discretionary: 19.59% | | | | | | | | | | | | |
| | | |
| Diversified Consumer Services: 0.88% | | | | | | | | | | |
Weight Watchers International Incorporated« | | | | | | | 164,500 | | | $ | 12,523,385 | |
| | | | | | | | | | | | |
| | | |
| Hotels, Restaurants & Leisure: 1.54% | | | | | | | | | | |
Starbucks Corporation | | | | | | | 455,974 | | | | 21,854,834 | |
| | | | | | | | | | | | |
| | | |
| Internet & Catalog Retail: 4.30% | | | | | | | | | | |
Amazon.com Incorporated† | | | | | | | 169,890 | | | | 33,033,412 | |
priceline.com Incorporated† | | | | | | | 52,910 | | | | 28,014,787 | |
| | | | |
| | | | | | | | | | | 61,048,199 | |
| | | | | | | | | | | | |
| | | |
| Media: 2.24% | | | | | | | | | | |
CBS Corporation Class B | | | | | | | 614,170 | | | | 17,491,562 | |
DIRECTV Group Incorporated« | | | | | | | 318,434 | | | | 14,332,714 | |
| | | | |
| | | | | | | | | | | 31,824,276 | |
| | | | | | | | | | | | |
| | | |
| Multiline Retail: 2.09% | | | | | | | | | | |
Dollar General Corporation† | | | | | | | 523,315 | | | | 22,298,452 | |
JCPenney Company Incorporated | | | | | | | 177,400 | | | | 7,370,970 | |
| | | | |
| | | | | | | | | | | 29,669,422 | |
| | | | | | | | | | | | |
| | | |
| Specialty Retail: 2.77% | | | | | | | | | | |
Home Depot Incorporated | | | | | | | 378,150 | | | | 16,786,079 | |
TJX Companies Incorporated | | | | | | | 331,250 | | | | 22,571,375 | |
| | | | |
| | | | | | | | | | | 39,357,454 | |
| | | | | | | | | | | | |
| | | |
| Textiles, Apparel & Luxury Goods: 5.77% | | | | | | | | | | |
Coach Incorporated | | | | | | | 364,870 | | | | 25,559,144 | |
lululemon athletica incorporatedǠ | | | | | | | 306,400 | | | | 19,343,032 | |
Nike Incorporated Class B | | | | | | | 137,800 | | | | 14,329,822 | |
Ralph Lauren Corporation | | | | | | | 148,650 | | | | 22,594,800 | |
| | | | |
| | | | | | | | | | | 81,826,798 | |
| | | | | | | | | | | | |
| | | | |
Consumer Staples: 6.68% | | | | | | | | | | | | |
| | | |
| Beverages: 0.81% | | | | | | | | | | |
Monster Beverage Corporation | | | | | | | 110,200 | | | | 11,517,002 | |
| | | | | | | | | | | | |
| | | |
| Food & Staples Retailing: 3.56% | | | | | | | | | | |
Costco Wholesale Corporation | | | | | | | 369,750 | | | | 30,419,333 | |
Whole Foods Market Incorporated | | | | | | | 271,550 | | | | 20,102,847 | |
| | | | |
| | | | | | | | | | | 50,522,180 | |
| | | | | | | | | | | | |
| | | |
| Food Products: 1.06% | | | | | | | | | | |
Mead Johnson & Company | | | | | | | 202,350 | | | | 14,992,112 | |
| | | | | | | | | | | | |
| | | |
| Personal Products: 1.25% | | | | | | | | | | |
Estee Lauder Companies Incorporated Class A | | | | | | | 307,250 | | | | 17,798,993 | |
| | | | | | | | | | | | |
| | | | | | |
| Portfolio of Investments—January 31, 2012 (Unaudited) | | Wells Fargo Advantage Capital Growth Fund | | | 9 | |
| | | | | | | | | | | | |
| Security Name | | | | | | Shares | | | Value | |
| | | | | | | | | | | | |
| | | |
Energy: 10.92% | | | | | | | | | | |
| | | | |
| Energy Equipment & Services: 4.95% | | | | | | | | | | | | |
Cameron International Corporation† | | | | | | | 452,550 | | | $ | 24,075,660 | |
Ensco International plc ADR | | | | | | | 397,900 | | | | 20,945,456 | |
Schlumberger Limited | | | | | | | 337,100 | | | | 25,339,807 | |
| | | | |
| | | | | | | | | | | 70,360,923 | |
| | | | | | | | | | | | |
| | | |
| Oil, Gas & Consumable Fuels: 5.97% | | | | | | | | | | |
Exxon Mobil Corporation | | | | | | | 330,150 | | | | 27,646,761 | |
Occidental Petroleum Corporation | | | | | | | 288,700 | | | | 28,803,599 | |
Pioneer Natural Resources Company« | | | | | | | 284,980 | | | | 28,298,514 | |
| | | | |
| | | | | | | | | | | 84,748,874 | |
| | | | | | | | | | | | |
| | | |
Financials: 6.98% | | | | | | | | | | |
| | | | |
| Consumer Finance: 5.35% | | | | | | | | | | | | |
American Express Company | | | | | | | 457,050 | | | | 22,916,487 | |
Capital One Financial Corporation | | | | | | | 214,850 | | | | 9,829,388 | |
MasterCard Incorporated | | | | | | | 46,860 | | | | 16,662,010 | |
Visa Incorporated Class A« | | | | | | | 264,550 | | | | 26,624,312 | |
| | | | |
| | | | | | | | | | | 76,032,197 | |
| | | | | | | | | | | | |
| | | |
| REIT: 1.63% | | | | | | | | | | |
American Tower Corporation | | | | | | | 363,650 | | | | 23,095,412 | |
| | | | | | | | | | | | |
| | | |
Health Care: 12.39% | | | | | | | | | | |
| | | | |
| Biotechnology: 2.65% | | | | | | | | | | | | |
Alexion Pharmaceuticals Incorporated† | | | | | | | 268,582 | | | | 20,616,354 | |
Gilead Sciences Incorporated† | | | | | | | 346,950 | | | | 16,945,038 | |
| | | | |
| | | | | | | | | | | 37,561,392 | |
| | | | | | | | | | | | |
| | | |
| Health Care Equipment & Supplies: 1.03% | | | | | | | | | | |
Intuitive Surgical Incorporated | | | | | | | 31,950 | | | | 14,694,125 | |
| | | | | | | | | | | | |
| | | |
| Health Care Providers & Services: 2.20% | | | | | | | | | | |
Humana Incorporated | | | | | | | 122,750 | | | | 10,927,205 | |
UnitedHealth Group Incorporated | | | | | | | 392,810 | | | | 20,343,630 | |
| | | | |
| | | | | | | | | | | 31,270,835 | |
| | | | | | | | | | | | |
| | | |
| Health Care Technology: 1.50% | | | | | | | | | | |
Cerner CorporationǠ | | | | | | | 349,550 | | | | 21,284,100 | |
| | | | | | | | | | | | |
| | | |
| Pharmaceuticals: 5.01% | | | | | | | | | | |
Allergan Incorporated | | | | | | | 306,690 | | | | 26,961,118 | |
Bristol-Myers Squibb Company | | | | | | | 720,650 | | | | 23,233,756 | |
Shire plc ADR | | | | | | | 210,193 | | | | 20,918,407 | |
| | | | |
| | | | | | | | | | | 71,113,281 | |
| | | | | | | | | | | | |
| | | |
Industrials: 10.62% | | | | | | | | | | |
| | | | |
| Aerospace & Defense: 1.45% | | | | | | | | | | | | |
Precision Castparts Corporation« | | | | | | | 125,900 | | | | 20,607,312 | |
| | | | | | | | | | | | |
| | | | |
| 10 | | Wells Fargo Advantage Capital Growth Fund | | Portfolio of Investments—January 31, 2012 (Unaudited) |
| | | | | | | | | | | | |
| Security Name | | | | | | Shares | | | Value | |
| | | | | | | | | | | | |
| | | |
| Electrical Equipment: 0.73% | | | | | | | | | | |
Rockwell Automation Incorporated | | | | | | | 133,800 | | | $ | 10,419,006 | |
| | | | | | | | | | | | |
| | | |
| Machinery: 4.50% | | | | | | | | | | |
Cummins Incorporated | | | | | | | 192,961 | | | | 20,067,944 | |
Danaher Corporation | | | | | | | 554,450 | | | | 29,114,170 | |
Deere & Company | | | | | | | 170,200 | | | | 14,662,730 | |
| | | | |
| | | | | | | | | | | 63,844,844 | |
| | | | | | | | | | | | |
| | | |
| Road & Rail: 2.70% | | | | | | | | | | |
Hertz Global Holdings IncorporatedǠ | | | | | | | 1,168,650 | | | | 15,893,640 | |
Union Pacific Corporation | | | | | | | 195,539 | | | | 22,352,063 | |
| | | | |
| | | | | | | | | | | 38,245,703 | |
| | | | | | | | | | | | |
| | | |
| Trading Companies & Distributors: 1.24% | | | | | | | | | | |
W.W. Grainger Incorporated« | | | | | | | 92,537 | | | | 17,650,507 | |
| | | | | | | | | | | | |
| | | | |
Information Technology: 25.26% | | | | | | | | | | | | |
| | | |
| Communications Equipment: 1.52% | | | | | | | | | | |
F5 Networks Incorporated† | | | | | | | 180,100 | | | | 21,565,174 | |
| | | | | | | | | | | | |
| | | |
| Computers & Peripherals: 9.54% | | | | | | | | | | |
Apple Incorporated† | | | | | | | 248,025 | | | | 113,218,452 | |
EMC Corporation† | | | | | | | 864,320 | | | | 22,264,883 | |
| | | | |
| | | | | | | | | | | 135,483,335 | |
| | | | | | | | | | | | |
| | | |
| Internet Software & Services: 5.93% | | | | | | | | | | |
Baidu.com Incorporated ADR† | | | | | | | 115,110 | | | | 14,678,827 | |
eBay Incorporated† | | | | | | | 655,750 | | | | 20,721,700 | |
Google Incorporated Class A† | | | | | | | 84,150 | | | | 48,816,257 | |
| | | | |
| | | | | | | | | | | 84,216,784 | |
| | | | | | | | | | | | |
| | | |
| IT Services: 1.33% | | | | | | | | | | |
Cognizant Technology Solutions Corporation Class A† | | | | | | | 263,500 | | | | 18,906,125 | |
| | | | | | | | | | | | |
| | | |
| Semiconductors & Semiconductor Equipment: 2.89% | | | | | | | | | | |
ARM Holdings plc ADR | | | | | | | 193,850 | | | | 5,598,388 | |
Avago Technologies Limited | | | | | | | 654,200 | | | | 22,203,548 | |
Microchip Technology Incorporated« | | | | | | | 358,050 | | | | 13,215,626 | |
| | | | |
| | | | | | | | | | | 41,017,562 | |
| | | | | | | | | | | | |
| | | |
| Software: 4.05% | | | | | | | | | | |
Autodesk Incorporated | | | | | | | 318,200 | | | | 11,455,200 | |
Check Point Software Technologies Limited« | | | | | | | 350,938 | | | | 19,754,300 | |
Citrix Systems Incorporated† | | | | | | | 148,687 | | | | 9,695,874 | |
Red Hat Incorporated | | | | | | | 31,371 | | | | 1,454,673 | |
VMware Incorporated | | | | | | | 165,450 | | | | 15,100,622 | |
| | | | |
| | | | | | | | | | | 57,460,669 | |
| | | | | | | | | | | | |
| | | | |
Materials: 3.14% | | | | | | | | | | | | |
| | | |
| Chemicals: 3.14% | | | | | | | | | | |
Monsanto Company | | | | | | | 384,050 | | | | 31,511,303 | |
| | | | | | |
| Portfolio of Investments—January 31, 2012 (Unaudited) | | Wells Fargo Advantage Capital Growth Fund | | | 11 | |
| | | | | | | | | | | | | | |
| Security Name | | | | | | | Shares | | | Value | |
| | | | | | | | | | | | | | |
| | | |
| Chemicals (continued) | | | | | | | | | | | | |
Praxair Incorporated | | | | | | | | | 122,650 | | | $ | 13,025,430 | |
| | | | |
| | | | | | | | | | | | | 44,536,733 | |
| | | | | | | | | | | | | | |
| | | | |
Telecommunication Services: 2.86% | | | | | | | | | | | | | | |
| | | |
| Wireless Telecommunication Services: 2.86% | | | | | | | | | | | | |
QUALCOMM Incorporated | | | | | | | | | 690,200 | | | | 40,597,563 | |
| | | | | | | | | | | | | | |
| | | |
Total Common Stocks (Cost $1,217,770,347) | | | | | | | | | | | 1,397,647,111 | |
| | | | | | | | | | | | | | |
| | | | |
| | | | | | | | Principal | | | | |
| Other: 0.22% | | | | | | | | | | | | |
Gryphon Funding Limited, Pass-Through Entity(a)(i)(v) | | | | | | | | $ | 4,185,360 | | | | 1,130,047 | |
VFNC Corporation, Pass-Through Entity, 0.27%(a)(i)(v)144A± | | | | | | | | | 4,769,221 | | | | 2,050,765 | |
| | | |
Total Other (Cost $1,486,707) | | | | | | | | | | | 3,180,812 | |
| | | | | | | | | | | | | | |
| | | | |
| | | | | Yield | | | Shares | | | | |
| Short-Term Investments: 7.38% | | | | | | | | | | | | |
| | | | |
| Investment Companies: 7.38% | | | | | | | | | | | | | | |
Wells Fargo Advantage Cash Investment Money Market Fund, Institutional Class(l)(u) | | | | | 0.02 | % | | | 2,689,712 | | | | 2,689,712 | |
Wells Fargo Securities Lending Cash Investments, LLC(v)(l)(u)(r) | | | | | 0.15 | | | | 102,068,543 | | | | 102,068,543 | |
| | | |
Total Short-Term Investments (Cost $104,758,255) | | | | | | | | | | | 104,758,255 | |
| | | | | | | | | | | | | | |
| | | | | | | | |
| Total Investments in Securities | | | | | | | | |
| (Cost $1,324,015,309)* | | | 106.04 | % | | | 1,505,586,178 | |
Other Assets and Liabilities, Net | | | (6.04 | ) | | | (85,805,382 | ) |
| | | | | | | | |
| Total Net Assets | | | 100.00 | % | | $ | 1,419,780,796 | |
| | | | | | | | |
| « | All or a portion of this security is on loan. |
| † | Non-income earning security. |
| (a) | Security is fair valued by the Management Valuation Team, and in certain instances by the Board of Trustees, in accordance with procedures approved by the Board of Trustees. |
| (v) | Security represents investment of cash collateral received from securities on loan. |
| 144A | Security that may be resold to “qualified institutional buyers” under Rule 144A or security offered pursuant to Section 4(2) of the Securities Act of 1933, as amended. |
| ± | Variable rate investment. |
| (l) | Investment in an affiliate. |
| (u) | Rate shown is the 7-day annualized yield at period end. |
| (r) | The investment company is exempt from registration under Section 3(c)(7) of the 1940 Act. |
| * | Cost for federal income tax purposes is $1,327,994,666 and net unrealized appreciation (depreciation) consists of: |
| | | | |
Gross unrealized appreciation | | $ | 189,138,757 | |
Gross unrealized depreciation | | | (11,547,245 | ) |
| | | | |
Net unrealized appreciation | | $ | 177,591,512 | |
The accompanying notes are an integral part of these financial statements.
| | | | |
| 12 | | Wells Fargo Advantage Capital Growth Fund | | Statement of Assets and Liabilities—January 31, 2012 (Unaudited) |
| | | | |
| | | | |
| |
Assets | | | | |
Investments | | | | |
In unaffiliated securities (including securities on loan), at value (see cost below) | | $ | 1,400,827,923 | |
In affiliated securities, at value (see cost below) | | | 104,758,255 | |
| | | | |
Total investments, at value (see cost below) | | | 1,505,586,178 | |
Receivable for investments sold | | | 27,868,320 | |
Receivable for Fund shares sold | | | 555,668 | |
Receivable for dividends | | | 387,537 | |
Receivable for securities lending income | | | 13,431 | |
Prepaid expenses and other assets | | | 47,819 | |
| | | | |
Total assets | | | 1,534,458,953 | |
| | | | |
| |
Liabilities | | | | |
Payable for investments purchased | | | 8,490,847 | |
Payable for Fund shares redeemed | | | 1,534,819 | |
Payable upon receipt of securities loaned | | | 103,555,250 | |
Advisory fee payable | | | 642,300 | |
Distribution fees payable | | | 4,684 | |
Due to other related parties | | | 158,937 | |
Accrued expenses and other liabilities | | | 291,320 | |
| | | | |
Total liabilities | | | 114,678,157 | |
| | | | |
Total net assets | | $ | 1,419,780,796 | |
| | | | |
| |
NET ASSETS CONSIST OF | | | | |
Paid-in capital | | $ | 1,474,204,049 | |
Undistributed net investment income | | | 897,753 | |
Accumulated net realized losses on investments | | | (236,891,875 | ) |
Net unrealized gains on investments | | | 181,570,869 | |
| | | | |
Total net assets | | $ | 1,419,780,796 | |
| | | | |
| |
COMPUTATION OF NET ASSET VALUE AND OFFERING PRICE PER SHARE1 | | | | |
Net assets – Class A | | $ | 18,202,908 | |
Shares outstanding – Class A | | | 1,144,302 | |
Net asset value per share – Class A | | | $15.91 | |
Maximum offering price per share – Class A2 | | | $16.88 | |
Net assets – Class C | | $ | 7,398,238 | |
Shares outstanding – Class C | | | 481,080 | |
Net asset value per share – Class C | | | $15.38 | |
Net assets – Administrator Class | | $ | 364,699,397 | |
Shares outstanding – Administrator Class | | | 22,186,868 | |
Net asset value per share – Administrator Class | | | $16.44 | |
Net assets – Institutional Class | | $ | 944,966,378 | |
Shares outstanding – Institutional Class | | | 56,787,734 | |
Net asset value per share – Institutional Class | | | $16.64 | |
Net assets – Investor Class | | $ | 84,513,875 | |
Shares outstanding – Investor Class | | | 5,338,975 | |
Net asset value per share – Investor Class | | | $15.83 | |
| |
Investments in unaffiliated securities, at cost | | $ | 1,219,257,054 | |
| | | | |
Investments in affiliated securities, at cost | | $ | 104,758,255 | |
| | | | |
Total investments, at cost | | $ | 1,324,015,309 | |
| | | | |
Securities on loan, at value | | $ | 101,232,275 | |
| | | | |
| 1. | The Fund has an unlimited number of authorized shares. |
| 2. | Maximum offering price is computed as 100/94.25 of net asset value. On investments of $50,000 or more, the offering price is reduced. |
The accompanying notes are an integral part of these financial statements.
| | | | | | |
| Statement of Operations—Six Months Ended January 31, 2012 (Unaudited) | | Wells Fargo Advantage Capital Growth Fund | | | 13 | |
| | | | |
| | | | |
| |
Investment income | | | | |
Dividends* | | $ | 6,310,317 | |
Securities lending income, net | | | 93,464 | |
Income from affiliated securities | | | 10,491 | |
| | | | |
Total investment income | | | 6,414,272 | |
| | | | |
| |
Expenses | | | | |
Advisory fee | | | 4,273,167 | |
Administration fees | | | | |
Fund level | | | 340,387 | |
Class A | | | 23,414 | |
Class C | | | 9,515 | |
Administrator Class | | | 175,994 | |
Institutional Class | | | 360,296 | |
Investor Class | | | 137,756 | |
Shareholder servicing fees | | | | |
Class A | | | 22,514 | |
Class C | | | 9,149 | |
Administrator Class | | | 439,985 | |
Investor Class | | | 104,141 | |
Distribution fees | | | | |
Class C | | | 27,448 | |
Custody and accounting fees | | | 32,593 | |
Professional fees | | | 6,988 | |
Registration fees | | | 27,633 | |
Shareholder report expenses | | | 88,581 | |
Trustees’ fees and expenses | | | 6,033 | |
Other fees and expenses | | | 13,005 | |
| | | | |
Total expenses | | | 6,098,599 | |
Less: Fee waivers and/or expense reimbursements | | | (582,080 | ) |
| | | | |
Net expenses | | | 5,516,519 | |
| | | | |
Net investment income | | | 897,753 | |
| | | | |
| |
REALIZED AND UNREALIZED GAINS (LOSSES) ON INVESTMENTS | | | | |
Net realized losses on investments | | | (15,163,336 | ) |
Net change in unrealized gains (losses) on investments | | | (15,850,250 | ) |
| | | | |
Net realized and unrealized gains (losses) on investments | | | (31,013,586 | ) |
| | | | |
Net decrease in net assets resulting from operations | | $ | (30,115,833 | ) |
| | | | |
| |
* Net of foreign dividend withholding taxes of | | | $15,632 | |
The accompanying notes are an integral part of these financial statements.
| | | | |
| 14 | | Wells Fargo Advantage Capital Growth Fund | | Statements of Changes in Net Assets |
| | | | | | | | | | | | | | | | |
| | | Six Months Ended
January 31, 2012
(Unaudited) | | | Year Ended
July 31, 2011 | |
| | | | |
Operations | | | | | | | | | | | | | | | | |
Net investment income (loss) | | | | | | $ | 897,753 | | | | | | | $ | (1,580,716 | ) |
Net realized gains (losses) on investments | | | | | | | (15,163,336 | ) | | | | | | | 160,826,597 | |
Net change in unrealized gains (losses) on investments | | | | | | | (15,850,250 | ) | | | | | | | 147,362,801 | |
| | | | | | | | | | | | | | | | |
Net increase (decrease) in net assets resulting from operations | | | | | | | (30,115,833 | ) | | | | | | | 306,608,682 | |
| | | | | | | | | | | | | | | | |
| | | | |
Capital share transactions | | | Shares | | | | | | | | Shares | | | | | |
Proceeds from shares sold | | | | | | | | | | | | | | | | |
Class A | | | 60,689 | | | | 888,705 | | | | 94,865 | | | | 1,482,711 | |
Class C | | | 23,681 | | | | 336,775 | | | | 57,425 | | | | 871,679 | |
Administrator Class | | | 3,275,005 | | | | 50,148,454 | | | | 5,250,091 | | | | 82,207,407 | |
Institutional Class | | | 5,379,968 | | | | 83,112,739 | | | | 35,795,657 | | | | 523,745,064 | |
Investor Class | | | 225,408 | | | | 3,329,034 | | | | 591,572 | | | | 9,235,502 | |
| | | | | | | | | | | | | | | | |
| | | | | | | 137,815,707 | | | | | | | | 617,542,363 | |
| | | | | | | | | | | | | | | | |
Payment for shares redeemed | | | | | | | | | | | | | | | | |
Class A | | | (189,600 | ) | | | (2,838,419 | ) | | | (675,574 | ) | | | (10,233,303 | ) |
Class C | | | (67,090 | ) | | | (964,822 | ) | | | (90,936 | ) | | | (1,394,981 | ) |
Administrator Class | | | (3,278,004 | ) | | | (50,652,748 | ) | | | (33,927,433 | ) | | | (478,171,336 | ) |
Institutional Class | | | (6,889,576 | ) | | | (107,284,919 | ) | | | (12,422,744 | ) | | | (201,343,608 | ) |
Investor Class | | | (878,337 | ) | | | (12,894,650 | ) | | | (2,605,808 | ) | | | (39,824,815 | ) |
| | | | | | | | | | | | | | | | |
| | | | | | | (174,635,558 | ) | | | | | | | (730,968,043 | ) |
| | | | | | | | | | | | | | | | |
Net decrease in net assets resulting from capital share transactions | | | | | | | (36,819,851 | ) | | | | | | | (113,425,680 | ) |
| | | | | | | | | | | | | | | | |
Total increase (decrease) in net assets | | | | | | | (66,935,684 | ) | | | | | | | 193,183,002 | |
| | | | | | | | | | | | | | | | |
| | | | |
Net assets | | | | | | | | | | | | | | | | |
Beginning of period | | | | | | | 1,486,716,480 | | | | | | | | 1,293,533,478 | |
| | | | | | | | | | | | | | | | |
End of period | | | | | | $ | 1,419,780,796 | | | | | | | $ | 1,486,716,480 | |
| | | | | | | | | | | | | | | | |
Undistributed net investment income | | | | | | $ | 897,753 | | | | | | | $ | 0 | |
| | | | | | | | | | | | | | | | |
The accompanying notes are an integral part of these financial statements.
| | | | | | |
| Financial Highlights | | Wells Fargo Advantage Capital Growth Fund | | | 15 | |
(For a share outstanding throughout each period)
| | | | | | | | | | | | | | | | | | | | | | | | |
| | | Six Months Ended
January 31, 2012 (Unaudited) | | | Year Ended July 31, | |
| Class A | | | 2011 | | | 2010 | | | 2009 | | | 2008 | | | 20071 | |
Net asset value, beginning of period | | $ | 16.25 | | | $ | 13.07 | | | $ | 11.83 | | | $ | 17.60 | | | $ | 18.64 | | | $ | 18.64 | |
Net investment income (loss) | | | (0.02 | )2 | | | (0.07 | )2 | | | (0.06 | )2 | | | (0.00 | )2,3 | | | (0.08 | )2 | | | 0.00 | |
Net realized and unrealized gains (losses) on investments | | | (0.32 | ) | | | 3.25 | | | | 1.30 | | | | (5.26 | ) | | | 0.08 | | | | 0.00 | |
| | | | | | | | | | | | | | | | | | | | | | | | |
Total from investment operations | | | (0.34 | ) | | | 3.18 | | | | 1.24 | | | | (5.26 | ) | | | 0.00 | | | | 0.00 | |
Distributions to shareholders from | | | | | | | | | | | | | | | | | | | | | | | | |
Net realized gains | | | 0.00 | | | | 0.00 | | | | 0.00 | | | | (0.51 | ) | | | (1.04 | ) | | | 0.00 | |
Net asset value, end of period | | $ | 15.91 | | | $ | 16.25 | | | $ | 13.07 | | | $ | 11.83 | | | $ | 17.60 | | | $ | 18.64 | |
Total return4 | | | (2.09 | )% | | | 24.43 | % | | | 10.40 | % | | | (29.23 | )% | | | (0.46 | )% | | | 0.00 | % |
Ratios to average net assets (annualized) | | | | | | | | | | | | | | | | | | | | | | | | |
Gross expenses | | | 1.21 | % | | | 1.21 | % | | | 1.27 | % | | | 1.31 | % | | | 1.22 | % | | | 0.00 | % |
Net expenses | | | 1.20 | % | | | 1.20 | % | | | 1.25 | % | | | 1.25 | % | | | 1.22 | % | | | 0.00 | % |
Net investment income (loss) | | | (0.26 | )% | | | (0.48 | )% | | | (0.55 | )% | | | (0.01 | )% | | | (0.45 | )% | | | 0.00 | % |
Supplemental data | | | | | | | | | | | | | | | | | | | | | | | | |
Portfolio turnover rate | | | 58 | % | | | 116 | % | | | 128 | % | | | 172 | % | | | 151 | % | | | 114 | % |
Net assets, end of period (000’s omitted) | | | $18,203 | | | | $20,693 | | | | $24,222 | | | | $21,064 | | | | $33,756 | | | | $10 | |
| 1. | Class A commenced operations on July 31, 2007 and had no activity during the period. |
| 2. | Calculated based upon average shares outstanding. |
| 3. | Amount is less than $0.005. |
| 4. | Total return calculations do not include any sales charges. Returns for periods of less than one year are not annualized. |
The accompanying notes are an integral part of these financial statements.
| | | | |
| 16 | | Wells Fargo Advantage Capital Growth Fund | | Financial Highlights |
(For a share outstanding throughout each period)
| | | | | | | | | | | | | | | | | | | | | | | | |
| | | Six Months Ended
January 31, 2012 (Unaudited) | | | Year Ended July 31, | |
| Class C | | | 2011 | | | 2010 | | | 2009 | | | 2008 | | | 20071 | |
Net asset value, beginning of period | | $ | 15.77 | | | $ | 12.77 | | | $ | 11.65 | | | $ | 17.47 | | | $ | 18.64 | | | $ | 18.64 | |
Net investment income (loss) | | | (0.07 | )2 | | | (0.19 | )2 | | | (0.17 | ) | | | (0.08 | )2 | | | (0.22 | )2 | | | 0.00 | |
Net realized and unrealized gains (losses) on investments | | | (0.32 | ) | | | 3.19 | | | | 1.29 | | | | (5.23 | ) | | | 0.09 | | | | 0.00 | |
| | | | | | | | | | | | | | | | | | | | | | | | |
Total from investment operations | | | (0.39 | ) | | | 3.00 | | | | 1.12 | | | | (5.31 | ) | | | (0.13 | ) | | | 0.00 | |
Distributions to shareholders from | | | | | | | | | | | | | | | | | | | | | | | | |
Net realized gains | | | 0.00 | | | | 0.00 | | | | 0.00 | | | | (0.51 | ) | | | (1.04 | ) | | | 0.00 | |
Net asset value, end of period | | $ | 15.38 | | | $ | 15.77 | | | $ | 12.77 | | | $ | 11.65 | | | $ | 17.47 | | | $ | 18.64 | |
Total return3 | | | (2.47 | )% | | | 23.49 | % | | | 9.61 | % | | | (29.75 | )% | | | (1.18 | )% | | | 0.00 | % |
Ratios to average net assets (annualized) | | | | | | | | | | | | | | | | | | | | | | | | |
Gross expenses | | | 1.96 | % | | | 1.96 | % | | | 2.02 | % | | | 2.02 | % | | | 2.14 | % | | | 0.00 | % |
Net expenses | | | 1.95 | % | | | 1.95 | % | | | 2.00 | % | | | 1.96 | % | | | 2.00 | % | | | 0.00 | % |
Net investment income (loss) | | | (1.01 | )% | | | (1.23 | )% | | | (1.31 | )% | | | (0.70 | )% | | | (1.21 | )% | | | 0.00 | % |
Supplemental data | | | | | | | | | | | | | | | | | | | | | | | | |
Portfolio turnover rate | | | 58 | % | | | 116 | % | | | 128 | % | | | 172 | % | | | 151 | % | | | 114 | % |
Net assets, end of period (000’s omitted) | | | $7,398 | | | | $8,272 | | | | $7,127 | | | | $6,772 | | | | $7,835 | | | | $10 | |
| 1. | Class C commenced operations on July 31, 2007 and had no activity during the period. |
| 2. | Calculated based upon average shares outstanding. |
| 3. | Total return calculations do not include any sales charges. Returns for periods of less than one year are not annualized. |
The accompanying notes are an integral part of these financial statements.
| | | | | | |
| Financial Highlights | | Wells Fargo Advantage Capital Growth Fund | | | 17 | |
(For a share outstanding throughout each period)
| | | | | | | | | | | | | | | | | | | | | | | | |
| | | Six Months Ended
January 31, 2012 (Unaudited) | | | Year Ended July 31, | |
| Administrator Class | | | 2011 | | | 2010 | | | 2009 | | | 2008 | | | 2007 | |
Net asset value, beginning of period | | $ | 16.77 | | | $ | 13.45 | | | $ | 12.17 | | | $ | 18.03 | | | $ | 19.03 | | | $ | 16.07 | |
Net investment income (loss) | | | 0.00 | 2 | | | (0.03 | )1 | | | (0.03 | )1 | | | 0.04 | 1 | | | (0.02 | )1 | | | (0.02 | )1 |
Net realized and unrealized gains (losses) on investments | | | (0.33 | ) | | | 3.35 | | | | 1.35 | | | | (5.39 | ) | | | 0.06 | | | | 3.08 | |
| | | | | | | | | | | | | | | | | | | | | | | | |
Total from investment operations | | | (0.33 | ) | | | 3.32 | | | | 1.32 | | | | (5.35 | ) | | | 0.04 | | | | 3.06 | |
Distributions to shareholders from | | | | | | | | | | | | | | | | | | | | | | | | |
Net investment income | | | 0.00 | | | | 0.00 | | | | (0.04 | ) | | | 0.00 | | | | 0.00 | | | | 0.00 | |
Net realized gains | | | 0.00 | | | | 0.00 | | | | 0.00 | | | | (0.51 | ) | | | (1.04 | ) | | | (0.10 | ) |
| | | | | | | | | | | | | | | | | | | | | | | | |
Total distributions to shareholders | | | 0.00 | | | | 0.00 | | | | (0.04 | ) | | | (0.51 | ) | | | (1.04 | ) | | | (0.10 | ) |
Net asset value, end of period | | | $16.44 | | | | $16.77 | | | | $13.45 | | | | $12.17 | | | | $18.03 | | | | $19.03 | |
Total return3 | | | (1.97 | )% | | | 24.68 | % | | | 10.81 | % | | | (29.02 | )% | | | (0.24 | )% | | | 19.08 | % |
Ratios to average net assets (annualized) | | | | | | | | | | | | | | | | | | | | | | | | |
Gross expenses | | | 1.05 | % | | | 1.05 | % | | | 1.09 | % | | | 1.13 | % | | | 1.12 | % | | | 1.18 | % |
Net expenses | | | 0.94 | % | | | 0.94 | % | | | 0.94 | % | | | 0.94 | % | | | 0.94 | % | | | 0.94 | % |
Net investment income (loss) | | | 0.00 | % | | | (0.21 | )% | | | (0.25 | )% | | | 0.33 | % | | | (0.11 | )% | | | (0.09 | )% |
Supplemental data | | | | | | | | | | | | | | | | | | | | | | | | |
Portfolio turnover rate | | | 58 | % | | | 116 | % | | | 128 | % | | | 172 | % | | | 151 | % | | | 114 | % |
Net assets, end of period (000’s omitted) | | | $364,699 | | | | $372,178 | | | | $684,207 | | | | $680,869 | | | | $678,414 | | | | $500,499 | |
| 1. | Calculated based upon average shares outstanding. |
| 2. | Amount is less than $0.005. |
| 3. | Returns for periods of less than one year are not annualized. |
The accompanying notes are an integral part of these financial statements.
| | | | |
| 18 | | Wells Fargo Advantage Capital Growth Fund | | Financial Highlights |
(For a share outstanding throughout each period)
| | | | | | | | | | | | | | | | | | | | | | | | |
| | | Six Months Ended
January 31, 2012 (Unaudited) | | | Year Ended July 31, | |
| Institutional Class | | | 2011 | | | 2010 | | | 2009 | | | 2008 | | | 2007 | |
Net asset value, beginning of period | | $ | 16.96 | | | $ | 13.57 | | | $ | 12.27 | | | $ | 18.14 | | | $ | 19.10 | | | $ | 16.10 | |
Net investment income (loss) | | | 0.02 | 1 | | | 0.00 | 2 | | | (0.00 | ) | | | 0.06 | 1 | | | 0.01 | 1 | | | 0.02 | 1 |
Net realized and unrealized gains (losses) on investments | | | (0.34 | ) | | | 3.39 | | | | 1.36 | | | | (5.42 | ) | | | 0.07 | | | | 3.08 | |
| | | | | | | | | | | | | | | | | | | | | | | | |
Total from investment operations | | | (0.32 | ) | | | 3.39 | | | | 1.36 | | | | (5.36 | ) | | | 0.08 | | | | 3.10 | |
Distributions to shareholders from | | | | | | | | | | | | | | | | | | | | | | | | |
Net investment income | | | 0.00 | | | | 0.00 | | | | (0.06 | ) | | | 0.00 | | | | 0.00 | | | | 0.00 | |
Net realized gains | | | 0.00 | | | | 0.00 | | | | 0.00 | | | | (0.51 | ) | | | (1.04 | ) | | | (0.10 | ) |
| | | | | | | | | | | | | | | | | | | | | | | | |
Total distributions to shareholders | | | 0.00 | | | | 0.00 | | | | (0.06 | ) | | | (0.51 | ) | | | (1.04 | ) | | | (0.10 | ) |
Net asset value, end of period | | $ | 16.64 | | | $ | 16.96 | | | $ | 13.57 | | | $ | 12.27 | | | $ | 18.14 | | | $ | 19.10 | |
Total return3 | | | (1.89 | )% | | | 25.07 | % | | | 10.97 | % | | | (28.90 | )% | | | (0.02 | )% | | | 19.36 | % |
Ratios to average net assets (annualized) | | | | | | | | | | | | | | | | | | | | | | | | |
Gross expenses | | | 0.78 | % | | | 0.78 | % | | | 0.82 | % | | | 0.86 | % | | | 0.85 | % | | | 0.91 | % |
Net expenses | | | 0.70 | % | | | 0.70 | % | | | 0.75 | % | | | 0.75 | % | | | 0.75 | % | | | 0.76 | % |
Net investment income (loss) | | | 0.24 | % | | | 0.00 | % | | | (0.06 | )% | | | 0.51 | % | | | 0.07 | % | | | 0.11 | % |
Supplemental data | | | | | | | | | | | | | | | | | | | | | | | | |
Portfolio turnover rate | | | 58 | % | | | 116 | % | | | 128 | % | | | 172 | % | | | 151 | % | | | 114 | % |
Net assets, end of period (000’s omitted) | | | $944,966 | | | | $988,633 | | | | $473,777 | | | | $443,931 | | | | $539,373 | | | | $281,353 | |
| 1. | Calculated based upon average shares outstanding. |
| 2. | Amount is less than $0.005. |
| 3. | Returns for periods of less than one year are not annualized. |
The accompanying notes are an integral part of these financial statements.
| | | | | | |
| Financial Highlights | | Wells Fargo Advantage Capital Growth Fund | | | 19 | |
(For a share outstanding throughout each period)
| | | | | | | | | | | | | | | | | | | | | | | | |
| | | Six Months Ended
January 31, 2012 (Unaudited) | | | Year Ended July 31, | |
| Investor Class | | | 2011 | | | 2010 | | | 2009 | | | 2008 | | | 2007 | |
Net asset value, beginning of period | | $ | 16.18 | | | $ | 13.02 | | | $ | 11.79 | | | $ | 17.56 | | | $ | 18.64 | | | $ | 15.81 | |
Net investment loss | | | (0.02 | )1 | | | (0.08 | )1 | | | (0.08 | )1 | | | (0.01 | )1 | | | (0.10 | )1 | | | (0.10 | )1 |
Net realized and unrealized gains (losses) on investments | | | (0.33 | ) | | | 3.24 | | | | 1.31 | | | | (5.25 | ) | | | 0.06 | | | | 3.03 | |
| | | | | | | | | | | | | | | | | | | | | | | | |
Total from investment operations | | | (0.35 | ) | | | 3.16 | | | | 1.23 | | | | (5.26 | ) | | | (0.04 | ) | | | 2.93 | |
Distributions to shareholders from | | | | | | | | | | | | | | | | | | | | | | | | |
Net realized gains | | | 0.00 | | | | 0.00 | | | | 0.00 | | | | (0.51 | ) | | | (1.04 | ) | | | (0.10 | ) |
Net asset value, end of period | | $ | 15.83 | | | $ | 16.18 | | | $ | 13.02 | | | $ | 11.79 | | | $ | 17.56 | | | $ | 18.64 | |
Total return2 | | | (2.16 | )% | | | 24.37 | % | | | 10.35 | % | | | (29.30 | )% | | | (0.68 | )% | | | 18.63 | % |
Ratios to average net assets (annualized) | | | | | | | | | | | | | | | | | | | | | | | | |
Gross expenses | | | 1.28 | % | | | 1.28 | % | | | 1.36 | % | | | 1.41 | % | | | 1.42 | % | | | 1.53 | % |
Net expenses | | | 1.27 | % | | | 1.27 | % | | | 1.35 | % | | | 1.36 | % | | | 1.39 | % | | | 1.42 | % |
Net investment loss | | | (0.33 | )% | | | (0.55 | )% | | | (0.64 | )% | | | (0.12 | )% | | | (0.54 | )% | | | (0.56 | )% |
Supplemental data | | | | | | | | | | | | | | | | | | | | | | | | |
Portfolio turnover rate | | | 58 | % | | | 116 | % | | | 128 | % | | | 172 | % | | | 151 | % | | | 114 | % |
Net assets, end of period (000’s omitted) | | | $84,514 | | | | $96,941 | | | | $104,200 | | | | $220,008 | | | | $379,966 | | | | $374,723 | |
| 1. | Calculated based upon average shares outstanding. |
| 2. | Returns for periods of less than one year are not annualized. |
The accompanying notes are an integral part of these financial statements.
| | | | |
| 20 | | Wells Fargo Advantage Capital Growth Fund | | Notes to Financial Statements (Unaudited) |
1. ORGANIZATION
Wells Fargo Funds Trust (the “Trust”), a Delaware statutory trust organized on March 10, 1999, is an open-end management investment company registered under the Investment Company Act of 1940, as amended (the “1940 Act”). These financial statements report on Wells Fargo Advantage Capital Growth Fund (the “Fund”) which is a diversified series of the Trust.
2. SIGNIFICANT ACCOUNTING POLICIES
The following significant accounting policies, which are consistently followed in the preparation of the financial statements of the Fund, are in conformity with U.S. generally accepted accounting principles which require management to make estimates and assumptions that affect the reported amounts of assets and liabilities, disclosure of contingent assets and liabilities at the date of the financial statements, and the reported amounts of revenues and expenses during the reporting period. Actual results could differ from those estimates.
Securities valuation
Investments in equity securities are valued each business day as of the close of regular trading on the New York Stock Exchange, which is usually 4:00 p.m. (Eastern Time). Securities which are traded on a national or foreign securities exchange are valued at the last reported sales price, except that securities listed on The Nasdaq Stock Market, Inc. (“Nasdaq”) are valued at the Nasdaq Official Closing Price (“NOCP”), and if no NOCP is available, then at the last reported sales price. If no sales price is shown on the Nasdaq, the bid price will be used. In the absence of any sale of securities listed on the Nasdaq, and in the case of other securities (including U.S. Government obligations, but excluding debt securities maturing in 60 days or less), the price will be deemed “stale” and the valuations will be determined in accordance with the Fund’s Fair Value Procedures.
Investments in open-end mutual funds and non-registered investment companies are generally valued at net asset value.
Investments which are not valued using any of the methods discussed above, are valued at their fair value, as determined by procedures established in good faith and approved by the Board of Trustees.
Security loans
The Fund may lend its securities from time to time in order to earn additional income in the form of fees or interest on securities received as collateral or the investment of any cash received as collateral. The Fund continues to receive interest or dividends on the securities loaned. The Fund receives collateral in the form of cash or securities with a value at least equal to the value of the securities on loan. The value of the loaned securities is determined at the close of each business day and any additional required collateral is delivered to the Fund on the next business day. In a securities lending transaction, the net asset value of the Fund will be affected by an increase or decrease in the value of the securities loaned and by an increase or decrease in the value of the instrument in which collateral is invested. The amount of securities lending activity undertaken by the Fund fluctuates from time to time. In the event of default or bankruptcy by the borrower, the Fund may be prevented from recovering the loaned securities or gaining access to the collateral or may experience delays or costs in doing so. In addition, the investment of any cash collateral received may lose all or part of its value. The Fund has the right under the lending agreement to recover the securities from the borrower on demand.
The Fund lends its securities through an unaffiliated securities lending agent. Cash collateral received in connection with its securities lending transactions is invested in Wells Fargo Securities Lending Cash Investments, LLC (the “Cash Collateral Fund”). The Cash Collateral Fund is exempt from registration under Section 3(c)(7) of the 1940 Act and is managed by Wells Fargo Funds Management LLC (“Funds Management”) and is sub-advised by Wells Capital Management Incorporated (“Wells Capital Management”). Funds Management receives an advisory fee starting at 0.05% and declining to 0.01% as the average daily net assets of the Cash Collateral Fund increase. All of the fees received by Funds Management are paid to Wells Capital Management for its services as sub-adviser. The Cash Collateral Fund seeks to provide a positive return compared to the daily Fed Funds Open rate by investing in high-quality, U.S. dollar-denominated short-term money market instruments. Cash Collateral Fund investments are fair valued based upon the amortized cost valuation technique. Income earned from investment in the Cash Collateral Fund is included in securities lending income on the Statement of Operations.
For Wells Fargo Advantage Funds that participated in securities lending activity prior to February 13, 2009, certain structured investment vehicles purchased in a joint account by the former securities lending agent defaulted or were
| | | | | | |
| Notes to Financial Statements (Unaudited) | | Wells Fargo Advantage Capital Growth Fund | | | 21 | |
impaired. Certain of the Wells Fargo Advantage Funds still hold ownership interest in these structured investment vehicles, which have since been restructured as pass-through securities. If the Fund holds an ownership interest in such pass-through securities, information regarding this ownership interest can be found in the Portfolio of Investments under the category “Other”.
Security transactions and income recognition
Securities transactions are recorded on a trade date basis. Realized gains or losses are reported on the basis of identified cost of securities delivered.
Dividend income is recognized on the ex-dividend date. Dividend income is recorded net of foreign taxes withheld where recovery is not assured.
Distributions to shareholders
Distributions to shareholders from net investment income and net realized gains, if any, are recorded on the ex-dividend date. Such distributions are determined in conformity with income tax regulations, which may differ from generally accepted accounting principles.
Federal and other taxes
The Fund intends to continue to qualify as a regulated investment company by distributing substantially all of its investment company taxable income and any net realized capital gains (after reduction for capital loss carryforwards) sufficient to relieve it from all, or substantially all, federal income taxes. Accordingly, no provision for federal income taxes was required.
The Fund’s income and federal excise tax returns and all financial records supporting those returns for the prior three fiscal years are subject to examination by the federal and Delaware revenue authorities.
Under the recently enacted Regulated Investment Company Modernization Act of 2010, the Fund is permitted to carry forward capital losses incurred in taxable years which began after December 22, 2010 for an unlimited period. However, any losses incurred are required to be utilized prior to the losses incurred in pre-enactment taxable years. As a result of this ordering rule, pre-enactment capital loss carryforwards may be more likely to expire unused. Additionally, post-enactment capital losses that are carried forward will retain their character as either short-term or long-term capital losses rather than being considered all short-term as under previous law.
As of July 31, 2011, the Fund had net capital loss carryforwards, which were available to offset future net realized capital gains, in the amount of $217,442,388 with $4,472,500 expiring in 2015, $17,258,430 expiring in 2016 and $195,711,458 expiring in 2018.
Class allocations
The separate classes of shares offered by the Fund differ principally in applicable sales charges, distribution, shareholder servicing and administration fees. Shareholders of each class bear certain expenses that pertain to that particular class. All shareholders bear the common expenses of the Fund, earn income from the portfolio, and are allocated unrealized gains and losses pro rata based on the average daily net assets of each class, without distinction between share classes. Dividends are determined separately for each class based on income and expenses allocable to each class. Realized gains and losses are allocated to each class pro rata based upon the net assets of each class on the date realized. Differences in per share dividend rates generally result from the relative weightings of pro rata income and realized gain allocations and from differences in separate class expenses, including distribution, shareholder servicing and administration fees.
3. FAIR VALUATION MEASUREMENTS
Fair value measurements of investments are determined within a framework that has established a fair value hierarchy based upon the various data inputs utilized in determining the value of the Fund’s investments. The three-level hierarchy gives the highest priority to unadjusted quoted prices in active markets for identical assets or liabilities (Level 1) and the lowest priority to significant unobservable inputs (Level 3). The Fund’s investments are classified within the fair value hierarchy based on the lowest level of input that is significant to the fair value measurement. The inputs are summarized into three broad levels as follows:
| n | | Level 1 – quoted prices in active markets for identical securities |
| | | | |
| 22 | | Wells Fargo Advantage Capital Growth Fund | | Notes to Financial Statements (Unaudited) |
| n | | Level 2 – other significant observable inputs (including quoted prices for similar securities, interest rates, prepayment speeds, credit risk, etc.) |
| n | | Level 3 – significant unobservable inputs (including the Fund’s own assumptions in determining the fair value of investments) |
The inputs or methodologies used for valuing securities are not necessarily an indication of the risk associated with investing in those securities.
As of January 31, 2012, the inputs used in valuing the Fund’s assets, which are carried at fair value, were as follows:
| | | | | | | | | | | | | | | | |
| Investments in Securities | | Quoted Prices (Level 1) | | | Significant Other
Observable Inputs (Level 2) | | | Significant Unobservable Inputs (Level 3) | | | Total | |
Equity securities | | | | | | | | | | | | | | | | |
Common stocks | | $ | 1,397,647,111 | | | $ | 0 | | | $ | 0 | | | $ | 1,397,647,111 | |
Other | | | 0 | | | | 0 | | | | 3,180,812 | | | | 3,180,812 | |
| | | | |
Short-term investments | | | | | | | | | | | | | | | | |
Investment companies | | | 2,689,712 | | | | 102,068,543 | | | | 0 | | | | 104,758,255 | |
| | | $ | 1,400,336,823 | | | $ | 102,068,543 | | | $ | 3,180,812 | | | $ | 1,505,586,178 | |
Further details on the major security types listed above can be found in the Portfolio of Investments.
Transfers in and transfers out are recognized at the end of the reporting period. For the six months ended January 31, 2012, the Fund did not have any significant transfers into/out of Level 1 and Level 2.
The following is a reconciliation of assets in which significant unobservable inputs (Level 3) were used in determining fair value:
| | | | |
| | | Other | |
Balance as of July��31, 2011 | | | $4,511,470 | |
Accrued discounts (premiums) | | | 0 | |
Realized gains (losses) | | | 0 | |
Change in unrealized gains (losses) | | | (784,221 | ) |
Purchases | | | 0 | |
Sales | | | (546,437 | ) |
Transfers into Level 3 | | | 0 | |
Transfers out of Level 3 | | | 0 | |
Balance as of January 31, 2012 | | | $3,180,812 | |
Change in unrealized gains (losses) relating to securities still held at January 31, 2012 | | | $(1,060,759 | ) |
4. TRANSACTIONS WITH AFFILIATES AND OTHER EXPENSES
Advisory fee
The Trust has entered into an advisory contract with Funds Management, an indirect wholly owned subsidiary of Wells Fargo & Company (“Wells Fargo”). The adviser is responsible for implementing investment policies and guidelines and for supervising the sub-adviser, who is responsible for day-to-day portfolio management of the Fund.
Pursuant to the contract, Funds Management is entitled to receive an annual advisory fee starting at 0.65% and declining to 0.55% as the average daily net assets of the Fund increase. For the six months ended January 31, 2012, the advisory fee was equivalent to an annual rate of 0.63% of the Fund’s average daily net assets.
Funds Management may retain the services of certain sub-advisers to provide daily portfolio management to the Fund. The fees related to sub-advisory services are borne directly by Funds Management and do not increase the overall fees paid by the Fund. Wells Capital Management, an affiliate of Funds Management, is the sub-adviser to the Fund and is entitled to receive a fee from Funds Management at an annual rate starting at 0.35% and declining to 0.15% as the average daily net assets of the Fund increase.
| | | | | | |
| Notes to Financial Statements (Unaudited) | | Wells Fargo Advantage Capital Growth Fund | | | 23 | |
Administration and transfer agent fees
The Trust has entered into an administration agreement with Funds Management. Under this agreement, for providing administrative services, which includes paying fees and expenses for services provided by the transfer agent, sub-transfer agents, omnibus account servicers and record-keepers, Funds Management is entitled to receive from the Fund an annual fund level administration fee starting at 0.05% and declining to 0.03% as the average daily net assets of the Fund increase and a class level administration fee which is calculated based on the average daily net assets of each class as follows:
| | | | |
| | | Class Level Administration Fee | |
Class A, Class C | | | 0.26 | % |
Administrator Class | | | 0.10 | |
Institutional Class | | | 0.08 | |
Investor Class | | | 0.33 | |
Funds Management has contractually waived and/or reimbursed advisory and administration fees to the extent necessary to maintain certain net operating expense ratios for the Fund. Waiver of fees and/or reimbursement of expenses by Funds Management were made first from fund level expenses on a proportionate basis and then from class specific expenses. Funds Management has committed through July 18, 2013 to waive fees and/or reimburse expenses to the extent necessary to cap the Fund’s expenses at 1.20% for Class A, 1.95% for Class C, 0.94% for Administrator Class, 0.70% for Institutional Class and 1.27% for Investor Class.
Distribution fees
The Trust has adopted a Distribution Plan for Class C shares of the Fund pursuant to Rule 12b-1 under the 1940 Act. Distribution fees are charged to the Class C shares and paid to Wells Fargo Funds Distributor, LLC, the principal underwriter, at an annual rate of 0.75% of its average daily net assets.
For the six months ended January 31, 2012, Wells Fargo Funds Distributor, LLC received $1,581 from the sale of Class A shares and $141 and $229 in contingent deferred sales charges from redemptions of Class A and Class C shares, respectively.
Shareholder servicing fees
The Trust has entered into contracts with one or more shareholder servicing agents, whereby Class A, Class C, Administrator Class and Investor Class of the Fund is charged a fee at an annual rate of 0.25% of the average daily net assets of each respective class.
A portion of these total shareholder servicing fees were paid to affiliates of Wells Fargo.
5. INVESTMENT PORTFOLIO TRANSACTIONS
Purchases and sales of investments, excluding U.S. Government obligations (if any) and short-term securities (securities with maturities of one year or less at purchase date), for the six months ended January 31, 2012 were $798,622,349 and $861,780,880, respectively.
6. BANK BORROWINGS
The Trust (excluding the money market funds) and Wells Fargo Variable Trust are parties to a $150,000,000 revolving credit agreement with State Street Bank and Trust Company, whereby the Fund is permitted to use bank borrowings for temporary or emergency purposes, such as to fund shareholder redemption requests. Interest under the credit agreement is charged to the Fund based on a borrowing rate equal to the higher of the Federal Funds rate in effect on that day plus 1.25% or the overnight LIBOR rate in effect on that day plus 1.25%. In addition, an annual commitment fee equal to 0.10% of the unused balance is allocated to each participating fund. Prior to September 6, 2011, the revolving credit agreement was for $125,000,000 and the annual commitment fee paid by the Fund was 0.125% of the unused balance. For the six months ended January 31, 2012, the Fund paid $734 in commitment fees.
For the six months ended January 31, 2012, there were no borrowings by the Fund under the agreement.
| | | | |
| 24 | | Wells Fargo Advantage Capital Growth Fund | | Notes to Financial Statements (Unaudited) |
7. INDEMNIFICATION
Under the Trust’s organizational documents, the officers and directors are indemnified against certain liabilities that may arise out of performance of their duties to the Trust. Additionally, in the normal course of business, the Trust may enter into contracts with service providers that contain a variety of indemnification clauses. The Trust’s maximum exposure under these arrangements is dependent on future claims that may be made against the Fund and, therefore, cannot be estimated.
8. NEW ACCOUNTING PRONOUNCEMENTS
In May 2011, the Financial Accounting Standards Board (“FASB”) issued Accounting Standards Update (“ASU”) No. 2011-04 “Amendments to Achieve Common Fair Value Measurement and Disclosure Requirements in U.S. GAAP and IFRSs”. ASU No. 2011-04 amends FASB ASC Topic 820, Fair Value Measurements and Disclosures, to establish common requirements for measuring fair value and for disclosing information about fair value measurements in accordance with GAAP. The ASU is effective prospectively for interim and annual periods beginning after December 15, 2011. Management expects that adoption of the ASU will result in additional disclosures in the financial statements, as applicable.
In April 2011, FASB issued ASU No. 2011-03 “Reconsideration of Effective Control for Repurchase Agreements”. ASU No. 2011-03 amends FASB ASC Topic 860, Transfers and Servicing, specifically the criteria required to determine whether a repurchase agreement (repo) and similar agreements should be accounted for as sales of financial assets or secured borrowings with commitments. ASU No. 2011-03 changes the assessment of effective control by focusing on the transferor’s contractual rights and obligations and removing the criterion to assess its ability to exercise those rights or honor those obligations. This could result in changes to the way entities account for certain transactions including repurchase agreements, mortgage dollar rolls and reverse repurchase agreements. The ASU will become effective on a prospective basis for new transfers and modifications to existing transactions as of the beginning of the first interim or annual period beginning on or after December 15, 2011. Management has evaluated the impact of adopting the ASU and expects no significant changes.
| | | | | | |
| Other Information (Unaudited) | | Wells Fargo Advantage Capital Growth Fund | | | 25 | |
PROXY VOTING INFORMATION
A description of the policies and procedures that the Fund uses to determine how to vote proxies relating to portfolio securities is available without charge, upon request, by calling 1-800-222-8222, visiting our Web site at wellsfargoadvantagefunds.com, or visiting the SEC Web site at sec.gov. Information regarding how the Fund voted proxies relating to portfolio securities during the most recent 12-month period ended June 30 is available without charge on the Fund’s Web site at wellsfargoadvantagefunds.com or by visiting the SEC Web site at sec.gov.
PORTFOLIO HOLDINGS INFORMATION
The complete portfolio holdings for the Fund are publicly available on the Fund’s Web site (wellsfargoadvantagefunds.com) on a monthly, 30-day or more delayed basis. In addition, top ten holdings information for the Fund is publicly available on the Fund’s Web site on a monthly, seven-day or more delayed basis. The Fund files its complete schedule of portfolio holdings with the SEC for the first and third quarters of each fiscal year on Form N-Q, which is available without charge by visiting the SEC Web site at sec.gov. In addition, the Fund’s Form N-Q may be reviewed and copied at the SEC’s Public Reference Room in Washington, DC, and at regional offices in New York City, at 233 Broadway, and in Chicago, at 175 West Jackson Boulevard, Suite 900. Information about the Public Reference Room may be obtained by calling 1-800-SEC-0330.
| | | | |
| 26 | | Wells Fargo Advantage Capital Growth Fund | | Other Information (Unaudited) |
BOARD OF TRUSTEES
The following table provides basic information about the Board of Trustees (the “Trustees”) of the Trust and Officers of the Trust. This table should be read in conjunction with the Prospectus and the Statement of Additional Information1 of the Fund. Each of the Trustees and Officers listed below acts in identical capacities for the Wells Fargo Advantage family of funds, which consists of 137 funds comprising the Wells Fargo Funds Trust, Wells Fargo Variable Trust, Wells Fargo Master Trust and four closed-end funds (collectively the “Fund Complex”). All of the Trustees are also Members of the Audit and Governance Committees of each Trust in the Fund Complex. The mailing address of each Trustee and Officer is 525 Market Street, 12th Floor, San Francisco, CA 94105. Each Trustee and Officer serves an indefinite term, however, each Trustee serves such term until reaching the mandatory retirement age established by the Trustees.
Independent Trustees
| | | | | | |
Name and Year of Birth | | Position Held and Length of Service | | Principal Occupations During Past Five Years | | Other Directorships During
Past Five Years |
Peter G. Gordon
(Born 1942) | | Trustee, since 1998; Chairman, since 2005 (Lead Trustee since 2001) | | Co-Founder, Retired Chairman, President and CEO of Crystal Geyser Water Company. Trustee Emeritus, Colby College | | Asset Allocation Trust |
Isaiah Harris, Jr.
(Born 1952) | | Trustee, since 2009 | | Retired. Prior thereto, President and CEO of BellSouth Advertising and Publishing Corp. from 2005 to 2007, President and CEO of BellSouth Enterprises from 2004 to 2005 and President of BellSouth Consumer Services from 2000 to 2003. Emeritus member of the Iowa State University Foundation Board of Governors. Emeritus Member of the Advisory Board of Iowa State University School of Business. Mr. Harris is a certified public accountant. | | CIGNA Corporation; Deluxe Corporation; Asset Allocation Trust |
Judith M. Johnson
(Born 1949) | | Trustee, since 2008 | | Retired. Prior thereto, Chief Executive Officer and Chief Investment Officer of Minneapolis Employees Retirement Fund from 1996 to 2008. Ms. Johnson is an attorney, certified public accountant and a certified managerial accountant. | | Asset Allocation Trust |
Leroy Keith, Jr.
(Born 1939) | | Trustee, since 2010 | | Chairman, Bloc Global Services (development and construction). Trustee of the Evergreen Funds from 1983 to 2010. Former Managing Director, Almanac Capital Management (commodities firm), former Partner, Stonington Partners, Inc. (private equity fund), former Director, Obagi Medical Products Co. and former Director, Lincoln Educational Services. | | Trustee, Virtus Fund Complex (consisting of 40 portfolios as of 12/31/11); Asset Allocation Trust |
David F. Larcker
(Born 1950) | | Trustee, since 2009 | | James Irvin Miller Professor of Accounting at the Graduate School of Business, Stanford University, Director of Corporate Governance Research Program and Senior Faculty of The Rock Center for Corporate Governance since 2006. From 2005 to 2008, Professor of Accounting at the Graduate School of Business, Stanford University. Prior thereto, Ernst & Young Professor of Accounting at The Wharton School, University of Pennsylvania from 1985 to 2005. | | Asset Allocation Trust |
Olivia S. Mitchell
(Born 1953) | | Trustee, since 2006 | | International Foundation of Employee Benefit Plans Professor, Wharton School of the University of Pennsylvania since 1993. Director of Wharton’s Pension Research Council and Boettner Center on Pensions & Retirement Research, and Research Associate at the National Bureau of Economic Research. Previously, Cornell University Professor from 1978 to 1993. | | Asset Allocation Trust |
| | | | | | |
| Other Information (Unaudited) | | Wells Fargo Advantage Capital Growth Fund | | | 27 | |
| | | | | | |
Name and Year of Birth | | Position Held and Length of Service | | Principal Occupations During Past Five Years | | Other Directorships During
Past Five Years |
Timothy J. Penny
(Born 1951) | | Trustee, since 1996 | | President and CEO of Southern Minnesota Initiative Foundation, a non-profit organization, since 2007 and Senior Fellow at the Humphrey Institute Policy Forum at the University of Minnesota since 1995. Member of the Board of Trustees of NorthStar Education Finance, Inc., a non-profit organization, since 2007. | | Asset Allocation Trust |
Michael S. Scofield
(Born 1943) | | Trustee, since 2010 | | Served on the Investment Company Institute’s Board of Governors and Executive Committee from 2008-2011 as well the Governing Council of the Independent Directors Council from 2006-2011 and the Independent Directors Council Executive Committee from 2008-2011. Chairman of the IDC from 2008-2010. Institutional Investor (Fund Directions) Trustee of Year in 2007. Trustee of the Evergreen Funds (and its predecessors) from 1984 to 2010. Chairman of the Evergreen Funds from 2000-2010. Former Trustee of the Mentor Funds. Retired Attorney, Law Offices of Michael S. Scofield and former Director and Chairman, Branded Media Corporation (multi-media branding company). | | Asset Allocation Trust |
Donald C. Willeke
(Born 1940) | | Trustee, since 1996 | | Principal of the law firm of Willeke & Daniels. General Counsel of the Minneapolis Employees Retirement Fund from 1984 until its consolidation into the Minnesota Public Employees Retirement Association on June 30, 2010. Director and Vice Chair of The Free Trust (non-profit corporation). Director of the American Chestnut Foundation (non-profit corporation). | | Asset Allocation Trust |
Officers
| | | | | | |
Name and Year of Birth | | Position Held and
Length of Service | | Principal Occupations During Past Five Years | | |
Karla M. Rabusch
(Born 1959) | | President, since 2003 | | Executive Vice President of Wells Fargo Bank, N.A. and President of Wells Fargo Funds Management, LLC since 2003. Senior Vice President and Chief Administrative Officer of Wells Fargo Funds Management, LLC from 2001 to 2003. | | |
C. David Messman
(Born 1960) | | Secretary, since 2000; Chief Legal Counsel, since 2003 | | Senior Vice President and Secretary of Wells Fargo Funds Management, LLC since 2001. Vice President and Managing Senior Counsel of Wells Fargo Bank, N.A. since 1996. | | |
Kasey Phillips
(Born 1970) | | Treasurer, since 2009 | | Senior Vice President of Wells Fargo Funds Management, LLC since 2009. Senior Vice President of Evergreen Investment Management Company, LLC from 2006 to 2010. Treasurer of the Evergreen Funds from 2005 to 2010. | | |
David Berardi
(Born 1975) | | Assistant Treasurer, since 2009 | | Vice President of Wells Fargo Funds Management, LLC since 2009. Vice President of Evergreen Investment Management Company, LLC from 2008 to 2010. Assistant Vice President of Evergreen Investment Services, Inc. from 2004 to 2008. Manager of Fund Reporting and Control for Evergreen Investment Management Company, LLC from 2004 to 2010. | | |
Jeremy DePalma
(Born 1974) | | Assistant Treasurer, since 2009 | | Senior Vice President of Wells Fargo Funds Management, LLC since 2009. Senior Vice President of Evergreen Investment Management Company, LLC from 2008 to 2010. Vice President, Evergreen Investment Services, Inc. from 2004 to 2007. Head of the Fund Reporting and Control Team within Fund Administration from 2005 to 2010. | | |
Debra Ann Early
(Born 1964) | | Chief Compliance Officer, since 2007 | | Chief Compliance Officer of Wells Fargo Funds Management, LLC since 2007. Chief Compliance Officer of Parnassus Investments from 2005 to 2007. Chief Financial Officer of Parnassus Investments from 2004 to 2007 and Senior Audit Manager of PricewaterhouseCoopers LLP from 1998 to 2004. | | |
| 1. | The Statement of Additional Information includes additional information about the Trustees and is available, without charge, upon request, by calling 1-800-222-8222 or by visiting the Web site at wellsfargoadvantagefunds.com. |
| | | | |
| 28 | | Wells Fargo Advantage Capital Growth Fund | | List of Abbreviations |
The following is a list of common abbreviations for terms and entities which may have appeared in this report.
| ACB | — Agricultural Credit Bank |
| ADR | — American Depository Receipt |
| ADS | — American Depository Shares |
| AGC-ICC | — Assured Guaranty Corporation - Insured Custody Certificates |
| AGM | — Assured Guaranty Municipal |
| AMBAC | — American Municipal Bond Assurance Corporation |
| AMT | — Alternative Minimum Tax |
| BAN | — Bond Anticipation Notes |
| BHAC | — Berkshire Hathaway Assurance Corporation |
| CAB | — Capital Appreciation Bond |
| CCAB | — Convertible Capital Appreciation Bond |
| CDA | — Community Development Authority |
| CDO | — Collateralized Debt Obligation |
| COP | — Certificate of Participation |
| DRIVER | — Derivative Inverse Tax-Exempt Receipts |
| DW&P | — Department of Water & Power |
| DWR | — Department of Water Resources |
| ECFA | — Educational & Cultural Facilities Authority |
| EDA | — Economic Development Authority |
| EDFA | — Economic Development Finance Authority |
| ETF | — Exchange-Traded Fund |
| FFCB | — Federal Farm Credit Bank |
| FGIC | — Financial Guaranty Insurance Corporation |
| FHA | — Federal Housing Authority |
| FHLB | — Federal Home Loan Bank |
| FHLMC | — Federal Home Loan Mortgage Corporation |
| FNMA | — Federal National Mortgage Association |
| GDR | — Global Depository Receipt |
| GNMA | — Government National Mortgage Association |
| HCFR | — Healthcare Facilities Revenue |
| HEFA | — Health & Educational Facilities Authority |
| HEFAR | — Higher Education Facilities Authority Revenue |
| HFA | — Housing Finance Authority |
| HFFA | — Health Facilities Financing Authority |
| IBC | — Insured Bond Certificate |
| IDA | — Industrial Development Authority |
| IDAG | — Industrial Development Agency |
| IDR | — Industrial Development Revenue |
| KRW | — Republic of Korea Won |
| LIBOR | — London Interbank Offered Rate |
| LLC | — Limited Liability Company |
| LLP | — Limited Liability Partnership |
| MBIA | — Municipal Bond Insurance Association |
| MFHR | — Multi-Family Housing Revenue |
| MSTR | — Municipal Securities Trust Receipts |
| MUD | — Municipal Utility District |
| NATL-RE | — National Public Finance Guarantee Corporation |
| PCFA | — Pollution Control Finance Authority |
| PCR | — Pollution Control Revenue |
| PFA | — Public Finance Authority |
| PFFA | — Public Facilities Financing Authority |
| PFOTER | — Puttable Floating Option Tax-Exempt Receipts |
| plc | — Public Limited Company |
| PUTTER | — Puttable Tax-Exempt Receipts |
| R&D | — Research & Development |
| RDA | — Redevelopment Authority |
| RDFA | — Redevelopment Finance Authority |
| REIT | — Real Estate Investment Trust |
| ROC | — Reset Option Certificates |
| SAVRS | — Select Auction Variable Rate Securities |
| SBA | — Small Business Authority |
| SFHR | — Single Family Housing Revenue |
| SFMR | — Single Family Mortgage Revenue |
| SPDR | — Standard & Poor’s Depositary Receipts |
| TAN | — Tax Anticipation Notes |
| TIPS | — Treasury Inflation-Protected Securities |
| TRAN | — Tax Revenue Anticipation Notes |
| TCR | — Transferable Custody Receipts |
| TTFA | — Transportation Trust Fund Authority |
| TVA | — Tennessee Valley Authority |
| XLCA | — XL Capital Assurance |
This page is intentionally left blank.
This page is intentionally left blank.


FOR MORE INFORMATION
More information about Wells Fargo Advantage Funds is available free upon request. To obtain literature, please write, e-mail, visit the Fund’s Web site, or call:
Wells Fargo Advantage Funds
P.O. Box 8266
Boston, MA 02266-8266
E-mail: wfaf@wellsfargo.com
Web site: wellsfargoadvantagefunds.com
Individual investors: 1-800-222-8222
Retail investment professionals: 1-888-877-9275
Institutional investment professionals: 1-866-765-0778
This report and the financial statements contained herein are submitted for the general information of the shareholders of Wells Fargo Advantage Funds. If this report is used for promotional purposes, distribution of the report must be accompanied or preceded by a current prospectus. For a prospectus containing more complete information, including charges and expenses, call 1-800-222-8222 or visit the Fund’s Web site at wellsfargoadvantagefunds.com. Please consider the investment objectives, risks, charges, and expenses of the investment carefully before investing. This and other information about Wells Fargo Advantage Funds can be found in the current prospectus. Read the prospectus carefully before you invest or send money.
Wells Fargo Funds Management, LLC, a wholly owned subsidiary of Wells Fargo & Company, provides investment advisory and administrative services for Wells Fargo Advantage Funds. Other affiliates of Wells Fargo & Company provide subadvisory and other services for the Funds. The Funds are distributed by Wells Fargo Funds Distributor, LLC, Member FINRA/SIPC, an affiliate of Wells Fargo & Company.
NOT FDIC INSURED ¡ NO BANK GUARANTEE ¡ MAY LOSE VALUE
© 2012 Wells Fargo Funds Management, LLC. All rights reserved.
| | |
 | | 207943 03-12 SA200/SAR200 1-12 |

Wells Fargo Advantage
Disciplined U.S. Core Fund

Semi-Annual Report
January 31, 2012

Reduce clutter. Save trees.
Sign up for electronic delivery of prospectuses and shareholder reports at wellsfargo.com/advantagedelivery
Contents
The views expressed and any forward-looking statements are as of January 31, 2012, unless otherwise noted, and are those of the Fund managers and/or Wells Fargo Funds Management, LLC. Discussions of individual securities, or the markets generally, or any Wells Fargo Advantage Fund are not intended as individual recommendations. Future events or results may vary significantly from those expressed in any forward-looking statements; the views expressed are subject to change at any time in response to changing circumstances in the market. Wells Fargo Funds Management, LLC, disclaims any obligation to publicly update or revise any views expressed or forward-looking statements.
NOT FDIC INSURED ¡ NO BANK GUARANTEE ¡ MAY LOSE VALUE

WELLS FARGO INVESTMENT HISTORY
| | |
| |
| 1932 | | Keystone creates one of the first mutual fund families. |
| |
| 1971 | | Wells Fargo & Company introduces one of the first institutional index funds. |
| |
| 1978 | | Wells Fargo applies Markowitz and Sharpe’s research on Modern Portfolio Theory to introduce one of the industry’s first Tactical Asset Allocation (TAA) models in institutional separately managed accounts. |
| |
| 1984 | | Wells Fargo Stagecoach Funds launches its first asset allocation fund. |
| |
| 1989 | | The Tactical Asset Allocation (TAA) Model is first applied to Wells Fargo’s asset allocation mutual funds. |
| |
| 1994 | | Wells Fargo introduces the LifePath Funds, one of the first suites of target date funds (now the Wells Fargo Advantage Dow Jones Target Date FundsSM). |
| |
| 1996 | | Evergreen Investments and Keystone Funds merge. |
| |
| 1997 | | Wells Fargo launches Wells Fargo Advantage WealthBuilder PortfoliosSM, a fund-of-funds suite of products that includes the use of quantitative models to shift assets among investment styles. |
| |
| 1999 | | Norwest Advantage Funds and Stagecoach Funds are reorganized into Wells Fargo Funds after the merger of Norwest and Wells Fargo. |
| |
| 2002 | | Evergreen Retail and Evergreen Institutional companies form the umbrella asset management company, Evergreen Investments. |
| |
| 2005 | | The integration of Strong Funds with Wells Fargo Funds creates Wells Fargo Advantage Funds, resulting in one of the top 20 mutual fund companies in the United States. |
| |
| 2006 | | Wells Fargo Advantage Funds relaunches the target date product line as Wells Fargo Advantage Dow Jones Target Date Funds. |
| |
| 2010 | | The mergers and reorganizations of Evergreen and Wells Fargo Advantage mutual funds are completed, unifying the families under the brand of Wells Fargo Advantage Funds. |
Wells Fargo Advantage Funds®
Wells Fargo Advantage Funds skillfully guides institutions, financial advisors, and individuals through the investment terrain to help them reach their financial objectives. Everything we do on behalf of investors is backed by our unique combination of qualifications.
Strength
Our organization is built on the standards of integrity and service established by our parent company—Wells Fargo & Company—more than 150 years ago. And, because we’re part of a highly diversified financial enterprise, we offer the depth of resources to help investors succeed.
Expertise
Our multi-boutique model offers investors access to the independent thinking of premier investment managers that have been chosen for their time-tested strategies. While each team specializes in a specific investment strategy, collectively they provide investors a wide choice of distinct investment styles. Our dedication to investment excellence doesn’t end with our expertise in manager selection—risk management, analysis, and rigorous ongoing review seek to ensure each manager’s investment process remains consistent.
Partnership
Our collaborative approach is built around understanding the needs and goals of our clients. By adhering to core principles of sound judgment and steady guidance, we support you through every stage of the investment decision process.
Carefully consider a fund’s investment objectives, risks, charges, and expenses before investing. For a current prospectus and, if available, a summary prospectus, containing this and other information, visit wellsfargoadvantagefunds.com. Read it carefully before investing.
Wells Fargo Funds Management, LLC, a wholly owned subsidiary of Wells Fargo & Company, provides investment advisory and administrative services for Wells Fargo Advantage Funds®. Other affiliates of Wells Fargo & Company provide subadvisory and other services for the Funds. The Funds are distributed by Wells Fargo Funds Distributor, LLC, Member FINRA/SIPC, an affiliate of Wells Fargo & Company.
“Dow Jones®” and “Dow Jones Target Date IndexesSM” are service marks of Dow Jones Trademark Holdings, LLC (“Dow Jones”), have been licensed to CME Group Index Services LLC (“CME Indexes”) and have been sublicensed for use for certain purposes by Global Index Advisors, Inc, and Wells Fargo Funds Management, LLC. The Wells Fargo Advantage Dow Jones Target Date FundsSM based on the Dow Jones Target Date IndexesSM, are not sponsored, endorsed, sold or promoted by Dow Jones, CME Indexes or their respective affiliates and none of them makes any representation regarding the advisability of investing in such product(s).
NOT FDIC INSURED ¡ NO BANK GUARANTEE ¡ MAY LOSE VALUE
Not part of the semi-annual report.
Wells Fargo Advantage Funds offers more than 110 mutual funds across a wide range of asset classes, representing over $217 billion in assets under management, as of January 31, 2012.
| | | | |
| Equity Funds | | | | |
Asia Pacific Fund | | Equity Value Fund | | Precious Metals Fund |
C&B Large Cap Value Fund | | Global Opportunities Fund | | Premier Large Company Growth Fund |
C&B Mid Cap Value Fund | | Growth Fund | | Small Cap Opportunities Fund |
Capital Growth Fund | | Index Fund | | Small Cap Value Fund |
Common Stock Fund | | International Equity Fund | | Small Company Growth Fund |
Disciplined U.S. Core Fund | | International Value Fund | | Small Company Value Fund |
Discovery Fund† | | Intrinsic Small Cap Value Fund | | Small/Mid Cap Core Fund |
Diversified Equity Fund | | Intrinsic Value Fund | | Small/Mid Cap Value Fund |
Diversified International Fund | | Intrinsic World Equity Fund | | Special Mid Cap Value Fund |
Diversified Small Cap Fund | | Large Cap Core Fund | | Special Small Cap Value Fund |
Emerging Growth Fund | | Large Cap Growth Fund | | Specialized Technology Fund |
Emerging Markets Equity Fund | | Large Company Value Fund | | Strategic Large Cap Growth Fund |
Endeavor Select Fund† | | Omega Growth Fund | | Traditional Small Cap Growth Fund |
Enterprise Fund† | | Opportunity Fund† | | Utility and Telecommunications Fund |
| Bond Funds | | | | |
Adjustable Rate Government Fund | | Inflation-Protected Bond Fund | | Short-Term Bond Fund |
California Limited-Term Tax-Free Fund | | Intermediate Tax/AMT-Free Fund | | Short-Term High Yield Bond Fund |
California Tax-Free Fund | | International Bond Fund | | Short-Term Municipal Bond Fund |
Colorado Tax-Free Fund | | Minnesota Tax-Free Fund | | Strategic Municipal Bond Fund |
Government Securities Fund | | Municipal Bond Fund | | Total Return Bond Fund |
High Income Fund | | North Carolina Tax-Free Fund | | Ultra Short-Term Income Fund |
High Yield Bond Fund | | Pennsylvania Tax-Free Fund | | Ultra Short-Term Municipal Income Fund |
Income Plus Fund | | Short Duration Government Bond Fund | | Wisconsin Tax-Free Fund |
| Asset Allocation Funds | | | | |
Absolute Return Fund | | WealthBuilder Equity Portfolio† | | Target 2020 Fund† |
Asset Allocation Fund | | WealthBuilder Growth Allocation Portfolio† | | Target 2025 Fund† |
Conservative Allocation Fund | | WealthBuilder Growth Balanced Portfolio† | | Target 2030 Fund† |
Diversified Capital Builder Fund | | WealthBuilder Moderate Balanced Portfolio† | | Target 2035 Fund† |
Diversified Income Builder Fund | | WealthBuilder Tactical Equity Portfolio† | | Target 2040 Fund† |
Growth Balanced Fund | | Target Today Fund† | | Target 2045 Fund† |
Index Asset Allocation Fund | | Target 2010 Fund† | | Target 2050 Fund† |
Moderate Balanced Fund | | Target 2015 Fund† | | Target 2055 Fund† |
WealthBuilder Conservative Allocation Portfolio† | | | | |
| Money Market Funds | | | | |
100% Treasury Money Market Fund | | Heritage Money Market Fund† | | National Tax-Free Money Market Fund |
California Municipal Money Market Fund | | Money Market Fund | | Prime Investment Money Market Fund |
Cash Investment Money Market Fund | | Municipal Cash Management Money Market Fund | | Treasury Plus Money Market Fund |
Government Money Market Fund | | Municipal Money Market Fund | | |
| Variable Trust Funds1 | | | | |
VT Discovery Fund† | | VT Intrinsic Value Fund | | VT Small Cap Growth Fund |
VT Index Asset Allocation Fund | | VT Omega Growth Fund | | VT Small Cap Value Fund |
VT International Equity Fund | | VT Opportunity Fund† | | VT Total Return Bond Fund |
An investment in a money market fund is not insured or guaranteed by the Federal Deposit Insurance Corporation or any other government agency. Although the Wells Fargo Advantage Money Market Funds seek to preserve the value of your investment at $1.00 per share, it is possible to lose money by investing in a money market fund.
| 1. | The Variable Trust Funds are generally available only through insurance company variable contracts. |
| † | In this report, the Wells Fargo Advantage Discovery FundSM, Wells Fargo Advantage Endeavor Select FundSM, Wells Fargo Advantage Enterprise FundSM, Wells Fargo Advantage Opportunity FundSM, Wells Fargo Advantage WealthBuilder Conservative Allocation PortfolioSM, Wells Fargo Advantage WealthBuilder Equity PortfolioSM, Wells Fargo Advantage WealthBuilder Growth Allocation PortfolioSM, Wells Fargo Advantage WealthBuilder Growth Balanced PortfolioSM, Wells Fargo Advantage WealthBuilder Moderate Balanced PortfolioSM, Wells Fargo Advantage WealthBuilder Tactical Equity PortfolioSM, Wells Fargo Advantage Dow Jones Target Today FundSM, Wells Fargo Advantage Dow Jones Target 2010 FundSM, Wells Fargo Advantage Dow Jones Target 2015 FundSM, Wells Fargo Advantage Dow Jones Target 2020 FundSM, Wells Fargo Advantage Dow Jones Target 2025 FundSM, Wells Fargo Advantage Dow Jones Target 2030 FundSM, Wells Fargo Advantage Dow Jones Target 2035 FundSM, Wells Fargo Advantage Dow Jones Target 2040 FundSM, Wells Fargo Advantage Dow Jones Target 2045 FundSM, Wells Fargo Advantage Dow Jones Target 2050 FundSM, Wells Fargo Advantage Dow Jones Target 2055 FundSM, Wells Fargo Advantage Heritage Money Market FundSM, Wells Fargo Advantage VT Discovery FundSM, and Wells Fargo Advantage VT Opportunity FundSM are referred to as the Discovery Fund, Endeavor Select Fund, Enterprise Fund, Opportunity Fund, WealthBuilder Conservative Allocation Portfolio, WealthBuilder Equity Portfolio, WealthBuilder Growth Allocation Portfolio, WealthBuilder Growth Balanced Portfolio, WealthBuilder Moderate Balanced Portfolio, WealthBuilder Tactical Equity Portfolio, Target Today Fund, Target 2010 Fund, Target 2015 Fund, Target 2020 Fund, Target 2025 Fund, Target 2030 Fund, Target 2035 Fund, Target 2040 Fund, Target 2045 Fund, Target 2050 Fund, Target 2055 Fund, Heritage Money Market Fund, VT Discovery Fund, and VT Opportunity Fund, respectively. |
Not part of the semi-annual report.
| | | | |
| 2 | | Wells Fargo Advantage Disciplined U.S. Core Fund | | Letter to Shareholders |

Karla M. Rabusch,
President
Wells Fargo Advantage Funds
The period was marked by increased confidence that the U.S. economy was staging a fragile recovery, offset by continued concerns about the possible effect on the global economy of the ongoing European sovereign debt crisis—which began in Greece and later spread to the larger economies of Italy and Spain.
The slow-motion debt crisis in the eurozone was a major headwind to both domestic and global stock market indexes.
Dear Valued Shareholder:
We’re pleased to offer you this semi-annual report for the Wells Fargo Advantage Disciplined U.S. Core Fund for the six-month period that ended January 31, 2012. The period was marked by increased confidence that the U.S. economy was staging a fragile recovery, offset by continued concerns about the possible effect on the global economy of the ongoing European sovereign debt crisis—which began in Greece and later spread to the larger economies of Italy and Spain. Most U.S. stock indexes posted gains for the period, even if only modest ones.
Worries gave way to guarded optimism for the U.S. economy.
The period began with worries that the U.S. economy was returning to recession. Revised figures for gross domestic product (GDP) indicated that the U.S. economy grew by an annualized rate of only 0.8% in the first half of 2011. Moreover, although the July 2011 Institute for Supply Management (ISM) manufacturing survey suggested that factories continued to expand, the rate of expansion was lower than in previous months. The prolonged debate over whether and how to raise the U.S. debt ceiling—which only ended on July 31, 2011—also depressed market sentiment by highlighting the country’s political divisions.
The stock market remained volatile throughout September. By late October, however, stronger economic data led to greater optimism and higher stock prices. Revised real GDP growth came in at 1.8% in the third quarter of 2011 and 2.8% in the fourth quarter, suggesting that the recovery was on firmer footing. Economic growth was not evenly distributed, though, as December 2011 retail same-store sales generally showed stronger growth for retailers targeting affluent customers than for those targeting the broad middle class. The reported unemployment rate also showed some signs of improvement, falling from 9.1% in August 2011 to 8.3% in January 2012. However, this decline in the unemployment rate was accompanied by an increase in the number of Americans not in the labor force, raising concerns about the economy’s ability to generate jobs.
The eurozone had continued trouble.
The slow-motion debt crisis in the eurozone was a major headwind to both domestic and global stock market indexes. The worsening debt and deficit numbers for Greece in late 2011 and early 2012 cast doubt on the country’s ability to service its debt under the plan put in place by the European Union and the International Monetary Fund and put the ongoing drama of the European sovereign debt crisis back on center stage. Investors became increasingly concerned that Greece would default on its debt, a scenario that only seemed more likely as many Greeks rioted in response to greater budgetary austerity and the discussion moved from whether private investors would take a loss on their Greek debt to how big the loss would be. Because many eurozone banks owned Greek debt and many U.S. banks had financial ties to eurozone banks, investors worried about the effect of such an event on the financial system and the global economy.
Even as the situation in Greece deteriorated, eurozone GDP numbers supported the case for a modest recovery in the global economy. Reported GDP growth for the 17 countries that comprise the eurozone was modest, rising 0.2% in the third quarter compared to the second quarter, and by 0.2% in the fourth quarter
| | | | | | |
| Letter to Shareholders | | Wells Fargo Advantage Disciplined U.S. Core Fund | | | 3 | |
compared to the third quarter. However, the eurozone average concealed a wide variation between economies, with Germany’s growing by 0.5% in the third quarter of 2011 even as Greece’s GDP contracted.
Central banks continued to provide stimulus.
Throughout the reporting period, the Federal Open Market Committee (FOMC) kept its key interest rates effectively at zero in order to support the economy and financial system. Moreover, in response to extreme market volatility and signs of a weakening economy, in its August 2011 policy statement, the Federal Reserve (Fed) announced it would keep interest rates “exceptionally low” until at least mid-2013 as a way to support the economy. Market participants interpreted the Fed’s statement to mean that the central bankers believed the economy would remain weak over the next two years. However, the Fed also said that it was considering a “range of policy tools available to promote a stronger economic recovery” and “is prepared to employ these tools as appropriate.”
At the beginning of the period, the European Central Bank (ECB) had a key rate of 1.50% but lowered it to 1.25% in November 2011 and then to 1.00% in December 2011 in an attempt to support the sluggish eurozone recovery. To support the banking system, in late 2011, the ECB initiated a long-term refinancing operation (LTRO) in which it supplied three-year loans to banks against a wide range of collateral. The operation basically provided a near-unlimited amount of liquidity to banks, easing some investor concerns about the effect of an increasingly probable Greek default.
We use time-tested investment strategies, even as many variables are at work in the market.
Experience tells us that strict adherence to time-tested investment strategies has its rewards. As a whole, Wells Fargo Advantage Funds represents investments across a range of asset classes and investment styles, giving you an opportunity to create a diversified investment portfolio. While diversification may not prevent losses in a downturn, it does provide you with one way of managing risk.
Thank you for choosing to invest with Wells Fargo Advantage Funds. We appreciate your confidence in us and remain committed to helping you meet your financial needs. For current information about your fund investments, contact your investment professional, visit our website at wellsfargoadvantagefunds.com, or call us directly at 1-800-222-8222. We are available 24 hours a day, 7 days a week.
Sincerely,

Karla M. Rabusch
President
Wells Fargo Advantage Funds
| | | | |
| 4 | | Wells Fargo Advantage Disciplined U.S. Core Fund | | Letter to Shareholders |
Notice to Shareholders
The Board of Trustees for Wells Fargo Advantage Funds has unanimously approved the following modifications to certain net asset value (NAV) waiver privileges and commission schedules:
| | n | | Effective May 1, 2012, automatic investment plan (AIP) purchases and proceeds received from systematic withdrawals will no longer qualify for NAV repurchase privileges. | |
| | n | | Effective May 1, 2012, discretionary rights to waive the upfront commission for Class C and “jumbo” Class A share purchases will no longer be granted to broker/dealers. However, we will continue to waive the Class C shares contingent deferred sales charge for redemptions by employer-sponsored retirement plans where the dealer of record waived its commission at the time of purchase. | |
| | n | | Effective July 31, 2012, NAV purchase privileges for former Evergreen Class IS and Class R shareholders are being modified to remove the ability to purchase Class A shares at NAV unless those shares are held directly with the Fund on or after July 31, 2012. | |
Please contact your investment professional or call us directly at 1-800-222-8222 if you have any questions on this Notice to Shareholders.
| | | | | | |
| Performance Highlights (Unaudited) | | Wells Fargo Advantage Disciplined U.S. Core Fund | | | 5 | |
INVESTMENT OBJECTIVE
The Fund seeks long-term capital appreciation.
ADVISER
Wells Fargo Funds Management, LLC
SUB-ADVISER
Golden Capital Management, LLC.
PORTFOLIO MANAGER
Greg Golden, CFA
FUND INCEPTION
February 28, 1990
| | | | |
TEN LARGEST EQUITY HOLDINGS1 (AS OF JANUARY 31, 2012) | | | |
Apple Incorporated | | | 4.04% | |
Exxon Mobil Corporation | | | 3.69% | |
ChevronTexaco Corporation | | | 2.12% | |
Microsoft Corporation | | | 2.02% | |
International Business Machines Corporation | | | 1.89% | |
General Electric Company | | | 1.84% | |
AT&T Incorporated | | | 1.65% | |
Pfizer Incorporated | | | 1.49% | |
Johnson & Johnson | | | 1.48% | |
Intel Corporation | | | 1.42% | |
| | |
SECTOR DISTRIBUTION2 (AS OF JANUARY 31, 2012) | | |
|
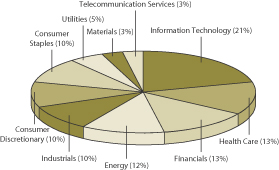 |
| 1. | The ten largest equity holdings are calculated based on the value of the securities divided by total net assets of the Fund. Holdings are subject to change and may have changed since the date specified. |
| 2. | Sector distribution is subject to change and is calculated based on the total long-term investments of the Fund. |
| | | | |
| 6 | | Wells Fargo Advantage Disciplined U.S. Core Fund | | Performance Highlights (Unaudited) |
AVERAGE ANNUAL TOTAL RETURN3 (%) (AS OF JANUARY 31, 2012)
| | | | | | | | | | | | | | | | | | | | | | | | | | | | | | | | | | | | | | | | | | | | |
| | | | | | Including Sales Charge | | | Excluding Sales Charge | | | Expense Ratios4 | |
| | | Inception Date | | | 6 Months* | | | 1 Year | | | 5 Year | | | 10 Year | | | 6 Months* | | | 1 Year | | | 5 Year | | | 10 Year | | | Gross | | | Net5 | |
Class A (EVSAX) | | | 02/28/1990 | | | | (2.94 | ) | | | (0.84 | ) | | | (1.18 | ) | | | 3.30 | | | | 2.98 | | | | 5.20 | | | | (0.00 | ) | | | 3.91 | | | | 0.93% | | | | 0.92% | |
Class C (EVSTX) | | | 06/30/1999 | | | | 1.63 | | | | 3.46 | | | | (0.74 | ) | | | 3.15 | | | | 2.63 | | | | 4.46 | | | | (0.74 | ) | | | 3.15 | | | | 1.68% | | | | 1.67% | |
Administrator Class (EVSYX) | | | 02/21/1995 | | | | | | | | | | | | | | | | | | | | 3.06 | | | | 5.41 | | | | 0.23 | | | | 4.17 | | | | 0.77% | | | | 0.74% | |
Institutional Class (EVSIX) | | | 07/30/2010 | | | | | | | | | | | | | | | | | | | | 3.19 | | | | 5.61 | | | | 0.30 | | | | 4.20 | | | | 0.50% | | | | 0.48% | |
S&P 500 Index6 | | | | | | | | | | | | | | | | | | | | | | | (2.71 | ) | | | 4.22 | | | | 0.33 | | | | 3.52 | | | | | | | | | |
| * | Returns for periods of less than one year are not annualized. |
Figures quoted represent past performance, which is no guarantee of future results and do not reflect the deduction of taxes that a shareholder may pay on fund distributions or the redemption of fund shares. Investment return and principal value of an investment will fluctuate so that an investor’s shares, when redeemed, may be worth more or less than their original cost. Performance shown without sales charges would be lower if sales charges were reflected. Current performance may be lower or higher than the performance data quoted and assumes the reinvestment of dividends and capital gains. Current month-end performance is available on the Fund’s Web site – wellsfargoadvantagefunds.com
Index returns do not include transaction costs associated with buying and selling securities, any mutual fund fees or expenses or any taxes. It is not possible to invest directly in an index.
For Class A shares, the maximum front-end sales charge is 5.75%. For Class C shares, the maximum contingent deferred sales charge is 1.00%. Performance including sales charge assumes the sales charge for the corresponding time period. Administrator Class and Institutional Class shares are sold without a front-end sales charge or contingent deferred sales charge.
Stock fund values fluctuate in response to the activities of individual companies and general market and economic conditions. The use of derivatives may reduce returns and/or increase volatility. Consult the Fund’s prospectus for additional information on these and other risks.
| 3. | Historical performance shown for the Institutional Class shares prior to their inception reflects the performance of the Administrator Class shares, and includes the higher expenses applicable to the Administrator Class shares. If these expenses had not been included, returns would be higher. Historical performance shown for all classes of the Fund prior to July 19, 2010 is based on the performance of the Fund’s predecessor, Evergreen Enhanced S&P 500 Fund. |
| 4. | Reflects the expense ratios as stated in the most recent prospectuses. |
| 5. | The Adviser has committed through July 18, 2013 to waive fees and/or reimburse expenses to the extent necessary to cap the Fund’s Total Annual Fund Operating Expenses After Fee Waiver, excluding certain expenses, at the amounts shown above. Without this cap, the Fund’s returns would have been lower. |
| 6. | The S&P 500 Index consists of 500 stocks chosen for market size, liquidity, and industry group representation. It is a market-value weighted index with each stock’s weight in the index proportionate to its market value. You cannot invest directly in an index. |
| | | | | | |
| Fund Expenses (Unaudited) | | Wells Fargo Advantage Disciplined U.S. Core Fund | | | 7 | |
As a shareholder of the Fund, you incur two types of costs: (1) transaction costs, including sales charges (loads) on purchase payments and contingent deferred sales charges (if any) on redemptions and (2) ongoing costs, including management fees; distribution (12b-1) and/or shareholder service fees; and other Fund expenses. This example is intended to help you understand your ongoing costs (in dollars) of investing in the Fund and to compare these costs with the ongoing costs of investing in other mutual funds.
The example is based on an investment of $1,000 invested at the beginning of the six-month period and held for the entire period from August 1, 2011 to January 31, 2012.
Actual Expenses
The “Actual” line of the table below provides information about actual account values and actual expenses. You may use the information in this line, together with the amount you invested, to estimate the expenses that you paid over the period. Simply divide your account value by $1,000 (for example, an $8,600 account value divided by $1,000 = 8.6), then multiply the result by the number in the “Actual” line under the heading entitled “Expenses Paid During Period” for your applicable class of shares to estimate the expenses you paid on your account during this period.
Hypothetical Example for Comparison Purposes
The “Hypothetical” line of the table below provides information about hypothetical account values and hypothetical expenses based on the Fund’s actual expense ratio and an assumed rate of return of 5% per year before expenses, which is not the Fund’s actual return. The hypothetical account values and expenses may not be used to estimate the actual ending account balance or expenses you paid for the period. You may use this information to compare the ongoing costs of investing in the Fund and other funds. To do so, compare this 5% hypothetical example with the 5% hypothetical examples that appear in the shareholder reports of the other funds.
Please note that the expenses shown in the table are meant to highlight your ongoing costs only and do not reflect any transactional costs, such as sales charges (loads) and contingent deferred sales charges. Therefore, the “Hypothetical” line of the table is useful in comparing ongoing costs only, and will not help you determine the relative total costs of owning different funds. In addition, if these transactional costs were included, your costs would have been higher.
| | | | | | | | | | | | | | | | |
| | | Beginning
Account Value
08-01-2011 | | | Ending
Account Value
01-31-2012 | | | Expenses
Paid During
the Period1 | | | Net Annual
Expense Ratio | |
Class A | | | | | | | | | | | | | | | | |
Actual | | $ | 1,000.00 | | | $ | 1,029.84 | | | $ | 4.64 | | | | 0.91 | % |
Hypothetical (5% return before expenses) | | $ | 1,000.00 | | | $ | 1,020.56 | | | $ | 4.62 | | | | 0.91 | % |
Class C | | | | | | | | | | | | | | | | |
Actual | | $ | 1,000.00 | | | $ | 1,026.33 | | | $ | 8.46 | | | | 1.66 | % |
Hypothetical (5% return before expenses) | | $ | 1,000.00 | | | $ | 1,016.79 | | | $ | 8.42 | | | | 1.66 | % |
Administrator Class | | | | | | | | | | | | | | | | |
Actual | | $ | 1,000.00 | | | $ | 1,030.64 | | | $ | 3.78 | | | | 0.74 | % |
Hypothetical (5% return before expenses) | | $ | 1,000.00 | | | $ | 1,021.42 | | | $ | 3.76 | | | | 0.74 | % |
Institutional Class | | | | | | | | | | | | | | | | |
Actual | | $ | 1,000.00 | | | $ | 1,031.89 | | | $ | 2.45 | | | | 0.48 | % |
Hypothetical (5% return before expenses) | | $ | 1,000.00 | | | $ | 1,022.72 | | | $ | 2.44 | | | | 0.48 | % |
| 1. | Expenses paid is equal to the annualized expense ratio of each class multiplied by the average account value over the period, multiplied by the number of days in the most recent fiscal half-year divided by the number of days in the fiscal year (to reflect the one-half year period). |
| | | | |
| 8 | | Wells Fargo Advantage Disciplined U.S. Core Fund | | Portfolio of Investments—January 31, 2012 (Unaudited) |
| | | | | | | | | | | | |
| Security Name | | | | | | Shares | | | Value | |
| | | | | | | | | | | | |
| | | | |
Common Stocks: 98.62% | | | | | | | | | | | | |
| | | | |
Consumer Discretionary: 9.93% | | | | | | | | | | | | |
| | | | |
| Auto Components: 0.38% | | | | | | | | | | | | |
BorgWarner Incorporated†« | | | | | | | 10,640 | | | $ | 794,063 | |
Dana Holding Corporation† | | | | | | | 36,266 | | | | 538,550 | |
The Goodyear Tire & Rubber Company† | | | | | | | 29,666 | | | | 385,658 | |
| | | | |
| | | | | | | | | | | 1,718,271 | |
| | | | | | | | | | | | |
| | | | |
| Automobiles: 0.58% | | | | | | | | | | | | |
Ford Motor Company« | | | | | | | 208,460 | | | | 2,589,073 | |
| | | | | | | | | | | | |
| | | | |
| Diversified Consumer Services: 0.93% | | | | | | | | | | | | |
Apollo Group Incorporated Class A† | | | | | | | 14,557 | | | | 762,932 | |
ITT Educational Services Incorporated†« | | | | | | | 44,851 | | | | 2,954,335 | |
Service Corporation International | | | | | | | 41,422 | | | | 459,784 | |
| | | | |
| | | | | | | | | | | 4,177,051 | |
| | | | | | | | | | | | |
| | | | |
| Hotels, Restaurants & Leisure: 0.56% | | | | | | | | | | | | |
McDonald’s Corporation | | | | | | | 25,077 | | | | 2,483,877 | |
| | | | | | | | | | | | |
| | | | |
| Internet & Catalog Retail: 0.13% | | | | | | | | | | | | |
Expedia Incorporated | | | | | | | 17,895 | | | | 579,261 | |
| | | | | | | | | | | | |
| | | | |
| Media: 3.21% | | | | | | | | | | | | |
Comcast Corporation Class A | | | | | | | 145,856 | | | | 3,878,311 | |
DIRECTV Group Incorporated | | | | | | | 62,746 | | | | 2,824,197 | |
Interpublic Group of Companies Incorporated | | | | | | | 58,515 | | | | 604,460 | |
News Corporation Class A | | | | | | | 144,605 | | | | 2,722,912 | |
Time Warner Incorporated« | | | | | | | 61,064 | | | | 2,263,032 | |
Walt Disney Company | | | | | | | 54,482 | | | | 2,119,350 | |
| | | | |
| | | | | | | | | | | 14,412,262 | |
| | | | | | | | | | | | |
| | | | |
| Multiline Retail: 1.01% | | | | | | | | | | | | |
Dillard’s Incorporated Class A« | | | | | | | 58,026 | | | | 2,567,651 | |
Dollar Tree Incorporated | | | | | | | 15,818 | | | | 1,341,525 | |
Target Corporation | | | | | | | 12,170 | | | | 618,358 | |
| | | | |
| | | | | | | | | | | 4,527,534 | |
| | | | | | | | | | | | |
| | | | |
| Specialty Retail: 3.13% | | | | | | | | | | | | |
Aeropostale Incorporated†« | | | | | | | 40,577 | | | | 664,245 | |
AutoZone Incorporated† | | | | | | | 1,997 | | | | 694,716 | |
Best Buy Company Incorporated« | | | | | | | 107,227 | | | | 2,568,087 | |
GameStop Corporation Class A† | | | | | | | 22,725 | | | | 530,856 | |
Gap Incorporated | | | | | | | 36,265 | | | | 688,310 | |
Home Depot Incorporated | | | | | | | 81,066 | | | | 3,598,520 | |
Limited Brands Incorporated | | | | | | | 11,829 | | | | 495,162 | |
Lowe’s Companies Incorporated | | | | | | | 108,641 | | | | 2,914,838 | |
RadioShack Corporation« | | | | | | | 264,088 | | | | 1,896,152 | |
| | | | |
| | | | | | | | | | | 14,050,886 | |
| | | | | | | | | | | | |
| | | | | | |
| Portfolio of Investments—January 31, 2012 (Unaudited) | | Wells Fargo Advantage Disciplined U.S. Core Fund | | | 9 | |
| | | | | | | | | | | | |
| Security Name | | | | | | Shares | | | Value | |
| | | | | | | | | | | | |
| | | | |
Consumer Staples: 10.21% | | | | | | | | | | | | |
| | | | |
| Beverages: 2.16% | | | | | | | | | | | | |
Coca-Cola Enterprises Incorporated | | | | | | | 70,439 | | | $ | 1,887,061 | |
Constellation Brands Incorporated Class A† | | | | | | | 131,035 | | | | 2,738,632 | |
The Coca-Cola Company | | | | | | | 75,164 | | | | 5,075,825 | |
| | | | |
| | | | | | | | | | | 9,701,518 | |
| | | | | | | | | | | | |
| | | | |
| Food & Staples Retailing: 4.37% | | | | | | | | | | | | |
Costco Wholesale Corporation | | | | | | | 16,301 | | | | 1,341,083 | |
CVS Caremark Corporation | | | | | | | 87,094 | | | | 3,636,174 | |
Kroger Company | | | | | | | 134,977 | | | | 3,207,054 | |
Safeway Incorporated« | | | | | | | 125,704 | | | | 2,762,974 | |
SUPERVALU Incorporated« | | | | | | | 337,461 | | | | 2,331,856 | |
Wal-Mart Stores Incorporated | | | | | | | 103,082 | | | | 6,325,112 | |
| | | | |
| | | | | | | | | | | 19,604,253 | |
| | | | | | | | | | | | |
| | | | |
| Food Products: 1.28% | | | | | | | | | | | | |
Archer Daniels Midland Company | | | | | | | 89,469 | | | | 2,561,497 | |
Dean Foods Company | | | | | | | 247,003 | | | | 2,657,752 | |
Tyson Foods Incorporated Class A« | | | | | | | 28,720 | | | | 535,341 | |
| | | | |
| | | | | | | | | | | 5,754,590 | |
| | | | | | | | | | | | |
| | | | |
| Household Products: 0.81% | | | | | | | | | | | | |
Procter & Gamble Company | | | | | | | 57,572 | | | | 3,629,339 | |
| | | | | | | | | | | | |
| | | | |
| Personal Products: 0.60% | | | | | | | | | | | | |
Herbalife Limited | | | | | | | 46,176 | | | | 2,672,667 | |
| | | | | | | | | | | | |
| | | | |
| Tobacco: 0.99% | | | | | | | | | | | | |
Philip Morris International | | | | | | | 59,689 | | | | 4,462,947 | |
| | | | | | | | | | | | |
| | | | |
Energy: 12.14% | | | | | | | | | | | | |
| | | | |
| Energy Equipment & Services: 1.96% | | | | | | | | | | | | |
Baker Hughes Incorporated | | | | | | | 8,286 | | | | 407,091 | |
Halliburton Company | | | | | | | 47,184 | | | | 1,735,428 | |
Helmerich & Payne Incorporated« | | | | | | | 40,929 | | | | 2,525,729 | |
National Oilwell Varco Incorporated | | | | | | | 32,473 | | | | 2,402,353 | |
Schlumberger Limited | | | | | | | 22,786 | | | | 1,712,824 | |
| | | | |
| | | | | | | | | | | 8,783,425 | |
| | | | | | | | | | | | |
| | | | |
| Oil, Gas & Consumable Fuels: 10.18% | | | | | | | | | | | | |
ChevronTexaco Corporation | | | | | | | 92,167 | | | | 9,500,574 | |
ConocoPhillips | | | | | | | 66,949 | | | | 4,566,591 | |
Exxon Mobil Corporation | | | | | | | 197,620 | | | | 16,548,699 | |
Hess Corporation | | | | | | | 7,188 | | | | 404,684 | |
Marathon Oil Corporation | | | | | | | 90,487 | | | | 2,840,387 | |
Marathon Petroleum Corporation | | | | | | | 82,102 | | | | 3,137,938 | |
Murphy Oil Corporation | | | | | | | 46,396 | | | | 2,765,202 | |
Occidental Petroleum Corporation | | | | | | | 4,410 | | | | 439,986 | |
Tesoro Corporation | | | | | | | 96,126 | | | | 2,406,034 | |
Valero Energy Corporation | | | | | | | 127,820 | | | | 3,066,402 | |
| | | | |
| | | | | | | | | | | 45,676,497 | |
| | | | | | | | | | | | |
| | | | |
| 10 | | Wells Fargo Advantage Disciplined U.S. Core Fund | | Portfolio of Investments—January 31, 2012 (Unaudited) |
| | | | | | | | | | | | |
| Security Name | | | | | | Shares | | | Value | |
| | | | | | | | | | | | |
| | | | |
Financials: 13.27% | | | | | | | | | | | | |
| | | | |
| Capital Markets: 0.46% | | | | | | | | | | | | |
Bank of New York Mellon Corporation | | | | | | | 47,073 | | | $ | 947,579 | |
State Street Corporation | | | | | | | 29,015 | | | | 1,136,808 | |
| | | | |
| | | | | | | | | | | 2,084,387 | |
| | | | | | | | | | | | |
| | | | |
| Commercial Banks: 2.04% | | | | | | | | | | | | |
Fifth Third Bancorp | | | | | | | 156,548 | | | | 2,036,689 | |
KeyCorp | | | | | | | 227,708 | | | | 1,769,291 | |
PNC Financial Services Group Incorporated | | | | | | | 22,644 | | | | 1,334,184 | |
Regions Financial Corporation | | | | | | | 147,630 | | | | 770,629 | |
US Bancorp | | | | | | | 114,947 | | | | 3,243,804 | |
| | | | |
| | | | | | | | | | | 9,154,597 | |
| | | | | | | | | | | | |
| | | | |
| Consumer Finance: 1.50% | | | | | | | | | | | | |
American Express Company | | | | | | | 24,065 | | | | 1,206,619 | |
Capital One Financial Corporation | | | | | | | 58,361 | | | | 2,670,016 | |
Discover Financial Services | | | | | | | 104,321 | | | | 2,835,445 | |
| | | | |
| | | | | | | | | | | 6,712,080 | |
| | | | | | | | | | | | |
| | | | |
| Diversified Financial Services: 2.54% | | | | | | | | | | | | |
Citigroup Incorporated | | | | | | | 130,470 | | | | 4,008,038 | |
InterContinental Exchange Incorporated | | | | | | | 6,188 | | | | 708,402 | |
JPMorgan Chase & Company | | | | | | | 167,531 | | | | 6,248,906 | |
NASDAQ Stock Market Incorporated | | | | | | | 16,675 | | | | 413,207 | |
| | | | |
| | | | | | | | | | | 11,378,553 | |
| | | | | | | | | | | | |
| | | | |
| Insurance: 3.77% | | | | | | | | | | | | |
ACE Limited | | | | | | | 5,737 | | | | 399,295 | |
AFLAC Incorporated | | | | | | | 61,111 | | | | 2,947,383 | |
American Financial Group Incorporated | | | | | | | 11,432 | | | | 419,211 | |
Berkshire Hathaway Incorporated Class B† | | | | | | | 52,479 | | | | 4,112,779 | |
Chubb Corporation | | | | | | | 12,626 | | | | 851,119 | |
Lincoln National Corporation | | | | | | | 22,165 | | | | 477,434 | |
MetLife Incorporated | | | | | | | 76,664 | | | | 2,708,539 | |
Prudential Financial Incorporated | | | | | | | 49,361 | | | | 2,825,424 | |
Torchmark Corporation | | | | | | | 24,982 | | | | 1,140,928 | |
UnumProvident Corporation | | | | | | | 45,326 | | | | 1,034,793 | |
| | | | |
| | | | | | | | | | | 16,916,905 | |
| | | | | | | | | | | | |
| | | | |
| REITs: 2.96% | | | | | | | | | | | | |
Equity Residential« | | | | | | | 8,509 | | | | 506,711 | |
HCP Incorporated« | | | | | | | 59,733 | | | | 2,510,578 | |
Host Hotels & Resorts Incorporated« | | | | | | | 146,364 | | | | 2,403,297 | |
Public Storage Incorporated | | | | | | | 18,820 | | | | 2,613,345 | |
Simon Property Group Incorporated | | | | | | | 22,403 | | | | 3,043,672 | |
Weyerhaeuser Company | | | | | | | 109,947 | | | | 2,201,139 | |
| | | | |
| | | | | | | | | | | 13,278,742 | |
| | | | | | | | | | | | |
| | | | | | |
| Portfolio of Investments—January 31, 2012 (Unaudited) | | Wells Fargo Advantage Disciplined U.S. Core Fund | | | 11 | |
| | | | | | | | | | | | |
| Security Name | | | | | | Shares | | | Value | |
| | | | | | | | | | | | |
| | | | |
Health Care: 12.38% | | | | | | | | | | | | |
| | | | |
| Biotechnology: 1.31% | | | | | | | | | | | | |
Amgen Incorporated | | | | | | | 40,351 | | | $ | 2,740,236 | |
Gilead Sciences Incorporated† | | | | | | | 64,164 | | | | 3,133,770 | |
| | | | |
| | | | | | | | | | | 5,874,006 | |
| | | | | | | | | | | | |
| | | | |
| Health Care Equipment & Supplies: 0.59% | | | | | | | | | | | | |
Boston Scientific Corporation† | | | | | | | 368,044 | | | | 2,193,542 | |
Medtronic Incorporated | | | | | | | 11,492 | | | | 443,246 | |
| | | | |
| | | | | | | | | | | 2,636,788 | |
| | | | | | | | | | | | |
| | | | |
| Health Care Providers & Services: 3.99% | | | | | | | | | | | | |
Aetna Incorporated | | | | | | | 59,240 | | | | 2,588,788 | |
AmerisourceBergen Corporation | | | | | | | 24,545 | | | | 956,519 | |
Cardinal Health Incorporated | | | | | | | 9,128 | | | | 392,778 | |
CIGNA Corporation | | | | | | | 9,909 | | | | 444,220 | |
Express Scripts Incorporated« | | | | | | | 21,233 | | | | 1,086,280 | |
Humana Incorporated | | | | | | | 29,822 | | | | 2,654,754 | |
McKesson Corporation | | | | | | | 22,996 | | | | 1,879,233 | |
Medco Health Solutions Incorporated | | | | | | | 45,071 | | | | 2,795,303 | |
UnitedHealth Group Incorporated | | | | | | | 51,928 | | | | 2,689,351 | |
WellPoint Incorporated | | | | | | | 37,428 | | | | 2,407,369 | |
| | | | |
| | | | | | | | | | | 17,894,595 | |
| | | | | | | | | | | | |
| | | | |
| Pharmaceuticals: 6.49% | | | | | | | | | | | | |
Abbott Laboratories | | | | | | | 62,826 | | | | 3,402,028 | |
Bristol-Myers Squibb Company | | | | | | | 84,784 | | | | 2,733,436 | |
Eli Lilly & Company | | | | | | | 68,842 | | | | 2,735,781 | |
Forest Laboratories Incorporated† | | | | | | | 63,537 | | | | 2,019,206 | |
Johnson & Johnson | | | | | | | 100,859 | | | | 6,647,617 | |
Merck & Company Incorporated | | | | | | | 127,925 | | | | 4,894,411 | |
Pfizer Incorporated | | | | | | | 313,253 | | | | 6,703,614 | |
| | | | |
| | | | | | | | | | | 29,136,093 | |
| | | | | | | | | | | | |
| | | | |
Industrials: 10.32% | | | | | | | | | | | | |
| | | | |
| Aerospace & Defense: 3.95% | | | | | | | | | | | | |
General Dynamics Corporation | | | | | | | 36,647 | | | | 2,534,507 | |
Honeywell International Incorporated | | | | | | | 38,908 | | | | 2,258,220 | |
L-3 Communications Holdings Incorporated | | | | | | | 38,691 | | | | 2,737,001 | |
Lockheed Martin Corporation | | | | | | | 31,365 | | | | 2,581,967 | |
Northrop Grumman Corporation | | | | | | | 44,711 | | | | 2,595,474 | |
Raytheon Company | | | | | | | 46,463 | | | | 2,229,759 | |
United Technologies Corporation | | | | | | | 35,554 | | | | 2,785,656 | |
| | | | |
| | | | | | | | | | | 17,722,584 | |
| | | | | | | | | | | | |
| | | | |
| Air Freight & Logistics: 0.63% | | | | | | | | | | | | |
FedEx Corporation« | | | | | | | 30,931 | | | | 2,829,877 | |
| | | | | | | | | | | | |
| | | | |
| Airlines: 0.27% | | | | | | | | | | | | |
Southwest Airlines Company | | | | | | | 125,116 | | | | 1,198,611 | |
| | | | | | | | | | | | |
| | | | |
| 12 | | Wells Fargo Advantage Disciplined U.S. Core Fund | | Portfolio of Investments—January 31, 2012 (Unaudited) |
| | | | | | | | | | | | |
| Security Name | | | | | | Shares | | | Value | |
| | | | | | | | | | | | |
| | | | |
| Commercial Services & Supplies: 0.07% | | | | | | | | | | | | |
RR Donnelley & Sons Company« | | | | | | | 29,052 | | | $ | 330,031 | |
| | | | | | | | | | | | |
| | | | |
| Construction & Engineering: 0.11% | | | | | | | | | | | | |
Fluor Corporation | | | | | | | 8,470 | | | | 476,353 | |
| | | | | | | | | | | | |
| | | | |
| Industrial Conglomerates: 1.84% | | | | | | | | | | | | |
General Electric Company | | | | | | | 441,631 | | | | 8,262,916 | |
| | | | | | | | | | | | |
| | | | |
| Machinery: 1.79% | | | | | | | | | | | | |
Caterpillar Incorporated | | | | | | | 4,611 | | | | 503,152 | |
Cummins Incorporated | | | | | | | 23,829 | | | | 2,478,216 | |
Paccar Incorporated | | | | | | | 21,760 | | | | 961,792 | |
Parker Hannifin Corporation | | | | | | | 33,651 | | | | 2,714,963 | |
Timken Company | | | | | | | 13,987 | | | | 682,985 | |
Xylem Incorporated | | | | | | | 26,046 | | | | 674,852 | |
| | | | |
| | | | | | | | | | | 8,015,960 | |
| | | | | | | | | | | | |
| | | | |
| Road & Rail: 1.66% | | | | | | | | | | | | |
Amerco Corporation | | | | | | | 32,092 | | | | 3,103,938 | |
CSX Corporation | | | | | | | 97,779 | | | | 2,204,916 | |
Norfolk Southern Corporation | | | | | | | 14,473 | | | | 1,044,951 | |
Ryder System Incorporated | | | | | | | 11,078 | | | | 623,470 | |
Union Pacific Corporation | | | | | | | 4,214 | | | | 481,702 | |
| | | | |
| | | | | | | | | | | 7,458,977 | |
| | | | | | | | | | | | |
| | | | |
Information Technology: 20.17% | | | | | | | | | | | | |
| | | | |
| Communications Equipment: 1.87% | | | | | | | | | | | | |
QUALCOMM Incorporated | | | | | | | 54,219 | | | | 3,189,162 | |
Cisco Systems Incorporated | | | | | | | 264,351 | | | | 5,189,210 | |
| | | | |
| | | | | | | | | | | 8,378,372 | |
| | | | | | | | | | | | |
| | | | |
| Computers & Peripherals: 6.80% | | | | | | | | | | | | |
Apple Incorporated† | | | | | | | 39,743 | | | | 18,141,885 | |
Dell Incorporated† | | | | | | | 169,709 | | | | 2,924,086 | |
EMC Corporation | | | | | | | 91,805 | | | | 2,364,897 | |
Hewlett-Packard Company | | | | | | | 115,105 | | | | 3,220,638 | |
Seagate Technology plc | | | | | | | 36,928 | | | | 780,658 | |
Western Digital Corporation | | | | | | | 84,144 | | | | 3,058,634 | |
| | | | |
| | | | | | | | | | | 30,490,798 | |
| | | | | | | | | | | | |
| | | | |
| Electronic Equipment, Instruments & Components: 0.93% | | | | | | | | | | | | |
Agilent Technologies Incorporated | | | | | | | 12,059 | | | | 512,146 | |
Amkor Technology Incorporated†« | | | | | | | 90,013 | | | | 515,774 | |
Corning Incorporated | | | | | | | 30,086 | | | | 387,207 | |
Jabil Circuit Incorporated | | | | | | | 122,579 | | | | 2,777,640 | |
| | | | |
| | | | | | | | | | | 4,192,767 | |
| | | | | | | | | | | | |
| | | | |
| Internet Software & Services: 2.06% | | | | | | | | | | | | |
eBay Incorporated | | | | | | | 12,929 | | | | 408,556 | |
Google Incorporated Class A† | | | | | | | 9,893 | | | | 5,739,028 | |
IAC InterActive Corporation | | | | | | | 71,975 | | | | 3,099,963 | |
| | | | |
| | | | | | | | | | | 9,247,547 | |
| | | | | | | | | | | | |
| | | | | | |
| Portfolio of Investments—January 31, 2012 (Unaudited) | | Wells Fargo Advantage Disciplined U.S. Core Fund | | | 13 | |
| | | | | | | | | | | | |
| Security Name | | | | | | Shares | | | Value | |
| | | | | | | | | | | | |
| | | | |
| IT Services: 2.13% | | | | | | | | | | | | |
Computer Sciences Corporation | | | | | | | 18,499 | | | $ | 477,829 | |
International Business Machines Corporation | | | | | | | 44,135 | | | | 8,500,401 | |
Total System Services Incorporated | | | | | | | 27,849 | | | | 597,083 | |
| | | | |
| | | | | | | | | | | 9,575,313 | |
| | | | | | | | | | | | |
| | | | |
| Office Electronics: 0.56% | | | | | | | | | | | | |
Xerox Corporation | | | | | | | 321,097 | | | | 2,488,502 | |
| | | | | | | | | | | | |
| | | | |
| Semiconductors & Semiconductor Equipment: 2.63% | | | | | | | | | | | | |
Applied Materials Incorporated | | | | | | | 197,728 | | | | 2,428,100 | |
Intel Corporation | | | | | | | 241,713 | | | | 6,386,057 | |
LSI Logic Corporation† | | | | | | | 396,154 | | | | 2,998,886 | |
| | | | |
| | | | | | | | | | | 11,813,043 | |
| | | | | | | | | | | | |
| | | | |
| Software: 3.19% | | | | | | | | | | | | |
Microsoft Corporation | | | | | | | 306,479 | | | | 9,050,325 | |
Oracle Corporation | | | | | | | 187,241 | | | | 5,280,196 | |
| | | | |
| | | | | | | | | | | 14,330,521 | |
| | | | | | | | | | | | |
| | | | |
Materials: 2.87% | | | | | | | | | | | | |
| | | | |
| Chemicals: 1.09% | | | | | | | | | | | | |
CF Industries Holdings Incorporated | | | | | | | 17,160 | | | | 3,043,841 | |
Dow Chemical Company | | | | | | | 16,965 | | | | 568,497 | |
Mosaic Company | | | | | | | 23,215 | | | | 1,299,344 | |
| | | | |
| | | | | | | | | | | 4,911,682 | |
| | | | | | | | | | | | |
| | | | |
| Metals & Mining: 1.24% | | | | | | | | | | | | |
Freeport-McMoRan Copper & Gold Incorporated Class B | | | | | | | 80,961 | | | | 3,741,208 | |
Nucor Corporation | | | | | | | 10,754 | | | | 478,445 | |
Silver Standard Resources Incorporated | | | | | | | 76,963 | | | | 1,329,151 | |
| | | | |
| | | | | | | | | | | 5,548,804 | |
| | | | | | | | | | | | |
| | | | |
| Paper & Forest Products: 0.54% | | | | | | | | | | | | |
International Paper Company« | | | | | | | 77,244 | | | | 2,405,378 | |
| | | | | | | | | | | | |
| | | | |
Telecommunication Services: 2.88% | | | | | | | | | | | | |
| | | | |
| Diversified Telecommunication Services: 2.78% | | | | | | | | | | | | |
AT&T Incorporated | | | | | | | 251,063 | | | | 7,383,763 | |
Verizon Communications Incorporated« | | | | | | | 135,415 | | | | 5,099,729 | |
| | | | |
| | | | | | | | | | | 12,483,492 | |
| | | | | | | | | | | | |
| | | | |
| Wireless Telecommunication Services: 0.10% | | | | | | | | | | | | |
Sprint Nextel Corporation | | | | | | | 198,108 | | | | 419,989 | |
| | | | | | | | | | | | |
| | | | |
Utilities: 4.45% | | | | | | | | | | | | |
| | | | |
| Electric Utilities: 2.11% | | | | | | | | | | | | |
Duke Energy Corporation« | | | | | | | 83,480 | | | | 1,778,959 | |
Edison International | | | | | | | 64,256 | | | | 2,637,066 | |
Entergy Corporation | | | | | | | 36,478 | | | | 2,530,844 | |
Exelon Corporation« | | | | | | | 63,111 | | | | 2,510,556 | |
| | | | |
| | | | | | | | | | | 9,457,425 | |
| | | | | | | | | | | | |
| | | | |
| 14 | | Wells Fargo Advantage Disciplined U.S. Core Fund | | Portfolio of Investments—January 31, 2012 (Unaudited) |
| | | | | | | | | | | | | | |
| Security Name | | | | | | | Shares | | | Value | |
| | | | | | | | | | | | | | |
| | | | |
| Gas Utilities: 0.14% | | | | | | | | | | | | | | |
Questar Corporation | | | | | | | | | 33,405 | | | $ | 644,048 | |
| | | | | | | | | | | | | | |
| | | | |
| Independent Power Producers & Energy Traders: 0.38% | | | | | | | | | | | | | | |
AES Corporation† | | | | | | | | | 132,656 | | | | 1,692,690 | |
| | | | | | | | | | | | | | |
| | | | |
| Multi-Utilities: 1.82% | | | | | | | | | | | | | | |
Ameren Corporation | | | | | | | | | 80,941 | | | | 2,560,973 | |
CenterPoint Energy Incorporated | | | | | | | | | 133,090 | | | | 2,458,172 | |
Public Service Enterprise Group Incorporated | | | | | | | | | 81,776 | | | | 2,481,084 | |
Sempra Energy | | | | | | | | | 12,041 | | | | 685,133 | |
| | | | |
| | | | | | | | | | | | | 8,185,362 | |
| | | | | | | | | | | | | | |
| | | | |
Total Common Stocks (Cost $320,918,625) | | | | | | | | | | | | | 442,451,239 | |
| | | | | | | | | | | | | | |
| | | | |
| | | Yield | | | | | | | | | |
| Short-Term Investments: 8.66% | | | | | | | | | | | | | | |
| | | | |
| Investment Companies: 8.66% | | | | | | | | | | | | | | |
Wells Fargo Advantage Cash Investment Money Market Fund, Institutional Class(l)(u) | | | 0.02 | % | | | | | 6,525,583 | | | | 6,525,583 | |
Wells Fargo Securities Lending Cash Investments, LLC(l)(u)(r)(v) | | | 0.15 | | | | | | 32,336,450 | | | | 32,336,450 | |
| | | | |
Total Short-Term Investments (Cost $38,862,033) | | | | | | | | | | | | | 38,862,033 | |
| | | | | | | | | | | | | | |
| | | | | | | | |
| Total Investments in Securities | | | | | | | | |
| (Cost $359,780,658)* | | | 107.28 | % | | | 481,313,272 | |
Other Assets and Liabilities, Net | | | (7.28 | ) | | | (32,643,365 | ) |
| | | | | | | | |
| Total Net Assets | | | 100.00 | % | | $ | 448,669,907 | |
| | | | | | | | |
| † | Non-income earning security. |
| « | All or a portion of this security is on loan. |
| (l) | Investment in an affiliate. |
| (u) | Rate shown is the 7-day annualized yield at period end. |
| (r) | The investment company is exempt from registration under Section 3(c)(7) of the 1940 Act. |
| (v) | Security represents investment of cash collateral received from securities on loan. |
| * | Cost for federal income tax purposes is $361,833,253 and net unrealized appreciation (depreciation) consists of: |
| | | | |
Gross unrealized appreciation | | $ | 125,716,036 | |
Gross unrealized depreciation | | | (6,236,017 | ) |
| | | | |
Net unrealized appreciation | | $ | 119,480,019 | |
The accompanying notes are an integral part of these financial statements.
| | | | | | |
| Statement of Assets and Liabilities—January 31, 2012 (Unaudited) | | Wells Fargo Advantage Disciplined U.S. Core Fund | | | 15 | |
| | | | |
| | | | |
| |
Assets | | | | |
Investments | | | | |
In unaffiliated securities (including securities on loan), at value (see cost below) | | $ | 442,451,239 | |
In affiliated securities, at value (see cost below) | | | 38,862,033 | |
| | | | |
Total investments, at value (see cost below) | | | 481,313,272 | |
Receivable for Fund shares sold | | | 25,896 | |
Receivable for dividends | | | 449,729 | |
Receivable for securities lending income | | | 19,427 | |
Prepaid expenses and other assets | | | 80,863 | |
| | | | |
Total assets | | | 481,889,187 | |
| | | | |
| |
Liabilities | | | | |
Payable for Fund shares redeemed | | | 409,976 | |
Payable upon receipt of securities loaned | | | 32,336,450 | |
Advisory fee payable | | | 70,830 | |
Distribution fees payable | | | 1,494 | |
Due to other related parties | | | 67,954 | |
Accrued expenses and other liabilities | | | 332,576 | |
| | | | |
Total liabilities | | | 33,219,280 | |
| | | | |
Total net assets | | $ | 448,669,907 | |
| | | | |
| |
NET ASSETS CONSIST OF | | | | |
Paid-in capital | | $ | 295,339,092 | |
Undistributed net investment income | | | 3,327,280 | |
Accumulated net realized gains on investments | | | 28,470,921 | |
Net unrealized gains on investments | | | 121,532,614 | |
| | | | |
Total net assets | | $ | 448,669,907 | |
| | | | |
| |
COMPUTATION OF NET ASSET VALUE AND OFFERING PRICE PER SHARE1 | | | | |
Net assets – Class A | | $ | 254,233,252 | |
Shares outstanding – Class A | | | 18,287,526 | |
Net asset value per share – Class A | | | $13.90 | |
Maximum offering price per share – Class A2 | | | $14.75 | |
Net assets – Class C | | $ | 8,652,868 | |
Shares outstanding – Class C | | | 644,416 | |
Net asset value per share – Class C | | | $13.43 | |
Net assets – Administrator Class | | $ | 184,591,373 | |
Shares outstanding – Administrator Class | | | 13,168,711 | |
Net asset value per share – Administrator Class | | | $14.02 | |
Net assets – Institutional Class | | $ | 1,192,414 | |
Shares outstanding – Institutional Class | | | 85,205 | |
Net asset value per share – Institutional Class | | | $13.99 | |
| |
Investments in unaffiliated securities, at cost | | $ | 320,918,625 | |
| | | | |
Investments in affiliated securities, at cost | | $ | 38,862,033 | |
| | | | |
Total investments, at cost | | $ | 359,780,658 | |
| | | | |
Securities on loan, at value | | $ | 31,483,274 | |
| | | | |
| 1. | The Fund has an unlimited number of authorized shares. |
| 2. | Maximum offering price is computed as 100/94.25 of net asset value. On investments of $50,000 or more, the offering price is reduced. |
The accompanying notes are an integral part of these financial statements.
| | | | |
| 16 | | Wells Fargo Advantage Disciplined U.S. Core Fund | | Statement of Operations—Six Months Ended January 31, 2012 (Unaudited) |
| | | | |
| | | | |
| |
Investment income | | | | |
Dividends | | $ | 5,304,345 | |
Securities lending income, net | | | 61,887 | |
Income from affiliated securities | | | 2,045 | |
Interest | | | 64 | |
| | | | |
Total investment income | | | 5,368,341 | |
| | | | |
| |
Expenses | | | | |
Advisory fee | | | 690,756 | |
Administration fees | | | | |
Fund level | | | 115,126 | |
Class A | | | 323,178 | |
Class C | | | 10,610 | |
Administrator Class | | | 101,507 | |
Institutional Class | | | 292 | |
Shareholder servicing fees | | | | |
Class A | | | 310,748 | |
Class C | | | 10,202 | |
Administrator Class | | | 251,975 | |
Distribution fees | | | | |
Class C | | | 30,605 | |
Custody and accounting fees | | | 19,267 | |
Professional fees | | | 24,028 | |
Registration fees | | | 22,265 | |
Shareholder report expenses | | | 31,837 | |
Trustees’ fees and expenses | | | 8,738 | |
Other fees and expenses | | | 17,308 | |
| | | | |
Total expenses | | | 1,968,442 | |
Less: Fee waivers and/or expense reimbursements | | | (11,554 | ) |
| | | | |
Net expenses | | | 1,956,888 | |
| | | | |
Net investment income | | | 3,411,453 | |
| | | | |
| |
REALIZED AND UNREALIZED GAINS (LOSSES) ON INVESTMENTS | | | | |
| |
Net realized gains (losses) on: | | | | |
Unaffiliated securities | | | 31,167,600 | |
Futures transactions | | | (575,097 | ) |
| | | | |
Net realized gains on investments | | | 30,592,503 | |
| | | | |
| |
Net change in unrealized gains (losses) on: | | | | |
Unaffiliated securities | | | (24,771,163 | ) |
Futures transactions | | | 19,905 | |
| | | | |
Net change in unrealized gains (losses) on investments | | | (24,751,258 | ) |
| | | | |
Net realized and unrealized gains (losses) on investments | | | 5,841,245 | |
| | | | |
Net increase in net assets resulting from operations | | $ | 9,252,698 | |
| | | | |
The accompanying notes are an integral part of these financial statements.
| | | | | | |
| Statements of Changes in Net Assets | | Wells Fargo Advantage Disciplined U.S. Core Fund | | | 17 | |
| | | | | | | | | | | | | | | | |
| | | Six Months Ended
January 31, 2012
(Unaudited) | | | Year Ended
July 31, 2011 | |
| | | | |
Operations | | | | | | | | | | | | | | | | |
Net investment income | | | | | | $ | 3,411,453 | | | | | | | $ | 7,666,243 | |
Net realized gains on investments | | | | | | | 30,592,503 | | | | | | | | 107,381,301 | |
Net change in unrealized gains (losses) on investments | | | | | | | (24,751,258 | ) | | | | | | | (1,346,233 | ) |
| | | | | | | | | | | | | | | | |
Net increase in net assets resulting from operations | | | | | | | 9,252,698 | | | | | | | | 113,701,311 | |
| | | | | | | | | | | | | | | | |
| | | | |
Distributions to shareholders from | | | | | | | | | | | | | | | | |
Net investment income | | | | | | | | | | | | | | | | |
Class A | | | | | | | (4,231,155 | ) | | | | | | | (124,951 | ) |
Class C | | | | | | | (53,972 | ) | | | | | | | 0 | |
Administrator Class | | | | | | | (3,244,083 | ) | | | | | | | (212,566 | ) |
Institutional Class | | | | | | | (25,062 | ) | | | | | | | (8 | ) |
Net realized gains | | | | | | | | | | | | | | | | |
Class A | | | | | | | (9,085,986 | ) | | | | | | | 0 | |
Class C | | | | | | | (310,411 | ) | | | | | | | 0 | |
Administrator Class | | | | | | | (7,012,529 | ) | | | | | | | 0 | |
Institutional Class | | | | | | | (40,036 | ) | | | | | | | 0 | |
| | | | | | | | | | | | | | | | |
Total distributions to shareholders | | | | | | | (24,003,234 | ) | | | | | | | (337,525 | ) |
| | | | | | | | | | | | | | | | |
| | | | |
Capital share transactions | | | Shares | | | | | | | | Shares | | | | | |
Proceeds from shares sold | | | | | | | | | | | | | | | | |
Class A | | | 149,613 | | | | 1,973,072 | | | | 430,266 | | | | 5,684,893 | |
Class C | | | 26,749 | | | | 339,539 | | | | 35,384 | | | | 472,116 | |
Administrator Class | | | 238,736 | | | | 3,161,458 | | | | 1,012,926 | | | | 13,285,992 | |
Institutional Class | | | 85,478 | | | | 1,071,132 | | | | 0 | | | | 0 | |
| | | | | | | | | | | | | | | | |
| | | | | | | 6,545,201 | | | | | | | | 19,443,001 | |
| | | | | | | | | | | | | | | | |
Reinvestment of distributions | | | | | | | | | | | | | | | | |
Class A | | | 931,488 | | | | 12,377,000 | | | | 8,603 | | | | 115,201 | |
Class C | | | 17,202 | | | | 220,814 | | | | 0 | | | | 0 | |
Administrator Class | | | 203,569 | | | | 2,733,877 | | | | 4,345 | | | | 58,533 | |
Institutional Class | | | 4,870 | | | | 65,098 | | | | 1 | | | | 8 | |
| | | | | | | | | | | | | | | | |
| | | | | | | 15,396,789 | | | | | | | | 173,742 | |
| | | | | | | | | | | | | | | | |
Payment for shares redeemed | | | | | | | | | | | | | | | | |
Class A | | | (1,629,903 | ) | | | (22,002,289 | ) | | | (3,893,101 | ) | | | (52,287,068 | ) |
Class C | | | (39,901 | ) | | | (509,121 | ) | | | (401,485 | ) | | | (5,197,587 | ) |
Administrator Class | | | (4,319,181 | ) | | | (57,887,793 | ) | | | (14,937,178 | ) | | | (202,387,161 | ) |
Institutional Class | | | (5,978 | ) | | | (78,369 | ) | | | 0 | | | | 0 | |
| | | | | | | | | | | | | | | | |
| | | | | | | (80,477,572 | ) | | | | | | | (259,871,816 | ) |
| | | | | | | | | | | | | | | | |
Net decrease in net assets resulting
from capital share transactions | | | | | | | (58,535,582 | ) | | | | | | | (240,255,073 | ) |
| | | | | | | | | | | | | | | | |
Total decrease in net assets | | | | | | | (73,286,118 | ) | | | | | | | (126,891,287 | ) |
| | | | | | | | | | | | | | | | |
| | | | |
Net assets | | | | | | | | | | | | | | | | |
Beginning of period | | | | | | | 521,956,025 | | | | | | | | 648,847,312 | |
| | | | | | | | | | | | | | | | |
End of period | | | | | | $ | 448,669,907 | | | | | | | $ | 521,956,025 | |
| | | | | | | | | | | | | | | | |
Undistributed net investment income | | | | | | $ | 3,327,280 | | | | | | | $ | 7,470,099 | |
| | | | | | | | | | | | | | | | |
The accompanying notes are an integral part of these financial statements.
| | | | |
| 18 | | Wells Fargo Advantage Disciplined U.S. Core Fund | | Financial Highlights |
(For a share outstanding throughout each period)
| | | | | | | | | | | | | | | | | | | | | | | | | | | | |
| | | Six Months Ended
January 31, 2012
(Unaudited) | | | Year Ended July 31, | | | Year Ended
September 30, | |
| Class A | | | 2011 | | | 20101 | | | 20091 | | | 20081,2 | | | 20071 | | | 20061 | |
Net asset value, beginning of period | | $ | 14.25 | | | $ | 11.93 | | | $ | 10.85 | | | $ | 14.40 | | | $ | 18.97 | | | $ | 17.09 | | | $ | 15.56 | |
Net investment income | | | 0.09 | | | | 0.16 | | | | 0.15 | | | | 0.18 | | | | 0.14 | | | | 0.18 | | | | 0.19 | |
Net realized and unrealized gains (losses) on investments | | | 0.29 | | | | 2.17 | | | | 1.09 | | | | (3.15 | ) | | | (2.58 | ) | | | 2.48 | | | | 1.53 | |
| | | | | | | | | | | | | | | | | | | | | | | | | | | | |
Total from investment operations | | | 0.38 | | | | 2.33 | | | | 1.24 | | | | (2.97 | ) | | | (2.44 | ) | | | 2.66 | | | | 1.72 | |
Distributions to shareholders from | | | | | | | | | | | | | | | | | | | | | | | | | | | | |
Net investment income | | | (0.23 | ) | | | (0.01 | ) | | | (0.16 | ) | | | (0.17 | ) | | | (0.14 | ) | | | (0.18 | ) | | | (0.19 | ) |
Net realized gains | | | (0.50 | ) | | | 0.00 | | | | 0.00 | | | | (0.41 | ) | | | (1.99 | ) | | | (0.60 | ) | | | 0.00 | |
| | | | | | | | | | | | | | | | | | | | | | | | | | | | |
Total distributions to shareholders | | | (0.73 | ) | | | (0.01 | ) | | | (0.16 | ) | | | (0.58 | ) | | | (2.13 | ) | | | (0.78 | ) | | | (0.19 | ) |
Net asset value, end of period | | $ | 13.90 | | | $ | 14.25 | | | $ | 11.93 | | | $ | 10.85 | | | $ | 14.40 | | | $ | 18.97 | | | $ | 17.09 | |
Total return3 | | | 2.98 | % | | | 19.50 | % | | | 11.39 | % | | | (20.07 | )% | | | (14.06 | )% | | | 15.98 | % | | | 11.13 | % |
Ratios to average net assets (annualized) | | | | | | | | | | | | | | | | | | | | | | | | | | | | |
Gross expenses | | | 0.91 | % | | | 0.93 | % | | | 0.76 | % | | | 1.00 | % | | | 0.94 | % | | | 0.89 | % | | | 0.82 | % |
Net expenses | | | 0.91 | % | | | 0.92 | % | | | 0.76 | % | | | 1.00 | % | | | 0.94 | % | | | 0.89 | % | | | 0.81 | % |
Net investment income | | | 1.40 | % | | | 1.18 | % | | | 1.27 | % | | | 1.71 | % | | | 1.12 | % | | | 0.92 | % | | | 1.20 | % |
Supplemental data | | | | | | | | | | | | | | | | | | | | | | | | | | | | |
Portfolio turnover rate | | | 53 | % | | | 64 | % | | | 63 | % | | | 30 | % | | | 29 | % | | | 71 | % | | | 52 | % |
Net assets, end of period (000’s omitted) | | | $254,233 | | | | $268,460 | | | | $265,835 | | | | $243,049 | | | | $348,350 | | | | $513,074 | | | | $115,630 | |
| 1. | After the close of business on July 16, 2010, the Fund acquired the net assets of Evergreen Enhanced S&P 500 Fund which became accounting and performance survivor in the transaction. The information for the periods prior to July 19, 2010 is that of Class A of Evergreen Enhanced S&P 500 Fund. |
| 2. | For the ten months ended July 31, 2008. The Fund changed its fiscal year end from September 30 to July 31, effective July 31, 2008. |
| 3. | Total return calculations do not include any sales charges. Returns for periods of less than one year are not annualized. |
The accompanying notes are an integral part of these financial statements.
| | | | | | |
| Financial Highlights | | Wells Fargo Advantage Disciplined U.S. Core Fund | | | 19 | |
(For a share outstanding throughout each period)
| | | | | | | | | | | | | | | | | | | | | | | | | | | | |
| | | Six Months Ended
January 31, 2012
(Unaudited) | | | Year Ended July 31, | | | Year Ended
September 30, | |
| Class C | | | 2011 | | | 20101 | | | 20091 | | | 20081,2 | | | 20071 | | | 20061 | |
Net asset value, beginning of period | | $ | 13.69 | | | $ | 11.54 | | | $ | 10.50 | | | $ | 13.95 | | | $ | 18.45 | | | $ | 16.64 | | | $ | 15.17 | |
Net investment income | | | 0.04 | | | | 0.05 | | | | 0.06 | | | | 0.11 | | | | 0.05 | | | | 0.04 | 3 | | | 0.07 | 3 |
Net realized and unrealized gains (losses) on investments | | | 0.28 | | | | 2.10 | | | | 1.04 | | | | (3.06 | ) | | | (2.51 | ) | | | 2.42 | | | | 1.49 | |
| | | | | | | | | | | | | | | | | | | | | | | | | | | | |
Total from investment operations | | | 0.32 | | | | 2.15 | | | | 1.10 | | | | (2.95 | ) | | | (2.46 | ) | | | 2.46 | | | | 1.56 | |
Distributions to shareholders from | | | | | | | | | | | | | | | | | | | | | | | | | | | | |
Net investment income | | | (0.08 | ) | | | 0.00 | | | | (0.06 | ) | | | (0.09 | ) | | | (0.05 | ) | | | (0.05 | ) | | | (0.09 | ) |
Net realized gains | | | (0.50 | ) | | | 0.00 | | | | 0.00 | | | | (0.41 | ) | | | (1.99 | ) | | | (0.60 | ) | | | 0.00 | |
| | | | | | | | | | | | | | | | | | | | | | | | | | | | |
Total distributions to shareholders | | | (0.58 | ) | | | 0.00 | | | | (0.06 | ) | | | (0.50 | ) | | | (2.04 | ) | | | (0.65 | ) | | | (0.09 | ) |
Net asset value, end of period | | $ | 13.43 | | | $ | 13.69 | | | $ | 11.54 | | | $ | 10.50 | | | $ | 13.95 | | | $ | 18.45 | | | $ | 16.64 | |
Total return4 | | | 2.63 | % | | | 18.63 | % | | | 10.51 | % | | | (20.65 | )% | | | (14.58 | )% | | | 15.10 | % | | | 10.29 | % |
Ratios to average net assets (annualized) | | | | | | | | | | | | | | | | | | | | | | | | | | | | |
Gross expenses | | | 1.66 | % | | | 1.68 | % | | | 1.51 | % | | | 1.76 | % | | | 1.69 | % | | | 1.63 | % | | | 1.56 | % |
Net expenses | | | 1.66 | % | | | 1.67 | % | | | 1.51 | % | | | 1.76 | % | | | 1.69 | % | | | 1.63 | % | | | 1.55 | % |
Net investment income | | | 0.65 | % | | | 0.44 | % | | | 0.52 | % | | | 0.95 | % | | | 0.36 | % | | | 0.24 | % | | | 0.45 | % |
Supplemental data | | | | | | | | | | | | | | | | | | | | | | | | | | | | |
Portfolio turnover rate | | | 53 | % | | | 64 | % | | | 63 | % | | | 30 | % | | | 29 | % | | | 71 | % | | | 52 | % |
Net assets, end of period (000’s omitted) | | | $8,653 | | | | $8,768 | | | | $11,613 | | | | $11,462 | | | | $10,409 | | | | $12,331 | | | | $7,944 | |
| 1. | After the close of business on July 16, 2010, the Fund acquired the net assets of Evergreen Enhanced S&P 500 Fund which became accounting and performance survivor in the transaction. The information for the periods prior to July 19, 2010 is that of Class C of Evergreen Enhanced S&P 500 Fund. |
| 2. | For the ten months ended July 31, 2008. The Fund changed its fiscal year end from September 30 to July 31, effective July 31, 2008. |
| 3. | Calculated based upon average shares outstanding. |
| 4. | Total return calculations do not include any sales charges. Returns for periods of less than one year are not annualized. |
The accompanying notes are an integral part of these financial statements.
| | | | |
| 20 | | Wells Fargo Advantage Disciplined U.S. Core Fund | | Financial Highlights |
(For a share outstanding throughout each period)
| | | | | | | | | | | | | | | | | | | | | | | | | | | | |
| | | Six Months Ended
January 31, 2012
(Unaudited) | | | Year Ended July 31, | | | Year Ended September 30, | |
| Administrator Class | | | 2011 | | | 20101 | | | 20091 | | | 20081,2 | | | 20071 | | | 20061 | |
Net asset value, beginning of period | | $ | 14.36 | | | $ | 11.99 | | | $ | 10.92 | | | $ | 14.48 | | | $ | 19.06 | | | $ | 17.16 | | | $ | 15.62 | |
Net investment income | | | 0.11 | 3 | | | 0.19 | 3 | | | 0.20 | | | | 0.22 | | | | 0.19 | | | | 0.23 | | | | 0.24 | |
Net realized and unrealized gains (losses) on investments | | | 0.28 | | | | 2.19 | | | | 1.06 | | | | (3.17 | ) | | | (2.61 | ) | | | 2.49 | | | | 1.53 | |
| | | | | | | | | | | | | | | | | | | | | | | | | | | | |
Total from investment operations | | | 0.39 | | | | 2.38 | | | | 1.26 | | | | (2.95 | ) | | | (2.42 | ) | | | 2.72 | | | | 1.77 | |
Distributions to shareholders from | | | | | | | | | | | | | | | | | | | | | | | | | | | | |
Net investment income | | | (0.23 | ) | | | (0.01 | ) | | | (0.19 | ) | | | (0.20 | ) | | | (0.17 | ) | | | (0.22 | ) | | | (0.23 | ) |
Net realized gains | | | (0.50 | ) | | | 0.00 | | | | 0.00 | | | | (0.41 | ) | | | (1.99 | ) | | | (0.60 | ) | | | 0.00 | ) |
| | | | | | | | | | | | | | | | | | | | | | | | | | | | |
Total distributions to shareholders | | | (0.73 | ) | | | (0.01 | ) | | | (0.19 | ) | | | (0.61 | ) | | | (2.16 | ) | | | (0.82 | ) | | | (0.23 | ) |
Net asset value, end of period | | $ | 14.02 | | | $ | 14.36 | | | $ | 11.99 | | | $ | 10.92 | | | $ | 14.48 | | | $ | 19.06 | | | $ | 17.16 | |
Total return4 | | | 3.06 | % | | | 19.84 | % | | | 11.51 | % | | | (19.81 | )% | | | (13.89 | )% | | | 16.28 | % | | | 11.44 | % |
Ratios to average net assets (annualized) | | | | | | | | | | | | | | | | | | | | | | | | | | | | |
Gross expenses | | | 0.75 | % | | | 0.77 | % | | | 0.52 | % | | | 0.75 | % | | | 0.69 | % | | | 0.62 | % | | | 0.56 | % |
Net expenses | | | 0.74 | % | | | 0.74 | % | | | 0.52 | % | | | 0.75 | % | | | 0.69 | % | | | 0.62 | % | | | 0.55 | % |
Net investment income | | | 1.61 | % | | | 1.37 | % | | | 1.53 | % | | | 1.99 | % | | | 1.36 | % | | | 1.25 | % | | | 1.45 | % |
Supplemental data | | | | | | | | | | | | | | | | | | | | | | | | | | | | |
Portfolio turnover rate | | | 53 | % | | | 64 | % | | | 63 | % | | | 30 | % | | | 29 | % | | | 71 | % | | | 52 | % |
Net assets, end of period (000’s omitted) | | | $184,591 | | | | $244,716 | | | | $371,389 | | | | $484,594 | | | | $942,112 | | | | $1,592,166 | | | | $1,722,790 | |
| 1. | After the close of business on July 16, 2010, the Fund acquired the net assets of Evergreen Enhanced S&P 500 Fund which became accounting and performance survivor in the transaction. The information for the periods prior to July 19, 2010 is that of Class I of Evergreen Enhanced S&P 500 Fund. |
| 2. | For the ten months ended July 31, 2008. The Fund changed its fiscal year end from September 30 to July 31, effective July 31, 2008. |
| 3. | Calculated based upon average shares outstanding. |
| 4. | Returns for periods of less than one year are not annualized. |
The accompanying notes are an integral part of these financial statements.
| | | | | | |
| Financial Highlights | | Wells Fargo Advantage Disciplined U.S. Core Fund | | | 21 | |
(For a share outstanding throughout each period)
| | | | | | | | | | | | |
| | | Six Months Ended
January 31, 2012
(Unaudited) | | | Year Ended July 31, | |
| Institutional Class | | | 2011 | | | 20101 | |
Net asset value, beginning of period | | $ | 14.39 | | | $ | 11.99 | | | $ | 11.99 | |
Net investment income | | | 0.11 | 2 | | | 0.22 | | | | 0.00 | |
Net realized and unrealized gains (losses) on investments | | | 0.29 | | | | 2.19 | | | | 0.00 | |
| | | | | | | | | | | | |
Total from investment operations | | | 0.40 | | | | 2.41 | | | | 0.00 | |
Distributions to shareholders from | | | | | | | | | | | | |
Net investment income | | | (0.30 | ) | | | (0.01 | ) | | | 0.00 | |
Net realized gains | | | (0.50 | ) | | | 0.00 | | | | 0.00 | |
| | | | | | | | | | | | |
Total distributions to shareholders | | | (0.80 | ) | | | (0.01 | ) | | | 0.00 | |
Net asset value, end of period | | $ | 13.99 | | | $ | 14.39 | | | $ | 11.99 | |
Total return3 | | | 3.19 | % | | | 20.10 | % | | | 0.00 | % |
Ratios to average net assets (annualized) | | | | | | | | | | | | |
Gross expenses | | | 0.49 | % | | | 0.51 | % | | | 0.00 | % |
Net expenses | | | 0.48 | % | | | 0.47 | % | | | 0.00 | % |
Net investment income | | | 1.62 | % | | | 1.62 | % | | | 0.00 | % |
Supplemental data | | | | | | | | | | | | |
Portfolio turnover rate | | | 53 | % | | | 64 | % | | | 63 | % |
Net assets, end of period (000’s omitted) | | | $1,192 | | | | $12 | | | | $10 | |
| 1. | For the period from July 30, 2010 (commence of class operations) to July 31, 2010. |
| 2. | Calculated based upon average shares outstanding. |
| 3. | Returns for periods of less than one year are not annualized. |
The accompanying notes are an integral part of these financial statements.
| | | | |
| 22 | | Wells Fargo Advantage Disciplined U.S. Core Fund | | Notes to Financial Statements (Unaudited) |
1. ORGANIZATION
Wells Fargo Funds Trust (the “Trust”), a Delaware statutory trust organized on March 10, 1999, is an open-end management investment company registered under the Investment Company Act of 1940, as amended (the “1940 Act”). These financial statements report on Wells Fargo Advantage Disciplined U.S. Core Fund (the “Fund”) which is a diversified series of the Trust.
2. SIGNIFICANT ACCOUNTING POLICIES
The following significant accounting policies, which are consistently followed in the preparation of the financial statements of the Fund, are in conformity with U.S. generally accepted accounting principles which require management to make estimates and assumptions that affect the reported amounts of assets and liabilities, disclosure of contingent assets and liabilities at the date of the financial statements, and the reported amounts of revenues and expenses during the reporting period. Actual results could differ from those estimates.
Securities valuation
Investments in equity securities are valued each business day as of the close of regular trading on the New York Stock Exchange, which is usually 4:00 p.m. (Eastern Time). Securities which are traded on a national or foreign securities exchange are valued at the last reported sales price, except that securities listed on The Nasdaq Stock Market, Inc. (“Nasdaq”) are valued at the Nasdaq Official Closing Price (“NOCP”), and if no NOCP is available, then at the last reported sales price. If no sales price is shown on the Nasdaq, the bid price will be used. In the absence of any sale of securities listed on the Nasdaq, and in the case of other securities (including U.S. Government obligations, but excluding debt securities maturing in 60 days or less), the price will be deemed “stale” and the valuations will be determined in accordance with the Fund’s Fair Value Procedures.
Debt securities of sufficient credit quality with original maturities of 60 days or less generally are valued at amortized cost which approximates fair value. The amortized cost method involves valuing a security at its cost, plus accretion of discount or minus amortization of premium over the period until maturity.
Investments in open-end mutual funds and non-registered investment companies are generally valued at net asset value.
Investments which are not valued using any of the methods discussed above, are valued at their fair value, as determined by procedures established in good faith and approved by the Board of Trustees.
Security loans
The Fund may lend its securities from time to time in order to earn additional income in the form of fees or interest on securities received as collateral or the investment of any cash received as collateral. The Fund continues to receive interest or dividends on the securities loaned. The Fund receives collateral in the form of cash or securities with a value at least equal to the value of the securities on loan. The value of the loaned securities is determined at the close of each business day and any additional required collateral is delivered to the Fund on the next business day. In a securities lending transaction, the net asset value of the Fund will be affected by an increase or decrease in the value of the securities loaned and by an increase or decrease in the value of the instrument in which collateral is invested. The amount of securities lending activity undertaken by the Fund fluctuates from time to time. In the event of default or bankruptcy by the borrower, the Fund may be prevented from recovering the loaned securities or gaining access to the collateral or may experience delays or costs in doing so. In addition, the investment of any cash collateral received may lose all or part of its value. The Fund has the right under the lending agreement to recover the securities from the borrower on demand.
The Fund lends its securities through an unaffiliated securities lending agent. Cash collateral received in connection with its securities lending transactions is invested in Wells Fargo Securities Lending Cash Investments, LLC (the “Cash Collateral Fund”). The Cash Collateral Fund is exempt from registration under Section 3(c)(7) of the 1940 Act and is managed by Wells Fargo Funds Management LLC (“Funds Management”) and is sub-advised by Wells Capital Management Incorporated (“Wells Capital Management”). Funds Management receives an advisory fee starting at 0.05% and declining to 0.01% as the average daily net assets of the Cash Collateral Fund increase. All of the fees received by Funds Management are paid to Wells Capital Management for its services as sub-adviser. The Cash Collateral Fund seeks to provide a positive return compared to the daily Fed Funds Open rate by investing in high-quality, U.S. dollar-denominated short-term money market instruments. Cash Collateral Fund investments are fair valued based upon the amortized cost valuation technique. Income earned from investment in the Cash Collateral Fund is included in securities lending income on the Statement of Operations.
| | | | | | |
| Notes to Financial Statements (Unaudited) | | Wells Fargo Advantage Disciplined U.S. Core Fund | | | 23 | |
Futures contracts
The Fund may be subject to equity price risk in the normal course of pursuing its investment objectives. The Fund may buy and sell futures contracts in order to gain exposure to, or protect against, changes in security values and interest rates. The primary risks associated with the use of futures contracts are the imperfect correlation between changes in market values of securities held by the Fund and the prices of futures contracts, and the possibility of an illiquid market.
Futures contracts are valued based upon their quoted daily settlement prices when available. The aggregate principal amounts of the contracts are not recorded in the financial statements. Fluctuations in the value of the contracts are recorded in the Statement of Assets and Liabilities as an asset or liability and in the Statement of Operations as unrealized gains or losses until the contracts are closed, at which point they are recorded as net realized gains or losses on futures contracts. With futures contracts, there is minimal counterparty risk to the Fund since futures are exchange traded and the exchange’s clearinghouse, as counterparty to all exchange traded futures, guarantees the futures against default.
Security transactions and income recognition
Securities transactions are recorded on a trade date basis. Realized gains or losses are reported on the basis of identified cost of securities delivered.
Dividend income is recognized on the ex-dividend date.
Interest income is accrued daily and bond discounts are accreted and premiums are amortized daily based on the effective interest method. To the extent debt obligations are placed on non-accrual status, any related interest income may be reduced by writing off interest receivables when the collection of all or a portion of interest has become doubtful based on consistently applied procedures. If the issuer subsequently resumes interest payments or when the collectability of interest is reasonably assured, the debt obligation is removed from non-accrual status.
Distributions to shareholders
Distributions to shareholders from net investment income and net realized gains, if any, are recorded on the ex-dividend date. Such distributions are determined in conformity with income tax regulations, which may differ from generally accepted accounting principles.
Federal and other taxes
The Fund intends to continue to qualify as a regulated investment company by distributing substantially all of its investment company taxable income and any net realized capital gains (after reduction for capital loss carryforwards) sufficient to relieve it from all, or substantially all, federal income taxes. Accordingly, no provision for federal income taxes was required.
The Fund’s income and federal excise tax returns and all financial records supporting those returns for the prior three fiscal years are subject to examination by the federal and Delaware revenue authorities.
Under the recently enacted Regulated Investment Company Modernization Act of 2010, the Fund is permitted to carry forward capital losses incurred in taxable years which began after December 22, 2010 for an unlimited period. However, any losses incurred are required to be utilized prior to the losses incurred in pre-enactment taxable years. As a result of this ordering rule, pre-enactment capital loss carryforwards may be more likely to expire unused. Additionally, post-enactment capital losses that are carried forward will retain their character as either short-term or long-term capital losses rather than being considered all short-term as under previous law.
Class allocations
The separate classes of shares offered by the Fund differ principally in applicable sales charges, distribution, shareholder servicing and administration fees. Shareholders of each class bear certain expenses that pertain to that particular class. All shareholders bear the common expenses of the Fund, earn income from the portfolio, and are allocated unrealized gains and losses pro rata based on the average daily net assets of each class, without distinction between share classes. Dividends are determined separately for each class based on income and expenses allocable to each class. Realized gains and losses are allocated to each class pro rata based upon the net assets of each class on the date realized. Differences in per share dividend rates generally result from the relative weightings of pro rata income and realized gain allocations and from differences in separate class expenses, including distribution, shareholder servicing and administration fees.
| | | | |
| 24 | | Wells Fargo Advantage Disciplined U.S. Core Fund | | Notes to Financial Statements (Unaudited) |
3. FAIR VALUATION MEASUREMENTS
Fair value measurements of investments are determined within a framework that has established a fair value hierarchy based upon the various data inputs utilized in determining the value of the Fund’s investments. The three-level hierarchy gives the highest priority to unadjusted quoted prices in active markets for identical assets or liabilities (Level 1) and the lowest priority to significant unobservable inputs (Level 3). The Fund’s investments are classified within the fair value hierarchy based on the lowest level of input that is significant to the fair value measurement. The inputs are summarized into three broad levels as follows:
| n | | Level 1 – quoted prices in active markets for identical securities |
| n | | Level 2 – other significant observable inputs (including quoted prices for similar securities, interest rates, prepayment speeds, credit risk, etc.) |
| n | | Level 3 – significant unobservable inputs (including the Fund’s own assumptions in determining the fair value of investments) |
The inputs or methodologies used for valuing securities are not necessarily an indication of the risk associated with investing in those securities.
As of January 31, 2012, the inputs used in valuing the Fund’s assets, which are carried at fair value, were as follows:
| | | | | | | | | | | | | | | | |
| Investments in Securities | | Quoted Prices (Level 1) | | | Significant Other
Observable Inputs (Level 2) | | | Significant Unobservable Inputs (Level 3) | | | Total | |
Equity securities | | | | | | | | | | | | | | | | |
Common stocks | | $ | 442,451,239 | | | $ | 0 | | | $ | 0 | | | $ | 442,451,239 | |
Short-term investments | | | | | | | | | | | | | | | | |
Investment companies | | | 6,525,583 | | | | 32,336,450 | | | | 0 | | | | 38,862,033 | |
| | | $ | 448,976,822 | | | $ | 32,336,450 | | | $ | 0 | | | $ | 481,313,272 | |
Transfers in and transfers out are recognized at the end of the reporting period. For the six months ended January 31, 2012, the Fund did not have any significant transfers into/out of Level 1 and Level 2.
Further details on the major security types listed above can be found in the Portfolio of Investments.
4. TRANSACTIONS WITH AFFILIATES AND OTHER EXPENSES
Advisory fee
The Trust has entered into an advisory contract with Funds Management, an indirect wholly owned subsidiary of Wells Fargo & Company (“Wells Fargo”). The adviser is responsible for implementing investment policies and guidelines and for supervising the sub-adviser, who is responsible for day-to-day portfolio management of the Fund.
Pursuant to the contract, Funds Management is entitled to receive an annual advisory fee starting at 0.30% and declining to 0.25% as the average daily net assets of the Fund increase. For the six months ended January 31, 2012, the advisory fee was equivalent to an annual rate of 0.30% of the Fund’s average daily net assets.
Funds Management may retain the services of certain sub-advisers to provide daily portfolio management to the Fund. The fees related to sub-advisory services are borne directly by Funds Management and do not increase the overall fees paid by the Fund. Golden Capital Management, LLC, an affiliate of Funds Management, is the sub-adviser to the Fund and is entitled to receive a fee from Funds Management at an annual rate starting at 0.25% and declining to 0.15% as the average daily net assets of the Fund increase. Prior to October 1, 2011, Wells Capital Management, also an affiliate of Funds Management, was the sub-adviser to the Fund and received a fee from Funds Management at the same rates as is currently paid to Golden Capital Management, LLC.
Administration and transfer agent fees
The Trust has entered into an administration agreement with Funds Management. Under this agreement, for providing administrative services, which includes paying fees and expenses for services provided by the transfer agent, sub-transfer agents, omnibus account servicers and record-keepers, Funds Management is entitled to receive from the Fund an
| | | | | | |
| Notes to Financial Statements (Unaudited) | | Wells Fargo Advantage Disciplined U.S. Core Fund | | | 25 | |
annual fund level administration fee starting at 0.05% and declining to 0.03% as the average daily net assets of the Fund increase and a class level administration fee which is calculated based on the average daily net assets of each class as follows:
| | | | |
| | | Class Level Administration Fee | |
Class A, Class C | | | 0.26 | % |
Administrator Class | | | 0.10 | |
Institutional Class | | | 0.08 | |
Funds Management has contractually waived and/or reimbursed advisory and administration fees to the extent necessary to maintain certain net operating expense ratios for the Fund. Waiver of fees and/or reimbursement of expenses by Funds Management were made first from fund level expenses on a proportionate basis and then from class specific expenses. Funds Management has committed through July 18, 2013 to waive fees and/or reimburse expenses to the extent necessary to cap the Fund’s expenses at 0.92% for Class A, 1.67% for Class C, 0.74% for Administrator Class and 0.48% for Institutional Class.
Distribution fees
The Trust has adopted a Distribution Plan for Class C shares of the Fund pursuant to Rule 12b-1 under the 1940 Act. Distribution fees are charged to Class C shares and paid to Wells Fargo Funds Distributor, LLC, the principal underwriter, at an annual rate of 0.75% of the average daily net assets of Class C shares.
For the six months ended January 31, 2012, Wells Fargo Funds Distributor, LLC received $1,162 from the sale of Class A shares and $4 and $37 in contingent deferred sales charges from redemptions of Class A and Class C shares, respectively.
Shareholder servicing fees
The Trust has entered into contracts with one or more shareholder servicing agents, whereby Class A, Class C and Administrator Class of the Fund is charged a fee at an annual rate of 0.25% of the average daily net assets of each respective class.
A portion of these total shareholder servicing fees were paid to affiliates of Wells Fargo.
5. INVESTMENT PORTFOLIO TRANSACTIONS
Purchases and sales of investments, excluding U.S. Government obligations (if any) and short-term securities (securities with maturities of one year or less at purchase date), for the six months ended January 31, 20012 were $243,495,956 and $323,278,985, respectively.
6. DERIVATIVE TRANSACTIONS
During the six months ended January 31, 2012, the Fund used uninvested cash to enter into futures contracts to gain market exposure.
As of January 31, 2012, the Fund did not have any open futures contracts but had an average notional amount of $3,389,855 in long futures contracts during the six months ended January 31, 2012.
The realized gains and change in unrealized gains (losses) on futures contracts are reflected in the Statement of Operations.
7. BANK BORROWINGS
The Trust (excluding the money market funds) and Wells Fargo Variable Trust are parties to a $150,000,000 revolving credit agreement with State Street Bank and Trust Company, whereby the Fund is permitted to use bank borrowings for temporary or emergency purposes, such as to fund shareholder redemption requests. Interest under the credit agreement is charged to the Fund based on a borrowing rate equal to the higher of the Federal Funds rate in effect on that day plus 1.25% or the overnight LIBOR rate in effect on that day plus 1.25%. In addition, an annual commitment fee equal to 0.10% of the unused balance is allocated to each participating fund. Prior to September 6, 2011, the revolving credit agreement was for $125,000,000 and the annual commitment fee paid by the Fund was 0.125% of the unused balance. For the six months ended January 31, 2012, the Fund paid $263 in commitment fees.
| | | | |
| 26 | | Wells Fargo Advantage Disciplined U.S. Core Fund | | Notes to Financial Statements (Unaudited) |
For the six months ended January 31, 2012, there were no borrowings by the Fund under the agreement.
8. INDEMNIFICATION
Under the Trust’s organizational documents, the officers and directors are indemnified against certain liabilities that may arise out of performance of their duties to the Trust. Additionally, in the normal course of business, the Trust may enter into contracts with service providers that contain a variety of indemnification clauses. The Trust’s maximum exposure under these arrangements is dependent on future claims that may be made against the Fund and, therefore, cannot be estimated.
9. NEW ACCOUNTING PRONOUNCEMENTS
In May 2011, the Financial Accounting Standards Board (“FASB”) issued Accounting Standards Update (“ASU”) No. 2011-04 “Amendments to Achieve Common Fair Value Measurement and Disclosure Requirements in U.S. GAAP and IFRSs”. ASU No. 2011-04 amends FASB ASC Topic 820, Fair Value Measurements and Disclosures, to establish common requirements for measuring fair value and for disclosing information about fair value measurements in accordance with GAAP. The ASU is effective prospectively for interim and annual periods beginning after December 15, 2011. Management expects that adoption of the ASU will result in additional disclosures in the financial statements, as applicable.
In April 2011, FASB issued ASU No. 2011-03 “Reconsideration of Effective Control for Repurchase Agreements”. ASU No. 2011-03 amends FASB ASC Topic 860, Transfers and Servicing, specifically the criteria required to determine whether a repurchase agreement (repo) and similar agreements should be accounted for as sales of financial assets or secured borrowings with commitments. ASU No. 2011-03 changes the assessment of effective control by focusing on the transferor’s contractual rights and obligations and removing the criterion to assess its ability to exercise those rights or honor those obligations. This could result in changes to the way entities account for certain transactions including repurchase agreements, mortgage dollar rolls and reverse repurchase agreements. The ASU will become effective on a prospective basis for new transfers and modifications to existing transactions as of the beginning of the first interim or annual period beginning on or after December 15, 2011. Management has evaluated the impact of adopting the ASU and expects no significant changes.
| | | | | | |
| Other Information (Unaudited) | | Wells Fargo Advantage Disciplined U.S. Core Fund | | | 27 | |
PROXY VOTING INFORMATION
A description of the policies and procedures that the Fund uses to determine how to vote proxies relating to portfolio securities is available without charge, upon request, by calling 1-800-222-8222, visiting our Web site at wellsfargoadvantagefunds.com, or visiting the SEC Web site at sec.gov. Information regarding how the Fund voted proxies relating to portfolio securities during the most recent 12-month period ended June 30 is available without charge on the Fund’s Web site at wellsfargoadvantagefunds.com or by visiting the SEC Web site at sec.gov.
PORTFOLIO HOLDINGS INFORMATION
The complete portfolio holdings for the Fund are publicly available on the Fund’s Web site (wellsfargoadvantagefunds.com) on a monthly, 30-day or more delayed basis. In addition, top ten holdings information for the Fund is publicly available on the Fund’s Web site on a monthly, seven-day or more delayed basis. The Fund files its complete schedule of portfolio holdings with the SEC for the first and third quarters of each fiscal year on Form N-Q, which is available without charge by visiting the SEC Web site at sec.gov. In addition, the Fund’s Form N-Q may be reviewed and copied at the SEC’s Public Reference Room in Washington, DC, and at regional offices in New York City, at 233 Broadway, and in Chicago, at 175 West Jackson Boulevard, Suite 900. Information about the Public Reference Room may be obtained by calling 1-800-SEC-0330.
| | | | |
| 28 | | Wells Fargo Advantage Disciplined U.S. Core Fund | | Other Information (Unaudited) |
BOARD OF TRUSTEES
The following table provides basic information about the Board of Trustees (the “Trustees”) of the Trust and Officers of the Trust. This table should be read in conjunction with the Prospectus and the Statement of Additional Information1 of the Fund. Each of the Trustees and Officers listed below acts in identical capacities for the Wells Fargo Advantage family of funds, which consists of 137 funds comprising the Wells Fargo Funds Trust, Wells Fargo Variable Trust, Wells Fargo Master Trust and four closed-end funds (collectively the “Fund Complex”). All of the Trustees are also Members of the Audit and Governance Committees of each Trust in the Fund Complex. The mailing address of each Trustee and Officer is 525 Market Street, 12th Floor, San Francisco, CA 94105. Each Trustee and Officer serves an indefinite term, however, each Trustee serves such term until reaching the mandatory retirement age established by the Trustees.
Independent Trustees
| | | | | | |
Name and Year of Birth | | Position Held and Length of Service | | Principal Occupations During Past Five Years | | Other Directorships During
Past Five Years |
Peter G. Gordon
(Born 1942) | | Trustee, since 1998; Chairman, since 2005 (Lead Trustee since 2001) | | Co-Founder, Retired Chairman, President and CEO of Crystal Geyser Water Company. Trustee Emeritus, Colby College | | Asset Allocation Trust |
Isaiah Harris, Jr.
(Born 1952) | | Trustee, since 2009 | | Retired. Prior thereto, President and CEO of BellSouth Advertising and Publishing Corp. from 2005 to 2007, President and CEO of BellSouth Enterprises from 2004 to 2005 and President of BellSouth Consumer Services from 2000 to 2003. Emeritus member of the Iowa State University Foundation Board of Governors. Emeritus Member of the Advisory Board of Iowa State University School of Business. Mr. Harris is a certified public accountant. | | CIGNA Corporation; Deluxe Corporation; Asset Allocation Trust |
Judith M. Johnson
(Born 1949) | | Trustee, since 2008 | | Retired. Prior thereto, Chief Executive Officer and Chief Investment Officer of Minneapolis Employees Retirement Fund from 1996 to 2008. Ms. Johnson is an attorney, certified public accountant and a certified managerial accountant. | | Asset Allocation Trust |
Leroy Keith, Jr.
(Born 1939) | | Trustee, since 2010 | | Chairman, Bloc Global Services (development and construction). Trustee of the Evergreen Funds from 1983 to 2010. Former Managing Director, Almanac Capital Management (commodities firm), former Partner, Stonington Partners, Inc. (private equity fund), former Director, Obagi Medical Products Co. and former Director, Lincoln Educational Services. | | Trustee, Virtus Fund Complex (consisting of 40 portfolios as of 12/31/11); Asset Allocation Trust |
David F. Larcker
(Born 1950) | | Trustee, since 2009 | | James Irvin Miller Professor of Accounting at the Graduate School of Business, Stanford University, Director of Corporate Governance Research Program and Senior Faculty of The Rock Center for Corporate Governance since 2006. From 2005 to 2008, Professor of Accounting at the Graduate School of Business, Stanford University. Prior thereto, Ernst & Young Professor of Accounting at The Wharton School, University of Pennsylvania from 1985 to 2005. | | Asset Allocation Trust |
Olivia S. Mitchell
(Born 1953) | | Trustee, since 2006 | | International Foundation of Employee Benefit Plans Professor, Wharton School of the University of Pennsylvania since 1993. Director of Wharton’s Pension Research Council and Boettner Center on Pensions & Retirement Research, and Research Associate at the National Bureau of Economic Research. Previously, Cornell University Professor from 1978 to 1993. | | Asset Allocation Trust |
| | | | | | |
| Other Information (Unaudited) | | Wells Fargo Advantage Disciplined U.S. Core Fund | | | 29 | |
| | | | | | |
Name and Year of Birth | | Position Held and Length of Service | | Principal Occupations During Past Five Years | | Other Directorships During
Past Five Years |
Timothy J. Penny
(Born 1951) | | Trustee, since 1996 | | President and CEO of Southern Minnesota Initiative Foundation, a non-profit organization, since 2007 and Senior Fellow at the Humphrey Institute Policy Forum at the University of Minnesota since 1995. Member of the Board of Trustees of NorthStar Education Finance, Inc., a non-profit organization, since 2007. | | Asset Allocation Trust |
Michael S. Scofield
(Born 1943) | | Trustee, since 2010 | | Served on the Investment Company Institute’s Board of Governors and Executive Committee from 2008-2011 as well the Governing Council of the Independent Directors Council from 2006-2011 and the Independent Directors Council Executive Committee from 2008-2011. Chairman of the IDC from 2008-2010. Institutional Investor (Fund Directions) Trustee of Year in 2007. Trustee of the Evergreen Funds (and its predecessors) from 1984 to 2010. Chairman of the Evergreen Funds from 2000-2010. Former Trustee of the Mentor Funds. Retired Attorney, Law Offices of Michael S. Scofield and former Director and Chairman, Branded Media Corporation (multi-media branding company). | | Asset Allocation Trust |
Donald C. Willeke
(Born 1940) | | Trustee, since 1996 | | Principal of the law firm of Willeke & Daniels. General Counsel of the Minneapolis Employees Retirement Fund from 1984 until its consolidation into the Minnesota Public Employees Retirement Association on June 30, 2010. Director and Vice Chair of The Free Trust (non-profit corporation). Director of the American Chestnut Foundation (non-profit corporation). | | Asset Allocation Trust |
Officers
| | | | | | |
Name and Year of Birth | | Position Held and
Length of Service | | Principal Occupations During Past Five Years | | |
Karla M. Rabusch
(Born 1959) | | President, since 2003 | | Executive Vice President of Wells Fargo Bank, N.A. and President of Wells Fargo Funds Management, LLC since 2003. Senior Vice President and Chief Administrative Officer of Wells Fargo Funds Management, LLC from 2001 to 2003. | | |
C. David Messman
(Born 1960) | | Secretary, since 2000; Chief Legal Counsel, since 2003 | | Senior Vice President and Secretary of Wells Fargo Funds Management, LLC since 2001. Vice President and Managing Senior Counsel of Wells Fargo Bank, N.A. since 1996. | | |
Kasey Phillips
(Born 1970) | | Treasurer, since 2009 | | Senior Vice President of Wells Fargo Funds Management, LLC since 2009. Senior Vice President of Evergreen Investment Management Company, LLC from 2006 to 2010. Treasurer of the Evergreen Funds from 2005 to 2010. | | |
David Berardi
(Born 1975) | | Assistant Treasurer, since 2009 | | Vice President of Wells Fargo Funds Management, LLC since 2009. Vice President of Evergreen Investment Management Company, LLC from 2008 to 2010. Assistant Vice President of Evergreen Investment Services, Inc. from 2004 to 2008. Manager of Fund Reporting and Control for Evergreen Investment Management Company, LLC from 2004 to 2010. | | |
Jeremy DePalma
(Born 1974) | | Assistant Treasurer, since 2009 | | Senior Vice President of Wells Fargo Funds Management, LLC since 2009. Senior Vice President of Evergreen Investment Management Company, LLC from 2008 to 2010. Vice President, Evergreen Investment Services, Inc. from 2004 to 2007. Head of the Fund Reporting and Control Team within Fund Administration from 2005 to 2010. | | |
Debra Ann Early
(Born 1964) | | Chief Compliance Officer, since 2007 | | Chief Compliance Officer of Wells Fargo Funds Management, LLC since 2007. Chief Compliance Officer of Parnassus Investments from 2005 to 2007. Chief Financial Officer of Parnassus Investments from 2004 to 2007 and Senior Audit Manager of PricewaterhouseCoopers LLP from 1998 to 2004. | | |
| 1. | The Statement of Additional Information includes additional information about the Trustees and is available, without charge, upon request, by calling 1-800-222-8222 or by visiting the Web site at wellsfargoadvantagefunds.com. |
| | | | |
| 30 | | Wells Fargo Advantage Disciplined U.S. Core Fund | | List of Abbreviations |
The following is a list of common abbreviations for terms and entities which may have appeared in this report.
| ACB | — Agricultural Credit Bank |
| ADR | — American Depository Receipt |
| ADS | — American Depository Shares |
| AGC-ICC | — Assured Guaranty Corporation - Insured Custody Certificates |
| AGM | — Assured Guaranty Municipal |
| AMBAC | — American Municipal Bond Assurance Corporation |
| AMT | — Alternative Minimum Tax |
| BAN | — Bond Anticipation Notes |
| BHAC | — Berkshire Hathaway Assurance Corporation |
| CAB | — Capital Appreciation Bond |
| CCAB | — Convertible Capital Appreciation Bond |
| CDA | — Community Development Authority |
| CDO | — Collateralized Debt Obligation |
| COP | — Certificate of Participation |
| DRIVER | — Derivative Inverse Tax-Exempt Receipts |
| DW&P | — Department of Water & Power |
| DWR | — Department of Water Resources |
| ECFA | — Educational & Cultural Facilities Authority |
| EDA | — Economic Development Authority |
| EDFA | — Economic Development Finance Authority |
| ETF | — Exchange-Traded Fund |
| FFCB | — Federal Farm Credit Bank |
| FGIC | — Financial Guaranty Insurance Corporation |
| FHA | — Federal Housing Authority |
| FHLB | — Federal Home Loan Bank |
| FHLMC | — Federal Home Loan Mortgage Corporation |
| FNMA | — Federal National Mortgage Association |
| GDR | — Global Depository Receipt |
| GNMA | — Government National Mortgage Association |
| HCFR | — Healthcare Facilities Revenue |
| HEFA | — Health & Educational Facilities Authority |
| HEFAR | — Higher Education Facilities Authority Revenue |
| HFA | — Housing Finance Authority |
| HFFA | — Health Facilities Financing Authority |
| IBC | — Insured Bond Certificate |
| IDA | — Industrial Development Authority |
| IDAG | — Industrial Development Agency |
| IDR | — Industrial Development Revenue |
| KRW | — Republic of Korea Won |
| LIBOR | — London Interbank Offered Rate |
| LLC | — Limited Liability Company |
| LLP | — Limited Liability Partnership |
| MBIA | — Municipal Bond Insurance Association |
| MFHR | — Multi-Family Housing Revenue |
| MSTR | — Municipal Securities Trust Receipts |
| MUD | — Municipal Utility District |
| NATL-RE | — National Public Finance Guarantee Corporation |
| PCFA | — Pollution Control Finance Authority |
| PCR | — Pollution Control Revenue |
| PFA | — Public Finance Authority |
| PFFA | — Public Facilities Financing Authority |
| PFOTER | — Puttable Floating Option Tax-Exempt Receipts |
| plc | — Public Limited Company |
| PUTTER | — Puttable Tax-Exempt Receipts |
| R&D | — Research & Development |
| RDA | — Redevelopment Authority |
| RDFA | — Redevelopment Finance Authority |
| REIT | — Real Estate Investment Trust |
| ROC | — Reset Option Certificates |
| SAVRS | — Select Auction Variable Rate Securities |
| SBA | — Small Business Authority |
| SFHR | — Single Family Housing Revenue |
| SFMR | — Single Family Mortgage Revenue |
| SPDR | — Standard & Poor’s Depositary Receipts |
| TAN | — Tax Anticipation Notes |
| TIPS | — Treasury Inflation-Protected Securities |
| TRAN | — Tax Revenue Anticipation Notes |
| TCR | — Transferable Custody Receipts |
| TTFA | — Transportation Trust Fund Authority |
| TVA | — Tennessee Valley Authority |
| XLCA | — XL Capital Assurance |


FOR MORE INFORMATION
More information about Wells Fargo Advantage Funds is available free upon request. To obtain literature, please write, e-mail, visit the Fund’s Web site, or call:
Wells Fargo Advantage Funds
P.O. Box 8266
Boston, MA 02266-8266
E-mail: wfaf@wellsfargo.com
Web site: wellsfargoadvantagefunds.com
Individual investors: 1-800-222-8222
Retail investment professionals: 1-888-877-9275
Institutional investment professionals: 1-866-765-0778
This report and the financial statements contained herein are submitted for the general information of the shareholders of Wells Fargo Advantage Funds. If this report is used for promotional purposes, distribution of the report must be accompanied or preceded by a current prospectus. For a prospectus containing more complete information, including charges and expenses, call 1-800-222-8222 or visit the Fund’s Web site at wellsfargoadvantagefunds.com. Please consider the investment objectives, risks, charges, and expenses of the investment carefully before investing. This and other information about Wells Fargo Advantage Funds can be found in the current prospectus. Read the prospectus carefully before you invest or send money.
Wells Fargo Funds Management, LLC, a wholly owned subsidiary of Wells Fargo & Company, provides investment advisory and administrative services for Wells Fargo Advantage Funds. Other affiliates of Wells Fargo & Company provide subadvisory and other services for the Funds. The Funds are distributed by Wells Fargo Funds Distributor, LLC, Member FINRA/SIPC, an affiliate of Wells Fargo & Company.
NOT FDIC INSURED ¡ NO BANK GUARANTEE ¡ MAY LOSE VALUE
© 2012 Wells Fargo Funds Management, LLC. All rights reserved.
| | |
 | | 277944 03-12 SA203/SAR203 1-12 |

Wells Fargo Advantage
Endeavor Select FundSM

Semi-Annual Report
January 31, 2012

Reduce clutter. Save trees.
Sign up for electronic delivery of prospectuses and shareholder reports at wellsfargo.com/advantagedelivery
Contents
The views expressed and any forward-looking statements are as of January 31, 2012, unless otherwise noted, and are those of the Fund managers and/or Wells Fargo Funds Management, LLC. Discussions of individual securities, or the markets generally, or any Wells Fargo Advantage Fund are not intended as individual recommendations. Future events or results may vary significantly from those expressed in any forward-looking statements; the views expressed are subject to change at any time in response to changing circumstances in the market. Wells Fargo Funds Management, LLC, disclaims any obligation to publicly update or revise any views expressed or forward-looking statements.
NOT FDIC INSURED ¡ NO BANK GUARANTEE ¡ MAY LOSE VALUE

WELLS FARGO INVESTMENT HISTORY
| | |
| |
| 1932 | | Keystone creates one of the first mutual fund families. |
| |
| 1971 | | Wells Fargo & Company introduces one of the first institutional index funds. |
| |
| 1978 | | Wells Fargo applies Markowitz and Sharpe’s research on Modern Portfolio Theory to introduce one of the industry’s first Tactical Asset Allocation (TAA) models in institutional separately managed accounts. |
| |
| 1984 | | Wells Fargo Stagecoach Funds launches its first asset allocation fund. |
| |
| 1989 | | The Tactical Asset Allocation (TAA) Model is first applied to Wells Fargo’s asset allocation mutual funds. |
| |
| 1994 | | Wells Fargo introduces the LifePath Funds, one of the first suites of target date funds (now the Wells Fargo Advantage Dow Jones Target Date FundsSM ). |
| |
| 1996 | | Evergreen Investments and Keystone Funds merge. |
| |
| 1997 | | Wells Fargo launches Wells Fargo Advantage WealthBuilder PortfoliosSM, a fund-of-funds suite of products that includes the use of quantitative models to shift assets among investment styles. |
| |
| 1999 | | Norwest Advantage Funds and Stagecoach Funds are reorganized into Wells Fargo Funds after the merger of Norwest and Wells Fargo. |
| |
| 2002 | | Evergreen Retail and Evergreen Institutional companies form the umbrella asset management company, Evergreen Investments. |
| |
| 2005 | | The integration of Strong Funds with Wells Fargo Funds creates Wells Fargo Advantage Funds, resulting in one of the top 20 mutual fund companies in the United States. |
| |
| 2006 | | Wells Fargo Advantage Funds relaunches the target date product line as Wells Fargo Advantage Dow Jones Target Date Funds. |
| |
| 2010 | | The mergers and reorganizations of Evergreen and Wells Fargo Advantage mutual funds are completed, unifying the families under the brand of Wells Fargo Advantage Funds. |
Wells Fargo Advantage Funds®
Wells Fargo Advantage Funds skillfully guides institutions, financial advisors, and individuals through the investment terrain to help them reach their financial objectives. Everything we do on behalf of investors is backed by our unique combination of qualifications.
Strength
Our organization is built on the standards of integrity and service established by our parent company—Wells Fargo & Company—more than 150 years ago. And, because we’re part of a highly diversified financial enterprise, we offer the depth of resources to help investors succeed.
Expertise
Our multi-boutique model offers investors access to the independent thinking of premier investment managers that have been chosen for their time-tested strategies. While each team specializes in a specific investment strategy, collectively they provide investors a wide choice of distinct investment styles. Our dedication to investment excellence doesn’t end with our expertise in manager selection—risk management, analysis, and rigorous ongoing review seek to ensure each manager’s investment process remains consistent.
Partnership
Our collaborative approach is built around understanding the needs and goals of our clients. By adhering to core principles of sound judgment and steady guidance, we support you through every stage of the investment decision process.
Carefully consider a fund’s investment objectives, risks, charges, and expenses before investing. For a current prospectus and, if available, a summary prospectus, containing this and other information, visit wellsfargoadvantagefunds.com. Read it carefully before investing.
Wells Fargo Funds Management, LLC, a wholly owned subsidiary of Wells Fargo & Company, provides investment advisory and administrative services for Wells Fargo Advantage Funds®. Other affiliates of Wells Fargo & Company provide subadvisory and other services for the Funds. The Funds are distributed by Wells Fargo Funds Distributor, LLC, Member FINRA/SIPC, an affiliate of Wells Fargo & Company.
“Dow Jones®” and “Dow Jones Target Date IndexesSM” are service marks of Dow Jones Trademark Holdings, LLC (“Dow Jones”), have been licensed to CME Group Index Services LLC (“CME Indexes”) and have been sublicensed for use for certain purposes by Global Index Advisors, Inc, and Wells Fargo Funds Management, LLC. The Wells Fargo Advantage Dow Jones Target Date FundsSM based on the Dow Jones Target Date IndexesSM, are not sponsored, endorsed, sold or promoted by Dow Jones, CME Indexes or their respective affiliates and none of them makes any representation regarding the advisability of investing in such product(s).
NOT FDIC INSURED ¡ NO BANK GUARANTEE ¡ MAY LOSE VALUE
Not part of the semi-annual report.
Wells Fargo Advantage Funds offers more than 110 mutual funds across a wide range of asset classes, representing over $217 billion in assets under management, as of January 31, 2012.
| | | | |
| Equity Funds | | | | |
Asia Pacific Fund | | Equity Value Fund | | Precious Metals Fund |
C&B Large Cap Value Fund | | Global Opportunities Fund | | Premier Large Company Growth Fund |
C&B Mid Cap Value Fund | | Growth Fund | | Small Cap Opportunities Fund |
Capital Growth Fund | | Index Fund | | Small Cap Value Fund |
Common Stock Fund | | International Equity Fund | | Small Company Growth Fund |
Disciplined U.S. Core Fund | | International Value Fund | | Small Company Value Fund |
Discovery Fund† | | Intrinsic Small Cap Value Fund | | Small/Mid Cap Core Fund |
Diversified Equity Fund | | Intrinsic Value Fund | | Small/Mid Cap Value Fund |
Diversified International Fund | | Intrinsic World Equity Fund | | Special Mid Cap Value Fund |
Diversified Small Cap Fund | | Large Cap Core Fund | | Special Small Cap Value Fund |
Emerging Growth Fund | | Large Cap Growth Fund | | Specialized Technology Fund |
Emerging Markets Equity Fund | | Large Company Value Fund | | Strategic Large Cap Growth Fund |
Endeavor Select Fund† | | Omega Growth Fund | | Traditional Small Cap Growth Fund |
Enterprise Fund† | | Opportunity Fund† | | Utility and Telecommunications Fund |
| Bond Funds | | | | |
Adjustable Rate Government Fund | | Inflation-Protected Bond Fund | | Short-Term Bond Fund |
California Limited-Term Tax-Free Fund | | Intermediate Tax/AMT-Free Fund | | Short-Term High Yield Bond Fund |
California Tax-Free Fund | | International Bond Fund | | Short-Term Municipal Bond Fund |
Colorado Tax-Free Fund | | Minnesota Tax-Free Fund | | Strategic Municipal Bond Fund |
Government Securities Fund | | Municipal Bond Fund | | Total Return Bond Fund |
High Income Fund | | North Carolina Tax-Free Fund | | Ultra Short-Term Income Fund |
High Yield Bond Fund | | Pennsylvania Tax-Free Fund | | Ultra Short-Term Municipal Income Fund |
Income Plus Fund | | Short Duration Government Bond Fund | | Wisconsin Tax-Free Fund |
| Asset Allocation Funds | | | | |
Absolute Return Fund | | WealthBuilder Equity Portfolio† | | Target 2020 Fund† |
Asset Allocation Fund | | WealthBuilder Growth Allocation Portfolio† | | Target 2025 Fund† |
Conservative Allocation Fund | | WealthBuilder Growth Balanced Portfolio† | | Target 2030 Fund† |
Diversified Capital Builder Fund | | WealthBuilder Moderate Balanced Portfolio† | | Target 2035 Fund† |
Diversified Income Builder Fund | | WealthBuilder Tactical Equity Portfolio† | | Target 2040 Fund† |
Growth Balanced Fund | | Target Today Fund† | | Target 2045 Fund† |
Index Asset Allocation Fund | | Target 2010 Fund† | | Target 2050 Fund† |
Moderate Balanced Fund | | Target 2015 Fund† | | Target 2055 Fund† |
WealthBuilder Conservative Allocation Portfolio† | | | | |
| Money Market Funds | | | | |
100% Treasury Money Market Fund | | Heritage Money Market Fund† | | National Tax-Free Money Market Fund |
California Municipal Money Market Fund | | Money Market Fund | | Prime Investment Money Market Fund |
Cash Investment Money Market Fund | | Municipal Cash Management Money Market Fund | | Treasury Plus Money Market Fund |
Government Money Market Fund | | Municipal Money Market Fund | | |
| Variable Trust Funds1 | | | | |
VT Discovery Fund† | | VT Intrinsic Value Fund | | VT Small Cap Growth Fund |
VT Index Asset Allocation Fund | | VT Omega Growth Fund | | VT Small Cap Value Fund |
VT International Equity Fund | | VT Opportunity Fund† | | VT Total Return Bond Fund |
An investment in a money market fund is not insured or guaranteed by the Federal Deposit Insurance Corporation or any other government agency. Although the Wells Fargo Advantage Money Market Funds seek to preserve the value of your investment at $1.00 per share, it is possible to lose money by investing in a money market fund.
| 1. | The Variable Trust Funds are generally available only through insurance company variable contracts. |
| † | In this report, the Wells Fargo Advantage Discovery FundSM, Wells Fargo Advantage Endeavor Select FundSM, Wells Fargo Advantage Enterprise FundSM, Wells Fargo Advantage Opportunity FundSM, Wells Fargo Advantage WealthBuilder Conservative Allocation PortfolioSM, Wells Fargo Advantage WealthBuilder Equity PortfolioSM, Wells Fargo Advantage WealthBuilder Growth Allocation PortfolioSM, Wells Fargo Advantage WealthBuilder Growth Balanced PortfolioSM, Wells Fargo Advantage WealthBuilder Moderate Balanced PortfolioSM, Wells Fargo Advantage WealthBuilder Tactical Equity PortfolioSM, Wells Fargo Advantage Dow Jones Target Today FundSM, Wells Fargo Advantage Dow Jones Target 2010 FundSM, Wells Fargo Advantage Dow Jones Target 2015 FundSM, Wells Fargo Advantage Dow Jones Target 2020 FundSM, Wells Fargo Advantage Dow Jones Target 2025 FundSM, Wells Fargo Advantage Dow Jones Target 2030 FundSM, Wells Fargo Advantage Dow Jones Target 2035 FundSM, Wells Fargo Advantage Dow Jones Target 2040 FundSM, Wells Fargo Advantage Dow Jones Target 2045 FundSM, Wells Fargo Advantage Dow Jones Target 2050 FundSM, Wells Fargo Advantage Dow Jones Target 2055 FundSM, Wells Fargo Advantage Heritage Money Market FundSM, Wells Fargo Advantage VT Discovery FundSM, and Wells Fargo Advantage VT Opportunity FundSM are referred to as the Discovery Fund, Endeavor Select Fund, Enterprise Fund, Opportunity Fund, WealthBuilder Conservative Allocation Portfolio, WealthBuilder Equity Portfolio, WealthBuilder Growth Allocation Portfolio, WealthBuilder Growth Balanced Portfolio, WealthBuilder Moderate Balanced Portfolio, WealthBuilder Tactical Equity Portfolio, Target Today Fund, Target 2010 Fund, Target 2015 Fund, Target 2020 Fund, Target 2025 Fund, Target 2030 Fund, Target 2035 Fund, Target 2040 Fund, Target 2045 Fund, Target 2050 Fund, Target 2055 Fund, Heritage Money Market Fund, VT Discovery Fund, and VT Opportunity Fund, respectively. |
Not part of the semi-annual report.
| | | | |
| 2 | | Wells Fargo Advantage Endeavor Select Fund | | Letter to Shareholders |

Karla M. Rabusch,
President
Wells Fargo Advantage Funds
The period was marked by increased confidence that the U.S. economy was staging a fragile recovery, offset by continued concerns about the possible effect on the global economy of the ongoing European sovereign debt crisis—which began in Greece and later spread to the larger economies of Italy and Spain.
The slow-motion debt crisis in the eurozone was a major headwind to both domestic and global stock market indexes.
Dear Valued Shareholder:
We’re pleased to offer you this semi-annual report for the Wells Fargo Advantage Endeavor Select Fund for the six-month period that ended January 31, 2012. The period was marked by increased confidence that the U.S. economy was staging a fragile recovery, offset by continued concerns about the possible effect on the global economy of the ongoing European sovereign debt crisis—which began in Greece and later spread to the larger economies of Italy and Spain. Most U.S. stock indexes posted gains for the period, even if only modest ones.
Worries gave way to guarded optimism for the U.S. economy.
The period began with worries that the U.S. economy was returning to recession. Revised figures for gross domestic product (GDP) indicated that the U.S. economy grew by an annualized rate of only 0.8% in the first half of 2011. Moreover, although the July 2011 Institute for Supply Management (ISM) manufacturing survey suggested that factories continued to expand, the rate of expansion was lower than in previous months. The prolonged debate over whether and how to raise the U.S. debt ceiling—which only ended on July 31, 2011—also depressed market sentiment by highlighting the country’s political divisions.
The stock market remained volatile throughout September. By late October, however, stronger economic data led to greater optimism and higher stock prices. Revised real GDP growth came in at 1.8% in the third quarter of 2011 and 2.8% in the fourth quarter, suggesting that the recovery was on firmer footing. Economic growth was not evenly distributed, though, as December 2011 retail same-store sales generally showed stronger growth for retailers targeting affluent customers than for those targeting the broad middle class. The reported unemployment rate also showed some signs of improvement, falling from 9.1% in August 2011 to 8.3% in January 2012. However, this decline in the unemployment rate was accompanied by an increase in the number of Americans not in the labor force, raising concerns about the economy’s ability to generate jobs.
The eurozone had continued trouble.
The slow-motion debt crisis in the eurozone was a major headwind to both domestic and global stock market indexes. The worsening debt and deficit numbers for Greece in late 2011 and early 2012 cast doubt on the country’s ability to service its debt under the plan put in place by the European Union and the International Monetary Fund and put the ongoing drama of the European sovereign debt crisis back on center stage. Investors became increasingly concerned that Greece would default on its debt, a scenario that only seemed more likely as many Greeks rioted in response to greater budgetary austerity and the discussion moved from whether private investors would take a loss on their Greek debt to how big the loss would be. Because many eurozone banks owned Greek debt and many U.S. banks had financial ties to eurozone banks, investors worried about the effect of such an event on the financial system and the global economy.
Even as the situation in Greece deteriorated, eurozone GDP numbers supported the case for a modest recovery in the global economy. Reported GDP growth for the 17 countries that comprise the eurozone was modest, rising 0.2% in the third quarter compared to the second quarter, and by 0.2% in the fourth quarter
| | | | | | |
| Letter to Shareholders | | Wells Fargo Advantage Endeavor Select Fund | | | 3 | |
compared to the third quarter. However, the eurozone average concealed a wide variation between economies, with Germany’s growing by 0.5% in the third quarter of 2011 even as Greece’s GDP contracted.
Central banks continued to provide stimulus.
Throughout the reporting period, the Federal Open Market Committee (FOMC) kept its key interest rates effectively at zero in order to support the economy and financial system. Moreover, in response to extreme market volatility and signs of a weakening economy, in its August 2011 policy statement, the Federal Reserve (Fed) announced it would keep interest rates “exceptionally low” until at least mid-2013 as a way to support the economy. Market participants interpreted the Fed’s statement to mean that the central bankers believed the economy would remain weak over the next two years. However, the Fed also said that it was considering a “range of policy tools available to promote a stronger economic recovery” and “is prepared to employ these tools as appropriate.”
At the beginning of the period, the European Central Bank (ECB) had a key rate of 1.50% but lowered it to 1.25% in November 2011 and then to 1.00% in December 2011 in an attempt to support the sluggish eurozone recovery. To support the banking system, in late 2011, the ECB initiated a long-term refinancing operation (LTRO) in which it supplied three-year loans to banks against a wide range of collateral. The operation basically provided a near-unlimited amount of liquidity to banks, easing some investor concerns about the effect of an increasingly probable Greek default.
We use time-tested investment strategies, even as many variables are at work in the market.
Experience tells us that strict adherence to time-tested investment strategies has its rewards. As a whole, Wells Fargo Advantage Funds represents investments across a range of asset classes and investment styles, giving you an opportunity to create a diversified investment portfolio. While diversification may not prevent losses in a downturn, it does provide you with one way of managing risk.
Thank you for choosing to invest with Wells Fargo Advantage Funds. We appreciate your confidence in us and remain committed to helping you meet your financial needs. For current information about your fund investments, contact your investment professional, visit our website at wellsfargoadvantagefunds.com, or call us directly at 1-800-222-8222. We are available 24 hours a day, 7 days a week.
Sincerely,

Karla M. Rabusch
President
Wells Fargo Advantage Funds
| | | | |
| 4 | | Wells Fargo Advantage Endeavor Select Fund | | Letter to Shareholders |
Notice to Shareholders
The Board of Trustees for Wells Fargo Advantage Funds has unanimously approved the following modifications to certain net asset value (NAV) waiver privileges and commission schedules:
| | n | | Effective May 1, 2012, automatic investment plan (AIP) purchases and proceeds received from systematic withdrawals will no longer qualify for NAV repurchase privileges. | |
| | n | | Effective May 1, 2012, discretionary rights to waive the upfront commission for Class C and “jumbo” Class A share purchases will no longer be granted to broker/dealers. However, we will continue to waive the Class C shares contingent deferred sales charge for redemptions by employer-sponsored retirement plans where the dealer of record waived its commission at the time of purchase. | |
| | n | | Effective July 31, 2012, NAV purchase privileges for former Evergreen Class IS and Class R shareholders are being modified to remove the ability to purchase Class A shares at NAV unless those shares are held directly with the Fund on or after July 31, 2012. | |
Please contact your investment professional or call us directly at 1-800-222-8222 if you have any questions on this Notice to Shareholders.
| | | | | | |
| Performance Highlights (Unaudited) | | Wells Fargo Advantage Endeavor Select Fund | | | 5 | |
INVESTMENT OBJECTIVE
The Fund seeks long-term capital appreciation.
ADVISER
Wells Fargo Funds Management, LLC
SUB-ADVISER
Wells Capital Management Incorporated
PORTFOLIO MANAGERS
Thomas J. Pence, CFA
Michael T. Smith, CFA
FUND INCEPTION
December 29, 2000
| | | | |
TEN LARGEST EQUITY HOLDINGS1 (AS OF JANUARY 31, 2012) | |
Apple Incorporated | | | 9.82% | |
QUALCOMM Incorporated | | | 3.94% | |
Google Incorporated Class A | | | 3.60% | |
Danaher Corporation | | | 3.38% | |
Visa Incorporated Class A | | | 3.11% | |
Amazon.com Incorporated | | | 2.75% | |
priceline.com Incorporated | | | 2.67% | |
Precision Castparts Corporation | | | 2.65% | |
American Tower Corporation | | | 2.63% | |
Monsanto Company | | | 2.60% | |
| | |
SECTOR DISTRIBUTION2 (AS OF JANUARY 31, 2012) | | |
|
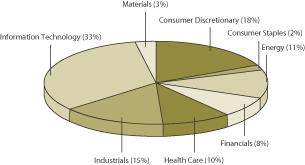 |
| 1. | The ten largest equity holdings are calculated based on the value of the securities divided by total net assets of the Fund. Holdings are subject to change and may have changed since the date specified. |
| 2. | Sector distribution is subject to change and is calculated based on the total long-term investments of the Fund. |
| | | | |
| 6 | | Wells Fargo Advantage Endeavor Select Fund | | Performance Highlights (Unaudited) |
AVERAGE ANNUAL TOTAL RETURN3 (%) (AS OF JANUARY 31, 2012)
| | | | | | | | | | | | | | | | | | | | | | | | | | | | | | | | | | | | | | | | | | | | |
| | | | | | Including Sales Charge | | | Excluding Sales Charge | | | Expense Ratios4 | |
| | | Inception Date | | | 6 Months* | | | 1 Year | | | 5 Year | | | 10 Year | | | 6 Months* | | | 1 Year | | | 5 Year | | | 10 Year | | | Gross | | | Net5 | |
Class A (STAEX) | | | 12/29/2000 | | | | (8.10 | ) | | | (5.64 | ) | | | (1.36 | ) | | | 3.69 | | | | (2.47 | ) | | | 0.10 | | | | (0.18 | ) | | | 4.31 | | | | 1.23% | | | | 1.23% | |
Class B (WECBX)** | | | 12/29/2000 | | | | (7.80 | ) | | | (5.55 | ) | | | (1.35 | ) | | | 3.75 | | | | (2.80 | ) | | | (0.55 | ) | | | (0.93 | ) | | | 3.75 | | | | 1.98% | | | | 1.98% | |
Class C (WECCX) | | | 12/29/2000 | | | | (3.80 | ) | | | (1.55 | ) | | | (0.91 | ) | | | 3.51 | | | | (2.80 | ) | | | (0.55 | ) | | | (0.91 | ) | | | 3.51 | | | | 1.98% | | | | 1.98% | |
Administrator Class (WECDX) | | | 04/08/2005 | | | | | | | | | | | | | | | | | | | | (2.24 | ) | | | 0.50 | | | | 0.11 | | | | 4.50 | | | | 1.07% | | | | 1.00% | |
Institutional Class (WFCIX) | | | 04/08/2005 | | | | | | | | | | | | | | | | | | | | (2.22 | ) | | | 0.60 | | | | 0.28 | | | | 4.62 | | | | 0.80% | | | | 0.80% | |
Russell 1000® Growth Index6 | | | | | | | | | | | | | | | | | | | | | | | 2.84 | | | | 6.07 | | | | 3.17 | | | | 3.38 | | | | | | | | | |
| * | Returns for periods of less than one year are not annualized. |
| ** | Class B shares are closed to investment, except in connectionwith the reinvestment of any distributions and permitted exchanges. |
Figures quoted represent past performance, which is no guarantee of future results and do not reflect the deduction of taxes that a shareholder may pay on fund distributions or the redemption of fund shares. Investment return and principal value of an investment will fluctuate so that an investor’s shares, when redeemed, may be worth more or less than their original cost. Performance shown without sales charges would be lower if sales charges were reflected. Current performance may be lower or higher than the performance data quoted and assumes the reinvestment of dividends and capital gains. Current month-end performance is available on the Fund’s Web site – wellsfargoadvantagefunds.com.
Index returns do not include transaction costs associated with buying and selling securities, any mutual fund fees or expenses or any taxes. It is not possible to invest directly in an index.
For Class A shares, the maximum front-end sales charge is 5.75%. For Class B shares, the maximum contingent deferred sales charge is 5.00%. For Class C shares, the maximum contingent deferred sales charge is 1.00%. Performance including sales charge assumes the sales charge for the corresponding time period. Administrator Class and Institutional Class shares are sold without a front-end sales charge or contingent deferred sales charge.
Stock fund values fluctuate in response to the activities of individual companies and general market and economic conditions. Certain investment strategies tend to increase the total risk of an investment (relative to the broader market). This Fund is exposed to foreign investment risk and non-diversification risk. Consult the Fund’s prospectus for additional information on these and other risks.
| 3. | Historical performance shown for the Administrator Class and Institutional Class shares prior to their inception reflects the performance of Class A shares, and includes the higher expenses applicable to Class A shares. If these expenses had not been included, returns would be higher. |
| 4. | Reflects the expense ratios as stated in the most recent prospectuses. |
| 5. | The Adviser has committed through November 30, 2012 to waive fees and/or reimburse expenses to the extent necessary to cap the Fund’s Total Annual Fund Operating Expenses After Fee Waiver, excluding certain expenses, at 1.25% for Class A, 2.00% for Class B, 2.00% for Class C, 1.00% for Administrator Class and 0.80% for Institutional Class shares. Without this cap, the Fund’s returns would have been lower. |
| 6. | The Russell 1000® Growth Index measures the performance of those Russell 1000 Growth Index companies with higher price-to-book ratios and higher forecasted growth values. You cannot invest directly in an index. |
| | | | | | |
| Fund Expenses (Unaudited) | | Wells Fargo Advantage Endeavor Select Fund | | | 7 | |
As a shareholder of the Fund, you incur two types of costs: (1) transaction costs, including sales charges (loads) on purchase payments and contingent deferred sales charges (if any) on redemptions and (2) ongoing costs, including management fees; distribution (12b-1) and/or shareholder service fees; and other Fund expenses. This example is intended to help you understand your ongoing costs (in dollars) of investing in the Fund and to compare these costs with the ongoing costs of investing in other mutual funds.
The example is based on an investment of $1,000 invested at the beginning of the six-month period and held for the entire period from August 1, 2011 to January 31, 2012.
Actual Expenses
The “Actual” line of the table below provides information about actual account values and actual expenses. You may use the information in this line, together with the amount you invested, to estimate the expenses that you paid over the period. Simply divide your account value by $1,000 (for example, an $8,600 account value divided by $1,000 = 8.6), then multiply the result by the number in the “Actual” line under the heading entitled “Expenses Paid During Period” for your applicable class of shares to estimate the expenses you paid on your account during this period.
Hypothetical Example for Comparison Purposes
The “Hypothetical” line of the table below provides information about hypothetical account values and hypothetical expenses based on the Fund’s actual expense ratio and an assumed rate of return of 5% per year before expenses, which is not the Fund’s actual return. The hypothetical account values and expenses may not be used to estimate the actual ending account balance or expenses you paid for the period. You may use this information to compare the ongoing costs of investing in the Fund and other funds. To do so, compare this 5% hypothetical example with the 5% hypothetical examples that appear in the shareholder reports of the other funds.
Please note that the expenses shown in the table are meant to highlight your ongoing costs only and do not reflect any transactional costs, such as sales charges (loads) and contingent deferred sales charges. Therefore, the “Hypothetical” line of the table is useful in comparing ongoing costs only, and will not help you determine the relative total costs of owning different funds. In addition, if these transactional costs were included, your costs would have been higher.
| | | | | | | | | | | | | | | | |
| | | Beginning
Account Value
08-01-2011 | | | Ending
Account Value
01-31-2012 | | | Expenses
Paid During
the Period1 | | | Net Annual
Expense Ratio | |
Class A | | | | | | | | | | | | | | | | |
Actual | | $ | 1,000.00 | | | $ | 975.30 | | | $ | 6.16 | | | | 1.24 | % |
Hypothetical (5% return before expenses) | | $ | 1,000.00 | | | $ | 1,018.90 | | | $ | 6.29 | | | | 1.24 | % |
Class B | | | | | | | | | | | | | | | | |
Actual | | $ | 1,000.00 | | | $ | 971.98 | | | $ | 9.86 | | | | 1.99 | % |
Hypothetical (5% return before expenses) | | $ | 1,000.00 | | | $ | 1,015.13 | | | $ | 10.08 | | | | 1.99 | % |
Class C | | | | | | | | | | | | | | | | |
Actual | | $ | 1,000.00 | | | $ | 971.98 | | | $ | 9.86 | | | | 1.99 | % |
Hypothetical (5% return before expenses) | | $ | 1,000.00 | | | $ | 1,015.13 | | | $ | 10.08 | | | | 1.99 | % |
Administrator Class | | | | | | | | | | | | | | | | |
Actual | | $ | 1,000.00 | | | $ | 977.60 | | | $ | 4.97 | | | | 1.00 | % |
Hypothetical (5% return before expenses) | | $ | 1,000.00 | | | $ | 1,020.11 | | | $ | 5.08 | | | | 1.00 | % |
Institutional Class | | | | | | | | | | | | | | | | |
Actual | | $ | 1,000.00 | | | $ | 977.82 | | | $ | 3.98 | | | | 0.80 | % |
Hypothetical (5% return before expenses) | | $ | 1,000.00 | | | $ | 1,021.11 | | | $ | 4.06 | | | | 0.80 | % |
| 1. | Expenses paid is equal to the annualized expense ratio of each class multiplied by the average account value over the period, multiplied by the number of days in the most recent fiscal half-year divided by the number of days in the fiscal year (to reflect the one-half year period). |
| | | | |
| 8 | | Wells Fargo Advantage Endeavor Select Fund | | Portfolio of Investments—January 31, 2012 (Unaudited) |
| | | | | | | | | | | | |
| Security Name | | | | | | Shares | | | Value | |
| | | | | | | | | | | | |
| | | |
Common Stocks: 97.51% | | | | | | | | | | |
| | | | |
Consumer Discretionary: 17.32% | | | | | | | | | | | | |
| | | |
| Hotels, Restaurants & Leisure: 2.01% | | | | | | | | | | |
Starbucks Corporation | | | | | | | 380,047 | | | $ | 18,215,653 | |
| | | | | | | | | | | | |
| | | |
| Internet & Catalog Retail: 5.42% | | | | | | | | | | |
Amazon.com Incorporated† | | | | | | | 127,900 | | | | 24,868,876 | |
priceline.com Incorporated† | | | | | | | 45,700 | | | | 24,197,236 | |
| | | | |
| | | | | | | | | | | 49,066,112 | |
| | | | | | | | | | | | |
| | | |
| Multiline Retail: 1.78% | | | | | | | | | | |
Dollar General Corporation† | | | | | | | 378,784 | | | | 16,139,986 | |
| | | | | | | | | | | | |
| | | |
| Specialty Retail: 2.56% | | | | | | | | | | |
TJX Companies Incorporated | | | | | | | 339,400 | | | | 23,126,716 | |
| | | | | | | | | | | | |
| | | |
| Textiles, Apparel & Luxury Goods: 5.55% | | | | | | | | | | |
lululemon athletica incorporatedǠ | | | | | | | 232,600 | | | | 14,684,038 | |
Nike Incorporated Class B | | | | | | | 178,900 | | | | 18,603,811 | |
Ralph Lauren Corporation | | | | | | | 111,300 | | | | 16,917,600 | |
| | | | |
| | | | | | | | | | | 50,205,449 | |
| | | | | | | | | | | | |
| | | |
Consumer Staples: 2.20% | | | | | | | | | | |
| | | |
| Food & Staples Retailing: 2.20% | | | | | | | | | | |
Costco Wholesale Corporation | | | | | | | 241,900 | | | | 19,901,113 | |
| | | | | | | | | | | | |
| | | |
Energy: 10.54% | | | | | | | | | | |
| | | |
| Energy Equipment & Services: 4.03% | | | | | | | | | | |
Cameron International Corporation† | | | | | | | 308,700 | | | | 16,422,840 | |
Ensco International plc ADR | | | | | | | 380,800 | | | | 20,045,312 | |
| | | | |
| | | | | | | | | | | 36,468,152 | |
| | | | | | | | | | | | |
| | | |
| Oil, Gas & Consumable Fuels: 6.51% | | | | | | | | | | |
Exxon Mobil Corporation | | | | | | | 264,000 | | | | 22,107,360 | |
Occidental Petroleum Corporation | | | | | | | 181,800 | | | | 18,138,186 | |
Pioneer Natural Resources Company | | | | | | | 187,600 | | | | 18,628,680 | |
| | | | |
| | | | | | | | | | | 58,874,226 | |
| | | | | | | | | | | | |
| | | |
Financials: 7.90% | | | | | | | | | | |
| | | |
| Consumer Finance: 5.27% | | | | | | | | | | |
MasterCard Incorporated | | | | | | | 55,000 | | | | 19,556,350 | |
Visa Incorporated Class A« | | | | | | | 279,600 | | | | 28,138,944 | |
| | | | |
| | | | | | | | | | | 47,695,294 | |
| | | | | | | | | | | | |
| | | |
| REITs: 2.63% | | | | | | | | | | |
American Tower Corporation | | | | | | | 374,000 | | | | 23,752,740 | |
| | | | | | | | | | | | |
| | | |
Health Care: 10.33% | | | | | | | | | | |
| | | |
| Biotechnology: 3.96% | | | | | | | | | | |
Alexion Pharmaceuticals Incorporated† | | | | | | | 217,454 | | | | 16,691,769 | |
Gilead Sciences Incorporated† | | | | | | | 392,900 | | | | 19,189,236 | |
| | | | |
| | | | | | | | | | | 35,881,005 | |
| | | | | | | | | | | | |
| | | | | | |
| Portfolio of Investments—January 31, 2012 (Unaudited) | | Wells Fargo Advantage Endeavor Select Fund | | | 9 | |
| | | | | | | | | | | | |
| Security Name | | | | | | Shares | | | Value | |
| | | | | | | | | | | | |
| | | |
| Health Care Providers & Services: 2.17% | | | | | | | | | | |
UnitedHealth Group Incorporated | | | | | | | 378,400 | | | $ | 19,597,336 | |
| | | | | | | | | | | | |
| | | |
| Health Care Technology: 0.14% | | | | | | | | | | |
Cerner Corporation† | | | | | | | 21,390 | | | | 1,302,437 | |
| | | | | | | | | | | | |
| | | |
| Pharmaceuticals: 4.06% | | | | | | | | | | |
Allergan Incorporated | | | | | | | 188,600 | | | | 16,579,826 | |
Shire plc ADR | | | | | | | 202,512 | | | | 20,153,994 | |
| | | | |
| | | | | | | | | | | 36,733,820 | |
| | | | | | | | | | | | |
| | | |
Industrials: 14.42% | | | | | | | | | | |
| | | |
| Aerospace & Defense: 2.65% | | | | | | | | | | |
Precision Castparts Corporation« | | | | | | | 146,600 | | | | 23,995,488 | |
| | | | | | | | | | | | |
| | | |
| Machinery: 7.88% | | | | | | | | | | |
Cummins Incorporated | | | | | | | 203,794 | | | | 21,194,576 | |
Danaher Corporation | | | | | | | 582,800 | | | | 30,602,828 | |
Deere & Company | | | | | | | 225,600 | | | | 19,435,440 | |
| | | | |
| | | | | | | | | | | 71,232,844 | |
| | | | | | | | | | | | |
| | | |
| Road & Rail: 3.89% | | | | | | | | | | |
Hertz Global Holdings IncorporatedǠ | | | | | | | 1,067,100 | | | | 14,512,560 | |
Union Pacific Corporation | | | | | | | 181,014 | | | | 20,691,710 | |
| | | | |
| | | | | | | | | | | 35,204,270 | |
| | | | | | | | | | | | |
| | | |
Information Technology: 32.20% | | | | | | | | | | |
| | | |
| Communications Equipment: 5.74% | | | | | | | | | | |
F5 Networks Incorporated† | | | | | | | 136,500 | | | | 16,344,510 | |
QUALCOMM Incorporated | | | | | | | 605,600 | | | | 35,621,392 | |
| | | | |
| | | | | | | | | | | 51,965,902 | |
| | | | | | | | | | | | |
| | | |
| Computers & Peripherals: 12.01% | | | | | | | | | | |
Apple Incorporated† | | | | | | | 194,649 | | | | 88,853,376 | |
EMC Corporation† | | | | | | | 768,200 | | | | 19,788,832 | |
| | | | |
| | | | | | | | | | | 108,642,208 | |
| | | | | | | | | | | | |
| | | |
| Internet Software & Services: 7.24% | | | | | | | | | | |
Baidu.com Incorporated ADR† | | | | | | | 111,900 | | | | 14,269,488 | |
eBay Incorporated† | | | | | | | 590,800 | | | | 18,669,280 | |
Google Incorporated Class A† | | | | | | | 56,200 | | | | 32,602,182 | |
| | | | |
| | | | | | | | | | | 65,540,950 | |
| | | | | | | | | | | | |
| | | |
| IT Services: 2.07% | | | | | | | | | | |
Cognizant Technology Solutions Corporation Class A† | | | | | | | 260,500 | | | | 18,690,875 | |
| | | | | | | | | | | | |
| | | |
| Semiconductors & Semiconductor Equipment: 3.36% | | | | | | | | | | |
ARM Holdings plc ADR« | | | | | | | 473,332 | | | | 13,669,828 | |
Avago Technologies Limited | | | | | | | 493,300 | | | | 16,742,602 | |
| | | | |
| | | | | | | | | | | 30,412,430 | |
| | | | | | | | | | | | |
| | | | |
| 10 | | Wells Fargo Advantage Endeavor Select Fund | | Portfolio of Investments—January 31, 2012 (Unaudited) |
| | | | | | | | | | | | | | |
| Security Name | | | | | | | Shares | | | Value | |
| | | | | | | | | | | | | | |
| | | | |
| Software: 1.78% | | | | | | | | | | | | | | |
Citrix Systems Incorporated† | | | | | | | | | 246,300 | | | $ | 16,061,223 | |
| | | | | | | | | | | | | | |
| | | | |
Materials: 2.60% | | | | | | | | | | | | | | |
| | | | |
| Chemicals: 2.60% | | | | | | | | | | | | | | |
Monsanto Company | | | | | | | | | 286,300 | | | | 23,490,915 | |
| | | | | | | | | | | | | | |
| | | | |
Total Common Stocks (Cost $678,048,702) | | | | | | | | | | | | | 882,197,144 | |
| | | | | | | | | | | | | | |
| | | | |
| | | | | | | | Principal | | | | |
| | | | |
| Other: 0.47% | | | | | | | | | | | | | | |
Gryphon Funding Limited, Pass-Through Entity(v)(a)(i) | | | | | | | | $ | 5,595,997 | | | | 1,510,919 | |
VFNC Corporation, Pass-Through Entity, 0.27%(v)(a)(i)±144A | | | | | | | | | 6,376,643 | | | | 2,741,956 | |
| | | | |
Total Other (Cost $1,987,788) | | | | | | | | | | | | | 4,252,875 | |
| | | | | | | | | | | | | | |
| | | | |
| | | Yield | | | | | Shares | | | | |
| | | | |
Short-Term Investments: 10.03% | | | | | | | | | | | | | | |
| | | | |
| Investment Companies: 10.03% | | | | | | | | | | | | | | |
Wells Fargo Advantage Cash Investment Money Market Fund, Institutional Class(l)(u) | | | 0.02 | % | | | | | 17,759,307 | | | | 17,759,307 | |
Wells Fargo Securities Lending Cash Investments, LLC(v)(r)(l)(u) | | | 0.15 | | | | | | 72,966,037 | | | | 72,966,037 | |
| | | | | | | | | | | | | | |
| | | | |
Total Short-Term Investments (Cost $90,725,344) | | | | | | | | | | | | | 90,725,344 | |
| | | | | | | | | | | | | | |
| | | | | | | | |
| Total Investments in Securities | | | | | | | | |
| (Cost $770,761,834)* | | | 108.01 | % | | | 977,175,363 | |
Other Assets and Liabilities, Net | | | (8.01 | ) | | | (72,466,253 | ) |
| | | | | | | | |
| Total Net Assets | | | 100.00 | % | | $ | 904,709,110 | |
| | | | | | | | |
| « | All or a portion of this security is on loan. |
| † | Non-income earning security. |
| (v) | Security represents investment of cash collateral received from securities on loan. |
| (a) | Security is fair valued by the Management Valuation Team, and in certain instances by the Board of Trustees, in accordance with procedures approved by the Board of Trustees. |
| ± | Variable rate investment. |
| (r) | The investment company is exempt from registration under Section 3(c)(7) of the 1940 Act. |
| 144A | Security that may be resold to “qualified institutional buyers” under Rule 144A or security offered pursuant to Section 4(2) of the Securities Act of 1933, as amended. |
| (l) | Investment in an affiliate. |
| (u) | Rate shown is the 7-day annualized yield at period end. |
| * | Cost for federal income tax purposes is $776,575,993 and net unrealized appreciation (depreciation) consists of: |
| | | | |
Gross unrealized appreciation | | $ | 204,453,359 | |
Gross unrealized depreciation | | | (3,853,989 | ) |
| | | | |
Net unrealized appreciation | | $ | 200,599,370 | |
The accompanying notes are an integral part of these financial statements.
| | | | | | |
| Statement of Assets and Liabilities—January 31, 2012 (Unaudited) | | Wells Fargo Advantage Endeavor Select Fund | | | 11 | |
| | | | |
| | | | |
| |
Assets | | | | |
Investments | | | | |
In unaffiliated securities (including securities on loan), at value (see cost below) | | $ | 886,450,019 | |
In affiliated securities, at value (see cost below) | | | 90,725,344 | |
| | | | |
Total investments, at value (see cost below) | | | 977,175,363 | |
Receivable for investments sold | | | 3,084,941 | |
Receivable for Fund shares sold | | | 1,248,734 | |
Receivable for dividends | | | 80,166 | |
Receivable for securities lending income | | | 7,785 | |
Prepaid expenses and other assets | | | 48,088 | |
| | | | |
Total assets | | | 981,645,077 | |
| | | | |
| |
Liabilities | | | | |
Payable for Fund shares redeemed | | | 1,140,943 | |
Payable upon receipt of securities loaned | | | 74,953,825 | |
Advisory fee payable | | | 469,753 | |
Distribution fees payable | | | 4,899 | |
Due to other related parties | | | 100,834 | |
Accrued expenses and other liabilities | | | 265,713 | |
| | | | |
Total liabilities | | | 76,935,967 | |
| | | | |
Total net assets | | $ | 904,709,110 | |
| | | | |
| |
NET ASSETS CONSIST OF | | | | |
Paid-in capital | | $ | 940,043,715 | |
Undistributed net investment loss | | | (636,542 | ) |
Accumulated net realized losses on investments | | | (241,111,592 | ) |
Net unrealized gains on investments | | | 206,413,529 | |
| | | | |
Total net assets | | $ | 904,709,110 | |
| | | | |
| |
COMPUTATION OF NET ASSET VALUE AND OFFERING PRICE PER SHARE1 | | | | |
Net assets – Class A | | $ | 55,064,671 | |
Shares outstanding – Class A | | | 5,576,575 | |
Net asset value per share – Class A | | | $9.87 | |
Maximum offering price per share – Class A2 | | | $10.47 | |
Net assets – Class B | | $ | 1,223,893 | |
Shares outstanding – Class B | | | 135,661 | |
Net asset value per share – Class B | | | $9.02 | |
Net assets – Class C | | $ | 6,643,803 | |
Shares outstanding – Class C | | | 736,461 | |
Net asset value per share – Class C | | | $9.02 | |
Net assets – Administrator Class | | $ | 101,241,774 | |
Shares outstanding – Administrator Class | | | 10,086,077 | |
Net asset value per share – Administrator Class | | | $10.04 | |
Net assets – Institutional Class | | $ | 740,534,969 | |
Shares outstanding – Institutional Class | | | 73,023,462 | |
Net asset value per share – Institutional Class | | | $10.14 | |
| |
Investments in unaffiliated securities, at cost | | $ | 680,036,490 | |
| | | | |
Investments in affiliated securities, at cost | | $ | 90,725,344 | |
| | | | |
Total investments, at cost | | $ | 770,761,834 | |
| | | | |
Securities on loan, at value | | $ | 73,177,879 | |
| | | | |
| 1. | The Fund has an unlimited number of authorized shares. |
| 2. | Maximum offering price is computed as 100/94.25 of net asset value. On investments of $50,000 or more, the offering price is reduced. |
The accompanying notes are an integral part of these financial statements.
| | | | |
| 12 | | Wells Fargo Advantage Endeavor Select Fund | | Statement of Operations—Six Months Ended January 31, 2012 (Unaudited) |
| | | | |
| | | | |
| |
Investment income | | | | |
Dividends* | | $ | 3,627,288 | |
Securities lending income, net | | | 55,933 | |
Income from affiliated securities | | | 9,655 | |
| | | | |
Total investment income | | | 3,692,876 | |
| | | | |
| |
Expenses | | | | |
Advisory fee | | | 3,144,521 | |
Administration fees | | | | |
Fund level | | | 246,891 | |
Class A | | | 91,249 | |
Class B | | | 1,702 | |
Class C | | | 8,535 | |
Administrator Class | | | 88,700 | |
Institutional Class | | | 292,839 | |
Shareholder servicing fees | | | | |
Class A | | | 87,740 | |
Class B | | | 1,636 | |
Class C | | | 8,207 | |
Administrator Class | | | 217,179 | |
Distribution fees | | | | |
Class B | | | 4,909 | |
Class C | | | 24,621 | |
Custody and accounting fees | | | 22,313 | |
Professional fees | | | 16,518 | |
Registration fees | | | 39,849 | |
Shareholder report expenses | | | 123,931 | |
Trustees’ fees and expenses | | | 7,578 | |
Other fees and expenses | | | 16,706 | |
| | | | |
Total expenses | | | 4,445,624 | |
Less: Fee waivers and/or expense reimbursements | | | (116,206 | ) |
| | | | |
Net expenses | | | 4,329,418 | |
| | | | |
Net investment loss | | | (636,542 | ) |
| | | | |
| |
REALIZED AND UNREALIZED GAINS (LOSSES) ON INVESTMENTS | | | | |
Net realized gains on investments | | | 1,117,572 | |
Net change in unrealized gains (losses) on investments | | | (38,928,139 | ) |
| | | | |
Net realized and unrealized gains (losses) on investments | | | (37,810,567 | ) |
| | | | |
Net decrease in net assets resulting from operations | | $ | (38,447,109 | ) |
| | | | |
| |
* Net of foreign dividend withholding taxes of | | | $8,927 | |
The accompanying notes are an integral part of these financial statements.
| | | | | | |
| Statements of Changes in Net Assets | | Wells Fargo Advantage Endeavor Select Fund | | | 13 | |
| | | | | | | | | | | | | | | | |
| | | Six Months Ended
January 31, 2012
(Unaudited) | | | Year Ended
July 31, 2011 | |
| | | | |
Operations | | | | | | | | | | | | | | | | |
Net investment loss | | | | | | $ | (636,542 | ) | | | | | | $ | (2,261,368 | ) |
Net realized gains on investments | | | | | | | 1,117,572 | | | | | | | | 185,914,884 | |
Net change in unrealized gains (losses) on investments | | | | | | | (38,928,139 | ) | | | | | | | 93,350,136 | |
| | | | | | | | | | | | | | | | |
Net increase (decrease) in net assets resulting from operations | | | | | | | (38,447,109 | ) | | | | | | | 277,003,652 | |
| | | | | | | | | | | | | | | | |
| | | | |
Capital share transactions | | | Shares | | | | | | | | Shares | | | | | |
Proceeds from shares sold | | | | | | | | | | | | | | | | |
Class A | | | 228,976 | | | | 2,083,747 | | | | 2,440,416 | | | | 23,535,041 | |
Class B | | | 3,956 | | | | 33,739 | | | | 5,168 | | | | 47,537 | |
Class C | | | 14,806 | | | | 127,351 | | | | 57,823 | | | | 523,855 | |
Administrator Class | | | 6,255,443 | | | | 60,888,214 | | | | 6,705,953 | | | | 65,199,722 | |
Institutional Class | | | 6,129,024 | | | | 57,654,368 | | | | 20,315,594 | | | | 199,445,632 | |
| | | | | | | | | | | | | | | | |
| | | | | | | 120,787,419 | | | | | | | | 288,751,787 | |
| | | | | | | | | | | | | | | | |
Payment for shares redeemed | | | | | | | | | | | | | | | | |
Class A | | | (4,009,860 | ) | | | (37,959,674 | ) | | | (8,510,412 | ) | | | (83,011,574 | ) |
Class B | | | (44,250 | ) | | | (374,531 | ) | | | (178,672 | ) | | | (1,550,952 | ) |
Class C | | | (81,177 | ) | | | (681,916 | ) | | | (298,247 | ) | | | (2,609,826 | ) |
Administrator Class | | | (18,867,409 | ) | | | (183,798,898 | ) | | | (11,163,995 | ) | | | (107,274,190 | ) |
Institutional Class | | | (15,437,558 | ) | | | (145,049,798 | ) | | | (50,686,101 | ) | | | (473,696,678 | ) |
| | | | | | | | | | | | | | | | |
| | | | | | | (367,864,817 | ) | | | | | | | (668,143,220 | ) |
| | | | | | | | | | | | | | | | |
Net decrease in net assets resulting
from capital share transactions | | | | | | | (247,077,398 | ) | | | | | | | (379,391,433 | ) |
| | | | | | | | | | | | | | | | |
Total decrease in net assets | | | | | | | (285,524,507 | ) | | | | | | | (102,387,781 | ) |
| | | | | | | | | | | | | | | | |
| | | | |
Net assets | | | | | | | | | | | | | | | | |
Beginning of period | | | | | | | 1,190,233,617 | | | | | | | | 1,292,621,398 | |
| | | | | | | | | | | | | | | | |
End of period | | | | | | $ | 904,709,110 | | | | | | | $ | 1,190,233,617 | |
| | | | | | | | | | | | | | | | |
Undistributed net investment income (loss) | | | | | | $ | (636,542 | ) | | | | | | $ | 0 | |
| | | | | | | | | | | | | | | | |
The accompanying notes are an integral part of these financial statements.
| | | | |
| 14 | | Wells Fargo Advantage Endeavor Select Fund | | Financial Highlights |
(For a share outstanding throughout each period)
| | | | | | | | | | | | | | | | | | | | | | | | |
| | | Six Months Ended
January 31, 2012 (Unaudited) | | | Year Ended July 31, | |
| Class A | | | 2011 | | | 2010 | | | 2009 | | | 2008 | | | 2007 | |
Net asset value, beginning of period | | $ | 10.12 | | | $ | 8.12 | | | $ | 7.25 | | | $ | 10.81 | | | $ | 10.85 | | | $ | 9.35 | |
Net investment loss | | | (0.02 | )1 | | | (0.05 | )1 | | | (0.04 | )1 | | | (0.01 | )1 | | | (0.04 | )1 | | | (0.04 | )1 |
Net realized and unrealized gains (losses) on investments | | | (0.23 | ) | | | 2.05 | | | | 0.91 | | | | (3.29 | ) | | | 0.10 | | | | 1.54 | |
| | | | | | | | | | | | | | | | | | | | | | | | |
Total from investment operations | | | (0.25 | ) | | | 2.00 | | | | 0.87 | | | | (3.30 | ) | | | 0.06 | | | | 1.50 | |
Distributions to shareholders from | | | | | | | | | | | | | | | | | | | | | | | | |
Net realized gains | | | 0.00 | | | | 0.00 | | | | 0.00 | | | | (0.26 | ) | | | (0.10 | ) | | | (0.00 | )2 |
Net asset value, end of period | | | $9.87 | | | | $10.12 | | | | $8.12 | | | | $7.25 | | | | $10.81 | | | | $10.85 | |
Total return3 | | | (2.47 | )% | | | 24.63 | % | | | 12.00 | % | | | (30.10 | )% | | | 0.50 | % | | | 16.05 | % |
Ratios to average net assets (annualized) | | | | | | | | | | | | | | | | | | | | | | | | |
Gross expenses | | | 1.24 | % | | | 1.23 | % | | | 1.28 | % | | | 1.32 | % | | | 1.31 | % | | | 1.36 | % |
Net expenses | | | 1.24 | % | | | 1.23 | % | | | 1.25 | % | | | 1.25 | % | | | 1.25 | % | | | 1.25 | % |
Net investment loss | | | (0.48 | )% | | | (0.52 | )% | | | (0.51 | )% | | | (0.08 | )% | | | (0.38 | )% | | | (0.40 | )% |
Supplemental data | | | | | | | | | | | | | | | | | | | | | | | | |
Portfolio turnover rate | | | 49 | % | | | 100 | % | | | 139 | % | | | 173 | % | | | 154 | % | | | 91 | % |
Net assets, end of period (000’s omitted) | | | $55,065 | | | | $94,704 | | | | $125,266 | | | | $155,666 | | | | $237,689 | | | | $162,421 | |
| 1. | Calculated based upon average shares outstanding. |
| 2. | Amount is less than $0.005. |
| 3. | Total return calculations do not include any sales charges. Returns for periods of less than one year are not annualized. |
The accompanying notes are an integral part of these financial statements.
| | | | | | |
| Financial Highlights | | Wells Fargo Advantage Endeavor Select Fund | | | 15 | |
(For a share outstanding throughout each period)
| | | | | | | | | | | | | | | | | | | | | | | | |
| | | Six Months Ended
January 31, 2012 (Unaudited) | | | Year Ended July 31, | |
| Class B | | | 2011 | | | 2010 | | | 2009 | | | 2008 | | | 2007 | |
Net asset value, beginning of period | | $ | 9.28 | | | $ | 7.50 | | | $ | 6.75 | | | $ | 10.18 | | | $ | 10.29 | | | $ | 8.94 | |
Net investment loss | | | (0.05 | )1 | | | (0.11 | )1 | | | (0.09 | )1 | | | (0.06 | )1 | | | (0.12 | )1 | | | (0.11 | )1 |
Net realized and unrealized gains (losses) on investments | | | (0.21 | ) | | | 1.89 | | | | 0.84 | | | | (3.11 | ) | | | 0.11 | | | | 1.46 | |
| | | | | | | | | | | | | | | | | | | | | | | | |
Total from investment operations | | | (0.26 | ) | | | 1.78 | | | | 0.75 | | | | (3.17 | ) | | | (0.01 | ) | | | 1.35 | |
Distributions to shareholders from | | | | | | | | | | | | | | | | | | | | | | | | |
Net realized gains | | | 0.00 | | | | 0.00 | | | | 0.00 | | | | (0.26 | ) | | | (0.10 | ) | | | (0.00 | )2 |
Net asset value, end of period | | $ | 9.02 | | | $ | 9.28 | | | $ | 7.50 | | | $ | 6.75 | | | $ | 10.18 | | | $ | 10.29 | |
Total return3 | | | (2.80 | )% | | | 23.73 | % | | | 11.11 | % | | | (30.71 | )% | | | (0.15 | )% | | | 15.11 | % |
Ratios to average net assets (annualized) | | | | | | | | | | | | | | | | | | | | | | | | |
Gross expenses | | | 1.99 | % | | | 1.98 | % | | | 2.02 | % | | | 2.07 | % | | | 2.06 | % | | | 2.11 | % |
Net expenses | | | 1.99 | % | | | 1.98 | % | | | 2.00 | % | | | 2.00 | % | | | 2.00 | % | | | 2.00 | % |
Net investment loss | | | (1.23 | )% | | | (1.26 | )% | | | (1.25 | )% | | | (0.85 | )% | | | (1.12 | )% | | | (1.16 | )% |
Supplemental data | | | | | | | | | | | | | | | | | | | | | | | | |
Portfolio turnover rate | | | 49 | % | | | 100 | % | | | 139 | % | | | 173 | % | | | 154 | % | | | 91 | % |
Net assets, end of period (000’s omitted) | | | $1,224 | | | | $1,633 | | | | $2,622 | | | | $3,976 | | | | $9,097 | | | | $10,596 | |
| 1. | Calculated based upon average shares outstanding. |
| 2. | Amount is less than $0.005. |
| 3. | Total return calculations do not include any sales charges. Returns for periods of less than one year are not annualized. |
The accompanying notes are an integral part of these financial statements.
| | | | |
| 16 | | Wells Fargo Advantage Endeavor Select Fund | | Financial Highlights |
(For a share outstanding throughout each period)
| | | | | | | | | | | | | | | | | | | | | | | | |
| | | Six Months Ended
January 31, 2012 (Unaudited) | | | Year Ended July 31, | |
| Class C | | | 2011 | | | 2010 | | | 2009 | | | 2008 | | | 2007 | |
Net asset value, beginning of period | | $ | 9.28 | | | $ | 7.50 | | | $ | 6.75 | | | $ | 10.18 | | | $ | 10.28 | | | $ | 8.93 | |
Net investment loss | | | (0.05 | )1 | | | (0.11 | )1 | | | (0.09 | )1 | | | (0.05 | )1 | | | (0.12 | )1 | | | (0.11 | )1 |
Net realized and unrealized gains (losses) on investments | | | (0.21 | ) | | | 1.89 | | | | 0.84 | | | | (3.12 | ) | | | 0.12 | | | | 1.46 | |
| | | | | | | | | | | | | | | | | | | | | | | | |
Total from investment operations | | | (0.26 | ) | | | 1.78 | | | | 0.75 | | | | (3.17 | ) | | | 0.00 | | | | 1.35 | |
Distributions to shareholders from | | | | | | | | | | | | | | | | | | | | | | | | |
Net realized gains | | | 0.00 | | | | 0.00 | | | | 0.00 | | | | (0.26 | ) | | | (0.10 | ) | | | (0.00 | )2 |
Net asset value, end of period | | $ | 9.02 | | | $ | 9.28 | | | $ | 7.50 | | | $ | 6.75 | | | $ | 10.18 | | | $ | 10.28 | |
Total return3 | | | (2.80 | )% | | | 23.73 | % | | | 11.11 | % | | | (30.70 | )% | | | (0.06 | )% | | | 15.12 | % |
Ratios to average net assets (annualized) | | | | | | | | | | | | | | | | | | | | | | | | |
Gross expenses | | | 1.99 | % | | | 1.98 | % | | | 2.03 | % | | | 2.07 | % | | | 2.06 | % | | | 2.11 | % |
Net expenses | | | 1.99 | % | | | 1.98 | % | | | 2.00 | % | | | 2.00 | % | | | 2.00 | % | | | 2.00 | % |
Net investment loss | | | (1.24 | )% | | | (1.27 | )% | | | (1.26 | )% | | | (0.82 | )% | | | (1.13 | )% | | | (1.14 | )% |
Supplemental data | | | | | | | | | | | | | | | | | | | | | | | | |
Portfolio turnover rate | | | 49 | % | | | 100 | % | | | 139 | % | | | 173 | % | | | 154 | % | | | 91 | % |
Net assets, end of period (000’s omitted) | | | $6,644 | | | | $7,448 | | | | $7,825 | | | | $9,139 | | | | $12,297 | | | | $9,805 | |
| 1. | Calculated based upon average shares outstanding. |
| 2. | Amount is less than $0.005. |
| 3. | Total return calculations do not include any sales charges. Returns for periods of less than one year are not annualized. |
The accompanying notes are an integral part of these financial statements.
| | | | | | |
| Financial Highlights | | Wells Fargo Advantage Endeavor Select Fund | | | 17 | |
(For a share outstanding throughout each period)
| | | | | | | | | | | | | | | | | | | | | | | | |
| | | Six Months Ended
January 31, 2012 (Unaudited) | | | Year Ended July 31, | |
| Administrator Class | | | 2011 | | | 2010 | | | 2009 | | | 2008 | | | 2007 | |
Net asset value, beginning of period | | | $10.26 | | | | $8.22 | | | | $7.34 | | | | $10.91 | | | | $10.91 | | | | $9.37 | |
Net investment income (loss) | | | (0.01 | )1 | | | (0.03 | )1 | | | (0.02 | )1 | | | 0.01 | 1 | | | (0.01 | )1 | | | (0.01 | )1 |
Net realized and unrealized gains (losses) on investments | | | (0.21 | ) | | | 2.07 | | | | 0.91 | | | | (3.32 | ) | | | 0.11 | | | | 1.55 | |
| | | | | | | | | | | | | | | | | | | | | | | | |
Total from investment operations | | | (0.22 | ) | | | 2.04 | | | | 0.89 | | | | (3.31 | ) | | | 0.10 | | | | 1.54 | |
Distributions to shareholders from | | | | | | | | | | | | | | | | | | | | | | | | |
Net investment income | | | 0.00 | | | | 0.00 | | | | (0.01 | ) | | | 0.00 | | | | 0.00 | | | | 0.00 | |
Net realized gains | | | 0.00 | | | | 0.00 | | | | 0.00 | | | | (0.26 | ) | | | (0.10 | ) | | | (0.00 | )2 |
| | | | | | | | | | | | | | | | | | | | | | | | |
Total distributions to shareholders | | | 0.00 | | | | 0.00 | | | | (0.01 | ) | | | (0.26 | ) | | | (0.10 | ) | | | (0.00 | )2 |
Net asset value, end of period | | | $10.04 | | | | $10.26 | | | | $8.22 | | | | $7.34 | | | | $10.91 | | | | $10.91 | |
Total return3 | | | (2.24 | )% | | | 24.94 | % | | | 12.16 | % | | | (29.91 | )% | | | 0.87 | % | | | 16.44 | % |
Ratios to average net assets (annualized) | | | | | | | | | | | | | | | | | | | | | | | | |
Gross expenses | | | 1.08 | % | | | 1.07 | % | | | 1.10 | % | | | 1.14 | % | | | 1.12 | % | | | 1.17 | % |
Net expenses | | | 1.00 | % | | | 1.00 | % | | | 1.00 | % | | | 1.00 | % | | | 1.00 | % | | | 1.00 | % |
Net investment income (loss) | | | (0.27 | )% | | | (0.29 | )% | | | (0.26 | )% | | | 0.20 | % | | | (0.12 | )% | | | (0.14 | )% |
Supplemental data | | | | | | | | | | | | | | | | | | | | | | | | |
Portfolio turnover rate | | | 49 | % | | | 100 | % | | | 139 | % | | | 173 | % | | | 154 | % | | | 91 | % |
Net assets, end of period (000’s omitted) | | $ | 101,242 | | | $ | 232,954 | | | $ | 223,320 | | | $ | 247,298 | | | $ | 276,388 | | | $ | 108,062 | |
| 1. | Calculated based upon average shares outstanding. |
| 2. | Amount is less than $0.005 per share. |
| 3. | Returns for periods of less than one year are not annualized. |
The accompanying notes are an integral part of these financial statements.
| | | | |
| 18 | | Wells Fargo Advantage Endeavor Select Fund | | Financial Highlights |
(For a share outstanding throughout each period)
| | | | | | | | | | | | | | | | | | | | | | | | |
| | | Six Months Ended
January 31, 2012 (Unaudited) | | | Year Ended July 31, | |
| Institutional Class | | | 2011 | | | 2010 | | | 2009 | | | 2008 | | | 2007 | |
Net asset value, beginning of period | | $ | 10.37 | | | $ | 8.28 | | | $ | 7.39 | | | $ | 10.97 | | | $ | 10.96 | | | $ | 9.40 | |
Net Investment income (loss) | | | 0.00 | 1,2 | | | (0.01 | )1 | | | (0.01 | )1 | | | 0.03 | 1 | | | 0.01 | 1 | | | 0.01 | 1 |
Net realized and unrealized gains (losses) on investments | | | (0.23 | ) | | | 2.10 | | | | 0.93 | | | | (3.35 | ) | | | 0.11 | | | | 1.55 | |
| | | | | | | | | | | | | | | | | | | | | | | | |
Total from investment operations | | | (0.23 | ) | | | 2.09 | | | | 0.92 | | | | (3.32 | ) | | | 0.12 | | | | 1.56 | |
Distributions to shareholders from | | | | | | | | | | | | | | | | | | | | | | | | |
Net investment income | | | 0.00 | | | | 0.00 | | | | (0.03 | ) | | | 0.00 | | | | (0.01 | ) | | | 0.00 | |
Net realized gains | | | 0.00 | | | | 0.00 | | | | 0.00 | | | | (0.26 | ) | | | (0.10 | ) | | | (0.00 | )2 |
| | | | | | | | | | | | | | | | | | | | | | | | |
Total distributions to shareholders | | | 0.00 | | | | 0.00 | | | | (0.03 | ) | | | (0.26 | ) | | | (0.11 | ) | | | (0.00 | )2 |
Net asset value, end of period | | $ | 10.14 | | | $ | 10.37 | | | $ | 8.28 | | | $ | 7.39 | | | $ | 10.97 | | | $ | 10.96 | |
Total return3 | | | (2.22 | )% | | | 25.24 | % | | | 12.41 | % | | | (29.84 | )% | | | 1.06 | % | | | 16.60 | % |
Ratios to average net assets (annualized) | | | | | | | | | | | | | | | | | | | | | | | | |
Gross expenses | | | 0.81 | % | | | 0.80 | % | | | 0.83 | % | | | 0.88 | % | | | 0.86 | % | | | 0.91 | % |
Net expenses | | | 0.80 | % | | | 0.80 | % | | | 0.80 | % | | | 0.80 | % | | | 0.80 | % | | | 0.80 | % |
Net investment income (loss) | | | (0.05 | )% | | | (0.08 | )% | | | (0.07 | )% | | | 0.38 | % | | | 0.07 | % | | | 0.06 | % |
Supplemental data | | | | | | | | | | | | | | | | | | | | | | | | |
Portfolio turnover rate | | | 49 | % | | | 100 | % | | | 139 | % | | | 173 | % | | | 154 | % | | | 91 | % |
Net assets, end of period (000’s omitted) | | | $740,535 | | | | $853,494 | | | | $933,587 | | | | $867,167 | | | | $1,158,997 | | | | $1,099,424 | |
| 1. | Calculated based upon average shares outstanding. |
| 2. | Amount is less than $0.005. |
| 3. | Returns for periods of less than one year are not annualized. |
The accompanying notes are an integral part of these financial statements.
| | | | | | |
| Notes to Financial Statements (Unaudited) | | Wells Fargo Advantage Endeavor Select Fund | | | 19 | |
1. ORGANIZATION
Wells Fargo Funds Trust (the “Trust”), a Delaware statutory trust organized on March 10, 1999, is an open-end management investment company registered under the Investment Company Act of 1940, as amended (the “1940 Act”). These financial statements report on Wells Fargo Advantage Endeavor Select Fund (the “Fund”) which is a non-diversified series of the Trust.
2. SIGNIFICANT ACCOUNTING POLICIES
The following significant accounting policies, which are consistently followed in the preparation of the financial statements of the Fund, are in conformity with U.S. generally accepted accounting principles which require management to make estimates and assumptions that affect the reported amounts of assets and liabilities, disclosure of contingent assets and liabilities at the date of the financial statements, and the reported amounts of revenues and expenses during the reporting period. Actual results could differ from those estimates.
Securities valuation
Investments in equity securities are valued each business day as of the close of regular trading on the New York Stock Exchange, which is usually 4:00 p.m. (Eastern Time). Securities which are traded on a national or foreign securities exchange are valued at the last reported sales price, except that securities listed on The Nasdaq Stock Market, Inc. (“Nasdaq”) are valued at the Nasdaq Official Closing Price (“NOCP”), and if no NOCP is available, then at the last reported sales price. If no sales price is shown on the Nasdaq, the bid price will be used. In the absence of any sale of securities listed on the Nasdaq, and in the case of other securities (including U.S. Government obligations, but excluding debt securities maturing in 60 days or less), the price will be deemed “stale” and the valuations will be determined in accordance with the Fund’s Fair Value Procedures.
Investments in open-end mutual funds and non-registered investment companies are generally valued at net asset value.
Investments which are not valued using any of the methods discussed above, are valued at their fair value, as determined by procedures established in good faith and approved by the Board of Trustees.
Security loans
The Fund may lend its securities from time to time in order to earn additional income in the form of fees or interest on securities received as collateral or the investment of any cash received as collateral. The Fund continues to receive interest or dividends on the securities loaned. The Fund receives collateral in the form of cash or securities with a value at least equal to the value of the securities on loan. The value of the loaned securities is determined at the close of each business day and any additional required collateral is delivered to the Fund on the next business day. In a securities lending transaction, the net asset value of the Fund will be affected by an increase or decrease in the value of the securities loaned and by an increase or decrease in the value of the instrument in which collateral is invested. The amount of securities lending activity undertaken by the Fund fluctuates from time to time. In the event of default or bankruptcy by the borrower, the Fund may be prevented from recovering the loaned securities or gaining access to the collateral or may experience delays or costs in doing so. In addition, the investment of any cash collateral received may lose all or part of its value. The Fund has the right under the lending agreement to recover the securities from the borrower on demand.
The Fund lends its securities through an unaffiliated securities lending agent. Cash collateral received in connection with its securities lending transactions is invested in Wells Fargo Securities Lending Cash Investments, LLC (the “Cash Collateral Fund”). The Cash Collateral Fund is exempt from registration under Section 3(c)(7) of the 1940 Act and is managed by Wells Fargo Funds Management LLC (“Funds Management”) and is sub-advised by Wells Capital Management Incorporated (“Wells Capital Management”). Funds Management receives an advisory fee starting at 0.05% and declining to 0.01% as the average daily net assets of the Cash Collateral Fund increase. All of the fees received by Funds Management are paid to Wells Capital Management for its services as sub-adviser. The Cash Collateral Fund seeks to provide a positive return compared to the daily Fed Funds Open rate by investing in high-quality, U.S. dollar-denominated short-term money market instruments. Cash Collateral Fund investments are fair valued based upon the amortized cost valuation technique. Income earned from investment in the Cash Collateral Fund is included in securities lending income on the Statement of Operations.
For Wells Fargo Advantage Funds that participated in securities lending activity prior to February 13, 2009, certain structured investment vehicles purchased in a joint account by the former securities lending agent defaulted or were
| | | | |
| 20 | | Wells Fargo Advantage Endeavor Select Fund | | Notes to Financial Statements (Unaudited) |
impaired. Certain of the Wells Fargo Advantage Funds still hold ownership interest in these structured investment vehicles, which have since been restructured as pass-through securities. If the Fund holds an ownership interest in such pass-through securities, information regarding this ownership interest can be found in the Portfolio of Investments under the category “Other”.
Security transactions and income recognition
Securities transactions are recorded on a trade date basis. Realized gains or losses are reported on the basis of identified cost of securities delivered.
Dividend income is recognized on the ex-dividend date. Dividend income is recorded net of foreign taxes withheld where recovery of such taxes is not assured.
Distributions to shareholders
Distributions to shareholders from net investment income and net realized gains, if any, are recorded on the ex-dividend date. Such distributions are determined in conformity with income tax regulations, which may differ from generally accepted accounting principles.
Federal and other taxes
The Fund intends to continue to qualify as a regulated investment company by distributing substantially all of its investment company taxable income and any net realized capital gains (after reduction for capital loss carryforwards) sufficient to relieve it from all, or substantially all, federal income taxes. Accordingly, no provision for federal income taxes was required.
The Fund’s income and federal excise tax returns and all financial records supporting those returns for the prior three fiscal years are subject to examination by the federal and Delaware revenue authorities.
Under the recently enacted Regulated Investment Company Modernization Act of 2010, the Fund is permitted to carry forward capital losses incurred in taxable years which began after December 22, 2010 for an unlimited period. However, any losses incurred are required to be utilized prior to the losses incurred in pre-enactment taxable years. As a result of this ordering rule, pre-enactment capital loss carryforwards may be more likely to expire unused. Additionally, post-enactment capital losses that are carried forward will retain their character as either short-term or long-term capital losses rather than being considered all short-term as under previous law.
As of July 31, 2011, the Fund had net capital loss carryforwards, which were available to offset future net realized capital gains, in the amount of $235,067,985 expiring in 2018.
Class allocations
The separate classes of shares offered by the Fund differ principally in applicable sales charges, distribution, shareholder servicing and administration fees. Shareholders of each class bear certain expenses that pertain to that particular class. All shareholders bear the common expenses of the Fund, earn income from the portfolio, and are allocated unrealized gains and losses pro rata based on the average daily net assets of each class, without distinction between share classes. Dividends are determined separately for each class based on income and expenses allocable to each class. Realized gains and losses are allocated to each class pro rata based upon the net assets of each class on the date realized. Differences in per share dividend rates generally result from the relative weightings of pro rata income and realized gain allocations and from differences in separate class expenses, including distribution, shareholder servicing and administration fees.
3. FAIR VALUATION MEASUREMENTS
Fair value measurements of investments are determined within a framework that has established a fair value hierarchy based upon the various data inputs utilized in determining the value of the Fund’s investments. The three-level hierarchy gives the highest priority to unadjusted quoted prices in active markets for identical assets or liabilities (Level 1) and the lowest priority to significant unobservable inputs (Level 3). The Fund’s investments are classified within the fair value hierarchy based on the lowest level of input that is significant to the fair value measurement. The inputs are summarized into three broad levels as follows:
| n | | Level 1 – quoted prices in active markets for identical securities |
| n | | Level 2 – other significant observable inputs (including quoted prices for similar securities, interest rates, prepayment speeds, credit risk, etc.) |
| | | | | | |
| Notes to Financial Statements (Unaudited) | | Wells Fargo Advantage Endeavor Select Fund | | | 21 | |
| n | | Level 3 – significant unobservable inputs (including the Fund’s own assumptions in determining the fair value of investments) |
The inputs or methodologies used for valuing securities are not necessarily an indication of the risk associated with investing in those securities.
As of January 31, 2012, the inputs used in valuing the Fund’s assets, which are carried at fair value, were as follows:
| | | | | | | | | | | | | | | | |
| Investments in Securities | | Quoted Prices
(Level 1) | | | Significant Other
Observable Inputs
(Level 2) | | | Significant
Unobservable Inputs
(Level 3) | | | Total | |
Equity securities | | | | | | | | | | | | | | | | |
Common stocks | | $ | 882,197,144 | | | $ | 0 | | | $ | 0 | | | $ | 882,197,144 | |
Other | | | 0 | | | | 0 | | | | 4,252,875 | | | | 4,252,875 | |
Short-term investments | | | | | | | | | | | | | | | | |
Investment companies | | | 17,759,307 | | | | 72,966,037 | | | | 0 | | | | 90,725,344 | |
| | | $ | 899,956,451 | | | $ | 72,966,037 | | | $ | 4,252,875 | | | $ | 977,175,363 | |
Further details on the major security types listed above can be found in the Portfolio of Investments.
Transfers in and transfers out are recognized at the end of the reporting period. For the six months ended January 31, 2012, the Fund did not have any significant transfers into/out of Level 1 and Level 2.
The following is a reconciliation of assets in which significant unobservable inputs (Level 3) were used in determining fair value:
| | | | |
| | | Other | |
Balance as of July 31, 2011 | | $ | 6,032,019 | |
Accrued discounts (premiums) | | | 0 | |
Realized gains (losses) | | | 0 | |
Change in unrealized gains (losses) | | | (1,048,535 | ) |
Purchases | | | 0 | |
Sales | | | (730,609 | ) |
Transfers into Level 3 | | | 0 | |
Transfers out of Level 3 | | | 0 | |
Balance as of January 31, 2012 | | $ | 4,252,875 | |
Change in unrealized gains (losses) relating to securities still held at January 31, 2012 | | $ | (1,418,278 | ) |
4. TRANSACTIONS WITH AFFILIATES AND OTHER EXPENSES
Advisory fee
The Trust has entered into an advisory contract with Funds Management, an indirect wholly owned subsidiary of Wells Fargo & Company (“Wells Fargo”). The adviser is responsible for implementing investment policies and guidelines and for supervising the sub-adviser, who is responsible for day-to-day portfolio management of the Fund.
Pursuant to the contract, Funds Management is entitled to receive an annual advisory fee starting at 0.65% and declining to 0.55% as the average daily net assets of the Fund increase. For the six months ended January 31, 2012, the advisory fee was equivalent to an annual rate of 0.64% of the Fund’s average daily net assets.
Funds Management may retain the services of certain sub-advisers to provide daily portfolio management to the Fund. The fees related to sub-advisory services are borne directly by Funds Management and do not increase the overall fees paid by the Fund. Wells Capital Management, an affiliate of Funds Management, is the sub-adviser to the Fund and is entitled to receive a fee from Funds Management at an annual rate starting at 0.35% and declining to 0.15% as the average daily net assets of the Fund increase.
| | | | |
| 22 | | Wells Fargo Advantage Endeavor Select Fund | | Notes to Financial Statements (Unaudited) |
Administration and transfer agent fees
The Trust has entered into an administration agreement with Funds Management. Under this agreement, for providing administrative services, which includes paying fees and expenses for services provided by the transfer agent, sub-transfer agents, omnibus account servicers and record-keepers, Funds Management is entitled to receive from the Fund an annual fund level administration fee starting at 0.05% and declining to 0.03% as the average daily net assets of the Fund increase and a class level administration fee which is calculated based on the average daily net assets of each class as follows:
| | | | |
| | | Class Level Administration Fee | |
Class A, Class B, Class C | | | 0.26 | % |
Administrator Class | | | 0.10 | |
Institutional Class | | | 0.08 | |
Funds Management has contractually waived and/or reimbursed advisory and administration fees to the extent necessary to maintain certain net operating expense ratios for the Fund. Waiver of fees and/or reimbursement of expenses by Funds Management were made first from fund level expenses on a proportionate basis and then from class specific expenses. Funds Management has committed through November 30, 2012 to waive fees and/or reimburse expenses to the extent necessary to cap the Fund’s expenses at 1.25% for Class A, 2.00% for Class B, 2.00% for Class C, 1.00% for Administrator Class and 0.80% for Institutional Class.
Distribution fees
The Trust has adopted a Distribution Plan for Class B and Class C shares of the Fund pursuant to Rule 12b-1 under the 1940 Act. Distribution fees are charged to Class B and Class C shares and paid to Wells Fargo Funds Distributor, LLC, the principal underwriter, at an annual rate of 0.75% of the average daily net assets of Class B and Class C shares.
For the six months ended January 31, 2012, Wells Fargo Funds Distributor, LLC received $2,566 from the sale of Class A shares and $673 and $16 in contingent deferred sales charges from redemptions of Class B and Class C shares, respectively.
Shareholder servicing fees
The Trust has entered into contracts with one or more shareholder servicing agents, whereby Class A, Class B, Class C and Administrator Class of the Fund is charged a fee at an annual rate of 0.25% of the average daily net assets of each respective class.
A portion of these total shareholder servicing fees were paid to affiliates of Wells Fargo.
5. INVESTMENT PORTFOLIO TRANSACTIONS
Purchases and sales of investments, excluding U.S. Government obligations (if any) and short-term securities (securities with maturities of one year or less at purchase date), for the six months ended January 31, 2012 were $480,614,478 and $723,493,887, respectively.
6. BANK BORROWINGS
The Trust (excluding the money market funds) and Wells Fargo Variable Trust are parties to a $150,000,000 revolving credit agreement with State Street Bank and Trust Company, whereby the Fund is permitted to use bank borrowings for temporary or emergency purposes, such as to fund shareholder redemption requests. Interest under the credit agreement is charged to the Fund based on a borrowing rate equal to the higher of the Federal Funds rate in effect on that day plus 1.25% or the overnight LIBOR rate in effect on that day plus 1.25%. In addition, an annual commitment fee equal to 0.10% of the unused balance is allocated to each participating fund. Prior to September 6, 2011, the revolving credit agreement was for $125,000,000 and the annual commitment fee paid by the Fund was 0.125% of the unused balance. For the six months ended January 31, 2012, the Fund paid $599 in commitment fees.
For the six month ended January 31, 2012, there were no borrowings by the Fund under the agreement.
| | | | | | |
| Notes to Financial Statements (Unaudited) | | Wells Fargo Advantage Endeavor Select Fund | | | 23 | |
7. INDEMNIFICATION
Under the Trust’s organizational documents, the officers and directors are indemnified against certain liabilities that may arise out of performance of their duties to the Trust. Additionally, in the normal course of business, the Trust may enter into contracts with service providers that contain a variety of indemnification clauses. The Trust’s maximum exposure under these arrangements is dependent on future claims that may be made against the Fund and, therefore, cannot be estimated.
8. NEW ACCOUNTING PRONOUNCEMENTS
In May 2011, the Financial Accounting Standards Board (“FASB”) issued Accounting Standards Update (“ASU”) No. 2011-04 “Amendments to Achieve Common Fair Value Measurement and Disclosure Requirements in U.S. GAAP and IFRSs”. ASU No. 2011-04 amends FASB ASC Topic 820, Fair Value Measurements and Disclosures, to establish common requirements for measuring fair value and for disclosing information about fair value measurements in accordance with GAAP. The ASU is effective prospectively for interim and annual periods beginning after December 15, 2011. Management expects that adoption of the ASU will result in additional disclosures in the financial statements, as applicable.
In April 2011, FASB issued ASU No. 2011-03 “Reconsideration of Effective Control for Repurchase Agreements”. ASU No. 2011-03 amends FASB ASC Topic 860, Transfers and Servicing, specifically the criteria required to determine whether a repurchase agreement (repo) and similar agreements should be accounted for as sales of financial assets or secured borrowings with commitments. ASU No. 2011-03 changes the assessment of effective control by focusing on the transferor’s contractual rights and obligations and removing the criterion to assess its ability to exercise those rights or honor those obligations. This could result in changes to the way entities account for certain transactions including repurchase agreements, mortgage dollar rolls and reverse repurchase agreements. The ASU will become effective on a prospective basis for new transfers and modifications to existing transactions as of the beginning of the first interim or annual period beginning on or after December 15, 2011. Management has evaluated the impact of adopting the ASU and expects no significant changes.
| | | | |
| 24 | | Wells Fargo Advantage Endeavor Select Fund | | Other Information (Unaudited) |
PROXY VOTING INFORMATION
A description of the policies and procedures that the Fund uses to determine how to vote proxies relating to portfolio securities is available without charge, upon request, by calling 1-800-222-8222, visiting our Web site at wellsfargoadvantagefunds.com, or visiting the SEC Web site at sec.gov. Information regarding how the Fund voted proxies relating to portfolio securities during the most recent 12-month period ended June 30 is available without charge on the Fund’s Web site at wellsfargoadvantagefunds.com or by visiting the SEC Web site at sec.gov.
PORTFOLIO HOLDINGS INFORMATION
The complete portfolio holdings for the Fund are publicly available on the Fund’s Web site (wellsfargoadvantagefunds.com) on a monthly, 30-day or more delayed basis. In addition, top ten holdings information for the Fund is publicly available on the Fund’s Web site on a monthly, seven-day or more delayed basis. The Fund files its complete schedule of portfolio holdings with the SEC for the first and third quarters of each fiscal year on Form N-Q, which is available without charge by visiting the SEC Web site at sec.gov. In addition, the Fund’s Form N-Q may be reviewed and copied at the SEC’s Public Reference Room in Washington, DC, and at regional offices in New York City, at 233 Broadway, and in Chicago, at 175 West Jackson Boulevard, Suite 900. Information about the Public Reference Room may be obtained by calling 1-800-SEC-0330.
| | | | | | |
| Other Information (Unaudited) | | Wells Fargo Advantage Endeavor Select Fund | | | 25 | |
BOARD OF TRUSTEES
The following table provides basic information about the Board of Trustees (the “Trustees”) of the Trust and Officers of the Trust. This table should be read in conjunction with the Prospectus and the Statement of Additional Information1 of the Fund. Each of the Trustees and Officers listed below acts in identical capacities for the Wells Fargo Advantage family of funds, which consists of 137 funds comprising the Wells Fargo Funds Trust, Wells Fargo Variable Trust, Wells Fargo Master Trust and four closed-end funds (collectively the “Fund Complex”). All of the Trustees are also Members of the Audit and Governance Committees of each Trust in the Fund Complex. The mailing address of each Trustee and Officer is 525 Market Street, 12th Floor, San Francisco, CA 94105. Each Trustee and Officer serves an indefinite term, however, each Trustee serves such term until reaching the mandatory retirement age established by the Trustees.
Independent Trustees
| | | | | | |
Name and Year of Birth | | Position Held and Length of Service | | Principal Occupations During Past Five Years | | Other Directorships During
Past Five Years |
Peter G. Gordon
(Born 1942) | | Trustee, since 1998; Chairman, since 2005 (Lead Trustee since 2001) | | Co-Founder, Retired Chairman, President and CEO of Crystal Geyser Water Company. Trustee Emeritus, Colby College | | Asset Allocation Trust |
Isaiah Harris, Jr.
(Born 1952) | | Trustee, since 2009 | | Retired. Prior thereto, President and CEO of BellSouth Advertising and Publishing Corp. from 2005 to 2007, President and CEO of BellSouth Enterprises from 2004 to 2005 and President of BellSouth Consumer Services from 2000 to 2003. Emeritus member of the Iowa State University Foundation Board of Governors. Emeritus Member of the Advisory Board of Iowa State University School of Business. Mr. Harris is a certified public accountant. | | CIGNA Corporation; Deluxe Corporation; Asset Allocation Trust |
Judith M. Johnson
(Born 1949) | | Trustee, since 2008 | | Retired. Prior thereto, Chief Executive Officer and Chief Investment Officer of Minneapolis Employees Retirement Fund from 1996 to 2008. Ms. Johnson is an attorney, certified public accountant and a certified managerial accountant. | | Asset Allocation Trust |
Leroy Keith, Jr.
(Born 1939) | | Trustee, since 2010 | | Chairman, Bloc Global Services (development and construction). Trustee of the Evergreen Funds from 1983 to 2010. Former Managing Director, Almanac Capital Management (commodities firm), former Partner, Stonington Partners, Inc. (private equity fund), former Director, Obagi Medical Products Co. and former Director, Lincoln Educational Services. | | Trustee, Virtus Fund Complex (consisting of 40 portfolios as of 12/31/11); Asset Allocation Trust |
David F. Larcker
(Born 1950) | | Trustee, since 2009 | | James Irvin Miller Professor of Accounting at the Graduate School of Business, Stanford University, Director of Corporate Governance Research Program and Senior Faculty of The Rock Center for Corporate Governance since 2006. From 2005 to 2008, Professor of Accounting at the Graduate School of Business, Stanford University. Prior thereto, Ernst & Young Professor of Accounting at The Wharton School, University of Pennsylvania from 1985 to 2005. | | Asset Allocation Trust |
Olivia S. Mitchell
(Born 1953) | | Trustee, since 2006 | | International Foundation of Employee Benefit Plans Professor, Wharton School of the University of Pennsylvania since 1993. Director of Wharton’s Pension Research Council and Boettner Center on Pensions & Retirement Research, and Research Associate at the National Bureau of Economic Research. Previously, Cornell University Professor from 1978 to 1993. | | Asset Allocation Trust |
| | | | |
| 26 | | Wells Fargo Advantage Endeavor Select Fund | | Other Information (Unaudited) |
| | | | | | |
Name and Year of Birth | | Position Held and Length of Service | | Principal Occupations During Past Five Years | | Other Directorships During
Past Five Years |
Timothy J. Penny
(Born 1951) | | Trustee, since 1996 | | President and CEO of Southern Minnesota Initiative Foundation, a non-profit organization, since 2007 and Senior Fellow at the Humphrey Institute Policy Forum at the University of Minnesota since 1995. Member of the Board of Trustees of NorthStar Education Finance, Inc., a non-profit organization, since 2007. | | Asset Allocation Trust |
Michael S. Scofield
(Born 1943) | | Trustee, since 2010 | | Served on the Investment Company Institute’s Board of Governors and Executive Committee from 2008-2011 as well the Governing Council of the Independent Directors Council from 2006-2011 and the Independent Directors Council Executive Committee from 2008-2011. Chairman of the IDC from 2008-2010. Institutional Investor (Fund Directions) Trustee of Year in 2007. Trustee of the Evergreen Funds (and its predecessors) from 1984 to 2010. Chairman of the Evergreen Funds from 2000-2010. Former Trustee of the Mentor Funds. Retired Attorney, Law Offices of Michael S. Scofield and former Director and Chairman, Branded Media Corporation (multi-media branding company). | | Asset Allocation Trust |
Donald C. Willeke
(Born 1940) | | Trustee, since 1996 | | Principal of the law firm of Willeke & Daniels. General Counsel of the Minneapolis Employees Retirement Fund from 1984 until its consolidation into the Minnesota Public Employees Retirement Association on June 30, 2010. Director and Vice Chair of The Free Trust (non-profit corporation). Director of the American Chestnut Foundation (non-profit corporation). | | Asset Allocation Trust |
Officers
| | | | | | |
Name and Year of Birth | | Position Held and
Length of Service | | Principal Occupations During Past Five Years | | |
Karla M. Rabusch
(Born 1959) | | President, since 2003 | | Executive Vice President of Wells Fargo Bank, N.A. and President of Wells Fargo Funds Management, LLC since 2003. Senior Vice President and Chief Administrative Officer of Wells Fargo Funds Management, LLC from 2001 to 2003. | | |
C. David Messman
(Born 1960) | | Secretary, since 2000; Chief Legal Counsel, since 2003 | | Senior Vice President and Secretary of Wells Fargo Funds Management, LLC since 2001. Vice President and Managing Senior Counsel of Wells Fargo Bank, N.A. since 1996. | | |
Kasey Phillips
(Born 1970) | | Treasurer, since 2009 | | Senior Vice President of Wells Fargo Funds Management, LLC since 2009. Senior Vice President of Evergreen Investment Management Company, LLC from 2006 to 2010. Treasurer of the Evergreen Funds from 2005 to 2010. | | |
David Berardi
(Born 1975) | | Assistant Treasurer, since 2009 | | Vice President of Wells Fargo Funds Management, LLC since 2009. Vice President of Evergreen Investment Management Company, LLC from 2008 to 2010. Assistant Vice President of Evergreen Investment Services, Inc. from 2004 to 2008. Manager of Fund Reporting and Control for Evergreen Investment Management Company, LLC from 2004 to 2010. | | |
Jeremy DePalma
(Born 1974) | | Assistant Treasurer, since 2009 | | Senior Vice President of Wells Fargo Funds Management, LLC since 2009. Senior Vice President of Evergreen Investment Management Company, LLC from 2008 to 2010. Vice President, Evergreen Investment Services, Inc. from 2004 to 2007. Head of the Fund Reporting and Control Team within Fund Administration from 2005 to 2010. | | |
Debra Ann Early
(Born 1964) | | Chief Compliance Officer, since 2007 | | Chief Compliance Officer of Wells Fargo Funds Management, LLC since 2007. Chief Compliance Officer of Parnassus Investments from 2005 to 2007. Chief Financial Officer of Parnassus Investments from 2004 to 2007 and Senior Audit Manager of PricewaterhouseCoopers LLP from 1998 to 2004. | | |
| 1. | The Statement of Additional Information includes additional information about the Trustees and is available, without charge, upon request, by calling 1-800-222-8222 or by visiting the Web site at wellsfargoadvantagefunds.com. |
| | | | | | |
| List of Abbreviations | | Wells Fargo Advantage Endeavor Select Fund | | | 27 | |
The following is a list of common abbreviations for terms and entities which may have appeared in this report.
| ACB | — Agricultural Credit Bank |
| ADR | — American Depository Receipt |
| ADS | — American Depository Shares |
| AGC-ICC | — Assured Guaranty Corporation - Insured Custody Certificates |
| AGM | — Assured Guaranty Municipal |
| AMBAC | — American Municipal Bond Assurance Corporation |
| AMT | — Alternative Minimum Tax |
| BAN | — Bond Anticipation Notes |
| BHAC | — Berkshire Hathaway Assurance Corporation |
| CAB | — Capital Appreciation Bond |
| CCAB | — Convertible Capital Appreciation Bond |
| CDA | — Community Development Authority |
| CDO | — Collateralized Debt Obligation |
| COP | — Certificate of Participation |
| DRIVER | — Derivative Inverse Tax-Exempt Receipts |
| DW&P | — Department of Water & Power |
| DWR | — Department of Water Resources |
| ECFA | — Educational & Cultural Facilities Authority |
| EDA | — Economic Development Authority |
| EDFA | — Economic Development Finance Authority |
| ETF | — Exchange-Traded Fund |
| FFCB | — Federal Farm Credit Bank |
| FGIC | — Financial Guaranty Insurance Corporation |
| FHA | — Federal Housing Authority |
| FHLB | — Federal Home Loan Bank |
| FHLMC | — Federal Home Loan Mortgage Corporation |
| FNMA | — Federal National Mortgage Association |
| GDR | — Global Depository Receipt |
| GNMA | — Government National Mortgage Association |
| HCFR | — Healthcare Facilities Revenue |
| HEFA | — Health & Educational Facilities Authority |
| HEFAR | — Higher Education Facilities Authority Revenue |
| HFA | — Housing Finance Authority |
| HFFA | — Health Facilities Financing Authority |
| IBC | — Insured Bond Certificate |
| IDA | — Industrial Development Authority |
| IDAG | — Industrial Development Agency |
| IDR | — Industrial Development Revenue |
| KRW | — Republic of Korea Won |
| LIBOR | — London Interbank Offered Rate |
| LLC | — Limited Liability Company |
| LLP | — Limited Liability Partnership |
| MBIA | — Municipal Bond Insurance Association |
| MFHR | — Multi-Family Housing Revenue |
| MSTR | — Municipal Securities Trust Receipts |
| MUD | — Municipal Utility District |
| NATL-RE | — National Public Finance Guarantee Corporation |
| PCFA | — Pollution Control Finance Authority |
| PCR | — Pollution Control Revenue |
| PFA | — Public Finance Authority |
| PFFA | — Public Facilities Financing Authority |
| PFOTER | — Puttable Floating Option Tax-Exempt Receipts |
| plc | — Public Limited Company |
| PUTTER | — Puttable Tax-Exempt Receipts |
| R&D | — Research & Development |
| RDA | — Redevelopment Authority |
| RDFA | — Redevelopment Finance Authority |
| REIT | — Real Estate Investment Trust |
| ROC | — Reset Option Certificates |
| SAVRS | — Select Auction Variable Rate Securities |
| SBA | — Small Business Authority |
| SFHR | — Single Family Housing Revenue |
| SFMR | — Single Family Mortgage Revenue |
| SPDR | — Standard & Poor’s Depositary Receipts |
| TAN | — Tax Anticipation Notes |
| TIPS | — Treasury Inflation-Protected Securities |
| TRAN | — Tax Revenue Anticipation Notes |
| TCR | — Transferable Custody Receipts |
| TTFA | — Transportation Trust Fund Authority |
| TVA | — Tennessee Valley Authority |
| XLCA | — XL Capital Assurance |
This page is intentionally left blank.
This page is intentionally left blank.
This page is intentionally left blank.


FOR MORE INFORMATION
More information about Wells Fargo Advantage Funds is available free upon request. To obtain literature, please write, e-mail, visit the Fund’s Web site, or call:
Wells Fargo Advantage Funds
P.O. Box 8266
Boston, MA 02266-8266
E-mail: wfaf@wellsfargo.com
Web site: wellsfargoadvantagefunds.com
Individual investors: 1-800-222-8222
Retail investment professionals: 1-888-877-9275
Institutional investment professionals: 1-866-765-0778
This report and the financial statements contained herein are submitted for the general information of the shareholders of Wells Fargo Advantage Funds. If this report is used for promotional purposes, distribution of the report must be accompanied or preceded by a current prospectus. For a prospectus containing more complete information, including charges and expenses, call 1-800-222-8222 or visit the Fund’s Web site at wellsfargoadvantagefunds.com. Please consider the investment objectives, risks, charges, and expenses of the investment carefully before investing. This and other information about Wells Fargo Advantage Funds can be found in the current prospectus. Read the prospectus carefully before you invest or send money.
Wells Fargo Funds Management, LLC, a wholly owned subsidiary of Wells Fargo & Company, provides investment advisory and administrative services for Wells Fargo Advantage Funds. Other affiliates of Wells Fargo & Company provide subadvisory and other services for the Funds. The Funds are distributed by Wells Fargo Funds Distributor, LLC, Member FINRA/SIPC, an affiliate of Wells Fargo & Company.
NOT FDIC INSURED ¡ NO BANK GUARANTEE ¡ MAY LOSE VALUE
© 2012 Wells Fargo Funds Management, LLC. All rights reserved.
| | |
 | | 207945 03-12 SA205/SAR205 1-12 |

Wells Fargo Advantage Growth Fund

Semi-Annual Report
January 31, 2012

Reduce clutter. Save trees.
Sign up for electronic delivery of prospectuses and shareholder reports at wellsfargo.com/advantagedelivery
Contents
The views expressed and any forward-looking statements are as of January 31, 2012, unless otherwise noted, and are those of the Fund managers and/or Wells Fargo Funds Management, LLC. Discussions of individual securities, or the markets generally, or any Wells Fargo Advantage Fund are not intended as individual recommendations. Future events or results may vary significantly from those expressed in any forward-looking statements; the views expressed are subject to change at any time in response to changing circumstances in the market. Wells Fargo Funds Management, LLC, disclaims any obligation to publicly update or revise any views expressed or forward-looking statements.
NOT FDIC INSURED ¡ NO BANK GUARANTEE ¡ MAY LOSE VALUE

WELLS FARGO INVESTMENT HISTORY
| | |
| |
| 1932 | | Keystone creates one of the first mutual fund families. |
| |
| 1971 | | Wells Fargo & Company introduces one of the first institutional index funds. |
| |
| 1978 | | Wells Fargo applies Markowitz and Sharpe’s research on Modern Portfolio Theory to introduce one of the industry’s first Tactical Asset Allocation (TAA) models in institutional separately managed accounts. |
| |
| 1984 | | Wells Fargo Stagecoach Funds launches its first asset allocation fund. |
| |
| 1989 | | The Tactical Asset Allocation (TAA) Model is first applied to Wells Fargo’s asset allocation mutual funds. |
| |
| 1994 | | Wells Fargo introduces the LifePath Funds, one of the first suites of target date funds (now the Wells Fargo Advantage Dow Jones Target Date FundsSM). |
| |
| 1996 | | Evergreen Investments and Keystone Funds merge. |
| |
| 1997 | | Wells Fargo launches Wells Fargo Advantage WealthBuilder PortfoliosSM, a fund-of-funds suite of products that includes the use of quantitative models to shift assets among investment styles. |
| |
| 1999 | | Norwest Advantage Funds and Stagecoach Funds are reorganized into Wells Fargo Funds after the merger of Norwest and Wells Fargo. |
| |
| 2002 | | Evergreen Retail and Evergreen Institutional companies form the umbrella asset management company, Evergreen Investments. |
| |
| 2005 | | The integration of Strong Funds with Wells Fargo Funds creates Wells Fargo Advantage Funds, resulting in one of the top 20 mutual fund companies in the United States. |
| |
| 2006 | | Wells Fargo Advantage Funds relaunches the target date product line as Wells Fargo Advantage Dow Jones Target Date Funds. |
| |
| 2010 | | The mergers and reorganizations of Evergreen and Wells Fargo Advantage mutual funds are completed, unifying the families under the brand of Wells Fargo Advantage Funds. |
Wells Fargo Advantage Funds®
Wells Fargo Advantage Funds skillfully guides institutions, financial advisors, and individuals through the investment terrain to help them reach their financial objectives. Everything we do on behalf of investors is backed by our unique combination of qualifications.
Strength
Our organization is built on the standards of integrity and service established by our parent company—Wells Fargo & Company—more than 150 years ago. And, because we’re part of a highly diversified financial enterprise, we offer the depth of resources to help investors succeed.
Expertise
Our multi-boutique model offers investors access to the independent thinking of premier investment managers that have been chosen for their time-tested strategies. While each team specializes in a specific investment strategy, collectively they provide investors a wide choice of distinct investment styles. Our dedication to investment excellence doesn’t end with our expertise in manager selection—risk management, analysis, and rigorous ongoing review seek to ensure each manager’s investment process remains consistent.
Partnership
Our collaborative approach is built around understanding the needs and goals of our clients. By adhering to core principles of sound judgment and steady guidance, we support you through every stage of the investment decision process.
Carefully consider a fund’s investment objectives, risks, charges, and expenses before investing. For a current prospectus and, if available, a summary prospectus, containing this and other information, visit wellsfargoadvantagefunds.com. Read it carefully before investing.
Wells Fargo Funds Management, LLC, a wholly owned subsidiary of Wells Fargo & Company, provides investment advisory and administrative services for Wells Fargo Advantage Funds®. Other affiliates of Wells Fargo & Company provide subadvisory and other services for the Funds. The Funds are distributed by Wells Fargo Funds Distributor, LLC, Member FINRA/SIPC, an affiliate of Wells Fargo & Company.
“Dow Jones®” and “Dow Jones Target Date IndexesSM” are service marks of Dow Jones Trademark Holdings, LLC (“Dow Jones”), have been licensed to CME Group Index Services LLC (“CME Indexes”) and have been sublicensed for use for certain purposes by Global Index Advisors, Inc, and Wells Fargo Funds Management, LLC. The Wells Fargo Advantage Dow Jones Target Date FundsSM based on the Dow Jones Target Date IndexesSM, are not sponsored, endorsed, sold or promoted by Dow Jones, CME Indexes or their respective affiliates and none of them makes any representation regarding the advisability of investing in such product(s).
NOT FDIC INSURED ¡ NO BANK GUARANTEE ¡ MAY LOSE VALUE
Not part of the semi-annual report.
Wells Fargo Advantage Funds offers more than 110 mutual funds across a wide range of asset classes, representing over $217 billion in assets under management, as of January 31, 2012.
| | | | |
| Equity Funds | | | | |
Asia Pacific Fund | | Equity Value Fund | | Precious Metals Fund |
C&B Large Cap Value Fund | | Global Opportunities Fund | | Premier Large Company Growth Fund |
C&B Mid Cap Value Fund | | Growth Fund | | Small Cap Opportunities Fund |
Capital Growth Fund | | Index Fund | | Small Cap Value Fund |
Common Stock Fund | | International Equity Fund | | Small Company Growth Fund |
Disciplined U.S. Core Fund | | International Value Fund | | Small Company Value Fund |
Discovery Fund† | | Intrinsic Small Cap Value Fund | | Small/Mid Cap Core Fund |
Diversified Equity Fund | | Intrinsic Value Fund | | Small/Mid Cap Value Fund |
Diversified International Fund | | Intrinsic World Equity Fund | | Special Mid Cap Value Fund |
Diversified Small Cap Fund | | Large Cap Core Fund | | Special Small Cap Value Fund |
Emerging Growth Fund | | Large Cap Growth Fund | | Specialized Technology Fund |
Emerging Markets Equity Fund | | Large Company Value Fund | | Strategic Large Cap Growth Fund |
Endeavor Select Fund† | | Omega Growth Fund | | Traditional Small Cap Growth Fund |
Enterprise Fund† | | Opportunity Fund† | | Utility and Telecommunications Fund |
| Bond Funds | | | | |
Adjustable Rate Government Fund | | Inflation-Protected Bond Fund | | Short-Term Bond Fund |
California Limited-Term Tax-Free Fund | | Intermediate Tax/AMT-Free Fund | | Short-Term High Yield Bond Fund |
California Tax-Free Fund | | International Bond Fund | | Short-Term Municipal Bond Fund |
Colorado Tax-Free Fund | | Minnesota Tax-Free Fund | | Strategic Municipal Bond Fund |
Government Securities Fund | | Municipal Bond Fund | | Total Return Bond Fund |
High Income Fund | | North Carolina Tax-Free Fund | | Ultra Short-Term Income Fund |
High Yield Bond Fund | | Pennsylvania Tax-Free Fund | | Ultra Short-Term Municipal Income Fund |
Income Plus Fund | | Short Duration Government Bond Fund | | Wisconsin Tax-Free Fund |
| Asset Allocation Funds | | | | |
Absolute Return Fund | | WealthBuilder Equity Portfolio† | | Target 2020 Fund† |
Asset Allocation Fund | | WealthBuilder Growth Allocation Portfolio† | | Target 2025 Fund† |
Conservative Allocation Fund | | WealthBuilder Growth Balanced Portfolio† | | Target 2030 Fund† |
Diversified Capital Builder Fund | | WealthBuilder Moderate Balanced Portfolio† | | Target 2035 Fund† |
Diversified Income Builder Fund | | WealthBuilder Tactical Equity Portfolio† | | Target 2040 Fund† |
Growth Balanced Fund | | Target Today Fund† | | Target 2045 Fund† |
Index Asset Allocation Fund | | Target 2010 Fund† | | Target 2050 Fund† |
Moderate Balanced Fund | | Target 2015 Fund† | | Target 2055 Fund† |
WealthBuilder Conservative Allocation Portfolio† | | | | |
| Money Market Funds | | | | |
100% Treasury Money Market Fund | | Heritage Money Market Fund† | | National Tax-Free Money Market Fund |
California Municipal Money Market Fund | | Money Market Fund | | Prime Investment Money Market Fund |
Cash Investment Money Market Fund | | Municipal Cash Management Money Market Fund | | Treasury Plus Money Market Fund |
Government Money Market Fund | | Municipal Money Market Fund | | |
| Variable Trust Funds1 | | | | |
VT Discovery Fund† | | VT Intrinsic Value Fund | | VT Small Cap Growth Fund |
VT Index Asset Allocation Fund | | VT Omega Growth Fund | | VT Small Cap Value Fund |
VT International Equity Fund | | VT Opportunity Fund† | | VT Total Return Bond Fund |
An investment in a money market fund is not insured or guaranteed by the Federal Deposit Insurance Corporation or any other government agency. Although the Wells Fargo Advantage Money Market Funds seek to preserve the value of your investment at $1.00 per share, it is possible to lose money by investing in a money market fund.
| 1. | The Variable Trust Funds are generally available only through insurance company variable contracts. |
| † | In this report, the Wells Fargo Advantage Discovery FundSM, Wells Fargo Advantage Endeavor Select FundSM, Wells Fargo Advantage Enterprise FundSM, Wells Fargo Advantage Opportunity FundSM, Wells Fargo Advantage WealthBuilder Conservative Allocation PortfolioSM, Wells Fargo Advantage WealthBuilder Equity PortfolioSM, Wells Fargo Advantage WealthBuilder Growth Allocation PortfolioSM, Wells Fargo Advantage WealthBuilder Growth Balanced PortfolioSM, Wells Fargo Advantage WealthBuilder Moderate Balanced PortfolioSM, Wells Fargo Advantage WealthBuilder Tactical Equity PortfolioSM, Wells Fargo Advantage Dow Jones Target Today FundSM, Wells Fargo Advantage Dow Jones Target 2010 FundSM, Wells Fargo Advantage Dow Jones Target 2015 FundSM, Wells Fargo Advantage Dow Jones Target 2020 FundSM, Wells Fargo Advantage Dow Jones Target 2025 FundSM, Wells Fargo Advantage Dow Jones Target 2030 FundSM, Wells Fargo Advantage Dow Jones Target 2035 FundSM, Wells Fargo Advantage Dow Jones Target 2040 FundSM, Wells Fargo Advantage Dow Jones Target 2045 FundSM, Wells Fargo Advantage Dow Jones Target 2050 FundSM, Wells Fargo Advantage Dow Jones Target 2055 FundSM, Wells Fargo Advantage Heritage Money Market FundSM, Wells Fargo Advantage VT Discovery FundSM, and Wells Fargo Advantage VT Opportunity FundSM are referred to as the Discovery Fund, Endeavor Select Fund, Enterprise Fund, Opportunity Fund, WealthBuilder Conservative Allocation Portfolio, WealthBuilder Equity Portfolio, WealthBuilder Growth Allocation Portfolio, WealthBuilder Growth Balanced Portfolio, WealthBuilder Moderate Balanced Portfolio, WealthBuilder Tactical Equity Portfolio, Target Today Fund, Target 2010 Fund, Target 2015 Fund, Target 2020 Fund, Target 2025 Fund, Target 2030 Fund, Target 2035 Fund, Target 2040 Fund, Target 2045 Fund, Target 2050 Fund, Target 2055 Fund, Heritage Money Market Fund, VT Discovery Fund, and VT Opportunity Fund, respectively. |
Not part of the semi-annual report.
| | | | |
| 2 | | Wells Fargo Advantage Growth Fund | | Letter to Shareholders |

Karla M. Rabusch,
President
Wells Fargo Advantage Funds
The period was marked by increased confidence that the U.S. economy was staging a fragile recovery, offset by continued concerns about the possible effect on the global economy of the ongoing European sovereign debt crisis—which began in Greece and later spread to the larger economies of Italy and Spain.
The slow-motion debt crisis in the eurozone was a major headwind to both domestic and global stock market indexes.
Dear Valued Shareholder:
We’re pleased to offer you this semi-annual report for the Wells Fargo Advantage Growth Fund for the six-month period that ended January 31, 2012. The period was marked by increased confidence that the U.S. economy was staging a fragile recovery, offset by continued concerns about the possible effect on the global economy of the ongoing European sovereign debt crisis—which began in Greece and later spread to the larger economies of Italy and Spain. Most U.S. stock indexes posted gains for the period, even if only modest ones.
Worries gave way to guarded optimism for the U.S. economy.
The period began with worries that the U.S. economy was returning to recession. Revised figures for gross domestic product (GDP) indicated that the U.S. economy grew by an annualized rate of only 0.8% in the first half of 2011. Moreover, although the July 2011 Institute for Supply Management (ISM) manufacturing survey suggested that factories continued to expand, the rate of expansion was lower than in previous months. The prolonged debate over whether and how to raise the U.S. debt ceiling—which only ended on July 31, 2011—also depressed market sentiment by highlighting the country’s political divisions.
The stock market remained volatile throughout September. By late October, however, stronger economic data led to greater optimism and higher stock prices. Revised real GDP growth came in at 1.8% in the third quarter of 2011 and 2.8% in the fourth quarter, suggesting that the recovery was on firmer footing. Economic growth was not evenly distributed, though, as December 2011 retail same-store sales generally showed stronger growth for retailers targeting affluent customers than for those targeting the broad middle class. The reported unemployment rate also showed some signs of improvement, falling from 9.1% in August 2011 to 8.3% in January 2012. However, this decline in the unemployment rate was accompanied by an increase in the number of Americans not in the labor force, raising concerns about the economy’s ability to generate jobs.
The eurozone had continued trouble.
The slow-motion debt crisis in the eurozone was a major headwind to both domestic and global stock market indexes. The worsening debt and deficit numbers for Greece in late 2011 and early 2012 cast doubt on the country’s ability to service its debt under the plan put in place by the European Union and the International Monetary Fund and put the ongoing drama of the European sovereign debt crisis back on center stage. Investors became increasingly concerned that Greece would default on its debt, a scenario that only seemed more likely as many Greeks rioted in response to greater budgetary austerity and the discussion moved from whether private investors would take a loss on their Greek debt to how big the loss would be. Because many eurozone banks owned Greek debt and many U.S. banks had financial ties to eurozone banks, investors worried about the effect of such an event on the financial system and the global economy.
Even as the situation in Greece deteriorated, eurozone GDP numbers supported the case for a modest recovery in the global economy. Reported GDP growth for the 17 countries that comprise the eurozone was modest, rising 0.2% in the third quarter compared to the second quarter, and by 0.2% in the fourth quarter
| | | | | | |
| Letter to Shareholders | | Wells Fargo Advantage Growth Fund | | | 3 | |
compared to the third quarter. However, the eurozone average concealed a wide variation between economies, with Germany’s growing by 0.5% in the third quarter of 2011 even as Greece’s GDP contracted.
Central banks continued to provide stimulus.
Throughout the reporting period, the Federal Open Market Committee (FOMC) kept its key interest rates effectively at zero in order to support the economy and financial system. Moreover, in response to extreme market volatility and signs of a weakening economy, in its August 2011 policy statement, the Federal Reserve (Fed) announced it would keep interest rates “exceptionally low” until at least mid-2013 as a way to support the economy. Market participants interpreted the Fed’s statement to mean that the central bankers believed the economy would remain weak over the next two years. However, the Fed also said that it was considering a “range of policy tools available to promote a stronger economic recovery” and “is prepared to employ these tools as appropriate.”
At the beginning of the period, the European Central Bank (ECB) had a key rate of 1.50% but lowered it to 1.25% in November 2011 and then to 1.00% in December 2011 in an attempt to support the sluggish eurozone recovery. To support the banking system, in late 2011, the ECB initiated a long-term refinancing operation (LTRO) in which it supplied three-year loans to banks against a wide range of collateral. The operation basically provided a near-unlimited amount of liquidity to banks, easing some investor concerns about the effect of an increasingly probable Greek default.
We use time-tested investment strategies, even as many variables are at work in the market.
Experience tells us that strict adherence to time-tested investment strategies has its rewards. As a whole, Wells Fargo Advantage Funds represents investments across a range of asset classes and investment styles, giving you an opportunity to create a diversified investment portfolio. While diversification may not prevent losses in a downturn, it does provide you with one way of managing risk.
Thank you for choosing to invest with Wells Fargo Advantage Funds. We appreciate your confidence in us and remain committed to helping you meet your financial needs. For current information about your fund investments, contact your investment professional, visit our website at wellsfargoadvantagefunds.com, or call us directly at 1-800-222-8222. We are available 24 hours a day, 7 days a week.
Sincerely,

Karla M. Rabusch
President
Wells Fargo Advantage Funds
| | | | |
| 4 | | Wells Fargo Advantage Growth Fund | | Letter to Shareholders |
Notice to Shareholders
The Board of Trustees for Wells Fargo Advantage Funds has unanimously approved the following modifications to certain net asset value (NAV) waiver privileges and commission schedules:
| | n | | Effective May 1, 2012, automatic investment plan (AIP) purchases and proceeds received from systematic withdrawals will no longer qualify for NAV repurchase privileges. | |
| | n | | Effective May 1, 2012, discretionary rights to waive the upfront commission for Class C and “jumbo” Class A share purchases will no longer be granted to broker/dealers. However, we will continue to waive the Class C shares contingent deferred sales charge for redemptions by employer-sponsored retirement plans where the dealer of record waived its commission at the time of purchase. | |
| | n | | Effective July 31, 2012, NAV purchase privileges for former Evergreen Class IS and Class R shareholders are being modified to remove the ability to purchase Class A shares at NAV unless those shares are held directly with the Fund on or after July 31, 2012. | |
Please contact your investment professional or call us directly at 1-800-222-8222 if you have any questions on this Notice to Shareholders.
| | | | | | |
| Performance Highlights (Unaudited) | | Wells Fargo Advantage Growth Fund | | | 5 | |
The Fund is closed to new investors1
INVESTMENT OBJECTIVE
The Fund seeks long-term capital appreciation.
ADVISER
Wells Fargo Funds Management, LLC
SUB-ADVISER
Wells Capital Management Incorporated
PORTFOLIO MANAGERS
Joseph M. Eberhardy, CFA, CPA
Thomas C. Ognar, CFA
Bruce C. Olson, CFA
FUND INCEPTION
December 31, 1993
| | | | |
TEN LARGEST EQUITY HOLDINGS2 (AS OF JANUARY 31, 2012) | |
Apple Incorporated | | | 7.13% | |
Pioneer Natural Resources Company | | | 2.81% | |
Cognizant Technology Solutions Corporation Class A | | | 2.77% | |
Alexion Pharmaceuticals Incorporated | | | 2.53% | |
EMC Corporation | | | 2.49% | |
Whole Foods Market Incorporated | | | 2.49% | |
Google Incorporated Class A | | | 2.32% | |
Kansas City Southern | | | 2.31% | |
Rackspace Hosting Incorporated | | | 2.13% | |
priceline.com Incorporated | | | 2.02% | |
| | |
SECTOR DISTRIBUTION3 (AS OF JANUARY 31, 2012) | | |
|
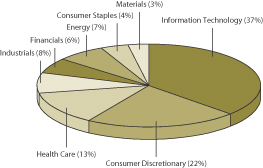 |
| 1. | Please see the Statement of Additonal Information for further details. |
| 2. | The ten largest equity holdings are calculated based on the value of the securities divided by total net assets of the Fund. Holdings are subject to change and may have changed since the date specified. |
| 3. | Sector distribution is subject to change and is calculated based on the total long-term investments of the Fund. |
| | | | |
| 6 | | Wells Fargo Advantage Growth Fund | | Performance Highlights (Unaudited) |
AVERAGE ANNUAL TOTAL RETURN4 (%) (AS OF JANUARY 31, 2012)
| | | | | | | | | | | | | | | | | | | | | | | | | | | | | | | | | | | | | | | | | | | | |
| | | | | | Including Sales Charge | | | Excluding Sales Charge | | | Expense Ratios5 | |
| | | Inception Date | | | 6 Months* | | | 1 Year | | | 5 Year | | | 10 Year | | | 6 Months* | | | 1 Year | | | 5 Year | | | 10 Year | | | Gross | | | Net6 | |
Class A (SGRAX) | | | 02/24/2000 | | | | (2.85 | ) | | | 5.77 | | | | 8.17 | | | | 7.33 | | | | 3.08 | | | | 12.22 | | | | 9.46 | | | | 7.97 | | | | 1.24% | | | | 1.22% | |
Class C (WGFCX) | | | 12/26/2002 | | | | 1.71 | | | | 10.43 | | | | 8.65 | | | | 7.16 | | | | 2.71 | | | | 11.43 | | | | 8.65 | | | | 7.16 | | | | 1.99% | | | | 1.97% | |
Administrator Class (SGRKX) | | | 08/30/2002 | | | | | | | | | | | | | | | | | | | | 3.21 | | | | 12.54 | | | | 9.81 | | | | 8.42 | | | | 1.08% | | | | 0.96% | |
Institutional Class (SGRNX) | | | 02/24/2000 | | | | | | | | | | | | | | | | | | | | 3.32 | | | | 12.75 | | | | 9.99 | | | | 8.55 | | | | 0.81% | | | | 0.75% | |
Investor Class (SGROX) | | | 12/31/1993 | | | | | | | | | | | | | | | | | | | | 3.06 | | | | 12.17 | | | | 9.34 | | | | 7.89 | | | | 1.31% | | | | 1.29% | |
Russell 3000® Growth Index7 | | | | | | | | | | | | | | | | | | | | | | | 2.61 | | | | 5.98 | | | | 3.17 | | | | 3.55 | | | | | | | | | |
| * | Returns for periods of less than one year are not annualized. |
Figures quoted represent past performance, which is no guarantee of future results and do not reflect the deduction of taxes that a shareholder may pay on fund distributions or the redemption of fund shares. Investment return and principal value of an investment will fluctuate so that an investor’s shares, when redeemed, may be worth more or less than their original cost. Performance shown without sales charges would be lower if sales charges were reflected. Current performance may be lower or higher than the performance data quoted and assumes the reinvestment of dividends and capital gains. Current month-end performance is available on the Fund’s Web site – wellsfargoadvantagefunds.com
Index returns do not include transaction costs associated with buying and selling securities, any mutual fund fees or expenses or any taxes. It is not possible to invest directly in an index.
For Class A shares, the maximum front-end sales charge is 5.75%. For Class C shares, the maximum contingent deferred sales charge is 1.00%. Performance including sales charge assumes the sales charge for the corresponding time period. Administrator Class, Institutional Class and Investor Class shares are sold without a front-end sales charge or contingent deferred sales charge.
Stock fund values fluctuate in response to the activities of individual companies and general market and economic conditions. Certain investment strategies tend to increase the total risk of an investment (relative to the broader market). This Fund is exposed to foreign investment risk. Consult the Fund’s prospectus for additional information on these and other risks.
| 4. | Historical performance shown for the Administrator Class shares prior to their inception reflects the performance of the Investor Class shares, and includes the higher expenses applicable to the Investor Class shares. If these expenses had not been included, returns would be higher. Historical performance shown for the Class C shares prior to their inception reflects the performance of the Investor Class shares, adjusted to reflect the higher expenses applicable to Class C shares. Historical performance shown for Class A shares through June 19, 2008 includes expenses of the Fund’s former Advisor Class. |
| 5. | Reflects the expense ratios as stated in the most recent prospectuses. |
| 6. | The Adviser has committed through November 30, 2012 to waive fees and/or reimburse expenses to the extent necessary to cap the Fund’s Total Annual Fund Operating Expenses After Fee Waiver, excluding certain expenses, at the amounts shown above. Without this cap, the Fund’s returns would have been lower. |
| 7. | The Russell 3000® Growth Index measures the performance of those Russell 3000® Index companies with higher price-to-book ratios and higher forecasted growth values. The stocks in this index are also members of either the Russell 1000® Growth Index or the Russell 2000® Growth Index. You cannot invest directly in an index. |
| | | | | | |
| Fund Expenses (Unaudited) | | Wells Fargo Advantage Growth Fund | | | 7 | |
As a shareholder of the Fund, you incur two types of costs: (1) transaction costs, including sales charges (loads) on purchase payments and contingent deferred sales charges (if any) on redemptions and (2) ongoing costs, including management fees; distribution (12b-1) and/or shareholder service fees; and other Fund expenses. This example is intended to help you understand your ongoing costs (in dollars) of investing in the Fund and to compare these costs with the ongoing costs of investing in other mutual funds.
The example is based on an investment of $1,000 invested at the beginning of the six-month period and held for the entire period from August 1, 2011 to January 31, 2012.
Actual Expenses
The “Actual” line of the table below provides information about actual account values and actual expenses. You may use the information in this line, together with the amount you invested, to estimate the expenses that you paid over the period. Simply divide your account value by $1,000 (for example, an $8,600 account value divided by $1,000 = 8.6), then multiply the result by the number in the “Actual” line under the heading entitled “Expenses Paid During Period” for your applicable class of shares to estimate the expenses you paid on your account during this period.
Hypothetical Example for Comparison Purposes
The “Hypothetical” line of the table below provides information about hypothetical account values and hypothetical expenses based on the Fund’s actual expense ratio and an assumed rate of return of 5% per year before expenses, which is not the Fund’s actual return. The hypothetical account values and expenses may not be used to estimate the actual ending account balance or expenses you paid for the period. You may use this information to compare the ongoing costs of investing in the Fund and other funds. To do so, compare this 5% hypothetical example with the 5% hypothetical examples that appear in the shareholder reports of the other funds.
Please note that the expenses shown in the table are meant to highlight your ongoing costs only and do not reflect any transactional costs, such as sales charges (loads) and contingent deferred sales charges. Therefore, the “Hypothetical” line of the table is useful in comparing ongoing costs only, and will not help you determine the relative total costs of owning different funds. In addition, if these transactional costs were included, your costs would have been higher.
| | | | | | | | | | | | | | | | |
| | | Beginning
Account Value
08-01-2011 | | | Ending
Account Value
01-31-2012 | | | Expenses
Paid During
the Period1 | | | Net Annual
Expense Ratio | |
Class A | | | | | | | | | | | | | | | | |
Actual | | $ | 1,000.00 | | | $ | 1,030.84 | | | $ | 6.18 | | | | 1.21 | % |
Hypothetical (5% return before expenses) | | $ | 1,000.00 | | | $ | 1,019.05 | | | $ | 6.14 | | | | 1.21 | % |
Class C | | | | | | | | | | | | | | | | |
Actual | | $ | 1,000.00 | | | $ | 1,027.06 | | | $ | 9.99 | | | | 1.96 | % |
Hypothetical (5% return before expenses) | | $ | 1,000.00 | | | $ | 1,015.28 | | | $ | 9.93 | | | | 1.96 | % |
Administrator Class | | | | | | | | | | | | | | | | |
Actual | | $ | 1,000.00 | | | $ | 1,032.14 | | | $ | 4.90 | | | | 0.96 | % |
Hypothetical (5% return before expenses) | | $ | 1,000.00 | | | $ | 1,020.31 | | | $ | 4.88 | | | | 0.96 | % |
Institutional Class | | | | | | | | | | | | | | | | |
Actual | | $ | 1,000.00 | | | $ | 1,033.17 | | | $ | 3.94 | | | | 0.77 | % |
Hypothetical (5% return before expenses) | | $ | 1,000.00 | | | $ | 1,021.27 | | | $ | 3.91 | | | | 0.77 | % |
Investor Class | | | | | | | | | | | | | | | | |
Actual | | $ | 1,000.00 | | | $ | 1,030.61 | | | $ | 6.48 | | | | 1.27 | % |
Hypothetical (5% return before expenses) | | $ | 1,000.00 | | | $ | 1,018.75 | | | $ | 6.44 | | | | 1.27 | % |
| 1. | Expenses paid is equal to the annualized expense ratio of each class multiplied by the average account value over the period, multiplied by the number of days in the most recent fiscal half-year divided by the number of days in the fiscal year (to reflect the one-half year period). |
| | | | |
| 8 | | Wells Fargo Advantage Growth Fund | | Portfolio of Investments—January 31, 2012 (Unaudited) |
| | | | | | | | | | | | |
| Security Name | | | | | | Shares | | | Value | |
| | | | | | | | | | | | |
| | | |
Common Stocks: 93.43% | | | | | | | | | | |
| | | | |
Consumer Discretionary: 20.49% | | | | | | | | | | | | |
| | | | |
| Auto Components: 1.22% | | | | | | | | | | | | |
Gentex Corporation« | | | | | | | 1,500,000 | | | $ | 40,305,000 | |
Johnson Controls Incorporated« | | | | | | | 2,209,000 | | | | 70,179,930 | |
| | | | |
| | | | | | | | | | | 110,484,930 | |
| | | | | | | | | | | | |
| | | | |
| Distributors: 0.08% | | | | | | | | | | | | |
LKQ Corporation† | | | | | | | 220,000 | | | | 7,172,000 | |
| | | | | | | | | | | | |
| | | |
| Hotels, Restaurants & Leisure: 2.32% | | | | | | | | | | |
Buffalo Wild Wings Incorporated† | | | | | | | 175,000 | | | | 11,648,000 | |
Las Vegas Sands Corporation | | | | | | | 733,000 | | | | 35,997,630 | |
Life Time Fitness Incorporated†« | | | | | | | 2,700,000 | | | | 132,678,000 | |
Starbucks Corporation« | | | | | | | 613,000 | | | | 29,381,090 | |
| | | | |
| | | | | | | | | | | 209,704,720 | |
| | | | | | | | | | | | |
| | | | |
| Household Durables: 0.72% | | | | | | | | | | | | |
Tempur-Pedic International Incorporated†« | | | | | | | 980,000 | | | | 65,375,800 | |
| | | | | | | | | | | | |
| | | |
| Internet & Catalog Retail: 5.17% | | | | | | | | | | |
Amazon.com Incorporated† | | | | | | | 590,000 | | | | 114,719,600 | |
Homeaway Incorporated†« | | | | | | | 2,748,178 | | | | 74,310,733 | |
priceline.com Incorporated†« | | | | | | | 345,000 | | | | 182,670,600 | |
Shutterfly Incorporated†« | | | | | | | 2,565,000 | | | | 60,841,800 | |
TripAdvisor Incorporated | | | | | | | 1,039,000 | | | | 34,193,490 | |
| | | | |
| | | | | | | | | | | 466,736,223 | |
| | | | | | | | | | | | |
| | | | |
| Multiline Retail: 1.01% | | | | | | | | | | | | |
Dollar Tree Incorporated† | | | | | | | 1,080,000 | | | | 91,594,800 | |
| | | | | | | | | | | | |
| | | |
| Specialty Retail: 8.21% | | | | | | | | | | |
CarMax Incorporated†« | | | | | | | 5,356,000 | | | | 162,983,080 | |
Dick’s Sporting Goods Incorporated« | | | | | | | 3,775,000 | | | | 155,567,750 | |
Hibbett Sports Incorporated†« | | | | | | | 1,125,000 | | | | 53,921,250 | |
O’Reilly Automotive Incorporated† | | | | | | | 290,000 | | | | 23,637,900 | |
Tractor Supply Company | | | | | | | 2,050,000 | | | | 165,578,500 | |
Ulta Salon Cosmetics & Fragrance Incorporated† | | | | | | | 1,765,000 | | | | 134,528,300 | |
Vitamin Shoppe Incorporated†« | | | | | | | 1,055,000 | | | | 45,090,700 | |
| | | | |
| | | | | | | | | | | 741,307,480 | |
| | | | | | | | | | | | |
| | | | |
| Textiles, Apparel & Luxury Goods: 1.76% | | | | | | | | | | | | |
Coach Incorporated | | | | | | | 590,000 | | | | 41,329,500 | |
Crocs Incorporated† | | | | | | | 1,380,000 | | | | 26,247,600 | |
Fossil Incorporated† | | | | | | | 115,000 | | | | 10,930,750 | |
lululemon athletica incorporated†« | | | | | | | 426,000 | | | | 26,893,380 | |
Vera Bradley Incorporated†« | | | | | | | 1,490,000 | | | | 53,371,800 | |
| | | | |
| | | | | | | | | | | 158,773,030 | |
| | | | | | | | | | | | |
| | | | |
Consumer Staples: 4.01% | | | | | | | | | | | | |
| | | | |
| Food & Staples Retailing: 3.44% | | | | | | | | | | | | |
Fresh Market Incorporated†« | | | | | | | 2,010,000 | | | | 86,550,600 | |
| | | | | | |
| Portfolio of Investments—January 31, 2012 (Unaudited) | | Wells Fargo Advantage Growth Fund | | | 9 | |
| | | | | | | | | | | | |
| Security Name | | | | | | Shares | | | Value | |
| | | | | | | | | | | | |
| | | | |
| Food & Staples Retailing (continued) | | | | | | | | | | | | |
Whole Foods Market Incorporated | | | | | | | 3,035,000 | | | $ | 224,681,050 | |
| | | | |
| | | | | | | | | | | 311,231,650 | |
| | | | | | | | | | | | |
| | | | |
| Food Products: 0.24% | | | | | | | | | | | | |
Green Mountain Coffee Roasters Incorporated† | | | | | | | 404,000 | | | | 21,549,360 | |
| | | | | | | | | | | | |
| | | |
| Personal Products: 0.33% | | | | | | | | | | |
Estee Lauder Companies Incorporated Class A | | | | | | | 515,000 | | | | 29,833,950 | |
| | | | | | | | | | | | |
| | | |
Energy: 6.23% | | | | | | | | | | |
| | | | |
| Energy Equipment & Services: 1.13% | | | | | | | | | | | | |
Schlumberger Limited | | | | | | | 1,360,000 | | | | 102,231,200 | |
| | | | | | | | | | | | |
| | | |
| Oil, Gas & Consumable Fuels: 5.10% | | | | | | | | | | |
Concho Resources Incorporated†« | | | | | | | 985,000 | | | | 105,060,100 | |
Continental Resources Incorporated†« | | | | | | | 850,000 | | | | 68,578,000 | |
Energy XXI Bermuda Limited† | | | | | | | 70,000 | | | | 2,329,096 | |
Oasis Petroleum Incorporated†« | | | | | | | 430,000 | | | | 14,508,200 | |
Pioneer Natural Resources Company | | | | | | | 2,559,000 | | | | 254,108,700 | |
Southwestern Energy Company† | | | | | | | 533,000 | | | | 16,597,620 | |
| | | | |
| | | | | | | | | | | 461,181,716 | |
| | | | | | | | | | | | |
| | | | |
Financials: 5.16% | | | | | | | | | | | | |
| | | | |
| Capital Markets: 2.63% | | | | | | | | | | | | |
Financial Engines Incorporated†« | | | | | | | 2,337,000 | | | | 55,971,150 | |
LPL Investment Holdings Incorporated† | | | | | | | 1,760,000 | | | | 57,816,000 | |
TD Ameritrade Holding Corporation | | | | | | | 7,700,000 | | | | 124,047,000 | |
| | | | |
| | | | | | | | | | | 237,834,150 | |
| | | | | | | | | | | | |
| | | | |
| Consumer Finance: 2.53% | | | | | | | | | | | | |
American Express Company | | | | | | | 1,420,000 | | | | 71,198,800 | |
MasterCard Incorporated« | | | | | | | 441,000 | | | | 156,806,370 | |
| | | | |
| | | | | | | | | | | 228,005,170 | |
| | | | | | | | | | | | |
| | | | |
Health Care: 12.24% | | | | | | | | | | | | |
| | | | |
| Biotechnology: 2.95% | | | | | | | | | | | | |
Alexion Pharmaceuticals Incorporated† | | | | | | | 2,976,000 | | | | 228,437,760 | |
Biogen Idec Incorporated† | | | | | | | 152,000 | | | | 17,923,840 | |
BioMarin Pharmaceutical Incorporated†« | | | | | | | 559,000 | | | | 19,939,530 | |
| | | | |
| | | | | | | | | | | 266,301,130 | |
| | | | | | | | | | | | |
| | | | |
| Health Care Equipment & Supplies: 4.11% | | | | | | | | | | | | |
Covidien plc | | | | | | | 616,000 | | | | 31,724,000 | |
DexCom Incorporated†« | | | | | | | 1,140,300 | | | | 12,509,091 | |
Edwards Lifesciences Corporation† | | | | | | | 56,000 | | | | 4,608,800 | |
Intuitive Surgical Incorporated†« | | | | | | | 265,000 | | | | 121,876,150 | |
NxStage Medical Incorporated†« | | | | | | | 2,905,000 | | | | 52,115,700 | |
St. Jude Medical Incorporated | | | | | | | 2,300,000 | | | | 95,933,000 | |
Volcano Corporation†« | | | | | | | 1,880,000 | | | | 52,734,000 | |
| | | | |
| | | | | | | | | | | 371,500,741 | |
| | | | | | | | | | | | |
| | | | |
| 10 | | Wells Fargo Advantage Growth Fund | | Portfolio of Investments—January 31, 2012 (Unaudited) |
| | | | | | | | | | | | |
| Security Name | | | | | | Shares | | | Value | |
| | | | | | | | | | | | |
| | | | |
| Health Care Providers & Services: 0.44% | | | | | | | | | | | | |
AmerisourceBergen Corporation« | | | | | | | 1,025,000 | | | $ | 39,944,250 | |
| | | | | | | | | | | | |
| | | |
| Health Care Technology: 0.31% | | | | | | | | | | |
Cerner Corporation† | | | | | | | 463,000 | | | | 28,192,070 | |
| | | | | | | | | | | | |
| | | |
| Life Sciences Tools & Services: 2.01% | | | | | | | | | | |
Covance Incorporated† | | | | | | | 440,000 | | | | 19,276,400 | |
Mettler-Toledo International Incorporated†« | | | | | | | 925,000 | | | | 162,337,500 | |
| | | | |
| | | | | | | | | | | 181,613,900 | |
| | | | | | | | | | | | |
| | | | |
| Pharmaceuticals: 2.42% | | | | | | | | | | | | |
Allergan Incorporated« | | | | | | | 850,000 | | | | 74,723,500 | |
Shire plc ADR | | | | | | | 1,440,000 | | | | 143,308,800 | |
| | | | |
| | | | | | | | | | | 218,032,300 | |
| | | | | | | | | | | | |
| | | | |
Industrials: 7.86% | | | | | | | | | | | | |
| | | | |
| Aerospace & Defense: 0.56% | | | | | | | | | | | | |
United Technologies Corporation | | | | | | | 647,400 | | | | 50,723,790 | |
| | | | | | | | | | | | |
| | | |
| Air Freight & Logistics: 0.40% | | | | | | | | | | |
C.H. Robinson Worldwide Incorporated« | | | | | | | 530,000 | | | | 36,485,200 | |
| | | | | | | | | | | | |
| | | |
| Electrical Equipment: 0.60% | | | | | | | | | | |
Polypore International Incorporated†« | | | | | | | 1,425,000 | | | | 54,264,000 | |
| | | | | | | | | | | | |
| | | |
| Machinery: 2.58% | | | | | | | | | | |
Caterpillar Incorporated | | | | | | | 111,000 | | | | 12,112,320 | |
Danaher Corporation | | | | | | | 1,289,100 | | | | 67,690,641 | |
Gardner Denver Incorporated | | | | | | | 507,000 | | | | 37,822,200 | |
Joy Global Incorporated« | | | | | | | 1,270,000 | | | | 115,176,300 | |
| | | | |
| | | | | | | | | | | 232,801,461 | |
| | | | | | | | | | | | |
| | | | |
| Road & Rail: 3.72% | | | | | | | | | | | | |
Kansas City Southern†« | | | | | | | 3,044,000 | | | | 208,940,160 | |
Norfolk Southern Corporation« | | | | | | | 935,000 | | | | 67,507,000 | |
Union Pacific Corporation | | | | | | | 524,000 | | | | 59,898,440 | |
| | | | |
| | | | | | | | | | | 336,345,600 | |
| | | | | | | | | | | | |
| | | | |
Information Technology: 34.75% | | | | | | | | | | | | |
| | | | |
| Communications Equipment: 2.84% | | | | | | | | | | | | |
Acme Packet Incorporated†« | | | | | | | 1,137,000 | | | | 33,234,510 | |
Aruba Networks Incorporated†« | | | | | | | 600,000 | | | | 13,308,000 | |
F5 Networks Incorporated† | | | | | | | 475,000 | | | | 56,876,500 | |
QUALCOMM Incorporated | | | | | | | 1,616,000 | | | | 95,053,120 | |
Riverbed Technology Incorporated† | | | | | | | 1,460,000 | | | | 34,952,400 | |
Ubiquiti Networks Incorporated†« | | | | | | | 954,681 | | | | 23,179,655 | |
| | | | |
| | | | | | | | | | | 256,604,185 | |
| | | | | | | | | | | | |
| | | | |
| Computers & Peripherals: 9.62% | | | | | | | | | | | | |
Apple Incorporated† | | | | | | | 1,412,000 | | | | 644,549,760 | |
EMC Corporation† | | | | | | | 8,735,000 | | | | 225,013,600 | |
| | | | |
| | | | | | | | | | | 869,563,360 | |
| | | | | | | | | | | | |
| | | | | | |
| Portfolio of Investments—January 31, 2012 (Unaudited) | | Wells Fargo Advantage Growth Fund | | | 11 | |
| | | | | | | | | | | | |
| Security Name | | | | | | Shares | | | Value | |
| | | | | | | | | | | | |
| | | | |
| Internet Software & Services: 7.70% | | | | | | | | | | | | |
eBay Incorporated† | | | | | | | 4,605,000 | | | $ | 145,518,000 | |
Google Incorporated Class A† | | | | | | | 361,000 | | | | 209,419,710 | |
LogMeIn Incorporated†« | | | | | | | 2,000,000 | | | | 79,660,000 | |
Mercadolibre Incorporated« | | | | | | | 785,000 | | | | 68,609,000 | |
Rackspace Hosting Incorporated†« | | | | | | | 4,440,000 | | | | 192,740,400 | |
| | | | |
| | | | | | | | | | | 695,947,110 | |
| | | | | | | | | | | | |
| | | | |
| IT Services: 5.44% | | | | | | | | | | | | |
Accenture plc | | | | | | | 610,000 | | | | 34,977,400 | |
Alliance Data Systems Corporation†« | | | | | | | 1,280,000 | | | | 141,824,000 | |
Cognizant Technology Solutions Corporation Class A† | | | | | | | 3,489,000 | | | | 250,335,750 | |
VeriFone Holdings Incorporated† | | | | | | | 1,500,000 | | | | 64,050,000 | |
| | | | |
| | | | | | | | | | | 491,187,150 | |
| | | | | | | | | | | | |
| | | | |
| Semiconductors & Semiconductor Equipment: 2.50% | | | | | | | | | | | | |
Altera Corporation | | | | | | | 594,000 | | | | 23,635,260 | |
Analog Devices Incorporated | | | | | | | 171,000 | | | | 6,691,230 | |
Avago Technologies Limited | | | | | | | 1,376,000 | | | | 46,701,440 | |
Cavium Incorporated†« | | | | | | | 900,000 | | | | 28,926,000 | |
Maxim Integrated Products Incorporated | | | | | | | 1,200,000 | | | | 32,208,000 | |
Microchip Technology Incorporated« | | | | | | | 2,370,000 | | | | 87,476,700 | |
| | | | |
| | | | | | | | | | | 225,638,630 | |
| | | | | | | | | | | | |
| | | | |
| Software: 6.65% | | | | | | | | | | | | |
Broadsoft Incorporated†« | | | | | | | 1,560,000 | | | | 43,492,800 | |
Check Point Software Technologies Limited†« | | | | | | | 800,000 | | | | 45,032,000 | |
Citrix Systems Incorporated† | | | | | | | 1,225,000 | | | | 79,882,250 | |
Fortinet Incorporated†« | | | | | | | 3,400,000 | | | | 77,554,000 | |
Qlik Technologies Incorporated† | | | | | | | 1,000,000 | | | | 28,200,000 | |
Red Hat Incorporated†« | | | | | | | 2,327,000 | | | | 107,902,990 | |
Salesforce.com Incorporated†« | | | | | | | 245,000 | | | | 28,616,000 | |
SuccessFactors Incorporated†« | | | | | | | 205,088 | | | | 8,162,501 | |
Synchronoss Technologies Incorporated†« | | | | | | | 700,000 | | | | 23,394,000 | |
Taleo Corporation Class A†« | | | | | | | 1,836,000 | | | | 66,114,360 | |
Ultimate Software Group Incorporated†« | | | | | | | 1,395,000 | | | | 93,032,550 | |
| | | | |
| | | | | | | | | | | 601,383,451 | |
| | | | | | | | | | | | |
| | | | |
Materials: 2.69% | | | | | | | | | | | | |
| | | | |
| Chemicals: 2.69% | | | | | | | | | | | | |
Air Products & Chemicals Incorporated | | | | | | | 430,000 | | | | 37,852,901 | |
Monsanto Company | | | | | | | 425,000 | | | | 34,871,250 | |
Praxair Incorporated« | | | | | | | 1,600,000 | | | | 169,920,000 | |
| | | | |
| | | | | | | | | | | 242,644,151 | |
| | | | | | | | | | | | |
| | | | |
Total Common Stocks (Cost $6,918,795,346) | | | | | | | | | | | 8,442,188,658 | |
| | | | | | | | | | | | |
| | | | |
Investment Companies: 1.69% | | | | | | | | | | | | |
Ishares Russell 1000 Growth | | | | | | | 2,494,924 | | | | 152,888,943 | |
| | | | | | | | | | | | |
| | | | |
Total Investment Companies (Cost $145,640,702) | | | | | | | | | | | 152,888,943 | |
| | | | | | | | | | | | |
| | | | |
| 12 | | Wells Fargo Advantage Growth Fund | | Portfolio of Investments—January 31, 2012 (Unaudited) |
| | | | | | | | | | | | | | |
| Security Name | | | | | | | Principal | | | Value | |
| | | | | | | | | | | | | | |
| Other: 0.05% | | | | | | | | | | | | | | |
Gryphon Funding Limited, Pass-Through Entity(v)(a)(i) | | | | | | | | | $ 5,341,546 | | | $ | 1,442,217 | |
VFNC Corporation, Pass-Through Entity, 0.27%±144A(v)(a)(i) | | | | | | | | | 6,086,695 | | | | 2,617,279 | |
| | | | |
Total Other (Cost $1,897,404) | | | | | | | | | | | | | 4,059,496 | |
| | | | | | | | | | | | | | |
| | | | |
| | | Yield | | | | | Shares | | | | |
| | | | |
Short-Term Investments: 15.77% | | | | | | | | | | | | | | |
| | | | |
| Investment Companies: 15.77% | | | | | | | | | | | | | | |
Wells Fargo Advantage Cash Investment Money Market Fund, Institutional Class(l)(u) | | | 0.02 | % | | | | | 288,966,966 | | | | 288,966,966 | |
Wells Fargo Securities Lending Cash Investments, LLC(r)(l)(u)(v) | | | 0.15 | | | | | | 1,136,035,898 | | | | 1,136,035,898 | |
| | | | |
Total Short-Term Investments (Cost $1,425,002,864) | | | | | | | | | | | | | 1,425,002,864 | |
| | | | | | | | | | | | | | |
| | | | | | | | |
| Total Investments in Securities | | | | | | | | |
| (Cost $8,491,336,316)* | | | 110.94 | % | | | 10,024,139,961 | |
Other Assets and Liabilities, Net | | | (10.94 | ) | | | (988,453,067 | ) |
| | | | | | | | |
| Total Net Assets | | | 100.00 | % | | $ | 9,035,686,894 | |
| | | | | | | | |
| « | All or a portion of this security is on loan. |
| † | Non-income earning security. |
| ± | Variable rate investment. |
| 144A | Security that may be resold to “qualified institutional buyers” under Rule 144A or security offered pursuant to Section 4(2) of the Securities Act of 1933, as amended. |
| (v) | Security represents investment of cash collateral received from securities on loan. |
| (a) | Security is fair valued by the Management Valuation Team, and in certain instances by the Board of Trustees, in accordance with procedures approved by the Board of Trustees. |
| (l) | Investment in an affiliate. |
| (u) | Rate shown is the 7-day annualized yield at period end. |
| (r) | The investment company is exempt from registration under Section 3(c)(7) of the 1940 Act. |
| * | Cost for federal income tax purposes is $8,639,503,655 and net unrealized appreciation (depreciation) consists of: |
| | | | |
Gross unrealized appreciation | | $ | 1,470,090,605 | |
Gross unrealized depreciation | | | (85,454,299 | ) |
| | | | |
Net unrealized appreciation | | $ | 1,384,636,306 | |
The accompanying notes are an integral part of these financial statements.
| | | | | | |
| Statement of Assets and Liabilities—January 31, 2012 (Unaudited) | | Wells Fargo Advantage Growth Fund | | | 13 | |
| | | | |
| | | | |
| |
Assets | | | | |
Investments | | | | |
In unaffiliated securities (including securities on loan), at value (see cost below) | | $ | 8,599,137,097 | |
In affiliated securities, at value (see cost below) | | | 1,425,002,864 | |
| | | | |
Total investments, at value (see cost below) | | | 10,024,139,961 | |
Receivable for investments sold | | | 45,544,322 | |
Receivable for Fund shares sold | | | 225,716,199 | |
Receivable for dividends | | | 1,151,272 | |
Receivable for securities lending income | | | 519,948 | |
Prepaid expenses and other assets | | | 247,342 | |
| | | | |
Total assets | | | 10,297,319,044 | |
| | | | |
| |
Liabilities | | | | |
Payable for investments purchased | | | 105,323,340 | |
Payable for Fund shares redeemed | | | 10,636,571 | |
Payable upon receipt of securities loaned | | | 1,137,933,301 | |
Advisory fee payable | | | 4,227,861 | |
Distribution fees payable | | | 260,255 | |
Due to other related parties | | | 1,711,439 | |
Accrued expenses and other liabilities | | | 1,539,383 | |
| | | | |
Total liabilities | | | 1,261,632,150 | |
| | | | |
Total net assets | | $ | 9,035,686,894 | |
| | | | |
| |
NET ASSETS CONSIST OF | | | | |
Paid-in capital | | $ | 7,725,299,500 | |
Undistributed net investment loss | | | (18,604,276 | ) |
Accumulated net realized losses on investments | | | (203,811,975 | ) |
Net unrealized gains on investments | | | 1,532,803,645 | |
| | | | |
Total net assets | | $ | 9,035,686,894 | |
| | | | |
| |
COMPUTATION OF NET ASSET VALUE AND OFFERING PRICE PER SHARE1 | | | | |
Net assets – Class A | | $ | 2,138,749,666 | |
Shares outstanding – Class A | | | 58,605,187 | |
Net asset value per share – Class A | | | $36.49 | |
Maximum offering price per share – Class A2 | | | $38.72 | |
Net assets – Class C | | $ | 486,699,872 | |
Shares outstanding – Class C | | | 14,197,095 | |
Net asset value per share – Class C | | | $34.28 | |
Net assets – Administrator Class | | $ | 2,440,427,606 | |
Shares outstanding – Administrator Class | | | 63,788,833 | |
Net asset value per share – Administrator Class | | | $38.26 | |
Net assets – Institutional Class | | $ | 1,804,770,255 | |
Shares outstanding – Institutional Class | | | 45,949,208 | |
Net asset value per share – Institutional Class | | | $39.28 | |
Net assets – Investor Class | | $ | 2,165,039,495 | |
Shares outstanding – Investor Class | | | 59,429,057 | |
Net asset value per share – Investor Class | | | $36.43 | |
| |
Investments in unaffiliated securities, at cost | | $ | 7,066,333,452 | |
| | | | |
Investments in affiliated securities, at cost | | $ | 1,425,002,864 | |
| | | | |
Total investments, at cost | | $ | 8,491,336,316 | |
| | | | |
Securities on loan, at value | | $ | 1,112,264,855 | |
| | | | |
| 1. | The Fund has an unlimited number of authorized shares. |
| 2. | Maximum offering price is computed as 100/94.25 of net asset value. On investments of $50,000 or more, the offering price is reduced. |
The accompanying notes are an integral part of these financial statements.
| | | | |
| 14 | | Wells Fargo Advantage Growth Fund | | Statement of Operations—Six Months Ended January 31, 2012 (Unaudited) |
| | | | |
| | | | |
| |
Investment income | | | | |
Dividends | | $ | 16,345,019 | |
Securities lending income, net | | | 1,373,440 | |
Income from affiliated securities | | | 169,858 | |
| | | | |
Total investment income | | | 17,888,317 | |
| | | | |
| |
Expenses | | | | |
Advisory fee | | | 20,871,377 | |
Administration fees | | | | |
Fund level | | | 1,566,992 | |
Class A | | | 1,958,573 | |
Class C | | | 398,877 | |
Administrator Class | | | 860,403 | |
Institutional Class | | | 511,548 | |
Investor Class | | | 2,915,511 | |
Shareholder servicing fees | | | | |
Class A | | | 1,883,243 | |
Class C | | | 383,536 | |
Administrator Class | | | 2,118,765 | |
Investor Class | | | 2,174,935 | |
Distribution fees | | | | |
Class C | | | 1,150,607 | |
Custody and accounting fees | | | 156,029 | |
Professional fees | | | 20,648 | |
Registration fees | | | 87,636 | |
Shareholder report expenses | | | 153,936 | |
Trustees’ fees and expenses | | | 5,332 | |
Other fees and expenses | | | 36,262 | |
| | | | |
Total expenses | | | 37,254,210 | |
Less: Fee waivers and/or expense reimbursements | | | (761,617 | ) |
| | | | |
Net expenses | | | 36,492,593 | |
| | | | |
Net investment loss | | | (18,604,276 | ) |
| | | | |
| |
REALIZED AND UNREALIZED GAINS (LOSSES) ON INVESTMENTS | | | | |
Net realized losses on investments | | | (183,534,595 | ) |
Net change in unrealized gains (losses) on investments | | | 573,275,915 | |
| | | | |
Net realized and unrealized gains (losses) on investments | | | 389,741,320 | |
| | | | |
Net increase in net assets resulting from operations | | $ | 371,137,044 | |
| | | | |
The accompanying notes are an integral part of these financial statements.
| | | | | | |
| Statements of Changes in Net Assets | | Wells Fargo Advantage Growth Fund | | | 15 | |
| | | | | | | | | | | | | | | | |
| | | Six Months Ended
January 31, 2012
(Unaudited) | | | Year Ended
July 31, 2011 | |
| | | | |
Operations | | | | | | | | | | | | | | | | |
Net investment loss | | | | | | $ | (18,604,276 | ) | | | | | | $ | (23,841,563 | ) |
Net realized gains (losses) on investments | | | | | | | (183,534,595 | ) | | | | | | | 100,634,865 | |
Net change in unrealized gains (losses) on investments | | | | | | | 573,275,915 | | | | | | | | 773,966,368 | |
| | | | | | | | | | | | | | | | |
Net increase in net assets resulting from operations | | | | | | | 371,137,044 | | | | | | | | 850,759,670 | |
| | | | | | | | | | | | | | | | |
| | | | |
Distributions to shareholders from | | | | | | | | | | | | | | | | |
Net realized gains | | | | | | | | | | | | | | | | |
Class A | | | | | | | (22,821,310 | ) | | | | | | | 0 | |
Class C | | | | | | | (4,924,745 | ) | | | | | | | 0 | |
Administrator Class | | | | | | | (24,894,020 | ) | | | | | | | 0 | |
Institutional Class | | | | | | | (18,155,513 | ) | | | | | | | 0 | |
Investor Class | | | | | | | (25,630,810 | ) | | | | | | | 0 | |
| | | | | | | | | | | | | | | | |
Total distributions to shareholders | | | | | | | (96,426,398 | ) | | | | | | | 0 | |
| | | | | | | | | | | | | | | | |
| | | | |
Capital share transactions | | | Shares | | | | | | | | Shares | | | | | |
Proceeds from shares sold | | | | | | | | | | | | | | | | |
Class A | | | 32,469,940 | | | | 1,118,610,791 | | | | 31,618,568 | | | | 1,080,012,208 | |
Class C | | | 7,839,716 | | | | 256,346,184 | | | | 6,581,626 | | | | 214,820,537 | |
Administrator Class | | | 33,647,584 | | | | 1,210,217,292 | | | | 32,395,353 | | | | 1,154,516,727 | |
Institutional Class | | | 23,327,746 | | | | 862,086,023 | | | | 17,002,296 | | | | 633,070,434 | |
Investor Class | | | 19,982,836 | | | | 695,086,223 | | | | 20,341,888 | | | | 687,118,438 | |
| | | | | | | | | | | | | | | | |
| | | | | | | 4,142,346,513 | | | | | | | | 3,769,538,344 | |
| | | | | | | | | | | | | | | | |
Reinvestment of distributions | | | | | | | | | | | | | | | | |
Class A | | | 605,503 | | | | 21,283,444 | | | | 0 | | | | 0 | |
Class C | | | 94,859 | | | | 3,135,086 | | | | 0 | | | | 0 | |
Administrator Class | | | 619,843 | | | | 22,828,833 | | | | 0 | | | | 0 | |
Institutional Class | | | 464,164 | | | | 17,550,046 | | | | 0 | | | | 0 | |
Investor Class | | | 701,497 | | | | 24,615,520 | | | | 0 | | | | 0 | |
| | | | | | | | | | | | | | | | |
| | | | | | | 89,412,929 | | | | | | | | 0 | |
| | | | | | | | | | | | | | | | |
Payment for shares redeemed | | | | | | | | | | | | | | | | |
Class A | | | (8,047,522 | ) | | | (274,066,239 | ) | | | (4,304,058 | ) | | | (146,726,940 | ) |
Class C | | | (622,926 | ) | | | (19,817,514 | ) | | | (290,159 | ) | | | (9,588,300 | ) |
Administrator Class | | | (6,152,029 | ) | | | (219,555,982 | ) | | | (11,938,560 | ) | | | (435,375,226 | ) |
Institutional Class | | | (3,634,621 | ) | | | (132,933,593 | ) | | | (4,385,240 | ) | | | (158,832,388 | ) |
Investor Class | | | (8,908,429 | ) | | | (301,476,690 | ) | | | (8,785,871 | ) | | | (294,439,261 | ) |
| | | | | | | | | | | | | | | | |
| | | | | | | (947,850,018 | ) | | | | | | | (1,044,962,115 | ) |
| | | | | | | | | | | | | | | | |
Net increase in net assets resulting from capital share transactions | | | | | | | 3,283,909,424 | | | | | | | | 2,724,576,229 | |
| | | | | | | | | | | | | | | | |
Total increase in net assets | | | | | | | 3,558,620,070 | | | | | | | | 3,575,335,899 | |
| | | | | | | | | | | | | | | | |
| | | | |
Net assets | | | | | | | | | | | | | | | | |
Beginning of period | | | | | | | 5,477,066,824 | | | | | | | | 1,901,730,925 | |
| | | | | | | | | | | | | | | | |
End of period | | | | | | $ | 9,035,686,894 | | | | | | | $ | 5,477,066,824 | |
| | | | | | | | | | | | | | | | |
Undistributed net investment income (loss) | | | | | | $ | (18,604,276 | ) | | | | | | $ | 0 | |
| | | | | | | | | | | | | | | | |
The accompanying notes are an integral part of these financial statements.
| | | | |
| 16 | | Wells Fargo Advantage Growth Fund | | Financial Highlights |
(For a share outstanding throughout each period)
| | | | | | | | | | | | | | | | | | | | | | | | |
| | | Six Months Ended
January 31, 2012 (Unaudited) | | | Year Ended July 31, | |
| Class A | | | 2011 | | | 2010 | | | 2009 | | | 20081 | | | 20071 | |
Net asset value, beginning of period | | $ | 35.88 | | | $ | 26.10 | | | $ | 21.13 | | | $ | 25.20 | | | $ | 26.36 | | | $ | 20.45 | |
Net investment loss | | | (0.15 | )2 | | | (0.27 | )2 | | | (0.16 | )2 | | | (0.08 | )2 | | | (0.16 | )2 | | | (0.15 | )2 |
Net realized and unrealized gains (losses) on investments | | | 1.23 | | | | 10.05 | | | | 5.13 | | | | (3.99 | ) | | | (1.00 | ) | | | 6.06 | |
| | | | | | | | | | | | | | | | | | | | | | | | |
Total from investment operations | | | 1.08 | | | | 9.78 | | | | 4.97 | | | | (4.07 | ) | | | (1.16 | ) | | | 5.91 | |
Distributions to shareholders from | | | | | | | | | | | | | | | | | | | | | | | | |
Net realized gains | | | (0.47 | ) | | | 0.00 | | | | 0.00 | | | | 0.00 | | | | 0.00 | | | | 0.00 | |
Net asset value, end of period | | $ | 36.49 | | | $ | 35.88 | | | $ | 26.10 | | | $ | 21.13 | | | $ | 25.20 | | | $ | 26.36 | |
Total return3 | | | 3.08 | % | | | 37.43 | % | | | 23.52 | % | | | (16.15 | )% | | | (4.40 | )% | | | 28.85 | % |
Ratios to average net assets (annualized) | | | | | | | | | | | | | | | | | | | | | | | | |
Gross expenses | | | 1.21 | % | | | 1.24 | % | | | 1.31 | % | | | 1.35 | % | | | 1.35 | % | | | 1.34 | % |
Net expenses | | | 1.21 | % | | | 1.24 | % | | | 1.30 | % | | | 1.29 | % | | | 1.30 | % | | | 1.30 | % |
Net investment loss | | | (0.66 | )% | | | (0.81 | )% | | | (0.64 | )% | | | (0.44 | )% | | | (0.60 | )% | | | (0.63 | )% |
Supplemental data | | | | | | | | | | | | | | | | | | | | | | | | |
Portfolio turnover rate | | | 23 | % | | | 54 | % | | | 72 | % | | | 88 | % | | | 122 | % | | | 117 | % |
Net assets, end of period (000’s omitted) | | | $2,138,750 | | | | $1,204,675 | | | | $163,485 | | | | $46,250 | | | | $34,992 | | | | $23,142 | |
| 1. | Effective June 20, 2008, Advisor Class was renamed Class A. |
| 2. | Calculated based upon average shares outstanding. |
| 3. | Total return calculations do not include any sales charges. Returns for periods of less than one year are not annualized. |
The accompanying notes are an integral part of these financial statements.
| | | | | | |
| Financial Highlights | | Wells Fargo Advantage Growth Fund | | | 17 | |
(For a share outstanding throughout each period)
| | | | | | | | | | | | | | | | | | | | | | | | |
| | | Six Months Ended
January 31, 2012 (Unaudited) | | | Year Ended July 31, | |
| Class C | | | 2011 | | | 2010 | | | 2009 | | | 2008 | | | 2007 | |
Net asset value, beginning of period | | $ | 33.86 | | | $ | 24.81 | | | $ | 20.24 | | | $ | 24.30 | | | $ | 25.62 | | | $ | 20.03 | |
Net investment loss | | | (0.31 | )1 | | | (0.51 | )1 | | | (0.34 | )1 | �� | | (0.21 | )1 | | | (0.35 | )1 | | | (0.31 | )1 |
Net realized and unrealized gains (losses) on investments | | | 1.20 | | | | 9.56 | | | | 4.91 | | | | (3.85 | ) | | | (0.97 | ) | | | 5.90 | |
| | | | | | | | | | | | | | | | | | | | | | | | |
Total from investment operations | | | 0.89 | | | | 9.05 | | | | 4.57 | | | | (4.06 | ) | | | (1.32 | ) | | | 5.59 | |
Distributions to shareholders from | | | | | | | | | | | | | | | | | | | | | | | | |
Net realized gains | | | (0.47 | ) | | | 0.00 | | | | 0.00 | | | | 0.00 | | | | 0.00 | | | | 0.00 | |
Net asset value, end of period | | $ | 34.28 | | | $ | 33.86 | | | $ | 24.81 | | | $ | 20.24 | | | $ | 24.30 | | | $ | 25.62 | |
Total return2 | | | 2.71 | % | | | 36.44 | % | | | 22.58 | % | | | (16.71 | )% | | | (5.15 | )% | | | 27.86 | % |
Ratios to average net assets (annualized) | | | | | | | | | | | | | | | | | | | | | | | | |
Gross expenses | | | 1.96 | % | | | 1.99 | % | | | 2.06 | % | | | 2.07 | % | | | 2.11 | % | | | 2.09 | % |
Net expenses | | | 1.96 | % | | | 1.99 | % | | | 2.05 | % | | | 2.02 | % | | | 2.05 | % | | | 2.05 | % |
Net investment loss | | | (1.42 | )% | | | (1.57 | )% | | | (1.40 | )% | | | (1.17 | )% | | | (1.36 | )% | | | (1.35 | )% |
Supplemental data | | | | | | | | | | | | | | | | | | | | | | | | |
Portfolio turnover rate | | | 23 | % | | | 54 | % | | | 72 | % | | | 88 | % | | | 122 | % | | | 117 | % |
Net assets, end of period (000’s omitted) | | | $486,700 | | | | $233,114 | | | | $14,737 | | | | $2,387 | | | | $1,307 | | | | $325 | |
| 1. | Calculated based upon average shares outstanding. |
| 2. | Total return calculations do not include any sales charges. Returns for periods of less than one year are not annualized. |
The accompanying notes are an integral part of these financial statements.
| | | | |
| 18 | | Wells Fargo Advantage Growth Fund | | Financial Highlights |
(For a share outstanding throughout each period)
| | | | | | | | | | | | | | | | | | | | | | | | |
| | | Six Months Ended
January 31, 2012 (Unaudited) | | | Year Ended July 31, | |
| Administrator Class | | | 2011 | | | 2010 | | | 2009 | | | 2008 | | | 2007 | |
Net asset value, beginning of period | | $ | 37.54 | | | $ | 27.24 | | | $ | 21.98 | | | $ | 26.12 | | | $ | 27.23 | | | $ | 21.06 | |
Net investment loss | | | (0.09 | )1 | | | (0.18 | )1 | | | (0.08 | )1 | | | (0.01 | )1 | | | (0.07 | )1 | | | (0.07 | )1 |
Net realized and unrealized gains (losses) on investments | | | 1.28 | | | | 10.48 | | | | 5.34 | | | | (4.13 | ) | | | (1.04 | ) | | | 6.24 | |
| | | | | | | | | | | | | | | | | | | | | | | | |
Total from investment operations | | | 1.19 | | | | 10.30 | | | | 5.26 | | | | (4.14 | ) | | | (1.11 | ) | | | 6.17 | |
Distributions to shareholders from | | | | | | | | | | | | | | | | | | | | | | | | |
Net realized gains | | | (0.47 | ) | | | 0.00 | | | | 0.00 | | | | 0.00 | | | | 0.00 | | | | 0.00 | |
Net asset value, end of period | | $ | 38.26 | | | $ | 37.54 | | | $ | 27.24 | | | $ | 21.98 | | | $ | 26.12 | | | $ | 27.23 | |
Total return2 | | | 3.21 | % | | | 37.81 | % | | | 23.93 | % | | | (15.85 | )% | | | (4.08 | )% | | | 29.25 | % |
Ratios to average net assets (annualized) | | | | | | | | | | | | | | | | | | | | | | | | |
Gross expenses | | | 1.04 | % | | | 1.08 | % | | | 1.13 | % | | | 1.18 | % | | | 1.17 | % | | | 1.16 | % |
Net expenses | | | 0.96 | % | | | 0.96 | % | | | 0.96 | % | | | 0.96 | % | | | 0.96 | % | | | 0.96 | % |
Net investment loss | | | (0.42 | )% | | | (0.51 | )% | | | (0.29 | )% | | | (0.07 | )% | | | (0.25 | )% | | | (0.29 | )% |
Supplemental data | | | | | | | | | | | | | | | | | | | | | | | | |
Portfolio turnover rate | | | 23 | % | | | 54 | % | | | 72 | % | | | 88 | % | | | 122 | % | | | 117 | % |
Net assets, end of period (000’s omitted) | | | $2,440,428 | | | | $1,339,245 | | | | $414,489 | | | | $196,301 | | | | $109,958 | | | | $128,523 | |
| 1. | Calculated based upon average shares outstanding. |
| 2. | Returns for periods of less than one year are not annualized. |
The accompanying notes are an integral part of these financial statements.
| | | | | | |
| Financial Highlights | | Wells Fargo Advantage Growth Fund | | | 19 | |
(For a share outstanding throughout each period)
| | | | | | | | | | | | | | | | | | | | | | | | |
| | | Six Months Ended
January 31, 2012 (Unaudited) | | | Year Ended July 31, | |
| Institutional Class | | | 2011 | | | 2010 | | | 2009 | | | 2008 | | | 2007 | |
Net asset value, beginning of period | | $ | 38.49 | | | $ | 27.88 | | | $ | 22.46 | | | $ | 26.65 | | | $ | 27.74 | | | $ | 21.42 | |
Net investment income (loss) | | | (0.05 | )1 | | | (0.12 | )1 | | | (0.03 | )1 | | | 0.01 | 1 | | | (0.03 | )1 | | | (0.04 | )1 |
Net realized and unrealized gains (losses) on investments | | | 1.31 | | | | 10.73 | | | | 5.45 | | | | (4.20 | ) | | | (1.06 | ) | | | 6.36 | |
| | | | | | | | | | | | | | | | | | | | | | | | |
Total from investment operations | | | 1.26 | | | | 10.61 | | | | 5.42 | | | | (4.19 | ) | | | (1.09 | ) | | | 6.32 | |
Distributions to shareholders from | | | | | | | | | | | | | | | | | | | | | | | | |
Net realized gains | | | (0.47 | ) | | | 0.00 | | | | 0.00 | | | | 0.00 | | | | 0.00 | | | | 0.00 | |
Net asset value, end of period | | $ | 39.28 | | | $ | 38.49 | | | $ | 27.88 | | | $ | 22.46 | | | $ | 26.65 | | | $ | 27.74 | |
Total return2 | | | 3.32 | % | | | 38.06 | % | | | 24.13 | % | | | (15.72 | )% | | | (3.93 | )% | | | 29.46 | % |
Ratios to average net assets (annualized) | | | | | | | | | | | | | | | | | | | | | | | | |
Gross expenses | | | 0.78 | % | | | 0.81 | % | | | 0.86 | % | | | 0.91 | % | | | 0.90 | % | | | 0.89 | % |
Net expenses | | | 0.77 | % | | | 0.80 | % | | | 0.80 | % | | | 0.80 | % | | | 0.80 | % | | | 0.82 | % |
Net investment income (loss) | | | (0.23 | )% | | | (0.35 | )% | | | (0.12 | )% | | | 0.07 | % | | | (0.10 | )% | | | (0.14 | )% |
Supplemental data | | | | | | | | | | | | | | | | | | | | | | | | |
Portfolio turnover rate | | | 23 | % | | | 0.54 | % | | | 72 | % | | | 88 | % | | | 122 | % | | | 117 | % |
Net assets, end of period (000’s omitted) | | | $1,804,770 | | | | $992,748 | | | | $367,360 | | | | $255,282 | | | | $260,671 | | | | $264,648 | |
| 1. | Calculated based upon average shares outstanding. |
| 2. | Returns for periods of less than one year are not annualized. |
The accompanying notes are an integral part of these financial statements.
| | | | |
| 20 | | Wells Fargo Advantage Growth Fund | | Financial Highlights |
(For a share outstanding throughout each period)
| | | | | | | | | | | | | | | | | | | | | | | | |
| | | Six Months Ended
January 31, 2012 (Unaudited) | | | Year Ended July 31, | |
| Investor Class | | | 2011 | | | 2010 | | | 2009 | | | 2008 | | | 2007 | |
Net asset value, beginning of period | | $ | 35.83 | | | $ | 26.09 | | | $ | 21.14 | | | $ | 25.23 | | | $ | 26.43 | | | $ | 20.55 | |
Net investment loss | | | (0.13 | )1 | | | (0.28 | )1 | | | (0.17 | )1 | | | (0.10 | )1 | | | (0.20 | )1 | | | (0.19 | )1 |
Net realized and unrealized gains (losses) on investments | | | 1.20 | | | | 10.02 | | | | 5.12 | | | | (3.99 | ) | | | (1.00 | ) | | | 6.07 | |
| | | | | | | | | | | | | | | | | | | | | | | | |
Total from investment operations | | | 1.07 | | | | 9.74 | | | | 4.95 | | | | (4.09 | ) | | | (1.20 | ) | | | 5.88 | |
Distributions to shareholders from | | | | | | | | | | | | | | | | | | | | | | | | |
Net realized gains | | | (0.47 | ) | | | 0.00 | | | | 0.00 | | | | 0.00 | | | | 0.00 | | | | 0.00 | |
Net asset value, end of period | | $ | 36.43 | | | $ | 35.83 | | | $ | 26.09 | | | $ | 21.14 | | | $ | 25.23 | | | $ | 26.43 | |
Total return2 | | | 3.06 | % | | | 37.29 | % | | | 23.42 | % | | | (16.21 | )% | | | (4.54 | )% | | | 28.61 | % |
Ratios to average net assets (annualized) | | | | | | | | | | | | | | | | | | | | | | | | |
Gross expenses | | | 1.27 | % | | | 1.31 | % | | | 1.41 | % | | | 1.46 | % | | | 1.49 | % | | | 1.51 | % |
Net expenses | | | 1.27 | % | | | 1.31 | % | | | 1.40 | % | | | 1.40 | % | | | 1.44 | % | | | 1.47 | % |
Net investment loss | | | (0.72 | )% | | | (0.85 | )% | | | (0.71 | )% | | | (0.54 | )% | | | (0.73 | )% | | | (0.80 | )% |
Supplemental data | | | | | | | | | | | | | | | | | | | | | | | | |
Portfolio turnover rate | | | 23 | % | | | 54 | % | | | 72 | % | | | 88 | % | | | 122 | % | | | 117 | % |
Net assets, end of period (000’s omitted) | | | $2,165,039 | | | | $1,707,285 | | | | $941,660 | | | | $748,218 | | | | $958,160 | | | | $1,063,168 | |
| 1. | Calculated based upon average shares outstanding. |
| 2. | Returns for periods of less than one year are not annualized. |
The accompanying notes are an integral part of these financial statements.
| | | | | | |
| Notes to Financial Statements (Unaudited) | | Wells Fargo Advantage Growth Fund | | | 21 | |
1. ORGANIZATION
Wells Fargo Funds Trust (the “Trust”), a Delaware statutory trust organized on March 10, 1999, is an open-end management investment company registered under the Investment Company Act of 1940, as amended (the “1940 Act”). These financial statements report on Wells Fargo Advantage Growth Fund (the “Fund”) which is a diversified series of the Trust.
2. SIGNIFICANT ACCOUNTING POLICIES
The following significant accounting policies, which are consistently followed in the preparation of the financial statements of the Fund, are in conformity with U.S. generally accepted accounting principles which require management to make estimates and assumptions that affect the reported amounts of assets and liabilities, disclosure of contingent assets and liabilities at the date of the financial statements, and the reported amounts of revenues and expenses during the reporting period. Actual results could differ from those estimates.
Securities valuation
Investments in equity securities are valued each business day as of the close of regular trading on the New York Stock Exchange, which is usually 4:00 p.m. (Eastern Time). Securities which are traded on a national or foreign securities exchange are valued at the last reported sales price, except that securities listed on The Nasdaq Stock Market, Inc. (“Nasdaq”) are valued at the Nasdaq Official Closing Price (“NOCP”), and if no NOCP is available, then at the last reported sales price. If no sales price is shown on the Nasdaq, the bid price will be used. In the absence of any sale of securities listed on the Nasdaq, and in the case of other securities (including U.S. Government obligations, but excluding debt securities maturing in 60 days or less), the price will be deemed “stale” and the valuations will be determined in accordance with the Fund’s Fair Value Procedures.
Investments in open-end mutual funds and non-registered investment companies are generally valued at net asset value.
Investments which are not valued using any of the methods discussed above, are valued at their fair value, as determined by procedures established in good faith and approved by the Board of Trustees.
Security loans
The Fund may lend its securities from time to time in order to earn additional income in the form of fees or interest on securities received as collateral or the investment of any cash received as collateral. The Fund continues to receive interest or dividends on the securities loaned. The Fund receives collateral in the form of cash or securities with a value at least equal to the value of the securities on loan. The value of the loaned securities is determined at the close of each business day and any additional required collateral is delivered to the Fund on the next business day. In a securities lending transaction, the net asset value of the Fund will be affected by an increase or decrease in the value of the securities loaned and by an increase or decrease in the value of the instrument in which collateral is invested. The amount of securities lending activity undertaken by the Fund fluctuates from time to time. In the event of default or bankruptcy by the borrower, the Fund may be prevented from recovering the loaned securities or gaining access to the collateral or may experience delays or costs in doing so. In addition, the investment of any cash collateral received may lose all or part of its value. The Fund has the right under the lending agreement to recover the securities from the borrower on demand.
The Fund lends its securities through an unaffiliated securities lending agent. Cash collateral received in connection with its securities lending transactions is invested in Wells Fargo Securities Lending Cash Investments, LLC (the “Cash Collateral Fund”). The Cash Collateral Fund is exempt from registration under Section 3(c)(7) of the 1940 Act and is managed by Wells Fargo Funds Management LLC (“Funds Management”) and is sub-advised by Wells Capital Management Incorporated (“Wells Capital Management”). Funds Management receives an advisory fee starting at 0.05% and declining to 0.01% as the average daily net assets of the Cash Collateral Fund increase. All of the fees received by Funds Management are paid to Wells Capital Management for its services as sub-adviser. The Cash Collateral Fund seeks to provide a positive return compared to the daily Fed Funds Open rate by investing in high-quality, U.S. dollar-denominated short-term money market instruments. Cash Collateral Fund investments are fair valued based upon the amortized cost valuation technique. Income earned from investment in the Cash Collateral Fund is included in securities lending income on the Statement of Operations.
For Wells Fargo Advantage Funds that participated in securities lending activity prior to February 13, 2009, certain structured investment vehicles purchased in a joint account by the former securities lending agent defaulted or were impaired. Certain of the Wells Fargo Advantage Funds still hold ownership interest in these structured investment
| | | | |
| 22 | | Wells Fargo Advantage Growth Fund | | Notes to Financial Statements (Unaudited) |
vehicles, which have since been restructured as pass-through securities. If the Fund holds an ownership interest in such pass-through securities, information regarding this ownership interest can be found in the Portfolio of Investments under the category “Other”.
Security transactions and income recognition
Securities transactions are recorded on a trade date basis. Realized gains or losses are reported on the basis of identified cost of securities delivered.
Dividend income is recognized on the ex-dividend date.
Distributions to shareholders
Distributions to shareholders from net investment income and net realized gains, if any, are recorded on the ex-dividend date. Such distributions are determined in conformity with income tax regulations, which may differ from generally accepted accounting principles.
Federal and other taxes
The Fund intends to continue to qualify as a regulated investment company by distributing substantially all of its investment company taxable income and any net realized capital gains (after reduction for capital loss carryforwards) sufficient to relieve it from all, or substantially all, federal income taxes. Accordingly, no provision for federal income taxes was required.
The Fund’s income and federal excise tax returns and all financial records supporting those returns for the prior three fiscal years are subject to examination by the federal and Delaware revenue authorities.
Under the recently enacted Regulated Investment Company Modernization Act of 2010, the Fund is permitted to carry forward capital losses incurred in taxable years which began after December 22, 2010 for an unlimited period. However, any losses incurred are required to be utilized prior to the losses incurred in pre-enactment taxable years. As a result of this ordering rule, pre-enactment capital loss carryforwards may be more likely to expire unused. Additionally, post-enactment capital losses that are carried forward will retain their character as either short-term or long-term capital losses rather than being considered all short-term as under previous law.
Class allocations
The separate classes of shares offered by the Fund differ principally in applicable sales charges, distribution, shareholder servicing and administration fees. Shareholders of each class bear certain expenses that pertain to that particular class. All shareholders bear the common expenses of the Fund, earn income from the portfolio, and are allocated unrealized gains and losses pro rata based on the average daily net assets of each class, without distinction between share classes. Dividends are determined separately for each class based on income and expenses allocable to each class. Realized gains and losses are allocated to each class pro rata based upon the net assets of each class on the date realized. Differences in per share dividend rates generally result from the relative weightings of pro rata income and realized gain allocations and from differences in separate class expenses, including distribution, shareholder servicing and administration fees.
3. FAIR VALUATION MEASUREMENTS
Fair value measurements of investments are determined within a framework that has established a fair value hierarchy based upon the various data inputs utilized in determining the value of the Fund’s investments. The three-level hierarchy gives the highest priority to unadjusted quoted prices in active markets for identical assets or liabilities (Level 1) and the lowest priority to significant unobservable inputs (Level 3). The Fund’s investments are classified within the fair value hierarchy based on the lowest level of input that is significant to the fair value measurement. The inputs are summarized into three broad levels as follows:
| n | | Level 1 – quoted prices in active markets for identical securities |
| n | | Level 2 – other significant observable inputs (including quoted prices for similar securities, interest rates, prepayment speeds, credit risk, etc.) |
| n | | Level 3 – significant unobservable inputs (including the Fund’s own assumptions in determining the fair value of investments) |
| | | | | | |
| Notes to Financial Statements (Unaudited) | | Wells Fargo Advantage Growth Fund | | | 23 | |
The inputs or methodologies used for valuing securities are not necessarily an indication of the risk associated with investing in those securities.
As of January 31, 2012, the inputs used in valuing the Fund’s assets, which are carried at fair value, were as follows:
| | | | | | | | | | | | | | | | |
| Investments in Securities | | Quoted Prices (Level 1) | | | Significant Other
Observable Inputs (Level 2) | | | Significant Unobservable Inputs (Level 3) | | | Total | |
Equity securities | | | | | | | | | | | | | | | | |
Common stocks | | $ | 8,442,188,658 | | | $ | 0 | | | $ | 0 | | | $ | 8,442,188,658 | |
Investment companies | | | 152,888,943 | | | | 0 | | | | 0 | | | | 152,888,943 | |
| | | | |
Other | | | 0 | | | | 0 | | | | 4,059,496 | | | | 4,059,496 | |
| | | | |
Short-term investments | | | | | | | | | | | | | | | | |
Investment companies | | | 288,966,966 | | | | 1,136,035,898 | | | | 0 | | | | 1,425,002,864 | |
| | | $ | 8,884,044,567 | | | $ | 1,136,035,898 | | | $ | 4,059,496 | | | $ | 10,024,139,961 | |
Transfers in and transfers out are recognized at the end of the reporting period. For the six months ended January 31, 2012, the Fund did not have any significant transfers into/out of Level 1 and Level 2.
Further details on the major security types listed above can be found in the Portfolio of Investments.
The following is a reconciliation of assets in which significant unobservable inputs (Level 3) were used in determining fair value:
| | | | |
| | | Other | |
Balance as of July 31, 2011 | | $ | 5,757,741 | |
Accrued discounts (premiums) | | | 0 | |
Realized gains (losses) | | | 0 | |
Change in unrealized gains (losses) | | | (1,000,858 | ) |
Purchases | | | 0 | |
Sales | | | (697,387 | ) |
Transfers into Level 3 | | | 0 | |
Transfers out of Level 3 | | | 0 | |
Balance as of January 31, 2012 | | $ | 4,059,496 | |
Change in unrealized gains (losses) relating to securities still held at January 31, 2012 | | $ | (1,353,788 | ) |
4. TRANSACTIONS WITH AFFILIATES AND OTHER EXPENSES
Advisory fee
The Trust has entered into an advisory contract with Funds Management, an indirect wholly owned subsidiary of Wells Fargo & Company (“Wells Fargo”). The adviser is responsible for implementing investment policies and guidelines and for supervising the sub-adviser, who is responsible for day-to-day portfolio management of the Fund.
Pursuant to the contract, Funds Management is entitled to receive an annual advisory fee starting at 0.75% and declining to 0.60% as the average daily net assets of the Fund increase. For the six months ended January 31, 2012, the advisory fee was equivalent to an annual rate of 0.63% of the Fund’s average daily net assets.
Funds Management may retain the services of certain sub-advisers to provide daily portfolio management to the Fund. The fees related to sub-advisory services are borne directly by Funds Management and do not increase the overall fees paid by the Fund. Wells Capital Management, an affiliate of Funds Management, is the sub-adviser to the Fund and is entitled to receive a fee from Funds Management at an annual rate starting at 0.35% and declining to 0.15% as the average daily net assets of the Fund increase.
Administration and transfer agent fees
The Trust has entered into an administration agreement with Funds Management. Under this agreement, for providing administrative services, which includes paying fees and expenses for services provided by the transfer agent, sub-transfer agents, omnibus account servicers and record-keepers, Funds Management is entitled to receive from the Fund an annual
| | | | |
| 24 | | Wells Fargo Advantage Growth Fund | | Notes to Financial Statements (Unaudited) |
fund level administration fee starting at 0.05% and declining to 0.03% as the average daily net assets of the Fund increase and a class level administration fee which is calculated based on the average daily net assets of each class as follows:
| | | | |
| | | Class Level Administration Fee | |
Class A, Class C | | | 0.26 | % |
Administrator Class | | | 0.10 | |
Institutional Class | | | 0.08 | |
Investor Class | | | 0.33 | |
Funds Management has contractually waived and/or reimbursed advisory and administration fees to the extent necessary to maintain certain net operating expense ratios for the Fund. Waiver of fees and/or reimbursement of expenses by Funds Management were made first from fund level expenses on a proportionate basis and then from class specific expenses. Funds Management has committed through November 30, 2012 to waive fees and/or reimburse expenses to the extent necessary to cap the Fund’s expenses at 1.22% for Class A, 1.97% for Class C, 0.96% for Administrator Class, 0.75% for Institutional Class and 1.29% for Investor Class.
Distribution fees
The Trust has adopted a Distribution Plan for Class C shares of the Fund pursuant to Rule 12b-1 under the 1940 Act. Distribution fees are charged to Class C shares and paid to Wells Fargo Funds Distributor, LLC, the principal underwriter, at an annual rate of 0.75% of its average daily net assets.
For the six months ended January 31, 2012, Wells Fargo Funds Distributor, LLC received $576,685 from the sale of Class A shares, $25,129 and $32,114 in contingent deferred sales charges from redemptions of Class A and Class C shares, respectively.
Shareholder servicing fees
The Trust has entered into contracts with one or more shareholder servicing agents, whereby Class A, Class C, Administrator Class and Investor Class of the Fund is charged a fee at an annual rate of 0.25% of the average daily net assets of each respective class.
A portion of these total shareholder servicing fees were paid to affiliates of Wells Fargo.
5. INVESTMENT PORTFOLIO TRANSACTIONS
Purchases and sales of investments, excluding U.S. Government obligations (if any) and short-term securities (securities with maturities of one year or less at purchase date), for the six months ended January 31, 2012 were $4,501,528,385 and $1,463,590,731, respectively.
6. BANK BORROWINGS
The Trust (excluding the money market funds) and Wells Fargo Variable Trust are parties to a $150,000,000 revolving credit agreement with State Street Bank and Trust Company, whereby the Fund is permitted to use bank borrowings for temporary or emergency purposes, such as to fund shareholder redemption requests. Interest under the credit agreement is charged to the Fund based on a borrowing rate equal to the higher of the Federal Funds rate in effect on that day plus 1.25% or the overnight LIBOR rate in effect on that day plus 1.25%. In addition, an annual commitment fee equal to 0.10% of the unused balance is allocated to each participating fund. Prior to September 6, 2011, the revolving credit agreement was for $125,000,000 and the annual commitment fee was equal 0.125% of the unused balance. For the six months ended January 31, 2012, the Fund paid $2,753 in commitment fees.
For the six months ended January 31, 2012, there were no borrowings by the Fund under the agreement.
7. INDEMNIFICATION
Under the Trust’s organizational documents, the officers and directors are indemnified against certain liabilities that may arise out of performance of their duties to the Trust. Additionally, in the normal course of business, the Trust may enter into contracts with service providers that contain a variety of indemnification clauses. The Trust’s maximum exposure under these arrangements is dependent on future claims that may be made against the Fund and, therefore, cannot be estimated.
| | | | | | |
| Notes to Financial Statements (Unaudited) | | Wells Fargo Advantage Growth Fund | | | 25 | |
8. NEW ACCOUNTING PRONOUNCEMENTS
In May 2011, the Financial Accounting Standards Board (“FASB”) issued Accounting Standards Update (“ASU”) No. 2011-04 “Amendments to Achieve Common Fair Value Measurement and Disclosure Requirements in U.S. GAAP and IFRSs”. ASU No. 2011-04 amends FASB ASC Topic 820, Fair Value Measurements and Disclosures, to establish common requirements for measuring fair value and for disclosing information about fair value measurements in accordance with GAAP. The ASU is effective prospectively for interim and annual periods beginning after December 15, 2011. Management expects that adoption of the ASU will result in additional disclosures in the financial statements, as applicable.
In April 2011, FASB issued ASU No. 2011-03 “Reconsideration of Effective Control for Repurchase Agreements”. ASU No. 2011-03 amends FASB ASC Topic 860, Transfers and Servicing, specifically the criteria required to determine whether a repurchase agreement (repo) and similar agreements should be accounted for as sales of financial assets or secured borrowings with commitments. ASU No. 2011-03 changes the assessment of effective control by focusing on the transferor’s contractual rights and obligations and removing the criterion to assess its ability to exercise those rights or honor those obligations. This could result in changes to the way entities account for certain transactions including repurchase agreements, mortgage dollar rolls and reverse repurchase agreements. The ASU will become effective on a prospective basis for new transfers and modifications to existing transactions as of the beginning of the first interim or annual period beginning on or after December 15, 2011. Management has evaluated the impact of adopting the ASU and expects no significant changes.
| | | | |
| 26 | | Wells Fargo Advantage Growth Fund | | Other Information (Unaudited) |
PROXY VOTING INFORMATION
A description of the policies and procedures that the Fund uses to determine how to vote proxies relating to portfolio securities is available without charge, upon request, by calling 1-800-222-8222, visiting our Web site at wellsfargoadvantagefunds.com, or visiting the SEC Web site at sec.gov. Information regarding how the Fund voted proxies relating to portfolio securities during the most recent 12-month period ended June 30 is available without charge on the Fund’s Web site at wellsfargoadvantagefunds.com or by visiting the SEC Web site at sec.gov.
PORTFOLIO HOLDINGS INFORMATION
The complete portfolio holdings for the Fund are publicly available on the Fund’s Web site (wellsfargoadvantagefunds.com) on a monthly, 30-day or more delayed basis. In addition, top ten holdings information for the Fund is publicly available on the Fund’s Web site on a monthly, seven-day or more delayed basis. The Fund files its complete schedule of portfolio holdings with the SEC for the first and third quarters of each fiscal year on Form N-Q, which is available without charge by visiting the SEC Web site at sec.gov. In addition, the Fund’s Form N-Q may be reviewed and copied at the SEC’s Public Reference Room in Washington, DC, and at regional offices in New York City, at 233 Broadway, and in Chicago, at 175 West Jackson Boulevard, Suite 900. Information about the Public Reference Room may be obtained by calling 1-800-SEC-0330.
| | | | | | |
| Other Information (Unaudited) | | Wells Fargo Advantage Growth Fund | | | 27 | |
BOARD OF TRUSTEES
The following table provides basic information about the Board of Trustees (the “Trustees”) of the Trust and Officers of the Trust. This table should be read in conjunction with the Prospectus and the Statement of Additional Information1 of the Fund. Each of the Trustees and Officers listed below acts in identical capacities for the Wells Fargo Advantage family of funds, which consists of 137 funds comprising the Wells Fargo Funds Trust, Wells Fargo Variable Trust, Wells Fargo Master Trust and four closed-end funds (collectively the “Fund Complex”). All of the Trustees are also Members of the Audit and Governance Committees of each Trust in the Fund Complex. The mailing address of each Trustee and Officer is 525 Market Street, 12th Floor, San Francisco, CA 94105. Each Trustee and Officer serves an indefinite term, however, each Trustee serves such term until reaching the mandatory retirement age established by the Trustees.
Independent Trustees
| | | | | | |
Name and Year of Birth | | Position Held and Length of Service | | Principal Occupations During Past Five Years | | Other Directorships During
Past Five Years |
Peter G. Gordon
(Born 1942) | | Trustee, since 1998; Chairman, since 2005 (Lead Trustee since 2001) | | Co-Founder, Retired Chairman, President and CEO of Crystal Geyser Water Company. Trustee Emeritus, Colby College | | Asset Allocation Trust |
Isaiah Harris, Jr.
(Born 1952) | | Trustee, since 2009 | | Retired. Prior thereto, President and CEO of BellSouth Advertising and Publishing Corp. from 2005 to 2007, President and CEO of BellSouth Enterprises from 2004 to 2005 and President of BellSouth Consumer Services from 2000 to 2003. Emeritus member of the Iowa State University Foundation Board of Governors. Emeritus Member of the Advisory Board of Iowa State University School of Business. Mr. Harris is a certified public accountant. | | CIGNA Corporation; Deluxe Corporation; Asset Allocation Trust |
Judith M. Johnson
(Born 1949) | | Trustee, since 2008 | | Retired. Prior thereto, Chief Executive Officer and Chief Investment Officer of Minneapolis Employees Retirement Fund from 1996 to 2008. Ms. Johnson is an attorney, certified public accountant and a certified managerial accountant. | | Asset Allocation Trust |
Leroy Keith, Jr.
(Born 1939) | | Trustee, since 2010 | | Chairman, Bloc Global Services (development and construction). Trustee of the Evergreen Funds from 1983 to 2010. Former Managing Director, Almanac Capital Management (commodities firm), former Partner, Stonington Partners, Inc. (private equity fund), former Director, Obagi Medical Products Co. and former Director, Lincoln Educational Services. | | Trustee, Virtus Fund Complex (consisting of 40 portfolios as of 12/31/11); Asset Allocation Trust |
David F. Larcker
(Born 1950) | | Trustee, since 2009 | | James Irvin Miller Professor of Accounting at the Graduate School of Business, Stanford University, Director of Corporate Governance Research Program and Senior Faculty of The Rock Center for Corporate Governance since 2006. From 2005 to 2008, Professor of Accounting at the Graduate School of Business, Stanford University. Prior thereto, Ernst & Young Professor of Accounting at The Wharton School, University of Pennsylvania from 1985 to 2005. | | Asset Allocation Trust |
Olivia S. Mitchell
(Born 1953) | | Trustee, since 2006 | | International Foundation of Employee Benefit Plans Professor, Wharton School of the University of Pennsylvania since 1993. Director of Wharton’s Pension Research Council and Boettner Center on Pensions & Retirement Research, and Research Associate at the National Bureau of Economic Research. Previously, Cornell University Professor from 1978 to 1993. | | Asset Allocation Trust |
| | | | |
| 28 | | Wells Fargo Advantage Growth Fund | | Other Information (Unaudited) |
| | | | | | |
Name and Year of Birth | | Position Held and Length of Service | | Principal Occupations During Past Five Years | | Other Directorships During
Past Five Years |
Timothy J. Penny
(Born 1951) | | Trustee, since 1996 | | President and CEO of Southern Minnesota Initiative Foundation, a non-profit organization, since 2007 and Senior Fellow at the Humphrey Institute Policy Forum at the University of Minnesota since 1995. Member of the Board of Trustees of NorthStar Education Finance, Inc., a non-profit organization, since 2007. | | Asset Allocation Trust |
Michael S. Scofield
(Born 1943) | | Trustee, since 2010 | | Served on the Investment Company Institute’s Board of Governors and Executive Committee from 2008-2011 as well the Governing Council of the Independent Directors Council from 2006-2011 and the Independent Directors Council Executive Committee from 2008-2011. Chairman of the IDC from 2008-2010. Institutional Investor (Fund Directions) Trustee of Year in 2007. Trustee of the Evergreen Funds (and its predecessors) from 1984 to 2010. Chairman of the Evergreen Funds from 2000-2010. Former Trustee of the Mentor Funds. Retired Attorney, Law Offices of Michael S. Scofield and former Director and Chairman, Branded Media Corporation (multi-media branding company). | | Asset Allocation Trust |
Donald C. Willeke
(Born 1940) | | Trustee, since 1996 | | Principal of the law firm of Willeke & Daniels. General Counsel of the Minneapolis Employees Retirement Fund from 1984 until its consolidation into the Minnesota Public Employees Retirement Association on June 30, 2010. Director and Vice Chair of The Free Trust (non-profit corporation). Director of the American Chestnut Foundation (non-profit corporation). | | Asset Allocation Trust |
Officers
| | | | | | |
Name and Year of Birth | | Position Held and
Length of Service | | Principal Occupations During Past Five Years | | |
Karla M. Rabusch
(Born 1959) | | President, since 2003 | | Executive Vice President of Wells Fargo Bank, N.A. and President of Wells Fargo Funds Management, LLC since 2003. Senior Vice President and Chief Administrative Officer of Wells Fargo Funds Management, LLC from 2001 to 2003. | | |
C. David Messman
(Born 1960) | | Secretary, since 2000; Chief Legal Counsel, since 2003 | | Senior Vice President and Secretary of Wells Fargo Funds Management, LLC since 2001. Vice President and Managing Senior Counsel of Wells Fargo Bank, N.A. since 1996. | | |
Kasey Phillips
(Born 1970) | | Treasurer, since 2009 | | Senior Vice President of Wells Fargo Funds Management, LLC since 2009. Senior Vice President of Evergreen Investment Management Company, LLC from 2006 to 2010. Treasurer of the Evergreen Funds from 2005 to 2010. | | |
David Berardi
(Born 1975) | | Assistant Treasurer, since 2009 | | Vice President of Wells Fargo Funds Management, LLC since 2009. Vice President of Evergreen Investment Management Company, LLC from 2008 to 2010. Assistant Vice President of Evergreen Investment Services, Inc. from 2004 to 2008. Manager of Fund Reporting and Control for Evergreen Investment Management Company, LLC from 2004 to 2010. | | |
Jeremy DePalma
(Born 1974) | | Assistant Treasurer, since 2009 | | Senior Vice President of Wells Fargo Funds Management, LLC since 2009. Senior Vice President of Evergreen Investment Management Company, LLC from 2008 to 2010. Vice President, Evergreen Investment Services, Inc. from 2004 to 2007. Head of the Fund Reporting and Control Team within Fund Administration from 2005 to 2010. | | |
Debra Ann Early
(Born 1964) | | Chief Compliance Officer, since 2007 | | Chief Compliance Officer of Wells Fargo Funds Management, LLC since 2007. Chief Compliance Officer of Parnassus Investments from 2005 to 2007. Chief Financial Officer of Parnassus Investments from 2004 to 2007 and Senior Audit Manager of PricewaterhouseCoopers LLP from 1998 to 2004. | | |
| 1. | The Statement of Additional Information includes additional information about the Trustees and is available, without charge, upon request, by calling 1-800-222-8222 or by visiting the Web site at wellsfargoadvantagefunds.com. |
| | | | | | |
| List of Abbreviations | | Wells Fargo Advantage Growth Fund | | | 29 | |
The following is a list of common abbreviations for terms and entities which may have appeared in this report.
| ACB | — Agricultural Credit Bank |
| ADR | — American Depository Receipt |
| ADS | — American Depository Shares |
| AGC-ICC | — Assured Guaranty Corporation - Insured Custody Certificates |
| AGM | — Assured Guaranty Municipal |
| AMBAC | — American Municipal Bond Assurance Corporation |
| AMT | — Alternative Minimum Tax |
| BAN | — Bond Anticipation Notes |
| BHAC | — Berkshire Hathaway Assurance Corporation |
| CAB | — Capital Appreciation Bond |
| CCAB | — Convertible Capital Appreciation Bond |
| CDA | — Community Development Authority |
| CDO | — Collateralized Debt Obligation |
| COP | — Certificate of Participation |
| DRIVER | — Derivative Inverse Tax-Exempt Receipts |
| DW&P | — Department of Water & Power |
| DWR | — Department of Water Resources |
| ECFA | — Educational & Cultural Facilities Authority |
| EDA | — Economic Development Authority |
| EDFA | — Economic Development Finance Authority |
| ETF | — Exchange-Traded Fund |
| FFCB | — Federal Farm Credit Bank |
| FGIC | — Financial Guaranty Insurance Corporation |
| FHA | — Federal Housing Authority |
| FHLB | — Federal Home Loan Bank |
| FHLMC | — Federal Home Loan Mortgage Corporation |
| FNMA | — Federal National Mortgage Association |
| GDR | — Global Depository Receipt |
| GNMA | — Government National Mortgage Association |
| HCFR | — Healthcare Facilities Revenue |
| HEFA | — Health & Educational Facilities Authority |
| HEFAR | — Higher Education Facilities Authority Revenue |
| HFA | — Housing Finance Authority |
| HFFA | — Health Facilities Financing Authority |
| IBC | — Insured Bond Certificate |
| IDA | — Industrial Development Authority |
| IDAG | — Industrial Development Agency |
| IDR | — Industrial Development Revenue |
| KRW | — Republic of Korea Won |
| LIBOR | — London Interbank Offered Rate |
| LLC | — Limited Liability Company |
| LLP | — Limited Liability Partnership |
| MBIA | — Municipal Bond Insurance Association |
| MFHR | — Multi-Family Housing Revenue |
| MSTR | — Municipal Securities Trust Receipts |
| MUD | — Municipal Utility District |
| NATL-RE | — National Public Finance Guarantee Corporation |
| PCFA | — Pollution Control Finance Authority |
| PCR | — Pollution Control Revenue |
| PFA | — Public Finance Authority |
| PFFA | — Public Facilities Financing Authority |
| PFOTER | — Puttable Floating Option Tax-Exempt Receipts |
| plc | — Public Limited Company |
| PUTTER | — Puttable Tax-Exempt Receipts |
| R&D | — Research & Development |
| RDA | — Redevelopment Authority |
| RDFA | — Redevelopment Finance Authority |
| REIT | — Real Estate Investment Trust |
| ROC | — Reset Option Certificates |
| SAVRS | — Select Auction Variable Rate Securities |
| SBA | — Small Business Authority |
| SFHR | — Single Family Housing Revenue |
| SFMR | — Single Family Mortgage Revenue |
| SPDR | — Standard & Poor’s Depositary Receipts |
| TAN | — Tax Anticipation Notes |
| TIPS | — Treasury Inflation-Protected Securities |
| TRAN | — Tax Revenue Anticipation Notes |
| TCR | — Transferable Custody Receipts |
| TTFA | — Transportation Trust Fund Authority |
| TVA | — Tennessee Valley Authority |
| XLCA | — XL Capital Assurance |
This page is intentionally left blank.


FOR MORE INFORMATION
More information about Wells Fargo Advantage Funds is available free upon request. To obtain literature, please write, e-mail, visit the Fund’s Web site, or call:
Wells Fargo Advantage Funds
P.O. Box 8266
Boston, MA 02266-8266
E-mail: wfaf@wellsfargo.com
Web site: wellsfargoadvantagefunds.com
Individual investors: 1-800-222-8222
Retail investment professionals: 1-888-877-9275
Institutional investment professionals: 1-866-765-0778
This report and the financial statements contained herein are submitted for the general information of the shareholders of Wells Fargo Advantage Funds. If this report is used for promotional purposes, distribution of the report must be accompanied or preceded by a current prospectus. For a prospectus containing more complete information, including charges and expenses, call 1-800-222-8222 or visit the Fund’s Web site at wellsfargoadvantagefunds.com. Please consider the investment objectives, risks, charges, and expenses of the investment carefully before investing. This and other information about Wells Fargo Advantage Funds can be found in the current prospectus. Read the prospectus carefully before you invest or send money.
Wells Fargo Funds Management, LLC, a wholly owned subsidiary of Wells Fargo & Company, provides investment advisory and administrative services for Wells Fargo Advantage Funds. Other affiliates of Wells Fargo & Company provide subadvisory and other services for the Funds. The Funds are distributed by Wells Fargo Funds Distributor, LLC, Member FINRA/SIPC, an affiliate of Wells Fargo & Company.
NOT FDIC INSURED ¡ NO BANK GUARANTEE ¡ MAY LOSE VALUE
© 2012 Wells Fargo Funds Management, LLC. All rights reserved.
| | |
 | | 207946 03-12 SA206/SAR206 1-12 |

Wells Fargo Advantage Intrinsic Value Fund

Semi-Annual Report
January 31, 2012

Reduce clutter. Save trees.
Sign up for electronic delivery of prospectuses and shareholder reports at wellsfargo.com/advantagedelivery
Contents
The views expressed and any forward-looking statements are as of January 31, 2012, unless otherwise noted, and are those of the Fund managers and/or Wells Fargo Funds Management, LLC. Discussions of individual securities, or the markets generally, or any Wells Fargo Advantage Fund are not intended as individual recommendations. Future events or results may vary significantly from those expressed in any forward-looking statements; the views expressed are subject to change at any time in response to changing circumstances in the market. Wells Fargo Funds Management, LLC, disclaims any obligation to publicly update or revise any views expressed or forward-looking statements.
NOT FDIC INSURED ¡ NO BANK GUARANTEE ¡ MAY LOSE VALUE

WELLS FARGO INVESTMENT HISTORY
| | |
| |
| 1932 | | Keystone creates one of the first mutual fund families. |
| |
| 1971 | | Wells Fargo & Company introduces one of the first institutional index funds. |
| |
| 1978 | | Wells Fargo applies Markowitz and Sharpe’s research on Modern Portfolio Theory to introduce one of the industry’s first Tactical Asset Allocation (TAA) models in institutional separately managed accounts. |
| |
| 1984 | | Wells Fargo Stagecoach Funds launches its first asset allocation fund. |
| |
| 1989 | | The Tactical Asset Allocation (TAA) Model is first applied to Wells Fargo’s asset allocation mutual funds. |
| |
| 1994 | | Wells Fargo introduces the LifePath Funds, one of the first suites of target date funds (now the Wells Fargo Advantage Dow Jones Target Date FundsSM). |
| |
| 1996 | | Evergreen Investments and Keystone Funds merge. |
| |
| 1997 | | Wells Fargo launches Wells Fargo Advantage WealthBuilder PortfoliosSM, a fund-of-funds suite of products that includes the use of quantitative models to shift assets among investment styles. |
| |
| 1999 | | Norwest Advantage Funds and Stagecoach Funds are reorganized into Wells Fargo Funds after the merger of Norwest and Wells Fargo. |
| |
| 2002 | | Evergreen Retail and Evergreen Institutional companies form the umbrella asset management company, Evergreen Investments. |
| |
| 2005 | | The integration of Strong Funds with Wells Fargo Funds creates Wells Fargo Advantage Funds, resulting in one of the top 20 mutual fund companies in the United States. |
| |
| 2006 | | Wells Fargo Advantage Funds relaunches the target date product line as Wells Fargo Advantage Dow Jones Target Date Funds. |
| |
| 2010 | | The mergers and reorganizations of Evergreen and Wells Fargo Advantage mutual funds are completed, unifying the families under the brand of Wells Fargo Advantage Funds. |
Wells Fargo Advantage Funds®
Wells Fargo Advantage Funds skillfully guides institutions, financial advisors, and individuals through the investment terrain to help them reach their financial objectives. Everything we do on behalf of investors is backed by our unique combination of qualifications.
Strength
Our organization is built on the standards of integrity and service established by our parent company—Wells Fargo & Company—more than 150 years ago. And, because we’re part of a highly diversified financial enterprise, we offer the depth of resources to help investors succeed.
Expertise
Our multi-boutique model offers investors access to the independent thinking of premier investment managers that have been chosen for their time-tested strategies. While each team specializes in a specific investment strategy, collectively they provide investors a wide choice of distinct investment styles. Our dedication to investment excellence doesn’t end with our expertise in manager selection—risk management, analysis, and rigorous ongoing review seek to ensure each manager’s investment process remains consistent.
Partnership
Our collaborative approach is built around understanding the needs and goals of our clients. By adhering to core principles of sound judgment and steady guidance, we support you through every stage of the investment decision process.
Carefully consider a fund’s investment objectives, risks, charges, and expenses before investing. For a current prospectus and, if available, a summary prospectus, containing this and other information, visit wellsfargoadvantagefunds.com. Read it carefully before investing.
Wells Fargo Funds Management, LLC, a wholly owned subsidiary of Wells Fargo & Company, provides investment advisory and administrative services for Wells Fargo Advantage Funds®. Other affiliates of Wells Fargo & Company provide subadvisory and other services for the Funds. The Funds are distributed by Wells Fargo Funds Distributor, LLC, Member FINRA/SIPC, an affiliate of Wells Fargo & Company.
“Dow Jones®” and “Dow Jones Target Date IndexesSM” are service marks of Dow Jones Trademark Holdings, LLC (“Dow Jones”), have been licensed to CME Group Index Services LLC (“CME Indexes”) and have been sublicensed for use for certain purposes by Global Index Advisors, Inc, and Wells Fargo Funds Management, LLC. The Wells Fargo Advantage Dow Jones Target Date FundsSM based on the Dow Jones Target Date IndexesSM, are not sponsored, endorsed, sold or promoted by Dow Jones, CME Indexes or their respective affiliates and none of them makes any representation regarding the advisability of investing in such product(s).
NOT FDIC INSURED ¡ NO BANK GUARANTEE ¡ MAY LOSE VALUE
Not part of the semi-annual report.
Wells Fargo Advantage Funds offers more than 110 mutual funds across a wide range of asset classes, representing over $217 billion in assets under management, as of January 31, 2012.
| | | | |
| Equity Funds | | | | |
Asia Pacific Fund | | Equity Value Fund | | Precious Metals Fund |
C&B Large Cap Value Fund | | Global Opportunities Fund | | Premier Large Company Growth Fund |
C&B Mid Cap Value Fund | | Growth Fund | | Small Cap Opportunities Fund |
Capital Growth Fund | | Index Fund | | Small Cap Value Fund |
Common Stock Fund | | International Equity Fund | | Small Company Growth Fund |
Disciplined U.S. Core Fund | | International Value Fund | | Small Company Value Fund |
Discovery Fund† | | Intrinsic Small Cap Value Fund | | Small/Mid Cap Core Fund |
Diversified Equity Fund | | Intrinsic Value Fund | | Small/Mid Cap Value Fund |
Diversified International Fund | | Intrinsic World Equity Fund | | Special Mid Cap Value Fund |
Diversified Small Cap Fund | | Large Cap Core Fund | | Special Small Cap Value Fund |
Emerging Growth Fund | | Large Cap Growth Fund | | Specialized Technology Fund |
Emerging Markets Equity Fund | | Large Company Value Fund | | Strategic Large Cap Growth Fund |
Endeavor Select Fund† | | Omega Growth Fund | | Traditional Small Cap Growth Fund |
Enterprise Fund† | | Opportunity Fund† | | Utility and Telecommunications Fund |
| Bond Funds | | | | |
Adjustable Rate Government Fund | | Inflation-Protected Bond Fund | | Short-Term Bond Fund |
California Limited-Term Tax-Free Fund | | Intermediate Tax/AMT-Free Fund | | Short-Term High Yield Bond Fund |
California Tax-Free Fund | | International Bond Fund | | Short-Term Municipal Bond Fund |
Colorado Tax-Free Fund | | Minnesota Tax-Free Fund | | Strategic Municipal Bond Fund |
Government Securities Fund | | Municipal Bond Fund | | Total Return Bond Fund |
High Income Fund | | North Carolina Tax-Free Fund | | Ultra Short-Term Income Fund |
High Yield Bond Fund | | Pennsylvania Tax-Free Fund | | Ultra Short-Term Municipal Income Fund |
Income Plus Fund | | Short Duration Government Bond Fund | | Wisconsin Tax-Free Fund |
| Asset Allocation Funds | | | | |
Absolute Return Fund | | WealthBuilder Equity Portfolio† | | Target 2020 Fund† |
Asset Allocation Fund | | WealthBuilder Growth Allocation Portfolio† | | Target 2025 Fund† |
Conservative Allocation Fund | | WealthBuilder Growth Balanced Portfolio† | | Target 2030 Fund† |
Diversified Capital Builder Fund | | WealthBuilder Moderate Balanced Portfolio† | | Target 2035 Fund† |
Diversified Income Builder Fund | | WealthBuilder Tactical Equity Portfolio† | | Target 2040 Fund† |
Growth Balanced Fund | | Target Today Fund† | | Target 2045 Fund† |
Index Asset Allocation Fund | | Target 2010 Fund† | | Target 2050 Fund† |
Moderate Balanced Fund | | Target 2015 Fund† | | Target 2055 Fund† |
WealthBuilder Conservative Allocation Portfolio† | | | | |
| Money Market Funds | | | | |
100% Treasury Money Market Fund | | Heritage Money Market Fund† | | National Tax-Free Money Market Fund |
California Municipal Money Market Fund | | Money Market Fund | | Prime Investment Money Market Fund |
Cash Investment Money Market Fund | | Municipal Cash Management Money Market Fund | | Treasury Plus Money Market Fund |
Government Money Market Fund | | Municipal Money Market Fund | | |
| Variable Trust Funds1 | | | | |
VT Discovery Fund† | | VT Intrinsic Value Fund | | VT Small Cap Growth Fund |
VT Index Asset Allocation Fund | | VT Omega Growth Fund | | VT Small Cap Value Fund |
VT International Equity Fund | | VT Opportunity Fund† | | VT Total Return Bond Fund |
An investment in a money market fund is not insured or guaranteed by the Federal Deposit Insurance Corporation or any other government agency. Although the Wells Fargo Advantage Money Market Funds seek to preserve the value of your investment at $1.00 per share, it is possible to lose money by investing in a money market fund.
| 1. | The Variable Trust Funds are generally available only through insurance company variable contracts. |
| † | In this report, the Wells Fargo Advantage Discovery FundSM, Wells Fargo Advantage Endeavor Select FundSM, Wells Fargo Advantage Enterprise FundSM, Wells Fargo Advantage Opportunity FundSM, Wells Fargo Advantage WealthBuilder Conservative Allocation PortfolioSM, Wells Fargo Advantage WealthBuilder Equity PortfolioSM, Wells Fargo Advantage WealthBuilder Growth Allocation PortfolioSM, Wells Fargo Advantage WealthBuilder Growth Balanced PortfolioSM, Wells Fargo Advantage WealthBuilder Moderate Balanced PortfolioSM, Wells Fargo Advantage WealthBuilder Tactical Equity PortfolioSM, Wells Fargo Advantage Dow Jones Target Today FundSM, Wells Fargo Advantage Dow Jones Target 2010 FundSM, Wells Fargo Advantage Dow Jones Target 2015 FundSM, Wells Fargo Advantage Dow Jones Target 2020 FundSM, Wells Fargo Advantage Dow Jones Target 2025 FundSM, Wells Fargo Advantage Dow Jones Target 2030 FundSM, Wells Fargo Advantage Dow Jones Target 2035 FundSM, Wells Fargo Advantage Dow Jones Target 2040 FundSM, Wells Fargo Advantage Dow Jones Target 2045 FundSM, Wells Fargo Advantage Dow Jones Target 2050 FundSM, Wells Fargo Advantage Dow Jones Target 2055 FundSM, Wells Fargo Advantage Heritage Money Market FundSM, Wells Fargo Advantage VT Discovery FundSM, and Wells Fargo Advantage VT Opportunity FundSM are referred to as the Discovery Fund, Endeavor Select Fund, Enterprise Fund, Opportunity Fund, WealthBuilder Conservative Allocation Portfolio, WealthBuilder Equity Portfolio, WealthBuilder Growth Allocation Portfolio, WealthBuilder Growth Balanced Portfolio, WealthBuilder Moderate Balanced Portfolio, WealthBuilder Tactical Equity Portfolio, Target Today Fund, Target 2010 Fund, Target 2015 Fund, Target 2020 Fund, Target 2025 Fund, Target 2030 Fund, Target 2035 Fund, Target 2040 Fund, Target 2045 Fund, Target 2050 Fund, Target 2055 Fund, Heritage Money Market Fund, VT Discovery Fund, and VT Opportunity Fund, respectively. |
Not part of the semi-annual report.
| | | | |
| 2 | | Wells Fargo Advantage Intrinsic Value Fund | | Letter to Shareholders |

Karla M. Rabusch,
President
Wells Fargo Advantage Funds
The period was marked by increased confidence that the U.S. economy was staging a fragile recovery, offset by continued concerns about the possible effect on the global economy of the ongoing European sovereign debt crisis—which began in Greece and later spread to the larger economies of Italy and Spain.
The slow-motion debt crisis in the eurozone was a major headwind to both domestic and global stock market indexes.
Dear Valued Shareholder:
We’re pleased to offer you this semi-annual report for the Wells Fargo Advantage Intrinsic Value Fund for the six-month period that ended January 31, 2012. The period was marked by increased confidence that the U.S. economy was staging a fragile recovery, offset by continued concerns about the possible effect on the global economy of the ongoing European sovereign debt crisis—which began in Greece and later spread to the larger economies of Italy and Spain. Most U.S. stock indexes posted gains for the period, even if only modest ones.
Worries gave way to guarded optimism for the U.S. economy.
The period began with worries that the U.S. economy was returning to recession. Revised figures for gross domestic product (GDP) indicated that the U.S. economy grew by an annualized rate of only 0.8% in the first half of 2011. Moreover, although the July 2011 Institute for Supply Management (ISM) manufacturing survey suggested that factories continued to expand, the rate of expansion was lower than in previous months. The prolonged debate over whether and how to raise the U.S. debt ceiling—which only ended on July 31, 2011—also depressed market sentiment by highlighting the country’s political divisions.
The stock market remained volatile throughout September. By late October, however, stronger economic data led to greater optimism and higher stock prices. Revised real GDP growth came in at 1.8% in the third quarter of 2011 and 2.8% in the fourth quarter, suggesting that the recovery was on firmer footing. Economic growth was not evenly distributed, though, as December 2011 retail same-store sales generally showed stronger growth for retailers targeting affluent customers than for those targeting the broad middle class. The reported unemployment rate also showed some signs of improvement, falling from 9.1% in August 2011 to 8.3% in January 2012. However, this decline in the unemployment rate was accompanied by an increase in the number of Americans not in the labor force, raising concerns about the economy’s ability to generate jobs.
The eurozone had continued trouble.
The slow-motion debt crisis in the eurozone was a major headwind to both domestic and global stock market indexes. The worsening debt and deficit numbers for Greece in late 2011 and early 2012 cast doubt on the country’s ability to service its debt under the plan put in place by the European Union and the International Monetary Fund and put the ongoing drama of the European sovereign debt crisis back on center stage. Investors became increasingly concerned that Greece would default on its debt, a scenario that only seemed more likely as many Greeks rioted in response to greater budgetary austerity and the discussion moved from whether private investors would take a loss on their Greek debt to how big the loss would be. Because many eurozone banks owned Greek debt and many U.S. banks had financial ties to eurozone banks, investors worried about the effect of such an event on the financial system and the global economy.
Even as the situation in Greece deteriorated, eurozone GDP numbers supported the case for a modest recovery in the global economy. Reported GDP growth for the 17 countries that comprise the eurozone was modest, rising 0.2% in the third
| | | | | | |
| Letter to Shareholders | | Wells Fargo Advantage Intrinsic Value Fund | | | 3 | |
quarter compared to the second quarter, and by 0.2% in the fourth quarter compared to the third quarter. However, the eurozone average concealed a wide variation between economies, with Germany’s growing by 0.5% in the third quarter of 2011 even as Greece’s GDP contracted.
Central banks continued to provide stimulus.
Throughout the reporting period, the Federal Open Market Committee (FOMC) kept its key interest rates effectively at zero in order to support the economy and financial system. Moreover, in response to extreme market volatility and signs of a weakening economy, in its August 2011 policy statement, the Federal Reserve (Fed) announced it would keep interest rates “exceptionally low” until at least mid-2013 as a way to support the economy. Market participants interpreted the Fed’s statement to mean that the central bankers believed the economy would remain weak over the next two years. However, the Fed also said that it was considering a “range of policy tools available to promote a stronger economic recovery” and “is prepared to employ these tools as appropriate.”
At the beginning of the period, the European Central Bank (ECB) had a key rate of 1.50% but lowered it to 1.25% in November 2011 and then to 1.00% in December 2011 in an attempt to support the sluggish eurozone recovery. To support the banking system, in late 2011, the ECB initiated a long-term refinancing operation (LTRO) in which it supplied three-year loans to banks against a wide range of collateral. The operation basically provided a near-unlimited amount of liquidity to banks, easing some investor concerns about the effect of an increasingly probable Greek default.
We use time-tested investment strategies, even as many variables are at work in the market.
Experience tells us that strict adherence to time-tested investment strategies has its rewards. As a whole, Wells Fargo Advantage Funds represents investments across a range of asset classes and investment styles, giving you an opportunity to create a diversified investment portfolio. While diversification may not prevent losses in a downturn, it does provide you with one way of managing risk.
Thank you for choosing to invest with Wells Fargo Advantage Funds. We appreciate your confidence in us and remain committed to helping you meet your financial needs. For current information about your fund investments, contact your investment professional, visit our website at wellsfargoadvantagefunds.com, or call us directly at 1-800-222-8222. We are available 24 hours a day, 7 days a week.
Sincerely,

Karla M. Rabusch
President
Wells Fargo Advantage Funds
| | | | |
| 4 | | Wells Fargo Advantage Intrinsic Value Fund | | Letter to Shareholders |
Notice to Shareholders
The Board of Trustees for Wells Fargo Advantage Funds has unanimously approved the following modifications to certain net asset value (NAV) waiver privileges and commission schedules:
| | n | | Effective May 1, 2012, automatic investment plan (AIP) purchases and proceeds received from systematic withdrawals will no longer qualify for NAV repurchase privileges. | |
| | n | | Effective May 1, 2012, discretionary rights to waive the upfront commission for Class C and “jumbo” Class A share purchases will no longer be granted to broker/dealers. However, we will continue to waive the Class C shares contingent deferred sales charge for redemptions by employer-sponsored retirement plans where the dealer of record waived its commission at the time of purchase. | |
| | n | | Effective July 31, 2012, NAV purchase privileges for former Evergreen Class IS and Class R shareholders are being modified to remove the ability to purchase Class A shares at NAV unless those shares are held directly with the Fund on or after July 31, 2012. | |
Please contact your investment professional or call us directly at 1-800-222-8222 if you have any questions on this Notice to Shareholders.
| | | | | | |
| Performance Highlights (Unaudited) | | Wells Fargo Advantage Intrinsic Value Fund | | | 5 | |
INVESTMENT OBJECTIVE
The Fund seeks long-term capital appreciation.
ADVISER
Wells Fargo Funds Management, LLC
SUB-ADVISER
Metropolitan West Capital Management, LLC
PORTFOLIO MANAGERS
Gary Lisenbee
Jeffrey Peck
David Graham1
FUND INCEPTION
August 1, 2006
| | | | |
TEN LARGEST EQUITY HOLDINGS2
(AS OF JANUARY 31, 2012) | |
Apple Incorporated | | | 3.25% | |
Home Depot Incorporated | | | 3.10% | |
International Business Machines Corporation | | | 2.93% | |
Hess Corporation | | | 2.91% | |
EMC Corporation | | | 2.90% | |
Diageo plc | | | 2.85% | |
The Hershey Company | | | 2.83% | |
Nordstrom Incorporated | | | 2.82% | |
Intuit Incorporated | | | 2.81% | |
Abbot Laboratories | | | 2.73% | |
| | |
SECTOR DISTRIBUTION3
(AS OF JANUARY 31, 2012) |
|
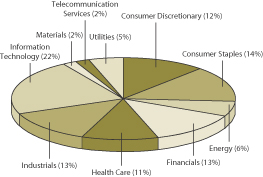 |
| 1. | Effective March 30, 2012, David Graham retired as a Portfolio Manager of the Fund. Gary Lisenbee and Jeffrey Peck will continue to manage the Fund. |
| 2. | The ten largest equity holdings are calculated based on the value of the securities divided by total net assets of the Fund. Holdings are subject to change and may have changed since the date specified. |
| 3. | Sector distribution is subject to change and is calculated based on the total long-term investments of the Fund. |
| | | | |
| 6 | | Wells Fargo Advantage Intrinsic Value Fund | | Performance Highlights (Unaudited) |
AVERAGE ANNUAL TOTAL RETURN4 (%) (AS OF JANUARY 31, 2012)
| | | | | | | | | | | | | | | | | | | | | | | | | | | | | | | | | | | | | | | | | | | | |
| | | | | | Including Sales Charge | | | Excluding Sales Charge | | | Expense Ratios5 | |
| | | Inception Date | | | 6 Months* | | | 1 Year | | | 5 Year | | | Life of
Fund | | | 6 Months* | | | 1 Year | | | 5 Year | | | Life of
Fund | | | Gross | | | Net6 | |
Class A (EIVAX) | | | 08/01/2006 | | | | (7.46 | ) | | | (5.99 | ) | | | 0.47 | | | | 2.46 | | | | (1.82 | ) | | | (0.26 | ) | | | 1.67 | | | | 3.57 | | | | 1.24% | | | | 1.18% | |
Class B (EIVBX)** | | | 08/01/2006 | | | | (6.44 | ) | | | (5.36 | ) | | | 0.56 | | | | 2.67 | | | | (2.15 | ) | | | (1.01 | ) | | | 0.90 | | | | 2.83 | | | | 1.99% | | | | 1.93% | |
Class C (EIVCX) | | | 08/01/2006 | | | | (3.11 | ) | | | (1.98 | ) | | | 0.90 | | | | 2.83 | | | | (2.11 | ) | | | (0.98 | ) | | | 0.90 | | | | 2.83 | | | | 1.99% | | | | 1.93% | |
Administrator Class (EIVDX) | | | 07/30/2010 | | | | | | | | | | | | | | | | | | | | (1.73 | ) | | | (0.09 | ) | | | 1.83 | | | | 3.74 | | | | 1.08% | | | | 0.96% | |
Institutional Class (EIVIX) | | | 08/01/2006 | | | | | | | | | | | | | | | | | | | | (1.69 | ) | | | 0.04 | | | | 1.93 | | | | 3.84 | | | | 0.81% | | | | 0.81% | |
Russell 1000® Value Index7 | | | | | | | | | | | | | | | | | | | | | | | 1.74 | | | | 1.88 | | | | (2.16 | ) | | | 0.35 | | | | | | | | | |
| * | Returns for periods of less than one year are not annualized. |
| ** | Class B shares are closed to investment, except in connection with the reinvestment of any distributions and permitted exchanges. |
Figures quoted represent past performance, which is no guarantee of future results and do not reflect the deduction of taxes that a shareholder may pay on fund distributions or the redemption of fund shares. Investment return and principal value of an investment will fluctuate so that an investor’s shares, when redeemed, may be worth more or less than their original cost. Performance shown without sales charges would be lower if sales charges were reflected. Current performance may be lower or higher than the performance data quoted and assumes the reinvestment of dividends and capital gains. Current month-end performance is available on the Fund’s Web site – wellsfargoadvantagefunds.com
Index returns do not include transaction costs associated with buying and selling securities, any mutual fund fees or expenses or any taxes. It is not possible to invest directly in an index.
For Class A shares, the maximum front-end sales charge is 5.75%. For Class B shares, the maximum contingent deferred sales charge is 5.00%. For Class C shares, the maximum contingent deferred sales charge is 1.00%. Performance including sales charge assumes the sales charge for the corresponding time period. Administrator Class and Institutional Class shares are sold without a front-end sales charge or contingent deferred sales charge.
Stock fund values fluctuate in response to the activities of individual companies and general market and economic conditions. Certain investment strategies tend to increase the total risk of an investment (relative to the broader market). This Fund is exposed to foreign investment risk. Consult the Fund’s prospectus for additional information on these and other risks.
| 4. | Historical performance shown for the Administrator Class shares prior to their inception reflects the performance of the Institutional Class shares, adjusted to reflect the higher expenses applicable to the Administrator Class shares. Historical performance shown for all classes of the Fund prior to July 19, 2010 is based on the performance of the Fund’s predecessor, Evergreen Intrinsic Value Fund. |
| 5. | Reflects the expense ratios as stated in the most recent prospectuses. |
| 6. | The Adviser has committed through July 18, 2013 to waive fees and/or reimburse expenses to the extent necessary to cap the Fund’s Total Annual Fund Operating Expenses After Fee Waiver, excluding certain expenses, at 1.17% for Class A, 1.92% for Class B, 1.92% for Class C, 0.95% for Administrator Class and 0.85% for Institutional Class shares. Without this cap, the Fund’s returns would have been lower. |
| 7. | The Russell 1000® Value Index measures the performance of those Russell 1000 Value Index companies with lower price-to-book ratios and lower forecasted growth values. You cannot invest directly in an index. |
| | | | | | |
| Fund Expenses (Unaudited) | | Wells Fargo Advantage Intrinsic Value Fund | | | 7 | |
As a shareholder of the Fund, you incur two types of costs: (1) transaction costs, including sales charges (loads) on purchase payments and contingent deferred sales charges (if any) on redemptions and (2) ongoing costs, including management fees; distribution (12b-1) and/or shareholder service fees; and other Fund expenses. This example is intended to help you understand your ongoing costs (in dollars) of investing in the Fund and to compare these costs with the ongoing costs of investing in other mutual funds.
The example is based on an investment of $1,000 invested at the beginning of the six-month period and held for the entire period from August 1, 2011 to January 31, 2012.
Actual Expenses
The “Actual” line of the table below provides information about actual account values and actual expenses. You may use the information in this line, together with the amount you invested, to estimate the expenses that you paid over the period. Simply divide your account value by $1,000 (for example, an $8,600 account value divided by $1,000 = 8.6), then multiply the result by the number in the “Actual” line under the heading entitled “Expenses Paid During Period” for your applicable class of shares to estimate the expenses you paid on your account during this period.
Hypothetical Example for Comparison Purposes
The “Hypothetical” line of the table below provides information about hypothetical account values and hypothetical expenses based on the Fund’s actual expense ratio and an assumed rate of return of 5% per year before expenses, which is not the Fund’s actual return. The hypothetical account values and expenses may not be used to estimate the actual ending account balance or expenses you paid for the period. You may use this information to compare the ongoing costs of investing in the Fund and other funds. To do so, compare this 5% hypothetical example with the 5% hypothetical examples that appear in the shareholder reports of the other funds.
Please note that the expenses shown in the table are meant to highlight your ongoing costs only and do not reflect any transactional costs, such as sales charges (loads) and contingent deferred sales charges. Therefore, the “Hypothetical” line of the table is useful in comparing ongoing costs only, and will not help you determine the relative total costs of owning different funds. In addition, if these transactional costs were included, your costs would have been higher.
| | | | | | | | | | | | | | | | |
| | | Beginning
Account Value 08-01-2011 | | | Ending
Account Value 01-31-2012 | | | Expenses
Paid During the Period1 | | | Net Annual
Expense Ratio | |
| | | | | | | | | | | | | | | | |
Class A | | | | | | | | | | | | | | | | |
Actual | | $ | 1,000.00 | | | $ | 981.83 | | | $ | 5.83 | | | | 1.17 | % |
Hypothetical (5% return before expenses) | | $ | 1,000.00 | | | $ | 1,019.25 | | | $ | 5.94 | | | | 1.17 | % |
Class B | | | | | | | | | | | | | | | | |
Actual | | $ | 1,000.00 | | | $ | 978.54 | | | $ | 9.55 | | | | 1.92 | % |
Hypothetical (5% return before expenses) | | $ | 1,000.00 | | | $ | 1,015.48 | | | $ | 9.73 | | | | 1.92 | % |
Class C | | | | | | | | | | | | | | | | |
Actual | | $ | 1,000.00 | | | $ | 978.90 | | | $ | 9.55 | | | | 1.92 | % |
Hypothetical (5% return before expenses) | | $ | 1,000.00 | | | $ | 1,015.48 | | | $ | 9.73 | | | | 1.92 | % |
Administrator Class | | | | | | | | | | | | | | | | |
Actual | | $ | 1,000.00 | | | $ | 982.69 | | | $ | 4.73 | | | | 0.95 | % |
Hypothetical (5% return before expenses) | | $ | 1,000.00 | | | $ | 1,020.36 | | | $ | 4.82 | | | | 0.95 | % |
Institutional Class | | | | | | | | | | | | | | | | |
Actual | | $ | 1,000.00 | | | $ | 983.12 | | | $ | 4.24 | | | | 0.85 | % |
Hypothetical (5% return before expenses) | | $ | 1,000.00 | | | $ | 1,020.86 | | | $ | 4.32 | | | | 0.85 | % |
| 1. | Expenses paid is equal to the annualized expense ratio of each class multiplied by the average account value over the period, multiplied by the number of days in the most recent fiscal half-year divided by the number of days in the fiscal year (to reflect the one-half year period). |
| | | | |
| 8 | | Wells Fargo Advantage Intrinsic Value Fund | | Portfolio of Investments—January 31, 2012 (Unaudited) |
| | | | | | | | | | | | |
| Security Name | | | | | | Shares | | | Value | |
| | | | | | | | | | | | |
| | | | |
Common Stocks: 96.71% | | | | | | | | | | | | |
| | | | |
Consumer Discretionary: 11.25% | | | | | | | | | | | | |
| | | | |
| Media: 2.70% | | | | | | | | | | | | |
Time Warner Incorporated« | | | | | | | 261,000 | | | $ | 9,672,660 | |
| | | | | | | | | | | | |
| | | | |
| Multiline Retail: 2.82% | | | | | | | | | | | | |
Nordstrom Incorporated« | | | | | | | 205,000 | | | | 10,122,900 | |
| | | | | | | | | | | | |
| | | | |
| Specialty Retail: 3.10% | | | | | | | | | | | | |
Home Depot Incorporated | | | | | | | 250,000 | | | | 11,097,500 | |
| | | | | | | | | | | | |
| | | | |
| Textiles, Apparel & Luxury Goods: 2.63% | | | | | | | | | | | | |
Ralph Lauren Corporation | | | | | | | 62,000 | | | | 9,424,000 | |
| | | | | | | | | | | | |
| | | | |
Consumer Staples: 13.07% | | | | | | | | | | | | |
| | | | |
| Beverages: 4.03% | | | | | | | | | | | | |
Diageo plc | | | | | | | 115,500 | | | | 10,232,145 | |
PepsiCo Incorporated | | | | | | | 64,000 | | | | 4,202,880 | |
| | | | |
| | | | | | | | | | | 14,435,025 | |
| | | | | | | | | | | | |
| | | | |
| Food & Staples Retailing: 1.80% | | | | | | | | | | | | |
Safeway Incorporated« | | | | | | | 293,000 | | | | 6,440,140 | |
| | | | | | | | | | | | |
| | | | |
| Food Products: 7.24% | | | | | | | | | | | | |
H.J. Heinz Company | | | | | | | 154,000 | | | | 7,984,900 | |
The Hershey Company | | | | | | | 166,000 | | | | 10,139,280 | |
Unilever NV« | | | | | | | 235,000 | | | | 7,837,250 | |
| | | | |
| | | | | | | | | | | 25,961,430 | |
| | | | | | | | | | | | |
| | | | |
Energy: 6.12% | | | | | | | | | | | | |
| | | | |
| Energy Equipment & Services: 1.67% | | | | | | | | | | | | |
Schlumberger Limited | | | | | | | 80,000 | | | | 6,013,600 | |
| | | | | | | | | | | | |
| | | | |
| Oil, Gas & Consumable Fuels: 4.45% | | | | | | | | | | | | |
Hess Corporation | | | | | | | 185,000 | | | | 10,415,500 | |
QEP Resources Incorporated | | | | | | | 193,000 | | | | 5,527,520 | |
| | | | |
| | | | | | | | | | | 15,943,020 | |
| | | | | | | | | | | | |
| | | | |
Financials: 12.65% | | | | | | | | | | | | |
| | | | |
| Capital Markets: 6.45% | | | | | | | | | | | | |
Charles Schwab Corporation | | | | | | | 614,000 | | | | 7,153,100 | |
Franklin Resources Incorporated | | | | | | | 72,000 | | | | 7,639,200 | |
Northern Trust Corporation | | | | | | | 109,200 | | | | 4,500,132 | |
State Street Corporation | | | | | | | 97,900 | | | | 3,835,722 | |
| | | | |
| | | | | | | | | | | 23,128,154 | |
| | | | | | | | | | | | |
| | | | |
| Commercial Banks: 4.08% | | | | | | | | | | | | |
M&T Bank Corporation« | | | | | | | 98,000 | | | | 7,814,520 | |
Zions Bancorporation« | | | | | | | 403,000 | | | | 6,786,520 | |
| | | | |
| | | | | | | | | | | 14,601,040 | |
| | | | | | | | | | | | |
| | | | | | |
| Portfolio of Investments—January 31, 2012 (Unaudited) | | Wells Fargo Advantage Intrinsic Value Fund | | | 9 | |
| | | | | | | | | | | | |
| Security Name | | | | | | Shares | | | Value | |
| | | | | | | | | | | | |
| | | | |
| Diversified Financial Services: 2.12% | | | | | | | | | | | | |
JPMorgan Chase & Company | | | | | | | 203,800 | | | $ | 7,601,740 | |
| | | | | | | | | | | | |
| | | | |
Health Care: 10.66% | | | | | | | | | | | | |
| | | | |
| Health Care Equipment & Supplies: 4.06% | | | | | | | | | | | | |
Baxter International Incorporated | | | | | | | 160,000 | | | | 8,876,800 | |
Hospira Incorporated† | | | | | | | 165,000 | | | | 5,685,900 | |
| | | | |
| | | | | | | | | | | 14,562,700 | |
| | | | | | | | | | | | |
| | | | |
| Health Care Providers & Services: 1.84% | | | | | | | | | | | | |
CIGNA Corporation | | | | | | | 147,000 | | | | 6,590,010 | |
| | | | | | | | | | | | |
| | | | |
| Pharmaceuticals: 4.76% | | | | | | | | | | | | |
Abbott Laboratories« | | | | | | | 181,000 | | | | 9,801,150 | |
Eli Lilly & Company | | | | | | | 183,000 | | | | 7,272,420 | |
| | | | |
| | | | | | | | | | | 17,073,570 | |
| | | | | | | | | | | | |
| | | | |
Industrials: 12.71% | | | | | | | | | | | | |
| | | | |
| Aerospace & Defense: 6.07% | | | | | | | | | | | | |
Boeing Company | | | | | | | 122,000 | | | | 9,049,960 | |
Huntington Ingalls Industries Incorporated† | | | | | | | 108,000 | | | | 4,069,440 | |
Northrop Grumman Corporation« | | | | | | | 149,000 | | | | 8,649,450 | |
| | | | |
| | | | | | | | | | | 21,768,850 | |
| | | | | | | | | | | | |
| | | | |
| Air Freight & Logistics: 2.05% | | | | | | | | | | | | |
United Parcel Service Incorporated Class B | | | | | | | 97,000 | | | | 7,338,050 | |
| | | | | | | | | | | | |
| | | | |
| Machinery: 4.59% | | | | | | | | | | | | |
Deere & Company | | | | | | | 106,000 | | | | 9,131,900 | |
SPX Corporation | | | | | | | 105,000 | | | | 7,311,150 | |
| | | | |
| | | | | | | | | | | 16,443,050 | |
| | | | | | | | | | | | |
| | | | |
Information Technology: 21.62% | | | | | | | | | | | | |
| | | | |
| Communications Equipment: 2.38% | | | | | | | | | | | | |
QUALCOMM Incorporated | | | | | | | 145,000 | | | | 8,528,900 | |
| | | | | | | | | | | | |
| | | | |
| Computers & Peripherals: 6.15% | | | | | | | | | | | | |
Apple Incorporated† | | | | | | | 25,500 | | | | 11,640,240 | |
EMC Corporation† | | | | | | | 404,000 | | | | 10,407,040 | |
| | | | |
| | | | | | | | | | | 22,047,280 | |
| | | | | | | | | | | | |
| | | | |
| Internet Software & Services: 2.50% | | | | | | | | | | | | |
eBay Incorporated† | | | | | | | 283,300 | | | | 8,952,280 | |
| | | | | | | | | | | | |
| | | | |
| IT Services: 2.93% | | | | | | | | | | | | |
International Business Machines Corporation | | | | | | | 54,500 | | | | 10,496,700 | |
| | | | | | | | | | | | |
| | | | |
| Semiconductors & Semiconductor Equipment: 2.15% | | | | | | | | | | | | |
Texas Instruments Incorporated | | | | | | | 238,000 | | | | 7,706,440 | |
| | | | | | | | | | | | |
| | | | |
| 10 | | Wells Fargo Advantage Intrinsic Value Fund | | Portfolio of Investments—January 31, 2012 (Unaudited) |
| | | | | | | | | | | | | | |
| Security Name | | | | | | | Shares | | | Value | |
| | | | | | | | | | | | | | |
| | | | |
| Software: 5.51% | | | | | | | | | | | | | | |
Intuit Incorporated | | | | | | | | | 178,500 | | | $ | 10,074,540 | |
Oracle Corporation | | | | | | | | | 343,000 | | | | 9,672,600 | |
| | | | |
| | | | | | | | | | | | | 19,747,140 | |
| | | | | | | | | | | | | | |
| | | | |
Materials: 2.27% | | | | | | | | | | | | | | |
| | | | |
| Chemicals: 2.27% | | | | | | | | | | | | | | |
Dow Chemical Company | | | | | | | | | 243,000 | | | | 8,142,930 | |
| | | | | | | | | | | | | | |
| | | | |
Telecommunication Services: 2.08% | | | | | | | | | | | | | | |
| | | | |
| Wireless Telecommunication Services: 2.08% | | | | | | | | | | | | | | |
Vodafone Group plc ADR« | | | | | | | | | 275,000 | | | | 7,449,750 | |
| | | | | | | | | | | | | | |
| | | | |
Utilities: 4.28% | | | | | | | | | | | | | | |
| | | | |
| Electric Utilities: 2.67% | | | | | | | | | | | | | | |
Nextera Energy Incorporated | | | | | | | | | 160,000 | | | | 9,576,000 | |
| | | | | | | | | | | | | | |
| | | | |
| Gas Utilities: 1.61% | | | | | | | | | | | | | | |
Questar Corporation | | | | | | | | | 299,600 | | | | 5,776,288 | |
| | | | | | | | | | | | | | |
| | | | |
Total Common Stocks (Cost $277,613,226) | | | | | | | | | | | | | 346,641,147 | |
| | | | | | | | | | | | | | |
| | | | |
| | | Yield | | | | | | | | | |
| Short-Term Investments: 12.60% | | | | | | | | | | | | | | |
| | | | |
| Investment Companies: 12.60% | | | | | | | | | | | | | | |
Wells Fargo Advantage Cash Investment Money Market Fund, Institutional Class(l)(u) | | | 0.02 | % | | | | | 9,623,613 | | | | 9,623,613 | |
Wells Fargo Securities Lending Cash Investments, LLC(l)(u)(v)(r) | | | 0.15 | | | | | | 35,522,278 | | | | 35,522,278 | |
| | | | |
Total Short-Term Investments (Cost $45,145,891) | | | | | | | | | | | | | 45,145,891 | |
| | | | | | | | | | | | | | |
| | | | | | | | |
| Total Investments in Securities | | | | | | | | |
| (Cost $322,759,117)* | | | 109.31 | % | | | 391,787,038 | |
Other Assets and Liabilities, Net | | | (9.31 | ) | | | (33,364,454 | ) |
| | | | | | | | |
| Total Net Assets | | | 100.00 | % | | $ | 358,422,584 | |
| | | | | | | | |
| « | All or a portion of this security is on loan. |
| † | Non-income earning security. |
| (l) | Investment in an affiliate. |
| (u) | Rate shown is the 7-day annualized yield at period end. |
| (v) | Security represents investment of cash collateral received from securities on loan. |
| (r) | The investment company is exempt from registration under Section 3(c)(7) of the 1940 Act. |
| * | Cost for federal income tax purposes is $323,268,700 and net unrealized appreciation (depreciation) consists of: |
| | | | |
Gross unrealized appreciation | | $ | 73,982,669 | |
Gross unrealized depreciation | | | (5,464,331 | ) |
| | | | |
Net unrealized appreciation | | $ | 68,518,338 | |
The accompanying notes are an integral part of these financial statements.
| | | | | | |
| Statement of Assets and Liabilities—January 31, 2012 (Unaudited) | | Wells Fargo Advantage Intrinsic Value Fund | | | 11 | |
| | | | |
| | | | |
| |
Assets | | | | |
Investments | | | | |
In unaffiliated securities (including securities on loan), at value (see cost below) | | $ | 346,641,147 | |
In affiliated securities, at value (see cost below) | | | 45,145,891 | |
| | | | |
Total investments, at value (see cost below) | | | 391,787,038 | |
Receivable for investments sold | | | 1,677,627 | |
Receivable for Fund shares sold | | | 2,651,081 | |
Receivable for dividends | | | 589,835 | |
Receivable for securities lending income | | | 4,109 | |
Prepaid expenses and other assets | | | 40,132 | |
| | | | |
Total assets | | | 396,749,822 | |
| | | | |
| |
Liabilities | | | | |
Payable for investments purchased | | | 1,724,442 | |
Payable for Fund shares redeemed | | | 434,394 | |
Payable upon receipt of securities loaned | | | 35,522,278 | |
Advisory fee payable | | | 197,857 | |
Distribution fees payable | | | 19,443 | |
Due to other related parties | | | 63,687 | |
Accrued expenses and other liabilities | | | 365,137 | |
| | | | |
Total liabilities | | | 38,327,238 | |
| | | | |
Total net assets | | $ | 358,422,584 | |
| | | | |
| |
NET ASSETS CONSIST OF | | | | |
Paid-in capital | | $ | 272,593,046 | |
Undistributed net investment income | | | 80,981 | |
Accumulated net realized gains on investments | | | 16,720,636 | |
Net unrealized gains on investments | | | 69,027,921 | |
| | | | |
Total net assets | | $ | 358,422,584 | |
| | | | |
| |
COMPUTATION OF NET ASSET VALUE AND OFFERING PRICE PER SHARE1 | | | | |
Net assets – Class A | | $ | 98,605,436 | |
Shares outstanding – Class A | | | 10,039,642 | |
Net asset value per share – Class A | | | $9.82 | |
Maximum offering price per share – Class A2 | | | $10.42 | |
Net assets – Class B | | $ | 5,631,005 | |
Shares outstanding – Class B | | | 576,566 | |
Net asset value per share – Class B | | | $9.77 | |
Net assets – Class C | | $ | 23,677,408 | |
Shares outstanding – Class C | | | 2,434,574 | |
Net asset value per share – Class C | | | $9.73 | |
Net assets – Administrator Class | | $ | 15,588,275 | |
Shares outstanding – Administrator Class | | | 1,538,467 | |
Net asset value per share – Administrator Class | | | $10.13 | |
Net assets – Institutional Class | | $ | 214,920,460 | |
Shares outstanding – Institutional Class | | | 21,835,929 | |
Net asset value per share – Institutional Class | | | $9.84 | |
| |
Investments in unaffiliated securities, at cost | | $ | 277,613,226 | |
| | | | |
Investments in affiliated securities, at cost | | $ | 45,145,891 | |
| | | | |
Total investments, at cost | | $ | 322,759,117 | |
| | | | |
Securities on loan, at value | | $ | 34,702,229 | |
| | | | |
| 1. | The Fund has an unlimited number of authorized shares. |
| 2. | Maximum offering price is computed as 100/94.25 of net asset value. On investments of $50,000 or more, the offering price is reduced. |
The accompanying notes are an integral part of these financial statements.
| | | | |
| 12 | | Wells Fargo Advantage Intrinsic Value Fund | | Statement of Operations—Six Months Ended January 31, 2012 (Unaudited) |
| | | | |
| | | | |
| |
Investment income | | | | |
Dividends* | | $ | 4,468,151 | |
Securities lending income, net | | | 46,221 | |
Income from affiliated securities | | | 5,694 | |
| | | | |
Total investment income | | | 4,520,066 | |
| | | | |
| |
Expenses | | | | |
Advisory fee | | | 1,267,636 | |
Administration fees | | | | |
Fund level | | | 97,511 | |
Class A | | | 159,435 | |
Class B | | | 7,889 | |
Class C | | | 31,620 | |
Administrator Class | | | 5,724 | |
Institutional Class | | | 90,224 | |
Shareholder servicing fees | | | | |
Class A | | | 139,518 | |
Class B | | | 7,586 | |
Class C | | | 30,100 | |
Administrator Class | | | 14,309 | |
Distribution fees | | | | |
Class B | | | 22,756 | |
Class C | | | 91,213 | |
Custody and accounting fees | | | 26,317 | |
Professional fees | | | 9,968 | |
Registration fees | | | 20,890 | |
Shareholder report expenses | | | 67,928 | |
Trustees’ fees and expenses | | | 6,066 | |
Other fees and expenses | | | 22,664 | |
| | | | |
Total expenses | | | 2,119,354 | |
Less: Fee waivers and/or expense reimbursements | | | (99,920 | ) |
| | | | |
Net expenses | | | 2,019,434 | |
| | | | |
Net investment income | | | 2,500,632 | |
| | | | |
| |
REALIZED AND UNREALIZED GAINS (LOSSES) ON INVESTMENTS | | | | |
Net realized losses on investments | | | (1,332,527 | ) |
Net change in unrealized gains (losses) on investments | | | (19,086,356 | ) |
| | | | |
Net realized and unrealized gains (losses) on investments | | | (20,418,883 | ) |
| | | | |
Net decrease in net assets resulting from operations | | $ | (17,918,251 | ) |
| | | | |
| |
* Net of foreign dividend withholding taxes of | | | $26,612 | |
The accompanying notes are an integral part of these financial statements.
| | | | | | |
| Statements of Changes in Net Assets | | Wells Fargo Advantage Intrinsic Value Fund | | | 13 | |
| | | | | | | | | | | | | | | | |
| | | Six Months Ended
January 31, 2012
(Unaudited) | | | Year Ended
July 31, 2011 | |
| | | | |
Operations | | | | | | | | | | | | | | | | |
Net investment income | | | | | | $ | 2,500,632 | | | | | | | $ | 11,612,277 | |
Net realized gains (losses) on investments | | | | | | | (1,332,527 | ) | | | | | | | 234,614,091 | |
Net change in unrealized gains (losses) on investments | | | | | | | (19,086,356 | ) | | | | | | | 18,798,707 | |
| | | | | | | | | | | | | | | | |
Net increase (decrease) in net assets resulting from operations | | | | | | | (17,918,251 | ) | | | | | | | 265,025,075 | |
| | | | | | | | | | | | | | | | |
| | | | |
Distributions to shareholders from | | | | | | | | | | | | | | | | |
Net investment income | | | | | | | | | | | | | | | | |
Class A | | | | | | | (3,158,452 | ) | | | | | | | (1,412,791 | ) |
Class B | | | | | | | (102,030 | ) | | | | | | | (4,240 | ) |
Class C | | | | | | | (486,427 | ) | | | | | | | (57,276 | ) |
Administrator Class | | | | | | | (53,362 | ) | | | | | | | (4,447,278 | ) |
Institutional Class | | | | | | | (6,661,737 | ) | | | | | | | (9,157,759 | ) |
Net realized gains | | | | | | | | | | | | | | | | |
Class A | | | | | | | (11,786,758 | ) | | | | | | | 0 | |
Class B | | | | | | | (603,944 | ) | | | | | | | 0 | |
Class C | | | | | | | (2,557,958 | ) | | | | | | | 0 | |
Administrator Class | | | | | | | (1,707,718 | ) | | | | | | | 0 | |
Institutional Class | | | | | | | (20,996,038 | ) | | | | | | | 0 | |
| | | | | | | | | | | | | | | | |
Total distributions to shareholders | | | | | | | (48,114,424 | ) | | | | | | | (15,079,344 | ) |
| | | | | | | | | | | | | | | | |
| | | | |
Capital share transactions | | | Shares | | | | | | | | Shares | | | | | |
Proceeds from shares sold | | | | | | | | | | | | | | | | |
Class A | | | 986,390 | | | | 10,217,972 | | | | 4,196,329 | | | | 45,841,771 | |
Class B | | | 13,838 | | | | 138,457 | | | | 34,726 | | | | 374,026 | |
Class C | | | 150,294 | | | | 1,530,033 | | | | 650,652 | | | | 7,003,299 | |
Administrator Class | | | 1,712,844 | | | | 17,557,443 | | | | 47,209,092 | | | | 462,799,715 | |
Institutional Class | | | 2,870,572 | | | | 28,759,862 | | | | 23,272,496 | | | | 247,394,935 | |
| | | | | | | | | | | | | | | | |
| | | | | | | 58,203,767 | | | | | | | | 763,413,746 | |
| | | | | | | | | | | | | | | | |
Reinvestment of distributions | | | | | | | | | | | | | | | | |
Class A | | | 1,315,618 | | | | 12,628,143 | | | | 110,602 | | | | 1,208,879 | |
Class B | | | 68,307 | | | | 649,452 | | | | 362 | | | | 3,926 | |
Class C | | | 283,110 | | | | 2,683,755 | | | | 4,483 | | | | 48,590 | |
Administrator Class | | | 82,852 | | | | 810,567 | | | | 402,094 | | | | 4,406,952 | |
Institutional Class | | | 2,479,308 | | | | 23,891,924 | | | | 700,649 | | | | 7,679,116 | |
| | | | | | | | | | | | | | | | |
| | | | | | | 40,663,841 | | | | | | | | 13,347,463 | |
| | | | | | | | | | | | | | | | |
Payment for shares redeemed | | | | | | | | | | | | | | | | |
Class A | | | (6,108,069 | ) | | | (61,031,256 | ) | | | (5,498,609 | ) | | | (61,172,846 | ) |
Class B | | | (179,989 | ) | | | (1,831,506 | ) | | | (307,645 | ) | | | (3,443,351 | ) |
Class C | | | (486,078 | ) | | | (4,855,523 | ) | | | (938,856 | ) | | | (10,500,544 | ) |
Administrator Class | | | (1,096,592 | ) | | | (10,774,334 | ) | | | (46,772,836 | ) | | | (540,610,675 | ) |
Institutional Class | | | (7,514,429 | ) | | | (78,015,480 | ) | | | (112,371,263 | ) | | | (1,222,497,717 | ) |
| | | | | | | | | | | | | | | | |
| | | | | | | (156,508,099 | ) | | | | | | | (1,838,225,133 | ) |
| | | | | | | | | | | | | | | | |
Net decrease in net assets resulting
from capital share transactions | | | | | | | (57,640,491 | ) | | | | | | | (1,061,463,924 | ) |
| | | | | | | | | | | | | | | | |
Total decrease in net assets | | | | | | | (123,673,166 | ) | | | | | | | (811,518,193 | ) |
| | | | | | | | | | | | | | | | |
| | | | |
Net assets | | | | | | | | | | | | | | | | |
Beginning of period | | | | | | | 482,095,750 | | | | | | | | 1,293,613,943 | |
| | | | | | | | | | | | | | | | |
End of period | | | | | | $ | 358,422,584 | | | | | | | $ | 482,095,750 | |
| | | | | | | | | | | | | | | | |
Undistributed net investment income | | | | | | $ | 80,981 | | | | | | | $ | 8,042,357 | |
| | | | | | | | | | | | | | | | |
The accompanying notes are an integral part of these financial statements.
| | | | |
| 14 | | Wells Fargo Advantage Intrinsic Value Fund | | Financial Highlights |
(For a share outstanding throughout each period)
| | | | | | | | | | | | | | | | | | | | | | | | |
| | | Six Months Ended January 31, 2012 (Unaudited) | | | Year Ended July 31, | |
| Class A | | | 2011 | | | 20101 | | | 20091 | | | 20081 | | | 20071,2 | |
Net asset value, beginning of period | | $ | 11.50 | | | $ | 9.84 | | | $ | 8.48 | | | $ | 10.19 | | | $ | 11.53 | | | $ | 10.00 | |
Net investment income | | | 0.06 | 3 | | | 0.10 | | | | 0.10 | 3 | | | 0.10 | | | | 0.09 | | | | 0.07 | |
Net realized and unrealized gains (losses) on investments | | | (0.33 | ) | | | 1.65 | | | | 1.31 | | | | (1.71 | ) | | | (0.96 | ) | | | 1.49 | |
| | | | | | | | | | | | | | | | | | | | | | | | |
Total from investment operations | | | (0.27 | ) | | | 1.75 | | | | 1.41 | | | | (1.61 | ) | | | (0.87 | ) | | | 1.56 | |
Distributions to shareholders from | | | | | | | | | | | | | | | | | | | | | | | | |
Net investment income | | | (0.28 | ) | | | (0.09 | ) | | | (0.05 | ) | | | (0.04 | ) | | | (0.05 | ) | | | (0.03 | ) |
Net realized gains | | | (1.13 | ) | | | 0.00 | | | | 0.00 | | | | (0.06 | ) | | | (0.42 | ) | | | 0.00 | |
| | | | | | | | | | | | | | | | | | | | | | | | |
Total distributions to shareholders | | | (1.41 | ) | | | (0.09 | ) | | | (0.05 | ) | | | (0.10 | ) | | | (0.47 | ) | | | (0.03 | ) |
Net asset value, end of period | | $ | 9.82 | | | $ | 11.50 | | | $ | 9.84 | | | $ | 8.48 | | | $ | 10.19 | | | $ | 11.53 | |
Total return4 | | | (1.82 | )% | | | 17.88 | % | | | 16.67 | % | | | (15.62 | )% | | | (7.89 | )% | | | 15.58 | % |
Ratios to average net assets (annualized) | | | | | | | | | | | | | | | | | | | | | | | | |
Gross expenses | | | 1.27 | % | | | 1.24 | % | | | 1.17 | % | | | 1.15 | % | | | 1.12 | % | | | 1.33 | % |
Net expenses | | | 1.17 | % | | | 1.17 | % | | | 1.11 | % | | | 1.14 | % | | | 1.11 | % | | | 1.21 | % |
Net investment income | | | 1.17 | % | | | 0.81 | % | | | 1.05 | % | | | 1.62 | % | | | 0.96 | % | | | 1.14 | % |
Supplemental data | | | | | | | | | | | | | | | | | | | | | | | | |
Portfolio turnover rate | | | 24 | % | | | 25 | % | | | 23 | % | | | 23 | % | | | 26 | % | | | 91 | % |
Net assets, end of period (000’s omitted) | | | $98,605 | | | | $159,178 | | | | $147,957 | | | | $90,382 | | | | $88,456 | | | | $81,087 | |
| 1. | After the close of business on July 16, 2010, the Fund acquired the net assets of Evergreen Intrinsic Value Fund which became the accounting and performance survivor in the transaction. The information for the periods prior to July 19, 2010 is that of Class A of Evergreen Intrinsic Value Fund. |
| 2. | For the period from August 1, 2006 (commencement of class operations) to July 31, 2007. |
| 3. | Calculated based upon average shares outstanding. |
| 4. | Total return calculations do not include any sales charges. Returns for periods of less than one year are not annualized. |
The accompanying notes are an integral part of these financial statements.
| | | | | | |
| Financial Highlights | | Wells Fargo Advantage Intrinsic Value Fund | | | 15 | |
(For a share outstanding throughout each period)
| | | | | | | | | | | | | | | | | | | | | | | | |
| | | Six Months Ended
January 31, 2012 (Unaudited) | | | Year Ended July 31, | |
| Class B | | | 2011 | | | 20101 | | | 20091 | | | 20081 | | | 20071,2 | |
Net asset value, beginning of period | | $ | 11.37 | | | $ | 9.72 | | | $ | 8.40 | | | $ | 10.11 | | | $ | 11.48 | | | $ | 10.00 | |
Net investment income | | | 0.02 | 3 | | | 0.01 | 3 | | | 0.03 | 3 | | | 0.07 | 3 | | | 0.02 | | | | 0.02 | |
Net realized and unrealized gains (losses) on investments | | | (0.32 | ) | | | 1.64 | | | | 1.29 | | | | (1.72 | ) | | | (0.97 | ) | | | 1.47 | |
| | | | | | | | | | | | | | | | | | | | | | | | |
Total from investment operations | | | (0.30 | ) | | | 1.65 | | | | 1.32 | | | | (1.65 | ) | | | (0.95 | ) | | | 1.49 | |
Distributions to shareholders from | | | | | | | | | | | | | | | | | | | | | | | | |
Net investment income | | | (0.17 | ) | | | (0.00 | )4 | | | 0.00 | | | | 0.00 | | | | 0.00 | | | | (0.01 | ) |
Net realized gains | | | (1.13 | ) | | | 0.00 | | | | 0.00 | | | | (0.06 | ) | | | (0.42 | ) | | | 0.00 | |
| | | | | | | | | | | | | | | | | | | | | | | | |
Total distributions to shareholders | | | (1.30 | ) | | | (0.00 | )4 | | | 0.00 | | | | (0.06 | ) | | | (0.42 | ) | | | (0.01 | ) |
Net asset value, end of period | | $ | 9.77 | | | $ | 11.37 | | | $ | 9.72 | | | $ | 8.40 | | | $ | 10.11 | | | $ | 11.48 | |
Total return5 | | | (2.15 | )% | | | 17.03 | % | | | 15.71 | % | | | (16.22 | )% | | | (8.58 | )% | | | 14.89 | % |
Ratios to average net assets (annualized) | | | | | | | | | | | | | | | | | | | | | | | | |
Gross expenses | | | 2.04 | % | | | 1.99 | % | | | 1.93 | % | | | 1.91 | % | | | 1.91 | % | | | 2.09 | % |
Net expenses | | | 1.92 | % | | | 1.91 | % | | | 1.88 | % | | | 1.90 | % | | | 1.90 | % | | | 1.97 | % |
Net investment income | | | 0.38 | % | | | 0.07 | % | | | 0.30 | % | | | 0.84 | % | | | 0.15 | % | | | 0.44 | % |
Supplemental data | | | | | | | | | | | | | | | | | | | | | | | | |
Portfolio turnover rate | | | 24 | % | | | 25 | % | | | 23 | % | | | 23 | % | | | 26 | % | | | 91 | % |
Net assets, end of period (000’s omitted) | | | $5,631 | | | | $7,666 | | | | $9,206 | | | | $10,014 | | | | $18,248 | | | | $24,084 | |
| 1. | After the close of business on July 16, 2010, the Fund acquired the net assets of Evergreen Intrinsic Value Fund which became the accounting and performance survivor in the transaction. The information for the periods prior to July 19, 2010 is that of Class B of Evergreen Intrinsic Value Fund. |
| 2. | For the period from August 1, 2006 (commencement of class operations) to July 31, 2007. |
| 3. | Calculated based upon average shares outstanding. |
| 4. | Amount is less than $0.005. |
| 5. | Total return calculations do not include any sales charges. Returns for periods of less than one year are not annualized. |
The accompanying notes are an integral part of these financial statements.
| | | | |
| 16 | | Wells Fargo Advantage Intrinsic Value Fund | | Financial Highlights |
(For a share outstanding throughout each period)
| | | | | | | | | | | | | | | | | | | | | | | | |
| | | Six Months Ended
January 31, 2012 (Unaudited) | | | Year Ended July 31, | |
| Class C | | | 2011 | | | 20101 | | | 20091 | | | 20081 | | | 20071,2 | |
Net asset value, beginning of period | | $ | 11.35 | | | $ | 9.72 | | | $ | 8.40 | | | $ | 10.11 | | | $ | 11.48 | | | $ | 10.00 | |
Net investment income | | | 0.01 | | | | 0.02 | | | | 0.03 | 3 | | | 0.06 | 3 | | | 0.01 | | | | 0.02 | |
Net realized and unrealized gains (losses) on investments | | | (0.31 | ) | | | 1.63 | | | | 1.29 | | | | (1.71 | ) | | | (0.96 | ) | | | 1.47 | |
| | | | | | | | | | | | | | | | | | | | | | | | |
Total from investment operations | | | (0.30 | ) | | | 1.65 | | | | 1.32 | | | | (1.65 | ) | | | (0.95 | ) | | | 1.49 | |
Distributions to shareholders from | | | | | | | | | | | | | | | | | | | | | | | | |
Net investment income | | | (0.19 | ) | | | (0.02 | ) | | | 0.00 | | | | 0.00 | | | | 0.00 | | | | (0.01 | ) |
Net realized gains | | | (1.13 | ) | | | 0.00 | | | | 0.00 | | | | (0.06 | ) | | | (0.42 | ) | | | 0.00 | |
| | | | | | | | | | | | | | | | | | | | | | | | |
Total distributions to shareholders | | | (1.32 | ) | | | (0.02 | ) | | | 0.00 | | | | (0.06 | ) | | | (0.42 | ) | | | (0.01 | ) |
Net asset value, end of period | | $ | 9.73 | | | $ | 11.35 | | | $ | 9.72 | | | $ | 8.40 | | | $ | 10.11 | | | $ | 11.48 | |
Total return4 | | | (2.11 | )% | | | 16.98 | % | | | 15.71 | % | | | (16.22 | )% | | | (8.58 | )% | | | 14.90 | % |
Ratios to average net assets (annualized) | | | | | | | | | | | | | | | | | | | | | | | | |
Gross expenses | | | 2.03 | % | | | 1.97 | % | | | 1.94 | % | | | 1.92 | % | | | 1.91 | % | | | 2.10 | % |
Net expenses | | | 1.92 | % | | | 1.92 | % | | | 1.88 | % | | | 1.91 | % | | | 1.90 | % | | | 1.98 | % |
Net investment income | | | 0.37 | % | | | 0.07 | % | | | 0.29 | % | | | 0.84 | % | | | 0.18 | % | | | 0.31 | % |
Supplemental data | | | | | | | | | | | | | | | | | | | | | | | | |
Portfolio turnover rate | | | 24 | % | | | 25 | % | | | 23 | % | | | 23 | % | | | 26 | % | | | 91 | % |
Net assets, end of period (000’s omitted) | | | $23,677 | | | | $28,230 | | | | $26,934 | | | | $20,396 | | | | $22,369 | | | | $19,640 | |
| 1. | After the close of business on July 16, 2010, the Fund acquired the net assets of Evergreen Intrinsic Value Fund which became the accounting and performance survivor in the transaction. The information for the periods prior to July 19, 2010 is that of Class C of Evergreen Intrinsic Value Fund. |
| 2. | For the period from August 1, 2006 (commencement of class operations) to July 31, 2007. |
| 3. | Calculated based upon average shares outstanding. |
| 4. | Total return calculations do not include any sales charges. Returns for periods of less than one year are not annualized. |
The accompanying notes are an integral part of these financial statements.
| | | | | | |
| Financial Highlights | | Wells Fargo Advantage Intrinsic Value Fund | | | 17 | |
(For a share outstanding throughout each period)
| | | | | | | | | | | | |
| | | Six Months Ended January 31, 2012 (Unaudited) | | | Year Ended July 31, | |
| Administrator Class | | | 2011 | | | 20101 | |
Net asset value, beginning of period | | $ | 11.55 | | | $ | 9.87 | | | $ | 9.87 | |
Net investment income | | | 0.07 | 2 | | | 0.11 | 2 | | | 0.00 | |
Net realized and unrealized gains (losses) on investments | | | (0.32 | ) | | | 1.68 | | | | 0.00 | |
| | | | | | | | | | | | |
Total from investment operations | | | (0.25 | ) | | | 1.79 | | | | 0.00 | |
Distributions to shareholders from | | | | | | | | | | | | |
Net investment income | | | (0.04 | ) | | | (0.11 | ) | | | 0.00 | |
Net realized gains | | | (1.13 | ) | | | 0.00 | | | | 0.00 | |
| | | | | | | | | | | | |
Total distributions to shareholders | | | (1.17 | ) | | | (0.11 | ) | | | 0.00 | |
Net asset value, end of period | | $ | 10.13 | | | $ | 11.55 | | | $ | 9.87 | |
Total return3 | | | (1.73 | )% | | | 18.23 | % | | | 0.00 | % |
Ratios to average net assets (annualized) | | | | | | | | | | | | |
Gross expenses | | | 1.13 | % | | | 1.06 | % | | | 0.00 | % |
Net expenses | | | 0.95 | % | | | 0.95 | % | | | 0.00 | % |
Net investment income | | | 1.34 | % | | | 1.04 | % | | | 0.00 | % |
Supplemental data | | | | | | | | | | | | |
Portfolio turnover rate | | | 24 | % | | | 25 | % | | | 23 | % |
Net assets, end of period (000’s omitted) | | | $15,588 | | | | $9,693 | | | | $10 | |
| 1. | For the period from July 30, 2010 (commencement of class operations) to July 31, 2010. |
| 2. | Calculated based upon average shares outstanding. |
| 3. | Returns for periods of less than one year are not annualized. |
The accompanying notes are an integral part of these financial statements.
| | | | |
| 18 | | Wells Fargo Advantage Intrinsic Value Fund | | Financial Highlights |
(For a share outstanding throughout each period)
| | | | | | | | | | | | | | | | | | | | | | | | |
| | | Six Months Ended
January 31, 2012 (Unaudited) | | | Year Ended July 31, | |
| Institutional Class | | | 2011 | | | 20101 | | | 20091 | | | 20081 | | | 20071,2 | |
Net asset value, beginning of period | | $ | 11.56 | | | $ | 9.87 | | | $ | 8.51 | | | $ | 10.22 | | | $ | 11.55 | | | $ | 10.00 | |
Net investment income | | | 0.08 | 3 | | | 0.13 | 3 | | | 0.12 | 3 | | | 0.12 | | | | 0.14 | 3 | | | 0.10 | |
Net realized and unrealized gains (losses) on investments | | | (0.34 | ) | | | 1.67 | | | | 1.32 | | | | (1.72 | ) | | | (0.98 | ) | | | 1.48 | |
| | | | | | | | | | | | | | | | | | | | | | | | |
Total from investment operations | | | (0.26 | ) | | | 1.80 | | | | 1.44 | | | | (1.60 | ) | | | (0.84 | ) | | | 1.58 | |
Distributions to shareholders from | | | | | | | | | | | | | | | | | | | | | | | | |
Net investment income | | | (0.33 | ) | | | (0.11 | ) | | | (0.08 | ) | | | (0.05 | ) | | | (0.07 | ) | | | (0.03 | ) |
Net realized gains | | | (1.13 | ) | | | 0.00 | | | | 0.00 | | | | (0.06 | ) | | | (0.42 | ) | | | 0.00 | |
| | | | | | | | | | | | | | | | | | | | | | | | |
Total distributions to shareholders | | | (1.46 | ) | | | (0.11 | ) | | | (0.08 | ) | | | (0.11 | ) | | | (0.49 | ) | | | (0.03 | ) |
Net asset value, end of period | | $ | 9.84 | | | $ | 11.56 | | | $ | 9.87 | | | $ | 8.51 | | | $ | 10.22 | | | $ | 11.55 | |
Total return4 | | | (1.69 | )% | | | 18.32 | % | | | 16.93 | % | | | (15.44 | )% | | | (7.66 | )% | | | 15.84 | % |
Ratios to average net assets (annualized) | | | | | | | | | | | | | | | | | | | | | | | | |
Gross expenses | | | 0.86 | % | | | 0.79 | % | | | 0.94 | % | | | 0.92 | % | | | 0.89 | % | | | 1.11 | % |
Net expenses | | | 0.85 | % | | | 0.79 | % | | | 0.88 | % | | | 0.91 | % | | | 0.88 | % | | | 0.99 | % |
Net investment income | | | 1.46 | % | | | 1.16 | % | | | 1.27 | % | | | 1.86 | % | | | 1.25 | % | | | 1.18 | % |
Supplemental data | | | | | | | | | | | | | | | | | | | | | | | | |
Portfolio turnover rate | | | 24 | % | | | 25 | % | | | 23 | % | | | 23 | % | | | 26 | % | | | 91 | % |
Net assets, end of period (000’s omitted) | | | $214,920 | | | | $277,329 | | | | $1,109,507 | | | | $348,093 | | | | $299,456 | | | | $61,469 | |
| 1. | After the close of business on July 16, 2010, the Fund acquired the net assets of Evergreen Intrinsic Value fund which became the accounting and performance survivor in the transaction. The information for the periods prior to July 19, 2010 is that of Class I of Evergreen Intrinsic Value Fund. |
| 2. | For the period from August 1, 2006 (commencement of class operations) to July 31, 2007. |
| 3. | Calculated based upon average shares outstanding. |
| 4. | Returns for periods of less than one year are not annualized. |
The accompanying notes are an integral part of these financial statements.
| | | | | | |
| Notes to Financial Statements (Unaudited) | | Wells Fargo Advantage Intrinsic Value Fund | | | 19 | |
1. ORGANIZATION
Wells Fargo Funds Trust (the “Trust”), a Delaware statutory trust organized on March 10, 1999, is an open-end management investment company registered under the Investment Company Act of 1940, as amended (the “1940 Act”). These financial statements report on Wells Fargo Advantage Intrinsic Value Fund (the “Fund”) which is a diversified series of the Trust.
2. SIGNIFICANT ACCOUNTING POLICIES
The following significant accounting policies, which are consistently followed in the preparation of the financial statements of the Fund, are in conformity with U.S. generally accepted accounting principles which require management to make estimates and assumptions that affect the reported amounts of assets and liabilities, disclosure of contingent assets and liabilities at the date of the financial statements, and the reported amounts of revenues and expenses during the reporting period. Actual results could differ from those estimates.
Securities valuation
Investments in equity securities are valued each business day as of the close of regular trading on the New York Stock Exchange, which is usually 4:00 p.m. (Eastern Time). Securities which are traded on a national or foreign securities exchange are valued at the last reported sales price, except that securities listed on The Nasdaq Stock Market, Inc. (“Nasdaq”) are valued at the Nasdaq Official Closing Price (“NOCP”), and if no NOCP is available, then at the last reported sales price. If no sales price is shown on the Nasdaq, the bid price will be used. In the absence of any sale of securities listed on the Nasdaq, and in the case of other securities (including U.S. Government obligations, but excluding debt securities maturing in 60 days or less), the price will be deemed “stale” and the valuations will be determined in accordance with the Fund’s Fair Value Procedures.
Investments in open-end mutual funds and non-registered investment companies are generally valued at net asset value.
Investments which are not valued using any of the methods discussed above, are valued at their fair value, as determined by procedures established in good faith and approved by the Board of Trustees.
Security loans
The Fund may lend its securities from time to time in order to earn additional income in the form of fees or interest on securities received as collateral or the investment of any cash received as collateral. The Fund continues to receive interest or dividends on the securities loaned. The Fund receives collateral in the form of cash or securities with a value at least equal to the value of the securities on loan. The value of the loaned securities is determined at the close of each business day and any additional required collateral is delivered to the Fund on the next business day. In a securities lending transaction, the net asset value of the Fund will be affected by an increase or decrease in the value of the securities loaned and by an increase or decrease in the value of the instrument in which collateral is invested. The amount of securities lending activity undertaken by the Fund fluctuates from time to time. In the event of default or bankruptcy by the borrower, the Fund may be prevented from recovering the loaned securities or gaining access to the collateral or may experience delays or costs in doing so. In addition, the investment of any cash collateral received may lose all or part of its value. The Fund has the right under the lending agreement to recover the securities from the borrower on demand.
The Fund lends its securities through an unaffiliated securities lending agent. Cash collateral received in connection with its securities lending transactions is invested in Wells Fargo Securities Lending Cash Investments, LLC (the “Cash Collateral Fund”). The Cash Collateral Fund is exempt from registration under Section 3(c)(7) of the 1940 Act and is managed by Wells Fargo Funds Management LLC (“Funds Management”) and is sub-advised by Wells Capital Management Incorporated (“Wells Capital Management”). Funds Management receives an advisory fee starting at 0.05% and declining to 0.01% as the average daily net assets of the Cash Collateral Fund increase. All of the fees received by Funds Management are paid to Wells Capital Management for its services as sub-adviser. The Cash Collateral Fund seeks to provide a positive return compared to the daily Fed Funds Open rate by investing in high-quality, U.S. dollar-denominated short-term money market instruments. Cash Collateral Fund investments are fair valued based upon the amortized cost valuation technique. Income earned from investment in the Cash Collateral Fund is included in securities lending income on the Statement of Operations.
| | | | |
| 20 | | Wells Fargo Advantage Intrinsic Value Fund | | Notes to Financial Statements (Unaudited) |
Security transactions and income recognition
Securities transactions are recorded on a trade date basis. Realized gains or losses are reported on the basis of identified cost of securities delivered.
Dividend income is recognized on the ex-dividend date. Dividend income is recorded net of foreign taxes withheld where recovery of such taxes is not assured.
Distributions to shareholders
Distributions to shareholders from net investment income and net realized gains, if any, are recorded on the ex-dividend date. Such distributions are determined in conformity with income tax regulations, which may differ from generally accepted accounting principles.
Federal and other taxes
The Fund intends to continue to qualify as a regulated investment company by distributing substantially all of its investment company taxable income and any net realized capital gains (after reduction for capital loss carryforwards) sufficient to relieve it from all, or substantially all, federal income taxes. Accordingly, no provision for federal income taxes was required.
The Fund’s income and federal excise tax returns and all financial records supporting those returns for the prior three fiscal years are subject to examination by the federal and Delaware revenue authorities.
Under the recently enacted Regulated Investment Company Modernization Act of 2010, the Fund is permitted to carry forward capital losses incurred in taxable years which began after December 22, 2010 for an unlimited period. However, any losses incurred are required to be utilized prior to the losses incurred in pre-enactment taxable years. As a result of this ordering rule, pre-enactment capital loss carryforwards may be more likely to expire unused. Additionally, post-enactment capital losses that are carried forward will retain their character as either short-term or long-term capital losses rather than being considered all short-term as under previous law.
Class allocations
The separate classes of shares offered by the Fund differ principally in applicable sales charges, distribution, shareholder servicing and administration fees. Shareholders of each class bear certain expenses that pertain to that particular class. All shareholders bear the common expenses of the Fund, earn income from the portfolio, and are allocated unrealized gains and losses pro rata based on the average daily net assets of each class, without distinction between share classes. Dividends are determined separately for each class based on income and expenses allocable to each class. Realized gains and losses are allocated to each class pro rata based upon the net assets of each class on the date realized. Differences in per share dividend rates generally result from the relative weightings of pro rata income and realized gain allocations and from differences in separate class expenses, including distribution, shareholder servicing and administration fees.
3. FAIR VALUATION MEASUREMENTS
Fair value measurements of investments are determined within a framework that has established a fair value hierarchy based upon the various data inputs utilized in determining the value of the Fund’s investments. The three-level hierarchy gives the highest priority to unadjusted quoted prices in active markets for identical assets or liabilities (Level 1) and the lowest priority to significant unobservable inputs (Level 3). The Fund’s investments are classified within the fair value hierarchy based on the lowest level of input that is significant to the fair value measurement. The inputs are summarized into three broad levels as follows:
| n | | Level 1 – quoted prices in active markets for identical securities |
| n | | Level 2 – other significant observable inputs (including quoted prices for similar securities, interest rates, prepayment speeds, credit risk, etc.) |
| n | | Level 3 – significant unobservable inputs (including the Fund’s own assumptions in determining the fair value of investments) |
The inputs or methodologies used for valuing securities are not necessarily an indication of the risk associated with investing in those securities.
| | | | | | |
| Notes to Financial Statements (Unaudited) | | Wells Fargo Advantage Intrinsic Value Fund | | | 21 | |
As of January 31, 2012, the inputs used in valuing the Fund’s assets, which are carried at fair value, were as follows:
| | | | | | | | | | | | | | | | |
| Investments in Securities | | Quoted Prices
(Level 1) | | | Significant Other
Observable Inputs
(Level 2) | | | Significant
Unobservable Inputs
(Level 3) | | | Total | |
Equity securities | | | | | | | | | | | | | | | | |
Common stocks | | $ | 346,641,147 | | | $ | 0 | | | $ | 0 | | | $ | 346,641,147 | |
Short-term investments | | | | | | | | | | | | | | | | |
Investment companies | | | 9,623,613 | | | | 35,522,278 | | | | 0 | | | | 45,145,891 | |
| | | $ | 356,264,760 | | | $ | 35,522,278 | | | $ | 0 | | | $ | 391,787,038 | |
Further details on the major security types listed above can be found in the Portfolio of Investments.
Transfers in and transfers out are recognized at the end of the reporting period. For the six months ended January 31, 2012, the Fund did not have any significant transfers into/out of Level 1 and Level 2.
4. TRANSACTIONS WITH AFFILIATES AND OTHER EXPENSES
Advisory fee
The Trust has entered into an advisory contract with Funds Management, an indirect wholly owned subsidiary of Wells Fargo & Company (“Wells Fargo”). The adviser is responsible for implementing investment policies and guidelines and for supervising the sub-adviser who is responsible for day-to-day portfolio management of the Fund.
Pursuant to the contract, Funds Management is entitled to receive an annual advisory fee starting at 0.65% and declining to 0.55% as the average daily net assets of the Fund increase. For the six months ended January 31, 2012, the advisory fee was equivalent to an annual rate of 0.65% of the Fund’s average daily net assets.
Funds Management may retain the services of certain sub-advisers to provide daily portfolio management to the Fund. The fees related to sub-advisory services are borne directly by Funds Management and do not increase the overall fees paid by the Fund. Metropolitan West Capital Management, LLC, an affiliate of Funds Management, is the sub-adviser to the Fund and is entitled to receive a fee from Funds Management at an annual rate starting at 0.35% and declining to 0.25% as the average daily net assets of the Fund increase.
Administration and transfer agent fees
The Trust has entered into an administration agreement with Funds Management. Under this agreement, for providing administrative services, which includes paying fees and expenses for services provided by the transfer agent, sub-transfer agents, omnibus account servicers and record-keepers, Funds Management is entitled to receive from the Fund an annual fund level administration fee starting at 0.05% and declining to 0.03% as the average daily net assets of the Fund increase and a class level administration fee which is calculated based on the average daily net assets of each class as follows:
| | | | |
| | | Class Level Administration Fee | |
Class A, Class B, Class C | | | 0.26 | % |
Administrator Class | | | 0.10 | |
Institutional Class | | | 0.08 | |
Funds Management has contractually waived and/or reimbursed advisory and administration fees to the extent necessary to maintain certain net operating expense ratios for the Fund. Waiver of fees and/or reimbursement of expenses by Funds Management were made first from fund level expenses on a proportionate basis and then from class specific expenses. Funds Management has committed through July 18, 2013 to waive fees and/or reimburse expenses to the extent necessary to cap the Fund’s expenses at 1.17% for Class A, 1.92% for Class B, 1.92% for Class C, 0.95% for Administrator Class and 0.85% for Institutional Class.
| | | | |
| 22 | | Wells Fargo Advantage Intrinsic Value Fund | | Notes to Financial Statements (Unaudited) |
Distribution fees
The Trust has adopted a Distribution Plan for Class B and Class C shares of the Fund pursuant to Rule 12b-1 under the 1940 Act. Distribution fees are charged to Class B and Class C shares and paid to Wells Fargo Funds Distributor, LLC, the principal underwriter, at an annual rate of 0.75% of the average daily net assets of Class B and Class C shares.
For the six months ended January 31, 2012, Wells Fargo Funds Distributor, LLC received $2,363 from the sale of Class A shares and $3,305 and $1,797 in contingent deferred sales charges from redemptions of Class B and Class C shares, respectively.
Shareholder servicing fees
The Trust has entered into contracts with one or more shareholder servicing agents, whereby Class A, Class B, Class C and Administrator Class of the Fund is charged a fee at an annual rate of 0.25% of the average daily net assets of each respective class.
A portion of these total shareholder servicing fees were paid to affiliates of Wells Fargo.
5. INVESTMENT PORTFOLIO TRANSACTIONS
Purchases and sales of investments, excluding U.S. Government obligations (if any) and short-term securities (securities with maturities of one year or less at purchase date), for the six months ended January 31, 2012 were $90,062,253 and $186,757,707, respectively.
6. BANK BORROWINGS
The Trust (excluding the money market funds) and Wells Fargo Variable Trust are parties to a $150,000,000 revolving credit agreement with State Street Bank and Trust Company, whereby the Fund is permitted to use bank borrowings for temporary or emergency purposes, such as to fund shareholder redemption requests. Interest under the credit agreement is charged to the Fund based on a borrowing rate equal to the higher of the Federal Funds rate in effect on that day plus 1.25% or the overnight LIBOR rate in effect on that day plus 1.25%. In addition, an annual commitment fee equal to 0.10% of the unused balance is allocated to each participating fund. Prior to September 6, 2011, the revolving credit agreement was for $125,000,000 and the annual commitment fee paid by the Fund was 0.125% of the unused balance. For the six months ended January 31, 2012, the Fund paid $242 in commitment fees.
For the six months ended January 31, 2012, there were no borrowings by the Fund under the agreement.
7. REDEMPTION IN-KIND
After the close of business on March 28, 2011, the Fund redeemed assets through an in-kind redemption. In the redemption transaction, the Fund issued securities with a value of $427,928,397 and cash in the amount of $23,965,784. The Fund recognized gains in the amount of $127,937,466 which are reflected on the Statement of Changes in Net Assets for the year ended July 31, 2011. The redemption in-kind represented 44.44% of the Fund.
8. INDEMNIFICATION
Under the Trust’s organizational documents, the officers and directors are indemnified against certain liabilities that may arise out of performance of their duties to the Trust. Additionally, in the normal course of business, the Trust may enter into contracts with service providers that contain a variety of indemnification clauses. The Trust’s maximum exposure under these arrangements is dependent on future claims that may be made against the Fund and, therefore, cannot be estimated.
9. NEW ACCOUNTING PRONOUNCEMENTS
In May 2011, the Financial Accounting Standards Board (“FASB”) issued Accounting Standards Update (“ASU”) No. 2011-04 “Amendments to Achieve Common Fair Value Measurement and Disclosure Requirements in U.S. GAAP and IFRSs”. ASU No. 2011-04 amends FASB ASC Topic 820, Fair Value Measurements and Disclosures, to establish common requirements for measuring fair value and for disclosing information about fair value measurements in accordance with GAAP. The ASU is effective prospectively for interim and annual periods beginning after December 15, 2011. Management expects that adoption of the ASU will result in additional disclosures in the financial statements, as applicable.
| | | | | | |
| Notes to Financial Statements (Unaudited) | | Wells Fargo Advantage Intrinsic Value Fund | | | 23 | |
In April 2011, FASB issued ASU No. 2011-03 “Reconsideration of Effective Control for Repurchase Agreements”. ASU No. 2011-03 amends FASB ASC Topic 860, Transfers and Servicing, specifically the criteria required to determine whether a repurchase agreement (repo) and similar agreements should be accounted for as sales of financial assets or secured borrowings with commitments. ASU No. 2011-03 changes the assessment of effective control by focusing on the transferor’s contractual rights and obligations and removing the criterion to assess its ability to exercise those rights or honor those obligations. This could result in changes to the way entities account for certain transactions including repurchase agreements, mortgage dollar rolls and reverse repurchase agreements. The ASU will become effective on a prospective basis for new transfers and modifications to existing transactions as of the beginning of the first interim or annual period beginning on or after December 15, 2011. Management has evaluated the impact of adopting the ASU and expects no significant changes.
| | | | |
| 24 | | Wells Fargo Advantage Intrinsic Value Fund | | Other Information (Unaudited) |
PROXY VOTING INFORMATION
A description of the policies and procedures that the Fund uses to determine how to vote proxies relating to portfolio securities is available without charge, upon request, by calling 1-800-222-8222, visiting our Web site at wellsfargoadvantagefunds.com, or visiting the SEC Web site at sec.gov. Information regarding how the Fund voted proxies relating to portfolio securities during the most recent 12-month period ended June 30 is available without charge on the Fund’s Web site at wellsfargoadvantagefunds.com or by visiting the SEC Web site at sec.gov.
PORTFOLIO HOLDINGS INFORMATION
The complete portfolio holdings for the Fund are publicly available on the Fund’s Web site (wellsfargoadvantagefunds.com) on a monthly, 30-day or more delayed basis. In addition, top ten holdings information for the Fund is publicly available on the Fund’s Web site on a monthly, seven-day or more delayed basis. The Fund files its complete schedule of portfolio holdings with the SEC for the first and third quarters of each fiscal year on Form N-Q, which is available without charge by visiting the SEC Web site at sec.gov. In addition, the Fund’s Form N-Q may be reviewed and copied at the SEC’s Public Reference Room in Washington, DC, and at regional offices in New York City, at 233 Broadway, and in Chicago, at 175 West Jackson Boulevard, Suite 900. Information about the Public Reference Room may be obtained by calling 1-800-SEC-0330.
| | | | | | |
| Other Information (Unaudited) | | Wells Fargo Advantage Intrinsic Value Fund | | | 25 | |
BOARD OF TRUSTEES
The following table provides basic information about the Board of Trustees (the “Trustees”) of the Trust and Officers of the Trust. This table should be read in conjunction with the Prospectus and the Statement of Additional Information1 of the Fund. Each of the Trustees and Officers listed below acts in identical capacities for the Wells Fargo Advantage family of funds, which consists of 137 funds comprising the Wells Fargo Funds Trust, Wells Fargo Variable Trust, Wells Fargo Master Trust and four closed-end funds (collectively the “Fund Complex”). All of the Trustees are also Members of the Audit and Governance Committees of each Trust in the Fund Complex. The mailing address of each Trustee and Officer is 525 Market Street, 12th Floor, San Francisco, CA 94105. Each Trustee and Officer serves an indefinite term, however, each Trustee serves such term until reaching the mandatory retirement age established by the Trustees.
Independent Trustees
| | | | | | |
Name and Year of Birth | | Position Held and Length of Service | | Principal Occupations During Past Five Years | | Other Directorships During
Past Five Years |
Peter G. Gordon
(Born 1942) | | Trustee, since 1998; Chairman, since 2005 (Lead Trustee since 2001) | | Co-Founder, Retired Chairman, President and CEO of Crystal Geyser Water Company. Trustee Emeritus, Colby College | | Asset Allocation Trust |
Isaiah Harris, Jr.
(Born 1952) | | Trustee, since 2009 | | Retired. Prior thereto, President and CEO of BellSouth Advertising and Publishing Corp. from 2005 to 2007, President and CEO of BellSouth Enterprises from 2004 to 2005 and President of BellSouth Consumer Services from 2000 to 2003. Emeritus member of the Iowa State University Foundation Board of Governors. Emeritus Member of the Advisory Board of Iowa State University School of Business. Mr. Harris is a certified public accountant. | | CIGNA Corporation; Deluxe Corporation; Asset Allocation Trust |
Judith M. Johnson
(Born 1949) | | Trustee, since 2008 | | Retired. Prior thereto, Chief Executive Officer and Chief Investment Officer of Minneapolis Employees Retirement Fund from 1996 to 2008. Ms. Johnson is an attorney, certified public accountant and a certified managerial accountant. | | Asset Allocation Trust |
Leroy Keith, Jr.
(Born 1939) | | Trustee, since 2010 | | Chairman, Bloc Global Services (development and construction). Trustee of the Evergreen Funds from 1983 to 2010. Former Managing Director, Almanac Capital Management (commodities firm), former Partner, Stonington Partners, Inc. (private equity fund), former Director, Obagi Medical Products Co. and former Director, Lincoln Educational Services. | | Trustee, Virtus Fund Complex (consisting of 40 portfolios as of 12/31/11); Asset Allocation Trust |
David F. Larcker
(Born 1950) | | Trustee, since 2009 | | James Irvin Miller Professor of Accounting at the Graduate School of Business, Stanford University, Director of Corporate Governance Research Program and Senior Faculty of The Rock Center for Corporate Governance since 2006. From 2005 to 2008, Professor of Accounting at the Graduate School of Business, Stanford University. Prior thereto, Ernst & Young Professor of Accounting at The Wharton School, University of Pennsylvania from 1985 to 2005. | | Asset Allocation Trust |
Olivia S. Mitchell
(Born 1953) | | Trustee, since 2006 | | International Foundation of Employee Benefit Plans Professor, Wharton School of the University of Pennsylvania since 1993. Director of Wharton’s Pension Research Council and Boettner Center on Pensions & Retirement Research, and Research Associate at the National Bureau of Economic Research. Previously, Cornell University Professor from 1978 to 1993. | | Asset Allocation Trust |
| | | | |
| 26 | | Wells Fargo Advantage Intrinsic Value Fund | | Other Information (Unaudited) |
| | | | | | |
Name and Year of Birth | | Position Held and Length of Service | | Principal Occupations During Past Five Years | | Other Directorships During
Past Five Years |
Timothy J. Penny
(Born 1951) | | Trustee, since 1996 | | President and CEO of Southern Minnesota Initiative Foundation, a non-profit organization, since 2007 and Senior Fellow at the Humphrey Institute Policy Forum at the University of Minnesota since 1995. Member of the Board of Trustees of NorthStar Education Finance, Inc., a non-profit organization, since 2007. | | Asset Allocation Trust |
Michael S. Scofield
(Born 1943) | | Trustee, since 2010 | | Served on the Investment Company Institute’s Board of Governors and Executive Committee from 2008-2011 as well the Governing Council of the Independent Directors Council from 2006-2011 and the Independent Directors Council Executive Committee from 2008-2011. Chairman of the IDC from 2008-2010. Institutional Investor (Fund Directions) Trustee of Year in 2007. Trustee of the Evergreen Funds (and its predecessors) from 1984 to 2010. Chairman of the Evergreen Funds from 2000-2010. Former Trustee of the Mentor Funds. Retired Attorney, Law Offices of Michael S. Scofield and former Director and Chairman, Branded Media Corporation (multi-media branding company). | | Asset Allocation Trust |
Donald C. Willeke
(Born 1940) | | Trustee, since 1996 | | Principal of the law firm of Willeke & Daniels. General Counsel of the Minneapolis Employees Retirement Fund from 1984 until its consolidation into the Minnesota Public Employees Retirement Association on June 30, 2010. Director and Vice Chair of The Free Trust (non-profit corporation). Director of the American Chestnut Foundation (non-profit corporation). | | Asset Allocation Trust |
Officers
| | | | | | |
Name and Year of Birth | | Position Held and
Length of Service | | Principal Occupations During Past Five Years | | |
Karla M. Rabusch
(Born 1959) | | President, since 2003 | | Executive Vice President of Wells Fargo Bank, N.A. and President of Wells Fargo Funds Management, LLC since 2003. Senior Vice President and Chief Administrative Officer of Wells Fargo Funds Management, LLC from 2001 to 2003. | | |
C. David Messman
(Born 1960) | | Secretary, since 2000; Chief Legal Counsel, since 2003 | | Senior Vice President and Secretary of Wells Fargo Funds Management, LLC since 2001. Vice President and Managing Senior Counsel of Wells Fargo Bank, N.A. since 1996. | | |
Kasey Phillips
(Born 1970) | | Treasurer, since 2009 | | Senior Vice President of Wells Fargo Funds Management, LLC since 2009. Senior Vice President of Evergreen Investment Management Company, LLC from 2006 to 2010. Treasurer of the Evergreen Funds from 2005 to 2010. | | |
David Berardi
(Born 1975) | | Assistant Treasurer, since 2009 | | Vice President of Wells Fargo Funds Management, LLC since 2009. Vice President of Evergreen Investment Management Company, LLC from 2008 to 2010. Assistant Vice President of Evergreen Investment Services, Inc. from 2004 to 2008. Manager of Fund Reporting and Control for Evergreen Investment Management Company, LLC from 2004 to 2010. | | |
Jeremy DePalma
(Born 1974) | | Assistant Treasurer, since 2009 | | Senior Vice President of Wells Fargo Funds Management, LLC since 2009. Senior Vice President of Evergreen Investment Management Company, LLC from 2008 to 2010. Vice President, Evergreen Investment Services, Inc. from 2004 to 2007. Head of the Fund Reporting and Control Team within Fund Administration from 2005 to 2010. | | |
Debra Ann Early
(Born 1964) | | Chief Compliance Officer, since 2007 | | Chief Compliance Officer of Wells Fargo Funds Management, LLC since 2007. Chief Compliance Officer of Parnassus Investments from 2005 to 2007. Chief Financial Officer of Parnassus Investments from 2004 to 2007 and Senior Audit Manager of PricewaterhouseCoopers LLP from 1998 to 2004. | | |
| 1. | The Statement of Additional Information includes additional information about the Trustees and is available, without charge, upon request, by calling 1-800-222-8222 or by visiting the Web site at wellsfargoadvantagefunds.com. |
| | | | | | |
| List of Abbreviations | | Wells Fargo Advantage Intrinsic Value Fund | | | 27 | |
The following is a list of common abbreviations for terms and entities which may have appeared in this report.
| ACB | — Agricultural Credit Bank |
| ADR | — American Depository Receipt |
| ADS | — American Depository Shares |
| AGC-ICC | — Assured Guaranty Corporation - Insured Custody Certificates |
| AGM | — Assured Guaranty Municipal |
| AMBAC | — American Municipal Bond Assurance Corporation |
| AMT | — Alternative Minimum Tax |
| BAN | — Bond Anticipation Notes |
| BHAC | — Berkshire Hathaway Assurance Corporation |
| CAB | — Capital Appreciation Bond |
| CCAB | — Convertible Capital Appreciation Bond |
| CDA | — Community Development Authority |
| CDO | — Collateralized Debt Obligation |
| COP | — Certificate of Participation |
| DRIVER | — Derivative Inverse Tax-Exempt Receipts |
| DW&P | — Department of Water & Power |
| DWR | — Department of Water Resources |
| ECFA | — Educational & Cultural Facilities Authority |
| EDA | — Economic Development Authority |
| EDFA | — Economic Development Finance Authority |
| ETF | — Exchange-Traded Fund |
| FFCB | — Federal Farm Credit Bank |
| FGIC | — Financial Guaranty Insurance Corporation |
| FHA | — Federal Housing Authority |
| FHLB | — Federal Home Loan Bank |
| FHLMC | — Federal Home Loan Mortgage Corporation |
| FNMA | — Federal National Mortgage Association |
| GDR | — Global Depository Receipt |
| GNMA | — Government National Mortgage Association |
| HCFR | — Healthcare Facilities Revenue |
| HEFA | — Health & Educational Facilities Authority |
| HEFAR | — Higher Education Facilities Authority Revenue |
| HFA | — Housing Finance Authority |
| HFFA | — Health Facilities Financing Authority |
| IBC | — Insured Bond Certificate |
| IDA | — Industrial Development Authority |
| IDAG | — Industrial Development Agency |
| IDR | — Industrial Development Revenue |
| KRW | — Republic of Korea Won |
| LIBOR | — London Interbank Offered Rate |
| LLC | — Limited Liability Company |
| LLP | — Limited Liability Partnership |
| MBIA | — Municipal Bond Insurance Association |
| MFHR | — Multi-Family Housing Revenue |
| MSTR | — Municipal Securities Trust Receipts |
| MUD | — Municipal Utility District |
| NATL-RE | — National Public Finance Guarantee Corporation |
| PCFA | — Pollution Control Finance Authority |
| PCR | — Pollution Control Revenue |
| PFA | — Public Finance Authority |
| PFFA | — Public Facilities Financing Authority |
| PFOTER | — Puttable Floating Option Tax-Exempt Receipts |
| plc | — Public Limited Company |
| PUTTER | — Puttable Tax-Exempt Receipts |
| R&D | — Research & Development |
| RDA | — Redevelopment Authority |
| RDFA | — Redevelopment Finance Authority |
| REIT | — Real Estate Investment Trust |
| ROC | — Reset Option Certificates |
| SAVRS | — Select Auction Variable Rate Securities |
| SBA | — Small Business Authority |
| SFHR | — Single Family Housing Revenue |
| SFMR | — Single Family Mortgage Revenue |
| SPDR | — Standard & Poor’s Depositary Receipts |
| TAN | — Tax Anticipation Notes |
| TIPS | — Treasury Inflation-Protected Securities |
| TRAN | — Tax Revenue Anticipation Notes |
| TCR | — Transferable Custody Receipts |
| TTFA | — Transportation Trust Fund Authority |
| TVA | — Tennessee Valley Authority |
| XLCA | — XL Capital Assurance |
This page is intentionally left blank.
This page is intentionally left blank.
This page is intentionally left blank.


FOR MORE INFORMATION
More information about Wells Fargo Advantage Funds is available free upon request. To obtain literature, please write, e-mail, visit the Fund’s Web site, or call:
Wells Fargo Advantage Funds
P.O. Box 8266
Boston, MA 02266-8266
E-mail: wfaf@wellsfargo.com
Web site: wellsfargoadvantagefunds.com
Individual investors: 1-800-222-8222
Retail investment professionals: 1-888-877-9275
Institutional investment professionals: 1-866-765-0778
This report and the financial statements contained herein are submitted for the general information of the shareholders of Wells Fargo Advantage Funds. If this report is used for promotional purposes, distribution of the report must be accompanied or preceded by a current prospectus. For a prospectus containing more complete information, including charges and expenses, call 1-800-222-8222 or visit the Fund’s Web site at wellsfargoadvantagefunds.com. Please consider the investment objectives, risks, charges, and expenses of the investment carefully before investing. This and other information about Wells Fargo Advantage Funds can be found in the current prospectus. Read the prospectus carefully before you invest or send money.
Wells Fargo Funds Management, LLC, a wholly owned subsidiary of Wells Fargo & Company, provides investment advisory and administrative services for Wells Fargo Advantage Funds. Other affiliates of Wells Fargo & Company provide subadvisory and other services for the Funds. The Funds are distributed by Wells Fargo Funds Distributor, LLC, Member FINRA/SIPC, an affiliate of Wells Fargo & Company.
NOT FDIC INSURED ¡ NO BANK GUARANTEE ¡ MAY LOSE VALUE
© 2012 Wells Fargo Funds Management, LLC. All rights reserved.
| | |
 | | 207947 03-12 SA207/SAR207 1-12 |

Wells Fargo Advantage
Large Cap Core Fund

Semi-Annual Report
January 31, 2012

Reduce clutter. Save trees.
Sign up for electronic delivery of prospectuses and shareholder reports at wellsfargo.com/advantagedelivery
Contents
The views expressed and any forward-looking statements are as of January 31, 2012, unless otherwise noted, and are those of the Fund managers and/or Wells Fargo Funds Management, LLC. Discussions of individual securities, or the markets generally, or any Wells Fargo Advantage Fund are not intended as individual recommendations. Future events or results may vary significantly from those expressed in any forward-looking statements; the views expressed are subject to change at any time in response to changing circumstances in the market. Wells Fargo Funds Management, LLC, disclaims any obligation to publicly update or revise any views expressed or forward-looking statements.
NOT FDIC INSURED ¡ NO BANK GUARANTEE ¡ MAY LOSE VALUE

WELLS FARGO INVESTMENT HISTORY
| | |
| |
| 1932 | | Keystone creates one of the first mutual fund families. |
| |
| 1971 | | Wells Fargo & Company introduces one of the first institutional index funds. |
| |
| 1978 | | Wells Fargo applies Markowitz and Sharpe’s research on Modern Portfolio Theory to introduce one of the industry’s first Tactical Asset Allocation (TAA) models in institutional separately managed accounts. |
| |
| 1984 | | Wells Fargo Stagecoach Funds launches its first asset allocation fund. |
| |
| 1989 | | The Tactical Asset Allocation (TAA) Model is first applied to Wells Fargo’s asset allocation mutual funds. |
| |
| 1994 | | Wells Fargo introduces the LifePath Funds, one of the first suites of target date funds (now the Wells Fargo Advantage Dow Jones Target Date FundsSM ). |
| |
| 1996 | | Evergreen Investments and Keystone Funds merge. |
| |
| 1997 | | Wells Fargo launches Wells Fargo Advantage WealthBuilder PortfoliosSM, a fund-of-funds suite of products that includes the use of quantitative models to shift assets among investment styles. |
| |
| 1999 | | Norwest Advantage Funds and Stagecoach Funds are reorganized into Wells Fargo Funds after the merger of Norwest and Wells Fargo. |
| |
| 2002 | | Evergreen Retail and Evergreen Institutional companies form the umbrella asset management company, Evergreen Investments. |
| |
| 2005 | | The integration of Strong Funds with Wells Fargo Funds creates Wells Fargo Advantage Funds, resulting in one of the top 20 mutual fund companies in the United States. |
| |
| 2006 | | Wells Fargo Advantage Funds relaunches the target date product line as Wells Fargo Advantage Dow Jones Target Date Funds. |
| |
| 2010 | | The mergers and reorganizations of Evergreen and Wells Fargo Advantage mutual funds are completed, unifying the families under the brand of Wells Fargo Advantage Funds. |
Wells Fargo Advantage Funds®
Wells Fargo Advantage Funds skillfully guides institutions, financial advisors, and individuals through the investment terrain to help them reach their financial objectives. Everything we do on behalf of investors is backed by our unique combination of qualifications.
Strength
Our organization is built on the standards of integrity and service established by our parent company—Wells Fargo & Company—more than 150 years ago. And, because we’re part of a highly diversified financial enterprise, we offer the depth of resources to help investors succeed.
Expertise
Our multi-boutique model offers investors access to the independent thinking of premier investment managers that have been chosen for their time-tested strategies. While each team specializes in a specific investment strategy, collectively they provide investors a wide choice of distinct investment styles. Our dedication to investment excellence doesn’t end with our expertise in manager selection—risk management, analysis, and rigorous ongoing review seek to ensure each manager’s investment process remains consistent.
Partnership
Our collaborative approach is built around understanding the needs and goals of our clients. By adhering to core principles of sound judgment and steady guidance, we support you through every stage of the investment decision process.
Carefully consider a fund’s investment objectives, risks, charges, and expenses before investing. For a current prospectus and, if available, a summary prospectus, containing this and other information, visit wellsfargoadvantagefunds.com. Read it carefully before investing.
Wells Fargo Funds Management, LLC, a wholly owned subsidiary of Wells Fargo & Company, provides investment advisory and administrative services for Wells Fargo Advantage Funds®. Other affiliates of Wells Fargo & Company provide subadvisory and other services for the Funds. The Funds are distributed by Wells Fargo Funds Distributor, LLC, Member FINRA/SIPC, an affiliate of Wells Fargo & Company.
“Dow Jones®” and “Dow Jones Target Date IndexesSM” are service marks of Dow Jones Trademark Holdings, LLC (“Dow Jones”), have been licensed to CME Group Index Services LLC (“CME Indexes”) and have been sublicensed for use for certain purposes by Global Index Advisors, Inc, and Wells Fargo Funds Management, LLC. The Wells Fargo Advantage Dow Jones Target Date FundsSM based on the Dow Jones Target Date IndexesSM, are not sponsored, endorsed, sold or promoted by Dow Jones, CME Indexes or their respective affiliates and none of them makes any representation regarding the advisability of investing in such product(s).
NOT FDIC INSURED ¡ NO BANK GUARANTEE ¡ MAY LOSE VALUE
Not part of the semi-annual report.
Wells Fargo Advantage Funds offers more than 110 mutual funds across a wide range of asset classes, representing over $217 billion in assets under management, as of January 31, 2012.
| | | | |
| Equity Funds | | | | |
Asia Pacific Fund | | Equity Value Fund | | Precious Metals Fund |
C&B Large Cap Value Fund | | Global Opportunities Fund | | Premier Large Company Growth Fund |
C&B Mid Cap Value Fund | | Growth Fund | | Small Cap Opportunities Fund |
Capital Growth Fund | | Index Fund | | Small Cap Value Fund |
Common Stock Fund | | International Equity Fund | | Small Company Growth Fund |
Disciplined U.S. Core Fund | | International Value Fund | | Small Company Value Fund |
Discovery Fund† | | Intrinsic Small Cap Value Fund | | Small/Mid Cap Core Fund |
Diversified Equity Fund | | Intrinsic Value Fund | | Small/Mid Cap Value Fund |
Diversified International Fund | | Intrinsic World Equity Fund | | Special Mid Cap Value Fund |
Diversified Small Cap Fund | | Large Cap Core Fund | | Special Small Cap Value Fund |
Emerging Growth Fund | | Large Cap Growth Fund | | Specialized Technology Fund |
Emerging Markets Equity Fund | | Large Company Value Fund | | Strategic Large Cap Growth Fund |
Endeavor Select Fund† | | Omega Growth Fund | | Traditional Small Cap Growth Fund |
Enterprise Fund† | | Opportunity Fund† | | Utility and Telecommunications Fund |
| Bond Funds | | | | |
Adjustable Rate Government Fund | | Inflation-Protected Bond Fund | | Short-Term Bond Fund |
California Limited-Term Tax-Free Fund | | Intermediate Tax/AMT-Free Fund | | Short-Term High Yield Bond Fund |
California Tax-Free Fund | | International Bond Fund | | Short-Term Municipal Bond Fund |
Colorado Tax-Free Fund | | Minnesota Tax-Free Fund | | Strategic Municipal Bond Fund |
Government Securities Fund | | Municipal Bond Fund | | Total Return Bond Fund |
High Income Fund | | North Carolina Tax-Free Fund | | Ultra Short-Term Income Fund |
High Yield Bond Fund | | Pennsylvania Tax-Free Fund | | Ultra Short-Term Municipal Income Fund |
Income Plus Fund | | Short Duration Government Bond Fund | | Wisconsin Tax-Free Fund |
| Asset Allocation Funds | | | | |
Absolute Return Fund | | WealthBuilder Equity Portfolio† | | Target 2020 Fund† |
Asset Allocation Fund | | WealthBuilder Growth Allocation Portfolio† | | Target 2025 Fund† |
Conservative Allocation Fund | | WealthBuilder Growth Balanced Portfolio† | | Target 2030 Fund† |
Diversified Capital Builder Fund | | WealthBuilder Moderate Balanced Portfolio† | | Target 2035 Fund† |
Diversified Income Builder Fund | | WealthBuilder Tactical Equity Portfolio† | | Target 2040 Fund† |
Growth Balanced Fund | | Target Today Fund† | | Target 2045 Fund† |
Index Asset Allocation Fund | | Target 2010 Fund† | | Target 2050 Fund† |
Moderate Balanced Fund | | Target 2015 Fund† | | Target 2055 Fund† |
WealthBuilder Conservative Allocation Portfolio† | | | | |
| Money Market Funds | | | | |
100% Treasury Money Market Fund | | Heritage Money Market Fund† | | National Tax-Free Money Market Fund |
California Municipal Money Market Fund | | Money Market Fund | | Prime Investment Money Market Fund |
Cash Investment Money Market Fund | | Municipal Cash Management Money Market Fund | | Treasury Plus Money Market Fund |
Government Money Market Fund | | Municipal Money Market Fund | | |
| Variable Trust Funds1 | | | | |
VT Discovery Fund† | | VT Intrinsic Value Fund | | VT Small Cap Growth Fund |
VT Index Asset Allocation Fund | | VT Omega Growth Fund | | VT Small Cap Value Fund |
VT International Equity Fund | | VT Opportunity Fund† | | VT Total Return Bond Fund |
An investment in a money market fund is not insured or guaranteed by the Federal Deposit Insurance Corporation or any other government agency. Although the Wells Fargo Advantage Money Market Funds seek to preserve the value of your investment at $1.00 per share, it is possible to lose money by investing in a money market fund.
| 1. | The Variable Trust Funds are generally available only through insurance company variable contracts. |
| † | In this report, the Wells Fargo Advantage Discovery FundSM, Wells Fargo Advantage Endeavor Select FundSM, Wells Fargo Advantage Enterprise FundSM, Wells Fargo Advantage Opportunity FundSM, Wells Fargo Advantage WealthBuilder Conservative Allocation PortfolioSM, Wells Fargo Advantage WealthBuilder Equity PortfolioSM, Wells Fargo Advantage WealthBuilder Growth Allocation PortfolioSM, Wells Fargo Advantage WealthBuilder Growth Balanced PortfolioSM, Wells Fargo Advantage WealthBuilder Moderate Balanced PortfolioSM, Wells Fargo Advantage WealthBuilder Tactical Equity PortfolioSM, Wells Fargo Advantage Dow Jones Target Today FundSM, Wells Fargo Advantage Dow Jones Target 2010 FundSM, Wells Fargo Advantage Dow Jones Target 2015 FundSM, Wells Fargo Advantage Dow Jones Target 2020 FundSM, Wells Fargo Advantage Dow Jones Target 2025 FundSM, Wells Fargo Advantage Dow Jones Target 2030 FundSM, Wells Fargo Advantage Dow Jones Target 2035 FundSM, Wells Fargo Advantage Dow Jones Target 2040 FundSM, Wells Fargo Advantage Dow Jones Target 2045 FundSM, Wells Fargo Advantage Dow Jones Target 2050 FundSM, Wells Fargo Advantage Dow Jones Target 2055 FundSM, Wells Fargo Advantage Heritage Money Market FundSM, Wells Fargo Advantage VT Discovery FundSM, and Wells Fargo Advantage VT Opportunity FundSM are referred to as the Discovery Fund, Endeavor Select Fund, Enterprise Fund, Opportunity Fund, WealthBuilder Conservative Allocation Portfolio, WealthBuilder Equity Portfolio, WealthBuilder Growth Allocation Portfolio, WealthBuilder Growth Balanced Portfolio, WealthBuilder Moderate Balanced Portfolio, WealthBuilder Tactical Equity Portfolio, Target Today Fund, Target 2010 Fund, Target 2015 Fund, Target 2020 Fund, Target 2025 Fund, Target 2030 Fund, Target 2035 Fund, Target 2040 Fund, Target 2045 Fund, Target 2050 Fund, Target 2055 Fund, Heritage Money Market Fund, VT Discovery Fund, and VT Opportunity Fund, respectively. |
Not part of the semi-annual report.
| | | | |
| 2 | | Wells Fargo Advantage Large Cap Core Fund | | Letter to Shareholders |

Karla M. Rabusch,
President
Wells Fargo Advantage Funds
The period was marked by increased confidence that the U.S. economy was staging a fragile recovery, offset by continued concerns about the possible effect on the global economy of the ongoing European sovereign debt crisis—which began in Greece and later spread to the larger economies of Italy and Spain.
The slow-motion debt crisis in the eurozone was a major headwind to both domestic and global stock market indexes.
Dear Valued Shareholder,
We’re pleased to offer you this semi-annual report for the Wells Fargo Advantage Large Cap Core Fund for the six-month period that ended January 31, 2012. The period was marked by increased confidence that the U.S. economy was staging a fragile recovery, offset by continued concerns about the possible effect on the global economy of the ongoing European sovereign debt crisis—which began in Greece and later spread to the larger economies of Italy and Spain. Most U.S. stock indexes posted gains for the period, even if only modest ones.
Worries gave way to guarded optimism for the U.S. economy.
The period began with worries that the U.S. economy was returning to recession. Revised figures for gross domestic product (GDP) indicated that the U.S. economy grew by an annualized rate of only 0.8% in the first half of 2011. Moreover, although the July 2011 Institute for Supply Management (ISM) manufacturing survey suggested that factories continued to expand, the rate of expansion was lower than in previous months. The prolonged debate over whether and how to raise the U.S. debt ceiling—which only ended on July 31, 2011—also depressed market sentiment by highlighting the country’s political divisions.
The stock market remained volatile throughout September. By late October, however, stronger economic data led to greater optimism and higher stock prices. Revised real GDP growth came in at 1.8% in the third quarter of 2011 and 2.8% in the fourth quarter, suggesting that the recovery was on firmer footing. Economic growth was not evenly distributed, though, as December 2011 retail same-store sales generally showed stronger growth for retailers targeting affluent customers than for those targeting the broad middle class. The reported unemployment rate also showed some signs of improvement, falling from 9.1% in August 2011 to 8.3% in January 2012. However, this decline in the unemployment rate was accompanied by an increase in the number of Americans not in the labor force, raising concerns about the economy’s ability to generate jobs.
The eurozone had continued trouble.
The slow-motion debt crisis in the eurozone was a major headwind to both domestic and global stock market indexes. The worsening debt and deficit numbers for Greece in late 2011 and early 2012 cast doubt on the country’s ability to service its debt under the plan put in place by the European Union and the International Monetary Fund and put the ongoing drama of the European sovereign debt crisis back on center stage. Investors became increasingly concerned that Greece would default on its debt, a scenario that only seemed more likely as many Greeks rioted in response to greater budgetary austerity and the discussion moved from whether private investors would take a loss on their Greek debt to how big the loss would be. Because many eurozone banks owned Greek debt and many U.S. banks had financial ties to eurozone banks, investors worried about the effect of such an event on the financial system and the global economy.
Even as the situation in Greece deteriorated, eurozone GDP numbers supported the case for a modest recovery in the global economy. Reported GDP growth for the 17 countries that comprise the eurozone was modest, rising 0.2% in the third quarter compared to the second quarter, and by 0.2% in the fourth quarter
| | | | | | |
| Letter to Shareholders | | Wells Fargo Advantage Large Cap Core Fund | | | 3 | |
compared to the third quarter. However, the eurozone average concealed a wide variation between economies, with Germany’s growing by 0.5% in the third quarter of 2011 even as Greece’s GDP contracted.
Central banks continued to provide stimulus.
Throughout the reporting period, the Federal Open Market Committee (FOMC) kept its key interest rates effectively at zero in order to support the economy and financial system. Moreover, in response to extreme market volatility and signs of a weakening economy, in its August 2011 policy statement, the Federal Reserve (Fed) announced it would keep interest rates “exceptionally low” until at least mid-2013 as a way to support the economy. Market participants interpreted the Fed’s statement to mean that the central bankers believed the economy would remain weak over the next two years. However, the Fed also said that it was considering a “range of policy tools available to promote a stronger economic recovery” and “is prepared to employ these tools as appropriate.”
At the beginning of the period, the European Central Bank (ECB) had a key rate of 1.50% but lowered it to 1.25% in November 2011 and then to 1.00% in December 2011 in an attempt to support the sluggish eurozone recovery. To support the banking system, in late 2011, the ECB initiated a long-term refinancing operation (LTRO) in which it supplied three-year loans to banks against a wide range of collateral. The operation basically provided a near-unlimited amount of liquidity to banks, easing some investor concerns about the effect of an increasingly probable Greek default.
We use time-tested investment strategies, even as many variables are at work in the market.
Experience tells us that strict adherence to time-tested investment strategies has its rewards. As a whole, Wells Fargo Advantage Funds represents investments across a range of asset classes and investment styles, giving you an opportunity to create a diversified investment portfolio. While diversification may not prevent losses in a downturn, it does provide you with one way of managing risk.
Thank you for choosing to invest with Wells Fargo Advantage Funds. We appreciate your confidence in us and remain committed to helping you meet your financial needs. For current information about your fund investments, contact your investment professional, visit our website at wellsfargoadvantagefunds.com, or call us directly at 1-800-222-8222. We are available 24 hours a day, 7 days a week.
Sincerely,

Karla M. Rabusch
President
Wells Fargo Advantage Funds
| | | | |
| 4 | | Wells Fargo Advantage Large Cap Core Fund | | Letter to Shareholders |
Notice to Shareholders
The Board of Trustees for Wells Fargo Advantage Funds has unanimously approved the following modifications to certain net asset value (NAV) waiver privileges and commission schedules:
| | n | | Effective May 1, 2012, automatic investment plan (AIP) purchases and proceeds received from systematic withdrawals will no longer qualify for NAV repurchase privileges. | |
| | n | | Effective May 1, 2012, discretionary rights to waive the upfront commission for Class C and “jumbo” Class A share purchases will no longer be granted to broker/dealers. However, we will continue to waive the Class C shares contingent deferred sales charge for redemptions by employer-sponsored retirement plans where the dealer of record waived its commission at the time of purchase. | |
| | n | | Effective July 31, 2012, NAV purchase privileges for former Evergreen Class IS and Class R shareholders are being modified to remove the ability to purchase Class A shares at NAV unless those shares are held directly with the Fund on or after July 31, 2012. | |
Please contact your investment professional or call us directly at 1-800-222-8222 if you have any questions on this Notice to Shareholders.
| | | | | | |
| Performance Highlights (Unaudited) | | Wells Fargo Advantage Large Cap Core Fund | | | 5 | |
INVESTMENT OBJECTIVE
The Fund seeks long-term capital appreciation.
ADVISER
Wells Fargo Funds Management, LLC
SUB-ADVISER
Golden Capital Management, LLC
PORTFOLIO MANAGER
Jeff C. Moser, CFA
FUND INCEPTION
December 17, 2007
| | | | |
TEN LARGEST EQUITY HOLDINGS1
(AS OF JANUARY 31, 2012) | | | |
Home Depot Incorporated | | | 2.50% | |
International Business Machines Corporation | | | 2.41% | |
Apple Incorporated | | | 2.39% | |
Chevron Corporation | | | 2.34% | |
CVS Caremark Corporation | | | 2.29% | |
CBS Corporation Class B | | | 2.28% | |
Exxon Mobil Corporation | | | 2.23% | |
Union Pacific Corporation | | | 2.23% | |
Tyco International Limited | | | 2.21% | |
Comcast Corporation Class A | | | 2.20% | |
| | |
SECTOR DISTRIBUTION2
(AS OF JANUARY 31, 2012) | | |
|
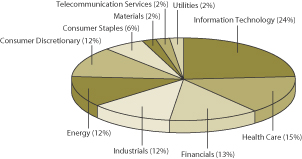 |
| 1. | The ten largest equity holdings are calculated based on the value of the securities divided by total net assets of the Fund. Holdings are subject to change and may have changed since the date specified. |
| 2. | Sector distribution is subject to change and is calculated based on the total long-term investments of the Fund. |
| | | | |
| 6 | | Wells Fargo Advantage Large Cap Core Fund | | Performance Highlights (Unaudited) |
AVERAGE ANNUAL TOTAL RETURN3 (%) (AS OF JANUARY 31, 2012)
| | | | | | | | | | | | | | | | | | | | | | | | | | | | | | | | | | | | |
| | | | | | Including Sales Charge | | | Excluding Sales Charge | | | Expense Ratios4 | |
| | | Inception Date | | | 6 Months* | | | 1 Year | | | Life of Fund | | | 6 Months* | | | 1 Year | | | Life of Fund | | | Gross | | | Net5 | |
Class A (EGOAX) | | | 12/17/2007 | | | | (3.26 | ) | | | (2.63 | ) | | | (3.30 | ) | | | 2.60 | | | | 3.31 | | | | (1.90 | ) | | | 1.30% | | | | 1.14% | |
Class C (EGOCX) | | | 12/17/2007 | | | | 1.18 | | | | 1.42 | | | | (2.61 | ) | | | 2.18 | | | | 2.42 | | | | (2.61 | ) | | | 2.05% | | | | 1.89% | |
Administrator Class (WFLLX) | | | 07/16/2010 | | | | | | | | | | | | | | | | 2.70 | | | | 3.53 | | | | (1.78 | ) | | | 1.14% | | | | 0.90% | |
Institutional Class (EGOIX) | | | 12/17/2007 | | | | | | | | | | | | | | | | 2.84 | | | | 3.67 | | | | (1.56 | ) | | | 0.87% | | | | 0.66% | |
Investor Class (WFLNX) | | | 07/16/2010 | | | | | | | | | | | | | | | | 2.54 | | | | 3.25 | | | | (2.10 | ) | | | 1.37% | | | | 1.21% | |
S&P 500 Index6 | | | | | | | | | | | | | | | | | | | 2.71 | | | | 4.22 | | | | (0.15 | ) | | | | | | | | |
| * | Returns for periods of less than one year are not annualized. |
Figures quoted represent past performance, which is no guarantee of future results and do not reflect the deduction of taxes that a shareholder may pay on fund distributions or the redemption of fund shares. Investment return and principal value of an investment will fluctuate so that an investor’s shares, when redeemed, may be worth more or less than their original cost. Performance shown without sales charges would be lower if sales charges were reflected. Current performance may be lower or higher than the performance data quoted and assumes the reinvestment of dividends and capital gains. Current month-end performance is available on the Fund’s Web site – wellsfargoadvantagefunds.com
Index returns do not include transaction costs associated with buying and selling securities, any mutual fund fees or expenses or any taxes. It is not possible to invest directly in an index.
For Class A shares, the maximum front-end sales charge is 5.75%. For Class C shares, the maximum contingent deferred sales charge is 1.00%. Performance including sales charge assumes the sales charge for the corresponding time period. Administrator Class, Institutional Class and Investor Class shares are sold without a front-end sales charge or contingent deferred sales charge.
Stock fund values fluctuate in response to the activities of individual companies and general market and economic conditions. The use of derivatives may reduce returns and/or increase volatility. Certain investment strategies tend to increase the total risk of an investment (relative to the broader market). This Fund is exposed to foreign investment risk. Consult the Fund’s prospectus for additional information on these and other risks.
| 3. | Historical performance shown for the Administrator Class and Investor Class shares prior to their inception reflects the performance of the Institutional Class shares, adjusted to reflect higher expenses applicable to the Administrator Class and Investor Class shares. Historical performance shown for all classes of the Fund prior to July 19, 2010 is based on the performance of the Fund’s predecessor, Evergreen Golden Large Cap Core Fund. |
| 4. | Reflects the expense ratios as stated in the most recent prospectuses. |
| 5. | The Adviser has committed through July 18, 2013 to waive fees and/or reimburse expenses to the extent necessary to cap the Fund’s Total Annual Fund Operating Expenses After Fee Waiver, excluding certain expenses, at the amounts shown above. Without this cap, the Fund’s returns would have been lower. |
| 6. | The S&P 500 Index consists of 500 stocks chosen for market size, liquidity, and industry group representation. It is a market-value weighted index with each stock’s weight in the index proportionate to its market value. You cannot invest directly in an index. |
| | | | | | |
| Fund Expenses (Unaudited) | | Wells Fargo Advantage Large Cap Core Fund | | | 7 | |
As a shareholder of the Fund, you incur two types of costs: (1) transaction costs, including sales charges (loads) on purchase payments and contingent deferred sales charges (if any) on redemptions and (2) ongoing costs, including management fees; distribution (12b-1) and/or shareholder service fees; and other Fund expenses. This example is intended to help you understand your ongoing costs (in dollars) of investing in the Fund and to compare these costs with the ongoing costs of investing in other mutual funds.
The example is based on an investment of $1,000 invested at the beginning of the six-month period and held for the entire period from August 1, 2011 to January 31, 2012.
Actual Expenses
The “Actual” line of the table below provides information about actual account values and actual expenses. You may use the information in this line, together with the amount you invested, to estimate the expenses that you paid over the period. Simply divide your account value by $1,000 (for example, an $8,600 account value divided by $1,000 = 8.6), then multiply the result by the number in the “Actual” line under the heading entitled “Expenses Paid During Period” for your applicable class of shares to estimate the expenses you paid on your account during this period.
Hypothetical Example for Comparison Purposes
The “Hypothetical” line of the table below provides information about hypothetical account values and hypothetical expenses based on the Fund’s actual expense ratio and an assumed rate of return of 5% per year before expenses, which is not the Fund’s actual return. The hypothetical account values and expenses may not be used to estimate the actual ending account balance or expenses you paid for the period. You may use this information to compare the ongoing costs of investing in the Fund and other funds. To do so, compare this 5% hypothetical example with the 5% hypothetical examples that appear in the shareholder reports of the other funds.
Please note that the expenses shown in the table are meant to highlight your ongoing costs only and do not reflect any transactional costs, such as sales charges (loads) and contingent deferred sales charges. Therefore, the “Hypothetical” line of the table is useful in comparing ongoing costs only, and will not help you determine the relative total costs of owning different funds. In addition, if these transactional costs were included, your costs would have been higher.
| | | | | | | | | | | | | | | | |
| | | Beginning
Account Value
08-01-2011 | | | Ending
Account Value
01-31-2012 | | | Expenses
Paid During
the Period1 | | | Net Annual
Expense Ratio | |
Class A | | | | | | | | | | | | | | | | |
Actual | | $ | 1,000.00 | | | $ | 1,026.03 | | | $ | 5.81 | | | | 1.14 | % |
Hypothetical (5% return before expenses) | | $ | 1,000.00 | | | $ | 1,019.41 | | | $ | 5.79 | | | | 1.14 | % |
Class C | | | | | | | | | | | | | | | | |
Actual | | $ | 1,000.00 | | | $ | 1,021.81 | | | $ | 9.61 | | | | 1.89 | % |
Hypothetical (5% return before expenses) | | $ | 1,000.00 | | | $ | 1,015.63 | | | $ | 9.58 | | | | 1.89 | % |
Administrator Class | | | | | | | | | | | | | | | | |
Actual | | $ | 1,000.00 | | | $ | 1,027.04 | | | $ | 4.59 | | | | 0.90 | % |
Hypothetical (5% return before expenses) | | $ | 1,000.00 | | | $ | 1,020.61 | | | $ | 4.57 | | | | 0.90 | % |
Institutional Class | | | | | | | | | | | | | | | | |
Actual | | $ | 1,000.00 | | | $ | 1,028.40 | | | $ | 3.37 | | | | 0.66 | % |
Hypothetical (5% return before expenses) | | $ | 1,000.00 | | | $ | 1,021.82 | | | $ | 3.35 | | | | 0.66 | % |
Investor Class | | | | | | | | | | | | | | | | |
Actual | | $ | 1,000.00 | | | $ | 1,025.45 | | | $ | 6.16 | | | | 1.21 | % |
Hypothetical (5% return before expenses) | | $ | 1,000.00 | | | $ | 1,019.05 | | | $ | 6.14 | | | | 1.21 | % |
| 1. | Expenses paid is equal to the annualized expense ratio of each class multiplied by the average account value over the period, multiplied by the number of days in the most recent fiscal half-year divided by the number of days in the fiscal year (to reflect the one-half year period). |
| | | | |
| 8 | | Wells Fargo Advantage Large Cap Core Fund | | Portfolio of Investments—January 31, 2012 (Unaudited) |
| | | | | | | | | | | | |
| Security Name | | | | | | Shares | | | Value | |
| | | | |
Common Stocks: 98.86% | | | | | | | | | | | | |
| | | | |
Consumer Discretionary: 11.36% | | | | | | | | | | | | |
| | | | |
| Media: 4.48% | | | | | | | | | | | | |
CBS Corporation Class B | | | | | | | 132,405 | | | $ | 3,770,894 | |
Comcast Corporation Class A | | | | | | | 137,377 | | | | 3,652,854 | |
| | | | |
| | | | | | | | | | | 7,423,748 | |
| | | | | | | | | | | | |
| | | | |
| Specialty Retail: 6.88% | | | | | | | | | | | | |
Foot Locker Incorporated« | | | | | | | 138,408 | | | | 3,631,826 | |
Home Depot Incorporated | | | | | | | 93,333 | | | | 4,143,052 | |
Ross Stores Incorporated« | | | | | | | 71,470 | | | | 3,632,105 | |
| | | | |
| | | | | | | | | | | 11,406,983 | |
| | | | | | | | | | | | |
| | | | |
Consumer Staples: 6.05% | | | | | | | | | | | | |
| | | | |
| Food & Staples Retailing: 4.24% | | | | | | | | | | | | |
CVS Caremark Corporation | | | | | | | 90,846 | | | | 3,792,821 | |
Wal-Mart Stores Incorporated« | | | | | | | 52,652 | | | | 3,230,727 | |
| | | | |
| | | | | | | | | | | 7,023,548 | |
| | | | | | | | | | | | |
| | | | |
| Personal Products: 1.81% | | | | | | | | | | | | |
Herbalife Limited | | | | | | | 51,783 | | | | 2,997,200 | |
| | | | | | | | | | | | |
| | | | |
Energy: 12.02% | | | | | | | | | | | | |
| | | | |
| Energy Equipment & Services: 3.33% | | | | | | | | | | | | |
Halliburton Company | | | | | | | 68,750 | | | | 2,528,625 | |
National Oilwell Varco Incorporated« | | | | | | | 40,500 | | | | 2,996,190 | |
| | | | |
| | | | | | | | | | | 5,524,815 | |
| | | | | | | | | | | | |
| | | | |
| Oil, Gas & Consumable Fuels: 8.69% | | | | | | | | | | | | |
Chevron Corporation | | | | | | | 37,619 | | | | 3,877,767 | |
ConocoPhillips | | | | | | | 51,665 | | | | 3,524,070 | |
Exxon Mobil Corporation | | | | | | | 44,141 | | | | 3,696,367 | |
Occidental Petroleum Corporation | | | | | | | 33,065 | | | | 3,298,895 | |
| | | | |
| | | | | | | | | | | 14,397,099 | |
| | | | | | | | | | | | |
| | | | |
Financials: 12.83% | | | | | | | | | | | | |
| | | | |
| Capital Markets: 3.68% | | | | | | | | | | | | |
Ameriprise Financial Incorporated | | | | | | | 60,014 | | | | 3,213,750 | |
Raymond James Financial Incorporated | | | | | | | 82,566 | | | | 2,889,810 | |
| | | | |
| | | | | | | | | | | 6,103,560 | |
| | | | | | | | | | | | |
| | | | |
| Commercial Banks: 3.84% | | | | | | | | | | | | |
Fifth Third Bancorp | | | | | | | 243,358 | | | | 3,166,088 | |
US Bancorp | | | | | | | 113,090 | | | | 3,191,400 | |
| | | | |
| | | | | | | | | | | 6,357,488 | |
| | | | | | | | | | | | |
| | | | |
| Diversified Financial Services: 1.58% | | | | | | | | | | | | |
JPMorgan Chase & Company | | | | | | | 70,296 | | | | 2,622,041 | |
| | | | | | | | | | | | |
| | | | | | |
| Portfolio of Investments—January 31, 2012 (Unaudited) | | Wells Fargo Advantage Large Cap Core Fund | | | 9 | |
| | | | | | | | | | | | |
| Security Name | | | | | | Shares | | | Value | |
| | | | | | | | | | | | |
| | | | |
| Insurance: 3.73% | | | | | | | | | | | | |
ACE Limited | | | | | | | 50,414 | | | $ | 3,508,814 | |
MetLife Incorporated | | | | | | | 75,361 | | | | 2,662,504 | |
| | | | |
| | | | | | | | | | | 6,171,318 | |
| | | | | | | | | | | | |
| | | | |
Health Care: 14.62% | | | | | | | | | | | | |
| | | | |
| Biotechnology: 4.07% | | | | | | | | | | | | |
Amgen Incorporated | | | | | | | 49,418 | | | | 3,355,976 | |
Celgene Corporation† | | | | | | | 46,634 | | | | 3,390,292 | |
| | | | |
| | | | | | | | | | | 6,746,268 | |
| | | | | | | | | | | | |
| | | | |
| Health Care Providers & Services: 5.42% | | | | | | | | | | | | |
Cardinal Health Incorporated | | | | | | | 66,092 | | | | 2,843,939 | |
McKesson Corporation | | | | | | | 35,063 | | | | 2,865,348 | |
UnitedHealth Group Incorporated | | | | | | | 62,968 | | | | 3,261,113 | |
| | | | |
| | | | | | | | | | | 8,970,400 | |
| | | | | | | | | | | | |
| | | | |
| Pharmaceuticals: 5.13% | | | | | | | | | | | | |
Bristol-Myers Squibb Company | | | | | | | 91,836 | | | | 2,960,793 | |
Johnson & Johnson | | | | | | | 43,184 | | | | 2,846,257 | |
Questcor Pharmaceuticals Incorporated† | | | | | | | 76,175 | | | | 2,698,880 | |
| | | | |
| | | | | | | | | | | 8,505,930 | |
| | | | | | | | | | | | |
| | | | |
Industrials: 12.07% | | | | | | | | | | | | |
| | | | |
| Aerospace & Defense: 1.86% | | | | | | | | | | | | |
United Technologies Corporation | | | | | | | 39,400 | | | | 3,086,990 | |
| | | | | | | | | | | | |
| | | | |
| Industrial Conglomerates: 4.27% | | | | | | | | | | | | |
General Electric Company | | | | | | | 182,476 | | | | 3,414,126 | |
Tyco International Limited | | | | | | | 71,812 | | | | 3,658,821 | |
| | | | |
| | | | | | | | | | | 7,072,947 | |
| | | | | | | | | | | | |
| | | | |
| Machinery: 3.71% | | | | | | | | | | | | |
Danaher Corporation | | | | | | | 66,463 | | | | 3,489,972 | |
Wabco Holdings IncorporatedǠ | | | | | | | 51,141 | | | | 2,651,661 | |
| | | | |
| | | | | | | | | | | 6,141,633 | |
| | | | | | | | | | | | |
| | | | |
| Road & Rail: 2.23% | | | | | | | | | | | | |
Union Pacific Corporation | | | | | | | 32,284 | | | | 3,690,384 | |
| | | | | | | | | | | | |
| | | | |
Information Technology: 23.88% | | | | | | | | | | | | |
| | | | |
| Communications Equipment: 1.41% | | | | | | | | | | | | |
Cisco Systems Incorporated | | | | | | | 118,987 | | | | 2,335,715 | |
| | | | | | | | | | | | |
| | | | |
| Computers & Peripherals: 4.41% | | | | | | | | | | | | |
Apple Incorporated† | | | | | | | 8,674 | | | | 3,959,508 | |
EMC CorporationǠ | | | | | | | 129,868 | | | | 3,345,400 | |
| | | | |
| | | | | | | | | | | 7,304,908 | |
| | | | | | | | | | | | |
| | | | |
| Electronic Equipment, Instruments & Components: 1.71% | | | | | | | | | | | | |
Agilent Technologies Incorporated | | | | | | | 66,728 | | | | 2,833,938 | |
| | | | | | | | | | | | |
| | | | |
| 10 | | Wells Fargo Advantage Large Cap Core Fund | | Portfolio of Investments—January 31, 2012 (Unaudited) |
| | | | | | | | | | | | | | |
| Security Name | | | | | | | Shares | | | Value | |
| | | | |
| Internet Software & Services: 2.05% | | | | | | | | | | | | | | |
IAC/InterActive Corporation | | | | | | | | | 78,890 | | | $ | 3,397,792 | |
| | | | | | | | | | | | | | |
| | | | |
| IT Services: 4.38% | | | | | | | | | | | | | | |
Alliance Data Systems CorporationǠ | | | | | | | | | 29,425 | | | | 3,260,290 | |
International Business Machines Corporation | | | | | | | | | 20,746 | | | | 3,995,680 | |
| | | | |
| | | | | | | | | | | | | 7,255,970 | |
| | | | | | | | | | | | | | |
| | | | |
| Semiconductors & Semiconductor Equipment: 2.09% | | | | | | | | | | | | | | |
Intel Corporation | | | | | | | | | 131,213 | | | | 3,466,647 | |
| | | | | | | | | | | | | | |
| | | | |
| Software: 7.83% | | | | | | | | | | | | | | |
Microsoft Corporation | | | | | | | | | 107,253 | | | | 3,167,181 | |
Oracle Corporation | | | | | | | | | 114,344 | | | | 3,224,501 | |
Symantec Corporation† | | | | | | | | | 172,778 | | | | 2,970,054 | |
TIBCO Software Incorporated† | | | | | | | | | 138,245 | | | | 3,604,047 | |
| | | | |
| | | | | | | | | | | | | 12,965,783 | |
| | | | | | | | | | | | | | |
| | | | |
Materials: 2.10% | | | | | | | | | | | | | | |
| | | | |
| Chemicals: 2.10% | | | | | | | | | | | | | | |
Rockwood Holdings Incorporated† | | | | | | | | | 68,789 | | | | 3,473,845 | |
| | | | | | | | | | | | | | |
| | | | |
Telecommunication Services: 2.01% | | | | | | | | | | | | | | |
| | | | |
| Diversified Telecommunication Services: 2.01% | | | | | | | | | | | | | | |
Verizon Communications Incorporated | | | | | | | | | 88,519 | | | | 3,333,626 | |
| | | | | | | | | | | | | | |
| | | | |
Utilities: 1.92% | | | | | | | | | | | | | | |
| | | | |
| Electric Utilities: 1.92% | | | | | | | | | | | | | | |
Duke Energy Corporation« | | | | | | | | | 149,642 | | | | 3,188,870 | |
| | | | | | | | | | | | | | |
| | | | |
Total Common Stocks (Cost $134,152,035) | | | | | | | | | | | | | 163,799,446 | |
| | | | | | | | | | | | | | |
| | | | |
| | | | | | | | Principal | | | | |
| Other: 0.51% | | | | | | | | | | | | | | |
Gryphon Funding Limited, Pass-Through Entity(v)(a)(i) | | | | | | | | $ | 1,111,579 | | | | 300,126 | |
VFNC Corporation, Pass-Through Entity, 0.27%(v)(a)(i)±144A | | | | | | | | | 1,266,645 | | | | 544,657 | |
| | | | |
Total Other (Cost $394,851) | | | | | | | | | | | | | 844,783 | |
| | | | | | | | | | | | | | |
| | | | |
| | | Yield | | | | | Shares | | | | |
| Short-Term Investments: 8.45% | | | | | | | | | | | | | | |
| | | | |
| Investment Companies: 8.45% | | | | | | | | | | | | | | |
Wells Fargo Advantage Cash Investment Money Market Fund, Institutional Class(l)(u) | | | 0.02 | % | | | | | 1,473,893 | | | | 1,473,893 | |
Wells Fargo Securities Lending Cash Investments, LLC(v)(l)(u)(r) | | | 0.15 | | | | | | 12,529,649 | | | | 12,529,649 | |
| | | | |
Total Short-Term Investments (Cost $14,003,542) | | | | | | | | | | | | | 14,003,542 | |
| | | | | | | | | | | | | | |
| | | | | | | | |
| | |
| Total Investments in Securities | | | | | | | | |
| (Cost $148,550,428)* | | | 107.82 | % | | | 178,647,771 | |
Other Assets and Liabilities, Net | | | (7.82 | ) | | | (12,963,042 | ) |
| | | | | | | | |
| Total Net Assets | | | 100.00 | % | | $ | 165,684,729 | |
| | | | | | | | |
| | | | | | |
| Portfolio of Investments—January 31, 2012 (Unaudited) | | Wells Fargo Advantage Large Cap Core Fund | | | 11 | |
| « | All or a portion of this security is on loan. |
| † | Non-income earning security. |
| (v) | Security represents investment of cash collateral received from securities on loan. |
| (a) | Security is fair valued by the Management Valuation Team, and in certain instances by the Board of Trustees, in accordance with procedures approved by the Board of Trustees. |
| ± | Variable rate investment. |
| 144A | Security that may be resold to “qualified institutional buyers” under Rule 144A or security offered pursuant to Section 4(2) of the Securities Act of 1933, as amended. |
| (l) | Investment in an affiliate. |
| (u) | Rate shown is the 7-day annualized yield at period end. |
| (r) | The investment company is exempt from registration under Section 3(c)(7) of the 1940 Act. |
| * | Cost for federal income tax purposes is $148,985,445 and net unrealized appreciation (depreciation) consists of: |
| | | | |
Gross unrealized appreciation | | $ | 32,442,183 | |
Gross unrealized depreciation | | | (2,779,857 | ) |
| | | | |
Net unrealized appreciation | | $ | 29,662,326 | |
The accompanying notes are an integral part of these financial statements.
| | | | |
| 12 | | Wells Fargo Advantage Large Cap Core Fund | | Statement of Assets and Liabilities—January 31, 2012 (Unaudited) |
| | | | |
| | | | |
| |
Assets | | | | |
Investments | | | | |
In unaffiliated securities (including securities on loan), at value (see cost below) | | $ | 164,644,229 | |
In affiliated securities, at value (see cost below) | | | 14,003,542 | |
| | | | |
Total investments, at value (see cost below) | | | 178,647,771 | |
Receivable for Fund shares sold | | | 111,858 | |
Receivable for dividends | | | 116,117 | |
Receivable for securities lending income | | | 1,263 | |
Prepaid expenses and other assets | | | 40,883 | |
| | | | |
Total assets | | | 178,917,892 | |
| | | | |
| |
Liabilities | | | | |
Payable for Fund shares redeemed | | | 191,558 | |
Payable upon receipt of securities loaned | | | 12,924,500 | |
Advisory fee payable | | | 49,648 | |
Distribution fees payable | | | 1,109 | |
Due to other related parties | | | 31,793 | |
Accrued expenses and other liabilities | | | 34,555 | |
| | | | |
Total liabilities | | | 13,233,163 | |
| | | | |
Total net assets | | $ | 165,684,729 | |
| | | | |
| |
NET ASSETS CONSIST OF | | | | |
Paid-in capital | | $ | 215,206,957 | |
Undistributed net investment income | | | 38,330 | |
Accumulated net realized losses on investments | | | (79,657,901 | ) |
Net unrealized gains on investments | | | 30,097,343 | |
| | | | |
Total net assets | | $ | 165,684,729 | |
| | | | |
| |
COMPUTATION OF NET ASSET VALUE AND OFFERING PRICE PER SHARE1 | | | | |
Net assets – Class A | | $ | 7,138,518 | |
Shares outstanding – Class A | | | 800,667 | |
Net asset value per share – Class A | | | $8.92 | |
Maximum offering price per share – Class A2 | | | $9.46 | |
Net assets – Class C | | $ | 1,777,295 | |
Shares outstanding – Class C | | | 199,638 | |
Net asset value per share – Class C | | | $8.90 | |
Net assets – Administrator Class | | $ | 471,292 | |
Shares outstanding – Administrator Class | | | 52,819 | |
Net asset value per share – Administrator Class | | | $8.92 | |
Net assets – Institutional Class | | $ | 456,080 | |
Shares outstanding – Institutional Class | | | 51,172 | |
Net asset value per share – Institutional Class | | | $8.91 | |
Net assets – Investor Class | | $ | 155,841,544 | |
Shares outstanding – Investor Class | | | 17,477,103 | |
Net asset value per share – Investor Class | | | $8.92 | |
| |
Investments in unaffiliated securities, at cost | | $ | 134,546,886 | |
| | | | |
Investments in affiliated securities, at cost | | $ | 14,003,542 | |
| | | | |
Total investments, at cost | | $ | 148,550,428 | |
| | | | |
Securities on loan, at value | | $ | 12,614,577 | |
| | | | |
| 1. | The Fund has an unlimited number of authorized shares. |
| 2. | Maximum offering price is computed as 100/94.25 of net asset value. On investments of $50,000 or more, the offering price is reduced. |
The accompanying notes are an integral part of these financial statements.
| | | | | | |
| Statement of Operations—Six Months Ended January 31, 2012 (Unaudited) | | Wells Fargo Advantage Large Cap Core Fund | | | 13 | |
| | | | |
| | | | |
| |
Investment income | | | | |
Dividends | | $ | 1,437,377 | |
Securities lending income, net | | | 7,154 | |
Income from affiliated securities | | | 914 | |
| | | | |
Total investment income | | | 1,445,445 | |
| | | | |
| |
Expenses | | | | |
Advisory fee | | | 506,193 | |
Administration fees | | | | |
Fund level | | | 38,938 | |
Class A | | | 8,806 | |
Class C | | | 2,100 | |
Administrator Class | | | 221 | |
Institutional Class | | | 175 | |
Investor Class | | | 241,698 | |
Shareholder servicing fees | | | | |
Class A | | | 8,467 | |
Class C | | | 2,020 | |
Administrator Class | | | 553 | |
Investor Class | | | 179,850 | |
Distribution fees | | | | |
Class C | | | 6,059 | |
Custody and accounting fees | | | 8,639 | |
Professional fees | | | 20,584 | |
Registration fees | | | 35,006 | |
Shareholder report expenses | | | 23,285 | |
Trustees’ fees and expenses | | | 6,066 | |
Other fees and expenses | | | 5,192 | |
| | | | |
Total expenses | | | 1,093,852 | |
Less: Fee waivers and/or expense reimbursements | | | (150,318 | ) |
| | | | |
Net expenses | | | 943,534 | |
| | | | |
Net investment income | | | 501,911 | |
| | | | |
| |
REALIZED AND UNREALIZED GAINS (LOSSES) ON INVESTMENTS | | | | |
Net realized losses on investments | | | (1,315,306 | ) |
Net change in unrealized gains (losses) on investments | | | 4,529,128 | |
| | | | |
Net realized and unrealized gains (losses) on investments | | | 3,213,822 | |
| | | | |
Net increase in net assets resulting from operations | | $ | 3,715,733 | |
| | | | |
The accompanying notes are an integral part of these financial statements.
| | | | |
| 14 | | Wells Fargo Advantage Large Cap Core Fund | | Statements of Changes in Net Assets |
| | | | | | | | | | | | | | | | |
| | | Six Months Ended January 31, 2012 (Unaudited) | | | Year Ended July 31, 2011 | |
| | | | |
Operations | | | | | | | | | | | | | | | | |
Net investment income | | | | | | $ | 501,911 | | | | | | | $ | 922,353 | |
Net realized gains (losses) on investments | | | | | | | (1,315,306 | ) | | | | | | | 14,284,176 | |
Net change in unrealized gains (losses) on investments | | | | | | | 4,529,128 | | | | | | | | 14,508,213 | |
| | | | | | | | | | | | | | | | |
Net increase in net assets resulting from operations | | | | | | | 3,715,733 | | | | | | | | 29,714,742 | |
| | | | | | | | | | | | | | | | |
| | | | |
Distributions to shareholders from | | | | | | | | | | | | | | | | |
Net investment income | | | | | | | | | | | | | | | | |
Class A | | | | | | | (42,583 | ) | | | | | | | (30,356 | ) |
Administrator Class | | | | | | | (4,224 | ) | | | | | | | (2,374 | ) |
Institutional Class | | | | | | | (5,032 | ) | | | | | | | (4,157 | ) |
Investor Class | | | | | | | (842,065 | ) | | | | | | | (555,179 | ) |
| | | | | | | | | | | | | | | | |
Total distributions to shareholders | | | | | | | (893,904 | ) | | | | | | | (592,066 | ) |
| | | | | | | | | | | | | | | | |
| | | | |
Capital share transactions | | | Shares | | | | | | | | Shares | | | | | |
Proceeds from shares sold | | | | | | | | | | | | | | | | |
Class A | | | 102,517 | | | | 847,523 | | | | 120,209 | | | | 1,004,920 | |
Class C | | | 18,922 | | | | 159,636 | | | | 26,271 | | | | 233,035 | |
Administrator Class | | | 2,794 | | | | 21,867 | | | | 68,492 | | | | 571,173 | |
Institutional Class | | | 4 | | | | 31 | | | | 5,841 | | | | 45,793 | |
Investor Class | | | 230,958 | | | | 1,880,077 | | | | 741,068 | | | | 6,300,740 | |
| | | | | | | | | | | | | | | | |
| | | | | | | 2,909,134 | | | | | | | | 8,155,661 | |
| | | | | | | | | | | | | | | | |
Reinvestment of distributions | | | | | | | | | | | | | | | | |
Class A | | | 5,037 | | | | 40,746 | | | | 3,553 | | | | 29,813 | |
Administrator Class | | | 311 | | | | 2,512 | | | | 118 | | | | 994 | |
Institutional Class | | | 607 | | | | 4,903 | | | | 487 | | | | 4,082 | |
Investor Class | | | 100,884 | | | | 816,154 | | | | 63,752 | | | | 534,879 | |
| | | | | | | | | | | | | | | | |
| | | | | | | 864,315 | | | | | | | | 569,768 | |
| | | | | | | | | | | | | | | | |
Payment for shares redeemed | | | | | | | | | | | | | | | | |
Class A | | | (163,809 | ) | | | (1,352,049 | ) | | | (419,887 | ) | | | (3,475,235 | ) |
Class C | | | (20,163 | ) | | | (169,783 | ) | | | (89,604 | ) | | | (714,295 | ) |
Administrator Class | | | (4,702 | ) | | | (38,272 | ) | | | (19,881 | ) | | | (171,931 | ) |
Institutional Class | | | (3,876 | ) | | | (33,036 | ) | | | (376,395 | ) | | | (2,908,594 | ) |
Investor Class | | | (1,029,369 | ) | | | (8,483,728 | ) | | | (2,988,793 | ) | | | (25,190,566 | ) |
| | | | | | | | | | | | | | | | |
| | | | | | | (10,076,868 | ) | | | | | | | (32,460,621 | ) |
| | | | | | | | | | | | | | | | |
Net decrease in net assets resulting
from capital share transactions | | | | | | | (6,303,419 | ) | | | | | | | (23,735,192 | ) |
| | | | | | | | | | | | | | | | |
Total increase (decrease) in net assets | | | | | | | (3,481,590 | ) | | | | | | | 5,387,484 | |
| | | | | | | | | | | | | | | | |
| | | | |
Net assets | | | | | | | | | | | | | | | | |
Beginning of period | | | | | | | 169,166,319 | | | | | | | | 163,778,835 | |
| | | | | | | | | | | | | | | | |
End of period | | | | | | $ | 165,684,729 | | | | | | | $ | 169,166,319 | |
| | | | | | | | | | | | | | | | |
Undistributed net investment income | | | | | | $ | 38,330 | | | | | | | $ | 430,323 | |
| | | | | | | | | | | | | | | | |
The accompanying notes are an integral part of these financial statements.
| | | | | | |
| Financial Highlights | | Wells Fargo Advantage Large Cap Core Fund | | | 15 | |
(For a share outstanding throughout each period)
| | | | | | | | | | | | | | | | | | | | |
| | | Six Months Ended January 31, 2012 (Unaudited) | | | Year Ended July 31, | |
| Class A | | | 2011 | | | 20101 | | | 20091 | | | 20081,2 | |
Net asset value, beginning of period | | $ | 8.75 | | | $ | 7.37 | | | $ | 6.96 | | | $ | 8.77 | | | $ | 10.00 | |
Net investment income | | | 0.03 | | | | 0.05 | | | | 0.06 | | | | 0.08 | | | | 0.03 | |
Net realized and unrealized gains (losses) on investments | | | 0.19 | | | | 1.36 | | | | 0.46 | | | | (1.82 | ) | | | (1.26 | ) |
| | | | | | | | | | | | | | | | | | | | |
Total from investment operations | | | 0.22 | | | | 1.41 | | | | 0.52 | | | | (1.74 | ) | | | (1.23 | ) |
Distributions to shareholders from | | | | | | | | | | | | | | | | | | | | |
Net investment income | | | (0.05 | ) | | | (0.03 | ) | | | (0.11 | ) | | | (0.07 | ) | | | 0.00 | |
Net asset value, end of period | | | $8.92 | | | | $8.75 | | | | $7.37 | | | | $6.96 | | | | $8.77 | |
Total return3 | | | 2.60 | % | | | 19.16 | % | | | 7.43 | % | | | (19.78 | )% | | | (12.30 | )% |
Ratios to average net assets (annualized) | | | | | | | | | | | | | | | | | | | | |
Gross expenses | | | 1.34 | % | | | 1.30 | % | | | 2.55 | % | | | 4.10 | % | | | 5.03 | % |
Net expenses | | | 1.14 | % | | | 1.14 | % | | | 1.15 | % | | | 1.15 | % | | | 1.15 | % |
Net investment income | | | 0.72 | % | | | 0.61 | % | | | 0.91 | % | | | 1.22 | % | | | 0.69 | % |
Supplemental data | | | | | | | | | | | | | | | | | | | | |
Portfolio turnover rate | | | 24 | % | | | 43 | % | | | 18 | % | | | 45 | % | | | 23 | % |
Net assets, end of period (000’s omitted) | | | $7,139 | | | | $7,495 | | | | $8,501 | | | | $533 | | | | $604 | |
| 1. | After the close of business on July 16, 2010, the Fund acquired the net assets of Evergreen Golden Large Cap Core Fund and Wells Fargo Advantage Large Company Core Fund. Evergreen Golden Large Cap Core Fund was the accounting and performance survivor in the transaction. The information for the periods prior to July 19, 2010 is that of Class A of Evergreen Golden Large Cap Core Fund. |
| 2. | For the period from December 17, 2007 (commencement of class operations) to July 31, 2008. |
| 3. | Total return calculations do not include any sales charges. Returns for periods of less than one year are not annualized. |
The accompanying notes are an integral part of these financial statements.
| | | | |
| 16 | | Wells Fargo Advantage Large Cap Core Fund | | Financial Highlights |
(For a share outstanding throughout each period)
| | | | | | | | | | | | | | | | | | | | |
| | | Six Months Ended January 31, 2012 (Unaudited) | | | Year Ended July 31, | |
| Class C | | | 2011 | | | 20101 | | | 20091 | | | 20081,2 | |
Net asset value, beginning of period | | $ | 8.71 | | | $ | 7.37 | | | $ | 6.94 | | | $ | 8.75 | | | $ | 10.00 | |
Net investment income (loss) | | | (0.00 | ) | | | (0.01 | ) | | | 0.01 | | | | 0.03 | | | | 0.00 | |
Net realized and unrealized gains (losses) on investments | | | 0.19 | | | | 1.35 | | | | 0.44 | | | | (1.81 | ) | | | (1.25 | ) |
| | | | | | | | | | | | | | | | | | | | |
Total from investment operations | | | 0.19 | | | | 1.34 | | | | 0.45 | | | | (1.78 | ) | | | (1.25 | ) |
Distributions to shareholders from | | | | | | | | | | | | | | | | | | | | |
Net investment income | | | 0.00 | | | | 0.00 | | | | (0.02 | ) | | | (0.03 | ) | | | 0.00 | |
Net asset value, end of period | | | $8.90 | | | | $8.71 | | | | $7.37 | | | | $6.94 | | | | $8.75 | |
Total return3 | | | 2.18 | % | | | 18.18 | % | | | 6.54 | % | | | (20.33 | )% | | | (12.50 | )% |
Ratios to average net assets (annualized) | | | | | | | | | | | | | | | | | | | | |
Gross expenses | | | 2.09 | % | | | 2.05 | % | | | 3.75 | % | | | 4.85 | % | | | 5.78 | % |
Net expenses | | | 1.89 | % | | | 1.89 | % | | | 1.90 | % | | | 1.90 | % | | | 1.90 | % |
Net investment income (loss) | | | (0.04 | )% | | | (0.13 | )% | | | 0.09 | % | | | 0.48 | % | | | (0.06 | )% |
Supplemental data | | | | | | | | | | | | | | | | | | | | |
Portfolio turnover rate | | | 24 | % | | | 43 | % | | | 18 | % | | | 45 | % | | | 23 | % |
Net assets, end of period (000’s omitted) | | | $1,777 | | | | $1,750 | | | | $1,947 | | | | $1,043 | | | | $942 | |
| 1. | After the close of business on July 16, 2010, the Fund acquired the net assets of Evergreen Golden Large Cap Core Fund and Wells Fargo Advantage Large Company Core Fund. Evergreen Golden Large Cap Core Fund was the accounting and performance survivor in the transaction. The information for the periods prior to July 19, 2010 is that of Class C of Evergreen Golden Large Cap Core Fund. |
| 2. | For the period from December 17, 2007 (commencement of class operations) to July 31, 2008. |
| 3. | Total return calculations do not include any sales charges. Returns for periods of less than one year are not annualized. |
The accompanying notes are an integral part of these financial statements.
| | | | | | |
| Financial Highlights | | Wells Fargo Advantage Large Cap Core Fund | | | 17 | |
(For a share outstanding throughout each period)
| | | | | | | | | | | | |
| | | Six Months Ended January 31, 2012 (Unaudited) | | | Year Ended July 31, | |
| Administrator Class | | | 2011 | | | 20101 | |
Net asset value, beginning of period | | $ | 8.77 | | | $ | 7.38 | | | $ | 7.22 | |
Net investment income | | | 0.04 | | | | 0.07 | 2 | | | 0.00 | |
Net realized and unrealized gains (losses) on investments | | | 0.19 | | | | 1.36 | | | | 0.16 | |
| | | | | | | | | | | | |
Total from investment operations | | | 0.23 | | | | 1.43 | | | | 0.16 | |
Distributions to shareholders from | | | | | | | | | | | | |
Net investment income | | | (0.08 | ) | | | (0.04 | ) | | | 0.00 | |
Net asset value, end of period | | $ | 8.92 | | | $ | 8.77 | | | $ | 7.38 | |
Total return3 | | | 2.70 | % | | | 19.44 | % | | | 2.22 | % |
Ratios to average net assets (annualized) | | | | | | | | | | | | |
Gross expenses | | | 1.18 | % | | | 1.08 | % | | | 1.12 | % |
Net expenses | | | 0.90 | % | | | 0.86 | % | | | 0.89 | % |
Net investment income | | | 0.96 | % | | | 0.76 | % | | | 1.12 | % |
Supplemental data | | | | | | | | | | | | |
Portfolio turnover rate | | | 24 | % | | | 43 | % | | | 18 | % |
Net assets, end of period (000’s omitted) | | | $471 | | | | $477 | | | | $42 | |
| 1. | For the period from July 16, 2010 (commencement of class operations) to July 31, 2010. |
| 2. | Calculated based upon average shares outstanding. |
| 3. | Returns for periods of less than one year are not annualized. |
The accompanying notes are an integral part of these financial statements.
| | | | |
| 18 | | Wells Fargo Advantage Large Cap Core Fund | | Financial Highlights |
(For a share outstanding throughout each period)
| | | | | | | | | | | | | | | | | | | | |
| | | Six Months Ended
January 31, 2012 (Unaudited) | | | Year Ended July 31, | |
| Institutional Class | | | 2011 | | | 20101 | | | 20091 | | | 20081,2 | |
Net asset value, beginning of period | | $ | 8.77 | | | $ | 7.38 | | | $ | 6.97 | | | $ | 8.79 | | | $ | 10.00 | |
Net investment income | | | 0.05 | | | | 0.10 | 3 | | | 0.08 | | | | 0.09 | | | | 0.05 | |
Net realized and unrealized gains (losses) on investments | | | 0.19 | | | | 1.35 | | | | 0.46 | | | | (1.82 | ) | | | (1.26 | ) |
| | | | | | | | | | | | | | | | | | | | |
Total from investment operations | | | 0.24 | | | | 1.45 | | | | 0.54 | | | | (1.73 | ) | | | (1.21 | ) |
Distributions to shareholders from | | | | | | | | | | | | | | | | | | | | |
Net investment income | | | (0.10 | ) | | | (0.06 | ) | | | (0.13 | ) | | | (0.09 | ) | | | 0.00 | |
Net asset value, end of period | | | $8.91 | | | | $8.77 | | | | $7.38 | | | | $6.97 | | | | $8.79 | |
Total return4 | | | 2.84 | % | | | 19.65 | % | | | 7.79 | % | | | (19.61 | )% | | | (12.10 | )% |
Ratios to average net assets (annualized) | | | | | | | | | | | | | | | | | | | | |
Gross expenses | | | 0.91 | % | | | 0.86 | % | | | 2.80 | % | | | 3.85 | % | | | 4.78 | % |
Net expenses | | | 0.66 | % | | | 0.66 | % | | | 0.89 | % | | | 0.90 | % | | | 0.90 | % |
Net investment income | | | 1.20 | % | | | 1.32 | % | | | 1.09 | % | | | 1.47 | % | | | 0.93 | % |
Supplemental data | | | | | | | | | | | | | | | | | | | | |
Portfolio turnover rate | | | 24 | % | | | 43 | % | | | 18 | % | | | 45 | % | | | 23 | % |
Net assets, end of period (000’s omitted) | | | $456 | | | | $478 | | | | $3,132 | | | | $2,809 | | | | $3,149 | |
| 1. | After the close of business on July 16, 2010, the Fund acquired the net assets of Evergreen Golden Large Cap Core Fund and Wells Fargo Advantage Large Company Core Fund. Evergreen Golden Large Cap Core Fund was the accounting and performance survivor in the transaction. The information for the periods prior to July 19, 2010 is that of Class I of Evergreen Golden Large Cap Core Fund. |
| 2. | For the period from December 17, 2007 (commencement of class operations) to July 31, 2008. |
| 3. | Calculated based upon average shares outstanding. |
| 4. | Returns for periods of less than one year are not annualized. |
The accompanying notes are an integral part of these financial statements.
| | | | | | |
| Financial Highlights | | Wells Fargo Advantage Large Cap Core Fund | | | 19 | |
(For a share outstanding throughout each period)
| | | | | | | | | | | | |
| | | Six Months Ended
January 31, 2012 (Unaudited) | | | Year Ended July 31, | |
| Investor Class | | | 2011 | | | 20101 | |
Net asset value, beginning of period | | $ | 8.75 | | | $ | 7.38 | | | $ | 7.22 | |
Net investment income | | | 0.03 | | | | 0.05 | | | | 0.00 | |
Net realized and unrealized gains (losses) on investments | | | 0.19 | | | | 1.35 | | | | 0.16 | |
| | | | | | | | | | | | |
Total from investment operations | | | 0.22 | | | | 1.40 | | | | 0.16 | |
Distributions to shareholders from | | | | | | | | | | | | |
Net investment income | | | (0.05 | ) | | | (0.03 | ) | | | 0.00 | |
Net asset value, end of period | | $ | 8.92 | | | $ | 8.75 | | | $ | 7.38 | |
Total return2 | | | 2.54 | % | | | 18.97 | % | | | 2.22 | % |
Ratios to average net assets (annualized) | | | | | | | | | | | | |
Gross expenses | | | 1.40 | % | | | 1.37 | % | | | 1.37 | % |
Net expenses | | | 1.21 | % | | | 1.21 | % | | | 1.21 | % |
Net investment income | | | 0.65 | % | | | 0.53 | % | | | 1.03 | % |
Supplemental data | | | | | | | | | | | | |
Portfolio turnover rate | | | 24 | % | | | 43 | % | | | 18 | % |
Net assets, end of period (000’s omitted) | | | $155,842 | | | | $158,966 | | | | $150,157 | |
| 1. | For the period from July 16, 2010 (commencement of class operations) to July 31, 2010. |
| 2. | Returns for periods of less than one year are not annualized. |
The accompanying notes are an integral part of these financial statements.
| | | | |
| 20 | | Wells Fargo Advantage Large Cap Core Fund | | Notes to Financial Statements (Unaudited) |
1. ORGANIZATION
Wells Fargo Funds Trust (the “Trust”), a Delaware statutory trust organized on March 10, 1999, is an open-end management investment company registered under the Investment Company Act of 1940, as amended (the “1940 Act”). These financial statements report on Wells Fargo Advantage Large Cap Core Fund (the “Fund”) which is a diversified series of the Trust.
2. SIGNIFICANT ACCOUNTING POLICIES
The following significant accounting policies, which are consistently followed in the preparation of the financial statements of the Fund, are in conformity with U.S. generally accepted accounting principles which require management to make estimates and assumptions that affect the reported amounts of assets and liabilities, disclosure of contingent assets and liabilities at the date of the financial statements, and the reported amounts of revenues and expenses during the reporting period. Actual results could differ from those estimates.
Securities valuation
Investments in equity securities are valued each business day as of the close of regular trading on the New York Stock Exchange, which is usually 4:00 p.m. (Eastern Time). Securities which are traded on a national or foreign securities exchange are valued at the last reported sales price, except that securities listed on The Nasdaq Stock Market, Inc. (“Nasdaq”) are valued at the Nasdaq Official Closing Price (“NOCP”), and if no NOCP is available, then at the last reported sales price. If no sales price is shown on the Nasdaq, the bid price will be used. In the absence of any sale of securities listed on the Nasdaq, and in the case of other securities (including U.S. Government obligations, but excluding debt securities maturing in 60 days or less), the price will be deemed “stale” and the valuations will be determined in accordance with the Fund’s Fair Value Procedures.
Investments in open-end mutual funds and non-registered investment companies are generally valued at net asset value.
Investments which are not valued using any of the methods discussed above, are valued at their fair value, as determined by procedures established in good faith and approved by the Board of Trustees.
Security loans
The Fund may lend its securities from time to time in order to earn additional income in the form of fees or interest on securities received as collateral or the investment of any cash received as collateral. The Fund continues to receive interest or dividends on the securities loaned. The Fund receives collateral in the form of cash or securities with a value at least equal to the value of the securities on loan. The value of the loaned securities is determined at the close of each business day and any additional required collateral is delivered to the Fund on the next business day. In a securities lending transaction, the net asset value of the Fund will be affected by an increase or decrease in the value of the securities loaned and by an increase or decrease in the value of the instrument in which collateral is invested. The amount of securities lending activity undertaken by the Fund fluctuates from time to time. In the event of default or bankruptcy by the borrower, the Fund may be prevented from recovering the loaned securities or gaining access to the collateral or may experience delays or costs in doing so. In addition, the investment of any cash collateral received may lose all or part of its value. The Fund has the right under the lending agreement to recover the securities from the borrower on demand.
The Fund lends its securities through an unaffiliated securities lending agent. Cash collateral received in connection with its securities lending transactions is invested in Wells Fargo Securities Lending Cash Investments, LLC (the “Cash Collateral Fund”). The Cash Collateral Fund is exempt from registration under Section 3(c)(7) of the 1940 Act and is managed by Wells Fargo Funds Management LLC (“Funds Management”) and is sub-advised by Wells Capital Management Incorporated (“Wells Capital Management”). Funds Management receives an advisory fee starting at 0.05% and declining to 0.01% as the average daily net assets of the Cash Collateral Fund increase. All of the fees received by Funds Management are paid to Wells Capital Management for its services as sub-adviser. The Cash Collateral Fund seeks to provide a positive return compared to the daily Fed Funds Open rate by investing in high-quality, U.S. dollar-denominated short-term money market instruments. Cash Collateral Fund investments are fair valued based upon the amortized cost valuation technique. Income earned from investment in the Cash Collateral Fund is included in securities lending income on the Statement of Operations.
For Wells Fargo Advantage Funds that participated in securities lending activity prior to February 13, 2009, certain structured investment vehicles purchased in a joint account by the former securities lending agent defaulted or were
| | | | | | |
| Notes to Financial Statements (Unaudited) | | Wells Fargo Advantage Large Cap Core Fund | | | 21 | |
impaired. Certain of the Wells Fargo Advantage Funds still hold ownership interest in these structured investment vehicles, which have since been restructured as pass-through securities. If the Fund holds an ownership interest in such pass-through securities, information regarding this ownership interest can be found in the Portfolio of Investments under the category “Other”.
Security transactions and income recognition
Securities transactions are recorded on a trade date basis. Realized gains or losses are reported on the basis of identified cost of securities delivered.
Dividend income is recognized on the ex-dividend date.
Distributions to shareholders
Distributions to shareholders from net investment income and net realized gains, if any, are recorded on the ex-dividend date. Such distributions are determined in conformity with income tax regulations, which may differ from generally accepted accounting principles.
Federal and other taxes
The Fund intends to continue to qualify as a regulated investment company by distributing substantially all of its investment company taxable income and any net realized capital gains (after reduction for capital loss carryforwards) sufficient to relieve it from all, or substantially all, federal income taxes. Accordingly, no provision for federal income taxes was required.
The Fund’s income and federal excise tax returns and all financial records supporting those returns for the prior three fiscal years are subject to examination by the federal and Delaware revenue authorities.
Under the recently enacted Regulated Investment Company Modernization Act of 2010, the Fund is permitted to carry forward capital losses incurred in taxable years which began after December 22, 2010 for an unlimited period. However, any losses incurred are required to be utilized prior to the losses incurred in pre-enactment taxable years. As a result of this ordering rule, pre-enactment capital loss carryforwards may be more likely to expire unused. Additionally, post-enactment capital losses that are carried forward will retain their character as either short-term or long-term capital losses rather than being considered all short-term as under previous law.
As of July 31, 2011, the Fund had net capital loss carryforwards, which were available to offset future net realized capital gains, in the amount of $77,872,569 with $1,336,271 expiring in 2016, $2,447,332 expiring in 2017 and $74,088,966 expiring in 2018.
Class allocations
The separate classes of shares offered by the Fund differ principally in applicable sales charges, distribution, shareholder servicing and administration fees. Shareholders of each class bear certain expenses that pertain to that particular class. All shareholders bear the common expenses of the Fund, earn income from the portfolio, and are allocated unrealized gains and losses pro rata based on the average daily net assets of each class, without distinction between share classes. Dividends are determined separately for each class based on income and expenses allocable to each class. Realized gains and losses are allocated to each class pro rata based upon the net assets of each class on the date realized. Differences in per share dividend rates generally result from the relative weightings of pro rata income and realized gain allocations and from differences in separate class expenses, including distribution, shareholder servicing and administration fees.
3. FAIR VALUATION MEASUREMENTS
Fair value measurements of investments are determined within a framework that has established a fair value hierarchy based upon the various data inputs utilized in determining the value of the Fund’s investments. The three-level hierarchy gives the highest priority to unadjusted quoted prices in active markets for identical assets or liabilities (Level 1) and the lowest priority to significant unobservable inputs (Level 3). The Fund’s investments are classified within the fair value hierarchy based on the lowest level of input that is significant to the fair value measurement. The inputs are summarized into three broad levels as follows:
| n | | Level 1 – quoted prices in active markets for identical securities |
| n | | Level 2 – other significant observable inputs (including quoted prices for similar securities, interest rates, prepayment speeds, credit risk, etc.) |
| | | | |
| 22 | | Wells Fargo Advantage Large Cap Core Fund | | Notes to Financial Statements (Unaudited) |
| n | | Level 3 – significant unobservable inputs (including the Fund’s own assumptions in determining the fair value of investments) |
The inputs or methodologies used for valuing securities are not necessarily an indication of the risk associated with investing in those securities.
As of January 31, 2012, the inputs used in valuing the Fund’s assets, which are carried at fair value, were as follows:
| | | | | | | | | | | | | | | | |
| Investments in Securities | | Quoted Prices (Level 1) | | | Significant Other
Observable Inputs (Level 2) | | | Significant Unobservable Inputs (Level 3) | | | Total | |
Equity securities | | | | | | | | | | | | | | | | |
Common stocks | | $ | 163,799,446 | | | $ | 0 | | | $ | 0 | | | $ | 163,799,446 | |
Other | | | 0 | | | | 0 | | | | 844,783 | | | | 844,783 | |
| | | | |
Short-term investments | | | | | | | | | | | | | | | | |
Investment companies | | | 1,473,893 | | | | 12,529,649 | | | | 0 | | | | 14.003,542 | |
| | | $ | 165,273,339 | | | $ | 12,529,649 | | | $ | 844,783 | | | $ | 178,647,771 | |
Further details on the major security types listed above can be found in the Portfolio of Investments.
Transfers in and transfers out are recognized at the end of the reporting period. For the six months ended January 31, 2012, the Fund did not have any significant transfers into/out of Level 1 and Level 2.
The following is a reconciliation of assets in which significant unobservable inputs (Level 3) were used in determining fair value:
| | | | |
| | | Other | |
Balance as of July 31, 2011 | | $ | 1,198,189 | |
Accrued discounts (premiums) | | | 0 | |
Realized gains (losses) | | | 0 | |
Change in unrealized gains (losses) | | | (208,279 | ) |
Purchases | | | 0 | |
Sales | | | (145,127 | ) |
Transfers into Level 3 | | | 0 | |
Transfers out of Level 3 | | | 0 | |
Balance as of January 31, 2012 | | $ | 844,783 | |
Change in unrealized gains (losses) relating to securities still held at January 31, 2012 | | $ | (281,724 | ) |
4. TRANSACTIONS WITH AFFILIATES AND OTHER EXPENSES
Advisory fee
The Trust has entered into an advisory contract with Funds Management, an indirect wholly owned subsidiary of Wells Fargo & Company (“Wells Fargo”). The adviser is responsible for implementing investment policies and guidelines and for supervising the sub-adviser, who is responsible for day-to-day portfolio management of the Fund.
Pursuant to the contract, Funds Management is entitled to receive an annual advisory fee starting at 0.65% and declining to 0.55% as the average daily net assets of the Fund increase. For the six months ended January 31, 2012, the advisory fee was equivalent to an annual rate of 0.65% of the Fund’s average daily net assets.
Funds Management may retain the services of certain sub-advisers to provide daily portfolio management to the Fund. The fees related to sub-advisory services are borne directly by Funds Management and do not increase the overall fees paid by the Fund. Golden Capital Management, LLC, an affiliate of Funds Management, is the sub-adviser to the Fund and is entitled to receive a fee from Funds Management at an annual rate starting at 0.35% and declining to 0.30% as the average daily net assets of the Fund increase. Wells Fargo Bank, N.A., and affiliate of Funds Management, owns a 65% majority stake interest in Golden Capital Management, LLC.
| | | | | | |
| Notes to Financial Statements (Unaudited) | | Wells Fargo Advantage Large Cap Core Fund | | | 23 | |
Administration and transfer agent fees
The Trust has entered into an administration agreement with Funds Management. Under this agreement, for providing administrative services, which includes paying fees and expenses for services provided by the transfer agent, sub-transfer agents, omnibus account servicers and record-keepers, Funds Management is entitled to receive from the Fund an annual fund level administration fee starting at 0.05% and declining to 0.03% as the average daily net assets of the Fund increase and a class level administration fee which is calculated based on the average daily net assets of each class as follows:
| | | | |
| | | Class Level Administration Fee | |
Class A, Class C | | | 0.26 | % |
Administrator Class | | | 0.10 | |
Institutional Class | | | 0.08 | |
Investor Class | | | 0.33 | |
Funds Management has contractually waived and/or reimbursed advisory and administration fees to the extent necessary to maintain certain net operating expense ratios for the Fund. Waiver of fees and/or reimbursement of expenses by Funds Management were made first from fund level expenses on a proportionate basis and then from class specific expenses. Funds Management has committed through July 18, 2013 to waive fees and/or reimburse expenses to the extent necessary to cap the Fund’s expenses at 1.14% for Class A, 1.89% for Class C, 0.90% for Administrator Class, 0.66% for Institutional Class and 1.21% for Investor Class.
Distribution fees
The Trust has adopted a Distribution Plan for Class C shares of the Fund pursuant to Rule 12b-1 under the 1940 Act. Distribution fees are charged to Class C shares and paid to Wells Fargo Funds Distributor, LLC, the principal underwriter, at an annual rate of 0.75% of its average daily net assets.
For the six months ended January 31, 2012, Wells Fargo Funds Distributor, LLC received $49 from the sale of Class A shares.
Shareholder servicing fees
The Trust has entered into contracts with one or more shareholder servicing agents, whereby Class A, Class C, Administrator Class and Investor Class of the Fund is charged a fee at an annual rate of 0.25% of the average daily net assets of each respective class.
A portion of these total shareholder servicing fees were paid to affiliates of Wells Fargo.
5. INVESTMENT PORTFOLIO TRANSACTIONS
Purchases and sales of investments, excluding U.S. Government obligations (if any) and short-term securities (securities with maturities of one year or less at purchase date), for the six months ended January 31, 2012 were $36,558,588 and $42,378,013, respectively.
6. BANK BORROWINGS
The Trust (excluding the money market funds) and Wells Fargo Variable Trust are parties to a $150,000,000 revolving credit agreement with State Street Bank and Trust Company, whereby the Fund is permitted to use bank borrowings for temporary or emergency purposes, such as to fund shareholder redemption requests. Interest under the credit agreement is charged to the Fund based on a borrowing rate equal to the higher of the Federal Funds rate in effect on that day plus 1.25% or the overnight LIBOR rate in effect on that day plus 1.25%. In addition, an annual commitment fee equal to 0.10% of the unused balance is allocated to each participating fund. Prior to September 6, 2011, the revolving credit agreement was for $125,000,000 and the annual commitment fee paid by the Fund was 0.125% of the unused balance. For the six months ended January 31, 2012, the Fund paid $85 in commitment fees.
For the six months ended January 31, 2012, there were no borrowings by the Fund under the agreement.
| | | | |
| 24 | | Wells Fargo Advantage Large Cap Core Fund | | Notes to Financial Statements (Unaudited) |
7. INDEMNIFICATION
Under the Trust’s organizational documents, the officers and directors are indemnified against certain liabilities that may arise out of performance of their duties to the Trust. Additionally, in the normal course of business, the Trust may enter into contracts with service providers that contain a variety of indemnification clauses. The Trust’s maximum exposure under these arrangements is dependent on future claims that may be made against the Fund and, therefore, cannot be estimated.
8. NEW ACCOUNTING PRONOUNCEMENTS
In May 2011, the Financial Accounting Standards Board (“FASB”) issued Accounting Standards Update (“ASU”) No. 2011-04 “Amendments to Achieve Common Fair Value Measurement and Disclosure Requirements in U.S. GAAP and IFRSs”. ASU No. 2011-04 amends FASB ASC Topic 820, Fair Value Measurements and Disclosures, to establish common requirements for measuring fair value and for disclosing information about fair value measurements in accordance with GAAP. The ASU is effective prospectively for interim and annual periods beginning after December 15, 2011. Management expects that adoption of the ASU will result in additional disclosures in the financial statements, as applicable.
In April 2011, FASB issued ASU No. 2011-03 “Reconsideration of Effective Control for Repurchase Agreements”. ASU No. 2011-03 amends FASB ASC Topic 860, Transfers and Servicing, specifically the criteria required to determine whether a repurchase agreement (repo) and similar agreements should be accounted for as sales of financial assets or secured borrowings with commitments. ASU No. 2011-03 changes the assessment of effective control by focusing on the transferor’s contractual rights and obligations and removing the criterion to assess its ability to exercise those rights or honor those obligations. This could result in changes to the way entities account for certain transactions including repurchase agreements, mortgage dollar rolls and reverse repurchase agreements. The ASU will become effective on a prospective basis for new transfers and modifications to existing transactions as of the beginning of the first interim or annual period beginning on or after December 15, 2011. Management has evaluated the impact of adopting the ASU and expects no significant changes.
| | | | | | |
| Other Information (Unaudited) | | Wells Fargo Advantage Large Cap Core Fund | | | 25 | |
PROXY VOTING INFORMATION
A description of the policies and procedures that the Fund uses to determine how to vote proxies relating to portfolio securities is available without charge, upon request, by calling 1-800-222-8222, visiting our Web site at wellsfargoadvantagefunds.com, or visiting the SEC Web site at sec.gov. Information regarding how the Fund voted proxies relating to portfolio securities during the most recent 12-month period ended June 30 is available without charge on the Fund’s Web site at wellsfargoadvantagefunds.com or by visiting the SEC Web site at sec.gov.
PORTFOLIO HOLDINGS INFORMATION
The complete portfolio holdings for the Fund are publicly available on the Fund’s Web site (wellsfargoadvantagefunds.com) on a monthly, 30-day or more delayed basis. In addition, top ten holdings information for the Fund is publicly available on the Fund’s Web site on a monthly, seven-day or more delayed basis. The Fund files its complete schedule of portfolio holdings with the SEC for the first and third quarters of each fiscal year on Form N-Q, which is available without charge by visiting the SEC Web site at sec.gov. In addition, the Fund’s Form N-Q may be reviewed and copied at the SEC’s Public Reference Room in Washington, DC, and at regional offices in New York City, at 233 Broadway, and in Chicago, at 175 West Jackson Boulevard, Suite 900. Information about the Public Reference Room may be obtained by calling 1-800-SEC-0330.
| | | | |
| 26 | | Wells Fargo Advantage Large Cap Core Fund | | Other Information (Unaudited) |
BOARD OF TRUSTEES
The following table provides basic information about the Board of Trustees (the “Trustees”) of the Trust and Officers of the Trust. This table should be read in conjunction with the Prospectus and the Statement of Additional Information1 of the Fund. Each of the Trustees and Officers listed below acts in identical capacities for the Wells Fargo Advantage family of funds, which consists of 137 funds comprising the Wells Fargo Funds Trust, Wells Fargo Variable Trust, Wells Fargo Master Trust and four closed-end funds (collectively the “Fund Complex”). All of the Trustees are also Members of the Audit and Governance Committees of each Trust in the Fund Complex. The mailing address of each Trustee and Officer is 525 Market Street, 12th Floor, San Francisco, CA 94105. Each Trustee and Officer serves an indefinite term, however, each Trustee serves such term until reaching the mandatory retirement age established by the Trustees.
Independent Trustees
| | | | | | |
Name and Year of Birth | | Position Held and Length of Service | | Principal Occupations During Past Five Years | | Other Directorships During
Past Five Years |
Peter G. Gordon
(Born 1942) | | Trustee, since 1998; Chairman, since 2005 (Lead Trustee since 2001) | | Co-Founder, Retired Chairman, President and CEO of Crystal Geyser Water Company. Trustee Emeritus, Colby College | | Asset Allocation Trust |
Isaiah Harris, Jr.
(Born 1952) | | Trustee, since 2009 | | Retired. Prior thereto, President and CEO of BellSouth Advertising and Publishing Corp. from 2005 to 2007, President and CEO of BellSouth Enterprises from 2004 to 2005 and President of BellSouth Consumer Services from 2000 to 2003. Emeritus member of the Iowa State University Foundation Board of Governors. Emeritus Member of the Advisory Board of Iowa State University School of Business. Mr. Harris is a certified public accountant. | | CIGNA Corporation; Deluxe Corporation; Asset Allocation Trust |
Judith M. Johnson
(Born 1949) | | Trustee, since 2008 | | Retired. Prior thereto, Chief Executive Officer and Chief Investment Officer of Minneapolis Employees Retirement Fund from 1996 to 2008. Ms. Johnson is an attorney, certified public accountant and a certified managerial accountant. | | Asset Allocation Trust |
Leroy Keith, Jr.
(Born 1939) | | Trustee, since 2010 | | Chairman, Bloc Global Services (development and construction). Trustee of the Evergreen Funds from 1983 to 2010. Former Managing Director, Almanac Capital Management (commodities firm), former Partner, Stonington Partners, Inc. (private equity fund), former Director, Obagi Medical Products Co. and former Director, Lincoln Educational Services. | | Trustee, Virtus Fund Complex (consisting of 40 portfolios as of 12/31/11); Asset Allocation Trust |
David F. Larcker
(Born 1950) | | Trustee, since 2009 | | James Irvin Miller Professor of Accounting at the Graduate School of Business, Stanford University, Director of Corporate Governance Research Program and Senior Faculty of The Rock Center for Corporate Governance since 2006. From 2005 to 2008, Professor of Accounting at the Graduate School of Business, Stanford University. Prior thereto, Ernst & Young Professor of Accounting at The Wharton School, University of Pennsylvania from 1985 to 2005. | | Asset Allocation Trust |
Olivia S. Mitchell
(Born 1953) | | Trustee, since 2006 | | International Foundation of Employee Benefit Plans Professor, Wharton School of the University of Pennsylvania since 1993. Director of Wharton’s Pension Research Council and Boettner Center on Pensions & Retirement Research, and Research Associate at the National Bureau of Economic Research. Previously, Cornell University Professor from 1978 to 1993. | | Asset Allocation Trust |
| | | | | | |
| Other Information (Unaudited) | | Wells Fargo Advantage Large Cap Core Fund | | | 27 | |
| | | | | | |
Name and Year of Birth | | Position Held and Length of Service | | Principal Occupations During Past Five Years | | Other Directorships During
Past Five Years |
Timothy J. Penny
(Born 1951) | | Trustee, since 1996 | | President and CEO of Southern Minnesota Initiative Foundation, a non-profit organization, since 2007 and Senior Fellow at the Humphrey Institute Policy Forum at the University of Minnesota since 1995. Member of the Board of Trustees of NorthStar Education Finance, Inc., a non-profit organization, since 2007. | | Asset Allocation Trust |
Michael S. Scofield
(Born 1943) | | Trustee, since 2010 | | Served on the Investment Company Institute’s Board of Governors and Executive Committee from 2008-2011 as well the Governing Council of the Independent Directors Council from 2006-2011 and the Independent Directors Council Executive Committee from 2008-2011. Chairman of the IDC from 2008-2010. Institutional Investor (Fund Directions) Trustee of Year in 2007. Trustee of the Evergreen Funds (and its predecessors) from 1984 to 2010. Chairman of the Evergreen Funds from 2000-2010. Former Trustee of the Mentor Funds. Retired Attorney, Law Offices of Michael S. Scofield and former Director and Chairman, Branded Media Corporation (multi-media branding company). | | Asset Allocation Trust |
Donald C. Willeke
(Born 1940) | | Trustee, since 1996 | | Principal of the law firm of Willeke & Daniels. General Counsel of the Minneapolis Employees Retirement Fund from 1984 until its consolidation into the Minnesota Public Employees Retirement Association on June 30, 2010. Director and Vice Chair of The Free Trust (non-profit corporation). Director of the American Chestnut Foundation (non-profit corporation). | | Asset Allocation Trust |
Officers
| | | | | | |
Name and Year of Birth | | Position Held and
Length of Service | | Principal Occupations During Past Five Years | | |
Karla M. Rabusch
(Born 1959) | | President, since 2003 | | Executive Vice President of Wells Fargo Bank, N.A. and President of Wells Fargo Funds Management, LLC since 2003. Senior Vice President and Chief Administrative Officer of Wells Fargo Funds Management, LLC from 2001 to 2003. | | |
C. David Messman
(Born 1960) | | Secretary, since 2000; Chief Legal Counsel, since 2003 | | Senior Vice President and Secretary of Wells Fargo Funds Management, LLC since 2001. Vice President and Managing Senior Counsel of Wells Fargo Bank, N.A. since 1996. | | |
Kasey Phillips
(Born 1970) | | Treasurer, since 2009 | | Senior Vice President of Wells Fargo Funds Management, LLC since 2009. Senior Vice President of Evergreen Investment Management Company, LLC from 2006 to 2010. Treasurer of the Evergreen Funds from 2005 to 2010. | | |
David Berardi
(Born 1975) | | Assistant Treasurer, since 2009 | | Vice President of Wells Fargo Funds Management, LLC since 2009. Vice President of Evergreen Investment Management Company, LLC from 2008 to 2010. Assistant Vice President of Evergreen Investment Services, Inc. from 2004 to 2008. Manager of Fund Reporting and Control for Evergreen Investment Management Company, LLC from 2004 to 2010. | | |
Jeremy DePalma
(Born 1974) | | Assistant Treasurer, since 2009 | | Senior Vice President of Wells Fargo Funds Management, LLC since 2009. Senior Vice President of Evergreen Investment Management Company, LLC from 2008 to 2010. Vice President, Evergreen Investment Services, Inc. from 2004 to 2007. Head of the Fund Reporting and Control Team within Fund Administration from 2005 to 2010. | | |
Debra Ann Early
(Born 1964) | | Chief Compliance Officer, since 2007 | | Chief Compliance Officer of Wells Fargo Funds Management, LLC since 2007. Chief Compliance Officer of Parnassus Investments from 2005 to 2007. Chief Financial Officer of Parnassus Investments from 2004 to 2007 and Senior Audit Manager of PricewaterhouseCoopers LLP from 1998 to 2004. | | |
| 1. | The Statement of Additional Information includes additional information about the Trustees and is available, without charge, upon request, by calling 1-800-222-8222 or by visiting the Web site at wellsfargoadvantagefunds.com. |
| | | | |
| 28 | | Wells Fargo Advantage Large Cap Core Fund | | List of Abbreviations |
The following is a list of common abbreviations for terms and entities which may have appeared in this report.
| ACB | — Agricultural Credit Bank |
| ADR | — American Depository Receipt |
| ADS | — American Depository Shares |
| AGC-ICC | — Assured Guaranty Corporation - Insured Custody Certificates |
| AGM | — Assured Guaranty Municipal |
| AMBAC | — American Municipal Bond Assurance Corporation |
| AMT | — Alternative Minimum Tax |
| BAN | — Bond Anticipation Notes |
| BHAC | — Berkshire Hathaway Assurance Corporation |
| CAB | — Capital Appreciation Bond |
| CCAB | — Convertible Capital Appreciation Bond |
| CDA | — Community Development Authority |
| CDO | — Collateralized Debt Obligation |
| COP | — Certificate of Participation |
| DRIVER | — Derivative Inverse Tax-Exempt Receipts |
| DW&P | — Department of Water & Power |
| DWR | — Department of Water Resources |
| ECFA | — Educational & Cultural Facilities Authority |
| EDA | — Economic Development Authority |
| EDFA | — Economic Development Finance Authority |
| ETF | — Exchange-Traded Fund |
| FFCB | — Federal Farm Credit Bank |
| FGIC | — Financial Guaranty Insurance Corporation |
| FHA | — Federal Housing Authority |
| FHLB | — Federal Home Loan Bank |
| FHLMC | — Federal Home Loan Mortgage Corporation |
| FNMA | — Federal National Mortgage Association |
| GDR | — Global Depository Receipt |
| GNMA | — Government National Mortgage Association |
| HCFR | — Healthcare Facilities Revenue |
| HEFA | — Health & Educational Facilities Authority |
| HEFAR | — Higher Education Facilities Authority Revenue |
| HFA | — Housing Finance Authority |
| HFFA | — Health Facilities Financing Authority |
| IBC | — Insured Bond Certificate |
| IDA | — Industrial Development Authority |
| IDAG | — Industrial Development Agency |
| IDR | — Industrial Development Revenue |
| KRW | — Republic of Korea Won |
| LIBOR | — London Interbank Offered Rate |
| LLC | — Limited Liability Company |
| LLP | — Limited Liability Partnership |
| MBIA | — Municipal Bond Insurance Association |
| MFHR | — Multi-Family Housing Revenue |
| MSTR | — Municipal Securities Trust Receipts |
| MUD | — Municipal Utility District |
| NATL-RE | — National Public Finance Guarantee Corporation |
| PCFA | — Pollution Control Finance Authority |
| PCR | — Pollution Control Revenue |
| PFA | — Public Finance Authority |
| PFFA | — Public Facilities Financing Authority |
| PFOTER | — Puttable Floating Option Tax-Exempt Receipts |
| plc | — Public Limited Company |
| PUTTER | — Puttable Tax-Exempt Receipts |
| R&D | — Research & Development |
| RDA | — Redevelopment Authority |
| RDFA | — Redevelopment Finance Authority |
| REIT | — Real Estate Investment Trust |
| ROC | — Reset Option Certificates |
| SAVRS | — Select Auction Variable Rate Securities |
| SBA | — Small Business Authority |
| SFHR | — Single Family Housing Revenue |
| SFMR | — Single Family Mortgage Revenue |
| SPDR | — Standard & Poor’s Depositary Receipts |
| TAN | — Tax Anticipation Notes |
| TIPS | — Treasury Inflation-Protected Securities |
| TRAN | — Tax Revenue Anticipation Notes |
| TCR | — Transferable Custody Receipts |
| TTFA | — Transportation Trust Fund Authority |
| TVA | — Tennessee Valley Authority |
| XLCA | — XL Capital Assurance |
This page is intentionally left blank.
This page is intentionally left blank.


FOR MORE INFORMATION
More information about Wells Fargo Advantage Funds is available free upon request. To obtain literature, please write, e-mail, visit the Fund’s Web site, or call:
Wells Fargo Advantage Funds
P.O. Box 8266
Boston, MA 02266-8266
E-mail: wfaf@wellsfargo.com
Web site: wellsfargoadvantagefunds.com
Individual investors: 1-800-222-8222
Retail investment professionals: 1-888-877-9275
Institutional investment professionals: 1-866-765-0778
This report and the financial statements contained herein are submitted for the general information of the shareholders of Wells Fargo Advantage Funds. If this report is used for promotional purposes, distribution of the report must be accompanied or preceded by a current prospectus. For a prospectus containing more complete information, including charges and expenses, call 1-800-222-8222 or visit the Fund’s Web site at wellsfargoadvantagefunds.com. Please consider the investment objectives, risks, charges, and expenses of the investment carefully before investing. This and other information about Wells Fargo Advantage Funds can be found in the current prospectus. Read the prospectus carefully before you invest or send money.
Wells Fargo Funds Management, LLC, a wholly owned subsidiary of Wells Fargo & Company, provides investment advisory and administrative services for Wells Fargo Advantage Funds. Other affiliates of Wells Fargo & Company provide subadvisory and other services for the Funds. The Funds are distributed by Wells Fargo Funds Distributor, LLC, Member FINRA/SIPC, an affiliate of Wells Fargo & Company.
NOT FDIC INSURED ¡ NO BANK GUARANTEE ¡ MAY LOSE VALUE
© 2012 Wells Fargo Funds Management, LLC. All rights reserved.
| | |
 | | 207948 03-12 SA208/SAR208 1-12 |

Wells Fargo Advantage
Large Cap Growth Fund

Semi-Annual Report
January 31, 2012

Reduce clutter. Save trees.
Sign up for electronic delivery of prospectuses and shareholder reports at wellsfargo.com/advantagedelivery
Contents
The views expressed and any forward-looking statements are as of January 31, 2012, unless otherwise noted, and are those of the Fund managers and/or Wells Fargo Funds Management, LLC. Discussions of individual securities, or the markets generally, or any Wells Fargo Advantage Fund are not intended as individual recommendations. Future events or results may vary significantly from those expressed in any forward-looking statements; the views expressed are subject to change at any time in response to changing circumstances in the market. Wells Fargo Funds Management, LLC, disclaims any obligation to publicly update or revise any views expressed or forward-looking statements.
NOT FDIC INSURED ¡ NO BANK GUARANTEE ¡ MAY LOSE VALUE

WELLS FARGO INVESTMENT HISTORY
| | |
| |
| 1932 | | Keystone creates one of the first mutual fund families. |
| |
| 1971 | | Wells Fargo & Company introduces one of the first institutional index funds. |
| |
| 1978 | | Wells Fargo applies Markowitz and Sharpe’s research on Modern Portfolio Theory to introduce one of the industry’s first Tactical Asset Allocation (TAA) models in institutional separately managed accounts. |
| |
| 1984 | | Wells Fargo Stagecoach Funds launches its first asset allocation fund. |
| |
| 1989 | | The Tactical Asset Allocation (TAA) Model is first applied to Wells Fargo’s asset allocation mutual funds. |
| |
| 1994 | | Wells Fargo introduces the LifePath Funds, one of the first suites of target date funds (now the Wells Fargo Advantage Dow Jones Target Date FundsSM ). |
| |
| 1996 | | Evergreen Investments and Keystone Funds merge. |
| |
| 1997 | | Wells Fargo launches Wells Fargo Advantage WealthBuilder PortfoliosSM, a fund-of-funds suite of products that includes the use of quantitative models to shift assets among investment styles. |
| |
| 1999 | | Norwest Advantage Funds and Stagecoach Funds are reorganized into Wells Fargo Funds after the merger of Norwest and Wells Fargo. |
| |
| 2002 | | Evergreen Retail and Evergreen Institutional companies form the umbrella asset management company, Evergreen Investments. |
| |
| 2005 | | The integration of Strong Funds with Wells Fargo Funds creates Wells Fargo Advantage Funds, resulting in one of the top 20 mutual fund companies in the United States. |
| |
| 2006 | | Wells Fargo Advantage Funds relaunches the target date product line as Wells Fargo Advantage Dow Jones Target Date Funds. |
| |
| 2010 | | The mergers and reorganizations of Evergreen and Wells Fargo Advantage mutual funds are completed, unifying the families under the brand of Wells Fargo Advantage Funds. |
Wells Fargo Advantage Funds®
Wells Fargo Advantage Funds skillfully guides institutions, financial advisors, and individuals through the investment terrain to help them reach their financial objectives. Everything we do on behalf of investors is backed by our unique combination of qualifications.
Strength
Our organization is built on the standards of integrity and service established by our parent company—Wells Fargo & Company—more than 150 years ago. And, because we’re part of a highly diversified financial enterprise, we offer the depth of resources to help investors succeed.
Expertise
Our multi-boutique model offers investors access to the independent thinking of premier investment managers that have been chosen for their time-tested strategies. While each team specializes in a specific investment strategy, collectively they provide investors a wide choice of distinct investment styles. Our dedication to investment excellence doesn’t end with our expertise in manager selection—risk management, analysis, and rigorous ongoing review seek to ensure each manager’s investment process remains consistent.
Partnership
Our collaborative approach is built around understanding the needs and goals of our clients. By adhering to core principles of sound judgment and steady guidance, we support you through every stage of the investment decision process.
Carefully consider a fund’s investment objectives, risks, charges, and expenses before investing. For a current prospectus and, if available, a summary prospectus, containing this and other information, visit wellsfargoadvantagefunds.com. Read it carefully before investing.
Wells Fargo Funds Management, LLC, a wholly owned subsidiary of Wells Fargo & Company, provides investment advisory and administrative services for Wells Fargo Advantage Funds®. Other affiliates of Wells Fargo & Company provide subadvisory and other services for the Funds. The Funds are distributed by Wells Fargo Funds Distributor, LLC, Member FINRA/SIPC, an affiliate of Wells Fargo & Company.
“Dow Jones®” and “Dow Jones Target Date IndexesSM” are service marks of Dow Jones Trademark Holdings, LLC (“Dow Jones”), have been licensed to CME Group Index Services LLC (“CME Indexes”) and have been sublicensed for use for certain purposes by Global Index Advisors, Inc, and Wells Fargo Funds Management, LLC. The Wells Fargo Advantage Dow Jones Target Date FundsSM based on the Dow Jones Target Date IndexesSM, are not sponsored, endorsed, sold or promoted by Dow Jones, CME Indexes or their respective affiliates and none of them makes any representation regarding the advisability of investing in such product(s).
NOT FDIC INSURED ¡ NO BANK GUARANTEE ¡ MAY LOSE VALUE
Not part of the semi-annual report.
Wells Fargo Advantage Funds offers more than 110 mutual funds across a wide range of asset classes, representing over $217 billion in assets under management, as of January 31, 2012.
| | | | |
| Equity Funds | | | | |
Asia Pacific Fund | | Equity Value Fund | | Precious Metals Fund |
C&B Large Cap Value Fund | | Global Opportunities Fund | | Premier Large Company Growth Fund |
C&B Mid Cap Value Fund | | Growth Fund | | Small Cap Opportunities Fund |
Capital Growth Fund | | Index Fund | | Small Cap Value Fund |
Common Stock Fund | | International Equity Fund | | Small Company Growth Fund |
Disciplined U.S. Core Fund | | International Value Fund | | Small Company Value Fund |
Discovery Fund† | | Intrinsic Small Cap Value Fund | | Small/Mid Cap Core Fund |
Diversified Equity Fund | | Intrinsic Value Fund | | Small/Mid Cap Value Fund |
Diversified International Fund | | Intrinsic World Equity Fund | | Special Mid Cap Value Fund |
Diversified Small Cap Fund | | Large Cap Core Fund | | Special Small Cap Value Fund |
Emerging Growth Fund | | Large Cap Growth Fund | | Specialized Technology Fund |
Emerging Markets Equity Fund | | Large Company Value Fund | | Strategic Large Cap Growth Fund |
Endeavor Select Fund† | | Omega Growth Fund | | Traditional Small Cap Growth Fund |
Enterprise Fund† | | Opportunity Fund† | | Utility and Telecommunications Fund |
| Bond Funds | | | | |
Adjustable Rate Government Fund | | Inflation-Protected Bond Fund | | Short-Term Bond Fund |
California Limited-Term Tax-Free Fund | | Intermediate Tax/AMT-Free Fund | | Short-Term High Yield Bond Fund |
California Tax-Free Fund | | International Bond Fund | | Short-Term Municipal Bond Fund |
Colorado Tax-Free Fund | | Minnesota Tax-Free Fund | | Strategic Municipal Bond Fund |
Government Securities Fund | | Municipal Bond Fund | | Total Return Bond Fund |
High Income Fund | | North Carolina Tax-Free Fund | | Ultra Short-Term Income Fund |
High Yield Bond Fund | | Pennsylvania Tax-Free Fund | | Ultra Short-Term Municipal Income Fund |
Income Plus Fund | | Short Duration Government Bond Fund | | Wisconsin Tax-Free Fund |
| Asset Allocation Funds | | | | |
Absolute Return Fund | | WealthBuilder Equity Portfolio† | | Target 2020 Fund† |
Asset Allocation Fund | | WealthBuilder Growth Allocation Portfolio† | | Target 2025 Fund† |
Conservative Allocation Fund | | WealthBuilder Growth Balanced Portfolio† | | Target 2030 Fund† |
Diversified Capital Builder Fund | | WealthBuilder Moderate Balanced Portfolio† | | Target 2035 Fund† |
Diversified Income Builder Fund | | WealthBuilder Tactical Equity Portfolio† | | Target 2040 Fund† |
Growth Balanced Fund | | Target Today Fund† | | Target 2045 Fund† |
Index Asset Allocation Fund | | Target 2010 Fund† | | Target 2050 Fund† |
Moderate Balanced Fund | | Target 2015 Fund† | | Target 2055 Fund† |
WealthBuilder Conservative Allocation Portfolio† | | | | |
| Money Market Funds | | | | |
100% Treasury Money Market Fund | | Heritage Money Market Fund† | | National Tax-Free Money Market Fund |
California Municipal Money Market Fund | | Money Market Fund | | Prime Investment Money Market Fund |
Cash Investment Money Market Fund | | Municipal Cash Management Money Market Fund | | Treasury Plus Money Market Fund |
Government Money Market Fund | | Municipal Money Market Fund | | |
| Variable Trust Funds1 | | | | |
VT Discovery Fund† | | VT Intrinsic Value Fund | | VT Small Cap Growth Fund |
VT Index Asset Allocation Fund | | VT Omega Growth Fund | | VT Small Cap Value Fund |
VT International Equity Fund | | VT Opportunity Fund† | | VT Total Return Bond Fund |
An investment in a money market fund is not insured or guaranteed by the Federal Deposit Insurance Corporation or any other government agency. Although the Wells Fargo Advantage Money Market Funds seek to preserve the value of your investment at $1.00 per share, it is possible to lose money by investing in a money market fund.
| 1. | The Variable Trust Funds are generally available only through insurance company variable contracts. |
| † | In this report, the Wells Fargo Advantage Discovery FundSM, Wells Fargo Advantage Endeavor Select FundSM, Wells Fargo Advantage Enterprise FundSM, Wells Fargo Advantage Opportunity FundSM, Wells Fargo Advantage WealthBuilder Conservative Allocation PortfolioSM, Wells Fargo Advantage WealthBuilder Equity PortfolioSM, Wells Fargo Advantage WealthBuilder Growth Allocation PortfolioSM, Wells Fargo Advantage WealthBuilder Growth Balanced PortfolioSM, Wells Fargo Advantage WealthBuilder Moderate Balanced PortfolioSM, Wells Fargo Advantage WealthBuilder Tactical Equity PortfolioSM, Wells Fargo Advantage Dow Jones Target Today FundSM, Wells Fargo Advantage Dow Jones Target 2010 FundSM, Wells Fargo Advantage Dow Jones Target 2015 FundSM, Wells Fargo Advantage Dow Jones Target 2020 FundSM, Wells Fargo Advantage Dow Jones Target 2025 FundSM, Wells Fargo Advantage Dow Jones Target 2030 FundSM, Wells Fargo Advantage Dow Jones Target 2035 FundSM, Wells Fargo Advantage Dow Jones Target 2040 FundSM, Wells Fargo Advantage Dow Jones Target 2045 FundSM, Wells Fargo Advantage Dow Jones Target 2050 FundSM, Wells Fargo Advantage Dow Jones Target 2055 FundSM, Wells Fargo Advantage Heritage Money Market FundSM, Wells Fargo Advantage VT Discovery FundSM, and Wells Fargo Advantage VT Opportunity FundSM are referred to as the Discovery Fund, Endeavor Select Fund, Enterprise Fund, Opportunity Fund, WealthBuilder Conservative Allocation Portfolio, WealthBuilder Equity Portfolio, WealthBuilder Growth Allocation Portfolio, WealthBuilder Growth Balanced Portfolio, WealthBuilder Moderate Balanced Portfolio, WealthBuilder Tactical Equity Portfolio, Target Today Fund, Target 2010 Fund, Target 2015 Fund, Target 2020 Fund, Target 2025 Fund, Target 2030 Fund, Target 2035 Fund, Target 2040 Fund, Target 2045 Fund, Target 2050 Fund, Target 2055 Fund, Heritage Money Market Fund, VT Discovery Fund, and VT Opportunity Fund, respectively. |
Not part of the semi-annual report.
| | | | |
| 2 | | Wells Fargo Advantage Large Cap Growth Fund | | Letter to Shareholders |

Karla M. Rabusch,
President
Wells Fargo Advantage Funds
The period was marked by increased confidence that the U.S. economy was staging a fragile recovery, offset by continued concerns about the possible effect on the global economy of the ongoing European sovereign debt crisis—which began in Greece and later spread to the larger economies of Italy and Spain.
The slow-motion debt crisis in the eurozone was a major headwind to both domestic and global stock market indexes.
Dear Valued Shareholder:
We’re pleased to offer you this semi-annual report for the Wells Fargo Advantage Large Cap Growth Fund for the six-month period that ended January 31, 2012. The period was marked by increased confidence that the U.S. economy was staging a fragile recovery, offset by continued concerns about the possible effect on the global economy of the ongoing European sovereign debt crisis—which began in Greece and later spread to the larger economies of Italy and Spain. Most U.S. stock indexes posted gains for the period, even if only modest ones.
Worries gave way to guarded optimism for the U.S. economy.
The period began with worries that the U.S. economy was returning to recession. Revised figures for gross domestic product (GDP) indicated that the U.S. economy grew by an annualized rate of only 0.8% in the first half of 2011. Moreover, although the July 2011 Institute for Supply Management (ISM) manufacturing survey suggested that factories continued to expand, the rate of expansion was lower than in previous months. The prolonged debate over whether and how to raise the U.S. debt ceiling—which only ended on July 31, 2011—also depressed market sentiment by highlighting the country’s political divisions.
The stock market remained volatile throughout September. By late October, however, stronger economic data led to greater optimism and higher stock prices. Revised real GDP growth came in at 1.8% in the third quarter of 2011 and 2.8% in the fourth quarter, suggesting that the recovery was on firmer footing. Economic growth was not evenly distributed, though, as December 2011 retail same-store sales generally showed stronger growth for retailers targeting affluent customers than for those targeting the broad middle class. The reported unemployment rate also showed some signs of improvement, falling from 9.1% in August 2011 to 8.3% in January 2012. However, this decline in the unemployment rate was accompanied by an increase in the number of Americans not in the labor force, raising concerns about the economy’s ability to generate jobs.
The eurozone had continued trouble.
The slow-motion debt crisis in the eurozone was a major headwind to both domestic and global stock market indexes. The worsening debt and deficit numbers for Greece in late 2011 and early 2012 cast doubt on the country’s ability to service its debt under the plan put in place by the European Union and the International Monetary Fund and put the ongoing drama of the European sovereign debt crisis back on center stage. Investors became increasingly concerned that Greece would default on its debt, a scenario that only seemed more likely as many Greeks rioted in response to greater budgetary austerity and the discussion moved from whether private investors would take a loss on their Greek debt to how big the loss would be. Because many eurozone banks owned Greek debt and many U.S. banks had financial ties to eurozone banks, investors worried about the effect of such an event on the financial system and the global economy.
Even as the situation in Greece deteriorated, eurozone GDP numbers supported the case for a modest recovery in the global economy. Reported GDP growth for the 17 countries that comprise the eurozone was modest, rising 0.2% in the third quarter compared to the second quarter, and by 0.2% in the fourth quarter
| | | | | | |
| Letter to Shareholders | | Wells Fargo Advantage Large Cap Growth Fund | | | 3 | |
compared to the third quarter. However, the eurozone average concealed a wide variation between economies, with Germany’s growing by 0.5% in the third quarter of 2011 even as Greece’s GDP contracted.
Central banks continued to provide stimulus.
Throughout the reporting period, the Federal Open Market Committee (FOMC) kept its key interest rates effectively at zero in order to support the economy and financial system. Moreover, in response to extreme market volatility and signs of a weakening economy, in its August 2011 policy statement, the Federal Reserve (Fed) announced it would keep interest rates “exceptionally low” until at least mid-2013 as a way to support the economy. Market participants interpreted the Fed’s statement to mean that the central bankers believed the economy would remain weak over the next two years. However, the Fed also said that it was considering a “range of policy tools available to promote a stronger economic recovery” and “is prepared to employ these tools as appropriate.”
At the beginning of the period, the European Central Bank (ECB) had a key rate of 1.50% but lowered it to 1.25% in November 2011 and then to 1.00% in December 2011 in an attempt to support the sluggish eurozone recovery. To support the banking system, in late 2011, the ECB initiated a long-term refinancing operation (LTRO) in which it supplied three-year loans to banks against a wide range of collateral. The operation basically provided a near-unlimited amount of liquidity to banks, easing some investor concerns about the effect of an increasingly probable Greek default.
We use time-tested investment strategies, even as many variables are at work in the market.
Experience tells us that strict adherence to time-tested investment strategies has its rewards. As a whole, Wells Fargo Advantage Funds represents investments across a range of asset classes and investment styles, giving you an opportunity to create a diversified investment portfolio. While diversification may not prevent losses in a downturn, it does provide you with one way of managing risk.
Thank you for choosing to invest with Wells Fargo Advantage Funds. We appreciate your confidence in us and remain committed to helping you meet your financial needs. For current information about your fund investments, contact your investment professional, visit our website at wellsfargoadvantagefunds.com, or call us directly at 1-800-222-8222. We are available 24 hours a day, 7 days a week.
Sincerely,

Karla M. Rabusch
President
Wells Fargo Advantage Funds
| | | | |
| 4 | | Wells Fargo Advantage Large Cap Growth Fund | | Letter to Shareholders |
Notice to Shareholders
The Board of Trustees for Wells Fargo Advantage Funds has unanimously approved the following modifications to certain net asset value (NAV) waiver privileges and commission schedules:
| | n | | Effective May 1, 2012, automatic investment plan (AIP) purchases and proceeds received from systematic withdrawals will no longer qualify for NAV repurchase privileges. | |
| | n | | Effective May 1, 2012, discretionary rights to waive the upfront commission for Class C and “jumbo” Class A share purchases will no longer be granted to broker/dealers. However, we will continue to waive the Class C shares contingent deferred sales charge for redemptions by employer-sponsored retirement plans where the dealer of record waived its commission at the time of purchase. | |
| | n | | Effective July 31, 2012, NAV purchase privileges for former Evergreen Class IS and Class R shareholders are being modified to remove the ability to purchase Class A shares at NAV unless those shares are held directly with the Fund on or after July 31, 2012. | |
Please contact your investment professional or call us directly at 1-800-222-8222 if you have any questions on this Notice to Shareholders.
| | | | | | |
| Performance Highlights (Unaudited) | | Wells Fargo Advantage Large Cap Growth Fund | | | 5 | |
INVESTMENT OBJECTIVE
The Fund seeks long-term capital appreciation.
ADVISER
Wells Fargo Funds Management, LLC
SUB-ADVISER
Wells Capital Management Incorporated
PORTFOLIO MANAGERS
Joseph M. Eberhardy, CFA, CPA
Thomas C. Ognar, CFA
Bruce C. Olson, CFA
FUND INCEPTION
December 30, 1981
| | | | |
TEN LARGEST EQUITY HOLDINGS1 (AS OF JANUARY 31, 2012) | |
Apple Incorporated | | | 7.53% | |
Google Incorporated Class A | | | 3.19% | |
QUALCOMM Incorporated | | | 2.94% | |
Cognizant Technology Solutions Corporation
Class A | | | 2.57% | |
MasterCard Incorporated | | | 2.49% | |
Praxair Incorporated | | | 2.40% | |
Alexion Pharmaceuticals Incorporated | | | 2.36% | |
priceline.com Incorporated | | | 2.33% | |
EMC Corporation | | | 2.30% | |
Whole Foods Market Incorporated | | | 2.20% | |
| | |
SECTOR DISTRIBUTION2 (AS OF JANUARY 31, 2012) | | |
|
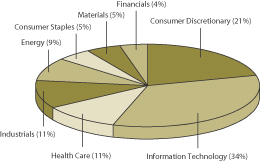 |
| 1. | The ten largest equity holdings are calculated based on the value of the securities divided by total net assets of the Fund. Holdings are subject to change and may have changed since the date specified. |
| 2. | Sector distribution is subject to change and is calculated based on the total long-term investments of the Fund. |
| | | | |
| 6 | | Wells Fargo Advantage Large Cap Growth Fund | | Performance Highlights (Unaudited) |
AVERAGE ANNUAL TOTAL RETURN3 (%) (AS OF JANUARY 31, 2012)
| | | | | | | | | | | | | | | | | | | | | | | | | | | | | | | | | | | | | | | | | | | | |
| | | | | | Including Sales Charge | | | Excluding Sales Charge | | | Expense Ratios4 | |
| | | Inception Date | | | 6 Months* | | | 1 Year | | | 5 Year | | | 10 Year | | | 6 Months* | | | 1 Year | | | 5 Year | | | 10 Year | | | Gross | | | Net5 | |
Class A (STAFX) | | | 07/30/2010 | | | | (4.26 | ) | | | 1.82 | | | | 2.92 | | | | 2.71 | | | | 1.58 | | | | 8.04 | | | | 4.15 | | | | 3.32 | | | | 1.25% | | | | 1.12% | |
Class C (STOFX) | | | 07/30/2010 | | | | 0.21 | | | | 6.26 | | | | 3.42 | | | | 2.61 | | | | 1.21 | | | | 7.26 | | | | 3.42 | | | | 2.61 | | | | 2.00% | | | | 1.87% | |
Administrator Class (STDFX) | | | 07/30/2010 | | | | | | | | | | | | | | | | | | | | 1.71 | | | | 8.23 | | | | 4.20 | | | | 3.35 | | | | 1.09% | | | | 0.95% | |
Institutional Class (STNFX) | | | 07/30/2010 | | | | | | | | | | | | | | | | | | | | 1.80 | | | | 8.46 | | | | 4.26 | | | | 3.38 | | | | 0.82% | | | | 0.75% | |
Investor Class (STRFX) | | | 12/30/1981 | | | | | | | | | | | | | | | | | | | | 1.58 | | | | 7.97 | | | | 4.12 | | | | 3.31 | | | | 1.32% | | | | 1.19% | |
Russell 1000® Growth Index6 | | | | | | | | | | | | | | | | | | | | | | | 2.84 | | | | 6.07 | | | | 3.17 | | | | 3.38 | | | | | | | | | |
| * | Returns for periods of less than one year are not annualized. |
Figures quoted represent past performance, which is no guarantee of future results and do not reflect the deduction of taxes that a shareholder may pay on fund distributions or the redemption of fund shares. Investment return and principal value of an investment will fluctuate so that an investor’s shares, when redeemed, may be worth more or less than their original cost. Performance shown without sales charges would be lower if sales charges were reflected. Current performance may be lower or higher than the performance data quoted and assumes the reinvestment of dividends and capital gains. Current month-end performance is available on the Fund’s Web site – wellsfargoadvantagefunds.com.
Index returns do not include transaction costs associated with buying and selling securities, any mutual fund fees or expenses or any taxes. It is not possible to invest directly in an index.
For Class A shares, the maximum front-end sales charge is 5.75%. For Class C shares, the maximum contingent deferred sales charge is 1.00%. Performance including sales charge assumes the sales charge for the corresponding time period. Administrator Class, Institutional Class and Investor Class shares are sold without a front-end sales charge or contingent deferred sales charge.
Stock fund values fluctuate in response to the activities of individual companies and general market and economic conditions. Certain investment strategies tend to increase the total risk of an investment (relative to the broader market). This Fund is exposed to foreign investment risk. Consult the Fund’s prospectus for additional information on these and other risks.
| 3. | Historical performance shown for the Class A, Administrator Class and Institutional Class shares prior to their inception reflects the performance of the Investor Class shares, and includes the higher expenses applicable to Investor Class shares. If these expenses had not been included, returns would be higher. Historical performance shown for Class C shares prior to their inception reflects the performance of the Investor Class shares, adjusted to reflect the higher expenses applicable to Class C shares. |
| 4. | Reflects the expense ratios as stated in the most recent prospectuses. |
| 5. | The Adviser has committed through November 30, 2012 to waive fees and/or reimburse expenses to the extent necessary to cap the Fund’s Total Annual Fund Operating Expenses After Fee Waiver, excluding certain expenses, at the amounts shown above. Without this cap, the Fund’s returns would have been lower. |
| 6. | The Russell 1000® Growth Index measures the performance of those Russell 1000 Growth Index companies with higher price-to-book ratios and higher forecasted growth values. You cannot invest directly in an index. |
| | | | | | |
| Fund Expenses (Unaudited) | | Wells Fargo Advantage Large Cap Growth Fund | | | 7 | |
As a shareholder of the Fund, you incur two types of costs: (1) transaction costs, including sales charges (loads) on purchase payments and contingent deferred sales charges (if any) on redemptions and (2) ongoing costs, including management fees; distribution (12b-1) and/or shareholder service fees; and other Fund expenses. This example is intended to help you understand your ongoing costs (in dollars) of investing in the Fund and to compare these costs with the ongoing costs of investing in other mutual funds.
The example is based on an investment of $1,000 invested at the beginning of the six-month period and held for the entire period from August 1, 2011 to January 31, 2012.
Actual Expenses
The “Actual” line of the table below provides information about actual account values and actual expenses. You may use the information in this line, together with the amount you invested, to estimate the expenses that you paid over the period. Simply divide your account value by $1,000 (for example, an $8,600 account value divided by $1,000 = 8.6), then multiply the result by the number in the “Actual” line under the heading entitled “Expenses Paid During Period” for your applicable class of shares to estimate the expenses you paid on your account during this period.
Hypothetical Example for Comparison Purposes
The “Hypothetical” line of the table below provides information about hypothetical account values and hypothetical expenses based on the Fund’s actual expense ratio and an assumed rate of return of 5% per year before expenses, which is not the Fund’s actual return. The hypothetical account values and expenses may not be used to estimate the actual ending account balance or expenses you paid for the period. You may use this information to compare the ongoing costs of investing in the Fund and other funds. To do so, compare this 5% hypothetical example with the 5% hypothetical examples that appear in the shareholder reports of the other funds.
Please note that the expenses shown in the table are meant to highlight your ongoing costs only and do not reflect any transactional costs, such as sales charges (loads) and contingent deferred sales charges. Therefore, the “Hypothetical” line of the table is useful in comparing ongoing costs only, and will not help you determine the relative total costs of owning different funds. In addition, if these transactional costs were included, your costs would have been higher.
| | | | | | | | | | | | | | | | |
| | | Beginning
Account Value
08-01-2011 | | | Ending
Account Value
01-31-2012 | | | Expenses
Paid During
the Period1 | | | Net Annual
Expense Ratio | |
Class A | | | | | | | | | | | | | | | | |
Actual | | $ | 1,000.00 | | | $ | 1,015.81 | | | $ | 5.68 | | | | 1.12 | % |
Hypothetical (5% return before expenses) | | $ | 1,000.00 | | | $ | 1,019.51 | | | $ | 5.69 | | | | 1.12 | % |
Class C | | | | | | | | | | | | | | | | |
Actual | | $ | 1,000.00 | | | $ | 1,012.11 | | | $ | 9.46 | | | | 1.87 | % |
Hypothetical (5% return before expenses) | | $ | 1,000.00 | | | $ | 1,015.74 | | | $ | 9.48 | | | | 1.87 | % |
Administrator Class | | | | | | | | | | | | | | | | |
Actual | | $ | 1,000.00 | | | $ | 1,017.05 | | | $ | 4.82 | | | | 0.95 | % |
Hypothetical (5% return before expenses) | | $ | 1,000.00 | | | $ | 1,020.36 | | | $ | 4.82 | | | | 0.95 | % |
Institutional Class | | | | | | | | | | | | | | | | |
Actual | | $ | 1,000.00 | | | $ | 1,017.96 | | | $ | 3.80 | | | | 0.75 | % |
Hypothetical (5% return before expenses) | | $ | 1,000.00 | | | $ | 1,021.37 | | | $ | 3.81 | | | | 0.75 | % |
Investor Class | | | | | | | | | | | | | | | | |
Actual | | $ | 1,000.00 | | | $ | 1,015.83 | | | $ | 6.03 | | | | 1.19 | % |
Hypothetical (5% return before expenses) | | $ | 1,000.00 | | | $ | 1,019.15 | | | $ | 6.04 | | | | 1.19 | % |
| 1. | Expenses paid is equal to the annualized expense ratio of each class multiplied by the average account value over the period, multiplied by the number of days in the most recent fiscal half-year divided by the number of days in the fiscal year (to reflect the one-half year period). |
| | | | |
| 8 | | Wells Fargo Advantage Large Cap Growth Fund | | Portfolio of Investments—January 31, 2012 (Unaudited) |
| | | | | | | | | | | | |
| Security Name | | | | | | Shares | | | Value | |
| | | | | | | | | | | | |
| | | | |
Common Stocks: 98.02% | | | | | | | | | | | | |
| | | | |
Consumer Discretionary: 20.83% | | | | | | | | | | | | |
| | | | |
| Auto Components: 0.60% | | | | | | | | | | | | |
Johnson Controls Incorporated | | | | | | | 69,000 | | | $ | 2,192,130 | |
| | | | | | | | | | | | |
| | | | |
| Hotels, Restaurants & Leisure: 5.25% | | | | | | | | | | | | |
McDonald’s Corporation | | | | | | | 76,000 | | | | 7,527,800 | |
Starbucks Corporation | | | | | | | 133,000 | | | | 6,374,690 | |
Wynn Resorts Limited | | | | | | | 45,000 | | | | 5,185,350 | |
| | | | |
| | | | | | | | | | | 19,087,840 | |
| | | | | | | | | | | | |
| | | | |
| Internet & Catalog Retail: 3.93% | | | | | | | | | | | | |
Amazon.com Incorporated† | | | | | | | 30,000 | | | | 5,833,200 | |
priceline.com Incorporated† | | | | | | | 16,000 | | | | 8,471,680 | |
| | | | |
| | | | | | | | | | | 14,304,880 | |
| | | | | | | | | | | | |
| | | | |
| Multiline Retail: 1.52% | | | | | | | | | | | | |
Dollar Tree Incorporated† | | | | | | | 65,000 | | | | 5,512,650 | |
| | | | | | | | | | | | |
| | | | |
| Specialty Retail: 4.20% | | | | | | | | | | | | |
CarMax Incorporated†« | | | | | | | 185,000 | | | | 5,629,550 | |
Dick’s Sporting Goods Incorporated | | | | | | | 70,000 | | | | 2,884,700 | |
O’Reilly Automotive Incorporated† | | | | | | | 61,000 | | | | 4,972,110 | |
Ross Stores Incorporated | | | | | | | 35,000 | | | | 1,778,700 | |
| | | | |
| | | | | | | | | | | 15,265,060 | |
| | | | | | | | | | | | |
| | | | |
| Textiles, Apparel & Luxury Goods: 5.33% | | | | | | | | | | | | |
Coach Incorporated | | | | | | | 98,000 | | | | 6,864,900 | |
Fossil Incorporated† | | | | | | | 40,000 | | | | 3,802,000 | |
Nike Incorporated Class B | | | | | | | 52,000 | | | | 5,407,480 | |
VF Corporation | | | | | | | 25,000 | | | | 3,287,250 | |
| | | | |
| | | | | | | | | | | 19,361,630 | |
| | | | | | | | | | | | |
| | | | |
Consumer Staples: 4.68% | | | | | | | | | | | | |
| | | | |
| Beverages: 0.69% | | | | | | | | | | | | |
The Coca-Cola Company | | | | | | | 37,000 | | | | 2,498,610 | |
| | | | | | | | | | | | |
| | | | |
| Food & Staples Retailing: 2.85% | | | | | | | | | | | | |
Costco Wholesale Corporation | | | | | | | 29,000 | | | | 2,385,830 | |
Whole Foods Market Incorporated | | | | | | | 108,000 | | | | 7,995,240 | |
| | | | |
| | | | | | | | | | | 10,381,070 | |
| | | | | | | | | | | | |
| | | | |
| Food Products: 0.95% | | | | | | | | | | | | |
Green Mountain Coffee Roasters Incorporated† | | | | | | | 7,500 | | | | 400,050 | |
Mead Johnson & Company | | | | | | | 41,000 | | | | 3,037,690 | |
| | | | |
| | | | | | | | | | | 3,437,740 | |
| | | | | | | | | | | | |
| | | | |
| Personal Products: 0.19% | | | | | | | | | | | | |
Estee Lauder Companies Incorporated Class A | | | | | | | 12,000 | | | | 695,160 | |
| | | | | | | | | | | | |
| | | | | | |
| Portfolio of Investments—January 31, 2012 (Unaudited) | | Wells Fargo Advantage Large Cap Growth Fund | | | 9 | |
| | | | | | | | | | | | |
| Security Name | | | | | | Shares | | | Value | |
| | | | | | | | | | | | |
| | | | |
Energy: 8.56% | | | | | | | | | | | | |
| | | | |
| Energy Equipment & Services: 3.47% | | | | | | | | | | | | |
National Oilwell Varco Incorporated | | | | | | | 77,000 | | | $ | 5,696,460 | |
Schlumberger Limited | | | | | | | 92,000 | | | | 6,915,640 | |
| | | | |
| | | | | | | | | | | 12,612,100 | |
| | | | | | | | | | | | |
| | | | |
| Oil, Gas & Consumable Fuels: 5.09% | | | | | | | | | | | | |
Apache Corporation | | | | | | | 25,000 | | | | 2,472,000 | |
Continental Resources Incorporated†« | | | | | | | 42,000 | | | | 3,388,560 | |
Occidental Petroleum Corporation | | | | | | | 50,000 | | | | 4,988,500 | |
Pioneer Natural Resources Company | | | | | | | 68,000 | | | | 6,752,400 | |
Southwestern Energy Company† | | | | | | | 30,000 | | | | 934,200 | |
| | | | |
| | | | | | | | | | | 18,535,660 | |
| | | | | | | | | | | | |
| | | | |
Financials: 4.10% | | | | | | | | | | | | |
| | | | |
| Capital Markets: 0.78% | | | | | | | | | | | | |
TD Ameritrade Holding Corporation | | | | | | | 176,000 | | | | 2,835,360 | |
| | | | | | | | | | | | |
| | | | |
| Consumer Finance: 3.32% | | | | | | | | | | | | |
American Express Company | | | | | | | 60,000 | | | | 3,008,400 | |
MasterCard Incorporated | | | | | | | 25,500 | | | | 9,067,035 | |
| | | | |
| | | | | | | | | | | 12,075,435 | |
| | | | | | | | | | | | |
| | | | |
Health Care: 10.40% | | | | | | | | | | | | |
| | | | |
| Biotechnology: 2.82% | | | | | | | | | | | | |
Alexion Pharmaceuticals Incorporated† | | | | | | | 112,000 | | | | 8,597,120 | |
Biogen Idec Incorporated† | | | | | | | 14,000 | | | | 1,650,880 | |
| | | | |
| | | | | | | | | | | 10,248,000 | |
| | | | | | | | | | | | |
| | | | |
| Health Care Equipment & Supplies: 2.68% | | | | | | | | | | | | |
Intuitive Surgical Incorporated† | | | | | | | 12,000 | | | | 5,518,920 | |
St. Jude Medical Incorporated | | | | | | | 101,000 | | | | 4,212,710 | |
| | | | |
| | | | | | | | | | | 9,731,630 | |
| | | | | | | | | | | | |
| | | | |
| Health Care Providers & Services: 1.28% | | | | | | | | | | | | |
AmerisourceBergen Corporation | | | | | | | 120,000 | | | | 4,676,400 | |
| | | | | | | | | | | | |
| | | | |
| Pharmaceuticals: 3.62% | | | | | | | | | | | | |
Allergan Incorporated | | | | | | | 67,000 | | | | 5,889,970 | |
Shire plc ADR | | | | | | | 73,000 | | | | 7,264,960 | |
| | | | |
| | | | | | | | | | | 13,154,930 | |
| | | | | | | | | | | | |
| | | | |
Industrials: 10.36% | | | | | | | | | | | | |
| | | | |
| Aerospace & Defense: 1.51% | | | | | | | | | | | | |
United Technologies Corporation | | | | | | | 70,000 | | | | 5,484,500 | |
| | | | | | | | | | | | |
| | | | |
| Air Freight & Logistics: 1.63% | | | | | | | | | | | | |
C.H. Robinson Worldwide Incorporated | | | | | | | 86,000 | | | | 5,920,240 | |
| | | | | | | | | | | | |
| | | | |
| 10 | | Wells Fargo Advantage Large Cap Growth Fund | | Portfolio of Investments—January 31, 2012 (Unaudited) |
| | | | | | | | | | | | |
| Security Name | | | | | | Shares | | | Value | |
| | | | | | | | | | | | |
| | | | |
| Electrical Equipment: 0.78% | | | | | | | | | | | | |
Emerson Electric Company | | | | | | | 55,000 | | | $ | 2,825,900 | |
| | | | | | | | | | | | |
| | | | |
| Machinery: 3.49% | | | | | | | | | | | | |
Caterpillar Incorporated | | | | | | | 26,000 | | | | 2,837,120 | |
Danaher Corporation | | | | | | | 110,000 | | | | 5,776,100 | |
Joy Global Incorporated | | | | | | | 45,000 | | | | 4,081,050 | |
| | | | |
| | | | | | | | | | | 12,694,270 | |
| | | | | | | | | | | | |
| | | | |
| Road & Rail: 2.95% | | | | | | | | | | | | |
Norfolk Southern Corporation | | | | | | | 57,000 | | | | 4,115,400 | |
Union Pacific Corporation | | | | | | | 58,000 | | | | 6,629,980 | |
| | | | |
| | | | | | | | | | | 10,745,380 | |
| | | | | | | | | | | | |
| | | | |
Information Technology: 33.81% | | | | | | | | | | | | |
| | | | |
| Communications Equipment: 3.83% | | | | | | | | | | | | |
F5 Networks Incorporated† | | | | | | | 27,000 | | | | 3,232,980 | |
QUALCOMM Incorporated | | | | | | | 182,000 | | | | 10,705,240 | |
| | | | |
| | | | | | | | | | | 13,938,220 | |
| | | | | | | | | | | | |
| | | | |
| Computers & Peripherals: 9.83% | | | | | | | | | | | | |
Apple Incorporated† | | | | | | | 60,000 | | | | 27,388,800 | |
EMC Corporation† | | | | | | | 324,000 | | | | 8,346,240 | |
| | | | |
| | | | | | | | | | | 35,735,040 | |
| | | | | | | | | | | | |
| | | | |
| Internet Software & Services: 4.58% | | | | | | | | | | | | |
eBay Incorporated† | | | | | | | 160,000 | | | | 5,056,000 | |
Google Incorporated Class A† | | | | | | | 20,000 | | | | 11,602,200 | |
| | | | |
| | | | | | | | | | | 16,658,200 | |
| | | | | | | | | | | | |
| | | | |
| IT Services: 4.38% | | | | | | | | | | | | |
Accenture plc | | | | | | | 115,000 | | | | 6,594,100 | |
Cognizant Technology Solutions Corporation Class A† | | | | | | | 130,000 | | | | 9,327,500 | |
| | | | |
| | | | | | | | | | | 15,921,600 | |
| | | | | | | | | | | | |
| | | | |
| Semiconductors & Semiconductor Equipment: 4.63% | | | | | | | | | | | | |
Altera Corporation | | | | | | | 40,000 | | | | 1,591,600 | |
Analog Devices Incorporated | | | | | | | 86,000 | | | | 3,365,180 | |
ARM Holdings plc ADR | | | | | | | 64,000 | | | | 1,848,320 | |
Avago Technologies Limited | | | | | | | 89,000 | | | | 3,020,660 | |
Maxim Integrated Products Incorporated | | | | | | | 60,000 | | | | 1,610,400 | |
Microchip Technology Incorporated« | | | | | | | 146,000 | | | | 5,388,860 | |
| | | | |
| | | | | | | | | | | 16,825,020 | |
| | | | | | | | | | | | |
| | | | |
| Software: 6.56% | | | | | | | | | | | | |
Check Point Software Technologies Limited†« | | | | | | | 120,000 | | | | 6,754,800 | |
Citrix Systems Incorporated† | | | | | | | 60,000 | | | | 3,912,600 | |
Red Hat Incorporated† | | | | | | | 135,000 | | | | 6,259,950 | |
Salesforce.com Incorporated†« | | | | | | | 42,000 | | | | 4,905,600 | |
VMware Incorporated†« | | | | | | | 22,000 | | | | 2,007,940 | |
| | | | |
| | | | | | | | | | | 23,840,890 | |
| | | | | | | | | | | | |
| | | | | | |
| Portfolio of Investments—January 31, 2012 (Unaudited) | | Wells Fargo Advantage Large Cap Growth Fund | | | 11 | |
| | | | | | | | | | | | | | |
| Security Name | | | | | | | Shares | | | Value | |
| | | | | | | | | | | | | | |
| | | | |
Materials: 5.28% | | | | | | | | | | | | | | |
| | | | |
| Chemicals: 5.28% | | | | | | | | | | | | | | |
Air Products & Chemicals Incorporated | | | | | | | | | 28,000 | | | $ | 2,464,840 | |
Ecolab Incorporated | | | | | | | | | 35,000 | | | | 2,115,400 | |
Monsanto Company | | | | | | | | | 72,000 | | | | 5,907,600 | |
Praxair Incorporated | | | | | | | | | 82,000 | | | | 8,708,400 | |
| | | | |
| | | | | | | | | | | | | 19,196,240 | |
| | | | | | | | | | | | | | |
| | | | |
Total Common Stocks (Cost $276,011,362) | | | | | | | | | | | | | 356,391,785 | |
| | | | | | | | | | | | | | |
| | | | |
| | | | | | | | Principal | | | | |
| | | | |
Other: 0.26% | | | | | | | | | | | | | | |
Gryphon Funding Limited, Pass-Through Entity(v)(a)(i) | | | | | | | | $ | 1,215,091 | | | | 328,074 | |
VFNC Corporation, Pass-Through Entity, 0.27%(v)(a)(i)144A± | | | | | | | | | 1,384,597 | | | | 595,377 | |
| | | | |
Total Other (Cost $431,620) | | | | | | | | | | | | | 923,451 | |
| | | | | | | | | | | | | | |
| | | | |
| | | | | Yield | | | Shares | | | | |
| | | | |
Short-Term Investments: 6.75% | | | | | | | | | | | | | | |
| | | | |
| Investment Companies: 6.75% | | | | | | | | | | | | | | |
Wells Fargo Advantage Cash Investment Money Market Fund, Institutional Class(l)(u) | | | | | 0.02 | % | | | 7,146,931 | | | | 7,146,931 | |
Wells Fargo Securities Lending Cash Investments, LLC(v)(l)(u)(r) | | | | | 0.15 | | | | 17,402,580 | | | | 17,402,580 | |
| | | | |
Total Short-Term Investments (Cost $24,549,511) | | | | | | | | | | | | | 24,549,511 | |
| | | | | | | | | | | | | | |
| | | | | | | | |
| Total Investments in Securities | | | | | | | | |
| (Cost $300,992,493)* | | | 105.03 | % | | | 381,864,747 | |
Other Assets and Liabilities, Net | | | (5.03 | ) | | | (18,280,967 | ) |
| | | | | | | | |
| Total Net Assets | | | 100.00 | % | | $ | 363,583,780 | |
| | | | | | | | |
| † | Non-income earning security. |
| « | All or a portion of this security is on loan. |
| (v) | Security represents investment of cash collateral received from securities on loan. |
| (a) | Security is fair valued by the Management Valuation Team, and in certain instances by the Board of Trustees, in accordance with procedures approved by the Board of Trustees. |
| 144A | Security that may be resold to “qualified institutional buyers” under Rule 144A or security offered pursuant to Section 4(2) of the Securities Act of 1933, as amended. |
| ± | Variable rate investment. |
| (l) | Investment in an affiliate. |
| (u) | Rate shown is the 7-day annualized yield at period end. |
| (r) | The investment company is exempt from registration under Section 3(c)(7) of the 1940 Act. |
| * | Cost for federal income tax purposes is $301,738,761 and net unrealized appreciation (depreciation) consists of: |
| | | | |
Gross unrealized appreciation | | $ | 83,999,665 | |
Gross unrealized depreciation | | | (3,873,679 | ) |
| | | | |
Net unrealized appreciation | | $ | 80,125,986 | |
The accompanying notes are an integral part of these financial statements.
| | | | |
| 12 | | Wells Fargo Advantage Large Cap Growth Fund | | Statement of Assets and Liabilities—January 31, 2012 (Unaudited) |
| | | | |
| | | | |
| |
Assets | | | | |
Investments | | | | |
In unaffiliated securities (including securities on loan), at value (see cost below) | | $ | 357,315,236 | |
In affiliated securities, at value (see cost below) | | | 24,549,511 | |
| | | | |
Total investments, at value (see cost below) | | | 381,864,747 | |
Receivable for investments sold | | | 1,781,382 | |
Receivable for Fund shares sold | | | 553,957 | |
Receivable for dividends | | | 58,943 | |
Receivable for securities lending income | | | 2,551 | |
Prepaid expenses and other assets | | | 6,226 | |
| | | | |
Total assets | | | 384,267,806 | |
| | | | |
| |
Liabilities | | | | |
Payable for investments purchased | | | 2,403,612 | |
Payable for Fund shares redeemed | | | 111,381 | |
Payable upon receipt of securities loaned | | | 17,834,200 | |
Advisory fee payable | | | 161,030 | |
Distribution fees payable | | | 522 | |
Due to other related parties | | | 71,478 | |
Accrued expenses and other liabilities | | | 101,803 | |
| | | | |
Total liabilities | | | 20,684,026 | |
| | | | |
Total net assets | | $ | 363,583,780 | |
| | | | |
| |
NET ASSETS CONSIST OF | | | | |
Paid-in capital | | $ | 330,424,571 | |
Undistributed net investment loss | | | (186,575 | ) |
Accumulated net realized losses on investments | | | (47,526,470 | ) |
Net unrealized gains on investments | | | 80,872,254 | |
| | | | |
Total net assets | | $ | 363,583,780 | |
| | | | |
| |
COMPUTATION OF NET ASSET VALUE AND OFFERING PRICE PER SHARE1 | | | | |
Net assets – Class A | | $ | 12,079,297 | |
Shares outstanding – Class A | | | 375,958 | |
Net asset value per share – Class A | | | $32.13 | |
Maximum offering price per share – Class A2 | | | $34.09 | |
Net assets – Class C | | $ | 904,825 | |
Shares outstanding – Class C | | | 28,482 | |
Net asset value per share – Class C | | | $31.77 | |
Net assets – Administrator Class | | $ | 5,537,514 | |
Shares outstanding – Administrator Class | | | 171,931 | |
Net asset value per share – Administrator Class | | | $32.21 | |
Net assets – Institutional Class | | $ | 4,184,591 | |
Shares outstanding – Institutional Class | | | 129,517 | |
Net asset value per share – Institutional Class | | | $32.31 | |
Net assets – Investor Class | | $ | 340,877,553 | |
Shares outstanding – Investor Class | | | 10,622,954 | |
Net asset value per share – Investor Class | | | $32.09 | |
| |
Investments in unaffiliated securities, at cost | | $ | 276,442,982 | |
| | | | |
Investments in affiliated securities, at cost | | $ | 24,549,511 | |
| | | | |
Total investments, at cost | | $ | 300,992,493 | |
| | | | |
Securities on loan, at value | | $ | 17,446,148 | |
| | | | |
| 1. | The Fund has an unlimited number of authorized shares. |
| 2. | Maximum offering price is computed as 100/94.25 of net asset value. On investments of $50,000 or more, the offering price is reduced. |
The accompanying notes are an integral part of these financial statements.
| | | | | | |
| Statement of Operations—Six Months Ended January 31, 2012 (Unaudited) | | Wells Fargo Advantage Large Cap Growth Fund | | | 13 | |
| | | | |
| | | | |
| |
Investment income | | | | |
Dividends | | $ | 1,736,623 | |
Securities lending income, net | | | 37,304 | |
Income from affiliated securities | | | 3,374 | |
| | | | |
Total investment income | | | 1,777,301 | |
| | | | |
| |
Expenses | | | | |
Advisory fee | | | 1,078,904 | |
Administration fees | | | | |
Fund level | | | 82,993 | |
Class A | | | 6,936 | |
Class C | | | 616 | |
Administrator Class | | | 1,552 | |
Institutional Class | | | 1,333 | |
Investor Class | | | 527,546 | |
Shareholder servicing fees | | | | |
Class A | | | 6,669 | |
Class C | | | 593 | |
Administrator Class | | | 3,767 | |
Investor Class | | | 399,350 | |
Distribution fees | | | | |
Class C | | | 1,778 | |
Custody and accounting fees | | | 13,163 | |
Professional fees | | | 16,376 | |
Registration fees | | | 13,901 | |
Shareholder report expenses | | | 24,402 | |
Trustees’ fees and expenses | | | 5,332 | |
Other fees and expenses | | | 4,972 | |
| | | | |
Total expenses | | | 2,190,183 | |
Less: Fee waivers and/or expense reimbursements | | | (226,307 | ) |
| | | | |
Net expenses | | | 1,963,876 | |
| | | | |
Net investment loss | | | (186,575 | ) |
| | | | |
| |
REALIZED AND UNREALIZED GAINS (LOSSES) ON INVESTMENTS | | | | |
Net realized gains on investments | | | 1,892,627 | |
Net change in unrealized gains (losses) on investments | | | 4,449,001 | |
| | | | |
Net realized and unrealized gains (losses) on investments | | | 6,341,628 | |
| | | | |
Net increase in net assets resulting from operations | | $ | 6,155,053 | |
| | | | |
The accompanying notes are an integral part of these financial statements.
| | | | |
| 14 | | Wells Fargo Advantage Large Cap Growth Fund | | Statements of Changes in Net Assets |
| | | | | | | | | | | | | | | | |
| | | Six Months Ended January 31, 2012 (Unaudited) | | | Year Ended July 31, 2011 | |
| |
Operations | | | | | |
Net investment loss | | | | | | $ | (186,575 | ) | | | | | | $ | (610,361 | ) |
Net realized gains on investments | | | | | | | 1,892,627 | | | | | | | | 12,397,367 | |
Net change in unrealized gains (losses) on investments | | | | | | | 4,449,001 | | | | | | | | 66,385,325 | |
| | | | | | | | | | | | | | | | |
Net increase in net assets resulting from operations | | | | | | | 6,155,053 | | | | | | | | 78,172,331 | |
| | | | | | | | | | | | | | | | |
| | | | |
Capital share transactions | | | Shares | | | | | | | | Shares | | | | | |
Proceeds from shares sold | | | | | | | | | | | | | | | | |
Class A | | | 332,232 | | | | 10,084,103 | | | | 79,152 | | | | 2,432,063 | |
Class C | | | 22,626 | | | | 680,969 | | | | 9,687 | | | | 296,419 | |
Administrator Class | | | 156,562 | | | | 4,665,443 | | | | 44,795 | | | | 1,375,046 | |
Institutional Class | | | 120,041 | | | | 3,584,808 | | | | 26,255 | | | | 821,357 | |
Investor Class | | | 626,219 | | | | 19,073,820 | | | | 551,943 | | | | 16,503,447 | |
| | | | | | | | | | | | | | | | |
| | | | | | | 38,089,143 | | | | | | | | 21,428,332 | |
| | | | | | | | | | | | | | | | |
Payment for shares redeemed | | | | | | | | | | | | | | | | |
Class A | | | (31,169 | ) | | | (940,305 | ) | | | (4,664 | ) | | | (144,197 | ) |
Class C | | | (2,825 | ) | | | (85,632 | ) | | | (1,413 | ) | | | (43,080 | ) |
Administrator Class | | | (28,188 | ) | | | (851,589 | ) | | | (1,645 | ) | | | (50,115 | ) |
Institutional Class | | | (17,186 | ) | | | (521,244 | ) | | | 0 | | | | 0 | |
Investor Class | | | (643,068 | ) | | | (19,255,809 | ) | | | (1,264,960 | ) | | | (36,993,708 | ) |
| | | | | | | | | | | | | | | | |
| | | | | | | (21,654,579 | ) | | | | | | | (37,231,100 | ) |
| | | | | | | | | | | | | | | | |
Net increase (decrease) in net assets resulting
from capital share transactions | | | | | | | 16,434,564 | | | | | | | | (15,802,768 | ) |
| | | | | | | | | | | | | | | | |
Total increase in net assets | | | | | | | 22,589,617 | | | | | | | | 62,369,563 | |
| | | | | | | | | | | | | | | | |
| | | | |
Net assets | | | | | | | | | | | | | | | | |
Beginning of period | | | | | | | 340,994,163 | | | | | | | | 278,624,600 | |
| | | | | | | | | | | | | | | | |
End of period | | | | | | $ | 363,583,780 | | | | | | | $ | 340,994,163 | |
| | | | | | | | | | | | | | | | |
Undistributed net investment income (loss) | | | | | | $ | (186,575 | ) | | | | | | $ | 0 | |
| | | | | | | | | | | | | | | | |
The accompanying notes are an integral part of these financial statements.
| | | | | | |
| Financial Highlights | | Wells Fargo Advantage Large Cap Growth Fund | | | 15 | |
(For a share outstanding throughout each period)
| | | | | | | | | | | | |
| | | Six Months Ended
January 31, 2012 (Unaudited) | | | Year Ended July 31, | |
| Class A | | | 2011 | | | 20101 | |
Net asset value, beginning of period | | $ | 31.62 | | | $ | 24.54 | | | $ | 24.54 | |
Net investment income (loss) | | | (0.00 | ) | | | (0.10 | )2 | | | 0.00 | |
Net realized and unrealized gains (losses) on investments | | | 0.51 | | | | 7.18 | | | | 0.00 | |
| | | | | | | | | | | | |
Total from investment operations | | | 0.51 | | | | 7.08 | | | | 0.00 | |
Net asset value, end of period | | $ | 32.13 | | | $ | 31.62 | | | $ | 24.54 | |
Total return3 | | | 1.58 | % | | | 28.89 | % | | | 0.00 | % |
Ratios to average net assets (annualized) | | | | | | | | | | | | |
Gross expenses | | | 1.26 | % | | | 1.25 | % | | | 0.00 | % |
Net expenses | | | 1.12 | % | | | 1.12 | % | | | 0.00 | % |
Net investment income (loss) | | | (0.16 | )% | | | (0.33 | )% | | | 0.00 | % |
Supplemental data | | | | | | | | | | | | |
Portfolio turnover rate | | | 20 | % | | | 47 | % | | | 60 | % |
Net assets, end of period (000’s omitted) | | | $12,079 | | | | $2,368 | | | | $10 | |
| 1. | For the period from July 30, 2010 (commencement of class operations) to July 31, 2010. |
| 2. | Calculated based upon average shares outstanding. |
| 3. | Total return calculations do not include any sales charges. Returns for periods of less than one year are not annualized. |
The accompanying notes are an integral part of these financial statements.
| | | | |
| 16 | | Wells Fargo Advantage Large Cap Growth Fund | | Financial Highlights |
(For a share outstanding throughout each period)
| | | | | | | | | | | | |
| | | Six Months Ended
January 31, 2012 (Unaudited) | | | Year Ended July 31, | |
| Class C | | | 2011 | | | 20101 | |
Net asset value, beginning of period | | $ | 31.38 | | | $ | 24.54 | | | $ | 24.54 | |
Net investment income (loss) | | | (0.13 | )2 | | | (0.32 | )2 | | | 0.00 | |
Net realized and unrealized gains (losses) on investments | | | 0.52 | | | | 7.16 | | | | 0.00 | |
| | | | | | | | | | | | |
Total from investment operations | | | 0.39 | | | | 6.84 | | | | 0.00 | |
Net asset value, end of period | | $ | 31.77 | | | $ | 31.38 | | | $ | 24.54 | |
Total return3 | | | 1.21 | % | | | 27.91 | % | | | 0.00 | % |
Ratios to average net assets (annualized) | | | | | | | | | | | | |
Gross expenses | | | 2.01 | % | | | 2.00 | % | | | 0.00 | % |
Net expenses | | | 1.87 | % | | | 1.87 | % | | | 0.00 | % |
Net investment income (loss) | | | (0.88 | )% | | | (1.04 | )% | | | 0.00 | % |
Supplemental data | | | | | | | | | | | | |
Portfolio turnover rate | | | 20 | % | | | 47 | % | | | 60 | % |
Net assets, end of period (000’s omitted) | | | $905 | | | | $272 | | | | $10 | |
| 1. | For the period from July 30, 2010 (commencement of class operations) to July 31, 2010. |
| 2. | Calculated based upon average shares outstanding. |
| 3. | Total return calculations do not include any sales charges. Returns for periods of less than one year are not annualized. |
The accompanying notes are an integral part of these financial statements.
| | | | | | |
| Financial Highlights | | Wells Fargo Advantage Large Cap Growth Fund | | | 17 | |
(For a share outstanding throughout each period)
| | | | | | | | | | | | |
| | | Six Months Ended
January 31, 2012 (Unaudited) | | | Year Ended July 31, | |
| Administrator Class | | | 2011 | | | 20101 | |
Net asset value, beginning of period | | $ | 31.67 | | | $ | 24.54 | | | $ | 24.54 | |
Net investment income (loss) | | | 0.01 | | | | (0.06 | )2 | | | 0.00 | |
Net realized and unrealized gains (losses) on investments | | | 0.53 | | | | 7.19 | | | | 0.00 | |
| | | | | | | | | | | | |
Total from investment operations | | | 0.54 | | | | 7.13 | | | | 0.00 | |
Net asset value, end of period | | $ | 32.21 | | | $ | 31.67 | | | $ | 24.54 | |
Total return3 | | | 1.71 | % | | | 29.05 | % | | | 0.00 | % |
Ratios to average net assets (annualized) | | | | | | | | | | | | |
Gross expenses | | | 1.09 | % | | | 1.07 | % | | | 0.00 | % |
Net expenses | | | 0.95 | % | | | 0.94 | % | | | 0.00 | % |
Net investment income (loss) | | | 0.11 | % | | | (0.19 | )% | | | 0.00 | % |
Supplemental data | | | | | | | | | | | | |
Portfolio turnover rate | | | 20 | % | | | 47 | % | | | 60 | % |
Net assets, end of period (000’s omitted) | | | $5,538 | | | | $1,379 | | | | $10 | |
| 1. | For the period from July 30, 2010 (commencement of class operations) to July 31, 2010. |
| 2. | Calculated based upon average shares outstanding. |
| 3. | Returns for periods of less than one year are not annualized. |
The accompanying notes are an integral part of these financial statements.
| | | | |
| 18 | | Wells Fargo Advantage Large Cap Growth Fund | | Financial Highlights |
(For a share outstanding throughout each period)
| | | | | | | | | | | | |
| | | Six Months Ended January 31, 2012 (Unaudited) | | | Year Ended July 31, | |
| Institutional Class | | | 2011 | | | 20101 | |
Net asset value, beginning of period | | $ | 31.73 | | | $ | 24.54 | | | $ | 24.54 | |
Net Investment income (loss) | | | 0.03 | | | | (0.00 | )2 | | | 0.00 | |
Net realized and unrealized gains (losses) on investments | | | 0.55 | | | | 7.19 | | | | 0.00 | |
| | | | | | | | | | | | |
Total from investment operations | | | 0.58 | | | | 7.19 | | | | 0.00 | |
Net asset value, end of period | | $ | 32.31 | | | $ | 31.73 | | | $ | 24.54 | |
Total return3 | | | 1.80 | % | | | 29.34 | % | | | 0.00 | % |
Ratios to average net assets (annualized) | | | | | | | | | | | | |
Gross expenses | | | 0.83 | % | | | 0.81 | % | | | 0.00 | % |
Net expenses | | | 0.75 | % | | | 0.75 | % | | | 0.00 | % |
Net investment income (loss) | | | 0.35 | % | | | (0.01 | )% | | | 0.00 | % |
Supplemental data | | | | | | | | | | | | |
Portfolio turnover rate | | | 20 | % | | | 47 | % | | | 60 | % |
Net assets, end of period (000’s omitted) | | | $4,185 | | | | $846 | | | | $10 | |
| 1. | For the period from July 30, 2010 (commencement of class operations) to July 31, 2010. |
| 2. | Amount is less than $0.005. |
| 3. | Returns for periods of less than one year are not annualized. |
The accompanying notes are an integral part of these financial statements.
| | | | | | |
| Financial Highlights | | Wells Fargo Advantage Large Cap Growth Fund | | | 19 | |
(For a share outstanding throughout each period)
| | | | | | | | | | | | | | | | | | | | | | | | |
| | | Six Months Ended
January 31, 2012 (Unaudited) | | | Year Ended July 31, | |
| Investor Class | | | 2011 | | | 2010 | | | 2009 | | | 2008 | | | 2007 | |
Net asset value, beginning of period | | $ | 31.59 | | | $ | 24.54 | | | $ | 21.77 | | | $ | 26.62 | | | $ | 27.18 | | | $ | 23.18 | |
Net investment income (loss) | | | (0.02 | ) | | | (0.06 | ) | | | (0.02 | )1 | | | 0.02 | 1 | | | (0.04 | )1 | | | (0.07 | )1 |
Net realized and unrealized gains (losses) on investments | | | 0.52 | | | | 7.11 | | | | 2.81 | | | | (4.87 | ) | | | (0.52 | ) | | | 4.07 | |
| | | | | | | | | | | | | | | | | | | | | | | | |
Total from investment operations | | | 0.50 | | | | 7.05 | | | | 2.79 | | | | (4.85 | ) | | | (0.56 | ) | | | 4.00 | |
Distributions to shareholders from | | | | | | | | | | | | | | | | | | | | | | | | |
Net investment income | | | 0.00 | | | | 0.00 | | | | (0.02 | ) | | | 0.00 | | | | 0.00 | | | | 0.00 | |
Net asset value, end of period | | $ | 32.09 | | | $ | 31.59 | | | $ | 24.54 | | | $ | 21.77 | | | $ | 26.62 | | | $ | 27.18 | |
Total return2 | | | 1.58 | % | | | 28.73 | % | | | 12.80 | % | | | (18.22 | )% | | | (2.06 | )% | | | 17.26 | % |
Ratios to average net assets (annualized) | | | | | | | | | | | | | | | | | | | | | | | | |
Gross expenses | | | 1.33 | % | | | 1.32 | % | | | 1.43 | % | | | 1.46 | % | | | 1.47 | % | | | 1.53 | % |
Net expenses | | | 1.19 | % | | | 1.19 | % | | | 1.19 | % | | | 1.19 | % | | | 1.19 | % | | | 1.19 | % |
Net investment income (loss) | | | (0.12 | )% | | | (0.19 | )% | | | (0.07 | )% | | | 0.07 | % | | | (0.13 | )% | | | (0.26 | )% |
Supplemental data | | | | | | | | | | | | | | | | | | | | | | | | |
Portfolio turnover rate | | | 20 | % | | | 47 | % | | | 60 | % | | | 81 | % | | | 131 | % | | | 113 | % |
Net assets, end of period (000’s omitted) | | | $340,878 | | | | $336,128 | | | | $278,585 | | | | $264,776 | | | | $350,352 | | | | $388,700 | |
| 1. | Calculated based upon average shares outstanding. |
| 2. | Returns for periods of less than one year are not annualized. |
The accompanying notes are an integral part of these financial statements.
| | | | |
| 20 | | Wells Fargo Advantage Large Cap Growth Fund | | Notes to Financial Statements (Unaudited) |
1. ORGANIZATION
Wells Fargo Funds Trust (the “Trust”), a Delaware statutory trust organized on March 10, 1999, is an open-end management investment company registered under the Investment Company Act of 1940, as amended (the “1940 Act”). These financial statements report on Wells Fargo Advantage Large Cap Growth Fund (the “Fund”) which is a diversified series of the Trust.
2. SIGNIFICANT ACCOUNTING POLICIES
The following significant accounting policies, which are consistently followed in the preparation of the financial statements of the Fund, are in conformity with U.S. generally accepted accounting principles which require management to make estimates and assumptions that affect the reported amounts of assets and liabilities, disclosure of contingent assets and liabilities at the date of the financial statements, and the reported amounts of revenues and expenses during the reporting period. Actual results could differ from those estimates.
Securities valuation
Investments in equity securities are valued each business day as of the close of regular trading on the New York Stock Exchange, which is usually 4:00 p.m. (Eastern Time). Securities which are traded on a national or foreign securities exchange are valued at the last reported sales price, except that securities listed on The Nasdaq Stock Market, Inc. (“Nasdaq”) are valued at the Nasdaq Official Closing Price (“NOCP”), and if no NOCP is available, then at the last reported sales price. If no sales price is shown on the Nasdaq, the bid price will be used. In the absence of any sale of securities listed on the Nasdaq, and in the case of other securities (including U.S. Government obligations, but excluding debt securities maturing in 60 days or less), the price will be deemed “stale” and the valuations will be determined in accordance with the Fund’s Fair Value Procedures.
Investments in open-end mutual funds and non-registered investment companies are generally valued at net asset value.
Investments which are not valued using any of the methods discussed above, are valued at their fair value, as determined by procedures established in good faith and approved by the Board of Trustees.
Security loans
The Fund may lend its securities from time to time in order to earn additional income in the form of fees or interest on securities received as collateral or the investment of any cash received as collateral. The Fund continues to receive interest or dividends on the securities loaned. The Fund receives collateral in the form of cash or securities with a value at least equal to the value of the securities on loan. The value of the loaned securities is determined at the close of each business day and any additional required collateral is delivered to the Fund on the next business day. In a securities lending transaction, the net asset value of the Fund will be affected by an increase or decrease in the value of the securities loaned and by an increase or decrease in the value of the instrument in which collateral is invested. The amount of securities lending activity undertaken by the Fund fluctuates from time to time. In the event of default or bankruptcy by the borrower, the Fund may be prevented from recovering the loaned securities or gaining access to the collateral or may experience delays or costs in doing so. In addition, the investment of any cash collateral received may lose all or part of its value. The Fund has the right under the lending agreement to recover the securities from the borrower on demand.
The Fund lends its securities through an unaffiliated securities lending agent. Cash collateral received in connection with its securities lending transactions is invested in Wells Fargo Securities Lending Cash Investments, LLC (the “Cash Collateral Fund”). The Cash Collateral Fund is exempt from registration under Section 3(c)(7) of the 1940 Act and is managed by
Wells Fargo Funds Management LLC (“Funds Management”) and is sub-advised by Wells Capital Management Incorporated (“Wells Capital Management”). Funds Management receives an advisory fee starting at 0.05% and declining to 0.01% as the average daily net assets of the Cash Collateral Fund increase. All of the fees received by Funds Management are paid to Wells Capital Management for its services as sub-adviser. The Cash Collateral Fund seeks to provide a positive return compared to the daily Fed Funds Open rate by investing in high-quality, U.S. dollar-denominated short-term money market instruments. Cash Collateral Fund investments are fair valued based upon the amortized cost valuation technique. Income earned from investment in the Cash Collateral Fund is included in securities lending income on the Statement of Operations.
For Wells Fargo Advantage Funds that participated in securities lending activity prior to February 13, 2009, certain structured investment vehicles purchased in a joint account by the former securities lending agent defaulted or were
| | | | | | |
| Notes to Financial Statements (Unaudited) | | Wells Fargo Advantage Large Cap Growth Fund | | | 21 | |
impaired. Certain of the Wells Fargo Advantage Funds still hold ownership interest in these structured investment vehicles, which have since been restructured as pass-through securities. If the Fund holds an ownership interest in such pass-through securities, information regarding this ownership interest can be found in the Portfolio of Investments under the category “Other”.
Security transactions and income recognition
Securities transactions are recorded on a trade date basis. Realized gains or losses are reported on the basis of identified cost of securities delivered.
Dividend income is recognized on the ex-dividend.
Distributions to shareholders
Distributions to shareholders from net investment income and net realized gains, if any, are recorded on the ex-dividend date. Such distributions are determined in conformity with income tax regulations, which may differ from generally accepted accounting principles.
Federal and other taxes
The Fund intends to continue to qualify as a regulated investment company by distributing substantially all of its investment company taxable income and any net realized capital gains (after reduction for capital loss carryforwards) sufficient to relieve it from all, or substantially all, federal income taxes. Accordingly, no provision for federal income taxes was required.
The Fund’s income and federal excise tax returns and all financial records supporting those returns for the prior three fiscal years are subject to examination by the federal and Delaware revenue authorities.
Under the recently enacted Regulated Investment Company Modernization Act of 2010, the Fund is permitted to carry forward capital losses incurred in taxable years which began after December 22, 2010 for an unlimited period. However, any losses incurred are required to be utilized prior to the losses incurred in pre-enactment taxable years. As a result of this ordering rule, pre-enactment capital loss carryforwards may be more likely to expire unused. Additionally, post-enactment capital losses that are carried forward will retain their character as either short-term or long-term capital losses rather than being considered all short-term as under previous law.
As of July 31, 2011, the Fund had net capital loss carryforwards, which were available to offset future net realized capital gains, in the amount of $48,943,894 with $17,697,584 expiring in 2017 and $31,246,310 expiring in 2018.
Class allocations
The separate classes of shares offered by the Fund differ principally in applicable sales charges, distribution, shareholder servicing and administration fees. Shareholders of each class bear certain expenses that pertain to that particular class. All shareholders bear the common expenses of the Fund, earn income from the portfolio, and are allocated unrealized gains and losses pro rata based on the average daily net assets of each class, without distinction between share classes. Dividends are determined separately for each class based on income and expenses allocable to each class. Realized gains and losses are allocated to each class pro rata based upon the net assets of each class on the date realized. Differences in per share dividend rates generally result from the relative weightings of pro rata income and realized gain allocations and from differences in separate class expenses, including distribution, shareholder servicing and administration fees.
3. FAIR VALUATION MEASUREMENTS
Fair value measurements of investments are determined within a framework that has established a fair value hierarchy based upon the various data inputs utilized in determining the value of the Fund’s investments. The three-level hierarchy gives the highest priority to unadjusted quoted prices in active markets for identical assets or liabilities (Level 1) and the lowest priority to significant unobservable inputs (Level 3). The Fund’s investments are classified within the fair value hierarchy based on the lowest level of input that is significant to the fair value measurement. The inputs are summarized into three broad levels as follows:
| n | | Level 1 – quoted prices in active markets for identical securities |
| n | | Level 2 – other significant observable inputs (including quoted prices for similar securities, interest rates, prepayment speeds, credit risk, etc.) |
| | | | |
| 22 | | Wells Fargo Advantage Large Cap Growth Fund | | Notes to Financial Statements (Unaudited) |
| n | | Level 3 – significant unobservable inputs (including the Fund’s own assumptions in determining the fair value of investments) |
The inputs or methodologies used for valuing securities are not necessarily an indication of the risk associated with investing in those securities.
As of January 31, 2012, the inputs used in valuing the Fund’s assets, which are carried at fair value, were as follows:
| | | | | | | | | | | | | | | | |
| Investments in Securities | | Quoted Prices (Level 1) | | | Significant Other
Observable Inputs (Level 2) | | | Significant Unobservable Inputs (Level 3) | | | Total | |
Equity securities | | | | | | | | | | | | | | | | |
Common stocks | | $ | 356,391,785 | | | $ | 0 | | | $ | 0 | | | $ | 356,391,785 | |
Other | | | 0 | | | | 0 | | | | 923,451 | | | | 923,451 | |
| | | | |
Short-term investments | | | | | | | | | | | | | | | | |
Investment companies | | | 7,146,931 | | | | 17,402,580 | | | | 0 | | | | 24,549,511 | |
| | | $ | 363,538,716 | | | $ | 17,402,580 | | | $ | 923,451 | | | $ | 381,864,747 | |
Further details on the major security types listed above can be found in the Portfolio of Investments.
Transfers in and transfers out are recognized at the end of the reporting period. For the six months ended January 31, 2012, the Fund did not have any significant transfers into/out of Level 1 and Level 2.
The following is a reconciliation of assets in which significant unobservable inputs (Level 3) were used in determining fair value:
| | | | |
| | | Other | |
Balance as of July 31, 2011 | | | $1,309,767 | |
Accrued discounts (premiums) | | | 0 | |
Realized gains (losses) | | | 0 | |
Change in unrealized gains (losses) | | | (227,675 | ) |
Purchases | | | 0 | |
Sales | | | (158,641 | ) |
Transfers into Level 3 | | | 0 | |
Transfers out of Level 3 | | | 0 | |
Balance as of January 31, 2012 | | | $923,451 | |
Change in unrealized gains (losses) relating to securities still held at January 31, 2012 | | | $(307,959 | ) |
4. TRANSACTIONS WITH AFFILIATES AND OTHER EXPENSES
Advisory fee
The Trust has entered into an advisory contract with Funds Management, an indirect wholly owned subsidiary of Wells Fargo & Company (“Wells Fargo”). The adviser is responsible for implementing investment policies and guidelines and for supervising the sub-adviser, who is responsible for day-to-day portfolio management of the Fund.
Pursuant to the contract, Funds Management is entitled to receive an annual advisory fee starting at 0.65% and declining to 0.55% as the average daily net assets of the Fund increase. For the six months ended January 31, 2012, the advisory fee was equivalent to an annual rate of 0.65% of the Fund’s average daily net assets.
Funds Management may retain the services of certain sub-advisers to provide daily portfolio management to the Fund. The fees related to sub-advisory services are borne directly by Funds Management and do not increase the overall fees paid by the Fund. Wells Capital Management, an affiliate of Funds Management, is the sub-adviser to the Fund and is entitled to receive a fee from Funds Management at an annual rate starting at 0.35% and declining to 0.15% as the average daily net assets of the Fund increase.
Administration and transfer agent fees
The Trust has entered into an administration agreement with Funds Management. Under this agreement, for providing administrative services, which includes paying fees and expenses for services provided by the transfer agent, sub-transfer
| | | | | | |
| Notes to Financial Statements (Unaudited) | | Wells Fargo Advantage Large Cap Growth Fund | | | 23 | |
agents, omnibus account servicers and record-keepers, Funds Management is entitled to receive from the Fund an annual fund level administration fee starting at 0.05% and declining to 0.03% as the average daily net assets of the Fund increase and a class level administration fee which is calculated based on the average daily net assets of each class as follows:
| | | | |
| | | Class Level Administration Fee | |
Class A, Class C | | | 0.26 | % |
Administrator Class | | | 0.10 | |
Institutional Class | | | 0.08 | |
Investor Class | | | 0.33 | |
Funds Management has contractually waived and/or reimbursed advisory and administration fees to the extent necessary to maintain certain net operating expense ratios for the Fund. Waiver of fees and/or reimbursement of expenses by Funds Management were made first from fund level expenses on a proportionate basis and then from class specific expenses. Funds Management has committed through November 30, 2012 to waive fees and/or reimburse expenses to the extent necessary to cap the Fund’s expenses at 1.12% for Class A, 1.87% for Class C, 0.95% for Administrator Class, 0.75% for Institutional Class and 1.19% for Investor Class.
Distribution fees
The Trust has adopted a Distribution Plan for Class C shares of the Fund pursuant to Rule 12b-1 under the 1940 Act. Distribution fees are charged to Class C shares and paid to Wells Fargo Funds Distributor, LLC, the principal underwriter, at an annual rate of 0.75% of its average daily net assets.
For the six months ended January 31, 2012, Wells Fargo Funds Distributor, LLC received $2,708 from the sale of Class A shares.
Shareholder servicing fees
The Trust has entered into contracts with one or more shareholder servicing agents, whereby Class A, Class C, Administrator Class and Investor Class of the Fund is charged a fee at an annual rate of 0.25% of the average daily net assets of each respective class.
A portion of these total shareholder servicing fees were paid to affiliates of Wells Fargo.
5. INVESTMENT PORTFOLIO TRANSACTIONS
Purchases and sales of investments, excluding U.S. Government obligations (if any) and short-term securities (securities with maturities of one year or less at purchase date), for the six months ended January 31, 2012 were $83,573,713 and $66,372,302, respectively.
6. BANK BORROWINGS
The Trust (excluding the money market funds) and Wells Fargo Variable Trust are parties to a $150,000,000 revolving credit agreement with State Street Bank and Trust Company, whereby the Fund is permitted to use bank borrowings for temporary or emergency purposes, such as to fund shareholder redemption requests. Interest under the credit agreement is charged to the Fund based on a borrowing rate equal to the higher of the Federal Funds rate in effect on that day plus 1.25% or the overnight LIBOR rate in effect on that day plus 1.25%. In addition, an annual commitment fee equal to 0.10% of the unused balance is allocated to each participating fund. Prior to September 6, 2011, the revolving credit agreement was for $125,000,000 and the annual commitment fee was equal 0.125% of the unused balance. For the six months ended January 31, 2012, the Fund paid $171 in commitment fees.
For the six months ended January 31, 2012, there were no borrowings by the Fund under the agreement.
7. INDEMNIFICATION
Under the Trust’s organizational documents, the officers and directors are indemnified against certain liabilities that may arise out of performance of their duties to the Trust. Additionally, in the normal course of business, the Trust may enter into contracts with service providers that contain a variety of indemnification clauses. The Trust’s maximum exposure under these arrangements is dependent on future claims that may be made against the Fund and, therefore, cannot be estimated.
| | | | |
| 24 | | Wells Fargo Advantage Large Cap Growth Fund | | Notes to Financial Statements (Unaudited) |
8. NEW ACCOUNTING PRONOUNCEMENTS
In May 2011, the Financial Accounting Standards Board (“FASB”) issued Accounting Standards Update (“ASU”) No. 2011-04 “Amendments to Achieve Common Fair Value Measurement and Disclosure Requirements in U.S. GAAP and IFRSs”. ASU No. 2011-04 amends FASB ASC Topic 820, Fair Value Measurements and Disclosures, to establish common requirements for measuring fair value and for disclosing information about fair value measurements in accordance with GAAP. The ASU is effective prospectively for interim and annual periods beginning after December 15, 2011. Management expects that adoption of the ASU will result in additional disclosures in the financial statements, as applicable.
In April 2011, FASB issued ASU No. 2011-03 “Reconsideration of Effective Control for Repurchase Agreements”. ASU No. 2011-03 amends FASB ASC Topic 860, Transfers and Servicing, specifically the criteria required to determine whether a repurchase agreement (repo) and similar agreements should be accounted for as sales of financial assets or secured borrowings with commitments. ASU No. 2011-03 changes the assessment of effective control by focusing on the transferor’s contractual rights and obligations and removing the criterion to assess its ability to exercise those rights or honor those obligations. This could result in changes to the way entities account for certain transactions including repurchase agreements, mortgage dollar rolls and reverse repurchase agreements. The ASU will become effective on a prospective basis for new transfers and modifications to existing transactions as of the beginning of the first interim or annual period beginning on or after December 15, 2011. Management has evaluated the impact of adopting the ASU and expects no significant changes.
| | | | | | |
| Other Information (Unaudited) | | Wells Fargo Advantage Large Cap Growth Fund | | | 25 | |
PROXY VOTING INFORMATION
A description of the policies and procedures that the Fund uses to determine how to vote proxies relating to portfolio securities is available without charge, upon request, by calling 1-800-222-8222, visiting our Web site at wellsfargoadvantagefunds.com, or visiting the SEC Web site at sec.gov. Information regarding how the Fund voted proxies relating to portfolio securities during the most recent 12-month period ended June 30 is available without charge on the Fund’s Web site at wellsfargoadvantagefunds.com or by visiting the SEC Web site at sec.gov.
PORTFOLIO HOLDINGS INFORMATION
The complete portfolio holdings for the Fund are publicly available on the Fund’s Web site (wellsfargoadvantagefunds.com) on a monthly, 30-day or more delayed basis. In addition, top ten holdings information for the Fund is publicly available on the Fund’s Web site on a monthly, seven-day or more delayed basis. The Fund files its complete schedule of portfolio holdings with the SEC for the first and third quarters of each fiscal year on Form N-Q, which is available without charge by visiting the SEC Web site at sec.gov. In addition, the Fund’s Form N-Q may be reviewed and copied at the SEC’s Public Reference Room in Washington, DC, and at regional offices in New York City, at 233 Broadway, and in Chicago, at 175 West Jackson Boulevard, Suite 900. Information about the Public Reference Room may be obtained by calling 1-800-SEC-0330.
| | | | |
| 26 | | Wells Fargo Advantage Large Cap Growth Fund | | Other Information (Unaudited) |
BOARD OF TRUSTEES
The following table provides basic information about the Board of Trustees (the “Trustees”) of the Trust and Officers of the Trust. This table should be read in conjunction with the Prospectus and the Statement of Additional Information1 of the Fund. Each of the Trustees and Officers listed below acts in identical capacities for the Wells Fargo Advantage family of funds, which consists of 137 funds comprising the Wells Fargo Funds Trust, Wells Fargo Variable Trust, Wells Fargo Master Trust and four closed-end funds (collectively the “Fund Complex”). All of the Trustees are also Members of the Audit and Governance Committees of each Trust in the Fund Complex. The mailing address of each Trustee and Officer is 525 Market Street, 12th Floor, San Francisco, CA 94105. Each Trustee and Officer serves an indefinite term, however, each Trustee serves such term until reaching the mandatory retirement age established by the Trustees.
Independent Trustees
| | | | | | |
Name and Year of Birth | | Position Held and Length of Service | | Principal Occupations During Past Five Years | | Other Directorships During
Past Five Years |
Peter G. Gordon
(Born 1942) | | Trustee, since 1998; Chairman, since 2005 (Lead Trustee since 2001) | | Co-Founder, Retired Chairman, President and CEO of Crystal Geyser Water Company. Trustee Emeritus, Colby College | | Asset Allocation Trust |
Isaiah Harris, Jr.
(Born 1952) | | Trustee, since 2009 | | Retired. Prior thereto, President and CEO of BellSouth Advertising and Publishing Corp. from 2005 to 2007, President and CEO of BellSouth Enterprises from 2004 to 2005 and President of BellSouth Consumer Services from 2000 to 2003. Emeritus member of the Iowa State University Foundation Board of Governors. Emeritus Member of the Advisory Board of Iowa State University School of Business. Mr. Harris is a certified public accountant. | | CIGNA Corporation; Deluxe Corporation; Asset Allocation Trust |
Judith M. Johnson
(Born 1949) | | Trustee, since 2008 | | Retired. Prior thereto, Chief Executive Officer and Chief Investment Officer of Minneapolis Employees Retirement Fund from 1996 to 2008. Ms. Johnson is an attorney, certified public accountant and a certified managerial accountant. | | Asset Allocation Trust |
Leroy Keith, Jr.
(Born 1939) | | Trustee, since 2010 | | Chairman, Bloc Global Services (development and construction). Trustee of the Evergreen Funds from 1983 to 2010. Former Managing Director, Almanac Capital Management (commodities firm), former Partner, Stonington Partners, Inc. (private equity fund), former Director, Obagi Medical Products Co. and former Director, Lincoln Educational Services. | | Trustee, Virtus Fund Complex (consisting of 40 portfolios as of 12/31/11); Asset Allocation Trust |
David F. Larcker
(Born 1950) | | Trustee, since 2009 | | James Irvin Miller Professor of Accounting at the Graduate School of Business, Stanford University, Director of Corporate Governance Research Program and Senior Faculty of The Rock Center for Corporate Governance since 2006. From 2005 to 2008, Professor of Accounting at the Graduate School of Business, Stanford University. Prior thereto, Ernst & Young Professor of Accounting at The Wharton School, University of Pennsylvania from 1985 to 2005. | | Asset Allocation Trust |
Olivia S. Mitchell
(Born 1953) | | Trustee, since 2006 | | International Foundation of Employee Benefit Plans Professor, Wharton School of the University of Pennsylvania since 1993. Director of Wharton’s Pension Research Council and Boettner Center on Pensions & Retirement Research, and Research Associate at the National Bureau of Economic Research. Previously, Cornell University Professor from 1978 to 1993. | | Asset Allocation Trust |
| | | | | | |
| Other Information (Unaudited) | | Wells Fargo Advantage Large Cap Growth Fund | | | 27 | |
| | | | | | |
Name and Year of Birth | | Position Held and Length of Service | | Principal Occupations During Past Five Years | | Other Directorships During
Past Five Years |
Timothy J. Penny
(Born 1951) | | Trustee, since 1996 | | President and CEO of Southern Minnesota Initiative Foundation, a non-profit organization, since 2007 and Senior Fellow at the Humphrey Institute Policy Forum at the University of Minnesota since 1995. Member of the Board of Trustees of NorthStar Education Finance, Inc., a non-profit organization, since 2007. | | Asset Allocation Trust |
Michael S. Scofield
(Born 1943) | | Trustee, since 2010 | | Served on the Investment Company Institute’s Board of Governors and Executive Committee from 2008-2011 as well the Governing Council of the Independent Directors Council from 2006-2011 and the Independent Directors Council Executive Committee from 2008-2011. Chairman of the IDC from 2008-2010. Institutional Investor (Fund Directions) Trustee of Year in 2007. Trustee of the Evergreen Funds (and its predecessors) from 1984 to 2010. Chairman of the Evergreen Funds from 2000-2010. Former Trustee of the Mentor Funds. Retired Attorney, Law Offices of Michael S. Scofield and former Director and Chairman, Branded Media Corporation (multi-media branding company). | | Asset Allocation Trust |
Donald C. Willeke
(Born 1940) | | Trustee, since 1996 | | Principal of the law firm of Willeke & Daniels. General Counsel of the Minneapolis Employees Retirement Fund from 1984 until its consolidation into the Minnesota Public Employees Retirement Association on June 30, 2010. Director and Vice Chair of The Free Trust (non-profit corporation). Director of the American Chestnut Foundation (non-profit corporation). | | Asset Allocation Trust |
Officers
| | | | | | |
Name and Year of Birth | | Position Held and
Length of Service | | Principal Occupations During Past Five Years | | |
Karla M. Rabusch
(Born 1959) | | President, since 2003 | | Executive Vice President of Wells Fargo Bank, N.A. and President of Wells Fargo Funds Management, LLC since 2003. Senior Vice President and Chief Administrative Officer of Wells Fargo Funds Management, LLC from 2001 to 2003. | | |
C. David Messman
(Born 1960) | | Secretary, since 2000; Chief Legal Counsel, since 2003 | | Senior Vice President and Secretary of Wells Fargo Funds Management, LLC since 2001. Vice President and Managing Senior Counsel of Wells Fargo Bank, N.A. since 1996. | | |
Kasey Phillips
(Born 1970) | | Treasurer, since 2009 | | Senior Vice President of Wells Fargo Funds Management, LLC since 2009. Senior Vice President of Evergreen Investment Management Company, LLC from 2006 to 2010. Treasurer of the Evergreen Funds from 2005 to 2010. | | |
David Berardi
(Born 1975) | | Assistant Treasurer, since 2009 | | Vice President of Wells Fargo Funds Management, LLC since 2009. Vice President of Evergreen Investment Management Company, LLC from 2008 to 2010. Assistant Vice President of Evergreen Investment Services, Inc. from 2004 to 2008. Manager of Fund Reporting and Control for Evergreen Investment Management Company, LLC from 2004 to 2010. | | |
Jeremy DePalma
(Born 1974) | | Assistant Treasurer, since 2009 | | Senior Vice President of Wells Fargo Funds Management, LLC since 2009. Senior Vice President of Evergreen Investment Management Company, LLC from 2008 to 2010. Vice President, Evergreen Investment Services, Inc. from 2004 to 2007. Head of the Fund Reporting and Control Team within Fund Administration from 2005 to 2010. | | |
Debra Ann Early
(Born 1964) | | Chief Compliance Officer, since 2007 | | Chief Compliance Officer of Wells Fargo Funds Management, LLC since 2007. Chief Compliance Officer of Parnassus Investments from 2005 to 2007. Chief Financial Officer of Parnassus Investments from 2004 to 2007 and Senior Audit Manager of PricewaterhouseCoopers LLP from 1998 to 2004. | | |
| 1. | The Statement of Additional Information includes additional information about the Trustees and is available, without charge, upon request, by calling 1-800-222-8222 or by visiting the Web site at wellsfargoadvantagefunds.com. |
| | | | |
| 28 | | Wells Fargo Advantage Large Cap Growth Fund | | List of Abbreviations |
The following is a list of common abbreviations for terms and entities which may have appeared in this report.
| ACB | — Agricultural Credit Bank |
| ADR | — American Depository Receipt |
| ADS | — American Depository Shares |
| AGC-ICC | — Assured Guaranty Corporation - Insured Custody Certificates |
| AGM | — Assured Guaranty Municipal |
| AMBAC | — American Municipal Bond Assurance Corporation |
| AMT | — Alternative Minimum Tax |
| BAN | — Bond Anticipation Notes |
| BHAC | — Berkshire Hathaway Assurance Corporation |
| CAB | — Capital Appreciation Bond |
| CCAB | — Convertible Capital Appreciation Bond |
| CDA | — Community Development Authority |
| CDO | — Collateralized Debt Obligation |
| COP | — Certificate of Participation |
| DRIVER | — Derivative Inverse Tax-Exempt Receipts |
| DW&P | — Department of Water & Power |
| DWR | — Department of Water Resources |
| ECFA | — Educational & Cultural Facilities Authority |
| EDA | — Economic Development Authority |
| EDFA | — Economic Development Finance Authority |
| ETF | — Exchange-Traded Fund |
| FFCB | — Federal Farm Credit Bank |
| FGIC | — Financial Guaranty Insurance Corporation |
| FHA | — Federal Housing Authority |
| FHLB | — Federal Home Loan Bank |
| FHLMC | — Federal Home Loan Mortgage Corporation |
| FNMA | — Federal National Mortgage Association |
| GDR | — Global Depository Receipt |
| GNMA | — Government National Mortgage Association |
| HCFR | — Healthcare Facilities Revenue |
| HEFA | — Health & Educational Facilities Authority |
| HEFAR | — Higher Education Facilities Authority Revenue |
| HFA | — Housing Finance Authority |
| HFFA | — Health Facilities Financing Authority |
| IBC | — Insured Bond Certificate |
| IDA | — Industrial Development Authority |
| IDAG | — Industrial Development Agency |
| IDR | — Industrial Development Revenue |
| KRW | — Republic of Korea Won |
| LIBOR | — London Interbank Offered Rate |
| LLC | — Limited Liability Company |
| LLP | — Limited Liability Partnership |
| MBIA | — Municipal Bond Insurance Association |
| MFHR | — Multi-Family Housing Revenue |
| MSTR | — Municipal Securities Trust Receipts |
| MUD | — Municipal Utility District |
| NATL-RE | — National Public Finance Guarantee Corporation |
| PCFA | — Pollution Control Finance Authority |
| PCR | — Pollution Control Revenue |
| PFA | — Public Finance Authority |
| PFFA | — Public Facilities Financing Authority |
| PFOTER | — Puttable Floating Option Tax-Exempt Receipts |
| plc | — Public Limited Company |
| PUTTER | — Puttable Tax-Exempt Receipts |
| R&D | — Research & Development |
| RDA | — Redevelopment Authority |
| RDFA | — Redevelopment Finance Authority |
| REIT | — Real Estate Investment Trust |
| ROC | — Reset Option Certificates |
| SAVRS | — Select Auction Variable Rate Securities |
| SBA | — Small Business Authority |
| SFHR | — Single Family Housing Revenue |
| SFMR | — Single Family Mortgage Revenue |
| SPDR | — Standard & Poor’s Depositary Receipts |
| TAN | — Tax Anticipation Notes |
| TIPS | — Treasury Inflation-Protected Securities |
| TRAN | — Tax Revenue Anticipation Notes |
| TCR | — Transferable Custody Receipts |
| TTFA | — Transportation Trust Fund Authority |
| TVA | — Tennessee Valley Authority |
| XLCA | — XL Capital Assurance |
This page is intentionally left blank.
This page is intentionally left blank.


FOR MORE INFORMATION
More information about Wells Fargo Advantage Funds is available free upon request. To obtain literature, please write, e-mail, visit the Fund’s Web site, or call:
Wells Fargo Advantage Funds
P.O. Box 8266
Boston, MA 02266-8266
E-mail: wfaf@wellsfargo.com
Web site: wellsfargoadvantagefunds.com
Individual investors: 1-800-222-8222
Retail investment professionals: 1-888-877-9275
Institutional investment professionals: 1-866-765-0778
This report and the financial statements contained herein are submitted for the general information of the shareholders of Wells Fargo Advantage Funds. If this report is used for promotional purposes, distribution of the report must be accompanied or preceded by a current prospectus. For a prospectus containing more complete information, including charges and expenses, call 1-800-222-8222 or visit the Fund’s Web site at wellsfargoadvantagefunds.com. Please consider the investment objectives, risks, charges, and expenses of the investment carefully before investing. This and other information about Wells Fargo Advantage Funds can be found in the current prospectus. Read the prospectus carefully before you invest or send money.
Wells Fargo Funds Management, LLC, a wholly owned subsidiary of Wells Fargo & Company, provides investment advisory and administrative services for Wells Fargo Advantage Funds. Other affiliates of Wells Fargo & Company provide subadvisory and other services for the Funds. The Funds are distributed by Wells Fargo Funds Distributor, LLC, Member FINRA/SIPC, an affiliate of Wells Fargo & Company.
NOT FDIC INSURED ¡ NO BANK GUARANTEE ¡ MAY LOSE VALUE
© 2012 Wells Fargo Funds Management, LLC. All rights reserved.
| | |
 | | 207949 03-12 SA209/SAR209 1-12 |

Wells Fargo Advantage
Large Company Value Fund

Semi-Annual Report
January 31, 2012

Reduce clutter. Save trees.
Sign up for electronic delivery of prospectuses and shareholder reports at wellsfargo.com/advantagedelivery
Contents
The views expressed and any forward-looking statements are as of January 31, 2012, unless otherwise noted, and are those of the Fund managers and/or Wells Fargo Funds Management, LLC. Discussions of individual securities, or the markets generally, or any Wells Fargo Advantage Fund are not intended as individual recommendations. Future events or results may vary significantly from those expressed in any forward-looking statements; the views expressed are subject to change at any time in response to changing circumstances in the market. Wells Fargo Funds Management, LLC, disclaims any obligation to publicly update or revise any views expressed or forward-looking statements.
NOT FDIC INSURED ¡ NO BANK GUARANTEE ¡ MAY LOSE VALUE

WELLS FARGO INVESTMENT HISTORY
| | |
| |
| 1932 | | Keystone creates one of the first mutual fund families. |
| |
| 1971 | | Wells Fargo & Company introduces one of the first institutional index funds. |
| |
| 1978 | | Wells Fargo applies Markowitz and Sharpe’s research on Modern Portfolio Theory to introduce one of the industry’s first Tactical Asset Allocation (TAA) models in institutional separately managed accounts. |
| |
| 1984 | | Wells Fargo Stagecoach Funds launches its first asset allocation fund. |
| |
| 1989 | | The Tactical Asset Allocation (TAA) Model is first applied to Wells Fargo’s asset allocation mutual funds. |
| |
| 1994 | | Wells Fargo introduces the LifePath Funds, one of the first suites of target date funds (now the Wells Fargo Advantage Dow Jones Target Date FundsSM). |
| |
| 1996 | | Evergreen Investments and Keystone Funds merge. |
| |
| 1997 | | Wells Fargo launches Wells Fargo Advantage WealthBuilder PortfoliosSM, a fund-of-funds suite of products that includes the use of quantitative models to shift assets among investment styles. |
| |
| 1999 | | Norwest Advantage Funds and Stagecoach Funds are reorganized into Wells Fargo Funds after the merger of Norwest and Wells Fargo. |
| |
| 2002 | | Evergreen Retail and Evergreen Institutional companies form the umbrella asset management company, Evergreen Investments. |
| |
| 2005 | | The integration of Strong Funds with Wells Fargo Funds creates Wells Fargo Advantage Funds, resulting in one of the top 20 mutual fund companies in the United States. |
| |
| 2006 | | Wells Fargo Advantage Funds relaunches the target date product line as Wells Fargo Advantage Dow Jones Target Date Funds. |
| |
| 2010 | | The mergers and reorganizations of Evergreen and Wells Fargo Advantage mutual funds are completed, unifying the families under the brand of Wells Fargo Advantage Funds. |
Wells Fargo Advantage Funds®
Wells Fargo Advantage Funds skillfully guides institutions, financial advisors, and individuals through the investment terrain to help them reach their financial objectives. Everything we do on behalf of investors is backed by our unique combination of qualifications.
Strength
Our organization is built on the standards of integrity and service established by our parent company—Wells Fargo & Company—more than 150 years ago. And, because we’re part of a highly diversified financial enterprise, we offer the depth of resources to help investors succeed.
Expertise
Our multi-boutique model offers investors access to the independent thinking of premier investment managers that have been chosen for their time-tested strategies. While each team specializes in a specific investment strategy, collectively they provide investors a wide choice of distinct investment styles. Our dedication to investment excellence doesn’t end with our expertise in manager selection—risk management, analysis, and rigorous ongoing review seek to ensure each manager’s investment process remains consistent.
Partnership
Our collaborative approach is built around understanding the needs and goals of our clients. By adhering to core principles of sound judgment and steady guidance, we support you through every stage of the investment decision process.
Carefully consider a fund’s investment objectives, risks, charges, and expenses before investing. For a current prospectus and, if available, a summary prospectus, containing this and other information, visit wellsfargoadvantagefunds.com. Read it carefully before investing.
Wells Fargo Funds Management, LLC, a wholly owned subsidiary of Wells Fargo & Company, provides investment advisory and administrative services for Wells Fargo Advantage Funds®. Other affiliates of Wells Fargo & Company provide subadvisory and other services for the Funds. The Funds are distributed by Wells Fargo Funds Distributor, LLC, Member FINRA/SIPC, an affiliate of Wells Fargo & Company.
“Dow Jones®” and “Dow Jones Target Date IndexesSM” are service marks of Dow Jones Trademark Holdings, LLC (“Dow Jones”), have been licensed to CME Group Index Services LLC (“CME Indexes”) and have been sublicensed for use for certain purposes by Global Index Advisors, Inc, and Wells Fargo Funds Management, LLC. The Wells Fargo Advantage Dow Jones Target Date FundsSM based on the Dow Jones Target Date IndexesSM, are not sponsored, endorsed, sold or promoted by Dow Jones, CME Indexes or their respective affiliates and none of them makes any representation regarding the advisability of investing in such product(s).
NOT FDIC INSURED ¡ NO BANK GUARANTEE ¡ MAY LOSE VALUE
Not part of the semi-annual report.
Wells Fargo Advantage Funds offers more than 110 mutual funds across a wide range of asset classes, representing over $217 billion in assets under management, as of January 31, 2012.
| | | | |
| Equity Funds | | | | |
Asia Pacific Fund | | Equity Value Fund | | Precious Metals Fund |
C&B Large Cap Value Fund | | Global Opportunities Fund | | Premier Large Company Growth Fund |
C&B Mid Cap Value Fund | | Growth Fund | | Small Cap Opportunities Fund |
Capital Growth Fund | | Index Fund | | Small Cap Value Fund |
Common Stock Fund | | International Equity Fund | | Small Company Growth Fund |
Disciplined U.S. Core Fund | | International Value Fund | | Small Company Value Fund |
Discovery Fund† | | Intrinsic Small Cap Value Fund | | Small/Mid Cap Core Fund |
Diversified Equity Fund | | Intrinsic Value Fund | | Small/Mid Cap Value Fund |
Diversified International Fund | | Intrinsic World Equity Fund | | Special Mid Cap Value Fund |
Diversified Small Cap Fund | | Large Cap Core Fund | | Special Small Cap Value Fund |
Emerging Growth Fund | | Large Cap Growth Fund | | Specialized Technology Fund |
Emerging Markets Equity Fund | | Large Company Value Fund | | Strategic Large Cap Growth Fund |
Endeavor Select Fund† | | Omega Growth Fund | | Traditional Small Cap Growth Fund |
Enterprise Fund† | | Opportunity Fund† | | Utility and Telecommunications Fund |
| Bond Funds | | | | |
Adjustable Rate Government Fund | | Inflation-Protected Bond Fund | | Short-Term Bond Fund |
California Limited-Term Tax-Free Fund | | Intermediate Tax/AMT-Free Fund | | Short-Term High Yield Bond Fund |
California Tax-Free Fund | | International Bond Fund | | Short-Term Municipal Bond Fund |
Colorado Tax-Free Fund | | Minnesota Tax-Free Fund | | Strategic Municipal Bond Fund |
Government Securities Fund | | Municipal Bond Fund | | Total Return Bond Fund |
High Income Fund | | North Carolina Tax-Free Fund | | Ultra Short-Term Income Fund |
High Yield Bond Fund | | Pennsylvania Tax-Free Fund | | Ultra Short-Term Municipal Income Fund |
Income Plus Fund | | Short Duration Government Bond Fund | | Wisconsin Tax-Free Fund |
| Asset Allocation Funds | | | | |
Absolute Return Fund | | WealthBuilder Equity Portfolio† | | Target 2020 Fund† |
Asset Allocation Fund | | WealthBuilder Growth Allocation Portfolio† | | Target 2025 Fund† |
Conservative Allocation Fund | | WealthBuilder Growth Balanced Portfolio† | | Target 2030 Fund† |
Diversified Capital Builder Fund | | WealthBuilder Moderate Balanced Portfolio† | | Target 2035 Fund† |
Diversified Income Builder Fund | | WealthBuilder Tactical Equity Portfolio† | | Target 2040 Fund† |
Growth Balanced Fund | | Target Today Fund† | | Target 2045 Fund† |
Index Asset Allocation Fund | | Target 2010 Fund† | | Target 2050 Fund† |
Moderate Balanced Fund | | Target 2015 Fund† | | Target 2055 Fund† |
WealthBuilder Conservative Allocation Portfolio† | | | | |
| Money Market Funds | | | | |
100% Treasury Money Market Fund | | Heritage Money Market Fund† | | National Tax-Free Money Market Fund |
California Municipal Money Market Fund | | Money Market Fund | | Prime Investment Money Market Fund |
Cash Investment Money Market Fund | | Municipal Cash Management Money Market Fund | | Treasury Plus Money Market Fund |
Government Money Market Fund | | Municipal Money Market Fund | | |
| Variable Trust Funds1 | | | | |
VT Discovery Fund† | | VT Intrinsic Value Fund | | VT Small Cap Growth Fund |
VT Index Asset Allocation Fund | | VT Omega Growth Fund | | VT Small Cap Value Fund |
VT International Equity Fund | | VT Opportunity Fund† | | VT Total Return Bond Fund |
An investment in a money market fund is not insured or guaranteed by the Federal Deposit Insurance Corporation or any other government agency. Although the Wells Fargo Advantage Money Market Funds seek to preserve the value of your investment at $1.00 per share, it is possible to lose money by investing in a money market fund.
| 1. | The Variable Trust Funds are generally available only through insurance company variable contracts. |
| † | In this report, the Wells Fargo Advantage Discovery FundSM, Wells Fargo Advantage Endeavor Select FundSM, Wells Fargo Advantage Enterprise FundSM, Wells Fargo Advantage Opportunity FundSM, Wells Fargo Advantage WealthBuilder Conservative Allocation PortfolioSM, Wells Fargo Advantage WealthBuilder Equity PortfolioSM, Wells Fargo Advantage WealthBuilder Growth Allocation PortfolioSM, Wells Fargo Advantage WealthBuilder Growth Balanced PortfolioSM, Wells Fargo Advantage WealthBuilder Moderate Balanced PortfolioSM, Wells Fargo Advantage WealthBuilder Tactical Equity PortfolioSM, Wells Fargo Advantage Dow Jones Target Today FundSM, Wells Fargo Advantage Dow Jones Target 2010 FundSM, Wells Fargo Advantage Dow Jones Target 2015 FundSM, Wells Fargo Advantage Dow Jones Target 2020 FundSM, Wells Fargo Advantage Dow Jones Target 2025 FundSM, Wells Fargo Advantage Dow Jones Target 2030 FundSM, Wells Fargo Advantage Dow Jones Target 2035 FundSM, Wells Fargo Advantage Dow Jones Target 2040 FundSM, Wells Fargo Advantage Dow Jones Target 2045 FundSM, Wells Fargo Advantage Dow Jones Target 2050 FundSM, Wells Fargo Advantage Dow Jones Target 2055 FundSM, Wells Fargo Advantage Heritage Money Market FundSM, Wells Fargo Advantage VT Discovery FundSM, and Wells Fargo Advantage VT Opportunity FundSM are referred to as the Discovery Fund, Endeavor Select Fund, Enterprise Fund, Opportunity Fund, WealthBuilder Conservative Allocation Portfolio, WealthBuilder Equity Portfolio, WealthBuilder Growth Allocation Portfolio, WealthBuilder Growth Balanced Portfolio, WealthBuilder Moderate Balanced Portfolio, WealthBuilder Tactical Equity Portfolio, Target Today Fund, Target 2010 Fund, Target 2015 Fund, Target 2020 Fund, Target 2025 Fund, Target 2030 Fund, Target 2035 Fund, Target 2040 Fund, Target 2045 Fund, Target 2050 Fund, Target 2055 Fund, Heritage Money Market Fund, VT Discovery Fund, and VT Opportunity Fund, respectively. |
Not part of the semi-annual report.
| | | | |
| 2 | | Wells Fargo Advantage Large Company Value Fund | | Letter to Shareholders |

Karla M. Rabusch,
President
Wells Fargo Advantage Funds
The period was marked by increased confidence that the U.S. economy was staging a fragile recovery, offset by continued concerns about the possible effect on the global economy of the ongoing European sovereign debt crisis—which began in Greece and later spread to the larger economies of Italy and Spain.
The slow-motion debt crisis in the eurozone was a major headwind to both domestic and global stock market indexes.
Dear Valued Shareholder:
We’re pleased to offer you this semi-annual report for the Wells Fargo Advantage Large Company Value Fund for the six-month period that ended January 31, 2012. The period was marked by increased confidence that the U.S. economy was staging a fragile recovery, offset by continued concerns about the possible effect on the global economy of the ongoing European sovereign debt crisis—which began in Greece and later spread to the larger economies of Italy and Spain. Most U.S. stock indexes posted gains for the period, even if only modest ones.
Worries gave way to guarded optimism for the U.S. economy.
The period began with worries that the U.S. economy was returning to recession. Revised figures for gross domestic product (GDP) indicated that the U.S. economy grew by an annualized rate of only 0.8% in the first half of 2011. Moreover, although the July 2011 Institute for Supply Management (ISM) manufacturing survey suggested that factories continued to expand, the rate of expansion was lower than in previous months. The prolonged debate over whether and how to raise the U.S. debt ceiling—which only ended on July 31, 2011—also depressed market sentiment by highlighting the country’s political divisions.
The stock market remained volatile throughout September. By late October, however, stronger economic data led to greater optimism and higher stock prices. Revised real GDP growth came in at 1.8% in the third quarter of 2011 and 2.8% in the fourth quarter, suggesting that the recovery was on firmer footing. Economic growth was not evenly distributed, though, as December 2011 retail same-store sales generally showed stronger growth for retailers targeting affluent customers than for those targeting the broad middle class. The reported unemployment rate also showed some signs of improvement, falling from 9.1% in August 2011 to 8.3% in January 2012. However, this decline in the unemployment rate was accompanied by an increase in the number of Americans not in the labor force, raising concerns about the economy’s ability to generate jobs.
The eurozone had continued trouble.
The slow-motion debt crisis in the eurozone was a major headwind to both domestic and global stock market indexes. The worsening debt and deficit numbers for Greece in late 2011 and early 2012 cast doubt on the country’s ability to service its debt under the plan put in place by the European Union and the International Monetary Fund and put the ongoing drama of the European sovereign debt crisis back on center stage. Investors became increasingly concerned that Greece would default on its debt, a scenario that only seemed more likely as many Greeks rioted in response to greater budgetary austerity and the discussion moved from whether private investors would take a loss on their Greek debt to how big the loss would be. Because many eurozone banks owned Greek debt and many U.S. banks had financial ties to eurozone banks, investors worried about the effect of such an event on the financial system and the global economy.
Even as the situation in Greece deteriorated, eurozone GDP numbers supported the case for a modest recovery in the global economy. Reported GDP growth for the 17 countries that comprise the eurozone was modest, rising 0.2% in the third quarter compared to the second quarter, and by 0.2% in the fourth quarter
| | | | | | |
| Letter to Shareholders | | Wells Fargo Advantage Large Company Value Fund | | | 3 | |
compared to the third quarter. However, the eurozone average concealed a wide variation between economies, with Germany’s growing by 0.5% in the third quarter of 2011 even as Greece’s GDP contracted.
Central banks continued to provide stimulus.
Throughout the reporting period, the Federal Open Market Committee (FOMC) kept its key interest rates effectively at zero in order to support the economy and financial system. Moreover, in response to extreme market volatility and signs of a weakening economy, in its August 2011 policy statement, the Federal Reserve (Fed) announced it would keep interest rates “exceptionally low” until at least mid-2013 as a way to support the economy. Market participants interpreted the Fed’s statement to mean that the central bankers believed the economy would remain weak over the next two years. However, the Fed also said that it was considering a “range of policy tools available to promote a stronger economic recovery” and “is prepared to employ these tools as appropriate.”
At the beginning of the period, the European Central Bank (ECB) had a key rate of 1.50% but lowered it to 1.25% in November 2011 and then to 1.00% in December 2011 in an attempt to support the sluggish eurozone recovery. To support the banking system, in late 2011, the ECB initiated a long-term refinancing operation (LTRO) in which it supplied three-year loans to banks against a wide range of collateral. The operation basically provided a near-unlimited amount of liquidity to banks, easing some investor concerns about the effect of an increasingly probable Greek default.
We use time-tested investment strategies, even as many variables are at work in the market.
Experience tells us that strict adherence to time-tested investment strategies has its rewards. As a whole, Wells Fargo Advantage Funds represents investments across a range of asset classes and investment styles, giving you an opportunity to create a diversified investment portfolio. While diversification may not prevent losses in a downturn, it does provide you with one way of managing risk.
Thank you for choosing to invest with Wells Fargo Advantage Funds. We appreciate your confidence in us and remain committed to helping you meet your financial needs. For current information about your fund investments, contact your investment professional, visit our website at wellsfargoadvantagefunds.com, or call us directly at 1-800-222-8222. We are available 24 hours a day, 7 days a week.
Sincerely,

Karla M. Rabusch
President
Wells Fargo Advantage Funds
| | | | |
| 4 | | Wells Fargo Advantage Large Company Value Fund | | Letter to Shareholders |
Notice to Shareholders
The Board of Trustees for Wells Fargo Advantage Funds has unanimously approved the following modifications to certain net asset value (NAV) waiver privileges and commission schedules:
| | n | | Effective May 1, 2012, automatic investment plan (AIP) purchases and proceeds received from systematic withdrawals will no longer qualify for NAV repurchase privileges. | |
| | n | | Effective May 1, 2012, discretionary rights to waive the upfront commission for Class C and “jumbo” Class A share purchases will no longer be granted to broker/dealers. However, we will continue to waive the Class C shares contingent deferred sales charge for redemptions by employer-sponsored retirement plans where the dealer of record waived its commission at the time of purchase. | |
| | n | | Effective July 31, 2012, NAV purchase privileges for former Evergreen Class IS and Class R shareholders are being modified to remove the ability to purchase Class A shares at NAV unless those shares are held directly with the Fund on or after July 31, 2012. | |
Please contact your investment professional or call us directly at 1-800-222-8222 if you have any questions on this Notice to Shareholders.
| | | | | | |
| Performance Highlights (Unaudited) | | Wells Fargo Advantage Large Company Value Fund | | | 5 | |
INVESTMENT OBJECTIVE
The Fund seeks long-term capital appreciation.
ADVISER
Wells Fargo Funds Management, LLC
SUB-ADVISER
Phocas Financial Corporation
PORTFOLIO MANAGERS
Stephen L. Block, CFA
William F.K. Schaff, CFA
FUND INCEPTION
July 1, 1993
| | | | |
TEN LARGEST EQUITY HOLDINGS1 (AS OF JANUARY 31, 2012) | | | |
General Electric Company | | | 3.49% | |
Chevron Corporation | | | 2.91% | |
Simon Property Group Incorporated | | | 2.65% | |
JPMorgan Chase & Company | | | 2.63% | |
Pfizer Incorporated | | | 2.37% | |
Home Depot Incorporated | | | 2.10% | |
CVS Caremark Corporation | | | 2.09% | |
CIGNA Corporation | | | 2.00% | |
The Travelers Companies Incorporated | | | 1.98% | |
Cisco Systems Incorporated | | | 1.97% | |
| | |
SECTOR DISTRIBUTION2 (AS OF JANUARY 31, 2012) |
|
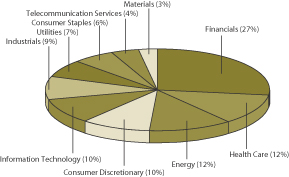 |
| 1. | The ten largest equity holdings are calculated based on the value of the securities divided by total net assets of the Fund. Holdings are subject to change and may have changed since the date specified. |
| 2. | Sector distribution is subject to change and is calculated based on the total long-term investments of the Fund. |
| | | | |
| 6 | | Wells Fargo Advantage Large Company Value Fund | | Performance Highlights (Unaudited) |
AVERAGE ANNUAL TOTAL RETURN3 (%) (AS OF JANUARY 31, 2012)
| | | | | | | | | | | | | | | | | | | | | | | | | | | | | | | | | | | | | | | | | | | | |
| | | | | | Including Sales Charge | | | Excluding Sales Charge | | | Expense Ratios4 | |
| | | Inception Date | | | 6 Months* | | | 1 Year | | | 5 Year | | | 10 Year | | | 6 Months* | | | 1 Year | | | 5 Year | | | 10 Year | | | Gross | | | Net5 | |
Class A (WLCAX) | | | 03/31/2008 | | | | (5.84 | ) | | | (6.46 | ) | | | (2.44 | ) | | | 2.70 | | | | (0.09 | ) | | | (0.79 | ) | | | (1.28 | ) | | | 3.31 | | | | 1.34% | | | | 1.11% | |
Class C (WFLVX) | | | 03/31/2008 | | | | (1.50 | ) | | | (2.58 | ) | | | (1.98 | ) | | | 2.63 | | | | (0.50 | ) | | | (1.58 | ) | | | (1.98 | ) | | | 2.63 | | | | 2.09% | | | | 1.86% | |
Administrator Class (WWIDX) | | | 12/31/2001 | | | | | | | | | | | | | | | | | | | | (0.02 | ) | | | (0.57 | ) | | | (0.96 | ) | | | 3.69 | | | | 1.18% | | | | 0.86% | |
Institutional Class (WLCIX) | | | 03/31/2008 | | | | | | | | | | | | | | | | | | | | 0.08 | | | | (0.40 | ) | | | (0.82 | ) | | | 3.76 | | | | 0.91% | | | | 0.66% | |
Investor Class (SDVIX) | | | 07/01/1993 | | | | | | | | | | | | | | | | | | | | (0.23 | ) | | | (0.92 | ) | | | (1.35 | ) | | | 3.27 | | | | 1.41% | | | | 1.18% | |
Russell 1000® Value Index6 | | | | | | | | | | | | | | | | | | | | | | | 1.74 | | | | 1.88 | | | | (2.16 | ) | | | 4.36 | | | | | | | | | |
| * | Returns for periods of less than one year are not annualized. |
Figures quoted represent past performance, which is no guarantee of future results and do not reflect the deduction of taxes that a shareholder may pay on fund distributions or the redemption of fund shares. Investment return and principal value of an investment will fluctuate so that an investor’s shares, when redeemed, may be worth more or less than their original cost. Performance shown without sales charges would be lower if sales charges were reflected. Current performance may be lower or higher than the performance data quoted and assumes the reinvestment of dividends and capital gains. Current month-end performance is available on the Fund’s Web site – wellsfargoadvantagefunds.com
Index returns do not include transaction costs associated with buying and selling securities, any mutual fund fees or expenses or any taxes. It is not possible to invest directly in an index.
For Class A shares, the maximum front-end sales charge is 5.75%. For Class C shares, the maximum contingent deferred sales charge is 1.00%. Performance including sales charge assumes the sales charge for the corresponding time period. Administrator Class, Institutional Class and Investor Class shares are sold without a front-end sales charge or contingent deferred sales charge.
Stock fund values fluctuate in response to the activities of individual companies and general market and economic conditions. Certain investment strategies tend to increase the total risk of an investment (relative to the broader market). This Fund is exposed to foreign investment risk. Consult the Fund’s prospectus for additional information on these and other risks.
| 3. | Historical performance shown for Class A shares prior to their inception reflects the performance of the Investor Class shares, and includes the higher expenses applicable to the Investor Class shares (except during those periods in which the expenses of Class A shares would have been higher than those of the Investor Class shares.) If these expenses had not been included, returns would be higher. Historical performance shown for Class C shares prior to their inception reflects the performance of the Investor Class shares, adjusted to reflect the higher expenses applicable to Class C shares. Historical performance shown for the Administrator Class and Institutional Class shares prior to their inception reflects the performance of the Investor Class shares and includes the higher expenses applicable to the Investor Class shares. If these expenses had not been included, returns would be higher. |
| 4. | Reflects the expense ratios as stated in the most recent prospectuses. |
| 5. | The Adviser has committed through July 18, 2013 to waive fees and/or reimburse expenses to the extent necessary to cap the Fund’s Total Annual Fund Operating Expenses After Fee Waiver, excluding certain expenses, at 1.10% for Class A, 1.85% for Class C, 0.85% for Administrator Class, 0.65% for Institutional Class and 1.17% for Investor Class shares. Without this cap, the Fund’s returns would have been lower. |
| 6. | The Russell 1000® Value Index measures the performance of those Russell 1000 Value Index companies with lower price-to-book ratios and lower forecasted growth values. You cannot invest directly in an index. |
| | | | | | |
| Fund Expenses (Unaudited) | | Wells Fargo Advantage Large Company Value Fund | | | 7 | |
As a shareholder of the Fund, you incur two types of costs: (1) transaction costs, including sales charges (loads) on purchase payments and contingent deferred sales charges (if any) on redemptions and (2) ongoing costs, including management fees; distribution (12b-1) and/or shareholder service fees; and other Fund expenses. This example is intended to help you understand your ongoing costs (in dollars) of investing in the Fund and to compare these costs with the ongoing costs of investing in other mutual funds.
The example is based on an investment of $1,000 invested at the beginning of the six-month period and held for the entire period from August 1, 2011 to January 31, 2012.
Actual Expenses
The “Actual” line of the table below provides information about actual account values and actual expenses. You may use the information in this line, together with the amount you invested, to estimate the expenses that you paid over the period. Simply divide your account value by $1,000 (for example, an $8,600 account value divided by $1,000 = 8.6), then multiply the result by the number in the “Actual” line under the heading entitled “Expenses Paid During Period” for your applicable class of shares to estimate the expenses you paid on your account during this period.
Hypothetical Example for Comparison Purposes
The “Hypothetical” line of the table below provides information about hypothetical account values and hypothetical expenses based on the Fund’s actual expense ratio and an assumed rate of return of 5% per year before expenses, which is not the Fund’s actual return. The hypothetical account values and expenses may not be used to estimate the actual ending account balance or expenses you paid for the period. You may use this information to compare the ongoing costs of investing in the Fund and other funds. To do so, compare this 5% hypothetical example with the 5% hypothetical examples that appear in the shareholder reports of the other funds.
Please note that the expenses shown in the table are meant to highlight your ongoing costs only and do not reflect any transactional costs, such as sales charges (loads) and contingent deferred sales charges. Therefore, the “Hypothetical” line of the table is useful in comparing ongoing costs only, and will not help you determine the relative total costs of owning different funds. In addition, if these transactional costs were included, your costs would have been higher.
| | | | | | | | | | | | | | | | |
| | | Beginning
Account Value
08-01-2011 | | | Ending
Account Value
01-31-2012 | | | Expenses
Paid During
the Period1 | | | Net Annual
Expense Ratio | |
Class A | | | | | | | | | | | | | | | | |
Actual | | $ | 1,000.00 | | | $ | 999.14 | | | $ | 5.53 | | | | 1.10 | % |
Hypothetical (5% return before expenses) | | $ | 1,000.00 | | | $ | 1,019.61 | | | $ | 5.58 | | | | 1.10 | % |
Class C | | | | | | | | | | | | | | | | |
Actual | | $ | 1,000.00 | | | $ | 994.97 | | | $ | 9.28 | | | | 1.85 | % |
Hypothetical (5% return before expenses) | | $ | 1,000.00 | | | $ | 1,015.84 | | | $ | 9.37 | | | | 1.85 | % |
Administrator Class | | | | | | | | | | | | | | | | |
Actual | | $ | 1,000.00 | | | $ | 999.82 | | | $ | 4.27 | | | | 0.85 | % |
Hypothetical (5% return before expenses) | | $ | 1,000.00 | | | $ | 1,020.86 | | | $ | 4.32 | | | | 0.85 | % |
Institutional Class | | | | | | | | | | | | | | | | |
Actual | | $ | 1,000.00 | | | $ | 1,000.76 | | | $ | 3.32 | | | | 0.66 | % |
Hypothetical (5% return before expenses) | | $ | 1,000.00 | | | $ | 1,021.82 | | | $ | 3.35 | | | | 0.66 | % |
Investor Class | | | | | | | | | | | | | | | | |
Actual | | $ | 1,000.00 | | | $ | 997.72 | | | $ | 5.98 | | | | 1.19 | % |
Hypothetical (5% return before expenses) | | $ | 1,000.00 | | | $ | 1,019.15 | | | $ | 6.04 | | | | 1.19 | % |
| 1. | Expenses paid is equal to the annualized expense ratio of each class multiplied by the average account value over the period, multiplied by the number of days in the most recent fiscal half-year divided by the number of days in the fiscal year (to reflect the one-half year period). |
| | | | |
| 8 | | Wells Fargo Advantage Large Company Value Fund | | Portfolio of Investments—January 31, 2012 (Unaudited) |
| | | | | | | | | | | | |
| Security Name | | | | | | Shares | | | Value | |
| | | | | | | | | | | | |
| | | | |
Common Stocks: 96.85% | | | | | | | | | | | | |
| | | | |
Consumer Discretionary: 9.43% | | | | | | | | | | | | |
| | | | |
| Hotels, Restaurants & Leisure: 1.09% | | | | | | | | | | | | |
Starwood Hotels & Resorts Worldwide Incorporated | | | | | | | 88,997 | | | $ | 4,827,197 | |
| | | | | | | | | | | | |
| | | | |
| Household Durables: 1.41% | | | | | | | | | | | | |
Newell Rubbermaid Incorporated | | | | | | | 337,029 | | | | 6,224,926 | |
| | | | | | | | | | | | |
| | | | |
| Media: 2.98% | | | | | | | | | | | | |
DIRECTV Group IncorporatedǠ | | | | | | | 104,001 | | | | 4,681,090 | |
Omnicom Group Incorporated | | | | | | | 92,259 | | | | 4,207,933 | |
Walt Disney Company« | | | | | | | 110,504 | | | | 4,298,606 | |
| | | | |
| | | | | | | | | | | 13,187,629 | |
| | | | | | | | | | | | |
| | | | |
| Multiline Retail: 0.87% | | | | | | | | | | | | |
Target Corporation | | | | | | | 75,990 | | | | 3,861,052 | |
| | | | | | | | | | | | |
| | | | |
| Specialty Retail: 2.10% | | | | | | | | | | | | |
Home Depot Incorporated | | | | | | | 208,633 | | | | 9,261,219 | |
| | | | | | | | | | | | |
| | | | |
| Textiles, Apparel & Luxury Goods: 0.98% | | | | | | | | | | | | |
VF Corporation | | | | | | | 32,858 | | | | 4,320,498 | |
| | | | | | | | | | | | |
| | | | |
Consumer Staples: 5.48% | | | | | | | | | | | | |
| | | | |
| Beverages: 0.96% | | | | | | | | | | | | |
PepsiCo Incorporated | | | | | | | 64,472 | | | | 4,233,876 | |
| | | | | | | | | | | | |
| | | | |
| Food & Staples Retailing: 2.08% | | | | | | | | | | | | |
CVS Caremark Corporation | | | | | | | 220,728 | | | | 9,215,394 | |
| | | | | | | | | | | | |
| | | | |
| Food Products: 1.08% | | | | | | | | | | | | |
Sara Lee Corporation | | | | | | | 249,400 | | | | 4,776,010 | |
| | | | | | | | | | | | |
| | | | |
| Household Products: 1.36% | | | | | | | | | | | | |
Procter & Gamble Company | | | | | | | 95,243 | | | | 6,004,119 | |
| | | | | | | | | | | | |
| | | | |
Energy: 11.36% | | | | | | | | | | | | |
| | | | |
| Energy Equipment & Services: 2.77% | | | | | | | | | | | | |
Nabors Industries Limited† | | | | | | | 337,287 | | | | 6,280,284 | |
Noble Corporation« | | | | | | | 171,468 | | | | 5,973,945 | |
| | | | |
| | | | | | | | | | | 12,254,229 | |
| | | | | | | | | | | | |
| | | | |
| Oil, Gas & Consumable Fuels: 8.59% | | | | | | | | | | | | |
Apache Corporation | | | | | | | 46,701 | | | | 4,617,795 | |
Chevron Corporation | | | | | | | 124,617 | | | | 12,845,520 | |
ConocoPhillips Company | | | | | | | 113,682 | | | | 7,754,249 | |
Devon Energy Corporation | | | | | | | 72,639 | | | | 4,635,095 | |
Pioneer Natural Resources Company | | | | | | | 47,293 | | | | 4,696,195 | |
Whiting Petroleum Corporation† | | | | | | | 67,482 | | | | 3,380,173 | |
| | | | |
| | | | | | | | | | | 37,929,027 | |
| | | | | | | | | | | | |
| | | | | | |
| Portfolio of Investments—January 31, 2012 (Unaudited) | | Wells Fargo Advantage Large Company Value Fund | | | 9 | |
| | | | | | | | | | | | |
| Security Name | | | | | | Shares | | | Value | |
| | | | | | | | | | | | |
| | | | |
Financials: 26.12% | | | | | | | | | | | | |
| | | | |
| Capital Markets: 1.99% | | | | | | | | | | | | |
Goldman Sachs Group Incorporated | | | | | | | 39,360 | | | $ | 4,387,459 | |
State Street Corporation | | | | | | | 112,949 | | | | 4,425,342 | |
| | | | |
| | | | | | | | | | | 8,812,801 | |
| | | | | | | | | | | | |
| | | | |
| Commercial Banks: 4.59% | | | | | | | | | | | | |
Comerica Incorporated | | | | | | | 247,114 | | | | 6,837,644 | |
First Republic Bank Corporation† | | | | | | | 212,808 | | | | 6,379,984 | |
KeyCorp Incorporated | | | | | | | 909,178 | | | | 7,064,313 | |
| | | | |
| | | | | | | | | | | 20,281,941 | |
| | | | | | | | | | | | |
| | | | |
| Consumer Finance: 2.38% | | | | | | | | | | | | |
Capital One Financial Corporation« | | | | | | | 131,287 | | | | 6,006,380 | |
SLM Corporation | | | | | | | 300,719 | | | | 4,495,749 | |
| | | | |
| | | | | | | | | | | 10,502,129 | |
| | | | | | | | | | | | |
| | | | |
| Diversified Financial Services: 7.67% | | | | | | | | | | | | |
Bank of America Corporation | | | | | | | 800,064 | | | | 5,704,456 | |
Berkshire Hathaway Incorporated Class B† | | | | | | | 108,957 | | | | 8,538,960 | |
Citigroup Incorporated | | | | | | | 262,185 | | | | 8,054,323 | |
JPMorgan Chase & Company | | | | | | | 311,490 | | | | 11,618,577 | |
| | | | |
| | | | | | | | | | | 33,916,316 | |
| | | | | | | | | | | | |
| | | | |
| Insurance: 5.49% | | | | | | | | | | | | |
ACE Limited | | | | | | | 118,572 | | | | 8,252,611 | |
MetLife Incorporated | | | | | | | 205,421 | | | | 7,257,524 | |
The Travelers Companies Incorporated | | | | | | | 149,821 | | | | 8,734,564 | |
| | | | |
| | | | | | | | | | | 24,244,699 | |
| | | | | | | | | | | | |
| | | | |
| REITs: 4.00% | | | | | | | | | | | | |
Alexandria Real Estate Equities Incorporated« | | | | | | | 82,226 | | | | 5,953,985 | |
Simon Property Group Incorporated | | | | | | | 86,126 | | | | 11,701,078 | |
| | | | |
| | | | | | | | | | | 17,655,063 | |
| | | | | | | | | | | | |
| | | | |
Health Care: 11.86% | | | | | | | | | | | | |
| | | | |
| Health Care Equipment & Supplies: 1.02% | | | | | | | | | | | | |
Stryker Corporation | | | | | | | 81,312 | | | | 4,507,124 | |
| | | | | | | | | | | | |
| | | | |
| Health Care Providers & Services: 2.00% | | | | | | | | | | | | |
CIGNA Corporation | | | | | | | 196,806 | | | | 8,822,813 | |
| | | | | | | | | | | | |
| | | | |
| Pharmaceuticals: 8.84% | | | | | | | | | | | | |
Abbott Laboratories | | | | | | | 74,695 | | | | 4,044,734 | |
Hospira Incorporated† | | | | | | | 140,644 | | | | 4,846,592 | |
Johnson & Johnson Services Incorporated | | | | | | | 122,133 | | | | 8,049,786 | |
Merck & Company Incorporated | | | | | | | 187,829 | | | | 7,186,338 | |
Pfizer Incorporated | | | | | | | 490,157 | | | | 10,489,360 | |
Teva Pharmaceutical Industries Limited ADR | | | | | | | 98,533 | | | | 4,446,794 | |
| | | | |
| | | | | | | | | | | 39,063,604 | |
| | | | | | | | | | | | |
| | | | |
| 10 | | Wells Fargo Advantage Large Company Value Fund | | Portfolio of Investments—January 31, 2012 (Unaudited) |
| | | | | | | | | | | | |
| Security Name | | | | | | Shares | | | Value | |
| | | | | | | | | | | | |
| | | | |
Industrials: 9.16% | | | | | | | | | | | | |
| | | | |
| Airlines: 1.02% | | | | | | | | | | | | |
Southwest Airlines Company | | | | | | | 472,219 | | | $ | 4,523,858 | |
| | | | | | | | | | | | |
| | | | |
| Construction & Engineering: 0.91% | | | | | | | | | | | | |
URS Corporation† | | | | | | | 97,270 | | | | 4,002,661 | |
| | | | | | | | | | | | |
| | | | |
| Industrial Conglomerates: 3.49% | | | | | | | | | | | | |
General Electric Company | | | | | | | 825,169 | | | | 15,438,912 | |
| | | | | | | | | | | | |
| | | | |
| Machinery: 2.31% | | | | | | | | | | | | |
Dover Corporation« | | | | | | | 106,836 | | | | 6,774,471 | |
Eaton Corporation | | | | | | | 69,833 | | | | 3,423,912 | |
| | | | |
| | | | | | | | | | | 10,198,383 | |
| | | | | | | | | | | | |
| | | | |
| Road & Rail: 1.43% | | | | | | | | | | | | |
Norfolk Southern Corporation | | | | | | | 87,578 | | | | 6,323,132 | |
| | | | | | | | | | | | |
| | | | |
Information Technology: 9.54% | | | | | | | | | | | | |
| | | | |
| Communications Equipment: 1.98% | | | | | | | | | | | | |
Cisco Systems Incorporated | | | | | | | 444,497 | | | | 8,725,476 | |
| | | | | | | | | | | | |
| | | | |
| Computers & Peripherals: 1.55% | | | | | | | | | | | | |
EMC Corporation† | | | | | | | 266,088 | | | | 6,854,427 | |
| | | | | | | | | | | | |
| | | | |
| Internet Software & Services: 0.96% | | | | | | | | | | | | |
Google Incorporated Class A† | | | | | | | 7,290 | | | | 4,229,002 | |
| | | | | | | | | | | | |
| | | | |
| IT Services: 1.79% | | | | | | | | | | | | |
Accenture plc | | | | | | | 138,272 | | | | 7,928,516 | |
| | | | | | | | | | | | |
| | | | |
| Semiconductors & Semiconductor Equipment: 1.27% | | | | | | | | | | | | |
Maxim Integrated Products Incorporated | | | | | | | 209,503 | | | | 5,623,061 | |
| | | | | | | | | | | | |
| | | | |
| Software: 1.99% | | | | | | | | | | | | |
Compuware Corporation† | | | | | | | 555,010 | | | | 4,351,278 | |
Microsoft Corporation | | | | | | | 150,989 | | | | 4,458,705 | |
| | | | |
| | | | | | | | | | | 8,809,983 | |
| | | | | | | | | | | | |
| | | | |
Materials: 2.62% | | | | | | | | | | | | |
| | | | |
| Chemicals: 2.02% | | | | | | | | | | | | |
Ashland Incorporated« | | | | | | | 73,608 | | | | 4,641,720 | |
Huntsman Corporation | | | | | | | 337,767 | | | | 4,299,774 | |
| | | | |
| | | | | | | | | | | 8,941,494 | |
| | | | | | | | | | | | |
| | | | |
| Metals & Mining: 0.60% | | | | | | | | | | | | |
Alcoa Incorporated | | | | | | | 261,009 | | | | 2,651,851 | |
| | | | | | | | | | | | |
| | | | |
Telecommunication Services: 4.07% | | | | | | | | | | | | |
| | | | |
| Diversified Telecommunication Services: 3.43% | | | | | | | | | | | | |
AT&T Incorporated | | | | | | | 291,778 | | | | 8,581,191 | |
Verizon Communications Incorporated« | | | | | | | 174,531 | | | | 6,572,837 | |
| | | | |
| | | | | | | | | | | 15,154,028 | |
| | | | | | | | | | | | |
| | | | | | |
| Portfolio of Investments—January 31, 2012 (Unaudited) | | Wells Fargo Advantage Large Company Value Fund | | | 11 | |
| | | | | | | | | | | | | | |
| Security Name | | | | | | | Shares | | | Value | |
| | | | | | | | | | | | | | |
| | | | |
| Wireless Telecommunication Services: 0.64% | | | | | | | | | | | | | | |
NII Holdings Incorporated† | | | | | | | | | 141,148 | | | $ | 2,838,486 | |
| | | | | | | | | | | | | | |
| | | | |
Utilities: 7.21% | | | | | | | | | | | | | | |
| | | | |
| Electric Utilities: 3.30% | | | | | | | | | | | | | | |
Duke Energy Corporation« | | | | | | | | | 361,659 | | | | 7,706,953 | |
Entergy Corporation | | | | | | | | | 98,630 | | | | 6,842,949 | |
| | | | |
| | | | | | | | | | | | | 14,549,902 | |
| | | | | | | | | | | | | | |
| | | | |
| Multi-Utilities: 2.82% | | | | | | | | | | | | | | |
Dominion Resources Incorporated | | | | | | | | | 121,470 | | | | 6,078,359 | |
NiSource Incorporated« | | | | | | | | | 281,243 | | | | 6,392,653 | |
| | | | |
| | | | | | | | | | | | | 12,471,012 | |
| | | | | | | | | | | | | | |
| | | | |
| Water Utilities: 1.09% | | | | | | | | | | | | | | |
American Water Works Company Incorporated | | | | | | | | | 143,105 | | | | 4,826,930 | |
| | | | | | | | | | | | | | |
| | | | |
Total Common Stocks (Cost $374,541,024) | | | | | | | | | | | | | 427,992,780 | |
| | | | | | | | | | | | | | |
| | | | |
| | | | | | | | Principal | | | | |
| Other: 0.11% | | | | | | | | | | | | | | |
Gryphon Funding Limited, Pass-Through Entity(a)(i)(v) | | | | | | | | $ | 639,367 | | | | 172,629 | |
VFNC Corporation, Pass-Through Entity, 0.27%(a)(i)(v)± 144A | | | | | | | | | 728,559 | | | | 313,280 | |
| | | | |
Total Other (Cost $227,113) | | | | | | | | | | | | | 485,909 | |
| | | | | | | | | | | | | | |
| | | | |
| | | | | Yield | | | Shares | | | | |
| Short-Term Investments: 10.07% | | | | | | | | | | | | | | |
| | | | |
| Investment Companies: 10.07% | | | | | | | | | | | | | | |
Wells Fargo Advantage Cash Investment Money Market Fund, Institutional Class(l)(u) | | | | | 0.02 | % | | | 6,210,669 | | | | 6,210,669 | |
Wells Fargo Securities Lending Cash Investments, LLC(v)(l)(u)(r) | | | | | 0.15 | | | | 38,272,387 | | | | 38,272,387 | |
| | | | |
Total Short-Term Investments (Cost $44,483,056) | | | | | | | | | | | | | 44,483,056 | |
| | | | | | | | | | | | | | |
| | | | | | | | |
| Total Investments in Securities | | | | | | | | |
| (Cost $419,251,193)* | | | 107.03 | % | | | 472,961,745 | |
Other Assets and Liabilities, Net | | | (7.03 | ) | | | (31,055,386 | ) |
| | | | | | | | |
Total Net Assets | | | 100.00 | % | | $ | 441,906,359 | |
| | | | | | | | |
| « | All or a portion of this security is on loan. |
| † | Non-income earning security. |
| (a) | Security is fair valued by the Management Valuation Team, and in certain instances by the Board of Trustees, in accordance with procedures approved by the Board of Trustees. |
| (v) | Security represents investment of cash collateral received from securities on loan. |
| ± | Variable rate investment. |
| 144A | Security that may be resold to “qualified institutional buyers” under Rule 144A or security offered pursuant to Section 4(2) of the Securities Act of 1933, as amended. |
| (l) | Investment in an affiliate. |
| (u) | Rate shown is the 7-day annualized yield at period end. |
| (r) | The investment company is exempt from registration under Section 3(c)(7) of the 1940 Act. |
| * | Cost for federal income tax purposes is $426,188,235 and net unrealized appreciation (depreciation) consists of: |
| | | | |
Gross unrealized appreciation | | $ | 55,646,259 | |
Gross unrealized depreciation | | | (8,872,749 | ) |
| | | | |
Net unrealized appreciation | | $ | 46,773,510 | |
The accompanying notes are an integral part of these financial statements.
| | | | |
| 12 | | Wells Fargo Advantage Large Company Value Fund | | Statement of Assets and Liabilities—January 31, 2012 (Unaudited) |
| | | | |
| | | | |
| |
Assets | | | | |
Investments | | | | |
In unaffiliated securities (including securities on loan), at value (see cost below) | | $ | 428,478,689 | |
In affiliated securities, at value (see cost below) | | | 44,483,056 | |
| | | | |
Total investments, at value (see cost below) | | | 472,961,745 | |
Receivable for investments sold | | | 12,111,996 | |
Receivable for Fund shares sold | | | 223,654 | |
Receivable for dividends | | | 353,963 | |
Receivable for securities lending income | | | 4,298 | |
Prepaid expenses and other assets | | | 34,772 | |
| | | | |
Total assets | | | 485,690,428 | |
| | | | |
| |
Liabilities | | | | |
Payable for investments purchased | | | 4,442,752 | |
Payable for Fund shares redeemed | | | 473,421 | |
Payable upon receipt of securities loaned | | | 38,499,500 | |
Advisory fee payable | | | 167,511 | |
Distribution fees payable | | | 2,822 | |
Due to other related parties | | | 41,374 | |
Accrued expenses and other liabilities | | | 156,689 | |
| | | | |
Total liabilities | | | 43,784,069 | |
| | | | |
Total net assets | | $ | 441,906,359 | |
| | | | |
| |
NET ASSETS CONSIST OF | | | | |
Paid-in capital | | $ | 409,206,451 | |
Undistributed net investment income | | | 863,721 | |
Accumulated net realized losses on investments | | | (21,874,365 | ) |
Net unrealized gains on investments | | | 53,710,552 | |
| | | | |
Total net assets | | $ | 441,906,359 | |
| | | | |
| |
COMPUTATION OF NET ASSET VALUE AND OFFERING PRICE PER SHARE1 | | | | |
Net assets – Class A | | $ | 107,042,579 | |
Shares outstanding – Class A | | | 8,560,419 | |
Net asset value per share – Class A | | | $12.50 | |
Maximum offering price per share – Class A2 | | | $13.26 | |
Net assets – Class C | | $ | 4,159,747 | |
Shares outstanding – Class C | | | 326,402 | |
Net asset value per share – Class C | | | $12.74 | |
Net assets – Administrator Class | | $ | 190,332,855 | |
Shares outstanding – Administrator Class | | | 15,151,571 | |
Net asset value per share – Administrator Class | | | $12.56 | |
Net assets – Institutional Class | | $ | 16,178,049 | |
Shares outstanding – Institutional Class | | | 1,289,825 | |
Net asset value per share – Institutional Class | | | $12.54 | |
Net assets – Investor Class | | $ | 124,193,129 | |
Shares outstanding – Investor Class | | | 9,707,021 | |
Net asset value per share – Investor Class | | | $12.79 | |
| |
Investments in unaffiliated securities, at cost | | $ | 374,768,137 | |
| | | | |
Investments in affiliated securities, at cost | | $ | 44,483,056 | |
| | | | |
Total investments, at cost | | $ | 419,251,193 | |
| | | | |
Securities on loan, at value | | $ | 37,591,238 | |
| | | | |
| 1. | The Fund has an unlimited number of authorized shares. |
| 2. | Maximum offering price is computed as 100/94.25 of net asset value. On investments of $50,000 or more, the offering price is reduced. |
The accompanying notes are an integral part of these financial statements.
| | | | | | |
| Statement of Operations—Six Months Ended January 31, 2012 (Unaudited) | | Wells Fargo Advantage Large Company Value Fund | | | 13 | |
| | | | |
| | | | |
| |
Investment income | | | | |
Dividends* | | $ | 4,213,054 | |
Securities lending income, net | | | 48,640 | |
Income from affiliated securities | | | 4,154 | |
| | | | |
Total investment income | | | 4,265,848 | |
| | | | |
| |
Expenses | | | | |
Advisory fee | | | 1,246,515 | |
Administration fees | | | | |
Fund level | | | 95,886 | |
Class A | | | 116,062 | |
Class C | | | 4,595 | |
Administrator Class | | | 79,258 | |
Institutional Class | | | 5,987 | |
Investor Class | | | 193,456 | |
Shareholder servicing fees | | | | |
Class A | | | 111,598 | |
Class C | | | 4,418 | |
Administrator Class | | | 196,635 | |
Investor Class | | | 146,299 | |
Distribution fees | | | | |
Class C | | | 13,255 | |
Custody and accounting fees | | | 20,414 | |
Professional fees | | | 17,320 | |
Registration fees | | | 36,781 | |
Shareholder report expenses | | | 34,103 | |
Trustees’ fees and expenses | | | 6,295 | |
Other fees and expenses | | | 2,378 | |
| | | | |
Total expenses | | | 2,331,255 | |
Less: Fee waivers and/or expense reimbursements | | | (386,638 | ) |
| | | | |
Net expenses | | | 1,944,617 | |
| | | | |
Net investment income | | | 2,321,231 | |
| | | | |
| |
REALIZED AND UNREALIZED GAINS (LOSSES) ON INVESTMENTS | | | | |
Net realized losses on investments | | | (782,097 | ) |
Net change in unrealized gains (losses) on investments | | | 30,927,252 | |
| | | | |
Net realized and unrealized gains (losses) on investments | | | 30,145,155 | |
| | | | |
Net increase in net assets resulting from operations | | $ | 32,466,386 | |
| | | | |
| |
* Net of foreign dividend withholding taxes of | | | $5,856 | |
The accompanying notes are an integral part of these financial statements.
| | | | |
| 14 | | Wells Fargo Advantage Large Company Value Fund | | Statements of Changes in Net Assets |
| | | | | | | | | | | | | | | | |
| | | Six Months Ended
January 31, 2012
(Unaudited) | | | Year Ended
July 31, 2011 | |
| | | | |
Operations | | | | | | | | | | | | | | | | |
Net investment income | | | | | | $ | 2,321,231 | | | | | | | $ | 977,881 | |
Net realized gains (losses) on investments | | | | | | | (782,097 | ) | | | | | | | 4,434,553 | |
Net change in unrealized gains (losses) on investments | | | | | | | 30,927,252 | | | | | | | | 11,459,595 | |
| | | | | | | | | | | | | | | | |
Net increase in net assets resulting from operations | | | | | | | 32,466,386 | | | | | | | | 16,872,029 | |
| | | | | | | | | | | | | | | | |
| | | | |
Distributions to shareholders from | | | | | | | | | | | | | | | | |
Net investment income | | | | | | | | | | | | | | | | |
Class A | | | | | | | (334,035 | ) | | | | | | | (1,998 | ) |
Class C | | | | | | | (1,710 | ) | | | | | | | (323 | ) |
Administrator Class | | | | | | | (750,728 | ) | | | | | | | (5,162 | ) |
Institutional Class | | | | | | | (162,729 | ) | | | | | | | (47,434 | ) |
Investor Class | | | | | | | (585,686 | ) | | | | | | | (468,824 | ) |
| | | | | | | | | | | | | | | | |
Total distributions to shareholders | | | | | | | (1,834,888 | ) | | | | | | | (523,741 | ) |
| | | | | | | | | | | | | | | | |
| | | | |
Capital share transactions | | | Shares | | | | | | | | Shares | | | | | |
Proceeds from shares sold | | | | | | | | | | | | | | | | |
Class A | | | 94,047 | | | | 1,089,898 | | | | 46,394 | | | | 583,401 | |
Class C | | | 7,282 | | | | 85,667 | | | | 8,302 | | | | 105,538 | |
Administrator Class | | | 385,001 | | | | 4,611,487 | | | | 1,020,192 | | | | 11,899,540 | |
Institutional Class | | | 46,631 | | | | 538,473 | | | | 1,178,928 | | | | 14,101,121 | |
Investor Class | | | 186,651 | | | | 2,225,706 | | | | 528,969 | | | | 6,737,077 | |
| | | | | | | | | | | | | | | | |
| | | | | | | 8,551,231 | | | | | | | | 33,426,677 | |
| | | | | | | | | | | | | | | | |
Reinvestment of distributions | | | | | | | | | | | | | | | | |
Class A | | | 27,638 | | | | 315,692 | | | | 169 | | | | 1,998 | |
Class C | | | 125 | | | | 1,406 | | | | 21 | | | | 261 | |
Administrator Class | | | 55,889 | | | | 642,615 | | | | 310 | | | | 3,721 | |
Institutional Class | | | 14,100 | | | | 159,578 | | | | 3,911 | | | | 47,434 | |
Investor Class | | | 47,642 | | | | 551,836 | | | | 36,075 | | | | 436,265 | |
| | | | | | | | | | | | | | | | |
| | | | | | | 1,671,127 | | | | | | | | 489,679 | |
| | | | | | | | | | | | | | | | |
Payment for shares redeemed | | | | | | | | | | | | | | | | |
Class A | | | (719,583 | ) | | | (8,516,019 | ) | | | (28,394 | ) | | | (357,049 | ) |
Class C | | | (57,968 | ) | | | (689,078 | ) | | | (7,171 | ) | | | (85,115 | ) |
Administrator Class | | | (1,965,696 | ) | | | (23,061,545 | ) | | | (993,961 | ) | | | (11,762,472 | ) |
Institutional Class | | | (29,551 | ) | | | (345,253 | ) | | | (47,746 | ) | | | (616,491 | ) |
Investor Class | | | (713,849 | ) | | | (8,589,322 | ) | | | (1,618,749 | ) | | | (20,465,218 | ) |
| | | | | | | | | | | | | | | | |
| | | | | | | (41,201,217 | ) | | | | | | | (33,286,345 | ) |
| | | | | | | | | | | | | | | | |
Net asset value of shares issued in acquisition | | | | | | | | | | | | | | | | |
Class A | | | 9,107,380 | | | | 102,927,298 | | | | 0 | | | | 0 | |
Class C | | | 336,931 | | | | 3,882,390 | | | | 0 | | | | 0 | |
Administrator Class | | | 16,623,780 | | | | 188,701,818 | | | | 0 | | | | 0 | |
Institutional Class | | | 122,764 | | | | 1,391,319 | | | | 0 | | | | 0 | |
Investor Class | | | 1,606,770 | | | | 18,572,940 | | | | 0 | | | | 0 | |
| | | | | | | | | | | | | | | | |
| | | | | | | 315,475,765 | | | | | | | | 0 | |
| | | | | | | | | | | | | | | | |
Net increase in net assets resulting
from capital share transactions | | | | | | | 284,496,906 | | | | | | | | 630,011 | |
| | | | | | | | | | | | | | | | |
Total increase in net assets | | | | | | | 315,128,404 | | | | | | | | 16,978,299 | |
| | | | | | | | | | | | | | | | |
| | | | |
Net assets | | | | | | | | | | | | | | | | |
Beginning of period | | | | | | | 126,777,955 | | | | | | | | 109,799,656 | |
| | | | | | | | | | | | | | | | |
End of period | | | | | | $ | 441,906,359 | | | | | | | $ | 126,777,955 | |
| | | | | | | | | | | | | | | | |
Undistributed net investment income | | | | | | $ | 863,721 | | | | | | | $ | 377,378 | |
| | | | | | | | | | | | | | | | |
The accompanying notes are an integral part of these financial statements.
| | | | | | |
| Financial Highlights | | Wells Fargo Advantage Large Company Value Fund | | | 15 | |
(For a share outstanding throughout each period)
| | | | | | | | | | | | | | | | | | | | |
| | | Six Months Ended
January 31, 2012 (Unaudited) | | | Year Ended July 31, | |
| Class A | | | 2011 | | | 2010 | | | 2009 | | | 20081 | |
Net asset value, beginning of period | | $ | 12.61 | | | $ | 11.04 | | | $ | 9.84 | | | $ | 14.43 | | | $ | 14.92 | |
Net investment income | | | 0.06 | 2 | | | 0.12 | | | | 0.09 | | | | 0.17 | 2 | | | 0.08 | 2 |
Net realized and unrealized gains (losses) on investments | | | (0.09 | ) | | | 1.51 | | | | 1.21 | | | | (3.39 | ) | | | (0.51 | ) |
| | | | | | | | | | | | | | | | | | | | |
Total from investment operations | | | (0.03 | ) | | | 1.63 | | | | 1.30 | | | | (3.22 | ) | | | (0.43 | ) |
Distributions to shareholders from | | | | | | | | | | | | | | | | | | | | |
Net investment income | | | (0.08 | ) | | | (0.06 | ) | | | (0.10 | ) | | | (0.24 | ) | | | (0.06 | ) |
Net realized gains | | | 0.00 | | | | 0.00 | | | | 0.00 | | | | (1.13 | ) | | | 0.00 | |
| | | | | | | | | | | | | | | | | | | | |
Total distributions to shareholders | | | (0.08 | ) | | | (0.06 | ) | | | (0.10 | ) | | | (1.37 | ) | | | (0.06 | ) |
Net asset value, end of period | | | $12.50 | | | | $12.61 | | | | $11.04 | | | | $ 9.84 | | | | $14.43 | |
Total return3 | | | (0.09 | )% | | | 14.77 | % | | | 13.22 | % | | | (21.52 | )% | | | (2.92 | )% |
Ratios to average net assets (annualized) | | | | | | | | | | | | | | | | | | | | |
Gross expenses | | | 1.27 | % | | | 1.32 | % | | | 1.42 | % | | | 1.52 | % | | | 1.37 | % |
Net expenses | | | 1.10 | % | | | 1.25 | % | | | 1.25 | % | | | 1.23 | % | | | 1.25 | % |
Net investment income | | | 1.07 | % | | | 0.74 | % | | | 0.74 | % | | | 1.85 | % | | | 1.55 | % |
Supplemental data | | | | | | | | | | | | | | | | | | | | |
Portfolio turnover rate | | | 18 | % | | | 35 | % | | | 42 | % | | | 61 | % | | | 71 | % |
Net assets, end of period (000’s omitted) | | | $107,043 | | | | $642 | | | | $362 | | | | $165 | | | | $14 | |
| 1. | For the period from March 31, 2008 (commencement of class operations) to July 31, 2008. |
| 2. | Calculated based upon average shares outstanding. |
| 3. | Total return calculations do not include any sales charges. Returns for periods of less than one year are not annualized. |
The accompanying notes are an integral part of these financial statements.
| | | | |
| 16 | | Wells Fargo Advantage Large Company Value Fund | | Financial Highlights |
(For a share outstanding throughout each period)
| | | | | | | | | | | | | | | | | | | | |
| | | Six Months Ended
January 31, 2012 (Unaudited) | | | Year Ended July 31, | |
| Class C | | | 2011 | | | 2010 | | | 2009 | | | 20081 | |
Net asset value, beginning of period | | $ | 12.81 | | | $ | 11.26 | | | $ | 10.03 | | | $ | 14.66 | | | $ | 15.17 | |
Net investment income | | | 0.04 | | | | 0.01 | | | | 0.03 | | | | 0.06 | 2 | | | 0.04 | 2 |
Net realized and unrealized gains (losses) on investments | | | (0.11 | ) | | | 1.55 | | | | 1.22 | | | | (3.40 | ) | | | (0.52 | ) |
| | | | | | | | | | | | | | | | | | | | |
Total from investment operations | | | (0.07 | ) | | | 1.56 | | | | 1.25 | | | | (3.34 | ) | | | (0.48 | ) |
Distributions to shareholders from | | | | | | | | | | | | | | | | | | | | |
Net investment income | | | (0.00 | )2 | | | (0.01 | ) | | | (0.02 | ) | | | (0.16 | ) | | | (0.03 | ) |
Net realized gains | | | 0.00 | | | | 0.00 | | | | 0.00 | | | | (1.13 | ) | | | 0.00 | |
| | | | | | | | | | | | | | | | | | | | |
Total distributions to shareholders | | | (0.00 | )2 | | | (0.01 | ) | | | (0.02 | ) | | | (1.29 | ) | | | (0.03 | ) |
Net asset value, end of period | | $ | 12.74 | | | $ | 12.81 | | | $ | 11.26 | | | $ | 10.03 | | | $ | 14.66 | |
Total return3 | | | (0.50 | )% | | | 13.85 | % | | | 12.47 | % | | | (22.07 | )% | | | (3.17 | )% |
Ratios to average net assets (annualized) | | | | | | | | | | | | | | | | | | | | |
Gross expenses | | | 2.02 | % | | | 2.08 | % | | | 2.17 | % | | | 2.23 | % | | | 2.12 | % |
Net expenses | | | 1.85 | % | | | 2.00 | % | | | 2.00 | % | | | 1.97 | % | | | 2.00 | % |
Net investment income | | | 0.34 | % | | | 0.04 | % | | | 0.02 | % | | | 0.69 | % | | | 0.78 | % |
Supplemental data | | | | | | | | | | | | | | | | | | | | |
Portfolio turnover rate | | | 18 | % | | | 35 | % | | | 42 | % | | | 61 | % | | | 71 | % |
Net assets, end of period (000’s omitted) | | | $4,160 | | | | $513 | | | | $438 | | | | $274 | | | | $10 | |
| 1. | For the period from March 31, 2008 (commencement of class operations) to July 31, 2008. |
| 2. | Calculated based upon average shares outstanding. |
| 3. | Total return calculations do not include any sales charges. Returns for periods of less than one year are not annualized. |
The accompanying notes are an integral part of these financial statements.
| | | | | | |
| Financial Highlights | | Wells Fargo Advantage Large Company Value Fund | | | 17 | |
(For a share outstanding throughout each period)
| | | | | | | | | | | | | | | | | | | | | | | | |
| | | Six Months Ended
January 31, 2012 (Unaudited) | | | Year Ended July 31, | |
| Administrator Class | | | 2011 | | | 2010 | | | 2009 | | | 2008 | | | 2007 | |
Net asset value, beginning of period | | $ | 12.68 | | | $ | 11.08 | | | $ | 9.87 | | | $ | 14.43 | | | $ | 17.09 | | | $ | 16.76 | |
Net investment income | | | 0.08 | 1 | | | 0.11 | | | | 0.12 | 1 | | | 0.31 | 1 | | | 0.33 | 1 | | | 0.38 | 1 |
Net realized and unrealized gains (losses) on investments | | | (0.09 | ) | | | 1.56 | | | | 1.22 | | | | (3.49 | ) | | | (1.46 | ) | | | 1.51 | |
| | | | | | | | | | | | | | | | | | | | | | | | |
Total from investment operations | | | (0.01 | ) | | | 1.67 | | | | 1.34 | | | | (3.18 | ) | | | (1.13 | ) | | | 1.89 | |
Distributions to shareholders from | | | | | | | | | | | | | | | | | | | | | | | | |
Net investment income | | | (0.11 | ) | | | (0.07 | ) | | | (0.13 | ) | | | (0.25 | ) | | | (0.34 | ) | | | (0.38 | ) |
Net realized gains | | | 0.00 | | | | 0.00 | | | | 0.00 | | | | (1.13 | ) | | | (1.19 | ) | | | (1.18 | ) |
| | | | | | | | | | | | | | | | | | | | | | | | |
Total distributions to shareholders | | | (0.11 | ) | | | (0.07 | ) | | | (0.13 | ) | | | (1.38 | ) | | | (1.53 | ) | | | (1.56 | ) |
Net asset value, end of period | | | $12.56 | | | | $12.68 | | | | $11.08 | | | | $ 9.87 | | | | $14.43 | | | | $17.09 | |
Total return2 | | | (0.02 | )% | | | 15.12 | % | | | 13.53 | % | | | (21.20 | )% | | | (7.48 | )% | | | 11.45 | % |
Ratios to average net assets (annualized) | | | | | | | | | | | | | | | | | | | | | | | | |
Gross expenses | | | 1.11 | % | | | 1.17 | % | | | 1.24 | % | | | 1.30 | % | | | 1.21 | % | | | 1.24 | % |
Net expenses | | | 0.85 | % | | | 0.96 | % | | | 0.96 | % | | | 0.95 | % | | | 0.96 | % | | | 0.96 | % |
Net investment income | | | 1.32 | % | | | 1.93 | % | | | 1.12 | % | | | 2.56 | % | | | 2.05 | % | | | 2.16 | % |
Supplemental data | | | | | | | | | | | | | | | | | | | | | | | | |
Portfolio turnover rate | | | 18 | % | | | 35 | % | | | 42 | % | | | 61 | % | | | 71 | % | | | 18 | % |
Net assets, end of period (000’s omitted) | | | $190,333 | | | | $667 | | | | $289 | | | | $185 | | | | $2,405 | | | | $3,489 | |
| 1. | Calculated based upon average shares outstanding. |
| 2. | Returns for periods of less than one year are not annualized. |
The accompanying notes are an integral part of these financial statements.
| | | | |
| 18 | | Wells Fargo Advantage Large Company Value Fund | | Financial Highlights |
(For a share outstanding throughout each period)
| | | | | | | | | | | | | | | | | | | | |
| | | Six Months Ended
January 31, 2012 (Unaudited) | | | Year Ended July 31, | |
| Institutional Class | | | 2011 | | | 2010 | | | 2009 | | | 20081 | |
Net asset value, beginning of period | | $ | 12.68 | | | $ | 11.08 | | | $ | 9.86 | | | $ | 14.43 | | | $ | 14.92 | |
Net investment income | | | 0.10 | | | | 0.14 | | | | 0.14 | | | | 0.26 | 2 | | | 0.10 | 2 |
Net realized and unrealized gains (losses) on investments | | | (0.11 | ) | | | 1.54 | | | | 1.23 | | | | (3.42 | ) | | | (0.52 | ) |
| | | | | | | | | | | | | | | | | | | | |
Total from investment operations | | | (0.01 | ) | | | 1.68 | | | | 1.37 | | | | (3.16 | ) | | | (0.42 | ) |
Distributions to shareholders from | | | | | | | | | | | | | | | | | | | | |
Net investment income | | | (0.13 | ) | | | (0.08 | ) | | | (0.15 | ) | | | (0.28 | ) | | | (0.07 | ) |
Net realized gains | | | 0.00 | | | | 0.00 | | | | 0.00 | | | | (1.13 | ) | | | 0.00 | |
| | | | | | | | | | | | | | | | | | | | |
Total distributions to shareholders | | | (0.13 | ) | | | (0.08 | ) | | | (0.15 | ) | | | (1.41 | ) | | | (0.07 | ) |
Net asset value, end of period | | $ | 12.54 | | | $ | 12.68 | | | $ | 11.08 | | | $ | 9.86 | | | $ | 14.43 | |
Total return3 | | | 0.08 | % | | | 15.36 | % | | | 13.76 | % | | | (21.07 | )% | | | (2.82 | )% |
Ratios to average net assets (annualized) | | | | | | | | | | | | | | | | | | | | |
Gross expenses | | | 0.85 | % | | | 0.89 | % | | | 0.96 | % | | | 1.06 | % | | | 0.91 | % |
Net expenses | | | 0.66 | % | | | 0.75 | % | | | 0.75 | % | | | 0.75 | % | | | 0.75 | % |
Net investment income | | | 1.67 | % | | | 1.12 | % | | | 1.28 | % | | | 2.64 | % | | | 2.02 | % |
Supplemental data | | | | | | | | | | | | | | | | | | | | |
Portfolio turnover rate | | | 18 | % | | | 35 | % | | | 42 | % | | | 61 | % | | | 71 | % |
Net assets, end of period (000’s omitted) | | | $16,178 | | | | $14,401 | | | | $9 | | | | $8 | | | | $10 | |
| 1. | For the period from March 31, 2008 (commencement of class operations) to July 31, 2008. |
| 2. | Calculated based upon average shares outstanding. |
| 3. | Returns for periods of less than one year are not annualized. |
The accompanying notes are an integral part of these financial statements.
| | | | | | |
| Financial Highlights | | Wells Fargo Advantage Large Company Value Fund | | | 19 | |
(For a share outstanding throughout each period)
| | | | | | | | | | | | | | | | | | | | | | | | |
| | | Six Months Ended
January 31, 2012 (Unaudited) | | | Year Ended July 31, | |
| Investor Class | | | 2011 | | | 2010 | | | 2009 | | | 2008 | | | 2007 | |
Net asset value, beginning of period | | $ | 12.89 | | | $ | 11.28 | | | $ | 10.05 | | | $ | 14.67 | | | $ | 17.35 | | | $ | 16.99 | |
Net investment income | | | 0.07 | | | | 0.09 | | | | 0.08 | | | | 0.21 | 1 | | | 0.28 | 1 | | | 0.29 | 1 |
Net realized and unrealized gains (losses) on investments | | | (0.11 | ) | | | 1.57 | | | | 1.23 | | | | (3.48 | ) | | | (1.50 | ) | | | 1.56 | |
| | | | | | | | | | | | | | | | | | | | | | | | |
Total from investment operations | | | (0.04 | ) | | | 1.66 | | | | 1.31 | | | | (3.27 | ) | | | (1.22 | ) | | | 1.85 | |
Distributions to shareholders from | | | | | | | | | | | | | | | | | | | | | | | | |
Net investment income | | | (0.06 | ) | | | (0.05 | ) | | | (0.08 | ) | | | (0.22 | ) | | | (0.27 | ) | | | (0.31 | ) |
Net realized gains | | | 0.00 | | | | 0.00 | | | | 0.00 | | | | (1.13 | ) | | | (1.19 | ) | | | (1.18 | ) |
| | | | | | | | | | | | | | | | | | | | | | | | |
Total distributions to shareholders | | | (0.06 | ) | | | (0.05 | ) | | | (0.08 | ) | | | (1.35 | ) | | | (1.46 | ) | | | (1.49 | ) |
Net asset value, end of period | | | $12.79 | | | | $12.89 | | | | $11.28 | | | | $10.05 | | | | $14.67 | | | | $17.35 | |
Total return2 | | | (0.23 | )% | | | 14.75 | % | | | 13.06 | % | | | (21.53 | )% | | | (7.84 | )% | | | 11.04 | % |
Ratios to average net assets (annualized) | | | | | | | | | | | | | | | | | | | | | | | | |
Gross expenses | | | 1.35 | % | | | 1.40 | % | | | 1.52 | % | | | 1.63 | % | | | 1.52 | % | | | 1.51 | % |
Net expenses | | | 1.19 | % | | | 1.32 | % | | | 1.35 | % | | | 1.35 | % | | | 1.37 | % | | | 1.37 | % |
Net investment income | | | 1.14 | % | | | 0.74 | % | | | 0.70 | % | | | 2.05 | % | | | 1.71 | % | | | 1.62 | % |
Supplemental data | | | | | | | | | | | | | | | | | | | | | | | | |
Portfolio turnover rate | | | 18 | % | | | 35 | % | | | 42 | % | | | 61 | % | | | 71 | % | | | 18 | % |
Net assets, end of period (000’s omitted) | | | $124,193 | | | | $110,554 | | | | $108,703 | | | | $106,931 | | | | $151,546 | | | | $196,291 | |
| 1. | Calculated based upon average shares outstanding. |
| 2. | Returns for periods of less than one year are not annualized. |
The accompanying notes are an integral part of these financial statements.
| | | | |
| 20 | | Wells Fargo Advantage Large Company Value Fund | | Notes to Financial Statements (Unaudited) |
1. ORGANIZATION
Wells Fargo Funds Trust (the “Trust”), a Delaware statutory trust organized on March 10, 1999, is an open-end management investment company registered under the Investment Company Act of 1940, as amended (the “1940 Act”). These financial statements report on Wells Fargo Advantage Large Company Value Fund (the “Fund”) which is a diversified series of the Trust.
2. SIGNIFICANT ACCOUNTING POLICIES
The following significant accounting policies, which are consistently followed in the preparation of the financial statements of the Fund, are in conformity with U.S. generally accepted accounting principles which require management to make estimates and assumptions that affect the reported amounts of assets and liabilities, disclosure of contingent assets and liabilities at the date of the financial statements, and the reported amounts of revenues and expenses during the reporting period. Actual results could differ from those estimates.
Securities valuation
Investments in equity securities are valued each business day as of the close of regular trading on the New York Stock Exchange, which is usually 4:00 p.m. (Eastern Time). Securities which are traded on a national or foreign securities exchange are valued at the last reported sales price, except that securities listed on The Nasdaq Stock Market, Inc. (“Nasdaq”) are valued at the Nasdaq Official Closing Price (“NOCP”), and if no NOCP is available, then at the last reported sales price. If no sales price is shown on the Nasdaq, the bid price will be used. In the absence of any sale of securities listed on the Nasdaq, and in the case of other securities (including U.S. Government obligations, but excluding debt securities maturing in 60 days or less), the price will be deemed “stale” and the valuations will be determined in accordance with the Fund’s Fair Value Procedures.
Investments in open-end mutual funds and non-registered investment companies are generally valued at net asset value.
Investments which are not valued using any of the methods discussed above, are valued at their fair value, as determined by procedures established in good faith and approved by the Board of Trustees.
Security loans
The Fund may lend its securities from time to time in order to earn additional income in the form of fees or interest on securities received as collateral or the investment of any cash received as collateral. The Fund continues to receive interest or dividends on the securities loaned. The Fund receives collateral in the form of cash or securities with a value at least equal to the value of the securities on loan. The value of the loaned securities is determined at the close of each business day and any additional required collateral is delivered to the Fund on the next business day. In a securities lending transaction, the net asset value of the Fund will be affected by an increase or decrease in the value of the securities loaned and by an increase or decrease in the value of the instrument in which collateral is invested. The amount of securities lending activity undertaken by the Fund fluctuates from time to time. In the event of default or bankruptcy by the borrower, the Fund may be prevented from recovering the loaned securities or gaining access to the collateral or may experience delays or costs in doing so. In addition, the investment of any cash collateral received may lose all or part of its value. The Fund has the right under the lending agreement to recover the securities from the borrower on demand.
The Fund lends its securities through an unaffiliated securities lending agent. Cash collateral received in connection with its securities lending transactions is invested in Wells Fargo Securities Lending Cash Investments, LLC (the “Cash Collateral Fund”). The Cash Collateral Fund is exempt from registration under Section 3(c)(7) of the 1940 Act and is managed by Wells Fargo Funds Management LLC (“Funds Management”) and is sub-advised by Wells Capital Management Incorporated (“Wells Capital Management”). Funds Management receives an advisory fee starting at 0.05% and declining to 0.01% as the average daily net assets of the Cash Collateral Fund increase. All of the fees received by Funds Management are paid to Wells Capital Management for its services as sub-adviser. The Cash Collateral Fund seeks to provide a positive return compared to the daily Fed Funds Open rate by investing in high-quality, U.S. dollar-denominated short-term money market instruments. Cash Collateral Fund investments are fair valued based upon the amortized cost valuation technique. Income earned from investment in the Cash Collateral Fund is included in securities lending income on the Statement of Operations.
For Wells Fargo Advantage Funds that participated in securities lending activity prior to February 13, 2009, certain structured investment vehicles purchased in a joint account by the former securities lending agent defaulted or were
| | | | | | |
| Notes to Financial Statements (Unaudited) | | Wells Fargo Advantage Large Company Value Fund | | | 21 | |
impaired. Certain of the Wells Fargo Advantage Funds still hold ownership interest in these structured investment vehicles, which have since been restructured as pass-through securities. If the Fund holds an ownership interest in such pass-through securities, information regarding this ownership interest can be found in the Portfolio of Investments under the category “Other”.
Security transactions and income recognition
Securities transactions are recorded on a trade date basis. Realized gains or losses are reported on the basis of identified cost of securities delivered.
Dividend income is recognized on the ex-dividend date, except for certain dividends from foreign securities, which are recorded as soon as the Fund is informed of the ex-dividend date. Dividend income from foreign securities is recorded net of foreign taxes withheld where recovery of such taxes is not assured.
Distributions to shareholders
Distributions to shareholders from net investment income and net realized gains, if any, are recorded on the ex-dividend date. Such distributions are determined in conformity with income tax regulations, which may differ from generally accepted accounting principles.
Federal and other taxes
The Fund intends to continue to qualify as a regulated investment company by distributing substantially all of its investment company taxable income and any net realized capital gains (after reduction for capital loss carryforwards) sufficient to relieve it from all, or substantially all, federal income taxes. Accordingly, no provision for federal income taxes was required.
The Fund’s income and federal excise tax returns and all financial records supporting those returns for the prior three fiscal years are subject to examination by the federal and Delaware revenue authorities.
Under the recently enacted Regulated Investment Company Modernization Act of 2010, the Fund is permitted to carry forward capital losses incurred in taxable years which began after December 22, 2010 for an unlimited period. However, any losses incurred are required to be utilized prior to the losses incurred in pre-enactment taxable years. As a result of this ordering rule, pre-enactment capital loss carryforwards may be more likely to expire unused. Additionally, post-enactment capital losses that are carried forward will retain their character as either short-term or long-term capital losses rather than being considered all short-term as under previous law.
As of July 31, 2011, the Fund had net capital loss carryforwards, which were available to offset future net realized capital gains, in the amount of $17,119,743 with $7,073,671 expiring in 2017 and $10,046,072 expiring in 2018.
Class allocations
The separate classes of shares offered by the Fund differ principally in applicable sales charges, distribution, shareholder servicing and administration fees. Shareholders of each class bear certain expenses that pertain to that particular class. All shareholders bear the common expenses of the Fund, earn income from the portfolio, and are allocated unrealized gains and losses pro rata based on the average daily net assets of each class, without distinction between share classes. Dividends are determined separately for each class based on income and expenses allocable to each class. Realized gains and losses are allocated to each class pro rata based upon the net assets of each class on the date realized. Differences in per share dividend rates generally result from the relative weightings of pro rata income and realized gain allocations and from differences in separate class expenses, including distribution, shareholder servicing and administration fees.
3. FAIR VALUATION MEASUREMENTS
Fair value measurements of investments are determined within a framework that has established a fair value hierarchy based upon the various data inputs utilized in determining the value of the Fund’s investments. The three-level hierarchy gives the highest priority to unadjusted quoted prices in active markets for identical assets or liabilities (Level 1) and the lowest priority to significant unobservable inputs (Level 3). The Fund’s investments are classified within the fair value hierarchy based on the lowest level of input that is significant to the fair value measurement. The inputs are summarized into three broad levels as follows:
| n | | Level 1 – quoted prices in active markets for identical securities |
| | | | |
| 22 | | Wells Fargo Advantage Large Company Value Fund | | Notes to Financial Statements (Unaudited) |
| n | | Level 2 – other significant observable inputs (including quoted prices for similar securities, interest rates, prepayment speeds, credit risk, etc.) |
| n | | Level 3 – significant unobservable inputs (including the Fund’s own assumptions in determining the fair value of investments) |
The inputs or methodologies used for valuing securities are not necessarily an indication of the risk associated with investing in those securities.
As of January 31, 2012, the inputs used in valuing the Fund’s assets, which are carried at fair value, were as follows:
| | | | | | | | | | | | | | | | |
| Investments in Securities | | Quoted Prices (Level 1) | | | Significant Other
Observable Inputs (Level 2) | | | Significant Unobservable Inputs (Level 3) | | | Total | |
Equity securities | | | | | | | | | | | | | | | | |
Common stocks | | $ | 427,992,780 | | | $ | 0 | | | $ | 0 | | | $ | 427,992,780 | |
Other | | | 0 | | | | 0 | | | | 485,909 | | | | 485,909 | |
Short-term investments | | | | | | | | | | | | | | | | |
Investment companies | | | 6,210,669 | | | | 38,272,387 | | | | 0 | | | | 44,483,056 | |
| | | $ | 434,203,449 | | | $ | 38,272,387 | | | $ | 485,909 | | | $ | 472,961,745 | |
Further details on the major security types listed above can be found in the Portfolio of Investments.
Transfers in and transfers out are recognized at the end of the reporting period. For the six months ended January 31, 2012, the Fund did not have any significant transfers into/out of Level 1 and Level 2.
The following is a reconciliation of assets in which significant unobservable inputs (Level 3) were used in determining fair value:
| | | | |
| | | Other | |
Balance as of July 31, 2011 | | $ | 258,422 | |
Accrued discounts (premiums) | | | 0 | |
Realized gains (losses) | | | 0 | |
Change in unrealized gains (losses) | | | (120,502 | ) |
Purchases | | | 0 | |
Sales | | | (67,911 | ) |
Transfers into Level 3 | | | 0 | |
Transfers out of Level 3 | | | 0 | |
Transfers in from acquisition | | | 415,900 | |
Balance as of January 31, 2012 | | $ | 485,909 | |
Change in unrealized gains (losses) relating to securities still held at January 31, 2012 | | $ | (162,044 | ) |
4. TRANSACTIONS WITH AFFILIATES AND OTHER EXPENSES
Advisory fee
The Trust has entered into an advisory contract with Funds Management, an indirect wholly owned subsidiary of Wells Fargo & Company (“Wells Fargo”). The adviser is responsible for implementing investment policies and guidelines and for supervising the sub-adviser, who is responsible for day-to-day portfolio management of the Fund.
Pursuant to the contract, Funds Management is entitled to receive an annual advisory fee starting at 0.65% and declining to 0.55% as the average daily net assets of the Fund increase. For the six months ended January 31, 2012, the advisory fee was equivalent to an annual rate of 0.65% of the Fund’s average daily net assets.
Funds Management may retain the services of certain sub-advisers to provide daily portfolio management to the Fund. The fees related to sub-advisory services are borne directly by Funds Management and do not increase the overall fees paid by the Fund. Phocas Financial Corporation is the sub-adviser to the Fund and is entitled to receive a fee from Funds Management at an annual rate starting at 0.29% and declining to 0.20% as the average daily net assets of the Fund increase.
| | | | | | |
| Notes to Financial Statements (Unaudited) | | Wells Fargo Advantage Large Company Value Fund | | | 23 | |
Administration and transfer agent fees
The Trust has entered into an administration agreement with Funds Management. Under this agreement, for providing administrative services, which includes paying fees and expenses for services provided by the transfer agent, sub-transfer agents, omnibus account servicers and record-keepers, Funds Management is entitled to receive from the Fund an annual fund level administration fee starting at 0.05% and declining to 0.03% as the average daily net assets of the Fund increase and a class level administration fee which is calculated based on the average daily net assets of each class as follows:
| | | | |
| | | Class Level Administration Fee | |
Class A, Class C | | | 0.26 | % |
Administrator Class | | | 0.10 | |
Institutional Class | | | 0.08 | |
Investor Class | | | 0.33 | |
Funds Management has contractually waived and/or reimbursed advisory and administration fees to the extent necessary to maintain certain net operating expense ratios for the Fund. Waiver of fees and/or reimbursement of expenses by Funds Management were made first from fund level expenses on a proportionate basis and then from class specific expenses. Funds Management has committed through July 18, 2013, to waive fees and/or reimburse expenses to the extent necessary to cap the Fund’s expenses at 1.10% for Class A, 1.85% for Class C, 0.85% for Administrator Class, 0.65 for Institutional Class and 1.17% for Investor Class.
Distribution fees
The Trust has adopted a Distribution Plan for Class C shares of the Fund pursuant to Rule 12b-1 under the 1940 Act. Distribution fees are charged to Class C shares and paid to Wells Fargo Funds Distributor, LLC, the principal underwriter, at an annual rate of 0.75% its average daily net assets.
For the six months ended January 31, 2012, Wells Fargo Funds Distributor, LLC received $1,533 from the sale of Class A shares.
Shareholder servicing fees
The Trust has entered into contracts with one or more shareholder servicing agents, whereby Class A, Class C, Administrator Class and Investor Class of the Fund is charged a fee at an annual rate of 0.25% of the average daily net assets of each respective class.
A portion of these total shareholder servicing fees were paid to affiliates of Wells Fargo.
5. INVESTMENT PORTFOLIO TRANSACTIONS
Purchases and sales of investments, excluding U.S. Government obligations (if any) and short-term securities (securities with maturities of one year or less at purchase date), for the six months ended January 31, 2012, were $68,649,481 and $104,187,548, respectively.
6. ACQUISITION
After the close of business on August 26, 2011, the Fund acquired the net assets of Wells Fargo Advantage Disciplined Value Fund. The purpose of the transaction was to combine two funds with similar investment objectives and strategies. Shareholders holding Class A, Class C Administrator Class, Institutional Class and Investor Class shares of Wells Fargo Advantage Disciplined Value Fund received Class A, Class C, Administrator Class, Institutional Class and Investor Class shares, respectively, of the Fund in the reorganization. The acquisition was accomplished by a tax-free exchange of all the shares of Wells Fargo Advantage Disciplined Value fund for 27,797,625 shares of the Fund valued at $315,475,765 at an exchange ratio of 1.00, 0.97, 0.99, 0.99 and 0.97 for Class A, Class C, Administrator Class, Institutional Class and Investor Class, respectively. The investment portfolio of Wells Fargo Advantage Disciplined Value Fund with a fair value of $310,613,015, identified cost of $304,030,365 and unrealized appreciation of $6,582,650 at August 26, 2011 were the principal assets acquired by the Fund. The aggregated net assets of Wells Fargo Advantage Disciplined Value Fund and the Fund immediately prior to the acquisition were $315,475,765 and $113,518,809, respectively. The aggregate net assets of the Fund immediately after the acquisition were $428,994,574. For financial reporting purposes, assets received and shares issued by the Fund were recorded at fair value; however, the cost basis of the investments received from Wells
| | | | |
| 24 | | Wells Fargo Advantage Large Company Value Fund | | Notes to Financial Statements (Unaudited) |
Fargo Advantage Disciplined Value Fund was carried forward to align ongoing reporting of the Fund’s realized and unrealized gains and losses with amounts distributable to shareholders for tax purposes.
Assuming the acquisition had been completed August 1, 2011 the beginning of the reporting period for the Fund, the pro forma results of operations for the six months ended January 31, 2012 would have been:
| | | | |
Net investment income | | $ | 3,070,755 | |
Net realized and unrealized losses on investments | | $ | (9,290,220 | ) |
Net decrease in net assets resulting from operations | | $ | (6,219,465 | ) |
Because the combined investment portfolios have been managed as a single integrated portfolio since the acquisition was completed, it is not practicable to separate the amounts of revenue and earnings of Wells Fargo Advantage Disciplined Value Fund that have been included in the Fund’s Statement of Operations since August 29, 2011.
7. BANK BORROWINGS
The Trust (excluding the money market funds) and Wells Fargo Variable Trust are parties to a $150,000,000 revolving credit agreement with State Street Bank and Trust Company, whereby the Fund is permitted to use bank borrowings for temporary or emergency purposes, such as to fund shareholder redemption requests. Interest under the credit agreement is charged to the Fund based on a borrowing rate equal to the higher of the Federal Funds rate in effect on that day plus 1.25% or the overnight LIBOR rate in effect on that day plus 1.25%. In addition, an annual commitment fee equal to 0.10% of the unused balance is allocated to each participating fund. Prior to September 6, 2011, the revolving credit agreement was for $125,000,000 and the annual commitment fee was equal 0.125% of the unused balance. For the six months ended January 31, 2012, the Fund paid $119 in commitment fees.
For the six months ended January 31, 2012, there were no borrowings by the Fund under the agreement.
8. INDEMNIFICATION
Under the Trust’s organizational documents, the officers and directors are indemnified against certain liabilities that may arise out of performance of their duties to the Trust. Additionally, in the normal course of business, the Trust may enter into contracts with service providers that contain a variety of indemnification clauses. The Trust’s maximum exposure under these arrangements is dependent on future claims that may be made against the Fund and, therefore, cannot be estimated.
9. NEW ACCOUNTING PRONOUNCEMENTS
In May 2011, the Financial Accounting Standards Board (“FASB”) issued Accounting Standards Update (“ASU”) No. 2011-04 “Amendments to Achieve Common Fair Value Measurement and Disclosure Requirements in U.S. GAAP and IFRSs”. ASU No. 2011-04 amends FASB ASC Topic 820, Fair Value Measurements and Disclosures, to establish common requirements for measuring fair value and for disclosing information about fair value measurements in accordance with GAAP. The ASU is effective prospectively for interim and annual periods beginning after December 15, 2011. Management expects that adoption of the ASU will result in additional disclosures in the financial statements, as applicable.
In April 2011, FASB issued ASU No. 2011-03 “Reconsideration of Effective Control for Repurchase Agreements”. ASU No. 2011-03 amends FASB ASC Topic 860, Transfers and Servicing, specifically the criteria required to determine whether a repurchase agreement (repo) and similar agreements should be accounted for as sales of financial assets or secured borrowings with commitments. ASU No. 2011-03 changes the assessment of effective control by focusing on the transferor’s contractual rights and obligations and removing the criterion to assess its ability to exercise those rights or honor those obligations. This could result in changes to the way entities account for certain transactions including repurchase agreements, mortgage dollar rolls and reverse repurchase agreements. The ASU will become effective on a prospective basis for new transfers and modifications to existing transactions as of the beginning of the first interim or annual period beginning on or after December 15, 2011. Management has evaluated the impact of adopting the ASU and expects no significant changes.
| | | | | | |
| Notes to Financial Statements (Unaudited) | | Wells Fargo Advantage Large Company Value Fund | | | 25 | |
10. SUBSEQUENT DISTRIBUTIONS
On March 26, 2012, the Fund declared distributions from net investment income to shareholders of record on March 23, 2012. The per share amounts payable on March 27, 2012 were as follows:
| | | | |
| | | Net
Investment
Income | |
Class A | | $ | 0.05641 | |
Class C | | | 0.03492 | |
Administrator Class | | | 0.06324 | |
Institutional Class | | | 0.06888 | |
Investor Class | | | 0.05414 | |
These distributions are not reflected in the accompanying financial statements.
| | | | |
| 26 | | Wells Fargo Advantage Large Company Value Fund | | Other Information (Unaudited) |
PROXY VOTING INFORMATION
A description of the policies and procedures that the Fund uses to determine how to vote proxies relating to portfolio securities is available without charge, upon request, by calling 1-800-222-8222, visiting our Web site at wellsfargoadvantagefunds.com, or visiting the SEC Web site at sec.gov. Information regarding how the Fund voted proxies relating to portfolio securities during the most recent 12-month period ended June 30 is available without charge on the Fund’s Web site at wellsfargoadvantagefunds.com or by visiting the SEC Web site at sec.gov.
PORTFOLIO HOLDINGS INFORMATION
The complete portfolio holdings for the Fund are publicly available on the Fund’s Web site (wellsfargoadvantagefunds.com) on a monthly, 30-day or more delayed basis. In addition, top ten holdings information for the Fund is publicly available on the Fund’s Web site on a monthly, seven-day or more delayed basis. The Fund files its complete schedule of portfolio holdings with the SEC for the first and third quarters of each fiscal year on Form N-Q, which is available without charge by visiting the SEC Web site at sec.gov. In addition, the Fund’s Form N-Q may be reviewed and copied at the SEC’s Public Reference Room in Washington, DC, and at regional offices in New York City, at 233 Broadway, and in Chicago, at 175 West Jackson Boulevard, Suite 900. Information about the Public Reference Room may be obtained by calling 1-800-SEC-0330.
| | | | | | |
| Other Information (Unaudited) | | Wells Fargo Advantage Large Company Value Fund | | | 27 | |
BOARD OF TRUSTEES
The following table provides basic information about the Board of Trustees (the “Trustees”) of the Trust and Officers of the Trust. This table should be read in conjunction with the Prospectus and the Statement of Additional Information1 of the Fund. Each of the Trustees and Officers listed below acts in identical capacities for the Wells Fargo Advantage family of funds, which consists of 137 funds comprising the Wells Fargo Funds Trust, Wells Fargo Variable Trust, Wells Fargo Master Trust and four closed-end funds (collectively the “Fund Complex”). All of the Trustees are also Members of the Audit and Governance Committees of each Trust in the Fund Complex. The mailing address of each Trustee and Officer is 525 Market Street, 12th Floor, San Francisco, CA 94105. Each Trustee and Officer serves an indefinite term, however, each Trustee serves such term until reaching the mandatory retirement age established by the Trustees.
Independent Trustees
| | | | | | |
Name and Year of Birth | | Position Held and Length of Service | | Principal Occupations During Past Five Years | | Other Directorships During
Past Five Years |
Peter G. Gordon
(Born 1942) | | Trustee, since 1998; Chairman, since 2005 (Lead Trustee since 2001) | | Co-Founder, Retired Chairman, President and CEO of Crystal Geyser Water Company. Trustee Emeritus, Colby College | | Asset Allocation Trust |
Isaiah Harris, Jr.
(Born 1952) | | Trustee, since 2009 | | Retired. Prior thereto, President and CEO of BellSouth Advertising and Publishing Corp. from 2005 to 2007, President and CEO of BellSouth Enterprises from 2004 to 2005 and President of BellSouth Consumer Services from 2000 to 2003. Emeritus member of the Iowa State University Foundation Board of Governors. Emeritus Member of the Advisory Board of Iowa State University School of Business. Mr. Harris is a certified public accountant. | | CIGNA Corporation; Deluxe Corporation; Asset Allocation Trust |
Judith M. Johnson
(Born 1949) | | Trustee, since 2008 | | Retired. Prior thereto, Chief Executive Officer and Chief Investment Officer of Minneapolis Employees Retirement Fund from 1996 to 2008. Ms. Johnson is an attorney, certified public accountant and a certified managerial accountant. | | Asset Allocation Trust |
Leroy Keith, Jr.
(Born 1939) | | Trustee, since 2010 | | Chairman, Bloc Global Services (development and construction). Trustee of the Evergreen Funds from 1983 to 2010. Former Managing Director, Almanac Capital Management (commodities firm), former Partner, Stonington Partners, Inc. (private equity fund), former Director, Obagi Medical Products Co. and former Director, Lincoln Educational Services. | | Trustee, Virtus Fund Complex (consisting of 40 portfolios as of 12/31/11); Asset Allocation Trust |
David F. Larcker
(Born 1950) | | Trustee, since 2009 | | James Irvin Miller Professor of Accounting at the Graduate School of Business, Stanford University, Director of Corporate Governance Research Program and Senior Faculty of The Rock Center for Corporate Governance since 2006. From 2005 to 2008, Professor of Accounting at the Graduate School of Business, Stanford University. Prior thereto, Ernst & Young Professor of Accounting at The Wharton School, University of Pennsylvania from 1985 to 2005. | | Asset Allocation Trust |
Olivia S. Mitchell
(Born 1953) | | Trustee, since 2006 | | International Foundation of Employee Benefit Plans Professor, Wharton School of the University of Pennsylvania since 1993. Director of Wharton’s Pension Research Council and Boettner Center on Pensions & Retirement Research, and Research Associate at the National Bureau of Economic Research. Previously, Cornell University Professor from 1978 to 1993. | | Asset Allocation Trust |
| | | | |
| 28 | | Wells Fargo Advantage Large Company Value Fund | | Other Information (Unaudited) |
| | | | | | |
Name and Year of Birth | | Position Held and Length of Service | | Principal Occupations During Past Five Years | | Other Directorships During
Past Five Years |
Timothy J. Penny
(Born 1951) | | Trustee, since 1996 | | President and CEO of Southern Minnesota Initiative Foundation, a non-profit organization, since 2007 and Senior Fellow at the Humphrey Institute Policy Forum at the University of Minnesota since 1995. Member of the Board of Trustees of NorthStar Education Finance, Inc., a non-profit organization, since 2007. | | Asset Allocation Trust |
Michael S. Scofield
(Born 1943) | | Trustee, since 2010 | | Served on the Investment Company Institute’s Board of Governors and Executive Committee from 2008-2011 as well the Governing Council of the Independent Directors Council from 2006-2011 and the Independent Directors Council Executive Committee from 2008-2011. Chairman of the IDC from 2008-2010. Institutional Investor (Fund Directions) Trustee of Year in 2007. Trustee of the Evergreen Funds (and its predecessors) from 1984 to 2010. Chairman of the Evergreen Funds from 2000-2010. Former Trustee of the Mentor Funds. Retired Attorney, Law Offices of Michael S. Scofield and former Director and Chairman, Branded Media Corporation (multi-media branding company). | | Asset Allocation Trust |
Donald C. Willeke
(Born 1940) | | Trustee, since 1996 | | Principal of the law firm of Willeke & Daniels. General Counsel of the Minneapolis Employees Retirement Fund from 1984 until its consolidation into the Minnesota Public Employees Retirement Association on June 30, 2010. Director and Vice Chair of The Free Trust (non-profit corporation). Director of the American Chestnut Foundation (non-profit corporation). | | Asset Allocation Trust |
Officers
| | | | | | |
Name and Year of Birth | | Position Held and
Length of Service | | Principal Occupations During Past Five Years | | |
Karla M. Rabusch
(Born 1959) | | President, since 2003 | | Executive Vice President of Wells Fargo Bank, N.A. and President of Wells Fargo Funds Management, LLC since 2003. Senior Vice President and Chief Administrative Officer of Wells Fargo Funds Management, LLC from 2001 to 2003. | | |
C. David Messman
(Born 1960) | | Secretary, since 2000; Chief Legal Counsel, since 2003 | | Senior Vice President and Secretary of Wells Fargo Funds Management, LLC since 2001. Vice President and Managing Senior Counsel of Wells Fargo Bank, N.A. since 1996. | | |
Kasey Phillips
(Born 1970) | | Treasurer, since 2009 | | Senior Vice President of Wells Fargo Funds Management, LLC since 2009. Senior Vice President of Evergreen Investment Management Company, LLC from 2006 to 2010. Treasurer of the Evergreen Funds from 2005 to 2010. | | |
David Berardi
(Born 1975) | | Assistant Treasurer, since 2009 | | Vice President of Wells Fargo Funds Management, LLC since 2009. Vice President of Evergreen Investment Management Company, LLC from 2008 to 2010. Assistant Vice President of Evergreen Investment Services, Inc. from 2004 to 2008. Manager of Fund Reporting and Control for Evergreen Investment Management Company, LLC from 2004 to 2010. | | |
Jeremy DePalma
(Born 1974) | | Assistant Treasurer, since 2009 | | Senior Vice President of Wells Fargo Funds Management, LLC since 2009. Senior Vice President of Evergreen Investment Management Company, LLC from 2008 to 2010. Vice President, Evergreen Investment Services, Inc. from 2004 to 2007. Head of the Fund Reporting and Control Team within Fund Administration from 2005 to 2010. | | |
Debra Ann Early
(Born 1964) | | Chief Compliance Officer, since 2007 | | Chief Compliance Officer of Wells Fargo Funds Management, LLC since 2007. Chief Compliance Officer of Parnassus Investments from 2005 to 2007. Chief Financial Officer of Parnassus Investments from 2004 to 2007 and Senior Audit Manager of PricewaterhouseCoopers LLP from 1998 to 2004. | | |
| 1. | The Statement of Additional Information includes additional information about the Trustees and is available, without charge, upon request, by calling 1-800-222-8222 or by visiting the Web site at wellsfargoadvantagefunds.com. |
| | | | | | |
| List of Abbreviations | | Wells Fargo Advantage Large Company Value Fund | | | 29 | |
The following is a list of common abbreviations for terms and entities which may have appeared in this report.
| ACB | — Agricultural Credit Bank |
| ADR | — American Depository Receipt |
| ADS | — American Depository Shares |
| AGC-ICC | — Assured Guaranty Corporation - Insured Custody Certificates |
| AGM | — Assured Guaranty Municipal |
| AMBAC | — American Municipal Bond Assurance Corporation |
| AMT | — Alternative Minimum Tax |
| BAN | — Bond Anticipation Notes |
| BHAC | — Berkshire Hathaway Assurance Corporation |
| CAB | — Capital Appreciation Bond |
| CCAB | — Convertible Capital Appreciation Bond |
| CDA | — Community Development Authority |
| CDO | — Collateralized Debt Obligation |
| COP | — Certificate of Participation |
| DRIVER | — Derivative Inverse Tax-Exempt Receipts |
| DW&P | — Department of Water & Power |
| DWR | — Department of Water Resources |
| ECFA | — Educational & Cultural Facilities Authority |
| EDA | — Economic Development Authority |
| EDFA | — Economic Development Finance Authority |
| ETF | — Exchange-Traded Fund |
| FFCB | — Federal Farm Credit Bank |
| FGIC | — Financial Guaranty Insurance Corporation |
| FHA | — Federal Housing Authority |
| FHLB | — Federal Home Loan Bank |
| FHLMC | — Federal Home Loan Mortgage Corporation |
| FNMA | — Federal National Mortgage Association |
| GDR | — Global Depository Receipt |
| GNMA | — Government National Mortgage Association |
| HCFR | — Healthcare Facilities Revenue |
| HEFA | — Health & Educational Facilities Authority |
| HEFAR | — Higher Education Facilities Authority Revenue |
| HFA | — Housing Finance Authority |
| HFFA | — Health Facilities Financing Authority |
| IBC | — Insured Bond Certificate |
| IDA | — Industrial Development Authority |
| IDAG | — Industrial Development Agency |
| IDR | — Industrial Development Revenue |
| KRW | — Republic of Korea Won |
| LIBOR | — London Interbank Offered Rate |
| LLC | — Limited Liability Company |
| LLP | — Limited Liability Partnership |
| MBIA | — Municipal Bond Insurance Association |
| MFHR | — Multi-Family Housing Revenue |
| MSTR | — Municipal Securities Trust Receipts |
| MUD | — Municipal Utility District |
| NATL-RE | — National Public Finance Guarantee Corporation |
| PCFA | — Pollution Control Finance Authority |
| PCR | — Pollution Control Revenue |
| PFA | — Public Finance Authority |
| PFFA | — Public Facilities Financing Authority |
| PFOTER | — Puttable Floating Option Tax-Exempt Receipts |
| plc | — Public Limited Company |
| PUTTER | — Puttable Tax-Exempt Receipts |
| R&D | — Research & Development |
| RDA | — Redevelopment Authority |
| RDFA | — Redevelopment Finance Authority |
| REIT | — Real Estate Investment Trust |
| ROC | — Reset Option Certificates |
| SAVRS | — Select Auction Variable Rate Securities |
| SBA | — Small Business Authority |
| SFHR | — Single Family Housing Revenue |
| SFMR | — Single Family Mortgage Revenue |
| SPDR | — Standard & Poor’s Depositary Receipts |
| TAN | — Tax Anticipation Notes |
| TIPS | — Treasury Inflation-Protected Securities |
| TRAN | — Tax Revenue Anticipation Notes |
| TCR | — Transferable Custody Receipts |
| TTFA | — Transportation Trust Fund Authority |
| TVA | — Tennessee Valley Authority |
| XLCA | — XL Capital Assurance |
This page is intentionally left blank.

FOR MORE INFORMATION
More information about Wells Fargo Advantage Funds is available free upon request. To obtain literature, please write, e-mail, visit the Fund’s Web site, or call:
Wells Fargo Advantage Funds
P.O. Box 8266
Boston, MA 02266-8266
E-mail: wfaf@wellsfargo.com
Web site: wellsfargoadvantagefunds.com
Individual investors: 1-800-222-8222
Retail investment professionals: 1-888-877-9275
Institutional investment professionals: 1-866-765-0778
This report and the financial statements contained herein are submitted for the general information of the shareholders of Wells Fargo Advantage Funds. If this report is used for promotional purposes, distribution of the report must be accompanied or preceded by a current prospectus. For a prospectus containing more complete information, including charges and expenses, call 1-800-222-8222 or visit the Fund’s Web site at wellsfargoadvantagefunds.com. Please consider the investment objectives, risks, charges, and expenses of the investment carefully before investing. This and other information about Wells Fargo Advantage Funds can be found in the current prospectus. Read the prospectus carefully before you invest or send money.
Wells Fargo Funds Management, LLC, a wholly owned subsidiary of Wells Fargo & Company, provides investment advisory and administrative services for Wells Fargo Advantage Funds. Other affiliates of Wells Fargo & Company provide subadvisory and other services for the Funds. The Funds are distributed by Wells Fargo Funds Distributor, LLC, Member FINRA/SIPC, an affiliate of Wells Fargo & Company.
NOT FDIC INSURED ¡ NO BANK GUARANTEE ¡ MAY LOSE VALUE
© 2012 Wells Fargo Funds Management, LLC. All rights reserved.
| | |
 | | 207950 03-12 SA210/SAR210 1-12 |

Wells Fargo Advantage
Omega Growth Fund

Semi-Annual Report
January 31, 2012

Reduce clutter. Save trees.
Sign up for electronic delivery of prospectuses and shareholder reports at wellsfargo.com/advantagedelivery
Contents
The views expressed and any forward-looking statements are as of January 31, 2012, unless otherwise noted, and are those of the Fund managers and/or Wells Fargo Funds Management, LLC. Discussions of individual securities, or the markets generally, or any Wells Fargo Advantage Fund are not intended as individual recommendations. Future events or results may vary significantly from those expressed in any forward-looking statements; the views expressed are subject to change at any time in response to changing circumstances in the market. Wells Fargo Funds Management, LLC, disclaims any obligation to publicly update or revise any views expressed or forward-looking statements.
NOT FDIC INSURED ¡ NO BANK GUARANTEE ¡ MAY LOSE VALUE

WELLS FARGO INVESTMENT HISTORY
| | |
| |
| 1932 | | Keystone creates one of the first mutual fund families. |
| |
| 1971 | | Wells Fargo & Company introduces one of the first institutional index funds. |
| |
| 1978 | | Wells Fargo applies Markowitz and Sharpe’s research on Modern Portfolio Theory to introduce one of the industry’s first Tactical Asset Allocation (TAA) models in institutional separately managed accounts. |
| |
| 1984 | | Wells Fargo Stagecoach Funds launches its first asset allocation fund. |
| |
| 1989 | | The Tactical Asset Allocation (TAA) Model is first applied to Wells Fargo’s asset allocation mutual funds. |
| |
| 1994 | | Wells Fargo introduces the LifePath Funds, one of the first suites of target date funds (now the Wells Fargo Advantage Dow Jones Target Date FundsSM). |
| |
| 1996 | | Evergreen Investments and Keystone Funds merge. |
| |
| 1997 | | Wells Fargo launches Wells Fargo Advantage WealthBuilder PortfoliosSM, a fund-of-funds suite of products that includes the use of quantitative models to shift assets among investment styles. |
| |
| 1999 | | Norwest Advantage Funds and Stagecoach Funds are reorganized into Wells Fargo Funds after the merger of Norwest and Wells Fargo. |
| |
| 2002 | | Evergreen Retail and Evergreen Institutional companies form the umbrella asset management company, Evergreen Investments. |
| |
| 2005 | | The integration of Strong Funds with Wells Fargo Funds creates Wells Fargo Advantage Funds, resulting in one of the top 20 mutual fund companies in the United States. |
| |
| 2006 | | Wells Fargo Advantage Funds relaunches the target date product line as Wells Fargo Advantage Dow Jones Target Date Funds. |
| |
| 2010 | | The mergers and reorganizations of Evergreen and Wells Fargo Advantage mutual funds are completed, unifying the families under the brand of Wells Fargo Advantage Funds. |
Wells Fargo Advantage Funds®
Wells Fargo Advantage Funds skillfully guides institutions, financial advisors, and individuals through the investment terrain to help them reach their financial objectives. Everything we do on behalf of investors is backed by our unique combination of qualifications.
Strength
Our organization is built on the standards of integrity and service established by our parent company—Wells Fargo & Company—more than 150 years ago. And, because we’re part of a highly diversified financial enterprise, we offer the depth of resources to help investors succeed.
Expertise
Our multi-boutique model offers investors access to the independent thinking of premier investment managers that have been chosen for their time-tested strategies. While each team specializes in a specific investment strategy, collectively they provide investors a wide choice of distinct investment styles. Our dedication to investment excellence doesn’t end with our expertise in manager selection—risk management, analysis, and rigorous ongoing review seek to ensure each manager’s investment process remains consistent.
Partnership
Our collaborative approach is built around understanding the needs and goals of our clients. By adhering to core principles of sound judgment and steady guidance, we support you through every stage of the investment decision process.
Carefully consider a fund’s investment objectives, risks, charges, and expenses before investing. For a current prospectus and, if available, a summary prospectus, containing this and other information, visit wellsfargoadvantagefunds.com. Read it carefully before investing.
Wells Fargo Funds Management, LLC, a wholly owned subsidiary of Wells Fargo & Company, provides investment advisory and administrative services for Wells Fargo Advantage Funds®. Other affiliates of Wells Fargo & Company provide subadvisory and other services for the Funds. The Funds are distributed by Wells Fargo Funds Distributor, LLC, Member FINRA/SIPC, an affiliate of Wells Fargo & Company.
“Dow Jones®” and “Dow Jones Target Date IndexesSM” are service marks of Dow Jones Trademark Holdings, LLC (“Dow Jones”), have been licensed to CME Group Index Services LLC (“CME Indexes”) and have been sublicensed for use for certain purposes by Global Index Advisors, Inc, and Wells Fargo Funds Management, LLC. The Wells Fargo Advantage Dow Jones Target Date FundsSM based on the Dow Jones Target Date IndexesSM, are not sponsored, endorsed, sold or promoted by Dow Jones, CME Indexes or their respective affiliates and none of them makes any representation regarding the advisability of investing in such product(s).
NOT FDIC INSURED ¡ NO BANK GUARANTEE ¡ MAY LOSE VALUE
Not part of the semi-annual report.
Wells Fargo Advantage Funds offers more than 110 mutual funds across a wide range of asset classes, representing over $217 billion in assets under management, as of January 31, 2012.
| | | | |
| Equity Funds | | | | |
Asia Pacific Fund | | Equity Value Fund | | Precious Metals Fund |
C&B Large Cap Value Fund | | Global Opportunities Fund | | Premier Large Company Growth Fund |
C&B Mid Cap Value Fund | | Growth Fund | | Small Cap Opportunities Fund |
Capital Growth Fund | | Index Fund | | Small Cap Value Fund |
Common Stock Fund | | International Equity Fund | | Small Company Growth Fund |
Disciplined U.S. Core Fund | | International Value Fund | | Small Company Value Fund |
Discovery Fund† | | Intrinsic Small Cap Value Fund | | Small/Mid Cap Core Fund |
Diversified Equity Fund | | Intrinsic Value Fund | | Small/Mid Cap Value Fund |
Diversified International Fund | | Intrinsic World Equity Fund | | Special Mid Cap Value Fund |
Diversified Small Cap Fund | | Large Cap Core Fund | | Special Small Cap Value Fund |
Emerging Growth Fund | | Large Cap Growth Fund | | Specialized Technology Fund |
Emerging Markets Equity Fund | | Large Company Value Fund | | Strategic Large Cap Growth Fund |
Endeavor Select Fund† | | Omega Growth Fund | | Traditional Small Cap Growth Fund |
Enterprise Fund† | | Opportunity Fund† | | Utility and Telecommunications Fund |
| Bond Funds | | | | |
Adjustable Rate Government Fund | | Inflation-Protected Bond Fund | | Short-Term Bond Fund |
California Limited-Term Tax-Free Fund | | Intermediate Tax/AMT-Free Fund | | Short-Term High Yield Bond Fund |
California Tax-Free Fund | | International Bond Fund | | Short-Term Municipal Bond Fund |
Colorado Tax-Free Fund | | Minnesota Tax-Free Fund | | Strategic Municipal Bond Fund |
Government Securities Fund | | Municipal Bond Fund | | Total Return Bond Fund |
High Income Fund | | North Carolina Tax-Free Fund | | Ultra Short-Term Income Fund |
High Yield Bond Fund | | Pennsylvania Tax-Free Fund | | Ultra Short-Term Municipal Income Fund |
Income Plus Fund | | Short Duration Government Bond Fund | | Wisconsin Tax-Free Fund |
| Asset Allocation Funds | | | | |
Absolute Return Fund | | WealthBuilder Equity Portfolio† | | Target 2020 Fund† |
Asset Allocation Fund | | WealthBuilder Growth Allocation Portfolio† | | Target 2025 Fund† |
Conservative Allocation Fund | | WealthBuilder Growth Balanced Portfolio† | | Target 2030 Fund† |
Diversified Capital Builder Fund | | WealthBuilder Moderate Balanced Portfolio† | | Target 2035 Fund† |
Diversified Income Builder Fund | | WealthBuilder Tactical Equity Portfolio† | | Target 2040 Fund† |
Growth Balanced Fund | | Target Today Fund† | | Target 2045 Fund† |
Index Asset Allocation Fund | | Target 2010 Fund† | | Target 2050 Fund† |
Moderate Balanced Fund | | Target 2015 Fund† | | Target 2055 Fund† |
WealthBuilder Conservative Allocation Portfolio† | | | | |
| Money Market Funds | | | | |
100% Treasury Money Market Fund | | Heritage Money Market Fund† | | National Tax-Free Money Market Fund |
California Municipal Money Market Fund | | Money Market Fund | | Prime Investment Money Market Fund |
Cash Investment Money Market Fund | | Municipal Cash Management Money Market Fund | | Treasury Plus Money Market Fund |
Government Money Market Fund | | Municipal Money Market Fund | | |
| Variable Trust Funds1 | | | | |
VT Discovery Fund† | | VT Intrinsic Value Fund | | VT Small Cap Growth Fund |
VT Index Asset Allocation Fund | | VT Omega Growth Fund | | VT Small Cap Value Fund |
VT International Equity Fund | | VT Opportunity Fund† | | VT Total Return Bond Fund |
An investment in a money market fund is not insured or guaranteed by the Federal Deposit Insurance Corporation or any other government agency. Although the Wells Fargo Advantage Money Market Funds seek to preserve the value of your investment at $1.00 per share, it is possible to lose money by investing in a money market fund.
| 1. | The Variable Trust Funds are generally available only through insurance company variable contracts. |
| † | In this report, the Wells Fargo Advantage Discovery FundSM, Wells Fargo Advantage Endeavor Select FundSM, Wells Fargo Advantage Enterprise FundSM, Wells Fargo Advantage Opportunity FundSM, Wells Fargo Advantage WealthBuilder Conservative Allocation PortfolioSM, Wells Fargo Advantage WealthBuilder Equity PortfolioSM, Wells Fargo Advantage WealthBuilder Growth Allocation PortfolioSM, Wells Fargo Advantage WealthBuilder Growth Balanced PortfolioSM, Wells Fargo Advantage WealthBuilder Moderate Balanced PortfolioSM, Wells Fargo Advantage WealthBuilder Tactical Equity PortfolioSM, Wells Fargo Advantage Dow Jones Target Today FundSM, Wells Fargo Advantage Dow Jones Target 2010 FundSM, Wells Fargo Advantage Dow Jones Target 2015 FundSM, Wells Fargo Advantage Dow Jones Target 2020 FundSM, Wells Fargo Advantage Dow Jones Target 2025 FundSM, Wells Fargo Advantage Dow Jones Target 2030 FundSM, Wells Fargo Advantage Dow Jones Target 2035 FundSM, Wells Fargo Advantage Dow Jones Target 2040 FundSM, Wells Fargo Advantage Dow Jones Target 2045 FundSM, Wells Fargo Advantage Dow Jones Target 2050 FundSM, Wells Fargo Advantage Dow Jones Target 2055 FundSM, Wells Fargo Advantage Heritage Money Market FundSM, Wells Fargo Advantage VT Discovery FundSM, and Wells Fargo Advantage VT Opportunity FundSM are referred to as the Discovery Fund, Endeavor Select Fund, Enterprise Fund, Opportunity Fund, WealthBuilder Conservative Allocation Portfolio, WealthBuilder Equity Portfolio, WealthBuilder Growth Allocation Portfolio, WealthBuilder Growth Balanced Portfolio, WealthBuilder Moderate Balanced Portfolio, WealthBuilder Tactical Equity Portfolio, Target Today Fund, Target 2010 Fund, Target 2015 Fund, Target 2020 Fund, Target 2025 Fund, Target 2030 Fund, Target 2035 Fund, Target 2040 Fund, Target 2045 Fund, Target 2050 Fund, Target 2055 Fund, Heritage Money Market Fund, VT Discovery Fund, and VT Opportunity Fund, respectively. |
Not part of the semi-annual report.
| | | | |
| 2 | | Wells Fargo Advantage Omega Growth Fund | | Letter to Shareholders |

Karla M. Rabusch,
President
Wells Fargo Advantage Funds
The period was marked by increased confidence that the U.S. economy was staging a fragile recovery, offset by continued concerns about the possible effect on the global economy of the ongoing European sovereign debt crisis—which began in Greece and later spread to the larger economies of Italy and Spain.
The slow-motion debt crisis in the eurozone was a major headwind to both domestic and global stock market indexes.
Dear Valued Shareholder:
We’re pleased to offer you this semi-annual report for the Wells Fargo Advantage Omega Growth Fund for the six-month period that ended January 31, 2012. The period was marked by increased confidence that the U.S. economy was staging a fragile recovery, offset by continued concerns about the possible effect on the global economy of the ongoing European sovereign debt crisis—which began in Greece and later spread to the larger economies of Italy and Spain. Most U.S. stock indexes posted gains for the period, even if only modest ones.
Worries gave way to guarded optimism for the U.S. economy.
The period began with worries that the U.S. economy was returning to recession. Revised figures for gross domestic product (GDP) indicated that the U.S. economy grew by an annualized rate of only 0.8% in the first half of 2011. Moreover, although the July 2011 Institute for Supply Management (ISM) manufacturing survey suggested that factories continued to expand, the rate of expansion was lower than in previous months. The prolonged debate over whether and how to raise the U.S. debt ceiling—which only ended on July 31, 2011—also depressed market sentiment by highlighting the country’s political divisions.
The stock market remained volatile throughout September. By late October, however, stronger economic data led to greater optimism and higher stock prices. Revised real GDP growth came in at 1.8% in the third quarter of 2011 and 2.8% in the fourth quarter, suggesting that the recovery was on firmer footing. Economic growth was not evenly distributed, though, as December 2011 retail same-store sales generally showed stronger growth for retailers targeting affluent customers than for those targeting the broad middle class. The reported unemployment rate also showed some signs of improvement, falling from 9.1% in August 2011 to 8.3% in January 2012. However, this decline in the unemployment rate was accompanied by an increase in the number of Americans not in the labor force, raising concerns about the economy’s ability to generate jobs.
The eurozone had continued trouble.
The slow-motion debt crisis in the eurozone was a major headwind to both domestic and global stock market indexes. The worsening debt and deficit numbers for Greece in late 2011 and early 2012 cast doubt on the country’s ability to service its debt under the plan put in place by the European Union and the International Monetary Fund and put the ongoing drama of the European sovereign debt crisis back on center stage. Investors became increasingly concerned that Greece would default on its debt, a scenario that only seemed more likely as many Greeks rioted in response to greater budgetary austerity and the discussion moved from whether private investors would take a loss on their Greek debt to how big the loss would be. Because many eurozone banks owned Greek debt and many U.S. banks had financial ties to eurozone banks, investors worried about the effect of such an event on the financial system and the global economy.
Even as the situation in Greece deteriorated, eurozone GDP numbers supported the case for a modest recovery in the global economy. Reported GDP growth for the 17 countries that comprise the eurozone was modest, rising 0.2% in the third quarter compared to the second quarter, and by 0.2% in the fourth quarter
| | | | | | |
| Letter to Shareholders | | Wells Fargo Advantage Omega Growth Fund | | | 3 | |
compared to the third quarter. However, the eurozone average concealed a wide variation between economies, with Germany’s growing by 0.5% in the third quarter of 2011 even as Greece’s GDP contracted.
Central banks continued to provide stimulus.
Throughout the reporting period, the Federal Open Market Committee (FOMC) kept its key interest rates effectively at zero in order to support the economy and financial system. Moreover, in response to extreme market volatility and signs of a weakening economy, in its August 2011 policy statement, the Federal Reserve (Fed) announced it would keep interest rates “exceptionally low” until at least mid-2013 as a way to support the economy. Market participants interpreted the Fed’s statement to mean that the central bankers believed the economy would remain weak over the next two years. However, the Fed also said that it was considering a “range of policy tools available to promote a stronger economic recovery” and “is prepared to employ these tools as appropriate.”
At the beginning of the period, the European Central Bank (ECB) had a key rate of 1.50% but lowered it to 1.25% in November 2011 and then to 1.00% in December 2011 in an attempt to support the sluggish eurozone recovery. To support the banking system, in late 2011, the ECB initiated a long-term refinancing operation (LTRO) in which it supplied three-year loans to banks against a wide range of collateral. The operation basically provided a near-unlimited amount of liquidity to banks, easing some investor concerns about the effect of an increasingly probable Greek default.
We use time-tested investment strategies, even as many variables are at work in the market.
Experience tells us that strict adherence to time-tested investment strategies has its rewards. As a whole, Wells Fargo Advantage Funds represents investments across a range of asset classes and investment styles, giving you an opportunity to create a diversified investment portfolio. While diversification may not prevent losses in a downturn, it does provide you with one way of managing risk.
Thank you for choosing to invest with Wells Fargo Advantage Funds. We appreciate your confidence in us and remain committed to helping you meet your financial needs. For current information about your fund investments, contact your investment professional, visit our website at wellsfargoadvantagefunds.com, or call us directly at 1-800-222-8222. We are available 24 hours a day, 7 days a week.
Sincerely,

Karla M. Rabusch
President
Wells Fargo Advantage Funds
| | | | |
| 4 | | Wells Fargo Advantage Omega Growth Fund | | Letter to Shareholders |
Notice to Shareholders
The Board of Trustees for Wells Fargo Advantage Funds has unanimously approved the following modifications to certain net asset value (NAV) waiver privileges and commission schedules:
| | n | | Effective May 1, 2012, automatic investment plan (AIP) purchases and proceeds received from systematic withdrawals will no longer qualify for NAV repurchase privileges. | |
| | n | | Effective May 1, 2012, discretionary rights to waive the upfront commission for Class C and “jumbo” Class A share purchases will no longer be granted to broker/dealers. However, we will continue to waive the Class C shares contingent deferred sales charge for redemptions by employer-sponsored retirement plans where the dealer of record waived its commission at the time of purchase. | |
| | n | | Effective July 31, 2012, NAV purchase privileges for former Evergreen Class IS and Class R shareholders are being modified to remove the ability to purchase Class A shares at NAV unless those shares are held directly with the Fund on or after July 31, 2012. | |
Please contact your investment professional or call us directly at 1-800-222-8222 if you have any questions on this Notice to Shareholders.
| | | | | | |
| Performance Highlights (Unaudited) | | Wells Fargo Advantage Omega Growth Fund | | | 5 | |
INVESTMENT OBJECTIVE
The Fund seeks long-term capital appreciation.
ADVISER
Wells Fargo Funds Management, LLC
SUB-ADVISER
Wells Capital Management Incorporated
PORTFOLIO MANAGERS
Thomas J. Pence, CFA
Michael T. Smith, CFA
FUND INCEPTION
April 29, 1968
| | | | |
TEN LARGEST EQUITY HOLDINGS1 (AS OF JANUARY 31, 2012) | |
Apple Incorporated | | | 7.53% | |
Visa Incorporated Class A | | | 2.20% | |
Transdigm Group Incorporated | | | 2.02% | |
Amazon.com Incorporated | | | 2.00% | |
Monsanto Company | | | 1.97% | |
Kansas City Southern | | | 1.94% | |
priceline.com Incorporated | | | 1.91% | |
Airgas Incorporated | | | 1.88% | |
Alexion Pharmaceuticals Incorporated | | | 1.86% | |
Pioneer Natural Resources Company | | | 1.84% | |
| | |
SECTOR DISTRIBUTION2 (AS OF JANUARY 31, 2012) |
|
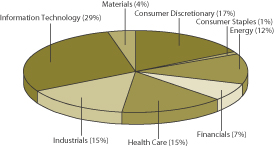 |
| 1. | The ten largest equity holdings are calculated based on the value of the securities divided by total net assets of the Fund. Holdings are subject to change and may have changed since the date specified. |
| 2. | Sector distribution is subject to change and is calculated based on the total long-term investments of the Fund. |
| | | | |
| 6 | | Wells Fargo Advantage Omega Growth Fund | | Performance Highlights (Unaudited) |
AVERAGE ANNUAL TOTAL RETURN3 (%) (AS OF JANUARY 31, 2012)
| | | | | | | | | | | | | | | | | | | | | | | | | | | | | | | | | | | | | | | | | | | | |
| | | | | | Including Sales Charge | | | Excluding Sales Charge | | | Expense Ratios4 | |
| | | Inception Date | | | 6 Months* | | | 1 Year | | | 5 Year | | | 10 Year | | | 6 Months* | | | 1 Year | | | 5 Year | | | 10 Year | | | Gross | | | Net5 | |
Class A (EKOAX) | | | 04/29/1968 | | | | (7.30 | ) | | | (6.10 | ) | | | 5.12 | | | | 4.63 | | | | (1.65 | ) | | | (0.37 | ) | | | 6.38 | | | | 5.25 | | | | 1.37% | | | | 1.30% | |
Class B (EKOBX)** | | | 08/02/1993 | | | | (6.92 | ) | | | (6.06 | ) | | | 5.25 | | | | 4.72 | | | | (2.02 | ) | | | (1.11 | ) | | | 5.58 | | | | 4.72 | | | | 2.12% | | | | 2.05% | |
Class C (EKOCX) | | | 08/02/1993 | | | | (3.05 | ) | | | (2.14 | ) | | | 5.58 | | | | 4.48 | | | | (2.05 | ) | | | (1.14 | ) | | | 5.58 | | | | 4.48 | | | | 2.12% | | | | 2.05% | |
Class R (EKORX) | | | 10/10/2003 | | | | | | | | | | | | | | | | | | | | (1.78 | ) | | | (0.62 | ) | | | 6.11 | | | | 5.01 | | | | 1.62% | | | | 1.55% | |
Administrator Class (EOMYX) | | | 01/13/1997 | | | | | | | | | | | | | | | | | | | | (1.54 | ) | | | (0.13 | ) | | | 6.64 | | | | 5.53 | | | | 1.21% | | | | 1.05% | |
Institutional Class (EKONX) | | | 07/30/2010 | | | | | | | | | | | | | | | | | | | | (1.41 | ) | | | 0.10 | | | | 6.72 | | | | 5.57 | | | | 0.94% | | | | 0.80% | |
Russell 3000® Growth Index6 | | | | | | | | | | | | | | | | | | | | | | | 2.61 | | | | 5.98 | | | | 3.17 | | | | 3.55 | | | | | | | | | |
| * | Returns for periods of less than one year are not annualized. |
| ** | Class B shares are closed to investment, except in connection with the reinvestment of any distributions and permitted exchanges. |
Figures quoted represent past performance, which is no guarantee of future results and do not reflect the deduction of taxes that a shareholder may pay on fund distributions or the redemption of fund shares. Investment return and principal value of an investment will fluctuate so that an investor’s shares, when redeemed, may be worth more or less than their original cost. Performance shown without sales charges would be lower if sales charges were reflected. Current performance may be lower or higher than the performance data quoted and assumes the reinvestment of dividends and capital gains. Current month-end performance is available on the Fund’s Web site – wellsfargoadvantagefunds.com.
Index returns do not include transaction costs associated with buying and selling securities, any mutual fund fees or expenses or any taxes. It is not possible to invest directly in an index.
For Class A shares, the maximum front-end sales charge is 5.75%. For Class B shares, the maximum contingent deferred sales charge is 5.00%. For Class C shares, the maximum contingent deferred sales charge is 1.00%. Performance including sales charge assumes the sales charge for the corresponding time period. Class R, Administrator Class and Institutional Class shares are sold without a front-end sales charge or contingent deferred sales charge.
Stock fund values fluctuate in response to the activities of individual companies and general market and economic conditions. Certain investment strategies tend to increase the total risk of an investment (relative to the broader market). This Fund is exposed to foreign investment risk and smaller-company securities risk. Consult the Fund’s prospectus for additional information on these and other risks.
| 3. | Historical performance shown for Class R shares prior to their inception reflects the performance of the Class A shares, adjusted to reflect the higher expenses applicable to Class R shares. Historical performance shown for the Institutional Class shares prior to their inception reflects the performance of the Administrator Class shares, and includes the higher expenses applicable to the Administrator Class shares. If these expenses had not been included, returns would be higher. Historical performance shown for all classes of the Fund prior to July 19, 2010 is based on the performance of the Fund’s predecessor, Evergreen Omega Fund. |
| 4. | Reflects the expense ratios as stated in the most recent prospectuses. |
| 5. | The Adviser has committed through July 18, 2013 to waive fees and/or reimburse expenses to the extent necessary to cap the Fund’s Total Annual Fund Operating Expenses After Fee Waiver, excluding certain expenses, at the amounts shown above. Without this cap, the Fund’s returns would have been lower. |
| 6. | The Russell 3000® Growth Index measures the performance of those Russell 3000 Growth Index companies with higher price-to-book ratios and higher forecasted growth values. The stocks in this index are also members of either the Russell 1000® Growth Index or the Russell 2000® Growth Index. You cannot invest directly in an index. |
| | | | | | |
| Fund Expenses (Unaudited) | | Wells Fargo Advantage Omega Growth Fund | | | 7 | |
As a shareholder of the Fund, you incur two types of costs: (1) transaction costs, including sales charges (loads) on purchase payments and contingent deferred sales charges (if any) on redemptions and (2) ongoing costs, including management fees; distribution (12b-1) and/or shareholder service fees; and other Fund expenses. This example is intended to help you understand your ongoing costs (in dollars) of investing in the Fund and to compare these costs with the ongoing costs of investing in other mutual funds.
The example is based on an investment of $1,000 invested at the beginning of the six-month period and held for the entire period from August 1, 2011 to January 31, 2012.
Actual Expenses
The “Actual” line of the table below provides information about actual account values and actual expenses. You may use the information in this line, together with the amount you invested, to estimate the expenses that you paid over the period. Simply divide your account value by $1,000 (for example, an $8,600 account value divided by $1,000 = 8.6), then multiply the result by the number in the “Actual” line under the heading entitled “Expenses Paid During Period” for your applicable class of shares to estimate the expenses you paid on your account during this period.
Hypothetical Example for Comparison Purposes
The “Hypothetical” line of the table below provides information about hypothetical account values and hypothetical expenses based on the Fund’s actual expense ratio and an assumed rate of return of 5% per year before expenses, which is not the Fund’s actual return. The hypothetical account values and expenses may not be used to estimate the actual ending account balance or expenses you paid for the period. You may use this information to compare the ongoing costs of investing in the Fund and other funds. To do so, compare this 5% hypothetical example with the 5% hypothetical examples that appear in the shareholder reports of the other funds.
Please note that the expenses shown in the table are meant to highlight your ongoing costs only and do not reflect any transactional costs, such as sales charges (loads) and contingent deferred sales charges. Therefore, the “Hypothetical” line of the table is useful in comparing ongoing costs only, and will not help you determine the relative total costs of owning different funds. In addition, if these transactional costs were included, your costs would have been higher.
| | | | | | | | | | | | | | | | |
| | | Beginning
Account Value
08-01-2011 | | | Ending
Account Value
01-31-2012 | | | Expenses
Paid During
the Period1 | | | Net Annual
Expense Ratio | |
Class A | | | | | | | | | | | | | | | | |
Actual | | $ | 1,000.00 | | | $ | 983.55 | | | $ | 6.48 | | | | 1.30 | % |
Hypothetical (5% return before expenses) | | $ | 1,000.00 | | | $ | 1,018.60 | | | $ | 6.60 | | | | 1.30 | % |
Class B | | | | | | | | | | | | | | | | |
Actual | | $ | 1,000.00 | | | $ | 979.80 | | | $ | 10.20 | | | | 2.05 | % |
Hypothetical (5% return before expenses) | | $ | 1,000.00 | | | $ | 1,014.83 | | | $ | 10.38 | | | | 2.05 | % |
Class C | | | | | | | | | | | | | | | | |
Actual | | $ | 1,000.00 | | | $ | 979.54 | | | $ | 10.20 | | | | 2.05 | % |
Hypothetical (5% return before expenses) | | $ | 1,000.00 | | | $ | 1,014.83 | | | $ | 10.38 | | | | 2.05 | % |
Class R | | | | | | | | | | | | | | | | |
Actual | | $ | 1,000.00 | | | $ | 982.21 | | | $ | 7.72 | | | | 1.55 | % |
Hypothetical (5% return before expenses) | | $ | 1,000.00 | | | $ | 1,017.34 | | | $ | 7.86 | | | | 1.55 | % |
Administrator Class | | | | | | | | | | | | | | | | |
Actual | | $ | 1,000.00 | | | $ | 984.62 | | | $ | 5.24 | | | | 1.05 | % |
Hypothetical (5% return before expenses) | | $ | 1,000.00 | | | $ | 1,019.86 | | | $ | 5.33 | | | | 1.05 | % |
Institutional Class | | | | | | | | | | | | | | | | |
Actual | | $ | 1,000.00 | | | $ | 985.92 | | | $ | 3.99 | | | | 0.80 | % |
Hypothetical (5% return before expenses) | | $ | 1,000.00 | | | $ | 1,021.11 | | | $ | 4.06 | | | | 0.80 | % |
| 1. | Expenses paid is equal to the annualized expense ratio of each class multiplied by the average account value over the period, multiplied by the number of days in the most recent fiscal half-year divided by the number of days in the fiscal year (to reflect the one-half year period). |
| | | | |
| 8 | | Wells Fargo Advantage Omega Growth Fund | | Portfolio of Investments—January 31, 2012 (Unaudited) |
| | | | | | | | | | | | |
| Security Name | | | | | | Shares | | | Value | |
| | | | | | | | | | | | |
| | | | |
Common Stocks: 98.42% | | | | | | | | | | | | |
| | | | |
Consumer Discretionary: 17.18% | | | | | | | | | | | | |
| | | | |
| Auto Components: 1.61% | | | | | | | | | | | | |
BorgWarner IncorporatedǠ | | | | | | | 148,400 | | | $ | 11,075,092 | |
| | | | | | | | | | | | |
| | | | |
| Diversified Consumer Services: 1.33% | | | | | | | | | | | | |
Weight Watchers International Incorporated | | | | | | | 120,300 | | | | 9,158,439 | |
| | | | | | | | | | | | |
| | | | |
| Hotels, Restaurants & Leisure: 1.14% | | | | | | | | | | | | |
Starbucks Corporation | | | | | | | 163,520 | | | | 7,837,514 | |
| | | | | | | | | | | | |
| | | | |
| Household Durables: 1.03% | | | | | | | | | | | | |
Tempur-Pedic International IncorporatedǠ | | | | | | | 106,100 | | | | 7,077,931 | |
| | | | | | | | | | | | |
| | | | |
| Internet & Catalog Retail: 4.36% | | | | | | | | | | | | |
Amazon.com Incorporated† | | | | | | | 70,700 | | | | 13,746,908 | |
priceline.com Incorporated† | | | | | | | 24,800 | | | | 13,131,104 | |
Shutterfly Incorporated† | | | | | | | 132,900 | | | | 3,152,388 | |
| | | | |
| | | | | | | | | | | 30,030,400 | |
| | | | | | | | | | | | |
| | | | |
| Media: 2.95% | | | | | | | | | | | | |
CBS Corporation Class B | | | | | | | 327,200 | | | | 9,318,656 | |
Discovery Communications Incorporated† | | | | | | | 283,300 | | | | 11,006,205 | |
| | | | |
| | | | | | | | | | | 20,324,861 | |
| | | | | | | | | | | | |
| | | | |
| Multiline Retail: 1.69% | | | | | | | | | | | | |
Dollar General Corporation† | | | | | | | 184,471 | | | | 7,860,309 | |
JCPenney Company Incorporated | | | | | | | 90,000 | | | | 3,739,500 | |
| | | | |
| | | | | | | | | | | 11,599,809 | |
| | | | | | | | | | | | |
| | | | |
| Textiles, Apparel & Luxury Goods: 3.07% | | | | | | | | | | | | |
Deckers Outdoor CorporationǠ | | | | | | | 40,969 | | | | 3,312,344 | |
lululemon athletica incorporatedǠ | | | | | | | 141,400 | | | | 8,926,582 | |
Ralph Lauren Corporation | | | | | | | 58,500 | | | | 8,892,000 | |
| | | | |
| | | | | | | | | | | 21,130,926 | |
| | | | | | | | | | | | |
| | | | |
Consumer Staples: 1.35% | | | | | | | | | | | | |
| | | | |
| Food & Staples Retailing: 1.35% | | | | | | | | | | | | |
Whole Foods Market Incorporated | | | | | | | 125,900 | | | | 9,320,377 | |
| | | | | | | | | | | | |
| | | | |
Energy: 11.43% | | | | | | | | | | | | |
| | | | |
| Energy Equipment & Services: 5.43% | | | | | | | | | | | | |
Cameron International Corporation† | | | | | | | 175,800 | | | | 9,352,560 | |
Ensco International plc ADR | | | | | | | 132,400 | | | | 6,969,536 | |
Oil States International Incorporated† | | | | | | | 124,300 | | | | 9,905,467 | |
Schlumberger Limited | | | | | | | 147,900 | | | | 11,117,643 | |
| | | | |
| | | | | | | | | | | 37,345,206 | |
| | | | | | | | | | | | |
| | | | |
| Oil, Gas & Consumable Fuels: 6.00% | | | | | | | | | | | | |
Cabot Oil & Gas Corporation | | | | | | | 172,800 | | | | 5,512,320 | |
| | | | | | |
| Portfolio of Investments—January 31, 2012 (Unaudited) | | Wells Fargo Advantage Omega Growth Fund | | | 9 | |
| | | | | | | | | | | | |
| Security Name | | | | | | Shares | | | Value | |
| | | | | | | | | | | | |
| | | | |
| Oil, Gas & Consumable Fuels (continued) | | | | | | | | | | | | |
Concho Resources IncorporatedǠ | | | | | | | 108,119 | | | $ | 11,531,973 | |
Exxon Mobil Corporation | | | | | | | 138,700 | | | | 11,614,738 | |
Pioneer Natural Resources Company | | | | | | | 127,600 | | | | 12,670,680 | |
| | | | |
| | | | | | | | | | | 41,329,711 | |
| | | | | | | | | | | | |
| | | | |
Financials: 7.28% | | | | | | | | | | | | |
| | | | |
| Capital Markets: 0.83% | | | | | | | | | | | | |
TD Ameritrade Holding Corporation | | | | | | | 353,300 | | | | 5,691,663 | |
| | | | | | | | | | | | |
| | | | |
| Consumer Finance: 3.73% | | | | | | | | | | | | |
MasterCard Incorporated | | | | | | | 29,800 | | | | 10,595,986 | |
Visa Incorporated Class A« | | | | | | | 150,300 | | | | 15,126,192 | |
| | | | |
| | | | | | | | | | | 25,722,178 | |
| | | | | | | | | | | | |
| | | | |
| Real Estate Management & Development: 1.28% | | | | | | | | | | | | |
CBRE Group Incorporated† | | | | | | | 457,400 | | | | 8,827,820 | |
| | | | | | | | | | | | |
| | | | |
| REITs: 1.44% | | | | | | | | | | | | |
American Tower Corporation | | | | | | | 155,900 | | | | 9,901,209 | |
| | | | | | | | | | | | |
| | | | |
Health Care: 14.39% | | | | | | | | | | | | |
| | | | |
| Biotechnology: 4.31% | | | | | | | | | | | | |
Alexion Pharmaceuticals Incorporated† | | | | | | | 166,650 | | | | 12,792,054 | |
BioMarin Pharmaceutical IncorporatedǠ | | | | | | | 190,470 | | | | 6,794,065 | |
Gilead Sciences Incorporated† | | | | | | | 206,500 | | | | 10,085,460 | |
| | | | |
| | | | | | | | | | | 29,671,579 | |
| | | | | | | | | | | | |
| | | | |
| Health Care Equipment & Supplies: 0.97% | | | | | | | | | | | | |
Alere Incorporated† | | | | | | | 277,192 | | | | 6,694,187 | |
| | | | | | | | | | | | |
| | | | |
| Health Care Providers & Services: 3.15% | | | | | | | | | | | | |
Cardinal Health Incorporated | | | | | | | 176,900 | | | | 7,612,007 | |
Humana Incorporated | | | | | | | 75,400 | | | | 6,712,108 | |
UnitedHealth Group Incorporated | | | | | | | 142,200 | | | | 7,364,538 | |
| | | | |
| | | | | | | | | | | 21,688,653 | |
| | | | | | | | | | | | |
| | | | |
| Health Care Technology: 1.38% | | | | | | | | | | | | |
Cerner Corporation† | | | | | | | 155,700 | | | | 9,480,573 | |
| | | | | | | | | | | | |
| | | | |
| Life Sciences Tools & Services: 0.76% | | | | | | | | | | | | |
Bruker BioSciences CorporationǠ | | | | | | | 368,700 | | | | 5,235,540 | |
| | | | | | | | | | | | |
| | | | |
| Pharmaceuticals: 3.82% | | | | | | | | | | | | |
Allergan Incorporated | | | | | | | 106,300 | | | | 9,344,833 | |
Bristol-Myers Squibb Company | | | | | | | 212,800 | | | | 6,860,672 | |
Shire plc ADR | | | | | | | 101,500 | | | | 10,101,280 | |
| | | | |
| | | | | | | | | | | 26,306,785 | |
| | | | | | | | | | | | |
| | | | |
| 10 | | Wells Fargo Advantage Omega Growth Fund | | Portfolio of Investments—January 31, 2012 (Unaudited) |
| | | | | | | | | | | | |
| Security Name | | | | | | Shares | | | Value | |
| | | | | | | | | | | | |
| | | | |
Industrials: 14.81% | | | | | | | | | | | | |
| | | | |
| Aerospace & Defense: 3.73% | | | | | | | | | | | | |
Precision Castparts Corporation | | | | | | | 71,900 | | | $ | 11,768,592 | |
Transdigm Group Incorporated† | | | | | | | 133,200 | | | | 13,923,396 | |
| | | | |
| | | | | | | | | | | 25,691,988 | |
| | | | | | | | | | | | |
| | | | |
| Electrical Equipment: 1.19% | | | | | | | | | | | | |
Rockwell Automation Incorporated | | | | | | | 105,600 | | | | 8,223,072 | |
| | | | | | | | | | | | |
| | | | |
| Machinery: 3.55% | | | | | | | | | | | | |
Chart Industries IncorporatedǠ | | | | | | | 107,900 | | | | 6,016,504 | |
Cummins Incorporated | | | | | | | 83,405 | | | | 8,674,120 | |
Gardner Denver Incorporated | | | | | | | 130,600 | | | | 9,742,760 | |
| | | | |
| | | | | | | | | | | 24,433,384 | |
| | | | | | | | | | | | |
| | | | |
| Marine: 1.13% | | | | | | | | | | | | |
Kirby Corporation† | | | | | | | 116,091 | | | | 7,751,395 | |
| | | | | | | | | | | | |
| | | | |
| Road & Rail: 2.93% | | | | | | | | | | | | |
Hertz Global Holdings IncorporatedǠ | | | | | | | 499,900 | | | | 6,798,640 | |
Kansas City Southern† | | | | | | | 194,400 | | | | 13,343,616 | |
| | | | |
| | | | | | | | | | | 20,142,256 | |
| | | | | | | | | | | | |
| | | | |
| Trading Companies & Distributors: 2.28% | | | | | | | | | | | | |
W.W. Grainger Incorporated | | | | | | | 19,542 | | | | 3,727,441 | |
Wesco International IncorporatedǠ | | | | | | | 190,600 | | | | 11,984,928 | |
| | | | |
| | | | | | | | | | | 15,712,369 | |
| | | | | | | | | | | | |
| | | | |
Information Technology: 28.13% | | | | | | | | | | | | |
| | | | |
| Communications Equipment: 1.74% | | | | | | | | | | | | |
Acme Packet IncorporatedǠ | | | | | | | 125,700 | | | | 3,674,211 | |
F5 Networks Incorporated† | | | | | | | 69,400 | | | | 8,309,956 | |
| | | | |
| | | | | | | | | | | 11,984,167 | |
| | | | | | | | | | | | |
| | | | |
| Computers & Peripherals: 9.22% | | | | | | | | | | | | |
Apple Incorporated† | | | | | | | 113,600 | | | | 51,856,128 | |
EMC Corporation† | | | | | | | 452,000 | | | | 11,643,520 | |
| | | | |
| | | | | | | | | | | 63,499,648 | |
| | | | | | | | | | | | |
| | | | |
| Internet Software & Services: 2.42% | | | | | | | | | | | | |
eBay Incorporated† | | | | | | | 307,300 | | | | 9,710,680 | |
Mercadolibre Incorporated | | | | | | | 79,800 | | | | 6,974,520 | |
| | | | |
| | | | | | | | | | | 16,685,200 | |
| | | | | | | | | | | | |
| | | | |
| IT Services: 3.28% | | | | | | | | | | | | |
Cognizant Technology Solutions Corporation Class A† | | | | | | | 155,700 | | | | 11,171,475 | |
Gartner Incorporated† | | | | | | | 300,626 | | | | 11,396,732 | |
| | | | |
| | | | | | | | | | | 22,568,207 | |
| | | | | | | | | | | | |
| | | | | | |
| Portfolio of Investments—January 31, 2012 (Unaudited) | | Wells Fargo Advantage Omega Growth Fund | | | 11 | |
| | | | | | | | | | | | | | |
| Security Name | | | | | | | Shares | | | Value | |
| | | | | | | | | | | | | | |
| | | | |
| Semiconductors & Semiconductor Equipment: 4.06% | | | | | | | | | | | | | | |
ARM Holdings plc ADR | | | | | | | | | 258,800 | | | $ | 7,474,144 | |
Atmel Corporation† | | | | | | | | | 396,600 | | | | 3,850,986 | |
Avago Technologies Limited | | | | | | | | | 279,200 | | | | 9,476,048 | |
Microchip Technology Incorporated« | | | | | | | | | 193,600 | | | | 7,145,776 | |
| | | | |
| | | | | | | | | | | | | 27,946,954 | |
| | | | | | | | | | | | | | |
| | | | |
| Software: 7.41% | | | | | | | | | | | | | | |
BroadSoft Incorporated† | | | | | | | | | 83,700 | | | | 2,333,556 | |
Check Point Software Technologies Limited† | | | | | | | | | 175,349 | | | | 9,870,395 | |
Citrix Systems Incorporated† | | | | | | | | | 119,200 | | | | 7,773,032 | |
QLIK Technologies Incorporated† | | | | | | | | | 226,574 | | | | 6,389,387 | |
Red Hat Incorporated† | | | | | | | | | 199,700 | | | | 9,260,089 | |
Salesforce.com IncorporatedǠ | | | | | | | | | 56,100 | | | | 6,552,480 | |
TIBCO Software Incorporated† | | | | | | | | | 337,400 | | | | 8,796,018 | |
| | | | |
| | | | | | | | | | | | | 50,974,957 | |
| | | | | | | | | | | | | | |
| | | | |
Materials: 3.85% | | | | | | | | | | | | | | |
| | | | |
| Chemicals: 3.85% | | | | | | | | | | | | | | |
Airgas Incorporated | | | | | | | | | 163,700 | | | | 12,920,841 | |
Monsanto Company | | | | | | | | | 165,400 | | | | 13,571,070 | |
| | | | |
| | | | | | | | | | | | | 26,491,911 | |
| | | | | | | | | | | | | | |
| | | | |
Total Common Stocks (Cost $562,154,768) | | | | | | | | | | | | | 677,555,961 | |
| | | | | | | | | | | | | | |
| | | | |
| | | Yield | | | | | | | | | |
| Short-Term Investments: 13.05% | | | | | | | | | | | | | | |
| | | | |
| Investment Companies: 13.05% | | | | | | | | | | | | | | |
Wells Fargo Advantage Cash Investment Money Market Fund, Institutional Class(l)(u) | | | 0.02 | % | | | | | 10,034,498 | | | | 10,034,498 | |
Wells Fargo Securities Lending Cash Investments, LLC(l)(u)(r)(v) | | | 0.15 | | | | | | 79,788,360 | | | | 79,788,360 | |
| | | | |
Total Short-Term Investments (Cost $89,822,858) | | | | | | | | | | | | | 89,822,858 | |
| | | | | | | | | | | | | | |
| | | | | | | | |
| Total Investments in Securities | | | | | | | | |
| (Cost $651,977,626)* | | | 111.47 | % | | | 767,378,819 | |
Other Assets and Liabilities, Net | | | (11.47 | ) | | | (78,988,609 | ) |
| | | | | | | | |
| Total Net Assets | | | 100.00 | % | | $ | 688,390,210 | |
| | | | | | | | |
| « | All or a portion of this security is on loan. |
| † | Non-income earning security. |
| (l) | Investment in an affiliate. |
| (u) | Rate shown is the 7-day annualized yield at period end. |
| (r) | The investment company is exempt from registration under Section 3(c)(7) of the 1940 Act. |
| (v) | Security represents investment of cash collateral received from securities on loan. |
| * | Cost for federal income tax purposes is $653,093,595 and net unrealized appreciation (depreciation) consists of: |
| | | | |
Gross unrealized appreciation | | $ | 127,676,560 | |
Gross unrealized depreciation | | | (13,391,336 | ) |
| | | | |
Net unrealized appreciation | | $ | 114,285,224 | |
The accompanying notes are an integral part of these financial statements.
| | | | |
| 12 | | Wells Fargo Advantage Omega Growth Fund | | Statement of Assets and Liabilities—January 31, 2012 (Unaudited) |
| | | | |
| | | | |
| |
Assets | | | | |
Investments | | | | |
In unaffiliated securities (including securities on loan), at value (see cost below) | | $ | 677,555,961 | |
In affiliated securities, at value (see cost below) | | | 89,822,858 | |
| | | | |
Total investments, at value (see cost below) | | | 767,378,819 | |
Receivable for investments sold | | | 4,854,055 | |
Receivable for Fund shares sold | | | 327,848 | |
Receivable for dividends | | | 74,248 | |
Receivable for securities lending income | | | 7,693 | |
Prepaid expenses and other assets | | | 95,388 | |
| | | | |
Total assets | | | 772,738,051 | |
| | | | |
| |
Liabilities | | | | |
Payable for investments purchased | | | 2,819,149 | |
Payable for Fund shares redeemed | | | 793,519 | |
Payable upon receipt of securities loaned | | | 79,788,360 | |
Advisory fee payable | | | 395,400 | |
Distribution fees payable | | | 57,284 | |
Due to other related parties | | | 176,392 | |
Accrued expenses and other liabilities | | | 317,737 | |
| | | | |
Total liabilities | | | 84,347,841 | |
| | | | |
Total net assets | | $ | 688,390,210 | |
| | | | |
| |
NET ASSETS CONSIST OF | | | | |
Paid-in capital | | $ | 601,142,378 | |
Undistributed net investment loss | | | (3,038,557 | ) |
Accumulated net realized losses on investments | | | (25,114,804 | ) |
Net unrealized gains on investments | | | 115,401,193 | |
| | | | |
Total net assets | | $ | 688,390,210 | |
| | | | |
| |
COMPUTATION OF NET ASSET VALUE AND OFFERING PRICE PER SHARE1 | | | | |
Net assets – Class A | | $ | 546,285,355 | |
Shares outstanding – Class A | | | 14,506,190 | |
Net asset value per share – Class A | | | $37.66 | |
Maximum offering price per share – Class A2 | | | $39.96 | |
Net assets – Class B | | $ | 29,469,981 | |
Shares outstanding – Class B | | | 920,381 | |
Net asset value per share – Class B | | | $32.02 | |
Net assets – Class C | | $ | 54,261,536 | |
Shares outstanding – Class C | | | 1,691,294 | |
Net asset value per share – Class C | | | $32.08 | |
Net assets – Class R | | $ | 14,601,328 | |
Shares outstanding – Class R | | | 394,771 | |
Net asset value per share – Class R | | | $36.99 | |
Net assets – Administrator Class | | $ | 43,076,523 | |
Shares outstanding – Administrator Class | | | 1,102,796 | |
Net asset value per share – Administrator Class | | | $39.06 | |
Net assets – Institutional Class | | $ | 695,487 | |
Shares outstanding – Institutional Class | | | 17,736 | |
Net asset value per share – Institutional Class | | | $39.21 | |
| |
Investments in unaffiliated securities, at cost | | $ | 562,154,768 | |
| | | | |
Investments in affiliated securities, at cost | | $ | 89,822,858 | |
| | | | |
Total investments, at cost | | $ | 651,977,626 | |
| | | | |
Securities on loan, at value | | $ | 77,952,845 | |
| | | | |
| 1. | The Fund has an unlimited number of authorized shares. |
| 2. | Maximum offering price is computed as 100/94.25 of net asset value. On investments of $50,000 or more, the offering price is reduced. |
The accompanying notes are an integral part of these financial statements.
| | | | | | |
| Statement of Operations—Six Months Ended January 31, 2012 (Unaudited) | | Wells Fargo Advantage Omega Growth Fund | | | 13 | |
| | | | |
| | | | |
| |
Investment income | | | | |
Dividends* | | $ | 1,518,064 | |
Securities lending income, net | | | 64,663 | |
Income from affiliated securities | | | 5,398 | |
| | | | |
Total investment income | | | 1,588,125 | |
| | | | |
| |
Expenses | | | | |
Advisory fee | | | 2,445,176 | |
Administration fees | | | | |
Fund level | | | 165,678 | |
Class A | | | 684,988 | |
Class B | | | 41,141 | |
Class C | | | 66,853 | |
Class R | | | 16,827 | |
Administrator Class | | | 19,576 | |
Institutional Class | | | 252 | |
Shareholder servicing fees | | | | |
Class A | | | 658,641 | |
Class B | | | 39,352 | |
Class C | | | 64,282 | |
Class R | | | 16,180 | |
Administrator Class | | | 44,885 | |
Distribution fees | | | | |
Class B | | | 118,675 | |
Class C | | | 192,846 | |
Class R | | | 16,180 | |
Custody and accounting fees | | | 19,648 | |
Professional fees | | | 19,406 | |
Registration fees | | | 30,645 | |
Shareholder report expenses | | | 76,756 | |
Trustees’ fees and expenses | | | 5,027 | |
Other fees and expenses | | | 34,815 | |
| | | | |
Total expenses | | | 4,777,829 | |
Less: Fee waivers and/or expense reimbursements | | | (193,027 | ) |
| | | | |
Net expenses | | | 4,584,802 | |
| | | | |
Net investment loss | | | (2,996,677 | ) |
| | | | |
| |
REALIZED AND UNREALIZED GAINS (LOSSES) ON INVESTMENTS | | | | |
Net realized losses on investments | | | (20,935,472 | ) |
Net change in unrealized gains (losses) on investments | | | 10,042,936 | |
| | | | |
Net realized and unrealized gains (losses) on investments | | | (10,892,536 | ) |
| | | | |
Net decrease in net assets resulting from operations | | $ | (13,889,213 | ) |
| | | | |
| |
* Net of foreign dividend withholding taxes of | | | $33,751 | |
The accompanying notes are an integral part of these financial statements.
| | | | |
| 14 | | Wells Fargo Advantage Omega Growth Fund | | Statements of Changes in Net Assets |
| | | | | | | | | | | | | | | | |
| | | Six Months Ended
January 31, 2012
(Unaudited) | | | Year Ended
July 31, 2011 | |
| | | | |
Operations | | | | | | | | | | | | | | | | |
Net investment loss | | | | | | $ | (2,996,677 | ) | | | | | | $ | (6,178,369 | ) |
Net realized gains (losses) on investments | | | | | | | (20,935,472 | ) | | | | | | | 88,497,676 | |
Net change in unrealized gains (losses) on investments | | | | | | | 10,042,936 | | | | | | | | 68,137,386 | |
| | | | | | | | | | | | | | | | |
Net increase (decrease) in net assets resulting from operations | | | | | | | (13,889,213 | ) | | | | | | | 150,456,693 | |
| | | | | | | | | | | | | | | | |
| | | | |
| | | Shares | | | | | | | | Shares | | | | | |
| | | | |
Capital share transactions | | | | | | | | | | | | | | | | |
Proceeds from shares sold | | | | | | | | | | | | | | | | |
Class A | | | 1,149,142 | | | | 40,008,314 | | | | 2,838,012 | | | | 108,395,404 | |
Class B | | | 5,863 | | | | 174,396 | | | | 43,803 | | | | 1,412,533 | |
Class C | | | 133,240 | | | | 3,964,993 | | | | 377,592 | | | | 12,328,185 | |
Class R | | | 350,518 | | | | 11,466,022 | | | | 152,504 | | | | 5,802,537 | |
Administrator Class | | | 221,854 | | | | 7,972,613 | | | | 539,113 | | | | 21,056,806 | |
Institutional Class | | | 1,957 | | | | 69,255 | | | | 19,517 | | | | 801,285 | |
| | | | | | | | | | | | | | | | |
| | | | | | | 63,655,593 | | | | | | | | 149,796,750 | |
| | | | | | | | | | | | | | | | |
Payment for shares redeemed | | | | | | | | | | | | | | | | |
Class A | | | (1,917,655 | ) | | | (66,927,228 | ) | | | (2,846,449 | ) | | | (104,057,586 | ) |
Class B | | | (310,076 | ) | | | (9,185,679 | ) | | | (612,477 | ) | | | (19,638,287 | ) |
Class C | | | (223,142 | ) | | | (6,543,516 | ) | | | (326,730 | ) | | | (10,231,543 | ) |
Class R | | | (128,762 | ) | | | (4,585,475 | ) | | | (30,784 | ) | | | (1,145,524 | ) |
Administrator Class | | | (158,660 | ) | | | (5,744,403 | ) | | | (454,709 | ) | | | (16,181,492 | ) |
Institutional Class | | | (726 | ) | | | (25,620 | ) | | | (3,333 | ) | | | (133,288 | ) |
| | | | | | | | | | | | | | | | |
| | | | | | | (93,011,921 | ) | | | | | | | (151,387,720 | ) |
| | | | | | | | | | | | | | | | |
Net decrease in net assets resulting
from capital share transactions | | | | | | | (29,356,328 | ) | | | | | | | (1,590,970 | ) |
| | | | | | | | | | | | | | | | |
Total increase (decrease) in net assets | | | | | | | (43,245,541 | ) | | | | | | | 148,865,723 | |
| | | | | | | | | | | | | | | | |
| | | | |
Net assets | | | | | | | | | | | | | | | | |
Beginning of period | | | | | | | 731,635,751 | | | | | | | | 582,770,028 | |
| | | | | | | | | | | | | | | | |
End of period | | | | | | $ | 688,390,210 | | | | | | | $ | 731,635,751 | |
| | | | | | | | | | | | | | | | |
Undistributed net investment loss | | | | | | $ | (3,038,557 | ) | | | | | | $ | (41,880 | ) |
| | | | | | | | | | | | | | | | |
The accompanying notes are an integral part of these financial statements.
| | | | | | |
| Financial Highlights | | Wells Fargo Advantage Omega Growth Fund | | | 15 | |
(For a share outstanding throughout each period)
| | | | | | | | | | | | | | | | | | | | | | | | | | | | |
| | | Six Month Ended
January 31, 2012
(Unaudited) | | | Year Ended July 31, | | | Year Ended September 30, | |
| Class A | | | 2011 | | | 20101,2 | | | 20091 | | | 20081 | | | 20071 | | | 20061 | |
Net asset value, beginning of period | | $ | 38.29 | | | $ | 30.11 | | | $ | 28.44 | | | $ | 27.26 | | | $ | 31.44 | | | $ | 25.60 | | | $ | 25.54 | |
Net investment income (loss) | | | (0.14 | )3 | | | (0.29 | ) | | | (0.10 | )3 | | | 0.18 | 3 | | | 0.05 | 3 | | | (0.11 | )3 | | | (0.15 | )3 |
Net realized and unrealized gains (losses) on investments | | | (0.49 | ) | | | 8.47 | | | | 1.96 | | | | 1.00 | | | | (4.23 | ) | | | 5.95 | | | | 0.21 | |
| | | | | | | | | | | | | | | | | | | | | | | | | | | | |
Total from investment operations | | | (0.63 | ) | | | 8.18 | | | | 1.86 | | | | 1.18 | | | | (4.18 | ) | | | 5.84 | | | | 0.06 | |
Distributions to shareholders from | | | | | | | | | | | | | | | | | | | | | | | | | | | | |
Net investment income | | | 0.00 | | | | 0.00 | | | | (0.19 | ) | | | 0.00 | | | | 0.00 | | | | 0.00 | | | | 0.00 | |
Net asset value, end of period | | $ | 37.66 | | | $ | 38.29 | | | $ | 30.11 | | | $ | 28.44 | | | $ | 27.26 | | | $ | 31.44 | | | $ | 25.60 | |
Total return4 | | | (1.65 | )% | | | 27.17 | % | | | 6.53 | % | | | 4.33 | % | | | (13.30 | )% | | | 22.81 | % | | | 0.23 | % |
Ratios to average net assets (annualized) | | | | | | | | | | | | | | | | | | | | | | | | | | | | |
Gross expenses | | | 1.35 | % | | | 1.36 | % | | | 1.35 | % | | | 1.48 | % | | | 1.44 | % | | | 1.46 | % | | | 1.51 | % |
Net expenses | | | 1.30 | % | | | 1.30 | % | | | 1.34 | % | | | 1.39 | % | | | 1.37 | % | | | 1.40 | % | | | 1.42 | % |
Net investment income (loss) | | | (0.82 | )% | | | (0.80 | )% | | | (0.40 | )% | | | 0.79 | % | | | 0.16 | % | | | (0.38 | )% | | | (0.57 | )% |
Supplemental data | | | | | | | | | | | | | | | | | | | | | | | | | | | | |
Portfolio turnover rate | | | 49 | % | | | 123 | % | | | 116 | % | | | 26 | % | | | 44 | % | | | 23 | % | | | 128 | % |
Net assets, end of period (000’s omitted) | | | $546,285 | | | | $584,871 | | | | $460,187 | | | | $460,082 | | | | $465,952 | | | | $595,296 | | | | $520,421 | |
| 1. | After the close of business on July 16, 2010, the Fund acquired the net assets of Evergreen Omega Fund which became the accounting and performance survivor in the transaction. The information for the periods prior to July 19, 2010 is that of Class A of Evergreen Omega Fund. |
| 2. | For the ten months ended July 31, 2010. The Fund changed its fiscal year end from September 30 to July 31, effective July 31, 2010. |
| 3. | Calculated based upon average shares outstanding. |
| 4. | Total return calculations do not include any sales charges. Returns for periods of less than one year are not annualized. |
The accompanying notes are an integral part of these financial statements.
| | | | |
| 16 | | Wells Fargo Advantage Omega Growth Fund | | Financial Highlights |
(For a share outstanding throughout each period)
| | | | | | | | | | | | | | | | | | | | | | | | | | | | |
| | | Six Month Ended
January 31, 2012
(Unaudited) | | | Year Ended July 31, | | | Year Ended September 30, | |
| Class B | | | 2011 | | | 20101,2 | | | 20091 | | | 20081 | | | 20071 | | | 20061 | |
Net asset value, beginning of period | | $ | 32.68 | | | $ | 25.89 | | | $ | 24.46 | | | $ | 23.62 | | | $ | 27.45 | | | $ | 22.51 | | | $ | 22.62 | |
Net investment income (loss) | | | (0.20 | )3 | | | (0.48 | )3 | | | (0.25 | )3 | | | 0.02 | 3 | | | (0.15 | )3 | | | (0.27 | )3 | | | (0.29 | )3 |
Net realized and unrealized gains (losses) on investments | | | (0.46 | ) | | | 7.27 | | | | 1.68 | | | | 0.82 | | | | (3.68 | ) | | | 5.21 | | | | 0.18 | |
| | | | | | | | | | | | | | | | | | | | | | | | | | | | |
Total from investment operations | | | (0.66 | ) | | | 6.79 | | | | 1.43 | | | | 0.84 | | | | (3.83 | ) | | | 4.94 | | | | (0.11 | ) |
Net asset value, end of period | | $ | 32.02 | | | $ | 32.68 | | | $ | 25.89 | | | $ | 24.46 | | | $ | 23.62 | | | $ | 27.45 | | | $ | 22.51 | |
Total return4 | | | (2.02 | )% | | | 26.23 | % | | | 5.85 | % | | | 3.56 | % | | | (13.95 | )% | | | 21.95 | % | | | (0.49 | )% |
Ratios to average net assets (annualized) | | | | | | | | | | | | | | | | | | | | | | | | | | | | |
Gross expenses | | | 2.10 | % | | | 2.12 | % | | | 2.10 | % | | | 2.22 | % | | | 2.16 | % | | | 2.15 | % | | | 2.21 | % |
Net expenses | | | 2.05 | % | | | 2.05 | % | | | 2.09 | % | | | 2.13 | % | | | 2.11 | % | | | 2.11 | % | | | 2.12 | % |
Net investment income (loss) | | | (1.57 | )% | | | (1.55 | )% | | | (1.14 | )% | | | 0.10 | % | | | (0.61 | )% | | | (1.08 | )% | | | (1.27 | )% |
Supplemental data | | | | | | | | | | | | | | | | | | | | | | | | | | | | |
Portfolio turnover rate | | | 49 | % | | | 123 | % | | | 116 | % | | | 26 | % | | | 44 | % | | | 23 | % | | | 128 | % |
Net assets, end of period (000’s omitted) | | | $29,470 | | | | $40,023 | | | | $46,434 | | | | $51,984 | | | | $85,008 | | | | $183,129 | | | | $311,011 | |
| 1. | After the close of business on July 16, 2010, the Fund acquired the net assets of Evergreen Omega Fund which became the accounting and performance survivor in the transaction. The information for the periods prior to July 19, 2010 is that of Class B of Evergreen Omega Fund. |
| 2. | For the ten months ended July 31, 2010. The Fund changed its fiscal year end from September 30 to July 31, effective July 31, 2010. |
| 3. | Calculated based upon average shares outstanding. |
| 4. | Total return calculations do not include any sales charges. Returns for periods of less than one year are not annualized. |
The accompanying notes are an integral part of these financial statements.
| | | | | | |
| Financial Highlights | | Wells Fargo Advantage Omega Growth Fund | | | 17 | |
(For a share outstanding throughout each period)
| | | | | | | | | | | | | | | | | | | | | | | | | | | | |
| | | Six Month Ended
January 31, 2012
(Unaudited) | | | Year Ended July 31, | | | Year Ended September 30, | |
| Class C | | | 2011 | | | 20101,2 | | | 20091 | | | 20081 | | | 20071 | | | 20061 | |
Net asset value, beginning of period | | $ | 32.75 | | | $ | 25.94 | | | $ | 24.53 | | | $ | 23.69 | | | $ | 27.52 | | | $ | 22.57 | | | $ | 22.67 | |
Net investment income (loss) | | | (0.23 | )3 | | | (0.49 | )3 | | | (0.25 | )3 | | | 0.00 | 3 | | | (0.15 | )3 | | | (0.27 | )3 | | | (0.29 | )3 |
Net realized and unrealized gains (losses) on investments | | | (0.44 | ) | | | 7.30 | | | | 1.68 | | | | 0.84 | | | | (3.68 | ) | | | 5.22 | | | | 0.19 | |
| | | | | | | | | | | | | | | | | | | | | | | | | | | | |
Total from investment operations | | | (0.67 | ) | | | 6.81 | | | | 1.43 | | | | 0.84 | | | | (3.83 | ) | | | 4.95 | | | | (0.10 | ) |
Distributions to shareholders from | | | | | | | | | | | | | | | | | | | | | | | | | | | | |
Net investment income | | | 0.00 | | | | 0.00 | | | | (0.02 | ) | | | 0.00 | | | | 0.00 | | | | 0.00 | | | | 0.00 | |
Net asset value, end of period | | $ | 32.08 | | | $ | 32.75 | | | $ | 25.94 | | | $ | 24.53 | | | $ | 23.69 | | | $ | 27.52 | | | $ | 22.57 | |
Total return4 | | | (2.05 | )% | | | 26.25 | % | | | 5.83 | % | | | 3.55 | % | | | (13.92 | )% | | | 21.93 | % | | | (0.44 | )% |
Ratios to average net assets (annualized) | | | | | | | | | | | | | | | | | | | | | | | | | | | | |
Gross expenses | | | 2.10 | % | | | 2.11 | % | | | 2.10 | % | | | 2.23 | % | | | 2.16 | % | | | 2.15 | % | | | 2.21 | % |
Net expenses | | | 2.05 | % | | | 2.05 | % | | | 2.09 | % | | | 2.14 | % | | | 2.11 | % | | | 2.11 | % | | | 2.12 | % |
Net investment income (loss) | | | (1.57 | )% | | | (1.55 | )% | | | (1.15 | )% | | | 0.02 | % | | | (0.58 | )% | | | (1.09 | )% | | | (1.27 | )% |
Supplemental data | | | | | | | | | | | | | | | | | | | | | | | | | | | | |
Portfolio turnover rate | | | 49 | % | | | 123 | % | | | 116 | % | | | 26 | % | | | 44 | % | | | 23 | % | | | 128 | % |
Net assets, end of period (000’s omitted) | | | $54,262 | | | | $58,329 | | | | $44,892 | | | | $43,806 | | | | $40,829 | | | | $54,982 | | | | $64,042 | |
| 1. | After the close of business on July 16, 2010, the Fund acquired the net assets of Evergreen Omega Fund which became the accounting and performance survivor in the transaction. The information for the periods prior to July 19, 2010 is that of Class C of Evergreen Omega Fund. |
| 2. | For the ten months ended July 31, 2010. The Fund changed its fiscal year end from September 30 to July 31, effective July 31, 2010. |
| 3. | Calculated based upon average shares outstanding. |
| 4. | Total return calculations do not include any sales charges. Returns for periods of less than one year are not annualized. |
The accompanying notes are an integral part of these financial statements.
| | | | |
| 18 | | Wells Fargo Advantage Omega Growth Fund | | Financial Highlights |
(For a share outstanding throughout each period)
| | | | | | | | | | | | | | | | | | | | | | | | | | | | |
| | | Six Month Ended
January 31, 2012
(Unaudited) | | | Year Ended July 31, | | | Year Ended September 30, | |
| Class R | | | 2011 | | | 20101,2 | | | 20091 | | | 20081 | | | 20071 | | | 20061 | |
Net asset value, beginning of period | | $ | 37.66 | | | $ | 29.69 | | | $ | 28.09 | | | $ | 26.99 | | | $ | 31.20 | | | $ | 25.47 | | | $ | 25.46 | |
Net investment income (loss) | | | (0.26 | )3 | | | (0.13 | ) | | | (0.16 | )3 | | | 0.08 | 3 | | | (0.02 | )3 | | | (0.14 | )3 | | | (0.19 | )3 |
Net realized and unrealized gains (losses) on investments | | | (0.41 | ) | | | 8.10 | | | | 1.94 | | | | 1.02 | | | | (4.19 | ) | | | 5.87 | | | | 0.20 | |
| | | | | | | | | | | | | | | | | | | | | | | | | | | | |
Total from investment operations | | | (0.67 | ) | | | 7.97 | | | | 1.78 | | | | 1.10 | | | | (4.21 | ) | | | 5.73 | | | | 0.01 | |
Distributions to shareholders from | | | | | | | | | | | | | | | | | | | | | | | | | | | | |
Net investment income | | | 0.00 | | | | 0.00 | | | | (0.18 | ) | | | 0.00 | | | | 0.00 | | | | 0.00 | | | | 0.00 | |
Net asset value, end of period | | $ | 36.99 | | | $ | 37.66 | | | $ | 29.69 | | | $ | 28.09 | | | $ | 26.99 | | | $ | 31.20 | | | $ | 25.47 | |
Total return4 | | | (1.78 | )% | | | 26.89 | % | | | 6.29 | % | | | 4.08 | % | | | (13.49 | )% | | | 22.50 | % | | | 0.04 | % |
Ratios to average net assets (annualized) | | | | | | | | | | | | | | | | | | | | | | | | | | | | |
Gross expenses | | | 1.61 | % | | | 1.59 | % | | | 1.60 | % | | | 1.76 | % | | | 1.66 | % | | | 1.65 | % | | | 1.71 | % |
Net expenses | | | 1.55 | % | | | 1.55 | % | | | 1.59 | % | | | 1.67 | % | | | 1.61 | % | | | 1.61 | % | | | 1.62 | % |
Net investment income (loss) | | | (1.07 | )% | | | (1.08 | )% | | | (0.65 | )% | | | 0.35 | % | | | (0.08 | )% | | | (0.53 | )% | | | (0.75 | )% |
Supplemental data | | | | | | | | | | | | | | | | | | | | | | | | | | | | |
Portfolio turnover rate | | | 49 | % | | | 123 | % | | | 116 | % | | | 26 | % | | | 44 | % | | | 23 | % | | | 128 | % |
Net assets, end of period (000’s omitted) | | | $14,601 | | | | $6,515 | | | | $1,523 | | | | $838 | | | | $84 | | | | $63 | | | | $445 | |
| 1. | After the close of business on July 16, 2010, the Fund acquired the net assets of Evergreen Omega Fund which became the accounting and performance survivor in the transaction. The information for the periods prior to July 19, 2010 is that of Class R of Evergreen Omega Fund. |
| 2. | For the ten months ended July 31, 2010. The Fund changed its fiscal year end from September 30 to July 31, effective July 31, 2010. |
| 3. | Calculated based upon average shares outstanding. |
| 4. | Returns for periods of less than one year are not annualized. |
The accompanying notes are an integral part of these financial statements.
| | | | | | |
| Financial Highlights | | Wells Fargo Advantage Omega Growth Fund | | | 19 | |
(For a share outstanding throughout each period)
| | | | | | | | | | | | | | | | | | | | | | | | | | | | |
| | | Six Month Ended
January 31, 2012
(Unaudited) | | | Year Ended July 31, | | | Year Ended September 30, | |
| Administrator Class | | | 2011 | | | 20101,2 | | | 20091 | | | 20081 | | | 20071 | | | 20061 | |
Net asset value, beginning of period | | $ | 39.67 | | | $ | 31.12 | | | $ | 29.39 | | | $ | 28.10 | | | $ | 32.32 | | | $ | 26.25 | | | $ | 26.10 | |
Net investment income (loss) | | | (0.11 | )3 | | | (0.21 | )3 | | | (0.04 | )3 | | | 0.24 | 3 | | | 0.13 | 3 | | | (0.03 | )3 | | | (0.08 | )3 |
Net realized and unrealized gains (losses) on investments | | | (0.50 | ) | | | 8.76 | | | | 2.02 | | | | 1.05 | | | | (4.35 | ) | | | 6.10 | | | | 0.23 | |
| | | | | | | | | | | | | | | | | | | | | | | | | | | | |
Total from investment operations | | | (0.61 | ) | | | 8.55 | | | | 1.98 | | | | 1.29 | | | | (4.22 | ) | | | 6.07 | | | | 0.15 | |
Distributions to shareholders from | | | | | | | | | | | | | | | | | | | | | | | | | | | | |
Net investment income | | | 0.00 | | | | 0.00 | | | | (0.25 | ) | | | 0.00 | | | | 0.00 | | | | 0.00 | | | | 0.00 | |
Net asset value, end of period | | $ | 39.06 | | | $ | 39.67 | | | $ | 31.12 | | | $ | 29.39 | | | $ | 28.10 | | | $ | 32.32 | | | $ | 26.25 | |
Total return4 | | | (1.54 | )% | | | 27.47 | % | | | 6.75 | % | | | 4.59 | % | | | (13.06 | )% | | | 23.12 | % | | | 0.57 | % |
Ratios to average net assets (annualized) | | | | | | | | | | | | | | | | | | | | | | | | | | | | |
Gross expenses | | | 1.17 | % | | | 1.18 | % | | | 1.11 | % | | | 1.23 | % | | | 1.17 | % | | | 1.15 | % | | | 1.21 | % |
Net expenses | | | 1.05 | % | | | 1.05 | % | | | 1.09 | % | | | 1.14 | % | | | 1.12 | % | | | 1.11 | % | | | 1.12 | % |
Net investment income (loss) | | | (0.57 | )% | | | (0.56 | )% | | | (0.16 | )% | | | 1.00 | % | | | 0.42 | % | | | (0.09 | )% | | | (0.30 | )% |
Supplemental data | | | | | | | | | | | | | | | | | | | | | | | | | | | | |
Portfolio turnover rate | | | 49 | % | | | 123 | % | | | 116 | % | | | 26 | % | | | 44 | % | | | 23 | % | | | 128 | % |
Net assets, end of period (000’s omitted) | | | $43,077 | | | | $41,242 | | | | $29,724 | | | | $32,437 | | | | $23,910 | | | | $16,503 | | | | $16,344 | |
| 1. | After the close of business on July 16, 2010, the Fund acquired the net assets of Evergreen Omega Fund which became the accounting and performance survivor in the transaction. The information for the periods prior to July 19, 2010 is that of Class I of Evergreen Omega Fund. |
| 2. | For the ten months ended July 31, 2010. The Fund changed its fiscal year end from September 30 to July 31, effective July 31, 2010. |
| 3. | Calculated based upon average shares outstanding. |
| 4. | Returns for periods of less than one year are not annualized. |
The accompanying notes are an integral part of these financial statements.
| | | | |
| 20 | | Wells Fargo Advantage Omega Growth Fund | | Financial Highlights |
(For a share outstanding throughout each period)
| | | | | | | | | | | | |
| | | Six Month Ended
January 31, 2012
(Unaudited) | | | Year Ended July 31, | |
| Institutional Class | | | 2011 | | | 20101 | |
Net asset value, beginning of period | | $ | 39.77 | | | $ | 31.12 | | | $ | 31.12 | |
Net Investment income (loss) | | | (0.06 | ) | | | (0.03 | ) | | | 0.00 | |
Net realized and unrealized gains (losses) on investments | | | (0.50 | ) | | | 8.68 | | | | 0.00 | |
| | | | | | | | | | | | |
Total from investment operations | | | (0.56 | ) | | | 8.65 | | | | 0.00 | |
Net asset value, end of period | | $ | 39.21 | | | $ | 39.77 | | | $ | 31.12 | |
Total return2 | | | (1.41 | )% | | | 27.80 | % | | | 0 | % |
Ratios to average net assets (annualized) | | | | | | | | | | | | |
Gross expenses | | | 0.93 | % | | | 0.88 | % | | | 0.00 | % |
Net expenses | | | 0.80 | % | | | 0.80 | % | | | 0.00 | % |
Net investment income (loss) | | | (0.32 | )% | | | (0.34 | )% | | | 0.00 | % |
Supplemental data | | | | | | | | | | | | |
Portfolio turnover rate | | | 49 | % | | | 123 | % | | | 116 | % |
Net assets, end of period (000’s omitted) | | | $695 | | | | $656 | | | | $10 | |
| 1. | For the period from July 30, 2010 (commence of class operations) to July 31, 2010. |
| 2. | Returns for periods of less than one year are not annualized. |
The accompanying notes are an integral part of these financial statements.
| | | | | | |
| Notes to Financial Statements (Unaudited) | | Wells Fargo Advantage Omega Growth Fund | | | 21 | |
1. ORGANIZATION
Wells Fargo Funds Trust (the “Trust”), a Delaware statutory trust organized on March 10, 1999, is an open-end management investment company registered under the Investment Company Act of 1940, as amended (the “1940 Act”). These financial statements report on Wells Fargo Advantage Omega Growth Fund (the “Fund”) which is a diversified series of the Trust.
2. SIGNIFICANT ACCOUNTING POLICIES
The following significant accounting policies, which are consistently followed in the preparation of the financial statements of the Fund, are in conformity with U.S. generally accepted accounting principles which require management to make estimates and assumptions that affect the reported amounts of assets and liabilities, disclosure of contingent assets and liabilities at the date of the financial statements, and the reported amounts of revenues and expenses during the reporting period. Actual results could differ from those estimates.
Securities valuation
Investments in equity securities are valued each business day as of the close of regular trading on the New York Stock Exchange, which is usually 4:00 p.m. (Eastern Time). Securities which are traded on a national or foreign securities exchange are valued at the last reported sales price, except that securities listed on The Nasdaq Stock Market, Inc. (“Nasdaq”) are valued at the Nasdaq Official Closing Price (“NOCP”), and if no NOCP is available, then at the last reported sales price. If no sales price is shown on the Nasdaq, the bid price will be used. In the absence of any sale of securities listed on the Nasdaq, and in the case of other securities (including U.S. Government obligations, but excluding debt securities maturing in 60 days or less), the price will be deemed “stale” and the valuations will be determined in accordance with the Fund’s Fair Value Procedures.
Investments in open-end mutual funds and non-registered investment companies are generally valued at net asset value.
Investments which are not valued using any of the methods discussed above, are valued at their fair value, as determined by procedures established in good faith and approved by the Board of Trustees.
Security loans
The Fund may lend its securities from time to time in order to earn additional income in the form of fees or interest on securities received as collateral or the investment of any cash received as collateral. The Fund continues to receive interest or dividends on the securities loaned. The Fund receives collateral in the form of cash or securities with a value at least equal to the value of the securities on loan. The value of the loaned securities is determined at the close of each business day and any additional required collateral is delivered to the Fund on the next business day. In a securities lending transaction, the net asset value of the Fund will be affected by an increase or decrease in the value of the securities loaned and by an increase or decrease in the value of the instrument in which collateral is invested. The amount of securities lending activity undertaken by the Fund fluctuates from time to time. In the event of default or bankruptcy by the borrower, the Fund may be prevented from recovering the loaned securities or gaining access to the collateral or may experience delays or costs in doing so. In addition, the investment of any cash collateral received may lose all or part of its value. The Fund has the right under the lending agreement to recover the securities from the borrower on demand.
The Fund lends its securities through an unaffiliated securities lending agent. Cash collateral received in connection with its securities lending transactions is invested in Wells Fargo Securities Lending Cash Investments, LLC (the “Cash Collateral Fund”). The Cash Collateral Fund is exempt from registration under Section 3(c)(7) of the 1940 Act and is managed by Wells Fargo Funds Management LLC (“Funds Management”) and is sub-advised by Wells Capital Management Incorporated (“Wells Capital Management”). Funds Management receives an advisory fee starting at 0.05% and declining to 0.01% as the average daily net assets of the Cash Collateral Fund increase. All of the fees received by Funds Management are paid to Wells Capital Management for its services as sub-adviser. The Cash Collateral Fund seeks to provide a positive return compared to the daily Fed Funds Open rate by investing in high-quality, U.S. dollar-denominated short-term money market instruments. Cash Collateral Fund investments are fair valued based upon the amortized cost valuation technique. Income earned from investment in the Cash Collateral Fund is included in securities lending income on the Statement of Operations.
| | | | |
| 22 | | Wells Fargo Advantage Omega Growth Fund | | Notes to Financial Statements (Unaudited) |
Security transactions and income recognition
Securities transactions are recorded on a trade date basis. Realized gains or losses are reported on the basis of identified cost of securities delivered.
Dividend income is recognized on the ex-dividend date. Dividend income is recorded net of foreign taxes withheld where recovery of such taxes is not assured.
Distributions to shareholders
Distributions to shareholders from net investment income and net realized gains, if any, are recorded on the ex-dividend date. Such distributions are determined in conformity with income tax regulations, which may differ from generally accepted accounting principles.
Federal and other taxes
The Fund intends to continue to qualify as a regulated investment company by distributing substantially all of its investment company taxable income and any net realized capital gains (after reduction for capital loss carryforwards) sufficient to relieve it from all, or substantially all, federal income taxes. Accordingly, no provision for federal income taxes was required.
The Fund’s income and federal excise tax returns and all financial records supporting those returns for the prior three fiscal years are subject to examination by the federal and Delaware revenue authorities.
Under the recently enacted Regulated Investment Company Modernization Act of 2010, the Fund is permitted to carry forward capital losses incurred in taxable years which began after December 22, 2010 for an unlimited period. However, any losses incurred are required to be utilized prior to the losses incurred in pre-enactment taxable years. As a result of this ordering rule, pre-enactment capital loss carryforwards may be more likely to expire unused. Additionally, post-enactment capital losses that are carried forward will retain their character as either short-term or long-term capital losses rather than being considered all short-term as under previous law.
As of July 31, 2011, the Fund had net capital loss carryforwards, which were available to offset future net realized capital gains, in the amount of $4,068,979 expiring in 2017.
Class allocations
The separate classes of shares offered by the Fund differ principally in applicable sales charges, distribution, shareholder servicing and administration fees. Shareholders of each class bear certain expenses that pertain to that particular class. All shareholders bear the common expenses of the Fund, earn income from the portfolio, and are allocated unrealized gains and losses pro rata based on the average daily net assets of each class, without distinction between share classes. Dividends are determined separately for each class based on income and expenses allocable to each class. Realized gains and losses are allocated to each class pro rata based upon the net assets of each class on the date realized. Differences in per share dividend rates generally result from the relative weightings of pro rata income and realized gain allocations and from differences in separate class expenses, including distribution, shareholder servicing and administration fees.
3. FAIR VALUATION MEASUREMENTS
Fair value measurements of investments are determined within a framework that has established a fair value hierarchy based upon the various data inputs utilized in determining the value of the Fund’s investments. The three-level hierarchy gives the highest priority to unadjusted quoted prices in active markets for identical assets or liabilities (Level 1) and the lowest priority to significant unobservable inputs (Level 3). The Fund’s investments are classified within the fair value hierarchy based on the lowest level of input that is significant to the fair value measurement. The inputs are summarized into three broad levels as follows:
| n | | Level 1 – quoted prices in active markets for identical securities |
| n | | Level 2 – other significant observable inputs (including quoted prices for similar securities, interest rates, prepayment speeds, credit risk, etc.) |
| n | | Level 3 – significant unobservable inputs (including the Fund’s own assumptions in determining the fair value of investments) |
The inputs or methodologies used for valuing securities are not necessarily an indication of the risk associated with investing in those securities.
| | | | | | |
| Notes to Financial Statements (Unaudited) | | Wells Fargo Advantage Omega Growth Fund | | | 23 | |
As of January 31, 2012, the inputs used in valuing the Fund’s assets, which are carried at fair value, were as follows:
| | | | | | | | | | | | | | | | |
| Investments in Securities | | Quoted Prices (Level 1) | | | Significant Other
Observable Inputs (Level 2) | | | Significant Unobservable Inputs (Level 3) | | | Total | |
Equity securities | | | | | | | | | | | | | | | | |
Common stocks | | $ | 677,555,961 | | | $ | 0 | | | $ | 0 | | | $ | 677,555,961 | |
Short-term investments | | | | | | | | | | | | | | | | |
Investment companies | | | 10,034,498 | | | | 79,788,360 | | | | 0 | | | | 89,822,858 | |
| | | $ | 687,590,459 | | | $ | 79,788,360 | | | $ | 0 | | | $ | 767,378,819 | |
Further details on the major security types listed above can be found in the Portfolio of Investments.
Transfers in and transfers out are recognized at the end of the reporting period. For the six months ended January 31, 2012, the Fund did not have any significant transfers into/out of Level 1 and Level 2.
4. TRANSACTIONS WITH AFFILIATES AND OTHER EXPENSES
Advisory fee
The Trust has entered into an advisory contract with Funds Management, an indirect wholly owned subsidiary of Wells Fargo & Company (“Wells Fargo”). The adviser is responsible for implementing investment policies and guidelines and for supervising the sub-adviser, who is responsible for day-to-day portfolio management of the Fund.
Pursuant to the contract, Funds Management is entitled to receive an annual advisory fee starting at 0.75% and declining to 0.60% as the average daily net assets of the Fund increase. For the six months ended January 31, 2012, the advisory fee was equivalent to an annual rate of 0.74% of the Fund’s average daily net assets.
Funds Management may retain the services of certain sub-advisers to provide daily portfolio management to the Fund. The fees related to sub-advisory services are borne directly by Funds Management and do not increase the overall fees paid by the Fund. Wells Capital Management, an affiliate of Funds Management, is the sub-adviser to the Fund and is entitled to receive a fee from Funds Management at an annual rate starting at 0.35% and declining to 0.15% as the average daily net assets of the Fund increase.
Administration and transfer agent fees
The Trust has entered into an administration agreement with Funds Management. Under this agreement, for providing administrative services, which includes paying fees and expenses for services provided by the transfer agent, sub-transfer agents, omnibus account servicers and record-keepers, Funds Management is entitled to receive from the Fund an annual fund level administration fee starting at 0.05% and declining to 0.03% as the average daily net assets of the Fund increase and a class level administration fee which is calculated based on the average daily net assets of each class as follows:
| | | | |
| | | Class Level Administration Fee | |
Class A, Class B, Class C, Class R | | | 0.26 | % |
Administrator Class | | | 0.10 | |
Institutional Class | | | 0.08 | |
Funds Management has contractually waived and/or reimbursed advisory and administration fees to the extent necessary to maintain certain net operating expense ratios for the Fund. Waiver of fees and/or reimbursement of expenses by Funds Management were made first from fund level expenses on a proportionate basis and then from class specific expenses. Funds Management has committed through July 18, 2013 to waive fees and/or reimburse expenses to the extent necessary to cap the Fund’s expenses at 1.30% for Class A, 2.05% for Class B, 2.05% for Class C, 1.55% for Class R, 1.05% for Administrator Class, and 0.80% for Institutional Class.
Distribution fees
The Trust has adopted a Distribution Plan for Class B, Class C and Class R shares of the Fund pursuant to Rule 12b-1 under the 1940 Act. Distribution fees are charged to Class B, Class C and Class R shares and paid to Wells Fargo Funds Distributor, LLC, the principal underwriter, at an annual rate of 0.75% of the average daily net assets of Class B and Class C shares and 0.25% of the average daily net assets for Class R shares.
| | | | |
| 24 | | Wells Fargo Advantage Omega Growth Fund | | Notes to Financial Statements (Unaudited) |
For the six months ended January 31, 2012, Wells Fargo Funds Distributor, LLC received $13,469 from the sale of Class A shares and $12,279 and $2,278 in contingent deferred sales charges from redemptions of Class B and Class C shares, respectively.
Shareholder servicing fees
The Trust has entered into contracts with one or more shareholder servicing agents, whereby Class A, Class B, Class C, Class R and Administrator Class of the Fund is charged a fee at an annual rate of 0.25% of the average daily net assets of each respective class.
A portion of these total shareholder servicing fees were paid to affiliates of Wells Fargo.
5. INVESTMENT PORTFOLIO TRANSACTIONS
Purchases and sales of investments, excluding U.S. Government obligations (if any) and short-term securities (securities with maturities of one year or less at purchase date), for the six months ended January 31, 2012 were $325,874,221 and $359,775,528, respectively.
6. BANK BORROWINGS
The Trust (excluding the money market funds) and Wells Fargo Variable Trust are parties to a $150,000,000 revolving credit agreement with State Street Bank and Trust Company, whereby the Fund is permitted to use bank borrowings for temporary or emergency purposes, such as to fund shareholder redemption requests. Interest under the credit agreement is charged to the Fund based on a borrowing rate equal to the higher of the Federal Funds rate in effect on that day plus 1.25% or the overnight LIBOR rate in effect on that day plus 1.25%. In addition, an annual commitment fee equal to 0.10% of the unused balance is allocated to each participating fund. Prior to September 6, 2011, the revolving credit agreement was for $125,000,000 and the annual commitment fee was equal 0.125% of the unused balance. For the six months ended January 31, 2012, the Fund paid $361 in commitment fees.
For the six months ended January 31, 2012, there were no borrowings by the Fund under the agreement.
7. INDEMNIFICATION
Under the Trust’s organizational documents, the officers and directors are indemnified against certain liabilities that may arise out of performance of their duties to the Trust. Additionally, in the normal course of business, the Trust may enter into contracts with service providers that contain a variety of indemnification clauses. The Trust’s maximum exposure under these arrangements is dependent on future claims that may be made against the Fund and, therefore, cannot be estimated.
8. NEW ACCOUNTING PRONOUNCEMENTS
In May 2011, the Financial Accounting Standards Board (“FASB”) issued Accounting Standards Update (“ASU”) No. 2011-04 “Amendments to Achieve Common Fair Value Measurement and Disclosure Requirements in U.S. GAAP and IFRSs”. ASU No. 2011-04 amends FASB ASC Topic 820, Fair Value Measurements and Disclosures, to establish common requirements for measuring fair value and for disclosing information about fair value measurements in accordance with GAAP. The ASU is effective prospectively for interim and annual periods beginning after December 15, 2011. Management expects that adoption of the ASU will result in additional disclosures in the financial statements, as applicable.
In April 2011, FASB issued ASU No. 2011-03 “Reconsideration of Effective Control for Repurchase Agreements”. ASU No. 2011-03 amends FASB ASC Topic 860, Transfers and Servicing, specifically the criteria required to determine whether a repurchase agreement (repo) and similar agreements should be accounted for as sales of financial assets or secured borrowings with commitments. ASU No. 2011-03 changes the assessment of effective control by focusing on the transferor’s contractual rights and obligations and removing the criterion to assess its ability to exercise those rights or honor those obligations. This could result in changes to the way entities account for certain transactions including repurchase agreements, mortgage dollar rolls and reverse repurchase agreements. The ASU will become effective on a prospective basis for new transfers and modifications to existing transactions as of the beginning of the first interim or annual period beginning on or after December 15, 2011. Management has evaluated the impact of adopting the ASU and expects no significant changes.
| | | | | | |
| Other Information (Unaudited) | | Wells Fargo Advantage Omega Growth Fund | | | 25 | |
PROXY VOTING INFORMATION
A description of the policies and procedures that the Fund uses to determine how to vote proxies relating to portfolio securities is available without charge, upon request, by calling 1-800-222-8222, visiting our Web site at wellsfargoadvantagefunds.com, or visiting the SEC Web site at sec.gov. Information regarding how the Fund voted proxies relating to portfolio securities during the most recent 12-month period ended June 30 is available without charge on the Fund’s Web site at wellsfargoadvantagefunds.com or by visiting the SEC Web site at sec.gov.
PORTFOLIO HOLDINGS INFORMATION
The complete portfolio holdings for the Fund are publicly available on the Fund’s Web site (wellsfargoadvantagefunds.com) on a monthly, 30-day or more delayed basis. In addition, top ten holdings information for the Fund is publicly available on the Fund’s Web site on a monthly, seven-day or more delayed basis. The Fund files its complete schedule of portfolio holdings with the SEC for the first and third quarters of each fiscal year on Form N-Q, which is available without charge by visiting the SEC Web site at sec.gov. In addition, the Fund’s Form N-Q may be reviewed and copied at the SEC’s Public Reference Room in Washington, DC, and at regional offices in New York City, at 233 Broadway, and in Chicago, at 175 West Jackson Boulevard, Suite 900. Information about the Public Reference Room may be obtained by calling 1-800-SEC-0330.
| | | | |
| 26 | | Wells Fargo Advantage Omega Growth Fund | | Other Information (Unaudited) |
BOARD OF TRUSTEES
The following table provides basic information about the Board of Trustees (the “Trustees”) of the Trust and Officers of the Trust. This table should be read in conjunction with the Prospectus and the Statement of Additional Information1 of the Fund. Each of the Trustees and Officers listed below acts in identical capacities for the Wells Fargo Advantage family of funds, which consists of 137 funds comprising the Wells Fargo Funds Trust, Wells Fargo Variable Trust, Wells Fargo Master Trust and four closed-end funds (collectively the “Fund Complex”). All of the Trustees are also Members of the Audit and Governance Committees of each Trust in the Fund Complex. The mailing address of each Trustee and Officer is 525 Market Street, 12th Floor, San Francisco, CA 94105. Each Trustee and Officer serves an indefinite term, however, each Trustee serves such term until reaching the mandatory retirement age established by the Trustees.
Independent Trustees
| | | | | | |
Name and Year of Birth | | Position Held and Length of Service | | Principal Occupations During Past Five Years | | Other Directorships During
Past Five Years |
Peter G. Gordon
(Born 1942) | | Trustee, since 1998; Chairman, since 2005 (Lead Trustee since 2001) | | Co-Founder, Retired Chairman, President and CEO of Crystal Geyser Water Company. Trustee Emeritus, Colby College | | Asset Allocation Trust |
Isaiah Harris, Jr.
(Born 1952) | | Trustee, since 2009 | | Retired. Prior thereto, President and CEO of BellSouth Advertising and Publishing Corp. from 2005 to 2007, President and CEO of BellSouth Enterprises from 2004 to 2005 and President of BellSouth Consumer Services from 2000 to 2003. Emeritus member of the Iowa State University Foundation Board of Governors. Emeritus Member of the Advisory Board of Iowa State University School of Business. Mr. Harris is a certified public accountant. | | CIGNA Corporation; Deluxe Corporation; Asset Allocation Trust |
Judith M. Johnson
(Born 1949) | | Trustee, since 2008 | | Retired. Prior thereto, Chief Executive Officer and Chief Investment Officer of Minneapolis Employees Retirement Fund from 1996 to 2008. Ms. Johnson is an attorney, certified public accountant and a certified managerial accountant. | | Asset Allocation Trust |
Leroy Keith, Jr.
(Born 1939) | | Trustee, since 2010 | | Chairman, Bloc Global Services (development and construction). Trustee of the Evergreen Funds from 1983 to 2010. Former Managing Director, Almanac Capital Management (commodities firm), former Partner, Stonington Partners, Inc. (private equity fund), former Director, Obagi Medical Products Co. and former Director, Lincoln Educational Services. | | Trustee, Virtus Fund Complex (consisting of 40 portfolios as of 12/31/11); Asset Allocation Trust |
David F. Larcker
(Born 1950) | | Trustee, since 2009 | | James Irvin Miller Professor of Accounting at the Graduate School of Business, Stanford University, Director of Corporate Governance Research Program and Senior Faculty of The Rock Center for Corporate Governance since 2006. From 2005 to 2008, Professor of Accounting at the Graduate School of Business, Stanford University. Prior thereto, Ernst & Young Professor of Accounting at The Wharton School, University of Pennsylvania from 1985 to 2005. | | Asset Allocation Trust |
Olivia S. Mitchell
(Born 1953) | | Trustee, since 2006 | | International Foundation of Employee Benefit Plans Professor, Wharton School of the University of Pennsylvania since 1993. Director of Wharton’s Pension Research Council and Boettner Center on Pensions & Retirement Research, and Research Associate at the National Bureau of Economic Research. Previously, Cornell University Professor from 1978 to 1993. | | Asset Allocation Trust |
| | | | | | |
| Other Information (Unaudited) | | Wells Fargo Advantage Omega Growth Fund | | | 27 | |
| | | | | | |
Name and Year of Birth | | Position Held and Length of Service | | Principal Occupations During Past Five Years | | Other Directorships During
Past Five Years |
Timothy J. Penny
(Born 1951) | | Trustee, since 1996 | | President and CEO of Southern Minnesota Initiative Foundation, a non-profit organization, since 2007 and Senior Fellow at the Humphrey Institute Policy Forum at the University of Minnesota since 1995. Member of the Board of Trustees of NorthStar Education Finance, Inc., a non-profit organization, since 2007. | | Asset Allocation Trust |
Michael S. Scofield
(Born 1943) | | Trustee, since 2010 | | Served on the Investment Company Institute’s Board of Governors and Executive Committee from 2008-2011 as well the Governing Council of the Independent Directors Council from 2006-2011 and the Independent Directors Council Executive Committee from 2008-2011. Chairman of the IDC from 2008-2010. Institutional Investor (Fund Directions) Trustee of Year in 2007. Trustee of the Evergreen Funds (and its predecessors) from 1984 to 2010. Chairman of the Evergreen Funds from 2000-2010. Former Trustee of the Mentor Funds. Retired Attorney, Law Offices of Michael S. Scofield and former Director and Chairman, Branded Media Corporation (multi-media branding company). | | Asset Allocation Trust |
Donald C. Willeke
(Born 1940) | | Trustee, since 1996 | | Principal of the law firm of Willeke & Daniels. General Counsel of the Minneapolis Employees Retirement Fund from 1984 until its consolidation into the Minnesota Public Employees Retirement Association on June 30, 2010. Director and Vice Chair of The Free Trust (non-profit corporation). Director of the American Chestnut Foundation (non-profit corporation). | | Asset Allocation Trust |
Officers
| | | | | | |
Name and Year of Birth | | Position Held and
Length of Service | | Principal Occupations During Past Five Years | | |
Karla M. Rabusch
(Born 1959) | | President, since 2003 | | Executive Vice President of Wells Fargo Bank, N.A. and President of Wells Fargo Funds Management, LLC since 2003. Senior Vice President and Chief Administrative Officer of Wells Fargo Funds Management, LLC from 2001 to 2003. | | |
C. David Messman
(Born 1960) | | Secretary, since 2000; Chief Legal Counsel, since 2003 | | Senior Vice President and Secretary of Wells Fargo Funds Management, LLC since 2001. Vice President and Managing Senior Counsel of Wells Fargo Bank, N.A. since 1996. | | |
Kasey Phillips
(Born 1970) | | Treasurer, since 2009 | | Senior Vice President of Wells Fargo Funds Management, LLC since 2009. Senior Vice President of Evergreen Investment Management Company, LLC from 2006 to 2010. Treasurer of the Evergreen Funds from 2005 to 2010. | | |
David Berardi
(Born 1975) | | Assistant Treasurer, since 2009 | | Vice President of Wells Fargo Funds Management, LLC since 2009. Vice President of Evergreen Investment Management Company, LLC from 2008 to 2010. Assistant Vice President of Evergreen Investment Services, Inc. from 2004 to 2008. Manager of Fund Reporting and Control for Evergreen Investment Management Company, LLC from 2004 to 2010. | | |
Jeremy DePalma
(Born 1974) | | Assistant Treasurer, since 2009 | | Senior Vice President of Wells Fargo Funds Management, LLC since 2009. Senior Vice President of Evergreen Investment Management Company, LLC from 2008 to 2010. Vice President, Evergreen Investment Services, Inc. from 2004 to 2007. Head of the Fund Reporting and Control Team within Fund Administration from 2005 to 2010. | | |
Debra Ann Early
(Born 1964) | | Chief Compliance Officer, since 2007 | | Chief Compliance Officer of Wells Fargo Funds Management, LLC since 2007. Chief Compliance Officer of Parnassus Investments from 2005 to 2007. Chief Financial Officer of Parnassus Investments from 2004 to 2007 and Senior Audit Manager of PricewaterhouseCoopers LLP from 1998 to 2004. | | |
| 1. | The Statement of Additional Information includes additional information about the Trustees and is available, without charge, upon request, by calling 1-800-222-8222 or by visiting the Web site at wellsfargoadvantagefunds.com. |
| | | | |
| 28 | | Wells Fargo Advantage Omega Growth Fund | | List of Abbreviations |
The following is a list of common abbreviations for terms and entities which may have appeared in this report.
| ACB | — Agricultural Credit Bank |
| ADR | — American Depository Receipt |
| ADS | — American Depository Shares |
| AGC-ICC | — Assured Guaranty Corporation - Insured Custody Certificates |
| AGM | — Assured Guaranty Municipal |
| AMBAC | — American Municipal Bond Assurance Corporation |
| AMT | — Alternative Minimum Tax |
| BAN | — Bond Anticipation Notes |
| BHAC | — Berkshire Hathaway Assurance Corporation |
| CAB | — Capital Appreciation Bond |
| CCAB | — Convertible Capital Appreciation Bond |
| CDA | — Community Development Authority |
| CDO | — Collateralized Debt Obligation |
| COP | — Certificate of Participation |
| DRIVER | — Derivative Inverse Tax-Exempt Receipts |
| DW&P | — Department of Water & Power |
| DWR | — Department of Water Resources |
| ECFA | — Educational & Cultural Facilities Authority |
| EDA | — Economic Development Authority |
| EDFA | — Economic Development Finance Authority |
| ETF | — Exchange-Traded Fund |
| FFCB | — Federal Farm Credit Bank |
| FGIC | — Financial Guaranty Insurance Corporation |
| FHA | — Federal Housing Authority |
| FHLB | — Federal Home Loan Bank |
| FHLMC | — Federal Home Loan Mortgage Corporation |
| FNMA | — Federal National Mortgage Association |
| GDR | — Global Depository Receipt |
| GNMA | — Government National Mortgage Association |
| HCFR | — Healthcare Facilities Revenue |
| HEFA | — Health & Educational Facilities Authority |
| HEFAR | — Higher Education Facilities Authority Revenue |
| HFA | — Housing Finance Authority |
| HFFA | — Health Facilities Financing Authority |
| IBC | — Insured Bond Certificate |
| IDA | — Industrial Development Authority |
| IDAG | — Industrial Development Agency |
| IDR | — Industrial Development Revenue |
| KRW | — Republic of Korea Won |
| LIBOR | — London Interbank Offered Rate |
| LLC | — Limited Liability Company |
| LLP | — Limited Liability Partnership |
| MBIA | — Municipal Bond Insurance Association |
| MFHR | — Multi-Family Housing Revenue |
| MSTR | — Municipal Securities Trust Receipts |
| MUD | — Municipal Utility District |
| NATL-RE | — National Public Finance Guarantee Corporation |
| PCFA | — Pollution Control Finance Authority |
| PCR | — Pollution Control Revenue |
| PFA | — Public Finance Authority |
| PFFA | — Public Facilities Financing Authority |
| PFOTER | — Puttable Floating Option Tax-Exempt Receipts |
| plc | — Public Limited Company |
| PUTTER | — Puttable Tax-Exempt Receipts |
| R&D | — Research & Development |
| RDA | — Redevelopment Authority |
| RDFA | — Redevelopment Finance Authority |
| REIT | — Real Estate Investment Trust |
| ROC | — Reset Option Certificates |
| SAVRS | — Select Auction Variable Rate Securities |
| SBA | — Small Business Authority |
| SFHR | — Single Family Housing Revenue |
| SFMR | — Single Family Mortgage Revenue |
| SPDR | — Standard & Poor’s Depositary Receipts |
| TAN | — Tax Anticipation Notes |
| TIPS | — Treasury Inflation-Protected Securities |
| TRAN | — Tax Revenue Anticipation Notes |
| TCR | — Transferable Custody Receipts |
| TTFA | — Transportation Trust Fund Authority |
| TVA | — Tennessee Valley Authority |
| XLCA | — XL Capital Assurance |
This page is intentionally left blank.
This page is intentionally left blank.


FOR MORE INFORMATION
More information about Wells Fargo Advantage Funds is available free upon request. To obtain literature, please write, e-mail, visit the Fund’s Web site, or call:
Wells Fargo Advantage Funds
P.O. Box 8266
Boston, MA 02266-8266
E-mail: wfaf@wellsfargo.com
Web site: wellsfargoadvantagefunds.com
Individual investors: 1-800-222-8222
Retail investment professionals: 1-888-877-9275
Institutional investment professionals: 1-866-765-0778
This report and the financial statements contained herein are submitted for the general information of the shareholders of Wells Fargo Advantage Funds. If this report is used for promotional purposes, distribution of the report must be accompanied or preceded by a current prospectus. For a prospectus containing more complete information, including charges and expenses, call 1-800-222-8222 or visit the Fund’s Web site at wellsfargoadvantagefunds.com. Please consider the investment objectives, risks, charges, and expenses of the investment carefully before investing. This and other information about Wells Fargo Advantage Funds can be found in the current prospectus. Read the prospectus carefully before you invest or send money.
Wells Fargo Funds Management, LLC, a wholly owned subsidiary of Wells Fargo & Company, provides investment advisory and administrative services for Wells Fargo Advantage Funds. Other affiliates of Wells Fargo & Company provide subadvisory and other services for the Funds. The Funds are distributed by Wells Fargo Funds Distributor, LLC, Member FINRA/SIPC, an affiliate of Wells Fargo & Company.
NOT FDIC INSURED ¡ NO BANK GUARANTEE ¡ MAY LOSE VALUE
© 2012 Wells Fargo Funds Management, LLC. All rights reserved.
| | |
 | | 207951 03-12 SA211/SAR211 1-12 |

Wells Fargo Advantage
Premier Large Company Growth Fund

Semi-Annual Report
January 31, 2012

Reduce clutter. Save trees.
Sign up for electronic delivery of prospectuses and shareholder reports at wellsfargo.com/advantagedelivery
Contents
The views expressed and any forward-looking statements are as of January 31, 2012, unless otherwise noted, and are those of the Fund managers and/or Wells Fargo Funds Management, LLC. Discussions of individual securities, or the markets generally, or any Wells Fargo Advantage Fund are not intended as individual recommendations. Future events or results may vary significantly from those expressed in any forward-looking statements; the views expressed are subject to change at any time in response to changing circumstances in the market. Wells Fargo Funds Management, LLC, disclaims any obligation to publicly update or revise any views expressed or forward-looking statements.
NOT FDIC INSURED ¡ NO BANK GUARANTEE ¡ MAY LOSE VALUE

WELLS FARGO INVESTMENT HISTORY
| | |
| |
| 1932 | | Keystone creates one of the first mutual fund families. |
| |
| 1971 | | Wells Fargo & Company introduces one of the first institutional index funds. |
| |
| 1978 | | Wells Fargo applies Markowitz and Sharpe’s research on Modern Portfolio Theory to introduce one of the industry’s first Tactical Asset Allocation (TAA) models in institutional separately managed accounts. |
| |
| 1984 | | Wells Fargo Stagecoach Funds launches its first asset allocation fund. |
| |
| 1989 | | The Tactical Asset Allocation (TAA) Model is first applied to Wells Fargo’s asset allocation mutual funds. |
| |
| 1994 | | Wells Fargo introduces the LifePath Funds, one of the first suites of target date funds (now the Wells Fargo Advantage Dow Jones Target Date FundsSM ). |
| |
| 1996 | | Evergreen Investments and Keystone Funds merge. |
| |
| 1997 | | Wells Fargo launches Wells Fargo Advantage WealthBuilder PortfoliosSM, a fund-of-funds suite of products that includes the use of quantitative models to shift assets among investment styles. |
| |
| 1999 | | Norwest Advantage Funds and Stagecoach Funds are reorganized into Wells Fargo Funds after the merger of Norwest and Wells Fargo. |
| |
| 2002 | | Evergreen Retail and Evergreen Institutional companies form the umbrella asset management company, Evergreen Investments. |
| |
| 2005 | | The integration of Strong Funds with Wells Fargo Funds creates Wells Fargo Advantage Funds, resulting in one of the top 20 mutual fund companies in the United States. |
| |
| 2006 | | Wells Fargo Advantage Funds relaunches the target date product line as Wells Fargo Advantage Dow Jones Target Date Funds. |
| |
| 2010 | | The mergers and reorganizations of Evergreen and Wells Fargo Advantage mutual funds are completed, unifying the families under the brand of Wells Fargo Advantage Funds. |
Wells Fargo Advantage Funds®
Wells Fargo Advantage Funds skillfully guides institutions, financial advisors, and individuals through the investment terrain to help them reach their financial objectives. Everything we do on behalf of investors is backed by our unique combination of qualifications.
Strength
Our organization is built on the standards of integrity and service established by our parent company—Wells Fargo & Company—more than 150 years ago. And, because we’re part of a highly diversified financial enterprise, we offer the depth of resources to help investors succeed.
Expertise
Our multi-boutique model offers investors access to the independent thinking of premier investment managers that have been chosen for their time-tested strategies. While each team specializes in a specific investment strategy, collectively they provide investors a wide choice of distinct investment styles. Our dedication to investment excellence doesn’t end with our expertise in manager selection—risk management, analysis, and rigorous ongoing review seek to ensure each manager’s investment process remains consistent.
Partnership
Our collaborative approach is built around understanding the needs and goals of our clients. By adhering to core principles of sound judgment and steady guidance, we support you through every stage of the investment decision process.
Carefully consider a fund’s investment objectives, risks, charges, and expenses before investing. For a current prospectus and, if available, a summary prospectus, containing this and other information, visit wellsfargoadvantagefunds.com. Read it carefully before investing.
Wells Fargo Funds Management, LLC, a wholly owned subsidiary of Wells Fargo & Company, provides investment advisory and administrative services for Wells Fargo Advantage Funds®. Other affiliates of Wells Fargo & Company provide subadvisory and other services for the Funds. The Funds are distributed by Wells Fargo Funds Distributor, LLC, Member FINRA/SIPC, an affiliate of Wells Fargo & Company.
“Dow Jones®” and “Dow Jones Target Date IndexesSM” are service marks of Dow Jones Trademark Holdings, LLC (“Dow Jones”), have been licensed to CME Group Index Services LLC (“CME Indexes”) and have been sublicensed for use for certain purposes by Global Index Advisors, Inc, and Wells Fargo Funds Management, LLC. The Wells Fargo Advantage Dow Jones Target Date FundsSM based on the Dow Jones Target Date IndexesSM, are not sponsored, endorsed, sold or promoted by Dow Jones, CME Indexes or their respective affiliates and none of them makes any representation regarding the advisability of investing in such product(s).
NOT FDIC INSURED ¡ NO BANK GUARANTEE ¡ MAY LOSE VALUE
Not part of the semi-annual report.
Wells Fargo Advantage Funds offers more than 110 mutual funds across a wide range of asset classes, representing over $217 billion in assets under management, as of January 31, 2012.
| | | | |
| Equity Funds | | | | |
Asia Pacific Fund | | Equity Value Fund | | Precious Metals Fund |
C&B Large Cap Value Fund | | Global Opportunities Fund | | Premier Large Company Growth Fund |
C&B Mid Cap Value Fund | | Growth Fund | | Small Cap Opportunities Fund |
Capital Growth Fund | | Index Fund | | Small Cap Value Fund |
Common Stock Fund | | International Equity Fund | | Small Company Growth Fund |
Disciplined U.S. Core Fund | | International Value Fund | | Small Company Value Fund |
Discovery Fund† | | Intrinsic Small Cap Value Fund | | Small/Mid Cap Core Fund |
Diversified Equity Fund | | Intrinsic Value Fund | | Small/Mid Cap Value Fund |
Diversified International Fund | | Intrinsic World Equity Fund | | Special Mid Cap Value Fund |
Diversified Small Cap Fund | | Large Cap Core Fund | | Special Small Cap Value Fund |
Emerging Growth Fund | | Large Cap Growth Fund | | Specialized Technology Fund |
Emerging Markets Equity Fund | | Large Company Value Fund | | Strategic Large Cap Growth Fund |
Endeavor Select Fund† | | Omega Growth Fund | | Traditional Small Cap Growth Fund |
Enterprise Fund† | | Opportunity Fund† | | Utility and Telecommunications Fund |
| Bond Funds | | | | |
Adjustable Rate Government Fund | | Inflation-Protected Bond Fund | | Short-Term Bond Fund |
California Limited-Term Tax-Free Fund | | Intermediate Tax/AMT-Free Fund | | Short-Term High Yield Bond Fund |
California Tax-Free Fund | | International Bond Fund | | Short-Term Municipal Bond Fund |
Colorado Tax-Free Fund | | Minnesota Tax-Free Fund | | Strategic Municipal Bond Fund |
Government Securities Fund | | Municipal Bond Fund | | Total Return Bond Fund |
High Income Fund | | North Carolina Tax-Free Fund | | Ultra Short-Term Income Fund |
High Yield Bond Fund | | Pennsylvania Tax-Free Fund | | Ultra Short-Term Municipal Income Fund |
Income Plus Fund | | Short Duration Government Bond Fund | | Wisconsin Tax-Free Fund |
| Asset Allocation Funds | | | | |
Absolute Return Fund | | WealthBuilder Equity Portfolio† | | Target 2020 Fund† |
Asset Allocation Fund | | WealthBuilder Growth Allocation Portfolio† | | Target 2025 Fund† |
Conservative Allocation Fund | | WealthBuilder Growth Balanced Portfolio† | | Target 2030 Fund† |
Diversified Capital Builder Fund | | WealthBuilder Moderate Balanced Portfolio† | | Target 2035 Fund† |
Diversified Income Builder Fund | | WealthBuilder Tactical Equity Portfolio† | | Target 2040 Fund† |
Growth Balanced Fund | | Target Today Fund† | | Target 2045 Fund† |
Index Asset Allocation Fund | | Target 2010 Fund† | | Target 2050 Fund† |
Moderate Balanced Fund | | Target 2015 Fund† | | Target 2055 Fund† |
WealthBuilder Conservative Allocation Portfolio† | | | | |
| Money Market Funds | | | | |
100% Treasury Money Market Fund | | Heritage Money Market Fund† | | National Tax-Free Money Market Fund |
California Municipal Money Market Fund | | Money Market Fund | | Prime Investment Money Market Fund |
Cash Investment Money Market Fund | | Municipal Cash Management Money Market Fund | | Treasury Plus Money Market Fund |
Government Money Market Fund | | Municipal Money Market Fund | | |
| Variable Trust Funds1 | | | | |
VT Discovery Fund† | | VT Intrinsic Value Fund | | VT Small Cap Growth Fund |
VT Index Asset Allocation Fund | | VT Omega Growth Fund | | VT Small Cap Value Fund |
VT International Equity Fund | | VT Opportunity Fund† | | VT Total Return Bond Fund |
An investment in a money market fund is not insured or guaranteed by the Federal Deposit Insurance Corporation or any other government agency. Although the Wells Fargo Advantage Money Market Funds seek to preserve the value of your investment at $1.00 per share, it is possible to lose money by investing in a money market fund.
| 1. | The Variable Trust Funds are generally available only through insurance company variable contracts. |
| † | In this report, the Wells Fargo Advantage Discovery FundSM, Wells Fargo Advantage Endeavor Select FundSM, Wells Fargo Advantage Enterprise FundSM, Wells Fargo Advantage Opportunity FundSM, Wells Fargo Advantage WealthBuilder Conservative Allocation PortfolioSM, Wells Fargo Advantage WealthBuilder Equity PortfolioSM, Wells Fargo Advantage WealthBuilder Growth Allocation PortfolioSM, Wells Fargo Advantage WealthBuilder Growth Balanced PortfolioSM, Wells Fargo Advantage WealthBuilder Moderate Balanced PortfolioSM, Wells Fargo Advantage WealthBuilder Tactical Equity PortfolioSM, Wells Fargo Advantage Dow Jones Target Today FundSM, Wells Fargo Advantage Dow Jones Target 2010 FundSM, Wells Fargo Advantage Dow Jones Target 2015 FundSM, Wells Fargo Advantage Dow Jones Target 2020 FundSM, Wells Fargo Advantage Dow Jones Target 2025 FundSM, Wells Fargo Advantage Dow Jones Target 2030 FundSM, Wells Fargo Advantage Dow Jones Target 2035 FundSM, Wells Fargo Advantage Dow Jones Target 2040 FundSM, Wells Fargo Advantage Dow Jones Target 2045 FundSM, Wells Fargo Advantage Dow Jones Target 2050 FundSM, Wells Fargo Advantage Dow Jones Target 2055 FundSM, Wells Fargo Advantage Heritage Money Market FundSM, Wells Fargo Advantage VT Discovery FundSM, and Wells Fargo Advantage VT Opportunity FundSM are referred to as the Discovery Fund, Endeavor Select Fund, Enterprise Fund, Opportunity Fund, WealthBuilder Conservative Allocation Portfolio, WealthBuilder Equity Portfolio, WealthBuilder Growth Allocation Portfolio, WealthBuilder Growth Balanced Portfolio, WealthBuilder Moderate Balanced Portfolio, WealthBuilder Tactical Equity Portfolio, Target Today Fund, Target 2010 Fund, Target 2015 Fund, Target 2020 Fund, Target 2025 Fund, Target 2030 Fund, Target 2035 Fund, Target 2040 Fund, Target 2045 Fund, Target 2050 Fund, Target 2055 Fund, Heritage Money Market Fund, VT Discovery Fund, and VT Opportunity Fund, respectively. |
Not part of the semi-annual report.
| | | | |
| 2 | | Wells Fargo Advantage Premier Large Company Growth Fund | | Letter to Shareholders |

Karla M. Rabusch,
President
Wells Fargo Advantage Funds
The period was marked by increased confidence that the U.S. economy was staging a fragile recovery, offset by continued concerns about the possible effect on the global economy of the ongoing European sovereign debt crisis—which began in Greece and later spread to the larger economies of Italy and Spain.
The slow-motion debt crisis in the eurozone was a major headwind to both domestic and global stock market indexes.
Dear Valued Shareholder:
We’re pleased to offer you this semi-annual report for the Wells Fargo Advantage Premier Large Company Growth Fund for the six-month period that ended January 31, 2012. The period was marked by increased confidence that the U.S. economy was staging a fragile recovery, offset by continued concerns about the possible effect on the global economy of the ongoing European sovereign debt crisis—which began in Greece and later spread to the larger economies of Italy and Spain. Most U.S. stock indexes posted gains for the period, even if only modest ones.
Worries gave way to guarded optimism for the U.S. economy.
The period began with worries that the U.S. economy was returning to recession. Revised figures for gross domestic product (GDP) indicated that the U.S. economy grew by an annualized rate of only 0.8% in the first half of 2011. Moreover, although the July 2011 Institute for Supply Management (ISM) manufacturing survey suggested that factories continued to expand, the rate of expansion was lower than in previous months. The prolonged debate over whether and how to raise the U.S. debt ceiling—which only ended on July 31, 2011—also depressed market sentiment by highlighting the country’s political divisions.
The stock market remained volatile throughout September. By late October, however, stronger economic data led to greater optimism and higher stock prices. Revised real GDP growth came in at 1.8% in the third quarter of 2011 and 2.8% in the fourth quarter, suggesting that the recovery was on firmer footing. Economic growth was not evenly distributed, though, as December 2011 retail same-store sales generally showed stronger growth for retailers targeting affluent customers than for those targeting the broad middle class. The reported unemployment rate also showed some signs of improvement, falling from 9.1% in August 2011 to 8.3% in January 2012. However, this decline in the unemployment rate was accompanied by an increase in the number of Americans not in the labor force, raising concerns about the economy’s ability to generate jobs.
The eurozone had continued trouble.
The slow-motion debt crisis in the eurozone was a major headwind to both domestic and global stock market indexes. The worsening debt and deficit numbers for Greece in late 2011 and early 2012 cast doubt on the country’s ability to service its debt under the plan put in place by the European Union and the International Monetary Fund and put the ongoing drama of the European sovereign debt crisis back on center stage. Investors became increasingly concerned that Greece would default on its debt, a scenario that only seemed more likely as many Greeks rioted in response to greater budgetary austerity and the discussion moved from whether private investors would take a loss on their Greek debt to how big the loss would be. Because many eurozone banks owned Greek debt and many U.S. banks had financial ties to eurozone banks, investors worried about the effect of such an event on the financial system and the global economy.
Even as the situation in Greece deteriorated, eurozone GDP numbers supported the case for a modest recovery in the global economy. Reported GDP growth for the 17 countries that comprise the eurozone was modest, rising 0.2% in the third
| | | | | | |
| Letter to Shareholders | | Wells Fargo Advantage Premier Large Company Growth Fund | | | 3 | |
quarter compared to the second quarter, and by 0.2% in the fourth quarter compared to the third quarter. However, the eurozone average concealed a wide variation between economies, with Germany’s growing by 0.5% in the third quarter of 2011 even as Greece’s GDP contracted.
Central banks continued to provide stimulus.
Throughout the reporting period, the Federal Open Market Committee (FOMC) kept its key interest rates effectively at zero in order to support the economy and financial system. Moreover, in response to extreme market volatility and signs of a weakening economy, in its August 2011 policy statement, the Federal Reserve (Fed) announced it would keep interest rates “exceptionally low” until at least mid-2013 as a way to support the economy. Market participants interpreted the Fed’s statement to mean that the central bankers believed the economy would remain weak over the next two years. However, the Fed also said that it was considering a “range of policy tools available to promote a stronger economic recovery” and “is prepared to employ these tools as appropriate.”
At the beginning of the period, the European Central Bank (ECB) had a key rate of 1.50% but lowered it to 1.25% in November 2011 and then to 1.00% in December 2011 in an attempt to support the sluggish eurozone recovery. To support the banking system, in late 2011, the ECB initiated a long-term refinancing operation (LTRO) in which it supplied three-year loans to banks against a wide range of collateral. The operation basically provided a near-unlimited amount of liquidity to banks, easing some investor concerns about the effect of an increasingly probable Greek default.
We use time-tested investment strategies, even as many variables are at work in the market.
Experience tells us that strict adherence to time-tested investment strategies has its rewards. As a whole, Wells Fargo Advantage Funds represents investments across a range of asset classes and investment styles, giving you an opportunity to create a diversified investment portfolio. While diversification may not prevent losses in a downturn, it does provide you with one way of managing risk.
Thank you for choosing to invest with Wells Fargo Advantage Funds. We appreciate your confidence in us and remain committed to helping you meet your financial needs. For current information about your fund investments, contact your investment professional, visit our website at wellsfargoadvantagefunds.com, or call us directly at 1-800-222-8222. We are available 24 hours a day, 7 days a week.
Sincerely,

Karla M. Rabusch
President
Wells Fargo Advantage Funds
| | | | |
| 4 | | Wells Fargo Advantage Premier Large Company Growth Fund | | Letter to Shareholders |
Notice to Shareholders
The Board of Trustees for Wells Fargo Advantage Funds has unanimously approved the following modifications to certain net asset value (NAV) waiver privileges and commission schedules:
| | n | | Effective May 1, 2012, automatic investment plan (AIP) purchases and proceeds received from systematic withdrawals will no longer qualify for NAV repurchase privileges. | |
| | n | | Effective May 1, 2012, discretionary rights to waive the upfront commission for Class C and “jumbo” Class A share purchases will no longer be granted to broker/dealers. However, we will continue to waive the Class C shares contingent deferred sales charge for redemptions by employer-sponsored retirement plans where the dealer of record waived its commission at the time of purchase. | |
| | n | | Effective July 31, 2012, NAV purchase privileges for former Evergreen Class IS and Class R shareholders are being modified to remove the ability to purchase Class A shares at NAV unless those shares are held directly with the Fund on or after July 31, 2012. | |
Please contact your investment professional or call us directly at 1-800-222-8222 if you have any questions on this Notice to Shareholders.
| | | | | | |
| Performance Highlights (Unaudited) | | Wells Fargo Advantage Premier Large Company Growth Fund | | | 5 | |
INVESTMENT OBJECTIVE
The Fund seeks long-term capital appreciation.
ADVISER
Wells Fargo Funds Management, LLC
SUB-ADVISER
Wells Capital Management Incorporated
PORTFOLIO MANAGERS
Joseph M. Eberhardy, CFA, CPA
Thomas C. Ognar, CFA
Bruce C. Olson, CFA
FUND INCEPTION
September 11, 1935
| | | | |
TEN LARGEST EQUITY HOLDINGS1
(AS OF JANUARY 31, 2012) | |
Apple Incorporated | | | 7.28% | |
Cognizant Technology Solutions Corporation Class A | | | 2.93% | |
Alexion Pharmaceuticals Incorporated | | | 2.92% | |
EMC Corporation | | | 2.72% | |
Pioneer Natural Resources Company | | | 2.72% | |
Google Incorporated Class A | | | 2.63% | |
Kansas City Southern | | | 2.59% | |
Whole Foods Market Incorporated | | | 2.57% | |
Praxair Incorporated | | | 2.39% | |
Mettler-Toledo International Incorporated | | | 2.20% | |
|
SECTOR DISTRIBUTION2
(AS OF JANUARY 31, 2012) |
|
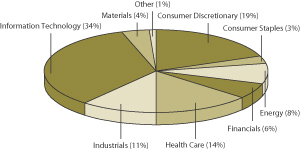 |
| 1. | The ten largest equity holdings are calculated based on the value of the securities divided by total net assets of the Fund. Holdings are subject to change and may have changed since the date specified. |
| 2. | Sector distribution is subject to change and is calculated based on the total long-term investments of the Fund. |
| | | | |
| 6 | | Wells Fargo Advantage Premier Large Company Growth Fund | | Performance Highlights (Unaudited) |
AVERAGE ANNUAL TOTAL RETURN3 (%) (AS OF JANUARY 31, 2012)
| | | | | | | | | | | | | | | | | | | | | | | | | | | | | | | | | | | | | | | | | | | | |
| | | | | | Including Sales Charge | | | Excluding Sales Charge | | | Expense Ratios4 | |
| | | Inception Date | | | 6 Months* | | | 1 Year | | | 5 Year | | | 10 Year | | | 6 Months* | | | 1 Year | | | 5 Year | | | 10 Year | | | Gross | | | Net5 | |
Class A (EKJAX) | | | 01/20/1998 | | | | (3.42 | ) | | | 1.83 | | | | 5.06 | | | | 4.52 | | | | 2.45 | | | | 8.02 | | | | 6.31 | | | | 5.14 | | | | 1.24% | | | | 1.12% | |
Class B (EKJBX)** | | | 09/11/1935 | | | | (2.94 | ) | | | 2.27 | | | | 5.20 | | | | 4.60 | | | | 2.02 | | | | 7.27 | | | | 5.52 | | | | 4.60 | | | | 1.99% | | | | 1.87% | |
Class C (EKJCX) | | | 01/22/1998 | | | | 1.03 | | | | 6.29 | | | | 5.52 | | | | 4.35 | | | | 2.03 | | | | 7.29 | | | | 5.52 | | | | 4.35 | | | | 1.99% | | | | 1.87% | |
Administrator Class (WFPDX) | | | 07/16/2010 | | | | | | | | | | | | | | | | | | | | 2.44 | | | | 8.13 | | | | 6.39 | | | | 5.22 | | | | 1.08% | | | | 0.95% | |
Institutional Class (EKJYX) | | | 06/30/1999 | | | | | | | | | | | | | | | | | | | | 2.54 | | | | 8.33 | | | | 6.60 | | | | 5.43 | | | | 0.81% | | | | 0.75% | |
Investor Class (WFPNX) | | | 07/16/2010 | | | | | | | | | | | | | | | | | | | | 2.35 | | | | 7.92 | | | | 6.23 | | | | 5.06 | | | | 1.31% | | | | 1.19% | |
Russell 1000® Growth Index6 | | | | | | | | | | | | | | | | | | | | | | | 2.84 | | | | 6.07 | | | | 3.17 | | | | 3.38 | | | | | | | | | |
| * | Returns for periods of less than one year are not annualized. |
| ** | Class B shares are closed to investment, except in connection with the reinvestment of any distributions and permitted exchanges. |
Figures quoted represent past performance, which is no guarantee of future results and do not reflect the deduction of taxes that a shareholder may pay on fund distributions or the redemption of fund shares. Investment return and principal value of an investment will fluctuate so that an investor’s shares, when redeemed, may be worth more or less than their original cost. Performance shown without sales charges would be lower if sales charges were reflected. Current performance may be lower or higher than the performance data quoted and assumes the reinvestment of dividends and capital gains. Current month-end performance is available on the Fund’s Web site – wellsfargoadvantagefunds.com
Index returns do not include transaction costs associated with buying and selling securities, any mutual fund fees or expenses or any taxes. It is not possible to invest directly in an index.
For Class A shares, the maximum front-end sales charge is 5.75%. For Class B shares, the maximum contingent deferred sales charge is 5.00%. For Class C shares, the maximum contingent deferred sales charge is 1.00%. Performance including sales charge assumes the sales charge for the corresponding time period. Administrator Class, Institutional Class and Investor Class shares are sold without a front-end sales charge or contingent deferred sales charge.
Stock fund values fluctuate in response to the activities of individual companies and general market and economic conditions. Certain investment strategies tend to increase the total risk of an investment (relative to the broader market). This Fund is exposed to foreign investment risk. Consult the Fund’s prospectus for additional information on these and other risks.
| 3. | Historical performance shown for the Administrator Class shares prior to their inception reflects the performance of the Institutional Class shares, adjusted to reflect the higher expenses applicable to the Administrator Class shares. Historical performance shown for the Investor Class shares prior to their inception reflects the performance of the Class A shares, adjusted to reflect the higher expenses applicable to the Investor Class shares. Historical performance shown for all classes of the Fund prior to July 19, 2010 is based on the performance of the Fund’s predecessor, Evergreen Large Company Growth Fund. |
| 4. | Reflects the expense ratios as stated in the most recent prospectuses. |
| 5. | The Adviser has committed through July 18, 2013 to waive fees and/or reimburse expenses to the extent necessary to cap the Fund’s Total Annual Fund Operating Expenses After Fee Waiver, excluding certain expenses, at the amounts shown above. Without this cap, the Fund’s returns would have been lower. |
| 6. | The Russell 1000® Growth Index measures the performance of those Russell 1000 Growth Index companies with higher price-to-book ratios and higher forecasted growth values. You cannot invest directly in an index. |
| | | | | | |
| Fund Expenses (Unaudited) | | Wells Fargo Advantage Premier Large Company Growth Fund | | | 7 | |
As a shareholder of the Fund, you incur two types of costs: (1) transaction costs, including sales charges (loads) on purchase payments and contingent deferred sales charges (if any) on redemptions and (2) ongoing costs, including management fees; distribution (12b-1) and/or shareholder service fees; and other Fund expenses. This example is intended to help you understand your ongoing costs (in dollars) of investing in the Fund and to compare these costs with the ongoing costs of investing in other mutual funds.
The example is based on an investment of $1,000 invested at the beginning of the six-month period and held for the entire period from August 1, 2011 to January 31, 2012.
Actual Expenses
The “Actual” line of the table below provides information about actual account values and actual expenses. You may use the information in this line, together with the amount you invested, to estimate the expenses that you paid over the period. Simply divide your account value by $1,000 (for example, an $8,600 account value divided by $1,000 = 8.6), then multiply the result by the number in the “Actual” line under the heading entitled “Expenses Paid During Period” for your applicable class of shares to estimate the expenses you paid on your account during this period.
Hypothetical Example for Comparison Purposes
The “Hypothetical” line of the table below provides information about hypothetical account values and hypothetical expenses based on the Fund’s actual expense ratio and an assumed rate of return of 5% per year before expenses, which is not the Fund’s actual return. The hypothetical account values and expenses may not be used to estimate the actual ending account balance or expenses you paid for the period. You may use this information to compare the ongoing costs of investing in the Fund and other funds. To do so, compare this 5% hypothetical example with the 5% hypothetical examples that appear in the shareholder reports of the other funds.
Please note that the expenses shown in the table are meant to highlight your ongoing costs only and do not reflect any transactional costs, such as sales charges (loads) and contingent deferred sales charges. Therefore, the “Hypothetical” line of the table is useful in comparing ongoing costs only, and will not help you determine the relative total costs of owning different funds. In addition, if these transactional costs were included, your costs would have been higher.
| | | | | | | | | | | | | | | | |
| | | Beginning
Account Value
08-01-2011 | | | Ending
Account Value
01-31-2012 | | | Expenses
Paid During
the Period1 | | | Net Annual
Expense Ratio | |
Class A | | | | | | | | | | | | | | | | |
Actual | | $ | 1,000.00 | | | $ | 1,024.47 | | | $ | 5.70 | | | | 1.12 | % |
Hypothetical (5% return before expenses) | | $ | 1,000.00 | | | $ | 1,019.51 | | | $ | 5.69 | | | | 1.12 | % |
Class B | | | | | | | | | | | | | | | | |
Actual | | $ | 1,000.00 | | | $ | 1,020.18 | | | $ | 9.50 | | | | 1.87 | % |
Hypothetical (5% return before expenses) | | $ | 1,000.00 | | | $ | 1,015.74 | | | $ | 9.48 | | | | 1.87 | % |
Class C | | | | | | | | | | | | | | | | |
Actual | | $ | 1,000.00 | | | $ | 1,020.26 | | | $ | 9.50 | | | | 1.87 | % |
Hypothetical (5% return before expenses) | | $ | 1,000.00 | | | $ | 1,015.74 | | | $ | 9.48 | | | | 1.87 | % |
Administrator Class | | | | | | | | | | | | | | | | |
Actual | | $ | 1,000.00 | | | $ | 1,024.44 | | | $ | 4.83 | | | | 0.95 | % |
Hypothetical (5% return before expenses) | | $ | 1,000.00 | | | $ | 1,020.36 | | | $ | 4.82 | | | | 0.95 | % |
Institutional Class | | | | | | | | | | | | | | | | |
Actual | | $ | 1,000.00 | | | $ | 1,025.40 | | | $ | 3.82 | | | | 0.75 | % |
Hypothetical (5% return before expenses) | | $ | 1,000.00 | | | $ | 1,021.37 | | | $ | 3.81 | | | | 0.75 | % |
Investor Class | | | | | | | | | | | | | | | | |
Actual | | $ | 1,000.00 | | | $ | 1,023.48 | | | $ | 6.05 | | | | 1.19 | % |
Hypothetical (5% return before expenses) | | $ | 1,000.00 | | | $ | 1,019.15 | | | $ | 6.04 | | | | 1.19 | % |
| 1. | Expenses paid is equal to the annualized expense ratio of each class multiplied by the average account value over the period, multiplied by the number of days in the most recent fiscal half-year divided by the number of days in the fiscal year (to reflect the one-half year period). |
| | | | |
| 8 | | Wells Fargo Advantage Premier Large Company Growth Fund | | Portfolio of Investments—January 31, 2012 (Unaudited) |
| | | | | | | | | | | | |
| Security Name | | | | | | Shares | | | Value | |
| | | | | | | | | | | | |
| | | | |
Common Stocks: 95.76% | | | | | | | | | | | | |
| | | | |
Consumer Discretionary: 18.05% | | | | | | | | | | | | |
| | | | |
| Auto Components: 1.39% | | | | | | | | | | | | |
Gentex Corporation« | | | | | | | 159,500 | | | $ | 4,285,765 | |
Johnson Controls Incorporated | | | | | | | 285,500 | | | | 9,070,335 | |
| | | | |
| | | | | | | | | | | 13,356,100 | |
| | | | | | | | | | | | |
| | | | |
| Hotels, Restaurants & Leisure: 3.35% | | | | | | | | | | | | |
Las Vegas Sands Corporation | | | | | | | 70,000 | | | | 3,437,700 | |
McDonald’s Corporation | | | | | | | 98,000 | | | | 9,706,900 | |
Starbucks Corporation | | | | | | | 244,500 | | | | 11,718,885 | |
Wynn Resorts Limited | | | | | | | 64,500 | | | | 7,432,335 | |
| | | | |
| | | | | | | | | | | 32,295,820 | |
| | | | | | | | | | | | |
| | | | |
| Household Durables: 0.53% | | | | | | | | | | | | |
Tempur-Pedic International IncorporatedǠ | | | | | | | 76,000 | | | | 5,069,960 | |
| | | | | | | | | | | | |
| | | | |
| Internet & Catalog Retail: 3.30% | | | | | | | | | | | | |
Amazon.com Incorporated† | | | | | | | 65,000 | | | | 12,638,600 | |
priceline.com Incorporated† | | | | | | | 36,100 | | | | 19,114,228 | |
| | | | |
| | | | | | | | | | | 31,752,828 | |
| | | | | | | | | | | | |
| | | | |
| Multiline Retail: 1.46% | | | | | | | | | | | | |
Dollar Tree Incorporated† | | | | | | | 166,000 | | | | 14,078,460 | |
| | | | | | | | | | | | |
| | | | |
| Specialty Retail: 6.98% | | | | | | | | | | | | |
CarMax IncorporatedǠ | | | | | | | 628,500 | | | | 19,125,255 | |
Dick’s Sporting Goods Incorporated† | | | | | | | 407,000 | | | | 16,772,470 | |
O’Reilly Automotive Incorporated† | | | | | | | 187,000 | | | | 15,242,370 | |
Tractor Supply Company | | | | | | | 189,000 | | | | 15,265,530 | |
| | | | |
| | | | | | | | | | | 66,405,625 | |
| | | | | | | | | | | | |
| | | | |
| Textiles, Apparel & Luxury Goods: 1.04% | | | | | | | | | | | | |
Coach Incorporated | | | | | | | 107,000 | | | | 7,495,350 | |
Fossil Incorporated† | | | | | | | 26,000 | | | | 2,471,300 | |
| | | | |
| | | | | | | | | | | 9,966,650 | |
| | | | | | | | | | | | |
| | | | |
Consumer Staples: 3.38% | | | | | | | | | | | | |
| | | | |
| Food & Staples Retailing: 2.67% | | | | | | | | | | | | |
Costco Wholesale Corporation | | | | | | | 11,000 | | | | 899,855 | |
Whole Foods Market Incorporated | | | | | | | 334,500 | | | | 24,763,035 | |
| | | | |
| | | | | | | | | | | 25,662,890 | |
| | | | | | | | | | | | |
| | | | |
| Food Products: 0.26% | | | | | | | | | | | | |
Green Mountain Coffee Roasters Incorporated† | | | | | | | 14,500 | | | | 773,430 | |
Mead Johnson & Company | | | | | | | 34,000 | | | | 2,519,060 | |
| | | | |
| | | | | | | | | | | 3,292,490 | |
| | | | | | | | | | | | |
| | | | |
| Personal Products: 0.45% | | | | | | | | | | | | |
Estee Lauder Companies Incorporated Class A | | | | | | | 74,900 | | | | 4,338,957 | |
| | | | | | | | | | | | |
| | | | | | |
| Portfolio of Investments—January 31, 2012 (Unaudited) | | Wells Fargo Advantage Premier Large Company Growth Fund | | | 9 | |
| | | | | | | | | | | | |
| Security Name | | | | | | Shares | | | Value | |
| | | | | | | | | | | | |
| | | | |
Energy: 7.93% | | | | | | | | | | | | |
| | | | |
| Energy Equipment & Services: 1.88% | | | | | | | | | | | | |
National Oilwell Varco Incorporated | | | | | | | 82,500 | | | $ | 6,103,350 | |
Schlumberger Limited | | | | | | | 159,500 | | | | 11,989,615 | |
| | | | |
| | | | | | | | | | | 18,092,965 | |
| | | | | | | | | | | | |
| | | | |
| Oil, Gas & Consumable Fuels: 6.05% | | | | | | | | | | | | |
Concho Resources IncorporatedǠ | | | | | | | 113,000 | | | | 12,052,580 | |
Continental Resources IncorporatedǠ | | | | | | | 100,000 | | | | 8,068,000 | |
Oasis Petroleum IncorporatedǠ | | | | | | | 82,500 | | | | 2,783,550 | |
Occidental Petroleum Corporation | | | | | | | 76,800 | | | | 7,662,336 | |
Pioneer Natural Resources Company | | | | | | | 263,700 | | | | 26,185,410 | |
Southwestern Energy Company† | | | | | | | 48,500 | | | | 1,510,290 | |
| | | | |
| | | | | | | | | | | 58,262,166 | |
| | | | | | | | | | | | |
| | | | |
Financials: 5.57% | | | | | | | | | | | | |
| | | | |
| Capital Markets: 2.66% | | | | | | | | | | | | |
Ameriprise Financial Incorporated | | | | | | | 96,000 | | | | 5,140,800 | |
LPL Investment Holdings Incorporated† | | | | | | | 174,500 | | | | 5,732,325 | |
T. Rowe Price Group Incorporated | | | | | | | 17,000 | | | | 983,280 | |
TD Ameritrade Holding Corporation | | | | | | | 852,300 | | | | 13,730,553 | |
| | | | |
| | | | | | | | | | | 25,586,958 | |
| | | | | | | | | | | | |
| | | | |
| Consumer Finance: 2.91% | | | | | | | | | | | | |
American Express Company | | | | | | | 212,000 | | | | 10,629,680 | |
MasterCard Incorporated | | | | | | | 49,000 | | | | 17,422,930 | |
| | | | |
| | | | | | | | | | | 28,052,610 | |
| | | | | | | | | | | | |
| | | | |
Health Care: 13.37% | | | | | | | | | | | | |
| | | | |
| Biotechnology: 3.71% | | | | | | | | | | | | |
Alexion Pharmaceuticals Incorporated† | | | | | | | 366,000 | | | | 28,094,160 | |
Biogen Idec Incorporated† | | | | | | | 65,000 | | | | 7,664,800 | |
| | | | |
| | | | | | | | | | | 35,758,960 | |
| | | | | | | | | | | | |
| | | | |
| Health Care Equipment & Supplies: 3.42% | | | | | | | | | | | | |
Covidien plc | | | | | | | 146,500 | | | | 7,544,750 | |
Intuitive Surgical Incorporated† | | | | | | | 29,500 | | | | 13,567,345 | |
St. Jude Medical Incorporated | | | | | | | 282,500 | | | | 11,783,075 | |
| | | | |
| | | | | | | | | | | 32,895,170 | |
| | | | | | | | | | | | |
| | | | |
| Health Care Providers & Services: 0.92% | | | | | | | | | | | | |
AmerisourceBergen Corporation | | | | | | | 226,200 | | | | 8,815,014 | |
| | | | | | | | | | | | |
| | | | |
| Health Care Technology: 0.38% | | | | | | | | | | | | |
Cerner Corporation† | | | | | | | 60,500 | | | | 3,683,845 | |
| | | | | | | | | | | | |
| | | | |
| Life Sciences Tools & Services: 2.20% | | | | | | | | | | | | |
Mettler-Toledo International IncorporatedǠ | | | | | | | 120,500 | | | | 21,147,750 | |
| | | | | | | | | | | | |
| | | | |
| 10 | | Wells Fargo Advantage Premier Large Company Growth Fund | | Portfolio of Investments—January 31, 2012 (Unaudited) |
| | | | | | | | | | | | |
| Security Name | | | | | | Shares | | | Value | |
| | | | | | | | | | | | |
| | | | |
| Pharmaceuticals: 2.74% | | | | | | | | | | | | |
Allergan Incorporated | | | | | | | 108,200 | | | $ | 9,511,862 | |
Shire plc ADR | | | | | | | 170,000 | | | | 16,918,400 | |
| | | | |
| | | | | | | | | | | 26,430,262 | |
| | | | | | | | | | | | |
| | | | |
Industrials: 10.27% | | | | | | | | | | | | |
| | | | |
| Aerospace & Defense: 1.12% | | | | | | | | | | | | |
United Technologies Corporation | | | | | | | 137,500 | | | | 10,773,125 | |
| | | | | | | | | | | | |
| | | | |
| Air Freight & Logistics: 1.00% | | | | | | | | | | | | |
C.H. Robinson Worldwide Incorporated | | | | | | | 119,500 | | | | 8,226,380 | |
United Parcel Service Incorporated Class B | | | | | | | 19,000 | | | | 1,457,490 | |
| | | | |
| | | | | | | | | | | 9,683,870 | |
| | | | | | | | | | | | |
| | | | |
| Electrical Equipment: 0.38% | | | | | | | | | | | | |
Polypore International IncorporatedǠ | | | | | | | 97,000 | | | | 3,693,760 | |
| | | | | | | | | | | | |
| | | | |
| Machinery: 2.93% | | | | | | | | | | | | |
Caterpillar Incorporated | | | | | | | 18,000 | | | | 1,964,160 | |
Danaher Corporation | | | | | | | 168,000 | | | | 8,821,680 | |
Gardner Denver Incorporated | | | | | | | 57,000 | | | | 4,252,200 | |
Joy Global Incorporated | | | | | | | 145,000 | | | | 13,150,050 | |
| | | | |
| | | | | | | | | | | 28,188,090 | |
| | | | | | | | | | | | |
| | | | |
| Road & Rail: 4.84% | | | | | | | | | | | | |
Kansas City Southern† | | | | | | | 363,700 | | | | 24,964,368 | |
Norfolk Southern Corporation | | | | | | | 121,700 | | | | 8,786,740 | |
Union Pacific Corporation | | | | | | | 112,000 | | | | 12,802,720 | |
| | | | |
| | | | | | | | | | | 46,553,828 | |
| | | | | | | | | | | | |
| | | | |
Information Technology: 33.51% | | | | | | | | | | | | |
| | | | |
| Communications Equipment: 2.99% | | | | | | | | | | | | |
Cisco Systems Incorporated | | | | | | | 161,000 | | | | 3,160,430 | |
F5 Networks Incorporated† | | | | | | | 55,500 | | | | 6,645,570 | |
QUALCOMM Incorporated | | | | | | | 265,000 | | | | 15,587,300 | |
Riverbed Technology Incorporated† | | | | | | | 143,000 | | | | 3,423,420 | |
| | | | |
| | | | | | | | | | | 28,816,720 | |
| | | | | | | | | | | | |
| | | | |
| Computers & Peripherals: 10.00% | | | | | | | | | | | | |
Apple Incorporated† | | | | | | | 153,500 | | | | 70,069,680 | |
EMC Corporation† | | | | | | | 1,017,500 | | | | 26,210,800 | |
| | | | |
| | | | | | | | | | | 96,280,480 | |
| | | | | | | | | | | | |
| | | | |
| Internet Software & Services: 6.17% | | | | | | | | | | | | |
eBay Incorporated† | | | | | | | 517,500 | | | | 16,353,000 | |
Google Incorporated Class A† | | | | | | | 43,600 | | | | 25,292,796 | |
Mercadolibre Incorporated | | | | | | | 10,500 | | | | 917,700 | |
Rackspace Hosting Incorporated† | | | | | | | 386,500 | | | | 16,777,965 | |
| | | | |
| | | | | | | | | | | 59,341,461 | |
| | | | | | | | | | | | |
| | | | | | |
| Portfolio of Investments—January 31, 2012 (Unaudited) | | Wells Fargo Advantage Premier Large Company Growth Fund | | | 11 | |
| | | | | | | | | | | | |
| Security Name | | | | | | Shares | | | Value | |
| | | | | | | | | | | | |
| | | | |
| IT Services: 6.93% | | | | | | | | | | | | |
Accenture plc | | | | | | | 307,500 | | | $ | 17,632,050 | |
Alliance Data Systems CorporationǠ | | | | | | | 128,500 | | | | 14,237,800 | |
Cognizant Technology Solutions Corporation Class A† | | | | | | | 393,000 | | | | 28,197,750 | |
VeriFone Holdings Incorporated† | | | | | | | 156,000 | | | | 6,661,200 | |
| | | | |
| | | | | | | | | | | 66,728,800 | |
| | | | | | | | | | | | |
| | | | |
| Semiconductors & Semiconductor Equipment: 3.42% | | | | | | | | | | | | |
Altera Corporation | | | | | | | 35,000 | | | | 1,392,650 | |
Analog Devices Incorporated | | | | | | | 119,700 | | | | 4,683,861 | |
Avago Technologies Limited | | | | | | | 162,000 | | | | 5,498,280 | |
Cavium Incorporated† | | | | | | | 121,000 | | | | 3,888,940 | |
Maxim Integrated Products Incorporated | | | | | | | 124,500 | | | | 3,341,580 | |
Microchip Technology Incorporated« | | | | | | | 310,000 | | | | 11,442,100 | |
NetLogic Microsystems Incorporated† | | | | | | | 53,000 | | | | 2,639,400 | |
| | | | |
| | | | | | | | | | | 32,886,811 | |
| | | | | | | | | | | | |
| | | | |
| Software: 4.00% | | | | | | | | | | | | |
Check Point Software Technologies LimitedǠ | | | | | | | 135,500 | | | | 7,627,295 | |
Citrix Systems Incorporated† | | | | | | | 146,500 | | | | 9,553,265 | |
Red Hat Incorporated† | | | | | | | 271,000 | | | | 12,566,270 | |
Salesforce.com IncorporatedǠ | | | | | | | 39,500 | | | | 4,613,600 | |
VMware Incorporated† | | | | | | | 45,000 | | | | 4,107,150 | |
| | | | |
| | | | | | | | | | | 38,467,580 | |
| | | | | | | | | | | | |
| | | | |
Materials: 3.68% | | | | | | | | | | | | |
| | | | |
| Chemicals: 3.68% | | | | | | | | | | | | |
Air Products & Chemicals Incorporated | | | | | | | 55,500 | | | | 4,885,665 | |
Monsanto Company | | | | | | | 91,300 | | | | 7,491,165 | |
Praxair Incorporated | | | | | | | 216,900 | | | | 23,034,781 | |
| | | | |
| | | | | | | | | | | 35,411,611 | |
| | | | | | | | | | | | |
| | | | |
Total Common Stocks (Cost $695,458,225) | | | | | | | | | | | 921,771,616 | |
| | | | | | | | | | | | |
| | | | |
Investment Companies: 1.43% | | | | | | | | | | | | |
iShares Russell 1000 Growth | | | | | | | 224,500 | | | | 13,757,360 | |
| | | | | | | | | | | | |
| | | | |
Total Investment Companies (Cost $13,190,853) | | | | | | | | | | | 13,757,360 | |
| | | | | | | | | | | | |
| | | | |
| | | | | | | Principal | | | | |
| | | | |
Other: 0.10% | | | | | | | | | | | | |
Gryphon Funding Limited, Pass-Through Entity(v)(i)(a) | | | | | | $ | 1,322,167 | | | | 356,985 | |
VFNC Corporation, Pass-Through Entity, 0.27%(v)(i)(a)±144A | | | | | | | 1,506,610 | | | | 647,842 | |
| | | | |
Total Other (Cost $469,655) | | | | | | | | | | | 1,004,827 | |
| | | | | | | | | | | | |
| | | | |
| 12 | | Wells Fargo Advantage Premier Large Company Growth Fund | | Portfolio of Investments—January 31, 2012 (Unaudited) |
| | | | | | | | | | | | | | |
| Security Name | | Yield | | | | | Shares | | | Value | |
| | | | | | | | | | | | | | |
| | | | |
Short-Term Investments: 10.07% | | | | | | | | | | | | | | |
| | | | |
| Investment Companies: 10.07% | | | | | | | | | | | | | | |
Wells Fargo Advantage Cash Investment Money Market Fund, Institutional Class(l)(u) | | | 0.02 | % | | | | | 29,623,519 | | | $ | 29,623,519 | |
Wells Fargo Securities Lending Cash Investments, LLC(v)(l)(u)(r) | | | 0.15 | | | | | | 67,324,983 | | | | 67,324,983 | |
| | | | |
Total Short-Term Investments (Cost $96,948,502) | | | | | | | | | | | | �� | 96,948,502 | |
| | | | | | | | | | | | | | |
| | | | | | | | |
| Total Investments in Securities | | | | | | | | |
| (Cost $806,067,235)* | | | 107.36 | % | | | 1,033,482,305 | |
Other Assets and Liabilities, Net | | | (7.36 | ) | | | (70,871,755 | ) |
| | | | | | | | |
| Total Net Assets | | | 100.00 | % | | $ | 962,610,550 | |
| | | | | | | | |
| « | All or a portion of this security is on loan. |
| † | Non-income earning security. |
| (v) | Security represents investment of cash collateral received from securities on loan. |
| (a) | Security is fair valued by the Management Valuation Team, and in certain instances by the Board of Trustees, in accordance with procedures approved by the Board of Trustees. |
| ± | Variable rate investment. |
| 144A | Security that may be resold to “qualified institutional buyers” under Rule 144A or security offered pursuant to Section 4(2) of the Securities Act of 1933, as amended. |
| (l) | Investment in an affiliate. |
| (u) | Rate shown is the 7-day annualized yield at period end. |
| (r) | The investment company is exempt from registration under Section 3(c)(7) of the 1940 Act. |
| * | Cost for federal income tax purposes is $809,183,776 and net unrealized appreciation (depreciation) consists of: |
| | | | |
Gross unrealized appreciation | | $ | 228,706,251 | |
Gross unrealized depreciation | | | (4,407,722 | ) |
| | | | |
Net unrealized appreciation | | $ | 224,298,529 | |
The accompanying notes are an integral part of these financial statements.
| | | | | | |
| Statement of Assets and Liabilities—January 31, 2012 (Unaudited) | | Wells Fargo Advantage Premier Large Company Growth Fund | | | 13 | |
| | | | |
| | | | |
| |
Assets | | | | |
Investments | | | | |
In unaffiliated securities (including securities on loan), at value (see cost below) | | $ | 936,533,803 | |
In affiliated securities, at value (see cost below) | | | 96,948,502 | |
| | | | |
Total investments, at value (see cost below) | | | 1,033,482,305 | |
Receivable for investments sold | | | 6,550,976 | |
Receivable for Fund shares sold | | | 5,287,863 | |
Receivable for dividends | | | 174,465 | |
Receivable for securities lending income | | | 6,721 | |
Prepaid expenses and other assets | | | 123,048 | |
| | | | |
Total assets | | | 1,045,625,378 | |
| | | | |
| |
Liabilities | | | | |
Payable for investments purchased | | | 12,735,010 | |
Payable for Fund shares redeemed | | | 1,517,080 | |
Payable upon receipt of securities loaned | | | 67,794,638 | |
Advisory fee payable | | | 389,055 | |
Distribution fees payable | | | 38,330 | |
Due to other related parties | | | 200,861 | |
Accrued expenses and other liabilities | | | 339,854 | |
| | | | |
Total liabilities | | | 83,014,828 | |
| | | | |
Total net assets | | $ | 962,610,550 | |
| | | | |
| |
NET ASSETS CONSIST OF | | | | |
Paid-in capital | | $ | 821,943,729 | |
Undistributed net investment loss | | | (1,448,606 | ) |
Accumulated net realized losses on investments | | | (85,299,643 | ) |
Net unrealized gains on investments | | | 227,415,070 | |
| | | | |
Total net assets | | $ | 962,610,550 | |
| | | | |
| |
COMPUTATION OF NET ASSET VALUE AND OFFERING PRICE PER SHARE1 | | | | |
Net assets – Class A | | $ | 675,156,936 | |
Shares outstanding – Class A | | | 68,506,367 | |
Net asset value per share – Class A | | | $9.86 | |
Maximum offering price per share – Class A2 | | | $10.46 | |
Net assets – Class B | | $ | 8,271,455 | |
Shares outstanding – Class B | | | 928,526 | |
Net asset value per share – Class B | | | $8.91 | |
Net assets – Class C | | $ | 52,162,199 | |
Shares outstanding – Class C | | | 5,871,162 | |
Net asset value per share – Class C | | | $8.88 | |
Net assets – Administrator Class | | $ | 81,125,006 | |
Shares outstanding – Administrator Class | | | 8,216,049 | |
Net asset value per share – Administrator Class | | | $9.87 | |
Net assets – Institutional Class | | $ | 63,742,785 | |
Shares outstanding – Institutional Class | | | 6,436,614 | |
Net asset value per share – Institutional Class | | | $9.90 | |
Net assets – Investor Class | | $ | 82,152,169 | |
Shares outstanding – Investor Class | | | 8,350,271 | |
Net asset value per share – Investor Class | | | $9.84 | |
| |
Investments in unaffiliated securities, at cost | | $ | 709,118,733 | |
| | | | |
Investments in affiliated securities, at cost | | $ | 96,948,502 | |
| | | | |
Total investments, at cost | | $ | 806,067,235 | |
| | | | |
Securities on loan, at value | | $ | 66,360,234 | |
| | | | |
| 1. | The Fund has an unlimited number of authorized shares. |
| 2. | Maximum offering price is computed as 100/94.25 of net asset value. On investments of $50,000 or more, the offering price is reduced. |
The accompanying notes are an integral part of these financial statements.
| | | | |
| 14 | | Wells Fargo Advantage Premier Large Company Growth Fund | | Statement of Operations—Six Months Ended January 31, 2012 (Unaudited) |
| | | | |
| | | | |
| |
Investment income | | | | |
Dividends | | $ | 3,286,592 | |
Securities lending income, net | | | 65,919 | |
Income from affiliated securities | | | 17,497 | |
| | | | |
Total investment income | | | 3,370,008 | |
| | | | |
| |
Expenses | | | | |
Advisory fee | | | 2,674,823 | |
Administration fees | | | | |
Fund level | | | 208,959 | |
Class A | | | 789,902 | |
Class B | | | 11,142 | |
Class C | | | 57,094 | |
Administrator Class | | | 28,388 | |
Institutional Class | | | 15,373 | |
Investor Class | | | 132,857 | |
Shareholder servicing fees | | | | |
Class A | | | 759,521 | |
Class B | | | 10,714 | |
Class C | | | 54,898 | |
Administrator Class | | | 70,970 | |
Investor Class | | | 96,137 | |
Distribution fees | | | | |
Class B | | | 32,141 | |
Class C | | | 164,695 | |
Custody and accounting fees | | | 24,395 | |
Professional fees | | | 29,300 | |
Registration fees | | | 46,386 | |
Shareholder report expenses | | | 34,385 | |
Trustees’ fees and expenses | | | 2,108 | |
Other fees and expenses | | | 12,836 | |
| | | | |
Total expenses | | | 5,257,024 | |
Less: Fee waivers and/or expense reimbursements | | | (470,695 | ) |
| | | | |
Net expenses | | | 4,786,329 | |
| | | | |
Net investment loss | | | (1,416,321 | ) |
| | | | |
| |
REALIZED AND UNREALIZED GAINS (LOSSES) ON INVESTMENTS | | | | |
Net realized losses on investments | | | (10,441,413 | ) |
Net change in unrealized gains (losses) on investments | | | 38,279,543 | |
| | | | |
Net realized and unrealized gains (losses) on investments | | | 27,838,130 | |
| | | | |
Net increase in net assets resulting from operations | | $ | 26,421,809 | |
| | | | |
The accompanying notes are an integral part of these financial statements.
| | | | | | |
| Statements of Changes in Net Assets | | Wells Fargo Advantage Premier Large Company Growth Fund | | | 15 | |
| | | | | | | | | | | | | | | | |
| | | Six Months Ended
January 31, 2012
(Unaudited) | | | Year Ended
July 31, 2011 | |
| | | | |
Operations | | | | | | | | | | | | | | | | |
Net investment loss | | | | | | $ | (1,416,321 | ) | | | | | | $ | (1,217,760 | ) |
Net realized gains (losses) on investments | | | | | | | (10,441,413 | ) | | | | | | | 41,137,232 | |
Net change in unrealized gains (losses) on investments | | | | | | | 38,279,543 | | | | | | | | 135,655,888 | |
| | | | | | | | | | | | | | | | |
Net increase in net assets resulting from operations | | | | | | | 26,421,809 | | | | | | | | 175,575,360 | |
| | | | | | | | | | | | | | | | |
| | | | |
Distributions to shareholders from | | | | | | | | | | | | | | | | |
Net investment income | | | | | | | | | | | | | | | | |
Class A | | | | | | | 0 | | | | | | | | (292,828 | ) |
Administrator Class | | | | | | | 0 | | | | | | | | (47,613 | ) |
Institutional Class | | | | | | | 0 | | | | | | | | (31,262 | ) |
Investor Class | | | | | | | 0 | | | | | | | | (75,138 | ) |
Net realized gains | | | | | | | | | | | | | | | | |
Class A | | | | | | | (16,290,744 | ) | | | | | | | 0 | |
Class B | | | | | | | (232,403 | ) | | | | | | | 0 | |
Class C | | | | | | | (1,336,936 | ) | | | | | | | 0 | |
Administrator Class | | | | | | | (1,567,504 | ) | | | | | | | 0 | |
Institutional Class | | | | | | | (1,091,657 | ) | | | | | | | 0 | |
Investor Class | | | | | | | (2,041,500 | ) | | | | | | | 0 | |
| | | | | | | | | | | | | | | | |
Total distributions to shareholders | | | | | | | (22,560,744 | ) | | | | | | | (446,841 | ) |
| | | | | | | | | | | | | | | | |
| | | | |
Capital share transactions | | | Shares | | | | | | | | Shares | | | | | |
Proceeds from shares sold | | | | | | | | | | | | | | | | |
Class A | | | 9,766,193 | | | | 89,950,614 | | | | 8,063,099 | | | | 76,433,132 | |
Class B | | | 70,797 | | | | 593,864 | | | | 60,305 | | | | 522,352 | |
Class C | | | 2,497,662 | | | | 20,859,782 | | | | 1,348,270 | | | | 11,798,975 | |
Administrator Class | | | 3,788,769 | | | | 36,127,137 | | | | 2,796,716 | | | | 26,595,581 | |
Institutional Class | | | 3,771,248 | | | | 36,149,783 | | | | 1,754,955 | | | | 16,280,347 | |
Investor Class | | | 1,548,373 | | | | 14,365,127 | | | | 678,085 | | | | 6,376,951 | |
| | | | | | | | | | | | | | | | |
| | | | | | | 198,046,307 | | | | | | | | 138,007,338 | |
| | | | | | | | | | | | | | | | |
Reinvestment of distributions | | | | | | | | | | | | | | | | |
Class A | | | 1,545,287 | | | | 14,602,964 | | | | 28,108 | | | | 259,156 | |
Class B | | | 23,672 | | | | 202,400 | | | | 0 | | | | 0 | |
Class C | | | 93,610 | | | | 797,556 | | | | 0 | | | | 0 | |
Administrator Class | | | 120,175 | | | | 1,136,851 | | | | 2,993 | | | | 27,596 | |
Institutional Class | | | 101,699 | | | | 965,124 | | | | 2,785 | | | | 25,680 | |
Investor Class | | | 210,673 | | | | 1,986,646 | | | | 7,938 | | | | 73,111 | |
| | | | | | | | | | | | | | | | |
| | | | | | | 19,691,541 | | | | | | | | 385,543 | |
| | | | | | | | | | | | | | | | |
Payment for shares redeemed | | | | | | | | | | | | | | | | |
Class A | | | (5,547,068 | ) | | | (51,977,768 | ) | | | (8,759,829 | ) | | | (80,572,170 | ) |
Class B | | | (304,894 | ) | | | (2,569,583 | ) | | | (887,438 | ) | | | (7,456,646 | ) |
Class C | | | (708,698 | ) | | | (5,980,444 | ) | | | (502,012 | ) | | | (4,180,655 | ) |
Administrator Class | | | (1,183,528 | ) | | | (10,919,079 | ) | | | (2,022,104 | ) | | | (18,667,990 | ) |
Institutional Class | | | (511,736 | ) | | | (4,810,145 | ) | | | (1,114,377 | ) | | | (10,454,872 | ) |
Investor Class | | | (1,456,365 | ) | | | (13,311,780 | ) | | | (999,907 | ) | | | (9,231,530 | ) |
| | | | | | | | | | | | | | | | |
| | | | | | | (89,568,799 | ) | | | | | | | (130,563,863 | ) |
| | | | | | | | | | | | | | | | |
Net increase in net assets resulting
from capital share transactions | | | | | | | 128,169,049 | | | | | | | | 7,829,018 | |
| | | | | | | | | | | | | | | | |
Total increase in net assets | | | | | | | 132,030,114 | | | | | | | | 182,957,537 | |
| | | | | | | | | | | | | | | | |
| | | | |
Net assets | | | | | | | | | | | | | | | | |
Beginning of period | | | | | | | 830,580,436 | | | | | | | | 647,622,899 | |
| | | | | | | | | | | | | | | | |
End of period | | | | | | $ | 962,610,550 | | | | | | | $ | 830,580,436 | |
| | | | | | | | | | | | | | | | |
Undistributed (accumulated) net investment loss | | | | | | $ | (1,448,606 | ) | | | | | | $ | (32,285 | ) |
| | | | | | | | | | | | | | | | |
The accompanying notes are an integral part of these financial statements.
| | | | |
| 16 | | Wells Fargo Advantage Premier Large Company Growth Fund | | Financial Highlights |
(For a share outstanding throughout each period)
| | | | | | | | | | | | | | | | | | | | | | | | | | | | |
| | | Six Months Ended
January 31, 2012 (Unaudited) | | | Year Ended July 31, | | | Year Ended September 30, | |
| Class A | | | 2011 | | | 20101,2 | | | 20091 | | | 20081 | | | 20071 | | | 20061 | |
Net asset value, beginning of period | | $ | 9.89 | | | $ | 7.75 | | | $ | 7.23 | | | $ | 7.20 | | | $ | 8.50 | | | $ | 6.96 | | | $ | 6.66 | |
Net investment income (loss) | | | (0.02 | ) | | | (0.01 | ) | | | 0.00 | 3 | | | 0.05 | 3 | | | 0.03 | 3 | | | 0.01 | 3 | | | (0.00 | )3 |
Net realized and unrealized gains (losses) on investments | | | 0.24 | | | | 2.15 | | | | 0.57 | | | | 0.02 | | | | (1.33 | ) | | | 1.53 | | | | 0.31 | |
| | | | | | | | | | | | | | | | | | | | | | | | | | | | |
Total from investment operations | | | 0.22 | | | | 2.14 | | | | 0.57 | | | | 0.07 | | | | (1.30 | ) | | | 1.54 | | | | 0.31 | |
Distributions to shareholders from | | | | | | | | | | | | | | | | | | | | | | | | | | | | |
Net investment income | | | 0.00 | | | | (0.00 | )4 | | | (0.05 | ) | | | (0.04 | ) | | | (0.00 | )4 | | | 0.00 | | | | (0.01 | ) |
Net realized gains | | | (0.25 | ) | | | 0.00 | | | | 0.00 | | | | 0.00 | | | | 0.00 | | | | 0.00 | | | | 0.00 | |
| | | | | | | | | | | | | | | | | | | | | | | | | | | | |
Total distributions to shareholders | | | (0.25 | ) | | | (0.00 | )4 | | | (0.05 | ) | | | (0.04 | ) | | | (0.00 | )4 | | | 0.00 | | | | (0.01 | ) |
Net asset value, end of period | | $ | 9.86 | | | $ | 9.89 | | | $ | 7.75 | | | $ | 7.23 | | | $ | 7.20 | | | $ | 8.50 | | | $ | 6.96 | |
Total return5 | | | 2.45 | % | | | 27.55 | % | | | 7.93 | % | | | 1.04 | % | | | (15.25 | )% | | | 22.13 | % | | | 4.65 | % |
Ratios to average net assets (annualized) | | | | | | | | | | | | | | | | | | | | | | | | | | | | |
Gross expenses | | | 1.24 | % | | | 1.24 | % | | | 1.09 | % | | | 1.12 | % | | | 1.09 | % | | | 1.12 | % | | | 1.14 | % |
Net expenses | | | 1.12 | % | | | 1.12 | % | | | 1.08 | % | | | 1.12 | % | | | 1.07 | % | | | 1.10 | % | | | 1.14 | % |
Net investment income (loss) | | | (0.31 | )% | | | (0.13 | )% | | | 0.06 | % | | | 0.86 | % | | | 0.44 | % | | | 0.10 | % | | | (0.01 | )% |
Supplemental data | | | | | | | | | | | | | | | | | | | | | | | | | | | | |
Portfolio turnover rate | | | 22 | % | | | 65 | % | | | 89 | % | | | 24 | % | | | 39 | % | | | 21 | % | | | 117 | % |
Net assets, end of period (000’s omitted) | | | $675,157 | | | | $620,262 | | | | $491,290 | | | | $268,422 | | | | $276,771 | | | | $361,051 | | | | $341,511 | |
| 1. | After the close of business on July 16, 2010, the Fund acquired the net assets of Evergreen Large Company Growth Fund and Wells Fargo Advantage Large Company Growth Fund. Evergreen Large Company Growth Fund became the accounting and performance survivor in the transaction. The information for the periods prior to July 19, 2010 is that of Class A of Evergreen Large Company Growth Fund. |
| 2. | For the ten months ended July 31, 2010. The Fund changed its fiscal year end from September 30 to July 31, effective July 31, 2010. |
| 3. | Calculated based upon average shares outstanding. |
| 4. | Amount is less than $0.005. |
| 5. | Total return calculations do not include any sales charges. Returns for periods of less than one year are not annualized. |
The accompanying notes are an integral part of these financial statements.
| | | | | | |
| Financial Highlights | | Wells Fargo Advantage Premier Large Company Growth Fund | | | 17 | |
(For a share outstanding throughout each period)
| | | | | | | | | | | | | | | | | | | | | | | | | | | | |
| | | Six Months Ended
January 31, 2012 (Unaudited) | | | Year Ended July 31, | | | Year Ended September 30, | |
| Class B | | | 2011 | | | 20101,2 | | | 20091 | | | 20081 | | | 20071 | | | 20061 | |
Net asset value, beginning of period | | $ | 8.99 | | | $ | 7.10 | | | $ | 6.62 | | | $ | 6.60 | | | $ | 7.85 | | | $ | 6.47 | | | $ | 6.23 | |
Net investment income (loss) | | | (0.04 | )3 | | | (0.07 | )3 | | | (0.04 | )3 | | | 0.01 | 3 | | | (0.02 | )3 | | | (0.04 | )3 | | | (0.05 | )3 |
Net realized and unrealized gains (losses) on investments | | | 0.21 | | | | 1.96 | | | | 0.52 | | | | 0.01 | | | | (1.23 | ) | | | 1.42 | | | | 0.29 | |
| | | | | | | | | | | | | | | | | | | | | | | | | | | | |
Total from investment operations | | | 0.17 | | | | 1.89 | | | | 0.48 | | | | 0.02 | | | | (1.25 | ) | | | 1.38 | | | | 0.24 | |
Distributions to shareholders from | | | | | | | | | | | | | | | | | | | | | | | | | | | | |
Net realized gains | | | (0.25 | ) | | | 0.00 | | | | 0.00 | | | | 0.00 | | | | 0.00 | | | | 0.00 | | | | 0.00 | |
Net asset value, end of period | | $ | 8.91 | | | $ | 8.99 | | | $ | 7.10 | | | $ | 6.62 | | | $ | 6.60 | | | $ | 7.85 | | | $ | 6.47 | |
Total return4 | | | 2.02 | % | | | 26.62 | % | | | 7.25 | % | | | 0.30 | % | | | (15.92 | )% | | | 21.33 | % | | | 3.85 | % |
Ratios to average net assets (annualized) | | | | | | | | | | | | | | | | | | | | | | | | | | | | |
Gross expenses | | | 1.98 | % | | | 2.00 | % | | | 1.84 | % | | | 1.87 | % | | | 1.81 | % | | | 1.82 | % | | | 1.84 | % |
Net expenses | | | 1.87 | % | | | 1.87 | % | | | 1.83 | % | | | 1.87 | % | | | 1.81 | % | | | 1.82 | % | | | 1.84 | % |
Net investment income (loss) | | | (1.05 | )% | | | (0.85 | )% | | | (0.69 | )% | | | 0.11 | % | | | (0.31 | )% | | | (0.61 | )% | | | (0.71 | )% |
Supplemental data | | | | | | | | | | | | | | | | | | | | | | | | | | | | |
Portfolio turnover rate | | | 22 | % | | | 65 | % | | | 89 | % | | | 24 | % | | | 39 | % | | | 21 | % | | | 117 | % |
Net assets, end of period (000’s omitted) | | | $8,271 | | | | $10,244 | | | | $13,957 | | | | $7,951 | | | | $10,489 | | | | $16,694 | | | | $17,986 | |
| 1. | After the close of business on July 16, 2010, the Fund acquired the net assets of Evergreen Large Company Growth Fund and Wells Fargo Advantage Large Company Growth Fund. Evergreen Large Company Growth Fund became the accounting and performance survivor in the transaction. The information for the periods prior to July 19, 2010 is that of Class B of Evergreen Large Company Growth Fund. |
| 2. | For the ten months ended July 31, 2010. The Fund changed its fiscal year end from September 30 to July 31, effective July 31, 2010. |
| 3. | Calculated based upon average shares outstanding. |
| 4. | Total return calculations do not include any sales charges. Returns for periods of less than one year are not annualized. |
The accompanying notes are an integral part of these financial statements.
| | | | |
| 18 | | Wells Fargo Advantage Premier Large Company Growth Fund | | Financial Highlights |
(For a share outstanding throughout each period)
| | | | | | | | | | | | | | | | | | | | | | | | | | | | |
| | | Six Months Ended
January 31, 2012 (Unaudited) | | | Year Ended July 31, | | | Year Ended September 30, | |
| Class C | | | 2011 | | | 20101,2 | | | 20091 | | | 20081 | | | 20071 | | | 20061 | |
Net asset value, beginning of period | | $ | 8.97 | | | $ | 7.08 | | | $ | 6.62 | | | $ | 6.59 | | | $ | 7.84 | | | $ | 6.47 | | | $ | 6.23 | |
Net investment income (loss) | | | (0.05 | )3 | | | (0.08 | )3 | | | (0.04 | )3 | | | 0.00 | 3 | | | (0.02 | )3 | | | (0.04 | )3 | | | (0.05 | )3 |
Net realized and unrealized gains (losses) on investments | | | 0.21 | | | | 1.97 | | | | 0.52 | | | | 0.03 | | | | (1.23 | ) | | | 1.41 | | | | 0.29 | |
| | | | | | | | | | | | | | | | | | | | | | | | | | | | |
Total from investment operations | | | 0.16 | | | | 1.89 | | | | 0.48 | | | | 0.03 | | | | (1.25 | ) | | | 1.37 | | | | 0.24 | |
Distributions to shareholders from | | | | | | | | | | | | | | | | | | | | | | | | | | | | |
Net investment income | | | 0.00 | | | | 0.00 | | | | (0.02 | ) | | | 0.00 | | | | 0.00 | | | | 0.00 | | | | 0.00 | |
Net realized gains | | | (0.25 | ) | | | 0.00 | | | | 0.00 | | | | 0.00 | | | | 0.00 | | | | 0.00 | | | | 0.00 | |
| | | | | | | | | | | | | | | | | | | | | | | | | | | | |
Total distributions to shareholders | | | (0.25 | ) | | | 0.00 | | | | (0.02 | ) | | | 0.00 | | | | 0.00 | | | | 0.00 | | | | 0.00 | |
Net asset value, end of period | | $ | 8.88 | | | $ | 8.97 | | | $ | 7.08 | | | $ | 6.62 | | | $ | 6.59 | | | $ | 7.84 | | | $ | 6.47 | |
Total return4 | | | 2.03 | % | | | 26.69 | % | | | 7.18 | % | | | 0.46 | % | | | (15.94 | )% | | | 21.17 | % | | | 3.85 | % |
Ratios to average net assets (annualized) | | | | | | | | | | | | | | | | | | | | | | | | | | | | |
Gross expenses | | | 1.99 | % | | | 1.99 | % | | | 1.84 | % | | | 1.87 | % | | | 1.82 | % | | | 1.82 | % | | | 1.84 | % |
Net expenses | | | 1.87 | % | | | 1.87 | % | | | 1.83 | % | | | 1.87 | % | | | 1.82 | % | | | 1.82 | % | | | 1.84 | % |
Net investment income (loss) | | | (1.07 | )% | | | (0.90 | )% | | | (0.68 | )% | | | 0.08 | % | | | (0.30 | )% | | | (0.61 | )% | | | (0.71 | )% |
Supplemental data | | | | | | | | | | | | | | | | | | | | | | | | | | | | |
Portfolio turnover rate | | | 22 | % | | | 65 | % | | | 89 | % | | | 24 | % | | | 39 | % | | | 21 | % | | | 117 | % |
Net assets, end of period (000’s omitted) | | | $52,162 | | | | $35,783 | | | | $22,246 | | | | $13,717 | | | | $10,046 | | | | $10,058 | | | | $8,397 | |
| 1. | After the close of business on July 16, 2010, the Fund acquired the net assets of Evergreen Large Company Growth Fund and Wells Fargo Advantage Large Company Growth Fund. Evergreen Large Company Growth Fund became the accounting and performance survivor in the transaction. The information for the periods prior to July 19, 2010 is that of Class C of Evergreen Large Company Growth Fund. |
| 2. | For the ten months ended July 31, 2010. The Fund changed its fiscal year end from September 30 to July 31, effective July 31, 2010. |
| 3. | Calculated based upon average shares outstanding. |
| 4. | Total return calculations do not include any sales charges. Returns for periods of less than one year are not annualized. |
The accompanying notes are an integral part of these financial statements.
| | | | | | |
| Financial Highlights | | Wells Fargo Advantage Premier Large Company Growth Fund | | | 19 | |
(For a share outstanding throughout each period)
| | | | | | | | | | | | |
| | | Six Months Ended
January 31, 2012 (Unaudited) | | | Year Ended July 31, | |
| Administrator Class | | | 2011 | | | 20101 | |
Net asset value, beginning of period | | $ | 9.90 | | | $ | 7.75 | | | $ | 7.53 | |
Net investment income (loss) | | | (0.01 | ) | | | 0.00 | | | | (0.00 | )2 |
Net realized and unrealized gains (losses) on investments | | | 0.23 | | | | 2.16 | | | | 0.22 | |
| | | | | | | | | | | | |
Total from investment operations | | | 0.22 | | | | 2.16 | | | | 0.22 | |
Distributions to shareholders from | | | | | | | | | | | | |
Net investment income | | | 0.00 | | | | (0.01 | ) | | | 0.00 | |
Net realized gains | | | (0.25 | ) | | | 0.00 | | | | 0.00 | |
| | | | | | | | | | | | |
Total distributions to shareholders | | | (0.25 | ) | | | (0.01 | ) | | | 0.00 | |
Net asset value, end of period | | $ | 9.87 | | | $ | 9.90 | | | $ | 7.75 | |
Total return3 | | | 2.44 | % | | | 27.75 | % | | | 2.92 | % |
Ratios to average net assets (annualized) | | | | | | | | | | | | |
Gross expenses | | | 1.08 | % | | | 1.08 | % | | | 1.13 | % |
Net expenses | | | 0.95 | % | | | 0.95 | % | | | 0.95 | % |
Net investment income (loss) | | | (0.15 | )% | | | 0.01 | % | | | (0.34 | )% |
Supplemental data | | | | | | | | | | | | |
Portfolio turnover rate | | | 22 | % | | | 65 | % | | | 89 | % |
Net assets, end of period (000’s omitted) | | | $81,125 | | | | $54,335 | | | | $36,508 | |
| 1. | For the period from July 16, 2010 (commencement of class operations) to July 31, 2010. |
| 2. | Amount is less than $0.005. |
| 3. | Returns for periods of less than one year are not annualized. |
The accompanying notes are an integral part of these financial statements.
| | | | |
| 20 | | Wells Fargo Advantage Premier Large Company Growth Fund | | Financial Highlights |
(For a share outstanding throughout each period)
| | | | | | | | | | | | | | | | | | | | | | | | | | | | |
| | | Six Months Ended
January 31, 2012 (Unaudited) | | | Year Ended July 31, | | | Year Ended September 30, | |
| Institutional Class | | | 2011 | | | 20101,2 | | | 20091 | | | 20081 | | | 20071 | | | 20061 | |
Net asset value, beginning of period | | $ | 9.91 | | | $ | 7.75 | | | $ | 7.24 | | | $ | 7.22 | | | $ | 8.53 | | | $ | 6.96 | | | $ | 6.67 | |
Net investment income | | | 0.00 | 3 | | | 0.02 | 3 | | | 0.02 | | | | 0.06 | 3 | | | 0.05 | 3 | | | 0.03 | 3 | | | 0.02 | 3 |
Net realized and unrealized gains (losses) on investments | | | 0.24 | | | | 2.15 | | | | 0.57 | | | | 0.02 | | | | (1.33 | ) | | | 1.54 | | | | 0.30 | |
| | | | | | | | | | | | | | | | | | | | | | | | | | | | |
Total from investment operations | | | 0.24 | | | | 2.17 | | | | 0.59 | | | | 0.08 | | | | (1.28 | ) | | | 1.57 | | | | 0.32 | |
Distributions to shareholders from | | | | | | | | | | | | | | | | | | | | | | | | | | | | |
Net investment income | | | 0.00 | | | | (0.01 | ) | | | (0.08 | ) | | | (0.06 | ) | | | (0.03 | ) | | | 0.00 | | | | (0.03 | ) |
Net realized gains | | | (0.25 | ) | | | 0.00 | | | | 0.00 | | | | 0.00 | | | | 0.00 | | | | 0.00 | | | | 0.00 | |
| | | | | | | | | | | | | | | | | | | | | | | | | | | | |
Total distributions to shareholders | | | (0.25 | ) | | | (0.01 | ) | | | (0.08 | ) | | | (0.06 | ) | | | (0.03 | ) | | | 0.00 | | | | (0.03 | ) |
Net asset value, end of period | | $ | 9.90 | | | $ | 9.91 | | | $ | 7.75 | | | $ | 7.24 | | | $ | 7.22 | | | $ | 8.53 | | | $ | 6.96 | |
Total return4 | | | 2.54 | % | | | 28.03 | % | | | 8.20 | % | | | 1.28 | % | | | (15.07 | )% | | | 22.56 | % | | | 4.81 | % |
Ratios to average net assets (annualized) | | | | | | | | | | | | | | | | | | | | | | | | | | | | |
Gross expenses | | | 0.81 | % | | | 0.81 | % | | | 0.83 | % | | | 0.87 | % | | | 0.81 | % | | | 0.82 | % | | | 0.84 | % |
Net expenses | | | 0.75 | % | | | 0.75 | % | | | 0.82 | % | | | 0.87 | % | | | 0.81 | % | | | 0.82 | % | | | 0.84 | % |
Net investment income | | | 0.04 | % | | | 0.22 | % | | | 0.34 | % | | | 1.04 | % | | | 0.68 | % | | | 0.39 | % | | | 0.29 | % |
Supplemental data | | | | | | | | | | | | | | | | | | | | | | | | | | | | |
Portfolio turnover rate | | | 22 | % | | | 65 | % | | | 89 | % | | | 24 | % | | | 39 | % | | | 21 | % | | | 117 | % |
Net assets, end of period (000’s omitted) | | | $63,743 | | | | $30,493 | | | | $18,841 | | | | $11,335 | | | | $6,321 | | | | $11,197 | | | | $13,605 | |
| 1. | After the close of business on July 16, 2010, the Fund acquired the net assets of Evergreen Large Company Growth Fund and Wells Fargo Advantage Large Company Growth Fund. Evergreen Large Company Growth Fund became the accounting and performance survivor in the transaction. The information for the periods prior to July 19, 2010 is that of Class I of Evergreen Large Company Growth Fund. |
| 2. | For the ten months ended July 31, 2010. The Fund changed its fiscal year end from September 30 to July 31, effective July 31, 2010. |
| 3. | Calculated based upon average shares outstanding. |
| 4. | Returns for periods of less than one year are not annualized. |
The accompanying notes are an integral part of these financial statements.
| | | | | | |
| Financial Highlights | | Wells Fargo Advantage Premier Large Company Growth Fund | | | 21 | |
(For a share outstanding throughout each period)
| | | | | | | | | | | | |
| | | Six Months Ended
January 31, 2012 (Unaudited) | | | Year Ended July 31, | |
| Investor Class | | | 2011 | | | 20101 | |
Net asset value, beginning of period | | $ | 9.87 | | | $ | 7.75 | | | $ | 7.54 | |
Net investment income (loss) | | | (0.02 | ) | | | (0.02 | ) | | | (0.00 | )2 |
Net realized and unrealized gains (losses) on investments | | | 0.24 | | | | 2.15 | | | | 0.21 | |
| | | | | | | | | | | | |
Total from investment operations | | | 0.22 | | | | 2.13 | | | | 0.21 | |
Distributions to shareholders from | | | | | | | | | | | | |
Net investment income | | | 0.00 | | | | (0.01 | ) | | | 0.00 | |
Net realized gains | | | (0.25 | ) | | | 0.00 | | | | 0.00 | |
| | | | | | | | | | | | |
Total distributions to shareholders | | | (0.25 | ) | | | (0.01 | ) | | | 0.00 | |
Net asset value, end of period | | $ | 9.84 | | | $ | 9.87 | | | $ | 7.75 | |
Total return3 | | | 2.35 | % | | | 27.48 | % | | | 2.79 | % |
Ratios to average net assets (annualized) | | | | | | | | | | | | |
Gross expenses | | | 1.29 | % | | | 1.31 | % | | | 1.36 | % |
Net expenses | | | 1.19 | % | | | 1.19 | % | | | 1.19 | % |
Net investment loss | | | (0.38 | )% | | | (0.20 | )% | | | (0.59 | )% |
Supplemental data | | | | | | | | | | | | |
Portfolio turnover rate | | | 22 | % | | | 65 | % | | | 89 | % |
Net assets, end of period (000’s omitted) | | | $82,152 | | | | $79,464 | | | | $64,781 | |
| 1. | For the period from July 16, 2010 (commencement of class operations) to July 31, 2010. |
| 2. | Amount is less than $0.005. |
| 3. | Returns for periods of less than one year are not annualized. |
The accompanying notes are an integral part of these financial statements.
| | | | |
| 22 | | Wells Fargo Advantage Premier Large Company Growth Fund | | Notes to Financial Statements (Unaudited) |
1. ORGANIZATION
Wells Fargo Funds Trust (the “Trust”), a Delaware statutory trust organized on March 10, 1999, is an open-end management investment company registered under the Investment Company Act of 1940, as amended (the “1940 Act”). These financial statements report on Wells Fargo Advantage Premier Large Company Growth Fund (the “Fund”) which is a diversified series of the Trust.
2. SIGNIFICANT ACCOUNTING POLICIES
The following significant accounting policies, which are consistently followed in the preparation of the financial statements of the Fund, are in conformity with U.S. generally accepted accounting principles which require management to make estimates and assumptions that affect the reported amounts of assets and liabilities, disclosure of contingent assets and liabilities at the date of the financial statements, and the reported amounts of revenues and expenses during the reporting period. Actual results could differ from those estimates.
Securities valuation
Investments in equity securities are valued each business day as of the close of regular trading on the New York Stock Exchange, which is usually 4:00 p.m. (Eastern Time). Securities which are traded on a national or foreign securities exchange are valued at the last reported sales price, except that securities listed on The Nasdaq Stock Market, Inc. (“Nasdaq”) are valued at the Nasdaq Official Closing Price (“NOCP”), and if no NOCP is available, then at the last reported sales price. If no sales price is shown on the Nasdaq, the bid price will be used. In the absence of any sale of securities listed on the Nasdaq, and in the case of other securities (including U.S. Government obligations, but excluding debt securities maturing in 60 days or less), the price will be deemed “stale” and the valuations will be determined in accordance with the Fund’s Fair Value Procedures.
Investments in open-end mutual funds and non-registered investment companies are generally valued at net asset value.
Investments which are not valued using any of the methods discussed above, are valued at their fair value, as determined by procedures established in good faith and approved by the Board of Trustees.
Security loans
The Fund may lend its securities from time to time in order to earn additional income in the form of fees or interest on securities received as collateral or the investment of any cash received as collateral. The Fund continues to receive interest or dividends on the securities loaned. The Fund receives collateral in the form of cash or securities with a value at least equal to the value of the securities on loan. The value of the loaned securities is determined at the close of each business day and any additional required collateral is delivered to the Fund on the next business day. In a securities lending transaction, the net asset value of the Fund will be affected by an increase or decrease in the value of the securities loaned and by an increase or decrease in the value of the instrument in which collateral is invested. The amount of securities lending activity undertaken by the Fund fluctuates from time to time. In the event of default or bankruptcy by the borrower, the Fund may be prevented from recovering the loaned securities or gaining access to the collateral or may experience delays or costs in doing so. In addition, the investment of any cash collateral received may lose all or part of its value. The Fund has the right under the lending agreement to recover the securities from the borrower on demand.
The Fund lends its securities through an unaffiliated securities lending agent. Cash collateral received in connection with its securities lending transactions is invested in Wells Fargo Securities Lending Cash Investments, LLC (the “Cash Collateral Fund”). The Cash Collateral Fund is exempt from registration under Section 3(c)(7) of the 1940 Act and is managed by Wells Fargo Funds Management LLC (“Funds Management”) and is sub-advised by Wells Capital Management Incorporated (“Wells Capital Management”). Funds Management receives an advisory fee starting at 0.05% and declining to 0.01% as the average daily net assets of the Cash Collateral Fund increase. All of the fees received by Funds Management are paid to Wells Capital Management for its services as sub-adviser. The Cash Collateral Fund seeks to provide a positive return compared to the daily Fed Funds Open rate by investing in high-quality, U.S. dollar-denominated short-term money market instruments. Cash Collateral Fund investments are fair valued based upon the amortized cost valuation technique. Income earned from investment in the Cash Collateral Fund is included in securities lending income on the Statement of Operations.
For Wells Fargo Advantage Funds that participated in securities lending activity prior to February 13, 2009, certain structured investment vehicles purchased in a joint account by the former securities lending agent defaulted or were
| | | | | | |
| Notes to Financial Statements (Unaudited) | | Wells Fargo Advantage Premier Large Company Growth Fund | | | 23 | |
impaired. Certain of the Wells Fargo Advantage Funds still hold ownership interest in these structured investment vehicles, which have since been restructured as pass-through securities. If the Fund holds an ownership interest in such pass-through securities, information regarding this ownership interest can be found in the Portfolio of Investments under the category “Other”.
Security transactions and income recognition
Securities transactions are recorded on a trade date basis. Realized gains or losses are reported on the basis of identified cost of securities delivered.
Dividend income is recognized on the ex-dividend date.
Distributions to shareholders
Distributions to shareholders from net investment income and net realized gains, if any, are recorded on the ex-dividend date. Such distributions are determined in conformity with income tax regulations, which may differ from generally accepted accounting principles.
Federal and other taxes
The Fund intends to continue to qualify as a regulated investment company by distributing substantially all of its investment company taxable income and any net realized capital gains (after reduction for capital loss carryforwards) sufficient to relieve it from all, or substantially all, federal income taxes. Accordingly, no provision for federal income taxes was required.
The Fund’s income and federal excise tax returns and all financial records supporting those returns for the prior three fiscal years are subject to examination by the federal and Delaware revenue authorities.
Under the recently enacted Regulated Investment Company Modernization Act of 2010, the Fund is permitted to carry forward capital losses incurred in taxable years which began after December 22, 2010 for an unlimited period. However, any losses incurred are required to be utilized prior to the losses incurred in pre-enactment taxable years. As a result of this ordering rule, pre-enactment capital loss carryforwards may be more likely to expire unused. Additionally, post-enactment capital losses that are carried forward will retain their character as either short-term or long-term capital losses rather than being considered all short-term as under previous law.
As of July 31, 2011, the Fund had net capital loss carryforwards, which were available to offset future net realized capital gains, in the amount of $73,822,428 with $894,918 expiring in 2015, $54,899,363 expiring in 2016 and $18,028,147 expiring in 2017.
Class allocations
The separate classes of shares offered by the Fund differ principally in applicable sales charges, distribution, shareholder servicing and administration fees. Shareholders of each class bear certain expenses that pertain to that particular class. All shareholders bear the common expenses of the Fund, earn income from the portfolio, and are allocated unrealized gains and losses pro rata based on the average daily net assets of each class, without distinction between share classes. Dividends are determined separately for each class based on income and expenses allocable to each class. Realized gains and losses are allocated to each class pro rata based upon the net assets of each class on the date realized. Differences in per share dividend rates generally result from the relative weightings of pro rata income and realized gain allocations and from differences in separate class expenses, including distribution, shareholder servicing and administration fees.
3. FAIR VALUATION MEASUREMENTS
Fair value measurements of investments are determined within a framework that has established a fair value hierarchy based upon the various data inputs utilized in determining the value of the Fund’s investments. The three-level hierarchy gives the highest priority to unadjusted quoted prices in active markets for identical assets or liabilities (Level 1) and the lowest priority to significant unobservable inputs (Level 3). The Fund’s investments are classified within the fair value hierarchy based on the lowest level of input that is significant to the fair value measurement. The inputs are summarized into three broad levels as follows:
| n | | Level 1 – quoted prices in active markets for identical securities |
| n | | Level 2 – other significant observable inputs (including quoted prices for similar securities, interest rates, prepayment speeds, credit risk, etc.) |
| | | | |
| 24 | | Wells Fargo Advantage Premier Large Company Growth Fund | | Notes to Financial Statements (Unaudited) |
| n | | Level 3 – significant unobservable inputs (including the Fund’s own assumptions in determining the fair value of investments) |
The inputs or methodologies used for valuing securities are not necessarily an indication of the risk associated with investing in those securities.
As of January 31, 2012, the inputs used in valuing the Fund’s assets, which are carried at fair value, were as follows:
| | | | | | | | | | | | | | | | |
| Investments in Securities | | Quoted Prices
(Level 1) | | | Significant Other
Observable Inputs
(Level 2) | | | Significant
Unobservable Inputs
(Level 3) | | | Total | |
Equity securities | | | | | | | | | | | | | | | | |
Common stocks | | $ | 921,771,616 | | | $ | 0 | | | $ | 0 | | | $ | 921,771,616 | |
Investment companies | | | 13,757,360 | | | | 0 | | | | 0 | | | | 13,757,360 | |
| | | | |
Other | | | 0 | | | | 0 | | | | 1,004,827 | | | | 1,004,827 | |
| | | | |
Short-term investments | | | | | | | | | | | | | | | | |
Investment companies | | | 29,623,519 | | | | 67,324,983 | | | | 0 | | | | 96,948,502 | |
| | | $ | 965,152,495 | | | $ | 67,324,983 | | | $ | 1,004,827 | | | $ | 1,033,482,305 | |
Further details on the major security types listed above can be found in the Portfolio of Investments.
Transfers in and transfers out are recognized at the end of the reporting period. For the six months ended January 31, 2012, the Fund did not have any significant transfers into/out of Level 1 and Level 2.
The following is a reconciliation of assets in which significant unobservable inputs (Level 3) were used in determining fair value:
| | | | |
| | | Other | |
Balance as of July 31, 2011 | | $ | 1,425,187 | |
Accrued discounts (premiums) | | | 0 | |
Realized gains (losses) | | | 0 | |
Change in unrealized gains (losses) | | | (247,739 | ) |
Purchases | | | 0 | |
Sales | | | (172,621 | ) |
Transfers into Level 3 | | | 0 | |
Transfers out of Level 3 | | | 0 | |
Balance as of January 31, 2012 | | $ | 1,004,827 | |
Change in unrealized gains (losses) relating to securities still held at January 31, 2012 | | $ | (335,097 | ) |
4. TRANSACTIONS WITH AFFILIATES AND OTHER EXPENSES
Advisory fee
The Trust has entered into an advisory contract with Funds Management, an indirect wholly owned subsidiary of Wells Fargo & Company (“Wells Fargo”). The adviser is responsible for implementing investment policies and guidelines and for supervising the sub-adviser, who is responsible for day-to-day portfolio management of the Fund.
Pursuant to the contract, Funds Management is entitled to receive an annual advisory fee starting at 0.65% and declining to 0.55% as the average daily net assets of the Fund increase. For the six months ended January 31, 2012, the advisory fee was equivalent to an annual rate of 0.64% of the Fund’s average daily net assets.
Funds Management may retain the services of certain sub-advisers to provide daily portfolio management to the Fund. The fees related to sub-advisory services are borne directly by Funds Management and do not increase the overall fees paid by the Fund. Wells Capital Management, an affiliate of Funds Management, is the sub-adviser to the Fund and is entitled to receive a fee from Funds Management at an annual rate starting at 0.35% and declining to 0.15% as the average daily net assets of the Fund increase.
| | | | | | |
| Notes to Financial Statements (Unaudited) | | Wells Fargo Advantage Premier Large Company Growth Fund | | | 25 | |
Administration and transfer agent fees
The Trust has entered into an administration agreement with Funds Management. Under this agreement, for providing administrative services, which includes paying fees and expenses for services provided by the transfer agent, sub-transfer agents, omnibus account servicers and record-keepers, Funds Management is entitled to receive from the Fund an annual fund level administration fee starting at 0.05% and declining to 0.03% as the average daily net assets of the Fund increase and a class level administration fee which is calculated based on the average daily net assets of each class as follows:
| | | | |
| | | Class Level
Administration Fee | |
Class A, Class B, Class C | | | 0.26 | % |
Administrator Class | | | 0.10 | |
Institutional Class | | | 0.08 | |
Investor Class | | | 0.33 | |
Funds Management has contractually waived and/or reimbursed advisory and administration fees to the extent necessary to maintain certain net operating expense ratios for the Fund. Waiver of fees and/or reimbursement of expenses by Funds Management were made first from fund level expenses on a proportionate basis and then from class specific expenses. Funds Management has committed through July 18, 2013 to waive fees and/or reimburse expenses to the extent necessary to cap the Fund’s expenses at 1.12% for Class A, 1.87% for Class B, 1.87% for Class C, 0.95% for Administrator Class, 0.75% for Institutional Class and 1.19% for Investor Class.
Distribution fees
The Trust has adopted a Distribution Plan for Class B and Class C shares of the Fund pursuant to Rule 12b-1 under the 1940 Act. Distribution fees are charged to Class B and Class C shares and paid to Wells Fargo Funds Distributor, LLC, the principal underwriter, at an annual rate of 0.75% of the average daily net assets of Class B and Class C shares.
For the six months ended January 31, 2012, Wells Fargo Funds Distributor, LLC received $25,277 from the sale of Class A shares and $14, $4,839 and $721 in contingent deferred sales charges from redemptions of Class A, Class B and Class C shares, respectively.
Shareholder servicing fees
The Trust has entered into contracts with one or more shareholder servicing agents, whereby Class A, Class B, Class C, Administrator Class and Investor Class of the Fund is charged a fee at an annual rate of 0.25% of the average daily net assets of each respective class.
A portion of these total shareholder servicing fees were paid to affiliates of Wells Fargo.
5. INVESTMENT PORTFOLIO TRANSACTIONS
Purchases and sales of investments, excluding U.S. Government obligations (if any) and short-term securities (securities with maturities of one year or less at purchase date), for the six months ended January 31, 2012 were $279,923,660 and $179,324,542, respectively.
6. BANK BORROWINGS
The Trust (excluding the money market funds) and Wells Fargo Variable Trust are parties to a $150,000,000 revolving credit agreement with State Street Bank and Trust Company, whereby the Fund is permitted to use bank borrowings for temporary or emergency purposes, such as to fund shareholder redemption requests. Interest under the credit agreement is charged to the Fund based on a borrowing rate equal to the higher of the Federal Funds rate in effect on that day plus 1.25% or the overnight LIBOR rate in effect on that day plus 1.25%. In addition, an annual commitment fee equal to 0.10% of the unused balance is allocated to each participating fund. Prior to September 6, 2011, the revolving credit agreement was for $125,000,000 and the annual commitment fee paid by the Fund was 0.125% of the unused balance. For the six months ended January 31, 2012, the Fund paid $420 in commitment fees.
For the six months ended January 31, 2012, there were no borrowings by the Fund under the agreement.
| | | | |
| 26 | | Wells Fargo Advantage Premier Large Company Growth Fund | | Notes to Financial Statements (Unaudited) |
7. INDEMNIFICATION
Under the Trust’s organizational documents, the officers and directors are indemnified against certain liabilities that may arise out of performance of their duties to the Trust. Additionally, in the normal course of business, the Trust may enter into contracts with service providers that contain a variety of indemnification clauses. The Trust’s maximum exposure under these arrangements is dependent on future claims that may be made against the Fund and, therefore, cannot be estimated.
8. NEW ACCOUNTING PRONOUNCEMENTS
In May 2011, the Financial Accounting Standards Board (“FASB”) issued Accounting Standards Update (“ASU”) No. 2011-04 “Amendments to Achieve Common Fair Value Measurement and Disclosure Requirements in U.S. GAAP and IFRSs”. ASU No. 2011-04 amends FASB ASC Topic 820, Fair Value Measurements and Disclosures, to establish common requirements for measuring fair value and for disclosing information about fair value measurements in accordance with GAAP. The ASU is effective prospectively for interim and annual periods beginning after December 15, 2011. Management expects that adoption of the ASU will result in additional disclosures in the financial statements, as applicable.
In April 2011, FASB issued ASU No. 2011-03 “Reconsideration of Effective Control for Repurchase Agreements”. ASU No. 2011-03 amends FASB ASC Topic 860, Transfers and Servicing, specifically the criteria required to determine whether a repurchase agreement (repo) and similar agreements should be accounted for as sales of financial assets or secured borrowings with commitments. ASU No. 2011-03 changes the assessment of effective control by focusing on the transferor’s contractual rights and obligations and removing the criterion to assess its ability to exercise those rights or honor those obligations. This could result in changes to the way entities account for certain transactions including repurchase agreements, mortgage dollar rolls and reverse repurchase agreements. The ASU will become effective on a prospective basis for new transfers and modifications to existing transactions as of the beginning of the first interim or annual period beginning on or after December 15, 2011. Management has evaluated the impact of adopting the ASU and expects no significant changes.
| | | | | | |
| Other Information (Unaudited) | | Wells Fargo Advantage Premier Large Company Growth Fund | | | 27 | |
PROXY VOTING INFORMATION
A description of the policies and procedures that the Fund uses to determine how to vote proxies relating to portfolio securities is available without charge, upon request, by calling 1-800-222-8222, visiting our Web site at wellsfargoadvantagefunds.com, or visiting the SEC Web site at sec.gov. Information regarding how the Fund voted proxies relating to portfolio securities during the most recent 12-month period ended June 30 is available without charge on the Fund’s Web site at wellsfargoadvantagefunds.com or by visiting the SEC Web site at sec.gov.
PORTFOLIO HOLDINGS INFORMATION
The complete portfolio holdings for the Fund are publicly available on the Fund’s Web site (wellsfargoadvantagefunds.com) on a monthly, 30-day or more delayed basis. In addition, top ten holdings information for the Fund is publicly available on the Fund’s Web site on a monthly, seven-day or more delayed basis. The Fund files its complete schedule of portfolio holdings with the SEC for the first and third quarters of each fiscal year on Form N-Q, which is available without charge by visiting the SEC Web site at sec.gov. In addition, the Fund’s Form N-Q may be reviewed and copied at the SEC’s Public Reference Room in Washington, DC, and at regional offices in New York City, at 233 Broadway, and in Chicago, at 175 West Jackson Boulevard, Suite 900. Information about the Public Reference Room may be obtained by calling 1-800-SEC-0330.
| | | | |
| 28 | | Wells Fargo Advantage Premier Large Company Growth Fund | | Other Information (Unaudited) |
BOARD OF TRUSTEES
The following table provides basic information about the Board of Trustees (the “Trustees”) of the Trust and Officers of the Trust. This table should be read in conjunction with the Prospectus and the Statement of Additional Information1 of the Fund. Each of the Trustees and Officers listed below acts in identical capacities for the Wells Fargo Advantage family of funds, which consists of 137 funds comprising the Wells Fargo Funds Trust, Wells Fargo Variable Trust, Wells Fargo Master Trust and four closed-end funds (collectively the “Fund Complex”). All of the Trustees are also Members of the Audit and Governance Committees of each Trust in the Fund Complex. The mailing address of each Trustee and Officer is 525 Market Street, 12th Floor, San Francisco, CA 94105. Each Trustee and Officer serves an indefinite term, however, each Trustee serves such term until reaching the mandatory retirement age established by the Trustees.
Independent Trustees
| | | | | | |
Name and Year of Birth | | Position Held and Length of Service | | Principal Occupations During Past Five Years | | Other Directorships During
Past Five Years |
Peter G. Gordon
(Born 1942) | | Trustee, since 1998; Chairman, since 2005 (Lead Trustee since 2001) | | Co-Founder, Retired Chairman, President and CEO of Crystal Geyser Water Company. Trustee Emeritus, Colby College | | Asset Allocation Trust |
Isaiah Harris, Jr.
(Born 1952) | | Trustee, since 2009 | | Retired. Prior thereto, President and CEO of BellSouth Advertising and Publishing Corp. from 2005 to 2007, President and CEO of BellSouth Enterprises from 2004 to 2005 and President of BellSouth Consumer Services from 2000 to 2003. Emeritus member of the Iowa State University Foundation Board of Governors. Emeritus Member of the Advisory Board of Iowa State University School of Business. Mr. Harris is a certified public accountant. | | CIGNA Corporation; Deluxe Corporation; Asset Allocation Trust |
Judith M. Johnson
(Born 1949) | | Trustee, since 2008 | | Retired. Prior thereto, Chief Executive Officer and Chief Investment Officer of Minneapolis Employees Retirement Fund from 1996 to 2008. Ms. Johnson is an attorney, certified public accountant and a certified managerial accountant. | | Asset Allocation Trust |
Leroy Keith, Jr.
(Born 1939) | | Trustee, since 2010 | | Chairman, Bloc Global Services (development and construction). Trustee of the Evergreen Funds from 1983 to 2010. Former Managing Director, Almanac Capital Management (commodities firm), former Partner, Stonington Partners, Inc. (private equity fund), former Director, Obagi Medical Products Co. and former Director, Lincoln Educational Services. | | Trustee, Virtus Fund Complex (consisting of 40 portfolios as of 12/31/11); Asset Allocation Trust |
David F. Larcker
(Born 1950) | | Trustee, since 2009 | | James Irvin Miller Professor of Accounting at the Graduate School of Business, Stanford University, Director of Corporate Governance Research Program and Senior Faculty of The Rock Center for Corporate Governance since 2006. From 2005 to 2008, Professor of Accounting at the Graduate School of Business, Stanford University. Prior thereto, Ernst & Young Professor of Accounting at The Wharton School, University of Pennsylvania from 1985 to 2005. | | Asset Allocation Trust |
Olivia S. Mitchell
(Born 1953) | | Trustee, since 2006 | | International Foundation of Employee Benefit Plans Professor, Wharton School of the University of Pennsylvania since 1993. Director of Wharton’s Pension Research Council and Boettner Center on Pensions & Retirement Research, and Research Associate at the National Bureau of Economic Research. Previously, Cornell University Professor from 1978 to 1993. | | Asset Allocation Trust |
| | | | | | |
| Other Information (Unaudited) | | Wells Fargo Advantage Premier Large Company Growth Fund | | | 29 | |
| | | | | | |
Name and Year of Birth | | Position Held and Length of Service | | Principal Occupations During Past Five Years | | Other Directorships During
Past Five Years |
Timothy J. Penny
(Born 1951) | | Trustee, since 1996 | | President and CEO of Southern Minnesota Initiative Foundation, a non-profit organization, since 2007 and Senior Fellow at the Humphrey Institute Policy Forum at the University of Minnesota since 1995. Member of the Board of Trustees of NorthStar Education Finance, Inc., a non-profit organization, since 2007. | | Asset Allocation Trust |
Michael S. Scofield
(Born 1943) | | Trustee, since 2010 | | Served on the Investment Company Institute’s Board of Governors and Executive Committee from 2008-2011 as well the Governing Council of the Independent Directors Council from 2006-2011 and the Independent Directors Council Executive Committee from 2008-2011. Chairman of the IDC from 2008-2010. Institutional Investor (Fund Directions) Trustee of Year in 2007. Trustee of the Evergreen Funds (and its predecessors) from 1984 to 2010. Chairman of the Evergreen Funds from 2000-2010. Former Trustee of the Mentor Funds. Retired Attorney, Law Offices of Michael S. Scofield and former Director and Chairman, Branded Media Corporation (multi-media branding company). | | Asset Allocation Trust |
Donald C. Willeke
(Born 1940) | | Trustee, since 1996 | | Principal of the law firm of Willeke & Daniels. General Counsel of the Minneapolis Employees Retirement Fund from 1984 until its consolidation into the Minnesota Public Employees Retirement Association on June 30, 2010. Director and Vice Chair of The Free Trust (non-profit corporation). Director of the American Chestnut Foundation (non-profit corporation). | | Asset Allocation Trust |
Officers
| | | | | | |
Name and Year of Birth | | Position Held and
Length of Service | | Principal Occupations During Past Five Years | | |
Karla M. Rabusch
(Born 1959) | | President, since 2003 | | Executive Vice President of Wells Fargo Bank, N.A. and President of Wells Fargo Funds Management, LLC since 2003. Senior Vice President and Chief Administrative Officer of Wells Fargo Funds Management, LLC from 2001 to 2003. | | |
C. David Messman
(Born 1960) | | Secretary, since 2000; Chief Legal Counsel, since 2003 | | Senior Vice President and Secretary of Wells Fargo Funds Management, LLC since 2001. Vice President and Managing Senior Counsel of Wells Fargo Bank, N.A. since 1996. | | |
Kasey Phillips
(Born 1970) | | Treasurer, since 2009 | | Senior Vice President of Wells Fargo Funds Management, LLC since 2009. Senior Vice President of Evergreen Investment Management Company, LLC from 2006 to 2010. Treasurer of the Evergreen Funds from 2005 to 2010. | | |
David Berardi
(Born 1975) | | Assistant Treasurer, since 2009 | | Vice President of Wells Fargo Funds Management, LLC since 2009. Vice President of Evergreen Investment Management Company, LLC from 2008 to 2010. Assistant Vice President of Evergreen Investment Services, Inc. from 2004 to 2008. Manager of Fund Reporting and Control for Evergreen Investment Management Company, LLC from 2004 to 2010. | | |
Jeremy DePalma
(Born 1974) | | Assistant Treasurer, since 2009 | | Senior Vice President of Wells Fargo Funds Management, LLC since 2009. Senior Vice President of Evergreen Investment Management Company, LLC from 2008 to 2010. Vice President, Evergreen Investment Services, Inc. from 2004 to 2007. Head of the Fund Reporting and Control Team within Fund Administration from 2005 to 2010. | | |
Debra Ann Early
(Born 1964) | | Chief Compliance Officer, since 2007 | | Chief Compliance Officer of Wells Fargo Funds Management, LLC since 2007. Chief Compliance Officer of Parnassus Investments from 2005 to 2007. Chief Financial Officer of Parnassus Investments from 2004 to 2007 and Senior Audit Manager of PricewaterhouseCoopers LLP from 1998 to 2004. | | |
| 1. | The Statement of Additional Information includes additional information about the Trustees and is available, without charge, upon request, by calling 1-800-222-8222 or by visiting the Web site at wellsfargoadvantagefunds.com. |
| | | | |
| 30 | | Wells Fargo Advantage Premier Large Company Growth Fund | | List of Abbreviations |
The following is a list of common abbreviations for terms and entities which may have appeared in this report.
| ACB | — Agricultural Credit Bank |
| ADR | — American Depository Receipt |
| ADS | — American Depository Shares |
| AGC-ICC | — Assured Guaranty Corporation - Insured Custody Certificates |
| AGM | — Assured Guaranty Municipal |
| AMBAC | — American Municipal Bond Assurance Corporation |
| AMT | — Alternative Minimum Tax |
| BAN | — Bond Anticipation Notes |
| BHAC | — Berkshire Hathaway Assurance Corporation |
| CAB | — Capital Appreciation Bond |
| CCAB | — Convertible Capital Appreciation Bond |
| CDA | — Community Development Authority |
| CDO | — Collateralized Debt Obligation |
| COP | — Certificate of Participation |
| DRIVER | — Derivative Inverse Tax-Exempt Receipts |
| DW&P | — Department of Water & Power |
| DWR | — Department of Water Resources |
| ECFA | — Educational & Cultural Facilities Authority |
| EDA | — Economic Development Authority |
| EDFA | — Economic Development Finance Authority |
| ETF | — Exchange-Traded Fund |
| FFCB | — Federal Farm Credit Bank |
| FGIC | — Financial Guaranty Insurance Corporation |
| FHA | — Federal Housing Authority |
| FHLB | — Federal Home Loan Bank |
| FHLMC | — Federal Home Loan Mortgage Corporation |
| FNMA | — Federal National Mortgage Association |
| GDR | — Global Depository Receipt |
| GNMA | — Government National Mortgage Association |
| HCFR | — Healthcare Facilities Revenue |
| HEFA | — Health & Educational Facilities Authority |
| HEFAR | — Higher Education Facilities Authority Revenue |
| HFA | — Housing Finance Authority |
| HFFA | — Health Facilities Financing Authority |
| IBC | — Insured Bond Certificate |
| IDA | — Industrial Development Authority |
| IDAG | — Industrial Development Agency |
| IDR | — Industrial Development Revenue |
| KRW | — Republic of Korea Won |
| LIBOR | — London Interbank Offered Rate |
| LLC | — Limited Liability Company |
| LLP | — Limited Liability Partnership |
| MBIA | — Municipal Bond Insurance Association |
| MFHR | — Multi-Family Housing Revenue |
| MSTR | — Municipal Securities Trust Receipts |
| MUD | — Municipal Utility District |
| NATL-RE | — National Public Finance Guarantee Corporation |
| PCFA | — Pollution Control Finance Authority |
| PCR | — Pollution Control Revenue |
| PFA | — Public Finance Authority |
| PFFA | — Public Facilities Financing Authority |
| PFOTER | — Puttable Floating Option Tax-Exempt Receipts |
| plc | — Public Limited Company |
| PUTTER | — Puttable Tax-Exempt Receipts |
| R&D | — Research & Development |
| RDA | — Redevelopment Authority |
| RDFA | — Redevelopment Finance Authority |
| REIT | — Real Estate Investment Trust |
| ROC | — Reset Option Certificates |
| SAVRS | — Select Auction Variable Rate Securities |
| SBA | — Small Business Authority |
| SFHR | — Single Family Housing Revenue |
| SFMR | — Single Family Mortgage Revenue |
| SPDR | — Standard & Poor’s Depositary Receipts |
| TAN | — Tax Anticipation Notes |
| TIPS | — Treasury Inflation-Protected Securities |
| TRAN | — Tax Revenue Anticipation Notes |
| TCR | — Transferable Custody Receipts |
| TTFA | — Transportation Trust Fund Authority |
| TVA | — Tennessee Valley Authority |
| XLCA | — XL Capital Assurance |


FOR MORE INFORMATION
More information about Wells Fargo Advantage Funds is available free upon request. To obtain literature, please write, e-mail, visit the Fund’s Web site, or call:
Wells Fargo Advantage Funds
P.O. Box 8266
Boston, MA 02266-8266
E-mail: wfaf@wellsfargo.com
Web site: wellsfargoadvantagefunds.com
Individual investors: 1-800-222-8222
Retail investment professionals: 1-888-877-9275
Institutional investment professionals: 1-866-765-0778
This report and the financial statements contained herein are submitted for the general information of the shareholders of Wells Fargo Advantage Funds. If this report is used for promotional purposes, distribution of the report must be accompanied or preceded by a current prospectus. For a prospectus containing more complete information, including charges and expenses, call 1-800-222-8222 or visit the Fund’s Web site at wellsfargoadvantagefunds.com. Please consider the investment objectives, risks, charges, and expenses of the investment carefully before investing. This and other information about Wells Fargo Advantage Funds can be found in the current prospectus. Read the prospectus carefully before you invest or send money.
Wells Fargo Funds Management, LLC, a wholly owned subsidiary of Wells Fargo & Company, provides investment advisory and administrative services for Wells Fargo Advantage Funds. Other affiliates of Wells Fargo & Company provide subadvisory and other services for the Funds. The Funds are distributed by Wells Fargo Funds Distributor, LLC, Member FINRA/SIPC, an affiliate of Wells Fargo & Company.
NOT FDIC INSURED ¡ NO BANK GUARANTEE ¡ MAY LOSE VALUE
© 2012 Wells Fargo Funds Management, LLC. All rights reserved.
| | |
 | | 207952 03-12 SA212/SAR212 1-12 |

Wells Fargo Advantage
Social Sustainability FundSM*

Semi-Annual Report
January 31, 2012
| * | At a regular meeting held on February 7-8, 2012, the Board of Trustees approved the liquidation of the Fund. The Fund was closed to shareholders on February 10, 2012 and subsequently liquidated on March 28, 2012. |

Reduce clutter. Save trees.
Sign up for electronic delivery of prospectuses and shareholder reports at wellsfargo.com/advantagedelivery
Contents
The views expressed and any forward-looking statements are as of January 31, 2012, unless otherwise noted, and are those of the Fund managers and/or Wells Fargo Funds Management, LLC. Discussions of individual securities, or the markets generally, or any Wells Fargo Advantage Fund are not intended as individual recommendations. Future events or results may vary significantly from those expressed in any forward-looking statements; the views expressed are subject to change at any time in response to changing circumstances in the market. Wells Fargo Funds Management, LLC, disclaims any obligation to publicly update or revise any views expressed or forward-looking statements.
NOT FDIC INSURED ¡ NO BANK GUARANTEE ¡ MAY LOSE VALUE

WELLS FARGO INVESTMENT HISTORY
| | |
| |
| 1932 | | Keystone creates one of the first mutual fund families. |
| |
| 1971 | | Wells Fargo & Company introduces one of the first institutional index funds. |
| |
| 1978 | | Wells Fargo applies Markowitz and Sharpe’s research on Modern Portfolio Theory to introduce one of the industry’s first Tactical Asset Allocation (TAA) models in institutional separately managed accounts. |
| |
| 1984 | | Wells Fargo Stagecoach Funds launches its first asset allocation fund. |
| |
| 1989 | | The Tactical Asset Allocation (TAA) Model is first applied to Wells Fargo’s asset allocation mutual funds. |
| |
| 1994 | | Wells Fargo introduces the LifePath Funds, one of the first suites of target date funds (now the Wells Fargo Advantage Dow Jones Target Date FundsSM ). |
| |
| 1996 | | Evergreen Investments and Keystone Funds merge. |
| |
| 1997 | | Wells Fargo launches Wells Fargo Advantage WealthBuilder PortfoliosSM, a fund-of-funds suite of products that includes the use of quantitative models to shift assets among investment styles. |
| |
| 1999 | | Norwest Advantage Funds and Stagecoach Funds are reorganized into Wells Fargo Funds after the merger of Norwest and Wells Fargo. |
| |
| 2002 | | Evergreen Retail and Evergreen Institutional companies form the umbrella asset management company, Evergreen Investments. |
| |
| 2005 | | The integration of Strong Funds with Wells Fargo Funds creates Wells Fargo Advantage Funds, resulting in one of the top 20 mutual fund companies in the United States. |
| |
| 2006 | | Wells Fargo Advantage Funds relaunches the target date product line as Wells Fargo Advantage Dow Jones Target Date Funds. |
| |
| 2010 | | The mergers and reorganizations of Evergreen and Wells Fargo Advantage mutual funds are completed, unifying the families under the brand of Wells Fargo Advantage Funds. |
Wells Fargo Advantage Funds®
Wells Fargo Advantage Funds skillfully guides institutions, financial advisors, and individuals through the investment terrain to help them reach their financial objectives. Everything we do on behalf of investors is backed by our unique combination of qualifications.
Strength
Our organization is built on the standards of integrity and service established by our parent company—Wells Fargo & Company—more than 150 years ago. And, because we’re part of a highly diversified financial enterprise, we offer the depth of resources to help investors succeed.
Expertise
Our multi-boutique model offers investors access to the independent thinking of premier investment managers that have been chosen for their time-tested strategies. While each team specializes in a specific investment strategy, collectively they provide investors a wide choice of distinct investment styles. Our dedication to investment excellence doesn’t end with our expertise in manager selection—risk management, analysis, and rigorous ongoing review seek to ensure each manager’s investment process remains consistent.
Partnership
Our collaborative approach is built around understanding the needs and goals of our clients. By adhering to core principles of sound judgment and steady guidance, we support you through every stage of the investment decision process.
Carefully consider a fund’s investment objectives, risks, charges, and expenses before investing. For a current prospectus and, if available, a summary prospectus, containing this and other information, visit wellsfargoadvantagefunds.com. Read it carefully before investing.
Wells Fargo Funds Management, LLC, a wholly owned subsidiary of Wells Fargo & Company, provides investment advisory and administrative services for Wells Fargo Advantage Funds®. Other affiliates of Wells Fargo & Company provide subadvisory and other services for the Funds. The Funds are distributed by Wells Fargo Funds Distributor, LLC, Member FINRA/SIPC, an affiliate of Wells Fargo & Company.
“Dow Jones®” and “Dow Jones Target Date IndexesSM” are service marks of Dow Jones Trademark Holdings, LLC (“Dow Jones”), have been licensed to CME Group Index Services LLC (“CME Indexes”) and have been sublicensed for use for certain purposes by Global Index Advisors, Inc, and Wells Fargo Funds Management, LLC. The Wells Fargo Advantage Dow Jones Target Date FundsSM based on the Dow Jones Target Date IndexesSM, are not sponsored, endorsed, sold or promoted by Dow Jones, CME Indexes or their respective affiliates and none of them makes any representation regarding the advisability of investing in such product(s).
NOT FDIC INSURED ¡ NO BANK GUARANTEE ¡ MAY LOSE VALUE
Not part of the semi-annual report.
Wells Fargo Advantage Funds offers more than 110 mutual funds across a wide range of asset classes, representing over $217 billion in assets under management, as of January 31, 2012.
| | | | |
| Equity Funds | | | | |
Asia Pacific Fund | | Equity Value Fund | | Precious Metals Fund |
C&B Large Cap Value Fund | | Global Opportunities Fund | | Premier Large Company Growth Fund |
C&B Mid Cap Value Fund | | Growth Fund | | Small Cap Opportunities Fund |
Capital Growth Fund | | Index Fund | | Small Cap Value Fund |
Common Stock Fund | | International Equity Fund | | Small Company Growth Fund |
Disciplined U.S. Core Fund | | International Value Fund | | Small Company Value Fund |
Discovery Fund† | | Intrinsic Small Cap Value Fund | | Small/Mid Cap Core Fund |
Diversified Equity Fund | | Intrinsic Value Fund | | Small/Mid Cap Value Fund |
Diversified International Fund | | Intrinsic World Equity Fund | | Special Mid Cap Value Fund |
Diversified Small Cap Fund | | Large Cap Core Fund | | Special Small Cap Value Fund |
Emerging Growth Fund | | Large Cap Growth Fund | | Specialized Technology Fund |
Emerging Markets Equity Fund | | Large Company Value Fund | | Strategic Large Cap Growth Fund |
Endeavor Select Fund† | | Omega Growth Fund | | Traditional Small Cap Growth Fund |
Enterprise Fund† | | Opportunity Fund† | | Utility and Telecommunications Fund |
| Bond Funds | | | | |
Adjustable Rate Government Fund | | Inflation-Protected Bond Fund | | Short-Term Bond Fund |
California Limited-Term Tax-Free Fund | | Intermediate Tax/AMT-Free Fund | | Short-Term High Yield Bond Fund |
California Tax-Free Fund | | International Bond Fund | | Short-Term Municipal Bond Fund |
Colorado Tax-Free Fund | | Minnesota Tax-Free Fund | | Strategic Municipal Bond Fund |
Government Securities Fund | | Municipal Bond Fund | | Total Return Bond Fund |
High Income Fund | | North Carolina Tax-Free Fund | | Ultra Short-Term Income Fund |
High Yield Bond Fund | | Pennsylvania Tax-Free Fund | | Ultra Short-Term Municipal Income Fund |
Income Plus Fund | | Short Duration Government Bond Fund | | Wisconsin Tax-Free Fund |
| Asset Allocation Funds | | | | |
Absolute Return Fund | | WealthBuilder Equity Portfolio† | | Target 2020 Fund† |
Asset Allocation Fund | | WealthBuilder Growth Allocation Portfolio† | | Target 2025 Fund† |
Conservative Allocation Fund | | WealthBuilder Growth Balanced Portfolio† | | Target 2030 Fund† |
Diversified Capital Builder Fund | | WealthBuilder Moderate Balanced Portfolio† | | Target 2035 Fund† |
Diversified Income Builder Fund | | WealthBuilder Tactical Equity Portfolio† | | Target 2040 Fund† |
Growth Balanced Fund | | Target Today Fund† | | Target 2045 Fund† |
Index Asset Allocation Fund | | Target 2010 Fund† | | Target 2050 Fund† |
Moderate Balanced Fund | | Target 2015 Fund† | | Target 2055 Fund† |
WealthBuilder Conservative Allocation Portfolio† | | | | |
| Money Market Funds | | | | |
100% Treasury Money Market Fund | | Heritage Money Market Fund† | | National Tax-Free Money Market Fund |
California Municipal Money Market Fund | | Money Market Fund | | Prime Investment Money Market Fund |
Cash Investment Money Market Fund | | Municipal Cash Management Money Market Fund | | Treasury Plus Money Market Fund |
Government Money Market Fund | | Municipal Money Market Fund | | |
| Variable Trust Funds1 | | | | |
VT Discovery Fund† | | VT Intrinsic Value Fund | | VT Small Cap Growth Fund |
VT Index Asset Allocation Fund | | VT Omega Growth Fund | | VT Small Cap Value Fund |
VT International Equity Fund | | VT Opportunity Fund† | | VT Total Return Bond Fund |
An investment in a money market fund is not insured or guaranteed by the Federal Deposit Insurance Corporation or any other government agency. Although the Wells Fargo Advantage Money Market Funds seek to preserve the value of your investment at $1.00 per share, it is possible to lose money by investing in a money market fund.
| 1. | The Variable Trust Funds are generally available only through insurance company variable contracts. |
| † | In this report, the Wells Fargo Advantage Discovery FundSM, Wells Fargo Advantage Endeavor Select FundSM, Wells Fargo Advantage Enterprise FundSM, Wells Fargo Advantage Opportunity FundSM, Wells Fargo Advantage WealthBuilder Conservative Allocation PortfolioSM, Wells Fargo Advantage WealthBuilder Equity PortfolioSM, Wells Fargo Advantage WealthBuilder Growth Allocation PortfolioSM, Wells Fargo Advantage WealthBuilder Growth Balanced PortfolioSM, Wells Fargo Advantage WealthBuilder Moderate Balanced PortfolioSM, Wells Fargo Advantage WealthBuilder Tactical Equity PortfolioSM, Wells Fargo Advantage Dow Jones Target Today FundSM, Wells Fargo Advantage Dow Jones Target 2010 FundSM, Wells Fargo Advantage Dow Jones Target 2015 FundSM, Wells Fargo Advantage Dow Jones Target 2020 FundSM, Wells Fargo Advantage Dow Jones Target 2025 FundSM, Wells Fargo Advantage Dow Jones Target 2030 FundSM, Wells Fargo Advantage Dow Jones Target 2035 FundSM, Wells Fargo Advantage Dow Jones Target 2040 FundSM, Wells Fargo Advantage Dow Jones Target 2045 FundSM, Wells Fargo Advantage Dow Jones Target 2050 FundSM, Wells Fargo Advantage Dow Jones Target 2055 FundSM, Wells Fargo Advantage Heritage Money Market FundSM, Wells Fargo Advantage VT Discovery FundSM, and Wells Fargo Advantage VT Opportunity FundSM are referred to as the Discovery Fund, Endeavor Select Fund, Enterprise Fund, Opportunity Fund, WealthBuilder Conservative Allocation Portfolio, WealthBuilder Equity Portfolio, WealthBuilder Growth Allocation Portfolio, WealthBuilder Growth Balanced Portfolio, WealthBuilder Moderate Balanced Portfolio, WealthBuilder Tactical Equity Portfolio, Target Today Fund, Target 2010 Fund, Target 2015 Fund, Target 2020 Fund, Target 2025 Fund, Target 2030 Fund, Target 2035 Fund, Target 2040 Fund, Target 2045 Fund, Target 2050 Fund, Target 2055 Fund, Heritage Money Market Fund, VT Discovery Fund, and VT Opportunity Fund, respectively. |
Not part of the semi-annual report.
| | | | |
| 2 | | Wells Fargo Advantage Social Sustainability Fund | | Letter to Shareholders |

Karla M. Rabusch,
President
Wells Fargo Advantage Funds
The period was marked by increased confidence that the U.S. economy was staging a fragile recovery, offset by continued concerns about the possible effect on the global economy of the ongoing European sovereign debt crisis—which began in Greece and later spread to the larger economies of Italy and Spain.
The slow-motion debt crisis in the eurozone was a major headwind to both domestic and global stock market indexes.
Dear Valued Shareholder:
We’re pleased to offer you this semi-annual report for the Wells Fargo Advantage Social Sustainability Fund for the six-month period that ended January 31, 2012. The period was marked by increased confidence that the U.S. economy was staging a fragile recovery, offset by continued concerns about the possible effect on the global economy of the ongoing European sovereign debt crisis—which began in Greece and later spread to the larger economies of Italy and Spain. Most U.S. stock indexes posted gains for the period, even if only modest ones.
Worries gave way to guarded optimism for the U.S. economy.
The period began with worries that the U.S. economy was returning to recession. Revised figures for gross domestic product (GDP) indicated that the U.S. economy grew by an annualized rate of only 0.8% in the first half of 2011. Moreover, although the July 2011 Institute for Supply Management (ISM) manufacturing survey suggested that factories continued to expand, the rate of expansion was lower than in previous months. The prolonged debate over whether and how to raise the U.S. debt ceiling—which only ended on July 31, 2011—also depressed market sentiment by highlighting the country’s political divisions.
The stock market remained volatile throughout September. By late October, however, stronger economic data led to greater optimism and higher stock prices. Revised real GDP growth came in at 1.8% in the third quarter of 2011 and 2.8% in the fourth quarter, suggesting that the recovery was on firmer footing. Economic growth was not evenly distributed, though, as December 2011 retail same-store sales generally showed stronger growth for retailers targeting affluent customers than for those targeting the broad middle class. The reported unemployment rate also showed some signs of improvement, falling from 9.1% in August 2011 to 8.3% in January 2012. However, this decline in the unemployment rate was accompanied by an increase in the number of Americans not in the labor force, raising concerns about the economy’s ability to generate jobs.
The eurozone had continued trouble.
The slow-motion debt crisis in the eurozone was a major headwind to both domestic and global stock market indexes. The worsening debt and deficit numbers for Greece in late 2011 and early 2012 cast doubt on the country’s ability to service its debt under the plan put in place by the European Union and the International Monetary Fund and put the ongoing drama of the European sovereign debt crisis back on center stage. Investors became increasingly concerned that Greece would default on its debt, a scenario that only seemed more likely as many Greeks rioted in response to greater budgetary austerity and the discussion moved from whether private investors would take a loss on their Greek debt to how big the loss would be. Because many eurozone banks owned Greek debt and many U.S. banks had financial ties to eurozone banks, investors worried about the effect of such an event on the financial system and the global economy.
Even as the situation in Greece deteriorated, eurozone GDP numbers supported the case for a modest recovery in the global economy. Reported GDP growth for the 17 countries that comprise the eurozone was modest, rising 0.2% in the third quarter compared to the second quarter, and by 0.2% in the fourth quarter
| | | | | | |
| Letter to Shareholders | | Wells Fargo Advantage Social Sustainability Fund | | | 3 | |
compared to the third quarter. However, the eurozone average concealed a wide variation between economies, with Germany’s growing by 0.5% in the third quarter of 2011 even as Greece’s GDP contracted.
Central banks continued to provide stimulus.
Throughout the reporting period, the Federal Open Market Committee (FOMC) kept its key interest rates effectively at zero in order to support the economy and financial system. Moreover, in response to extreme market volatility and signs of a weakening economy, in its August 2011 policy statement, the Federal Reserve (Fed) announced it would keep interest rates “exceptionally low” until at least mid-2013 as a way to support the economy. Market participants interpreted the Fed’s statement to mean that the central bankers believed the economy would remain weak over the next two years. However, the Fed also said that it was considering a “range of policy tools available to promote a stronger economic recovery” and “is prepared to employ these tools as appropriate.”
At the beginning of the period, the European Central Bank (ECB) had a key rate of 1.50% but lowered it to 1.25% in November 2011 and then to 1.00% in December 2011 in an attempt to support the sluggish eurozone recovery. To support the banking system, in late 2011, the ECB initiated a long-term refinancing operation (LTRO) in which it supplied three-year loans to banks against a wide range of collateral. The operation basically provided a near-unlimited amount of liquidity to banks, easing some investor concerns about the effect of an increasingly probable Greek default.
We use time-tested investment strategies, even as many variables are at work in the market.
Experience tells us that strict adherence to time-tested investment strategies has its rewards. As a whole, Wells Fargo Advantage Funds represents investments across a range of asset classes and investment styles, giving you an opportunity to create a diversified investment portfolio. While diversification may not prevent losses in a downturn, it does provide you with one way of managing risk.
Thank you for choosing to invest with Wells Fargo Advantage Funds. We appreciate your confidence in us and remain committed to helping you meet your financial needs. For current information about your fund investments, contact your investment professional, visit our website at wellsfargoadvantagefunds.com, or call us directly at 1-800-222-8222. We are available 24 hours a day, 7 days a week.
Sincerely,

Karla M. Rabusch
President
Wells Fargo Advantage Funds
| | | | |
| 4 | | Wells Fargo Advantage Social Sustainability Fund | | Letter to Shareholders |
Notice to Shareholders
The Board of Trustees for Wells Fargo Advantage Funds has unanimously approved the following modifications to certain net asset value (NAV) waiver privileges and commission schedules:
| | n | | Effective May 1, 2012, automatic investment plan (AIP) purchases and proceeds received from systematic withdrawals will no longer qualify for NAV repurchase privileges. | |
| | n | | Effective May 1, 2012, discretionary rights to waive the upfront commission for Class C and “jumbo” Class A share purchases will no longer be granted to broker/dealers. However, we will continue to waive the Class C shares contingent deferred sales charge for redemptions by employer-sponsored retirement plans where the dealer of record waived its commission at the time of purchase. | |
| | n | | Effective July 31, 2012, NAV purchase privileges for former Evergreen Class IS and Class R shareholders are being modified to remove the ability to purchase Class A shares at NAV unless those shares are held directly with the Fund on or after July 31, 2012. | |
Please contact your investment professional or call us directly at 1-800-222-8222 if you have any questions on this Notice to Shareholders.
| | | | | | |
| Performance Highlights (Unaudited) | | Wells Fargo Advantage Social Sustainability Fund | | | 5 | |
INVESTMENT OBJECTIVE
The Fund seeks long-term capital appreciation by investing in securities which meet the Fund’s investment and social sustainability criteria.
ADVISER
Wells Fargo Funds Management, LLC
SUB-ADVISER
Nelson Capital Management, LLC
PORTFOLIO MANAGERS
Scott C. Benner, CFA
Lloyd Kurtz, CFA
Jon Manchester, CFA, CFP
Frank Marcoux, CFA
Suanne Ramar, CFA
FUND INCEPTION
September 30, 2008
| | | | |
TEN LARGEST EQUITY HOLDINGS1
(AS OF JANUARY 31, 2012) | | | |
Apple Incorporated | | | 3.26% | |
Microsoft Corporation | | | 3.22% | |
Google Incorporated Class A | | | 3.21% | |
Home Depot Incorporated | | | 2.90% | |
EMC Corporation | | | 2.88% | |
TJX Companies Incorporated | | | 2.84% | |
Capital One Financial Corporation | | | 2.81% | |
Johnson & Johnson Services Incorporated | | | 2.81% | |
Norfolk Southern Corporation | | | 2.73% | |
Eaton Corporation | | | 2.69% | |
| | |
SECTOR DISTRIBUTION2
(AS OF JANUARY 31, 2012) |
|
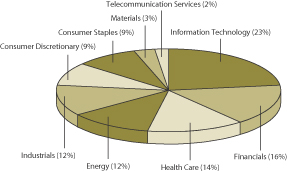 |
| 1. | The ten largest equity holdings are calculated based on the value of the securities divided by total net assets of the Fund. Holdings are subject to change and may have changed since the date specified. |
| 2. | Sector distribution is subject to change and is calculated based on the total long-term investments of the Fund. |
| | | | |
| 6 | | Wells Fargo Advantage Social Sustainability Fund | | Performance Highlights (Unaudited) |
AVERAGE ANNUAL TOTAL RETURN (%) (AS OF JANUARY 31, 2012)
| | | | | | | | | | | | | | | | | | | | | | | | | | | | | | | | | | | | |
| | | | | | Including Sales Charge | | | Excluding Sales Charge | | | Expense Ratios3 | |
| | | Inception Date | | | 6 Months* | | | 1 Year | | | Life of Fund | | | 6 Months* | | | 1 Year | | | Life of Fund | | | Gross | | | Net4 | |
Class A (WSSAX) | | | 09/30/2008 | | | | (4.15 | ) | | | (4.23 | ) | | | 2.22 | | | | 1.70 | | | | 1.61 | | | | 4.05 | | | | 3.05% | | | | 1.25% | |
Class C (WSRCX) | | | 09/30/2008 | | | | 0.32 | | | | (0.14 | ) | | | 3.29 | | | | 1.32 | | | | 0.86 | | | | 3.29 | | | | 3.80% | | | | 2.00% | |
Administrator Class (WSRAX) | | | 09/30/2008 | | | | | | | | | | | | | | | | 1.84 | | | | 1.84 | | | | 4.31 | | | | 2.89% | | | | 1.00% | |
S&P 500 Index5 | | | | | | | | | | | | | | | | | | | 2.71 | | | | 4.22 | | | | 5.93 | | | | | | | | | |
| * | Returns for periods of less than one year are not annualized. |
Figures quoted represent past performance, which is no guarantee of future results and do not reflect the deduction of taxes that a shareholder may pay on fund distributions or the redemption of fund shares. Investment return and principal value of an investment will fluctuate so that an investor’s shares, when redeemed, may be worth more or less than their original cost. Performance shown without sales charges would be lower if sales charges were reflected. Current performance may be lower or higher than the performance data quoted and assumes the reinvestment of dividends and capital gains. Current month-end performance is available on the Fund’s Web site – wellsfargoadvantagefunds.com
Index returns do not include transaction costs associated with buying and selling securities, any mutual fund fees or expenses or any taxes. It is not possible to invest directly in an index.
For Class A shares, the maximum front-end sales charge is 5.75%. For Class C shares, the maximum contingent deferred sales charge is 1.00%. Performance including sales charge assumes the sales charge for the corresponding time period. Administrator Class shares are sold without a front-end sales charge or contingent deferred sales charge.
Stock fund values fluctuate in response to the activities of individual companies and general market and economic conditions. Because the social screens applied to the Fund’s investments may exclude securities of certain issuers, industries, and sectors for nonfinancial reasons, the Fund may forgo some market opportunities available to funds that do not use these screens. Certain investment strategies tend to increase the total risk of an investment (relative to the broader market). This Fund is exposed to foreign investment risk and social investment risk. Consult the Fund’s prospectus for additional information on these and other risks.
| 3. | Reflects the expense ratios as stated in the most recent prospectuses. |
| 4. | The Adviser has committed through November 30, 2012 to waive fees and/or reimburse expenses to the extent necessary to cap the Fund’s Total Annual Fund Operating Expenses After Fee Waiver, excluding certain expenses, at the amounts shown above. Without this cap, the Fund’s returns would have been lower. |
| 5. | The S&P 500 Index consists of 500 stocks chosen for market size, liquidity, and industry group representation. It is a market-value weighted index with each stock’s weight in the index proportionate to its market value. You cannot invest directly in an index. |
| | | | | | |
| Fund Expenses (Unaudited) | | Wells Fargo Advantage Social Sustainability Fund | | | 7 | |
As a shareholder of the Fund, you incur two types of costs: (1) transaction costs, including sales charges (loads) on purchase payments and contingent deferred sales charges (if any) on redemptions and (2) ongoing costs, including management fees; distribution (12b-1) and/or shareholder service fees; and other Fund expenses. This example is intended to help you understand your ongoing costs (in dollars) of investing in the Fund and to compare these costs with the ongoing costs of investing in other mutual funds.
The example is based on an investment of $1,000 invested at the beginning of the six-month period and held for the entire period from August 1, 2011 to January 31, 2012.
Actual Expenses
The “Actual” line of the table below provides information about actual account values and actual expenses. You may use the information in this line, together with the amount you invested, to estimate the expenses that you paid over the period. Simply divide your account value by $1,000 (for example, an $8,600 account value divided by $1,000 = 8.6), then multiply the result by the number in the “Actual” line under the heading entitled “Expenses Paid During Period” for your applicable class of shares to estimate the expenses you paid on your account during this period.
Hypothetical Example for Comparison Purposes
The “Hypothetical” line of the table below provides information about hypothetical account values and hypothetical expenses based on the Fund’s actual expense ratio and an assumed rate of return of 5% per year before expenses, which is not the Fund’s actual return. The hypothetical account values and expenses may not be used to estimate the actual ending account balance or expenses you paid for the period. You may use this information to compare the ongoing costs of investing in the Fund and other funds. To do so, compare this 5% hypothetical example with the 5% hypothetical examples that appear in the shareholder reports of the other funds.
Please note that the expenses shown in the table are meant to highlight your ongoing costs only and do not reflect any transactional costs, such as sales charges (loads) and contingent deferred sales charges. Therefore, the “Hypothetical” line of the table is useful in comparing ongoing costs only, and will not help you determine the relative total costs of owning different funds. In addition, if these transactional costs were included, your costs would have been higher.
| | | | | | | | | | | | | | | | |
| | | Beginning
Account Value
08-01-2011 | | | Ending
Account Value
01-31-2012 | | | Expenses
Paid During
the Period¹ | | | Net Annual
Expense Ratio | |
Class A | | | | | | | | | | | | | | | | |
Actual | | $ | 1,000.00 | | | $ | 1,016.98 | | | $ | 6.34 | | | | 1.25 | % |
Hypothetical (5% return before expenses) | | $ | 1,000.00 | | | $ | 1,018.85 | | | $ | 6.34 | | | | 1.25 | % |
Class C | | | | | | | | | | | | | | | | |
Actual | | $ | 1,000.00 | | | $ | 1,013.21 | | | $ | 10.12 | | | | 2.00 | % |
Hypothetical (5% return before expenses) | | $ | 1,000.00 | | | $ | 1,015.08 | | | $ | 10.13 | | | | 2.00 | % |
Administrator Class | | | | | | | | | | | | | | | | |
Actual | | $ | 1,000.00 | | | $ | 1,018.45 | | | $ | 5.07 | | | | 1.00 | % |
Hypothetical (5% return before expenses) | | $ | 1,000.00 | | | $ | 1,020.11 | | | $ | 5.08 | | | | 1.00 | % |
| 1. | Expenses paid is equal to the annualized expense ratio of each class multiplied by the average account value over the period, multiplied by the number of days in the most recent fiscal half-year divided by the number of days in the fiscal year (to reflect the one-half year period). |
| | | | |
| 8 | | Wells Fargo Advantage Social Sustainability Fund | | Portfolio of Investments—January 31, 2012 (Unaudited) |
| | | | | | | | | | | | |
| Security Name | | | | | | Shares | | | Value | |
| | | | | | | | | | | | |
| | | | |
Common Stocks: 98.98% | | | | | | | | | | | | |
| | | | |
Consumer Discretionary: 9.16% | | | | | | | | | | | | |
| | | | |
| Media: 1.71% | | | | | | | | | | | | |
Walt Disney Company | | | | | | | 3,384 | | | $ | 131,638 | |
| | | | | | | | | | | | |
| | | | |
| Multiline Retail: 1.71% | | | | | | | | | | | | |
Nordstrom Incorporated | | | | | | | 2,660 | | | | 131,351 | |
| | | | | | | | | | | | |
| | | | |
| Specialty Retail: 5.74% | | | | | | | | | | | | |
Home Depot Incorporated | | | | | | | 5,009 | | | | 222,350 | |
TJX Companies Incorporated | | | | | | | 3,200 | | | | 218,048 | |
| | | | |
| | | | | | | | | | | 440,398 | |
| | | | | | | | | | | | |
| | | | |
Consumer Staples: 8.83% | | | | | | | | | | | | |
| | | | |
| Food & Staples Retailing: 3.96% | | | | | | | | | | | | |
Costco Wholesale Corporation | | | | | | | 2,080 | | | | 171,122 | |
Walgreen Company | | | | | | | 3,979 | | | | 132,739 | |
| | | | |
| | | | | | | | | | | 303,861 | |
| | | | | | | | | | | | |
| | | | |
| Food Products: 2.69% | | | | | | | | | | | | |
General Mills Incorporated | | | | | | | 5,194 | | | | 206,877 | |
| | | | | | | | | | | | |
| | | | |
| Household Products: 2.18% | | | | | | | | | | | | |
Procter & Gamble Company | | | | | | | 2,657 | | | | 167,497 | |
| | | | | | | | | | | | |
| | | | |
Energy: 11.40% | | | | | | | | | | | | |
| | | | |
| Energy Equipment & Services: 1.63% | | | | | | | | | | | | |
Noble Corporation | | | | | | | 3,600 | | | | 125,424 | |
| | | | | | | | | | | | |
| | | | |
| Oil, Gas & Consumable Fuels: 9.77% | | | | | | | | | | | | |
Apache Corporation | | | | | | | 1,666 | | | | 164,734 | |
Noble Energy Incorporated | | | | | | | 1,976 | | | | 198,924 | |
Spectra Energy Corporation | | | | | | | 6,133 | | | | 193,128 | |
Statoil ASA ADR | | | | | | | 7,663 | | | | 193,567 | |
| | | | |
| | | | | | | | | | | 750,353 | |
| | | | | | | | | | | | |
| | | | |
Financials: 15.79% | | | | | | | | | | | | |
| | | | |
| Capital Markets: 1.53% | | | | | | | | | | | | |
Franklin Resources Incorporated | | | | | | | 1,110 | | | | 117,771 | |
| | | | | | | | | | | | |
| | | | |
| Commercial Banks: 3.76% | | | | | | | | | | | | |
PNC Financial Services Group Incorporated | | | | | | | 3,136 | | | | 184,773 | |
Toronto-Dominion Bank ADR | | | | | | | 1,351 | | | | 104,189 | |
| | | | |
| | | | | | | | | | | 288,962 | |
| | | | | | | | | | | | |
| | | | |
| Consumer Finance: 2.81% | | | | | | | | | | | | |
Capital One Financial Corporation | | | | | | | 4,709 | | | | 215,437 | |
| | | | | | | | | | | | |
| | | | |
| Diversified Financial Services: 1.53% | | | | | | | | | | | | |
JPMorgan Chase & Company | | | | | | | 3,154 | | | | 117,644 | |
| | | | | | | | | | | | |
| | | | | | |
| Portfolio of Investments—January 31, 2012 (Unaudited) | | Wells Fargo Advantage Social Sustainability Fund | | | 9 | |
| | | | | | | | | | | | |
| Security Name | | | | | | Shares | | | Value | |
| | | | | | | | | | | | |
| | | | |
| Insurance: 6.16% | | | | | | | | | | | | |
ACE Limited | | | | | | | 2,483 | | | $ | 172,817 | |
MetLife Incorporated | | | | | | | 3,690 | | | | 130,368 | |
Prudential Financial Incorporated | | | | | | | 2,967 | | | | 169,831 | |
| | | | |
| | | | | | | | | | | 473,016 | |
| | | | | | | | | | | | |
| | | | |
Health Care: 14.27% | | | | | | | | | | | | |
| | | | |
| Health Care Equipment & Supplies: 5.92% | | | | | | | | | | | | |
Baxter International Incorporated | | | | | | | 2,925 | | | | 162,279 | |
Becton Dickinson & Company | | | | | | | 1,797 | | | | 140,903 | |
Stryker Corporation | | | | | | | 2,730 | | | | 151,324 | |
| | | | |
| | | | | | | | | | | 454,506 | |
| | | | | | | | | | | | |
| | | | |
| Health Care Providers & Services: 2.44% | | | | | | | | | | | | |
Laboratory Corporation of America Holdings† | | | | | | | 2,052 | | | | 187,532 | |
| | | | | | | | | | | | |
| | | | |
| Pharmaceuticals: 5.91% | | | | | | | | | | | | |
Johnson & Johnson Services Incorporated | | | | | | | 3,272 | | | | 215,658 | |
Novartis AG ADR | | | | | | | 1,784 | | | | 96,978 | |
Pfizer Incorporated | | | | | | | 6,622 | | | | 141,711 | |
| | | | |
| | | | | | | | | | | 454,347 | |
| | | | | | | | | | | | |
| | | | |
Industrials: 11.55% | | | | | | | | | | | | |
| | | | |
| Air Freight & Logistics: 1.83% | | | | | | | | | | | | |
United Parcel Service Incorporated Class B | | | | | | | 1,855 | | | | 140,331 | |
| | | | | | | | | | | | |
| | | | |
| Electrical Equipment: 2.68% | | | | | | | | | | | | |
Emerson Electric Company | | | | | | | 4,000 | | | | 205,520 | |
| | | | | | | | | | | | |
| | | | |
| Industrial Conglomerates: 1.62% | | | | | | | | | | | | |
3M Company | | | | | | | 1,439 | | | | 124,776 | |
| | | | | | | | | | | | |
| | | | |
| Machinery: 2.69% | | | | | | | | | | | | |
Eaton Corporation | | | | | | | 4,220 | | | | 206,907 | |
| | | | | | | | | | | | |
| | | | |
| Road & Rail: 2.73% | | | | | | | | | | | | |
Norfolk Southern Corporation | | | | | | | 2,900 | | | | 209,380 | |
| | | | | | | | | | | | |
| | | | |
Information Technology: 22.55% | | | | | | | | | | | | |
| | | | |
| Communications Equipment: 2.67% | | | | | | | | | | | | |
QUALCOMM Incorporated | | | | | | | 3,483 | | | | 204,870 | |
| | | | | | | | | | | | |
| | | | |
| Computers & Peripherals: 7.46% | | | | | | | | | | | | |
Apple Incorporated† | | | | | | | 548 | | | | 250,151 | |
EMC Corporation† | | | | | | | 8,575 | | | | 220,892 | |
SanDisk Corporation† | | | | | | | 2,215 | | | | 101,624 | |
| | | | |
| | | | | | | | | | | 572,667 | |
| | | | | | | | | | | | |
| | | | |
| Internet Software & Services: 3.21% | | | | | | | | | | | | |
Google Incorporated Class A† | | | | | | | 425 | | | | 246,547 | |
| | | | | | | | | | | | |
| | | | |
| 10 | | Wells Fargo Advantage Social Sustainability Fund | | Portfolio of Investments—January 31, 2012 (Unaudited) |
| | | | | | | | | | | | | | |
| Security Name | | | | | | | Shares | | | Value | |
| | | | | | | | | | | | | | |
| | | | |
| IT Services: 4.53% | | | | | | | | | | | | | | |
Accenture plc | | | | | | | | | 3,380 | | | $ | 193,809 | |
International Business Machines Corporation | | | | | | | | | 800 | | | | 154,080 | |
| | | | |
| | | | | | | | | | | | | 347,889 | |
| | | | | | | | | | | | | | |
| | | | |
| Semiconductors & Semiconductor Equipment: 1.46% | | | | | | | | | | | | | | |
Texas Instruments Incorporated | | | | | | | | | 3,473 | | | | 112,456 | |
| | | | | | | | | | | | | | |
| | | | |
| Software: 3.22% | | | | | | | | | | | | | | |
Microsoft Corporation | | | | | | | | | 8,379 | | | | 247,432 | |
| | | | | | | | | | | | | | |
| | | | |
Materials: 3.31% | | | | | | | | | | | | | | |
| | | | |
| Chemicals: 1.71% | | | | | | | | | | | | | | |
Potash Corporation of Saskatchewan | | | | | | | | | 2,807 | | | | 131,199 | |
| | | | | | | | | | | | | | |
| | | | |
| Metals & Mining: 1.60% | | | | | | | | | | | | | | |
Nucor Corporation | | | | | | | | | 2,759 | | | | 122,746 | |
| | | | | | | | | | | | | | |
| | | | |
Telecommunication Services: 2.12% | | | | | | | | | | | | | | |
| | | | |
| Wireless Telecommunication Services: 2.12% | | | | | | | | | | | | | | |
Vodafone Group plc ADR | | | | | | | | | 6,000 | | | | 162,540 | |
| | | | | | | | | | | | | | |
| | | | |
Total Common Stocks (Cost $6,772,842) | | | | | | | | | | | | | 7,601,874 | |
| | | | | | | | | | | | | | |
| | | | |
| | | Yield | | | | | | | | | |
| | | | |
Short-Term Investments: 0.74% | | | | | | | | | | | | | | |
| | | | |
| Investment Companies: 0.74% | | | | | | | | | | | | | | |
Wells Fargo Advantage Government Money Market Fund, Institutional Class(l)(u) | | | 0.01 | % | | | | | 57,193 | | | | 57,193 | |
| | | | | | | | | | | | | | |
| | | | |
Total Short-Term Investments (Cost $57,193) | | | | | | | | | | | | | 57,193 | |
| | | | | | | | | | | | | | |
| | | | | | | | |
| Total Investments in Securities | | | | | | | | |
| (Cost $6,830,035)* | | | 99.72 | % | | | 7,659,067 | |
Other Assets and Liabilities, Net | | | 0.28 | | | | 21,267 | |
| | | | | | | | |
| Total Net Assets | | | 100.00 | % | | $ | 7,680,334 | |
| | | | | | | | |
| † | Non-income earning security. |
| (l) | Investment in an affiliate. |
| (u) | Rate shown is the 7-day annualized yield at period end. |
| * | Cost for federal income tax purposes is $6,836,641 and net unrealized appreciation (depreciation) consists of: |
| | | | |
Gross unrealized appreciation | | $ | 937,116 | |
Gross unrealized depreciation | | | (114,690 | ) |
| | | | |
Net unrealized appreciation | | $ | 822,426 | |
The accompanying notes are an integral part of these financial statements.
| | | | | | |
| Statement of Assets and Liabilities—January 31, 2012 (Unaudited) | | Wells Fargo Advantage Social Sustainability Fund | | | 11 | |
| | | | |
| | | | |
| |
Assets | | | | |
Investments | | | | |
In unaffiliated securities, at value (see cost below) | | $ | 7,601,874 | |
In affiliated securities, at value (see cost below) | | | 57,193 | |
| | | | |
Total investments, at value (see cost below) | | | 7,659,067 | |
Receivable for Fund shares sold | | | 14,185 | |
Receivable for dividends | | | 14,633 | |
Receivable from adviser | | | 6,793 | |
Prepaid expenses and other assets | | | 15,702 | |
| | | | |
Total assets | | | 7,710,380 | |
| | | | |
| |
Liabilities | | | | |
Payable for Fund shares redeemed | | | 39 | |
Distribution fees payable | | | 150 | |
Due to other related parties | | | 1,199 | |
Shareholder report expenses payable | | | 12,620 | |
Shareholder servicing fees payable | | | 1,595 | |
Professional fees payable | | | 9,936 | |
Custody and accounting fees payable | | | 4,507 | |
| | | | |
Total liabilities | | | 30,046 | |
| | | | |
Total net assets | | $ | 7,680,334 | |
| | | | |
| |
NET ASSETS CONSIST OF | | | | |
Paid-in capital | | $ | 6,848,155 | |
Undistributed net investment income | | | 3,403 | |
Accumulated net realized losses on investments | | | (260 | ) |
Net unrealized gains on investments | | | 829,036 | |
| | | | |
Total net assets | | $ | 7,680,334 | |
| | | | |
| |
COMPUTATION OF NET ASSET VALUE AND OFFERING PRICE PER SHARE1 | | | | |
Net assets – Class A | | $ | 1,578,703 | |
Shares outstanding – Class A | | | 144,005 | |
Net asset value per share – Class A | | | $10.96 | |
Maximum offering price per share – Class A2 | | | $11.63 | |
Net assets – Class C | | $ | 229,343 | |
Shares outstanding – Class C | | | 21,373 | |
Net asset value per share – Class C | | | $10.73 | |
Net assets – Administrator Class | | $ | 5,872,288 | |
Shares outstanding – Administrator Class | | | 540,151 | |
Net asset value per share – Administrator Class | | | $10.87 | |
| |
Investments in unaffiliated securities, at cost | | $ | 6,772,842 | |
| | | | |
Investments in affiliated securities, at cost | | $ | 57,193 | |
| | | | |
Total investments, at cost | | $ | 6,830,035 | |
| | | | |
| 1. | The Fund has an unlimited number of authorized shares. |
| 2. | Maximum offering price is computed as 100/94.25 of net asset value. On investments of $50,000 or more, the offering price is reduced. |
The accompanying notes are an integral part of these financial statements.
| | | | |
| 12 | | Wells Fargo Advantage Social Sustainability Fund | | Statement of Operations—Six Months Ended January 31, 2012 (Unaudited) |
| | | | |
| | | | |
| |
Investment income | | | | |
Dividends* | | $ | 83,585 | |
Income from affiliated securities | | | 5 | |
| | | | |
Total investment income | | | 83,590 | |
| | | | |
| |
Expenses | | | | |
Advisory fee | | | 23,346 | |
Administration fees | | | | |
Fund level | | | 1,796 | |
Class A | | | 1,889 | |
Class C | | | 288 | |
Administrator Class | | | 2,754 | |
Shareholder servicing fees | | | | |
Class A | | | 1,816 | |
Class C | | | 277 | |
Administrator Class | | | 6,886 | |
Distribution fees | | | | |
Class C | | | 830 | |
Custody and accounting fees | | | 5,480 | |
Professional fees | | | 16,236 | |
Registration fees | | | 16,972 | |
Shareholder report expenses | | | 18,370 | |
Trustees’ fees and expenses | | | 7,611 | |
Other fees and expenses | | | 3,083 | |
| | | | |
Total expenses | | | 107,634 | |
Less: Fee waivers and/or expense reimbursements | | | (68,795 | ) |
| | | | |
Net expenses | | | 38,839 | |
| | | | |
Net investment income | | | 44,751 | |
| | | | |
| |
REALIZED AND UNREALIZED GAINS (LOSSES) ON INVESTMENTS | | | | |
Net realized gains on investments | | | 158,759 | |
Net change in unrealized gains (losses) on investments | | | (58,989 | ) |
| | | | |
Net realized and unrealized gains (losses) on investments | | | 99,770 | |
| | | | |
Net increase in net assets resulting from operations | | $ | 144,521 | |
| | | | |
| |
* Net of foreign dividend withholding taxes of | | | $329 | |
The accompanying notes are an integral part of these financial statements.
| | | | | | |
| Statements of Changes in Net Assets | | Wells Fargo Advantage Social Sustainability Fund | | | 13 | |
| | | | | | | | | | | | | | | | |
| | | Six Months Ended January 31, 2012 (Unaudited) | | | Year Ended July 31, 2011 | |
| | | | |
Operations | | | | | | | | | | | | | | | | |
Net investment income | | | | | | $ | 44,751 | | | | | | | $ | 45,138 | |
Net realized gains on investments | | | | | | | 158,759 | | | | | | | | 77,636 | |
Net change in unrealized gains (losses) on investments | | | | | | | (58,989 | ) | | | | | | | 772,121 | |
| | | | | | | | | | | | | | | | |
Net increase in net assets resulting from operations | | | | | | | 144,521 | | | | | | | | 894,895 | |
| | | | | | | | | | | | | | | | |
| | | | |
Distributions to shareholders from | | | | | | | | | | | | | | | | |
Net investment income | | | | | | | | | | | | | | | | |
Class A | | | | | | | (11,295 | ) | | | | | | | (2,721 | ) |
Administrator Class | | | | | | | (59,047 | ) | | | | | | | (30,364 | ) |
Net realized gains | | | | | | | | | | | | | | | | |
Class A | | | | | | | (39,402 | ) | | | | | | | (5,842 | ) |
Class C | | | | | | | (5,959 | ) | | | | | | | (1,433 | ) |
Administrator Class | | | | | | | (147,833 | ) | | | | | | | (23,847 | ) |
| | | | | | | | | | | | | | | | |
Total distributions to shareholders | | | | | | | (263,536 | ) | | | | | | | (64,207 | ) |
| | | | | | | | | | | | | | | | |
| | | | |
Capital share transactions | | | Shares | | | | | | | | Shares | | | | | |
Proceeds from shares sold | | | | | | | | | | | | | | | | |
Class A | | | 11,187 | | | | 115,536 | | | | 82,648 | | | | 890,292 | |
Class C | | | 2,047 | | | | 20,464 | | | | 2,397 | | | | 24,292 | |
Administrator Class | | | 50,111 | | | | 524,000 | | | | 179,283 | | | | 1,927,407 | |
| | | | | | | | | | | | | | | | |
| | | | | | | 660,000 | | | | | | | | 2,841,991 | |
| | | | | | | | | | | | | | | | |
Net assets value of shares issued in reinvestment of distributions | | | | | | | | | | | | | | | | |
Class A | | | 4,438 | | | | 46,560 | | | | 780 | | | | 8,412 | |
Class C | | | 574 | | | | 5,904 | | | | 135 | | | | 1,423 | |
Administrator Class | | | 7,026 | | | | 73,021 | | | | 1,506 | | | | 16,176 | |
| | | | | | | | | | | | | | | | |
| | | | | | | 125,485 | | | | | | | | 26,011 | |
| | | | | | | | | | | | | | | | |
Payment for shares redeemed | | | | | | | | | | | | | | | | |
Class A | | | (4,980 | ) | | | (52,724 | ) | | | (32,426 | ) | | | (362,196 | ) |
Class C | | | (3,174 | ) | | | (32,174 | ) | | | (9,196 | ) | | | (98,100 | ) |
Administrator Class | | | (38,872 | ) | | | (409,730 | ) | | | (111,158 | ) | | | (1,163,425 | ) |
| | | | | | | | | | | | | | | | |
| | | | | | | (494,628 | ) | | | | | | | (1,623,721 | ) |
| | | | | | | | | | | | | | | | |
Net increase in net assets resulting
from capital share transactions | | | | | | | 290,857 | | | | | | | | 1,244,281 | |
| | | | | | | | | | | | | | | | |
Total increase in net assets | | | | | | | 171,842 | | | | | | | | 2,074,969 | |
| | | | | | | | | | | | | | | | |
| | | | |
Net assets | | | | | | | | | | | | | | | | |
Beginning of period | | | | | | | 7,508,492 | | | | | | | | 5,433,523 | |
| | | | | | | | | | | | | | | | |
End of period | | | | | | $ | 7,680,334 | | | | | | | $ | 7,508,492 | |
| | | | | | | | | | | | | | | | |
Undistributed net investment income | | | | | | $ | 3,403 | | | | | | | $ | 28,994 | |
| | | | | | | | | | | | | | | | |
The accompanying notes are an integral part of these financial statements.
| | | | |
| 14 | | Wells Fargo Advantage Social Sustainability Fund | | Financial Highlights |
(For a share outstanding throughout each period)
| | | | | | | | | | | | | | | | |
| | | Six Months Ended
January 31, 2012
(Unaudited) | | | Year Ended July 31, | |
| Class A | | | 2011 | | | 2010 | | | 20091 | |
Net asset value, beginning of period | | $ | 11.15 | | | $ | 9.69 | | | $ | 8.91 | | | $ | 10.00 | |
Net investment income | | | 0.05 | | | | 0.03 | | | | 0.03 | | | | 0.02 | |
Net realized and unrealized gains (losses) on investments | | | 0.12 | | | | 1.50 | | | | 0.75 | | | | (1.11 | ) |
| | | | | | | | | | | | | | | | |
Total from investment operations | | | 0.17 | | | | 1.53 | | | | 0.78 | | | | (1.09 | ) |
Distributions to shareholders from | | | | | | | | | | | | | | | | |
Net investment income | | | (0.08 | ) | | | (0.02 | ) | | | 0.00 | | | | 0.00 | |
Net realized gains | | | (0.28 | ) | | | (0.05 | ) | | | 0.00 | | | | 0.00 | |
| | | | | | | | | | | | | | | | |
Total distributions to shareholders | | | (0.36 | ) | | | (0.07 | ) | | | 0.00 | | | | 0.00 | |
Net asset value, end of period | | $ | 10.96 | | | $ | 11.15 | | | $ | 9.69 | | | $ | 8.91 | |
Total return2 | | | 1.70 | % | | | 15.87 | % | | | 8.75 | % | | | (10.90 | )% |
Ratios to average net assets (annualized) | | | | | | | | | | | | | | | | |
Gross expenses | | | 3.09 | % | | | 3.05 | % | | | 5.03 | % | | | 17.43 | % |
Net expenses | | | 1.25 | % | | | 1.25 | % | | | 1.25 | % | | | 1.25 | % |
Net investment income | | | 1.07 | % | | | 0.51 | % | | | 0.52 | % | | | 0.95 | % |
Supplemental data | | | | | | | | | | | | | | | | |
Portfolio turnover rate | | | 13 | % | | | 30 | % | | | 37 | % | | | 12 | % |
Net assets, end of period (000’s omitted) | | | $1,579 | | | | $1,487 | | | | $798 | | | | $266 | |
| 1. | For the period from September 30, 2008 (commencement of class operations) to July 31, 2009. |
| 2. | Total return calculations do not include any sales charges. Returns for periods of less than one year are not annualized. |
The accompanying notes are an integral part of these financial statements.
| | | | | | |
| Financial Highlights | | Wells Fargo Advantage Social Sustainability Fund | | | 15 | |
(For a share outstanding throughout each period)
| | | | | | | | | | | | | | | | |
| | | Six Months Ended
January 31, 2012
(Unaudited) | | | Year Ended July 31, | |
| Class C | | | 2011 | | | 2010 | | | 20091 | |
Net asset value, beginning of period | | $ | 10.88 | | | $ | 9.51 | | | $ | 8.85 | | | $ | 10.00 | |
Net investment income (loss) | | | 0.01 | | | | (0.04 | ) | | | (0.00 | )2 | | | 0.01 | |
Net realized and unrealized gains (losses) on investments | | | 0.12 | | | | 1.46 | | | | 0.72 | | | | (1.16 | ) |
| | | | | | | | | | | | | | | | |
Total from investment operations | | | 0.13 | | | | 1.42 | | | | 0.72 | | | | (1.15 | ) |
Distributions to shareholders from | | | | | | | | | | | | | | | | |
Net investment income | | | 0.00 | | | | 0.00 | | | | (0.06 | ) | | | 0.00 | |
Net realized gains | | | (0.28 | ) | | | (0.05 | ) | | | 0.00 | | | | 0.00 | |
| | | | | | | | | | | | | | | | |
Total distributions to shareholders | | | (0.28 | ) | | | (0.05 | ) | | | (0.06 | ) | | | 0.00 | |
Net asset value, end of period | | $ | 10.73 | | | $ | 10.88 | | | $ | 9.51 | | | $ | 8.85 | |
Total return3 | | | 1.32 | % | | | 14.96 | % | | | 8.08 | % | | | (11.50 | )% |
Ratios to average net assets (annualized) | | | | | | | | | | | | | | | | |
Gross expenses | | | 3.84 | % | | | 3.89 | % | | | 5.93 | % | | | 16.14 | % |
Net expenses | | | 2.00 | % | | | 2.00 | % | | | 2.00 | % | | | 2.00 | % |
Net investment income (loss) | | | 0.33 | % | | | (0.25 | )% | | | (0.20 | )% | | | 0.41 | % |
Supplemental data | | | | | | | | | | | | | | | | |
Portfolio turnover rate | | | 13 | % | | | 30 | % | | | 37 | % | | | 12 | % |
Net assets, end of period (000’s omitted) | | | $229 | | | | $239 | | | | $272 | | | | $132 | |
| 1. | For the period from September 30, 2008 (commencement of class operations) to July 31, 2009. |
| 2. | Amount is less than $0.005. |
| 3. | Total return calculations do not include any sales charges. Returns for periods of less than one year are not annualized. |
The accompanying notes are an integral part of these financial statements.
| | | | |
| 16 | | Wells Fargo Advantage Social Sustainability Fund | | Financial Highlights |
(For a share outstanding throughout each period)
| | | | | | | | | | | | | | | | |
| | | Six Months Ended
January 31, 2012
(Unaudited) | | | Year Ended July 31, | |
| Administrator Class | | | 2011 | | | 2010 | | | 20091 | |
Net asset value, beginning of period | | $ | 11.08 | | | $ | 9.65 | | | $ | 8.92 | | | $ | 10.00 | |
Net investment income | | | 0.07 | | | | 0.08 | | | | 0.06 | | | | 0.07 | |
Net realized and unrealized gains (losses) on investments | | | 0.11 | | | | 1.47 | | | | 0.76 | | | | (1.15 | ) |
| | | | | | | | | | | | | | | | |
Total from investment operations | | | 0.18 | | | | 1.55 | | | | 0.82 | | | | (1.08 | ) |
Distributions to shareholders from | | | | | | | | | | | | | | | | |
Net investment income | | | (0.11 | ) | | | (0.07 | ) | | | (0.09 | ) | | | 0.00 | |
Net realized gains | | | (0.28 | ) | | | (0.05 | ) | | | 0.00 | | | | 0.00 | |
| | | | | | | | | | | | | | | | |
Total distributions to shareholders | | | (0.39 | ) | | | (0.12 | ) | | | (0.09 | ) | | | 0.00 | |
Net asset value, end of period | | $ | 10.87 | | | $ | 11.08 | | | $ | 9.65 | | | $ | 8.92 | |
Total return2 | | | 1.84 | % | | | 16.07 | % | | | 9.19 | % | | | (10.80 | )% |
Ratios to average net assets (annualized) | | | | | | | | | | | | | | | | |
Gross expenses | | | 2.94 | % | | | 2.89 | % | | | 4.92 | % | | | 14.12 | % |
Net expenses | | | 1.00 | % | | | 1.00 | % | | | 1.00 | % | | | 1.00 | % |
Net investment income | | | 1.32 | % | | | 0.77 | % | | | 0.80 | % | | | 1.43 | % |
Supplemental data | | | | | | | | | | | | | | | | |
Portfolio turnover rate | | | 13 | % | | | 30 | % | | | 37 | % | | | 12 | % |
Net assets, end of period (000’s omitted) | | | $5,872 | | | | $5,783 | | | | $4,363 | | | | $1,740 | |
| 1. | For the period from September 30, 2008 (commencement of class operations) to July 31, 2009. |
| 2. | Returns for periods of less than one year are not annualized. |
The accompanying notes are an integral part of these financial statements.
| | | | | | |
| Notes to Financial Statements (Unaudited) | | Wells Fargo Advantage Social Sustainability Fund | | | 17 | |
1. ORGANIZATION
Wells Fargo Funds Trust (the “Trust”), a Delaware statutory trust organized on March 10, 1999, is an open-end management investment company registered under the Investment Company Act of 1940, as amended (the “1940 Act”). These financial statements report on Wells Fargo Advantage Social Sustainability Fund (the “Fund”) which is a diversified series of the Trust.
2. SIGNIFICANT ACCOUNTING POLICIES
The following significant accounting policies, which are consistently followed in the preparation of the financial statements of the Fund, are in conformity with U.S. generally accepted accounting principles which require management to make estimates and assumptions that affect the reported amounts of assets and liabilities, disclosure of contingent assets and liabilities at the date of the financial statements, and the reported amounts of revenues and expenses during the reporting period. Actual results could differ from those estimates.
Securities valuation
Investments in equity securities are valued each business day as of the close of regular trading on the New York Stock Exchange, which is usually 4:00 p.m. (Eastern Time). Securities which are traded on a national or foreign securities exchange are valued at the last reported sales price, except that securities listed on The Nasdaq Stock Market, Inc. (“Nasdaq”) are valued at the Nasdaq Official Closing Price (“NOCP”), and if no NOCP is available, then at the last reported sales price. If no sales price is shown on the Nasdaq, the bid price will be used. In the absence of any sale of securities listed on the Nasdaq, and in the case of other securities (including U.S. Government obligations, but excluding debt securities maturing in 60 days or less), the price will be deemed “stale” and the valuations will be determined in accordance with the Fund’s Fair Value Procedures.
Investments in open-end mutual funds and non-registered investment companies are generally valued at net asset value.
Investments which are not valued using any of the methods discussed above, are valued at their fair value, as determined by procedures established in good faith and approved by the Board of Trustees.
Security transactions and income recognition
Securities transactions are recorded on a trade date basis. Realized gains or losses are reported on the basis of identified cost of securities delivered.
Dividend income is recognized on the ex-dividend date. Dividend income is recorded net of foreign taxes withheld where recovery of such taxes is not assured.
Distributions to shareholders
Distributions to shareholders from net investment income and net realized gains, if any, are recorded on the ex-dividend date. Such distributions are determined in conformity with income tax regulations, which may differ from generally accepted accounting principles.
Federal and other taxes
The Fund intends to continue to qualify as a regulated investment company by distributing substantially all of its investment company taxable income and any net realized capital gains (after reduction for capital loss carryforwards) sufficient to relieve it from all, or substantially all, federal income taxes. Accordingly, no provision for federal income taxes was required.
The Fund’s income and federal excise tax returns and all financial records supporting those returns for the prior three fiscal years are subject to examination by the federal and Delaware revenue authorities.
Under the recently enacted Regulated Investment Company Modernization Act of 2010, the Fund is permitted to carry forward capital losses incurred in taxable years which began after December 22, 2010 for an unlimited period. However, any losses incurred are required to be utilized prior to the losses incurred in pre-enactment taxable years. As a result of this ordering rule, pre-enactment capital loss carryforwards may be more likely to expire unused. Additionally, post-enactment capital losses that are carried forward will retain their character as either short-term or long-term capital losses rather than being considered all short-term as under previous law.
| | | | |
| 18 | | Wells Fargo Advantage Social Sustainability Fund | | Notes to Financial Statements (Unaudited) |
Class allocations
The separate classes of shares offered by the Fund differ principally in applicable sales charges, distribution, shareholder servicing and administration fees. Shareholders of each class bear certain expenses that pertain to that particular class. All shareholders bear the common expenses of the Fund, earn income from the portfolio, and are allocated unrealized gains and losses pro rata based on the average daily net assets of each class, without distinction between share classes. Dividends are determined separately for each class based on income and expenses allocable to each class. Realized gains and losses are allocated to each class pro rata based upon the net assets of each class on the date realized. Differences in per share dividend rates generally result from the relative weightings of pro rata income and realized gain allocations and from differences in separate class expenses, including distribution, shareholder servicing and administration fees.
3. FAIR VALUATION MEASUREMENTS
Fair value measurements of investments are determined within a framework that has established a fair value hierarchy based upon the various data inputs utilized in determining the value of the Fund’s investments. The three-level hierarchy gives the highest priority to unadjusted quoted prices in active markets for identical assets or liabilities (Level 1) and the lowest priority to significant unobservable inputs (Level 3). The Fund’s investments are classified within the fair value hierarchy based on the lowest level of input that is significant to the fair value measurement. The inputs are summarized into three broad levels as follows:
| n | | Level 1 – quoted prices in active markets for identical securities |
| n | | Level 2 – other significant observable inputs (including quoted prices for similar securities, interest rates, prepayment speeds, credit risk, etc.) |
| n | | Level 3 – significant unobservable inputs (including the Fund’s own assumptions in determining the fair value of investments) |
The inputs or methodologies used for valuing securities are not necessarily an indication of the risk associated with investing in those securities.
As of January 31, 2012, the inputs used in valuing the Fund’s assets, which are carried at fair value, were as follows:
| | | | | | | | | | | | | | | | |
| Investments in Securities | | Quoted Prices (Level 1) | | | Significant Other
Observable Inputs (Level 2) | | | Significant Unobservable Inputs (Level 3) | | | Total | |
| | | | |
Equity securities | | | | | | | | | | | | | | | | |
Common stocks | | $ | 7,601,874 | | | $ | 0 | | | $ | 0 | | | $ | 7,601,874 | |
| | | | |
Short-term investments | | | | | | | | | | | | | | | | |
Investment companies | | | 57,193 | | | | 0 | | | | 0 | | | | 57,193 | |
| | | $ | 7,659,067 | | | $ | 0 | | | $ | 0 | | | $ | 7,659,067 | |
Further details on the major security types listed above can be found in the Portfolio of Investments.
Transfers in and transfers out are recognized at the end of the reporting period. For the six months ended January 31, 2012, the Fund did not have any significant transfers into/out of Level 1 and Level 2.
4. TRANSACTIONS WITH AFFILIATES AND OTHER EXPENSES
Advisory fee
The Trust has entered into an advisory contract with Wells Fargo Funds Management, LLC (“Funds Management”), an indirect wholly owned subsidiary of Wells Fargo & Company (“Wells Fargo”). The adviser is responsible for implementing investment policies and guidelines and for supervising the sub-adviser, who is responsible for day-to-day portfolio management of the Fund.
Pursuant to the contract, Funds Management is entitled to receive an annual advisory fee starting at 0.65% and declining to 0.55% as the average daily net assets of the Fund increase. For the six months ended January 31, 2012, the advisory fee was equivalent to an annual rate of 0.65% of the Fund’s average daily net assets.
| | | | | | |
| Notes to Financial Statements (Unaudited) | | Wells Fargo Advantage Social Sustainability Fund | | | 19 | |
Funds Management may retain the services of certain sub-advisers to provide daily portfolio management to the Fund. The fees related to sub-advisory services are borne directly by Funds Management and do not increase the overall fees paid by the Fund. Nelson Capital Management, LLC, an affiliate of Funds Management, is the sub-adviser to the Fund and is entitled to receive a fee from Funds Management at an annual rate starting at 0.45% and declining to 0.25% as the average daily net assets of the Fund increase.
Administration and transfer agent fees
The Trust has entered into an administration agreement with Funds Management. Under this agreement, for providing administrative services, which includes paying fees and expenses for services provided by the transfer agent, sub-transfer agents, omnibus account servicers and record-keepers, Funds Management is entitled to receive from the Fund an annual fund level administration fee starting at 0.05% and declining to 0.03% as the average daily net assets of the Fund increase and a class level administration fee which is calculated based on the average daily net assets of each class as follows:
| | | | |
| | | Class Level Administration Fee | |
Class A, Class C | | | 0.26 | % |
Administrator Class | | | 0.10 | |
Funds Management has contractually waived and/or reimbursed advisory and administration fees to the extent necessary to maintain certain net operating expense ratios for the Fund. Waiver of fees and/or reimbursement of expenses by Funds Management were made first from fund level expenses on a proportionate basis and then from class specific expenses. Funds Management has committed through November 30, 2012 to waive fees and/or reimburse expenses to the extent necessary to cap the Fund’s expenses at 1.25% for Class A, 2.00% for Class C and 1.00% for Administrator Class.
Distribution fees
The Trust has adopted a Distribution Plan for Class C shares of the Fund pursuant to Rule 12b-1 under the 1940 Act. Distribution fees are charged to Class C shares and paid to Wells Fargo Funds Distributor, LLC, the principal underwriter, at an annual rate of 0.75% of its average daily net assets.
For the six months ended January 31, 2012, Wells Fargo Funds Distributor, LLC received $117 from the sale of Class A shares.
Shareholder servicing fees
The Trust has entered into contracts with one or more shareholder servicing agents, whereby Class A, Class C and Administrator Class of the Fund is charged a fee at an annual rate of 0.25% of the average daily net assets of each respective class.
A portion of these total shareholder servicing fees were paid to affiliates of Wells Fargo.
5. INVESTMENT PORTFOLIO TRANSACTIONS
Purchases and sales of investments, excluding U.S. Government obligations (if any) and short-term securities (securities with maturities of one year or less at purchase date), for the six months ended January 31, 2012 were $965,562 and $915,306, respectively.
6. BANK BORROWINGS
The Trust (excluding the money market funds) and Wells Fargo Variable Trust are parties to a $150,000,000 revolving credit agreement with State Street Bank and Trust Company, whereby the Fund is permitted to use bank borrowings for temporary or emergency purposes, such as to fund shareholder redemption requests. Interest under the credit agreement is charged to the Fund based on a borrowing rate equal to the higher of the Federal Funds rate in effect on that day plus 1.25% or the overnight LIBOR rate in effect on that day plus 1.25%. In addition, an annual commitment fee equal to 0.10% of the unused balance is allocated to each participating fund. Prior to September 6, 2011, the revolving credit agreement was for $125,000,000 and the annual commitment fee paid by the Fund was 0.125% of the unused balance. For the six months ended January 31, 2012, the Fund paid $4 in commitment fees.
For the six month ended January 31, 2012, there were no borrowings by the Fund under the agreement.
| | | | |
| 20 | | Wells Fargo Advantage Social Sustainability Fund | | Notes to Financial Statements (Unaudited) |
7. INDEMNIFICATION
Under the Trust’s organizational documents, the officers and directors are indemnified against certain liabilities that may arise out of performance of their duties to the Trust. Additionally, in the normal course of business, the Trust may enter into contracts with service providers that contain a variety of indemnification clauses. The Trust’s maximum exposure under these arrangements is dependent on future claims that may be made against the Fund and, therefore, cannot be estimated.
8. NEW ACCOUNTING PRONOUNCEMENTS
In May 2011, the Financial Accounting Standards Board (“FASB”) issued Accounting Standards Update (“ASU”) No. 2011-04 “Amendments to Achieve Common Fair Value Measurement and Disclosure Requirements in U.S. GAAP and IFRSs”. ASU No. 2011-04 amends FASB ASC Topic 820, Fair Value Measurements and Disclosures, to establish common requirements for measuring fair value and for disclosing information about fair value measurements in accordance with GAAP. The ASU is effective prospectively for interim and annual periods beginning after December 15, 2011. Management expects that adoption of the ASU will result in additional disclosures in the financial statements, as applicable.
In April 2011, FASB issued ASU No. 2011-03 “Reconsideration of Effective Control for Repurchase Agreements”. ASU No. 2011-03 amends FASB ASC Topic 860, Transfers and Servicing, specifically the criteria required to determine whether a repurchase agreement (repo) and similar agreements should be accounted for as sales of financial assets or secured borrowings with commitments. ASU No. 2011-03 changes the assessment of effective control by focusing on the transferor’s contractual rights and obligations and removing the criterion to assess its ability to exercise those rights or honor those obligations. This could result in changes to the way entities account for certain transactions including repurchase agreements, mortgage dollar rolls and reverse repurchase agreements. The ASU will become effective on a prospective basis for new transfers and modifications to existing transactions as of the beginning of the first interim or annual period beginning on or after December 15, 2011. Management has evaluated the impact of adopting the ASU and expects no significant changes.
9. SUBSEQUENT DISTRIBUTIONS
On March 26, 2012, the Fund declared distributions from net investment income, short-term capital gains and long-term capital gains to shareholders of record on March 23, 2012. The per share amounts payable on March 27, 2012 were as follows:
| | | | | | | | | | | | |
| | | Net Investment
Income | | | Short-term
Capital Gains | | | Long-term
Capital Gains | |
Class A | | $ | 0.02808 | | | $ | 0.42626 | | | $ | 2.23181 | |
Class C | | | 0.00000 | | | | 0.42626 | | | | 2.23181 | |
Administrator Class | | | 0.04207 | | | | 0.42626 | | | | 2.23181 | |
These distributions are not reflected in the accompanying financial statements.
10. SUBSEQUENT EVENT
At a regular meeting held February 7-8, 2012, the Fund’s Board of Trustees approved the liquidation of the Fund which took place on March 28, 2012.
| | | | | | |
| Other Information (Unaudited) | | Wells Fargo Advantage Social Sustainability Fund | | | 21 | |
PROXY VOTING INFORMATION
A description of the policies and procedures that the Fund uses to determine how to vote proxies relating to portfolio securities is available without charge, upon request, by calling 1-800-222-8222, visiting our Web site at wellsfargoadvantagefunds.com, or visiting the SEC Web site at sec.gov. Information regarding how the Fund voted proxies relating to portfolio securities during the most recent 12-month period ended June 30 is available without charge on the Fund’s Web site at wellsfargoadvantagefunds.com or by visiting the SEC Web site at sec.gov.
PORTFOLIO HOLDINGS INFORMATION
The complete portfolio holdings for the Fund are publicly available on the Fund’s Web site (wellsfargoadvantagefunds.com) on a monthly, 30-day or more delayed basis. In addition, top ten holdings information for the Fund is publicly available on the Fund’s Web site on a monthly, seven-day or more delayed basis. The Fund files its complete schedule of portfolio holdings with the SEC for the first and third quarters of each fiscal year on Form N-Q, which is available without charge by visiting the SEC Web site at sec.gov. In addition, the Fund’s Form N-Q may be reviewed and copied at the SEC’s Public Reference Room in Washington, DC, and at regional offices in New York City, at 233 Broadway, and in Chicago, at 175 West Jackson Boulevard, Suite 900. Information about the Public Reference Room may be obtained by calling 1-800-SEC-0330.
| | | | |
| 22 | | Wells Fargo Advantage Social Sustainability Fund | | Other Information (Unaudited) |
BOARD OF TRUSTEES
The following table provides basic information about the Board of Trustees (the “Trustees”) of the Trust and Officers of the Trust. This table should be read in conjunction with the Prospectus and the Statement of Additional Information1 of the Fund. Each of the Trustees and Officers listed below acts in identical capacities for the Wells Fargo Advantage family of funds, which consists of 137 funds comprising the Wells Fargo Funds Trust, Wells Fargo Variable Trust, Wells Fargo Master Trust and four closed-end funds (collectively the “Fund Complex”). All of the Trustees are also Members of the Audit and Governance Committees of each Trust in the Fund Complex. The mailing address of each Trustee and Officer is 525 Market Street, 12th Floor, San Francisco, CA 94105. Each Trustee and Officer serves an indefinite term, however, each Trustee serves such term until reaching the mandatory retirement age established by the Trustees.
Independent Trustees
| | | | | | |
Name and Year of Birth | | Position Held and Length of Service | | Principal Occupations During Past Five Years | | Other Directorships During
Past Five Years |
Peter G. Gordon
(Born 1942) | | Trustee, since 1998; Chairman, since 2005 (Lead Trustee since 2001) | | Co-Founder, Retired Chairman, President and CEO of Crystal Geyser Water Company. Trustee Emeritus, Colby College | | Asset Allocation Trust |
Isaiah Harris, Jr.
(Born 1952) | | Trustee, since 2009 | | Retired. Prior thereto, President and CEO of BellSouth Advertising and Publishing Corp. from 2005 to 2007, President and CEO of BellSouth Enterprises from 2004 to 2005 and President of BellSouth Consumer Services from 2000 to 2003. Emeritus member of the Iowa State University Foundation Board of Governors. Emeritus Member of the Advisory Board of Iowa State University School of Business. Mr. Harris is a certified public accountant. | | CIGNA Corporation; Deluxe Corporation; Asset Allocation Trust |
Judith M. Johnson
(Born 1949) | | Trustee, since 2008 | | Retired. Prior thereto, Chief Executive Officer and Chief Investment Officer of Minneapolis Employees Retirement Fund from 1996 to 2008. Ms. Johnson is an attorney, certified public accountant and a certified managerial accountant. | | Asset Allocation Trust |
Leroy Keith, Jr.
(Born 1939) | | Trustee, since 2010 | | Chairman, Bloc Global Services (development and construction). Trustee of the Evergreen Funds from 1983 to 2010. Former Managing Director, Almanac Capital Management (commodities firm), former Partner, Stonington Partners, Inc. (private equity fund), former Director, Obagi Medical Products Co. and former Director, Lincoln Educational Services. | | Trustee, Virtus Fund Complex (consisting of 40 portfolios as of 12/31/11); Asset Allocation Trust |
David F. Larcker
(Born 1950) | | Trustee, since 2009 | | James Irvin Miller Professor of Accounting at the Graduate School of Business, Stanford University, Director of Corporate Governance Research Program and Senior Faculty of The Rock Center for Corporate Governance since 2006. From 2005 to 2008, Professor of Accounting at the Graduate School of Business, Stanford University. Prior thereto, Ernst & Young Professor of Accounting at The Wharton School, University of Pennsylvania from 1985 to 2005. | | Asset Allocation Trust |
Olivia S. Mitchell
(Born 1953) | | Trustee, since 2006 | | International Foundation of Employee Benefit Plans Professor, Wharton School of the University of Pennsylvania since 1993. Director of Wharton’s Pension Research Council and Boettner Center on Pensions & Retirement Research, and Research Associate at the National Bureau of Economic Research. Previously, Cornell University Professor from 1978 to 1993. | | Asset Allocation Trust |
| | | | | | |
| Other Information (Unaudited) | | Wells Fargo Advantage Social Sustainability Fund | | | 23 | |
| | | | | | |
Name and Year of Birth | | Position Held and Length of Service | | Principal Occupations During Past Five Years | | Other Directorships During
Past Five Years |
Timothy J. Penny
(Born 1951) | | Trustee, since 1996 | | President and CEO of Southern Minnesota Initiative Foundation, a non-profit organization, since 2007 and Senior Fellow at the Humphrey Institute Policy Forum at the University of Minnesota since 1995. Member of the Board of Trustees of NorthStar Education Finance, Inc., a non-profit organization, since 2007. | | Asset Allocation Trust |
Michael S. Scofield
(Born 1943) | | Trustee, since 2010 | | Served on the Investment Company Institute’s Board of Governors and Executive Committee from 2008-2011 as well the Governing Council of the Independent Directors Council from 2006-2011 and the Independent Directors Council Executive Committee from 2008-2011. Chairman of the IDC from 2008-2010. Institutional Investor (Fund Directions) Trustee of Year in 2007. Trustee of the Evergreen Funds (and its predecessors) from 1984 to 2010. Chairman of the Evergreen Funds from 2000-2010. Former Trustee of the Mentor Funds. Retired Attorney, Law Offices of Michael S. Scofield and former Director and Chairman, Branded Media Corporation (multi-media branding company). | | Asset Allocation Trust |
Donald C. Willeke
(Born 1940) | | Trustee, since 1996 | | Principal of the law firm of Willeke & Daniels. General Counsel of the Minneapolis Employees Retirement Fund from 1984 until its consolidation into the Minnesota Public Employees Retirement Association on June 30, 2010. Director and Vice Chair of The Free Trust (non-profit corporation). Director of the American Chestnut Foundation (non-profit corporation). | | Asset Allocation Trust |
Officers
| | | | | | |
Name and Year of Birth | | Position Held and
Length of Service | | Principal Occupations During Past Five Years | | |
Karla M. Rabusch
(Born 1959) | | President, since 2003 | | Executive Vice President of Wells Fargo Bank, N.A. and President of Wells Fargo Funds Management, LLC since 2003. Senior Vice President and Chief Administrative Officer of Wells Fargo Funds Management, LLC from 2001 to 2003. | | |
C. David Messman
(Born 1960) | | Secretary, since 2000; Chief Legal Counsel, since 2003 | | Senior Vice President and Secretary of Wells Fargo Funds Management, LLC since 2001. Vice President and Managing Senior Counsel of Wells Fargo Bank, N.A. since 1996. | | |
Kasey Phillips
(Born 1970) | | Treasurer, since 2009 | | Senior Vice President of Wells Fargo Funds Management, LLC since 2009. Senior Vice President of Evergreen Investment Management Company, LLC from 2006 to 2010. Treasurer of the Evergreen Funds from 2005 to 2010. | | |
David Berardi
(Born 1975) | | Assistant Treasurer, since 2009 | | Vice President of Wells Fargo Funds Management, LLC since 2009. Vice President of Evergreen Investment Management Company, LLC from 2008 to 2010. Assistant Vice President of Evergreen Investment Services, Inc. from 2004 to 2008. Manager of Fund Reporting and Control for Evergreen Investment Management Company, LLC from 2004 to 2010. | | |
Jeremy DePalma
(Born 1974) | | Assistant Treasurer, since 2009 | | Senior Vice President of Wells Fargo Funds Management, LLC since 2009. Senior Vice President of Evergreen Investment Management Company, LLC from 2008 to 2010. Vice President, Evergreen Investment Services, Inc. from 2004 to 2007. Head of the Fund Reporting and Control Team within Fund Administration from 2005 to 2010. | | |
Debra Ann Early
(Born 1964) | | Chief Compliance Officer, since 2007 | | Chief Compliance Officer of Wells Fargo Funds Management, LLC since 2007. Chief Compliance Officer of Parnassus Investments from 2005 to 2007. Chief Financial Officer of Parnassus Investments from 2004 to 2007 and Senior Audit Manager of PricewaterhouseCoopers LLP from 1998 to 2004. | | |
| 1. | The Statement of Additional Information includes additional information about the Trustees and is available, without charge, upon request, by calling 1-800-222-8222 or by visiting the Web site at wellsfargoadvantagefunds.com. |
| | | | |
| 24 | | Wells Fargo Advantage Social Sustainability Fund | | List of Abbreviations |
The following is a list of common abbreviations for terms and entities which may have appeared in this report.
| ACB | — Agricultural Credit Bank |
| ADR | — American Depository Receipt |
| ADS | — American Depository Shares |
| AGC-ICC | — Assured Guaranty Corporation - Insured Custody Certificates |
| AGM | — Assured Guaranty Municipal |
| AMBAC | — American Municipal Bond Assurance Corporation |
| AMT | — Alternative Minimum Tax |
| BAN | — Bond Anticipation Notes |
| BHAC | — Berkshire Hathaway Assurance Corporation |
| CAB | — Capital Appreciation Bond |
| CCAB | — Convertible Capital Appreciation Bond |
| CDA | — Community Development Authority |
| CDO | — Collateralized Debt Obligation |
| COP | — Certificate of Participation |
| DRIVER | — Derivative Inverse Tax-Exempt Receipts |
| DW&P | — Department of Water & Power |
| DWR | — Department of Water Resources |
| ECFA | — Educational & Cultural Facilities Authority |
| EDA | — Economic Development Authority |
| EDFA | — Economic Development Finance Authority |
| ETF | — Exchange-Traded Fund |
| FFCB | — Federal Farm Credit Bank |
| FGIC | — Financial Guaranty Insurance Corporation |
| FHA | — Federal Housing Authority |
| FHLB | — Federal Home Loan Bank |
| FHLMC | — Federal Home Loan Mortgage Corporation |
| FNMA | — Federal National Mortgage Association |
| GDR | — Global Depository Receipt |
| GNMA | — Government National Mortgage Association |
| HCFR | — Healthcare Facilities Revenue |
| HEFA | — Health & Educational Facilities Authority |
| HEFAR | — Higher Education Facilities Authority Revenue |
| HFA | — Housing Finance Authority |
| HFFA | — Health Facilities Financing Authority |
| IBC | — Insured Bond Certificate |
| IDA | — Industrial Development Authority |
| IDAG | — Industrial Development Agency |
| IDR | — Industrial Development Revenue |
| KRW | — Republic of Korea Won |
| LIBOR | — London Interbank Offered Rate |
| LLC | — Limited Liability Company |
| LLP | — Limited Liability Partnership |
| MBIA | — Municipal Bond Insurance Association |
| MFHR | — Multi-Family Housing Revenue |
| MSTR | — Municipal Securities Trust Receipts |
| MUD | — Municipal Utility District |
| NATL-RE | — National Public Finance Guarantee Corporation |
| PCFA | — Pollution Control Finance Authority |
| PCR | — Pollution Control Revenue |
| PFA | — Public Finance Authority |
| PFFA | — Public Facilities Financing Authority |
| PFOTER | — Puttable Floating Option Tax-Exempt Receipts |
| plc | — Public Limited Company |
| PUTTER | — Puttable Tax-Exempt Receipts |
| R&D | — Research & Development |
| RDA | — Redevelopment Authority |
| RDFA | — Redevelopment Finance Authority |
| REIT | — Real Estate Investment Trust |
| ROC | — Reset Option Certificates |
| SAVRS | — Select Auction Variable Rate Securities |
| SBA | — Small Business Authority |
| SFHR | — Single Family Housing Revenue |
| SFMR | — Single Family Mortgage Revenue |
| SPDR | — Standard & Poor’s Depositary Receipts |
| TAN | — Tax Anticipation Notes |
| TIPS | — Treasury Inflation-Protected Securities |
| TRAN | — Tax Revenue Anticipation Notes |
| TCR | — Transferable Custody Receipts |
| TTFA | — Transportation Trust Fund Authority |
| TVA | — Tennessee Valley Authority |
| XLCA | — XL Capital Assurance |
This page is intentionally left blank.
This page is intentionally left blank.


FOR MORE INFORMATION
More information about Wells Fargo Advantage Funds is available free upon request. To obtain literature, please write, e-mail, visit the Fund’s Web site, or call:
Wells Fargo Advantage Funds
P.O. Box 8266
Boston, MA 02266-8266
E-mail: wfaf@wellsfargo.com
Web site: wellsfargoadvantagefunds.com
Individual investors: 1-800-222-8222
Retail investment professionals: 1-888-877-9275
Institutional investment professionals: 1-866-765-0778
This report and the financial statements contained herein are submitted for the general information of the shareholders of Wells Fargo Advantage Funds. If this report is used for promotional purposes, distribution of the report must be accompanied or preceded by a current prospectus. For a prospectus containing more complete information, including charges and expenses, call 1-800-222-8222 or visit the Fund’s Web site at wellsfargoadvantagefunds.com. Please consider the investment objectives, risks, charges, and expenses of the investment carefully before investing. This and other information about Wells Fargo Advantage Funds can be found in the current prospectus. Read the prospectus carefully before you invest or send money.
Wells Fargo Funds Management, LLC, a wholly owned subsidiary of Wells Fargo & Company, provides investment advisory and administrative services for Wells Fargo Advantage Funds. Other affiliates of Wells Fargo & Company provide subadvisory and other services for the Funds. The Funds are distributed by Wells Fargo Funds Distributor, LLC, Member FINRA/SIPC, an affiliate of Wells Fargo & Company.
NOT FDIC INSURED ¡ NO BANK GUARANTEE ¡ MAY LOSE VALUE
© 2012 Wells Fargo Funds Management, LLC. All rights reserved.
| | |
 | | 207954 03-12 SA214/SAR214 1-12 |

Wells Fargo Advantage
Strategic Large Cap Growth Fund

Semi-Annual Report
January 31, 2012

Reduce clutter. Save trees.
Sign up for electronic delivery of prospectuses and shareholder reports at wellsfargo.com/advantagedelivery
Contents
The views expressed and any forward-looking statements are as of January 31, 2012, unless otherwise noted, and are those of the Fund managers and/or Wells Fargo Funds Management, LLC. Discussions of individual securities, or the markets generally, or any Wells Fargo Advantage Fund are not intended as individual recommendations. Future events or results may vary significantly from those expressed in any forward-looking statements; the views expressed are subject to change at any time in response to changing circumstances in the market. Wells Fargo Funds Management, LLC, disclaims any obligation to publicly update or revise any views expressed or forward-looking statements.
NOT FDIC INSURED ¡ NO BANK GUARANTEE ¡ MAY LOSE VALUE

WELLS FARGO INVESTMENT HISTORY
| | |
| |
| 1932 | | Keystone creates one of the first mutual fund families. |
| |
| 1971 | | Wells Fargo & Company introduces one of the first institutional index funds. |
| |
| 1978 | | Wells Fargo applies Markowitz and Sharpe’s research on Modern Portfolio Theory to introduce one of the industry’s first Tactical Asset Allocation (TAA) models in institutional separately managed accounts. |
| |
| 1984 | | Wells Fargo Stagecoach Funds launches its first asset allocation fund. |
| |
| 1989 | | The Tactical Asset Allocation (TAA) Model is first applied to Wells Fargo’s asset allocation mutual funds. |
| |
| 1994 | | Wells Fargo introduces the LifePath Funds, one of the first suites of target date funds (now the Wells Fargo Advantage Dow Jones Target Date FundsSM). |
| |
| 1996 | | Evergreen Investments and Keystone Funds merge. |
| |
| 1997 | | Wells Fargo launches Wells Fargo Advantage WealthBuilder PortfoliosSM, a fund-of-funds suite of products that includes the use of quantitative models to shift assets among investment styles. |
| |
| 1999 | | Norwest Advantage Funds and Stagecoach Funds are reorganized into Wells Fargo Funds after the merger of Norwest and Wells Fargo. |
| |
| 2002 | | Evergreen Retail and Evergreen Institutional companies form the umbrella asset management company, Evergreen Investments. |
| |
| 2005 | | The integration of Strong Funds with Wells Fargo Funds creates Wells Fargo Advantage Funds, resulting in one of the top 20 mutual fund companies in the United States. |
| |
| 2006 | | Wells Fargo Advantage Funds relaunches the target date product line as Wells Fargo Advantage Dow Jones Target Date Funds. |
| |
| 2010 | | The mergers and reorganizations of Evergreen and Wells Fargo Advantage mutual funds are completed, unifying the families under the brand of Wells Fargo Advantage Funds. |
Wells Fargo Advantage Funds®
Wells Fargo Advantage Funds skillfully guides institutions, financial advisors, and individuals through the investment terrain to help them reach their financial objectives. Everything we do on behalf of investors is backed by our unique combination of qualifications.
Strength
Our organization is built on the standards of integrity and service established by our parent company—Wells Fargo & Company—more than 150 years ago. And, because we’re part of a highly diversified financial enterprise, we offer the depth of resources to help investors succeed.
Expertise
Our multi-boutique model offers investors access to the independent thinking of premier investment managers that have been chosen for their time-tested strategies. While each team specializes in a specific investment strategy, collectively they provide investors a wide choice of distinct investment styles. Our dedication to investment excellence doesn’t end with our expertise in manager selection—risk management, analysis, and rigorous ongoing review seek to ensure each manager’s investment process remains consistent.
Partnership
Our collaborative approach is built around understanding the needs and goals of our clients. By adhering to core principles of sound judgment and steady guidance, we support you through every stage of the investment decision process.
Carefully consider a fund’s investment objectives, risks, charges, and expenses before investing. For a current prospectus and, if available, a summary prospectus, containing this and other information, visit wellsfargoadvantagefunds.com. Read it carefully before investing.
Wells Fargo Funds Management, LLC, a wholly owned subsidiary of Wells Fargo & Company, provides investment advisory and administrative services for Wells Fargo Advantage Funds®. Other affiliates of Wells Fargo & Company provide subadvisory and other services for the Funds. The Funds are distributed by Wells Fargo Funds Distributor, LLC, Member FINRA/SIPC, an affiliate of Wells Fargo & Company.
“Dow Jones®” and “Dow Jones Target Date IndexesSM” are service marks of Dow Jones Trademark Holdings, LLC (“Dow Jones”), have been licensed to CME Group Index Services LLC (“CME Indexes”) and have been sublicensed for use for certain purposes by Global Index Advisors, Inc, and Wells Fargo Funds Management, LLC. The Wells Fargo Advantage Dow Jones Target Date FundsSM based on the Dow Jones Target Date IndexesSM, are not sponsored, endorsed, sold or promoted by Dow Jones, CME Indexes or their respective affiliates and none of them makes any representation regarding the advisability of investing in such product(s).
NOT FDIC INSURED ¡ NO BANK GUARANTEE ¡ MAY LOSE VALUE
Not part of the semi-annual report.
Wells Fargo Advantage Funds offers more than 110 mutual funds across a wide range of asset classes, representing over $217 billion in assets under management, as of January 31, 2012.
| | | | |
| Equity Funds | | | | |
Asia Pacific Fund | | Equity Value Fund | | Precious Metals Fund |
C&B Large Cap Value Fund | | Global Opportunities Fund | | Premier Large Company Growth Fund |
C&B Mid Cap Value Fund | | Growth Fund | | Small Cap Opportunities Fund |
Capital Growth Fund | | Index Fund | | Small Cap Value Fund |
Common Stock Fund | | International Equity Fund | | Small Company Growth Fund |
Disciplined U.S. Core Fund | | International Value Fund | | Small Company Value Fund |
Discovery Fund† | | Intrinsic Small Cap Value Fund | | Small/Mid Cap Core Fund |
Diversified Equity Fund | | Intrinsic Value Fund | | Small/Mid Cap Value Fund |
Diversified International Fund | | Intrinsic World Equity Fund | | Special Mid Cap Value Fund |
Diversified Small Cap Fund | | Large Cap Core Fund | | Special Small Cap Value Fund |
Emerging Growth Fund | | Large Cap Growth Fund | | Specialized Technology Fund |
Emerging Markets Equity Fund | | Large Company Value Fund | | Strategic Large Cap Growth Fund |
Endeavor Select Fund† | | Omega Growth Fund | | Traditional Small Cap Growth Fund |
Enterprise Fund† | | Opportunity Fund† | | Utility and Telecommunications Fund |
| Bond Funds | | | | |
Adjustable Rate Government Fund | | Inflation-Protected Bond Fund | | Short-Term Bond Fund |
California Limited-Term Tax-Free Fund | | Intermediate Tax/AMT-Free Fund | | Short-Term High Yield Bond Fund |
California Tax-Free Fund | | International Bond Fund | | Short-Term Municipal Bond Fund |
Colorado Tax-Free Fund | | Minnesota Tax-Free Fund | | Strategic Municipal Bond Fund |
Government Securities Fund | | Municipal Bond Fund | | Total Return Bond Fund |
High Income Fund | | North Carolina Tax-Free Fund | | Ultra Short-Term Income Fund |
High Yield Bond Fund | | Pennsylvania Tax-Free Fund | | Ultra Short-Term Municipal Income Fund |
Income Plus Fund | | Short Duration Government Bond Fund | | Wisconsin Tax-Free Fund |
| Asset Allocation Funds | | | | |
Absolute Return Fund | | WealthBuilder Equity Portfolio† | | Target 2020 Fund† |
Asset Allocation Fund | | WealthBuilder Growth Allocation Portfolio† | | Target 2025 Fund† |
Conservative Allocation Fund | | WealthBuilder Growth Balanced Portfolio† | | Target 2030 Fund† |
Diversified Capital Builder Fund | | WealthBuilder Moderate Balanced Portfolio† | | Target 2035 Fund† |
Diversified Income Builder Fund | | WealthBuilder Tactical Equity Portfolio† | | Target 2040 Fund† |
Growth Balanced Fund | | Target Today Fund† | | Target 2045 Fund† |
Index Asset Allocation Fund | | Target 2010 Fund† | | Target 2050 Fund† |
Moderate Balanced Fund | | Target 2015 Fund† | | Target 2055 Fund† |
WealthBuilder Conservative Allocation Portfolio† | | | | |
| Money Market Funds | | | | |
100% Treasury Money Market Fund | | Heritage Money Market Fund† | | National Tax-Free Money Market Fund |
California Municipal Money Market Fund | | Money Market Fund | | Prime Investment Money Market Fund |
Cash Investment Money Market Fund | | Municipal Cash Management Money Market Fund | | Treasury Plus Money Market Fund |
Government Money Market Fund | | Municipal Money Market Fund | | |
| Variable Trust Funds1 | | | | |
VT Discovery Fund† | | VT Intrinsic Value Fund | | VT Small Cap Growth Fund |
VT Index Asset Allocation Fund | | VT Omega Growth Fund | | VT Small Cap Value Fund |
VT International Equity Fund | | VT Opportunity Fund† | | VT Total Return Bond Fund |
An investment in a money market fund is not insured or guaranteed by the Federal Deposit Insurance Corporation or any other government agency. Although the Wells Fargo Advantage Money Market Funds seek to preserve the value of your investment at $1.00 per share, it is possible to lose money by investing in a money market fund.
| 1. | The Variable Trust Funds are generally available only through insurance company variable contracts. |
| † | In this report, the Wells Fargo Advantage Discovery FundSM, Wells Fargo Advantage Endeavor Select FundSM, Wells Fargo Advantage Enterprise FundSM, Wells Fargo Advantage Opportunity FundSM, Wells Fargo Advantage WealthBuilder Conservative Allocation PortfolioSM, Wells Fargo Advantage WealthBuilder Equity PortfolioSM, Wells Fargo Advantage WealthBuilder Growth Allocation PortfolioSM, Wells Fargo Advantage WealthBuilder Growth Balanced PortfolioSM, Wells Fargo Advantage WealthBuilder Moderate Balanced PortfolioSM, Wells Fargo Advantage WealthBuilder Tactical Equity PortfolioSM, Wells Fargo Advantage Dow Jones Target Today FundSM, Wells Fargo Advantage Dow Jones Target 2010 FundSM, Wells Fargo Advantage Dow Jones Target 2015 FundSM, Wells Fargo Advantage Dow Jones Target 2020 FundSM, Wells Fargo Advantage Dow Jones Target 2025 FundSM, Wells Fargo Advantage Dow Jones Target 2030 FundSM, Wells Fargo Advantage Dow Jones Target 2035 FundSM, Wells Fargo Advantage Dow Jones Target 2040 FundSM, Wells Fargo Advantage Dow Jones Target 2045 FundSM, Wells Fargo Advantage Dow Jones Target 2050 FundSM, Wells Fargo Advantage Dow Jones Target 2055 FundSM, Wells Fargo Advantage Heritage Money Market FundSM, Wells Fargo Advantage VT Discovery FundSM, and Wells Fargo Advantage VT Opportunity FundSM are referred to as the Discovery Fund, Endeavor Select Fund, Enterprise Fund, Opportunity Fund, WealthBuilder Conservative Allocation Portfolio, WealthBuilder Equity Portfolio, WealthBuilder Growth Allocation Portfolio, WealthBuilder Growth Balanced Portfolio, WealthBuilder Moderate Balanced Portfolio, WealthBuilder Tactical Equity Portfolio, Target Today Fund, Target 2010 Fund, Target 2015 Fund, Target 2020 Fund, Target 2025 Fund, Target 2030 Fund, Target 2035 Fund, Target 2040 Fund, Target 2045 Fund, Target 2050 Fund, Target 2055 Fund, Heritage Money Market Fund, VT Discovery Fund, and VT Opportunity Fund, respectively. |
Not part of the semi-annual report.
| | | | |
| 2 | | Wells Fargo Advantage Strategic Large Cap Growth Fund | | Letter to Shareholders |

Karla M. Rabusch,
President
Wells Fargo Advantage Funds
The period was marked by increased confidence that the U.S. economy was staging a fragile recovery, offset by continued concerns about the possible effect on the global economy of the ongoing European sovereign debt crisis—which began in Greece and later spread to the larger economies of Italy and Spain.
The slow-motion debt crisis in the eurozone was a major headwind to both domestic and global stock market indexes.
Dear Valued Shareholder:
We’re pleased to offer you this semi-annual report for the Wells Fargo Advantage Strategic Large Cap Growth Fund for the six-month period that ended January 31, 2012. The period was marked by increased confidence that the U.S. economy was staging a fragile recovery, offset by continued concerns about the possible effect on the global economy of the ongoing European sovereign debt crisis—which began in Greece and later spread to the larger economies of Italy and Spain. Most U.S. stock indexes posted gains for the period, even if only modest ones.
Worries gave way to guarded optimism for the U.S. economy.
The period began with worries that the U.S. economy was returning to recession. Revised figures for gross domestic product (GDP) indicated that the U.S. economy grew by an annualized rate of only 0.8% in the first half of 2011. Moreover, although the July 2011 Institute for Supply Management (ISM) manufacturing survey suggested that factories continued to expand, the rate of expansion was lower than in previous months. The prolonged debate over whether and how to raise the U.S. debt ceiling—which only ended on July 31, 2011—also depressed market sentiment by highlighting the country’s political divisions.
The stock market remained volatile throughout September. By late October, however, stronger economic data led to greater optimism and higher stock prices. Revised real GDP growth came in at 1.8% in the third quarter of 2011 and 2.8% in the fourth quarter, suggesting that the recovery was on firmer footing. Economic growth was not evenly distributed, though, as December 2011 retail same-store sales generally showed stronger growth for retailers targeting affluent customers than for those targeting the broad middle class. The reported unemployment rate also showed some signs of improvement, falling from 9.1% in August 2011 to 8.3% in January 2012. However, this decline in the unemployment rate was accompanied by an increase in the number of Americans not in the labor force, raising concerns about the economy’s ability to generate jobs.
The eurozone had continued trouble.
The slow-motion debt crisis in the eurozone was a major headwind to both domestic and global stock market indexes. The worsening debt and deficit numbers for Greece in late 2011 and early 2012 cast doubt on the country’s ability to service its debt under the plan put in place by the European Union and the International Monetary Fund and put the ongoing drama of the European sovereign debt crisis back on center stage. Investors became increasingly concerned that Greece would default on its debt, a scenario that only seemed more likely as many Greeks rioted in response to greater budgetary austerity and the discussion moved from whether private investors would take a loss on their Greek debt to how big the loss would be. Because many eurozone banks owned Greek debt and many U.S. banks had financial ties to eurozone banks, investors worried about the effect of such an event on the financial system and the global economy.
Even as the situation in Greece deteriorated, eurozone GDP numbers supported the case for a modest recovery in the global economy. Reported GDP growth for the 17 countries that comprise the eurozone was modest, rising 0.2% in the third quarter compared to the second quarter and by 0.2% in the fourth quarter compared to the third quarter. However, the eurozone average concealed a wide
| | | | | | |
| Letter to Shareholders | | Wells Fargo Advantage Strategic Large Cap Growth Fund | | | 3 | |
variation between economies, with Germany’s growing by 0.5% in the third quarter of 2011 even as Greece’s GDP contracted.
Central banks continued to provide stimulus.
Throughout the reporting period, the Federal Open Market Committee (FOMC) kept its key interest rates effectively at zero in order to support the economy and financial system. Moreover, in response to extreme market volatility and signs of a weakening economy, in its August 2011 policy statement, the Federal Reserve (Fed) announced it would keep interest rates “exceptionally low” until at least mid-2013 as a way to support the economy. Market participants interpreted the Fed’s statement to mean that the central bankers believed the economy would remain weak over the next two years. However, the Fed also said that it was considering a “range of policy tools available to promote a stronger economic recovery” and “is prepared to employ these tools as appropriate.”
At the beginning of the period, the European Central Bank (ECB) had a key rate of 1.50% but lowered it to 1.25% in November 2011 and then to 1.00% in December 2011 in an attempt to support the sluggish eurozone recovery. To support the banking system, in late 2011, the ECB initiated a long-term refinancing operation (LTRO) in which it supplied three-year loans to banks against a wide range of collateral. The operation basically provided a near-unlimited amount of liquidity to banks, easing some investor concerns about the effect of an increasingly probable Greek default.
We use time-tested investment strategies, even as many variables are at work in the market.
Experience tells us that strict adherence to time-tested investment strategies has its rewards. As a whole, Wells Fargo Advantage Funds represents investments across a range of asset classes and investment styles, giving you an opportunity to create a diversified investment portfolio. While diversification may not prevent losses in a downturn, it does provide you with one way of managing risk.
Thank you for choosing to invest with Wells Fargo Advantage Funds. We appreciate your confidence in us and remain committed to helping you meet your financial needs. For current information about your fund investments, contact your investment professional, visit our website at wellsfargoadvantagefunds.com, or call us directly at 1-800-222-8222. We are available 24 hours a day, 7 days a week.
Sincerely,

Karla M. Rabusch
President
Wells Fargo Advantage Funds
| | | | |
| 4 | | Wells Fargo Advantage Strategic Large Cap Growth Fund | | Letter to Shareholders |
Notice to Shareholders
The Board of Trustees for Wells Fargo Advantage Funds has unanimously approved the following modifications to certain net asset value (NAV) waiver privileges and commission schedules:
| | n | | Effective May 1, 2012, automatic investment plan (AIP) purchases and proceeds received from systematic withdrawals will no longer qualify for NAV repurchase privileges. | |
| | n | | Effective May 1, 2012, discretionary rights to waive the upfront commission for Class C and “jumbo” Class A share purchases will no longer be granted to broker/dealers. However, we will continue to waive the Class C shares contingent deferred sales charge for redemptions by employer-sponsored retirement plans where the dealer of record waived its commission at the time of purchase. | |
| | n | | Effective July 31, 2012, NAV purchase privileges for former Evergreen Class IS and Class R shareholders are being modified to remove the ability to purchase Class A shares at NAV unless those shares are held directly with the Fund on or after July 31, 2012. | |
Please contact your investment professional or call us directly at 1-800-222-8222 if you have any questions on this Notice to Shareholders.
| | | | | | |
| Performance Highlights (Unaudited) | | Wells Fargo Advantage Strategic Large Cap Growth Fund | | | 5 | |
INVESTMENT OBJECTIVE
The Fund seeks long-term capital appreciation.
ADVISER
Wells Fargo Funds Management, LLC
SUB-ADVISER
Wells Capital Management Incorporated
PORTFOLIO MANAGERS
Joseph M. Eberhardy, CFA, CPA
Thomas C. Ognar, CFA
Bruce C. Olson, CFA
FUND INCEPTION
December 31, 1994
| | | | |
TEN LARGEST EQUITY HOLDINGS1 (AS OF JANUARY 31, 2012) | |
Apple Incorporated | | | 7.69% | |
Google Incorporated Class A | | | 3.21% | |
Qualcomm Incorporated | | | 3.00% | |
MasterCard Incorporated Class A | | | 2.60% | |
Cognizant Technology Solutions Corporation Class A | | | 2.58% | |
Alexion Pharmaceuticals Incorporated | | | 2.49% | |
Praxair Incorporated | | | 2.43% | |
Priceline.com Incorporated | | | 2.39% | |
EMC Corporation | | | 2.31% | |
Whole Foods Marketing Incorporated | | | 2.22% | |
|
SECTOR DISTRIBUTION2 (AS OF JANUARY 31, 2012) |
|
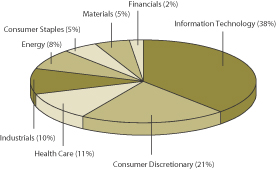 |
| 1. | The ten largest equity holdings are calculated based on the value of the securities divided by total net assets of the Fund. Holdings are subject to change and may have changed since the date specified. |
| 2. | Sector distribution is subject to change and is calculated based on the total long-term investments of the Fund. |
| | | | |
| 6 | | Wells Fargo Advantage Strategic Large Cap Growth Fund | | Performance Highlights (Unaudited) |
AVERAGE ANNUAL TOTAL RETURN3 (%) (AS OF JANUARY 31, 2012)
| | | | | | | | | | | | | | | | | | | | | | | | | | | | | | | | | | | | | | | | | | | | |
| | | | | | Including Sales Charge | | | Excluding Sales Charge | | | Expense Ratios4 | |
| | | Inception Date | | | 6 Months* | | | 1 Year | | | 5 Year | | | 10 Year | | | 6 Months* | | | 1 Year | | | 5 Year | | | 10 Year | | | Gross | | | Net5 | |
Class A (ESGAX) | | | 05/11/2001 | | | | (4.81 | ) | | | (2.21 | ) | | | 2.67 | | | | 3.10 | | | | 0.99 | | | | 3.75 | | | | 3.89 | | | | 3.71 | | | | 1.27% | | | | 1.08% | |
Class C (ESGTX) | | | 05/11/2001 | | | | (0.39 | ) | | | 2.00 | | | | 3.12 | | | | 2.95 | | | | 0.61 | | | | 3.00 | | | | 3.12 | | | | 2.95 | | | | 2.02% | | | | 1.83% | |
Class R (ESGRX) | | | 10/10/2003 | | | | | | | | | | | | | | | | | | | | 0.87 | | | | 3.50 | | | | 3.64 | | | | 3.48 | | | | 1.52% | | | | 1.33% | |
Administrator Class (ESGDX) | | | 07/30/2010 | | | | | | | | | | | | | | | | | | | | 1.06 | | | | 3.86 | | | | 4.01 | | | | 3.83 | | | | 1.11% | | | | 0.96% | |
Institutional Class (ESGIX) | | | 11/24/1997 | | | | | | | | | | | | | | | | | | | | 1.12 | | | | 4.02 | | | | 4.16 | | | | 3.99 | | | | 0.84% | | | | 0.81% | |
Russell 1000® Growth Index6 | | | | | | | | | | | | | | | | | | | | | | | 2.84 | | | | 6.07 | | | | 3.17 | | | | 3.38 | | | | | | | | | |
| * | Returns for periods of less than one year are not annualized. |
Figures quoted represent past performance, which is no guarantee of future results and do not reflect the deduction of taxes that a shareholder may pay on fund distributions or the redemption of fund shares. Investment return and principal value of an investment will fluctuate so that an investor’s shares, when redeemed, may be worth more or less than their original cost. Performance shown without sales charges would be lower if sales charges were reflected. Current performance may be lower or higher than the performance data quoted and assumes the reinvestment of dividends and capital gains. Current month-end performance is available on the Fund’s Web site – wellsfargoadvantagefunds.com
Index returns do not include transaction costs associated with buying and selling securities, any mutual fund fees or expenses or any taxes. It is not possible to invest directly in an index.
For Class A shares, the maximum front-end sales charge is 5.75%. For Class C shares, the maximum contingent deferred sales charge is 1.00%. Performance including sales charge assumes the sales charge for the corresponding time period. Class R, Administrator Class and Institutional Class shares are sold without a front-end sales charge or contingent deferred sales charge.
Stock fund values fluctuate in response to the activities of individual companies and general market and economic conditions. This Fund is exposed to active trading risk. Consult the Fund’s prospectus for additional information on these and other risks.
| 3. | Historical performance shown for Class R and Administrator Class shares prior to their inception reflects the performance of the Institutional Class shares, adjusted to reflect the higher expenses applicable to Class R and Administrator Class shares. Historical performance shown for all classes of the Fund prior to July 19, 2010 is based on the performance of the Fund’s predecessor, Evergreen Strategic Growth Fund. |
| 4. | Reflects the expense ratios as stated in the most recent prospectuses. |
| 5. | The Adviser has committed through July 18, 2013 to waive fees and/or reimburse expenses to the extent necessary to cap the Fund’s Total Annual Fund Operating Expenses After Fee Waiver, excluding certain expenses, at 1.07% for Class A, 1.82% for Class C, 1.32% for Class R, 0.95% for Administrator Class and 0.80% for Institutional Class. Without this cap, the Fund’s returns would have been lower. |
| 6. | The Russell 1000® Growth Index measures the performance of those Russell 1000 Growth Index companies with higher price-to-book ratios and higher forecasted growth values. You cannot invest directly in an index. |
| | | | | | |
| Fund Expenses (Unaudited) | | Wells Fargo Advantage Strategic Large Cap Growth Fund | | | 7 | |
As a shareholder of the Fund, you incur two types of costs: (1) transaction costs, including sales charges (loads) on purchase payments and contingent deferred sales charges (if any) on redemptions and (2) ongoing costs, including management fees; distribution (12b-1) and/or shareholder service fees; and other Fund expenses. This example is intended to help you understand your ongoing costs (in dollars) of investing in the Fund and to compare these costs with the ongoing costs of investing in other mutual funds.
The example is based on an investment of $1,000 invested at the beginning of the six-month period and held for the entire period from August 1, 2011 to January 31, 2012.
Actual Expenses
The “Actual” line of the table below provides information about actual account values and actual expenses. You may use the information in this line, together with the amount you invested, to estimate the expenses that you paid over the period. Simply divide your account value by $1,000 (for example, an $8,600 account value divided by $1,000 = 8.6), then multiply the result by the number in the “Actual” line under the heading entitled “Expenses Paid During Period” for your applicable class of shares to estimate the expenses you paid on your account during this period.
Hypothetical Example for Comparison Purposes
The “Hypothetical” line of the table below provides information about hypothetical account values and hypothetical expenses based on the Fund’s actual expense ratio and an assumed rate of return of 5% per year before expenses, which is not the Fund’s actual return. The hypothetical account values and expenses may not be used to estimate the actual ending account balance or expenses you paid for the period. You may use this information to compare the ongoing costs of investing in the Fund and other funds. To do so, compare this 5% hypothetical example with the 5% hypothetical examples that appear in the shareholder reports of the other funds.
Please note that the expenses shown in the table are meant to highlight your ongoing costs only and do not reflect any transactional costs, such as sales charges (loads) and contingent deferred sales charges. Therefore, the “Hypothetical” line of the table is useful in comparing ongoing costs only, and will not help you determine the relative total costs of owning different funds. In addition, if these transactional costs were included, your costs would have been higher.
| | | | | | | | | | | | | | | | |
| | | Beginning
Account Value
08-01-2011 | | | Ending
Account Value
01-31-2012 | | | Expenses
Paid During
the Period1 | | | Net Annual
Expense Ratio | |
Class A | | | | | | | | | | | | | | | | |
Actual | | $ | 1,000.00 | | | $ | 1,009.94 | | | $ | 5.41 | | | | 1.07 | % |
Hypothetical (5% return before expenses) | | $ | 1,000.00 | | | $ | 1,019.76 | | | $ | 5.43 | | | | 1.07 | % |
Class C | | | | | | | | | | | | | | | | |
Actual | | $ | 1,000.00 | | | $ | 1,006.07 | | | $ | 9.18 | | | | 1.82 | % |
Hypothetical (5% return before expenses) | | $ | 1,000.00 | | | $ | 1,015.99 | | | $ | 9.22 | | | | 1.82 | % |
Class R | | | | | | | | | | | | | | | | |
Actual | | $ | 1,000.00 | | | $ | 1,008.68 | | | $ | 6.66 | | | | 1.32 | % |
Hypothetical (5% return before expenses) | | $ | 1,000.00 | | | $ | 1,018.50 | | | $ | 6.70 | | | | 1.32 | % |
Administrator Class | | | | | | | | | | | | | | | | |
Actual | | $ | 1,000.00 | | | $ | 1,010.60 | | | $ | 4.80 | | | | 0.95 | % |
Hypothetical (5% return before expenses) | | $ | 1,000.00 | | | $ | 1,020.36 | | | $ | 4.82 | | | | 0.95 | % |
Institutional Class | | | | | | | | | | | | | | | | |
Actual | | $ | 1,000.00 | | | $ | 1,011.24 | | | $ | 4.04 | | | | 0.80 | % |
Hypothetical (5% return before expenses) | | $ | 1,000.00 | | | $ | 1,021.11 | | | $ | 4.06 | | | | 0.80 | % |
| 1. | Expenses paid is equal to the annualized expense ratio of each class multiplied by the average account value over the period, multiplied by the number of days in the most recent fiscal half-year divided by the number of days in the fiscal year (to reflect the one-half year period). |
| | | | |
| 8 | | Wells Fargo Advantage Strategic Large Cap Growth Fund | | Portfolio of Investments—January 31, 2012 (Unaudited) |
| | | | | | | | | | | | |
| Security Name | | | | | | Shares | | | Value | |
| | | | | | | | | | | | |
| | | | |
Common Stocks: 98.59% | | | | | | | | | | | | |
| | | | |
Consumer Discretionary: 21.29% | | | | | | | | | | | | |
| | | | |
| Auto Components: 0.62% | | | | | | | | | | | | |
Johnson Controls Incorporated | | | | | | | 113,750 | | | $ | 3,613,838 | |
| | | | | | | | | | | | |
| | | | |
| Hotels, Restaurants & Leisure: 5.47% | | | | | | | | | | | | |
Las Vegas Sands Corporation | | | | | | | 60,000 | | | | 2,946,600 | |
McDonald’s Corporation | | | | | | | 127,060 | | | | 12,585,293 | |
Starbucks Corporation | | | | | | | 217,000 | | | | 10,400,810 | |
Wynn Resorts Limited | | | | | | | 54,000 | | | | 6,222,420 | |
| | | | |
| | | | | | | | | | | 32,155,123 | |
| | | | | | | | | | | | |
| | | | |
| Internet & Catalog Retail: 4.01% | | | | | | | | | | | | |
Amazon.com Incorporated† | | | | | | | 48,970 | | | | 9,521,727 | |
Priceline.com Incorporated† | | | | | | | 26,560 | | | | 14,062,989 | |
| | | | |
| | | | | | | | | | | 23,584,716 | |
| | | | | | | | | | | | |
| | | | |
| Multiline Retail: 1.56% | | | | | | | | | | | | |
Dollar Tree Incorporated† | | | | | | | 108,000 | | | | 9,159,480 | |
| | | | | | | | | | | | |
| | | | |
| Specialty Retail: 4.34% | | | | | | | | | | | | |
CarMax Incorporated†« | | | | | | | 314,840 | | | | 9,580,581 | |
Dick’s Sporting Goods Incorporated | | | | | | | 120,000 | | | | 4,945,200 | |
O’Reilly Automotive Incorporated† | | | | | | | 100,000 | | | | 8,151,000 | |
Ross Stores Incorporated | | | | | | | 56,000 | | | | 2,845,920 | |
| | | | |
| | | | | | | | | | | 25,522,701 | |
| | | | | | | | | | | | |
| | | | |
| Textiles, Apparel & Luxury Goods: 5.29% | | | | | | | | | | | | |
Coach Incorporated | | | | | | | 160,000 | | | | 11,208,000 | |
Fossil Incorporated† | | | | | | | 65,000 | | | | 6,178,250 | |
Nike Incorporated Class B | | | | | | | 84,000 | | | | 8,735,160 | |
VF Corporation | | | | | | | 38,000 | | | | 4,996,620 | |
| | | | |
| | | | | | | | | | | 31,118,030 | |
| | | | | | | | | | | | |
| | | | |
Consumer Staples: 4.75% | | | | | | | | | | | | |
| | | | |
| Beverages: 0.70% | | | | | | | | | | | | |
The Coca-Cola Company | | | | | | | 61,000 | | | | 4,119,330 | |
| | | | | | | | | | | | |
| | | | |
| Food & Staples Retailing: 2.87% | | | | | | | | | | | | |
Costco Wholesale Corporation | | | | | | | 47,000 | | | | 3,866,690 | |
Whole Foods Market Incorporated | | | | | | | 176,000 | | | | 13,029,280 | |
| | | | |
| | | | | | | | | | | 16,895,970 | |
| | | | | | | | | | | | |
| | | | |
| Food Products: 0.98% | | | | | | | | | | | | |
Green Mountain Coffee Roasters Incorporated†« | | | | | | | 12,000 | | | | 640,080 | |
Mead Johnson Nutrition Company | | | | | | | 69,000 | | | | 5,112,210 | |
| | | | |
| | | | | | | | | | | 5,752,290 | |
| | | | | | | | | | | | |
| | | | |
| Personal Products: 0.20% | | | | | | | | | | | | |
Estee Lauder Companies Incorporated Class A | | | | | | | 20,000 | | | | 1,158,600 | |
| | | | | | | | | | | | |
| | | | | | |
| Portfolio of Investments—January 31, 2012 (Unaudited) | | Wells Fargo Advantage Strategic Large Cap Growth Fund | | | 9 | |
| | | | | | | | | | | | |
| Security Name | | | | | | Shares | | | Value | |
| | | | | | | | | | | | |
| | | | |
Energy: 8.29% | | | | | | | | | | | | |
| | | | |
| Energy Equipment & Services: 3.39% | | | | | | | | | | | | |
National Oilwell Varco Incorporated | | | | | | | 125,070 | | | $ | 9,252,679 | |
Schlumberger Limited | | | | | | | 142,000 | | | | 10,674,140 | |
| | | | |
| | | | | | | | | | | 19,926,819 | |
| | | | | | | | | | | | |
| | | | |
| Oil, Gas & Consumable Fuels: 4.90% | | | | | | | | | | | | |
Apache Corporation | | | | | | | 42,000 | | | | 4,152,960 | |
Continental Resources Incorporated†« | | | | | | | 51,120 | | | | 4,124,362 | |
Occidental Petroleum Corporation | | | | | | | 80,510 | | | | 8,032,483 | |
Pioneer Natural Resources Company | | | | | | | 110,000 | | | | 10,923,000 | |
Southwestern Energy Company† | | | | | | | 50,400 | | | | 1,569,456 | |
| | | | |
| | | | | | | | | | | 28,802,261 | |
| | | | | | | | | | | | |
| | | | |
Financials: 4.13% | | | | | | | | | | | | |
| | | | |
| Capital Markets: 0.79% | | | | | | | | | | | | |
TD Ameritrade Holding Corporation | | | | | | | 287,000 | | | | 4,623,570 | |
| | | | | | | | | | | | |
| | | | |
| Consumer Finance: 3.34% | | | | | | | | | | | | |
American Express Company | | | | | | | 87,000 | | | | 4,362,180 | |
MasterCard Incorporated Class A | | | | | | | 43,000 | | | | 15,289,510 | |
| | | | |
| | | | | | | | | | | 19,651,690 | |
| | | | | | | | | | | | |
| | | | |
Health Care: 10.68% | | | | | | | | | | | | |
| | | | |
| Biotechnology: 2.97% | | | | | | | | | | | | |
Alexion Pharmaceuticals Incorporated† | | | | | | | 190,640 | | | | 14,633,526 | |
Biogen Idec Incorporated† | | | | | | | 24,000 | | | | 2,830,080 | |
| | | | |
| | | | | | | | | | | 17,463,606 | |
| | | | | | | | | | | | |
| | | | |
| Health Care Equipment & Supplies: 2.68% | | | | | | | | | | | | |
Intuitive Surgical Incorporated† | | | | | | | 19,000 | | | | 8,738,290 | |
St. Jude Medical Incorporated | | | | | | | 168,310 | | | | 7,020,210 | |
| | | | |
| | | | | | | | | | | 15,758,500 | |
| | | | | | | | | | | | |
| | | | |
| Health Care Providers & Services: 1.27% | | | | | | | | | | | | |
AmerisourceBergen Corporation | | | | | | | 191,000 | | | | 7,443,270 | |
| | | | | | | | | | | | |
| | | | |
| Pharmaceuticals: 3.76% | �� | | | | | | | | | | | |
Allergan Incorporated | | | | | | | 112,380 | | | | 9,879,326 | |
Shire plc ADR | | | | | | | 123,090 | | | | 12,249,917 | |
| | | | |
| | | | | | | | | | | 22,129,243 | |
| | | | | | | | | | | | |
| | | | |
Industrials: 10.29% | | | | | | | | | | | | |
| | | | |
| Aerospace & Defense: 1.52% | | | | | | | | | | | | |
United Technologies Corporation | | | | | | | 114,000 | | | | 8,931,900 | |
| | | | | | | | | | | | |
| | | | |
| Air Freight & Logistics: 1.67% | | | | | | | | | | | | |
C.H. Robinson Worldwide Incorporated | | | | | | | 142,630 | | | | 9,818,649 | |
| | | | | | | | | | | | |
| | | | |
| Electrical Equipment: 0.72% | | | | | | | | | | | | |
Emerson Electric Company | | | | | | | 82,000 | | | | 4,213,160 | |
| | | | | | | | | | | | |
| | | | |
| 10 | | Wells Fargo Advantage Strategic Large Cap Growth Fund | | Portfolio of Investments—January 31, 2012 (Unaudited) |
| | | | | | | | | | | | |
| Security Name | | | | | | Shares | | | Value | |
| | | | | | | | | | | | |
| | | | |
| Industrial Conglomerates: 1.53% | | | | | | | | | | | | |
Danaher Corporation | | | | | | | 171,000 | | | $ | 8,979,210 | |
| | | | | | | | | | | | |
| | | | |
| Machinery: 1.81% | | | | | | | | | | | | |
Caterpillar Incorporated | | | | | | | 42,670 | | | | 4,656,150 | |
Joy Global Incorporated | | | | | | | 66,260 | | | | 6,009,119 | |
| | | | |
| | | | | | | | | | | 10,665,269 | |
| | | | | | | | | | | | |
| | | | |
| Road & Rail: 3.04% | | | | | | | | | | | | |
Norfolk Southern Corporation | | | | | | | 92,820 | | | | 6,701,604 | |
Union Pacific Corporation | | | | | | | 97,530 | | | | 11,148,654 | |
| | | | |
| | | | | | | | | | | 17,850,258 | |
| | | | | | | | | | | | |
| | | | |
Information Technology: 34.08% | | | | | | | | | | | | |
| | | | |
| Communications Equipment: 3.88% | | | | | | | | | | | | |
F5 Networks Incorporated† | | | | | | | 43,000 | | | | 5,148,820 | |
QUALCOMM Incorporated | | | | | | | 300,000 | | | | 17,646,000 | |
| | | | |
| | | | | | | | | | | 22,794,820 | |
| | | | | | | | | | | | |
| | | | |
| Computers & Peripherals: 10.00% | | | | | | | | | | | | |
Apple Incorporated† | | | | | | | 99,000 | | | | 45,191,520 | |
EMC Corporation† | | | | | | | 528,000 | | | | 13,601,280 | |
| | | | |
| | | | | | | | | | | 58,792,800 | |
| | | | | | | | | | | | |
| | | | |
| Internet Software & Services: 4.60% | | | | | | | | | | | | |
eBay Incorporated† | | | | | | | 260,000 | | | | 8,216,000 | |
Google Incorporated Class A† | | | | | | | 32,500 | | | | 18,853,575 | |
| | | | |
| | | | | | | | | | | 27,069,575 | |
| | | | | | | | | | | | |
| | | | |
| IT Services: 4.45% | | | | | | | | | | | | |
Accenture plc | | | | | | | 191,000 | | | | 10,951,940 | |
Cognizant Technology Solutions Corporation Class A† | | | | | | | 211,770 | | | | 15,194,498 | |
| | | | |
| | | | | | | | | | | 26,146,438 | |
| | | | | | | | | | | | |
| | | | |
| Semiconductors & Semiconductor Equipment: 4.56% | | | | | | | | | | | | |
Altera Corporation | | | | | | | 44,000 | | | | 1,750,760 | |
Analog Devices Incorporated | | | | | | | 141,350 | | | | 5,531,024 | |
ARM Holdings plc ADR | | | | | | | 107,000 | | | | 3,090,160 | |
Avago Technologies Limited | | | | | | | 146,380 | | | | 4,968,137 | |
Maxim Integrated Products Incorporated | | | | | | | 98,000 | | | | 2,630,320 | |
Microchip Technology Incorporated« | | | | | | | 238,740 | | | | 8,811,893 | |
| | | | |
| | | | | | | | | | | 26,782,294 | |
| | | | | | | | | | | | |
| | | | |
| Software: 6.59% | | | | | | | | | | | | |
Check Point Software Technologies Limited†« | | | | | | | 198,930 | | | | 11,197,770 | |
Citrix Systems Incorporated† | | | | | | | 89,000 | | | | 5,803,690 | |
Red Hat Incorporated† | | | | | | | 221,285 | | | | 10,260,985 | |
Salesforce.com Incorporated†« | | | | | | | 70,260 | | | | 8,206,368 | |
VMware Incorporated† | | | | | | | 35,700 | | | | 3,258,339 | |
| | | | |
| | | | | | | | | | | 38,727,152 | |
| | | | | | | | | | | | |
| | | | | | |
| Portfolio of Investments—January 31, 2012 (Unaudited) | | Wells Fargo Advantage Strategic Large Cap Growth Fund | | | 11 | |
| | | | | | | | | | | | | | |
| Security Name | | | | | | | Shares | | | Value | |
| | | | | | | | | | | | | | |
| | | | |
Materials: 5.08% | | | | | | | | | | | | | | |
| | | | |
| Chemicals: 5.08% | | | | | | | | | | | | | | |
Air Products & Chemicals Incorporated | | | | | | | | | 46,550 | | | $ | 4,097,797 | |
Ecolab Incorporated | | | | | | | | | 56,840 | | | | 3,435,410 | |
Monsanto Company | | | | | | | | | 98,000 | | | | 8,040,900 | |
Praxair Incorporated | | | | | | | | | 134,500 | | | | 14,283,900 | |
| | | | |
| | | | | | | | | | | | | 29,858,007 | |
| | | | | | | | | | | | | | |
| | | | |
Total Common Stocks (Cost $497,856,751) | | | | | | | | | | | | | 579,508,569 | |
| | | | | | | | | | | | | | |
| | | | |
| | | Yield | | | | | | | | | |
| Short-Term Investments: 6.64% | | | | | | | | | | | | | | |
Wells Fargo Advantage Cash Investment Money Market Fund, Institutional Class(l)(u) | | | 0.02 | % | | | | | 8,552,438 | | | | 8,552,438 | |
Wells Fargo Securities Lending Cash Investments, LLC(l)(r)(u)(v) | | | 0.15 | | | | | | 30,507,698 | | | | 30,507,698 | |
| | | | |
Total Short-Term Investments (Cost $39,060,136) | | | | | | | | | | | | | 39,060,136 | |
| | | | | | | | | | | | | | |
| | | | | | | | |
| Total Investments in Securities | | | | | | | | |
| (Cost $536,916,887)* | | | 105.23 | % | | | 618,568,705 | |
Other Assets and Liabilities, Net | | | (5.23 | ) | | | (30,756,857 | ) |
| | | | | | | | |
| Total Net Assets | | | 100.00 | % | | $ | 587,811,848 | |
| | | | | | | | |
| † | Non-income earning security. |
| « | All or a portion of this security is on loan. |
| (l) | Investment in an affiliate. |
| (r) | The investment company is exempt from registration under Section 3(c)(7) of the 1940 Act. |
| (u) | Rate shown is the 7-day annualized yield at period end. |
| (v) | Security represents investment of cash collateral received from securities on loan. |
| * | Cost for federal income tax purposes is $540,455,133 and net unrealized appreciation (depreciation) consists of: |
| | | | |
Gross unrealized appreciation | | $ | 85,137,322 | |
Gross unrealized depreciation | | | (7,023,750 | ) |
| | | | |
Net unrealized appreciation | | $ | 78,113,572 | |
The accompanying notes are an integral part of these financial statements.
| | | | |
| 12 | | Wells Fargo Advantage Strategic Large Cap Growth Fund | | Statement of Assets and Liabilities—January 31, 2012 (Unaudited) |
| | | | |
| | | | |
| |
Assets | | | | |
Investments | | | | |
In unaffiliated securities (including securities on loan), at value (see cost below) | | $ | 579,508,569 | |
In affiliated securities, at value (see cost below) | | | 39,060,136 | |
| | | | |
Total investments, at value (see cost below) | | | 618,568,705 | |
Receivable for investments sold | | | 3,706,285 | |
Receivable for Fund shares sold | | | 407,073 | |
Receivable for dividends | | | 90,840 | |
Receivable for securities lending income | | | 3,796 | |
Prepaid expenses and other assets | | | 24,775 | |
| | | | |
Total assets | | | 622,801,474 | |
| | | | |
| |
Liabilities | | | | |
Payable for investments purchased | | | 2,934,686 | |
Payable for Fund shares redeemed | | | 1,098,755 | |
Payable upon receipt of securities loaned | | | 30,507,698 | |
Advisory fee payable | | | 298,014 | |
Distribution fees payable | | | 4,463 | |
Due to other related parties | | | 70,352 | |
Accrued expenses and other liabilities | | | 75,658 | |
| | | | |
Total liabilities | | | 34,989,626 | |
| | | | |
Total net assets | | $ | 587,811,848 | |
| | | | |
| |
NET ASSETS CONSIST OF | | | | |
Paid-in capital | | $ | 541,140,090 | |
Undistributed net investment income | | | 436,871 | |
Accumulated net realized losses on investments | | | (35,416,931 | ) |
Net unrealized gains on investments | | | 81,651,818 | |
| | | | |
Total net assets | | $ | 587,811,848 | |
| | | | |
| |
COMPUTATION OF NET ASSET VALUE AND OFFERING PRICE PER SHARE1 | | | | |
Net assets – Class A | | $ | 28,619,945 | |
Shares outstanding – Class A | | | 898,312 | |
Net asset value per share – Class A | | | $31.86 | |
Maximum offering price per share – Class A2 | | | $33.80 | |
Net assets – Class C | | $ | 5,744,052 | |
Shares outstanding – Class C | | | 192,447 | |
Net asset value per share – Class C | | | $29.85 | |
Net assets – Class R | | $ | 3,648,596 | |
Shares outstanding – Class R | | | 115,472 | |
Net asset value per share – Class R | | | $31.60 | |
Net assets – Administrator Class | | $ | 2,412,112 | |
Shares outstanding – Administrator Class | | | 75,121 | |
Net asset value per share – Administrator Class | | | $32.11 | |
Net assets – Institutional Class | | $ | 547,387,143 | |
Shares outstanding – Institutional Class | | | 17,011,043 | |
Net asset value per share – Institutional Class | | | $32.18 | |
| |
Investments in unaffiliated securities, at cost | | $ | 497,856,751 | |
| | | | |
Investments in affiliated securities, at cost | | $ | 39,060,136 | |
| | | | |
Total investments, at cost | | $ | 536,916,887 | |
| | | | |
Securities on loan, at value | | $ | 29,834,788 | |
| | | | |
| 1. | The Fund has an unlimited number of authorized shares. |
| 2. | Maximum offering price is computed as 100/94.25 of net asset value. On investments of $50,000 or more, the offering price is reduced. |
The accompanying notes are an integral part of these financial statements.
| | | | | | |
| Statement of Operations—Six Months Ended January 31, 2012 (Unaudited) | | Wells Fargo Advantage Strategic Large Cap Growth Fund | | | 13 | |
| | | | |
| | | | |
| |
Investment income | | | | |
Dividends | | $ | 2,633,045 | |
Securities lending income, net | | | 54,627 | |
Income from affiliated securities | | | 5,126 | |
| | | | |
Total investment income | | | 2,692,798 | |
| | | | |
| |
Expenses | | | | |
Advisory fee | | | 1,734,969 | |
Administration fees | | | | |
Fund level | | | 133,776 | |
Class A | | | 34,802 | |
Class C | | | 7,071 | |
Class R | | | 2,821 | |
Administrator Class | | | 1,242 | |
Institutional Class | | | 199,295 | |
Shareholder servicing fees | | | | |
Class A | | | 33,463 | |
Class C | | | 6,799 | |
Class R | | | 2,713 | |
Administrator Class | | | 2,939 | |
Distribution fees | | | | |
Class C | | | 20,396 | |
Class R | | | 2,713 | |
Custody and accounting fees | | | 19,849 | |
Professional fees | | | 26,460 | |
Registration fees | | | 28,835 | |
Shareholder report expenses | | | 26,367 | |
Trustees’ fees and expenses | | | 4,974 | |
Other fees and expenses | | | 7,790 | |
| | | | |
Total expenses | | | 2,297,274 | |
Less: Fee waivers and/or expense reimbursements | | | (85,487 | ) |
| | | | |
Net expenses | | | 2,211,787 | |
| | | | |
Net investment income | | | 481,011 | |
| | | | |
| |
REALIZED AND UNREALIZED GAINS (LOSSES) ON INVESTMENTS | | | | |
Net realized losses on investments | | | (1,718,248 | ) |
Net change in unrealized gains (losses) on investments | | | 6,881,096 | |
| | | | |
Net realized and unrealized gains (losses) on investments | | | 5,162,848 | |
| | | | |
Net increase in net assets resulting from operations | | $ | 5,643,859 | |
| | | | |
The accompanying notes are an integral part of these financial statements.
| | | | |
| 14 | | Wells Fargo Advantage Strategic Large Cap Growth Fund | | Statements of Changes in Net Assets |
| | | | | | | | | | | | | | | | |
| | | Six Months Ended January 31, 2012 (Unaudited) | | | Year Ended July 31, 2011 | |
| |
Operations | | | | | |
Net investment income | | | | | | $ | 481,011 | | | | | | | $ | 1,610,220 | |
Net realized gains (losses) on investments | | | | | | | (1,718,248 | ) | | | | | | | 71,882,389 | |
Net change in unrealized gains (losses) on investments | | | | | | | 6,881,096 | | | | | | | | 27,547,809 | |
| | | | | | | | | | | | | | | | |
Net increase in net assets resulting from operations | | | | | | | 5,643,859 | | | | | | | | 101,040,418 | |
| | | | | | | | | | | | | | | | |
| | | |
Distributions to shareholders from | | | | | | | | | | | | |
Net investment income | | | | | | | | |
Class A | | | | | | | (19,325 | ) | | | | | | | 0 | |
Class R | | | | | | | (8,983 | ) | | | | | | | 0 | |
Administrator Class | | | | | | | (6,605 | ) | | | | | | | (4,618 | ) |
Institutional Class | | | | | | | (1,559,092 | ) | | | | | | | (844,105 | ) |
| | | | | | | | | | | | | | | | |
Total distributions to shareholders | | | | | | | (1,594,005 | ) | | | | | | | (848,723 | ) |
| | | | | | | | | | | | | | | | |
| | |
Capital share transactions | | | | | | | | |
Proceeds from shares sold | | | | | | | | |
Class A | | | 111,594 | | | | 3,370,688 | | | | 302,920 | | | | 9,420,716 | |
Class C | | | 22,294 | | | | 629,116 | | | | 56,060 | | | | 1,625,693 | |
Class R | | | 97,196 | | | | 2,931,854 | | | | 31,730 | | | | 994,238 | |
Administrator Class | | | 6,557 | | | | 198,026 | | | | 102,752 | | | | 3,146,016 | |
Institutional Class | | | 2,721,121 | | | | 82,153,040 | | | | 7,400,016 | | | | 232,824,334 | |
| | | | | | | | | | | | | | | | |
| | | | | | | 89,282,724 | | | | | | | | 248,010,997 | |
| | | | | | | | | | | | | | | | |
Reinvestment of distributions | | | | | | | | |
Class A | | | 475 | | | | 13,848 | | | | 0 | | | | 0 | |
Class R | | | 161 | | | | 4,672 | | | | 0 | | | | 0 | |
Administrator Class | | | 100 | | | | 2,948 | | | | 104 | | | | 3,154 | |
Institutional Class | | | 34,503 | | | | 1,016,449 | | | | 12,025 | | | | 365,447 | |
| | | | | | | | | | | | | | | | |
| | | | | | | 1,037,917 | | | | | | | | 368,601 | |
| | | | | | | | | | | | | | | | |
Payment for shares redeemed | | | | | | | | |
Class A | | | (102,899 | ) | | | (3,085,642 | ) | | | (367,241 | ) | | | (10,649,100 | ) |
Class C | | | (27,950 | ) | | | (780,599 | ) | | | (110,586 | ) | | | (3,020,425 | ) |
Class R | | | (25,412 | ) | | | (748,497 | ) | | | (5,661 | ) | | | (176,078 | ) |
Administrator Class | | | (21,091 | ) | | | (626,216 | ) | | | (13,695 | ) | | | (429,480 | ) |
Institutional Class | | | (2,905,378 | ) | | | (87,111,621 | ) | | | (5,541,807 | ) | | | (166,781,047 | ) |
| | | | | | | | | | | | | | | | |
| | | | | | | (92,352,575 | ) | | | | | | | (181,056,130 | ) |
| | | | | | | | | | | | | | | | |
Net increase (decrease) in net assets resulting
from capital share transactions | | | | | | | (2,031,934 | ) | | | | | | | 67,323,468 | |
| | | | | | | | | | | | | | | | |
Total increase in net assets | | | | | | | 2,017,920 | | | | | | | | 167,515,163 | |
| | | | | | | | | | | | | | | | |
| | |
Net assets | | | | | | | | |
Beginning of period | | | | | | | 585,793,928 | | | | | | | | 418,278,765 | |
| | | | | | | | | | | | | | | | |
End of period | | | | | | $ | 587,811,848 | | | | | | | $ | 585,793,928 | |
| | | | | | | | | | | | | | | | |
Undistributed net investment income | | | | | | $ | 436,871 | | | | | | | $ | 1,549,865 | |
| | | | | | | | | | | | | | | | |
The accompanying notes are an integral part of these financial statements.
| | | | | | |
| Financial Highlights | | Wells Fargo Advantage Strategic Large Cap Growth Fund | | | 15 | |
(For a share outstanding throughout each period)
| | | | | | | | | | | | | | | | | | | | | | | | | | | | |
| | | Six Months Ended
January 31, 2012 (Unaudited) | | | Year Ended July 31, | | | Year Ended September 30, | |
| Class A | | | 2011 | | | 20101,2 | | | 20091 | | | 20081 | | | 20071 | | | 20061 | |
Net asset value, beginning of period | | $ | 31.55 | | | $ | 25.10 | | | $ | 24.30 | | | $ | 26.61 | | | $ | 34.16 | | | $ | 27.57 | | | $ | 26.70 | |
Net investment income (loss) | | | (0.01 | ) | | | 0.03 | 3 | | | (0.00 | )3 | | | 0.15 | | | | 0.11 | 3 | | | 0.02 | | | | (0.02 | ) |
Net realized and unrealized gains (losses) on investments | | | 0.34 | | | | 6.42 | | | | 0.95 | | | | (0.50 | ) | | | (6.82 | ) | | | 6.57 | | | | 0.89 | |
| | | | | | | | | | | | | | | | | | | | | | | | | | | | |
Total from investment operations | | | 0.33 | | | | 6.45 | | | | 0.95 | | | | (0.35 | ) | | | (6.71 | ) | | | 6.59 | | | | 0.87 | |
Distributions to shareholders from | | | | | | | | | | | | | | | | | | | | | | | | | | | | |
Net investment income | | | (0.02 | ) | | | 0.00 | | | | (0.15 | ) | | | (0.08 | ) | | | (0.13 | ) | | | 0.00 | | | | 0.00 | |
Net realized gains | | | 0.00 | | | | 0.00 | | | | 0.00 | | | | (1.88 | ) | | | (0.71 | ) | | | 0.00 | | | | 0.00 | |
| | | | | | | | | | | | | | | | | | | | | | | | | | | | |
Total distributions to shareholders | | | (0.02 | ) | | | 0.00 | | | | (0.15 | ) | | | (1.96 | ) | | | (0.84 | ) | | | 0.00 | | | | 0.00 | |
Net asset value, end of period | | $ | 31.86 | | | $ | 31.55 | | | $ | 25.10 | | | $ | 24.30 | | | $ | 26.61 | | | $ | 34.16 | | | $ | 27.57 | |
Total return4 | | | 0.99 | % | | | 25.78 | % | | | 3.90 | % | | | 1.02 | % | | | (20.09 | )% | | | 23.90 | % | | | 3.26 | % |
Ratios to average net assets (annualized) | | | | | | | | | | | | | | | | | | | | | | | | | | | | |
Gross expenses | | | 1.25 | % | | | 1.25 | % | | | 1.09 | % | | | 1.07 | % | | | 1.06 | % | | | 1.10 | % | | | 1.07 | % |
Net expenses | | | 1.07 | % | | | 1.07 | % | | | 1.08 | % | | | 1.07 | % | | | 1.04 | % | | | 1.08 | % | | | 1.07 | % |
Net investment income (loss) | | | (0.06 | )% | | | 0.09 | % | | | (0.01 | )% | | | 0.59 | % | | | 0.35 | % | | | 0.04 | % | | | (0.06 | )% |
Supplemental data | | | | | | | | | | | | | | | | | | | | | | | | | | | | |
Portfolio turnover rate | | | 63 | % | | | 165 | % | | | 105 | % | | | 182 | % | | | 139 | % | | | 97 | % | | | 97 | % |
Net assets, end of period (000’s omitted) | | | $28,620 | | | | $28,056 | | | | $23,932 | | | | $15,280 | | | | $8,883 | | | | $7,379 | | | | $5,395 | |
| 1. | After the close of business on July 16, 2010, the Fund acquired the net assets of Evergreen Strategic Growth Fund which became the accounting and performance survivor in the transaction. The information for the periods prior to July 19, 2010 is that of Class A of Evergreen Strategic Growth Fund. |
| 2. | For the ten months ended July 31, 2010. The Fund changed its fiscal year end from September 30 to July 31, effective July 31, 2010. |
| 3. | Calculated based upon average shares outstanding. |
| 4. | Total return calculations do not include any sales charges. Returns for periods of less than one year are not annualized. |
The accompanying notes are an integral part of these financial statements.
| | | | |
| 16 | | Wells Fargo Advantage Strategic Large Cap Growth Fund | | Financial Highlights |
(For a share outstanding throughout each period)
| | | | | | | | | | | | | | | | | | | | | | | | | | | | |
| | | Six Months Ended
January 31, 2012 (Unaudited) | | | Year Ended July 31, | | | Year Ended September 30, | |
| Class C | | | 2011 | | | 20101,2 | | | 20091 | | | 20081 | | | 20071 | | | 20061 | |
Net asset value, beginning of period | | $ | 29.65 | | | $ | 23.76 | | | $ | 23.03 | | | $ | 25.43 | | | $ | 32.79 | | | $ | 26.67 | | | $ | 26.00 | |
Net investment loss | | | (0.14 | ) | | | (0.18 | )3 | | | (0.15 | ) | | | (0.03 | )3 | | | (0.12 | )3 | | | (0.20 | )3 | | | (0.20 | )3 |
Net realized and unrealized gains (losses) on investments | | | 0.34 | | | | 6.07 | | | | 0.90 | | | | (0.49 | ) | | | (6.53 | ) | | | 6.32 | | | | 0.87 | |
| | | | | | | | | | | | | | | | | | | | | | | | | | | | |
Total from investment operations | | | 0.20 | | | | 5.89 | | | | 0.75 | | | | (0.52 | ) | | | (6.65 | ) | | | 6.12 | | | | 0.67 | |
Distributions to shareholders from | | | | | | | | | | | | | | | | | | | | | | | | | | | | |
Net investment income | | | 0.00 | | | | 0.00 | | | | (0.02 | ) | | | 0.00 | | | | 0.00 | | | | 0.00 | | | | 0.00 | |
Net realized gains | | | 0.00 | | | | 0.00 | | | | 0.00 | | | | (1.88 | ) | | | (0.71 | ) | | | 0.00 | | | | 0.00 | |
| | | | | | | | | | | | | | | | | | | | | | | | | | | | |
Total distributions to shareholders | | | 0.00 | | | | 0.00 | | | | (0.02 | ) | | | (1.88 | ) | | | (0.71 | ) | | | 0.00 | | | | 0.00 | |
Net asset value, end of period | | $ | 29.85 | | | $ | 29.65 | | | $ | 23.76 | | | $ | 23.03 | | | $ | 25.43 | | | $ | 32.79 | | | $ | 26.67 | |
Total return4 | | | 0.61 | % | | | 24.87 | % | | | 3.24 | % | | | 0.25 | % | | | (20.70 | )% | | | 22.98 | % | | | 2.58 | % |
Ratios to average net assets (annualized) | | | | | | | | | | | | | | | | | | | | | | | | | | | | |
Gross expenses | | | 2.00 | % | | | 2.01 | % | | | 1.84 | % | | | 1.82 | % | | | 1.79 | % | | | 1.79 | % | | | 1.77 | % |
Net expenses | | | 1.82 | % | | | 1.82 | % | | | 1.83 | % | | | 1.82 | % | | | 1.79 | % | | | 1.79 | % | | | 1.77 | % |
Net investment loss | | | (0.80 | )% | | | (0.66 | )% | | | (0.76 | )% | | | (0.15 | )% | | | (0.39 | )% | | | (0.68 | )% | | | (0.76 | )% |
Supplemental data | | | | | | | | | | | | | | | | | | | | | | | | | | | | |
Portfolio turnover rate | | | 63 | % | | | 165 | % | | | 105 | % | | | 182 | % | | | 139 | % | | | 97 | % | | | 97 | % |
Net assets, end of period (000’s omitted) | | | $5,744 | | | | $5,874 | | | | $6,003 | | | | $5,672 | | | | $4,457 | | | | $2,845 | | | | $1,742 | |
| 1. | After the close of business on July 16, 2010, the Fund acquired the net assets of Evergreen Strategic Growth Fund which became the accounting and performance survivor in the transaction. The information for the periods prior to July 19, 2010 is that of Class C of Evergreen Strategic Growth Fund. |
| 2. | For the ten months ended July 31, 2010. The Fund changed its fiscal year end from September 30 to July 31, effective July 31, 2010. |
| 3. | Calculated based upon average shares outstanding. |
| 4. | Total return calculations do not include any sales charges. Returns for periods of less than one year are not annualized. |
The accompanying notes are an integral part of these financial statements.
| | | | | | |
| Financial Highlights | | Wells Fargo Advantage Strategic Large Cap Growth Fund | | | 17 | |
(For a share outstanding throughout each period)
| | | | | | | | | | | | | | | | | | | | | | | | | | | | |
| | | Six Months Ended
January 31, 2012 (Unaudited) | | | Year Ended July 31, | | | Year Ended September 30, | |
| Class R | | | 2011 | | | 20101,2 | | | 20091 | | | 20081 | | | 20071 | | | 20061 | |
Net asset value, beginning of period | | $ | 31.39 | | | $ | 25.03 | | | $ | 24.30 | | | $ | 26.61 | | | $ | 34.13 | | | $ | 27.61 | | | $ | 26.79 | |
Net investment income (loss) | | | (0.07 | )3 | | | (0.06 | )3 | | | (0.06 | )3 | | | 0.05 | 3 | | | 0.03 | 3 | | | (0.06 | )3 | | | (0.07 | )3 |
Net realized and unrealized gains (losses) on investments | | | 0.36 | | | | 6.42 | | | | 0.95 | | | | (0.45 | ) | | | (6.82 | ) | | | 6.58 | | | | 0.89 | |
| | | | | | | | | | | | | | | | | | | | | | | | | | | | |
Total from investment operations | | | 0.29 | | | | 6.36 | | | | 0.89 | | | | (0.40 | ) | | | (6.79 | ) | | | 6.52 | | | | 0.82 | |
Distributions to shareholders from | | | | | | | | | | | | | | | | | | | | | | | | | | | | |
Net investment income | | | (0.08 | ) | | | 0.00 | | | | (0.16 | ) | | | (0.03 | ) | | | (0.02 | ) | | | 0.00 | | | | 0.00 | |
Net realized gains | | | 0.00 | | | | 0.00 | | | | 0.00 | | | | (1.88 | ) | | | (0.71 | ) | | | 0.00 | �� | | | 0.00 | |
| | | | | | | | | | | | | | | | | | | | | | | | | | | | |
Total distributions to shareholders | | | (0.08 | ) | | | 0.00 | | | | (0.16 | ) | | | (1.91 | ) | | | (0.73 | ) | | | 0.00 | | | | 0.00 | |
Net asset value, end of period | | $ | 31.60 | | | $ | 31.39 | | | $ | 25.03 | | | $ | 24.30 | | | $ | 26.61 | | | $ | 34.13 | | | $ | 27.61 | |
Total return4 | | | 0.87 | % | | | 25.49 | % | | | 3.65 | % | | | 0.81 | % | | | (20.32 | )% | | | 23.61 | % | | | 3.06 | % |
Ratios to average net assets (annualized) | | | | | | | | | | | | | | | | | | | | | | | | | | | | |
Gross expenses | | | 1.50 | % | | | 1.50 | % | | | 1.33 | % | | | 1.34 | % | | | 1.29 | % | | | 1.31 | % | | | 1.28 | % |
Net expenses | | | 1.32 | % | | | 1.32 | % | | | 1.32 | % | | | 1.34 | % | | | 1.29 | % | | | 1.31 | % | | | 1.28 | % |
Net investment income (loss) | | | (0.48 | )% | | | (0.21 | )% | | | (0.27 | )% | | | 0.23 | % | | | 0.10 | % | | | (0.20 | )% | | | (0.27 | )% |
Supplemental data | | | | | | | | | | | | | | | | | | | | | | | | | | | | |
Portfolio turnover rate | | | 63 | % | | | 165 | % | | | 105 | % | | | 182 | % | | | 139 | % | | | 97 | % | | | 97 | % |
Net assets, end of period (000’s omitted) | | | $3,649 | | | | $1,366 | | | | $437 | | | | $289 | | | | $9 | | | | $10 | | | | $6 | |
| 1. | After the close of business on July 16, 2010, the Fund acquired the net assets of Evergreen Strategic Growth Fund which became the accounting and performance survivor in the transaction. The information for the periods prior to July 19, 2010 is that of Class R of Evergreen Strategic Growth Fund. |
| 2. | For the ten months ended July 31, 2010. The Fund changed its fiscal year end from September 30 to July 31, effective July 31, 2010. |
| 3. | Calculated based upon average shares outstanding. |
| 4. | Returns for periods of less than one year are not annualized. |
The accompanying notes are an integral part of these financial statements.
| | | | |
| 18 | | Wells Fargo Advantage Strategic Large Cap Growth Fund | | Financial Highlights |
(For a share outstanding throughout each period)
| | | | | | | | | | | | |
| | | Six Months Ended
January 31, 2012 (Unaudited) | | | Year Ended July 31, | |
| Administrator Class | | | 2011 | | | 20101 | |
Net asset value, beginning of period | | $ | 31.85 | | | $ | 25.37 | | | $ | 25.37 | |
Net investment income | | | 0.00 | 2 | | | 0.05 | | | | 0.00 | |
Net realized and unrealized gains (losses) on investments | | | 0.34 | | | | 6.52 | | | | 0.00 | |
| | | | | | | | | | | | |
Total from investment operations | | | 0.34 | | | | 6.57 | | | | 0.00 | |
Distributions to shareholders from | | | | | | | | | | | | |
Net investment income | | | (0.08 | ) | | | (0.09 | ) | | | 0.00 | |
Net asset value, end of period | | $ | 32.11 | | | $ | 31.85 | | | $ | 25.37 | |
Total return3 | | | 1.06 | % | | | 25.94 | % | | | 0.00 | % |
Ratios to average net assets (annualized) | | | | | | | | | | | | |
Gross expenses | | | 1.08 | % | | | 1.06 | % | | | 0.00 | % |
Net expenses | | | 0.95 | % | | | 0.95 | % | | | 0.00 | % |
Net investment income | | | 0.08 | % | | | 0.12 | % | | | 0.00 | % |
Supplemental data | | | | | | | | | | | | |
Portfolio turnover rate | | | 63 | % | | | 165 | % | | | 105 | % |
Net assets, end of period (000’s omitted) | | | $2,412 | | | | $2,852 | | | | $10 | |
| 1. | For the period from July 30, 2010 (commencement of class operations) to July 31, 2010. |
| 2. | Amount is less than $0.005. |
| 3. | Returns for periods of less than one year are not annualized. |
The accompanying notes are an integral part of these financial statements.
| | | | | | |
| Financial Highlights | | Wells Fargo Advantage Strategic Large Cap Growth Fund | | | 19 | |
(For a share outstanding throughout each period)
| | | | | | | | | | | | | | | | | | | | | | | | | | | | |
| | | Six Months Ended
January 31, 2012 (unaudited) | | | Year Ended July 31, | | | Year Ended September 30, | |
| Institutional Class | | | 2011 | | | 20101,2 | | | 20091 | | | 20081 | | | 20071 | | | 20061 | |
Net asset value, beginning of period | | $ | 31.91 | | | $ | 25.37 | | | $ | 24.54 | | | $ | 26.88 | | | $ | 34.49 | | | $ | 27.83 | | | $ | 26.89 | |
Net investment income | | | 0.04 | | | | 0.10 | | | | 0.07 | | | | 0.20 | | | | 0.22 | | | | 0.12 | | | | 0.07 | |
Net realized and unrealized gains (losses) on investments | | | 0.33 | | | | 6.50 | | | | 0.94 | | | | (0.52 | ) | | | (6.91 | ) | | | 6.62 | | | | 0.89 | |
| | | | | | | | | | | | | | | | | | | | | | | | | | | | |
Total from investment operations | | | 0.37 | | | | 6.60 | | | | 1.01 | | | | (0.32 | ) | | | (6.69 | ) | | | 6.74 | | | | 0.96 | |
Distributions to shareholders from | | | | | | | | | | | | | | | | | | | | | | | | | | | | |
Net investment income | | | (0.10 | ) | | | (0.06 | ) | | | (0.18 | ) | | | (0.14 | ) | | | (0.21 | ) | | | (0.08 | ) | | | (0.02 | ) |
Net realized gains | | | 0.00 | | | | 0.00 | | | | 0.00 | | | | (1.88 | ) | | | (0.71 | ) | | | 0.00 | | | | 0.00 | |
| | | | | | | | | | | | | | | | | | | | | | | | | | | | |
Total distributions to shareholders | | | (0.10 | ) | | | (0.06 | ) | | | (0.18 | ) | | | (2.02 | ) | | | (0.92 | ) | | | (0.08 | ) | | | (0.02 | ) |
Net asset value, end of period | | $ | 32.18 | | | $ | 31.91 | | | $ | 25.37 | | | $ | 24.54 | | | $ | 26.88 | | | $ | 34.49 | | | $ | 27.83 | |
Total return3 | | | 1.12 | % | | | 26.11 | % | | | 4.14 | % | | | 1.27 | % | | | (19.91 | )% | | | 24.28 | % | | | 3.56 | % |
Ratios to average net assets (annualized) | | | | | | | | | | | | | | | | | | | | | | | | | | | | |
Gross expenses | | | 0.82 | % | | | 0.82 | % | | | 0.83 | % | | | 0.82 | % | | | 0.79 | % | | | 0.79 | % | | | 0.77 | % |
Net expenses | | | 0.80 | % | | | 0.80 | % | | | 0.83 | % | | | 0.82 | % | | | 0.79 | % | | | 0.79 | % | | | 0.77 | % |
Net investment income | | | 0.21 | % | | | 0.35 | % | | | 0.25 | % | | | 0.87 | % | | | 0.60 | % | | | 0.33 | % | | | 0.24 | % |
Supplemental data | | | | | | | | | | | | | | | | | | | | | | | | | | | | |
Portfolio turnover rate | | | 63 | % | | | 165 | % | | | 105 | % | | | 182 | % | | | 139 | % | | | 97 | % | | | 97 | % |
Net assets, end of period (000’s omitted) | | | $547,387 | | | | $547,645 | | | | $387,896 | | | | $442,736 | | | | $571,879 | | | | $978,930 | | | | $1,389,589 | |
| 1. | After the close of business on July 16, 2010, the Fund acquired the net assets of Evergreen Strategic Growth Fund which became the accounting and performance survivor in the transaction. The information for the periods prior to July 19, 2010 is that of Class I of Evergreen Strategic Growth Fund. |
| 2. | For the ten months ended July 31, 2010. The Fund changed its fiscal year end from September 30 to July 31, effective July 31, 2010. |
| 3. | Returns for periods of less than one year are not annualized. |
The accompanying notes are an integral part of these financial statements.
| | | | |
| 20 | | Wells Fargo Advantage Strategic Large Cap Growth Fund | | Notes to Financial Statements (Unaudited) |
1. ORGANIZATION
Wells Fargo Funds Trust (the “Trust”), a Delaware statutory trust organized on March 10, 1999, is an open-end management investment company registered under the Investment Company Act of 1940, as amended (the “1940 Act”). These financial statements report on Wells Fargo Advantage Strategic Large Cap Growth Fund (the “Fund”) which is a diversified series of the Trust.
2. SIGNIFICANT ACCOUNTING POLICIES
The following significant accounting policies, which are consistently followed in the preparation of the financial statements of the Fund, are in conformity with U.S. generally accepted accounting principles which require management to make estimates and assumptions that affect the reported amounts of assets and liabilities, disclosure of contingent assets and liabilities at the date of the financial statements, and the reported amounts of revenues and expenses during the reporting period. Actual results could differ from those estimates.
Securities valuation
Investments in equity securities are valued each business day as of the close of regular trading on the New York Stock Exchange, which is usually 4:00 p.m. (Eastern Time). Securities which are traded on a national or foreign securities exchange are valued at the last reported sales price, except that securities listed on The Nasdaq Stock Market, Inc. (“Nasdaq”) are valued at the Nasdaq Official Closing Price (“NOCP”), and if no NOCP is available, then at the last reported sales price. If no sales price is shown on the Nasdaq, the bid price will be used. In the absence of any sale of securities listed on the Nasdaq, and in the case of other securities (including U.S. Government obligations, but excluding debt securities maturing in 60 days or less), the price will be deemed “stale” and the valuations will be determined in accordance with the Fund’s Fair Value Procedures.
Investments in open-end mutual funds and non-registered investment companies are generally valued at net asset value.
Investments which are not valued using any of the methods discussed above, are valued at their fair value, as determined by procedures established in good faith and approved by the Board of Trustees.
Security loans
The Fund may lend its securities from time to time in order to earn additional income in the form of fees or interest on securities received as collateral or the investment of any cash received as collateral. The Fund continues to receive interest or dividends on the securities loaned. The Fund receives collateral in the form of cash or securities with a value at least equal to the value of the securities on loan. The value of the loaned securities is determined at the close of each business day and any additional required collateral is delivered to the Fund on the next business day. In a securities lending transaction, the net asset value of the Fund will be affected by an increase or decrease in the value of the securities loaned and by an increase or decrease in the value of the instrument in which collateral is invested. The amount of securities lending activity undertaken by the Fund fluctuates from time to time. In the event of default or bankruptcy by the borrower, the Fund may be prevented from recovering the loaned securities or gaining access to the collateral or may experience delays or costs in doing so. In addition, the investment of any cash collateral received may lose all or part of its value. The Fund has the right under the lending agreement to recover the securities from the borrower on demand.
The Fund lends its securities through an unaffiliated securities lending agent. Cash collateral received in connection with its securities lending transactions is invested in Wells Fargo Securities Lending Cash Investments, LLC (the “Cash Collateral Fund”). The Cash Collateral Fund is exempt from registration under Section 3(c)(7) of the 1940 Act and is managed by Wells Fargo Funds Management LLC (“Funds Management”) and is sub-advised by Wells Capital Management Incorporated (“Wells Capital Management”). Funds Management receives an advisory fee starting at 0.05% and declining to 0.01% as the average daily net assets of the Cash Collateral Fund increase. All of the fees received by Funds Management are paid to Wells Capital Management for its services as sub-adviser. The Cash Collateral Fund seeks to provide a positive return compared to the daily Fed Funds Open rate by investing in high-quality, U.S. dollar-denominated short-term money market instruments. Cash Collateral Fund investments are fair valued based upon the amortized cost valuation technique. Income earned from investment in the Cash Collateral Fund is included in securities lending income on the Statement of Operations.
| | | | | | |
| Notes to Financial Statements (Unaudited) | | Wells Fargo Advantage Strategic Large Cap Growth Fund | | | 21 | |
Security transactions and income recognition
Securities transactions are recorded on a trade date basis. Realized gains or losses are reported on the basis of identified cost of securities delivered.
Dividend income is recognized on the ex-dividend date.
Distributions to shareholders
Distributions to shareholders from net investment income and net realized gains, if any, are recorded on the ex-dividend date. Such distributions are determined in conformity with income tax regulations, which may differ from generally accepted accounting principles.
Federal and other taxes
The Fund intends to continue to qualify as a regulated investment company by distributing substantially all of its investment company taxable income and any net realized capital gains (after reduction for capital loss carryforwards) sufficient to relieve it from all, or substantially all, federal income taxes. Accordingly, no provision for federal income taxes was required.
The Fund’s income and federal excise tax returns and all financial records supporting those returns for the prior three fiscal years are subject to examination by the federal and Delaware revenue authorities.
Under the recently enacted Regulated Investment Company Modernization Act of 2010, the Fund is permitted to carry forward capital losses incurred in taxable years which began after December 22, 2010 for an unlimited period. However, any losses incurred are required to be utilized prior to the losses incurred in pre-enactment taxable years. As a result of this ordering rule, pre-enactment capital loss carryforwards may be more likely to expire unused. Additionally, post-enactment capital losses that are carried forward will retain their character as either short-term or long-term capital losses rather than being considered all short-term as under previous law.
As of July 31, 2011, the Fund had net capital loss carryforwards, which were available to offset future net realized capital gains, in the amount of $31,551,482 expiring in 2018.
Class allocations
The separate classes of shares offered by the Fund differ principally in applicable sales charges, distribution, shareholder servicing and administration fees. Shareholders of each class bear certain expenses that pertain to that particular class. All shareholders bear the common expenses of the Fund, earn income from the portfolio, and are allocated unrealized gains and losses pro rata based on the average daily net assets of each class, without distinction between share classes. Dividends are determined separately for each class based on income and expenses allocable to each class. Realized gains and losses are allocated to each class pro rata based upon the net assets of each class on the date realized. Differences in per share dividend rates generally result from the relative weightings of pro rata income and realized gain allocations and from differences in separate class expenses, including distribution, shareholder servicing and administration fees.
3. FAIR VALUATION MEASUREMENTS
Fair value measurements of investments are determined within a framework that has established a fair value hierarchy based upon the various data inputs utilized in determining the value of the Fund’s investments. The three-level hierarchy gives the highest priority to unadjusted quoted prices in active markets for identical assets or liabilities (Level 1) and the lowest priority to significant unobservable inputs (Level 3). The Fund’s investments are classified within the fair value hierarchy based on the lowest level of input that is significant to the fair value measurement. The inputs are summarized into three broad levels as follows:
| n | | Level 1 – quoted prices in active markets for identical securities |
| n | | Level 2 – other significant observable inputs (including quoted prices for similar securities, interest rates, prepayment speeds, credit risk, etc.) |
| n | | Level 3 – significant unobservable inputs (including the Fund’s own assumptions in determining the fair value of investments) |
The inputs or methodologies used for valuing securities are not necessarily an indication of the risk associated with investing in those securities.
| | | | |
| 22 | | Wells Fargo Advantage Strategic Large Cap Growth Fund | | Notes to Financial Statements (Unaudited) |
As of January 31, 2012, the inputs used in valuing the Fund’s assets, which are carried at fair value, were as follows:
| | | | | | | | | | | | | | | | |
| Investments in Securities | | Quoted Prices (Level 1) | | | Significant Other
Observable Inputs (Level 2) | | | Significant Unobservable Inputs (Level 3) | | | Total | |
Equity securities | | | | | | | | | | | | | | | | |
Common stocks | | $ | 579,508,569 | | | $ | 0 | | | $ | 0 | | | $ | 579,508,569 | |
Short-term investments | | | | | | | | | | | | | | | | |
Investment companies | | | 8,552,438 | | | | 30,507,698 | | | | 0 | | | | 39,060,136 | |
| | | $ | 588,061,007 | | | $ | 30,507,698 | | | $ | 0 | | | $ | 618,568,705 | |
Further details on the major security types listed above can be found in the Portfolio of Investments.
Transfers in and transfers out are recognized at the end of the reporting period. For the six months ended January 31, 2012, the Fund did not have any significant transfers into/out of Level 1 and Level 2.
4. TRANSACTIONS WITH AFFILIATES AND OTHER EXPENSES
Advisory fee
The Trust has entered into an advisory contract with Funds Management, an indirect wholly owned subsidiary of Wells Fargo & Company (“Wells Fargo”). The adviser is responsible for implementing investment policies and guidelines and for supervising the sub-adviser, who is responsible for day-to-day portfolio management of the Fund.
Pursuant to the contract, Funds Management is entitled to receive an annual advisory fee starting at 0.65% and declining to 0.55% as the average daily net assets of the Fund increase. For the six months ended January 31, 2012, the advisory fee was equivalent to an annual rate of 0.65% of the Fund’s average daily net assets.
Funds Management may retain the services of certain sub-advisers to provide daily portfolio management to the Fund. The fees related to sub-advisory services are borne directly by Funds Management and do not increase the overall fees paid by the Fund. Wells Capital Management, an affiliate of Funds Management, is the sub-adviser to the Fund and is entitled to receive a fee from Funds Management at an annual rate starting at 0.35% and declining to 0.15% as the average daily net assets of the Fund increase.
Administration and transfer agent fees
The Trust has entered into an administration agreement with Funds Management. Under this agreement, for providing administrative services, which includes paying fees and expenses for services provided by the transfer agent, sub-transfer agents, omnibus account servicers and record-keepers, Funds Management is entitled to receive from the Fund an annual fund level administration fee starting at 0.05% and declining to 0.03% as the average daily net assets of the Fund increase and a class level administration fee which is calculated based on the average daily net assets of each class as follows:
| | | | |
| | | Class Level Administration Fee | |
Class A, Class C, Class R | | | 0.26 | % |
Administrator Class | | | 0.10 | |
Institutional Class | | | 0.08 | |
Funds Management has contractually waived and/or reimbursed advisory and administration fees to the extent necessary to maintain certain net operating expense ratios for the Fund. Waiver of fees and/or reimbursement of expenses by Funds Management were made first from fund level expenses on a proportionate basis and then from class specific expenses. Funds Management has committed through July 18, 2013 to waive fees and/or reimburse expenses to the extent necessary to cap the Fund’s expenses at 1.07% for Class A, 1.82% for Class C, 1.32% for Class R, 0.95% for Administrator Class and 0.80% for Institutional Class.
| | | | | | |
| Notes to Financial Statements (Unaudited) | | Wells Fargo Advantage Strategic Large Cap Growth Fund | | | 23 | |
Distribution fees
The Trust has adopted a Distribution Plan for Class C and Class R shares of the Fund pursuant to Rule 12b-1 under the 1940 Act. Distribution fees are charged to Class C and Class R shares and paid to Wells Fargo Funds Distributor, LLC, the principal underwriter, at an annual rate of 0.75% of the average daily net assets of Class C shares and 0.25% of the average daily net assets of Class R shares.
For the six months ended January 31, 2012, Wells Fargo Funds Distributor, LLC received $435 from the sale of Class A shares and $102 in contingent deferred sales charges from redemptions of Class C shares.
Shareholder servicing fees
The Trust has entered into contracts with one or more shareholder servicing agents, whereby Class A, Class C, Class R and Administrator Class of the Fund is charged a fee at an annual rate of 0.25% of the average daily net assets of each respective class.
A portion of these total shareholder servicing fees were paid to affiliates of Wells Fargo.
5. INVESTMENT PORTFOLIO TRANSACTIONS
Purchases and sales of investments, excluding U.S. Government obligations (if any) and short-term securities (securities with maturities of one year or less at purchase date), for the six months ended January 31, 2012 were $338,717,811 and $335,826,396, respectively.
6. BANK BORROWINGS
The Trust (excluding the money market funds) and Wells Fargo Variable Trust are parties to a $150,000,000 revolving credit agreement with State Street Bank and Trust Company, whereby the Fund is permitted to use bank borrowings for temporary or emergency purposes, such as to fund shareholder redemption requests. Interest under the credit agreement is charged to the Fund based on a borrowing rate equal to the higher of the Federal Funds rate in effect on that day plus 1.25% or the overnight LIBOR rate in effect on that day plus 1.25%. In addition, an annual commitment fee equal to 0.10% of the unused balance is allocated to each participating fund. Prior to September 6, 2011, the revolving credit agreement was for $125,000,000 and the annual commitment fee paid by the Fund was 0.125% of the unused balance. For the six months ended January 31, 2012, the Fund paid $285 in commitment fees.
For the six months ended January 31, 2012, there were no borrowings by the Fund under the agreement.
7. INDEMNIFICATION
Under the Trust’s organizational documents, the officers and directors are indemnified against certain liabilities that may arise out of performance of their duties to the Trust. Additionally, in the normal course of business, the Trust may enter into contracts with service providers that contain a variety of indemnification clauses. The Trust’s maximum exposure under these arrangements is dependent on future claims that may be made against the Fund and, therefore, cannot be estimated.
8. NEW ACCOUNTING PRONOUNCEMENTS
In May 2011, the Financial Accounting Standards Board (“FASB”) issued Accounting Standards Update (“ASU”) No. 2011-04 “Amendments to Achieve Common Fair Value Measurement and Disclosure Requirements in U.S. GAAP and IFRSs”. ASU No. 2011-04 amends FASB ASC Topic 820, Fair Value Measurements and Disclosures, to establish common requirements for measuring fair value and for disclosing information about fair value measurements in accordance with GAAP. The ASU is effective prospectively for interim and annual periods beginning after December 15, 2011. Management expects that adoption of the ASU will result in additional disclosures in the financial statements, as applicable.
In April 2011, FASB issued ASU No. 2011-03 “Reconsideration of Effective Control for Repurchase Agreements”. ASU No. 2011-03 amends FASB ASC Topic 860, Transfers and Servicing, specifically the criteria required to determine whether a repurchase agreement (repo) and similar agreements should be accounted for as sales of financial assets or secured borrowings with commitments. ASU No. 2011-03 changes the assessment of effective control by focusing on the transferor’s contractual rights and obligations and removing the criterion to assess its ability to exercise those rights or honor those obligations. This could result in changes to the way entities account for certain transactions including
| | | | |
| 24 | | Wells Fargo Advantage Strategic Large Cap Growth Fund | | Notes to Financial Statements (Unaudited) |
repurchase agreements, mortgage dollar rolls and reverse repurchase agreements. The ASU will become effective on a prospective basis for new transfers and modifications to existing transactions as of the beginning of the first interim or annual period beginning on or after December 15, 2011. Management has evaluated the impact of adopting the ASU and expects no significant changes.
9. REORGANIZATION
At a regular meeting of the Board of Trustees held on February 7-8, 2012, the Trustees of the Fund approved a Plan of Reorganization (the “Plan”). Under the Plan, Wells Fargo Advantage Large Cap Growth Fund will acquire the assets and assume the liabilities of the Fund in exchange for shares of Wells Fargo Advantage Large Cap Growth Fund.
A Special Meeting of Shareholders of the Fund will be held on June 8, 2012 to consider and vote on the Plan. On or about March 30, 2012, materials for this meeting will be mailed to shareholders of record on February 29, 2012.
| | | | | | |
| Other Information (Unaudited) | | Wells Fargo Advantage Strategic Large Cap Growth Fund | | | 25 | |
PROXY VOTING INFORMATION
A description of the policies and procedures that the Fund uses to determine how to vote proxies relating to portfolio securities is available without charge, upon request, by calling 1-800-222-8222, visiting our Web site at wellsfargoadvantagefunds.com, or visiting the SEC Web site at sec.gov. Information regarding how the Fund voted proxies relating to portfolio securities during the most recent 12-month period ended June 30 is available without charge on the Fund’s Web site at wellsfargoadvantagefunds.com or by visiting the SEC Web site at sec.gov.
PORTFOLIO HOLDINGS INFORMATION
The complete portfolio holdings for the Fund are publicly available on the Fund’s Web site (wellsfargoadvantagefunds.com) on a monthly, 30-day or more delayed basis. In addition, top ten holdings information for the Fund is publicly available on the Fund’s Web site on a monthly, seven-day or more delayed basis. The Fund files its complete schedule of portfolio holdings with the SEC for the first and third quarters of each fiscal year on Form N-Q, which is available without charge by visiting the SEC Web site at sec.gov. In addition, the Fund’s Form N-Q may be reviewed and copied at the SEC’s Public Reference Room in Washington, DC, and at regional offices in New York City, at 233 Broadway, and in Chicago, at 175 West Jackson Boulevard, Suite 900. Information about the Public Reference Room may be obtained by calling 1-800-SEC-0330.
| | | | |
| 26 | | Wells Fargo Advantage Strategic Large Cap Growth Fund | | Other Information (Unaudited) |
BOARD OF TRUSTEES
The following table provides basic information about the Board of Trustees (the “Trustees”) of the Trust and Officers of the Trust. This table should be read in conjunction with the Prospectus and the Statement of Additional Information1 of the Fund. Each of the Trustees and Officers listed below acts in identical capacities for the Wells Fargo Advantage family of funds, which consists of 137 funds comprising the Wells Fargo Funds Trust, Wells Fargo Variable Trust, Wells Fargo Master Trust and four closed-end funds (collectively the “Fund Complex”). All of the Trustees are also Members of the Audit and Governance Committees of each Trust in the Fund Complex. The mailing address of each Trustee and Officer is 525 Market Street, 12th Floor, San Francisco, CA 94105. Each Trustee and Officer serves an indefinite term, however, each Trustee serves such term until reaching the mandatory retirement age established by the Trustees.
Independent Trustees
| | | | | | |
Name and Year of Birth | | Position Held and Length of Service | | Principal Occupations During Past Five Years | | Other Directorships During
Past Five Years |
Peter G. Gordon
(Born 1942) | | Trustee, since 1998; Chairman, since 2005 (Lead Trustee since 2001) | | Co-Founder, Retired Chairman, President and CEO of Crystal Geyser Water Company. Trustee Emeritus, Colby College | | Asset Allocation Trust |
Isaiah Harris, Jr.
(Born 1952) | | Trustee, since 2009 | | Retired. Prior thereto, President and CEO of BellSouth Advertising and Publishing Corp. from 2005 to 2007, President and CEO of BellSouth Enterprises from 2004 to 2005 and President of BellSouth Consumer Services from 2000 to 2003. Emeritus member of the Iowa State University Foundation Board of Governors. Emeritus Member of the Advisory Board of Iowa State University School of Business. Mr. Harris is a certified public accountant. | | CIGNA Corporation; Deluxe Corporation; Asset Allocation Trust |
Judith M. Johnson
(Born 1949) | | Trustee, since 2008 | | Retired. Prior thereto, Chief Executive Officer and Chief Investment Officer of Minneapolis Employees Retirement Fund from 1996 to 2008. Ms. Johnson is an attorney, certified public accountant and a certified managerial accountant. | | Asset Allocation Trust |
Leroy Keith, Jr.
(Born 1939) | | Trustee, since 2010 | | Chairman, Bloc Global Services (development and construction). Trustee of the Evergreen Funds from 1983 to 2010. Former Managing Director, Almanac Capital Management (commodities firm), former Partner, Stonington Partners, Inc. (private equity fund), former Director, Obagi Medical Products Co. and former Director, Lincoln Educational Services. | | Trustee, Virtus Fund Complex (consisting of 40 portfolios as of 12/31/11); Asset Allocation Trust |
David F. Larcker
(Born 1950) | | Trustee, since 2009 | | James Irvin Miller Professor of Accounting at the Graduate School of Business, Stanford University, Director of Corporate Governance Research Program and Senior Faculty of The Rock Center for Corporate Governance since 2006. From 2005 to 2008, Professor of Accounting at the Graduate School of Business, Stanford University. Prior thereto, Ernst & Young Professor of Accounting at The Wharton School, University of Pennsylvania from 1985 to 2005. | | Asset Allocation Trust |
Olivia S. Mitchell
(Born 1953) | | Trustee, since 2006 | | International Foundation of Employee Benefit Plans Professor, Wharton School of the University of Pennsylvania since 1993. Director of Wharton’s Pension Research Council and Boettner Center on Pensions & Retirement Research, and Research Associate at the National Bureau of Economic Research. Previously, Cornell University Professor from 1978 to 1993. | | Asset Allocation Trust |
| | | | | | |
| Other Information (Unaudited) | | Wells Fargo Advantage Strategic Large Cap Growth Fund | | | 27 | |
| | | | | | |
Name and Year of Birth | | Position Held and Length of Service | | Principal Occupations During Past Five Years | | Other Directorships During
Past Five Years |
Timothy J. Penny
(Born 1951) | | Trustee, since 1996 | | President and CEO of Southern Minnesota Initiative Foundation, a non-profit organization, since 2007 and Senior Fellow at the Humphrey Institute Policy Forum at the University of Minnesota since 1995. Member of the Board of Trustees of NorthStar Education Finance, Inc., a non-profit organization, since 2007. | | Asset Allocation Trust |
Michael S. Scofield
(Born 1943) | | Trustee, since 2010 | | Served on the Investment Company Institute’s Board of Governors and Executive Committee from 2008-2011 as well the Governing Council of the Independent Directors Council from 2006-2011 and the Independent Directors Council Executive Committee from 2008-2011. Chairman of the IDC from 2008-2010. Institutional Investor (Fund Directions) Trustee of Year in 2007. Trustee of the Evergreen Funds (and its predecessors) from 1984 to 2010. Chairman of the Evergreen Funds from 2000-2010. Former Trustee of the Mentor Funds. Retired Attorney, Law Offices of Michael S. Scofield and former Director and Chairman, Branded Media Corporation (multi-media branding company). | | Asset Allocation Trust |
Donald C. Willeke
(Born 1940) | | Trustee, since 1996 | | Principal of the law firm of Willeke & Daniels. General Counsel of the Minneapolis Employees Retirement Fund from 1984 until its consolidation into the Minnesota Public Employees Retirement Association on June 30, 2010. Director and Vice Chair of The Free Trust (non-profit corporation). Director of the American Chestnut Foundation (non-profit corporation). | | Asset Allocation Trust |
Officers
| | | | | | |
Name and Year of Birth | | Position Held and
Length of Service | | Principal Occupations During Past Five Years | | |
Karla M. Rabusch
(Born 1959) | | President, since 2003 | | Executive Vice President of Wells Fargo Bank, N.A. and President of Wells Fargo Funds Management, LLC since 2003. Senior Vice President and Chief Administrative Officer of Wells Fargo Funds Management, LLC from 2001 to 2003. | | |
C. David Messman
(Born 1960) | | Secretary, since 2000; Chief Legal Counsel, since 2003 | | Senior Vice President and Secretary of Wells Fargo Funds Management, LLC since 2001. Vice President and Managing Senior Counsel of Wells Fargo Bank, N.A. since 1996. | | |
Kasey Phillips
(Born 1970) | | Treasurer, since 2009 | | Senior Vice President of Wells Fargo Funds Management, LLC since 2009. Senior Vice President of Evergreen Investment Management Company, LLC from 2006 to 2010. Treasurer of the Evergreen Funds from 2005 to 2010. | | |
David Berardi
(Born 1975) | | Assistant Treasurer, since 2009 | | Vice President of Wells Fargo Funds Management, LLC since 2009. Vice President of Evergreen Investment Management Company, LLC from 2008 to 2010. Assistant Vice President of Evergreen Investment Services, Inc. from 2004 to 2008. Manager of Fund Reporting and Control for Evergreen Investment Management Company, LLC from 2004 to 2010. | | |
Jeremy DePalma
(Born 1974) | | Assistant Treasurer, since 2009 | | Senior Vice President of Wells Fargo Funds Management, LLC since 2009. Senior Vice President of Evergreen Investment Management Company, LLC from 2008 to 2010. Vice President, Evergreen Investment Services, Inc. from 2004 to 2007. Head of the Fund Reporting and Control Team within Fund Administration from 2005 to 2010. | | |
Debra Ann Early
(Born 1964) | | Chief Compliance Officer, since 2007 | | Chief Compliance Officer of Wells Fargo Funds Management, LLC since 2007. Chief Compliance Officer of Parnassus Investments from 2005 to 2007. Chief Financial Officer of Parnassus Investments from 2004 to 2007 and Senior Audit Manager of PricewaterhouseCoopers LLP from 1998 to 2004. | | |
| 1. | The Statement of Additional Information includes additional information about the Trustees and is available, without charge, upon request, by calling 1-800-222-8222 or by visiting the Web site at wellsfargoadvantagefunds.com. |
| | | | |
| 28 | | Wells Fargo Advantage Strategic Large Cap Growth Fund | | List of Abbreviations |
The following is a list of common abbreviations for terms and entities which may have appeared in this report.
| ACB | — Agricultural Credit Bank |
| ADR | — American Depository Receipt |
| ADS | — American Depository Shares |
| AGC-ICC | — Assured Guaranty Corporation - Insured Custody Certificates |
| AGM | — Assured Guaranty Municipal |
| AMBAC | — American Municipal Bond Assurance Corporation |
| AMT | — Alternative Minimum Tax |
| BAN | — Bond Anticipation Notes |
| BHAC | — Berkshire Hathaway Assurance Corporation |
| CAB | — Capital Appreciation Bond |
| CCAB | — Convertible Capital Appreciation Bond |
| CDA | — Community Development Authority |
| CDO | — Collateralized Debt Obligation |
| COP | — Certificate of Participation |
| DRIVER | — Derivative Inverse Tax-Exempt Receipts |
| DW&P | — Department of Water & Power |
| DWR | — Department of Water Resources |
| ECFA | — Educational & Cultural Facilities Authority |
| EDA | — Economic Development Authority |
| EDFA | — Economic Development Finance Authority |
| ETF | — Exchange-Traded Fund |
| FFCB | — Federal Farm Credit Bank |
| FGIC | — Financial Guaranty Insurance Corporation |
| FHA | — Federal Housing Authority |
| FHLB | — Federal Home Loan Bank |
| FHLMC | — Federal Home Loan Mortgage Corporation |
| FNMA | — Federal National Mortgage Association |
| GDR | — Global Depository Receipt |
| GNMA | — Government National Mortgage Association |
| HCFR | — Healthcare Facilities Revenue |
| HEFA | — Health & Educational Facilities Authority |
| HEFAR | — Higher Education Facilities Authority Revenue |
| HFA | — Housing Finance Authority |
| HFFA | — Health Facilities Financing Authority |
| IBC | — Insured Bond Certificate |
| IDA | — Industrial Development Authority |
| IDAG | — Industrial Development Agency |
| IDR | — Industrial Development Revenue |
| KRW | — Republic of Korea Won |
| LIBOR | — London Interbank Offered Rate |
| LLC | — Limited Liability Company |
| LLP | — Limited Liability Partnership |
| MBIA | — Municipal Bond Insurance Association |
| MFHR | — Multi-Family Housing Revenue |
| MSTR | — Municipal Securities Trust Receipts |
| MUD | — Municipal Utility District |
| NATL-RE | — National Public Finance Guarantee Corporation |
| PCFA | — Pollution Control Finance Authority |
| PCR | — Pollution Control Revenue |
| PFA | — Public Finance Authority |
| PFFA | — Public Facilities Financing Authority |
| PFOTER | — Puttable Floating Option Tax-Exempt Receipts |
| plc | — Public Limited Company |
| PUTTER | — Puttable Tax-Exempt Receipts |
| R&D | — Research & Development |
| RDA | — Redevelopment Authority |
| RDFA | — Redevelopment Finance Authority |
| REIT | — Real Estate Investment Trust |
| ROC | — Reset Option Certificates |
| SAVRS | — Select Auction Variable Rate Securities |
| SBA | — Small Business Authority |
| SFHR | — Single Family Housing Revenue |
| SFMR | — Single Family Mortgage Revenue |
| SPDR | — Standard & Poor’s Depositary Receipts |
| TAN | — Tax Anticipation Notes |
| TIPS | — Treasury Inflation-Protected Securities |
| TRAN | — Tax Revenue Anticipation Notes |
| TCR | — Transferable Custody Receipts |
| TTFA | — Transportation Trust Fund Authority |
| TVA | — Tennessee Valley Authority |
| XLCA | — XL Capital Assurance |
This page is intentionally left blank.
This page is intentionally left blank.


FOR MORE INFORMATION
More information about Wells Fargo Advantage Funds is available free upon request. To obtain literature, please write, e-mail, visit the Fund’s Web site, or call:
Wells Fargo Advantage Funds
P.O. Box 8266
Boston, MA 02266-8266
E-mail: wfaf@wellsfargo.com
Web site: wellsfargoadvantagefunds.com
Individual investors: 1-800-222-8222
Retail investment professionals: 1-888-877-9275
Institutional investment professionals: 1-866-765-0778
This report and the financial statements contained herein are submitted for the general information of the shareholders of Wells Fargo Advantage Funds. If this report is used for promotional purposes, distribution of the report must be accompanied or preceded by a current prospectus. For a prospectus containing more complete information, including charges and expenses, call 1-800-222-8222 or visit the Fund’s Web site at wellsfargoadvantagefunds.com. Please consider the investment objectives, risks, charges, and expenses of the investment carefully before investing. This and other information about Wells Fargo Advantage Funds can be found in the current prospectus. Read the prospectus carefully before you invest or send money.
Wells Fargo Funds Management, LLC, a wholly owned subsidiary of Wells Fargo & Company, provides investment advisory and administrative services for Wells Fargo Advantage Funds. Other affiliates of Wells Fargo & Company provide subadvisory and other services for the Funds. The Funds are distributed by Wells Fargo Funds Distributor, LLC, Member FINRA/SIPC, an affiliate of Wells Fargo & Company.
NOT FDIC INSURED ¡ NO BANK GUARANTEE ¡ MAY LOSE VALUE
© 2012 Wells Fargo Funds Management, LLC. All rights reserved.
| | |
 | | 207953 03-12 SA213/SAR213 1-12 |
ITEM 2. CODE OF ETHICS
Not required in this filing
ITEM 3. AUDIT COMMITTEE FINANCIAL EXPERT
Not required in this filing.
ITEM 4. PRINCIPAL ACCOUNTANT FEES AND SERVICES
Not required in this filing.
ITEM 5. AUDIT COMMITTEE OF LISTED REGISTRANTS
Not required in this filing.
ITEM 6. SCHEDULE OF INVESTMENTS
The Schedule of Investments is included as part of the report to shareholders filed under Item 1 of this Form.
ITEM 7. DISCLOSURE OF PROXY VOTING POLICIES AND PROCEDURES FOR CLOSED-END MANAGEMENT INVESTMENT COMPANIES
Not applicable.
ITEM 8. PORTFOLIO MANAGERS OF CLOSED-END MANAGEMENT INVESTMENT COMPANIES
Not applicable.
ITEM 9. PURCHASES OF EQUITY SECURITIES BY CLOSED-END MANAGEMEENT INVESTMENT COMPANY AND AFFILIATED PURCHASES
Not applicable.
ITEM 10. SUBMISSION OF MATTERS TO A VOTE OF SECURITY HOLDERS
The Governance Committee (the “Committee”) of the Board of Trustees of the registrant (the “Trust”) has adopted procedures by which a shareholder of any series of the Trust may submit properly a nominee recommendation for the Committee’s consideration.
The shareholder must submit any such recommendation (a “Shareholder Recommendation”) in writing to the Trust, to the attention of the Trust’s Secretary, at the address of the principal executive offices of the Trust.
The Shareholder Recommendation must be delivered to, or mailed and received at, the principal executive offices of the Trust not less than forty-five (45) calendar days nor more than seventy-five (75) calendar days prior to the date of the Committee meeting at which the nominee would be considered.
The Shareholder Recommendation must include: (i) a statement in writing setting forth (A) the name, age, date of birth, business address, residence address and nationality of the person recommended by the shareholder (the “candidate”); (B) the series (and, if applicable, class) and number of all shares of the Trust owned of record or beneficially by the candidate, as reported to such shareholder by the candidate; (C) any other information regarding the candidate called for with respect to director nominees by paragraphs (a), (d), (e) and (f) of Item 401 of Regulation S-K or paragraph (b) of Item 22 of Rule 14a-101 (Schedule 14A) under the Securities Exchange Act of 1934, as amended (the “Exchange Act”), adopted by the Securities and Exchange Commission (or the corresponding provisions of any regulation or rule subsequently adopted by the Securities and Exchange Commission or any successor agency applicable to the Trust); (D) any other information regarding the candidate that would be required to be disclosed if the candidate were a nominee in a proxy statement or other filing required to be made in connection with solicitation of proxies for election of directors pursuant to Section 14 of the Exchange Act and the rules and regulations promulgated thereunder; and (E) whether the recommending shareholder believes that the candidate is or will be an “interested person” of the Trust (as defined in the Investment Company Act of 1940, as amended) and, if not an “interested person,” information regarding the candidate that will be sufficient for the Trust to make such determination; (ii) the written and signed consent of the candidate to be named as a nominee and to serve as a Trustee if elected; (iii) the recommending shareholder’s name as it appears on the Trust’s books; (iv) the series (and, if applicable, class) and number of all shares of the Trust owned beneficially and of record by the recommending shareholder; and (v) a description of all arrangements or understandings between the recommending shareholder and the candidate and any other person or persons (including their names) pursuant to which the recommendation is being made by the recommending shareholder. In addition, the Committee may require the candidate to interview in person and furnish such other information as it may reasonably require or deem necessary to determine the eligibility of such candidate to serve as a Trustee of the Trust.
ITEM 11. CONTROLS AND PROCEDURES
(a) The President and Treasurer have concluded that the Wells Fargo Funds Trust (the “Trust”) disclosure controls and procedures (as defined in Rule 30a-3(c) under the Investment Company Act of 1940) provide reasonable assurances that material information relating to the Trust is made known to them by the appropriate persons, based on their evaluation of these controls and procedures as of a date within 90 days of the filing of this report.
(b) There were no significant changes in the Trust’s internal controls over financial reporting (as defined in Rule 30a-3(d) under the Investment Company Act of 1940) that occurred during the second quarter of the period covered by this report that materially affected, or is reasonably likely to materially affect, the registrant’s internal control over financial reporting.
ITEM 12. EXHIBITS
(a)(1) Not required in this filing.
(a)(2) Certification pursuant to Rule 30a-2(a) under the Investment Company Act of 1940 (17 CFR 270.30a-2(a)) is filed and attached hereto as Exhibit 99.CERT.
(a)(3) Not applicable.
(b) Certification pursuant to Rule 30a-2(b) under the Investment Company Act of 1940 (17 CFR 270.30a-2(b)) is filed and attached hereto as Exhibit 99.906CERT.
SIGNATURES
Pursuant to the requirements of the Securities Exchange Act of 1934 and the Investment Company Act of 1940, the registrant has duly caused this report to be signed on its behalf by the undersigned, thereunto duly authorized.
| | |
| Wells Fargo Funds Trust |
| |
| By: | | |
| | /s/ Karla M. Rabusch |
| |
| | Karla M. Rabusch |
| | President |
|
| Date: March 26, 2012 |
Pursuant to the requirements of the Securities Exchange Act of 1934 and the Investment Company Act of 1940, this report has been signed below by the following persons on behalf of the registrant and in the capacities and on the date indicated.
| | |
| By: | | |
| | /s/ Karla M. Rabusch |
| |
| | Karla M. Rabusch |
| | President |
|
| Date: March 26, 2012 |
| |
| By: | | |
| | /s/ Kasey L. Phillips |
| |
| | Kasey L. Phillips |
| | Treasurer |
|
| Date: March 26, 2012 |