
UNITED STATES
SECURITIES AND EXCHANGE COMMISSION
Washington, D.C. 20549
FORM N-CSRS
CERTIFIED SHAREHOLDER REPORT OF REGISTERED
MANAGEMENT INVESTMENT COMPANIES
Investment Company Act file number: 811-09253
Wells Fargo Funds Trust
(Exact name of registrant as specified in charter)
525 Market St., San Francisco, CA 94105
(Address of principal executive offices) (Zip code)
C. David Messman
Wells Fargo Funds Management, LLC
525 Market St., San Francisco, CA 94105
(Name and address of agent for service)
Registrant’s telephone number, including area code: 800-222-8222
Date of fiscal year end: August 31, 2011
Date of reporting period: February 29, 2012
ITEM 1. REPORT TO SHAREHOLDERS

Wells Fargo Advantage
Adjustable Rate Government Fund

Semi-Annual Report
February 29, 2012

Reduce clutter. Save trees.
Sign up for electronic delivery of prospectuses and shareholder reports at wellsfargo.com/advantagedelivery
Contents
The views expressed and any forward-looking statements are as of February 29, 2012, unless otherwise noted, and are those of the Fund managers and/or Wells Fargo Funds Management, LLC. Discussions of individual securities, or the markets generally, or any Wells Fargo Advantage Fund are not intended as individual recommendations. Future events or results may vary significantly from those expressed in any forward-looking statements; the views expressed are subject to change at any time in response to changing circumstances in the market. Wells Fargo Funds Management, LLC, disclaims any obligation to publicly update or revise any views expressed or forward-looking statements.
NOT FDIC INSURED ¡ NO BANK GUARANTEE ¡ MAY LOSE VALUE

WELLS FARGO INVESTMENT HISTORY
| | |
| |
| 1932 | | Keystone creates one of the first mutual fund families. |
| |
| 1971 | | Wells Fargo & Company introduces one of the first institutional index funds. |
| |
| 1978 | | Wells Fargo applies Markowitz and Sharpe’s research on Modern Portfolio Theory to introduce one of the industry’s first Tactical Asset Allocation (TAA) models in institutional separately managed accounts. |
| |
| 1984 | | Wells Fargo Stagecoach Funds launches its first asset allocation fund. |
| |
| 1989 | | The Tactical Asset Allocation (TAA) Model is first applied to Wells Fargo’s asset allocation mutual funds. |
| |
| 1994 | | Wells Fargo introduces the LifePath Funds, one of the first suites of target date funds (now the Wells Fargo Advantage Dow Jones Target Date FundsSM). |
| |
| 1996 | | Evergreen Investments and Keystone Funds merge. |
| |
| 1997 | | Wells Fargo launches Wells Fargo Advantage WealthBuilder PortfoliosSM, a fund-of-funds suite of products that includes the use of quantitative models to shift assets among investment styles. |
| |
| 1999 | | Norwest Advantage Funds and Stagecoach Funds are reorganized into Wells Fargo Funds after the merger of Norwest and Wells Fargo. |
| |
| 2002 | | Evergreen Retail and Evergreen Institutional companies form the umbrella asset management company, Evergreen Investments. |
| |
| 2005 | | The integration of Strong Funds with Wells Fargo Funds creates Wells Fargo Advantage Funds, resulting in one of the top 20 mutual fund companies in the United States. |
| |
| 2006 | | Wells Fargo Advantage Funds relaunches the target date product line as Wells Fargo Advantage Dow Jones Target Date Funds. |
| |
| 2010 | | The mergers and reorganizations of Evergreen and Wells Fargo Advantage mutual funds are completed, unifying the families under the brand of Wells Fargo Advantage Funds. |
Wells Fargo Advantage Funds®
Wells Fargo Advantage Funds skillfully guides institutions, financial advisors, and individuals through the investment terrain to help them reach their financial objectives. Everything we do on behalf of investors is backed by our unique combination of qualifications.
Strength
Our organization is built on the standards of integrity and service established by our parent company—Wells Fargo & Company—more than 150 years ago. And, because we’re part of a highly diversified financial enterprise, we offer the depth of resources to help investors succeed.
Expertise
Our multi-boutique model offers investors access to the independent thinking of premier investment managers that have been chosen for their time-tested strategies. While each team specializes in a specific investment strategy, collectively they provide investors a wide choice of distinct investment styles. Our dedication to investment excellence doesn’t end with our expertise in manager selection—risk management, analysis, and rigorous ongoing review seek to ensure each manager’s investment process remains consistent.
Partnership
Our collaborative approach is built around understanding the needs and goals of our clients. By adhering to core principles of sound judgment and steady guidance, we support you through every stage of the investment decision process.
Carefully consider a fund’s investment objectives, risks, charges, and expenses before investing. For a current prospectus and, if available, a summary prospectus, containing this and other information, visit wellsfargoadvantagefunds.com. Read it carefully before investing.
Wells Fargo Funds Management, LLC, a wholly owned subsidiary of Wells Fargo & Company, provides investment advisory and administrative services for Wells Fargo Advantage Funds®. Other affiliates of Wells Fargo & Company provide subadvisory and other services for the Funds. The Funds are distributed by Wells Fargo Funds Distributor, LLC, Member FINRA/SIPC, an affiliate of Wells Fargo & Company.
“Dow Jones®” and “Dow Jones Target Date IndexesSM” are service marks of Dow Jones Trademark Holdings, LLC (“Dow Jones”), have been licensed to CME Group Index Services LLC (“CME Indexes”) and have been sublicensed for use for certain purposes by Global Index Advisors, Inc, and Wells Fargo Funds Management, LLC. The Wells Fargo Advantage Dow Jones Target Date FundsSM based on the Dow Jones Target Date IndexesSM, are not sponsored, endorsed, sold or promoted by Dow Jones, CME Indexes or their respective affiliates and none of them makes any representation regarding the advisability of investing in such product(s).
NOT FDIC INSURED ¡ NO BANK GUARANTEE ¡ MAY LOSE VALUE
Not part of the semi-annual report.
Wells Fargo Advantage Funds offers more than 110 mutual funds across a wide range of asset classes, representing over $218 billion in assets under management, as of February 29, 2012.
| | | | |
| Equity Funds | | | | |
Asia Pacific Fund | | Equity Value Fund | | Precious Metals Fund |
C&B Large Cap Value Fund | | Global Opportunities Fund | | Premier Large Company Growth Fund |
C&B Mid Cap Value Fund | | Growth Fund | | Small Cap Opportunities Fund |
Capital Growth Fund | | Index Fund | | Small Cap Value Fund |
Common Stock Fund | | International Equity Fund | | Small Company Growth Fund |
Disciplined U.S. Core Fund | | International Value Fund | | Small Company Value Fund |
Discovery Fund† | | Intrinsic Small Cap Value Fund | | Small/Mid Cap Core Fund |
Diversified Equity Fund | | Intrinsic Value Fund | | Small/Mid Cap Value Fund |
Diversified International Fund | | Intrinsic World Equity Fund | | Special Mid Cap Value Fund |
Diversified Small Cap Fund | | Large Cap Core Fund | | Special Small Cap Value Fund |
Emerging Growth Fund | | Large Cap Growth Fund | | Specialized Technology Fund |
Emerging Markets Equity Fund | | Large Company Value Fund | | Strategic Large Cap Growth Fund |
Endeavor Select Fund† | | Omega Growth Fund | | Traditional Small Cap Growth Fund |
Enterprise Fund† | | Opportunity Fund† | | Utility and Telecommunications Fund |
| Bond Funds | | | | |
Adjustable Rate Government Fund | | Inflation-Protected Bond Fund | | Short-Term Bond Fund |
California Limited-Term Tax-Free Fund | | Intermediate Tax/AMT-Free Fund | | Short-Term High Yield Bond Fund |
California Tax-Free Fund | | International Bond Fund | | Short-Term Municipal Bond Fund |
Colorado Tax-Free Fund | | Minnesota Tax-Free Fund | | Strategic Municipal Bond Fund |
Government Securities Fund | | Municipal Bond Fund | | Total Return Bond Fund |
High Income Fund | | North Carolina Tax-Free Fund | | Ultra Short-Term Income Fund |
High Yield Bond Fund | | Pennsylvania Tax-Free Fund | | Ultra Short-Term Municipal Income Fund |
Income Plus Fund | | Short Duration Government Bond Fund | | Wisconsin Tax-Free Fund |
| Asset Allocation Funds | | | | |
Absolute Return Fund | | WealthBuilder Equity Portfolio† | | Target 2020 Fund† |
Asset Allocation Fund | | WealthBuilder Growth Allocation Portfolio† | | Target 2025 Fund† |
Conservative Allocation Fund | | WealthBuilder Growth Balanced Portfolio† | | Target 2030 Fund† |
Diversified Capital Builder Fund | | WealthBuilder Moderate Balanced Portfolio† | | Target 2035 Fund† |
Diversified Income Builder Fund | | WealthBuilder Tactical Equity Portfolio† | | Target 2040 Fund† |
Growth Balanced Fund | | Target Today Fund† | | Target 2045 Fund† |
Index Asset Allocation Fund | | Target 2010 Fund† | | Target 2050 Fund† |
Moderate Balanced Fund | | Target 2015 Fund† | | Target 2055 Fund† |
WealthBuilder Conservative Allocation Portfolio† | | | | |
| Money Market Funds | | | | |
100% Treasury Money Market Fund | | Heritage Money Market Fund† | | National Tax-Free Money Market Fund |
California Municipal Money Market Fund | | Money Market Fund | | Prime Investment Money Market Fund |
Cash Investment Money Market Fund | | Municipal Cash Management Money Market Fund | | Treasury Plus Money Market Fund |
Government Money Market Fund | | Municipal Money Market Fund | | |
| Variable Trust Funds1 | | | | |
VT Discovery Fund† | | VT Intrinsic Value Fund | | VT Small Cap Growth Fund |
VT Index Asset Allocation Fund | | VT Omega Growth Fund | | VT Small Cap Value Fund |
VT International Equity Fund | | VT Opportunity Fund† | | VT Total Return Bond Fund |
An investment in a money market fund is not insured or guaranteed by the Federal Deposit Insurance Corporation or any other government agency. Although the Wells Fargo Advantage Money Market Funds seek to preserve the value of your investment at $1.00 per share, it is possible to lose money by investing in a money market fund.
| 1. | The Variable Trust Funds are generally available only through insurance company variable contracts. |
| † | In this report, the Wells Fargo Advantage Discovery FundSM, Wells Fargo Advantage Endeavor Select FundSM, Wells Fargo Advantage Enterprise FundSM, Wells Fargo Advantage Opportunity FundSM, Wells Fargo Advantage WealthBuilder Conservative Allocation PortfolioSM, Wells Fargo Advantage WealthBuilder Equity PortfolioSM, Wells Fargo Advantage WealthBuilder Growth Allocation PortfolioSM, Wells Fargo Advantage WealthBuilder Growth Balanced PortfolioSM, Wells Fargo Advantage WealthBuilder Moderate Balanced PortfolioSM, Wells Fargo Advantage WealthBuilder Tactical Equity PortfolioSM, Wells Fargo Advantage Dow Jones Target Today FundSM, Wells Fargo Advantage Dow Jones Target 2010 FundSM, Wells Fargo Advantage Dow Jones Target 2015 FundSM, Wells Fargo Advantage Dow Jones Target 2020 FundSM, Wells Fargo Advantage Dow Jones Target 2025 FundSM, Wells Fargo Advantage Dow Jones Target 2030 FundSM, Wells Fargo Advantage Dow Jones Target 2035 FundSM, Wells Fargo Advantage Dow Jones Target 2040 FundSM, Wells Fargo Advantage Dow Jones Target 2045 FundSM, Wells Fargo Advantage Dow Jones Target 2050 FundSM, Wells Fargo Advantage Dow Jones Target 2055 FundSM, Wells Fargo Advantage Heritage Money Market FundSM, Wells Fargo Advantage VT Discovery FundSM, and Wells Fargo Advantage VT Opportunity FundSM are referred to as the Discovery Fund, Endeavor Select Fund, Enterprise Fund, Opportunity Fund, WealthBuilder Conservative Allocation Portfolio, WealthBuilder Equity Portfolio, WealthBuilder Growth Allocation Portfolio, WealthBuilder Growth Balanced Portfolio, WealthBuilder Moderate Balanced Portfolio, WealthBuilder Tactical Equity Portfolio, Target Today Fund, Target 2010 Fund, Target 2015 Fund, Target 2020 Fund, Target 2025 Fund, Target 2030 Fund, Target 2035 Fund, Target 2040 Fund, Target 2045 Fund, Target 2050 Fund, Target 2055 Fund, Heritage Money Market Fund, VT Discovery Fund, and VT Opportunity Fund, respectively. |
Not part of the semi-annual report.
| | | | |
| 2 | | Wells Fargo Advantage Adjustable Rate Government Fund | | Letter to Shareholders |

Karla M. Rabusch,
President
Wells Fargo Advantage Funds
The theme for the period was a shift from risk aversion in the first half to burgeoning trends of improving investor confidence in the second half, which significantly improved pricing in the lower-rated asset classes.
On the whole, investment-grade fixed-income securities performed positively during the period, but the strongest returns came from the high-yield market.
Dear Valued Shareholder:
We are pleased to offer you this semi-annual report for the Wells Fargo Advantage Adjustable Rate Government Fund, which covers the six-month period that ended February 29, 2012. During the period, fixed-income performance was best among the lower-rated securities, as improved investor confidence in the U.S. economy and the U.S. credit markets encouraged investors to return to riskier asset classes.
The period began with heightened risk aversion but ended with stronger investor confidence.
The six-month period began with the worsening of the Greek crisis, which amplified risk aversion across the global credit markets. This in turn led to a powerful rally in U.S. Treasuries and a sharp decline in high-yield bond prices, most notably in the lowest-quality credit tiers. During this time, most investment-grade fixed-income markets continued to generate positive returns—although certain areas of the riskiest segments of the markets declined—and U.S. Treasury yields reached the lowest levels in decades, even surpassing the low yield levels reached in the summer of 2010.
The last three months of the period were characterized by a strong reversal of the trends of the first three months. In October 2011, the high-yield market recovered significantly, benefiting from indications of improving policy with regard to managing the debt crisis from Europe and the formal announcement of a European debt deal late in the month. Due to renewed concerns about the European Union’s ability to manage the debt crisis, November 2011 saw a modest decline in investment-grade corporate bond prices and a sharp correction in high-yield corporate bonds, but another strong recovery in pricing started in December and carried into the first two months of 2012. Investor confidence strengthened as the U.S. economy demonstrated signs of sustainable growth and U.S. credit markets began to show some resistance to the credit problems of Europe. Thus, the theme for the period was a shift from risk aversion in the first half to burgeoning trends of improving investor confidence in the second half, which significantly improved pricing in the lower-rated asset classes.
On the whole, investment-grade fixed-income securities performed positively during the period, but the strongest returns came from the high-yield market. In fact, the best returns for the six-month period came from the lowest-rated credit tiers, despite the fact that they significantly underperformed in August and September 2011. Similar trends were true in the structured products sector, as lower-rated commercial mortgage-backed securities were among the best performers for the period, despite underperforming in the first two months.
The Federal Reserve launched Operation Twist in September.
With economic concerns and credit woes escalating in Europe and some continued uncertainty about the growth outlook in the U.S. during August and September 2011, the Federal Reserve (Fed) intervened yet again with monetary accommodations—this time with “Operation Twist,” which was announced and launched in September 2011. With Operation Twist, the Fed endeavored to flatten the yield curve and drive long-term rates down by selling short-term Treasuries and using the proceeds to purchase long-term Treasuries. The Fed stated that it is unlikely to raise rates before 2014, which should keep yields on Treasuries low.
| | | | | | |
| Letter to Shareholders | | Wells Fargo Advantage Adjustable Rate Government Fund | | | 3 | |
Despite this announcement, problems in Europe caused Treasuries to continue to rally in the first 3 months of the period, while credit spreads on corporate and securitized sectors widened with increasing risk aversion. However, with an improved U.S. economic outlook and greater investor confidence, the last three months of the period saw a slight decline in U.S. Treasury prices and significant improvement in high-yield corporate bond prices. Credit spreads in the corporate and securitized sectors broadly tightened in December 2011 and January and February 2012.
Although U.S. economic conditions appear to have improved over the course of the period, the recovery continues to face some headwinds in the form of languishing housing values and elevated unemployment levels, which may continue to create some volatility in the fixed-income markets. While we cannot say definitively what near-term performance will look like, we continue to encourage investors to maintain fully diversified, actively managed portfolios, which may provide better protection from risk and added opportunities to capture relative value. While heightened volatility may be uncomfortable to experience in the short term, we believe it can lead to unique opportunities to add relative value for investors with long-term investment horizons.
Don’t let short-term uncertainty derail long-term investment goals.
Periods of uncertainty can present challenges, but experience has taught us that maintaining a long-term investment strategy based on individual goals and risk tolerance can be an effective way to plan for the future. To help you create a sound strategy based on your personal goals and risk tolerance, Wells Fargo Advantage Funds offers more than 110 mutual funds and other investments spanning a wide range of asset classes and investment styles. Although diversification cannot guarantee an investment profit or prevent losses, we believe it can be an effective way to manage investment risk and potentially smooth out overall portfolio performance.
In our opinion, diligent and earnest assessment of the fundamental risks in individual fixed-income securities will be a key differentiating factor between which investment strategies perform well and which do not. At Wells Fargo Advantage Funds, we intend to continue measuring relative-value opportunities in the fixed-income markets and across our lineup of funds. We believe it is particularly important to have diligent investment analysts in charge of investor assets in changing markets. As evidenced by the performance of fixed-income assets during the recent six-month period, heightened risks also often accompany such opportunities.
| | | | |
| 4 | | Wells Fargo Advantage Adjustable Rate Government Fund | | Letter to Shareholders |
Thank you for choosing to invest with Wells Fargo Advantage Funds. We appreciate your confidence in us and remain committed to helping you meet your financial needs. For current information about your fund investments, contact your investment professional, visit our Web site at wellsfargoadvantagefunds.com, or call us directly at 1-800-222-8222. We are available 24 hours a day, 7 days a week.
Sincerely,

Karla M. Rabusch
President
Wells Fargo Advantage Funds
Notice to Shareholders
The Board of Trustees for Wells Fargo Advantage Funds has unanimously approved the following modifications to certain net asset value (NAV) waiver privileges and commission schedules:
| | n | | Effective May 1, 2012, automatic investment plan (AIP) purchases and proceeds received from systematic withdrawals will no longer qualify for NAV repurchase privileges. | |
| | n | | Effective May 1, 2012, discretionary rights to waive the upfront commission for Class C and “jumbo” Class A share purchases will no longer be granted to broker/dealers. However, we will continue to waive the Class C shares contingent deferred sales charge for redemptions by employer-sponsored retirement plans where the dealer of record waived its commission at the time of purchase. | |
| | n | | Effective July 31, 2012, NAV purchase privileges for former Evergreen Class IS and Class R shareholders are being modified to remove the ability to purchase Class A shares at NAV unless those shares are held directly with the Fund on or after July 31, 2012. | |
Please contact your investment professional or call us directly at 1-800-222-8222 if you have any questions on this Notice to Shareholders.
| | | | | | |
| Performance Highlights (Unaudited) | | Wells Fargo Advantage Adjustable Rate Government Fund | | | 5 | |
INVESTMENT OBJECTIVE
The Fund seeks current income consistent with capital preservation.
ADVISER
Wells Fargo Funds Management, LLC
SUB-ADVISER
Wells Capital Management Incorporated
PORTFOLIO MANAGERS
Michael J. Bray, CFA
Christopher Y. Kauffman, CFA
FUND INCEPTION
October 1, 1991
| | | | |
TEN LARGEST LONG-TERM HOLDINGS1
(AS OF FEBRUARY 29, 2012) | |
FNMA, 2.62%, 10/1/2033 | | | 2.54% | |
FHLMC Series T-67 Class 1A1C, 3.12%, 3/25/2036 | | | 1.98% | |
FNMA, 2.84%, 11/1/2035 | | | 1.85% | |
FNMA Series 2003-W18 Class 2A, 3.51%, 6/25/2043 | | | 1.75% | |
FHLMC Series T-67 Class 2A1C, 3.08%, 3/25/2036 | | | 1.72% | |
FHLMC, 2.50%, 9/1/2030 | | | 1.62% | |
FNMA, 2.41%, 12/1/2040 | | | 1.39% | |
FNMA, 2.59%, 1/1/2036 | | | 1.34% | |
FNMA Series 2006-W1 Class 3A, 2.33%, 10/25/2045 | | | 1.28% | |
FNMA Series 2002-66 Class A3, 3.20%, 4/25/2042 | | | 1.26% | |
|
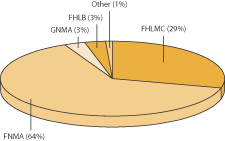
PORTFOLIO ALLOCATION2
(AS OF FEBRUARY 29, 2012) |
|
 |
| 1. | The ten largest long-term holdings are calculated based on the value of the securities divided by total net assets of the Fund. Holdings are subject to change and may have changed since the date specified. |
| 2. | Portfolio allocation is subject to change and is calculated based on the total long-term investments of the Fund. |
| | | | |
| 6 | | Wells Fargo Advantage Adjustable Rate Government Fund | | Performance Highlights (Unaudited) |
AVERAGE ANNUAL TOTAL RETURN3 (%) (AS OF FEBRUARY 29, 2012)
| | | | | | | | | | | | | | | | | | | | | | | | | | | | | | | | | | | | | | | | | | | | |
| | | | | | Including Sales Charge | | | Excluding Sales Charge | | | Expense Ratios4 | |
| | | Inception Date | | | 6 Months* | | | 1 Year | | | 5 Year | | | 10 Year | | | 6 Months* | | | 1 Year | | | 5 Year | | | 10 Year | | | Gross | | | Net5 | |
Class A (ESAAX) | | | 06/30/2000 | | | | (1.28 | ) | | | (0.26 | ) | | | 2.38 | | | | 2.61 | | | | 0.78 | | | | 1.82 | | | | 2.80 | | | | 2.82 | | | | 0.88% | | | | 0.74% | |
Class B (ESABX)** | | | 06/30/2000 | | | | (1.10 | ) | | | (0.55 | ) | | | 2.21 | | | | 2.52 | | | | 0.40 | | | | 0.95 | | | | 2.21 | | | | 2.52 | | | | 1.63% | | | | 1.49% | |
Class C (ESACX) | | | 06/30/2000 | | | | (0.60 | ) | | | (0.05 | ) | | | 2.03 | | | | 2.07 | | | | 0.40 | | | | 0.95 | | | | 2.03 | | | | 2.07 | | | | 1.63% | | | | 1.49% | |
Administrator Class (ESADX) | | | 07/30/2010 | | | | | | | | | | | | | | | | | | | | 0.84 | | | | 1.97 | | | | 2.94 | | | | 2.98 | | | | 0.82% | | | | 0.60% | |
Institutional Class (EKIZX) | | | 10/01/1991 | | | | | | | | | | | | | | | | | | | | 0.90 | | | | 1.97 | | | | 3.06 | | | | 3.09 | | | | 0.55% | | | | 0.49% | |
Barclays 6-Month Treasury Bill Index6 | | | | | | | | | | | | | | | | | | | | | | | 0.04 | | | | 0.23 | | | | 1.91 | | | | 2.27 | | | | | | | | | |
| * | Returns for periods of less than one year are not annualized. |
| ** | Class B shares are closed to investment, except in connection with the reinvestment of any distributions and permitted exchanges. |
Figures quoted represent past performance, which is no guarantee of future results and do not reflect the deduction of taxes that a shareholder may pay on fund distributions or the redemption of fund shares. Investment return and principal value of an investment will fluctuate so that an investor’s shares, when redeemed, may be worth more or less than their original cost. Performance shown without sales charges would be lower if sales charges were reflected. Current performance may be lower or higher than the performance data quoted and assumes the reinvestment of dividends and capital gains. Current month-end performance is available on the Fund’s Web site – wellsfargoadvantagefunds.com
Index returns do not include transaction costs associated with buying and selling securities, any mutual fund fees or expenses or any taxes. It is not possible to invest directly in an index.
For Class A shares, the maximum front-end sales charge is 2.00%. For Class B shares, the maximum contingent deferred sales charge is 1.50%. For Class C shares, the maximum contingent deferred sales charge is 1.00%. Performance including sales charge assumes the sales charge for the corresponding time period. Administrator Class and Institutional Class shares are sold without a front-end sales charge or contingent deferred sales charge.
Bond fund values fluctuate in response to the financial condition of individual issuers, general market and economic conditions, and changes in interest rates. In general, when interest rates rise, bond fund values fall and investors may lose principal value. The use of derivatives may reduce returns and/or increase volatility. Securities issued by U.S. government agencies or government-sponsored entities may not be guaranteed by the U.S. Treasury. Certain investment strategies tend to increase the total risk of an investment (relative to the broader market). This Fund is exposed to mortgage- and asset-backed securities risk. Consult the Fund’s prospectus for additional information on these and other risks. The U.S. government guarantee applies to certain underlying securities and not to shares of the Fund.
| 3. | Historical performance shown for the Administrator Class shares prior to their inception reflects the performance of the Institutional Class shares, adjusted to reflect the higher expenses applicable to the Administrator Class shares. Historical performance shown for all classes of the Fund prior to July 12, 2010 is based on the performance of the Fund’s predecessor, Evergreen Adjustable Rate Fund. |
| 4. | Reflects the expense ratios as stated in the most recent prospectuses. |
| 5. | The Adviser has committed through July 11, 2013 to waive fees and/or reimburse expenses to the extent necessary to cap the Fund’s Total Annual Fund Operating Expenses After Fee Waiver, excluding certain expenses, at the amounts shown above. Without this cap, the Fund’s returns would have been lower. |
| 6. | The Barclays 6-Month Treasury Bill Index tracks the performance and attributes of recently issued 6-month U.S. Treasury Bills. The index follows Barclay’s monthly rebalancing conventions. You cannot invest directly in an index. |
| | | | | | |
| Fund Expenses (Unaudited) | | Wells Fargo Advantage Adjustable Rate Government Fund | | | 7 | |
As a shareholder of the Fund, you incur two types of costs: (1) transaction costs, including sales charges (loads) on purchase payments and contingent deferred sales charges (if any) on redemptions and (2) ongoing costs, including management fees; distribution (12b-1) and/or shareholder service fees; and other Fund expenses. This example is intended to help you understand your ongoing costs (in dollars) of investing in the Fund and to compare these costs with the ongoing costs of investing in other mutual funds.
The example is based on an investment of $1,000 invested at the beginning of the six-month period and held for the entire period from September 1, 2011 to February 29, 2012.
Actual Expenses
The “Actual” line of the table below provides information about actual account values and actual expenses. You may use the information in this line, together with the amount you invested, to estimate the expenses that you paid over the period. Simply divide your account value by $1,000 (for example, an $8,600 account value divided by $1,000 = 8.6), then multiply the result by the number in the “Actual” line under the heading entitled “Expenses Paid During Period” for your applicable class of shares to estimate the expenses you paid on your account during this period.
Hypothetical Example for Comparison Purposes
The “Hypothetical” line of the table below provides information about hypothetical account values and hypothetical expenses based on the Fund’s actual expense ratio and an assumed rate of return of 5% per year before expenses, which is not the Fund’s actual return. The hypothetical account values and expenses may not be used to estimate the actual ending account balance or expenses you paid for the period. You may use this information to compare the ongoing costs of investing in the Fund and other funds. To do so, compare this 5% hypothetical example with the 5% hypothetical examples that appear in the shareholder reports of the other funds.
Please note that the expenses shown in the table are meant to highlight your ongoing costs only and do not reflect any transactional costs, such as sales charges (loads) and contingent deferred sales charges. Therefore, the “Hypothetical” line of the table is useful in comparing ongoing costs only, and will not help you determine the relative total costs of owning different funds. In addition, if these transactional costs were included, your costs would have been higher.
| | | | | | | | | | | | | | | | |
| | | Beginning
Account Value
09-01-2011 | | | Ending
Account Value
02-29-2012 | | | Expenses
Paid During
the Period1 | | | Net Annual
Expense Ratio | |
Class A | | | | | | | | | | | | | | | | |
Actual | | $ | 1,000.00 | | | $ | 1,007.76 | | | $ | 3.69 | | | | 0.74 | % |
Hypothetical (5% return before expenses) | | $ | 1,000.00 | | | $ | 1,021.18 | | | $ | 3.72 | | | | 0.74 | % |
Class B | | | | | | | | | | | | | | | | |
Actual | | $ | 1,000.00 | | | $ | 1,004.00 | | | $ | 7.42 | | | | 1.49 | % |
Hypothetical (5% return before expenses) | | $ | 1,000.00 | | | $ | 1,017.45 | | | $ | 7.47 | | | | 1.49 | % |
Class C | | | | | | | | | | | | | | | | |
Actual | | $ | 1,000.00 | | | $ | 1,004.01 | | | $ | 7.42 | | | | 1.49 | % |
Hypothetical (5% return before expenses) | | $ | 1,000.00 | | | $ | 1,017.45 | | | $ | 7.47 | | | | 1.49 | % |
Administrator Class | | | | | | | | | | | | | | | | |
Actual | | $ | 1,000.00 | | | $ | 1,008.45 | | | $ | 3.00 | | | | 0.60 | % |
Hypothetical (5% return before expenses) | | $ | 1,000.00 | | | $ | 1,021.88 | | | $ | 3.02 | | | | 0.60 | % |
Institutional Class | | | | | | | | | | | | | | | | |
Actual | | $ | 1,000.00 | | | $ | 1,009.01 | | | $ | 2.45 | | | | 0.49 | % |
Hypothetical (5% return before expenses) | | $ | 1,000.00 | | | $ | 1,022.43 | | | $ | 2.46 | | | | 0.49 | % |
| 1. | Expenses paid is equal to the annualized expense ratio of each class multiplied by the average account value over the period, multiplied by the number of days in the most recent fiscal half-year divided by the number of days in the fiscal year (to reflect the one-half year period). |
| | | | |
| 8 | | Wells Fargo Advantage Adjustable Rate Government Fund | | Portfolio of Investments—February 29, 2012 (Unaudited) |
| | | | | | | | | | | | | | | | |
| Security Name | | Interest Rate | | | Maturity Date | | | Principal | | | Value | |
| | | | | | | | | | | | | | | | |
| | | | |
| Agency Securities: 96.92% | | | | | | | | | | | | | | | | |
Federal Agricultural Mortgage Corporation Series 2000-A Class A ± | | | 8.48 | % | | | 12/15/2039 | | | $ | 1,668,356 | | | $ | 1,667,539 | |
FHLB ± | | | 2.27 | | | | 08/01/2033 | | | | 4,336,782 | | | | 4,564,821 | |
FHLB ± | | | 2.42 | | | | 08/01/2035 | | | | 403,500 | | | | 410,016 | |
FHLB ± | | | 2.43 | | | | 12/01/2034 | | | | 8,500,908 | | | | 8,951,117 | |
FHLB ± | | | 2.46 | | | | 05/01/2034 | | | | 4,503,752 | | | | 4,763,546 | |
FHLB ± | | | 2.50 | | | | 06/01/2035 | | | | 6,308,671 | | | | 6,715,154 | |
FHLB ± | | | 2.50 | | | | 05/01/2033 | | | | 498,045 | | | | 508,928 | |
FHLB ± | | | 2.56 | | | | 06/01/2026 | | | | 2,552,666 | | | | 2,740,267 | |
FHLB ± | | | 2.59 | | | | 07/01/2034 | | | | 2,028,658 | | | | 2,153,551 | |
FHLB ± | | | 2.85 | | | | 06/01/2032 | | | | 272,500 | | | | 275,353 | |
FHLB ± | | | 3.33 | | | | 06/01/2029 | | | | 2,493,709 | | | | 2,651,095 | |
FHLB ± | | | 4.31 | | | | 06/01/2035 | | | | 3,262,104 | | | | 3,438,856 | |
FHLMC ± | | | 2.19 | | | | 01/01/2037 | | | | 4,838,227 | | | | 5,087,683 | |
FHLMC ± | | | 2.20 | | | | 01/01/2023 | | | | 79,277 | | | | 81,964 | |
FHLMC ± | | | 2.24 | | | | 03/01/2020 | | | | 3,560 | | | | 3,583 | |
FHLMC ± | | | 2.25 | | | | 07/01/2030 | | | | 34,882 | | | | 36,215 | |
FHLMC ± | | | 2.25 | | | | 01/01/2029 | | | | 31,207 | | | | 31,995 | |
FHLMC ± | | | 2.25 | | | | 02/01/2035 | | | | 3,065,679 | | | | 3,217,208 | |
FHLMC ± | | | 2.27 | | | | 05/01/2020 | | | | 2,193 | | | | 2,203 | |
FHLMC ± | | | 2.29 | | | | 08/01/2034 | | | | 3,139,435 | | | | 3,289,695 | |
FHLMC ± | | | 2.29 | | | | 05/01/2028 | | | | 643,295 | | | | 673,783 | |
FHLMC ± | | | 2.34 | | | | 01/01/2030 | | | | 61,343 | | | | 64,875 | |
FHLMC ± | | | 2.34 | | | | 10/01/2033 | | | | 4,237,218 | | | | 4,480,542 | |
FHLMC ± | | | 2.35 | | | | 10/01/2033 | | | | 72,918 | | | | 76,639 | |
FHLMC ± | | | 2.35 | | | | 02/01/2034 | | | | 2,759,100 | | | | 2,909,165 | |
FHLMC ± | | | 2.36 | | | | 08/01/2036 | | | | 7,938,392 | | | | 8,359,971 | |
FHLMC ± | | | 2.38 | | | | 12/01/2032 | | | | 3,959,530 | | | | 4,177,880 | |
FHLMC ± | | | 2.38 | | | | 02/01/2036 | | | | 3,814,196 | | | | 4,023,106 | |
FHLMC ± | | | 2.38 | | | | 07/01/2019 | | | | 2,717 | | | | 2,732 | |
FHLMC ± | | | 2.38 | | | | 08/01/2036 | | | | 8,932,717 | | | | 9,470,841 | |
FHLMC ± | | | 2.40 | | | | 11/01/2029 | | | | 228,324 | | | | 241,574 | |
FHLMC ± | | | 2.40 | | | | 05/01/2025 | | | | 129,991 | | | | 137,861 | |
FHLMC ± | | | 2.41 | | | | 02/01/2034 | | | | 6,229,393 | | | | 6,579,513 | |
FHLMC ± | | | 2.41 | | | | 11/01/2036 | | | | 2,397,220 | | | | 2,537,922 | |
FHLMC ± | | | 2.41 | | | | 04/01/2034 | | | | 7,498,594 | | | | 7,914,808 | |
FHLMC ± | | | 2.41 | | | | 12/01/2032 | | | | 6,745,872 | | | | 7,127,269 | |
FHLMC ± | | | 2.42 | | | | 02/01/2035 | | | | 8,700,924 | | | | 9,176,689 | |
FHLMC ± | | | 2.42 | | | | 04/01/2035 | | | | 2,217,597 | | | | 2,347,372 | |
FHLMC ± | | | 2.43 | | | | 11/01/2027 | | | | 1,365,862 | | | | 1,448,937 | |
FHLMC ± | | | 2.43 | | | | 11/01/2029 | | | | 543,339 | | | | 575,361 | |
FHLMC ± | | | 2.43 | | | | 09/01/2035 | | | | 4,516,898 | | | | 4,744,412 | |
FHLMC ± | | | 2.43 | | | | 03/01/2037 | | | | 8,450,311 | | | | 8,920,747 | |
FHLMC ± | | | 2.43 | | | | 03/01/2027 | | | | 378,742 | | | | 401,171 | |
FHLMC ± | | | 2.44 | | | | 07/01/2024 | | | | 64,215 | | | | 66,599 | |
FHLMC ± | | | 2.44 | | | | 09/01/2030 | | | | 960,351 | | | | 1,016,221 | |
FHLMC ± | | | 2.45 | | | | 08/01/2027 | | | | 13,102 | | | | 13,214 | |
FHLMC ± | | | 2.45 | | | | 08/01/2035 | | | | 2,286,845 | | | | 2,413,964 | |
FHLMC ± | | | 2.45 | | | | 10/01/2035 | | | | 8,377,171 | | | | 8,816,634 | |
FHLMC ± | | | 2.47 | | | | 09/01/2016 | | | | 9,936 | | | | 10,031 | |
FHLMC ± | | | 2.47 | | | | 11/01/2016 | | | | 168,962 | | | | 174,389 | |
The accompanying notes are an integral part of these financial statements.
| | | | | | |
| Portfolio of Investments—February 29, 2012 (Unaudited) | | Wells Fargo Advantage Adjustable Rate Government Fund | | | 9 | |
| | | | | | | | | | | | | | | | |
| Security Name | | Interest Rate | | | Maturity Date | | | Principal | | | Value | |
| | | | | | | | | | | | | | | | |
| | | |
| Agency Securities (continued) | | | | | | | | | | | | | |
FHLMC ± | | | 2.47 | % | | | 07/01/2018 | | | $ | 6,099 | | | $ | 6,201 | |
FHLMC ± | | | 2.47 | | | | 01/01/2019 | | | | 14,009 | | | | 14,475 | |
FHLMC ± | | | 2.47 | | | | 02/01/2019 | | | | 19,136 | | | | 19,777 | |
FHLMC ± | | | 2.47 | | | | 02/01/2035 | | | | 793,053 | | | | 818,040 | |
FHLMC ± | | | 2.47 | | | | 07/01/2031 | | | | 516,677 | | | | 548,147 | |
FHLMC ± | | | 2.48 | | | | 05/01/2032 | | | | 87,932 | | | | 88,694 | |
FHLMC ± | | | 2.48 | | | | 02/01/2038 | | | | 5,475,059 | | | | 5,822,093 | |
FHLMC ± | | | 2.49 | | | | 10/01/2033 | | | | 4,624,972 | | | | 4,912,745 | |
FHLMC ± | | | 2.49 | | | | 05/01/2020 | | | | 1,330 | | | | 1,337 | |
FHLMC ± | | | 2.49 | | | | 09/01/2032 | | | | 4,925,514 | | | | 5,227,046 | |
FHLMC ± | | | 2.49 | | | | 09/01/2035 | | | | 8,129,322 | | | | 8,596,040 | |
FHLMC ± | | | 2.49 | | | | 10/01/2036 | | | | 3,225,997 | | | | 3,413,394 | |
FHLMC ± | | | 2.49 | | | | 05/01/2036 | | | | 3,054,561 | | | | 3,200,584 | |
FHLMC ± | | | 2.50 | | | | 01/01/2028 | | | | 57,802 | | | | 61,524 | |
FHLMC ± | | | 2.50 | | | | 04/01/2035 | | | | 1,174,553 | | | | 1,239,561 | |
FHLMC ± | | | 2.50 | | | | 12/01/2017 | | | | 52,855 | | | | 54,614 | |
FHLMC ± | | | 2.50 | | | | 05/01/2018 | | | | 1,425 | | | | 1,470 | |
FHLMC ± | | | 2.50 | | | | 06/01/2018 | | | | 37,476 | | | | 38,706 | |
FHLMC ± | | | 2.50 | | | | 09/01/2018 | | | | 3,477 | | | | 3,587 | |
FHLMC ± | | | 2.50 | | | | 05/01/2019 | | | | 10,550 | | | | 10,607 | |
FHLMC ± | | | 2.50 | | | | 06/01/2033 | | | | 4,619,258 | | | | 4,910,412 | |
FHLMC ± | | | 2.50 | | | | 09/01/2030 | | | | 20,117,753 | | | | 21,413,050 | |
FHLMC ± | | | 2.51 | | | | 01/01/2028 | | | | 9,613 | | | | 10,225 | |
FHLMC ± | | | 2.52 | | | | 10/01/2036 | | | | 2,050,459 | | | | 2,182,339 | |
FHLMC ± | | | 2.52 | | | | 06/01/2035 | | | | 4,196,035 | | | | 4,461,636 | |
FHLMC ± | | | 2.53 | | | | 01/01/2030 | | | | 25,654 | | | | 26,539 | |
FHLMC ± | | | 2.53 | | | | 01/01/2030 | | | | 12,715 | | | | 13,175 | |
FHLMC ± | | | 2.53 | | | | 07/01/2030 | | | | 237,657 | | | | 246,649 | |
FHLMC ± | | | 2.53 | | | | 10/01/2030 | | | | 4,639,753 | | | | 4,939,889 | |
FHLMC ± | | | 2.53 | | | | 10/01/2035 | | | | 5,593,336 | | | | 5,956,341 | |
FHLMC ± | | | 2.53 | | | | 11/01/2035 | | | | 1,256,194 | | | | 1,337,097 | |
FHLMC ± | | | 2.53 | | | | 01/01/2024 | | | | 82,551 | | | | 83,116 | |
FHLMC ± | | | 2.54 | | | | 04/01/2034 | | | | 10,523,677 | | | | 11,073,644 | |
FHLMC ± | | | 2.54 | | | | 03/01/2025 | | | | 175,543 | | | | 179,130 | |
FHLMC ± | | | 2.54 | | | | 01/01/2035 | | | | 1,330,056 | | | | 1,408,864 | |
FHLMC ± | | | 2.54 | | | | 10/01/2035 | | | | 6,854,943 | | | | 7,286,203 | |
FHLMC ± | | | 2.56 | | | | 05/01/2023 | | | | 108,378 | | | | 109,524 | |
FHLMC ± | | | 2.56 | | | | 11/01/2018 | | | | 24,245 | | | | 24,487 | |
FHLMC ± | | | 2.56 | | | | 04/01/2035 | | | | 5,956,681 | | | | 6,314,148 | |
FHLMC ± | | | 2.58 | | | | 04/01/2035 | | | | 4,491,378 | | | | 4,722,081 | |
FHLMC ± | | | 2.59 | | | | 10/01/2030 | | | | 39,608 | | | | 41,007 | |
FHLMC ± | | | 2.60 | | | | 08/01/2029 | | | | 209,353 | | | | 211,235 | |
FHLMC ± | | | 2.60 | | | | 06/01/2030 | | | | 163,465 | | | | 173,553 | |
FHLMC ± | | | 2.60 | | | | 10/01/2024 | | | | 378,982 | | | | 401,270 | |
FHLMC ± | | | 2.60 | | | | 07/01/2027 | | | | 1,258,895 | | | | 1,336,853 | |
FHLMC ± | | | 2.61 | | | | 06/01/2025 | | | | 136,516 | | | | 141,015 | |
FHLMC ± | | | 2.62 | | | | 03/01/2037 | | | | 5,495,486 | | | | 5,865,169 | |
FHLMC ± | | | 2.62 | | | | 06/01/2024 | | | | 51,633 | | | | 55,265 | |
FHLMC ± | | | 2.64 | | | | 11/01/2026 | | | | 513,990 | | | | 521,029 | |
The accompanying notes are an integral part of these financial statements.
| | | | |
| 10 | | Wells Fargo Advantage Adjustable Rate Government Fund | | Portfolio of Investments—February 29, 2012 (Unaudited) |
| | | | | | | | | | | | | | | | |
| Security Name | | Interest Rate | | | Maturity Date | | | Principal | | | Value | |
| | | | | | | | | | | | | | | | |
| | | |
| Agency Securities (continued) | | | | | | | | | | | | | |
FHLMC ± | | | 2.65 | % | | | 02/01/2036 | | | $ | 13,028,856 | | | $ | 13,892,973 | |
FHLMC ± | | | 2.65 | | | | 07/01/2029 | | | | 123,019 | | | | 130,088 | |
FHLMC ± | | | 2.66 | | | | 06/01/2030 | | | | 916,812 | | | | 970,290 | |
FHLMC ± | | | 2.66 | | | | 10/01/2029 | | | | 161,620 | | | | 171,111 | |
FHLMC ± | | | 2.67 | | | | 04/01/2036 | | | | 6,189,019 | | | | 6,595,051 | |
FHLMC ± | | | 2.68 | | | | 06/01/2028 | | | | 583,864 | | | | 613,144 | |
FHLMC ± | | | 2.68 | | | | 10/01/2025 | | | | 173,905 | | | | 174,473 | |
FHLMC ± | | | 2.69 | | | | 04/01/2020 | | | | 64,163 | | | | 68,065 | |
FHLMC ± | | | 2.72 | | | | 08/01/2018 | | | | 6,197 | | | | 6,512 | |
FHLMC ± | | | 2.72 | | | | 08/01/2030 | | | | 10,558,474 | | | | 11,163,684 | |
FHLMC ± | | | 2.73 | | | | 10/01/2025 | | | | 53,532 | | | | 54,018 | |
FHLMC ± | | | 2.73 | | | | 02/01/2030 | | | | 105,967 | | | | 112,315 | |
FHLMC ± | | | 2.73 | | | | 06/01/2030 | | | | 192,306 | | | | 193,551 | |
FHLMC ± | | | 2.73 | | | | 02/01/2037 | | | | 1,601,827 | | | | 1,704,384 | |
FHLMC ± | | | 2.74 | | | | 06/01/2037 | | | | 8,916,668 | | | | 9,523,435 | |
FHLMC ± | | | 2.76 | | | | 05/01/2028 | | | | 540,548 | | | | 548,263 | |
FHLMC ± | | | 2.76 | | | | 06/01/2020 | | | | 3,430 | | | | 3,452 | |
FHLMC ± | | | 2.76 | | | | 04/01/2035 | | | | 2,390,287 | | | | 2,551,197 | |
FHLMC ± | | | 2.78 | | | | 02/01/2024 | | | | 43,020 | | | | 43,261 | |
FHLMC ± | | | 2.78 | | | | 03/01/2018 | | | | 35,236 | | | | 35,739 | |
FHLMC ± | | | 2.78 | | | | 08/01/2018 | | | | 389 | | | | 389 | |
FHLMC ± | | | 2.80 | | | | 12/01/2017 | | | | 21,048 | | | | 21,129 | |
FHLMC ± | | | 2.81 | | | | 11/01/2032 | | | | 384,196 | | | | 403,948 | |
FHLMC ± | | | 2.86 | | | | 02/01/2036 | | | | 10,295,916 | | | | 10,983,264 | |
FHLMC ± | | | 2.87 | | | | 06/01/2020 | | | | 193,396 | | | | 203,566 | |
FHLMC ± | | | 2.89 | | | | 01/01/2022 | | | | 41,842 | | | | 42,199 | |
FHLMC ± | | | 2.93 | | | | 07/01/2017 | | | | 53,202 | | | | 56,018 | |
FHLMC ± | | | 2.93 | | | | 05/01/2032 | | | | 333,218 | | | | 347,470 | |
FHLMC ± | | | 2.97 | | | | 11/01/2029 | | | | 388,263 | | | | 392,098 | |
FHLMC ± | | | 3.04 | | | | 06/01/2019 | | | | 290,451 | | | | 292,567 | |
FHLMC ± | | | 3.04 | | | | 06/01/2022 | | | | 3,680 | | | | 3,711 | |
FHLMC ± | | | 3.07 | | | | 10/01/2018 | | | | 120,763 | | | | 127,639 | |
FHLMC ± | | | 3.12 | | | | 02/01/2027 | | | | 216,727 | | | | 225,224 | |
FHLMC ± | | | 3.18 | | | | 08/01/2029 | | | | 370,620 | | | | 372,933 | |
FHLMC ± | | | 3.22 | | | | 12/01/2018 | | | | 52,252 | | | | 52,640 | |
FHLMC ± | | | 3.23 | | | | 09/01/2030 | | | | 202,843 | | | | 203,121 | |
FHLMC ± | | | 3.24 | | | | 06/01/2019 | | | | 177,218 | | | | 184,368 | |
FHLMC ± | | | 3.25 | | | | 10/01/2019 | | | | 43,390 | | | | 43,528 | |
FHLMC ± | | | 3.25 | | | | 02/01/2018 | | | | 10,402 | | | | 10,454 | |
FHLMC ± | | | 3.25 | | | | 03/01/2025 | | | | 6,562,623 | | | | 6,894,724 | |
FHLMC ± | | | 3.28 | | | | 12/01/2018 | | | | 57,085 | | | | 57,278 | |
FHLMC ± | | | 3.38 | | | | 09/01/2016 | | | | 130,645 | | | | 131,460 | |
FHLMC ± | | | 3.43 | | | | 01/01/2026 | | | | 16,464 | | | | 16,598 | |
FHLMC ± | | | 3.44 | | | | 12/01/2025 | | | | 933,978 | | | | 956,305 | |
FHLMC ± | | | 3.50 | | | | 09/01/2031 | | | | 384,873 | | | | 388,765 | |
FHLMC ± | | | 3.52 | | | | 04/01/2019 | | | | 38,979 | | | | 39,132 | |
FHLMC ± | | | 3.57 | | | | 07/01/2028 | | | | 113,343 | | | | 114,563 | |
FHLMC ± | | | 3.63 | | | | 08/01/2019 | | | | 28,178 | | | | 28,332 | |
FHLMC ± | | | 3.76 | | | | 07/01/2018 | | | | 190,310 | | | | 191,041 | |
FHLMC ± | | | 3.91 | | | | 06/01/2021 | | | | 270,754 | | | | 284,604 | |
The accompanying notes are an integral part of these financial statements.
| | | | | | |
| Portfolio of Investments—February 29, 2012 (Unaudited) | | Wells Fargo Advantage Adjustable Rate Government Fund | | | 11 | |
| | | | | | | | | | | | | | | | |
| Security Name | | Interest Rate | | | Maturity Date | | | Principal | | | Value | |
| | | | | | | | | | | | | | | | |
| | | |
| Agency Securities (continued) | | | | | | | | | | | | | |
FHLMC ± | | | 3.92 | % | | | 01/01/2017 | | | $ | 2,434 | | | $ | 2,450 | |
FHLMC ± | | | 4.19 | | | | 04/01/2023 | | | | 283,274 | | | | 285,914 | |
FHLMC ± | | | 4.36 | | | | 05/01/2031 | | | | 278,116 | | | | 282,258 | |
FHLMC ± | | | 4.41 | | | | 08/01/2029 | �� | | | 50,545 | | | | 51,806 | |
FHLMC ± | | | 4.49 | | | | 01/01/2019 | | | | 1,804 | | | | 1,813 | |
FHLMC ± | | | 4.59 | | | | 04/01/2029 | | | | 376,479 | | | | 391,587 | |
FHLMC ± | | | 4.64 | | | | 10/01/2029 | | | | 150,692 | | | | 151,821 | |
FHLMC ± | | | 4.69 | | | | 04/01/2032 | | | | 172,526 | | | | 174,038 | |
FHLMC ± | | | 4.77 | | | | 02/01/2021 | | | | 58,411 | | | | 58,914 | |
FHLMC ± | | | 4.93 | | | | 02/01/2029 | | | | 437,283 | | | | 442,992 | |
FHLMC ± | | | 4.98 | | | | 04/01/2037 | | | | 2,557,954 | | | | 2,708,834 | |
FHLMC ± | | | 5.46 | | | | 06/01/2033 | | | | 1,136,963 | | | | 1,219,198 | |
FHLMC ± | | | 5.51 | | | | 08/01/2024 | | | | 975,635 | | | | 1,043,447 | |
FHLMC ± | | | 5.74 | | | | 08/01/2027 | | | | 90,975 | | | | 91,593 | |
FHLMC | | | 6.50 | | | | 04/01/2018 | | | | 259,222 | | | | 289,652 | |
FHLMC | | | 7.00 | | | | 11/01/2012 | | | | 27,511 | | | | 28,160 | |
FHLMC | | | 7.00 | | | | 09/01/2035 | | | | 278,370 | | | | 316,535 | |
FHLMC | | | 7.50 | | | | 01/01/2016 | | | | 46,967 | | | | 50,623 | |
FHLMC | | | 7.50 | | | | 06/01/2016 | | | | 17,037 | | | | 18,031 | |
FHLMC | | | 8.50 | | | | 05/01/2020 | | | | 221,266 | | | | 247,297 | |
FHLMC | | | 8.50 | | | | 06/01/2022 | | | | 1,451 | | | | 1,453 | |
FHLMC | | | 8.50 | | | | 09/01/2022 | | | | 35,699 | | | | 36,629 | |
FHLMC Series 1671 Class QA ± | | | 2.17 | | | | 02/15/2024 | | | | 590,190 | | | | 619,385 | |
FHLMC Series 1686 Class FE ± | | | 2.32 | | | | 02/15/2024 | | | | 57,056 | | | | 60,053 | |
FHLMC Series 1730 Class FA ± | | | 1.36 | | | | 05/15/2024 | | | | 580,571 | | | | 591,460 | |
FHLMC Series 20 Class F ± | | | 1.22 | | | | 07/01/2029 | | | | 40,972 | | | | 37,533 | |
FHLMC Series 2315 Class FW ± | | | 0.80 | | | | 04/15/2027 | | | | 333,450 | | | | 334,624 | |
FHLMC Series 2391 Class EF ± | | | 0.75 | | | | 06/15/2031 | | | | 328,524 | | | | 330,490 | |
FHLMC Series 2454 Class SL ±(c) | | | 7.75 | | | | 03/15/2032 | | | | 789,556 | | | | 148,337 | |
FHLMC Series 2461 Class FI ± | | | 0.75 | | | | 04/15/2028 | | | | 472,946 | | | | 476,502 | |
FHLMC Series 2464 Class FE ± | | | 1.25 | | | | 03/15/2032 | | | | 514,613 | | | | 520,109 | |
FHLMC Series 2466 Class FV ± | | | 0.80 | | | | 03/15/2032 | | | | 734,057 | | | | 738,715 | |
FHLMC Series 2527 Class SX ±(c) | | | 7.30 | | | | 02/15/2032 | | | | 100,125 | | | | 545 | |
FHLMC Series T-48 Class 2A ± | | | 3.58 | | | | 11/25/2032 | | | | 4,326,872 | | | | 4,468,876 | |
FHLMC Series T-54 Class 4A ± | | | 3.36 | | | | 02/25/2043 | | | | 3,040,477 | | | | 3,034,776 | |
FHLMC Series T-55 Class 1A1 | | | 6.50 | | | | 03/25/2043 | | | | 145,064 | | | | 163,630 | |
FHLMC Series T-66 Class 2A1 ± | | | 2.95 | | | | 01/25/2036 | | | | 6,560,468 | | | | 6,914,596 | |
FHLMC Series T-67 Class 1A1C ± | | | 3.12 | | | | 03/25/2036 | | | | 24,785,399 | | | | 26,226,050 | |
FHLMC Series T-67 Class 2A1C ± | | | 3.08 | | | | 03/25/2036 | | | | 21,507,113 | | | | 22,757,213 | |
FNMA ± | | | 1.30 | | | | 12/01/2020 | | | | 73,545 | | | | 73,902 | |
FNMA ± | | | 1.41 | | | | 06/01/2021 | | | | 125,052 | | | | 126,873 | |
FNMA ± | | | 1.45 | | | | 09/01/2032 | | | | 72,311 | | | | 72,451 | |
FNMA ± | | | 1.50 | | | | 01/01/2021 | | | | 7,285 | | | | 7,390 | |
FNMA ± | | | 1.50 | | | | 01/01/2021 | | | | 11,543 | | | | 11,581 | |
FNMA ± | | | 1.60 | | | | 12/01/2030 | | | | 253,730 | | | | 259,270 | |
FNMA ± | | | 1.75 | | | | 03/01/2015 | | | | 29,722 | | | | 30,279 | |
FNMA ± | | | 1.75 | | | | 12/01/2016 | | | | 2,031 | | | | 2,045 | |
FNMA ± | | | 1.75 | | | | 08/01/2031 | | | | 177,724 | | | | 180,896 | |
FNMA ± | | | 1.79 | | | | 08/01/2031 | | | | 159,423 | | | | 159,994 | |
FNMA ± | | | 1.80 | | | | 07/01/2020 | | | | 23,565 | | | | 23,807 | |
The accompanying notes are an integral part of these financial statements.
| | | | |
| 12 | | Wells Fargo Advantage Adjustable Rate Government Fund | | Portfolio of Investments—February 29, 2012 (Unaudited) |
| | | | | | | | | | | | | | | | |
| Security Name | | Interest Rate | | | Maturity Date | | | Principal | | | Value | |
| | | | | | | | | | | | | | | | |
| | | |
| Agency Securities (continued) | | | | | | | | | | | | | |
FNMA ± | | | 1.84 | % | | | 09/01/2031 | | | $ | 457,416 | | | $ | 474,944 | |
FNMA ± | | | 1.85 | | | | 05/01/2029 | | | | 564,489 | | | | 594,420 | |
FNMA ± | | | 1.87 | | | | 01/01/2032 | | | | 41,924 | | | | 42,004 | |
FNMA ± | | | 1.89 | | | | 12/01/2031 | | | | 207,889 | | | | 208,767 | |
FNMA ± | | | 1.90 | | | | 08/01/2032 | | | | 299,650 | | | | 302,148 | |
FNMA ± | | | 1.91 | | | | 08/01/2032 | | | | 185,751 | | | | 192,551 | |
FNMA ± | | | 1.92 | | | | 04/01/2033 | | | | 1,757,227 | | | | 1,815,738 | |
FNMA ± | | | 1.92 | | | | 12/01/2031 | | | | 461,698 | | | | 483,429 | |
FNMA ± | | | 1.96 | | | | 10/01/2017 | | | | 16,388 | | | | 16,730 | |
FNMA ± | | | 2.00 | | | | 08/01/2033 | | | | 4,453 | | | | 4,476 | |
FNMA ± | | | 2.00 | | | | 12/01/2031 | | | | 185,877 | | | | 195,140 | |
FNMA ± | | | 2.01 | | | | 07/01/2032 | | | | 240,376 | | | | 241,305 | |
FNMA ± | | | 2.04 | | | | 07/01/2018 | | | | 4,990 | | | | 5,003 | |
FNMA ± | | | 2.05 | | | | 12/01/2022 | | | | 20,560 | | | | 20,777 | |
FNMA ± | | | 2.05 | | | | 08/01/2033 | | | | 717,515 | | | | 736,529 | |
FNMA ± | | | 2.05 | | | | 10/01/2018 | | | | 193,558 | | | | 202,866 | |
FNMA ± | | | 2.08 | | | | 08/01/2031 | | | | 84,499 | | | | 85,428 | |
FNMA ± | | | 2.10 | | | | 10/01/2035 | | | | 14,679,782 | | | | 15,252,208 | |
FNMA ± | | | 2.11 | | | | 01/01/2032 | | | | 507,994 | | | | 514,494 | |
FNMA ± | | | 2.13 | | | | 02/01/2020 | | | | 24,514 | | | | 25,460 | |
FNMA ± | | | 2.13 | | | | 01/01/2022 | | | | 16,251 | | | | 16,433 | |
FNMA ± | | | 2.13 | | | | 01/01/2036 | | | | 7,590,879 | | | | 7,912,473 | |
FNMA ± | | | 2.14 | | | | 12/01/2035 | | | | 15,170,185 | | | | 15,778,648 | |
FNMA ± | | | 2.14 | | | | 06/01/2032 | | | | 193,901 | | | | 194,254 | |
FNMA ± | | | 2.15 | | | | 05/01/2032 | | | | 128,811 | | | | 135,614 | |
FNMA ± | | | 2.16 | | | | 06/01/2018 | | | | 3,032 | | | | 3,140 | |
FNMA ± | | | 2.18 | | | | 11/01/2039 | | | | 121,471 | | | | 122,382 | |
FNMA ± | | | 2.19 | | | | 01/01/2035 | | | | 5,167,341 | | | | 5,450,306 | |
FNMA ± | | | 2.20 | | | | 06/01/2031 | | | | 363,741 | | | | 385,536 | |
FNMA ± | | | 2.20 | | | | 07/01/2018 | | | | 826,222 | | | | 854,638 | |
FNMA ± | | | 2.20 | | | | 07/01/2035 | | | | 3,235,481 | | | | 3,352,522 | |
FNMA ± | | | 2.20 | | | | 04/01/2018 | | | | 725,465 | | | | 750,205 | |
FNMA ± | | | 2.21 | | | | 11/01/2017 | | | | 304,975 | | | | 319,553 | |
FNMA ± | | | 2.24 | | | | 02/01/2033 | | | | 281,120 | | | | 296,521 | |
FNMA ± | | | 2.24 | | | | 10/01/2024 | | | | 71,506 | | | | 75,410 | |
FNMA ± | | | 2.24 | | | | 12/01/2024 | | | | 112,787 | | | | 119,105 | |
FNMA ± | | | 2.25 | | | | 10/01/2025 | | | | 190,255 | | | | 200,283 | |
FNMA ± | | | 2.25 | | | | 01/01/2027 | | | | 51,833 | | | | 54,041 | |
FNMA ± | | | 2.25 | | | | 04/01/2030 | | | | 229,393 | | | | 241,782 | |
FNMA ± | | | 2.26 | | | | 04/01/2035 | | | | 5,442,798 | | | | 5,731,698 | |
FNMA ± | | | 2.26 | | | | 07/01/2025 | | | | 7,461 | | | | 7,605 | |
FNMA ± | | | 2.28 | | | | 12/01/2033 | | | | 2,669,738 | | | | 2,815,334 | |
FNMA ± | | | 2.28 | | | | 12/01/2039 | | | | 484,776 | | | | 509,660 | |
FNMA ± | | | 2.28 | | | | 07/01/2038 | | | | 2,647,167 | | | | 2,782,461 | |
FNMA ± | | | 2.29 | | | | 07/01/2035 | | | | 2,859,773 | | | | 2,961,349 | |
FNMA ± | | | 2.30 | | | | 12/01/2024 | | | | 44,339 | | | | 46,469 | |
FNMA ± | | | 2.31 | | | | 12/01/2023 | | | | 14,923 | | | | 15,051 | |
FNMA ± | | | 2.31 | | | | 08/01/2025 | | | | 61,200 | | | | 64,623 | |
FNMA ± | | | 2.31 | | | | 03/01/2031 | | | | 97,596 | | | | 103,194 | |
FNMA ± | | | 2.32 | | | | 06/01/2035 | | | | 5,265,465 | | | | 5,573,209 | |
The accompanying notes are an integral part of these financial statements.
| | | | | | |
| Portfolio of Investments—February 29, 2012 (Unaudited) | | Wells Fargo Advantage Adjustable Rate Government Fund | | | 13 | |
| | | | | | | | | | | | | | | | |
| Security Name | | Interest Rate | | | Maturity Date | | | Principal | | | Value | |
| | | | | | | | | | | | | | | | |
| | | |
| Agency Securities (continued) | | | | | | | | | | | | | |
FNMA ± | | | 2.32 | % | | | 02/01/2035 | | | $ | 13,248,253 | | | $ | 13,899,353 | |
FNMA ± | | | 2.33 | | | | 08/01/2035 | | | | 1,059,287 | | | | 1,094,123 | |
FNMA ± | | | 2.33 | | | | 04/01/2034 | | | | 7,567,932 | | | | 7,989,860 | |
FNMA ± | | | 2.34 | | | | 09/01/2032 | | | | 155,201 | | | | 156,327 | |
FNMA ± | | | 2.35 | | | | 08/01/2031 | | | | 150,725 | | | | 152,293 | |
FNMA ± | | | 2.35 | | | | 10/01/2034 | | | | 1,084,184 | | | | 1,160,417 | |
FNMA ± | | | 2.35 | | | | 09/01/2033 | | | | 69,499 | | | | 73,138 | |
FNMA ± | | | 2.35 | | | | 08/01/2036 | | | | 5,570,644 | | | | 5,800,908 | |
FNMA ± | | | 2.35 | | | | 05/01/2037 | | | | 9,548,649 | | | | 10,137,981 | |
FNMA ± | | | 2.36 | | | | 01/01/2027 | | | | 1,249,113 | | | | 1,320,970 | |
FNMA ± | | | 2.36 | | | | 07/01/2048 | | | | 8,664,897 | | | | 9,147,882 | |
FNMA ± | | | 2.36 | | | | 07/01/2038 | | | | 1,945,257 | | | | 2,049,906 | |
FNMA ± | | | 2.36 | | | | 07/01/2035 | | | | 5,191,890 | | | | 5,537,596 | |
FNMA ± | | | 2.37 | | | | 12/01/2025 | | | | 28,538 | | | | 28,633 | |
FNMA ± | | | 2.37 | | | | 06/01/2026 | | | | 139,492 | | | | 147,728 | |
FNMA ± | | | 2.37 | | | | 03/01/2028 | | | | 174,257 | | | | 174,479 | |
FNMA ± | | | 2.37 | | | | 05/01/2035 | | | | 5,615,243 | | | | 5,913,697 | |
FNMA ± | | | 2.37 | | | | 06/01/2027 | | | | 4,440 | | | | 4,669 | |
FNMA ± | | | 2.37 | | | | 05/01/2033 | | | | 2,021,816 | | | | 2,101,108 | |
FNMA ± | | | 2.38 | | | | 07/01/2017 | | | | 2,395 | | | | 2,415 | |
FNMA ± | | | 2.38 | | | | 02/01/2019 | | | | 3,024 | | | | 3,032 | |
FNMA ± | | | 2.38 | | | | 05/01/2033 | | | | 9,490,753 | | | | 10,004,695 | |
FNMA ± | | | 2.38 | | | | 07/01/2038 | | | | 5,963,272 | | | | 6,316,157 | |
FNMA ± | | | 2.38 | | | | 11/01/2027 | | | | 73,032 | | | | 77,116 | |
FNMA ± | | | 2.38 | | | | 05/01/2033 | | | | 1,177,262 | | | | 1,247,709 | |
FNMA ± | | | 2.38 | | | | 10/01/2035 | | | | 6,903,738 | | | | 7,273,868 | |
FNMA ± | | | 2.39 | | | | 02/01/2035 | | | | 9,353,560 | | | | 9,908,948 | |
FNMA ± | | | 2.40 | | | | 02/01/2036 | | | | 12,601,993 | | | | 13,394,522 | |
FNMA ± | | | 2.41 | | | | 04/01/2033 | | | | 1,154,243 | | | | 1,227,019 | |
FNMA ± | | | 2.41 | | | | 07/01/2035 | | | | 3,233,323 | | | | 3,442,109 | |
FNMA ± | | | 2.41 | | | | 12/01/2040 | | | | 17,465,102 | | | | 18,419,866 | |
FNMA ± | | | 2.41 | | | | 04/01/2034 | | | | 1,212,937 | | | | 1,277,967 | |
FNMA ± | | | 2.42 | | | | 04/01/2028 | | | | 52,633 | | | | 52,951 | |
FNMA ± | | | 2.42 | | | | 12/01/2030 | | | | 95,210 | | | | 96,448 | |
FNMA ± | | | 2.42 | | | | 09/01/2034 | | | | 3,603,469 | | | | 3,830,001 | |
FNMA ± | | | 2.42 | | | | 07/01/2035 | | | | 6,392,448 | | | | 6,778,587 | |
FNMA ± | | | 2.42 | | | | 04/01/2033 | | | | 1,929,833 | | | | 2,033,262 | |
FNMA ± | | | 2.43 | | | | 06/01/2032 | | | | 397,303 | | | | 407,221 | |
FNMA ± | | | 2.43 | | | | 03/01/2035 | | | | 3,028,092 | | | | 3,206,789 | |
FNMA ± | | | 2.43 | | | | 05/01/2018 | | | | 298,045 | | | | 299,343 | |
FNMA ± | | | 2.44 | | | | 09/01/2026 | | | | 246,940 | | | | 249,806 | |
FNMA ± | | | 2.44 | | | | 05/01/2025 | | | | 129,990 | | | | 138,080 | |
FNMA ± | | | 2.44 | | | | 02/01/2033 | | | | 554,729 | | | | 588,323 | |
FNMA ± | | | 2.44 | | | | 06/01/2027 | | | | 136,659 | | | | 145,048 | |
FNMA ± | | | 2.45 | | | | 06/01/2032 | | | | 60,218 | | | | 62,210 | |
FNMA ± | | | 2.45 | | | | 07/01/2048 | | | | 12,395,411 | | | | 13,122,833 | |
FNMA ± | | | 2.45 | | | | 11/01/2034 | | | | 13,397,529 | | | | 14,202,890 | |
FNMA ± | | | 2.45 | | | | 09/01/2028 | | | | 132,350 | | | | 133,421 | |
FNMA ± | | | 2.46 | | | | 11/01/2024 | | | | 297,473 | | | | 315,688 | |
FNMA ± | | | 2.46 | | | | 08/01/2035 | | | | 2,312,632 | | | | 2,392,620 | |
The accompanying notes are an integral part of these financial statements.
| | | | |
| 14 | | Wells Fargo Advantage Adjustable Rate Government Fund | | Portfolio of Investments—February 29, 2012 (Unaudited) |
| | | | | | | | | | | | | | | | |
| Security Name | | Interest Rate | | | Maturity Date | | | Principal | | | Value | |
| | | | | | | | | | | | | | | | |
| | | |
| Agency Securities (continued) | | | | | | | | | | | | | |
FNMA ± | | | 2.46 | % | | | 12/01/2040 | | | $ | 9,542,977 | | | $ | 10,112,728 | |
FNMA ± | | | 2.46 | | | | 10/01/2024 | | | | 561,727 | | | | 600,416 | |
FNMA ± | | | 2.46 | | | | 03/01/2035 | | | | 9,749,041 | | | | 10,285,070 | |
FNMA ± | | | 2.46 | | | | 06/01/2035 | | | | 3,559,144 | | | | 3,741,249 | |
FNMA ± | | | 2.46 | | | | 04/01/2042 | | | | 5,506,562 | | | | 5,749,908 | |
FNMA ± | | | 2.46 | | | | 06/01/2032 | | | | 179,104 | | | | 182,382 | |
FNMA ± | | | 2.46 | | | | 04/01/2024 | | | | 97,781 | | | | 103,986 | |
FNMA ± | | | 2.46 | | | | 01/01/2028 | | | | 12,702 | | | | 13,477 | |
FNMA ± | | | 2.47 | | | | 04/01/2030 | | | | 21,986 | | | | 23,158 | |
FNMA ± | | | 2.47 | | | | 07/01/2030 | | | | 134,992 | | | | 136,048 | |
FNMA ± | | | 2.47 | | | | 02/01/2033 | | | | 178,249 | | | | 178,663 | |
FNMA ± | | | 2.47 | | | | 04/01/2033 | | | | 3,544,152 | | | | 3,681,582 | |
FNMA ± | | | 2.47 | | | | 10/01/2017 | | | | 112,368 | | | | 115,112 | |
FNMA ± | | | 2.47 | | | | 01/01/2018 | | | | 124,547 | | | | 128,008 | |
FNMA ± | | | 2.47 | | | | 11/01/2023 | | | | 52,788 | | | | 53,810 | |
FNMA ± | | | 2.47 | | | | 04/01/2036 | | | | 10,301,645 | | | | 10,920,441 | |
FNMA ± | | | 2.47 | | | | 05/01/2036 | | | | 5,406,138 | | | | 5,752,780 | |
FNMA ± | | | 2.47 | | | | 09/01/2030 | | | | 371,499 | | | | 394,277 | |
FNMA ± | | | 2.47 | | | | 02/01/2032 | | | | 3,488,965 | | | | 3,627,342 | |
FNMA ± | | | 2.47 | | | | 12/01/2028 | | | | 100,534 | | | | 106,776 | |
FNMA ± | | | 2.47 | | | | 05/01/2034 | | | | 2,395,498 | | | | 2,525,984 | |
FNMA ± | | | 2.47 | | | | 06/01/2034 | | | | 7,656,507 | | | | 8,068,029 | |
FNMA ± | | | 2.48 | | | | 09/01/2030 | | | | 22,607 | | | | 22,909 | |
FNMA ± | | | 2.48 | | | | 06/01/2038 | | | | 8,744,154 | | | | 9,307,157 | |
FNMA ± | | | 2.49 | | | | 07/01/2028 | | | | 386 | | | | 409 | |
FNMA ± | | | 2.49 | | | | 11/01/2035 | | | | 5,887,839 | | | | 6,230,799 | |
FNMA ± | | | 2.49 | | | | 05/01/2018 | | | | 12,039 | | | | 12,072 | |
FNMA ± | | | 2.50 | | | | 05/01/2032 | | | | 325,189 | | | | 328,540 | |
FNMA ± | | | 2.50 | | | | 04/01/2024 | | | | 42,100 | | | | 44,113 | |
FNMA ± | | | 2.50 | | | | 11/01/2034 | | | | 4,899,142 | | | | 5,214,626 | |
FNMA ± | | | 2.50 | | | | 01/01/2035 | | | | 1,967,828 | | | | 2,011,422 | |
FNMA ± | | | 2.50 | | | | 05/01/2017 | | | | 104,899 | | | | 107,068 | |
FNMA ± | | | 2.50 | | | | 07/01/2017 | | | | 5,771 | | | | 5,847 | |
FNMA ± | | | 2.50 | | | | 01/01/2018 | | | | 1,294,679 | | | | 1,338,134 | |
FNMA ± | | | 2.50 | | | | 03/01/2021 | | | | 1,568 | | | | 1,593 | |
FNMA ± | | | 2.50 | | | | 06/01/2025 | | | | 11,383 | | | | 11,411 | |
FNMA ± | | | 2.50 | | | | 07/01/2027 | | | | 549,690 | | | | 586,617 | |
FNMA ± | | | 2.50 | | | | 03/01/2030 | | | | 58,475 | | | | 60,408 | |
FNMA ± | | | 2.51 | | | | 04/01/2019 | | | | 11,240 | | | | 11,270 | |
FNMA ± | | | 2.51 | | | | 07/01/2035 | | | | 2,585,404 | | | | 2,747,083 | |
FNMA ± | | | 2.51 | | | | 11/01/2024 | | | | 18,926 | | | | 19,396 | |
FNMA ± | | | 2.51 | | | | 06/01/2036 | | | | 7,398,880 | | | | 7,869,138 | |
FNMA ± | | | 2.52 | | | | 07/01/2027 | | | | 211,555 | | | | 225,548 | |
FNMA ± | | | 2.53 | | | | 04/01/2021 | | | | 130,417 | | | | 132,481 | |
FNMA ± | | | 2.53 | | | | 07/01/2024 | | | | 19,606 | | | | 20,512 | |
FNMA ± | | | 2.53 | | | | 02/01/2035 | | | | 3,144,747 | | | | 3,318,109 | |
FNMA ± | | | 2.53 | | | | 08/01/2039 | | | | 11,902,078 | | | | 12,684,704 | |
FNMA ± | | | 2.54 | | | | 12/01/2021 | | | | 192,325 | | | | 194,524 | |
FNMA ± | | | 2.54 | | | | 01/01/2035 | | | | 4,047,658 | | | | 4,310,010 | |
FNMA ± | | | 2.54 | | | | 09/01/2036 | | | | 2,215,575 | | | | 2,363,620 | |
The accompanying notes are an integral part of these financial statements.
| | | | | | |
| Portfolio of Investments—February 29, 2012 (Unaudited) | | Wells Fargo Advantage Adjustable Rate Government Fund | | | 15 | |
| | | | | | | | | | | | | | | | |
| Security Name | | Interest Rate | | | Maturity Date | | | Principal | | | Value | |
| | | | | | | | | | | | | | | | |
| | | |
| Agency Securities (continued) | | | | | | | | | | | | | |
FNMA ± | | | 2.54 | % | | | 06/01/2035 | | | $ | 3,802,111 | | | $ | 4,009,889 | |
FNMA ± | | | 2.54 | | | | 08/01/2017 | | | | 874,635 | | | | 891,467 | |
FNMA ± | | | 2.55 | | | | 08/01/2035 | | | | 5,883,864 | | | | 6,274,023 | |
FNMA ± | | | 2.55 | | | | 09/01/2033 | | | | 12,849,807 | | | | 13,719,048 | |
FNMA ± | | | 2.55 | | | | 12/01/2033 | | | | 4,331,206 | | | | 4,601,952 | |
FNMA ± | | | 2.55 | | | | 12/01/2033 | | | | 3,997,748 | | | | 4,211,685 | |
FNMA ± | | | 2.56 | | | | 04/01/2018 | | | | 1,183,689 | | | | 1,207,455 | |
FNMA ± | | | 2.56 | | | | 09/01/2032 | | | | 11,374,055 | | | | 12,043,641 | |
FNMA ± | | | 2.56 | | | | 07/01/2017 | | | | 245,553 | | | | 250,751 | |
FNMA ± | | | 2.56 | | | | 05/01/2035 | | | | 4,223,222 | | | | 4,456,497 | |
FNMA ± | | | 2.56 | | | | 09/01/2037 | | | | 10,656,208 | | | | 11,438,021 | |
FNMA ± | | | 2.57 | | | | 03/01/2033 | | | | 4,295,659 | | | | 4,549,554 | |
FNMA ± | | | 2.57 | | | | 01/01/2038 | | | | 1,430,314 | | | | 1,470,370 | |
FNMA ± | | | 2.57 | | | | 12/01/2030 | | | | 1,414,822 | | | | 1,499,992 | |
FNMA ± | | | 2.57 | | | | 04/01/2028 | | | | 628,288 | | | | 667,974 | |
FNMA ± | | | 2.58 | | | | 09/01/2022 | | | | 980,648 | | | | 1,044,336 | |
FNMA ± | | | 2.58 | | | | 03/01/2033 | | | | 9,028 | | | | 9,104 | |
FNMA ± | | | 2.58 | | | | 03/01/2035 | | | | 6,443,353 | | | | 6,864,419 | |
FNMA ± | | | 2.58 | | | | 02/01/2036 | | | | 9,668,220 | | | | 10,325,727 | |
FNMA ± | | | 2.58 | | | | 03/01/2027 | | | | 227,865 | | | | 228,597 | |
FNMA ± | | | 2.58 | | | | 07/01/2033 | | | | 2,470,068 | | | | 2,641,650 | |
FNMA ± | | | 2.58 | | | | 05/01/2036 | | | | 9,004,193 | | | | 9,504,566 | |
FNMA ± | | | 2.59 | | | | 01/01/2036 | | | | 16,617,827 | | | | 17,748,786 | |
FNMA ± | | | 2.60 | | | | 12/01/2017 | | | | 119,190 | | | | 120,762 | |
FNMA ± | | | 2.60 | | | | 04/01/2035 | | | | 4,414,439 | | | | 4,706,984 | |
FNMA ± | | | 2.60 | | | | 06/01/2027 | | | | 112,388 | | | | 119,723 | |
FNMA ± | | | 2.61 | | | | 05/01/2027 | | | | 131,003 | | | | 139,009 | |
FNMA ± | | | 2.61 | | | | 01/01/2032 | | | | 246,007 | | | | 261,288 | |
FNMA ± | | | 2.61 | | | | 06/01/2030 | | | | 260,089 | | | | 276,540 | |
FNMA ± | | | 2.62 | | | | 04/01/2035 | | | | 4,382,364 | | | | 4,678,130 | |
FNMA ± | | | 2.62 | | | | 08/01/2040 | | | | 1,837,466 | | | | 1,947,305 | |
FNMA ± | | | 2.62 | | | | 06/01/2032 | | | | 286,819 | | | | 304,755 | |
FNMA ± | | | 2.62 | | | | 10/01/2033 | | | | 31,445,720 | | | | 33,565,809 | |
FNMA ± | | | 2.63 | | | | 08/01/2017 | | | | 1,906 | | | | 1,931 | |
FNMA ± | | | 2.64 | | | | 07/01/2020 | | | | 354,788 | | | | 374,196 | |
FNMA ± | | | 2.64 | | | | 11/01/2024 | | | | 109,252 | | | | 110,143 | |
FNMA ± | | | 2.65 | | | | 10/01/2024 | | | | 63,034 | | | | 63,394 | |
FNMA ± | | | 2.65 | | | | 04/01/2036 | | | | 487,106 | | | | 506,812 | |
FNMA ± | | | 2.65 | | | | 06/01/2033 | | | | 667,443 | | | | 709,040 | |
FNMA ± | | | 2.65 | | | | 06/01/2024 | | | | 71,455 | | | | 75,029 | |
FNMA ± | | | 2.65 | | | | 11/01/2020 | | | | 1,575,566 | | | | 1,631,471 | |
FNMA ± | | | 2.68 | | | | 04/01/2032 | | | | 100,852 | | | | 106,597 | |
FNMA ± | | | 2.69 | | | | 05/01/2036 | | | | 7,543,074 | | | | 8,000,711 | |
FNMA ± | | | 2.70 | | | | 10/01/2018 | | | | 1,086,800 | | | | 1,118,303 | |
FNMA ± | | | 2.70 | | | | 10/01/2029 | | | | 743,161 | | | | 789,440 | |
FNMA ± | | | 2.70 | | | | 01/01/2033 | | | | 4,861,785 | | | | 5,186,400 | |
FNMA ± | | | 2.72 | | | | 04/01/2018 | | | | 10,345 | | | | 10,492 | |
FNMA ± | | | 2.72 | | | | 03/01/2018 | | | | 2,279 | | | | 2,288 | |
FNMA ± | | | 2.72 | | | | 03/01/2032 | | | | 156,409 | | | | 166,489 | |
FNMA ± | | | 2.72 | | | | 10/01/2025 | | | | 22,821 | | | | 24,256 | |
The accompanying notes are an integral part of these financial statements.
| | | | |
| 16 | | Wells Fargo Advantage Adjustable Rate Government Fund | | Portfolio of Investments—February 29, 2012 (Unaudited) |
| | | | | | | | | | | | | | | | |
| Security Name | | Interest Rate | | | Maturity Date | | | Principal | | | Value | |
| | | | | | | | | | | | | | | | |
| | | |
| Agency Securities (continued) | | | | | | | | | | | | | |
FNMA ± | | | 2.72 | % | | | 02/01/2028 | | | $ | 55,342 | | | $ | 58,627 | |
FNMA ± | | | 2.73 | | | | 09/01/2033 | | | | 80,161 | | | | 80,509 | |
FNMA ± | | | 2.74 | | | | 09/01/2035 | | | | 1,628,567 | | | | 1,748,683 | |
FNMA ± | | | 2.74 | | | | 09/01/2017 | | | | 691,098 | | | | 713,443 | |
FNMA ± | | | 2.74 | | | | 10/01/2018 | | | | 267,416 | | | | 273,461 | |
FNMA ± | | | 2.75 | | | | 05/01/2018 | | | | 781,075 | | | | 807,734 | |
FNMA ± | | | 2.75 | | | | 01/01/2019 | | | | 222,001 | | | | 228,672 | |
FNMA ± | | | 2.76 | | | | 04/01/2033 | | | | 810,630 | | | | 859,750 | |
FNMA ± | | | 2.76 | | | | 06/01/2040 | | | | 1,511,114 | | | | 1,569,538 | |
FNMA ± | | | 2.78 | | | | 01/01/2036 | | | | 752,597 | | | | 764,455 | |
FNMA ± | | | 2.78 | | | | 04/01/2040 | | | | 466,517 | | | | 492,006 | |
FNMA ± | | | 2.78 | | | | 08/01/2035 | | | | 6,748,515 | | | | 7,218,013 | |
FNMA ± | | | 2.79 | | | | 07/01/2020 | | | | 3,260,265 | | | | 3,326,433 | |
FNMA ± | | | 2.79 | | | | 08/01/2026 | | | | 150,095 | | | | 150,598 | |
FNMA ± | | | 2.80 | | | | 01/01/2025 | | | | 83,221 | | | | 84,067 | |
FNMA ± | | | 2.80 | | | | 09/01/2019 | | | | 14,722 | | | | 14,798 | |
FNMA ± | | | 2.82 | | | | 06/01/2023 | | | | 993 | | | | 1,001 | |
FNMA ± | | | 2.83 | | | | 11/01/2034 | | | | 3,762,732 | | | | 4,007,078 | |
FNMA ± | | | 2.84 | | | | 11/01/2035 | | | | 22,919,830 | | | | 24,471,413 | |
FNMA ± | | | 2.85 | | | | 04/01/2026 | | | | 10,531 | | | | 10,621 | |
FNMA ± | | | 2.85 | | | | 10/01/2028 | | | | 328,739 | | | | 349,091 | |
FNMA ± | | | 2.87 | | | | 08/01/2026 | | | | 1,491,093 | | | | 1,574,144 | |
FNMA ± | | | 2.88 | | | | 06/01/2019 | | | | 1,515 | | | | 1,537 | |
FNMA ± | | | 2.88 | | | | 02/01/2035 | | | | 3,162,105 | | | | 3,324,149 | |
FNMA ± | | | 2.89 | | | | 02/01/2018 | | | | 19,077 | | | | 19,356 | |
FNMA ± | | | 2.89 | | | | 07/01/2039 | | | | 4,028,032 | | | | 4,320,130 | |
FNMA ± | | | 2.89 | | | | 03/01/2033 | | | | 1,259,194 | | | | 1,319,174 | |
FNMA ± | | | 2.90 | | | | 07/01/2028 | | | | 473,366 | | | | 502,359 | |
FNMA ± | | | 2.90 | | | | 10/01/2029 | | | | 293,086 | | | | 295,204 | |
FNMA ± | | | 2.93 | | | | 04/01/2030 | | | | 61,195 | | | | 63,988 | |
FNMA ± | | | 2.94 | | | | 09/01/2018 | | | | 11,856 | | | | 12,490 | |
FNMA ± | | | 2.94 | | | | 05/01/2019 | | | | 3,377 | | | | 3,414 | |
FNMA ± | | | 2.96 | | | | 11/01/2018 | | | | 9,307 | | | | 9,395 | |
FNMA ± | | | 2.96 | | | | 11/01/2017 | | | | 142,284 | | | | 144,204 | |
FNMA ± | | | 2.97 | | | | 06/01/2017 | | | | 48,805 | | | | 49,464 | |
FNMA ± | | | 2.98 | | | | 11/01/2027 | | | | 3,991 | | | | 4,064 | |
FNMA ± | | | 2.99 | | | | 11/01/2031 | | | | 101,553 | | | | 101,737 | |
FNMA ± | | | 3.00 | | | | 06/01/2016 | | | | 195,448 | | | | 201,591 | |
FNMA ± | | | 3.00 | | | | 07/01/2016 | | | | 35,963 | | | | 37,210 | |
FNMA ± | | | 3.00 | | | | 05/01/2017 | | | | 80,335 | | | | 81,423 | |
FNMA ± | | | 3.00 | | | | 07/01/2017 | | | | 10,807 | | | | 10,953 | |
FNMA ± | | | 3.00 | | | | 08/01/2018 | | | | 155,148 | | | | 161,010 | |
FNMA ± | | | 3.00 | | | | 12/01/2028 | | | | 291,392 | | | | 302,492 | |
FNMA ± | | | 3.00 | | | | 01/01/2029 | | | | 38,890 | | | | 40,361 | |
FNMA ± | | | 3.00 | | | | 01/01/2036 | | | | 226,752 | | | | 230,363 | |
FNMA ± | | | 3.01 | | | | 01/01/2033 | | | | 185,157 | | | | 186,191 | |
FNMA ± | | | 3.02 | | | | 01/01/2031 | | | | 93,493 | | | | 93,874 | |
FNMA ± | | | 3.03 | | | | 11/01/2022 | | | | 109,132 | | | | 113,877 | |
FNMA ± | | | 3.04 | | | | 09/01/2032 | | | | 206,755 | | | | 211,010 | |
FNMA ± | | | 3.05 | | | | 09/01/2032 | | | | 2,354,952 | | | | 2,520,585 | |
The accompanying notes are an integral part of these financial statements.
| | | | | | |
| Portfolio of Investments—February 29, 2012 (Unaudited) | | Wells Fargo Advantage Adjustable Rate Government Fund | | | 17 | |
| | | | | | | | | | | | | | | | |
| Security Name | | Interest Rate | | | Maturity Date | | | Principal | | | Value | |
| | | | | | | | | | | | | | | | |
| | | |
| Agency Securities (continued) | | | | | | | | | | | | | |
FNMA ± | | | 3.07 | % | | | 04/01/2040 | | | $ | 4,078,708 | | | $ | 4,376,475 | |
FNMA ± | | | 3.07 | | | | 08/01/2030 | | | | 278,652 | | | | 289,973 | |
FNMA ± | | | 3.09 | | | | 03/01/2030 | | | | 193,711 | | | | 205,508 | |
FNMA ± | | | 3.11 | | | | 09/01/2033 | | | | 46,070 | | | | 46,232 | |
FNMA ± | | | 3.13 | | | | 05/01/2028 | | | | 146,198 | | | | 149,056 | |
FNMA ± | | | 3.13 | | | | 09/01/2030 | | | | 1,192,598 | | | | 1,257,226 | |
FNMA ± | | | 3.16 | | | | 09/01/2033 | | | | 202,146 | | | | 202,750 | |
FNMA ± | | | 3.16 | | | | 01/01/2019 | | | | 7,425 | | | | 7,456 | |
FNMA ± | | | 3.17 | | | | 01/01/2033 | | | | 77,492 | | | | 77,547 | |
FNMA ± | | | 3.20 | | | | 04/01/2024 | | | | 575,517 | | | | 609,063 | |
FNMA ± | | | 3.21 | | | | 10/01/2017 | | | | 12,431 | | | | 12,626 | |
FNMA ± | | | 3.22 | | | | 07/01/2017 | | | | 186,771 | | | | 188,023 | |
FNMA ± | | | 3.25 | | | | 09/01/2017 | | | | 4,503 | | | | 4,544 | |
FNMA ± | | | 3.26 | | | | 10/01/2024 | | | | 29,669 | | | | 31,405 | |
FNMA ± | | | 3.26 | | | | 05/01/2028 | | | | 424,601 | | | | 432,950 | |
FNMA ± | | | 3.30 | | | | 09/01/2019 | | | | 95,903 | | | | 97,562 | |
FNMA ± | | | 3.33 | | | | 01/01/2029 | | | | 59,959 | | | | 62,532 | |
FNMA ± | | | 3.34 | | | | 09/01/2021 | | | | 205,727 | | | | 207,052 | |
FNMA ± | | | 3.37 | | | | 07/01/2019 | | | | 5,028 | | | | 5,193 | |
FNMA ± | | | 3.38 | | | | 09/01/2016 | | | | 49 | | | | 49 | |
FNMA ± | | | 3.38 | | | | 06/01/2018 | | | | 54,902 | | | | 55,833 | |
FNMA ± | | | 3.39 | | | | 11/01/2028 | | | | 447,756 | | | | 475,015 | |
FNMA ± | | | 3.40 | | | | 11/01/2024 | | | | 198,079 | | | | 198,407 | |
FNMA ± | | | 3.40 | | | | 07/01/2033 | | | | 32,731 | | | | 32,819 | |
FNMA ± | | | 3.40 | | | | 02/01/2029 | | | | 214,731 | | | | 227,604 | |
FNMA ± | | | 3.42 | | | | 11/01/2029 | | | | 13,300 | | | | 14,068 | |
FNMA ± | | | 3.42 | | | | 08/01/2029 | | | | 1,509,750 | | | | 1,601,523 | |
FNMA ± | | | 3.44 | | | | 07/01/2028 | | | | 170,402 | | | | 173,779 | |
FNMA ± | | | 3.45 | | | | 11/01/2031 | | | | 50,375 | | | | 50,595 | |
FNMA ± | | | 3.46 | | | | 04/01/2020 | | | | 2,902,511 | | | | 3,044,971 | |
FNMA ± | | | 3.48 | | | | 09/01/2033 | | | | 102,938 | | | | 103,114 | |
FNMA ± | | | 3.51 | | | | 05/01/2017 | | | | 156,716 | | | | 165,986 | |
FNMA ± | | | 3.58 | | | | 10/01/2017 | | | | 619,942 | | | | 629,890 | |
FNMA ± | | | 3.66 | | | | 02/01/2029 | | | | 3,552,432 | | | | 3,783,518 | |
FNMA ± | | | 3.67 | | | | 01/01/2021 | | | | 1,141,627 | | | | 1,174,536 | |
FNMA ± | | | 3.73 | | | | 10/01/2034 | | | | 961,706 | | | | 972,123 | |
FNMA ± | | | 3.73 | | | | 01/01/2017 | | | | 2,721 | | | | 2,742 | |
FNMA ± | | | 3.82 | | | | 03/01/2030 | | | | 27,014 | | | | 28,171 | |
FNMA ± | | | 3.82 | | | | 04/01/2034 | | | | 2,560,955 | | | | 2,732,074 | |
FNMA ± | | | 3.86 | | | | 12/01/2050 | | | | 238,042 | | | | 240,401 | |
FNMA ± | | | 3.94 | | | | 12/01/2032 | | | | 241,517 | | | | 254,986 | |
FNMA ± | | | 3.97 | | | | 07/01/2021 | | | | 390,648 | | | | 393,030 | |
FNMA ± | | | 3.98 | | | | 10/01/2025 | | | | 17,179 | | | | 18,151 | |
FNMA ± | | | 4.00 | | | | 03/01/2023 | | | | 10,275 | | | | 10,355 | |
FNMA ± | | | 4.01 | | | | 04/01/2032 | | | | 279,064 | | | | 280,977 | |
FNMA ± | | | 4.04 | | | | 05/01/2018 | | | | 1,752 | | | | 1,788 | |
FNMA ± | | | 4.07 | | | | 07/01/2017 | | | | 81,780 | | | | 86,849 | |
FNMA ± | | | 4.15 | | | | 06/01/2034 | | | | 743,006 | | | | 782,440 | |
FNMA ± | | | 4.17 | | | | 02/01/2033 | | | | 108,192 | | | | 108,998 | |
FNMA ± | | | 4.20 | | | | 11/01/2031 | | | | 182,620 | | | | 182,894 | |
The accompanying notes are an integral part of these financial statements.
| | | | |
| 18 | | Wells Fargo Advantage Adjustable Rate Government Fund | | Portfolio of Investments—February 29, 2012 (Unaudited) |
| | | | | | | | | | | | | | | | |
| Security Name | | Interest Rate | | | Maturity Date | | | Principal | | | Value | |
| | | | | | | | | | | | | | | | |
| | | |
| Agency Securities (continued) | | | | | | | | | | | | | |
FNMA ± | | | 4.23 | % | | | 09/01/2017 | | | $ | 9,089 | | | $ | 9,103 | |
FNMA ± | | | 4.26 | | | | 08/01/2017 | | | | 49,898 | | | | 51,623 | |
FNMA ± | | | 4.30 | | | | 01/01/2018 | | | | 1,642 | | | | 1,646 | |
FNMA ± | | | 4.32 | | | | 04/01/2018 | | | | 45 | | | | 46 | |
FNMA ± | | | 4.32 | | | | 09/01/2028 | | | | 17,651 | | | | 18,334 | |
FNMA ± | | | 4.34 | | | | 09/01/2031 | | | | 432,283 | | | | 437,777 | |
FNMA ± | | | 4.46 | | | | 05/01/2017 | | | | 2,890 | | | | 2,907 | |
FNMA ± | | | 4.46 | | | | 05/01/2034 | | | | 1,168,110 | | | | 1,225,336 | |
FNMA ± | | | 4.49 | | | | 04/01/2020 | | | | 24,224 | | | | 24,416 | |
FNMA ± | | | 4.52 | | | | 12/01/2036 | | | | 267,297 | | | | 281,315 | |
FNMA ± | | | 4.65 | | | | 03/01/2014 | | | | 530 | | | | 531 | |
FNMA ± | | | 4.73 | | | | 02/01/2019 | | | | 648,338 | | | | 688,789 | |
FNMA ± | | | 4.75 | | | | 04/01/2019 | | | | 1,774 | | | | 1,800 | |
FNMA ± | | | 4.85 | | | | 06/01/2025 | | | | 42,647 | | | | 42,935 | |
FNMA ± | | | 4.86 | | | | 06/01/2024 | | | | 89,409 | | | | 89,952 | |
FNMA ± | | | 4.86 | | | | 01/01/2019 | | | | 1,003,952 | | | | 1,065,710 | |
FNMA ± | | | 5.06 | | | | 10/01/2018 | | | | 107 | | | | 113 | |
FNMA ± | | | 5.08 | | | | 04/01/2018 | | | | 558,447 | | | | 596,003 | |
FNMA ± | | | 5.08 | | | | 01/01/2023 | | | | 46,211 | | | | 49,493 | |
FNMA ± | | | 5.09 | | | | 08/01/2031 | | | | 78,040 | | | | 83,033 | |
FNMA ± | | | 5.16 | | | | 06/01/2028 | | | | 74,442 | | | | 77,240 | |
FNMA ± | | | 5.20 | | | | 09/01/2023 | | | | 10,521 | | | | 10,614 | |
FNMA ± | | | 5.34 | | | | 11/01/2014 | | | | 4,359 | | | | 4,397 | |
FNMA ± | | | 5.55 | | | | 01/01/2019 | | | | 203,917 | | | | 219,248 | |
FNMA ± | | | 5.57 | | | | 06/01/2019 | | | | 8,416 | | | | 8,487 | |
FNMA ± | | | 5.59 | | | | 06/01/2033 | | | | 424,314 | | | | 428,940 | |
FNMA ± | | | 5.66 | | | | 06/01/2028 | | | | 136,783 | | | | 147,587 | |
FNMA ± | | | 5.85 | | | | 03/01/2014 | | | | 18,801 | | | | 19,901 | |
FNMA ± | | | 5.96 | | | | 05/01/2025 | | | | 1,427 | | | | 1,438 | |
FNMA ± | | | 5.99 | | | | 09/01/2017 | | | | 1,165 | | | | 1,195 | |
FNMA ± | | | 6.00 | | | | 02/01/2017 | | | | 6,497 | | | | 6,532 | |
FNMA ± | | | 6.00 | | | | 01/01/2020 | | | | 27,299 | | | | 28,161 | |
FNMA ± | | | 6.00 | | | | 11/01/2021 | | | | 14,689 | | | | 14,717 | |
FNMA ± | | | 6.06 | | | | 11/01/2019 | | | | 531 | | | | 537 | |
FNMA ± | | | 6.25 | | | | 10/01/2021 | | | | 23,068 | | | | 23,162 | |
FNMA ± | | | 6.45 | | | | 02/01/2034 | | | | 94,045 | | | | 94,756 | |
FNMA | | | 6.50 | | | | 08/01/2028 | | | | 454,849 | | | | 517,120 | |
FNMA | | | 6.50 | | | | 05/01/2031 | | | | 273,988 | | | | 313,823 | |
FNMA ± | | | 6.72 | | | | 03/01/2023 | | | | 7,441 | | | | 7,450 | |
FNMA | | | 7.00 | | | | 11/01/2014 | | | | 9,794 | | | | 10,347 | |
FNMA | | | 7.00 | | | | 11/01/2017 | | | | 39,138 | | | | 42,863 | |
FNMA | | | 7.06 | | | | 11/01/2024 | | | | 61,171 | | | | 69,996 | |
FNMA | | | 7.06 | | | | 12/01/2024 | | | | 39,612 | | | | 45,327 | |
FNMA | | | 7.06 | | | | 01/01/2025 | | | | 38,527 | | | | 44,085 | |
FNMA | | | 7.06 | | | | 03/01/2025 | | | | 75,704 | | | | 86,625 | |
FNMA | | | 7.06 | | | | 03/01/2025 | | | | 15,115 | | | | 17,296 | |
FNMA | | | 7.06 | | | | 04/01/2025 | | | | 26,712 | | | | 30,616 | |
FNMA | | | 7.06 | | | | 01/01/2027 | | | | 68,893 | | | | 79,319 | |
FNMA | | | 7.50 | | | | 02/01/2016 | | | | 353,212 | | | | 380,485 | |
FNMA | | | 7.50 | | | | 01/01/2031 | | | | 273,905 | | | | 327,122 | |
The accompanying notes are an integral part of these financial statements.
| | | | | | |
| Portfolio of Investments—February 29, 2012 (Unaudited) | | Wells Fargo Advantage Adjustable Rate Government Fund | | | 19 | |
| | | | | | | | | | | | | | | | |
| Security Name | | Interest Rate | | | Maturity Date | | | Principal | | | Value | |
| | | | | | | | | | | | | | | | |
| | | |
| Agency Securities (continued) | | | | | | | | | | | | | |
FNMA | | | 7.50 | % | | | 01/01/2033 | | | $ | 493,309 | | | $ | 586,408 | |
FNMA | | | 7.50 | | | | 05/01/2033 | | | | 387,013 | | | | 462,911 | |
FNMA | | | 7.50 | | | | 05/01/2033 | | | | 314,126 | | | | 372,932 | |
FNMA | | | 7.50 | | | | 06/01/2033 | | | | 307,374 | | | | 367,256 | |
FNMA | | | 7.50 | | | | 07/01/2033 | | | | 350,932 | | | | 422,451 | |
FNMA | | | 7.50 | | | | 08/01/2033 | | | | 278,374 | | | | 335,020 | |
FNMA ± | | | 7.63 | | | | 03/01/2024 | | | | 422 | | | | 423 | |
FNMA ± | | | 7.75 | | | | 02/01/2024 | | | | 1,101 | | | | 1,102 | |
FNMA ± | | | 7.75 | | | | 01/01/2026 | | | | 645 | | | | 647 | |
FNMA | | | 8.00 | | | | 12/01/2026 | | | | 216,204 | | | | 260,689 | |
FNMA | | | 8.00 | | | | 02/01/2030 | | | | 862 | | | | 994 | |
FNMA | | | 8.00 | | | | 03/01/2030 | | | | 1,034 | | | | 1,233 | |
FNMA | | | 8.00 | | | | 02/01/2031 | | | | 14,376 | | | | 14,830 | |
FNMA | | | 8.00 | | | | 07/01/2031 | | | | 54,452 | | | | 56,185 | |
FNMA | | | 8.00 | | | | 05/01/2033 | | | | 359,030 | | | | 434,548 | |
FNMA ± | | | 8.38 | | | | 12/01/2024 | | | | 2,006 | | | | 2,009 | |
FNMA | | | 8.50 | | | | 10/01/2026 | | | | 23,196 | | | | 27,778 | |
FNMA | | | 8.50 | | | | 02/01/2027 | | | | 89,299 | | | | 99,621 | |
FNMA | | | 8.50 | | | | 06/01/2030 | | | | 145,285 | | | | 168,540 | |
FNMA | | | 8.54 | | | | 08/01/2024 | | | | 127,586 | | | | 150,486 | |
FNMA | | | 9.00 | | | | 05/01/2021 | | | | 2,153 | | | | 2,185 | |
FNMA | | | 9.00 | | | | 07/01/2030 | | | | 54,286 | | | | 56,876 | |
FNMA ± | | | 9.10 | | | | 10/01/2024 | | | | 1,942 | | | | 1,944 | |
FNMA | | | 9.50 | | | | 08/01/2021 | | | | 81,384 | | | | 93,500 | |
FNMA | | | 9.50 | | | | 12/01/2024 | | | | 47,551 | | | | 53,780 | |
FNMA | | | 10.00 | | | | 01/01/2021 | | | | 41,732 | | | | 48,704 | |
FNMA | | | 10.50 | | | | 04/01/2019 | | | | 9,114 | | | | 9,156 | |
FNMA | | | 11.00 | | | | 01/01/2018 | | | | 13,699 | | | | 15,985 | |
FNMA | | | 12.50 | | | | 07/01/2015 | | | | 6,821 | | | | 7,589 | |
FNMA Series 1989-74 Class J | | | 9.80 | | | | 10/25/2019 | | | | 54,098 | | | | 63,353 | |
FNMA Series 1989-96 Class H | | | 9.00 | | | | 12/25/2019 | | | | 21,569 | | | | 24,679 | |
FNMA Series 1992-39 Class FA ± | | | 1.38 | | | | 03/25/2022 | | | | 393,010 | | | | 403,622 | |
FNMA Series 1992-45 Class F ± | | | 1.38 | | | | 04/25/2022 | | | | 75,308 | | | | 77,281 | |
FNMA Series 1992-87 Class Z | | | 8.00 | | | | 05/25/2022 | | | | 57,290 | | | | 66,497 | |
FNMA Series 1993-113 Class FA ± | | | 1.32 | | | | 07/25/2023 | | | | 325,029 | | | | 331,529 | |
FNMA Series 1994-14 Class F ± | | | 2.82 | | | | 10/25/2023 | | | | 694,070 | | | | 720,418 | |
FNMA Series 1998-M5 Class D ± | | | 6.35 | | | | 06/25/2020 | | | | 234,190 | | | | 239,552 | |
FNMA Series 1998-T2 Class A5 ± | | | 2.59 | | | | 01/25/2032 | | | | 1,771,476 | | | | 1,815,000 | |
FNMA Series 2001-50 Class BA | | | 7.00 | | | | 10/25/2041 | | | | 445,380 | | | | 514,181 | |
FNMA Series 2001-63 Class FD ± | | | 0.85 | | | | 12/18/2031 | | | | 449,627 | | | | 453,373 | |
FNMA Series 2001-81 Class F ± | | | 0.79 | | | | 01/25/2032 | | | | 310,213 | | | | 312,983 | |
FNMA Series 2001-T08 Class A1 | | | 7.50 | | | | 07/25/2041 | | | | 296,790 | | | | 327,799 | |
FNMA Series 2001-T10 Class A2 | | | 7.50 | | | | 12/25/2041 | | | | 7,004,117 | | | | 8,111,373 | |
FNMA Series 2001-T12 Class A2 | | | 7.50 | | | | 08/25/2041 | | | | 537,216 | | | | 625,713 | |
FNMA Series 2001-T12 Class A4 ± | | | 3.44 | | | | 08/25/2041 | | | | 10,885,614 | | | | 11,581,273 | |
FNMA Series 2001-W03 Class A ± | | | 7.00 | | | | 09/25/2041 | | | | 1,501,829 | | | | 1,726,814 | |
FNMA Series 2002-05 Class FD ± | | | 1.14 | | | | 02/25/2032 | | | | 723,510 | | | | 735,004 | |
FNMA Series 2002-66 Class A3 ± | | | 3.20 | | | | 04/25/2042 | | | | 15,660,270 | | | | 16,712,445 | |
FNMA Series 2002-D12 Class A5 ± | | | 3.59 | | | | 10/25/2041 | | | | 3,072,920 | | | | 3,115,748 | |
FNMA Series 2002-T12 Class A3 | | | 7.50 | | | | 05/25/2042 | | | | 1,906,940 | | | | 2,255,319 | |
The accompanying notes are an integral part of these financial statements.
| | | | |
| 20 | | Wells Fargo Advantage Adjustable Rate Government Fund | | Portfolio of Investments—February 29, 2012 (Unaudited) |
| | | | | | | | | | | | | | | | |
| Security Name | | Interest Rate | | | Maturity Date | | | Principal | | | Value | |
| | | | | | | | | | | | | | | | |
| | | |
| Agency Securities (continued) | | | | | | | | | | | | | |
FNMA Series 2002-T19 Class A4 ± | | | 3.43 | % | | | 03/25/2042 | | | $ | 230,130 | | | $ | 241,206 | |
FNMA Series 2002-W1 Class 3A ± | | | 3.29 | | | | 04/25/2042 | | | | 2,520,595 | | | | 2,602,676 | |
FNMA Series 2002-W4 Class A6 ± | | | 3.41 | | | | 05/25/2042 | | | | 4,026,001 | | | | 4,283,288 | |
FNMA Series 2003-07 Class A2 ± | | | 2.61 | | | | 05/25/2042 | | | | 1,877,817 | | | | 1,994,887 | |
FNMA Series 2003-63 Class A8 ± | | | 2.74 | | | | 01/25/2043 | | | | 2,738,992 | | | | 2,926,441 | |
FNMA Series 2003-W02 Class 1A3 | | | 7.50 | | | | 07/25/2042 | | | | 646,320 | | | | 744,747 | |
FNMA Series 2003-W04 Class 5A ± | | | 3.42 | | | | 10/25/2042 | | | | 2,490,613 | | | | 2,657,173 | |
FNMA Series 2003-W08 Class 4A ± | | | 3.31 | | | | 11/25/2042 | | | | 2,953,646 | | | | 3,130,753 | |
FNMA Series 2003-W10 Class 2A ± | | | 3.36 | | | | 06/25/2043 | | | | 5,767,531 | | | | 6,102,769 | |
FNMA Series 2003-W18 Class 2A ± | | | 3.51 | | | | 06/25/2043 | | | | 21,706,527 | | | | 23,093,709 | |
FNMA Series 2004-T3 Class 1A3 | | | 7.00 | | | | 02/25/2044 | | | | 1,150,434 | | | | 1,329,681 | |
FNMA Series 2004-T3 Class 2A ± | | | 3.41 | | | | 08/25/2043 | | | | 2,846,098 | | | | 2,926,150 | |
FNMA Series 2004-W1 Class 2A2 | | | 7.00 | | | | 12/25/2033 | | | | 540,050 | | | | 628,987 | |
FNMA Series 2004-W1 Class 3A ± | | | 3.56 | | | | 01/25/2043 | | | | 179,517 | | | | 189,951 | |
FNMA Series 2004-W12 Class 2A ± | | | 3.52 | | | | 06/25/2044 | | | | 10,363,375 | | | | 11,064,198 | |
FNMA Series 2004-W15 Class 3A ± | | | 3.00 | | | | 06/25/2044 | | | | 15,534,650 | | | | 16,406,533 | |
FNMA Series 2004-W2 Class 5A | | | 7.50 | | | | 03/25/2044 | | | | 490,262 | | | | 570,122 | |
FNMA Series 2005-W3 Class 3A ± | | | 3.02 | | | | 04/25/2045 | | | | 2,846,845 | | | | 3,014,353 | |
FNMA Series 2006-W1 Class 3A ± | | | 2.33 | | | | 10/25/2045 | | | | 16,052,559 | | | | 16,985,614 | |
FNMA Series G92-20 Class FB ± | | | 1.38 | | | | 04/25/2022 | | | | 333,114 | | | | 339,570 | |
FNMA Series G93-1 Class K | | | 6.68 | | | | 01/25/2023 | | | | 1,207,486 | | | | 1,360,810 | |
FNMA Series G93-19 Class FD ± | | | 1.32 | | | | 04/25/2023 | | | | 1,126,308 | | | | 1,149,444 | |
GNMA ± | | | 1.63 | | | | 09/20/2017 | | | | 37,326 | | | | 38,614 | |
GNMA ± | | | 1.63 | | | | 09/20/2017 | | | | 5,025 | | | | 5,191 | |
GNMA ± | | | 1.63 | | | | 08/20/2021 | | | | 34,332 | | | | 35,461 | |
GNMA ± | | | 1.63 | | | | 08/20/2021 | | | | 72,641 | | | | 75,029 | |
GNMA ± | | | 1.63 | | | | 12/20/2021 | | | | 15,078 | | | | 15,599 | |
GNMA ± | | | 1.63 | | | | 07/20/2022 | | | | 17,197 | | | | 17,762 | |
GNMA ± | | | 1.63 | | | | 09/20/2022 | | | | 14,930 | | | | 15,421 | |
GNMA ± | | | 1.63 | | | | 09/20/2022 | | | | 143,517 | | | | 148,234 | |
GNMA ± | | | 1.63 | | | | 09/20/2022 | | | | 71,528 | | | | 73,879 | |
GNMA ± | | | 1.63 | | | | 10/20/2022 | | | | 56,804 | | | | 58,766 | |
GNMA ± | | | 1.63 | | | | 10/20/2022 | | | | 186,837 | | | | 193,289 | |
GNMA ± | | | 1.63 | | | | 11/20/2022 | | | | 113,597 | | | | 117,520 | |
GNMA ± | | | 1.63 | | | | 11/20/2022 | | | | 152,921 | | | | 158,202 | |
GNMA ± | | | 1.63 | | | | 12/20/2022 | | | | 42,875 | | | | 44,356 | |
GNMA ± | | | 1.63 | | | | 12/20/2022 | | | | 552,790 | | | | 571,879 | |
GNMA ± | | | 1.63 | | | | 12/20/2022 | | | | 10,717 | | | | 11,087 | |
GNMA ± | | | 1.63 | | | | 07/20/2023 | | | | 7,580 | | | | 7,829 | |
GNMA ± | | | 1.63 | | | | 09/20/2023 | | | | 624,656 | | | | 645,186 | |
GNMA ± | | | 1.63 | | | | 09/20/2023 | | | | 125,868 | | | | 130,005 | |
GNMA ± | | | 1.63 | | | | 09/20/2023 | | | | 500,042 | | | | 516,477 | |
GNMA ± | | | 1.63 | | | | 10/20/2023 | | | | 1,273,634 | | | | 1,317,616 | |
GNMA ± | | | 1.63 | | | | 11/20/2023 | | | | 937,588 | | | | 969,965 | |
GNMA ± | | | 1.63 | | | | 11/20/2023 | | | | 948,866 | | | | 981,633 | |
GNMA ± | | | 1.63 | | | | 12/20/2023 | | | | 41,446 | | | | 42,877 | |
GNMA ± | | | 1.63 | | | | 12/20/2023 | | | | 158,628 | | | | 164,106 | |
GNMA ± | | | 1.63 | | | | 12/20/2023 | | | | 1,319,760 | | | | 1,365,335 | |
GNMA ± | | | 1.63 | | | | 07/20/2024 | | | | 119,285 | | | | 123,205 | |
GNMA ± | | | 1.63 | | | | 07/20/2024 | | | | 867,013 | | | | 895,508 | |
The accompanying notes are an integral part of these financial statements.
| | | | | | |
| Portfolio of Investments—February 29, 2012 (Unaudited) | | Wells Fargo Advantage Adjustable Rate Government Fund | | | 21 | |
| | | | | | | | | | | | | | | | |
| Security Name | | Interest Rate | | | Maturity Date | | | Principal | | | Value | |
| | | | | | | | | | | | | | | | |
| | | |
| Agency Securities (continued) | | | | | | | | | | | | | |
GNMA ± | | | 1.63 | % | | | 08/20/2024 | | | $ | 59,884 | | | $ | 61,852 | |
GNMA ± | | | 1.63 | | | | 11/20/2024 | | | | 141,645 | | | | 146,536 | |
GNMA ± | | | 1.63 | | | | 09/20/2025 | | | | 244,015 | | | | 252,035 | |
GNMA ± | | | 1.63 | | | | 10/20/2025 | | | | 827,947 | | | | 856,538 | |
GNMA ± | | | 1.63 | | | | 10/20/2025 | | | | 172,205 | | | | 178,152 | |
GNMA ± | | | 1.63 | | | | 10/20/2026 | | | | 148,992 | | | | 154,137 | |
GNMA ± | | | 1.63 | | | | 01/20/2027 | | | | 11,451 | | | | 11,846 | |
GNMA ± | | | 1.63 | | | | 08/20/2027 | | | | 26,663 | | | | 27,539 | |
GNMA ± | | | 1.63 | | | | 09/20/2027 | | | | 5,364 | | | | 5,540 | |
GNMA ± | | | 1.63 | | | | 10/20/2027 | | | | 9,944 | | | | 10,288 | |
GNMA ± | | | 1.63 | | | | 12/20/2029 | | | | 295,864 | | | | 306,081 | |
GNMA ± | | | 1.63 | | | | 10/20/2030 | | | | 215,871 | | | | 223,326 | |
GNMA ± | | | 1.63 | | | | 11/20/2031 | | | | 11,999 | | | | 12,414 | |
GNMA ± | | | 1.63 | | | | 12/20/2031 | | | | 1,595 | | | | 1,650 | |
GNMA ± | | | 1.63 | | | | 11/20/2032 | | | | 765,672 | | | | 792,113 | |
GNMA ± | | | 1.63 | | | | 12/20/2032 | | | | 103,060 | | | | 106,619 | |
GNMA ± | | | 2.00 | | | | 09/20/2017 | | | | 6,153 | | | | 6,359 | |
GNMA ± | | | 2.00 | | | | 07/20/2018 | | | | 704 | | | | 727 | |
GNMA ± | | | 2.00 | | | | 08/20/2018 | | | | 10,496 | | | | 10,848 | |
GNMA ± | | | 2.00 | | | | 08/20/2021 | | | | 17,278 | | | | 17,858 | |
GNMA ± | | | 2.00 | | | | 10/20/2021 | | | | 360,726 | | | | 373,574 | |
GNMA ± | | | 2.00 | | | | 11/20/2021 | | | | 41,646 | | | | 43,130 | |
GNMA ± | | | 2.00 | | | | 07/20/2022 | | | | 9,734 | | | | 10,061 | |
GNMA ± | | | 2.00 | | | | 12/20/2022 | | | | 88,036 | | | | 91,172 | |
GNMA ± | | | 2.00 | | | | 10/20/2024 | | | | 1,580,240 | | | | 1,636,522 | |
GNMA ± | | | 2.00 | | | | 11/20/2024 | | | | 753,924 | | | | 780,776 | |
GNMA ± | | | 2.00 | | | | 07/20/2025 | | | | 9,811 | | | | 10,141 | |
GNMA ± | | | 2.00 | | | | 09/20/2026 | | | | 151,485 | | | | 156,571 | |
GNMA ± | | | 2.00 | | | | 11/20/2026 | | | | 13,801 | | | | 14,293 | |
GNMA ± | | | 2.00 | | | | 07/20/2027 | | | | 3,585 | | | | 3,705 | |
GNMA ± | | | 2.00 | | | | 08/20/2027 | | | | 5,260 | | | | 5,436 | |
GNMA ± | | | 2.00 | | | | 11/20/2027 | | | | 7,897 | | | | 8,178 | |
GNMA ± | | | 2.00 | | | | 01/20/2030 | | | | 170,029 | | | | 175,546 | |
GNMA ± | | | 2.13 | | | | 07/20/2022 | | | | 6,735 | | | | 6,971 | |
GNMA ± | | | 2.13 | | | | 07/20/2022 | | | | 7,942 | | | | 8,220 | |
GNMA ± | | | 2.38 | | | | 01/20/2017 | | | | 17,457 | | | | 18,070 | |
GNMA ± | | | 2.38 | | | | 02/20/2017 | | | | 21,820 | | | | 22,585 | |
GNMA ± | | | 2.38 | | | | 02/20/2017 | | | | 92,738 | | | | 95,991 | |
GNMA ± | | | 2.38 | | | | 03/20/2017 | | | | 30,118 | | | | 31,174 | |
GNMA ± | | | 2.38 | | | | 03/20/2017 | | | | 16,336 | | | | 16,909 | |
GNMA ± | | | 2.38 | | | | 05/20/2017 | | | | 72,947 | | | | 75,511 | |
GNMA ± | | | 2.38 | | | | 05/20/2017 | | | | 28,606 | | | | 29,611 | |
GNMA ± | | | 2.38 | | | | 06/20/2017 | | | | 7,195 | | | | 7,447 | |
GNMA ± | | | 2.38 | | | | 01/20/2021 | | | | 28,573 | | | | 29,575 | |
GNMA ± | | | 2.38 | | | | 02/20/2021 | | | | 70,312 | | | | 72,111 | |
GNMA ± | | | 2.38 | | | | 06/20/2021 | | | | 98,398 | | | | 101,858 | |
GNMA ± | | | 2.38 | | | | 01/20/2022 | | | | 186,516 | | | | 193,058 | |
GNMA ± | | | 2.38 | | | | 02/20/2022 | | | | 59,117 | | | | 61,190 | |
GNMA ± | | | 2.38 | | | | 02/20/2022 | | | | 155,163 | | | | 160,606 | |
GNMA ± | | | 2.38 | | | | 02/20/2022 | | | | 8,837 | | | | 9,147 | |
The accompanying notes are an integral part of these financial statements.
| | | | |
| 22 | | Wells Fargo Advantage Adjustable Rate Government Fund | | Portfolio of Investments—February 29, 2012 (Unaudited) |
| | | | | | | | | | | | | | | | |
| Security Name | | Interest Rate | | | Maturity Date | | | Principal | | | Value | |
| | | | | | | | | | | | | | | | |
| | | |
| Agency Securities (continued) | | | | | | | | | | | | | |
GNMA ± | | | 2.38 | % | | | 02/20/2022 | | | $ | 6,209 | | | $ | 6,427 | |
GNMA ± | | | 2.38 | | | | 03/20/2022 | | | | 168,270 | | | | 174,172 | |
GNMA ± | | | 2.38 | | | | 03/20/2022 | | | | 319,564 | | | | 330,773 | |
GNMA ± | | | 2.38 | | | | 03/20/2022 | | | | 53,606 | | | | 55,486 | |
GNMA ± | | | 2.38 | | | | 04/20/2022 | | | | 486,353 | | | | 503,452 | |
GNMA ± | | | 2.38 | | | | 04/20/2022 | | | | 482,688 | | | | 499,658 | |
GNMA ± | | | 2.38 | | | | 05/20/2022 | | | | 453,977 | | | | 469,938 | |
GNMA ± | | | 2.38 | | | | 05/20/2022 | | | | 126,013 | | | | 130,444 | |
GNMA ± | | | 2.38 | | | | 05/20/2022 | | | | 28,558 | | | | 29,562 | |
GNMA ± | | | 2.38 | | | | 05/20/2022 | | | | 67,141 | | | | 69,501 | |
GNMA ± | | | 2.38 | | | | 06/20/2022 | | | | 1,484 | | | | 1,537 | |
GNMA ± | | | 2.38 | | | | 06/20/2022 | | | | 36,734 | | | | 38,026 | |
GNMA ± | | | 2.38 | | | | 01/20/2023 | | | | 1,312,256 | | | | 1,358,283 | |
GNMA ± | | | 2.38 | | | | 01/20/2023 | | | | 93,163 | | | | 96,431 | |
GNMA ± | | | 2.38 | | | | 02/20/2023 | | | | 115,330 | | | | 119,375 | |
GNMA ± | | | 2.38 | | | | 02/20/2023 | | | | 67,761 | | | | 70,138 | |
GNMA ± | | | 2.38 | | | | 02/20/2023 | | | | 118,691 | | | | 122,854 | |
GNMA ± | | | 2.38 | | | | 02/20/2023 | | | | 14,633 | | | | 15,146 | |
GNMA ± | | | 2.38 | | | | 03/20/2023 | | | | 131,447 | | | | 136,057 | |
GNMA ± | | | 2.38 | | | | 04/20/2023 | | | | 20,948 | | | | 21,685 | |
GNMA ± | | | 2.38 | | | | 04/20/2023 | | | | 47,566 | | | | 49,239 | |
GNMA ± | | | 2.38 | | | | 05/20/2023 | | | | 16,286 | | | | 16,859 | |
GNMA ± | | | 2.38 | | | | 05/20/2023 | | | | 44,588 | | | | 46,155 | |
GNMA ± | | | 2.38 | | | | 06/20/2023 | | | | 450,709 | | | | 466,555 | |
GNMA ± | | | 2.38 | | | | 06/20/2023 | | | | 205,139 | | | | 212,352 | |
GNMA ± | | | 2.38 | | | | 04/20/2024 | | | | 63,759 | | | | 66,001 | |
GNMA ± | | | 2.38 | | | | 04/20/2024 | | | | 347,877 | | | | 360,107 | |
GNMA ± | | | 2.38 | | | | 05/20/2024 | | | | 300,720 | | | | 311,292 | |
GNMA ± | | | 2.38 | | | | 05/20/2024 | | | | 27,143 | | | | 28,097 | |
GNMA ± | | | 2.38 | | | | 06/20/2024 | | | | 32,014 | | | | 33,139 | |
GNMA ± | | | 2.38 | | | | 06/20/2024 | | | | 46,015 | | | | 47,633 | |
GNMA ± | | | 2.38 | | | | 06/20/2024 | | | | 173,969 | | | | 180,085 | |
GNMA ± | | | 2.38 | | | | 04/20/2025 | | | | 204,606 | | | | 211,799 | |
GNMA ± | | | 2.38 | | | | 01/20/2026 | | | | 885,691 | | | | 916,756 | |
GNMA ± | | | 2.38 | | | | 02/20/2026 | | | | 709,108 | | | | 733,979 | |
GNMA ± | | | 2.38 | | | | 01/20/2027 | | | | 366,859 | | | | 379,727 | |
GNMA ± | | | 2.38 | | | | 02/20/2027 | | | | 9,358 | | | | 9,687 | |
GNMA ± | | | 2.38 | | | | 05/20/2027 | | | | 34,716 | | | | 35,937 | |
GNMA ± | | | 2.38 | | | | 01/20/2028 | | | | 10,341 | | | | 10,703 | |
GNMA ± | | | 2.50 | | | | 07/20/2016 | | | | 18,181 | | | | 18,866 | |
GNMA ± | | | 2.50 | | | | 08/20/2017 | | | | 28,691 | | | | 29,772 | |
GNMA ± | | | 2.50 | | | | 10/20/2017 | | | | 12,479 | | | | 12,980 | |
GNMA ± | | | 2.50 | | | | 11/20/2017 | | | | 33,202 | | | | 34,535 | |
GNMA ± | | | 2.50 | | | | 12/20/2017 | | | | 26,724 | | | | 27,797 | |
GNMA ± | | | 2.50 | | | | 07/20/2018 | | | | 66,861 | | | | 69,379 | |
GNMA ± | | | 2.50 | | | | 08/20/2018 | | | | 40,121 | | | | 41,632 | |
GNMA ± | | | 2.50 | | | | 03/20/2019 | | | | 3,986 | | | | 4,135 | |
GNMA ± | | | 2.50 | | | | 11/20/2020 | | | | 22,836 | | | | 23,753 | |
GNMA ± | | | 2.50 | | | | 12/20/2020 | | | | 17,216 | | | | 17,907 | |
GNMA ± | | | 2.50 | | | | 05/20/2021 | | | | 16,248 | | | | 16,836 | |
The accompanying notes are an integral part of these financial statements.
| | | | | | |
| Portfolio of Investments—February 29, 2012 (Unaudited) | | Wells Fargo Advantage Adjustable Rate Government Fund | | | 23 | |
| | | | | | | | | | | | | | | | |
| Security Name | | Interest Rate | | | Maturity Date | | | Principal | | | Value | |
| | | | | | | | | | | | | | | | |
| | | |
| Agency Securities (continued) | | | | | | | | | | | | | |
GNMA ± | | | 2.50 | % | | | 12/20/2021 | | | $ | 42,894 | | | $ | 44,616 | |
GNMA ± | | | 2.50 | | | | 07/20/2022 | | | | 12,911 | | | | 13,397 | |
GNMA ± | | | 2.50 | | | | 07/20/2024 | | | | 486,589 | | | | 504,913 | |
GNMA ± | | | 2.50 | | | | 08/20/2024 | | | | 78,287 | | | | 81,235 | |
GNMA ± | | | 2.50 | | | | 10/20/2024 | | | | 717,215 | | | | 746,017 | |
GNMA ± | | | 2.50 | | | | 12/20/2024 | | | | 504,404 | | | | 524,660 | |
GNMA ± | | | 2.50 | | | | 04/20/2025 | | | | 7,679 | | | | 7,957 | |
GNMA ± | | | 2.50 | | | | 04/20/2032 | | | | 111,780 | | | | 115,826 | |
GNMA ± | | | 2.50 | | | | 05/20/2032 | | | | 270,548 | | | | 280,341 | |
GNMA ± | | | 2.50 | | | | 06/20/2032 | | | | 657,608 | | | | 681,413 | |
GNMA ± | | | 2.50 | | | | 02/20/2033 | | | | 4,793 | | | | 4,972 | |
GNMA ± | | | 2.50 | | | | 03/20/2033 | | | | 55,962 | | | | 58,058 | |
GNMA ± | | | 2.75 | | | | 10/20/2017 | | | | 70,772 | | | | 73,853 | |
GNMA ± | | | 2.88 | | | | 01/20/2022 | | | | 6,178 | | | | 6,455 | |
GNMA ± | | | 3.00 | | | | 02/20/2016 | | | | 16,465 | | | | 17,202 | |
GNMA ± | | | 3.00 | | | | 03/20/2016 | | | | 34,812 | | | | 36,371 | |
GNMA ± | | | 3.00 | | | | 04/20/2016 | | | | 26,320 | | | | 27,463 | |
GNMA ± | | | 3.00 | | | | 05/20/2016 | | | | 2,465 | | | | 2,572 | |
GNMA ± | | | 3.00 | | | | 07/20/2017 | | | | 18,214 | | | | 19,003 | |
GNMA ± | | | 3.00 | | | | 08/20/2017 | | | | 159,892 | | | | 166,813 | |
GNMA ± | | | 3.00 | | | | 08/20/2017 | | | | 13,317 | | | | 13,886 | |
GNMA ± | | | 3.00 | | | | 09/20/2017 | | | | 177,029 | | | | 184,692 | |
GNMA ± | | | 3.00 | | | | 11/20/2017 | | | | 31,760 | | | | 33,214 | |
GNMA ± | | | 3.00 | | | | 12/20/2017 | | | | 197,802 | | | | 206,858 | |
GNMA ± | | | 3.00 | | | | 01/20/2018 | | | | 56,220 | | | | 58,738 | |
GNMA ± | | | 3.00 | | | | 06/20/2018 | | | | 11,270 | | | | 11,759 | |
GNMA ± | | | 3.00 | | | | 11/20/2018 | | | | 5,562 | | | | 5,817 | |
GNMA ± | | | 3.00 | | | | 12/20/2018 | | | | 1,911 | | | | 1,999 | |
GNMA ± | | | 3.00 | | | | 01/20/2019 | | | | 4,352 | | | | 4,547 | |
GNMA ± | | | 3.00 | | | | 02/20/2019 | | | | 10,184 | | | | 10,640 | |
GNMA ± | | | 3.00 | | | | 03/20/2019 | | | | 18,680 | | | | 19,516 | |
GNMA ± | | | 3.00 | | | | 05/20/2019 | | | | 23,880 | | | | 24,917 | |
GNMA ± | | | 3.00 | | | | 06/20/2019 | | | | 55,622 | | | | 58,039 | |
GNMA ± | | | 3.00 | | | | 08/20/2019 | | | | 22,835 | | | | 23,823 | |
GNMA ± | | | 3.00 | | | | 06/20/2020 | | | | 12,809 | | | | 13,366 | |
GNMA ± | | | 3.00 | | | | 01/20/2021 | | | | 358 | | | | 374 | |
GNMA ± | | | 3.00 | | | | 02/20/2021 | | | | 493 | | | | 515 | |
GNMA ± | | | 3.50 | | | | 09/20/2017 | | | | 26,603 | | | | 27,821 | |
GNMA ± | | | 3.50 | | | | 10/20/2017 | | | | 445 | | | | 465 | |
GNMA ± | | | 3.50 | | | | 11/20/2017 | | | | 74,143 | | | | 77,475 | |
GNMA ± | | | 3.50 | | | | 02/20/2018 | | | | 56,460 | | | | 59,130 | |
GNMA ± | | | 3.50 | | | | 03/20/2018 | | | | 7,712 | | | | 8,077 | |
GNMA ± | | | 3.50 | | | | 04/20/2018 | | | | 8,571 | | | | 8,965 | |
GNMA ± | | | 3.50 | | | | 05/20/2018 | | | | 3,241 | | | | 3,390 | |
GNMA ± | | | 3.50 | | | | 09/20/2018 | | | | 8,000 | | | | 8,366 | |
GNMA ± | | | 3.50 | | | | 02/20/2019 | | | | 45,043 | | | | 47,173 | |
GNMA ± | | | 3.50 | | | | 09/20/2019 | | | | 67,172 | | | | 70,247 | |
GNMA ± | | | 3.50 | | | | 01/20/2020 | | | | 15,918 | | | | 16,670 | |
GNMA ± | | | 3.50 | | | | 06/20/2020 | | | | 23,027 | | | | 24,085 | |
GNMA ± | | | 4.00 | | | | 01/20/2016 | | | | 261,951 | | | | 275,733 | |
The accompanying notes are an integral part of these financial statements.
| | | | |
| 24 | | Wells Fargo Advantage Adjustable Rate Government Fund | | Portfolio of Investments—February 29, 2012 (Unaudited) |
| | | | | | | | | | | | | | | | |
| Security Name | | Interest Rate | | | Maturity Date | | | Principal | | | Value | |
| | | | | | | | | | | | | | | | |
| | | |
| Agency Securities (continued) | | | | | | | | | | | | | |
GNMA ± | | | 4.00 | % | | | 03/20/2016 | | | $ | 44,666 | | | $ | 47,016 | |
GNMA ± | | | 4.00 | | | | 04/20/2016 | | | | 6,178 | | | | 6,471 | |
GNMA ± | | | 4.00 | | | | 05/20/2016 | | | | 978 | | | | 1,024 | |
GNMA ± | | | 4.00 | | | | 11/20/2017 | | | | 34,140 | | | | 35,863 | |
GNMA ± | | | 4.00 | | | | 04/20/2018 | | | | 15,820 | | | | 16,571 | |
GNMA ± | | | 4.00 | | | | 11/20/2018 | | | | 102,838 | | | | 108,026 | |
GNMA ± | | | 4.00 | | | | 01/20/2019 | | | | 127,151 | | | | 129,159 | |
GNMA ± | | | 4.00 | | | | 05/20/2019 | | | | 6,473 | | | | 6,780 | |
GNMA ± | | | 4.50 | | | | 12/20/2017 | | | | 4,073 | | | | 4,291 | |
GNMA ± | | | 4.50 | | | | 06/20/2019 | | | | 4,755 | | | | 5,014 | |
GNMA ± | | | 5.00 | | | | 08/20/2015 | | | | 5,968 | | | | 6,311 | |
GNMA ± | | | 5.00 | | | | 09/20/2015 | | | | 8,564 | | | | 9,056 | |
GNMA ± | | | 5.00 | | | | 10/20/2015 | | | | 8,709 | | | | 9,211 | |
GNMA | | | 6.45 | | | | 04/20/2025 | | | | 94,536 | | | | 105,257 | |
GNMA | | | 6.45 | | | | 05/20/2025 | | | | 50,018 | | | | 54,012 | |
GNMA | | | 6.45 | | | | 09/20/2025 | | | | 55,573 | | | | 64,450 | |
GNMA | | | 6.50 | | | | 06/20/2034 | | | | 143,468 | | | | 164,757 | |
GNMA | | | 6.50 | | | | 06/20/2034 | | | | 88,761 | | | | 101,932 | |
GNMA | | | 6.50 | | | | 08/20/2034 | | | | 2,327,560 | | | | 2,672,935 | |
GNMA | | | 6.50 | | | | 08/20/2034 | | | | 97,257 | | | | 111,408 | |
GNMA | | | 6.50 | | | | 08/20/2034 | | | | 119,103 | | | | 136,776 | |
GNMA | | | 6.50 | | | | 08/20/2034 | | | | 130,754 | | | | 148,984 | |
GNMA | | | 6.75 | | | | 02/15/2029 | | | | 145,215 | | | | 170,589 | |
GNMA | | | 7.00 | | | | 07/20/2034 | | | | 71,498 | | | | 84,187 | |
GNMA | | | 7.00 | | | | 07/20/2034 | | | | 125,741 | | | | 148,057 | |
GNMA | | | 7.25 | | | | 07/15/2017 | | | | 35,206 | | | | 38,788 | |
GNMA | | | 7.25 | | | | 08/15/2017 | | | | 54,050 | | | | 59,754 | |
GNMA | | | 7.25 | | | | 08/15/2017 | | | | 28,197 | | | | 31,082 | |
GNMA | | | 7.25 | | | | 08/15/2017 | | | | 14,475 | | | | 16,051 | |
GNMA | | | 7.25 | | | | 09/15/2017 | | | | 40,515 | | | | 44,958 | |
GNMA | | | 7.25 | | | | 10/15/2017 | | | | 77,351 | | | | 85,471 | |
GNMA | | | 7.25 | | | | 10/15/2017 | �� | | | 45,211 | | | | 49,818 | |
GNMA | | | 7.25 | | | | 11/15/2017 | | | | 36,274 | | | | 39,840 | |
GNMA | | | 7.25 | | | | 01/15/2018 | | | | 12,824 | | | | 14,196 | |
GNMA | | | 7.25 | | | | 01/15/2018 | | | | 29,664 | | | | 33,008 | |
GNMA | | | 7.25 | | | | 02/15/2018 | | | | 30,260 | | | | 33,582 | |
GNMA | | | 7.25 | | | | 05/15/2018 | | | | 15,698 | | | | 17,192 | |
GNMA | | | 9.00 | | | | 05/15/2016 | | | | 10,297 | | | | 10,340 | |
GNMA | | | 9.00 | | | | 07/15/2016 | | | | 1,563 | | | | 1,569 | |
GNMA | | | 9.00 | | | | 08/15/2016 | | | | 14,184 | | | | 14,373 | |
GNMA | | | 9.00 | | | | 11/15/2016 | | | | 8,150 | | | | 8,184 | |
GNMA | | | 9.00 | | | | 11/15/2016 | | | | 7,716 | | | | 8,626 | |
GNMA | | | 9.00 | | | | 11/15/2016 | | | | 10,799 | | | | 10,844 | |
GNMA | | | 9.00 | | | | 12/15/2016 | | | | 323 | | | | 324 | |
GNMA | | | 9.00 | | | | 02/15/2017 | | | | 9,057 | | | | 10,208 | |
GNMA | | | 9.00 | | | | 02/15/2017 | | | | 1,563 | | | | 1,570 | |
GNMA | | | 9.00 | | | | 05/15/2017 | | | | 1,708 | | | | 1,715 | |
GNMA | | | 9.00 | | | | 07/15/2017 | | | | 12,478 | | | | 12,700 | |
GNMA | | | 9.00 | | | | 03/15/2020 | | | | 5,404 | | | | 5,685 | |
GNMA | | | 9.00 | | | | 08/15/2021 | | | | 911 | | | | 915 | |
The accompanying notes are an integral part of these financial statements.
| | | | | | |
| Portfolio of Investments—February 29, 2012 (Unaudited) | | Wells Fargo Advantage Adjustable Rate Government Fund | | | 25 | |
| | | | | | | | | | | | | | | | |
| Security Name | | Interest Rate | | | Maturity Date | | | Principal | | | Value | |
| | | | | | | | | | | | | | | | |
| | | |
| Agency Securities (continued) | | | | | | | | | | | | | |
GNMA | | | 9.00 | % | | | 07/20/2024 | | | $ | 1,164 | | | $ | 1,205 | |
GNMA | | | 9.00 | | | | 08/20/2024 | | | | 773 | | | | 940 | |
GNMA | | | 9.00 | | | | 09/20/2024 | | | | 2,888 | | | | 3,537 | |
GNMA | | | 9.00 | | | | 10/20/2024 | | | | 23,838 | | | | 28,809 | |
GNMA | | | 9.00 | | | | 11/20/2024 | | | | 706 | | | | 784 | |
GNMA | | | 9.00 | | | | 01/20/2025 | | | | 10,707 | | | | 13,160 | |
GNMA | | | 9.00 | | | | 02/20/2025 | | | | 37,522 | | | | 45,704 | |
GNMA Series 2003-1 Class SW ±(c) | | | 0.60 | | | | 06/16/2031 | | | | 2,973,914 | | | | 5,090 | |
| | | | |
Total Agency Securities (Cost $1,257,511,563) | | | | | | | | | | | | | | | 1,282,622,081 | |
| | | | | | | | | | | | | | | | |
| | | | |
| | | Yield | | | | | | Shares | | | | |
| | | | |
Short-Term Investments: 4.70% | | | | | | | | | | | | | | | | |
| | | | |
| Investment Companies: 4.68% | | | | | | | | | | | | | | | | |
Wells Fargo Advantage Government Money Market Fund, Institutional Class (l)(u) | | | 0.01 | | | | | | | | 61,848,812 | | | | 61,848,812 | |
| | | | | | | | | | | | | | | | |
| | | | |
| | | | | | | | | Principal | | | | |
| | | | |
| U.S. Treasury Securities: 0.02% | | | | | | | | | | | | | | | | |
U.S. Treasury Bill # | | | 0.08 | | | | 03/29/2012 | | | $ | 300,000 | | | | 299,981 | |
| | | | | | | | | | | | | | | | |
| | | | |
Total Short-Term Investments (Cost $62,148,809) | | | | | | | | | | | | | | | 62,148,793 | |
| | | | | | | | | | | | | | | | |
| | | | | | | | |
| Total Investments in Securities | | | | | | | | |
| (Cost $1,319,660,372) * | | | 101.62 | % | | | 1,344,770,874 | |
Other Assets and Liabilities, Net | | | (1.62 | ) | | | (21,444,947 | ) |
| | | | | | | | |
| Total Net Assets | | | 100.00 | % | | $ | 1,323,325,927 | |
| | | | | | | | |
| ± | Variable rate investment. |
| (c) | Interest-only securities entitle holders to receive only the interest payments on the underlying mortgages. The principal amount shown is the notional amount of the underlying mortgages. Interest rate disclosed represents the coupon rate. |
| (l) | Investment in an affiliate. |
| (u) | Rate shown is the 7-day annualized yield at period end. |
| # | All or a portion of this security is segregated as collateral for investments in derivative instruments. |
| * | Cost for federal income tax purposes is $1,320,847,066 and net unrealized appreciation (depreciation) consists of: |
| | | | |
Gross unrealized appreciation | | $ | 24,770,381 | |
Gross unrealized depreciation | | | (846,573 | ) |
| | | | |
Net unrealized appreciation | | $ | 23,923,808 | |
The accompanying notes are an integral part of these financial statements.
| | | | |
| 26 | | Wells Fargo Advantage Adjustable Rate Government Fund | | Statement of Assets and Liabilities—February 29, 2012 (Unaudited) |
| | | | |
| | | | |
| |
Assets | | | | |
Investments | | | | |
In unaffiliated securities, at value (see cost below) | | $ | 1,282,922,062 | |
In affiliated securities, at value (see cost below) | | | 61,848,812 | |
| | | | |
Total investments, at value (see cost below) | | | 1,344,770,874 | |
Principal paydown receivable | | | 4,737,501 | |
Receivable for Fund shares sold | | | 1,489,285 | |
Receivable for interest | | | 3,561,054 | |
Receivable for daily variation margin on open futures contracts | | | 55,781 | |
Prepaid expenses and other assets | | | 77,547 | |
| | | | |
Total assets | | | 1,354,692,042 | |
| | | | |
| |
Liabilities | | | | |
Dividends payable | | | 210,536 | |
Payable for investments purchased | | | 2,347,203 | |
Payable for Fund shares redeemed | | | 27,750,469 | |
Advisory fee payable | | | 243,101 | |
Distribution fees payable | | | 180,655 | |
Due to other related parties | | | 196,519 | |
Accrued expenses and other liabilities | | | 437,632 | |
| | | | |
Total liabilities | | | 31,366,115 | |
| | | | |
Total net assets | | $ | 1,323,325,927 | |
| | | | |
| |
NET ASSETS CONSIST OF | | | | |
Paid-in capital | | $ | 1,514,093,132 | |
Overdistributed net investment income | | | (2,340,672 | ) |
Accumulated net realized losses on investments | | | (213,511,723 | ) |
Net unrealized gains on investments | | | 25,085,190 | |
| | | | |
Total net assets | | $ | 1,323,325,927 | |
| | | | |
| |
COMPUTATION OF NET ASSET VALUE AND OFFERING PRICE PER SHARE1 | | | | |
Net assets – Class A | | $ | 302,277,686 | |
Shares outstanding – Class A | | | 33,100,321 | |
Net asset value per share – Class A | | | $9.13 | |
Maximum offering price per share – Class A2 | | | $9.32 | |
Net assets – Class B | | $ | 10,136,679 | |
Shares outstanding – Class B | | | 1,109,728 | |
Net asset value per share – Class B | | | $9.13 | |
Net assets – Class C | | $ | 277,486,861 | |
Shares outstanding – Class C | | | 30,383,620 | |
Net asset value per share – Class C | | | $9.13 | |
Net assets – Administrator Class | | $ | 115,495,249 | |
Shares outstanding – Administrator Class | | | 12,645,333 | |
Net asset value per share – Administrator Class | | | $9.13 | |
Net assets – Institutional Class | | $ | 617,929,452 | |
Shares outstanding – Institutional Class | | | 67,649,126 | |
Net asset value per share – Institutional Class | | | $9.13 | |
| |
Investments in unaffiliated securities, at cost | | $ | 1,257,811,560 | |
| | | | |
Investments in affiliated securities, at cost | | $ | 61,848,812 | |
| | | | |
Total investments, at cost | | $ | 1,319,660,372 | |
| | | | |
| 1. | The Fund has an unlimited number of authorized shares. |
| 2. | Maximum offering price is computed as 100/98 of net asset value. On investments of $50,000 or more, the offering price is reduced. |
The accompanying notes are an integral part of these financial statements.
| | | | | | |
| Statement of Operations—Six Months Ended February 29, 2012 (Unaudited) | | Wells Fargo Advantage Adjustable Rate Government Fund | | | 27 | |
| | | | |
| | | | |
| |
Investment income | | | | |
Interest | | $ | 12,294,425 | |
Income from affiliated securities | | | 3,612 | |
| | | | |
Total investment income | | | 12,298,037 | |
| | | | |
| |
Expenses | | | | |
Advisory fee | | | 2,556,801 | |
Administration fees | | | | |
Fund level | | | 338,618 | |
Class A | | | 265,834 | |
Class B | | | 9,560 | |
Class C | | | 229,940 | |
Administrator Class | | | 59,450 | |
Institutional Class | | | 241,562 | |
Shareholder servicing fees | | | | |
Class A | | | 415,368 | |
Class B | | | 14,937 | |
Class C | | | 359,280 | |
Administrator Class | | | 144,467 | |
Distribution fees | | | | |
Class B | | | 44,810 | |
Class C | | | 1,077,842 | |
Custody and accounting fees | | | 46,224 | |
Professional fees | | | 31,543 | |
Registration fees | | | 24,811 | |
Shareholder report expenses | | | 46,274 | |
Trustees’ fees and expenses | | | 5,420 | |
Other fees and expenses | | | 12,086 | |
| | | | |
Total expenses | | | 5,924,827 | |
Less: Fee waivers and/or expense reimbursements | | | (628,030 | ) |
| | | | |
Net expenses | | | 5,296,797 | |
| | | | |
Net investment income | | | 7,001,240 | |
| | | | |
| |
REALIZED AND UNREALIZED GAINS (LOSSES) ON INVESTMENTS | | | | |
| |
Net realized gains (losses) on: | | | | |
Unaffiliated securities | | | 601,293 | |
Futures transactions | | | (528,842 | ) |
| | | | |
Net realized gains on investments | | | 72,451 | |
| | | | |
| |
Net change in unrealized gains (losses) on: | | | | |
Unaffiliated securities | | | 4,173,574 | |
Futures transactions | | | 60,947 | |
| | | | |
Net change in unrealized gains (losses) on investments | | | 4,234,521 | |
| | | | |
Net realized and unrealized gains (losses) on investments | | | 4,306,972 | |
| | | | |
Net increase in net assets resulting from operations | | $ | 11,308,212 | |
| | | | |
The accompanying notes are an integral part of these financial statements.
| | | | |
| 28 | | Wells Fargo Advantage Adjustable Rate Government Fund | | Statements of Changes in Net Assets |
| | | | | | | | | | | | | | | | |
| | | Six Months Ended February 29, 2012 (Unaudited) | | | Year Ended August 31, 2011 | |
| | | | |
Operations | | | | | | | | | | | | | | | | |
Net investment income | | | | | | $ | 7,001,240 | | | | | | | $ | 16,262,285 | |
Net realized gains (losses) on investments | | | | | | | 72,451 | | | | | | | | (1,960,095 | ) |
Net change in unrealized gains (losses) on investments | | | | | | | 4,234,521 | | | | | | | | 7,687,306 | |
| | | | | | | | | | | | | | | | |
Net increase in net assets resulting from operations | | | | | | | 11,308,212 | | | | | | | | 21,989,496 | |
| | | | | | | | | | | | | | | | |
| | | | |
Distributions to shareholders from | | | | | | | | | | | | | | | | |
Net investment income | | | | | | | | | | | | | | | | |
Class A | | | | | | | (2,245,863 | ) | | | | | | | (4,583,566 | ) |
Class B | | | | | | | (36,625 | ) | | | | | | | (243,091 | ) |
Class C | | | | | | | (848,546 | ) | | | | | | | (2,279,362 | ) |
Administrator Class | | | | | | | (856,774 | ) | | | | | | | (316,549 | ) |
Institutional Class | | | | | | | (4,746,863 | ) | | | | | | | (8,624,206 | ) |
Tax basis return of capital | | | | | | | | | | | | | | | | |
Class A | | | | | | | 0 | | | | | | | | (1,731,087 | ) |
Class B | | | | | | | 0 | | | | | | | | (172,929 | ) |
Class C | | | | | | | 0 | | | | | | | | (1,762,948 | ) |
Administrator Class | | | | | | | 0 | | | | | | | | (120,023 | ) |
Institutional Class | | | | | | | 0 | | | | | | | | (2,835,213 | ) |
| | | | | | | | | | | | | | | | |
Total distributions to shareholders | | | | | | | (8,734,671 | ) | | | | | | | (22,668,974 | ) |
| | | | | | | | | | | | | | | | |
| | | | |
Capital share transactions | | | Shares | | | | | | | | Shares | | | | | |
Proceeds from shares sold | | | | | | | | | | | | | | | | |
Class A | | | 11,146,581 | | | | 101,488,024 | | | | 16,412,941 | | | | 149,657,118 | |
Class B | | | 34,038 | | | | 309,970 | | | | 99,347 | | | | 906,066 | |
Class C | | | 812,274 | | | | 7,393,920 | | | | 2,685,125 | | | | 24,474,739 | |
Administrator Class | | | 15,971,747 | | | | 145,347,317 | | | | 5,932,991 | | | | 54,071,142 | |
Institutional Class | | | 45,729,500 | | | | 416,417,906 | | | | 56,802,728 | | | | 517,846,081 | |
| | | | | | | | | | | | | | | | |
| | | | | | | 670,957,137 | | | | | | | | 746,955,146 | |
| | | | | | | | | | | | | | | | |
Reinvestment of distributions | | | | | | | | | | | | | | | | |
Class A | | | 172,403 | | | | 1,569,381 | | | | 472,739 | | | | 4,310,337 | |
Class B | | | 3,400 | | | | 30,955 | | | | 36,834 | | | | 336,000 | |
Class C | | | 59,903 | | | | 545,084 | | | | 275,194 | | | | 2,509,488 | |
Administrator Class | | | 64,585 | | | | 588,100 | | | | 28,945 | | | | 263,683 | |
Institutional Class | | | 409,297 | | | | 3,727,882 | | | | 938,927 | | | | 8,560,527 | |
| | | | | | | | | | | | | | | | |
| | | | | | | 6,461,402 | | | | | | | | 15,980,035 | |
| | | | | | | | | | | | | | | | |
Payment for shares redeemed | | | | | | | | | | | | | | | | |
Class A | | | (14,246,196 | ) | | | (129,654,129 | ) | | | (19,607,933 | ) | | | (178,746,472 | ) |
Class B | | | (563,024 | ) | | | (5,128,366 | ) | | | (4,007,517 | ) | | | (36,520,241 | ) |
Class C | | | (3,029,135 | ) | | | (27,581,408 | ) | | | (7,725,072 | ) | | | (70,421,005 | ) |
Administrator Class | | | (7,224,500 | ) | | | (65,769,253 | ) | | | (2,129,535 | ) | | | (19,400,449 | ) |
Institutional Class | | | (44,023,791 | ) | | | (400,983,573 | ) | | | (32,559,685 | ) | | | (296,753,911 | ) |
| | | | | | | | | | | | | | | | |
| | | | | | | (629,116,729 | ) | | | | | | | (601,842,078 | ) |
| | | | | | | | | | | | | | | | |
Net increase in net assets resulting
from capital share transactions | | | | | | | 48,301,810 | | | | | | | | 161,093,103 | |
| | | | | | | | | | | | | | | | |
Total increase in net assets | | | | | | | 50,875,351 | | | | | | | | 160,413,625 | |
| | | | | | | | | | | | | | | | |
| | | | |
Net assets | | | | | | | | | | | | | | | | |
Beginning of period | | | | | | | 1,272,450,576 | | | | | | | | 1,112,036,951 | |
| | | | | | | | | | | | | | | | |
End of period | | | | | | $ | 1,323,325,927 | | | | | | | $ | 1,272,450,576 | |
| | | | | | | | | | | | | | | | |
Overdistributed net investment income | | | | | | $ | (2,340,672 | ) | | | | | | $ | (607,241 | ) |
| | | | | | | | | | | | | | | | |
The accompanying notes are an integral part of these financial statements.
| | | | | | |
| Financial Highlights | | Wells Fargo Advantage Adjustable Rate Government Fund | | | 29 | |
(For a share outstanding throughout each period)
| | | | | | | | | | | | | | | | | | | | | | | | | | | | |
Class A | | Six Months Ended
February 29, 2012 (Unaudited) | | | Year Ended August 31, | | | Year Ended June 30, | |
| | | 2011 | | | 20101,2 | | | 20101 | | | 20091 | | | 20081 | | | 20071 | |
Net asset value, beginning of period | | $ | 9.12 | | | $ | 9.12 | | | $ | 9.11 | | | $ | 9.00 | | | $ | 9.15 | | | $ | 9.21 | | | $ | 9.23 | |
Net investment income | | | 0.05 | | | | 0.14 | | | | 0.02 | | | | 0.20 | | | | 0.32 | | | | 0.44 | 3 | | | 0.38 | |
Net realized and unrealized gains (losses)
on investments | | | 0.02 | | | | 0.04 | | | | 0.02 | | | | 0.11 | | | | (0.14 | ) | | | (0.05 | ) | | | 0.02 | |
| | | | | | | | | | | | | | | | | | | | | | | | | | | | |
Total from investment operations | | | 0.07 | | | | 0.18 | | | | 0.04 | | | | 0.31 | | | | 0.18 | | | | 0.39 | | | | 0.40 | |
Distributions to shareholders from | | | | | | | | | | | | | | | | | | | | | | | | | | | | |
Net investment income | | | (0.06 | ) | | | (0.13 | ) | | | (0.01 | ) | | | (0.20 | ) | | | (0.33 | ) | | | (0.45 | ) | | | (0.42 | ) |
Tax basis return of capital | | | 0.00 | | | | (0.05 | )3 | | | (0.02 | )3 | | | 0.00 | | | | 0.00 | | | | 0.00 | | | | 0.00 | |
| | | | | | | | | | | | | | | | | | | | | | | | | | | | |
Total distributions to shareholders | | | (0.06 | ) | | | (0.18 | ) | | | (0.03 | ) | | | (0.20 | ) | | | (0.33 | ) | | | (0.45 | ) | | | (0.42 | ) |
Net asset value, end of period | | $ | 9.13 | | | $ | 9.12 | | | $ | 9.12 | | | $ | 9.11 | | | $ | 9.00 | | | $ | 9.15 | | | $ | 9.21 | |
Total return4 | | | 0.78 | % | | | 2.04 | % | | | 0.49 | % | | | 3.51 | % | | | 2.09 | % | | | 4.30 | % | | | 4.42 | % |
Ratios to average net assets (annualized) | | | | | | | | | | | | | | | | | | | | | | | | | | | | |
Gross expenses | | | 0.86 | % | | | 0.88 | % | | | 0.88 | % | | | 0.73 | % | | | 0.73 | % | | | 0.98 | %5 | | | 1.11 | %5 |
Net expenses | | | 0.74 | % | | | 0.74 | % | | | 0.74 | % | | | 0.73 | % | | | 0.73 | % | | | 0.94 | %5 | | | 1.07 | %5 |
Net investment income | | | 1.12 | % | | | 1.50 | % | | | 1.18 | % | | | 2.27 | % | | | 3.61 | % | | | 4.74 | %5 | | | 4.18 | %5 |
Supplemental data | | | | | | | | | | | | | | | | | | | | | | | | | | | | |
Portfolio turnover rate | | | 6 | % | | | 18 | % | | | 0 | % | | | 14 | % | | | 41 | % | | | 39 | % | | | 29 | % |
Net assets, end of period (000’s omitted) | | | $302,278 | | | | $328,427 | | | | $353,453 | | | | $271,853 | | | | $277,862 | | | | $270,482 | | | | $311,031 | |
| 1. | After the close of business on July 9, 2010, the Fund acquired the net assets of Evergreen Adjustable Rate Fund, which became the accounting and performance survivor in the transaction. The information for the periods prior to July 12, 2010 is that of Class A of Evergreen Adjustable Rate Fund. |
| 2. | For the two months ended August 31, 2010. The Fund changed its fiscal year end from June 30 to August 31, effective August 31, 2010. |
| 3. | Calculated based upon average shares outstanding. |
| 4. | Total return calculations do not include any sales charges. Returns for periods of less than one year are not annualized. |
| 5. | Ratios include interest and fee expense relating to borrowings and/or leverage transactions as follows: |
| | | | |
Year ended June 30, 2008 | | | 0.25 | % |
Year ended June 30, 2007 | | | 0.36 | % |
The accompanying notes are an integral part of these financial statements.
| | | | |
| 30 | | Wells Fargo Advantage Adjustable Rate Government Fund | | Financial Highlights |
(For a share outstanding throughout each period)
| | | | | | | | | | | | | | | | | | | | | | | | | | | | |
Class B | | Six Months Ended
February 29, 2012 (Unaudited) | | | Year Ended August 31, | | | Year Ended June 30, | |
| | | 2011 | | | 20101,2 | | | 20101 | | | 20091 | | | 20081 | | | 20071 | |
Net asset value, beginning of period | | $ | 9.12 | | | $ | 9.12 | | | $ | 9.11 | | | $ | 9.00 | | | $ | 9.15 | | | $ | 9.21 | | | $ | 9.23 | |
Net investment income | | | 0.02 | 3 | | | 0.07 | 3 | | | 0.00 | 4 | | | 0.13 | 3 | | | 0.26 | 3 | | | 0.37 | 3 | | | 0.32 | 3 |
Net realized and unrealized gains (losses)
on investments | | | 0.02 | | | | 0.05 | | | | 0.03 | | | | 0.11 | | | | (0.14 | ) | | | (0.05 | ) | | | 0.01 | �� |
| | | | | | | | | | | | | | | | | | | | | | | | | | | | |
Total from investment operations | | | 0.04 | | | | 0.12 | | | | 0.03 | | | | 0.24 | | | | 0.12 | | | | 0.32 | | | | 0.33 | |
Distributions to shareholders from | | | | | | | | | | | | | | | | | | | | | | | | | | | | |
Net investment income | | | (0.03 | ) | | | (0.07 | ) | | | (0.00 | )4 | | | (0.13 | ) | | | (0.27 | ) | | | (0.38 | ) | | | (0.35 | ) |
Tax basis return of capital | | | 0.00 | | | | (0.05 | )3 | | | (0.02 | )3 | | | 0.00 | | | | 0.00 | | | | 0.00 | | | | 0.00 | |
| | | | | | | | | | | | | | | | | | | | | | | | | | | | |
Total distributions to shareholders | | | (0.03 | ) | | | (0.12 | ) | | | (0.02 | ) | | | (0.13 | ) | | | (0.27 | ) | | | (0.38 | ) | | | (0.35 | ) |
Net asset value, end of period | | $ | 9.13 | | | $ | 9.12 | | | $ | 9.12 | | | $ | 9.11 | | | $ | 9.00 | | | $ | 9.15 | | | $ | 9.21 | |
Total return5 | | | 0.40 | % | | | 1.28 | % | | | 0.36 | % | | | 2.73 | % | | | 1.33 | % | | | 3.53 | % | | | 3.65 | % |
Ratios to average net assets (annualized) | | | | | | | | | | | | | | | | | | | | | | | | | | | | |
Gross expenses | | | 1.61 | % | | | 1.63 | % | | | 1.62 | % | | | 1.48 | % | | | 1.48 | % | | | 1.70 | %6 | | | 1.81 | %6 |
Net expenses | | | 1.49 | % | | | 1.49 | % | | | 1.49 | % | | | 1.48 | % | | | 1.48 | % | | | 1.70 | %6 | | | 1.81 | %6 |
Net investment income | | | 0.39 | % | | | 0.81 | % | | | 0.24 | % | | | 1.55 | % | | | 2.95 | % | | | 3.99 | %6 | | | 3.45 | %6 |
Supplemental data | | | | | | | | | | | | | | | | | | | | | | | | | | | | |
Portfolio turnover rate | | | 6 | % | | | 18 | % | | | 0 | % | | | 14 | % | | | 41 | % | | | 39 | % | | | 29 | % |
Net assets, end of period (000’s omitted) | | | $10,137 | | | | $14,911 | | | | $50,229 | | | | $52,414 | | | | $90,520 | | | | $183,596 | | | | $274,387 | |
| 1. | After the close of business on July 9, 2010, the Fund acquired the net assets of Evergreen Adjustable Rate Fund which became the accounting and performance survivor in the transaction. The information for the periods prior to July 12, 2010 is that of Class B of Evergreen Adjustable Rate Fund. |
| 2. | For the two months ended August 31, 2010. The Fund changed its fiscal year end from June 30 to August 31, effective August 31, 2010. |
| 3. | Calculated based upon average shares outstanding. |
| 4. | Amount is less than $0.005. |
| 5. | Total return calculations do not include any sales charges. Returns for periods of less than one year are not annualized. |
| 6. | Ratios include interest and fee expense relating to borrowings and/or leverage transactions as follows: |
| | | | |
Year ended June 30, 2008 | | | 0.25 | % |
Year ended June 30, 2007 | | | 0.36 | % |
The accompanying notes are an integral part of these financial statements.
| | | | | | |
| Financial Highlights | | Wells Fargo Advantage Adjustable Rate Government Fund | | | 31 | |
(For a share outstanding throughout each period)
| | | | | | | | | | | | | | | | | | | | | | | | | | | | |
Class C | | Six Months Ended
February 29, 2012 (Unaudited) | | | Year Ended August 31, | | | Year Ended June 30, | |
| | | 2011 | | | 20101,2 | | | 20101 | | | 20091 | | | 20081 | | | 20071 | |
Net asset value, beginning of period | | $ | 9.12 | | | $ | 9.12 | | | $ | 9.11 | | | $ | 9.00 | | | $ | 9.15 | | | $ | 9.21 | | | $ | 9.23 | |
Net investment income | | | 0.01 | | | | 0.06 | | | | 0.00 | 3 | | | 0.14 | | | | 0.25 | | | | 0.37 | 4 | | | 0.32 | 4 |
Net realized and unrealized gains (losses)
on investments | | | 0.03 | | | | 0.06 | | | | 0.03 | | | | 0.10 | | | | (0.13 | ) | | | (0.05 | ) | | | 0.01 | |
| | | | | | | | | | | | | | | | | | | | | | | | | | | | |
Total from investment operations | | | 0.04 | | | | 0.12 | | | | 0.03 | | | | 0.24 | | | | 0.12 | | | | 0.32 | | | | 0.33 | |
Distributions to shareholders from | | | | | | | | | | | | | | | | | | | | | | | | | | | | |
Net investment income | | | (0.03 | ) | | | (0.07 | ) | | | (0.00 | )3 | | | (0.13 | ) | | | (0.27 | ) | | | (0.38 | ) | | | (0.35 | ) |
Tax basis return of capital | | | 0.00 | | | | (0.05 | )4 | | | (0.02 | )4 | | | 0.00 | | | | 0.00 | | | | 0.00 | | | | 0.00 | |
| | | | | | | | | | | | | | | | | | | | | | | | | | | | |
Total distributions to shareholders | | | (0.03 | ) | | | (0.12 | ) | | | (0.02 | ) | | | (0.13 | ) | | | (0.27 | ) | | | (0.38 | ) | | | (0.35 | ) |
Net asset value, end of period | | $ | 9.13 | | | $ | 9.12 | | | $ | 9.12 | | | $ | 9.11 | | | $ | 9.00 | | | $ | 9.15 | | | $ | 9.21 | |
Total return5 | | | 0.40 | % | | | 1.28 | % | | | 0.36 | % | | | 2.73 | % | | | 1.33 | % | | | 3.53 | % | | | 3.65 | % |
Ratios to average net assets (annualized) | | | | | | | | | | | | | | | | | | | | | | | | | | | | |
Gross expenses | | | 1.61 | % | | | 1.63 | % | | | 1.62 | % | | | 1.48 | % | | | 1.48 | % | | | 1.70 | %6 | | | 1.81 | %6 |
Net expenses | | | 1.49 | % | | | 1.49 | % | | | 1.51 | % | | | 1.48 | % | | | 1.48 | % | | | 1.70 | %6 | | | 1.81 | %6 |
Net investment income | | | 0.34 | % | | | 0.74 | % | | | 0.23 | % | | | 1.52 | % | | | 2.88 | % | | | 3.99 | %6 | | | 3.45 | %6 |
Supplemental data | | | | | | | | | | | | | | | | | | | | | | | | | | | | |
Portfolio turnover rate | | | 6 | % | | | 18 | % | | | 0 | % | | | 14 | % | | | 41 | % | | | 39 | % | | | 29 | % |
Net assets, end of period (000’s omitted) | | | $277,487 | | | | $296,645 | | | | $340,278 | | | | $349,562 | | | | $360,607 | | | | $395,703 | | | | $497,661 | |
| 1. | After the close of business on July 9, 2010, the Fund acquired the net assets of Evergreen Adjustable Rate Fund which became the accounting and performance survivor in the transaction. The information for the periods prior to July 12, 2010 is that of Class C of Evergreen Adjustable Rate Fund. |
| 2. | For the two months ended August 31, 2010. The Fund changed its fiscal year end from June 30 to August 31, effective August 31, 2010. |
| 3. | Amount is less than $0.005. |
| 4. | Calculated based upon average shares outstanding. |
| 5. | Total return calculations do not include any sales charges. Returns for periods of less than one year are not annualized. |
| 6. | Ratios include interest and fee expense relating to borrowings and/or leverage transactions as follows: |
| | | | |
Year ended June 30, 2008 | | | 0.25 | % |
Year ended June 30, 2007 | | | 0.36 | % |
The accompanying notes are an integral part of these financial statements.
| | | | |
| 32 | | Wells Fargo Advantage Adjustable Rate Government Fund | | Financial Highlights |
(For a share outstanding throughout each period)
| | | | | | | | | | | | |
Administrator Class | | Six Months Ended
February 29, 2012 (Unaudited) | | | Year Ended August 31, | |
| | | 2011 | | | 20101 | |
Net asset value, beginning of period | | $ | 9.12 | | | $ | 9.12 | | | $ | 9.11 | |
Net investment income | | | 0.05 | | | | 0.14 | 2 | | | 0.02 | |
Net realized and unrealized gains (losses) on investments | | | 0.03 | | | | 0.06 | | | | 0.01 | |
| | | | | | | | | | | | |
Total from investment operations | | | 0.08 | | | | 0.20 | | | | 0.03 | |
Distributions to shareholders from | | | | | | | | | | | | |
Net investment income | | | (0.07 | ) | | | (0.15 | ) | | | (0.00 | )3 |
Tax basis return of capital | | | 0.00 | | | | (0.05 | )2 | | | (0.02 | )2 |
| | | | | | | | | | | | |
Total distributions to shareholders | | | (0.07 | ) | | | (0.20 | ) | | | (0.02 | ) |
Net asset value, end of period | | $ | 9.13 | | | $ | 9.12 | | | $ | 9.12 | |
Total return4 | | | 0.84 | % | | | 2.18 | % | | | 0.31 | % |
Ratios to average net assets (annualized) | | | | | | | | | | | | |
Gross expenses | | | 0.79 | % | | | 0.78 | % | | | 0.90 | % |
Net expenses | | | 0.60 | % | | | 0.60 | % | | | 0.62 | % |
Net investment income | | | 1.18 | % | | | 1.49 | % | | | 2.01 | % |
Supplemental data | | | | | | | | | | | | |
Portfolio turnover rate | | | 6 | % | | | 18 | % | | | 0 | % |
Net assets, end of period (000’s omitted) | | | $115,495 | | | | $34,946 | | | | $10 | |
| 1. | For the period from July 30, 2010 (commencement of class operations) to August 31, 2010. |
| 2. | Calculated based upon average shares outstanding. |
| 3. | Amount is less than $0.005. |
| 4. | Returns for periods of less than one year are not annualized. |
The accompanying notes are an integral part of these financial statements.
| | | | | | |
| Financial Highlights | | Wells Fargo Advantage Adjustable Rate Government Fund | | | 33 | |
(For a share outstanding throughout each period)
| | | | | | | | | | | | | | | | | | | | | | | | | | | | |
Institutional Class | | Six Months Ended
February 29, 2012 (Unaudited) | | | Year Ended August 31, | | | Year Ended June 30, | |
| | | 2011 | | | 20101,2 | | | 20101 | | | 20091 | | | 20081 | | | 20071 | |
Net asset value, beginning of period | | $ | 9.12 | | | $ | 9.12 | | | $ | 9.11 | | | $ | 9.00 | | | $ | 9.15 | | | $ | 9.21 | | | $ | 9.23 | |
Net investment income | | | 0.06 | | | | 0.15 | | | | 0.02 | | | | 0.23 | | | | 0.35 | | | | 0.46 | | | | 0.41 | |
Net realized and unrealized gains (losses)
on investments | | | 0.02 | | | | 0.06 | | | | 0.03 | | | | 0.10 | | | | (0.14 | ) | | | (0.05 | ) | | | 0.02 | |
| | | | | | | | | | | | | | | | | | | | | | | | | | | | |
Total from investment operations | | | 0.08 | | | | 0.21 | | | | 0.05 | | | | 0.33 | | | | 0.21 | | | | 0.41 | | | | 0.43 | |
Distributions to shareholders from | | | | | | | | | | | | | | | | | | | | | | | | | | | | |
Net investment income | | | (0.07 | ) | | | (0.16 | ) | | | (0.02 | ) | | | (0.22 | ) | | | (0.36 | ) | | | (0.47 | ) | | | (0.45 | ) |
Tax basis return of capital | | | 0.00 | | | | (0.05 | )3 | | | (0.02 | )3 | | | 0.00 | | | | 0.00 | | | | 0.00 | | | | 0.00 | |
| | | | | | | | | | | | | | | | | | | | | | | | | | | | |
Total distributions to shareholders | | | (0.07 | ) | | | (0.21 | ) | | | (0.04 | ) | | | (0.22 | ) | | | (0.36 | ) | | | (0.47 | ) | | | (0.45 | ) |
Net asset value, end of period | | $ | 9.13 | | | $ | 9.12 | | | $ | 9.12 | | | $ | 9.11 | | | $ | 9.00 | | | $ | 9.15 | | | $ | 9.21 | |
Total return4 | | | 0.90 | % | | | 2.30 | % | | | 0.53 | % | | | 3.76 | % | | | 2.35 | % | | | 4.57 | % | | | 4.69 | % |
Ratios to average net assets (annualized) | | | | | | | | | | | | | | | | | | | | | | | | | | | | |
Gross expenses | | | 0.53 | % | | | 0.55 | % | | | 0.55 | % | | | 0.48 | % | | | 0.48 | % | | | 0.70 | %5 | | | 0.80 | %5 |
Net expenses | | | 0.49 | % | | | 0.49 | % | | | 0.49 | % | | | 0.48 | % | | | 0.48 | % | | | 0.70 | %5 | | | 0.80 | %5 |
Net investment income | | | 1.30 | % | | | 1.72 | % | | | 1.21 | % | | | 2.52 | % | | | 3.91 | % | | | 4.98 | %5 | | | 4.47 | %5 |
Supplemental data | | | | | | | | | | | | | | | | | | | | | | | | | | | | |
Portfolio turnover rate | | | 6 | % | | | 18 | % | | | 0 | % | | | 14 | % | | | 41 | % | | | 39 | % | | | 29 | % |
Net assets, end of period (000’s omitted) | | | $617,929 | | | | $597,521 | | | | $368,066 | | | | $389,075 | | | | $483,565 | | | | $890,857 | | | | $1,361,685 | |
| 1. | After the close of business on July 9, 2010, the Fund acquired the net assets of Evergreen Adjustable Rate Fund which became the accounting and performance survivor in the transaction. The information for the periods prior to July 12, 2010 is that of Class I of Evergreen Adjustable Rate Fund. |
| 2. | For the two months ended August 31, 2010. The Fund changed its fiscal year end from June 30 to August 31, effective August 31, 2010. |
| 3. | Calculated based upon average shares outstanding. |
| 4. | Returns for periods of less than one year are not annualized. |
| 5. | Ratios include interest and fee expense relating to borrowings and/or leverage transactions as follows: |
| | | | |
Year ended June 30, 2008 | | | 0.25 | % |
Year ended June 30, 2007 | | | 0.36 | % |
The accompanying notes are an integral part of these financial statements.
| | | | |
| 34 | | Wells Fargo Advantage Adjustable Rate Government Fund | | Notes to Financial Statements (Unaudited) |
1. ORGANIZATION
Wells Fargo Funds Trust (the “Trust”), a Delaware statutory trust organized on March 10, 1999, is an open-end management investment company registered under the Investment Company Act of 1940, as amended (the “1940 Act”). These financial statements report on Wells Fargo Advantage Adjustable Rate Government Fund (the “Fund”) which is a diversified series of the Trust.
2. SIGNIFICANT ACCOUNTING POLICIES
The following significant accounting policies, which are consistently followed in the preparation of the financial statements of the Fund, are in conformity with U.S. generally accepted accounting principles which require management to make estimates and assumptions that affect the reported amounts of assets and liabilities, disclosure of contingent assets and liabilities at the date of the financial statements, and the reported amounts of revenues and expenses during the reporting period. Actual results could differ from those estimates.
Securities valuation
Fixed income securities with original maturities exceeding 60 days are valued based on available evaluated prices received from an independent pricing service approved by the Board of Trustees which may utilize both transaction data and market information such as yield, prices of securities of comparable quality, coupon rate, maturity, type of issue, trading characteristics and other market data. If valuations are not available from the pricing service or values received are deemed not representative of market value, values will be obtained from a third party broker-dealer or determined based on the Fund’s Fair Value Procedures.
Debt securities of sufficient credit quality with original maturities of 60 days or less generally are valued at amortized cost which approximates fair value. The amortized cost method involves valuing a security at its cost, plus accretion of discount or minus amortization of premium over the period until maturity.
Investments in open-end mutual funds and non-registered investment companies are generally valued at net asset value.
Investments which are not valued using any of the methods discussed above, are valued at their fair value, as determined by procedures established in good faith and approved by the Board of Trustees.
Futures contracts
The Fund may be subject to interest rate risk in the normal course of pursuing its investment objectives. The Fund may buy and sell futures contracts in order to gain exposure to, or protect against, changes in security values and interest rates. The primary risks associated with the use of futures contracts are the imperfect correlation between changes in market values of securities held by the Fund and the prices of futures contracts, and the possibility of an illiquid market.
Futures contracts are valued based upon their quoted daily settlement prices when available. The aggregate principal amounts of the contracts are not recorded in the financial statements. Fluctuations in the value of the contracts are recorded in the Statement of Assets and Liabilities as an asset or liability and in the Statement of Operations as unrealized gains or losses until the contracts are closed, at which point they are recorded as net realized gains or losses on futures contracts. With futures contracts, there is minimal counterparty risk to the Fund since futures are exchange traded and the exchange’s clearinghouse, as counterparty to all exchange traded futures, guarantees the futures against default.
Security transactions and income recognition
Securities transactions are recorded on a trade date basis. Realized gains or losses are reported on the basis of identified cost of securities delivered.
Interest income is accrued daily and bond discounts are accreted and premiums are amortized daily based on the effective interest method. To the extent debt obligations are placed on non-accrual status, any related interest income may be reduced by writing off interest receivables when the collection of all or a portion of interest has become doubtful based on consistently applied procedures. If the issuer subsequently resumes interest payments or when the collectability of interest is reasonably assured, the debt obligation is removed from non-accrual status.
Distributions to shareholders
Distributions to shareholders from net investment income are accrued daily and paid monthly. Distributions from net realized gains, if any, are recorded on the ex-dividend date. Such distributions are determined in conformity with income tax regulations, which may differ from generally accepted accounting principles.
| | | | | | |
| Notes to Financial Statements (Unaudited) | | Wells Fargo Advantage Adjustable Rate Government Fund | | | 35 | |
Federal and other taxes
The Fund intends to continue to qualify as a regulated investment company by distributing substantially all of its investment company taxable income and any net realized capital gains (after reduction for capital loss carryforwards) sufficient to relieve it from all, or substantially all, federal income taxes. Accordingly, no provision for federal income taxes was required.
The Fund’s income and federal excise tax returns and all financial records supporting those returns for the prior three fiscal years are subject to examination by the federal and Delaware revenue authorities.
Under the recently enacted Regulated Investment Company Modernization Act of 2010, the Fund is permitted to carry forward capital losses incurred in taxable years which began after December 22, 2010 for an unlimited period. However, any losses incurred are required to be utilized prior to the losses incurred in pre-enactment taxable years. As a result of this ordering rule, pre-enactment capital loss carryforwards may be more likely to expire unused. Additionally, post-enactment capital losses that are carried forward will retain their character as either short-term or long-term capital losses rather than being considered all short-term as under previous law.
At August 31, 2011, net capital loss carryforwards, which were available to offset future net realized capital gains, were as follows:
| | | | | | | | | | | | | | | | | | | | | | | | | | | | | | |
| Expiration | |
| 2012 | | | 2013 | | | 2014 | | | 2015 | | | 2016 | | | 2017 | | | 2018 | | | 2019 | |
| $ | 95,791,789 | | | $ | 47,790,373 | | | $ | 11,283,743 | | | $ | 18,541,278 | | | $ | 10,766,785 | | | $ | 24,262,054 | | | $ | 1,705,150 | | | $ | 66,443 | |
As of August 31, 2011, the Fund had $2,127,503 of current year deferred post-October capital losses, which would be treated as realized for tax purposes on the first day of the succeeding year.
Class allocations
The separate classes of shares offered by the Fund differ principally in applicable sales charges, distribution, shareholder servicing and administration fees. Shareholders of each class bear certain expenses that pertain to that particular class. All shareholders bear the common expenses of the Fund, earn income from the portfolio, and are allocated unrealized gains and losses pro rata based on the average daily net assets of each class, without distinction between share classes. Dividends are determined separately for each class based on income and expenses allocable to each class. Realized gains and losses are allocated to each class pro rata based upon the net assets of each class on the date realized. Differences in per share dividend rates generally result from the relative weightings of pro rata income and realized gain allocations and from differences in separate class expenses, including distribution, shareholder servicing and administration fees.
3. FAIR VALUATION MEASUREMENTS
Fair value measurements of investments are determined within a framework that has established a fair value hierarchy based upon the various data inputs utilized in determining the value of the Fund’s investments. The three-level hierarchy gives the highest priority to unadjusted quoted prices in active markets for identical assets or liabilities (Level 1) and the lowest priority to significant unobservable inputs (Level 3). The Fund’s investments are classified within the fair value hierarchy based on the lowest level of input that is significant to the fair value measurement. The inputs are summarized into three broad levels as follows:
| n | | Level 1 – quoted prices in active markets for identical securities |
| n | | Level 2 – other significant observable inputs (including quoted prices for similar securities, interest rates, prepayment speeds, credit risk, etc.) |
| n | | Level 3 – significant unobservable inputs (including the Fund’s own assumptions in determining the fair value of investments) |
The inputs or methodologies used for valuing securities are not necessarily an indication of the risk associated with investing in those securities.
| | | | |
| 36 | | Wells Fargo Advantage Adjustable Rate Government Fund | | Notes to Financial Statements (Unaudited) |
As of February 29, 2012, the inputs used in valuing the Fund’s assets, which are carried at fair value, were as follows:
| | | | | | | | | | | | | | | | |
| Investments in Securities | | Quoted Prices (Level 1) | | | Significant Other
Observable Inputs (Level 2) | | | Significant Unobservable Inputs (Level 3) | | | Total | |
| | | | |
Agency securities | | $ | 0 | | | $ | 1,282,622,081 | | | $ | 0 | | | $ | 1,282,622,081 | |
| | | | |
Short-term investments | | | | | | | | | | | | | | | | |
Investment companies | | | 61,848,812 | | | | 0 | | | | 0 | | | | 61,848,812 | |
U.S. Treasury securities | | | 299,981 | | | | 0 | | | | 0 | | | | 299,981 | |
| | | $ | 62,148,793 | | | $ | 1,282,622,081 | | | $ | 0 | | | $ | 1,344,770,874 | |
Further details on the major security types listed above can be found in the Portfolio of Investments.
As of February 29, 2012, the inputs used in valuing the Fund’s other financial instruments, which are carried at fair value, were as follows:
| | | | | | | | | | | | | | | | |
| Other financial instruments | | Quoted Prices (Level 1) | | | Significant Other
Observable Inputs (Level 2) | | | Significant Unobservable Inputs (Level 3) | | | Total | |
Futures contracts+ | | $ | (25,312 | ) | | $ | 0 | | | $ | 0 | | | $ | (25,312 | ) |
| + | Futures contracts are presented at the unrealized gains or losses on the instrument. |
Transfers in and transfers out are recognized at the end of the reporting period. For the six months ended February 29, 2012, the Fund did not have any significant transfers into/out of Level 1 and Level 2.
4. TRANSACTIONS WITH AFFILIATES AND OTHER EXPENSES
Advisory fee
The Trust has entered into an advisory contract with Wells Fargo Funds Management, LLC (“Funds Management”), an indirect wholly owned subsidiary of Wells Fargo & Company (“Wells Fargo”). The adviser is responsible for implementing investment policies and guidelines and for supervising the sub-adviser, who is responsible for day-to-day portfolio management of the Fund.
Pursuant to the contract, Funds Management is entitled to receive an annual advisory fee starting at 0.40% and declining to 0.30% as the average daily net assets of the Fund increase. For the six months ended February 29, 2012, the advisory fee was equivalent to an annual rate of 0.38% of the Fund’s average daily net assets.
Funds Management has retained the services of certain sub-advisers to provide daily portfolio management to the Fund. The fees related to sub-advisory services are borne directly by Funds Management and do not increase the overall fees paid by the Fund. Wells Capital Management Incorporated, an affiliate of Funds Management, is the sub-adviser to the Fund and is entitled to receive a fee from Funds Management at an annual rate starting at 0.20% and declining to 0.10% as the average daily net assets of the Fund increase.
Administration and transfer agent fees
The Trust has entered into an administration agreement with Funds Management. Under this agreement, for providing administrative services, which includes paying fees and expenses for services provided by the transfer agent, sub-transfer agents, omnibus account servicers and record-keepers, Funds Management is entitled to receive from the Fund an annual fund level administration fee starting at 0.05% and declining to 0.03% as the average daily net assets of the Fund increase and a class level administration fee which is calculated based on the average daily net assets of each class as follows:
| | | | |
| | | Class Level Administration Fee | |
Class A, Class B, Class C | | | 0.16 | % |
Administrator Class | | | 0.10 | |
Institutional Class | | | 0.08 | |
| | | | | | |
| Notes to Financial Statements (Unaudited) | | Wells Fargo Advantage Adjustable Rate Government Fund | | | 37 | |
Funds Management has contractually waived and/or reimbursed advisory and administration fees to the extent necessary to maintain certain net operating expense ratios for the Fund. Waiver of fees and/or reimbursement of expenses by Funds Management were made first from fund level expenses on a proportionate basis and then from class specific expenses. Funds Management has committed through July 11, 2013 to waive fees and/or reimburse expenses to the extent necessary to cap the Fund’s expenses at 0.74% for Class A, 1.49% for Class B, 1.49% for Class C, 0.60% for Administrator Class and 0.49% for Institutional Class.
Distribution fees
The Trust has adopted a Distribution Plan for Class B and Class C shares of the Fund pursuant to Rule 12b-1 under the 1940 Act. Distribution fees are charged to Class B and Class C shares and paid to Wells Fargo Funds Distributor, LLC, the principal underwriter, at an annual rate of 0.75% of the average daily net assets of Class B and Class C shares.
For the six months ended February 29, 2012, Wells Fargo Funds Distributor, LLC received $1,923 from the sale of Class A shares and $5,568 and $3,726 in contingent deferred sales charges from redemptions of Class B and Class C shares, respectively.
Shareholder servicing fees
The Trust has entered into contracts with one or more shareholder servicing agents, whereby Class A, Class B, Class C and Administrator Class of the Fund is charged a fee at an annual rate of 0.25% of the average daily net assets of each respective class.
A portion of these total shareholder servicing fees were paid to affiliates of Wells Fargo.
5. INVESTMENT PORTFOLIO TRANSACTIONS
Purchases and sales of U.S. government securities, excluding short-term securities (securities with maturities of one year or less at purchase date), for the six months ended February 29, 2012 were $218,003,814 and $77,160,531, respectively.
6. DERIVATIVE TRANSACTIONS
During the six months ended February 29, 2012, the Fund entered into futures contracts to speculate on interest rates.
At February 29, 2012, the Fund had short futures contracts outstanding as follows:
| | | | | | | | | | | | |
| Expiration Date | | Contracts | | Type | | Contract
Value at
February 29, 2012 | | | Net Unrealized
Gains
(Losses) | |
| June 2012 | | 115 Short | | 5-Year U.S. Treasury Notes | | $ | 14,164,766 | | | $ | (1,117 | ) |
| June 2012 | | 70 Short | | 10-Year U.S. Treasury Notes | | | 9,166,719 | | | | (24,195 | ) |
The Fund had an average notional amount of $35,462,569 in short futures contracts during the six months ended February 29, 2012.
On February 29, 2012, the cumulative unrealized losses on futures contracts in the amount of $25,312 is reflected in net unrealized gains on investments on the Statement of Assets and Liabilities. The receivable for daily variation margin on open futures contracts reflected in the Statement of Assets and Liabilities only represents the current day’s variation margin. The realized losses and change in unrealized gains (losses) on futures contracts are reflected in the Statement of Operations.
7. BANK BORROWINGS
The Trust (excluding the money market funds) and Wells Fargo Variable Trust are parties to a $150,000,000 revolving credit agreement with State Street Bank and Trust Company, whereby the Fund is permitted to use bank borrowings for temporary or emergency purposes, such as to fund shareholder redemption requests. Interest under the credit agreement is charged to the Fund based on a borrowing rate equal to the higher of the Federal Funds rate in effect on that day plus 1.25% or the overnight LIBOR rate in effect on that day plus 1.25%. In addition, an annual commitment fee equal to 0.10% of the unused balance is allocated to each participating fund. Prior to September 6, 2011, the revolving credit agreement was for $125,000,000 and the annual commitment fee paid by the Fund was 0.125% of the unused balance. For the six months ended February 29, 2012, the Fund paid $965 in commitment fees.
| | | | |
| 38 | | Wells Fargo Advantage Adjustable Rate Government Fund | | Notes to Financial Statements (Unaudited) |
During the six months ended February 29, 2012, the Fund had average borrowings outstanding of $50,284 (on an annualized basis) at an average rate of 1.41% and paid interest of $709.
8. INDEMNIFICATION
Under the Trust’s organizational documents, the officers and directors are indemnified against certain liabilities that may arise out of performance of their duties to the Trust. Additionally, in the normal course of business, the Trust may enter into contracts with service providers that contain a variety of indemnification clauses. The Trust’s maximum exposure under these arrangements is dependent on future claims that may be made against the Fund and, therefore, cannot be estimated.
9. NEW ACCOUNTING PRONOUNCEMENTS
In May 2011, the Financial Accounting Standards Board (“FASB”) issued Accounting Standards Update (“ASU”) No. 2011-04 “Amendments to Achieve Common Fair Value Measurement and Disclosure Requirements in U.S. GAAP and IFRSs”. ASU No. 2011-04 amends FASB ASC Topic 820, Fair Value Measurements and Disclosures, to establish common requirements for measuring fair value and for disclosing information about fair value measurements in accordance with GAAP. The ASU is effective prospectively for interim and annual periods beginning after December 15, 2011. Management expects that adoption of the ASU will result in additional disclosures in the financial statements, as applicable.
In April 2011, FASB issued ASU No. 2011-03 “Reconsideration of Effective Control for Repurchase Agreements”. ASU No. 2011-03 amends FASB ASC Topic 860, Transfers and Servicing, specifically the criteria required to determine whether a repurchase agreement (repo) and similar agreements should be accounted for as sales of financial assets or secured borrowings with commitments. ASU No. 2011-03 changes the assessment of effective control by focusing on the transferor’s contractual rights and obligations and removing the criterion to assess its ability to exercise those rights or honor those obligations. This could result in changes to the way entities account for certain transactions including repurchase agreements, mortgage dollar rolls and reverse repurchase agreements. The ASU will become effective on a prospective basis for new transfers and modifications to existing transactions as of the beginning of the first interim or annual period beginning on or after December 15, 2011. Management has evaluated the impact of adopting the ASU and expects no significant changes.
| | | | | | |
| Other Information (Unaudited) | | Wells Fargo Advantage Adjustable Rate Government Fund | | | 39 | |
PROXY VOTING INFORMATION
A description of the policies and procedures that the Fund uses to determine how to vote proxies relating to portfolio securities is available without charge, upon request, by calling 1-800-222-8222, visiting our Web site at wellsfargoadvantagefunds.com, or visiting the SEC Web site at sec.gov. Information regarding how the Fund voted proxies relating to portfolio securities during the most recent 12-month period ended June 30 is available without charge on the Fund’s Web site at wellsfargoadvantagefunds.com or by visiting the SEC Web site at sec.gov.
PORTFOLIO HOLDINGS INFORMATION
The complete portfolio holdings for the Fund are publicly available on the Fund’s Web site (wellsfargoadvantagefunds.com) on a monthly, 30-day or more delayed basis. In addition, top ten holdings information for the Fund is publicly available on the Fund’s Web site on a monthly, seven-day or more delayed basis. The Fund files its complete schedule of portfolio holdings with the SEC for the first and third quarters of each fiscal year on Form N-Q, which is available without charge by visiting the SEC Web site at sec.gov. In addition, the Fund’s Form N-Q may be reviewed and copied at the SEC’s Public Reference Room in Washington, DC, and at regional offices in New York City, at 233 Broadway, and in Chicago, at 175 West Jackson Boulevard, Suite 900. Information about the Public Reference Room may be obtained by calling 1-800-SEC-0330.
| | | | |
| 40 | | Wells Fargo Advantage Adjustable Rate Government Fund | | Other Information (Unaudited) |
BOARD OF TRUSTEES
The following table provides basic information about the Board of Trustees (the “Trustees”) of the Trust and Officers of the Trust. This table should be read in conjunction with the Prospectus and the Statement of Additional Information1 of the Fund. Each of the Trustees and Officers listed below acts in identical capacities for the Wells Fargo Advantage family of funds, which consists of 137 funds comprising the Wells Fargo Funds Trust, Wells Fargo Variable Trust, Wells Fargo Master Trust and four closed-end funds (collectively the “Fund Complex”). All of the Trustees are also Members of the Audit and Governance Committees of each Trust in the Fund Complex. The mailing address of each Trustee and Officer is 525 Market Street, 12th Floor, San Francisco, CA 94105. Each Trustee and Officer serves an indefinite term, however, each Trustee serves such term until reaching the mandatory retirement age established by the Trustees.
Independent Trustees
| | | | | | |
Name and Year of Birth | | Position Held and Length of Service | | Principal Occupations During Past Five Years | | Other Directorships During
Past Five Years |
Peter G. Gordon
(Born 1942) | | Trustee, since 1998; Chairman, since 2005 (Lead Trustee since 2001) | | Co-Founder, Retired Chairman, President and CEO of Crystal Geyser Water Company. Trustee Emeritus, Colby College | | Asset Allocation Trust |
Isaiah Harris, Jr.
(Born 1952) | | Trustee, since 2009 | | Retired. Prior thereto, President and CEO of BellSouth Advertising and Publishing Corp. from 2005 to 2007, President and CEO of BellSouth Enterprises from 2004 to 2005 and President of BellSouth Consumer Services from 2000 to 2003. Emeritus member of the Iowa State University Foundation Board of Governors. Emeritus Member of the Advisory Board of Iowa State University School of Business. Mr. Harris is a certified public accountant. | | CIGNA Corporation; Deluxe Corporation; Asset Allocation Trust |
Judith M. Johnson
(Born 1949) | | Trustee, since 2008 | | Retired. Prior thereto, Chief Executive Officer and Chief Investment Officer of Minneapolis Employees Retirement Fund from 1996 to 2008. Ms. Johnson is an attorney, certified public accountant and a certified managerial accountant. | | Asset Allocation Trust |
Leroy Keith, Jr.
(Born 1939) | | Trustee, since 2010 | | Chairman, Bloc Global Services (development and construction). Trustee of the Evergreen Funds from 1983 to 2010. Former Managing Director, Almanac Capital Management (commodities firm), former Partner, Stonington Partners, Inc. (private equity fund), former Director, Obagi Medical Products Co. and former Director, Lincoln Educational Services. | | Trustee, Virtus Fund Complex (consisting of 40 portfolios as of 12/31/11); Asset Allocation Trust |
David F. Larcker
(Born 1950) | | Trustee, since 2009 | | James Irvin Miller Professor of Accounting at the Graduate School of Business, Stanford University, Director of Corporate Governance Research Program and Senior Faculty of The Rock Center for Corporate Governance since 2006. From 2005 to 2008, Professor of Accounting at the Graduate School of Business, Stanford University. Prior thereto, Ernst & Young Professor of Accounting at The Wharton School, University of Pennsylvania from 1985 to 2005. | | Asset Allocation Trust |
Olivia S. Mitchell
(Born 1953) | | Trustee, since 2006 | | International Foundation of Employee Benefit Plans Professor, Wharton School of the University of Pennsylvania since 1993. Director of Wharton’s Pension Research Council and Boettner Center on Pensions & Retirement Research, and Research Associate at the National Bureau of Economic Research. Previously, Cornell University Professor from 1978 to 1993. | | Asset Allocation Trust |
| | | | | | |
| Other Information (Unaudited) | | Wells Fargo Advantage Adjustable Rate Government Fund | | | 41 | |
| | | | | | |
Name and Year of Birth | | Position Held and Length of Service | | Principal Occupations During Past Five Years | | Other Directorships During
Past Five Years |
Timothy J. Penny
(Born 1951) | | Trustee, since 1996 | | President and CEO of Southern Minnesota Initiative Foundation, a non-profit organization, since 2007 and Senior Fellow at the Humphrey Institute Policy Forum at the University of Minnesota since 1995. Member of the Board of Trustees of NorthStar Education Finance, Inc., a non-profit organization, since 2007. | | Asset Allocation Trust |
Michael S. Scofield
(Born 1943) | | Trustee, since 2010 | | Served on the Investment Company Institute’s Board of Governors and Executive Committee from 2008-2011 as well the Governing Council of the Independent Directors Council from 2006-2011 and the Independent Directors Council Executive Committee from 2008-2011. Chairman of the IDC from 2008-2010. Institutional Investor (Fund Directions) Trustee of Year in 2007. Trustee of the Evergreen Funds (and its predecessors) from 1984 to 2010. Chairman of the Evergreen Funds from 2000-2010. Former Trustee of the Mentor Funds. Retired Attorney, Law Offices of Michael S. Scofield and former Director and Chairman, Branded Media Corporation (multi-media branding company). | | Asset Allocation Trust |
Donald C. Willeke
(Born 1940) | | Trustee, since 1996 | | Principal of the law firm of Willeke & Daniels. General Counsel of the Minneapolis Employees Retirement Fund from 1984 until its consolidation into the Minnesota Public Employees Retirement Association on June 30, 2010. Director and Vice Chair of The Free Trust (non-profit corporation). Director of the American Chestnut Foundation (non-profit corporation). | | Asset Allocation Trust |
Officers
| | | | | | |
Name and Year of Birth | | Position Held and
Length of Service | | Principal Occupations During Past Five Years | | |
Karla M. Rabusch
(Born 1959) | | President, since 2003 | | Executive Vice President of Wells Fargo Bank, N.A. and President of Wells Fargo Funds Management, LLC since 2003. Senior Vice President and Chief Administrative Officer of Wells Fargo Funds Management, LLC from 2001 to 2003. | | |
C. David Messman
(Born 1960) | | Secretary, since 2000; Chief Legal Counsel, since 2003 | | Senior Vice President and Secretary of Wells Fargo Funds Management, LLC since 2001. Vice President and Managing Senior Counsel of Wells Fargo Bank, N.A. since 1996. | | |
Kasey Phillips
(Born 1970) | | Treasurer, since 2009 | | Senior Vice President of Wells Fargo Funds Management, LLC since 2009. Senior Vice President of Evergreen Investment Management Company, LLC from 2006 to 2010. Treasurer of the Evergreen Funds from 2005 to 2010. | | |
David Berardi
(Born 1975) | | Assistant Treasurer, since 2009 | | Vice President of Wells Fargo Funds Management, LLC since 2009. Vice President of Evergreen Investment Management Company, LLC from 2008 to 2010. Assistant Vice President of Evergreen Investment Services, Inc. from 2004 to 2008. Manager of Fund Reporting and Control for Evergreen Investment Management Company, LLC from 2004 to 2010. | | |
Jeremy DePalma
(Born 1974) | | Assistant Treasurer, since 2009 | | Senior Vice President of Wells Fargo Funds Management, LLC since 2009. Senior Vice President of Evergreen Investment Management Company, LLC from 2008 to 2010. Vice President, Evergreen Investment Services, Inc. from 2004 to 2007. Head of the Fund Reporting and Control Team within Fund Administration from 2005 to 2010. | | |
Debra Ann Early
(Born 1964) | | Chief Compliance Officer, since 2007 | | Chief Compliance Officer of Wells Fargo Funds Management, LLC since 2007. Chief Compliance Officer of Parnassus Investments from 2005 to 2007. Chief Financial Officer of Parnassus Investments from 2004 to 2007 and Senior Audit Manager of PricewaterhouseCoopers LLP from 1998 to 2004. | | |
| 1. | The Statement of Additional Information includes additional information about the Trustees and is available, without charge, upon request, by calling 1-800-222-8222 or by visiting the Web site at wellsfargoadvantagefunds.com. |
| | | | |
| 42 | | Wells Fargo Advantage Adjustable Rate Government Fund | | List of Abbreviations |
The following is a list of common abbreviations for terms and entities which may have appeared in this report.
| ACB | — Agricultural Credit Bank |
| ADR | — American Depository Receipt |
| ADS | — American Depository Shares |
| AGC-ICC | — Assured Guaranty Corporation - Insured Custody Certificates |
| AGM | — Assured Guaranty Municipal |
| AMBAC | — American Municipal Bond Assurance Corporation |
| AMT | — Alternative Minimum Tax |
| BAN | — Bond Anticipation Notes |
| BHAC | — Berkshire Hathaway Assurance Corporation |
| CAB | — Capital Appreciation Bond |
| CCAB | — Convertible Capital Appreciation Bond |
| CDA | — Community Development Authority |
| CDO | — Collateralized Debt Obligation |
| COP | — Certificate of Participation |
| DRIVER | — Derivative Inverse Tax-Exempt Receipts |
| DW&P | — Department of Water & Power |
| DWR | — Department of Water Resources |
| ECFA | — Educational & Cultural Facilities Authority |
| EDA | — Economic Development Authority |
| EDFA | — Economic Development Finance Authority |
| ETF | — Exchange-Traded Fund |
| FFCB | — Federal Farm Credit Bank |
| FGIC | — Financial Guaranty Insurance Corporation |
| FHA | — Federal Housing Authority |
| FHLB | — Federal Home Loan Bank |
| FHLMC | — Federal Home Loan Mortgage Corporation |
| FNMA | — Federal National Mortgage Association |
| GDR | — Global Depository Receipt |
| GNMA | — Government National Mortgage Association |
| HCFR | — Healthcare Facilities Revenue |
| HEFA | — Health & Educational Facilities Authority |
| HEFAR | — Higher Education Facilities Authority Revenue |
| HFA | — Housing Finance Authority |
| HFFA | — Health Facilities Financing Authority |
| IBC | — Insured Bond Certificate |
| IDA | — Industrial Development Authority |
| IDAG | — Industrial Development Agency |
| IDR | — Industrial Development Revenue |
| KRW | — Republic of Korea Won |
| LIBOR | — London Interbank Offered Rate |
| LLC | — Limited Liability Company |
| LLP | — Limited Liability Partnership |
| MBIA | — Municipal Bond Insurance Association |
| MFHR | — Multi-Family Housing Revenue |
| MSTR | — Municipal Securities Trust Receipts |
| MUD | — Municipal Utility District |
| NATL-RE | — National Public Finance Guarantee Corporation |
| PCFA | — Pollution Control Finance Authority |
| PCR | — Pollution Control Revenue |
| PFA | — Public Finance Authority |
| PFFA | — Public Facilities Financing Authority |
| PFOTER | — Puttable Floating Option Tax-Exempt Receipts |
| plc | — Public Limited Company |
| PUTTER | — Puttable Tax-Exempt Receipts |
| R&D | — Research & Development |
| RDA | — Redevelopment Authority |
| RDFA | — Redevelopment Finance Authority |
| REIT | — Real Estate Investment Trust |
| ROC | — Reset Option Certificates |
| SAVRS | — Select Auction Variable Rate Securities |
| SBA | — Small Business Authority |
| SFHR | — Single Family Housing Revenue |
| SFMR | — Single Family Mortgage Revenue |
| SPDR | — Standard & Poor’s Depositary Receipts |
| STRIPS | — Separate Trading of Registered Interest and Principal Securities |
| TAN | — Tax Anticipation Notes |
| TIPS | — Treasury Inflation-Protected Securities |
| TRAN | — Tax Revenue Anticipation Notes |
| TCR | — Transferable Custody Receipts |
| TTFA | — Transportation Trust Fund Authority |
| TVA | — Tennessee Valley Authority |
| XLCA | — XL Capital Assurance |


FOR MORE INFORMATION
More information about Wells Fargo Advantage Funds is available free upon request. To obtain literature, please write, e-mail, visit the Fund’s Web site, or call:
Wells Fargo Advantage Funds
P.O. Box 8266
Boston, MA 02266-8266
E-mail: wfaf@wellsfargo.com
Web site: wellsfargoadvantagefunds.com
Individual investors: 1-800-222-8222
Retail investment professionals: 1-888-877-9275
Institutional investment professionals: 1-866-765-0778
This report and the financial statements contained herein are submitted for the general information of the shareholders of Wells Fargo Advantage Funds. If this report is used for promotional purposes, distribution of the report must be accompanied or preceded by a current prospectus. For a prospectus containing more complete information, including charges and expenses, call 1-800-222-8222 or visit the Fund’s Web site at wellsfargoadvantagefunds.com. Please consider the investment objectives, risks, charges, and expenses of the investment carefully before investing. This and other information about Wells Fargo Advantage Funds can be found in the current prospectus. Read the prospectus carefully before you invest or send money.
Wells Fargo Funds Management, LLC, a wholly owned subsidiary of Wells Fargo & Company, provides investment advisory and administrative services for Wells Fargo Advantage Funds. Other affiliates of Wells Fargo & Company provide subadvisory and other services for the Funds. The Funds are distributed by Wells Fargo Funds Distributor, LLC, Member FINRA/SIPC, an affiliate of Wells Fargo & Company.
NOT FDIC INSURED ¡ NO BANK GUARANTEE ¡ MAY LOSE VALUE
© 2012 Wells Fargo Funds Management, LLC. All rights reserved.
| | |
 | | 208520 04-12 SA215/SAR215 2-12 |

Wells Fargo Advantage
Government Securities Fund

Semi-Annual Report
February 29, 2012

Reduce clutter. Save trees.
Sign up for electronic delivery of prospectuses and shareholder reports at wellsfargo.com/advantagedelivery
Contents
The views expressed and any forward-looking statements are as of February 29, 2012, unless otherwise noted, and are those of the Fund managers and/or Wells Fargo Funds Management, LLC. Discussions of individual securities, or the markets generally, or any Wells Fargo Advantage Fund are not intended as individual recommendations. Future events or results may vary significantly from those expressed in any forward-looking statements; the views expressed are subject to change at any time in response to changing circumstances in the market. Wells Fargo Funds Management, LLC, disclaims any obligation to publicly update or revise any views expressed or forward-looking statements.
NOT FDIC INSURED ¡ NO BANK GUARANTEE ¡ MAY LOSE VALUE

WELLS FARGO INVESTMENT HISTORY
| | |
| |
| 1932 | | Keystone creates one of the first mutual fund families. |
| |
| 1971 | | Wells Fargo & Company introduces one of the first institutional index funds. |
| |
| 1978 | | Wells Fargo applies Markowitz and Sharpe’s research on Modern Portfolio Theory to introduce one of the industry’s first Tactical Asset Allocation (TAA) models in institutional separately managed accounts. |
| |
| 1984 | | Wells Fargo Stagecoach Funds launches its first asset allocation fund. |
| |
| 1989 | | The Tactical Asset Allocation (TAA) Model is first applied to Wells Fargo’s asset allocation mutual funds. |
| |
| 1994 | | Wells Fargo introduces the LifePath Funds, one of the first suites of target date funds (now the Wells Fargo Advantage Dow Jones Target Date FundsSM). |
| |
| 1996 | | Evergreen Investments and Keystone Funds merge. |
| |
| 1997 | | Wells Fargo launches Wells Fargo Advantage WealthBuilder PortfoliosSM, a fund-of-funds suite of products that includes the use of quantitative models to shift assets among investment styles. |
| |
| 1999 | | Norwest Advantage Funds and Stagecoach Funds are reorganized into Wells Fargo Funds after the merger of Norwest and Wells Fargo. |
| |
| 2002 | | Evergreen Retail and Evergreen Institutional companies form the umbrella asset management company, Evergreen Investments. |
| |
| 2005 | | The integration of Strong Funds with Wells Fargo Funds creates Wells Fargo Advantage Funds, resulting in one of the top 20 mutual fund companies in the United States. |
| |
| 2006 | | Wells Fargo Advantage Funds relaunches the target date product line as Wells Fargo Advantage Dow Jones Target Date Funds. |
| |
| 2010 | | The mergers and reorganizations of Evergreen and Wells Fargo Advantage mutual funds are completed, unifying the families under the brand of Wells Fargo Advantage Funds. |
Wells Fargo Advantage Funds®
Wells Fargo Advantage Funds skillfully guides institutions, financial advisors, and individuals through the investment terrain to help them reach their financial objectives. Everything we do on behalf of investors is backed by our unique combination of qualifications.
Strength
Our organization is built on the standards of integrity and service established by our parent company—Wells Fargo & Company—more than 150 years ago. And, because we’re part of a highly diversified financial enterprise, we offer the depth of resources to help investors succeed.
Expertise
Our multi-boutique model offers investors access to the independent thinking of premier investment managers that have been chosen for their time-tested strategies. While each team specializes in a specific investment strategy, collectively they provide investors a wide choice of distinct investment styles. Our dedication to investment excellence doesn’t end with our expertise in manager selection—risk management, analysis, and rigorous ongoing review seek to ensure each manager’s investment process remains consistent.
Partnership
Our collaborative approach is built around understanding the needs and goals of our clients. By adhering to core principles of sound judgment and steady guidance, we support you through every stage of the investment decision process.
Carefully consider a fund’s investment objectives, risks, charges, and expenses before investing. For a current prospectus and, if available, a summary prospectus, containing this and other information, visit wellsfargoadvantagefunds.com. Read it carefully before investing.
Wells Fargo Funds Management, LLC, a wholly owned subsidiary of Wells Fargo & Company, provides investment advisory and administrative services for Wells Fargo Advantage Funds®. Other affiliates of Wells Fargo & Company provide subadvisory and other services for the Funds. The Funds are distributed by Wells Fargo Funds Distributor, LLC, Member FINRA/SIPC, an affiliate of Wells Fargo & Company.
“Dow Jones®” and “Dow Jones Target Date IndexesSM” are service marks of Dow Jones Trademark Holdings, LLC (“Dow Jones”), have been licensed to CME Group Index Services LLC (“CME Indexes”) and have been sublicensed for use for certain purposes by Global Index Advisors, Inc, and Wells Fargo Funds Management, LLC. The Wells Fargo Advantage Dow Jones Target Date FundsSM based on the Dow Jones Target Date IndexesSM, are not sponsored, endorsed, sold or promoted by Dow Jones, CME Indexes or their respective affiliates and none of them makes any representation regarding the advisability of investing in such product(s).
NOT FDIC INSURED ¡ NO BANK GUARANTEE ¡ MAY LOSE VALUE
Not part of the semi-annual report.
Wells Fargo Advantage Funds offers more than 110 mutual funds across a wide range of asset classes, representing over $218 billion in assets under management, as of February 29, 2012.
| | | | |
| Equity Funds | | | | |
Asia Pacific Fund | | Equity Value Fund | | Precious Metals Fund |
C&B Large Cap Value Fund | | Global Opportunities Fund | | Premier Large Company Growth Fund |
C&B Mid Cap Value Fund | | Growth Fund | | Small Cap Opportunities Fund |
Capital Growth Fund | | Index Fund | | Small Cap Value Fund |
Common Stock Fund | | International Equity Fund | | Small Company Growth Fund |
Disciplined U.S. Core Fund | | International Value Fund | | Small Company Value Fund |
Discovery Fund† | | Intrinsic Small Cap Value Fund | | Small/Mid Cap Core Fund |
Diversified Equity Fund | | Intrinsic Value Fund | | Small/Mid Cap Value Fund |
Diversified International Fund | | Intrinsic World Equity Fund | | Special Mid Cap Value Fund |
Diversified Small Cap Fund | | Large Cap Core Fund | | Special Small Cap Value Fund |
Emerging Growth Fund | | Large Cap Growth Fund | | Specialized Technology Fund |
Emerging Markets Equity Fund | | Large Company Value Fund | | Strategic Large Cap Growth Fund |
Endeavor Select Fund† | | Omega Growth Fund | | Traditional Small Cap Growth Fund |
Enterprise Fund† | | Opportunity Fund† | | Utility and Telecommunications Fund |
| Bond Funds | | | | |
Adjustable Rate Government Fund | | Inflation-Protected Bond Fund | | Short-Term Bond Fund |
California Limited-Term Tax-Free Fund | | Intermediate Tax/AMT-Free Fund | | Short-Term High Yield Bond Fund |
California Tax-Free Fund | | International Bond Fund | | Short-Term Municipal Bond Fund |
Colorado Tax-Free Fund | | Minnesota Tax-Free Fund | | Strategic Municipal Bond Fund |
Government Securities Fund | | Municipal Bond Fund | | Total Return Bond Fund |
High Income Fund | | North Carolina Tax-Free Fund | | Ultra Short-Term Income Fund |
High Yield Bond Fund | | Pennsylvania Tax-Free Fund | | Ultra Short-Term Municipal Income Fund |
Income Plus Fund | | Short Duration Government Bond Fund | | Wisconsin Tax-Free Fund |
| Asset Allocation Funds | | | | |
Absolute Return Fund | | WealthBuilder Equity Portfolio† | | Target 2020 Fund† |
Asset Allocation Fund | | WealthBuilder Growth Allocation Portfolio† | | Target 2025 Fund† |
Conservative Allocation Fund | | WealthBuilder Growth Balanced Portfolio† | | Target 2030 Fund† |
Diversified Capital Builder Fund | | WealthBuilder Moderate Balanced Portfolio† | | Target 2035 Fund† |
Diversified Income Builder Fund | | WealthBuilder Tactical Equity Portfolio† | | Target 2040 Fund† |
Growth Balanced Fund | | Target Today Fund† | | Target 2045 Fund† |
Index Asset Allocation Fund | | Target 2010 Fund† | | Target 2050 Fund† |
Moderate Balanced Fund | | Target 2015 Fund† | | Target 2055 Fund† |
WealthBuilder Conservative Allocation Portfolio† | | | | |
| Money Market Funds | | | | |
100% Treasury Money Market Fund | | Heritage Money Market Fund† | | National Tax-Free Money Market Fund |
California Municipal Money Market Fund | | Money Market Fund | | Prime Investment Money Market Fund |
Cash Investment Money Market Fund | | Municipal Cash Management Money Market Fund | | Treasury Plus Money Market Fund |
Government Money Market Fund | | Municipal Money Market Fund | | |
| Variable Trust Funds1 | | | | |
VT Discovery Fund† | | VT Intrinsic Value Fund | | VT Small Cap Growth Fund |
VT Index Asset Allocation Fund | | VT Omega Growth Fund | | VT Small Cap Value Fund |
VT International Equity Fund | | VT Opportunity Fund† | | VT Total Return Bond Fund |
An investment in a money market fund is not insured or guaranteed by the Federal Deposit Insurance Corporation or any other government agency. Although the Wells Fargo Advantage Money Market Funds seek to preserve the value of your investment at $1.00 per share, it is possible to lose money by investing in a money market fund.
| 1. | The Variable Trust Funds are generally available only through insurance company variable contracts. |
| † | In this report, the Wells Fargo Advantage Discovery FundSM, Wells Fargo Advantage Endeavor Select FundSM, Wells Fargo Advantage Enterprise FundSM, Wells Fargo Advantage Opportunity FundSM, Wells Fargo Advantage WealthBuilder Conservative Allocation PortfolioSM, Wells Fargo Advantage WealthBuilder Equity PortfolioSM, Wells Fargo Advantage WealthBuilder Growth Allocation PortfolioSM, Wells Fargo Advantage WealthBuilder Growth Balanced PortfolioSM, Wells Fargo Advantage WealthBuilder Moderate Balanced PortfolioSM, Wells Fargo Advantage WealthBuilder Tactical Equity PortfolioSM, Wells Fargo Advantage Dow Jones Target Today FundSM, Wells Fargo Advantage Dow Jones Target 2010 FundSM, Wells Fargo Advantage Dow Jones Target 2015 FundSM, Wells Fargo Advantage Dow Jones Target 2020 FundSM, Wells Fargo Advantage Dow Jones Target 2025 FundSM, Wells Fargo Advantage Dow Jones Target 2030 FundSM, Wells Fargo Advantage Dow Jones Target 2035 FundSM, Wells Fargo Advantage Dow Jones Target 2040 FundSM, Wells Fargo Advantage Dow Jones Target 2045 FundSM, Wells Fargo Advantage Dow Jones Target 2050 FundSM, Wells Fargo Advantage Dow Jones Target 2055 FundSM, Wells Fargo Advantage Heritage Money Market FundSM, Wells Fargo Advantage VT Discovery FundSM, and Wells Fargo Advantage VT Opportunity FundSM are referred to as the Discovery Fund, Endeavor Select Fund, Enterprise Fund, Opportunity Fund, WealthBuilder Conservative Allocation Portfolio, WealthBuilder Equity Portfolio, WealthBuilder Growth Allocation Portfolio, WealthBuilder Growth Balanced Portfolio, WealthBuilder Moderate Balanced Portfolio, WealthBuilder Tactical Equity Portfolio, Target Today Fund, Target 2010 Fund, Target 2015 Fund, Target 2020 Fund, Target 2025 Fund, Target 2030 Fund, Target 2035 Fund, Target 2040 Fund, Target 2045 Fund, Target 2050 Fund, Target 2055 Fund, Heritage Money Market Fund, VT Discovery Fund, and VT Opportunity Fund, respectively. |
Not part of the semi-annual report.
| | | | |
| 2 | | Wells Fargo Advantage Government Securities Fund | | Letter to Shareholders |

Karla M. Rabusch,
President
Wells Fargo Advantage Funds
The theme for the period was a shift from risk aversion in the first half to burgeoning trends of improving investor confidence in the second half, which significantly improved pricing in the lower-rated asset classes.
On the whole, investment-grade fixed-income securities performed positively during the period, but the strongest returns came from the high-yield market.
Dear Valued Shareholder:
We are pleased to offer you this semi-annual report for the Wells Fargo Advantage Government Securities Fund, which covers the six-month period that ended February 29, 2012. During the period, fixed-income performance was best among the lower-rated securities, as improved investor confidence in the U.S. economy and the U.S. credit markets encouraged investors to return to riskier asset classes.
The period began with heightened risk aversion but ended with stronger investor confidence.
The six-month period began with the worsening of the Greek crisis, which amplified risk aversion across the global credit markets. This in turn led to a powerful rally in U.S. Treasuries and a sharp decline in high-yield bond prices, most notably in the lowest-quality credit tiers. During this time, most investment-grade fixed-income markets continued to generate positive returns—although certain areas of the riskiest segments of the markets declined—and U.S. Treasury yields reached the lowest levels in decades, even surpassing the low yield levels reached in the summer of 2010.
The last three months of the period were characterized by a strong reversal of the trends of the first three months. In October 2011, the high-yield market recovered significantly, benefiting from indications of improving policy with regard to managing the debt crisis from Europe and the formal announcement of a European debt deal late in the month. Due to renewed concerns about the European Union’s ability to manage the debt crisis, November 2011 saw a modest decline in investment-grade corporate bond prices and a sharp correction in high-yield corporate bonds, but another strong recovery in pricing started in December and carried into the first two months of 2012. Investor confidence strengthened as the U.S. economy demonstrated signs of sustainable growth and U.S. credit markets began to show some resistance to the credit problems of Europe. Thus, the theme for the period was a shift from risk aversion in the first half to burgeoning trends of improving investor confidence in the second half, which significantly improved pricing in the lower-rated asset classes.
On the whole, investment-grade fixed-income securities performed positively during the period, but the strongest returns came from the high-yield market. In fact, the best returns for the six-month period came from the lowest-rated credit tiers, despite the fact that they significantly underperformed in August and September 2011. Similar trends were true in the structured products sector, as lower-rated commercial mortgage-backed securities were among the best performers for the period, despite underperforming in the first two months.
The Federal Reserve launched Operation Twist in September.
With economic concerns and credit woes escalating in Europe and some continued uncertainty about the growth outlook in the U.S. during August and September 2011, the Federal Reserve (Fed) intervened yet again with monetary accommodations—this time with “Operation Twist,” which was announced and launched in September 2011. With Operation Twist, the Fed endeavored to flatten the yield curve and drive long-term rates down by selling short-term Treasuries and using the proceeds to purchase long-term Treasuries. The Fed stated that it is unlikely to raise rates before 2014, which should keep yields on Treasuries low. Despite this announcement, problems in Europe caused Treasuries to continue to rally in the first 3 months of the period, while credit spreads on corporate and
| | | | | | |
| Letter to Shareholders | | Wells Fargo Advantage Government Securities Fund | | | 3 | |
securitized sectors widened with increasing risk aversion. However, with an improved U.S. economic outlook and greater investor confidence, the last three months of the period saw a slight decline in U.S. Treasury prices and significant improvement in high-yield corporate bond prices. Credit spreads in the corporate and securitized sectors broadly tightened in December 2011 and January and February 2012.
Although U.S. economic conditions appear to have improved over the course of the period, the recovery continues to face some headwinds in the form of languishing housing values and elevated unemployment levels, which may continue to create some volatility in the fixed-income markets. While we cannot say definitively what near-term performance will look like, we continue to encourage investors to maintain fully diversified, actively managed portfolios, which may provide better protection from risk and added opportunities to capture relative value. While heightened volatility may be uncomfortable to experience in the short term, we believe it can lead to unique opportunities to add relative value for investors with long-term investment horizons.
Don’t let short-term uncertainty derail long-term investment goals.
Periods of uncertainty can present challenges, but experience has taught us that maintaining a long-term investment strategy based on individual goals and risk tolerance can be an effective way to plan for the future. To help you create a sound strategy based on your personal goals and risk tolerance, Wells Fargo Advantage Funds offers more than 110 mutual funds and other investments spanning a wide range of asset classes and investment styles. Although diversification cannot guarantee an investment profit or prevent losses, we believe it can be an effective way to manage investment risk and potentially smooth out overall portfolio performance.
In our opinion, diligent and earnest assessment of the fundamental risks in individual fixed-income securities will be a key differentiating factor between which investment strategies perform well and which do not. At Wells Fargo Advantage Funds, we intend to continue measuring relative-value opportunities in the fixed-income markets and across our lineup of funds. We believe it is particularly important to have diligent investment analysts in charge of investor assets in changing markets. As evidenced by the performance of fixed-income assets during the recent six-month period, heightened risks also often accompany such opportunities.
Thank you for choosing to invest with Wells Fargo Advantage Funds. We appreciate your confidence in us and remain committed to helping you meet your financial needs. For current information about your fund investments, contact your investment professional, visit our Web site at wellsfargoadvantagefunds.com, or call us directly at 1-800-222-8222. We are available 24 hours a day, 7 days a week.
Sincerely,

Karla M. Rabusch
President
Wells Fargo Advantage Funds
| | | | |
| 4 | | Wells Fargo Advantage Government Securities Fund | | Letter to Shareholders |
Notice to Shareholders
The Board of Trustees for Wells Fargo Advantage Funds has unanimously approved the following modifications to certain net asset value (NAV) waiver privileges and commission schedules:
| | n | | Effective May 1, 2012, automatic investment plan (AIP) purchases and proceeds received from systematic withdrawals will no longer qualify for NAV repurchase privileges. | |
| | n | | Effective May 1, 2012, discretionary rights to waive the upfront commission for Class C and “jumbo” Class A share purchases will no longer be granted to broker/dealers. However, we will continue to waive the Class C shares contingent deferred sales charge for redemptions by employer-sponsored retirement plans where the dealer of record waived its commission at the time of purchase. | |
| | n | | Effective July 31, 2012, NAV purchase privileges for former Evergreen Class IS and Class R shareholders are being modified to remove the ability to purchase Class A shares at NAV unless those shares are held directly with the Fund on or after July 31, 2012. | |
Please contact your investment professional or call us directly at 1-800-222-8222 if you have any questions on this Notice to Shareholders.
| | | | | | |
| Performance Highlights (Unaudited) | | Wells Fargo Advantage Government Securities Fund | | | 5 | |
INVESTMENT OBJECTIVE
The Fund seeks current income.
ADVISER
Wells Fargo Funds Management, LLC
SUBADVISER
Wells Capital Management Incorporated
PORTFOLIO MANAGERS
Michael J. Bray, CFA
Christopher Y. Kauffman, CFA
FUND INCEPTION
October 29, 1986
| | | | |
TEN LARGEST LONG-TERM HOLDINGS1 (AS OF FEBRUARY 29, 2012) | |
FNMA, 4.00%, 05/25/2040 | | | 6.24% | |
FNMA, 4.50%, 05/25/2039 | | | 5.07% | |
U.S. Treasury Note, 0.50%, 10/15/2014 | | | 4.72% | |
FNMA, 5.00%, 08/01/2040 | | | 3.83% | |
FHLMC, 3.50%, 08/15/2041 | | | 3.76% | |
U.S. Treasury Note, 0.25%, 01/31/2014 | | | 2.90% | |
GNMA, 4.50%, 05/20/2040 | | | 2.52% | |
FNMA, 6.00%, 08/25/2035 | | | 2.06% | |
U.S. Treasury Note, 2.00%, 11/15/2021 | | | 2.02% | |
U.S. Treasury Bond, 4.63%, 02/15/2040 | | | 1.82% | |
| | |
PORTFOLIO ALLOCATION2 (AS OF FEBRUARY 29, 2012) | | |
|
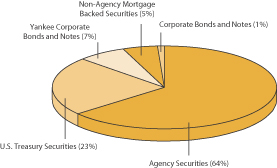 |
| 1. | The ten largest long-term holdings are calculated based on the value of the securities divided by total net assets of the Fund. Holdings are subject to change and may have changed since the date specified. |
| 2. | Portfolio allocation is subject to change and is calculated based on the total long-term investments of the Fund. |
| | | | |
| 6 | | Wells Fargo Advantage Government Securities Fund | | Performance Highlights (Unaudited) |
AVERAGE ANNUAL TOTAL RETURN3 (%) (AS OF FEBRUARY 29, 2012)
| | | | | | | | | | | | | | | | | | | | | | | | | | | | | | | | | | | | | | | | | | | | |
| | | | | | Including Sales Charge | | | Excluding Sales Charge | | | Expense Ratios4 | |
| | | Inception Date | | | 6 Months* | | | 1 Year | | | 5 Year | | | 10 Year | | | 6 Months* | | | 1 Year | | | 5 Year | | | 10 Year | | | Gross | | | Net5 | |
Class A (SGVDX) | | | 08/31/1999 | | | | (2.74 | ) | | | 2.40 | | | | 4.93 | | | | 4.61 | | | | 1.85 | | | | 7.22 | | | | 5.90 | | | | 5.09 | | | | 0.88% | | | | 0.88% | |
Class B (WGSBX)** | | | 07/18/2008 | | | | (3.53 | ) | | | 1.43 | | | | 4.78 | | | | 4.61 | | | | 1.47 | | | | 6.43 | | | | 5.11 | | | | 4.61 | | | | 1.63% | | | | 1.63% | |
Class C (WGSCX) | | | 12/26/2002 | | | | 0.47 | | | | 5.42 | | | | 5.10 | | | | 4.24 | | | | 1.47 | | | | 6.42 | | | | 5.10 | | | | 4.24 | | | | 1.63% | | | | 1.63% | |
Administrator Class (WGSDX) | | | 04/08/2005 | | | | | | | | | | | | | | | | | | | | 1.95 | | | | 7.46 | | | | 6.12 | | | | 5.37 | | | | 0.82% | | | | 0.66% | |
Institutional Class (SGVIX) | | | 08/31/1999 | | | | | | | | | | | | | | | | | | | | 2.04 | | | | 7.64 | | | | 6.33 | | | | 5.59 | | | | 0.55% | | | | 0.50% | |
Investor Class (STVSX) | | | 10/29/1986 | | | | | | | | | | | | | | | | | | | | 1.83 | | | | 7.19 | | | | 5.86 | | | | 5.11 | | | | 0.91% | | | | 0.91% | |
Barclays U.S. Aggregate Excluding Credit Bond Index6 | | | | | | | | | | | | | | | | | | | | | | | 2.01 | | | | 7.68 | | | | 6.17 | | | | 5.41 | | | | | | | | | |
Barclays Intermediate U.S. Government Bond Index7 | | | | | | | | | | | | | | | | | | | | | | | 1.03 | | | | 6.11 | | | | 5.61 | | | | 4.76 | | | | | | | | | |
| * | Returns for periods of less than one year are not annualized. |
| ** | Class B shares are closed to investment, except in connection with the reinvestment of any distributions and permitted exchanges. |
Figures quoted represent past performance, which is no guarantee of future results and do not reflect the deduction of taxes that a shareholder may pay on fund distributions or the redemption of fund shares. Investment return and principal value of an investment will fluctuate so that an investor’s shares, when redeemed, may be worth more or less than their original cost. Performance shown without sales charges would be lower if sales charges were reflected. Current performance may be lower or higher than the performance data quoted and assumes the reinvestment of dividends and capital gains. Current month-end performance is available on the Fund’s Web site – wellsfargoadvantagefunds.com
Index returns do not include transaction costs associated with buying and selling securities, any mutual fund fees or expenses or any taxes. It is not possible to invest directly in an index.
For Class A shares, the maximum front-end sales charge is 4.50%. For Class B shares, the maximum contingent deferred sales charge is 5.00%. For Class C shares, the maximum contingent deferred sales charge is 1.00%. Performance including sales charge assumes the sales charge for the corresponding time period. Administrator Class, Institutional Class and Investor Class shares are sold without a front-end sales charge or contingent deferred sales charge.
Bond fund values fluctuate in response to the financial condition of individual issuers, general market and economic conditions, and changes in interest rates. In general, when interest rates rise, bond fund values fall and investors may lose principal value. The use of derivatives may reduce returns and/or increase volatility. Securities issued by U.S. government agencies or government sponsored entities may not be guaranteed by the U.S. Treasury. Certain investment strategies tend to increase the total risk of an investment (relative to the broader market). This Fund is exposed to active trading risk and mortgage- and asset-backed securities risk. Consult the Fund’s prospectus for additional information on these and other risks. The U.S. government guarantee applies to certain of the underlying securities and not to shares of the Fund.
| 3. | Historical performance shown for the Class A shares through June 19, 2008 includes Advisor Class expenses. Historical performance shown for the Class B and Class C shares prior to their inception reflects the performance of the Investor Class shares, adjusted to reflect the higher expenses applicable to Class B and Class C shares. Historical performance shown for the Administrator Class shares prior to their inception reflects the performance of the Institutional Class shares, adjusted to reflect the higher expenses applicable to the Administrator Class shares. |
| 4. | Reflects the expense ratios as stated in the most recent prospectuses. |
| 5. | The Adviser has committed through July 11, 2013 to waive fees and/or reimburse expenses to the extent necessary to cap the Fund’s Total Annual Fund Operating Expenses After Fee Waiver, excluding certain expenses, at 0.87% for Class A, 1.62% for Class B, 1.62% for Class C, 0.64% for Administrator Class, 0.48% for Institutional Class and 0.90% for Investor Class. Without this cap, the Fund’s returns would have been lower. |
| 6. | The Barclays U.S. Aggregate Excluding Credit Bond Index is composed of the Barclays U.S. Government Bond Index and the Barclays U.S. Mortgage-Backed Securities Index and it includes Treasury issues, agency issues, and mortgage-backed securities. You cannot invest directly in an index. |
| 7. | The Barclays Intermediate U.S. Government Bond Index is an unmanaged index composed of U.S. Government securities with maturities in the one to ten-year range, including securities issued by the U.S. Treasury and U.S. Government agencies. You cannot invest directly in an index. |
| | | | | | |
| Fund Expenses (Unaudited) | | Wells Fargo Advantage Government Securities Fund | | | 7 | |
As a shareholder of the Fund, you incur two types of costs: (1) transaction costs, including sales charges (loads) on purchase payments and contingent deferred sales charges (if any) on redemptions and (2) ongoing costs, including management fees; distribution (12b-1) and/or shareholder service fees; and other Fund expenses. This example is intended to help you understand your ongoing costs (in dollars) of investing in the Fund and to compare these costs with the ongoing costs of investing in other mutual funds.
The example is based on an investment of $1,000 invested at the beginning of the six-month period and held for the entire period from September 1, 2011 to February 29, 2012.
Actual Expenses
The “Actual” line of the table below provides information about actual account values and actual expenses. You may use the information in this line, together with the amount you invested, to estimate the expenses that you paid over the period. Simply divide your account value by $1,000 (for example, an $8,600 account value divided by $1,000 = 8.6), then multiply the result by the number in the “Actual” line under the heading entitled “Expenses Paid During Period” for your applicable class of shares to estimate the expenses you paid on your account during this period.
Hypothetical Example for Comparison Purposes
The “Hypothetical” line of the table below provides information about hypothetical account values and hypothetical expenses based on the Fund’s actual expense ratio and an assumed rate of return of 5% per year before expenses, which is not the Fund’s actual return. The hypothetical account values and expenses may not be used to estimate the actual ending account balance or expenses you paid for the period. You may use this information to compare the ongoing costs of investing in the Fund and other funds. To do so, compare this 5% hypothetical example with the 5% hypothetical examples that appear in the shareholder reports of the other funds.
Please note that the expenses shown in the table are meant to highlight your ongoing costs only and do not reflect any transactional costs, such as sales charges (loads) and contingent deferred sales charges. Therefore, the “Hypothetical” line of the table is useful in comparing ongoing costs only, and will not help you determine the relative total costs of owning different funds. In addition, if these transactional costs were included, your costs would have been higher.
| | | | | | | | | | | | | | | | |
| | | Beginning
Account Value
09-01-2011 | | | Ending
Account Value
02-29-2012 | | | Expenses
Paid During
the Period1 | | | Net Annual
Expense Ratio | |
Class A | | | | | | | | | | | | | | | | |
Actual | | $ | 1,000.00 | | | $ | 1,018.45 | | | $ | 4.32 | | | | 0.86 | % |
Hypothetical (5% return before expenses) | | $ | 1,000.00 | | | $ | 1,020.59 | | | $ | 4.32 | | | | 0.86 | % |
Class B | | | | | | | | | | | | | | | | |
Actual | | $ | 1,000.00 | | | $ | 1,014.68 | | | $ | 8.06 | | | | 1.61 | % |
Hypothetical (5% return before expenses) | | $ | 1,000.00 | | | $ | 1,016.86 | | | $ | 8.07 | | | | 1.61 | % |
Class C | | | | | | | | | | | | | | | | |
Actual | | $ | 1,000.00 | | | $ | 1,014.67 | | | $ | 8.06 | | | | 1.61 | % |
Hypothetical (5% return before expenses) | | $ | 1,000.00 | | | $ | 1,016.86 | | | $ | 8.07 | | | | 1.61 | % |
Administrator Class | | | | | | | | | | | | | | | | |
Actual | | $ | 1,000.00 | | | $ | 1,019.55 | | | $ | 3.21 | | | | 0.64 | % |
Hypothetical (5% return before expenses) | | $ | 1,000.00 | | | $ | 1,021.68 | | | $ | 3.22 | | | | 0.64 | % |
Institutional Class | | | | | | | | | | | | | | | | |
Actual | | $ | 1,000.00 | | | $ | 1,020.37 | | | $ | 2.41 | | | | 0.48 | % |
Hypothetical (5% return before expenses) | | $ | 1,000.00 | | | $ | 1,022.48 | | | $ | 2.41 | | | | 0.48 | % |
Investor Class | | | | | | | | | | | | | | | | |
Actual | | $ | 1,000.00 | | | $ | 1,018.29 | | | $ | 4.47 | | | | 0.89 | % |
Hypothetical (5% return before expenses) | | $ | 1,000.00 | | | $ | 1,020.44 | | | $ | 4.47 | | | | 0.89 | % |
| 1. | Expenses paid is equal to the annualized expense ratio of each class multiplied by the average account value over the period, multiplied by the number of days in the most recent fiscal half-year divided by the number of days in the fiscal year (to reflect the one-half year period). |
| | | | |
| 8 | | Wells Fargo Advantage Government Securities Fund | | Portfolio of Investments—February 29, 2012 (Unaudited) |
| | | | | | | | | | | | | | | | |
| Security Name | | Interest Rate | | | Maturity Date | | | Principal | | | Value | |
| | | | | | | | | | | | | | | | |
| | | | |
| Agency Securities: 63.71% | | | | | | | | | | | | | | | | |
FHLB | | | 5.63 | % | | | 03/14/2036 | | | $ | 6,150,000 | | | $ | 7,988,635 | |
FHLMC ± | | | 0.70 | | | | 02/15/2033 | | | | 614,015 | | | | 614,733 | |
FHLMC ± | | | 2.30 | | | | 10/01/2026 | | | | 346,742 | | | | 365,662 | |
FHLMC ± | | | 2.50 | | | | 06/01/2032 | | | | 159,618 | | | | 168,319 | |
FHLMC ± | | | 2.62 | | | | 07/01/2029 | | | | 358,182 | | | | 379,469 | |
FHLMC ± | | | 2.66 | | | | 09/01/2031 | | | | 10,702 | | | | 10,843 | |
FHLMC ± | | | 2.66 | | | | 09/01/2031 | | | | 269,351 | | | | 273,140 | |
FHLMC (a) | | | 2.93 | | | | 11/01/2012 | | | | 263,241 | | | | 263,272 | |
FHLMC ± | | | 3.35 | | | | 07/01/2032 | | | | 2,931,222 | | | | 2,991,201 | |
FHLMC %% | | | 3.50 | | | | 08/15/2041 | | | | 77,907,000 | | | | 80,419,033 | |
FHLMC ± | | | 3.95 | | | | 05/01/2026 | | | | 120,254 | | | | 126,309 | |
FHLMC | | | 4.00 | | | | 03/01/2014 | | | | 495,900 | | | | 513,146 | |
FHLMC | | | 4.00 | | | | 04/01/2014 | | | | 2,616,252 | | | | 2,665,588 | |
FHLMC %% | | | 4.00 | | | | 04/15/2040 | | | | 29,010,000 | | | | 30,428,769 | |
FHLMC %% | | | 4.50 | | | | 05/15/2039 | | | | 2,300,000 | | | | 2,443,031 | |
FHLMC | | | 5.00 | | | | 05/01/2018 | | | | 852,483 | | | | 919,754 | |
FHLMC | | | 5.00 | | | | 04/01/2019 | | | | 727,115 | | | | 788,811 | |
FHLMC | | | 5.00 | | | | 04/01/2019 | | | | 555,580 | | | | 602,721 | |
FHLMC | | | 5.00 | | | | 06/01/2019 | | | | 901,512 | | | | 978,005 | |
FHLMC | | | 5.00 | | | | 08/01/2019 | | | | 3,824,028 | | | | 4,129,375 | |
FHLMC | | | 5.00 | | | | 10/01/2019 | | | | 1,025,136 | | | | 1,112,118 | |
FHLMC | | | 5.00 | | | | 02/01/2020 | | | | 3,025,783 | | | | 3,282,520 | |
FHLMC | | | 5.00 | | | | 08/01/2040 | | | | 6,386,363 | | | | 6,883,303 | |
FHLMC | | | 5.50 | | | | 11/01/2023 | | | | 677,326 | | | | 737,446 | |
FHLMC | | | 5.50 | | | | 07/01/2035 | | | | 23,621,068 | | | | 25,751,708 | |
FHLMC | | | 5.50 | | | | 06/01/2038 | | | | 8,144,986 | | | | 8,849,127 | |
FHLMC | | | 5.50 | | | | 09/01/2038 | | | | 13,841,069 | | | | 15,037,641 | |
FHLMC | | | 5.50 | | | | 01/01/2039 | | | | 1,747,053 | | | | 1,898,633 | |
FHLMC | | | 5.50 | | | | 05/01/2040 | | | | 5,398,057 | | | | 5,866,411 | |
FHLMC | | | 6.00 | | | | 10/01/2032 | | | | 174,854 | | | | 195,130 | |
FHLMC | | | 6.00 | | | | 05/25/2043 | | | | 9,219,356 | | | | 10,390,944 | |
FHLMC ± | | | 6.08 | | | | 01/01/2038 | | | | 1,099,735 | | | | 1,177,874 | |
FHLMC ± | | | 6.38 | | | | 01/01/2026 | | | | 92,789 | | | | 93,529 | |
FHLMC | | | 6.50 | | | | 04/01/2018 | | | | 80,902 | | | | 87,335 | |
FHLMC | | | 6.50 | | | | 04/01/2021 | | | | 227,169 | | | | 239,970 | |
FHLMC | | | 6.50 | | | | 04/01/2022 | | | | 271,475 | | | | 303,343 | |
FHLMC | | | 6.50 | | | | 04/01/2026 | | | | 4,068 | | | | 4,659 | |
FHLMC | | | 6.50 | | | | 09/01/2028 | | | | 86,512 | | | | 98,776 | |
FHLMC | | | 6.50 | | | | 09/01/2028 | | | | 25,979 | | | | 29,662 | |
FHLMC | | | 6.50 | | | | 07/01/2031 | | | | 14 | | | | 16 | |
FHLMC | | | 6.50 | | | | 08/01/2037 | | | | 3,023,001 | | | | 3,360,862 | |
FHLMC | | | 6.50 | | | | 10/01/2037 | | | | 839,019 | | | | 932,791 | |
FHLMC | | | 7.00 | | | | 11/17/2013 | | | | 34,677 | | | | 34,771 | |
FHLMC | | | 7.00 | | | | 10/01/2014 | | | | 447,855 | | | | 474,319 | |
FHLMC | | | 7.00 | | | | 12/01/2023 | | | | 11,662 | | | | 13,330 | |
FHLMC | | | 7.00 | | | | 05/01/2024 | | | | 13,372 | | | | 15,284 | |
FHLMC | | | 7.00 | | | | 12/01/2026 | | | | 424 | | | | 492 | |
FHLMC | | | 7.00 | | | | 12/01/2026 | | | | 2,707 | | | | 3,140 | |
FHLMC | | | 7.00 | | | | 12/01/2026 | | | | 4,826 | | | | 5,598 | |
FHLMC | | | 7.00 | | | | 12/01/2026 | | | | 149 | | | | 173 | |
The accompanying notes are an integral part of these financial statements.
| | | | | | |
| Portfolio of Investments—February 29, 2012 (Unaudited) | | Wells Fargo Advantage Government Securities Fund | | | 9 | |
| | | | | | | | | | | | | | | | |
| Security Name | | Interest Rate | | | Maturity Date | | | Principal | | | Value | |
| | | | | | | | | | | | | | | | |
| | | | |
| Agency Securities (continued) | | | | | | | | | | | | | | | | |
FHLMC | | | 7.00 | % | | | 12/01/2026 | | | $ | 1,649 | | | $ | 1,912 | |
FHLMC | | | 7.00 | | | | 12/01/2026 | | | | 1,586 | | | | 1,839 | |
FHLMC | | | 7.00 | | | | 04/01/2029 | | | | 6,362 | | | | 7,439 | |
FHLMC | | | 7.00 | | | | 04/01/2029 | | | | 2,237 | | | | 2,611 | |
FHLMC | | | 7.00 | | | | 05/01/2029 | | | | 55,295 | | | | 64,526 | |
FHLMC | | | 7.00 | | | | 04/01/2032 | | | | 410,924 | | | | 475,570 | |
FHLMC | | | 7.50 | | | | 12/01/2012 | | | | 25,518 | | | | 25,743 | |
FHLMC | | | 7.50 | | | | 10/01/2029 | | | | 5,253 | | | | 5,266 | |
FHLMC | | | 7.50 | | | | 11/01/2031 | | | | 443,180 | | | | 535,688 | |
FHLMC | | | 7.50 | | | | 04/01/2032 | | | | 467,936 | | | | 565,122 | |
FHLMC | | | 8.00 | | | | 02/01/2017 | | | | 15,686 | | | | 17,335 | |
FHLMC | | | 8.00 | | | | 08/01/2023 | | | | 66,496 | | | | 77,016 | |
FHLMC | | | 8.00 | | | | 06/01/2024 | | | | 17,480 | | | | 20,754 | |
FHLMC | | | 8.00 | | | | 06/01/2024 | | | | 4,575 | | | | 4,755 | |
FHLMC | | | 8.00 | | | | 06/01/2024 | | | | 15,767 | | | | 18,718 | |
FHLMC | | | 8.00 | | | | 08/01/2026 | | | | 42,909 | | | | 51,732 | |
FHLMC | | | 8.00 | | | | 11/01/2026 | | | | 43,241 | | | | 52,203 | |
FHLMC | | | 8.00 | | | | 11/01/2028 | | | | 32,807 | | | | 39,142 | |
FHLMC | | | 8.50 | | | | 07/01/2022 | | | | 6,813 | | | | 8,128 | |
FHLMC | | | 8.50 | | | | 12/01/2025 | | | | 37,271 | | | | 45,322 | |
FHLMC | | | 8.50 | | | | 05/01/2026 | | | | 4,848 | | | | 5,873 | |
FHLMC | | | 8.50 | | | | 08/01/2026 | | | | 8,887 | | | | 9,444 | |
FHLMC | | | 8.50 | | | | 08/01/2026 | | | | 32,641 | | | | 33,133 | |
FHLMC | | | 9.00 | | | | 06/01/2016 | | | | 11,723 | | | | 12,873 | |
FHLMC | | | 9.00 | | | | 01/01/2017 | | | | 20,317 | | | | 20,712 | |
FHLMC | | | 9.00 | | | | 04/01/2017 | | | | 30,986 | | | | 34,650 | |
FHLMC | | | 9.00 | | | | 11/01/2018 | | | | 103,082 | | | | 115,250 | |
FHLMC | | | 9.00 | | | | 08/01/2019 | | | | 121 | | | | 123 | |
FHLMC | | | 9.00 | | | | 08/01/2019 | | | | 324 | | | | 336 | |
FHLMC | | | 9.00 | | | | 08/01/2019 | | | | 1,036 | | | | 1,192 | |
FHLMC | | | 9.00 | | | | 12/01/2019 | | | | 411 | | | | 481 | |
FHLMC | | | 9.00 | | | | 01/01/2020 | | | | 180 | | | | 204 | |
FHLMC | | | 9.00 | | | | 02/01/2020 | | | | 4,697 | | | | 4,750 | |
FHLMC | | | 9.00 | | | | 02/01/2020 | | | | 228 | | | | 269 | |
FHLMC | | | 9.00 | | | | 03/01/2020 | | | | 2,702 | | | | 2,805 | |
FHLMC | | | 9.00 | | | | 03/01/2020 | | | | 360 | | | | 381 | |
FHLMC | | | 9.00 | | | | 09/01/2020 | | | | 445 | | | | 523 | |
FHLMC | | | 9.00 | | | | 09/01/2020 | | | | 1,037 | | | | 1,113 | |
FHLMC | | | 9.00 | | | | 12/01/2020 | | | | 93 | | | | 107 | |
FHLMC | | | 9.00 | | | | 02/01/2021 | | | | 166 | | | | 167 | |
FHLMC | | | 9.00 | | | | 03/01/2021 | | | | 9,439 | | | | 11,034 | |
FHLMC | | | 9.00 | | | | 03/01/2021 | | | | 2,260 | | | | 2,270 | |
FHLMC | | | 9.00 | | | | 04/01/2021 | | | | 8,274 | | | | 9,172 | |
FHLMC | | | 9.00 | | | | 04/01/2021 | | | | 563 | | | | 673 | |
FHLMC | | | 9.00 | | | | 04/01/2021 | | | | 147,880 | | | | 166,952 | |
FHLMC | | | 9.00 | | | | 06/01/2021 | | | | 1,359 | | | | 1,407 | |
FHLMC | | | 9.00 | | | | 07/01/2021 | | | | 6,459 | | | | 6,486 | |
FHLMC | | | 9.00 | | | | 07/01/2021 | | | | 5,219 | | | | 5,468 | |
FHLMC | | | 9.00 | | | | 08/01/2021 | | | | 1,283 | | | | 1,531 | |
FHLMC | | | 9.00 | | | | 04/01/2022 | | | | 5,887 | | | | 5,972 | |
The accompanying notes are an integral part of these financial statements.
| | | | |
| 10 | | Wells Fargo Advantage Government Securities Fund | | Portfolio of Investments—February 29, 2012 (Unaudited) |
| | | | | | | | | | | | | | | | |
| Security Name | | Interest Rate | | | Maturity Date | | | Principal | | | Value | |
| | | | | | | | | | | | | | | | |
| | | | |
| Agency Securities (continued) | | | | | | | | | | | | | | | | |
FHLMC | | | 9.00 | % | | | 07/01/2022 | | | $ | 1,436 | | | $ | 1,674 | |
FHLMC | | | 9.00 | | | | 09/01/2024 | | | | 2,522 | | | | 3,080 | |
FHLMC | | | 9.00 | | | | 10/01/2024 | | | | 2,381 | | | | 2,391 | |
FHLMC | | | 9.50 | | | | 09/01/2016 | | | | 80 | | | | 90 | |
FHLMC | | | 9.50 | | | | 10/01/2016 | | | | 575 | | | | 646 | |
FHLMC | | | 9.50 | | | | 08/01/2018 | | | | 51 | | | | 51 | |
FHLMC | | | 9.50 | | | | 08/01/2019 | | | | 326 | | | | 382 | |
FHLMC | | | 9.50 | | | | 02/01/2020 | | | | 17 | | | | 20 | |
FHLMC | | | 9.50 | | | | 06/01/2020 | | | | 124 | | | | 149 | |
FHLMC | | | 9.50 | | | | 08/01/2020 | | | | 886 | | | | 1,050 | |
FHLMC | | | 9.50 | | | | 09/01/2020 | | | | 27 | | | | 27 | |
FHLMC | | | 9.50 | | | | 09/01/2020 | | | | 16,855 | | | | 19,256 | |
FHLMC | | | 9.50 | | | | 09/01/2020 | | | | 117 | | | | 140 | |
FHLMC | | | 9.50 | | | | 10/01/2020 | | | | 104 | | | | 125 | |
FHLMC | | | 9.50 | | | | 10/01/2020 | | | | 62 | | | | 71 | |
FHLMC | | | 9.50 | | | | 11/01/2020 | | | | 159 | | | | 189 | |
FHLMC | | | 9.50 | | | | 05/01/2021 | | | | 348 | | | | 421 | |
FHLMC | | | 9.50 | | | | 09/17/2022 | | | | 1,420,092 | | | | 1,645,699 | |
FHLMC | | | 9.50 | | | | 04/01/2025 | | | | 139,293 | | | | 169,597 | |
FHLMC | | | 10.00 | | | | 08/01/2017 | | | | 44 | | | | 49 | |
FHLMC | | | 10.00 | | | | 01/01/2019 | | | | 26 | | | | 31 | |
FHLMC | | | 10.00 | | | | 08/01/2019 | | | | 91 | | | | 106 | |
FHLMC | | | 10.00 | | | | 12/01/2019 | | | | 445 | | | | 536 | |
FHLMC | | | 10.00 | | | | 03/01/2020 | | | | 41 | | | | 49 | |
FHLMC | | | 10.00 | | | | 06/01/2020 | | | | 75 | | | | 89 | |
FHLMC | | | 10.00 | | | | 07/01/2020 | | | | 68 | | | | 75 | |
FHLMC | | | 10.00 | | | | 08/01/2020 | | | | 74 | | | | 88 | |
FHLMC | | | 10.00 | | | | 10/01/2021 | | | | 134,217 | | | | 158,088 | |
FHLMC | | | 10.00 | | | | 08/17/2022 | | | | 686,410 | | | | 782,463 | |
FHLMC | | | 10.00 | | | | 02/17/2025 | | | | 1,198,113 | | | | 1,397,457 | |
FHLMC | | | 10.50 | | | | 02/01/2019 | | | | 42 | | | | 43 | |
FHLMC | | | 10.50 | | | | 05/01/2019 | | | | 227 | | | | 263 | |
FHLMC | | | 10.50 | | | | 06/01/2019 | | | | 32 | | | | 38 | |
FHLMC | | | 10.50 | | | | 08/01/2019 | | | | 36,446 | | | | 43,113 | |
FHLMC | | | 10.50 | | | | 12/01/2019 | | | | 80,203 | | | | 95,323 | |
FHLMC | | | 10.50 | | | | 02/01/2020 | | | | 1,784 | | | | 1,864 | |
FHLMC | | | 10.50 | | | | 05/01/2020 | | | | 86,534 | | | | 104,033 | |
FHLMC | | | 10.50 | | | | 05/01/2020 | | | | 8,249 | | | | 8,651 | |
FHLMC | | | 10.50 | | | | 08/01/2020 | | | | 26,672 | | | | 27,247 | |
FHLMC | | | 10.50 | | | | 08/01/2020 | | | | 43,406 | | | | 46,564 | |
FHLMC | | | 14.00 | | | | 11/01/2012 | | | | 34 | | | | 34 | |
FHLMC Series 16 Class D | | | 10.00 | | | | 10/15/2019 | | | | 31,833 | | | | 35,826 | |
FHLMC Series 1671 Class 1671-TA ± | | | 0.75 | | | | 02/15/2024 | | | | 89,100 | | | | 89,238 | |
FHLMC Series 2882 Class TF ± | | | 0.50 | | | | 10/15/2034 | | | | 6,995,357 | | | | 6,973,238 | |
FHLMC Series 3221 Class VA | | | 5.00 | | | | 09/15/2017 | | | | 7,477,242 | | | | 8,220,913 | |
FHLMC Series R008 Class FK ± | | | 0.65 | | | | 07/15/2023 | | | | 4,958,002 | | | | 4,957,125 | |
FHLMC Series T-57 Class 1A1 | | | 6.50 | | | | 07/25/2043 | | | | 2,260,143 | | | | 2,575,417 | |
FHLMC Series T-67 Class 1A1C ± | | | 3.12 | | | | 03/25/2036 | | | | 3,293,713 | | | | 3,485,160 | |
FHLMC Series T-67 Class 2A1C ± | | | 3.08 | | | | 03/25/2036 | | | | 4,251,146 | | | | 4,498,244 | |
FHLMC Series T-75 Class A1 ± | | | 0.28 | | | | 12/25/2036 | | | | 8,754,557 | | | | 8,705,215 | |
The accompanying notes are an integral part of these financial statements.
| | | | | | |
| Portfolio of Investments—February 29, 2012 (Unaudited) | | Wells Fargo Advantage Government Securities Fund | | | 11 | |
| | | | | | | | | | | | | | | | |
| Security Name | | Interest Rate | | | Maturity Date | | | Principal | | | Value | |
| | | | | | | | | | | | | | | | |
| | | | |
| Agency Securities (continued) | | | | | | | | | | | | | | | | |
FHLMC Structured Pass-Through Securities Series T-15 Class A6 ± | | | 0.71 | % | | | 11/25/2028 | | | $ | 337,487 | | | $ | 321,336 | |
FHLMC Structured Pass-Through Securities Series T-23 Class A ± | | | 0.52 | | | | 05/25/2030 | | | | 1,345,177 | | | | 1,268,710 | |
FHLMC Structured Pass-Through Securities Series T-35 Class A ± | | | 0.52 | | | | 09/25/2031 | | | | 603,613 | | | | 555,547 | |
FHLMC Structured Pass-Through Securities Series T-42 Class A6 | | | 9.50 | | | | 02/25/2042 | | | | 1,676,863 | | | | 1,997,023 | |
FHLMC Structured Pass-Through Securities Series T-55 Class 2A1 ± | | | 2.97 | | | | 03/25/2043 | | | | 742,536 | | | | 699,433 | |
FHLMC Structured Pass-Through Securities Series T-57 Class 2A1 ± | | | 3.53 | | | | 07/25/2043 | | | | 4,397,363 | | | | 4,488,989 | |
FICO Series D-P (z) | | | 2.11 | | | | 09/26/2019 | | | | 15,000,000 | | | | 12,781,365 | |
FNMA ± | | | 2.23 | | | | 05/01/2036 | | | | 3,513,603 | | | | 3,707,253 | |
FNMA ± | | | 2.30 | | | | 11/01/2031 | | | | 329,110 | | | | 346,237 | |
FNMA ± | | | 2.33 | | | | 09/01/2031 | | | | 133,774 | | | | 140,665 | |
FNMA ± | | | 2.34 | | | | 12/01/2035 | | | | 3,458,184 | | | | 3,666,692 | |
FNMA | | | 2.38 | | | | 07/28/2015 | | | | 29,170,000 | | | | 30,908,678 | |
FNMA | | | 2.38 | | | | 01/13/2022 | | | | 10,415,000 | | | | 10,533,012 | |
FNMA ± | | | 2.39 | | | | 12/01/2034 | | | | 2,787,208 | | | | 2,942,030 | |
FNMA ± | | | 2.39 | | | | 01/01/2033 | | | | 202,578 | | | | 205,425 | |
FNMA ± | | | 2.43 | | | | 12/01/2040 | | | | 112,394 | | | | 118,901 | |
FNMA ± | | | 2.44 | | | | 04/01/2032 | | | | 228,170 | | | | 240,115 | |
FNMA ± | | | 2.44 | | | | 09/01/2031 | | | | 552,194 | | | | 581,298 | |
FNMA ± | | | 2.48 | | | | 09/01/2036 | | | | 2,734,467 | | | | 2,910,653 | |
FNMA ± | | | 2.51 | | | | 08/01/2036 | | | | 3,713,058 | | | | 3,951,699 | |
FNMA ± | | | 2.54 | | | | 06/01/2032 | | | | 251,254 | | | | 252,883 | |
FNMA ± | | | 2.55 | | | | 06/01/2034 | | | | 1,276,439 | | | | 1,345,167 | |
FNMA ± | | | 2.60 | | | | 10/01/2027 | | | | 484,202 | | | | 515,710 | |
FNMA ± | | | 2.70 | | | | 05/01/2036 | | | | 5,559,139 | | | | 5,774,189 | |
FNMA ± | | | 3.10 | | | | 09/01/2027 | | | | 1,203,079 | | | | 1,259,717 | |
FNMA ± | | | 3.13 | | | | 07/01/2026 | | | | 736,978 | | | | 785,229 | |
FNMA ± | | | 3.16 | | | | 04/01/2033 | | | | 145,631 | | | | 153,972 | |
FNMA ± | | | 3.26 | | | | 02/01/2027 | | | | 2,126,978 | | | | 2,254,335 | |
FNMA ± | | | 3.39 | | | | 05/01/2036 | | | | 2,740,909 | | | | 2,864,001 | |
FNMA | | | 3.50 | | | | 02/01/2026 | | | | 8,283,230 | | | | 8,695,173 | |
FNMA | | | 4.00 | | | | 05/01/2021 | | | | 3,836,912 | | | | 4,094,876 | |
FNMA %% | | | 4.00 | | | | 04/25/2024 | | | | 16,840,000 | | | | 17,829,350 | |
FNMA %% | | | 4.00 | | | | 05/25/2040 | | | | 126,845,000 | | | | 133,484,549 | |
FNMA | | | 4.15 | | | | 07/01/2014 | | | | 10,627,489 | | | | 11,248,316 | |
FNMA ± | | | 4.32 | | | | 09/01/2028 | | | | 1,043,361 | | | | 1,083,701 | |
FNMA ± | | | 4.49 | | | | 07/01/2033 | | | | 175,174 | | | | 176,348 | |
FNMA | | | 4.50 | | | | 08/01/2018 | | | | 3,961,725 | | | | 4,259,650 | |
FNMA | | | 4.50 | | | | 12/01/2018 | | | | 2,815,860 | | | | 3,027,615 | |
FNMA %% | | | 4.50 | | | | 03/25/2021 | | | | 14,000,000 | | | | 14,982,187 | |
FNMA %% | | | 4.50 | | | | 05/25/2039 | | | | 101,917,000 | | | | 108,621,223 | |
FNMA | | | 4.62 | | | | 07/01/2013 | | | | 7,651,432 | | | | 7,925,453 | |
FNMA | | | 4.68 | | | | 02/01/2020 | | | | 3,352,510 | | | | 3,800,139 | |
FNMA | | | 4.79 | | | | 05/01/2019 | | | | 2,258,609 | | | | 2,557,881 | |
FNMA | | | 5.00 | | | | 12/01/2018 | | | | 2,188,807 | | | | 2,368,113 | |
FNMA %% | | | 5.00 | | | | 05/25/2019 | | | | 16,840,000 | | | | 18,145,100 | |
FNMA | | | 5.00 | | | | 03/01/2034 | | | | 11,449,856 | | | | 12,380,412 | |
FNMA | | | 5.00 | | | | 02/01/2036 | | | | 14,709,673 | | | | 15,902,865 | |
FNMA | | | 5.00 | | | | 08/01/2040 | | | | 15,119,505 | | | | 16,338,853 | |
FNMA | | | 5.00 | | | | 08/01/2040 | | | | 75,876,019 | | | | 81,995,220 | |
FNMA | | | 5.03 | | | | 05/01/2015 | | | | 6,569,886 | | | | 7,190,469 | |
The accompanying notes are an integral part of these financial statements.
| | | | |
| 12 | | Wells Fargo Advantage Government Securities Fund | | Portfolio of Investments—February 29, 2012 (Unaudited) |
| | | | | | | | | | | | | | | | |
| Security Name | | Interest Rate | | | Maturity Date | | | Principal | | | Value | |
| | | | | | | | | | | | | | | | |
| | | | |
| Agency Securities (continued) | | | | | | | | | | | | | | | | |
FNMA | | | 5.22 | % | | | 10/01/2015 | | | $ | 3,386,803 | | | $ | 3,724,009 | |
FNMA | | | 5.24 | | | | 12/01/2012 | | | | 136,612 | | | | 135,774 | |
FNMA | | | 5.39 | | | | 01/01/2024 | | | | 3,112,255 | | | | 3,601,250 | |
FNMA | | | 5.50 | | | | 06/01/2016 | | | | 706,682 | | | | 769,344 | |
FNMA %% | | | 5.50 | | | | 10/25/2019 | | | | 1,060,000 | | | | 1,152,916 | |
FNMA | | | 5.50 | | | | 01/01/2025 | | | | 859,358 | | | | 938,235 | |
FNMA | | | 5.50 | | | | 01/01/2025 | | | | 3,103,811 | | | | 3,386,757 | |
FNMA | | | 5.50 | | | | 09/01/2033 | | | | 8,418,368 | | | | 9,202,705 | |
FNMA | | | 5.50 | | | | 09/01/2033 | | | | 5,845,670 | | | | 6,390,309 | |
FNMA | | | 5.50 | | | | 06/01/2034 | | | | 20,239,522 | | | | 22,156,855 | |
FNMA | | | 5.50 | | | | 08/01/2035 | | | | 5,756,128 | | | | 6,288,827 | |
FNMA | | | 5.50 | | | | 01/01/2037 | | | | 6,007,572 | | | | 6,563,540 | |
FNMA | | | 5.55 | | | | 05/01/2016 | | | | 3,189,438 | | | | 3,603,068 | |
FNMA | | | 5.55 | | | | 09/01/2019 | | | | 4,205,978 | | | | 4,414,135 | |
FNMA | | | 5.60 | | | | 11/01/2013 | | | | 532,811 | | | | 560,506 | |
FNMA | | | 5.61 | | | | 02/01/2021 | | | | 3,504,741 | | | | 4,029,232 | |
FNMA | | | 5.63 | | | | 02/01/2018 | | | | 1,123,032 | | | | 1,299,332 | |
FNMA | | | 5.66 | | | | 12/01/2016 | | | | 1,732,000 | | | | 1,984,597 | |
FNMA | | | 5.67 | | | | 03/01/2016 | | | | 6,361,134 | | | | 7,155,827 | |
FNMA | | | 5.67 | | | | 11/01/2021 | | | | 5,744,837 | | | | 6,589,869 | |
FNMA | | | 5.70 | | | | 03/01/2016 | | | | 975,099 | | | | 1,097,783 | |
FNMA | | | 5.75 | | | | 05/01/2021 | | | | 3,674,105 | | | | 4,070,347 | |
FNMA | | | 5.79 | | | | 10/01/2017 | | | | 1,114,567 | | | | 1,286,315 | |
FNMA | | | 5.95 | | | | 06/01/2024 | | | | 1,855,463 | | | | 2,215,267 | |
FNMA ± | | | 5.99 | | | | 09/01/2018 | | | | 1,733,000 | | | | 1,870,205 | |
FNMA | | | 6.00 | | | | 12/01/2013 | | | | 131,845 | | | | 132,869 | |
FNMA | | | 6.00 | | | | 05/01/2016 | | | | 1,019,052 | | | | 1,098,224 | |
FNMA | | | 6.00 | | | | 03/01/2024 | | | | 265,879 | | | | 294,052 | |
FNMA | | | 6.00 | | | | 02/01/2035 | | | | 3,355,129 | | | | 3,744,189 | |
FNMA %% | | | 6.00 | | | | 08/25/2035 | | | | 40,080,000 | | | | 44,094,261 | |
FNMA | | | 6.00 | | | | 11/01/2037 | | | | 5,066,473 | | | | 5,581,149 | |
FNMA | | | 6.00 | | | | 08/01/2038 | | | | 15,294,653 | | | | 16,848,357 | |
FNMA | | | 6.00 | | | | 12/01/2038 | | | | 1,673,923 | | | | 1,843,968 | |
FNMA | | | 6.08 | | | | 01/01/2019 | | | | 2,220,588 | | | | 2,320,455 | |
FNMA | | | 6.50 | | | | 06/01/2017 | | | | 459,679 | | | | 505,575 | |
FNMA | | | 6.50 | | | | 01/01/2024 | | | | 118,443 | | | | 132,879 | |
FNMA | | | 6.50 | | | | 03/01/2028 | | | | 65,572 | | | | 75,481 | |
FNMA | | | 6.50 | | | | 12/01/2029 | | | | 1,031,453 | | | | 1,181,842 | |
FNMA | | | 6.50 | | | | 11/01/2031 | | | | 250,461 | | | | 288,148 | |
FNMA | | | 6.50 | | | | 07/01/2036 | | | | 2,555,171 | | | | 2,898,979 | |
FNMA | | | 6.50 | | | | 07/01/2036 | | | | 2,680,248 | | | | 3,040,885 | |
FNMA | | | 6.50 | | | | 09/01/2037 | | | | 789,117 | | | | 880,993 | |
FNMA | | | 6.50 | | | | 09/01/2037 | | | | 737,313 | | | | 823,157 | |
FNMA | | | 6.50 | | | | 07/25/2042 | | | | 3,246,539 | | | | 3,670,189 | |
FNMA | | | 6.65 | | | | 05/01/2016 | | | | 1,494,251 | | | | 1,704,035 | |
FNMA | | | 7.00 | | | | 11/01/2026 | | | | 24,756 | | | | 28,390 | |
FNMA | | | 7.00 | | | | 09/01/2031 | | | | 7,090 | | | | 8,280 | |
FNMA | | | 7.00 | | | | 01/01/2032 | | | | 8,508 | | | | 9,936 | |
FNMA | | | 7.00 | | | | 02/01/2032 | | | | 321,871 | | | | 375,877 | |
FNMA | | | 7.00 | | | | 02/01/2032 | | | | 53,793 | | | | 62,794 | |
The accompanying notes are an integral part of these financial statements.
| | | | | | |
| Portfolio of Investments—February 29, 2012 (Unaudited) | | Wells Fargo Advantage Government Securities Fund | | | 13 | |
| | | | | | | | | | | | | | | | |
| Security Name | | Interest Rate | | | Maturity Date | | | Principal | | | Value | |
| | | | | | | | | | | | | | | | |
| | | | |
| Agency Securities (continued) | | | | | | | | | | | | | | | | |
FNMA | | | 7.00 | % | | | 10/01/2032 | | | $ | 676,984 | | | $ | 790,688 | |
FNMA | | | 7.00 | | | | 02/01/2034 | | | | 8,707 | | | | 10,132 | |
FNMA | | | 7.00 | | | | 04/01/2034 | | | | 611,806 | | | | 712,984 | |
FNMA | | | 7.00 | | | | 12/01/2034 | | | | 73,289 | | | | 85,290 | |
FNMA | | | 7.00 | | | | 06/01/2035 | | | | 10,888 | | | | 12,644 | |
FNMA | | | 7.00 | | | | 01/01/2036 | | | | 40,600 | | | | 47,148 | |
FNMA | | | 7.00 | | | | 09/01/2036 | | | | 892,190 | | | | 1,033,725 | |
FNMA | | | 7.00 | | | | 07/01/2047 | | | | 397,590 | | | | 450,856 | |
FNMA | | | 7.48 | | | | 01/01/2025 | | | | 1,009,509 | | | | 1,013,769 | |
FNMA | | | 7.50 | | | | 07/01/2015 | | | | 16,033 | | | | 16,250 | |
FNMA | | | 7.50 | | | | 09/01/2031 | | | | 252,616 | | | | 304,682 | |
FNMA | | | 7.50 | | | | 11/25/2031 | | | | 1,325,463 | | | | 1,526,557 | |
FNMA | | | 7.50 | | | | 02/01/2032 | | | | 91,760 | | | | 110,722 | |
FNMA | | | 7.50 | | | | 10/01/2037 | | | | 5,874,340 | | | | 7,101,395 | |
FNMA | | | 8.00 | | | | 06/01/2012 | | | | 41,383 | | | | 41,558 | |
FNMA | | | 8.00 | | | | 11/01/2013 | | | | 3,658 | | | | 3,690 | |
FNMA | | | 8.00 | | | | 08/01/2020 | | | | 16,446 | | | | 16,495 | |
FNMA | | | 8.00 | | | | 05/01/2027 | | | | 70,765 | | | | 74,985 | |
FNMA | | | 8.00 | | | | 10/01/2027 | | | | 17,338 | | | | 17,390 | |
FNMA | | | 8.00 | | | | 06/01/2028 | | | | 14,490 | | | | 17,354 | |
FNMA | | | 8.00 | | | | 01/01/2030 | | | | 24,437 | | | | 24,509 | |
FNMA | | | 8.00 | | | | 02/01/2030 | | | | 266,864 | | | | 323,848 | |
FNMA | | | 8.00 | | | | 09/01/2040 | | | | 2,871,382 | | | | 3,457,215 | |
FNMA | | | 8.50 | | | | 12/01/2014 | | | | 733 | | | | 735 | |
FNMA | | | 8.50 | | | | 05/01/2017 | | | | 478,158 | | | | 537,372 | |
FNMA | | | 8.50 | | | | 05/01/2017 | | | | 11,496 | | | | 12,862 | |
FNMA | | | 8.50 | | | | 08/01/2024 | | | | 60,587 | | | | 73,357 | |
FNMA | | | 8.50 | | | | 05/01/2026 | | | | 377,667 | | | | 456,624 | |
FNMA | | | 8.50 | | | | 07/01/2026 | | | | 37,503 | | | | 40,690 | |
FNMA | | | 8.50 | | | | 08/01/2026 | | | | 19,040 | | | | 19,689 | |
FNMA | | | 8.50 | | | | 09/01/2026 | | | | 828 | | | | 1,007 | |
FNMA | | | 8.50 | | | | 10/01/2026 | | | | 41,044 | | | | 42,278 | |
FNMA | | | 8.50 | | | | 10/01/2026 | | | | 426 | | | | 454 | |
FNMA | | | 8.50 | | | | 10/01/2026 | | | | 11,718 | | | | 11,758 | |
FNMA | | | 8.50 | | | | 11/01/2026 | | | | 127,576 | | | | 155,009 | |
FNMA | | | 8.50 | | | | 11/01/2026 | | | | 13,712 | | | | 15,166 | |
FNMA | | | 8.50 | | | | 11/01/2026 | | | | 7,150 | | | | 7,190 | |
FNMA | | | 8.50 | | | | 12/01/2026 | | | | 396,334 | | | | 482,806 | |
FNMA | | | 8.50 | | | | 12/01/2026 | | | | 39,673 | | | | 48,504 | |
FNMA | | | 8.50 | | | | 12/01/2026 | | | | 372 | | | | 377 | |
FNMA | | | 8.50 | | | | 01/01/2027 | | | | 5,900 | | | | 6,368 | |
FNMA | | | 8.50 | | | | 02/01/2027 | | | | 877 | | | | 1,072 | |
FNMA | | | 8.50 | | | | 02/01/2027 | | | | 10,574 | | | | 10,773 | |
FNMA | | | 8.50 | | | | 03/01/2027 | | | | 1,648 | | | | 2,020 | |
FNMA | | | 8.50 | | | | 03/01/2027 | | | | 3,290 | | | | 3,332 | |
FNMA | | | 8.50 | | | | 06/01/2027 | | | | 858,175 | | | | 1,046,052 | |
FNMA | | | 8.50 | | | | 07/01/2029 | | | | 1,036 | | | | 1,052 | |
FNMA | | | 8.50 | | | | 08/01/2029 | | | | 34,215 | | | | 37,282 | |
FNMA | | | 9.00 | | | | 03/01/2021 | | | | 95,541 | | | | 110,639 | |
FNMA | | | 9.00 | | | | 06/01/2021 | | | | 343 | | | | 406 | |
The accompanying notes are an integral part of these financial statements.
| | | | |
| 14 | | Wells Fargo Advantage Government Securities Fund | | Portfolio of Investments—February 29, 2012 (Unaudited) |
| | | | | | | | | | | | | | | | |
| Security Name | | Interest Rate | | | Maturity Date | | | Principal | | | Value | |
| | | | | | | | | | | | | | | | |
| | | | |
| Agency Securities (continued) | | | | | | | | | | | | | | | | |
FNMA | | | 9.00 | % | | | 07/01/2021 | | | $ | 170,721 | | | $ | 194,691 | |
FNMA | | | 9.00 | | | | 08/01/2021 | | | | 497 | | | | 595 | |
FNMA | | | 9.00 | | | | 10/01/2021 | | | | 102,006 | | | | 115,814 | |
FNMA | | | 9.00 | | | | 01/01/2025 | | | | 3,299 | | | | 3,407 | |
FNMA | | | 9.00 | | | | 01/01/2025 | | | | 106 | | | | 109 | |
FNMA | | | 9.00 | | | | 01/01/2025 | | | | 47,868 | | | | 58,706 | |
FNMA | | | 9.00 | | | | 02/01/2025 | | | | 13,229 | | | | 13,412 | |
FNMA | | | 9.00 | | | | 03/01/2025 | | | | 2,052 | | | | 2,178 | |
FNMA | | | 9.00 | | | | 03/01/2025 | | | | 4,618 | | | | 4,937 | |
FNMA | | | 9.00 | | | | 03/01/2025 | | | | 30,256 | | | | 30,368 | |
FNMA | | | 9.00 | | | | 03/01/2025 | | | | 1,872 | | | | 1,894 | |
FNMA | | | 9.00 | | | | 04/01/2025 | | | | 4,984 | | | | 5,064 | |
FNMA | | | 9.00 | | | | 07/01/2028 | | | | 78,901 | | | | 94,856 | |
FNMA | | | 9.50 | | | | 11/01/2020 | | | | 434 | | | | 522 | |
FNMA | | | 9.50 | | | | 12/15/2020 | | | | 148,826 | | | | 177,051 | |
FNMA | | | 9.50 | | | | 01/01/2021 | | | | 40,167 | | | | 42,626 | |
FNMA | | | 9.50 | | | | 06/01/2022 | | | | 13,141 | | | | 15,649 | |
FNMA | | | 9.50 | | | | 07/01/2028 | | | | 150,065 | | | | 184,117 | |
FNMA | | | 10.00 | | | | 12/01/2020 | | | | 223,301 | | | | 264,244 | |
FNMA | | | 11.00 | | | | 02/01/2019 | | | | 22,614 | | | | 22,733 | |
FNMA | | | 11.00 | | | | 10/15/2020 | | | | 30,243 | | | | 34,633 | |
FNMA | | | 11.25 | | | | 02/01/2016 | | | | 6,284 | | | | 6,318 | |
FNMA | | | 12.00 | | | | 07/15/2014 | | | | 82,624 | | | | 93,023 | |
FNMA Grantor Trust Series 2000-T6 Class A2 | | | 9.50 | | | | 06/25/2030 | | | | 1,689,651 | | | | 1,972,055 | |
FNMA Grantor Trust Series 2001-T10 Class A3 | | | 9.50 | | | | 12/25/2041 | | | | 2,934,216 | | | | 3,503,267 | |
FNMA Grantor Trust Series 2001-T12 Class A3 | | | 9.50 | | | | 08/25/2041 | | | | 774,087 | | | | 933,224 | |
FNMA Grantor Trust Series 2001-T8 Class A3 ± | | | 3.87 | | | | 07/25/2041 | | | | 1,933,402 | | | | 1,956,886 | |
FNMA Grantor Trust Series 2002-T11 Class B | | | 5.34 | | | | 04/25/2012 | | | | 15,385,044 | | | | 15,432,907 | |
FNMA Grantor Trust Series 2002-T12 Class A5 ± | | | 3.59 | | | | 10/25/2041 | | | | 2,082,224 | | | | 2,111,245 | |
FNMA Grantor Trust Series 2002-T19 Class A1 | | | 6.50 | | | | 07/25/2042 | | | | 8,641,459 | | | | 9,916,708 | |
FNMA Grantor Trust Series 2002-T5 Class A1 ± | | | 0.48 | | | | 05/25/2032 | | | | 484,440 | | | | 463,235 | |
FNMA Grantor Trust Series 2003-T1 Class B | | | 4.49 | | | | 11/25/2012 | | | | 15,565,000 | | | | 15,906,481 | |
FNMA Grantor Trust Series 2003-T2 Class A1 ± | | | 0.52 | | | | 03/25/2033 | | | | 410,829 | | | | 394,694 | |
FNMA Grantor Trust Series 2004-T1 Class 1A2 | | | 6.50 | | | | 01/25/2044 | | | | 1,355,308 | | | | 1,529,931 | |
FNMA Series 1988-2 Class Z | | | 10.10 | | | | 02/25/2018 | | | | 86,938 | | | | 97,199 | |
FNMA Series 1988-7 Class Z | | | 9.25 | | | | 04/25/2018 | | | | 55,897 | | | | 62,340 | |
FNMA Series 1989-10 Class Z | | | 9.50 | | | | 03/25/2019 | | | | 320,284 | | | | 371,178 | |
FNMA Series 1989-100 Class Z | | | 8.75 | | | | 12/25/2019 | | | | 280,124 | | | | 317,896 | |
FNMA Series 1989-12 Class Y | | | 10.00 | | | | 03/25/2019 | | | | 593,566 | | | | 696,059 | |
FNMA Series 1989-22 Class G | | | 10.00 | | | | 05/25/2019 | | | | 377,234 | | | | 441,052 | |
FNMA Series 1989-63 Class Z | | | 9.40 | | | | 10/25/2019 | | | | 57,601 | | | | 64,601 | |
FNMA Series 1989-98 Class E | | | 9.20 | | | | 12/25/2019 | | | | 119,155 | | | | 134,338 | |
FNMA Series 1990-144 Class W | | | 9.50 | | | | 12/25/2020 | | | | 203,309 | | | | 238,078 | |
FNMA Series 1990-75 Class Z | | | 9.50 | | | | 07/25/2020 | | | | 222,567 | | | | 261,793 | |
FNMA Series 1990-84 Class Y | | | 9.00 | | | | 07/25/2020 | | | | 72,987 | | | | 83,726 | |
FNMA Series 1990-96 Class Z | | | 9.67 | | | | 08/25/2020 | | | | 323,195 | | | | 380,649 | |
FNMA Series 1991-5 Class Z | | | 8.75 | | | | 01/25/2021 | | | | 107,131 | | | | 123,160 | |
FNMA Series 1991-85 Class Z | | | 8.00 | | | | 06/25/2021 | | | | 324,677 | | | | 359,019 | |
FNMA Series 1992-45 Class Z | | | 8.00 | | | | 04/25/2022 | | | | 275,641 | | | | 328,366 | |
FNMA Series 2001-T4 Class A1 | | | 7.50 | | | | 07/25/2041 | | | | 1,497,033 | | | | 1,748,157 | |
The accompanying notes are an integral part of these financial statements.
| | | | | | |
| Portfolio of Investments—February 29, 2012 (Unaudited) | | Wells Fargo Advantage Government Securities Fund | | | 15 | |
| | | | | | | | | | | | | | | | |
| Security Name | | Interest Rate | | | Maturity Date | | | Principal | | | Value | |
| | | | | | | | | | | | | | | | |
| | | | |
| Agency Securities (continued) | | | | | | | | | | | | | | | | |
FNMA Series 2003-90 Class FL ± | | | 0.69 | % | | | 03/25/2031 | | | $ | 3,115,947 | | | $ | 3,117,988 | |
FNMA Series 2003-W1 Class 1A1 ± | | | 6.27 | | | | 12/25/2042 | | | | 1,281,619 | | | | 1,463,668 | |
FNMA Series 2003-W19 Class 1A6 | | | 5.29 | | | | 11/25/2033 | | | | 2,510,841 | | | | 2,607,436 | |
FNMA Series 2004-W1 Class 2A2 | | | 7.00 | | | | 12/25/2033 | | | | 2,883,405 | | | | 3,358,251 | |
FNMA Series 2004-W4 Class A9 | | | 5.50 | | | | 06/25/2034 | | | | 8,565,000 | | | | 8,786,307 | |
FNMA Series 2005-116 Class TU | | | 5.50 | | | | 12/25/2016 | | | | 1,312,713 | | | | 1,332,917 | |
FNMA Series 2005-71 Class DB | | | 4.50 | | | | 08/25/2025 | | | | 4,000,000 | | | | 4,355,142 | |
FNMA Series 2007-2 Class FA ± | | | 0.44 | | | | 02/25/2037 | | | | 2,327,559 | | | | 2,316,092 | |
FNMA Series 2007-W10 Class 2A ± | | | 6.21 | | | | 08/25/2047 | | | | 1,902,878 | | | | 2,147,380 | |
FNMA Series 2009-108 Class DE | | | 4.50 | | | | 08/25/2027 | | | | 1,378,273 | | | | 1,430,543 | |
FNMA Series G-8 Class E | | | 9.00 | | | | 04/25/2021 | | | | 289,980 | | | | 332,723 | |
FNMA Series G92-30 Class Z | | | 7.00 | | | | 06/25/2022 | | | | 608,052 | | | | 675,433 | |
FNMA STRIPS Series 161 Class 2 | | | 8.50 | | | | 07/25/2022 | | | | 123,361 | | | | 37,450 | |
FNMA STRIPS Series 265 Class 2 | | | 9.00 | | | | 03/01/2024 | | | | 307,696 | | | | 364,184 | |
FNMA Whole Loan Series 1999-W6 Class A ± | | | 9.18 | | | | 09/25/2028 | | | | 93,066 | | | | 103,400 | |
FNMA Whole Loan Series 2002-W4 Class A4 | | | 6.25 | | | | 05/25/2042 | | | | 1,425,695 | | | | 1,603,354 | |
FNMA Whole Loan Series 2003-W11 Class A1 ± | | | 3.10 | | | | 06/25/2033 | | | | 313,984 | | | | 313,916 | |
FNMA Whole Loan Series 2003-W3 Class 1A4 ± | | | 3.41 | | | | 08/25/2042 | | | | 4,901,660 | | | | 5,229,459 | |
FNMA Whole Loan Series 2003-W5 Class A ± | | | 0.46 | | | | 04/25/2033 | | | | 807,623 | | | | 768,492 | |
FNMA Whole Loan Series 2003-W6 Class 6A ± | | | 3.19 | | | | 08/25/2042 | | | | 3,732,877 | | | | 4,044,546 | |
FNMA Whole Loan Series 2003-W6 Class PT4 ± | | | 9.40 | | | | 10/25/2042 | | | | 3,576,242 | | | | 4,215,518 | |
FNMA Whole Loan Series 2003-W8 Class PT1 ± | | | 8.68 | | | | 12/25/2042 | | | | 1,642,884 | | | | 1,899,328 | |
FNMA Whole Loan Series 2003-W9 Class A ± | | | 0.48 | | | | 06/25/2033 | | | | 230,212 | | | | 218,948 | |
FNMA Whole Loan Series 2004-W15 Class 1A3 | | | 7.00 | | | | 08/25/2044 | | | | 2,936,414 | | | | 3,411,922 | |
GNMA ± | | | 3.00 | | | | 08/20/2020 | | | | 328,466 | | | | 342,682 | |
GNMA ± | | | 3.00 | | | | 11/20/2020 | | | | 206,098 | | | | 215,534 | |
GNMA %% | | | 4.00 | | | | 02/20/2041 | | | | 21,665,000 | | | | 23,330,497 | |
GNMA %% | | | 4.50 | | | | 05/20/2040 | | | | 49,420,000 | | | | 53,867,805 | |
GNMA | | | 5.00 | | | | 07/20/2040 | | | | 17,197,225 | | | | 18,980,442 | |
GNMA | | | 6.00 | | | | 01/15/2013 | | | | 13,165 | | | | 14,439 | |
GNMA | | | 6.00 | | | | 02/15/2013 | | | | 1,206 | | | | 1,205 | |
GNMA | | | 6.00 | | | | 08/20/2034 | | | | 1,153,496 | | | | 1,300,293 | |
GNMA | | | 6.50 | | | | 12/15/2025 | | | | 50,562 | | | | 57,916 | |
GNMA | | | 6.50 | | | | 04/15/2029 | | | | 1,593 | | | | 1,859 | |
GNMA | | | 6.50 | | | | 05/15/2029 | | | | 4,621 | | | | 5,391 | |
GNMA | | | 6.50 | | | | 05/15/2031 | | | | 3,777 | | | | 4,407 | |
GNMA | | | 6.50 | | | | 07/15/2032 | | | | 4,279 | | | | 4,992 | |
GNMA | | | 6.50 | | | | 09/20/2033 | | | | 177,757 | | | | 204,072 | |
GNMA | | | 7.00 | | | | 12/15/2022 | | | | 86,400 | | | | 99,224 | |
GNMA | | | 7.00 | | | | 05/15/2026 | | | | 7,235 | | | | 8,451 | |
GNMA | | | 7.00 | | | | 03/15/2028 | | | | 83,193 | | | | 97,930 | |
GNMA | | | 7.00 | | | | 01/15/2031 | | | | 519 | | | | 616 | |
GNMA | | | 7.00 | | | | 04/15/2031 | | | | 11,041 | | | | 13,106 | |
GNMA | | | 7.00 | | | | 04/15/2031 | | | | 1,435 | | | | 1,704 | |
GNMA | | | 7.00 | | | | 08/15/2031 | | | | 23,905 | | | | 28,377 | |
GNMA | | | 7.00 | | | | 03/15/2032 | | | | 17,743 | | | | 21,112 | |
GNMA | | | 7.00 | | | | 05/15/2032 | | | | 4,133 | | | | 4,918 | |
GNMA | | | 7.34 | | | | 10/20/2021 | | | | 78,987 | | | | 90,193 | |
GNMA | | | 7.34 | | | | 12/20/2021 | | | | 28,226 | | | | 32,231 | |
GNMA | | | 7.34 | | | | 02/20/2022 | | | | 29,148 | | | | 33,465 | |
The accompanying notes are an integral part of these financial statements.
| | | | |
| 16 | | Wells Fargo Advantage Government Securities Fund | | Portfolio of Investments—February 29, 2012 (Unaudited) |
| | | | | | | | | | | | | | | | |
| Security Name | | Interest Rate | | | Maturity Date | | | Principal | | | Value | |
| | | | | | | | | | | | | | | | |
| | | | |
| Agency Securities (continued) | | | | | | | | | | | | | | | | |
FNMA | | | 5.12 | % | | | 01/01/2017 | | | $ | 11,700,000 | | | $ | 13,160,360 | |
GNMA | | | 7.34 | | | | 04/20/2022 | | | | 33,198 | | | | 38,115 | |
GNMA | | | 7.34 | | | | 09/20/2022 | | | | 141,613 | | | | 162,586 | |
GNMA | | | 8.00 | | | | 04/15/2023 | | | | 3,707 | | | | 3,720 | |
GNMA | | | 8.00 | | | | 06/15/2023 | | | | 8,241 | | | | 9,785 | |
GNMA | | | 8.00 | | | | 12/15/2023 | | | | 968,608 | | | | 1,155,431 | |
GNMA | | | 8.00 | | | | 02/15/2024 | | | | 1,910 | | | | 2,274 | |
GNMA | | | 8.00 | | | | 09/15/2024 | | | | 5,783 | | | | 6,139 | |
GNMA | | | 8.00 | | | | 06/15/2025 | | | | 205 | | | | 217 | |
GNMA | | | 8.00 | | | | 06/15/2025 | | | | 21,506 | | | | 21,735 | |
GNMA | | | 8.35 | | | | 04/15/2020 | | | | 737,228 | | | | 850,894 | |
GNMA | | | 8.40 | | | | 05/15/2020 | | | | 344,504 | | | | 403,210 | |
GNMA | | | 8.50 | | | | 07/15/2016 | | | | 1,363 | | | | 1,368 | |
GNMA | | | 9.00 | | | | 12/15/2016 | | | | 6,960 | | | | 6,990 | |
GNMA | | | 9.00 | | | | 03/15/2020 | | | | 7,198 | | | | 7,229 | |
GNMA | | | 9.00 | | | | 04/15/2021 | | | | 3,726 | | | | 3,843 | |
GNMA | | | 9.50 | | | | 10/20/2019 | | | | 194,238 | | | | 224,462 | |
GNMA | | | 10.00 | | | | 12/15/2018 | | | | 10,565 | | | | 10,618 | |
GNMA | | | 12.50 | | | | 04/15/2019 | | | | 58,590 | | | | 59,588 | |
GNMA | | | 13.00 | | | | 11/15/2014 | | | | 1,604 | | | | 1,786 | |
GNMA | | | 14.00 | | | | 09/20/2014 | | | | 1,720 | | | | 1,733 | |
GNMA | | | 15.00 | | | | 07/15/2012 | | | | 942 | | | | 950 | |
GNMA Series 2002-53 Class IO ±(c) | | | 0.18 | | | | 04/16/2042 | | | | 29,635,339 | | | | 3,734 | |
GNMA Series 2004-20 Class B | | | 4.78 | | | | 04/16/2034 | | | | 56,478 | | | | 56,532 | |
GNMA Series 2005-23 Class IO ±(c) | | | 0.40 | | | | 06/17/2045 | | | | 103,014,614 | | | | 2,238,920 | |
GNMA Series 2005-90 Class A | | | 3.76 | | | | 09/16/2028 | | | | 8,150,439 | | | | 8,339,481 | |
GNMA Series 2006-32 Class C ± | | | 5.46 | | | | 11/16/2038 | | | | 12,510,000 | | | | 13,963,312 | |
GNMA Series 2006-32 Class XM ±(c) | | | 0.24 | | | | 11/16/2045 | | | | 70,510,783 | | | | 922,493 | |
GNMA Series 2006-68 Class D ± | | | 5.31 | | | | 12/16/2037 | | | | 12,520,000 | | | | 13,833,185 | |
GNMA Series 2008-22 Class XM ±(c) | | | 1.20 | | | | 02/16/2050 | | | | 201,032,938 | | | | 7,504,560 | |
GNMA Series 2008-80 Class B | | | 4.28 | | | | 03/16/2033 | | | | 15,122,751 | | | | 15,343,543 | |
GNMA Series 2010-105 Class QF ± | | | 0.60 | | | | 04/20/2039 | | | | 338,467 | | | | 338,471 | |
GNMA Series 2010-74 Class B | | | 3.81 | | | | 08/16/2039 | | | | 5,365,000 | | | | 5,707,469 | |
SBA ± | | | 0.63 | | | | 03/25/2013 | | | | 88,700 | | | | 88,513 | |
SBA (c)(a) | | | 1.44 | | | | 02/15/2018 | | | | 555,069 | | | | 11,212 | |
SBA Series 1992- 6 Class A (c)(a)(i) | | | 1.51 | | | | 10/15/2017 | | | | 1,646,419 | | | | 30,179 | |
TVA | | | 5.38 | | | | 04/01/2056 | | | | 3,670,000 | | | | 4,771,789 | |
| | | | |
Total Agency Securities (Cost $1,331,456,539) | | | | | | | | | | | | | | | 1,363,985,891 | |
| | | | | | | | | | | | | | | | |
| | | | |
Corporate Bonds and Notes: 0.00% | | | | | | | | | | | | | | | | |
| | | | |
Consumer Discretionary: 0.00% | | | | | | | | | | | | | | | | |
| | | | |
| Multiline Retail: 0.00% | | | | | | | | | | | | | | | | |
Sears Roebuck Acceptance Corporation | | | 6.70 | | | | 04/15/2012 | | | | 172 | | | | 171 | |
| | | | | | | | | | | | | | | | |
| | | | |
Total Corporate Bonds and Notes (Cost $0) | | | | | | | | | | | | | | | 171 | |
| | | | | | | | | | | | | | | | |
| | | | |
Municipal Bonds and Notes: 0.42% | | | | | | | | | | | | | | | | |
| | | | |
| Arkansas: 0.01% | | | | | | | | | | | | | | | | |
Arkansas Development Finance Authority (Housing Revenue, GNMA Insured) | | | 9.75 | | | | 11/15/2014 | | | | 233,354 | | | | 245,720 | |
| | | | | | | | | | | | | | | | |
The accompanying notes are an integral part of these financial statements.
| | | | | | |
| Portfolio of Investments—February 29, 2012 (Unaudited) | | Wells Fargo Advantage Government Securities Fund | | | 17 | |
| | | | | | | | | | | | | | | | |
| Security Name | | Interest Rate | | | Maturity Date | | | Principal | | | Value | |
| | | | | | | | | | | | | | | | |
| | | | |
| Texas: 0.41% | | | | | | | | | | | | | | | | |
Retama TX Development Corporation (Miscellaneous Revenue) | | | 10.00 | % | | | 12/15/2020 | | | $ | 5,405,000 | | | $ | 8,669,134 | |
| | | | | | | | | | | | | | | | |
| | | | |
Total Municipal Bonds and Notes (Cost $7,431,281) | | | | | | | | | | | | | | | 8,914,854 | |
| | | | | | | | | | | | | | | | |
| | | | |
Non-Agency Mortgage Backed Securities: 4.71% | | | | | | | | | | | | | | | | |
Bank of America Commercial Mortgage Incorporated Series 2006-2 Class A4 ± | | | 5.73 | | | | 05/10/2045 | | | | 9,735,000 | | | | 11,074,040 | |
Citigroup Commercial Mortgage Trust Series 2006-C4 Class A3 ± | | | 5.73 | | | | 03/15/2049 | | | | 10,188,000 | | | | 11,606,058 | |
Citigroup Commercial Mortgage Trust Series 2007-C6 Class A4 ± | | | 5.70 | | | | 12/10/2049 | | | | 11,603,400 | | | | 13,353,506 | |
Commercial Mortgage Trust Pass-Through Certificates Series 2004-LB4A Class A4 | | | 4.58 | | | | 10/15/2037 | | | | 5,388,999 | | | | 5,402,956 | |
Commercial Mortgage Trust Pass-Through Certificates Series 2007-C9 Class A4 ± | | | 5.81 | | | | 12/10/2049 | | | | 2,445,000 | | | | 2,826,767 | |
Credit Suisse Mortgage Capital Certificates Series 2006-C3 Class A3 ± | | | 5.81 | | | | 06/15/2038 | | | | 8,755,000 | | | | 9,871,543 | |
Lehman Brothers UBS Commercial Mortgage Trust Series 2006-C1 Class A4 | | | 5.16 | | | | 02/15/2031 | | | | 10,276,000 | | | | 11,461,799 | |
Merrill Lynch Countrywide Commercial Mortgage Trust Series 2006-4 Class AM ± | | | 5.20 | | | | 12/12/2049 | | | | 8,755,000 | | | | 8,656,673 | |
Merrill Lynch Mortgage Trust Series 2005-CKI1 Class A6 ± | | | 5.22 | | | | 11/12/2037 | | | | 1,885,000 | | | | 2,112,936 | |
Morgan Stanley Capital I Series 2006-HQ8 Class A4 ± | | | 5.42 | | | | 03/12/2044 | | | | 1,995,000 | | | | 2,235,547 | |
Nomura Asset Securities Corporation Series 1998-D6 Class A2 ± | | | 7.31 | | | | 03/15/2030 | | | | 8,025,000 | | | | 8,356,922 | |
TIAA Real Estate CDO Limited Series 2007-C4 Class A3 ± | | | 5.71 | | | | 08/15/2039 | | | | 11,460,000 | | | | 12,393,784 | |
Vendee Mortgage Trust Series 1995-1 Class 4 ± | | | 8.79 | | | | 02/15/2025 | | | | 533,842 | | | | 635,621 | |
Vendee Mortgage Trust Series 1995-2C Class 3A ± | | | 8.79 | | | | 06/15/2025 | | | | 775,786 | | | | 924,357 | |
| | | | |
Total Non-Agency Mortgage Backed Securities (Cost $97,350,013) | | | | | | | | | | | | | | | 100,912,509 | |
| | | | | | | | | | | | | | | | |
| | | | |
U.S. Treasury Securities: 22.57% | | | | | | | | | | | | | | | | |
U.S. Treasury Bond | | | 3.75 | | | | 08/15/2041 | | | | 23,355,000 | | | | 26,434,941 | |
U.S. Treasury Bond | | | 4.38 | | | | 05/15/2041 | | | | 16,235,000 | | | | 20,400,284 | |
U.S. Treasury Bond | | | 4.50 | | | | 02/15/2036 | | | | 18,650,000 | | | | 23,668,006 | |
U.S. Treasury Bond | | | 4.63 | | | | 02/15/2040 | | | | 29,820,000 | | | | 38,882,477 | |
U.S. Treasury Bond | | | 5.38 | | | | 02/15/2031 | | | | 9,690,000 | | | | 13,487,269 | |
U.S. Treasury Bond | | | 6.25 | | | | 08/15/2023 | | | | 25,060,000 | | | | 35,546,056 | |
U.S. Treasury Bond | | | 7.25 | | | | 08/15/2022 | | | | 20,950,000 | | | | 31,447,919 | |
U.S. Treasury Note | | | 0.25 | | | | 01/31/2014 | | | | 62,225,000 | | | | 62,169,122 | |
U.S. Treasury Note | | | 0.50 | | | | 10/15/2014 | | | | 100,725,000 | | | | 101,008,239 | |
U.S. Treasury Note | | | 0.63 | | | | 04/30/2013 | | | | 11,450,000 | | | | 11,503,678 | |
U.S. Treasury Note | | | 1.00 | | | | 10/31/2016 | | | | 33,095,000 | | | | 33,400,089 | |
U.S. Treasury Note | | | 1.88 | | | | 10/31/2017 | | | | 8,780,000 | | | | 9,177,155 | |
U.S. Treasury Note « | | | 2.00 | | | | 11/15/2021 | | | | 43,080,000 | | | | 43,281,959 | |
U.S. Treasury Note | | | 2.25 | | | | 07/31/2018 | | | | 30,800,000 | | | | 32,715,390 | |
| | | | |
Total U.S. Treasury Securities (Cost $463,235,190) | | | | | | | | | | | | | | | 483,122,584 | |
| | | | | | | | | | | | | | | | |
| | | | |
Yankee Corporate Bonds and Notes: 7.46% | | | | | | | | | | | | | | | | |
| | | | |
Financials: 7.46% | | | | | | | | | | | | | | | | |
| | | | |
| Commercial Banks: 7.46% | | | | | | | | | | | | | | | | |
Bank Nederlandse Gemeenten 144A | | | 2.50 | | | | 01/11/2016 | | | | 23,310,000 | | | | 23,769,697 | |
Bank of Nova Scotia 144A | | | 1.65 | | | | 10/29/2015 | | | | 13,235,000 | | | | 13,481,303 | |
Bank of Nova Scotia 144A | | | 2.15 | | | | 08/03/2016 | | | | 10,300,000 | | | | 10,628,385 | |
Canadian Imperial Bank «144A | | | 0.90 | | | | 09/19/2014 | | | | 8,355,000 | | | | 8,365,252 | |
The accompanying notes are an integral part of these financial statements.
| | | | |
| 18 | | Wells Fargo Advantage Government Securities Fund | | Portfolio of Investments—February 29, 2012 (Unaudited) |
| | | | | | | | | | | | | | | | |
| Security Name | | Interest Rate | | | Maturity Date | | | Principal | | | Value | |
| | | | | | | | | | | | | | | | |
| | | | |
| Commercial Banks (continued) | | | | | | | | | | | | | | | | |
HSBC Bank plc «144A | | | 1.63 | % | | | 07/07/2014 | | | $ | 14,500,000 | | | $ | 14,546,284 | |
Kommunalbanken AS 144A | | | 2.38 | | | | 01/19/2016 | | | | 10,135,000 | | | | 10,503,914 | |
Kommunalbanken AS 144A | | | 2.75 | | | | 05/05/2015 | | | | 17,090,000 | | | | 17,860,776 | |
Landwirtsch Rentenbank « | | | 2.50 | | | | 02/15/2016 | | | | 14,125,000 | | | | 14,809,187 | |
Nordea Eiendomskreditt 144A | | | 1.88 | | | | 04/07/2014 | | | | 10,430,000 | | | | 10,531,119 | |
Swedbank Hypotek 144A | | | 2.13 | | | | 08/31/2016 | | | | 12,110,000 | | | | 12,111,538 | |
Toronto Dominion Bank 144A | | | 1.63 | | | | 09/14/2016 | | | | 9,200,000 | | | | 9,281,558 | |
Westpac Banking Corporation 144A | | | 1.90 | | | | 12/14/2012 | | | | 13,660,000 | | | | 13,783,719 | |
| | | | |
Total Yankee Corporate Bonds and Notes (Cost $156,143,852) | | | | | | | | | | | | | | | 159,672,732 | |
| | | | | | | | | | | | | | | | |
| | | | |
Other: 0.34% | | | | | | | | | | | | | | | | |
Gryphon Funding Limited, Pass-Through Entity (a)(i)(v) | | | | | | | | | | | 5,094,336 | | | | 1,375,471 | |
VFNC Corporation, Pass-Through Entity, 0.24% ±(a)(i)144A(v) | | | | | | | | | | | 13,559,668 | | | | 5,830,657 | |
| | | | |
Total Other (Cost $2,934,712) | | | | | | | | | | | | | | | 7,206,128 | |
| | | | | | | | | | | | | | | | |
| | | | |
| | | Yield | | | | | | | | | | |
| Short-Term Investments: 26.61% | | | | | | | | | | | | | | | | |
| | | | |
| U.S. Treasury Securities: 0.03% | | | | | | | | | | | | | | | | |
U.S. Treasury Bill # | | | 0.07 | | | | 03/29/2012 | | | | 600,000 | | | | 599,965 | |
| | | | | | | | | | | | | | | | |
| | | | |
| | | | | | | | | Shares | | | | |
| Investment Companies: 26.58% | | | | | | | | | | | | | | | | |
Wells Fargo Advantage Government Money Market Fund, Institutional Class ##(l)(u) | | | 0.01 | | | | | | | | 537,572,549 | | | | 537,572,549 | |
Wells Fargo Securities Lending Cash Investments, LLC (v)(l)(u)(r) | | | 0.15 | | | | | | | | 31,466,405 | | | | 31,466,405 | |
| | | | |
| | | | | | | | | | | | | | | 569,038,954 | |
| | | | | | | | | | | | | | | | |
| | | | |
Total Short-Term Investments (Cost $569,638,946) | | | | | | | | | | | | | | | 569,638,919 | |
| | | | | | | | | | | | | | | | |
| | | | | | | | |
| Total Investments in Securities | | | | | | | | |
| (Cost $2,628,190,533) * | | | 125.82 | % | | | 2,693,453,788 | |
Other Assets and Liabilities, Net | | | (25.82 | ) | | | (552,684,777 | ) |
| | | | | | | | |
| Total Net Assets | | | 100.00 | % | | $ | 2,140,769,011 | |
| | | | | | | | |
The accompanying notes are an integral part of these financial statements.
| | | | | | |
| Portfolio of Investments—February 29, 2012 (Unaudited) | | Wells Fargo Advantage Government Securities Fund | | | 19 | |
| ± | Variable rate investment. |
| %% | Security issued on a when-issued (TBA) basis. |
| (c) | Interest-only securities entitle holders to receive only the interest payments on the underlying mortgages. The principal amount shown is the notional amount of the underlying mortgages. Interest rate disclosed represents the coupon rate. |
| (a) | Security is fair valued by the Management Valuation Team, and in certain instances by the Board of Trustees, in accordance with procedures approved by the Board of Trustees. |
| (z) | Zero coupon security. Rate represents yield to maturity. |
| « | All or a portion of this security is on loan. |
| 144A | Security that may be resold to “qualified institutional buyers” under Rule 144A or security offered pursuant to Section 4(2) of the Securities Act of 1933, as amended. |
| (v) | Security represents investment of cash collateral received from securities on loan. |
| # | All or a portion of this security is segregated as collateral for investments in derivative instruments. |
| ## | All or a portion of this security has been segregated for when-issued securities. |
| (l) | Investment in an affiliate. |
| (u) | Rate shown is the 7-day annualized yield at period end. |
| (r) | The investment company is exempt from registration under Section 3(c)(7) of the 1940 Act. |
| * | Cost for federal income tax purposes is $2,632,848,726 and net unrealized appreciation (depreciation) consists of: |
| | | | |
Gross unrealized appreciation | | $ | 78,273,670 | |
Gross unrealized depreciation | | | (17,668,608 | ) |
| | | | |
Net unrealized appreciation | | $ | 60,605,062 | |
The accompanying notes are an integral part of these financial statements.
| | | | |
| 20 | | Wells Fargo Advantage Government Securities Fund | | Statement of Assets and Liabilities—February 29, 2012 (Unaudited) |
| | | | |
| | | | |
| |
Assets | | | | |
Investments | | | | |
In unaffiliated securities (including securities on loan), at value (see cost below) | | $ | 2,124,414,834 | |
In affiliated securities, at value (see cost below) | | | 569,038,954 | |
| | | | |
Total investments, at value (see cost below) | | | 2,693,453,788 | |
Receivable for investments sold | | | 57,200,538 | |
Principal paydown receivable | | | 72,379 | |
Receivable for Fund shares sold | | | 1,668,185 | |
Receivable for interest | | | 6,731,439 | |
Receivable for securities lending income | | | 7,790 | |
Prepaid expenses and other assets | | | 73,940 | |
| | | | |
Total assets | | | 2,759,208,059 | |
| | | | |
| |
Liabilities | | | | |
Dividends payable | | | 333,100 | |
Payable for investments purchased | | | 580,433,462 | |
Payable for Fund shares redeemed | | | 1,850,642 | |
Payable upon receipt of securities loaned | | | 34,401,117 | |
Payable for daily variation margin on open futures contracts | | | 128,989 | |
Advisory fee payable | | | 563,175 | |
Distribution fees payable | | | 45,032 | |
Due to other related parties | | | 305,473 | |
Accrued expenses and other liabilities | | | 378,058 | |
| | | | |
Total liabilities | | | 618,439,048 | |
| | | | |
Total net assets | | $ | 2,140,769,011 | |
| | | | |
| |
NET ASSETS CONSIST OF | | | | |
Paid-in capital | | $ | 2,118,653,558 | |
Overdistributed net investment income | | | (5,594,186 | ) |
Accumulated net realized losses on investments | | | (37,512,287 | ) |
Net unrealized gains on investments | | | 65,221,926 | |
| | | | |
Total net assets | | $ | 2,140,769,011 | |
| | | | |
| |
COMPUTATION OF NET ASSET VALUE AND OFFERING PRICE PER SHARE1 | | | | |
Net assets – Class A | | $ | 272,186,920 | |
Shares outstanding – Class A | | | 24,192,353 | |
Net asset value per share – Class A | | | $11.25 | |
Maximum offering price per share – Class A2 | | | $11.78 | |
Net assets – Class B | | $ | 6,137,966 | |
Shares outstanding – Class B | | | 545,661 | |
Net asset value per share – Class B | | | $11.25 | |
Net assets – Class C | | $ | 70,322,731 | |
Shares outstanding – Class C | | | 6,251,145 | |
Net asset value per share – Class C | | | $11.25 | |
Net assets – Administrator Class | | $ | 287,079,550 | |
Shares outstanding – Administrator Class | | | 25,523,968 | |
Net asset value per share – Administrator Class | | | $11.25 | |
Net assets – Institutional Class | | $ | 829,203,417 | |
Shares outstanding – Institutional Class | | | 73,763,529 | |
Net asset value per share – Institutional Class | | | $11.24 | |
Net assets – Investor Class | | $ | 675,838,427 | |
Shares outstanding – Investor Class | | | 60,033,547 | |
Net asset value per share – Investor Class | | | $11.26 | |
Investments in unaffiliated securities, at cost | | $ | 2,059,151,579 | |
| | | | |
Investments in affiliated securities, at cost | | $ | 569,038,954 | |
| | | | |
Total investments, at cost | | $ | 2,628,190,533 | |
| | | | |
Securities on loan, at value | | $ | 33,675,924 | |
| | | | |
| 1. | The Fund has an unlimited number of authorized shares. |
| 2. | Maximum offering price is computed as 100/95.50 of net asset value. On investments of $50,000 or more, the offering price is reduced. |
The accompanying notes are an integral part of these financial statements.
| | | | | | |
| Statement of Operations—Six Months Ended February 29, 2012 (Unaudited) | | Wells Fargo Advantage Government Securities Fund | | | 21 | |
| | | | |
| | | | |
| |
Investment income | | | | |
Interest | | $ | 26,409,096 | |
Securities lending income, net | | | 55,743 | |
Income from affiliated securities | | | 19,744 | |
| | | | |
Total investment income | | | 26,484,583 | |
| |
Expenses | | | | |
Advisory fee | | | 3,812,896 | |
Administration fees | | | | |
Fund level | | | 518,060 | |
Class A | | | 213,362 | |
Class B | | | 5,333 | |
Class C | | | 50,958 | |
Administrator Class | | | 143,077 | |
Institutional Class | | | 309,427 | |
Investor Class | | | 641,679 | |
Shareholder servicing fees | | | | |
Class A | | | 333,379 | |
Class B | | | 8,333 | |
Class C | | | 79,622 | |
Administrator Class | | | 351,823 | |
Investor Class | | | 844,314 | |
Distribution fees | | | | |
Class B | | | 25,000 | |
Class C | | | 238,867 | |
Custody and accounting fees | | | 66,972 | |
Professional fees | | | 28,174 | |
Registration fees | | | 44,828 | |
Shareholder report expenses | | | 124,652 | |
Trustees’ fees and expenses | | | 6,004 | |
Other fees and expenses | | | 30,381 | |
| | | | |
Total expenses | | | 7,877,141 | |
Less: Fee waivers and/or expense reimbursements | | | (402,443 | ) |
| | | | |
Net expenses | | | 7,474,698 | |
| | | | |
Net investment income | | | 19,009,885 | |
| | | | |
| |
REALIZED AND UNREALIZED GAINS (LOSSES) ON INVESTMENTS | | | | |
| |
Net realized gains (losses) on: | | | | |
Unaffiliated securities | | | 27,258,267 | |
Futures transactions | | | 766,406 | |
| | | | |
Net realized gains on investments | | | 28,024,673 | |
| | | | |
| |
Net change in unrealized gains (losses) on: | | | | |
Unaffiliated securities | | | (6,939,077 | ) |
Futures transactions | | | (46,343 | ) |
| | | | |
Net change in unrealized gains (losses) on investments | | | (6,985,420 | ) |
| | | | |
Net realized and unrealized gains (losses) on investments | | | 21,039,253 | |
| | | | |
Net increase in net assets resulting from operations | | $ | 40,049,138 | |
| | | | |
The accompanying notes are an integral part of these financial statements.
| | | | |
| 22 | | Wells Fargo Advantage Government Securities Fund | | Statements of Changes in Net Assets |
| | | | | | | | | | | | | | | | |
| | | Six Months Ended
February 29, 2012
(Unaudited) | | | Year Ended
August 31, 2011 | |
| | | | |
Operations | | | | | | | | | | | | | | | | |
Net investment income | | | | | | $ | 19,009,885 | | | | | | | $ | 54,069,018 | |
Net realized gains on investments | | | | | | | 28,024,673 | | | | | | | | 41,311,018 | |
Net change in unrealized gains (losses) on investments | | | | | | | (6,985,420 | ) | | | | | | | (24,528,273 | ) |
| | | | | | | | | | | | | | | | |
Net increase in net assets resulting from operations | | | | | | | 40,049,138 | | | | | | | | 70,851,763 | |
| | | | | | | | | | | | | | | | |
| | | | |
Distributions to shareholders from | | | | | | | | | | | | | | | | |
Net investment income | | | | | | | | | | | | | | | | |
Class A | | | | | | | (2,942,260 | ) | | | | | | | (8,922,685 | ) |
Class B | | | | | | | (49,136 | ) | | | | | | | (209,776 | ) |
Class C | | | | | | | (456,804 | ) | | | | | | | (1,391,847 | ) |
Administrator Class | | | | | | | (3,468,767 | ) | | | | | | | (12,614,930 | ) |
Institutional Class | | | | | | | (9,944,593 | ) | | | | | | | (23,113,683 | ) |
Investor Class | | | | | | | (7,356,385 | ) | | | | | | | (24,546,230 | ) |
Net realized gains | | | | | | | | | | | | | | | | |
Class A | | | | | | | (1,482,998 | ) | | | | | | | 0 | |
Class B | | | | | | | (37,056 | ) | | | | | | | 0 | |
Class C | | | | | | | (358,176 | ) | | | | | | | 0 | |
Administrator Class | | | | | | | (1,606,587 | ) | | | | | | | 0 | |
Institutional Class | | | | | | | (4,364,227 | ) | | | | | | | 0 | |
Investor Class | | | | | | | (3,776,055 | ) | | | | | | | 0 | |
| | | | | | | | | | | | | | | | |
Total distributions to shareholders | | | | | | | (35,843,044 | ) | | | | | | | (70,799,151 | ) |
| | | | | | | | | | | | | | | | |
| | | | |
Capital share transactions | | | Shares | | | | | | | | Shares | | | | | |
Proceeds from shares sold | | | | | | | | | | | | | | | | |
Class A | | | 2,192,597 | | | | 24,691,436 | | | | 1,994,278 | | | | 21,916,728 | |
Class B | | | 38,481 | | | | 433,338 | | | | 44,410 | | | | 492,586 | |
Class C | | | 1,575,759 | | | | 17,733,974 | | | | 1,814,121 | | | | 20,009,882 | |
Administrator Class | | | 4,342,675 | | | | 48,858,035 | | | | 42,444,351 | | | | 466,051,052 | |
Institutional Class | | | 18,207,123 | | | | 204,640,599 | | | | 39,552,223 | | | | 435,595,163 | |
Investor Class | | | 6,863,308 | | | | 77,301,755 | | | | 21,217,913 | | | | 234,732,980 | |
| | | | | | | | | | | | | | | | |
| | | | | | | 373,659,137 | | | | | | | | 1,178,798,391 | |
| | | | | | | | | | | | | | | | |
Reinvestment of distributions | | | | | | | | | | | | | | | | |
Class A | | | 330,545 | | | | 3,719,659 | | | | 661,776 | | | | 7,275,643 | |
Class B | | | 5,834 | | | | 65,613 | | | | 14,450 | | | | 158,713 | |
Class C | | | 24,682 | | | | 277,599 | | | | 45,777 | | | | 503,112 | |
Administrator Class | | | 393,683 | | | | 4,430,217 | | | | 771,409 | | | | 8,476,508 | |
Institutional Class | | | 1,105,390 | | | | 12,429,854 | | | | 1,779,094 | | | | 19,540,860 | |
Investor Class | | | 944,667 | | | | 10,638,825 | | | | 1,922,418 | | | | 21,145,957 | |
| | | | | | | | | | | | | | | | |
| | | | | | | 31,561,767 | | | | | | | | 57,100,793 | |
| | | | | | | | | | | | | | | | |
Payment for shares redeemed | | | | | | | | | | | | | | | | |
Class A | | | (2,397,449 | ) | | | (27,032,442 | ) | | | (7,866,690 | ) | | | (86,331,974 | ) |
Class B | | | (129,546 | ) | | | (1,458,552 | ) | | | (457,969 | ) | | | (5,016,817 | ) |
Class C | | | (566,382 | ) | | | (6,373,548 | ) | | | (1,981,055 | ) | | | (21,699,976 | ) |
Administrator Class | | | (3,828,139 | ) | | | (43,098,747 | ) | | | (51,432,220 | ) | | | (561,733,378 | ) |
Institutional Class | | | (9,579,229 | ) | | | (107,931,935 | ) | | | (24,993,054 | ) | | | (275,257,423 | ) |
Investor Class | | | (8,118,676 | ) | | | (91,442,720 | ) | | | (65,432,945 | ) | | | (719,783,492 | ) |
| | | | | | | | | | | | | | | | |
| | | | | | | (277,337,944 | ) | | | | | | | (1,669,823,060 | ) |
| | | | | | | | | | | | | | | | |
Net increase (decrease) in net assets resulting
from capital share transactions | | | | | | | 127,882,960 | | | | | | | | (433,923,876 | ) |
| | | | | | | | | | | | | | | | |
Total increase (decrease) in net assets | | | | | | | 132,089,054 | | | | | | | | (433,871,264 | ) |
| | | | | | | | | | | | | | | | |
| | | | |
Net assets | | | | | | | | | | | | | | | | |
Beginning of period | | | | | | | 2,008,679,957 | | | | | | | | 2,442,551,221 | |
| | | | | | | | | | | | | | | | |
End of period | | | | | | $ | 2,140,769,011 | | | | | | | $ | 2,008,679,957 | |
| | | | | | | | | | | | | | | | |
Overdistributed net investment income | | | | | | $ | (5,594,186 | ) | | | | | | $ | (386,126 | ) |
| | | | | | | | | | | | | | | | |
The accompanying notes are an integral part of these financial statements.
| | | | | | |
| Financial Highlights | | Wells Fargo Advantage Government Securities Fund | | | 23 | |
(For a share outstanding throughout each period)
| | | | | | | | | | | | | | | | | | | | | | | | | | | | |
| | | Six Months Ended
February 29, 2012 (Unaudited) | | | Year Ended August 31, | | | Year Ended May 31, | |
| Class A | | | 2011 | | | 20101 | | | 2010 | | | 20092 | | | 20082 | | | 20072 | |
Net asset value, beginning of period | | $ | 11.23 | | | $ | 11.16 | | | $ | 10.89 | | | $ | 10.71 | | | $ | 10.45 | | | $ | 10.22 | | | $ | 10.15 | |
Net investment income | | | 0.10 | | | | 0.25 | | | | 0.06 | 3 | | | 0.29 | | | | 0.39 | 3 | | | 0.48 | | | | 0.48 | |
Net realized and unrealized gains (losses)
on investments | | | 0.10 | | | | 0.16 | | | | 0.30 | | | | 0.39 | | | | 0.34 | | | | 0.25 | | | | 0.09 | |
| | | | | | | | | | | | | | | | | | | | | | | | | | | | |
Total from investment operations | | | 0.20 | | | | 0.41 | | | | 0.36 | | | | 0.68 | | | | 0.73 | | | | 0.73 | | | | 0.57 | |
Distributions to shareholders from | | | | | | | | | | | | | | | | | | | | | | | | | | | | |
Net investment income | | | (0.12 | ) | | | (0.34 | ) | | | (0.09 | ) | | | (0.41 | ) | | | (0.44 | ) | | | (0.50 | ) | | | (0.50 | ) |
Net realized gains | | | (0.06 | ) | | | 0.00 | | | | 0.00 | | | | (0.09 | ) | | | (0.03 | ) | | | 0.00 | | | | 0.00 | |
| | | | | | | | | | | | | | | | | | | | | | | | | | | | |
Total distributions to shareholders | | | (0.18 | ) | | | (0.34 | ) | | | (0.09 | ) | | | (0.50 | ) | | | (0.47 | ) | | | (0.50 | ) | | | (0.50 | ) |
Net asset value, end of period | | $ | 11.25 | | | $ | 11.23 | | | $ | 11.16 | | | $ | 10.89 | | | $ | 10.71 | | | $ | 10.45 | | | $ | 10.22 | |
Total return4 | | | 1.85 | % | | | 3.75 | % | | | 3.29 | % | | | 6.48 | % | | | 7.17 | % | | | 7.21 | % | | | 5.71 | % |
Ratios to average net assets (annualized) | | | | | | | | | | | | | | | | | | | | | | | | | | | | |
Gross expenses | | | 0.86 | % | | | 0.85 | % | | | 0.86 | % | | | 0.89 | % | | | 0.90 | % | | | 1.03 | % | | | 1.06 | % |
Net expenses | | | 0.86 | % | | | 0.85 | % | | | 0.86 | % | | | 0.89 | % | | | 0.90 | % | | | 0.90 | % | | | 0.92 | % |
Net investment income | | | 1.70 | % | | | 2.31 | % | | | 2.10 | % | | | 2.71 | % | | | 3.65 | % | | | 4.54 | % | | | 4.64 | % |
Supplemental data | | | | | | | | | | | | | | | | | | | | | | | | | | | | |
Portfolio turnover rate | | | 135 | % | | | 268 | % | | | 89 | % | | | 194 | % | | | 368 | % | | | 263 | % | | | 159 | % |
Net assets, end of period (000’s omitted) | | | $272,187 | | | | $270,253 | | | | $326,800 | | | | $174,781 | | | | $181,342 | | | | $71,233 | | | | $59,760 | |
| 1. | For the three months ended August 31, 2010. The Fund changed its fiscal year end from May 31 to August 31, effective August 31, 2010. |
| 2. | On June 20, 2008, Advisor Class was renamed Class A. |
| 3. | Calculated based upon average shares outstanding |
| 4. | Total return calculations do not include any sales charges. Returns for periods of less than one year are not annualized. |
The accompanying notes are an integral part of these financial statements.
| | | | |
| 24 | | Wells Fargo Advantage Government Securities Fund | | Financial Highlights |
(For a share outstanding throughout each period)
| | | | | | | | | | | | | | | | | | | | |
| | | Six Months Ended
February 29, 2012 (Unaudited) | | | Year Ended August 31, | | | Year Ended May 31, | |
| CLASS B | | | 2011 | | | 20101 | | | 2010 | | | 20091 | |
Net asset value, beginning of period | | $ | 11.23 | | | $ | 11.16 | | | $ | 10.89 | | | $ | 10.70 | | | $ | 10.32 | |
Net investment income | | | 0.05 | | | | 0.15 | | | | 0.04 | 3 | | | 0.24 | 3 | | | 0.273 | |
Net realized and unrealized gains (losses)
on investments | | | 0.11 | | | | 0.17 | | | | 0.30 | | | | 0.37 | | | | 0.45 | |
| | | | | | | | | | | | | | | | | | | | |
Total from investment operations | | | 0.16 | | | | 0.32 | | | | 0.34 | | | | 0.61 | | | | 0.72 | |
Distributions to shareholders from | | | | | | | | | | | | | | | | | | | | |
Net investment income | | | (0.08 | ) | | | (0.25 | ) | | | (0.07 | ) | | | (0.33 | ) | | | (0.31 | ) |
Net realized gains | | | (0.06 | ) | | | 0.00 | | | | 0.00 | | | | (0.09 | ) | | | (0.03 | ) |
| | | | | | | | | | | | | | | | | | | | |
Total distributions to shareholders | | | (0.14 | ) | | | (0.25 | ) | | | (0.07 | ) | | | (0.42 | ) | | | (0.34 | ) |
Net asset value, end of period | | $ | 11.25 | | | $ | 11.23 | | | $ | 11.16 | | | $ | 10.89 | | | $ | 10.70 | |
Total return4 | | | 1.47 | % | | | 2.98 | % | | | 3.10 | % | | | 5.80 | % | | | 7.00 | % |
Ratios to average net assets (annualized) | | | | | | | | | | | | | | | | | | | | |
Gross expenses | | | 1.61 | % | | | 1.60 | % | | | 1.60 | % | | | 1.63 | % | | | 1.65 | % |
Net expenses | | | 1.61 | % | | | 1.60 | % | | | 1.60 | % | | | 1.63 | % | | | 1.65 | % |
Net investment income | | | 0.97 | % | | | 1.55 | % | | | 1.29 | % | | | 2.09 | % | | | 2.94 | % |
Supplemental data | | | | | | | | | | | | | | | | | | | | |
Portfolio turnover rate | | | 135 | % | | | 268 | % | | | 89 | % | | | 194 | % | | | 368 | % |
Net assets, end of period (000’s omitted) | | | $6,138 | | | | $7,083 | | | | $11,495 | | | | $2,159 | | | | $5,297 | |
| 1. | For the three months ended August 31, 2010. The Fund changed its fiscal year end from May 31 to August 31, effective August 31, 2010. |
| 2. | Class commenced operations on July 18, 2008. |
| 3. | Calculated based upon average shares outstanding. |
| 4. | Total return calculations do not include any sales charges. Returns for periods of less than one year are not annualized. |
The accompanying notes are an integral part of these financial statements.
| | | | | | |
| Financial Highlights | | Wells Fargo Advantage Government Securities Fund | | | 25 | |
(For a share outstanding throughout each period)
| | | | | | | | | | | | | | | | | | | | | | | | | | | | |
| | | Six Months Ended
February 29, 2012 (Unaudited) | | | Year Ended August 31, | | | Year Ended May 31, | |
| Class C | | | 2011 | | | 20101 | | | 2010 | | | 2009 | | | 2008 | | | 2007 | |
Net asset value, beginning of period | | $ | 11.23 | | | $ | 11.16 | | | $ | 10.89 | | | $ | 10.70 | | | $ | 10.45 | | | $ | 10.22 | | | $ | 10.15 | |
Net investment income | | | 0.06 | | | | 0.17 | | | | 0.04 | 2 | | | 0.23 | | | | 0.30 | 2 | | | 0.39 | | | | 0.40 | |
Net realized and unrealized gains (losses)
on investments | | | 0.10 | | | | 0.15 | | | | 0.30 | | | | 0.38 | | | | 0.35 | | | | 0.25 | | | | 0.09 | |
| | | | | | | | | | | | | | | | | | | | | | | | | | | | |
Total from investment operations | | | 0.16 | | | | 0.32 | | | | 0.34 | | | | 0.61 | | | | 0.65 | | | | 0.64 | | | | 0.49 | |
Distributions to shareholders from | | | | | | | | | | | | | | | | | | | | | | | | | | | | |
Net investment income | | | (0.08 | ) | | | (0.25 | ) | | | (0.07 | ) | | | (0.33 | ) | | | (0.37 | ) | | | (0.41 | ) | | | (0.42 | ) |
Net realized gains | | | (0.06 | ) | | | 0.00 | | | | 0.00 | | | | (0.09 | ) | | | (0.03 | ) | | | 0.00 | | | | 0.00 | |
| | | | | | | | | | | | | | | | | | | | | | | | | | | | |
Total distributions to shareholders | | | (0.14 | ) | | | (0.25 | ) | | | (0.07 | ) | | | (0.42 | ) | | | (0.40 | ) | | | (0.41 | ) | | | (0.42 | ) |
Net asset value, end of period | | $ | 11.25 | | | $ | 11.23 | | | $ | 11.16 | | | $ | 10.89 | | | $ | 10.70 | | | $ | 10.45 | | | $ | 10.22 | |
Total return3 | | | 1.47 | % | | | 2.98 | % | | | 3.09 | % | | | 5.78 | % | | | 6.28 | % | | | 6.36 | % | | | 4.89 | % |
Ratios to average net assets (annualized) | | | | | | | | | | | | | | | | | | | | | | | | | | | | |
Gross expenses | | | 1.61 | % | | | 1.60 | % | | | 1.61 | % | | | 1.64 | % | | | 1.63 | % | | | 1.77 | % | | | 1.81 | % |
Net expenses | | | 1.61 | % | | | 1.60 | % | | | 1.61 | % | | | 1.64 | % | | | 1.63 | % | | | 1.70 | % | | | 1.70 | % |
Net investment income | | | 0.93 | % | | | 1.56 | % | | | 1.35 | % | | | 1.89 | % | | | 2.78 | % | | | 3.69 | % | | | 3.87 | % |
Supplemental data | | | | | | | | | | | | | | | | | | | | | | | | | | | | |
Portfolio turnover rate | | | 135 | % | | | 268 | % | | | 89 | % | | | 194 | % | | | 368 | % | | | 263 | % | | | 159 | % |
Net assets, end of period (000’s omitted) | | | $70,323 | | | | $58,576 | | | | $59,580 | | | | $34,927 | | | | $21,783 | | | | $2,595 | | | | $1,335 | |
| 1. | For the three months ended August 31, 2010. The Fund changed its fiscal year end from May 31 to August 31, effective August 31, 2010. |
| 2. | Calculated based upon average shares outstanding. |
| 3. | Total return calculations do not include any sales charges. Returns for periods of less than one year are not annualized. |
The accompanying notes are an integral part of these financial statements.
| | | | |
| 26 | | Wells Fargo Advantage Government Securities Fund | | Financial Highlights |
(For a share outstanding throughout each period)
| | | | | | | | | | | | | | | | | | | | | | | | | | | | |
| | | Six Months Ended
February 29, 2012 (Unaudited) | | | Year Ended August 31, | | | Year Ended May 31, | |
| Administrator Class | | | 2011 | | | 20101 | | | 2010 | | | 2009 | | | 2008 | | | 2007 | |
Net asset value, beginning of period | | $ | 11.23 | | | $ | 11.16 | | | $ | 10.89 | | | $ | 10.70 | | | $ | 10.45 | | | $ | 10.22 | | | $ | 10.15 | |
Net investment income | | | 0.11 | | | | 0.27 | 2 | | | 0.06 | 2 | | | 0.32 | | | | 0.41 | 2 | | | 0.49 | | | | 0.50 | |
Net realized and unrealized gains (losses)
on investments | | | 0.11 | | | | 0.16 | | | | 0.30 | | | | 0.39 | | | | 0.34 | | | | 0.26 | | | | 0.09 | |
| | | | | | | | | | | | | | | | | | | | | | | | | | | | |
Total from investment operations | | | 0.22 | | | | 0.43 | | | | 0.36 | | | | 0.71 | | | | 0.75 | | | | 0.75 | | | | 0.59 | |
Distributions to shareholders from | | | | | | | | | | | | | | | | | | | | | | | | | | | | |
Net investment income | | | (0.14 | ) | | | (0.36 | ) | | | (0.09 | ) | | | (0.43 | ) | | | (0.47 | ) | | | (0.52 | ) | | | (0.52 | ) |
Net realized gains | | | (0.06 | ) | | | 0.00 | | | | 0.00 | | | | (0.09 | ) | | | (0.03 | ) | | | 0.00 | | | | 0.00 | |
| | | | | | | | | | | | | | | | | | | | | | | | | | | | |
Total distributions to shareholders | | | (0.20 | ) | | | (0.36 | ) | | | (0.09 | ) | | | (0.52 | ) | | | (0.50 | ) | | | (0.52 | ) | | | (0.52 | ) |
Net asset value, end of period | | $ | 11.25 | | | $ | 11.23 | | | $ | 11.16 | | | $ | 10.89 | | | $ | 10.70 | | | $ | 10.45 | | | $ | 10.22 | |
Total return3 | | | 1.95 | % | | | 3.97 | % | | | 3.34 | % | | | 6.78 | % | | | 7.28 | % | | | 7.42 | % | | | 5.94 | % |
Ratios to average net assets (annualized) | | | | | | | | | | | | | | | | | | | | | | | | | | | | |
Gross expenses | | | 0.79 | % | | | 0.74 | % | | | 0.79 | % | | | 0.81 | % | | | 0.81 | % | | | 0.85 | % | | | 0.88 | % |
Net expenses | | | 0.64 | % | | | 0.64 | % | | | 0.67 | % | | | 0.70 | % | | | 0.70 | % | | | 0.70 | % | | | 0.70 | % |
Net investment income | | | 1.92 | % | | | 2.50 | % | | | 2.30 | % | | | 2.90 | % | | | 3.86 | % | | | 4.72 | % | | | 4.87 | % |
Supplemental data | | | | | | | | | | | | | | | | | | | | | | | | | | | | |
Portfolio turnover rate | | | 135 | % | | | 268 | % | | | 89 | % | | | 194 | % | | | 368 | % | | | 263 | % | | | 159 | % |
Net assets, end of period (000’s omitted) | | | $287,080 | | | | $276,334 | | | | $366,430 | | | | $243,760 | | | | $266,579 | | | | $123,993 | | | | $117,347 | |
| 1. | For the three months ended August 31, 2010. The Fund changed its fiscal year end from May 31, to August 31, effective August 31,2010. |
| 2. | Calculated based upon average shares outstanding. |
| 3. | Returns for periods of less than one year are not annualized. |
The accompanying notes are an integral part of these financial statements.
| | | | | | |
| Financial Highlights | | Wells Fargo Advantage Government Securities Fund | | | 27 | |
(For a share outstanding throughout each period)
| | | | | | | | | | | | | | | | | | | | | | | | | | | | |
| | | Six Months Ended
February 29, 2012 (Unaudited) | | | Year Ended August 31, | | | Year Ended May 31, | |
| Institutional Class | | | 2011 | | | 20101 | | | 2010 | | | 2009 | | | 2008 | | | 2007 | |
Net asset value, beginning of period | | $ | 11.22 | | | $ | 11.15 | | | $ | 10.88 | | | $ | 10.70 | | | $ | 10.44 | | | $ | 10.21 | | | $ | 10.14 | |
Net investment income | | | 0.12 | | | | 0.30 | | | | 0.07 | 2 | | | 0.32 | 2 | | | 0.44 | 2 | | | 0.52 | | | | 0.54 | |
Net realized and unrealized gains (losses)
on investments | | | 0.10 | | | | 0.15 | | | | 0.30 | | | | 0.41 | | | | 0.34 | | | | 0.25 | | | | 0.08 | |
| | | | | | | | | | | | | | | | | | | | | | | | | | | | |
Total from investment operations | | | 0.22 | | | | 0.45 | | | | 0.37 | | | | 0.73 | | | | 0.78 | | | | 0.77 | | | | 0.62 | |
Distributions to shareholders from | | | | | | | | | | | | | | | | | | | | | | | | | | | | |
Net investment income | | | (0.14 | ) | | | (0.38 | ) | | | (0.10 | ) | | | (0.46 | ) | | | (0.49 | ) | | | (0.54 | ) | | | (0.55 | ) |
Net realized gains | | | (0.06 | ) | | | 0.00 | | | | 0.00 | | | | (0.09 | ) | | | (0.03 | ) | | | 0.00 | | | | 0.00 | |
| | | | | | | | | | | | | | | | | | | | | | | | | | | | |
Total distributions to shareholders | | | (0.20 | ) | | | (0.38 | ) | | | (0.10 | ) | | | (0.55 | ) | | | (0.52 | ) | | | (0.54 | ) | | | (0.55 | ) |
Net asset value, end of period | | $ | 11.24 | | | $ | 11.22 | | | $ | 11.15 | | | $ | 10.88 | | | $ | 10.70 | | | $ | 10.44 | | | $ | 10.21 | |
Total return3 | | | 2.04 | % | | | 4.14 | % | | | 3.39 | % | | | 6.92 | % | | | 7.62 | % | | | 7.66 | % | | | 6.17 | % |
Ratios to average net assets (annualized) | | | | | | | | | | | | | | | | | | | | | | | | | | | | |
Gross expenses | | | 0.53 | % | | | 0.52 | % | | | 0.52 | % | | | 0.54 | % | | | 0.56 | % | | | 0.59 | % | | | 0.61 | % |
Net expenses | | | 0.48 | % | | | 0.48 | % | | | 0.48 | % | | | 0.48 | % | | | 0.48 | % | | | 0.48 | % | | | 0.48 | % |
Net investment income | | | 2.07 | % | | | 2.71 | % | | | 2.52 | % | | | 3.06 | % | | | 4.14 | % | | | 4.96 | % | | | 5.08 | % |
Supplemental data | | | | | | | | | | | | | | | | | | | | | | | | | | | | |
Portfolio turnover rate | | | 135 | % | | | 268 | % | | | 89 | % | | | 194 | % | | | 368 | % | | | 263 | % | | | 159 | % |
Net assets, end of period (000’s omitted) | | | $829,203 | | | | $718,411 | | | | $531,890 | | | | $463,726 | | | | $313,486 | | | | $326,015 | | | | $236,424 | |
| 1. | For the three months ended August 31, 2010. The Fund changed its fiscal year end from May 31 to August 31, effective August 31, 2010. |
| 2. | Calculated based upon average shares outstanding. |
| 3. | Returns for periods of less than one year are not annualized. |
The accompanying notes are an integral part of these financial statements.
| | | | |
| 28 | | Wells Fargo Advantage Government Securities Fund | | Financial Highlights |
(For a share outstanding throughout each period)
| | | | | | | | | | | | | | | | | | | | | | | | | | | | |
| | | Six Months Ended
February 29, 2012 (Unaudited) | | | Year Ended August 31, | | | Year Ended May 31, | |
| Investor Class | | | 2011 | | | 20101 | | | 2010 | | | 2009 | | | 2008 | | | 2007 | |
Net asset value, beginning of period | | $ | 11.24 | | | $ | 11.17 | | | $ | 10.90 | | | $ | 10.71 | | | $ | 10.46 | | | $ | 10.22 | | | $ | 10.16 | |
Net investment income | | | 0.09 | | | | 0.25 | 2 | | | 0.06 | 2 | | | 0.29 | | | | 0.39 | 2 | | | 0.47 | | | | 0.47 | |
Net realized and unrealized gains (losses)
on investments | | | 0.11 | | | | 0.15 | | | | 0.30 | | | | 0.40 | | | | 0.33 | | | | 0.26 | | | | 0.09 | |
| | | | | | | | | | | | | | | | | | | | | | | | | | | | |
Total from investment operations | | | 0.20 | | | | 0.40 | | | | 0.36 | | | | 0.69 | | | | 0.72 | | | | 0.73 | | | | 0.56 | |
Distributions to shareholders from | | | | | | | | | | | | | | | | | | | | | | | | | | | | |
Net investment income | | | (0.12 | ) | | | (0.33 | ) | | | (0.09 | ) | | | (0.41 | ) | | | (0.44 | ) | | | (0.49 | ) | | | (0.50 | ) |
Net realized gains | | | (0.06 | ) | | | 0.00 | | | | 0.00 | | | | (0.09 | ) | | | (0.03 | ) | | | 0.00 | | | | 0.00 | |
| | | | | | | | | | | | | | | | | | | | | | | | | | | | |
Total distributions to shareholders | | | (0.18 | ) | | | (0.33 | ) | | | (0.09 | ) | | | (0.50 | ) | | | (0.47 | ) | | | (0.49 | ) | | | (0.50 | ) |
Net asset value, end of period | | $ | 11.26 | | | $ | 11.24 | | | $ | 11.17 | | | $ | 10.90 | | | $ | 10.71 | | | $ | 10.46 | | | $ | 10.22 | |
Total return3 | | | 1.83 | % | | | 3.72 | % | | | 3.28 | % | | | 6.53 | % | | | 7.02 | % | | | 7.26 | % | | | 5.55 | % |
Ratios to average net assets (annualized) | | | | | | | | | | | | | | | | | | | | | | | | | | | | |
Gross expenses | | | 0.89 | % | | | 0.88 | % | | | 0.90 | % | | | 0.94 | % | | | 0.94 | % | | | 1.16 | % | | | 1.23 | % |
Net expenses | | | 0.89 | % | | | 0.88 | % | | | 0.90 | % | | | 0.94 | % | | | 0.94 | % | | | 0.95 | % | | | 0.97 | % |
Net investment income | | | 1.68 | % | | | 2.25 | % | | | 2.10 | % | | | 2.66 | % | | | 3.65 | % | | | 4.48 | % | | | 4.59 | % |
Supplemental data | | | | | | | | | | | | | | | | | | | | | | | | | | | | |
Portfolio turnover rate | | | 135 | % | | | 268 | % | | | 89 | % | | | 194 | % | | | 368 | % | | | 263 | % | | | 159 | % |
Net assets, end of period (000’s omitted) | | | $675,838 | | | | $678,022 | | | | $1,146,356 | | | | $1,024,088 | | | | $1,134,770 | | | | $869,009 | | | | $733,191 | |
| 1. | For the three months ended August 31, 2010. The Fund changed its fiscal year end from May 31 to August 31, effective August 31, 2010. |
| 2. | Calculated based upon average shares outstanding |
| 3. | Returns for periods of less than one year are not annualized. |
The accompanying notes are an integral part of these financial statements.
| | | | | | |
| Notes to Financial Statements (Unaudited) | | Wells Fargo Advantage Government Securities Fund | | | 29 | |
1. ORGANIZATION
Wells Fargo Funds Trust (the “Trust”), a Delaware statutory trust organized on March 10, 1999, is an open-end management investment company registered under the Investment Company Act of 1940, as amended (the “1940 Act”). These financial statements report on Wells Fargo Advantage Government Securities Fund (the “Fund”) which is a diversified series of the Trust.
2. SIGNIFICANT ACCOUNTING POLICIES
The following significant accounting policies, which are consistently followed in the preparation of the financial statements of the Fund, are in conformity with U.S. generally accepted accounting principles which require management to make estimates and assumptions that affect the reported amounts of assets and liabilities, disclosure of contingent assets and liabilities at the date of the financial statements, and the reported amounts of revenues and expenses during the reporting period. Actual results could differ from those estimates.
Securities valuation
Fixed income securities with original maturities exceeding 60 days are valued based on evaluated prices received from an independent pricing service approved by the Board of Trustees which may utilize both transaction data and market information such as yield, prices of securities of comparable quality, coupon rate, maturity, type of issue, trading characteristics and other market data. If valuations are not available from the pricing service or values received are deemed not representative of market value, values will be obtained from a third party broker-dealer or determined based on the Fund’s Fair Value Procedures.
Debt securities of sufficient credit quality with original maturities of 60 days or less generally are valued at amortized cost which approximates fair value. The amortized cost method involves valuing a security at its cost, plus accretion of discount or minus amortization of premium over the period until maturity.
Investments in open-end mutual funds and non-registered investment companies are generally valued at net asset value.
Investments which are not valued using any of the methods discussed above, are valued at their fair value, as determined by procedures established in good faith and approved by the Board of Trustees.
Security loans
The Fund may lend its securities from time to time in order to earn additional income in the form of fees or interest on securities received as collateral or the investment of any cash received as collateral. The Fund continues to receive interest or dividends on the securities loaned. The Fund receives collateral in the form of cash or securities with a value at least equal to the value of the securities on loan. The value of the loaned securities is determined at the close of each business day and any additional required collateral is delivered to the Fund on the next business day. In a securities lending transaction, the net asset value of the Fund will be affected by an increase or decrease in the value of the securities loaned and by an increase or decrease in the value of the instrument in which collateral is invested. The amount of securities lending activity undertaken by the Fund fluctuates from time to time. In the event of default or bankruptcy by the borrower, the Fund may be prevented from recovering the loaned securities or gaining access to the collateral or may experience delays or costs in doing so. In addition, the investment of any cash collateral received may lose all or part of its value. The Fund has the right under the lending agreement to recover the securities from the borrower on demand.
The Fund lends its securities through an unaffiliated securities lending agent. Cash collateral received in connection with its securities lending transactions is invested in Wells Fargo Securities Lending Cash Investments, LLC (the “Cash Collateral Fund”). The Cash Collateral Fund is exempt from registration under Section 3(c)(7) of the 1940 Act and is managed by Wells Fargo Funds Management LLC (“Funds Management”) and is sub-advised by Wells Capital Management Incorporated (“Wells Capital Management”). Funds Management receives an advisory fee starting at 0.05% and declining to 0.01% as the average daily net assets of the Cash Collateral Fund increase. All of the fees received by Funds Management are paid to Wells Capital Management for its services as sub-adviser. The Cash Collateral Fund seeks to provide a positive return compared to the daily Fed Funds Open rate by investing in high-quality, U.S. dollar-denominated short-term money market instruments. Cash Collateral Fund investments are fair valued based upon the amortized cost valuation technique. Income earned from investment in the Cash Collateral Fund is included in securities lending income on the Statement of Operations.
| | | | |
| 30 | | Wells Fargo Advantage Government Securities Fund | | Notes to Financial Statements (Unaudited) |
For Wells Fargo Advantage Funds that participated in securities lending activity prior to February 13, 2009, certain structured investment vehicles purchased in a joint account by the former securities lending agent defaulted or were impaired. Certain of the Wells Fargo Advantage Funds still hold ownership interest in these structured investment vehicles, which have since been restructured as pass-through securities. If the Fund holds an ownership interest in such pass-through securities, information regarding this ownership interest can be found in the Portfolio of Investments under the category “Other”.
When-issued transactions
The Fund may purchase securities on a forward commitment or ‘when-issued’ basis. The Fund records a when-issued transaction on the trade date and will segregate assets to cover its obligation by confirming the availability of qualifying assets having a value sufficient to make payment for the securities purchased. Securities purchased on a when-issued basis are marked-to-market daily and the Fund begins earning interest on the settlement date. Losses may arise due to changes in the market value of the underlying securities or if the counterparty does not perform under the contract.
Futures contracts
The Fund may be subject to interest rate risk in the normal course of pursuing its investment objectives. The Fund may buy and sell futures contracts in order to gain exposure to, or protect against, changes in security values and interest rates. The primary risks associated with the use of futures contracts are the imperfect correlation between changes in market values of securities held by the Fund and the prices of futures contracts, and the possibility of an illiquid market.
Futures contracts are valued based upon their quoted daily settlement prices when available. The aggregate principal amounts of the contracts are not recorded in the financial statements. Fluctuations in the value of the contracts are recorded in the Statement of Assets and Liabilities as an asset or liability and in the Statement of Operations as unrealized gains or losses until the contracts are closed, at which point they are recorded as net realized gains or losses on futures contracts. With futures contracts, there is minimal counterparty risk to the Fund since futures are exchange traded and the exchange’s clearinghouse, as counterparty to all exchange traded futures, guarantees the futures against default.
Mortgage dollar roll transactions
The Fund may engage in mortgage dollar roll transactions with respect to mortgage-backed securities issued by Government National Mortgage Association (GNMA), Federal National Mortgage Association (FNMA) and Federal Home Loan Mortgage Corporation (FHLMC). In a mortgage dollar roll transaction, the Fund sells a mortgage-backed security to a financial institution, such as a bank or broker-dealer and simultaneously agrees to repurchase a substantially similar security from the institution at a later date at an agreed upon price. The mortgage-backed securities that are repurchased will bear the same interest rate as those sold, but generally will be collateralized by different pools of mortgages with different pre-payment histories. During the roll period, the Fund foregoes principal and interest paid on the securities. The Fund is compensated by the difference between the current sales price and the forward price for the future purchase as well as by the earnings on the cash proceeds of the initial sale. Mortgage dollar rolls may be renewed without physical delivery of the securities subject to the contract. The Funds account for TBA dollar roll transactions as purchases and sales.
Security transactions and income recognition
Securities transactions are recorded on a trade date basis. Realized gains or losses are reported on the basis of identified cost of securities delivered.
Interest income is accrued daily and bond discounts are accreted and premiums are amortized daily based on the effective interest method. To the extent debt obligations are placed on non-accrual status, any related interest income may be reduced by writing off interest receivables when the collection of all or a portion of interest has become doubtful based on consistently applied procedures. If the issuer subsequently resumes interest payments or when the collectability of interest is reasonably assured, the debt obligation is removed from non-accrual status.
Distributions to shareholders
Distributions to shareholders from net investment income are accrued daily and paid monthly. Distributions from net realized gains, if any, are recorded on the ex-dividend date. Such distributions are determined in conformity with income tax regulations, which may differ from generally accepted accounting principles.
| | | | | | |
| Notes to Financial Statements (Unaudited) | | Wells Fargo Advantage Government Securities Fund | | | 31 | |
Federal and other taxes
The Fund intends to continue to qualify as a regulated investment company by distributing substantially all of its investment company taxable income and any net realized capital gains (after reduction for capital loss carryforwards) sufficient to relieve it from all, or substantially all, federal income taxes. Accordingly, no provision for federal income taxes was required.
The Fund’s income and federal excise tax returns and all financial records supporting those returns for the prior three fiscal years are subject to examination by the federal and Delaware revenue authorities.
Under the recently enacted Regulated Investment Company Modernization Act of 2010, the Fund is permitted to carry forward capital losses incurred in taxable years which began after December 22, 2010 for an unlimited period. However, any losses incurred are required to be utilized prior to the losses incurred in pre-enactment taxable years. As a result of this ordering rule, pre-enactment capital loss carryforwards may be more likely to expire unused. Additionally, post-enactment capital losses that are carried forward will retain their character as either short-term or long-term capital losses rather than being considered all short-term as under previous law.
As of August 31, 2011, the Fund had net capital loss carryforwards, which were available to offset future net realized capital gains, in the amount of $50,306,986 with $22,887,731 expiring in 2015, $3,431,622 expiring in 2016 and $23,987,633 expiring in 2017.
As of August 31, 2011, the Fund had $2,517,298 of current year deferred post-October capital losses, which would be treated as realized for tax purposes on the first day of the succeeding year.
Class allocations
The separate classes of shares offered by the Fund differ principally in applicable sales charges, distribution, shareholder servicing and administration fees. Shareholders of each class bear certain expenses that pertain to that particular class. All shareholders bear the common expenses of the Fund, earn income from the portfolio, and are allocated unrealized gains and losses pro rata based on the average daily net assets of each class, without distinction between share classes. Dividends are determined separately for each class based on income and expenses allocable to each class. Realized gains and losses are allocated to each class pro rata based upon the net assets of each class on the date realized. Differences in per share dividend rates generally result from the relative weightings of pro rata income and realized gain allocations and from differences in separate class expenses, including distribution, shareholder servicing and administration fees.
3. FAIR VALUATION MEASUREMENTS
Fair value measurements of investments are determined within a framework that has established a fair value hierarchy based upon the various data inputs utilized in determining the value of the Fund’s investments. The three-level hierarchy gives the highest priority to unadjusted quoted prices in active markets for identical assets or liabilities (Level 1) and the lowest priority to significant unobservable inputs (Level 3). The Fund’s investments are classified within the fair value hierarchy based on the lowest level of input that is significant to the fair value measurement. The inputs are summarized into three broad levels as follows:
| n | | Level 1 – quoted prices in active markets for identical securities |
| n | | Level 2 – other significant observable inputs (including quoted prices for similar securities, interest rates, prepayment speeds, credit risk, etc.) |
| n | | Level 3 – significant unobservable inputs (including the Fund’s own assumptions in determining the fair value of investments) |
The inputs or methodologies used for valuing securities are not necessarily an indication of the risk associated with investing in those securities.
| | | | |
| 32 | | Wells Fargo Advantage Government Securities Fund | | Notes to Financial Statements (Unaudited) |
As of February 29, 2012, the inputs used in valuing the Fund’s assets, which are carried at fair value, were as follows:
| | | | | | | | | | | | | | | | |
| Investments in Securities | | Quoted Prices (Level 1) | | | Significant Other
Observable Inputs (Level 2) | | | Significant Unobservable Inputs (Level 3) | | | Total | |
| | | | |
Agency securities | | $ | 0 | | | $ | 1,363,681,228 | | | $ | 304,663 | | | $ | 1,363,985,891 | |
| | | | |
Corporate bonds and notes | | | 0 | | | | 171 | | | | 0 | | | | 171 | |
| | | | |
Municipal bonds and notes | | | 0 | | | | 8,914,854 | | | | 0 | | | | 8,914,854 | |
| | | | |
Non-agency mortgage backed securities | | | 0 | | | | 100,912,509 | | | | 0 | | | | 100,912,509 | |
| | | | |
U.S. Treasury securities | | | 483,122,584 | | | | 0 | | | | 0 | | | | 483,122,584 | |
| | | | |
Yankee corporate bonds and notes | | | 0 | | | | 159,672,732 | | | | 0 | | | | 159,672,732 | |
| | | | |
Other | | | 0 | | | | 0 | | | | 7,206,128 | | | | 7,206,128 | |
| | | | |
Short-term investments | | | | | | | | | | | | | | | | |
U.S. Treasury securities | | | 599,965 | | | | 0 | | | | 0 | | | | 599,965 | |
Investment companies | | | 537,572,549 | | | | 31,466,405 | | | | 0 | | | | 569,038,954 | |
| | | $ | 1,021,295,098 | | | $ | 1,664,647,899 | | | $ | 7,510,791 | | | $ | 2,693,453,788 | |
Further details on the major security types listed above can be found in the Portfolio of Investments.
As of February 29, 2012, the inputs used in valuing the Fund’s other financial instruments, which are carried at fair value, were as follows:
| | | | | | | | | | | | | | | | |
| Other financial instruments | | Quoted Prices (Level 1) | | | Significant Other
Observable Inputs (Level 2) | | | Significant Unobservable Inputs (Level 3) | | | Total | |
Futures contracts+ | | $ | (41,329 | ) | | $ | 0 | | | $ | 0 | | | $ | (41,329 | ) |
| + | Futures contracts are presented at the unrealized gains or losses on the instrument. |
Transfers in and transfers out are recognized at the end of the reporting period. For the six months ended February 29, 2012, the Fund did not have any significant transfers into/out of Level 1 and Level 2.
The following is a reconciliation of assets in which significant unobservable inputs (Level 3) were used in determining fair value:
| | | | | | | | | | | | |
| | | Agency
Securities | | | Other | | | Total | |
Balance as of August 31, 2011 | | $ | 473,364 | | | $ | 9,842,490 | | | $ | 10,315,854 | |
Accrued discounts (premiums) | | | 0 | | | | 0 | | | | 0 | |
Realized gains (losses) | | | (236,413 | ) | | | 0 | | | | (236,413 | ) |
Change in unrealized gains (losses) | | | 222,530 | | | | (1,505,235 | ) | | | (1,282,705 | ) |
Purchases | | | 0 | | | | 0 | | | | 0 | |
Sales | | | (154,818 | ) | | | (1,131,127 | ) | | | (1,285,945 | ) |
Transfers into Level 3 | | | 0 | | | | 0 | | | | 0 | |
Transfers out of Level 3 | | | 0 | | | | 0 | | | | 0 | |
Balance as of February 29, 2012 | | $ | 304,663 | | | $ | 7,206,128 | | | $ | 7,510,791 | |
Change in unrealized gains (losses)
relating to securities still held at February 29, 2012 | | $ | (9,614 | ) | | $ | (2,059,582 | ) | | $ | (2,069,196 | ) |
4. TRANSACTIONS WITH AFFILIATES AND OTHER EXPENSES
Advisory fee
The Trust has entered into an advisory contract with Funds Management, an indirect wholly owned subsidiary of Wells Fargo & Company (“Wells Fargo”). The adviser is responsible for implementing investment policies and guidelines and for supervising the sub-adviser, who is responsible for day-to-day portfolio management of the Fund.
| | | | | | |
| Notes to Financial Statements (Unaudited) | | Wells Fargo Advantage Government Securities Fund | | | 33 | |
Pursuant to the contract, Funds Management is entitled to receive an annual advisory fee starting at 0.40% and declining to 0.30% as the average daily net assets of the Fund increase. For the six months ended February 29, 2012, the advisory fee was equivalent to an annual rate of 0.37% of the Fund’s average daily net assets.
Funds Management has retained the services of certain sub-advisers to provide daily portfolio management to the Fund. The fees related to sub-advisory services are borne directly by Funds Management and do not increase the overall fees paid by the Fund. Wells Capital Management, an affiliate of Funds Management, is the sub-adviser to the Fund and is entitled to receive a fee from Funds Management at an annual rate starting at 0.20% and declining to 0.10% as the average daily net assets of the Fund increase.
Administration and transfer agent fees
The Trust has entered into an administration agreement with Funds Management. Under this agreement, for providing administrative services, which includes paying fees and expenses for services provided by the transfer agent, sub-transfer agents, omnibus account servicers and record-keepers, Funds Management is entitled to receive from the Fund an annual fund level administration fee starting at 0.05% and declining to 0.03% as the average daily net assets of the Fund increase and a class level administration fee which is calculated based on the average daily net assets of each class as follows:
| | | | |
| | | Class Level Administration Fee | |
Class A, Class B, Class C | | | 0.16 | % |
Administrator Class | | | 0.10 | |
Institutional Class | | | 0.08 | |
Investor Class | | | 0.19 | |
Funds Management has contractually waived and/or reimbursed advisory and administration fees to the extent necessary to maintain certain net operating expense ratios for the Fund. Waiver of fees and/or reimbursement of expenses by Funds Management were made first from fund level expenses on a proportionate basis and then from class specific expenses. Funds Management has committed through July 11, 2013 to waive fees and/or reimburse expenses to the extent necessary to cap the Fund’s expenses at 0.87% for Class A, 1.62% for Class B, 1.62% for Class C, 0.64% for Administrator Class, 0.48% for Institutional Class and 0.90% for Investor Class.
Distribution fees
The Trust has adopted a Distribution Plan for Class B and Class C shares of the Fund pursuant to Rule 12b-1 under the 1940 Act. Distribution fees are charged to Class B and Class C shares and paid to Wells Fargo Funds Distributor, LLC, the principal underwriter, at an annual rate of 0.75% of the average daily net assets of Class B and Class C shares.
For the six months ended February 29, 2012, Wells Fargo Funds Distributor, LLC received $15,971 from the sale of Class A shares and $4,580, $2,783 and $797 in contingent deferred sales charges from redemptions of Class A, Class B and Class C shares, respectively.
Shareholder servicing fees
The Trust has entered into contracts with one or more shareholder servicing agents, whereby Class A, Class B, Class C, Administrator Class and Investor Class of the Fund is charged a fee at an annual rate of 0.25% of the average daily net assets of each respective class.
A portion of these total shareholder servicing fees were paid to affiliates of Wells Fargo.
5. INVESTMENT PORTFOLIO TRANSACTIONS
Purchases and sales of investments, excluding short-term securities (securities with maturities of one year or less at purchase date), for the six months ended February 29, 2012 were as follows:
| | | | | | |
Purchases at Cost | | Sales Proceeds |
U.S.
Government | | Non-U.S.
Government | | U.S.
Government | | Non-U.S.
Government |
| $2,917,783,240 | | $78,344,251 | | $2,729,917,258 | | $104,878,182 |
| | | | |
| 34 | | Wells Fargo Advantage Government Securities Fund | | Notes to Financial Statements (Unaudited) |
6. DERIVATIVE TRANSACTIONS
During the six months ended February 29, 2012, the Fund entered into futures contracts to speculate on interest rates.
At February 29, 2012, the Fund had long and short futures contracts outstanding as follows:
| | | | | | | | | | | | | | | | |
| Expiration Date | | Contracts | | | Type | | | Contract Value at February 29, 2012 | | | Net Unrealized
Gains (Losses) | |
| June 2012 | | | 390 Long | | | | 5-Year U.S. Treasury Notes | | | $ | 48,037,031 | | | $ | 11,446 | |
| June 2012 | | | 364 Long | | | | 10-Year U.S. Treasury Notes | | | | 47,666,938 | | | | (56,582 | ) |
| June 2012 | | | 275 Short | | | | 2-Year U.S. Treasury Notes | | | | 60,564,453 | | | | 3,807 | |
The Fund had an average notional amount of $47,597,733 and $64,799,610 in long futures contracts and short futures contracts, respectively, during the six months ended February 29, 2012.
On February 29, 2012, the cumulative unrealized losses on futures contracts in the amount of $41,329 is reflected in net unrealized gains on investments on the Statement of Assets and Liabilities. The payable for daily variation margin on open futures contracts reflected in the Statement of Assets and Liabilities only represents the current day’s variation margin. The realized gains and change in unrealized gains (losses) on futures contracts are reflected in the Statement of Operations.
7. BANK BORROWINGS
The Trust (excluding the money market funds) and Wells Fargo Variable Trust are parties to a $150,000,000 revolving credit agreement with State Street Bank and Trust Company, whereby the Fund is permitted to use bank borrowings for temporary or emergency purposes, such as to fund shareholder redemption requests. Interest under the credit agreement is charged to the Fund based on a borrowing rate equal to the higher of the Federal Funds rate in effect on that day plus 1.25% or the overnight LIBOR rate in effect on that day plus 1.25%. In addition, an annual commitment fee equal to 0.10% of the unused balance is allocated to each participating fund. Prior to September 6, 2011, the revolving credit agreement was for $125,000,000 and the annual commitment fee paid by the Fund was 0.125% of the unused balance. For the six months ended February 29, 2012, the Fund paid $507 in commitment fees.
For the six months ended February 29, 2012, there were no borrowings by the Fund under the agreement.
8. INDEMNIFICATION
Under the Trust’s organizational documents, the officers and directors are indemnified against certain liabilities that may arise out of performance of their duties to the Trust. Additionally, in the normal course of business, the Trust may enter into contracts with service providers that contain a variety of indemnification clauses. The Trust’s maximum exposure under these arrangements is dependent on future claims that may be made against the Fund and, therefore, cannot be estimated.
9. NEW ACCOUNTING PRONOUNCEMENTS
In May 2011, the Financial Accounting Standards Board (“FASB”) issued Accounting Standards Update (“ASU”) No. 2011-04 “Amendments to Achieve Common Fair Value Measurement and Disclosure Requirements in U.S. GAAP and IFRSs”. ASU No. 2011-04 amends FASB ASC Topic 820, Fair Value Measurements and Disclosures, to establish common requirements for measuring fair value and for disclosing information about fair value measurements in accordance with GAAP. The ASU is effective prospectively for interim and annual periods beginning after December 15, 2011. Management expects that adoption of the ASU will result in additional disclosures in the financial statements, as applicable.
In April 2011, FASB issued ASU No. 2011-03 “Reconsideration of Effective Control for Repurchase Agreements”. ASU No. 2011-03 amends FASB ASC Topic 860, Transfers and Servicing, specifically the criteria required to determine whether a repurchase agreement (repo) and similar agreements should be accounted for as sales of financial assets or secured borrowings with commitments. ASU No. 2011-03 changes the assessment of effective control by focusing on the transferor’s contractual rights and obligations and removing the criterion to assess its ability to exercise those rights or
| | | | | | |
| Notes to Financial Statements (Unaudited) | | Wells Fargo Advantage Government Securities Fund | | | 35 | |
honor those obligations. This could result in changes to the way entities account for certain transactions including repurchase agreements, mortgage dollar rolls and reverse repurchase agreements. The ASU will become effective on a prospective basis for new transfers and modifications to existing transactions as of the beginning of the first interim or annual period beginning on or after December 15, 2011. Management has evaluated the impact of adopting the ASU and expects no significant changes.
| | | | |
| 36 | | Wells Fargo Advantage Government Securities Fund | | Other Information (Unaudited) |
PROXY VOTING INFORMATION
A description of the policies and procedures that the Fund uses to determine how to vote proxies relating to portfolio securities is available without charge, upon request, by calling 1-800-222-8222, visiting our Web site at wellsfargoadvantagefunds.com, or visiting the SEC Web site at sec.gov. Information regarding how the Fund voted proxies relating to portfolio securities during the most recent 12-month period ended June 30 is available without charge on the Fund’s Web site at wellsfargoadvantagefunds.com or by visiting the SEC Web site at sec.gov.
PORTFOLIO HOLDINGS INFORMATION
The complete portfolio holdings for the Fund are publicly available on the Fund’s Web site (wellsfargoadvantagefunds.com) on a monthly, 30-day or more delayed basis. In addition, top ten holdings information for the Fund is publicly available on the Fund’s Web site on a monthly, seven-day or more delayed basis. The Fund files its complete schedule of portfolio holdings with the SEC for the first and third quarters of each fiscal year on Form N-Q, which is available without charge by visiting the SEC Web site at sec.gov. In addition, the Fund’s Form N-Q may be reviewed and copied at the SEC’s Public Reference Room in Washington, DC, and at regional offices in New York City, at 233 Broadway, and in Chicago, at 175 West Jackson Boulevard, Suite 900. Information about the Public Reference Room may be obtained by calling 1-800-SEC-0330.
| | | | | | |
| Other Information (Unaudited) | | Wells Fargo Advantage Government Securities Fund | | | 37 | |
BOARD OF TRUSTEES
The following table provides basic information about the Board of Trustees (the “Trustees”) of the Trust and Officers of the Trust. This table should be read in conjunction with the Prospectus and the Statement of Additional Information1 of the Fund. Each of the Trustees and Officers listed below acts in identical capacities for the Wells Fargo Advantage family of funds, which consists of 137 funds comprising the Wells Fargo Funds Trust, Wells Fargo Variable Trust, Wells Fargo Master Trust and four closed-end funds (collectively the “Fund Complex”). All of the Trustees are also Members of the Audit and Governance Committees of each Trust in the Fund Complex. The mailing address of each Trustee and Officer is 525 Market Street, 12th Floor, San Francisco, CA 94105. Each Trustee and Officer serves an indefinite term, however, each Trustee serves such term until reaching the mandatory retirement age established by the Trustees.
Independent Trustees
| | | | | | |
Name and Year of Birth | | Position Held and Length of Service | | Principal Occupations During Past Five Years | | Other Directorships During
Past Five Years |
Peter G. Gordon
(Born 1942) | | Trustee, since 1998; Chairman, since 2005 (Lead Trustee since 2001) | | Co-Founder, Retired Chairman, President and CEO of Crystal Geyser Water Company. Trustee Emeritus, Colby College | | Asset Allocation Trust |
Isaiah Harris, Jr.
(Born 1952) | | Trustee, since 2009 | | Retired. Prior thereto, President and CEO of BellSouth Advertising and Publishing Corp. from 2005 to 2007, President and CEO of BellSouth Enterprises from 2004 to 2005 and President of BellSouth Consumer Services from 2000 to 2003. Emeritus member of the Iowa State University Foundation Board of Governors. Emeritus Member of the Advisory Board of Iowa State University School of Business. Mr. Harris is a certified public accountant. | | CIGNA Corporation; Deluxe Corporation; Asset Allocation Trust |
Judith M. Johnson
(Born 1949) | | Trustee, since 2008 | | Retired. Prior thereto, Chief Executive Officer and Chief Investment Officer of Minneapolis Employees Retirement Fund from 1996 to 2008. Ms. Johnson is an attorney, certified public accountant and a certified managerial accountant. | | Asset Allocation Trust |
Leroy Keith, Jr.
(Born 1939) | | Trustee, since 2010 | | Chairman, Bloc Global Services (development and construction). Trustee of the Evergreen Funds from 1983 to 2010. Former Managing Director, Almanac Capital Management (commodities firm), former Partner, Stonington Partners, Inc. (private equity fund), former Director, Obagi Medical Products Co. and former Director, Lincoln Educational Services. | | Trustee, Virtus Fund Complex (consisting of 40 portfolios as of 12/31/11); Asset Allocation Trust |
David F. Larcker
(Born 1950) | | Trustee, since 2009 | | James Irvin Miller Professor of Accounting at the Graduate School of Business, Stanford University, Director of Corporate Governance Research Program and Senior Faculty of The Rock Center for Corporate Governance since 2006. From 2005 to 2008, Professor of Accounting at the Graduate School of Business, Stanford University. Prior thereto, Ernst & Young Professor of Accounting at The Wharton School, University of Pennsylvania from 1985 to 2005. | | Asset Allocation Trust |
Olivia S. Mitchell
(Born 1953) | | Trustee, since 2006 | | International Foundation of Employee Benefit Plans Professor, Wharton School of the University of Pennsylvania since 1993. Director of Wharton’s Pension Research Council and Boettner Center on Pensions & Retirement Research, and Research Associate at the National Bureau of Economic Research. Previously, Cornell University Professor from 1978 to 1993. | | Asset Allocation Trust |
| | | | |
| 38 | | Wells Fargo Advantage Government Securities Fund | | Other Information (Unaudited) |
| | | | | | |
Name and Year of Birth | | Position Held and Length of Service | | Principal Occupations During Past Five Years | | Other Directorships During
Past Five Years |
Timothy J. Penny
(Born 1951) | | Trustee, since 1996 | | President and CEO of Southern Minnesota Initiative Foundation, a non-profit organization, since 2007 and Senior Fellow at the Humphrey Institute Policy Forum at the University of Minnesota since 1995. Member of the Board of Trustees of NorthStar Education Finance, Inc., a non-profit organization, since 2007. | | Asset Allocation Trust |
Michael S. Scofield
(Born 1943) | | Trustee, since 2010 | | Served on the Investment Company Institute’s Board of Governors and Executive Committee from 2008-2011 as well the Governing Council of the Independent Directors Council from 2006-2011 and the Independent Directors Council Executive Committee from 2008-2011. Chairman of the IDC from 2008-2010. Institutional Investor (Fund Directions) Trustee of Year in 2007. Trustee of the Evergreen Funds (and its predecessors) from 1984 to 2010. Chairman of the Evergreen Funds from 2000-2010. Former Trustee of the Mentor Funds. Retired Attorney, Law Offices of Michael S. Scofield and former Director and Chairman, Branded Media Corporation (multi-media branding company). | | Asset Allocation Trust |
Donald C. Willeke
(Born 1940) | | Trustee, since 1996 | | Principal of the law firm of Willeke & Daniels. General Counsel of the Minneapolis Employees Retirement Fund from 1984 until its consolidation into the Minnesota Public Employees Retirement Association on June 30, 2010. Director and Vice Chair of The Free Trust (non-profit corporation). Director of the American Chestnut Foundation (non-profit corporation). | | Asset Allocation Trust |
Officers
| | | | | | |
Name and Year of Birth | | Position Held and
Length of Service | | Principal Occupations During Past Five Years | | |
Karla M. Rabusch
(Born 1959) | | President, since 2003 | | Executive Vice President of Wells Fargo Bank, N.A. and President of Wells Fargo Funds Management, LLC since 2003. Senior Vice President and Chief Administrative Officer of Wells Fargo Funds Management, LLC from 2001 to 2003. | | |
C. David Messman
(Born 1960) | | Secretary, since 2000; Chief Legal Counsel, since 2003 | | Senior Vice President and Secretary of Wells Fargo Funds Management, LLC since 2001. Vice President and Managing Senior Counsel of Wells Fargo Bank, N.A. since 1996. | | |
Kasey Phillips
(Born 1970) | | Treasurer, since 2009 | | Senior Vice President of Wells Fargo Funds Management, LLC since 2009. Senior Vice President of Evergreen Investment Management Company, LLC from 2006 to 2010. Treasurer of the Evergreen Funds from 2005 to 2010. | | |
David Berardi
(Born 1975) | | Assistant Treasurer, since 2009 | | Vice President of Wells Fargo Funds Management, LLC since 2009. Vice President of Evergreen Investment Management Company, LLC from 2008 to 2010. Assistant Vice President of Evergreen Investment Services, Inc. from 2004 to 2008. Manager of Fund Reporting and Control for Evergreen Investment Management Company, LLC from 2004 to 2010. | | |
Jeremy DePalma
(Born 1974) | | Assistant Treasurer, since 2009 | | Senior Vice President of Wells Fargo Funds Management, LLC since 2009. Senior Vice President of Evergreen Investment Management Company, LLC from 2008 to 2010. Vice President, Evergreen Investment Services, Inc. from 2004 to 2007. Head of the Fund Reporting and Control Team within Fund Administration from 2005 to 2010. | | |
Debra Ann Early
(Born 1964) | | Chief Compliance Officer, since 2007 | | Chief Compliance Officer of Wells Fargo Funds Management, LLC since 2007. Chief Compliance Officer of Parnassus Investments from 2005 to 2007. Chief Financial Officer of Parnassus Investments from 2004 to 2007 and Senior Audit Manager of PricewaterhouseCoopers LLP from 1998 to 2004. | | |
| 1. | The Statement of Additional Information includes additional information about the Trustees and is available, without charge, upon request, by calling 1-800-222-8222 or by visiting the Web site at wellsfargoadvantagefunds.com. |
| | | | | | |
| List of Abbreviations | | Wells Fargo Advantage Government Securities Fund | | | 39 | |
The following is a list of common abbreviations for terms and entities which may have appeared in this report.
| ACB | — Agricultural Credit Bank |
| ADR | — American Depository Receipt |
| ADS | — American Depository Shares |
| AGC-ICC | — Assured Guaranty Corporation - Insured Custody Certificates |
| AGM | — Assured Guaranty Municipal |
| AMBAC | — American Municipal Bond Assurance Corporation |
| AMT | — Alternative Minimum Tax |
| BAN | — Bond Anticipation Notes |
| BHAC | — Berkshire Hathaway Assurance Corporation |
| CAB | — Capital Appreciation Bond |
| CCAB | — Convertible Capital Appreciation Bond |
| CDA | — Community Development Authority |
| CDO | — Collateralized Debt Obligation |
| COP | — Certificate of Participation |
| DRIVER | — Derivative Inverse Tax-Exempt Receipts |
| DW&P | — Department of Water & Power |
| DWR | — Department of Water Resources |
| ECFA | — Educational & Cultural Facilities Authority |
| EDA | — Economic Development Authority |
| EDFA | — Economic Development Finance Authority |
| ETF | — Exchange-Traded Fund |
| FFCB | — Federal Farm Credit Bank |
| FGIC | — Financial Guaranty Insurance Corporation |
| FHA | — Federal Housing Authority |
| FHLB | — Federal Home Loan Bank |
| FHLMC | — Federal Home Loan Mortgage Corporation |
| FICO | — The Financing Corporation |
| FNMA | — Federal National Mortgage Association |
| GDR | — Global Depository Receipt |
| GNMA | — Government National Mortgage Association |
| HCFR | — Healthcare Facilities Revenue |
| HEFA | — Health & Educational Facilities Authority |
| HEFAR | — Higher Education Facilities Authority Revenue |
| HFA | — Housing Finance Authority |
| HFFA | — Health Facilities Financing Authority |
| IBC | — Insured Bond Certificate |
| IDA | — Industrial Development Authority |
| IDAG | — Industrial Development Agency |
| IDR | — Industrial Development Revenue |
| KRW | — Republic of Korea Won |
| LIBOR | — London Interbank Offered Rate |
| LLC | — Limited Liability Company |
| LLP | — Limited Liability Partnership |
| MBIA | — Municipal Bond Insurance Association |
| MFHR | — Multi-Family Housing Revenue |
| MSTR | — Municipal Securities Trust Receipts |
| MUD | — Municipal Utility District |
| NATL-RE | — National Public Finance Guarantee Corporation |
| PCFA | — Pollution Control Finance Authority |
| PCR | — Pollution Control Revenue |
| PFA | — Public Finance Authority |
| PFFA | — Public Facilities Financing Authority |
| PFOTER | — Puttable Floating Option Tax-Exempt Receipts |
| plc | — Public Limited Company |
| PUTTER | — Puttable Tax-Exempt Receipts |
| R&D | — Research & Development |
| RDA | — Redevelopment Authority |
| RDFA | — Redevelopment Finance Authority |
| REIT | — Real Estate Investment Trust |
| ROC | — Reset Option Certificates |
| SAVRS | — Select Auction Variable Rate Securities |
| SBA | — Small Business Authority |
| SFHR | — Single Family Housing Revenue |
| SFMR | — Single Family Mortgage Revenue |
| SPDR | — Standard & Poor’s Depositary Receipts |
| STRIPS | — Separate Trading of Registered Interest and Principal Securities |
| TAN | — Tax Anticipation Notes |
| TIPS | — Treasury Inflation-Protected Securities |
| TRAN | — Tax Revenue Anticipation Notes |
| TCR | — Transferable Custody Receipts |
| TTFA | — Transportation Trust Fund Authority |
| TVA | — Tennessee Valley Authority |
| XLCA | — XL Capital Assurance |
This page is intentionally left blank.
This page is intentionally left blank.
This page is intentionally left blank.


FOR MORE INFORMATION
More information about Wells Fargo Advantage Funds is available free upon request. To obtain literature, please write, e-mail, visit the Fund’s Web site, or call:
Wells Fargo Advantage Funds
P.O. Box 8266
Boston, MA 02266-8266
E-mail: wfaf@wellsfargo.com
Web site: wellsfargoadvantagefunds.com
Individual investors: 1-800-222-8222
Retail investment professionals: 1-888-877-9275
Institutional investment professionals: 1-866-765-0778
This report and the financial statements contained herein are submitted for the general information of the shareholders of Wells Fargo Advantage Funds. If this report is used for promotional purposes, distribution of the report must be accompanied or preceded by a current prospectus. For a prospectus containing more complete information, including charges and expenses, call 1-800-222-8222 or visit the Fund’s Web site at wellsfargoadvantagefunds.com. Please consider the investment objectives, risks, charges, and expenses of the investment carefully before investing. This and other information about Wells Fargo Advantage Funds can be found in the current prospectus. Read the prospectus carefully before you invest or send money.
Wells Fargo Funds Management, LLC, a wholly owned subsidiary of Wells Fargo & Company, provides investment advisory and administrative services for Wells Fargo Advantage Funds. Other affiliates of Wells Fargo & Company provide subadvisory and other services for the Funds. The Funds are distributed by Wells Fargo Funds Distributor, LLC, Member FINRA/SIPC, an affiliate of Wells Fargo & Company.
NOT FDIC INSURED ¡ NO BANK GUARANTEE ¡ MAY LOSE VALUE
© 2012 Wells Fargo Funds Management, LLC. All rights reserved.
| | |
 | | 208521 04-12 SA216/SAR216 2-12 |

Wells Fargo Advantage High Income Fund

Semi-Annual Report
February 29, 2012

Reduce clutter. Save trees.
Sign up for electronic delivery of prospectuses and shareholder reports at wellsfargo.com/advantagedelivery
Contents
The views expressed and any forward-looking statements are as of February 29, 2012, unless otherwise noted, and are those of the Fund managers and/or Wells Fargo Funds Management, LLC. Discussions of individual securities, or the markets generally, or any Wells Fargo Advantage Fund are not intended as individual recommendations. Future events or results may vary significantly from those expressed in any forward-looking statements; the views expressed are subject to change at any time in response to changing circumstances in the market. Wells Fargo Funds Management, LLC, disclaims any obligation to publicly update or revise any views expressed or forward-looking statements.
NOT FDIC INSURED ¡ NO BANK GUARANTEE ¡ MAY LOSE VALUE

WELLS FARGO INVESTMENT HISTORY
| | |
| |
| 1932 | | Keystone creates one of the first mutual fund families. |
| |
| 1971 | | Wells Fargo & Company introduces one of the first institutional index funds. |
| |
| 1978 | | Wells Fargo applies Markowitz and Sharpe’s research on Modern Portfolio Theory to introduce one of the industry’s first Tactical Asset Allocation (TAA) models in institutional separately managed accounts. |
| |
| 1984 | | Wells Fargo Stagecoach Funds launches its first asset allocation fund. |
| |
| 1989 | | The Tactical Asset Allocation (TAA) Model is first applied to Wells Fargo’s asset allocation mutual funds. |
| |
| 1994 | | Wells Fargo introduces the LifePath Funds, one of the first suites of target date funds (now the Wells Fargo Advantage Dow Jones Target Date FundsSM). |
| |
| 1996 | | Evergreen Investments and Keystone Funds merge. |
| |
| 1997 | | Wells Fargo launches Wells Fargo Advantage WealthBuilder PortfoliosSM, a fund-of-funds suite of products that includes the use of quantitative models to shift assets among investment styles. |
| |
| 1999 | | Norwest Advantage Funds and Stagecoach Funds are reorganized into Wells Fargo Funds after the merger of Norwest and Wells Fargo. |
| |
| 2002 | | Evergreen Retail and Evergreen Institutional companies form the umbrella asset management company, Evergreen Investments. |
| |
| 2005 | | The integration of Strong Funds with Wells Fargo Funds creates Wells Fargo Advantage Funds, resulting in one of the top 20 mutual fund companies in the United States. |
| |
| 2006 | | Wells Fargo Advantage Funds relaunches the target date product line as Wells Fargo Advantage Dow Jones Target Date Funds. |
| |
| 2010 | | The mergers and reorganizations of Evergreen and Wells Fargo Advantage mutual funds are completed, unifying the families under the brand of Wells Fargo Advantage Funds. |
Wells Fargo Advantage Funds®
Wells Fargo Advantage Funds skillfully guides institutions, financial advisors, and individuals through the investment terrain to help them reach their financial objectives. Everything we do on behalf of investors is backed by our unique combination of qualifications.
Strength
Our organization is built on the standards of integrity and service established by our parent company—Wells Fargo & Company—more than 150 years ago. And, because we’re part of a highly diversified financial enterprise, we offer the depth of resources to help investors succeed.
Expertise
Our multi-boutique model offers investors access to the independent thinking of premier investment managers that have been chosen for their time-tested strategies. While each team specializes in a specific investment strategy, collectively they provide investors a wide choice of distinct investment styles. Our dedication to investment excellence doesn’t end with our expertise in manager selection—risk management, analysis, and rigorous ongoing review seek to ensure each manager’s investment process remains consistent.
Partnership
Our collaborative approach is built around understanding the needs and goals of our clients. By adhering to core principles of sound judgment and steady guidance, we support you through every stage of the investment decision process.
Carefully consider a fund’s investment objectives, risks, charges, and expenses before investing. For a current prospectus and, if available, a summary prospectus, containing this and other information, visit wellsfargoadvantagefunds.com. Read it carefully before investing.
Wells Fargo Funds Management, LLC, a wholly owned subsidiary of Wells Fargo & Company, provides investment advisory and administrative services for Wells Fargo Advantage Funds®. Other affiliates of Wells Fargo & Company provide subadvisory and other services for the Funds. The Funds are distributed by Wells Fargo Funds Distributor, LLC, Member FINRA/SIPC, an affiliate of Wells Fargo & Company.
“Dow Jones®” and “Dow Jones Target Date IndexesSM” are service marks of Dow Jones Trademark Holdings, LLC (“Dow Jones”), have been licensed to CME Group Index Services LLC (“CME Indexes”) and have been sublicensed for use for certain purposes by Global Index Advisors, Inc, and Wells Fargo Funds Management, LLC. The Wells Fargo Advantage Dow Jones Target Date FundsSM based on the Dow Jones Target Date IndexesSM, are not sponsored, endorsed, sold or promoted by Dow Jones, CME Indexes or their respective affiliates and none of them makes any representation regarding the advisability of investing in such product(s).
NOT FDIC INSURED ¡ NO BANK GUARANTEE ¡ MAY LOSE VALUE
Not part of the semi-annual report.
Wells Fargo Advantage Funds offers more than 110 mutual funds across a wide range of asset classes, representing over $218 billion in assets under management, as of February 29, 2012.
| | | | |
| Equity Funds | | | | |
Asia Pacific Fund | | Equity Value Fund | | Precious Metals Fund |
C&B Large Cap Value Fund | | Global Opportunities Fund | | Premier Large Company Growth Fund |
C&B Mid Cap Value Fund | | Growth Fund | | Small Cap Opportunities Fund |
Capital Growth Fund | | Index Fund | | Small Cap Value Fund |
Common Stock Fund | | International Equity Fund | | Small Company Growth Fund |
Disciplined U.S. Core Fund | | International Value Fund | | Small Company Value Fund |
Discovery Fund† | | Intrinsic Small Cap Value Fund | | Small/Mid Cap Core Fund |
Diversified Equity Fund | | Intrinsic Value Fund | | Small/Mid Cap Value Fund |
Diversified International Fund | | Intrinsic World Equity Fund | | Special Mid Cap Value Fund |
Diversified Small Cap Fund | | Large Cap Core Fund | | Special Small Cap Value Fund |
Emerging Growth Fund | | Large Cap Growth Fund | | Specialized Technology Fund |
Emerging Markets Equity Fund | | Large Company Value Fund | | Strategic Large Cap Growth Fund |
Endeavor Select Fund† | | Omega Growth Fund | | Traditional Small Cap Growth Fund |
Enterprise Fund† | | Opportunity Fund† | | Utility and Telecommunications Fund |
| Bond Funds | | | | |
Adjustable Rate Government Fund | | Inflation-Protected Bond Fund | | Short-Term Bond Fund |
California Limited-Term Tax-Free Fund | | Intermediate Tax/AMT-Free Fund | | Short-Term High Yield Bond Fund |
California Tax-Free Fund | | International Bond Fund | | Short-Term Municipal Bond Fund |
Colorado Tax-Free Fund | | Minnesota Tax-Free Fund | | Strategic Municipal Bond Fund |
Government Securities Fund | | Municipal Bond Fund | | Total Return Bond Fund |
High Income Fund | | North Carolina Tax-Free Fund | | Ultra Short-Term Income Fund |
High Yield Bond Fund | | Pennsylvania Tax-Free Fund | | Ultra Short-Term Municipal Income Fund |
Income Plus Fund | | Short Duration Government Bond Fund | | Wisconsin Tax-Free Fund |
| Asset Allocation Funds | | | | |
Absolute Return Fund | | WealthBuilder Equity Portfolio† | | Target 2020 Fund† |
Asset Allocation Fund | | WealthBuilder Growth Allocation Portfolio† | | Target 2025 Fund† |
Conservative Allocation Fund | | WealthBuilder Growth Balanced Portfolio† | | Target 2030 Fund† |
Diversified Capital Builder Fund | | WealthBuilder Moderate Balanced Portfolio† | | Target 2035 Fund† |
Diversified Income Builder Fund | | WealthBuilder Tactical Equity Portfolio† | | Target 2040 Fund† |
Growth Balanced Fund | | Target Today Fund† | | Target 2045 Fund† |
Index Asset Allocation Fund | | Target 2010 Fund† | | Target 2050 Fund† |
Moderate Balanced Fund | | Target 2015 Fund† | | Target 2055 Fund† |
WealthBuilder Conservative Allocation Portfolio† | | | | |
| Money Market Funds | | | | |
100% Treasury Money Market Fund | | Heritage Money Market Fund† | | National Tax-Free Money Market Fund |
California Municipal Money Market Fund | | Money Market Fund | | Prime Investment Money Market Fund |
Cash Investment Money Market Fund | | Municipal Cash Management Money Market Fund | | Treasury Plus Money Market Fund |
Government Money Market Fund | | Municipal Money Market Fund | | |
| Variable Trust Funds1 | | | | |
VT Discovery Fund† | | VT Intrinsic Value Fund | | VT Small Cap Growth Fund |
VT Index Asset Allocation Fund | | VT Omega Growth Fund | | VT Small Cap Value Fund |
VT International Equity Fund | | VT Opportunity Fund† | | VT Total Return Bond Fund |
An investment in a money market fund is not insured or guaranteed by the Federal Deposit Insurance Corporation or any other government agency. Although the Wells Fargo Advantage Money Market Funds seek to preserve the value of your investment at $1.00 per share, it is possible to lose money by investing in a money market fund.
| 1. | The Variable Trust Funds are generally available only through insurance company variable contracts. |
| † | In this report, the Wells Fargo Advantage Discovery FundSM, Wells Fargo Advantage Endeavor Select FundSM, Wells Fargo Advantage Enterprise FundSM, Wells Fargo Advantage Opportunity FundSM, Wells Fargo Advantage WealthBuilder Conservative Allocation PortfolioSM, Wells Fargo Advantage WealthBuilder Equity PortfolioSM, Wells Fargo Advantage WealthBuilder Growth Allocation PortfolioSM, Wells Fargo Advantage WealthBuilder Growth Balanced PortfolioSM, Wells Fargo Advantage WealthBuilder Moderate Balanced PortfolioSM, Wells Fargo Advantage WealthBuilder Tactical Equity PortfolioSM, Wells Fargo Advantage Dow Jones Target Today FundSM, Wells Fargo Advantage Dow Jones Target 2010 FundSM, Wells Fargo Advantage Dow Jones Target 2015 FundSM, Wells Fargo Advantage Dow Jones Target 2020 FundSM, Wells Fargo Advantage Dow Jones Target 2025 FundSM, Wells Fargo Advantage Dow Jones Target 2030 FundSM, Wells Fargo Advantage Dow Jones Target 2035 FundSM, Wells Fargo Advantage Dow Jones Target 2040 FundSM, Wells Fargo Advantage Dow Jones Target 2045 FundSM, Wells Fargo Advantage Dow Jones Target 2050 FundSM, Wells Fargo Advantage Dow Jones Target 2055 FundSM, Wells Fargo Advantage Heritage Money Market FundSM, Wells Fargo Advantage VT Discovery FundSM, and Wells Fargo Advantage VT Opportunity FundSM are referred to as the Discovery Fund, Endeavor Select Fund, Enterprise Fund, Opportunity Fund, WealthBuilder Conservative Allocation Portfolio, WealthBuilder Equity Portfolio, WealthBuilder Growth Allocation Portfolio, WealthBuilder Growth Balanced Portfolio, WealthBuilder Moderate Balanced Portfolio, WealthBuilder Tactical Equity Portfolio, Target Today Fund, Target 2010 Fund, Target 2015 Fund, Target 2020 Fund, Target 2025 Fund, Target 2030 Fund, Target 2035 Fund, Target 2040 Fund, Target 2045 Fund, Target 2050 Fund, Target 2055 Fund, Heritage Money Market Fund, VT Discovery Fund, and VT Opportunity Fund, respectively. |
Not part of the semi-annual report.
| | | | |
| 2 | | Wells Fargo Advantage High Income Fund | | Letter to Shareholders |

Karla M. Rabusch,
President
Wells Fargo Advantage Funds
The theme for the period was a shift from risk aversion in the first half to burgeoning trends of improving investor confidence in the second half, which significantly improved pricing in the lower-rated asset classes.
On the whole, investment-grade fixed-income securities performed positively during the period, but the strongest returns came from the high-yield market.
Dear Valued Shareholder:
We are pleased to offer you this semi-annual report for the Wells Fargo Advantage High Income Fund, which covers the six-month period that ended February 29, 2012. During the period, fixed-income performance was best among the lower-rated securities, as improved investor confidence in the U.S. economy and the U.S. credit markets encouraged investors to return to riskier asset classes.
The period began with heightened risk aversion but ended with stronger investor confidence.
The six-month period began with the worsening of the Greek crisis, which amplified risk aversion across the global credit markets. This in turn led to a powerful rally in U.S. Treasuries and a sharp decline in high-yield bond prices, most notably in the lowest-quality credit tiers. During this time, most investment-grade fixed-income markets continued to generate positive returns—although certain areas of the riskiest segments of the markets declined—and U.S. Treasury yields reached the lowest levels in decades, even surpassing the low yield levels reached in the summer of 2010.
The last three months of the period were characterized by a strong reversal of the trends of the first three months. In October 2011, the high-yield market recovered significantly, benefiting from indications of improving policy with regard to managing the debt crisis from Europe and the formal announcement of a European debt deal late in the month. Due to renewed concerns about the European Union’s ability to manage the debt crisis, November 2011 saw a modest decline in investment-grade corporate bond prices and a sharp correction in high-yield corporate bonds, but another strong recovery in pricing started in December and carried into the first two months of 2012. Investor confidence strengthened as the U.S. economy demonstrated signs of sustainable growth and U.S. credit markets began to show some resistance to the credit problems of Europe. Thus, the theme for the period was a shift from risk aversion in the first half to burgeoning trends of improving investor confidence in the second half, which significantly improved pricing in the lower-rated asset classes.
On the whole, investment-grade fixed-income securities performed positively during the period, but the strongest returns came from the high-yield market. In fact, the best returns for the six-month period came from the lowest-rated credit tiers, despite the fact that they significantly underperformed in August and September 2011. Similar trends were true in the structured products sector, as lower-rated commercial mortgage-backed securities were among the best performers for the period, despite underperforming in the first two months.
The Federal Reserve launched Operation Twist in September.
With economic concerns and credit woes escalating in Europe and some continued uncertainty about the growth outlook in the U.S. during August and September 2011, the Federal Reserve (Fed) intervened yet again with monetary accommodations—this time with “Operation Twist,” which was announced and launched in September 2011. With Operation Twist, the Fed endeavored to flatten the yield curve and drive long-term rates down by selling short-term Treasuries and using the proceeds to purchase long-term Treasuries. The Fed stated that it is unlikely to raise rates before 2014, which should keep yields on Treasuries low.
| | | | | | |
| Letter to Shareholders | | Wells Fargo Advantage High Income Fund | | | 3 | |
Despite this announcement, problems in Europe caused Treasuries to continue to rally in the first 3 months of the period, while credit spreads on corporate and securitized sectors widened with increasing risk aversion. However, with an improved U.S. economic outlook and greater investor confidence, the last three months of the period saw a slight decline in U.S. Treasury prices and significant improvement in high-yield corporate bond prices. Credit spreads in the corporate and securitized sectors broadly tightened in December 2011 and January and February 2012.
Although U.S. economic conditions appear to have improved over the course of the period, the recovery continues to face some headwinds in the form of languishing housing values and elevated unemployment levels, which may continue to create some volatility in the fixed-income markets. While we cannot say definitively what near-term performance will look like, we continue to encourage investors to maintain fully diversified, actively managed portfolios, which may provide better protection from risk and added opportunities to capture relative value. While heightened volatility may be uncomfortable to experience in the short term, we believe it can lead to unique opportunities to add relative value for investors with long-term investment horizons.
Don’t let short-term uncertainty derail long-term investment goals.
Periods of uncertainty can present challenges, but experience has taught us that maintaining a long-term investment strategy based on individual goals and risk tolerance can be an effective way to plan for the future. To help you create a sound strategy based on your personal goals and risk tolerance, Wells Fargo Advantage Funds offers more than 110 mutual funds and other investments spanning a wide range of asset classes and investment styles. Although diversification cannot guarantee an investment profit or prevent losses, we believe it can be an effective way to manage investment risk and potentially smooth out overall portfolio performance.
In our opinion, diligent and earnest assessment of the fundamental risks in individual fixed-income securities will be a key differentiating factor between which investment strategies perform well and which do not. At Wells Fargo Advantage Funds, we intend to continue measuring relative-value opportunities in the fixed-income markets and across our lineup of funds. We believe it is particularly important to have diligent investment analysts in charge of investor assets in changing markets. As evidenced by the performance of fixed-income assets during the recent six-month period, heightened risks also often accompany such opportunities.
| | | | |
| 4 | | Wells Fargo Advantage High Income Fund | | Letter to Shareholders |
Thank you for choosing to invest with Wells Fargo Advantage Funds. We appreciate your confidence in us and remain committed to helping you meet your financial needs. For current information about your fund investments, contact your investment professional, visit our Web site at wellsfargoadvantagefunds.com, or call us directly at 1-800-222-8222. We are available 24 hours a day, 7 days a week.
Sincerely,

Karla M. Rabusch
President
Wells Fargo Advantage Funds
Notice to Shareholders
The Board of Trustees for Wells Fargo Advantage Funds has unanimously approved the following modifications to certain net asset value (NAV) waiver privileges and commission schedules:
| | n | | Effective May 1, 2012, automatic investment plan (AIP) purchases and proceeds received from systematic withdrawals will no longer qualify for NAV repurchase privileges. | |
| | n | | Effective May 1, 2012, discretionary rights to waive the upfront commission for Class C and “jumbo” Class A share purchases will no longer be granted to broker/dealers. However, we will continue to waive the Class C shares contingent deferred sales charge for redemptions by employer-sponsored retirement plans where the dealer of record waived its commission at the time of purchase. | |
| | n | | Effective July 31, 2012, NAV purchase privileges for former Evergreen Class IS and Class R shareholders are being modified to remove the ability to purchase Class A shares at NAV unless those shares are held directly with the Fund on or after July 31, 2012. | |
Please contact your investment professional or call us directly at 1-800-222-8222 if you have any questions on this Notice to Shareholders.
| | | | | | |
| Performance Highlights (Unaudited) | | Wells Fargo Advantage High Income Fund | | | 5 | |
INVESTMENT OBJECTIVE
The Fund seeks total return, consisting of a high level of current income and capital appreciation.
ADVISER
Wells Fargo Funds Management, LLC
SUB-ADVISER
Wells Capital Management Incorporated
PORTFOLIO MANAGERS
Kevin J. Maas, CFA
Thomas M. Price, CFA
Michael J. Schueller, CFA
FUND INCEPTION
December 28, 1995
| | | | |
TEN LARGEST LONG-TERM HOLDINGS1
(AS OF FEBRUARY 29, 2012) | |
Harrah’s Entertainment Corporation, 3.24%, 1/28/2015 | | | 1.17% | |
CIT Group Incorporated, 7.00%, 5/2/2017 | | | 1.00% | |
Limited Brands Incorporated, 6.63%, 4/1/2021 | | | 0.90% | |
HealthSouth Corporation, 8.13%, 2/15/2020 | | | 0.85% | |
CITGO Petroleum Corporation, 11.50%, 7/1/2017 | | | 0.84% | |
Clear Channel Communications Incorporated, 9.00%, 3/1/2021 | | | 0.84% | |
Discover Financial Services, 10.25%, 7/15/2019 | | | 0.83% | |
Regency Energy Partners, 6.88%, 12/1/2018 | | | 0.82% | |
United Rentals North America Incorporated, 8.38%, 9/15/2020 | | | 0.81% | |
Ford Motor Company, 7.45%, 7/16/2031 | | | 0.80% | |
| | |
CREDIT QUALITY2
(AS OF FEBRUARY 29, 2012) |
|
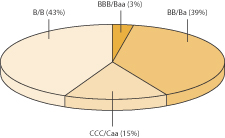 |
| 1. | The ten largest long-term holdings are calculated based on the value of the securities divided by total net assets of the Fund. Holdings are subject to change and may have changed since the date specified. |
| 2. | The ratings indicated are from Standard & Poor’s, Moody’s Investors Service, and/or Fitch Ratings Ltd. Credit Quality Ratings: Credit quality ratings apply to underlying holdings of the Fund and not the Fund itself. Standard & Poor’s rates the creditworthiness of bonds, ranging from AAA (highest) to D (lowest). Ratings from A to CCC may be modified by the addition of a plus (+) or minus (–) sign to show relative standing within the rating categories. Standard & Poor’s rates the creditworthiness of short-term notes from SP-1 (highest) to SP-3 (lowest). Moody’s rates the creditworthiness of bonds, ranging from Aaa (highest) to C (lowest). Ratings Aa to B may be modified by the addition of a number 1 (highest) to 3 (lowest) to show relative standing within the ratings categories. Moody’s rates the creditworthiness of short-term U.S. tax-exempt municipal securities from MIG 1/VMIG 1 (highest) to SG (lowest). Fitch rates the creditworthiness of bonds, ranging from AAA (highest) to D (lowest). If a security was rated by all three rating agencies, the middle rating was utilized. If rated by two of three rating agencies, the lower rating was utilized and if rated by one of the agencies that rating was utilized. Credit quality is subject to change and is calculated based on the total investments of the Fund. |
| | | | |
| 6 | | Wells Fargo Advantage High Income Fund | | Performance Highlights (Unaudited) |
AVERAGE ANNUAL TOTAL RETURN3 (%) (AS OF FEBRUARY 29, 2012)
| | | | | | | | | | | | | | | | | | | | | | | | | | | | | | | | | | | | | | | | | | | | |
| | | | | | Including Sales Charge | | | Excluding Sales Charge | | | Expense Ratios4 | |
| | | Inception Date | | | 6 Months* | | | 1 Year | | | 5 Year | | | 10 Year | | | 6 Months* | | | 1 Year | | | 5 Year | | | 10 Year | | | Gross | | | Net5 | |
Class A (SHBAX) | | | 02/29/2000 | | | | 3.16 | | | | 1.66 | | | | 5.54 | | | | 6.88 | | | | 8.03 | | | | 6.45 | | | | 6.51 | | | | 7.37 | | | | 1.02% | | | | 0.91% | |
Class B (WFNBX)** | | | 07/18/2008 | | | | 2.63 | | | | 0.66 | | | | 5.39 | | | | 6.87 | | | | 7.63 | | | | 5.66 | | | | 5.71 | | | | 6.87 | | | | 1.77% | | | | 1.66% | |
Class C (WFNCX) | | | 07/18/2008 | | | | 6.63 | | | | 4.66 | | | | 5.71 | | | | 6.63 | | | | 7.63 | | | | 5.66 | | | | 5.71 | | | | 6.63 | | | | 1.77% | | | | 1.66% | |
Administrator Class (WFNDX) | | | 07/30/2010 | | | | | | | | | | | | | | | | | | | | 8.04 | | | | 6.56 | | | | 6.64 | | | | 7.66 | | | | 0.96% | | | | 0.81% | |
Institutional Class (SHYYX) | | | 07/31/2001 | | | | | | | | | | | | | | | | | | | | 8.19 | | | | 6.88 | | | | 6.97 | | | | 7.99 | | | | 0.69% | | | | 0.51% | |
Investor Class (STHYX) | | | 12/28/1995 | | | | | | | | | | | | | | | | | | | | 7.99 | | | | 6.42 | | | | 6.49 | | | | 7.45 | | | | 1.05% | | | | 0.94% | |
Barclays U.S. Corporate High Yield Bond Index6 | | | | | | | | | | | | | | | | | | | | | | | 8.63 | | | | 6.94 | | | | 8.15 | | | | 9.51 | | | | | | | | | |
| * | Returns for periods of less than one year are not annualized. |
| ** | Class B shares are closed to investment, except in connection with the reinvestment of any distributions and permitted exchanges. |
Figures quoted represent past performance, which is no guarantee of future results and do not reflect the deduction of taxes that a shareholder may pay on fund distributions or the redemption of fund shares. Investment return and principal value of an investment will fluctuate so that an investor’s shares, when redeemed, may be worth more or less than their original cost. Performance shown without sales charges would be lower if sales charges were reflected. Current performance may be lower or higher than the performance data quoted and assumes the reinvestment of dividends and capital gains. Current month-end performance is available on the Fund’s Web site – wellsfargoadvantagefunds.com
Index returns do not include transaction costs associated with buying and selling securities, any mutual fund fees or expenses or any taxes. It is not possible to invest directly in an index.
For Class A shares, the maximum front-end sales charge is 4.50%. For Class B shares, the maximum contingent deferred sales charge is 5.00%. For Class C shares, the maximum contingent deferred sales charge is 1.00%. Performance including sales charge assumes the sales charge for the corresponding time period. Administrator Class, Institutional Class and Investor Class shares are sold without a front-end sales charge or contingent deferred sales charge.
Bond fund values fluctuate in response to the financial condition of individual issuers, general market and economic conditions, and changes in interest rates. In general, when interest rates rise, bond fund values fall and investors may lose principal value. High-yield securities have a greater risk of default and tend to be more volatile than higher-rated debt securities. Loans are subject to risks similar to those associated with other below investment grade bond investments, such as credit risk (e.g. risk of issuer default), below investment grade bond risk (e.g. risk of greater volatility in value) and risk that the loan may become illiquid or difficult to price. The use of derivatives may reduce returns and/or increase volatility. Certain investment strategies tend to increase the total risk of an investment (relative to the broader market). This Fund is exposed to foreign investment risk. Consult the Fund’s prospectus for additional information on these and other risks.
| 3. | Historical performance shown for the Class A shares through June 19, 2008 includes Advisor Class expenses. Historical performance shown for the Class B and Class C shares prior to their inception reflects the performance of the Investor Class shares, adjusted to reflect the higher expenses applicable to Class B and Class C shares. Historical performance shown for the Administrator Class shares prior to their inception reflects the performance of the Institutional Class shares, adjusted to reflect the higher expenses applicable to the Administrator Class shares. |
| 4. | Reflects the expense ratios as stated in the most recent prospectuses. |
| 5. | The Adviser has committed through July 11, 2013 to waive fees and/or reimburse expenses to the extent necessary to cap the Fund’s Total Annual Fund Operating Expenses After Fee Waiver, excluding certain expenses, at 0.90% for Class A, 1.65% for Class B, 1.65% for Class C, 0.80% for Administrator Class, 0.50% for Institutional Class and 0.93% for Investor Class. Without this cap, the Fund’s returns would have been lower. |
| 6. | The Barclays U.S. Corporate High Yield Bond Index is an unmanaged, U.S. dollar-denominated, nonconvertible, non-investment grade debt index. The index consists of domestic and corporate bonds rated Ba and below with a minimum outstanding amount of $150 million. You cannot invest directly in an index. |
| | | | | | |
| Fund Expenses (Unaudited) | | Wells Fargo Advantage High Income Fund | | | 7 | |
As a shareholder of the Fund, you incur two types of costs: (1) transaction costs, including sales charges (loads) on purchase payments and contingent deferred sales charges (if any) on redemptions and (2) ongoing costs, including management fees; distribution (12b-1) and/or shareholder service fees; and other Fund expenses. This example is intended to help you understand your ongoing costs (in dollars) of investing in the Fund and to compare these costs with the ongoing costs of investing in other mutual funds.
The example is based on an investment of $1,000 invested at the beginning of the six-month period and held for the entire period from September 1, 2011 to February 29, 2012.
Actual Expenses
The “Actual” line of the table below provides information about actual account values and actual expenses. You may use the information in this line, together with the amount you invested, to estimate the expenses that you paid over the period. Simply divide your account value by $1,000 (for example, an $8,600 account value divided by $1,000 = 8.6), then multiply the result by the number in the “Actual” line under the heading entitled “Expenses Paid During Period” for your applicable class of shares to estimate the expenses you paid on your account during this period.
Hypothetical Example for Comparison Purposes
The “Hypothetical” line of the table below provides information about hypothetical account values and hypothetical expenses based on the Fund’s actual expense ratio and an assumed rate of return of 5% per year before expenses, which is not the Fund’s actual return. The hypothetical account values and expenses may not be used to estimate the actual ending account balance or expenses you paid for the period. You may use this information to compare the ongoing costs of investing in the Fund and other funds. To do so, compare this 5% hypothetical example with the 5% hypothetical examples that appear in the shareholder reports of the other funds.
Please note that the expenses shown in the table are meant to highlight your ongoing costs only and do not reflect any transactional costs, such as sales charges (loads) and contingent deferred sales charges. Therefore, the “Hypothetical” line of the table is useful in comparing ongoing costs only, and will not help you determine the relative total costs of owning different funds. In addition, if these transactional costs were included, your costs would have been higher.
| | | | | | | | | | | | | | | | |
| | | Beginning
Account Value
09-01-2011 | | | Ending
Account Value
02-29-2012 | | | Expenses
Paid During
the Period1 | | | Net Annual
Expense Ratio | |
Class A | | | | | | | | | | | | | | | | |
Actual | | $ | 1,000.00 | | | $ | 1,080.26 | | | $ | 4.66 | | | | 0.90 | % |
Hypothetical (5% return before expenses) | | $ | 1,000.00 | | | $ | 1,020.39 | | | $ | 4.52 | | | | 0.90 | % |
Class B | | | | | | | | | | | | | | | | |
Actual | | $ | 1,000.00 | | | $ | 1,076.27 | | | $ | 8.52 | | | | 1.65 | % |
Hypothetical (5% return before expenses) | | $ | 1,000.00 | | | $ | 1,016.66 | | | $ | 8.27 | | | | 1.65 | % |
Class C | | | | | | | | | | | | | | | | |
Actual | | $ | 1,000.00 | | | $ | 1,076.29 | | | $ | 8.52 | | | | 1.65 | % |
Hypothetical (5% return before expenses) | | $ | 1,000.00 | | | $ | 1,016.66 | | | $ | 8.27 | | | | 1.65 | % |
Administrator Class | | | | | | | | | | | | | | | | |
Actual | | $ | 1,000.00 | | | $ | 1,080.37 | | | $ | 4.09 | | | | 0.79 | % |
Hypothetical (5% return before expenses) | | $ | 1,000.00 | | | $ | 1,020.93 | | | $ | 3.97 | | | | 0.79 | % |
Institutional Class | | | | | | | | | | | | | | | | |
Actual | | $ | 1,000.00 | | | $ | 1,081.93 | | | $ | 2.59 | | | | 0.50 | % |
Hypothetical (5% return before expenses) | | $ | 1,000.00 | | | $ | 1,022.38 | | | $ | 2.51 | | | | 0.50 | % |
Investor Class | | | | | | | | | | | | | | | | |
Actual | | $ | 1,000.00 | | | $ | 1,079.91 | | | $ | 4.81 | | | | 0.93 | % |
Hypothetical (5% return before expenses) | | $ | 1,000.00 | | | $ | 1,020.24 | | | $ | 4.67 | | | | 0.93 | % |
| 1. | Expenses paid is equal to the annualized expense ratio of each class multiplied by the average account value over the period, multiplied by the number of days in the most recent fiscal half-year divided by the number of days in the fiscal year (to reflect the one-half year period). |
| | | | |
| 8 | | Wells Fargo Advantage High Income Fund | | Portfolio of Investments—February 29, 2012 (Unaudited) |
| | | | | | | | | | | | | | | | |
| Security Name | | Interest Rate | | | Maturity Date | | | Principal | | | Value | |
| | | | | | | | | | | | | | | | |
| | | | |
Corporate Bonds and Notes: 81.38% | | | | | | | | | | | | | | | | |
| | | | |
Consumer Discretionary: 21.90% | | | | | | | | | | | | | | | | |
| | | | |
| Auto Components: 3.99% | | | | | | | | | | | | | | | | |
American Axle & Manufacturing Incorporated | | | 7.75 | % | | | 11/15/2019 | | | $ | 5,000,000 | | | $ | 5,331,245 | |
Cooper-Standard Holdings Incorporated | | | 8.50 | | | | 05/01/2018 | | | | 4,500,000 | | | | 4,860,000 | |
Dana Holding Corporation | | | 6.75 | | | | 02/15/2021 | | | | 4,000,000 | | | | 4,330,000 | |
Delphi Corporation 144A | | | 6.13 | | | | 05/15/2021 | | | | 5,250,000 | | | | 5,630,625 | |
Lear Corporation | | | 8.13 | | | | 03/15/2020 | | | | 3,000,000 | | | | 3,382,500 | |
Tenneco Automotive Incorporated | | | 7.75 | | | | 08/15/2018 | | | | 3,000,000 | | | | 3,262,500 | |
TRW Automotive Incorporated 144A | | | 7.25 | | | | 03/15/2017 | | | | 2,030,000 | | | | 2,258,375 | |
TRW Automotive Incorporated 144A | | | 8.88 | | | | 12/01/2017 | | | | 2,500,000 | | | | 2,781,250 | |
| | | | |
| | | | | | | | | | | | | | | 31,836,495 | |
| | | | | | | | | | | | | | | | |
| | | | |
| Automobiles: 0.80% | | | | | | | | | | | | | | | | |
Ford Motor Company « | | | 7.45 | | | | 07/16/2031 | | | | 5,000,000 | | | �� | 6,418,750 | |
| | | | | | | | | | | | | | | | |
| | | | |
| Diversified Consumer Services: 1.21% | | | | | | | | | | | | | | | | |
Service Corporation International | | | 7.50 | | | | 04/01/2027 | | | | 200,000 | | | | 200,000 | |
Service Corporation International Series WI | | | 7.00 | | | | 06/15/2017 | | | | 3,790,000 | | | | 4,244,800 | |
Stewart Enterprises Incorporated | | | 6.50 | | | | 04/15/2019 | | | | 5,000,000 | | | | 5,250,000 | |
| | | | |
| | | | | | | | | | | | | | | 9,694,800 | |
| | | | | | | | | | | | | | | | |
| | | | |
| Hotels, Restaurants & Leisure: 4.02% | | | | | | | | | | | | | | | | |
Caesars Entertainment Incorporated | | | 8.50 | | | | 02/15/2020 | | | | 1,000,000 | | | | 1,020,000 | |
CKE Restaurants Incorporated | | | 11.38 | | | | 07/15/2018 | | | | 4,725,000 | | | | 5,386,500 | |
MGM Resorts International Company 144A | | | 8.63 | | | | 02/01/2019 | | | | 1,000,000 | | | | 1,065,000 | |
Penn National Gaming Incorporated | | | 8.75 | | | | 08/15/2019 | | | | 3,750,000 | | | | 4,209,375 | |
Seminole Tribe of Florida 144A | | | 7.75 | | | | 10/01/2017 | | | | 4,900,000 | | | | 5,316,500 | |
Shingle Springs Tribal Gaming Authority 144A | | | 9.38 | | | | 06/15/2015 | | | | 4,050,000 | | | | 2,774,250 | |
Tunica-Biloxi Gaming Authority 144A | | | 9.00 | | | | 11/15/2015 | | | | 6,260,000 | | | | 6,056,550 | |
Yonkers Racing Corporation 144A | | | 11.38 | | | | 07/15/2016 | | | | 5,770,000 | | | | 6,253,238 | |
| | | | |
| | | | | | | | | | | | | | | 32,081,413 | |
| | | | | | | | | | | | | | | | |
| | | | |
| Media: 8.65% | | | | | | | | | | | | | | | | |
CCO Holdings LLC | | | 6.50 | | | | 04/30/2021 | | | | 2,000,000 | | | | 2,125,000 | |
CCO Holdings LLC | | | 6.63 | | | | 01/31/2022 | | | | 2,000,000 | | | | 2,135,000 | |
CCO Holdings LLC | | | 7.00 | | | | 01/15/2019 | | | | 5,000,000 | | | | 5,400,000 | |
Cequel Communications Holdings 144A | | | 8.63 | | | | 11/15/2017 | | | | 5,000,000 | | | | 5,362,500 | |
Cinemark USA Incorporated | | | 8.63 | | | | 06/15/2019 | | | | 5,500,000 | | | | 6,118,750 | |
Clear Channel Communications Incorporated 144A | | | 7.63 | | | | 03/15/2020 | | | | 1,750,000 | | | | 1,750,000 | |
Clear Channel Communications Incorporated | | | 9.00 | | | | 03/01/2021 | | | | 7,250,000 | | | | 6,670,000 | |
CSC Holdings LLC | | | 8.63 | | | | 02/15/2019 | | | | 3,500,000 | | | | 4,130,000 | |
DISH DBS Corporation | | | 6.75 | | | | 06/01/2021 | | | | 2,000,000 | | | | 2,220,000 | |
DISH DBS Corporation | | | 7.88 | | | | 09/01/2019 | | | | 4,500,000 | | | | 5,287,500 | |
Insight Communications 144A | | | 9.38 | | | | 07/15/2018 | | | | 4,000,000 | | | | 4,590,000 | |
Intelsat Jackson Holdings Limited | | | 8.50 | | | | 11/01/2019 | | | | 5,025,000 | | | | 5,514,938 | �� |
LBI Media Incorporated 144A | | | 9.25 | | | | 04/15/2019 | | | | 6,000,000 | | | | 5,100,000 | |
Regal Cinemas Corporation | | | 8.63 | | | | 07/15/2019 | | | | 5,000,000 | | | | 5,462,500 | |
Sirius XM Radio Incorporated 144A | | | 8.75 | | | | 04/01/2015 | | | | 3,500,000 | | | | 3,972,500 | |
The accompanying notes are an integral part of these financial statements.
| | | | | | |
| Portfolio of Investments—February 29, 2012 (Unaudited) | | Wells Fargo Advantage High Income Fund | | | 9 | |
| | | | | | | | | | | | | | | | |
| Security Name | | Interest Rate | | | Maturity Date | | | Principal | | | Value | |
| | | | | | | | | | | | | | | | |
| | | | |
| Media (continued) | | | | | | | | | | | | | | | | |
Visant Corporation | | | 10.00 | % | | | 10/01/2017 | | | $ | 3,500,000 | | | $ | 3,220,000 | |
| | | | |
| | | | | | | | | | | | | | | 69,058,688 | |
| | | | | | | | | | | | | | | | |
| | | | |
| Multiline Retail: 0.40% | | | | | | | | | | | | | | | | |
Bon-Ton Department Stores Incorporated | | | 10.25 | | | | 03/15/2014 | | | | 5,000,000 | | | | 3,200,000 | |
| | | | | | | | | | | | | | | | |
| | | | |
| Specialty Retail: 1.69% | | | | | | | | | | | | | | | | |
Limited Brands Incorporated | | | 5.63 | | | | 02/15/2022 | | | | 1,000,000 | | | | 1,030,000 | |
Limited Brands Incorporated | | | 6.63 | | | | 04/01/2021 | | | | 6,500,000 | | | | 7,150,000 | |
Toys R Us Property Company I LLC | | | 8.50 | | | | 12/01/2017 | | | | 5,000,000 | | | | 5,287,500 | |
| | | | |
| | | | | | | | | | | | | | | 13,467,500 | |
| | | | | | | | | | | | | | | | |
| | | | |
| Textiles, Apparel & Luxury Goods: 1.14% | | | | | | | | | | | | | | | | |
Hanesbrands Incorporated | | | 6.38 | | | | 12/15/2020 | | | | 5,000,000 | | | | 5,225,000 | |
Jones Group Incorporated | | | 6.88 | | | | 03/15/2019 | | | | 4,000,000 | | | | 3,865,000 | |
| | | | |
| | | | | | | | | | | | | | | 9,090,000 | |
| | | | | | | | | | | | | | | | |
| | | | |
Consumer Staples: 3.04% | | | | | | | | | | | | | | | | |
| | | | |
| Beverages: 0.52% | | | | | | | | | | | | | | | | |
Constellation Brands Incorporated | | | 7.25 | | | | 09/01/2016 | | | | 3,700,000 | | | | 4,181,000 | |
| | | | | | | | | | | | | | | | |
| | | | |
| Food Products: 2.45% | | | | | | | | | | | | | | | | |
Bumble Bee Acquisition Company 144A | | | 9.00 | | | | 12/15/2017 | | | | 3,802,000 | | | | 3,992,100 | |
Dean Foods Company | | | 9.75 | | | | 12/15/2018 | | | | 1,500,000 | | | | 1,657,500 | |
Del Monte Foods Company | | | 7.63 | | | | 02/15/2019 | | | | 4,000,000 | | | | 4,010,000 | |
JBS USA Finance Incorporated 144A | | | 8.25 | | | | 02/01/2020 | | | | 2,500,000 | | | | 2,581,250 | |
Pinnacle Foods Finance LLC | | | 8.25 | | | | 09/01/2017 | | | | 2,700,000 | | | | 2,922,750 | |
TreeHouse Foods Incorporated | | | 7.75 | | | | 03/01/2018 | | | | 4,000,000 | | | | 4,380,000 | |
| | | | |
| | | | | | | | | | | | | | | 19,543,600 | |
| | | | | | | | | | | | | | | | |
| | | | |
| Personal Products: 0.07% | | | | | | | | | | | | | | | | |
Sally Beauty Holdings Incorporated 144A | | | 6.88 | | | | 11/15/2019 | | | | 500,000 | | | | 537,500 | |
| | | | | | | | | | | | | | | | |
| | | | |
Energy: 12.92% | | | | | | | | | | | | | | | | |
| | | | |
| Energy Equipment & Services: 0.13% | | | | | | | | | | | | | | | | |
Atwood Oceanics Incorporated | | | 6.50 | | | | 02/01/2020 | | | | 1,000,000 | | | | 1,052,500 | |
| | | | | | | | | | | | | | | | |
| | | | |
| Oil, Gas & Consumable Fuels: 12.79% | | | | | | | | | | | | | | | | |
Bill Barrett Corporation | | | 7.63 | | | | 10/01/2019 | | | | 2,600,000 | | | | 2,717,000 | |
Bill Barrett Corporation | | | 9.88 | | | | 07/15/2016 | | | | 5,000,000 | | | | 5,525,000 | |
BreitBurn Energy Partners LP | | | 8.63 | | | | 10/15/2020 | | | | 4,000,000 | | | | 4,340,000 | |
Chesapeake Energy Corporation 144A | | | 6.63 | | | | 11/15/2019 | | | | 4,000,000 | | | | 4,080,000 | |
Chesapeake Energy Corporation | | | 6.88 | | | | 11/15/2020 | | | | 3,000,000 | | | | 3,150,000 | |
CITGO Petroleum Corporation 144A | | | 11.50 | | | | 07/01/2017 | | | | 6,000,000 | | | | 6,720,000 | |
Clayton Williams Energy Incorporated | | | 7.75 | | | | 04/01/2019 | | | | 4,000,000 | | | | 4,000,000 | |
Coffeyville Resources Refining & Marketing LLC 144A | | | 9.00 | | | | 04/01/2015 | | | | 1,575,000 | | | | 1,685,250 | |
Coffeyville Resources Refining & Marketing LLC 144A | | | 10.88 | | | | 04/01/2017 | | | | 3,750,000 | | | | 4,237,500 | |
Comstock Resources Incorporated | | | 8.38 | | | | 10/15/2017 | | | | 5,500,000 | | | | 5,348,750 | |
El Paso Corporation | | | 6.50 | | | | 09/15/2020 | | | | 3,500,000 | | | | 3,865,673 | |
The accompanying notes are an integral part of these financial statements.
| | | | |
| 10 | | Wells Fargo Advantage High Income Fund | | Portfolio of Investments—February 29, 2012 (Unaudited) |
| | | | | | | | | | | | | | | | |
| Security Name | | Interest Rate | | | Maturity Date | | | Principal | | | Value | |
| | | | | | | | | | | | | | | | |
| | | | |
| Oil, Gas & Consumable Fuels (continued) | | | | | | | | | | | | | | | | |
Energy Transfer Equity LP | | | 7.50 | % | | | 10/15/2020 | | | $ | 5,000,000 | | | $ | 5,725,000 | |
Energy XXI Gulf Coast Incorporated | | | 9.25 | | | | 12/15/2017 | | | | 3,000,000 | | | | 3,322,500 | |
Holly Corporation | | | 9.88 | | | | 06/15/2017 | | | | 3,250,000 | | | | 3,631,875 | |
James River Coal Company | | | 7.88 | | | | 04/01/2019 | | | | 5,000,000 | | | | 3,375,000 | |
Newfield Exploration Company | | | 6.88 | | | | 02/01/2020 | | | | 4,950,000 | | | | 5,346,000 | |
Peabody Energy Corporation 144A | | | 6.00 | | | | 11/15/2018 | | | | 1,000,000 | | | | 1,047,500 | |
Peabody Energy Corporation 144A | | | 6.25 | | | | 11/15/2021 | | | | 5,000,000 | | | | 5,237,500 | |
Penn Virginia Corporation | | | 10.38 | | | | 06/15/2016 | | | | 4,200,000 | | | | 4,168,500 | |
Plains Exploration & Production Company | | | 8.63 | | | | 10/15/2019 | | | | 4,600,000 | | | | 5,198,000 | |
Quicksilver Resources Incorporated | | | 11.75 | | | | 01/01/2016 | | | | 2,000,000 | | | | 2,130,000 | |
Regency Energy Partners | | | 6.88 | | | | 12/01/2018 | | | | 6,000,000 | | | | 6,510,000 | |
Suburban Propane Partners LP | | | 7.38 | | | | 03/15/2020 | | | | 3,250,000 | | | | 3,461,250 | |
Targa Resources Partners Incorporated 144A | | | 6.38 | | | | 08/01/2022 | | | | 1,000,000 | | | | 1,052,500 | |
Targa Resources Partners Incorporated | | | 6.88 | | | | 02/01/2021 | | | | 4,000,000 | | | | 4,270,000 | |
White Pine Hydro Portfolio LLC 144A(i) | | | 7.26 | | | | 07/20/2015 | | | | 2,000,000 | | | | 1,944,160 | |
| | | | |
| | | | | | | | | | | | | | | 102,088,958 | |
| | | | | | | | | | | | | | | | |
| | | | |
Financials: 8.48% | | | | | | | | | | | | | | | | |
| | | | |
| Commercial Banks: 0.46% | | | | | | | | | | | | | | | | |
Regions Bank | | | 7.50 | | | | 05/15/2018 | | | | 3,350,000 | | | | 3,651,500 | |
| | | | | | | | | | | | | | | | |
| | | | |
| Consumer Finance: 4.82% | | | | | | | | | | | | | | | | |
Ally Financial Incorporated | | | 5.50 | | | | 02/15/2017 | | | | 1,500,000 | | | | 1,519,433 | |
Ally Financial Incorporated | | | 6.25 | | | | 12/01/2017 | | | | 2,000,000 | | | | 2,067,532 | |
Ally Financial Incorporated | | | 8.00 | | | | 03/15/2020 | | | | 5,500,000 | | | | 6,228,750 | |
Discover Financial Services | | | 10.25 | | | | 07/15/2019 | | | | 5,200,000 | | | | 6,630,478 | |
Ford Motor Credit Company LLC | | | 5.00 | | | | 05/15/2018 | | | | 3,000,000 | | | | 3,162,654 | |
Ford Motor Credit Company LLC | | | 5.88 | | | | 08/02/2021 | | | | 5,000,000 | | | | 5,578,225 | |
Ford Motor Credit Company LLC | | | 6.63 | | | | 08/15/2017 | | | | 2,500,000 | | | | 2,833,303 | |
Ford Motor Credit Company LLC | | | 8.00 | | | | 12/15/2016 | | | | 1,840,000 | | | | 2,186,908 | |
GMAC LLC | | | 8.00 | | | | 11/01/2031 | | | | 3,500,000 | | | | 3,906,875 | |
SLM Corporation | | | 8.00 | | | | 03/25/2020 | | | | 4,000,000 | | | | 4,400,000 | |
| | | | |
| | | | | | | | | | | | | | | 38,514,158 | |
| | | | | | | | | | | | | | | | |
| | | | |
| Diversified Financial Services: 3.20% | | | | | | | | | | | | | | | | |
CIT Group Incorporated 144A | | | 5.50 | | | | 02/15/2019 | | | | 1,000,000 | | | | 1,021,250 | |
CIT Group Incorporated 144A | | | 6.63 | | | | 04/01/2018 | | | | 3,500,000 | | | | 3,771,250 | |
CIT Group Incorporated 144A | | | 7.00 | | | | 05/02/2016 | | | | 3,600,000 | | | | 3,604,500 | |
CIT Group Incorporated 144A | | | 7.00 | | | | 05/02/2017 | | | | 8,000,000 | | | | 8,010,000 | |
International Lease Finance Corporation | | | 6.25 | | | | 05/15/2019 | | | | 1,000,000 | | | | 1,013,626 | |
International Lease Finance Corporation | | | 8.25 | | | | 12/15/2020 | | | | 5,500,000 | | | | 6,131,010 | |
PHH Corporation | | | 7.13 | | | | 03/01/2013 | | | | 2,000,000 | | | | 2,000,000 | |
| | | | |
| | | | | | | | | | | | | | | 25,551,636 | |
| | | | | | | | | | | | | | | | |
| | | | |
Health Care: 9.32% | | | | | | | | | | | | | | | | |
| | | | |
| Health Care Equipment & Supplies: 1.58% | | | | | | | | | | | | | | | | |
Accellent Incorporated | | | 8.38 | | | | 02/01/2017 | | | | 4,000,000 | | | | 4,055,000 | |
Biomet Incorporated | | | 11.63 | | | | 10/15/2017 | | | | 4,000,000 | | | | 4,365,000 | |
The accompanying notes are an integral part of these financial statements.
| | | | | | |
| Portfolio of Investments—February 29, 2012 (Unaudited) | | Wells Fargo Advantage High Income Fund | | | 11 | |
| | | | | | | | | | | | | | | | |
| Security Name | | Interest Rate | | | Maturity Date | | | Principal | | | Value | |
| | | | | | | | | | | | | | | | |
| | | | |
| Health Care Equipment & Supplies (continued) | | | | | | | | | | | | | | | | |
Hanger Orthopedic Group | | | 7.13 | % | | | 11/15/2018 | | | $ | 4,000,000 | | | $ | 4,225,000 | |
| | | | |
| | | | | | | | | | | | | | | 12,645,000 | |
| | | | | | | | | | | | | | | | |
| | | | |
| Health Care Providers & Services: 7.18% | | | | | | | | | | | | | | | | |
Community Health Systems Incorporated Series WI | | | 8.88 | | | | 07/15/2015 | | | | 4,000,000 | | | | 4,190,000 | |
Davita Incorporated | | | 6.63 | | | | 11/01/2020 | | | | 4,000,000 | | | | 4,290,000 | |
Fresenius Medical Care Holdings Incorporated 144A | | | 5.63 | | | | 07/31/2019 | | | | 2,500,000 | | | | 2,662,500 | |
Fresenius Medical Care Holdings Incorporated 144A | | | 5.88 | | | | 01/31/2022 | | | | 2,500,000 | | | | 2,637,500 | |
Fresenius Medical Care Holdings Incorporated | | | 6.88 | | | | 07/15/2017 | | | | 3,000,000 | | | | 3,330,000 | |
HCA Incorporated | | | 5.88 | | | | 03/15/2022 | | | | 3,000,000 | | | | 3,075,000 | |
HCA Incorporated | | | 7.25 | | | | 09/15/2020 | | | | 4,550,000 | | | | 4,959,500 | |
HCA Incorporated | | | 7.88 | | | | 02/15/2020 | | | | 2,000,000 | | | | 2,205,000 | |
HCA Incorporated | | | 8.50 | | | | 04/15/2019 | | | | 1,000,000 | | | | 1,120,000 | |
Health Management Association 144A | | | 7.38 | | | | 01/15/2020 | | | | 2,000,000 | | | | 2,085,000 | |
HealthSouth Corporation | | | 8.13 | | | | 02/15/2020 | | | | 6,200,000 | | | | 6,816,125 | |
Iasis Healthcare Corporation | | | 8.38 | | | | 05/15/2019 | | | | 4,000,000 | | | | 3,820,000 | |
Lifepoint Hospitals Incorporated | | | 6.63 | | | | 10/01/2020 | | | | 3,750,000 | | | | 4,031,250 | |
MPT Operating Partnership LP | | | 6.38 | | | | 02/15/2022 | | | | 2,000,000 | | | | 2,065,000 | |
PSS World Medical Incorporated 144A | | | 6.38 | | | | 03/01/2022 | | | | 1,000,000 | | | | 1,040,000 | |
Tenet Healthcare Corporation 144A | | | 6.25 | | | | 11/01/2018 | | | | 4,000,000 | | | | 4,265,000 | |
Vanguard Health Holdings Incorporated LLC | | | 8.00 | | | | 02/01/2018 | | | | 4,500,000 | | | | 4,736,250 | |
| | | | |
| | | | | | | | | | | | | | | 57,328,125 | |
| | | | | | | | | | | | | | | | |
| | | | |
| Pharmaceuticals: 0.56% | | | | | | | | | | | | | | | | |
Mylan Incorporated 144A | | | 7.88 | | | | 07/15/2020 | | | | 4,000,000 | | | | 4,470,000 | |
| | | | | | | | | | | | | | | | |
| | | | |
Industrials: 9.52% | | | | | | | | | | | | | | | | |
| | | | |
| Aerospace & Defense: 1.24% | | | | | | | | | | | | | | | | |
Esterline Technologies Corporation | | | 7.00 | | | | 08/01/2020 | | | | 3,750,000 | | | | 4,143,750 | |
Hexcel Corporation | | | 6.75 | | | | 02/01/2015 | | | | 872,000 | | | | 879,630 | |
Spirit AeroSystems Holdings Incorporated | | | 7.50 | | | | 10/01/2017 | | | | 4,500,000 | | | | 4,893,750 | |
| | | | |
| | | | | | | | | | | | | | | 9,917,130 | |
| | | | | | | | | | | | | | | | |
| | | | |
| Building Products: 0.59% | | | | | | | | | | | | | | | | |
Griffon Corporation | | | 7.13 | | | | 04/01/2018 | | | | 4,500,000 | | | | 4,680,000 | |
| | | | | | | | | | | | | | | | |
| | | | |
| Commercial Services & Supplies: 2.56% | | | | | | | | | | | | | | | | |
Clarke American Incorporated | | | 9.50 | | | | 05/15/2015 | | | | 5,225,000 | | | | 4,114,688 | |
Deluxe Corporation | | | 7.00 | | | | 03/15/2019 | | | | 6,300,000 | | | | 6,378,750 | |
Iron Mountain Incorporated | | | 7.75 | | | | 10/01/2019 | | | | 1,000,000 | | | | 1,105,000 | |
Iron Mountain Incorporated | | | 8.38 | | | | 08/15/2021 | | | | 3,000,000 | | | | 3,333,750 | |
Swift Services Holdings Incorporated | | | 10.00 | | | | 11/15/2018 | | | | 5,000,000 | | | | 5,468,750 | |
| | | | |
| | | | | | | | | | | | | | | 20,400,938 | |
| | | | | | | | | | | | | | | | |
| | | | |
| Construction & Engineering: 0.52% | | | | | | | | | | | | | | | | |
Great Lakes Dredge & Dock Company | | | 7.38 | | | | 02/01/2019 | | | | 4,000,000 | | | | 4,170,000 | |
| | | | | | | | | | | | | | | | |
The accompanying notes are an integral part of these financial statements.
| | | | |
| 12 | | Wells Fargo Advantage High Income Fund | | Portfolio of Investments—February 29, 2012 (Unaudited) |
| | | | | | | | | | | | | | | | |
| Security Name | | Interest Rate | | | Maturity Date | | | Principal | | | Value | |
| | | | | | | | | | | | | | | | |
| | | | |
| Electrical Equipment: 0.62% | | | | | | | | | | | | | | | | |
Belden CDT Incorporated | | | 7.00 | % | | | 03/15/2017 | | | $ | 2,730,000 | | | $ | 2,811,900 | |
Belden CDT Incorporated | | | 9.25 | | | | 06/15/2019 | | | | 2,000,000 | | | | 2,160,000 | |
| | | | |
| | | | | | | | | | | | | | | 4,971,900 | |
| | | | | | | | | | | | | | | | |
| | | | |
| Machinery: 2.42% | | | | | | | | | | | | | | | | |
Briggs & Stratton Corporation | | | 6.88 | | | | 12/15/2020 | | | | 2,970,000 | | | | 3,140,775 | |
Manitowoc Company Incorporated | | | 8.50 | | | | 11/01/2020 | | | | 4,000,000 | | | | 4,460,000 | |
RSC Equipment Rental Incorporated | | | 8.25 | | | | 02/01/2021 | | | | 4,000,000 | | | | 4,240,000 | |
United Rentals Financing Escrow Corporation 144A | | | 7.38 | | | | 05/15/2020 | | | | 500,000 | | | | 513,125 | |
United Rentals Financing Escrow Corporation 144A | | | 7.63 | | | | 04/15/2022 | | | | 500,000 | | | | 517,500 | |
United Rentals North America Incorporated « | | | 8.38 | | | | 09/15/2020 | | | | 6,250,000 | | | | 6,468,750 | |
| | | | |
| | | | | | | | | | | | | | | 19,340,150 | |
| | | | | | | | | | | | | | | | |
| | | | |
| Professional Services: 1.57% | | | | | | | | | | | | | | | | |
Checkout Holdings Corporation 144A(z) | | | 8.39 | | | | 11/15/2015 | | | | 3,000,000 | | | | 1,350,000 | |
FTI Consulting Incorporated | | | 6.75 | | | | 10/01/2020 | | | | 3,300,000 | | | | 3,568,125 | |
FTI Consulting Incorporated | | | 7.75 | | | | 10/01/2016 | | | | 2,600,000 | | | | 2,707,250 | |
West Corporation | | | 7.88 | | | | 01/15/2019 | | | | 2,000,000 | | | | 2,162,500 | |
West Corporation | | | 8.63 | | | | 10/01/2018 | | | | 2,500,000 | | | | 2,743,750 | |
| | | | |
| | | | | | | | | | | | | | | 12,531,625 | |
| | | | | | | | | | | | | | | | |
| | | | |
Information Technology: 0.47% | | | | | | | | | | | | | | | | |
| | | | |
| Internet Software & Services: 0.04% | | | | | | | | | | | | | | | | |
Equinix Incorporated | | | 7.00 | | | | 07/15/2021 | | | | 250,000 | | | | 276,250 | |
| | | | | | | | | | | | | | | | |
| | | | |
| Semiconductors & Semiconductor Equipment: 0.43% | | | | | | | | | | | | | | | | |
Freescale Semiconductor Incorporated | | | 8.05 | | | | 02/01/2020 | | | | 3,500,000 | | | | 3,465,000 | |
| | | | | | | | | | | | | | | | |
| | | | |
Materials: 5.60% | | | | | | | | | | | | | | | | |
| | | | |
| Chemicals: 0.31% | | | | | | | | | | | | | | | | |
Polyone Corporation | | | 7.38 | | | | 09/15/2020 | | | | 2,250,000 | | | | 2,424,375 | |
| | | | | | | | | | | | | | | | |
| | | | |
| Construction Materials: 0.36% | | | | | | | | | | | | | | | | |
Headwaters Incorporated | | | 7.63 | | | | 04/01/2019 | | | | 3,000,000 | | | | 2,880,000 | |
| | | | | | | | | | | | | | | | |
| | | | |
| Containers & Packaging: 2.89% | | | | | | | | | | | | | | | | |
Berry Plastics Corporation | | | 9.75 | | | | 01/15/2021 | | | | 5,500,000 | | | | 5,885,000 | |
BWAY Corporation | | | 10.00 | | | | 06/15/2018 | | | | 4,000,000 | | | | 4,440,000 | |
Reynolds Group Holdings 144A | | | 7.13 | | | | 04/15/2019 | | | | 4,500,000 | | | | 4,758,750 | |
Reynolds Group Holdings 144A | | | 7.88 | | | | 08/15/2019 | | | | 1,000,000 | | | | 1,095,000 | |
Reynolds Group Holdings 144A | | | 8.25 | | | | 02/15/2021 | | | | 4,000,000 | | | | 3,820,000 | |
Reynolds Group Holdings 144A | | | 9.88 | | | | 08/15/2019 | | | | 1,000,000 | | | | 1,033,750 | |
Reynolds Group Holdings 144A | | | 9.88 | | | | 08/15/2019 | | | | 2,000,000 | | | | 2,067,500 | |
| | | | |
| | | | | | | | | | | | | | | 23,100,000 | |
| | | | | | | | | | | | | | | | |
| | | | |
| Paper & Forest Products: 2.04% | | | | | | | | | | | | | | | | |
ABI Escrow Corporation 144A | | | 10.25 | | | | 10/15/2018 | | | | 2,758,000 | | | | 3,151,015 | |
Appleton Papers Incorporated 144A | | | 10.50 | | | | 06/15/2015 | | | | 1,000,000 | | | | 1,022,500 | |
Appleton Papers Incorporated | | | 11.25 | | | | 12/15/2015 | | | | 1,634,000 | | | | 1,478,770 | |
The accompanying notes are an integral part of these financial statements.
| | | | | | |
| Portfolio of Investments—February 29, 2012 (Unaudited) | | Wells Fargo Advantage High Income Fund | | | 13 | |
| | | | | | | | | | | | | | | | |
| Security Name | | Interest Rate | | | Maturity Date | | | Principal | | | Value | |
| | | | | | | | | | | | | | | | |
| | | | |
| Paper & Forest Products (continued) | | | | | | | | | | | | | | | | |
Boise Paper Holdings LLC | | | 9.00 | % | | | 11/01/2017 | | | $ | 3,750,000 | | | $ | 4,125,000 | |
Domtar Corporation | | | 10.75 | | | | 06/01/2017 | | | | 3,065,000 | | | | 3,984,500 | |
P.H. Glatfelter Company | | | 7.13 | | | | 05/01/2016 | | | | 2,485,000 | | | | 2,540,913 | |
| | | | |
| | | | | | | | | | | | | | | 16,302,698 | |
| | | | | | | | | | | | | | | | |
| | | | |
Telecommunication Services: 5.70% | | | | | | | | | | | | | | | | |
| | | | |
| Diversified Telecommunication Services: 3.91% | | | | | | | | | | | | | | | | |
Cincinnati Bell Incorporated | | | 8.38 | | | | 10/15/2020 | | | | 3,000,000 | | | | 3,067,500 | |
Cincinnati Bell Incorporated | | | 8.75 | | | | 03/15/2018 | | | | 4,000,000 | | | | 3,810,000 | |
Frontier Communications Corporation | | | 8.25 | | | | 04/15/2017 | | | | 4,000,000 | | | | 4,320,000 | |
Frontier Communications Corporation | | | 8.75 | | | | 04/15/2022 | | | | 2,000,000 | | | | 2,175,000 | |
Level 3 Communications Incorporated | | | 11.88 | | | | 02/01/2019 | | | | 4,000,000 | | | | 4,550,000 | |
Level 3 Financing Incorporated 144A | | | 8.63 | | | | 07/15/2020 | | | | 1,000,000 | | | | 1,067,500 | |
PAETEC Holding Corporation | | | 9.88 | | | | 12/01/2018 | | | | 3,750,000 | | | | 4,200,000 | |
TW Telecommunications Holdings Incorporated | | | 8.00 | | | | 03/01/2018 | | | | 3,500,000 | | | | 3,836,875 | |
Windstream Corporation | | | 7.50 | | | | 04/01/2023 | | | | 4,000,000 | | | | 4,210,000 | |
| | | | |
| | | | | | | | | | | | | | | 31,236,875 | |
| | | | | | | | | | | | | | | | |
| | | | |
| Wireless Telecommunication Services: 1.79% | | | | | | | | | | | | | | | | |
Cricket Communications Incorporated | | | 7.75 | | | | 10/15/2020 | | | | 4,000,000 | | | | 3,980,000 | |
MetroPCS Communications Incorporated | | | 6.63 | | | | 11/15/2020 | | | | 3,015,000 | | | | 3,105,450 | |
Sprint Capital Corporation | | | 6.90 | | | | 05/01/2019 | | | | 2,600,000 | | | | 2,301,000 | |
Sprint Capital Corporation | | | 8.75 | | | | 03/15/2032 | | | | 3,000,000 | | | | 2,670,000 | |
Sprint Nextel Corporation | | | 6.00 | | | | 12/01/2016 | | | | 2,425,000 | | | | 2,206,750 | |
| | | | |
| | | | | | | | | | | | | | | 14,263,200 | |
| | | | | | | | | | | | | | | | |
| | | | |
Utilities: 4.43% | | | | | | | | | | | | | | | | |
| | | | |
| Electric Utilities: 0.71% | | | | | | | | | | | | | | | | |
Dolphin Subsidiary II Incorporated 144A | | | 7.25 | | | | 10/15/2021 | | | | 5,000,000 | | | | 5,700,000 | |
| | | | | | | | | | | | | | | | |
| | | | |
| Independent Power Producers & Energy Traders: 3.72% | | | | | | | | | | | | | | | | |
Calpine Corporation 144A | | | 7.50 | | | | 02/15/2021 | | | | 4,000,000 | | | | 4,340,000 | |
Calpine Corporation 144A | | | 7.88 | | | | 01/15/2023 | | | | 2,000,000 | | | | 2,180,000 | |
Energy Future Holdings Corporation | | | 10.00 | | | | 01/15/2020 | | | | 4,000,000 | | | | 4,325,000 | |
Energy Future Holdings Corporation 144A« | | | 11.75 | | | | 03/01/2022 | | | | 5,000,000 | | | | 5,125,000 | |
Mirant Americas Generation LLC « | | | 8.50 | | | | 10/01/2021 | | | | 5,200,000 | | | | 4,732,000 | |
NRG Energy Incorporated | | | 8.25 | | | | 09/01/2020 | | | | 3,000,000 | | | | 3,037,500 | |
NRG Energy Incorporated | | | 8.50 | | | | 06/15/2019 | | | | 4,000,000 | | | | 4,090,000 | |
RRI Energy Incorporated | | | 7.88 | | | | 06/15/2017 | | | | 2,000,000 | | | | 1,855,000 | |
| | | | |
| | | | | | | | | | | | | | | 29,684,500 | |
| | | | | | | | | | | | | | | | |
| | | | |
Total Corporate Bonds and Notes (Cost $620,903,123) | | | | | | | | | | | | | | | 649,756,264 | |
| | | | | | | | | | | | | | | | |
| | | | |
Municipal Bonds and Notes: 0.41% | | | | | | | | | | | | | | | | |
| | | | |
| Florida: 0.41% | | | | | | | | | | | | | | | | |
Florida Development Financial Corporation Renaissance Charter School Project Series 2011B (Resource Recovery Revenue) § | | | 8.00 | | | | 12/15/2018 | | | | 3,180,000 | | | | 3,249,356 | |
| | | | | | | | | | | | | | | | |
| | | | |
Total Municipal Bonds and Notes (Cost $3,180,000) | | | | | | | | | | | | | | | 3,249,356 | |
| | | | | | | | | | | | | | | | |
The accompanying notes are an integral part of these financial statements.
| | | | |
| 14 | | Wells Fargo Advantage High Income Fund | | Portfolio of Investments—February 29, 2012 (Unaudited) |
| | | | | | | | | | | | | | | | |
| Security Name | | Interest Rate | | | Maturity Date | | | Principal | | | Value | |
| | | | | | | | | | | | | | | | |
| | | | |
| Term Loans: 2.71% | | | | | | | | | | | | | | | | |
Chrysler Group LLC | | | 6.00 | % | | | 05/24/2017 | | | $ | 5,970,000 | | | $ | 5,984,209 | |
Dynegy Holdings Incorporated | | | 9.25 | | | | 08/04/2016 | | | | 1,995,000 | | | | 2,057,843 | |
Dynegy Holdings Incorporated | | | 9.25 | | | | 08/04/2016 | | | | 997,500 | | | | 991,894 | |
Goodman Global Holdings Incorporated | | | 9.00 | | | | 10/30/2017 | | | | 2,545,455 | | | | 2,585,240 | |
Goodyear Tire & Rubber Company | | | 1.75 | | | | 04/30/2014 | | | | 450,000 | | | | 442,688 | |
Harrah’s Entertainment Corporation | | | 3.24 | | | | 01/28/2015 | | | | 10,000,000 | | | | 9,370,000 | |
HCA Incorporated | | | 2.49 | | | | 11/18/2013 | | | | 251,131 | | | | 249,720 | |
| | | | |
Total Term Loans (Cost $21,682,939) | | | | | | | | | | | | | | | 21,681,594 | |
| | | | | | | | | | | | | | | | |
| | | | |
| | | | | | Expiration Date | | | Shares | | | | |
| Warrants: 0.00% | | | | | | | | | | | | | | | | |
| | | | |
Information Technology: 0.00% | | | | | | | | | | | | | | | | |
| | | | |
| IT Services: 0.00% | | | | | | | | | | | | | | | | |
Muzak Holdings LLC (a)† | | | | | | | 02/01/2015 | | | | 7,195 | | | | 2,302 | |
| | | | | | | | | | | | | | | | |
| | | | |
Total Warrants (Cost $0) | | | | | | | | | | | | | | | 2,302 | |
| | | | | | | | | | | | | | | | |
| | | | |
| | | | | | Maturity Date | | | Principal | | | | |
| Yankee Corporate Bonds and Notes: 8.05% | | | | | | | | | | | | | | | | |
| | | | |
Consumer Discretionary: 1.41% | | | | | | | | | | | | | | | | |
| | | | |
| Automobiles: 0.45% | | | | | | | | | | | | | | | | |
Jaguar Land Rover plc 144A | | | 8.13 | | | | 05/15/2021 | | | $ | 3,500,000 | | | | 3,613,750 | |
| | | | | | | | | | | | | | | | |
| | | | |
| Media: 0.96% | | | | | | | | | | | | | | | | |
Intelsat Limited | | | 11.50 | | | | 02/04/2017 | | | | 3,916,796 | | | | 4,034,300 | |
UPCB Finance Limited 144A | | | 7.25 | | | | 11/15/2021 | | | | 1,000,000 | | | | 1,052,500 | |
Videotron Limited 144A | | | 5.00 | | | | 07/15/2022 | | | | 1,500,000 | | | | 1,500,000 | |
Virgin Media Finance plc | | | 5.25 | | | | 02/15/2022 | | | | 1,000,000 | | | | 1,020,000 | |
| | | | |
| | | | | | | | | | | | | | | 7,606,800 | |
| | | | | | | | | | | | | | | | |
| | | | |
Energy: 1.20% | | | | | | | | | | | | | | | | |
| | | | |
| Oil, Gas & Consumable Fuels: 1.20% | | | | | | | | | | | | | | | | |
Kodiak Oil & Gas Corporation 144A | | | 8.13 | | | | 12/01/2019 | | | | 4,000,000 | | | | 4,280,000 | |
Petrobakken Energy Limited 144A | | | 8.63 | | | | 02/01/2020 | | | | 5,000,000 | | | | 5,312,500 | |
| | | | |
| | | | | | | | | | | | | | | 9,592,500 | |
| | | | | | | | | | | | | | | | |
| | | | |
Financials: 1.40% | | | | | | | | | | | | | | | | |
| | | | |
| Consumer Finance: 0.76% | | | | | | | | | | | | | | | | |
National Money Mart Company | | | 10.38 | | | | 12/15/2016 | | | | 5,500,000 | | | | 6,098,125 | |
| | | | | | | | | | | | | | | | |
| | | | |
| Diversified Financial Services: 0.64% | | | | | | | | | | | | | | | | |
Aircastle Limited | | | 9.75 | | | | 08/01/2018 | | | | 4,500,000 | | | | 5,073,750 | |
| | | | | | | | | | | | | | | | |
| | | | |
Information Technology: 1.24% | | | | | | | | | | | | | | | | |
| | | | |
| Semiconductors & Semiconductor Equipment: 1.24% | | | | | | | | | | | | | | | | |
Magnachip Semiconductor Limited | | | 10.50 | | | | 04/15/2018 | | | | 5,175,000 | | | | 5,711,906 | |
Sensata Technologies BV 144A | | | 6.50 | | | | 05/15/2019 | | | | 4,000,000 | | | | 4,230,000 | |
| | | | |
| | | | | | | | | | | | | | | 9,941,906 | |
| | | | | | | | | | | | | | | | |
The accompanying notes are an integral part of these financial statements.
| | | | | | |
| Portfolio of Investments—February 29, 2012 (Unaudited) | | Wells Fargo Advantage High Income Fund | | | 15 | |
| | | | | | | | | | | | | | | | |
| Security Name | | Interest Rate | | | Maturity Date | | | Principal | | | Value | |
| | | | | | | | | | | | | | | | |
| | | | |
Materials: 2.28% | | | | | | | | | | | | | | | | |
| | | | |
| Chemicals: 1.20% | | | | | | | | | | | | | | | | |
Ineos Group Holdings plc 144A | | | 8.38 | % | | | 02/15/2019 | | | $ | 1,000,000 | | | $ | 1,062,500 | |
Ineos Group Holdings plc 144A | | | 8.50 | | | | 02/15/2016 | | | | 4,490,000 | | | | 4,097,125 | |
Rhodia SA 144A | | | 6.88 | | | | 09/15/2020 | | | | 4,000,000 | | | | 4,420,000 | |
| | | | |
| | | | | | | | | | | | | | | 9,579,625 | |
| | | | | | | | | | | | | | | | |
| | | | |
| Metals & Mining: 0.61% | | | | | | | | | | | | | | | | |
FMG Resources Limited 144A | | | 6.88 | | | | 02/01/2018 | | | | 1,000,000 | | | | 1,055,000 | |
FMG Resources Limited 144A | | | 7.00 | | | | 11/01/2015 | | | | 3,600,000 | | | | 3,807,000 | |
| | | | |
| | | | | | | | | | | | | | | 4,862,000 | |
| | | | | | | | | | | | | | | | |
| | | | |
| Paper & Forest Products: 0.47% | | | | | | | | | | | | | | | | |
Sappi Papier Holding GmbH 144A | | | 6.63 | | | | 04/15/2021 | | | | 4,000,000 | | | | 3,750,000 | |
| | | | | | | | | | | | | | | | |
| | | | |
Telecommunication Services: 0.52% | | | | | | | | | | | | | | | | |
| | | | |
| Wireless Telecommunication Services: 0.52% | | | | | | | | | | | | | | | | |
Wind Acquisition Finance SA 144A | | | 12.25 | | | | 07/15/2017 | | | | 4,738,380 | | | | 4,134,237 | |
| | | | | | | | | | | | | | | | |
| | | | |
Total Yankee Corporate Bonds and Notes (Cost $62,937,366) | | | | | | | | | | | | | | | 64,252,693 | |
| | | | | | | | | | | | | | | | |
| | | | |
Other: 0.11% | | | | | | | | | | | | | | | | |
Gryphon Funding Limited, Pass-Through Entity (i)(a)(v) | | | | | | | | | | | 1,106,593 | | | | 298,780 | |
VFNC Corporation, Pass-Through Entity 0.24% 144A(i)(a)(v)± | | | | | | | | | | | 1,283,387 | | | | 551,857 | |
| | | | |
Total Other (Cost $372,032) | | | | | | | | | | | | | | | 850,637 | |
| | | | | | | | | | | | | | | | |
| | | | |
| | | Yield | | | | | | Shares | | | | |
| Short-Term Investments: 7.74% | | | | | | | | | | | | | | | | |
| | | | |
| Investment Companies: 7.74% | | | | | | | | | | | | | | | | |
Wells Fargo Advantage Cash Investment Money Market Fund, Institutional Class (u)(l) | | | 0.02 | | | | | | | | 52,511,475 | | | | 52,511,475 | |
Wells Fargo Securities Lending Cash Investments, LLC (v)(u)(l)(r) | | | 0.15 | | | | | | | | 9,249,208 | | | | 9,249,208 | |
| | | | |
Total Short-Term Investments (Cost $61,760,683) | | | | | | | | | | | | | | | 61,760,683 | |
| | | | | | | | | | | | | | | | |
| | | | | | | | |
| Total Investments in Securities | | | | | | | | |
| (Cost $770,836,143) * | | | 100.40 | % | | | 801,553,529 | |
Other Assets and Liabilities, Net | | | (0.40 | ) | | | (3,174,137 | ) |
| | | | | | | | |
| Total Net Assets | | | 100.00 | % | | $ | 798,379,392 | |
| | | | | | | | |
The accompanying notes are an integral part of these financial statements.
| | | | |
| 16 | | Wells Fargo Advantage High Income Fund | | Portfolio of Investments—February 29, 2012 (Unaudited) |
| 144A | Security that may be resold to “qualified institutional buyers” under Rule 144A or security offered pursuant to Section 4(2) of the Securities Act of 1933, as amended. |
| « | All or a portion of this security is on loan. |
| (z) | Zero coupon security. Rate represents yield to maturity. |
| § | These securities are subject to a demand feature which reduces the effective maturity. |
| (a) | Security is fair valued by the Management Valuation Team, and in certain instances by the Board of Trustees, in accordance with procedures approved by the Board of Trustees. |
| † | Non-income producing security |
| (v) | Security represents investment of cash collateral received from securities on loan. |
| ± | Variable rate investment. |
| (u) | Rate shown is the 7-day annualized yield at period end. |
| (l) | Investment in an affiliate. |
| (r) | The investment company is exempt from registration under Section 3(c)(7) of the 1940 Act. |
| * | Cost for federal income tax purposes is $771,612,741 and net unrealized appreciation (depreciation) consists of: |
| | | | |
Gross unrealized appreciation | | $ | 41,055,077 | |
Gross unrealized depreciation | | | (11,114,289 | ) |
| | | | |
Net unrealized appreciation | | $ | 29,940,788 | |
The accompanying notes are an integral part of these financial statements.
| | | | | | |
| Statement of Assets and Liabilities—February 29, 2012 (Unaudited) | | Wells Fargo Advantage High Income Fund | | | 17 | |
| | | | |
| | | | |
| |
Assets | | | | |
Investments | | | | |
In unaffiliated securities (including securities on loan), at value (see cost below) | | $ | 739,792,846 | |
In affiliated securities, at value (see cost below) | | | 61,760,683 | |
| | | | |
Total investments, at value (see cost below) | | | 801,553,529 | |
Receivable for investments sold | | | 250,000 | |
Receivable for Fund shares sold | | | 1,476,643 | |
Receivable for interest | | | 14,683,171 | |
Receivable for securities lending income | | | 5,450 | |
Prepaid expenses and other assets | | | 77,314 | |
| | | | |
Total assets | | | 818,046,107 | |
| | | | |
| |
Liabilities | | | | |
Dividends payable | | | 1,540,127 | |
Payable for investments purchased | | | 5,500,000 | |
Payable for Fund shares redeemed | | | 2,536,322 | |
Payable upon receipt of securities loaned | | | 9,621,240 | |
Advisory fee payable | | | 233,095 | |
Distribution fees payable | | | 19,963 | |
Due to other related parties | | | 90,250 | |
Accrued expenses and other liabilities | | | 125,718 | |
| | | | |
Total liabilities | | | 19,666,715 | |
| | | | |
Total net assets | | $ | 798,379,392 | |
| | | | |
| |
NET ASSETS CONSIST OF | | | | |
Paid-in capital | | $ | 775,456,098 | |
Overdistributed net investment income | | | (158,026 | ) |
Accumulated net realized losses on investments | | | (7,636,066 | ) |
Net unrealized gains on investments | | | 30,717,386 | |
| | | | |
Total net assets | | $ | 798,379,392 | |
| | | | |
| |
COMPUTATION OF NET ASSET VALUE AND OFFERING PRICE PER SHARE1 | | | | |
Net assets – Class A | | $ | 123,618,747 | |
Shares outstanding – Class A | | | 16,472,039 | |
Net asset value per share – Class A | | | $7.50 | |
Maximum offering price per share – Class A2 | | | $7.85 | |
Net assets – Class B | | $ | 1,828,905 | |
Shares outstanding – Class B | | | 243,771 | |
Net asset value per share – Class B | | | $7.50 | |
Net assets – Class C | | $ | 32,224,261 | |
Shares outstanding – Class C | | | 4,294,300 | |
Net asset value per share – Class C | | | $7.50 | |
Net assets – Administrator Class | | $ | 17,561,913 | |
Shares outstanding – Administrator Class | | | 2,318,933 | |
Net asset value per share – Administrator Class | | | $7.57 | |
Net assets – Institutional Class | | $ | 304,485,385 | |
Shares outstanding – Institutional Class | | | 40,212,220 | |
Net asset value per share – Institutional Class | | | $7.57 | |
Net assets – Investor Class | | $ | 318,660,181 | |
Shares outstanding – Investor Class | | | 42,295,632 | |
Net asset value per share – Investor Class | | | $7.53 | |
| |
Investments in unaffiliated securities, at cost | | $ | 709,075,460 | |
| | | | |
Investments in affiliated securities, at cost | | $ | 61,760,683 | |
| | | | |
Total investments, at cost | | $ | 770,836,143 | |
| | | | |
Securities on loan, at value | | $ | 9,422,576 | |
| | | | |
| 1. | The Fund has an unlimited number of authorized shares. |
| 2. | Maximum offering price is computed as 100/95.50 of net asset value. On investments of $50,000 or more, the offering price is reduced. |
The accompanying notes are an integral part of these financial statements.
| | | | |
| 18 | | Wells Fargo Advantage High Income Fund | | Statement of Operations—Six Months Ended February 29, 2012 (Unaudited) |
| | | | |
| | | | |
| |
Investment income | | | | |
Interest | | $ | 26,200,108 | |
Income from affiliated securities | | | 25,933 | |
Securities lending income, net | | | 25,866 | |
| | | | |
Total investment income | | | 26,251,907 | |
| | | | |
| |
Expenses | | | | |
Advisory fee | | | 1,744,059 | |
Administration fees | | | | |
Fund level | | | 177,042 | |
Class A | | | 88,284 | |
Class B | | | 1,628 | |
Class C | | | 24,419 | |
Administrator Class | | | 8,538 | |
Institutional Class | | | 105,500 | |
Investor Class | | | 270,208 | |
Shareholder servicing fees | | | | |
Class A | | | 137,943 | |
Class B | | | 2,544 | |
Class C | | | 38,155 | |
Administrator Class | | | 17,567 | |
Investor Class | | | 355,537 | |
Distribution fees | | | | |
Class B | | | 7,630 | |
Class C | | | 114,465 | |
Custody and accounting fees | | | 26,024 | |
Professional fees | | | 23,145 | |
Registration fees | | | 34,631 | |
Shareholder report expenses | | | 44,033 | |
Trustees’ fees and expenses | | | 7,347 | |
Other fees and expenses | | | 14,739 | |
| | | | |
Total expenses | | | 3,243,438 | |
Less: Fee waivers and/or expense reimbursements | | | (428,539 | ) |
| | | | |
Net expenses | | | 2,814,899 | |
| | | | |
Net investment income | | | 23,437,008 | |
| | | | |
| |
REALIZED AND UNREALIZED GAINS (LOSSES) ON INVESTMENTS | | | | |
Net realized losses on investments | | | (2,982,618 | ) |
Net change in unrealized gains (losses) on investments | | | 37,442,025 | |
| | | | |
Net realized and unrealized gains (losses) on investments | | | 34,459,407 | |
| | | | |
Net increase in net assets resulting from operations | | $ | 57,896,415 | |
| | | | |
The accompanying notes are an integral part of these financial statements.
| | | | | | |
| Statements of Changes in Net Assets | | Wells Fargo Advantage High Income Fund | | | 19 | |
| | | | | | | | | | | | | | | | |
| | | Six Months Ended February 29, 2012 (Unaudited) | | | Year Ended August 31, 2011 | |
| | | | |
Operations | | | | | | | | | | | | | | | | |
Net investment income | | | | | | $ | 23,437,008 | | | | | | | $ | 49,117,488 | |
Net realized gains (losses) on investments | | | | | | | (2,982,618 | ) | | | | | | | 30,277,310 | |
Net change in unrealized gains (losses) on investments | | | | | | | 37,442,025 | | | | | | | | (26,271,970 | ) |
| | | | | | | | | | | | | | | | |
Net increase in net assets resulting from operations | | | | | | | 57,896,415 | | | | | | | | 53,122,828 | |
| | | | | | | | | | | | | | | | |
| | | | |
Distributions to shareholders from | | | | | | | | | | | | | | | | |
Net investment income | | | | | | | | | | | | | | | | |
Class A | | | | | | | (3,589,786 | ) | | | | | | | (7,960,520 | ) |
Class B | | | | | | | (58,808 | ) | | | | | | | (235,298 | ) |
Class C | | | | | | | (880,332 | ) | | | | | | | (1,934,271 | ) |
Administrator Class | | | | | | | (564,190 | ) | | | | | | | (1,371,513 | ) |
Institutional Class | | | | | | | (9,118,259 | ) | | | | | | | (15,754,833 | ) |
Investor Class | | | | | | | (9,225,632 | ) | | | | | | | (21,932,524 | ) |
| | | | | | | | | | | | | | | | |
Total distributions to shareholders | | | | | | | (23,437,007 | ) | | | | | | | (49,188,959 | ) |
| | | | | | | | | | | | | | | | |
| | | | |
Capital share transactions | | | Shares | | | | | | | | Shares | | | | | |
Proceeds from shares sold | | | | | | | | |
Class A | | | 4,962,450 | | | | 35,748,415 | | | | 6,258,624 | | | | 46,384,591 | |
Class B | | | 35,060 | | | | 253,147 | | | | 92,007 | | | | 681,587 | |
Class C | | | 411,650 | | | | 2,981,164 | | | | 948,202 | | | | 7,054,076 | |
Administrator Class | | | 2,430,130 | | | | 17,171,308 | | | | 6,389,932 | | | | 48,011,300 | |
Institutional Class | | | 10,232,037 | | | | 74,588,941 | | | | 12,145,944 | | | | 90,366,875 | |
Investor Class | | | 13,495,809 | | | | 97,600,804 | | | | 15,063,197 | | | | 111,996,067 | |
| | | | | | | | | | | | | | | | |
| | | | | | | 228,343,779 | | | | | | | | 304,494,496 | |
| | | | | | | | | | | | | | | | |
Reinvestment of distributions | | | | | | | | |
Class A | | | 394,518 | | | | 2,857,070 | | | | 859,120 | | | | 6,383,122 | |
Class B | | | 5,227 | | | | 37,703 | | | | 22,922 | | | | 170,127 | |
Class C | | | 88,768 | | | | 641,768 | | | | 168,392 | | | | 1,251,327 | |
Administrator Class | | | 60,697 | | | | 443,410 | | | | 119,405 | | | | 899,379 | |
Institutional Class | | | 449,101 | | | | 3,280,386 | | | | 814,266 | | | | 6,108,680 | |
Investor Class | | | 1,051,060 | | | | 7,635,226 | | | | 2,438,276 | | | | 18,192,349 | |
| | | | | | | | | | | | | | | | |
| | | | | | | 14,895,563 | | | | | | | | 33,004,984 | |
| | | | | | | | | | | | | | | | |
Payment for shares redeemed | | | | | | | | |
Class A | | | (3,156,541 | ) | | | (22,746,187 | ) | | | (10,325,164 | ) | | | (76,518,643 | ) |
Class B | | | (138,448 | ) | | | (993,731 | ) | | | (537,216 | ) | | | (3,992,287 | ) |
Class C | | | (479,055 | ) | | | (3,443,877 | ) | | | (1,094,229 | ) | | | (8,118,360 | ) |
Administrator Class | | | (2,196,869 | ) | | | (16,006,126 | ) | | | (4,485,754 | ) | | | (33,637,272 | ) |
Institutional Class | | | (3,423,837 | ) | | | (24,871,414 | ) | | | (7,386,260 | ) | | | (55,266,998 | ) |
Investor Class | | | (10,862,682 | ) | | | (77,884,950 | ) | | | (23,838,049 | ) | | | (176,970,160 | ) |
| | | | | | | | | | | | | | | | |
| | | | | | | (145,946,285 | ) | | | | | | | (354,503,720 | ) |
| | | | | | | | | | | | | | | | |
Net increase (decrease) in net assets resulting
from capital share transactions | | | | | | | 97,293,057 | | | | | | | | (17,004,240 | ) |
| | | | | | | | | | | | | | | | |
Total increase (decrease) in net assets | | | | | | | 131,752,465 | | | | | | | | (13,070,371 | ) |
| | | | | | | | | | | | | | | | |
| | | | |
Net assets | | | | | | | | | | | | | | | | |
Beginning of period | | | | | | | 666,626,927 | | | | | | | | 679,697,298 | |
| | | | | | | | | | | | | | | | |
End of period | | | | | | $ | 798,379,392 | | | | | | | $ | 666,626,927 | |
| | | | | | | | | | | | | | | | |
Overdistributed net investment income | | | | | | $ | (158,026 | ) | | | | | | $ | (158,027 | ) |
| | | | | | | | | | | | | | | | |
The accompanying notes are an integral part of these financial statements.
| | | | |
| 20 | | Wells Fargo Advantage High Income Fund | | Financial Highlights |
(For a share outstanding throughout each period)
| | | | | | | | | | | | | | | | | | | | | | | | | | | | |
| | | Six Months Ended
February 29, 2012 (Unaudited) | | | Year Ended August 31, | | | Year Ended May 31, | |
| Class A | | | 2011 | | | 20101 | | | 2010 | | | 20092 | | | 20082 | | | 20072 | |
Net asset value, beginning of period | | $ | 7.17 | | | $ | 7.14 | | | $ | 6.90 | | | $ | 6.35 | | | $ | 7.25 | | | $ | 7.89 | | | $ | 7.63 | |
Net investment income | | | 0.23 | | | | 0.50 | | | | 0.13 | | | | 0.53 | | | | 0.50 | | | | 0.53 | | | | 0.55 | |
Net realized and unrealized gains (losses)
on investments | | | 0.33 | | | | 0.03 | | | | 0.24 | | | | 0.54 | | | | (0.90 | ) | | | (0.64 | ) | | | 0.26 | |
| | | | | | | | | | | | | | | | | | | | | | | | | | | | |
Total from investment operations | | | 0.56 | | | | 0.53 | | | | 0.37 | | | | 1.07 | | | | (0.40 | ) | | | (0.11 | ) | | | 0.81 | |
Distributions to shareholders from | | | | | | | | | | | | | | | | | | | | | | | | | | | | |
Net investment income | | | (0.23 | ) | | | (0.50 | ) | | | (0.13 | ) | | | (0.52 | ) | | | (0.50 | ) | | | (0.53 | ) | | | (0.55 | ) |
Net asset value, end of period | | $ | 7.50 | | | $ | 7.17 | | | $ | 7.14 | | | $ | 6.90 | | | $ | 6.35 | | | $ | 7.25 | | | $ | 7.89 | |
Total return3 | | | 8.03 | % | | | 7.41 | % | | | 5.44 | % | | | 17.20 | % | | | (5.07 | )% | | | (1.40 | )% | | | 10.96 | % |
Ratios to average net assets (annualized) | | | | | | | | | | | | | | | | | | | | | | | | | | | | |
Gross expenses | | | 0.99 | % | | | 1.01 | % | | | 1.00 | % | | | 1.03 | % | | | 1.05 | % | | | 1.19 | % | | | 1.16 | % |
Net expenses | | | 0.90 | % | | | 0.90 | % | | | 0.90 | % | | | 0.90 | % | | | 0.89 | % | | | 0.86 | % | | | 0.86 | % |
Net investment income | | | 6.51 | % | | | 6.77 | % | | | 7.52 | % | | | 7.86 | % | | | 8.13 | % | | | 7.04 | % | | | 7.07 | % |
Supplemental data | | | | | | | | | | | | | | | | | | | | | | | | | | | | |
Portfolio turnover rate | | | 8 | % | | | 78 | % | | | 11 | % | | | 77 | % | | | 52 | % | | | 53 | % | | | 82 | % |
Net assets, end of period (000’s omitted) | | | $123,619 | | | | $102,361 | | | | $124,730 | | | | $99,515 | | | | $105,678 | | | | $10,471 | | | | $115,254 | |
| 1. | For the three months ended August 31, 2010. The Fund changed its fiscal year end from May 31 to August 31, effective August 31, 2010. |
| 2. | On June 19, 2008, Advisor Class was renamed Class A. |
| 3. | Total return calculations do not include any sales charges. Returns for periods of less than one year are not annualized. |
The accompanying notes are an integral part of these financial statements.
| | | | | | |
| Financial Highlights | | Wells Fargo Advantage High Income Fund | | | 21 | |
(For a share outstanding throughout each period)
| | | | | | | | | | | | | | | | | | | | |
| | | Six Months Ended
February 29, 2012 (Unaudited) | | | Year Ended August 31, | | | Year Ended May 31, | |
| Class B | | | 2011 | | | 20101 | | | 2010 | | | 20092 | |
Net asset value, beginning of period | | $ | 7.17 | | | $ | 7.13 | | | $ | 6.90 | | | $ | 6.35 | | | $ | 6.99 | |
Net investment income | | | 0.21 | 3 | | | 0.45 | | | | 0.12 | | | | 0.48 | | | | 0.39 | |
Net realized and unrealized gains (losses) on investments | | | 0.33 | | | | 0.04 | | | | 0.23 | | | | 0.54 | | | | (0.64 | ) |
| | | | | | | | | | | | | | | | | | | | |
Total from investment operations | | | 0.54 | | | | 0.49 | | | | 0.35 | | | | 1.02 | | | | (0.25 | ) |
Distributions to shareholders from | | | | | | | | | | | | | | | | | | | | |
Net investment income | | | (0.21 | ) | | | (0.45 | ) | | | (0.12 | ) | | | (0.47 | ) | | | (0.39 | ) |
Net asset value, end of period | | $ | 7.50 | | | $ | 7.17 | | | $ | 7.13 | | | $ | 6.90 | | | $ | 6.35 | |
Total return4 | | | 7.63 | % | | | 6.76 | % | | | 5.10 | % | | | 16.33 | % | | | (3.11 | )% |
Ratios to average net assets (annualized) | | | | | | | | | | | | | | | | | | | | |
Gross expenses | | | 1.74 | % | | | 1.76 | % | | | 1.75 | % | | | 1.78 | % | | | 1.79 | % |
Net expenses | | | 1.65 | % | | | 1.65 | % | | | 1.65 | % | | | 1.65 | % | | | 1.65 | % |
Net investment income | | | 5.78 | % | | | 6.04 | % | | | 6.66 | % | | | 7.17 | % | | | 7.35 | % |
Supplemental data | | | | | | | | | | | | | | | | | | | | |
Portfolio turnover rate | | | 8 | % | | | 78 | % | | | 11 | % | | | 77 | % | | | 52 | % |
Net assets, end of period (000’s omitted) | | | $1,829 | | | | $2,452 | | | | $5,451 | | | | $4,564 | | | | $7,908 | |
| 1. | For the three months ended August 31, 2010. The Fund changed its fiscal year end from May 31 to August 31, effective August 31, 2010. |
| 2. | For the period from July 18, 2008 (commencement of class operations) to May 31, 2009. |
| 3. | Calculated based upon average shares outstanding. |
| 4. | Total return calculations do not include any sales charges. Returns for periods of less than one year are not annualized. |
The accompanying notes are an integral part of these financial statements.
| | | | |
| 22 | | Wells Fargo Advantage High Income Fund | | Financial Highlights |
(For a share outstanding throughout each period)
| | | | | | | | | | | | | | | | | | | | |
| | | Six Months Ended
February 29, 2012 (Unaudited) | | | Year Ended August 31, | | | Year Ended May 31, | |
| Class C | | | 2011 | | | 20101 | | | 2010 | | | 20092 | |
Net asset value, beginning of period | | $ | 7.17 | | | $ | 7.14 | | | $ | 6.90 | | | $ | 6.35 | | | $ | 6.99 | |
Net investment income | | | 0.21 | | | | 0.45 | | | | 0.12 | | | | 0.48 | | | | 0.39 | |
Net realized and unrealized gains (losses) on investments | | | 0.33 | | | | 0.03 | | | | 0.24 | | | | 0.54 | | | | (0.64 | ) |
| | | | | | | | | | | | | | | | | | | | |
Total from investment operations | | | 0.54 | | | | 0.48 | | | | 0.36 | | | | 1.02 | | | | (0.25 | ) |
Distributions to shareholders from | | | | | | | | | | | | | | | | | | | | |
Net investment income | | | (0.21 | ) | | | (0.45 | ) | | | (0.12 | ) | | | (0.47 | ) | | | (0.39 | ) |
Net asset value, end of period | | $ | 7.50 | | | $ | 7.17 | | | $ | 7.14 | | | $ | 6.90 | | | $ | 6.35 | |
Total return3 | | | 7.63 | % | | | 6.62 | % | | | 5.25 | % | | | 16.33 | % | | | (3.12 | )% |
Ratios to average net assets (annualized) | | | | | | | | | | | | | | | | | | | | |
Gross expenses | | | 1.74 | % | | | 1.76 | % | | | 1.75 | % | | | 1.78 | % | | | 1.79 | % |
Net expenses | | | 1.65 | % | | | 1.65 | % | | | 1.65 | % | | | 1.65 | % | | | 1.65 | % |
Net investment income | | | 5.77 | % | | | 6.01 | % | | | 6.75 | % | | | 7.04 | % | | | 7.29 | % |
Supplemental data | | | | | | | | | | | | | | | | | | | | |
Portfolio turnover rate | | | 8 | % | | | 78 | % | | | 11 | % | | | 77 | % | | | 52 | % |
Net assets, end of period (000’s omitted) | | | $32,224 | | | | $30,645 | | | | $30,332 | | | | $18,573 | | | | $13,460 | |
| 1. | For the three months ended August 31, 2010. The Fund changed its fiscal year end from May 31 to August 31, effective August 31, 2010. |
| 2. | For the period from July 18, 2008 (commencement of class operations) to May 31, 2009. |
| 3. | Total return calculations do not include any sales charges. Returns for periods of less than one year are not annualized. |
The accompanying notes are an integral part of these financial statements.
| | | | | | |
| Financial Highlights | | Wells Fargo Advantage High Income Fund | | | 23 | |
(For a share outstanding throughout each period)
| | | | | | | | | | | | |
| | | Six Months Ended
February 29, 2012 (Unaudited) | | | Year Ended August 31, | |
| Administrator Class | | | 2011 | | | 20101 | |
Net asset value, beginning of period | | $ | 7.24 | | | $ | 7.20 | | | $ | 7.23 | |
Net investment income | | | 0.24 | | | | 0.51 | | | | 0.04 | |
Net realized and unrealized gains (losses) on investments | | | 0.33 | | | | 0.04 | | | | (0.02 | ) |
| | | | | | | | | | | | |
Total from investment operations | | | 0.57 | | | | 0.55 | | | | 0.02 | |
Distributions to shareholders from | | | | | | | | | | | | |
Net investment income | | | (0.24 | ) | | | (0.51 | ) | | | (0.05 | ) |
Net asset value, end of period | | $ | 7.57 | | | $ | 7.24 | | | $ | 7.20 | |
Total return2 | | | 8.04 | % | | | 7.66 | % | | | 0.22 | % |
Ratios to average net assets (annualized) | | | | | | | | | | | | |
Gross expenses | | | 0.89 | % | | | 0.92 | % | | | 0.99 | % |
Net expenses | | | 0.79 | % | | | 0.79 | % | | | 0.84 | % |
Net investment income | | | 6.61 | % | | | 6.73 | % | | | 7.78 | % |
Supplemental data | | | | | | | | | | | | |
Portfolio turnover rate | | | 8 | % | | | 78 | % | | | 11 | % |
Net assets, end of period (000’s omitted) | | | $17,562 | | | | $14,654 | | | | $10 | |
| 1. | For the period from July 30, 2010 (commencement of class operations) to August 31, 2010. |
| 2. | Returns for periods of less than one year are not annualized. |
The accompanying notes are an integral part of these financial statements.
| | | | |
| 24 | | Wells Fargo Advantage High Income Fund | | Financial Highlights |
(For a share outstanding throughout each period)
| | | | | | | | | | | | | | | | | | | | | | | | | | | | |
| | | Six Months Ended
February 29, 2012 (Unaudited) | | | Year Ended August 31, | | | Year Ended May 31, | |
| Institutional Class | | | 2011 | | | 20101 | | | 2010 | | | 2009 | | | 2008 | | | 2007 | |
Net asset value, beginning of period | | $ | 7.24 | | | $ | 7.20 | | | $ | 6.96 | | | $ | 6.40 | | | $ | 7.31 | | | $ | 7.96 | | | $ | 7.70 | |
Net investment income | | | 0.25 | | | | 0.54 | | | | 0.14 | | | | 0.57 | | | | 0.53 | | | | 0.56 | | | | 0.59 | |
Net realized and unrealized gains (losses)
on investments | | | 0.33 | | | | 0.04 | | | | 0.24 | | | | 0.54 | | | | (0.91 | ) | | | (0.65 | ) | | | 0.26 | |
| | | | | | | | | | | | | | | | | | | | | | | | | | | | |
Total from investment operations | | | 0.58 | | | | 0.58 | | | | 0.38 | | | | 1.11 | | | | (0.38 | ) | | | (0.09 | ) | | | 0.85 | |
Distributions to shareholders from | | | | | | | | | | | | | | | | | | | | | | | | | | | | |
Net investment income | | | (0.25 | ) | | | (0.54 | ) | | | (0.14 | ) | | | (0.55 | ) | | | (0.53 | ) | | | (0.56 | ) | | | (0.59 | ) |
Net asset value, end of period | | $ | 7.57 | | | $ | 7.24 | | | $ | 7.20 | | | $ | 6.96 | | | $ | 6.40 | | | $ | 7.31 | | | $ | 7.96 | |
Total return2 | | | 8.19 | % | | | 7.98 | % | | | 5.52 | % | | | 17.76 | % | | | (4.75 | )% | | | (1.06 | )% | | | 11.39 | % |
Ratios to average net assets (annualized) | | | | | | | | | | | | | | | | | | | | | | | | | | | | |
Gross expenses | | | 0.67 | % | | | 0.68 | % | | | 0.67 | % | | | 0.68 | % | | | 0.70 | % | | | 0.80 | % | | | 0.75 | % |
Net expenses | | | 0.50 | % | | | 0.50 | % | | | 0.50 | % | | | 0.50 | % | | | 0.50 | % | | | 0.48 | % | | | 0.43 | % |
Net investment income | | | 6.91 | % | | | 7.15 | % | | | 7.94 | % | | | 8.18 | % | | | 8.42 | % | | | 8.15 | % | | | 7.53 | % |
Supplemental data | | | | | | | | | | | | | | | | | | | | | | | | | | | | |
Portfolio turnover rate | | | 8 | % | | | 78 | % | | | 11 | % | | | 77 | % | | | 52 | % | | | 53 | % | | | 82 | % |
Net assets, end of period (000’s omitted) | | | $304,485 | | | | $238,490 | | | | $197,158 | | | | $189,936 | | | | $119,004 | | | | $90,200 | | | | $242 | |
| 1. | For the three months ended August 31, 2010. The Fund changed its fiscal year end from May 31 to August 31, effective August 31, 2010. |
| 2. | Returns for periods of less than one year are not annualized. |
The accompanying notes are an integral part of these financial statements.
| | | | | | |
| Financial Highlights | | Wells Fargo Advantage High Income Fund | | | 25 | |
(For a share outstanding throughout each period)
| | | | | | | | | | | | | | | | | | | | | | | | | | | | |
| | | Six Months Ended
February 29, 2012 (Unaudited) | | | Year Ended August 31, | | | Year Ended May 31, | |
| Investor Class | | | 2011 | | | 20101 | | | 2010 | | | 2009 | | | 2008 | | | 2007 | |
Net asset value, beginning of period | | $ | 7.20 | | | $ | 7.16 | | | $ | 6.93 | | | $ | 6.37 | | | $ | 7.28 | | | $ | 7.92 | | | $ | 7.66 | |
Net investment income | | | 0.23 | | | | 0.50 | | | | 0.13 | | | | 0.53 | | | | 0.50 | | | | 0.53 | | | | 0.55 | |
Net realized and unrealized gains (losses)
on investments | | | 0.33 | | | | 0.04 | | | | 0.23 | | | | 0.55 | | | | (0.91 | ) | | | (0.64 | ) | | | 0.26 | |
| | | | | | | | | | | | | | | | | | | | | | | | | | | | |
Total from investment operations | | | 0.56 | | | | 0.54 | | | | 0.36 | | | | 1.08 | | | | (0.41 | ) | | | (0.11 | ) | | | 0.81 | |
Distributions to shareholders from | | | | | | | | | | | | | | | | | | | | | | | | | | | | |
Net investment income | | | (0.23 | ) | | | (0.50 | ) | | | (0.13 | ) | | | (0.52 | ) | | | (0.50 | ) | | | (0.53 | ) | | | (0.55 | ) |
Net asset value, end of period | | $ | 7.53 | | | $ | 7.20 | | | $ | 7.16 | | | $ | 6.93 | | | $ | 6.37 | | | $ | 7.28 | | | $ | 7.92 | |
Total return2 | | | 7.99 | % | | | 7.53 | % | | | 5.27 | % | | | 17.28 | % | | | (5.20 | )% | | | (1.35 | )% | | | 10.95 | % |
Ratios to average net assets (annualized) | | | | | | | | | | | | | | | | | | | | | | | | | | | | |
Gross expenses | | | 1.03 | % | | | 1.04 | % | | | 1.04 | % | | | 1.07 | % | | | 1.10 | % | | | 1.33 | % | | | 1.33 | % |
Net expenses | | | 0.93 | % | | | 0.93 | % | | | 0.94 | % | | | 0.95 | % | | | 0.92 | % | | | 0.86 | % | | | 0.86 | % |
Net investment income | | | 6.49 | % | | | 6.73 | % | | | 7.49 | % | | | 7.76 | % | | | 7.95 | % | | | 7.08 | % | | | 7.07 | % |
Supplemental data | | | | | | | | | | | | | | | | | | | | | | | | | | | | |
Portfolio turnover rate | | | 8 | % | | | 78 | % | | | 11 | % | | | 77 | % | | | 52 | % | | �� | 53 | % | | | 82 | % |
Net assets, end of period (000’s omitted) | | | $318,660 | | | | $278,024 | | | | $322,015 | | | | $286,836 | | | | $231,308 | | | | $179,909 | | | | $230,287 | |
| 1. | For the three months ended August 31, 2010. The Fund changed its fiscal year end from May 31 to August 31, effective August 31, 2010. |
| 2. | Returns for periods of less than one year are not annualized. |
The accompanying notes are an integral part of these financial statements.
| | | | |
| 26 | | Wells Fargo Advantage High Income Fund | | Notes to Financial Statements (Unaudited) |
1. ORGANIZATION
Wells Fargo Funds Trust (the “Trust”), a Delaware statutory trust organized on March 10, 1999, is an open-end management investment company registered under the Investment Company Act of 1940, as amended (the “1940 Act”). These financial statements report on Wells Fargo Advantage High Income Fund (the “Fund”) which is a diversified series of the Trust.
2. SIGNIFICANT ACCOUNTING POLICIES
The following significant accounting policies, which are consistently followed in the preparation of the financial statements of the Fund, are in conformity with U.S. generally accepted accounting principles which require management to make estimates and assumptions that affect the reported amounts of assets and liabilities, disclosure of contingent assets and liabilities at the date of the financial statements, and the reported amounts of revenues and expenses during the reporting period. Actual results could differ from those estimates.
Securities valuation
Fixed income securities with original maturities exceeding 60 days are valued based on available evaluated prices received from an independent pricing service approved by the Board of Trustees which may utilize both transaction data and market information such as yield, prices of securities of comparable quality, coupon rate, maturity, type of issue, trading characteristics and other market data. If valuations are not available from the pricing service or values received are deemed not representative of market value, values will be obtained from a third party broker-dealer or determined based on the Fund’s Fair Value Procedures.
Debt securities of sufficient credit quality with original maturities of 60 days or less generally are valued at amortized cost which approximates fair value. The amortized cost method involves valuing a security at its cost, plus accretion of discount or minus amortization of premium over the period until maturity.
Investments in equity securities are valued each business day as of the close of regular trading on the New York Stock Exchange, which is usually 4:00 p.m. (Eastern Time). Securities which are traded on a national or foreign securities exchange are valued at the last reported sales price, except that securities listed on The Nasdaq Stock Market, Inc. (“Nasdaq”) are valued at the Nasdaq Official Closing Price (“NOCP”), and if no NOCP is available, then at the last reported sales price. If no sales price is shown on the Nasdaq, the bid price will be used. In the absence of any sale of securities listed on the Nasdaq, and in the case of other securities (including U.S. Government obligations, but excluding debt securities maturing in 60 days or less), the price will be deemed “stale” and the valuations will be determined in accordance with the Fund’s Fair Value Procedures.
Investments in open-end mutual funds and non-registered investment companies are generally valued at net asset value.
Investments which are not valued using any of the methods discussed above, are valued at their fair value, as determined by procedures established in good faith and approved by the Board of Trustees.
Security loans
The Fund may lend its securities from time to time in order to earn additional income in the form of fees or interest on securities received as collateral or the investment of any cash received as collateral. The Fund continues to receive interest or dividends on the securities loaned. The Fund receives collateral in the form of cash or securities with a value at least equal to the value of the securities on loan. The value of the loaned securities is determined at the close of each business day and any additional required collateral is delivered to the Fund on the next business day. In a securities lending transaction, the net asset value of the Fund will be affected by an increase or decrease in the value of the securities loaned and by an increase or decrease in the value of the instrument in which collateral is invested. The amount of securities lending activity undertaken by the Fund fluctuates from time to time. In the event of default or bankruptcy by the borrower, the Fund may be prevented from recovering the loaned securities or gaining access to the collateral or may experience delays or costs in doing so. In addition, the investment of any cash collateral received may lose all or part of its value. The Fund has the right under the lending agreement to recover the securities from the borrower on demand.
The Fund lends its securities through an unaffiliated securities lending agent. Cash collateral received in connection with its securities lending transactions is invested in Wells Fargo Securities Lending Cash Investments, LLC (the “Cash Collateral Fund”). The Cash Collateral Fund is exempt from registration under Section 3(c)(7) of the 1940 Act and is managed by
| | | | | | |
| Notes to Financial Statements (Unaudited) | | Wells Fargo Advantage High Income Fund | | | 27 | |
Wells Fargo Funds Management LLC (“Funds Management”) and is sub-advised by Wells Capital Management Incorporated (“Wells Capital Management”). Funds Management receives an advisory fee starting at 0.05% and declining to 0.01% as the average daily net assets of the Cash Collateral Fund increase. All of the fees received by Funds Management are paid to Wells Capital Management for its services as sub-adviser. The Cash Collateral Fund seeks to provide a positive return compared to the daily Fed Funds Open rate by investing in high-quality, U.S. dollar-denominated short-term money market instruments. Cash Collateral Fund investments are fair valued based upon the amortized cost valuation technique. Income earned from investment in the Cash Collateral Fund is included in securities lending income on the Statement of Operations.
For Wells Fargo Advantage Funds that participated in securities lending activity prior to February 13, 2009, certain structured investment vehicles purchased in a joint account by the former securities lending agent defaulted or were impaired. Certain of the Wells Fargo Advantage Funds still hold ownership interest in these structured investment vehicles, which have since been restructured as pass-through securities. If the Fund holds an ownership interest in such pass-through securities, information regarding this ownership interest can be found in the Portfolio of Investments under the category “Other”.
When-issued transactions
The Fund may purchase securities on a forward commitment or ‘when-issued’ basis. The Fund records a when-issued transaction on the trade date and will segregate assets to cover its obligation by confirming the availability of qualifying assets having a value sufficient to make payment for the securities purchased. Securities purchased on a when-issued basis are marked-to-market daily and the Fund begins earning interest on the settlement date. Losses may arise due to changes in the market value of the underlying securities or if the counterparty does not perform under the contract.
Term loans
The Fund may invest in term loans. The loans are marked-to-market daily and the Fund begins earning interest when the loans are funded. The loans pay interest at rates which are periodically reset by reference to a base lending rate plus a spread. The Fund assumes the credit risk of the borrower and there could be potential loss to the Fund in the event of default by the borrower.
Security transactions and income recognition
Securities transactions are recorded on a trade date basis. Realized gains or losses are reported on the basis of identified cost of securities delivered.
Interest income is accrued daily and bond discounts are accreted and premiums are amortized daily based on the effective interest method. To the extent debt obligations are placed on non-accrual status, any related interest income may be reduced by writing off interest receivables when the collection of all or a portion of interest has become doubtful based on consistently applied procedures. If the issuer subsequently resumes interest payments or when the collectability of interest is reasonably assured, the debt obligation is removed from non-accrual status.
Distributions to shareholders
Distributions to shareholders from net investment income are accrued daily and paid monthly. Distributions from net realized gains, if any, are recorded on the ex-dividend date. Such distributions are determined in conformity with income tax regulations, which may differ from generally accepted accounting principles.
Federal and other taxes
The Fund intends to continue to qualify as a regulated investment company by distributing substantially all of its investment company taxable income and any net realized capital gains (after reduction for capital loss carryforwards) sufficient to relieve it from all, or substantially all, federal income taxes. Accordingly, no provision for federal income taxes was required.
The Fund’s income and federal excise tax returns and all financial records supporting those returns for the prior three fiscal years are subject to examination by the federal and Delaware revenue authorities.
Under the recently enacted Regulated Investment Company Modernization Act of 2010, the Fund is permitted to carry forward capital losses incurred in taxable years which began after December 22, 2010 for an unlimited period. However, any losses incurred are required to be utilized prior to the losses incurred in pre-enactment taxable years. As a result of
| | | | |
| 28 | | Wells Fargo Advantage High Income Fund | | Notes to Financial Statements (Unaudited) |
this ordering rule, pre-enactment capital loss carryforwards may be more likely to expire unused. Additionally, post-enactment capital losses that are carried forward will retain their character as either short-term or long-term capital losses rather than being considered all short-term as under previous law.
As of August 31, 2011, the Fund had net capital loss carryforwards, which were available to offset future net realized capital gains, in the amount of $3,946,738 with $1,794,616 expiring in 2015, $2,102,320 expiring in 2016 and $49,802 expiring in 2017.
Class allocations
The separate classes of shares offered by the Fund differ principally in applicable sales charges, distribution, shareholder servicing and administration fees. Shareholders of each class bear certain expenses that pertain to that particular class. All shareholders bear the common expenses of the Fund, earn income from the portfolio, and are allocated unrealized gains and losses pro rata based on the average daily net assets of each class, without distinction between share classes. Dividends are determined separately for each class based on income and expenses allocable to each class. Realized gains and losses are allocated to each class pro rata based upon the net assets of each class on the date realized. Differences in per share dividend rates generally result from the relative weightings of pro rata income and realized gain allocations and from differences in separate class expenses, including distribution, shareholder servicing and administration fees.
3. FAIR VALUATION MEASUREMENTS
Fair value measurements of investments are determined within a framework that has established a fair value hierarchy based upon the various data inputs utilized in determining the value of the Fund’s investments. The three-level hierarchy gives the highest priority to unadjusted quoted prices in active markets for identical assets or liabilities (Level 1) and the lowest priority to significant unobservable inputs (Level 3). The Fund’s investments are classified within the fair value hierarchy based on the lowest level of input that is significant to the fair value measurement. The inputs are summarized into three broad levels as follows:
| n | | Level 1 – quoted prices in active markets for identical securities |
| n | | Level 2 – other significant observable inputs (including quoted prices for similar securities, interest rates, prepayment speeds, credit risk, etc.) |
| n | | Level 3 – significant unobservable inputs (including the Fund’s own assumptions in determining the fair value of investments) |
The inputs or methodologies used for valuing securities are not necessarily an indication of the risk associated with investing in those securities.
As of February 29, 2012, the inputs used in valuing the Fund’s assets, which are carried at fair value, were as follows:
| | | | | | | | | | | | | | | | |
| Investments in Securities | | Quoted Prices
(Level 1) | | | Significant Other
Observable Inputs
(Level 2) | | | Significant
Unobservable Inputs
(Level 3) | | | Total | |
| | | | |
Corporate bonds and notes | | $ | 0 | | | $ | 649,756,264 | | | $ | 0 | | | $ | 649,756,264 | |
| | | | |
Municipal bonds and notes | | | 0 | | | | 3,249,356 | | | | 0 | | | | 3,249,356 | |
| | | | |
Term loans | | | 0 | | | | 21,681,594 | | | | 0 | | | | 21,681,594 | |
| | | | |
Yankee corporate bonds and notes | | | 0 | | | | 64,252,693 | | | | 0 | | | | 64,252,693 | |
| | | | |
Equity securities | | | | | | | | | | | | | | | | |
Warrants | | | 0 | | | | 0 | | | | 2,302 | | | | 2,302 | |
| | | | |
Other | | | 0 | | | | 0 | | | | 850,637 | | | | 850,637 | |
| | | | |
Short-term investments | | | | | | | | | | | | | | | | |
Investment companies | | | 52,511,475 | | | | 9,249,208 | | | | 0 | | | | 61,760,683 | |
| | | $ | 52,511,475 | | | $ | 748,189,115 | | | $ | 852,939 | | | $ | 801,553,529 | |
Further details on the major security types listed above can be found in the Portfolio of Investments.
| | | | | | |
| Notes to Financial Statements (Unaudited) | | Wells Fargo Advantage High Income Fund | | | 29 | |
Transfers in and transfers out are recognized at the end of the reporting period. For the six months ended February 29, 2012, the Fund did not have any significant transfers into/out of Level 1 and Level 2.
The following is a reconciliation of assets in which significant unobservable inputs (Level 3) were used in determining fair value:
| | | | | | | | | | | | | | | | |
| | | Warrants | | | Term
loans | | | Other | | | Total | |
Balance as of August 31, 2011 | | $ | 2,302 | | | $ | 4,020,000 | | | $ | 1,179,824 | | | $ | 5,202,126 | |
Accrued discounts (premiums) | | | 0 | | | | (6,744 | ) | | | 0 | | | | (6,744 | ) |
Realized gains (losses) | | | 0 | | | | (17,901 | ) | | | 0 | | | | (17,901 | ) |
Change in unrealized gains (losses) | | | 0 | | | | 44,430 | | | | (195,814 | ) | | | (151,384 | ) |
Purchases | | | 0 | | | | 0 | | | | 0 | | | | 0 | |
Sales | | | 0 | | | | (1,454,545 | ) | | | (133,373 | ) | | | (1,587,918 | ) |
Transfers into Level 3 | | | 0 | | | | 0 | | | | 0 | | | | 0 | |
Transfers out of Level 3 | | | 0 | | | | (2,585,240 | ) | | | 0 | | | | (2,585,240 | ) |
Balance as of February 29, 2012 | | $ | 2,302 | | | $ | 0 | | | $ | 850,637 | | | $ | 852,939 | |
Change in unrealized gains (losses)
relating to securities still held at February 29, 2012 | | $ | 0 | | | $ | 0 | | | $ | (264,558 | ) | | $ | (264,558 | ) |
Transfers out of Level 3 into Level 2 are due to the availability of significant observable inputs which are currently used in the determination of the fair value of the securities.
4. TRANSACTIONS WITH AFFILIATES AND OTHER EXPENSES
Advisory fee
The Trust has entered into an advisory contract with Funds Management, an indirect wholly owned subsidiary of Wells Fargo & Company (“Wells Fargo”). The adviser is responsible for implementing investment policies and guidelines and for supervising the sub-adviser, who is responsible for day-to-day portfolio management of the Fund.
Pursuant to the contract, Funds Management is entitled to receive an annual advisory fee starting at 0.50% and declining to 0.40% as the average daily net assets of the Fund increase. For the six months ended February 29, 2012, the advisory fee was equivalent to an annual rate of 0.49% of the Fund’s average daily net assets.
Funds Management has retained the services of certain sub-advisers to provide daily portfolio management to the Fund. The fees related to sub-advisory services are borne directly by Funds Management and do not increase the overall fees paid by the Fund. Wells Capital Management, an affiliate of Funds Management, is the sub-adviser to the Fund and is entitled to receive a fee from Funds Management at an annual rate starting at 0.35% and declining to 0.20% as the average daily net assets of the Fund increase.
Administration and transfer agent fees
The Trust has entered into an administration agreement with Funds Management. Under this agreement, for providing administrative services, which includes paying fees and expenses for services provided by the transfer agent, sub-transfer agents, omnibus account servicers and record-keepers, Funds Management is entitled to receive from the Fund an annual fund level administration fee starting at 0.05% and declining to 0.03% as the average daily net assets of the Fund increase and a class level administration fee which is calculated based on the average daily net assets of each class as follows:
| | | | |
| | | Class Level
Administration Fee | |
Class A, Class B, Class C | | | 0.16 | % |
Administrator Class | | | 0.10 | |
Institutional Class | | | 0.08 | |
Investor Class | | | 0.19 | |
Funds Management has contractually waived and/or reimbursed advisory and administration fees to the extent necessary to maintain certain net operating expense ratios for the Fund. Waiver of fees and/or reimbursement of
| | | | |
| 30 | | Wells Fargo Advantage High Income Fund | | Notes to Financial Statements (Unaudited) |
expenses by Funds Management were made first from fund level expenses on a proportionate basis and then from class specific expenses. Funds Management has committed through July 11, 2013 to waive fees and/or reimburse expenses to the extent necessary to cap the Fund’s expenses at 0.90% for Class A, 1.65% for Class B, 1.65% for Class C, 0.80% for Administrator Class, 0.50% for Institutional Class and 0.93% for Investor Class.
Distribution fees
The Trust has adopted a Distribution Plan for Class B and Class C shares of the Fund pursuant to Rule 12b-1 under the 1940 Act. Distribution fees are charged to Class B and Class C shares and paid to Wells Fargo Funds Distributor, LLC, the principal underwriter, at an annual rate of 0.75% of the average daily net assets of Class B and Class C shares.
For the six months ended February 29, 2012, Wells Fargo Funds Distributor, LLC received $12,149 from the sale of Class A shares and $827 and $631 in contingent deferred sales charges from redemptions of Class B and Class C shares, respectively.
Shareholder servicing fees
The Trust has entered into contracts with one or more shareholder servicing agents, whereby Class A, Class B, Class C, Administrator Class and Investor Class of the Fund is charged a fee at an annual rate of 0.25% of the average daily net assets of each respective class.
A portion of these total shareholder servicing fees were paid to affiliates of Wells Fargo.
5. INVESTMENT PORTFOLIO TRANSACTIONS
Purchases and sales of investments, excluding U.S. Government obligations (if any) and short-term securities (securities with maturities of one year or less at purchase date), for the six months ended February 29, 2012 were $135,629,835 and $51,248,356, respectively.
6. BANK BORROWINGS
The Trust (excluding the money market funds) and Wells Fargo Variable Trust are parties to a $150,000,000 revolving credit agreement with State Street Bank and Trust Company, whereby the Fund is permitted to use bank borrowings for temporary or emergency purposes, such as to fund shareholder redemption requests. Interest under the credit agreement is charged to the Fund based on a borrowing rate equal to the higher of the Federal Funds rate in effect on that day plus 1.25% or the overnight LIBOR rate in effect on that day plus 1.25%. In addition, an annual commitment fee equal to 0.10% of the unused balance is allocated to each participating fund. Prior to September 6, 2011, the revolving credit agreement was for $125,000,000 and the annual commitment fee paid by the Fund was 0.125% of the unused balance. For the six months ended February 29, 2012, the Fund paid $869 in commitment fees.
For the six months ended February 29, 2012, there were no borrowings by the Fund under the agreement.
7. INDEMNIFICATION
Under the Trust’s organizational documents, the officers and directors are indemnified against certain liabilities that may arise out of performance of their duties to the Trust. Additionally, in the normal course of business, the Trust may enter into contracts with service providers that contain a variety of indemnification clauses. The Trust’s maximum exposure under these arrangements is dependent on future claims that may be made against the Fund and, therefore, cannot be estimated.
8. NEW ACCOUNTING PRONOUNCEMENTS
In May 2011, the Financial Accounting Standards Board (“FASB”) issued Accounting Standards Update (“ASU”) No. 2011-04 “Amendments to Achieve Common Fair Value Measurement and Disclosure Requirements in U.S. GAAP and IFRSs”. ASU No. 2011-04 amends FASB ASC Topic 820, Fair Value Measurements and Disclosures, to establish common requirements for measuring fair value and for disclosing information about fair value measurements in accordance with GAAP. The ASU is effective prospectively for interim and annual periods beginning after December 15, 2011. Management expects that adoption of the ASU will result in additional disclosures in the financial statements, as applicable.
In April 2011, FASB issued ASU No. 2011-03 “Reconsideration of Effective Control for Repurchase Agreements”. ASU No. 2011-03 amends FASB ASC Topic 860, Transfers and Servicing, specifically the criteria required to determine whether a repurchase agreement (repo) and similar agreements should be accounted for as sales of financial assets or secured
| | | | | | |
| Notes to Financial Statements (Unaudited) | | Wells Fargo Advantage High Income Fund | | | 31 | |
borrowings with commitments. ASU No. 2011-03 changes the assessment of effective control by focusing on the transferor’s contractual rights and obligations and removing the criterion to assess its ability to exercise those rights or honor those obligations. This could result in changes to the way entities account for certain transactions including repurchase agreements, mortgage dollar rolls and reverse repurchase agreements. The ASU will become effective on a prospective basis for new transfers and modifications to existing transactions as of the beginning of the first interim or annual period beginning on or after December 15, 2011. Management has evaluated the impact of adopting the ASU and expects no significant changes.
| | | | |
| 32 | | Wells Fargo Advantage High Income Fund | | Other Information (Unaudited) |
PROXY VOTING INFORMATION
A description of the policies and procedures that the Fund uses to determine how to vote proxies relating to portfolio securities is available without charge, upon request, by calling 1-800-222-8222, visiting our Web site at wellsfargoadvantagefunds.com, or visiting the SEC Web site at sec.gov. Information regarding how the Fund voted proxies relating to portfolio securities during the most recent 12-month period ended June 30 is available without charge on the Fund’s Web site at wellsfargoadvantagefunds.com or by visiting the SEC Web site at sec.gov.
PORTFOLIO HOLDINGS INFORMATION
The complete portfolio holdings for the Fund are publicly available on the Fund’s Web site (wellsfargoadvantagefunds.com) on a monthly, 30-day or more delayed basis. In addition, top ten holdings information for the Fund is publicly available on the Fund’s Web site on a monthly, seven-day or more delayed basis. The Fund files its complete schedule of portfolio holdings with the SEC for the first and third quarters of each fiscal year on Form N-Q, which is available without charge by visiting the SEC Web site at sec.gov. In addition, the Fund’s Form N-Q may be reviewed and copied at the SEC’s Public Reference Room in Washington, DC, and at regional offices in New York City, at 233 Broadway, and in Chicago, at 175 West Jackson Boulevard, Suite 900. Information about the Public Reference Room may be obtained by calling 1-800-SEC-0330.
| | | | | | |
| Other Information (Unaudited) | | Wells Fargo Advantage High Income Fund | | | 33 | |
BOARD OF TRUSTEES
The following table provides basic information about the Board of Trustees (the “Trustees”) of the Trust and Officers of the Trust. This table should be read in conjunction with the Prospectus and the Statement of Additional Information1 of the Fund. Each of the Trustees and Officers listed below acts in identical capacities for the Wells Fargo Advantage family of funds, which consists of 137 funds comprising the Wells Fargo Funds Trust, Wells Fargo Variable Trust, Wells Fargo Master Trust and four closed-end funds (collectively the “Fund Complex”). All of the Trustees are also Members of the Audit and Governance Committees of each Trust in the Fund Complex. The mailing address of each Trustee and Officer is 525 Market Street, 12th Floor, San Francisco, CA 94105. Each Trustee and Officer serves an indefinite term, however, each Trustee serves such term until reaching the mandatory retirement age established by the Trustees.
Independent Trustees
| | | | | | |
Name and Year of Birth | | Position Held and Length of Service | | Principal Occupations During Past Five Years | | Other Directorships During
Past Five Years |
Peter G. Gordon
(Born 1942) | | Trustee, since 1998; Chairman, since 2005 (Lead Trustee since 2001) | | Co-Founder, Retired Chairman, President and CEO of Crystal Geyser Water Company. Trustee Emeritus, Colby College | | Asset Allocation Trust |
Isaiah Harris, Jr.
(Born 1952) | | Trustee, since 2009 | | Retired. Prior thereto, President and CEO of BellSouth Advertising and Publishing Corp. from 2005 to 2007, President and CEO of BellSouth Enterprises from 2004 to 2005 and President of BellSouth Consumer Services from 2000 to 2003. Emeritus member of the Iowa State University Foundation Board of Governors. Emeritus Member of the Advisory Board of Iowa State University School of Business. Mr. Harris is a certified public accountant. | | CIGNA Corporation; Deluxe Corporation; Asset Allocation Trust |
Judith M. Johnson
(Born 1949) | | Trustee, since 2008 | | Retired. Prior thereto, Chief Executive Officer and Chief Investment Officer of Minneapolis Employees Retirement Fund from 1996 to 2008. Ms. Johnson is an attorney, certified public accountant and a certified managerial accountant. | | Asset Allocation Trust |
Leroy Keith, Jr.
(Born 1939) | | Trustee, since 2010 | | Chairman, Bloc Global Services (development and construction). Trustee of the Evergreen Funds from 1983 to 2010. Former Managing Director, Almanac Capital Management (commodities firm), former Partner, Stonington Partners, Inc. (private equity fund), former Director, Obagi Medical Products Co. and former Director, Lincoln Educational Services. | | Trustee, Virtus Fund Complex (consisting of 40 portfolios as of 12/31/11); Asset Allocation Trust |
David F. Larcker
(Born 1950) | | Trustee, since 2009 | | James Irvin Miller Professor of Accounting at the Graduate School of Business, Stanford University, Director of Corporate Governance Research Program and Senior Faculty of The Rock Center for Corporate Governance since 2006. From 2005 to 2008, Professor of Accounting at the Graduate School of Business, Stanford University. Prior thereto, Ernst & Young Professor of Accounting at The Wharton School, University of Pennsylvania from 1985 to 2005. | | Asset Allocation Trust |
Olivia S. Mitchell
(Born 1953) | | Trustee, since 2006 | | International Foundation of Employee Benefit Plans Professor, Wharton School of the University of Pennsylvania since 1993. Director of Wharton’s Pension Research Council and Boettner Center on Pensions & Retirement Research, and Research Associate at the National Bureau of Economic Research. Previously, Cornell University Professor from 1978 to 1993. | | Asset Allocation Trust |
| | | | |
| 34 | | Wells Fargo Advantage High Income Fund | | Other Information (Unaudited) |
| | | | | | |
Name and Year of Birth | | Position Held and Length of Service | | Principal Occupations During Past Five Years | | Other Directorships During
Past Five Years |
Timothy J. Penny
(Born 1951) | | Trustee, since 1996 | | President and CEO of Southern Minnesota Initiative Foundation, a non-profit organization, since 2007 and Senior Fellow at the Humphrey Institute Policy Forum at the University of Minnesota since 1995. Member of the Board of Trustees of NorthStar Education Finance, Inc., a non-profit organization, since 2007. | | Asset Allocation Trust |
Michael S. Scofield
(Born 1943) | | Trustee, since 2010 | | Served on the Investment Company Institute’s Board of Governors and Executive Committee from 2008-2011 as well the Governing Council of the Independent Directors Council from 2006-2011 and the Independent Directors Council Executive Committee from 2008-2011. Chairman of the IDC from 2008-2010. Institutional Investor (Fund Directions) Trustee of Year in 2007. Trustee of the Evergreen Funds (and its predecessors) from 1984 to 2010. Chairman of the Evergreen Funds from 2000-2010. Former Trustee of the Mentor Funds. Retired Attorney, Law Offices of Michael S. Scofield and former Director and Chairman, Branded Media Corporation (multi-media branding company). | | Asset Allocation Trust |
Donald C. Willeke
(Born 1940) | | Trustee, since 1996 | | Principal of the law firm of Willeke & Daniels. General Counsel of the Minneapolis Employees Retirement Fund from 1984 until its consolidation into the Minnesota Public Employees Retirement Association on June 30, 2010. Director and Vice Chair of The Free Trust (non-profit corporation). Director of the American Chestnut Foundation (non-profit corporation). | | Asset Allocation Trust |
Officers
| | | | | | |
Name and Year of Birth | | Position Held and
Length of Service | | Principal Occupations During Past Five Years | | |
Karla M. Rabusch
(Born 1959) | | President, since 2003 | | Executive Vice President of Wells Fargo Bank, N.A. and President of Wells Fargo Funds Management, LLC since 2003. Senior Vice President and Chief Administrative Officer of Wells Fargo Funds Management, LLC from 2001 to 2003. | | |
C. David Messman
(Born 1960) | | Secretary, since 2000; Chief Legal Counsel, since 2003 | | Senior Vice President and Secretary of Wells Fargo Funds Management, LLC since 2001. Vice President and Managing Senior Counsel of Wells Fargo Bank, N.A. since 1996. | | |
Kasey Phillips
(Born 1970) | | Treasurer, since 2009 | | Senior Vice President of Wells Fargo Funds Management, LLC since 2009. Senior Vice President of Evergreen Investment Management Company, LLC from 2006 to 2010. Treasurer of the Evergreen Funds from 2005 to 2010. | | |
David Berardi
(Born 1975) | | Assistant Treasurer, since 2009 | | Vice President of Wells Fargo Funds Management, LLC since 2009. Vice President of Evergreen Investment Management Company, LLC from 2008 to 2010. Assistant Vice President of Evergreen Investment Services, Inc. from 2004 to 2008. Manager of Fund Reporting and Control for Evergreen Investment Management Company, LLC from 2004 to 2010. | | |
Jeremy DePalma
(Born 1974) | | Assistant Treasurer, since 2009 | | Senior Vice President of Wells Fargo Funds Management, LLC since 2009. Senior Vice President of Evergreen Investment Management Company, LLC from 2008 to 2010. Vice President, Evergreen Investment Services, Inc. from 2004 to 2007. Head of the Fund Reporting and Control Team within Fund Administration from 2005 to 2010. | | |
Debra Ann Early
(Born 1964) | | Chief Compliance Officer, since 2007 | | Chief Compliance Officer of Wells Fargo Funds Management, LLC since 2007. Chief Compliance Officer of Parnassus Investments from 2005 to 2007. Chief Financial Officer of Parnassus Investments from 2004 to 2007 and Senior Audit Manager of PricewaterhouseCoopers LLP from 1998 to 2004. | | |
| 1. | The Statement of Additional Information includes additional information about the Trustees and is available, without charge, upon request, by calling 1-800-222-8222 or by visiting the Web site at wellsfargoadvantagefunds.com. |
| | | | | | |
| List of Abbreviations | | Wells Fargo Advantage High Income Fund | | | 35 | |
The following is a list of common abbreviations for terms and entities which may have appeared in this report.
| ACB | — Agricultural Credit Bank |
| ADR | — American Depository Receipt |
| ADS | — American Depository Shares |
| AGC-ICC | — Assured Guaranty Corporation - Insured Custody Certificates |
| AGM | — Assured Guaranty Municipal |
| AMBAC | — American Municipal Bond Assurance Corporation |
| AMT | — Alternative Minimum Tax |
| BAN | — Bond Anticipation Notes |
| BHAC | — Berkshire Hathaway Assurance Corporation |
| CAB | — Capital Appreciation Bond |
| CCAB | — Convertible Capital Appreciation Bond |
| CDA | — Community Development Authority |
| CDO | — Collateralized Debt Obligation |
| COP | — Certificate of Participation |
| DRIVER | — Derivative Inverse Tax-Exempt Receipts |
| DW&P | — Department of Water & Power |
| DWR | — Department of Water Resources |
| ECFA | — Educational & Cultural Facilities Authority |
| EDA | — Economic Development Authority |
| EDFA | — Economic Development Finance Authority |
| ETF | — Exchange-Traded Fund |
| FFCB | — Federal Farm Credit Bank |
| FGIC | — Financial Guaranty Insurance Corporation |
| FHA | — Federal Housing Authority |
| FHLB | — Federal Home Loan Bank |
| FHLMC | — Federal Home Loan Mortgage Corporation |
| FNMA | — Federal National Mortgage Association |
| GDR | — Global Depository Receipt |
| GNMA | — Government National Mortgage Association |
| HCFR | — Healthcare Facilities Revenue |
| HEFA | — Health & Educational Facilities Authority |
| HEFAR | — Higher Education Facilities Authority Revenue |
| HFA | — Housing Finance Authority |
| HFFA | — Health Facilities Financing Authority |
| IBC | — Insured Bond Certificate |
| IDA | — Industrial Development Authority |
| IDAG | — Industrial Development Agency |
| IDR | — Industrial Development Revenue |
| KRW | — Republic of Korea Won |
| LIBOR | — London Interbank Offered Rate |
| LLC | — Limited Liability Company |
| LLP | — Limited Liability Partnership |
| MBIA | — Municipal Bond Insurance Association |
| MFHR | — Multi-Family Housing Revenue |
| MSTR | — Municipal Securities Trust Receipts |
| MUD | — Municipal Utility District |
| NATL-RE | — National Public Finance Guarantee Corporation |
| PCFA | — Pollution Control Finance Authority |
| PCR | — Pollution Control Revenue |
| PFA | — Public Finance Authority |
| PFFA | — Public Facilities Financing Authority |
| PFOTER | — Puttable Floating Option Tax-Exempt Receipts |
| plc | — Public Limited Company |
| PUTTER | — Puttable Tax-Exempt Receipts |
| R&D | — Research & Development |
| RDA | — Redevelopment Authority |
| RDFA | — Redevelopment Finance Authority |
| REIT | — Real Estate Investment Trust |
| ROC | — Reset Option Certificates |
| SAVRS | — Select Auction Variable Rate Securities |
| SBA | — Small Business Authority |
| SFHR | — Single Family Housing Revenue |
| SFMR | — Single Family Mortgage Revenue |
| SPDR | — Standard & Poor’s Depositary Receipts |
| TAN | — Tax Anticipation Notes |
| TIPS | — Treasury Inflation-Protected Securities |
| TRAN | — Tax Revenue Anticipation Notes |
| TCR | — Transferable Custody Receipts |
| TTFA | — Transportation Trust Fund Authority |
| TVA | — Tennessee Valley Authority |
| XLCA | — XL Capital Assurance |
This page is intentionally left blank.
This page is intentionally left blank.
This page is intentionally left blank.


FOR MORE INFORMATION
More information about Wells Fargo Advantage Funds is available free upon request. To obtain literature, please write, e-mail, visit the Fund’s Web site, or call:
Wells Fargo Advantage Funds
P.O. Box 8266
Boston, MA 02266-8266
E-mail: wfaf@wellsfargo.com
Web site: wellsfargoadvantagefunds.com
Individual investors: 1-800-222-8222
Retail investment professionals: 1-888-877-9275
Institutional investment professionals: 1-866-765-0778
This report and the financial statements contained herein are submitted for the general information of the shareholders of Wells Fargo Advantage Funds. If this report is used for promotional purposes, distribution of the report must be accompanied or preceded by a current prospectus. For a prospectus containing more complete information, including charges and expenses, call 1-800-222-8222 or visit the Fund’s Web site at wellsfargoadvantagefunds.com. Please consider the investment objectives, risks, charges, and expenses of the investment carefully before investing. This and other information about Wells Fargo Advantage Funds can be found in the current prospectus. Read the prospectus carefully before you invest or send money.
Wells Fargo Funds Management, LLC, a wholly owned subsidiary of Wells Fargo & Company, provides investment advisory and administrative services for Wells Fargo Advantage Funds. Other affiliates of Wells Fargo & Company provide subadvisory and other services for the Funds. The Funds are distributed by Wells Fargo Funds Distributor, LLC, Member FINRA/SIPC, an affiliate of Wells Fargo & Company.
NOT FDIC INSURED ¡ NO BANK GUARANTEE ¡ MAY LOSE VALUE
© 2012 Wells Fargo Funds Management, LLC. All rights reserved.
| | |
 | | 208522 04-12 SA217/SAR217 2-12 |

Wells Fargo Advantage
High Yield Bond Fund

Semi-Annual Report
February 29, 2012

Reduce clutter. Save trees.
Sign up for electronic delivery of prospectuses and shareholder reports at wellsfargo.com/advantagedelivery
Contents
The views expressed and any forward-looking statements are as of February 29, 2012, unless otherwise noted, and are those of the Fund managers and/or Wells Fargo Funds Management, LLC. Discussions of individual securities, or the markets generally, or any Wells Fargo Advantage Fund are not intended as individual recommendations. Future events or results may vary significantly from those expressed in any forward-looking statements; the views expressed are subject to change at any time in response to changing circumstances in the market. Wells Fargo Funds Management, LLC, disclaims any obligation to publicly update or revise any views expressed or forward-looking statements.
NOT FDIC INSURED ¡ NO BANK GUARANTEE ¡ MAY LOSE VALUE

WELLS FARGO INVESTMENT HISTORY
| | |
| |
| 1932 | | Keystone creates one of the first mutual fund families. |
| |
| 1971 | | Wells Fargo & Company introduces one of the first institutional index funds. |
| |
| 1978 | | Wells Fargo applies Markowitz and Sharpe’s research on Modern Portfolio Theory to introduce one of the industry’s first Tactical Asset Allocation (TAA) models in institutional separately managed accounts. |
| |
| 1984 | | Wells Fargo Stagecoach Funds launches its first asset allocation fund. |
| |
| 1989 | | The Tactical Asset Allocation (TAA) Model is first applied to Wells Fargo’s asset allocation mutual funds. |
| |
| 1994 | | Wells Fargo introduces the LifePath Funds, one of the first suites of target date funds (now the Wells Fargo Advantage Dow Jones Target Date FundsSM). |
| |
| 1996 | | Evergreen Investments and Keystone Funds merge. |
| |
| 1997 | | Wells Fargo launches Wells Fargo Advantage WealthBuilder PortfoliosSM, a fund-of-funds suite of products that includes the use of quantitative models to shift assets among investment styles. |
| |
| 1999 | | Norwest Advantage Funds and Stagecoach Funds are reorganized into Wells Fargo Funds after the merger of Norwest and Wells Fargo. |
| |
| 2002 | | Evergreen Retail and Evergreen Institutional companies form the umbrella asset management company, Evergreen Investments. |
| |
| 2005 | | The integration of Strong Funds with Wells Fargo Funds creates Wells Fargo Advantage Funds, resulting in one of the top 20 mutual fund companies in the United States. |
| |
| 2006 | | Wells Fargo Advantage Funds relaunches the target date product line as Wells Fargo Advantage Dow Jones Target Date Funds. |
| |
| 2010 | | The mergers and reorganizations of Evergreen and Wells Fargo Advantage mutual funds are completed, unifying the families under the brand of Wells Fargo Advantage Funds. |
Wells Fargo Advantage Funds®
Wells Fargo Advantage Funds skillfully guides institutions, financial advisors, and individuals through the investment terrain to help them reach their financial objectives. Everything we do on behalf of investors is backed by our unique combination of qualifications.
Strength
Our organization is built on the standards of integrity and service established by our parent company—Wells Fargo & Company—more than 150 years ago. And, because we’re part of a highly diversified financial enterprise, we offer the depth of resources to help investors succeed.
Expertise
Our multi-boutique model offers investors access to the independent thinking of premier investment managers that have been chosen for their time-tested strategies. While each team specializes in a specific investment strategy, collectively they provide investors a wide choice of distinct investment styles. Our dedication to investment excellence doesn’t end with our expertise in manager selection—risk management, analysis, and rigorous ongoing review seek to ensure each manager’s investment process remains consistent.
Partnership
Our collaborative approach is built around understanding the needs and goals of our clients. By adhering to core principles of sound judgment and steady guidance, we support you through every stage of the investment decision process.
Carefully consider a fund’s investment objectives, risks, charges, and expenses before investing. For a current prospectus and, if available, a summary prospectus, containing this and other information, visit wellsfargoadvantagefunds.com. Read it carefully before investing.
Wells Fargo Funds Management, LLC, a wholly owned subsidiary of Wells Fargo & Company, provides investment advisory and administrative services for Wells Fargo Advantage Funds®. Other affiliates of Wells Fargo & Company provide subadvisory and other services for the Funds. The Funds are distributed by Wells Fargo Funds Distributor, LLC, Member FINRA/SIPC, an affiliate of Wells Fargo & Company.
“Dow Jones®” and “Dow Jones Target Date IndexesSM” are service marks of Dow Jones Trademark Holdings, LLC (“Dow Jones”), have been licensed to CME Group Index Services LLC (“CME Indexes”) and have been sublicensed for use for certain purposes by Global Index Advisors, Inc, and Wells Fargo Funds Management, LLC. The Wells Fargo Advantage Dow Jones Target Date FundsSM based on the Dow Jones Target Date IndexesSM, are not sponsored, endorsed, sold or promoted by Dow Jones, CME Indexes or their respective affiliates and none of them makes any representation regarding the advisability of investing in such product(s).
NOT FDIC INSURED ¡ NO BANK GUARANTEE ¡ MAY LOSE VALUE
Not part of the semi-annual report.
Wells Fargo Advantage Funds offers more than 110 mutual funds across a wide range of asset classes, representing over $218 billion in assets under management, as of February 29, 2012.
| | | | |
| Equity Funds | | | | |
Asia Pacific Fund | | Equity Value Fund | | Precious Metals Fund |
C&B Large Cap Value Fund | | Global Opportunities Fund | | Premier Large Company Growth Fund |
C&B Mid Cap Value Fund | | Growth Fund | | Small Cap Opportunities Fund |
Capital Growth Fund | | Index Fund | | Small Cap Value Fund |
Common Stock Fund | | International Equity Fund | | Small Company Growth Fund |
Disciplined U.S. Core Fund | | International Value Fund | | Small Company Value Fund |
Discovery Fund† | | Intrinsic Small Cap Value Fund | | Small/Mid Cap Core Fund |
Diversified Equity Fund | | Intrinsic Value Fund | | Small/Mid Cap Value Fund |
Diversified International Fund | | Intrinsic World Equity Fund | | Special Mid Cap Value Fund |
Diversified Small Cap Fund | | Large Cap Core Fund | | Special Small Cap Value Fund |
Emerging Growth Fund | | Large Cap Growth Fund | | Specialized Technology Fund |
Emerging Markets Equity Fund | | Large Company Value Fund | | Strategic Large Cap Growth Fund |
Endeavor Select Fund† | | Omega Growth Fund | | Traditional Small Cap Growth Fund |
Enterprise Fund† | | Opportunity Fund† | | Utility and Telecommunications Fund |
| Bond Funds | | | | |
Adjustable Rate Government Fund | | Inflation-Protected Bond Fund | | Short-Term Bond Fund |
California Limited-Term Tax-Free Fund | | Intermediate Tax/AMT-Free Fund | | Short-Term High Yield Bond Fund |
California Tax-Free Fund | | International Bond Fund | | Short-Term Municipal Bond Fund |
Colorado Tax-Free Fund | | Minnesota Tax-Free Fund | | Strategic Municipal Bond Fund |
Government Securities Fund | | Municipal Bond Fund | | Total Return Bond Fund |
High Income Fund | | North Carolina Tax-Free Fund | | Ultra Short-Term Income Fund |
High Yield Bond Fund | | Pennsylvania Tax-Free Fund | | Ultra Short-Term Municipal Income Fund |
Income Plus Fund | | Short Duration Government Bond Fund | | Wisconsin Tax-Free Fund |
| Asset Allocation Funds | | | | |
Absolute Return Fund | | WealthBuilder Equity Portfolio† | | Target 2020 Fund† |
Asset Allocation Fund | | WealthBuilder Growth Allocation Portfolio† | | Target 2025 Fund† |
Conservative Allocation Fund | | WealthBuilder Growth Balanced Portfolio† | | Target 2030 Fund† |
Diversified Capital Builder Fund | | WealthBuilder Moderate Balanced Portfolio† | | Target 2035 Fund† |
Diversified Income Builder Fund | | WealthBuilder Tactical Equity Portfolio† | | Target 2040 Fund† |
Growth Balanced Fund | | Target Today Fund† | | Target 2045 Fund† |
Index Asset Allocation Fund | | Target 2010 Fund† | | Target 2050 Fund† |
Moderate Balanced Fund | | Target 2015 Fund† | | Target 2055 Fund† |
WealthBuilder Conservative Allocation Portfolio† | | | | |
| Money Market Funds | | | | |
100% Treasury Money Market Fund | | Heritage Money Market Fund† | | National Tax-Free Money Market Fund |
California Municipal Money Market Fund | | Money Market Fund | | Prime Investment Money Market Fund |
Cash Investment Money Market Fund | | Municipal Cash Management Money Market Fund | | Treasury Plus Money Market Fund |
Government Money Market Fund | | Municipal Money Market Fund | | |
| Variable Trust Funds1 | | | | |
VT Discovery Fund† | | VT Intrinsic Value Fund | | VT Small Cap Growth Fund |
VT Index Asset Allocation Fund | | VT Omega Growth Fund | | VT Small Cap Value Fund |
VT International Equity Fund | | VT Opportunity Fund† | | VT Total Return Bond Fund |
An investment in a money market fund is not insured or guaranteed by the Federal Deposit Insurance Corporation or any other government agency. Although the Wells Fargo Advantage Money Market Funds seek to preserve the value of your investment at $1.00 per share, it is possible to lose money by investing in a money market fund.
| 1. | The Variable Trust Funds are generally available only through insurance company variable contracts. |
| † | In this report, the Wells Fargo Advantage Discovery FundSM, Wells Fargo Advantage Endeavor Select FundSM, Wells Fargo Advantage Enterprise FundSM, Wells Fargo Advantage Opportunity FundSM, Wells Fargo Advantage WealthBuilder Conservative Allocation PortfolioSM, Wells Fargo Advantage WealthBuilder Equity PortfolioSM, Wells Fargo Advantage WealthBuilder Growth Allocation PortfolioSM, Wells Fargo Advantage WealthBuilder Growth Balanced PortfolioSM, Wells Fargo Advantage WealthBuilder Moderate Balanced PortfolioSM, Wells Fargo Advantage WealthBuilder Tactical Equity PortfolioSM, Wells Fargo Advantage Dow Jones Target Today FundSM, Wells Fargo Advantage Dow Jones Target 2010 FundSM, Wells Fargo Advantage Dow Jones Target 2015 FundSM, Wells Fargo Advantage Dow Jones Target 2020 FundSM, Wells Fargo Advantage Dow Jones Target 2025 FundSM, Wells Fargo Advantage Dow Jones Target 2030 FundSM, Wells Fargo Advantage Dow Jones Target 2035 FundSM, Wells Fargo Advantage Dow Jones Target 2040 FundSM, Wells Fargo Advantage Dow Jones Target 2045 FundSM, Wells Fargo Advantage Dow Jones Target 2050 FundSM, Wells Fargo Advantage Dow Jones Target 2055 FundSM, Wells Fargo Advantage Heritage Money Market FundSM, Wells Fargo Advantage VT Discovery FundSM, and Wells Fargo Advantage VT Opportunity FundSM are referred to as the Discovery Fund, Endeavor Select Fund, Enterprise Fund, Opportunity Fund, WealthBuilder Conservative Allocation Portfolio, WealthBuilder Equity Portfolio, WealthBuilder Growth Allocation Portfolio, WealthBuilder Growth Balanced Portfolio, WealthBuilder Moderate Balanced Portfolio, WealthBuilder Tactical Equity Portfolio, Target Today Fund, Target 2010 Fund, Target 2015 Fund, Target 2020 Fund, Target 2025 Fund, Target 2030 Fund, Target 2035 Fund, Target 2040 Fund, Target 2045 Fund, Target 2050 Fund, Target 2055 Fund, Heritage Money Market Fund, VT Discovery Fund, and VT Opportunity Fund, respectively. |
Not part of the semi-annual report.
| | | | |
| 2 | | Wells Fargo Advantage High Yield Bond Fund | | Letter to Shareholders |

Karla M. Rabusch,
President
Wells Fargo Advantage Funds
The theme for the period was a shift from risk aversion in the first half to burgeoning trends of improving investor confidence in the second half, which significantly improved pricing in the lower-rated asset classes.
On the whole, investment-grade fixed-income securities performed positively during the period, but the strongest returns came from the high-yield market.
Dear Valued Shareholder:
We are pleased to offer you this semi-annual report for the Wells Fargo Advantage High Yield Bond Fund, which covers the six-month period that ended February 29, 2012. During the period, fixed-income performance was best among the lower-rated securities, as improved investor confidence in the U.S. economy and the U.S. credit markets encouraged investors to return to riskier asset classes.
The period began with heightened risk aversion but ended with stronger investor confidence.
The six-month period began with the worsening of the Greek crisis, which amplified risk aversion across the global credit markets. This in turn led to a powerful rally in U.S. Treasuries and a sharp decline in high-yield bond prices, most notably in the lowest-quality credit tiers. During this time, most investment-grade fixed-income markets continued to generate positive returns—although certain areas of the riskiest segments of the markets declined—and U.S. Treasury yields reached the lowest levels in decades, even surpassing the low yield levels reached in the summer of 2010.
The last three months of the period were characterized by a strong reversal of the trends of the first three months. In October 2011, the high-yield market recovered significantly, benefiting from indications of improving policy with regard to managing the debt crisis from Europe and the formal announcement of a European debt deal late in the month. Due to renewed concerns about the European Union’s ability to manage the debt crisis, November 2011 saw a modest decline in investment-grade corporate bond prices and a sharp correction in high-yield corporate bonds, but another strong recovery in pricing started in December and carried into the first two months of 2012. Investor confidence strengthened as the U.S. economy demonstrated signs of sustainable growth and U.S. credit markets began to show some resistance to the credit problems of Europe. Thus, the theme for the period was a shift from risk aversion in the first half to burgeoning trends of improving investor confidence in the second half, which significantly improved pricing in the lower-rated asset classes.
On the whole, investment-grade fixed-income securities performed positively during the period, but the strongest returns came from the high-yield market. In fact, the best returns for the six-month period came from the lowest-rated credit tiers, despite the fact that they significantly underperformed in August and September 2011. Similar trends were true in the structured products sector, as lower-rated commercial mortgage-backed securities were among the best performers for the period, despite underperforming in the first two months.
The Federal Reserve launched Operation Twist in September.
With economic concerns and credit woes escalating in Europe and some continued uncertainty about the growth outlook in the U.S. during August and September 2011, the Federal Reserve (Fed) intervened yet again with monetary accommodations—this time with “Operation Twist,” which was announced and launched in September 2011. With Operation Twist, the Fed endeavored to flatten the yield curve and drive long-term rates down by selling short-term Treasuries and using the proceeds to purchase long-term Treasuries. The Fed stated that it is unlikely to raise rates before 2014, which should keep yields on Treasuries low. Despite this announcement, problems in Europe caused Treasuries to continue to rally in the first 3 months of the period, while credit spreads on corporate and
| | | | | | |
| Letter to Shareholders | | Wells Fargo Advantage High Yield Bond Fund | | | 3 | |
securitized sectors widened with increasing risk aversion. However, with an improved U.S. economic outlook and greater investor confidence, the last three months of the period saw a slight decline in U.S. Treasury prices and significant improvement in high-yield corporate bond prices. Credit spreads in the corporate and securitized sectors broadly tightened in December 2011 and January and February 2012.
Although U.S. economic conditions appear to have improved over the course of the period, the recovery continues to face some headwinds in the form of languishing housing values and elevated unemployment levels, which may continue to create some volatility in the fixed-income markets. While we cannot say definitively what near-term performance will look like, we continue to encourage investors to maintain fully diversified, actively managed portfolios, which may provide better protection from risk and added opportunities to capture relative value. While heightened volatility may be uncomfortable to experience in the short term, we believe it can lead to unique opportunities to add relative value for investors with long-term investment horizons.
Don’t let short-term uncertainty derail long-term investment goals.
Periods of uncertainty can present challenges, but experience has taught us that maintaining a long-term investment strategy based on individual goals and risk tolerance can be an effective way to plan for the future. To help you create a sound strategy based on your personal goals and risk tolerance, Wells Fargo Advantage Funds offers more than 110 mutual funds and other investments spanning a wide range of asset classes and investment styles. Although diversification cannot guarantee an investment profit or prevent losses, we believe it can be an effective way to manage investment risk and potentially smooth out overall portfolio performance.
In our opinion, diligent and earnest assessment of the fundamental risks in individual fixed-income securities will be a key differentiating factor between which investment strategies perform well and which do not. At Wells Fargo Advantage Funds, we intend to continue measuring relative-value opportunities in the fixed-income markets and across our lineup of funds. We believe it is particularly important to have diligent investment analysts in charge of investor assets in changing markets. As evidenced by the performance of fixed-income assets during the recent six-month period, heightened risks also often accompany such opportunities.
Thank you for choosing to invest with Wells Fargo Advantage Funds. We appreciate your confidence in us and remain committed to helping you meet your financial needs. For current information about your fund investments, contact your investment professional, visit our Web site at wellsfargoadvantagefunds.com, or call us directly at 1-800-222-8222. We are available 24 hours a day, 7 days a week.
Sincerely,

Karla M. Rabusch
President
Wells Fargo Advantage Funds
| | | | |
| 4 | | Wells Fargo Advantage High Yield Bond Fund | | Letter to Shareholders |
Notice to Shareholders
The Board of Trustees for Wells Fargo Advantage Funds has unanimously approved the following modifications to certain net asset value (NAV) waiver privileges and commission schedules:
| | n | | Effective May 1, 2012, automatic investment plan (AIP) purchases and proceeds received from systematic withdrawals will no longer qualify for NAV repurchase privileges. | |
| | n | | Effective May 1, 2012, discretionary rights to waive the upfront commission for Class C and “jumbo” Class A share purchases will no longer be granted to broker/dealers. However, we will continue to waive the Class C shares contingent deferred sales charge for redemptions by employer-sponsored retirement plans where the dealer of record waived its commission at the time of purchase. | |
| | n | | Effective July 31, 2012, NAV purchase privileges for former Evergreen Class IS and Class R shareholders are being modified to remove the ability to purchase Class A shares at NAV unless those shares are held directly with the Fund on or after July 31, 2012. | |
Please contact your investment professional or call us directly at 1-800-222-8222 if you have any questions on this Notice to Shareholders.
| | | | | | |
| Performance Highlights (Unaudited) | | Wells Fargo Advantage High Yield Bond Fund | | | 5 | |
INVESTMENT OBJECTIVE
The Fund seeks total return, consisting of a high level of current income and capital appreciation.
ADVISER
Wells Fargo Funds Management, LLC
SUB-ADVISER
Wells Capital Management Incorporated
PORTFOLIO MANAGERS
Niklas Nordenfelt, CFA
Phillip Susser
FUND INCEPTION
September 11, 1935
| | | | |
TEN LARGEST LONG-TERM HOLDINGS1 (AS OF FEBRUARY 29, 2012) | |
TXU Energy Company LLC, 3.50%, 10/10/2014 | | | 2.00% | |
Nuveen Investments Incorporated, 5.50%, 09/15/2015 | | | 1.72% | |
Nielson Finance LLC, 7.75%, 10/15/2018 | | | 1.67% | |
Sabine Pass LNG LP, 7.50%, 11/30/2016 | | | 1.51% | |
SunGard Data Systems Incorporated, 10.25%, 08/15/2015 | | | 1.44% | |
Sprint Capital Corporation, 6.88% , 11/15/2028 | | | 1.36% | |
Regal Cinemas Corporation, 8.63%, 07/15/2019 | | | 1.29% | |
CCH II Capital Corporation, 13.50%, 11/30/2016 | | | 1.27% | |
Cricket Communications Incorporated Series I, 7.75%, 05/15/2016 | | | 1.20% | |
Sprint Capital Corporation, 8.75% , 03/15/2032 | | | 1.19% | |
| | |
CREDIT QUALITY2 (AS OF FEBRUARY 29, 2012) |
|
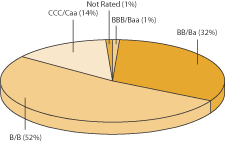 |
| 1. | The ten largest long-term holdings are calculated based on the value of the securities divided by total net assets of the Fund. Holdings are subject to change and may have changed since the date specified. |
| 2. | The ratings indicated are from Standard & Poor’s, Moody’s Investors Service, and/or Fitch Ratings Ltd. Credit Quality Ratings: Credit quality ratings apply to underlying holdings of the Fund and not the Fund itself. Standard & Poor’s rates the creditworthiness of bonds, ranging from AAA (highest) to D (lowest). Ratings from A to CCC may be modified by the addition of a plus (+) or minus (–) sign to show relative standing within the rating categories. Standard & Poor’s rates the creditworthiness of short-term notes from SP-1 (highest) to SP-3 (lowest). Moody’s rates the creditworthiness of bonds, ranging from Aaa (highest) to C (lowest). Ratings Aa to B may be modified by the addition of a number 1 (highest) to 3 (lowest) to show relative standing within the ratings categories. Moody’s rates the creditworthiness of short-term U.S. tax-exempt municipal securities from MIG 1/VMIG 1 (highest) to SG (lowest). Fitch rates the creditworthiness of bonds, ranging from AAA (highest) to D (lowest). If a security was rated by all three rating agencies, the middle rating was utilized. If rated by two of three rating agencies, the lower rating was utilized and if rated by one of the agencies that rating was utilized. Credit quality is subject to change and is calculated based on the total investments of the Fund. |
| | | | |
| 6 | | Wells Fargo Advantage High Yield Bond Fund | | Performance Highlights (Unaudited) |
AVERAGE ANNUAL TOTAL RETURN3 (%) (AS OF FEBRUARY 29, 2012)
| | | | | | | | | | | | | | | | | | | | | | | | | | | | | | | | | | | | | | | | | | | | |
| | | | | | Including Sales Charge | | | Excluding Sales Charge | | | Expense Ratios4 | |
| | | Inception Date | | | 6 Months* | | | 1 Year | | | 5 Year | | | 10 Year | | | 6 Months* | | | 1 Year | | | 5 Year | | | 10 Year | | | Gross | | | Net5 | |
Class A (EKHAX) | | | 01/20/1998 | | | | 2.08 | | | | 0.42 | | | | 5.72 | | | | 7.31 | | | | 6.79 | | | | 5.16 | | | | 6.70 | | | | 7.79 | | | | 1.02% | | | | 1.02% | |
Class B (EKHBX)** | | | 09/11/1935 | | | | 1.40 | | | | (0.55 | ) | | | 5.61 | | | | 7.25 | | | | 6.40 | | | | 4.37 | | | | 5.91 | | | | 7.25 | | | | 1.77% | | | | 1.77% | |
Class C (EKHCX) | | | 01/21/1998 | | | | 5.40 | | | | 3.37 | | | | 5.91 | | | | 7.01 | | | | 6.40 | | | | 4.37 | | | | 5.91 | | | | 7.01 | | | | 1.77% | | | | 1.77% | |
Administrator Class (EKHYX) | | | 04/14/1998 | | | | | | | | | | | | | | | | | | | | 6.91 | | | | 5.38 | | | | 6.96 | | | | 8.08 | | | | 0.96% | | | | 0.80% | |
BofA Merrill Lynch High Yield Master Index6 | | | | | | | | | | | | | | | | | | | | | | | 7.70 | | | | 6.25 | | | | 7.81 | | | | 9.13 | | | | | | | | | |
BofA Merrill Lynch U.S. High Yield Master II Constrained Index7 | | | | | | | | | | | | | | | | | | | | | | | 7.73 | | | | 6.17 | | | | 8.10 | | | | 9.38 | | | | | | | | | |
| * | Returns for periods of less than one year are not annualized. |
| ** | Class B shares are closed to investment, except in connection with the reinvestment of any distributions and permitted exchanges. |
Figures quoted represent past performance, which is no guarantee of future results and do not reflect the deduction of taxes that a shareholder may pay on fund distributions or the redemption of fund shares. Investment return and principal value of an investment will fluctuate so that an investor’s shares, when redeemed, may be worth more or less than their original cost. Performance shown without sales charges would be lower if sales charges were reflected. Current performance may be lower or higher than the performance data quoted and assumes the reinvestment of dividends and capital gains. Current month-end performance is available on the Fund’s Web site – wellsfargoadvantagefunds.com
Index returns do not include transaction costs associated with buying and selling securities, any mutual fund fees or expenses or any taxes. It is not possible to invest directly in an index.
For Class A shares, the maximum front-end sales charge is 4.50%. For Class B shares, the maximum contingent deferred sales charge is 5.00%. For Class C shares, the maximum contingent deferred sales charge is 1.00%. Performance including sales charge assumes the sales charge for the corresponding time period. Administrator Class shares are sold without a front-end sales charge or contingent deferred sales charge.
Bond fund values fluctuate in response to the financial condition of individual issuers, general market and economic conditions, and changes in interest rates. In general, when interest rates rise, bond fund values fall and investors may lose principal value. High-yield securities have a greater risk of default and tend to be more volatile than higher-rated debt securities. Loans are subject to risks similar to those associated with other below investment grade bond investments, such as credit risk (e.g. risk of issuer default), below investment grade bond risk (e.g. risk of greater volatility in value) and risk that the loan may become illiquid or difficult to price. The use of derivatives may reduce returns and/or increase volatility. Consult the Fund’s prospectus for additional information on these and other risks.
| 3. | Historical performance shown for all classes of the Fund prior to July 12, 2010 is based on the performance of the Fund’s predecessor, Evergreen High Income Fund. |
| 4. | Reflects the expense ratios as stated in the most recent prospectuses. |
| 5. | The Adviser has committed through July 11, 2013 to waive fees and/or reimburse expenses to the extent necessary to cap the Fund’s Total Annual Fund Operating Expenses After Fee Waiver, excluding certain expenses, at 1.03% for Class A, 1.78% for Class B, 1.78% for Class C and 0.80% for Administrator Class. Without this cap, the Fund’s returns would have been lower. |
| 6. | The BofA Merrill Lynch High Yield Master Index is a market capitalization-weighted index of domestic and yankee high-yield bonds. The index tracks the performance of high-yield securities traded in the U.S. bond market. The primary index was changed from BofA Merrill Lynch High Yield Master Index to BofAMerrill Lynch U.S. High Yield Master II Constrained Index. You cannot invest directly in an index. |
| 7. | The BofA Merrill Lynch U.S. High Yield Master II Constrained Index is a market value-weighted index of all domestic and yankee high-yield bonds, including deferred interest bonds and payment-in kind securities. Issues included in the index have maturities of one year or more and have a credit rating lower than BBB–/Baa3, but are not in default. The BofA Merrill Lynch U.S. High Yield Master II Constrained Index limits any individual issuer to a maximum of 2% benchmark exposure. You cannot invest directly in an index. |
| | | | | | |
| Fund Expenses (Unaudited) | | Wells Fargo Advantage High Yield Bond Fund | | | 7 | |
As a shareholder of the Fund, you incur two types of costs: (1) transaction costs, including sales charges (loads) on purchase payments and contingent deferred sales charges (if any) on redemptions and (2) ongoing costs, including management fees; distribution (12b-1) and/or shareholder service fees; and other Fund expenses. This example is intended to help you understand your ongoing costs (in dollars) of investing in the Fund and to compare these costs with the ongoing costs of investing in other mutual funds.
The example is based on an investment of $1,000 invested at the beginning of the six-month period and held for the entire period from September 1, 2011 to February 29, 2012.
Actual Expenses
The “Actual” line of the table below provides information about actual account values and actual expenses. You may use the information in this line, together with the amount you invested, to estimate the expenses that you paid over the period. Simply divide your account value by $1,000 (for example, an $8,600 account value divided by $1,000 = 8.6), then multiply the result by the number in the “Actual” line under the heading entitled “Expenses Paid During Period” for your applicable class of shares to estimate the expenses you paid on your account during this period.
Hypothetical Example for Comparison Purposes
The “Hypothetical” line of the table below provides information about hypothetical account values and hypothetical expenses based on the Fund’s actual expense ratio and an assumed rate of return of 5% per year before expenses, which is not the Fund’s actual return. The hypothetical account values and expenses may not be used to estimate the actual ending account balance or expenses you paid for the period. You may use this information to compare the ongoing costs of investing in the Fund and other funds. To do so, compare this 5% hypothetical example with the 5% hypothetical examples that appear in the shareholder reports of the other funds.
Please note that the expenses shown in the table are meant to highlight your ongoing costs only and do not reflect any transactional costs, such as sales charges (loads) and contingent deferred sales charges. Therefore, the “Hypothetical” line of the table is useful in comparing ongoing costs only, and will not help you determine the relative total costs of owning different funds. In addition, if these transactional costs were included, your costs would have been higher.
| | | | | | | | | | | | | | | | |
| | | Beginning
Account Value
09-01-2011 | | | Ending
Account Value
02-29-2012 | | | Expenses
Paid During
the Period1 | | | Net Annual
Expense Ratio | |
Class A | | | | | | | | | | | | | | | | |
Actual | | $ | 1,000.00 | | | $ | 1,067.95 | | | $ | 5.24 | | | | 1.02 | % |
Hypothetical (5% return before expenses) | | $ | 1,000.00 | | | $ | 1,019.79 | | | $ | 5.12 | | | | 1.02 | % |
Class B | | | | | | | | | | | | | | | | |
Actual | | $ | 1,000.00 | | | $ | 1,064.01 | | | $ | 9.03 | | | | 1.76 | % |
Hypothetical (5% return before expenses) | | $ | 1,000.00 | | | $ | 1,016.11 | | | $ | 8.82 | | | | 1.76 | % |
Class C | | | | | | | | | | | | | | | | |
Actual | | $ | 1,000.00 | | | $ | 1,064.01 | | | $ | 9.08 | | | | 1.77 | % |
Hypothetical (5% return before expenses) | | $ | 1,000.00 | | | $ | 1,016.06 | | | $ | 8.87 | | | | 1.77 | % |
Administrator Class | | | | | | | | | | | | | | | | |
Actual | | $ | 1,000.00 | | | $ | 1,069.10 | | | $ | 4.12 | | | | 0.80 | % |
Hypothetical (5% return before expenses) | | $ | 1,000.00 | | | $ | 1,020.89 | | | $ | 4.02 | | | | 0.80 | % |
| 1. | Expenses paid is equal to the annualized expense ratio of each class multiplied by the average account value over the period, multiplied by the number of days in the most recent fiscal half-year divided by the number of days in the fiscal year (to reflect the one-half year period). |
| | | | |
| 8 | | Wells Fargo Advantage High Yield Bond Fund | | Portfolio of Investments—February 29, 2012 (Unaudited) |
| | | | | | | | | | | | | | | | |
| Security Name | | | | | | | | Shares | | | Value | |
| | | | | | | | | | | | | | | | |
| | | | |
Common Stocks: 0.06% | | | | | | | | | | | | | | | | |
| | | | |
Consumer Discretionary: 0.00% | | | | | | | | | | | | | | | | |
| | | | |
| Hotels, Restaurants & Leisure: 0.00% | | | | | | | | | | | | | | | | |
Trump Entertainment Resorts Incorporated † | | | | | | | | | | | 1,840 | | | $ | 7,360 | |
| | | | | | | | | | | | | | | | |
| | | | |
Telecommunication Services: 0.06% | | | | | | | | | | | | | | | | |
| | | | |
| Diversified Telecommunication Services: 0.06% | | | | | | | | | | | | | | | | |
Fairpoint Communications Incorporated † | | | | | | | | | | | 70,879 | | | | 266,506 | |
| | | | | | | | | | | | | | | | |
| | | | |
Total Common Stocks (Cost $1,573,931) | | | | | | | | | | | | | | | 273,866 | |
| | | | | | | | | | | | | | | | |
| | | | |
| | | Interest Rate | | | Maturity Date | | | Principal | | | | |
| Corporate Bonds and Notes: 77.85% | | | | | | | | | | | | | | | | |
| | | | |
Consumer Discretionary: 19.63% | | | | | | | | | | | | | | | | |
| | | | |
| Auto Components: 1.78% | | | | | | | | | | | | | | | | |
Allison Transmission Incorporated 144A | | | 7.13 | % | | | 05/15/2019 | | | $ | 2,250,000 | | | | 2,317,500 | |
Cooper Tire & Rubber Company | | | 7.63 | | | | 03/15/2027 | | | | 1,935,000 | | | | 1,876,950 | |
Cooper Tire & Rubber Company | | | 8.00 | | | | 12/15/2019 | | | | 450,000 | | | | 479,813 | |
Exide Technologies | | | 8.63 | | | | 02/01/2018 | | | | 550,000 | | | | 427,625 | |
Goodyear Tire & Rubber Company | | | 7.00 | | | | 05/15/2022 | | | | 325,000 | | | | 329,063 | |
Goodyear Tire & Rubber Company | | | 10.50 | | | | 05/15/2016 | | | | 1,918,000 | | | | 2,100,229 | |
| | | | |
| | | | | | | | | | | | | | | 7,531,180 | |
| | | | | | | | | | | | | | | | |
| | | | |
| Diversified Consumer Services: 2.75% | | | | | | | | | | | | | | | | |
Carriage Services Incorporated | | | 7.88 | | | | 01/15/2015 | | | | 1,715,000 | | | | 1,732,150 | |
Mac-Gray Corporation | | | 7.63 | | | | 08/15/2015 | | | | 1,942,000 | | | | 1,995,405 | |
Service Corporation International | | | 7.00 | | | | 05/15/2019 | | | | 515,000 | | | | 569,075 | |
Service Corporation International | | | 7.50 | | | | 04/01/2027 | | | | 4,080,000 | | | | 4,080,000 | |
Service Corporation International | | | 7.63 | | | | 10/01/2018 | | | | 850,000 | | | | 989,188 | |
Service Corporation International | | | 8.00 | | | | 11/15/2021 | | | | 525,000 | | | | 610,641 | |
Service Corporation International Series WI | | | 7.00 | | | | 06/15/2017 | | | | 1,500,000 | | | | 1,680,000 | |
| | | | |
| | | | | | | | | | | | | | | 11,656,459 | |
| | | | | | | | | | | | | | | | |
| | | | |
| Hotels, Restaurants & Leisure: 5.01% | | | | | | | | | | | | | | | | |
Ameristar Casinos Incorporated | | | 7.50 | | | | 04/15/2021 | | | | 3,150,000 | | | | 3,402,000 | |
CityCenter Holdings LLC | | | 7.63 | | | | 01/15/2016 | | | | 175,000 | | | | 184,625 | |
CityCenter Holdings LLC 144A | | | 7.63 | | | | 01/15/2016 | | | | 1,225,000 | | | | 1,289,313 | |
CityCenter Holdings LLC ¥ | | | 11.50 | | | | 01/15/2017 | | | | 1,316,279 | | | | 1,423,227 | |
Dineequity Incorporated | | | 9.50 | | | | 10/30/2018 | | | | 3,450,000 | | | | 3,803,625 | |
FelCor Lodging LP | | | 6.75 | | | | 06/01/2019 | | | | 1,350,000 | | | | 1,380,375 | |
Greektown Superholdings Incorporated | | | 13.00 | | | | 07/01/2015 | | | | 3,550,000 | | | | 3,896,125 | |
Greektown Superholdings Incorporated | | | 13.00 | | | | 07/01/2015 | | | | 2,250,000 | | | | 2,469,375 | |
NAI Entertainment Holdings LLC 144A | | | 8.25 | | | | 12/15/2017 | | | | 2,350,000 | | | | 2,585,000 | |
Speedway Motorsports Incorporated | | | 6.75 | | | | 02/01/2019 | | | | 225,000 | | | | 234,563 | |
Yonkers Racing Corporation 144A | | | 11.38 | | | | 07/15/2016 | | | | 511,000 | | | | 553,796 | |
| | | | |
| | | | | | | | | | | | | | | 21,222,024 | |
| | | | | | | | | | | | | | | | |
The accompanying notes are an integral part of these financial statements.
| | | | | | |
| Portfolio of Investments—February 29, 2012 (Unaudited) | | Wells Fargo Advantage High Yield Bond Fund | | | 9 | |
| | | | | | | | | | | | | | | | |
| Security Name | | Interest Rate | | | Maturity Date | | | Principal | | | Value | |
| | | | | | | | | | | | | | | | |
| | | | |
| Media: 8.05% | | | | | | | | | | | | | | | | |
Cablevision Systems Corporation | | | 8.63 | % | | | 09/15/2017 | | | $ | 900,000 | | | $ | 1,014,750 | |
CCH II Capital Corporation | | | 13.50 | | | | 11/30/2016 | | | | 4,689,383 | | | | 5,392,790 | |
CCO Holdings LLC | | | 8.13 | | | | 04/30/2020 | | | | 560,000 | | | | 627,200 | |
Cinemark USA Incorporated | | | 7.38 | | | | 06/15/2021 | | | | 775,000 | | | | 827,313 | |
Cinemark USA Incorporated | | | 8.63 | | | | 06/15/2019 | | | | 3,525,000 | | | | 3,921,563 | |
CSC Holdings LLC | | | 7.88 | | | | 02/15/2018 | | | | 300,000 | | | | 339,000 | |
CSC Holdings LLC | | | 8.50 | | | | 04/15/2014 | | | | 125,000 | | | | 138,750 | |
DISH DBS Corporation | | | 7.88 | | | | 09/01/2019 | | | | 1,070,000 | | | | 1,257,250 | |
EchoStar DBS Corporation | | | 6.63 | | | | 10/01/2014 | | | | 675,000 | | | | 735,750 | |
EchoStar DBS Corporation | | | 7.75 | | | | 05/31/2015 | | | | 2,075,000 | | | | 2,347,344 | |
Gray Television Incorporated | | | 10.50 | | | | 06/29/2015 | | | | 2,600,000 | | | | 2,746,250 | |
Lamar Media Corporation 144A | | | 5.88 | | | | 02/01/2022 | | | | 200,000 | | | | 208,750 | |
Lamar Media Corporation | | | 7.88 | | | | 04/15/2018 | | | | 1,150,000 | | | | 1,265,000 | |
Lamar Media Corporation Series C | | | 9.75 | | | | 04/01/2014 | | | | 1,945,000 | | | | 2,212,438 | |
LIN Television Corporation | | | 8.38 | | | | 04/15/2018 | | | | 650,000 | | | | 687,375 | |
Local TV Finance LLC 144A¥ | | | 9.25 | | | | 06/15/2015 | | | | 1,450,000 | | | | 1,475,375 | |
National Cinemedia LLC | | | 7.88 | | | | 07/15/2021 | | | | 525,000 | | | | 556,500 | |
Nexstar Mission Broadcasting Incorporated | | | 8.88 | | | | 04/15/2017 | | | | 300,000 | | | | 321,000 | |
Regal Cinemas Corporation | | | 8.63 | | | | 07/15/2019 | | | | 5,000,000 | | | | 5,462,500 | |
Salem Communications Corporation | | | 9.63 | | | | 12/15/2016 | | | | 2,299,000 | | | | 2,534,648 | |
| | | | |
| | | | | | | | | | | | | | | 34,071,546 | |
| | | | | | | | | | | | | | | | |
| | | | |
| Specialty Retail: 2.04% | | | | | | | | | | | | | | | | |
99 Cents Only Stores Incorporated 144A | | | 11.00 | | | | 12/15/2019 | | | | 250,000 | | | | 264,375 | |
American Greetings Corporation | | | 7.38 | | | | 12/01/2021 | | | | 450,000 | | | | 464,625 | |
CDW Finance LLC | | | 12.54 | | | | 10/12/2017 | | | | 575,000 | | | | 626,750 | |
Gap Incorporated | | | 5.95 | | | | 04/12/2021 | | | | 600,000 | | | | 601,586 | |
Limited Brands Incorporated | | | 5.63 | | | | 02/15/2022 | | | | 1,025,000 | | | | 1,055,750 | |
Limited Brands Incorporated | | | 6.63 | | | | 04/01/2021 | | | | 300,000 | | | | 330,000 | |
RadioShack Corporation « | | | 6.75 | | | | 05/15/2019 | | | | 1,775,000 | | | | 1,486,563 | |
Rent A Center Incorporated | | | 6.63 | | | | 11/15/2020 | | | | 400,000 | | | | 416,500 | |
Toys R Us Property Company LLC | | | 8.50 | | | | 12/01/2017 | | | | 1,300,000 | | | | 1,374,750 | |
Toys R Us Property Company LLC | | | 10.75 | | | | 07/15/2017 | | | | 1,825,000 | | | | 2,023,469 | |
| | | | |
| | | | | | | | | | | | | | | 8,644,368 | |
| | | | | | | | | | | | | | | | |
| | | | |
Consumer Staples: 0.18% | | | | | | | | | | | | | | | | |
| | | | |
| Food Products: 0.18% | | | | | | | | | | | | | | | | |
B&G Foods Incorporated | | | 7.63 | | | | 01/15/2018 | | | | 575,000 | | | | 623,156 | |
Darling International Incorporated | | | 8.50 | | | | 12/15/2018 | | | | 125,000 | | | | 140,625 | |
| | | | |
| | | | | | | | | | | | | | | 763,781 | |
| | | | | | | | | | | | | | | | |
| | | | |
Energy: 13.84% | | | | | | | | | | | | | | | | |
| | | | |
| Energy Equipment & Services: 3.04% | | | | | | | | | | | | | | | | |
Bristow Group Incorporated | | | 7.50 | | | | 09/15/2017 | | | | 1,515,000 | | | | 1,583,175 | |
Dresser Rand Group Incorporated 144A | | | 6.50 | | | | 05/01/2021 | | | | 1,025,000 | | | | 1,073,688 | |
Gulfmark Offshore Incorporated | | | 7.75 | | | | 07/15/2014 | | | | 1,565,000 | | | | 1,576,738 | |
Hornbeck Offshore Services Incorporated Series B | | | 6.13 | | | | 12/01/2014 | | | | 2,300,000 | | | | 2,305,750 | |
Hornbeck Offshore Services Incorporated Series B | | | 8.00 | | | | 09/01/2017 | | | | 1,435,000 | | | | 1,513,925 | |
The accompanying notes are an integral part of these financial statements.
| | | | |
| 10 | | Wells Fargo Advantage High Yield Bond Fund | | Portfolio of Investments—February 29, 2012 (Unaudited) |
| | | | | | | | | | | | | | | | |
| Security Name | | Interest Rate | | | Maturity Date | | | Principal | | | Value | |
| | | | | | | | | | | | | | | | |
| | | | |
| Energy Equipment & Services (continued) | | | | | | | | | | | | | | | | |
Oil States International Incorporated | | | 6.50 | % | | | 06/01/2019 | | | $ | 1,375,000 | | | $ | 1,478,125 | |
PHI Incorporated | | | 8.63 | | | | 10/15/2018 | | | | 3,250,000 | | | | 3,331,250 | |
| | | | |
| | | | | | | | | | | | | | | 12,862,651 | |
| | | | | | | | | | | | | | | | |
| | | | |
| Oil, Gas & Consumable Fuels: 10.80% | | | | | | | | | | | | | | | | |
Arch Coal Incorporated | | | 8.75 | | | | 08/01/2016 | | | | 1,020,000 | | | | 1,122,000 | |
Coffeyville Resources Incorporated 144A | | | 9.00 | | | | 04/01/2015 | | | | 2,250,000 | | | | 2,407,500 | |
Coffeyville Resources Incorporated 144A | | | 10.88 | | | | 04/01/2017 | | | | 2,075,000 | | | | 2,344,750 | |
Consol Energy Incorporated | | | 8.25 | | | | 04/01/2020 | | | | 845,000 | | | | 921,050 | |
Crestwood Midstream Part Company 144A | | | 7.75 | | | | 04/01/2019 | | | | 600,000 | | | | 606,000 | |
Denbury Resources Incorporated | | | 6.38 | | | | 08/15/2021 | | | | 350,000 | | | | 385,875 | |
Denbury Resources Incorporated | | | 8.25 | | | | 02/15/2020 | | | | 1,400,000 | | | | 1,596,000 | |
Denbury Resources Incorporated | | | 9.75 | | | | 03/01/2016 | | | | 225,000 | | | | 251,156 | |
El Paso Corporation | | | 6.50 | | | | 09/15/2020 | | | | 915,000 | | | | 1,010,597 | |
El Paso Corporation | | | 7.00 | | | | 06/15/2017 | | | | 2,375,000 | | | | 2,654,272 | |
El Paso Corporation | | | 7.25 | | | | 06/01/2018 | | | | 4,010,000 | | | | 4,540,331 | |
El Paso Corporation | | | 7.42 | | | | 02/15/2037 | | | | 760,000 | | | | 841,179 | |
El Paso Corporation (i) | | | 8.25 | | | | 02/15/2016 | | | | 595,000 | | | | 647,412 | |
Energy Transfer Equity LP | | | 7.50 | | | | 10/15/2020 | | | | 3,475,000 | | | | 3,978,875 | |
Ferrellgas Partners LP | | | 9.13 | | | | 10/01/2017 | | | | 3,420,000 | | | | 3,625,200 | |
Forest Oil Corporation | | | 7.25 | | | | 06/15/2019 | | | | 1,315,000 | | | | 1,324,863 | |
Forest Oil Corporation | | | 8.50 | | | | 02/15/2014 | | | | 560,000 | | | | 607,600 | |
Holly Corporation | | | 9.88 | | | | 06/15/2017 | | | | 1,870,000 | | | | 2,089,725 | |
Inergy LP | | | 6.88 | | | | 08/01/2021 | | | | 421,000 | | | | 406,265 | |
Inergy LP | | | 7.00 | | | | 10/01/2018 | | | | 525,000 | | | | 517,125 | |
Overseas Shipholding Group | | | 7.50 | | | | 02/15/2024 | | | | 200,000 | | | | 118,500 | |
Regency Energy Partners | | | 6.88 | | | | 12/01/2018 | | | | 250,000 | | | | 271,250 | |
Sabine Pass LNG LP | | | 7.25 | | | | 11/30/2013 | | | | 2,600,000 | | | | 2,743,000 | |
Sabine Pass LNG LP | | | 7.50 | | | | 11/30/2016 | | | | 5,950,000 | | | | 6,396,250 | |
Suburban Propane Partners LP | | | 7.38 | | | | 03/15/2020 | | | | 2,550,000 | | | | 2,715,750 | |
Susser Holdings LLC | | | 8.50 | | | | 05/15/2016 | | | | 1,375,000 | | | | 1,509,063 | |
Targa Resources Partners LP 144A | | | 6.38 | | | | 08/01/2022 | | | | 100,000 | | | | 105,250 | |
| | | | |
| | | | | | | | | | | | | | | 45,736,838 | |
| | | | | | | | | | | | | | | | |
| | | | |
Financials: 20.04% | | | | | | | | | | | | | | | | |
| | | | |
| Capital Markets: 0.27% | | | | | | | | | | | | | | | | |
Oppenheimer Holdings Incorporated | | | 8.75 | | | | 04/15/2018 | | | | 1,100,000 | | | | 1,122,000 | |
| | | | | | | | | | | | | | | | |
| | | | |
| Commercial Banks: 0.65% | | | | | | | | | | | | | | | | |
Emigrant Bancorp Incorporated 144A (i) | | | 6.25 | | | | 06/15/2014 | | | | 3,050,000 | | | | 2,757,654 | |
| | | | | | | | | | | | | | | | |
| | | | |
| Consumer Finance: 12.28% | | | | | | | | | | | | | | | | |
Ally Financial Incorporated | | | 5.50 | | | | 02/15/2017 | | | | 625,000 | | | | 633,097 | |
American General Finance Corporation | | | 5.40 | | | | 12/01/2015 | | | | 300,000 | | | | 237,750 | |
American General Finance Corporation | | | 5.75 | | | | 09/15/2016 | | | | 925,000 | | | | 698,375 | |
Calpine Construction Finance Corporation 144A | | | 7.25 | | | | 10/15/2017 | | | | 3,350,000 | | | | 3,551,000 | |
Calpine Construction Finance Corporation 144A | | | 8.00 | | | | 06/01/2016 | | | | 1,700,000 | | | | 1,848,750 | |
CIT Group Incorporated 144A | | | 4.75 | | | | 02/15/2015 | | | | 1,350,000 | | | | 1,370,250 | |
CIT Group Incorporated 144A | | | 5.25 | | | | 04/01/2014 | | | | 750,000 | | | | 766,875 | |
The accompanying notes are an integral part of these financial statements.
| | | | | | |
| Portfolio of Investments—February 29, 2012 (Unaudited) | | Wells Fargo Advantage High Yield Bond Fund | | | 11 | |
| | | | | | | | | | | | | | | | |
| Security Name | | Interest Rate | | | Maturity Date | | | Principal | | | Value | |
| | | | | | | | | | | | | | | | |
| | | | |
| Consumer Finance (continued) | | | | | | | | | | | | | | | | |
CIT Group Incorporated 144A | | | 5.50 | % | | | 02/15/2019 | | | $ | 1,025,000 | | | $ | 1,046,781 | |
CIT Group Incorporated 144A | | | 7.00 | | | | 05/04/2015 | | | | 2,100,000 | | | | 2,105,250 | |
CIT Group Incorporated | | | 7.00 | | | | 05/01/2016 | | | | 2,247,239 | | | | 2,250,048 | |
CIT Group Incorporated | | | 7.00 | | | | 05/01/2017 | | | | 3,875,000 | | | | 3,875,000 | |
Ford Motor Credit Company LLC | | | 6.63 | | | | 08/15/2017 | | | | 900,000 | | | | 1,019,989 | |
Ford Motor Credit Company LLC | | | 8.00 | | | | 12/15/2016 | | | | 2,700,000 | | | | 3,209,050 | |
General Motors Finance Company | | | 6.75 | | | | 06/01/2018 | | | | 1,200,000 | | | | 1,295,188 | |
GMAC LLC | | | 7.50 | | | | 12/31/2013 | | | | 2,430,000 | | | | 2,587,950 | |
GMAC LLC | | | 8.00 | | | | 11/01/2031 | | | | 525,000 | | | | 586,031 | |
International Lease Finance Corporation | | | 6.38 | | | | 03/25/2013 | | | | 515,000 | | | | 526,588 | |
International Lease Finance Corporation 144A | | | 6.50 | | | | 09/01/2014 | | | | 125,000 | | | | 133,125 | |
International Lease Finance Corporation 144A | | | 6.75 | | | | 09/01/2016 | | | | 125,000 | | | | 136,563 | |
International Lease Finance Corporation 144A | | | 7.13 | | | | 09/01/2018 | | | | 1,200,000 | | | | 1,344,000 | |
International Lease Finance Corporation | | | 8.63 | | | | 09/15/2015 | | | | 1,015,000 | | | | 1,126,650 | |
Nielson Finance LLC | | | 7.75 | | | | 10/15/2018 | | | | 6,365,000 | | | | 7,081,063 | |
Springleaf Finance Corporation | | | 6.90 | | | | 12/15/2017 | | | | 4,875,000 | | | | 3,778,125 | |
Sprint Capital Corporation | | | 6.88 | | | | 11/15/2028 | | | | 7,357,000 | | | | 5,738,460 | |
Sprint Capital Corporation | | | 8.75 | | | | 03/15/2032 | | | | 5,675,000 | | | | 5,050,750 | |
| | | | |
| | | | | | | | | | | | | | | 51,996,708 | |
| | | | | | | | | | | | | | | | |
| | | | |
| Diversified Financial Services: 3.78% | | | | | | | | | | | | | | | | |
Ally Financial Incorporated | | | 8.30 | | | | 02/12/2015 | | | | 300,000 | | | | 331,500 | |
Interactive Data Corporation | | | 10.25 | | | | 08/01/2018 | | | | 1,250,000 | | | | 1,409,375 | |
NCO Group Incorporated | | | 11.88 | | | | 11/15/2014 | | | | 2,650,000 | | | | 2,636,750 | |
NSG Holdings LLC 144A (i) | | | 7.75 | | | | 12/15/2025 | | | | 900,000 | | | | 909,000 | |
Nuveen Investments Incorporated | | | 5.50 | | | | 09/15/2015 | | | | 7,800,000 | | | | 7,293,000 | |
Nuveen Investments Incorporated | | | 10.50 | | | | 11/15/2015 | | | | 1,575,000 | | | | 1,645,875 | |
Nuveen Investments Incorporated 144A | | | 10.50 | | | | 11/15/2015 | | | | 450,000 | | | | 468,000 | |
Samson Investment Compan 144A | | | 9.75 | | | | 02/15/2020 | | | | 600,000 | | | | 631,500 | |
USI Holdings Corporation 144A± | | | 4.38 | | | | 11/15/2014 | | | | 475,000 | | | | 440,563 | |
USI Holdings Corporation 144A | | | 9.75 | | | | 05/15/2015 | | | | 250,000 | | | | 250,625 | |
| | | | |
| | | | | | | | | | | | | | | 16,016,188 | |
| | | | | | | | | | | | | | | | |
| | | | |
| Insurance: 0.76% | | | | | | | | | | | | | | | | |
HUB International Holdings Incorporated 144A | | | 10.25 | | | | 06/15/2015 | | | | 3,150,000 | | | | 3,228,750 | |
| | | | | | | | | | | | | | | | |
| | | | |
| REITs: 2.30% | | | | | | | | | | | | | | | | |
Dupont Fabros Technology Incorporated | | | 8.50 | | | | 12/15/2017 | | | | 3,970,000 | | | | 4,386,850 | |
MPT Operating Partnership LP | | | 6.38 | | | | 02/15/2022 | | | | 325,000 | | | | 335,563 | |
MPT Operating Partnership LP | | | 6.88 | | | | 05/01/2021 | | | | 1,625,000 | | | | 1,727,578 | |
Omega Healthcare Investors Incorporated | | | 6.75 | | | | 10/15/2022 | | | | 2,200,000 | | | | 2,378,750 | |
Ventas Incorporated | | | 9.00 | | | | 05/01/2012 | | | | 909,000 | | | | 917,239 | |
| | | | |
| | | | | | | | | | | | | | | 9,745,980 | |
| | | | | | | | | | | | | | | | |
| | | | |
Health Care: 4.43% | | | | | | | | | | | | | | | | |
| | | | |
| Health Care Equipment & Supplies: 0.19% | | | | | | | | | | | | | | | | |
Biomet Incorporated ¥ | | | 10.38 | | | | 10/15/2017 | | | | 515,000 | | | | 560,706 | |
Fresenius Medical Care Incorporated 144A | | | 5.75 | | | | 02/15/2021 | | | | 225,000 | | | | 235,688 | |
| | | | |
| | | | | | | | | | | | | | | 796,394 | |
| | | | | | | | | | | | | | | | |
The accompanying notes are an integral part of these financial statements.
| | | | |
| 12 | | Wells Fargo Advantage High Yield Bond Fund | | Portfolio of Investments—February 29, 2012 (Unaudited) |
| | | | | | | | | | | | | | | | |
| Security Name | | Interest Rate | | | Maturity Date | | | Principal | | | Value | |
| | | | | | | | | | | | | | | | |
| | | | |
| Health Care Providers & Services: 3.84% | | | | | | | | | | | | | | | | |
AvivHealthcare Incorporated | | | 7.75 | % | | | 02/15/2019 | | | $ | 1,150,000 | | | $ | 1,175,875 | |
Centene Corporation | | | 5.75 | | | | 06/01/2017 | | | | 975,000 | | | | 1,016,438 | |
Community Health Systems Incorporated Series WI « | | | 8.88 | | | | 07/15/2015 | | | | 1,253,000 | | | | 1,312,518 | |
Emergency Medical Services Corporation | | | 8.13 | | | | 06/01/2019 | | | | 425,000 | | | | 446,250 | |
Fresenius Medical Care US Finance Incorporated | | | 6.88 | | | | 07/15/2017 | | | | 525,000 | | | | 582,750 | |
HCA Incorporated | | | 5.88 | | | | 03/15/2022 | | | | 100,000 | | | | 102,500 | |
HCA Incorporated | | | 6.50 | | | | 02/15/2020 | | | | 2,050,000 | | | | 2,198,625 | |
HCA Incorporated | | | 7.25 | | | | 09/15/2020 | | | | 1,000,000 | | | | 1,090,000 | |
HCA Incorporated | | | 7.50 | | | | 02/15/2022 | | | | 325,000 | | | | 351,813 | |
HCA Incorporated | | | 8.50 | | | | 04/15/2019 | | | | 175,000 | | | | 196,000 | |
Health Management plc | | | 6.13 | | | | 04/15/2016 | | | | 2,000,000 | | | | 2,087,500 | |
Health Management plc 144A | | | 7.38 | | | | 01/15/2020 | | | | 225,000 | | | | 234,563 | |
HealthSouth Corporation | | | 7.25 | | | | 10/01/2018 | | | | 450,000 | | | | 486,000 | |
HealthSouth Corporation | | | 7.75 | | | | 09/15/2022 | | | | 450,000 | | | | 489,375 | |
PSS World Medical Incorporated 144A | | | 6.38 | | | | 03/01/2022 | | | | 200,000 | | | | 208,000 | |
Sabra Health Care LP | | | 8.13 | | | | 11/01/2018 | | | | 1,875,000 | | | | 2,010,938 | |
United Surgical Partners International Incorporated | | | 8.88 | | | | 05/01/2017 | | | | 2,190,000 | | | | 2,285,813 | |
| | | | |
| | | | | | | | | | | | | | | 16,274,958 | |
| | | | | | | | | | | | | | | | |
| | | | |
| Pharmaceuticals: 0.40% | | | | | | | | | | | | | | | | |
Mylan Incorporated 144A | | | 6.00 | | | | 11/15/2018 | | | | 750,000 | | | | 784,688 | |
Mylan Incorporated 144A | | | 7.63 | | | | 07/15/2017 | | | | 100,000 | | | | 110,688 | |
Mylan Incorporated 144A | | | 7.88 | | | | 07/15/2020 | | | | 700,000 | | | | 782,250 | |
| | | | |
| | | | | | | | | | | | | | | 1,677,626 | |
| | | | | | | | | | | | | | | | |
| | | | |
Industrials: 3.13% | | | | | | | | | | | | | | | | |
| | | | |
| Aerospace & Defense: 0.08% | | | | | | | | | | | | | | | | |
TransDigm Group Incorporated | | | 7.75 | | | | 12/15/2018 | | | | 300,000 | | | | 330,000 | |
| | | | | | | | | | | | | | | | |
| | | | |
| Building Products: 0.09% | | | | | | | | | | | | | | | | |
Griffon Corporation | | | 7.13 | | | | 04/01/2018 | | | | 375,000 | | | | 390,000 | |
| | | | | | | | | | | | | | | | |
| | | | |
| Commercial Services & Supplies: 1.86% | | | | | | | | | | | | | | | | |
Corrections Corporation of America | | | 7.75 | | | | 06/01/2017 | | | | 1,445,000 | | | | 1,575,050 | |
Geo Group Incorporated | | | 7.75 | | | | 10/15/2017 | | | | 1,705,000 | | | | 1,837,138 | |
Iron Mountain Incorporated | | | 8.00 | | | | 06/15/2020 | | | | 1,400,000 | | | | 1,494,500 | |
Iron Mountain Incorporated | | | 8.38 | | | | 08/15/2021 | | | | 1,440,000 | | | | 1,600,200 | |
KAR Holdings Incorporated ± | | | 4.55 | | | | 05/01/2014 | | | | 1,375,000 | | | | 1,368,125 | |
| | | | |
| | | | | | | | | | | | | | | 7,875,013 | |
| | | | | | | | | | | | | | | | |
| | | | |
| Electrical Equipment: 0.07% | | | | | | | | | | | | | | | | |
Homer City Funding LLC | | | 8.73 | | | | 10/01/2026 | | | | 337,200 | | | | 303,480 | |
| | | | | | | | | | | | | | | | |
| | | | |
| Machinery: 0.37% | | | | | | | | | | | | | | | | |
Columbus McKinnon Corporation | | | 7.88 | | | | 02/01/2019 | | | | 525,000 | | | | 549,938 | |
Titan International Incorporated | | | 7.88 | | | | 10/01/2017 | | | | 400,000 | | | | 425,000 | |
UR Financing Escrow Corporation 144A | | | 5.75 | | | | 07/15/2018 | | | | 375,000 | | | | 385,313 | |
UR Financing Escrow Corporation 144A | | | 7.63 | | | | 04/15/2022 | | | | 200,000 | | | | 207,000 | |
| | | | |
| | | | | | | | | | | | | | | 1,567,251 | |
| | | | | | | | | | | | | | | | |
The accompanying notes are an integral part of these financial statements.
| | | | | | |
| Portfolio of Investments—February 29, 2012 (Unaudited) | | Wells Fargo Advantage High Yield Bond Fund | | | 13 | |
| | | | | | | | | | | | | | | | |
| Security Name | | Interest Rate | | | Maturity Date | | | Principal | | | Value | |
| | | | | | | | | | | | | | | | |
| | | | |
| Marine: 0.25% | | | | | | | | | | | | | | | | |
Hornbeck Offshore Services Company | | | 1.63 | % | | | 11/15/2026 | | | $ | 975,000 | | | $ | 1,068,405 | |
| | | | | | | | | | | | | | | | |
| | | | |
| Road & Rail: 0.41% | | | | | | | | | | | | | | | | |
RailAmerica Incorporated | | | 9.25 | | | | 07/01/2017 | | | | 1,531,000 | | | | 1,707,065 | |
| | | | | | | | | | | | | | | | |
| | | | |
Information Technology: 4.93% | | | | | | | | | | | | | | | | |
| | | | |
| Communications Equipment: 0.43% | | | | | | | | | | | | | | | | |
Allbritton Communications Company | | | 8.00 | | | | 05/15/2018 | | | | 1,275,000 | | | | 1,348,313 | |
Avaya Incorporated | | | 9.75 | | | | 11/01/2015 | | | | 450,000 | | | | 450,000 | |
| | | | |
| | | | | | | | | | | | | | | 1,798,313 | |
| | | | | | | | | | | | | | | | |
| | | | |
| Computers & Peripherals: 0.13% | | | | | | | | | | | | | | | | |
Seagate Technology HDD Holdings | | | 7.75 | | | | 12/15/2018 | | | | 500,000 | | | | 562,500 | |
| | | | | | | | | | | | | | | | |
| | | | |
| Internet Software & Services: 0.35% | | | | | | | | | | | | | | | | |
Equinix Incorporated | | | 7.00 | | | | 07/15/2021 | | | | 75,000 | | | | 82,875 | |
Equinix Incorporated | | | 8.13 | | | | 03/01/2018 | | | | 1,270,000 | | | | 1,417,638 | |
| | | | |
| | | | | | | | | | | | | | | 1,500,513 | |
| | | | | | | | | | | | | | | | |
| | | | |
| IT Services: 4.02% | | | | | | | | | | | | | | | | |
Audatex North American Incorporated 144A | | | 6.75 | | | | 06/15/2018 | | | | 175,000 | | | | 182,219 | |
Fidelity National Information Services | | | 7.63 | | | | 07/15/2017 | | | | 929,000 | | | | 1,013,771 | |
Fidelity National Information Services 144A | | | 7.63 | | | | 07/15/2017 | | | | 1,850,000 | | | | 2,009,563 | |
Fidelity National Information Services | | | 7.88 | | | | 07/15/2020 | | | | 774,000 | | | | 870,750 | |
First Data Corporation | | | 11.25 | | | | 03/31/2016 | | | | 3,175,000 | | | | 3,008,313 | |
SunGard Data Systems Incorporated | | | 4.88 | | | | 01/15/2014 | | | | 857,000 | | | | 882,710 | |
SunGard Data Systems Incorporated | | | 7.38 | | | | 11/15/2018 | | | | 550,000 | | | | 591,250 | |
SunGard Data Systems Incorporated | | | 7.63 | | | | 11/15/2020 | | | | 100,000 | | | | 108,000 | |
SunGard Data Systems Incorporated | | | 10.25 | | | | 08/15/2015 | | | | 5,850,000 | | | | 6,098,625 | |
TW Telecommunications Holdings Incorporated | | | 8.00 | | | | 03/01/2018 | | | | 2,075,000 | | | | 2,274,719 | |
| | | | |
| | | | | | | | | | | | | | | 17,039,920 | |
| | | | | | | | | | | | | | | | |
| | | | |
Materials: 1.98% | | | | | | | | | | | | | | | | |
| | | | |
| Chemicals: 0.33% | | | | | | | | | | | | | | | | |
Celanese US Holdings LLC | | | 6.63 | | | | 10/15/2018 | | | | 1,000,000 | | | | 1,095,000 | |
Solutia Incorporated | | | 8.75 | | | | 11/01/2017 | | | | 270,000 | | | | 305,775 | |
| | | | |
| | | | | | | | | | | | | | | 1,400,775 | |
| | | | | | | | | | | | | | | | |
| | | | |
| Containers & Packaging: 1.65% | | | | | | | | | | | | | | | | |
Ball Corporation | | | 5.00 | | | | 03/15/2022 | | | | 100,000 | | | | 102,250 | |
Ball Corporation | | | 5.75 | | | | 05/15/2021 | | | | 275,000 | | | | 295,625 | |
Crown Americas LLC | | | 7.63 | | | | 05/15/2017 | | | | 500,000 | | | | 546,250 | |
Crown Holdings Incorporated (i) | | | 7.50 | | | | 12/15/2096 | | | | 525,000 | | | | 452,813 | |
Graham Packaging Company Incorporated | | | 9.88 | | | | 10/15/2014 | | | | 3,570,000 | | | | 3,641,400 | |
Owens Brockway Glass Container Incorporated | | | 7.38 | | | | 05/15/2016 | | | | 1,702,000 | | | | 1,927,515 | |
| | | | |
| | | | | | | | | | | | | | | 6,965,853 | |
| | | | | | | | | | | | | | | | |
| | | | |
| Metals & Mining: 0.00% | | | | | | | | | | | | | | | | |
Indalex Holdings Corporation (s) | | | 11.50 | | | | 02/01/2014 | | | | 3,285,000 | | | | 12,319 | |
| | | | | | | | | | | | | | | | |
The accompanying notes are an integral part of these financial statements.
| | | | |
| 14 | | Wells Fargo Advantage High Yield Bond Fund | | Portfolio of Investments—February 29, 2012 (Unaudited) |
| | | | | | | | | | | | | | | | |
| Security Name | | Interest Rate | | | Maturity Date | | | Principal | | | Value | |
| | | | | | | | | | | | | | | | |
| | | | |
Telecommunication Services: 6.15% | | | | | | | | | | | | | | | | |
| | | | |
| Diversified Telecommunication Services: 1.37% | | | | | | | | | | | | | | | | |
GCI Incorporated | | | 6.75 | % | | | 06/01/2021 | | | $ | 625,000 | | | $ | 632,813 | |
GCI Incorporated | | | 8.63 | | | | 11/15/2019 | | | | 2,560,000 | | | | 2,790,400 | |
Intelsat Jackson Holdings Company | | | 7.25 | | | | 10/15/2020 | | | | 925,000 | | | | 973,563 | |
Qwest Corporation | | | 7.63 | | | | 08/03/2021 | | | | 270,000 | | | | 281,824 | |
SBA Telecommunications Incorporated | | | 8.00 | | | | 08/15/2016 | | | | 815,000 | | | | 878,163 | |
SBA Telecommunications Incorporated | | | 8.25 | | | | 08/15/2019 | | | | 225,000 | | | | 247,500 | |
| | | | |
| | | | | | | | | | | | | | | 5,804,263 | |
| | | | | | | | | | | | | | | | |
| | | | |
| Wireless Telecommunication Services: 4.78% | | | | | | | | | | | | | | | | |
CC Holdings V LLC 144A | | | 7.75 | | | | 05/01/2017 | | | | 2,350,000 | | | | 2,561,500 | |
Cricket Communications Incorporated | | | 7.75 | | | | 10/15/2020 | | | | 155,000 | | | | 154,225 | |
Cricket Communications Incorporated Series I | | | 7.75 | | | | 05/15/2016 | | | | 4,755,000 | | | | 5,064,075 | |
Crown Castle International Corporation | | | 7.13 | | | | 11/01/2019 | | | | 1,500,000 | | | | 1,642,500 | |
Crown Castle International Corporation | | | 9.00 | | | | 01/15/2015 | | | | 900,000 | | | | 992,250 | |
iPCS Incorporated ¥ | | | 3.80 | | | | 05/01/2014 | | | | 1,764,503 | | | | 1,649,810 | |
MetroPCS Communications Incorporated | | | 6.63 | | | | 11/15/2020 | | | | 1,975,000 | | | | 2,034,250 | |
MetroPCS Communications Incorporated | | | 7.88 | | | | 09/01/2018 | | | | 1,075,000 | | | | 1,152,938 | |
Sprint Nextel Corporation 144A | | | 11.50 | | | | 11/15/2021 | | | | 525,000 | | | | 572,250 | |
Syniverse Holdings Incorporated | | | 9.13 | | | | 01/15/2019 | | | | 4,075,000 | | | | 4,441,750 | |
| | | | |
| | | | | | | | | | | | | | | 20,265,548 | |
| | | | | | | | | | | | | | | | |
| | | | |
Utilities: 3.54% | | | | | | | | | | | | | | | | |
| | | | |
| Electric Utilities: 1.86% | | | | | | | | | | | | | | | | |
Dolphin Subsidiary II Incorporated 144A | | | 7.25 | | | | 10/15/2021 | | | | 4,375,000 | | | | 4,987,500 | |
Ipalco Enterprises Incorporated | | | 5.00 | | | | 05/01/2018 | | | | 900,000 | | | | 910,125 | |
Ipalco Enterprises Incorporated 144A | | | 7.25 | | | | 04/01/2016 | | | | 20,000 | | | | 22,200 | |
Otter Tail Corporation | | | 9.00 | | | | 12/15/2016 | | | | 1,815,000 | | | | 1,942,050 | |
| | | | |
| | | | | | | | | | | | | | | 7,861,875 | |
| | | | | | | | | | | | | | | | |
| | | | |
| Gas Utilities: 0.48% | | | | | | | | | | | | | | | | |
AmeriGas Finance LLC | | | 6.75 | | | | 05/20/2020 | | | | 100,000 | | | | 103,000 | |
AmeriGas Finance LLC | | | 7.00 | | | | 05/20/2022 | | | | 100,000 | | | | 102,625 | |
AmeriGas Partners LP | | | 6.25 | | | | 08/20/2019 | | | | 1,350,000 | | | | 1,363,500 | |
AmeriGas Partners LP | | | 6.50 | | | | 05/20/2021 | | | | 450,000 | | | | 454,500 | |
| | | | |
| | | | | | | | | | | | | | | 2,023,625 | |
| | | | | | | | | | | | | | | | |
| | | | |
| Independent Power Producers & Energy Traders: 1.20% | | | | | | | | | | | | | | | | |
NRG Energy Incorporated « | | | 7.38 | | | | 01/15/2017 | | | | 4,500,000 | | | | 4,668,750 | |
RRI Energy Incorporated | | | 9.68 | | | | 07/02/2026 | | | | 460,000 | | | | 428,950 | |
| | | | |
| | | | | | | | | | | | | | | 5,097,700 | |
| | | | | | | | | | | | | | | | |
| | | | |
Total Corporate Bonds and Notes (Cost $316,790,923) | | | | | | | | | | | | | | | 329,679,523 | |
| | | | | | | | | | | | | | | | |
| | | | |
Non-Agency Mortgage Backed Securities: 2.00% | | | | | | | | | | | | | | | | |
American Home Mortgage Assets Series 2006 Class 1A1 ± | | | 1.14 | | | | 09/25/2046 | | | | 4,219,485 | | | | 2,095,181 | |
American Home Mortgage Assets Series 2006 Class 1A1 | | | 5.47 | | | | 01/15/2045 | | | | 1,280,000 | | | | 1,357,321 | |
Banc of America Commercial Mortgage Incorporated Series 2006 Class AM ± | | | 5.86 | | | | 07/10/2044 | | | | 1,515,000 | | | | 1,480,955 | |
The accompanying notes are an integral part of these financial statements.
| | | | | | |
| Portfolio of Investments—February 29, 2012 (Unaudited) | | Wells Fargo Advantage High Yield Bond Fund | | | 15 | |
| | | | | | | | | | | | | | | | |
| Security Name | | Interest Rate | | | Maturity Date | | | Principal | | | Value | |
| | | | | | | | | | | | | | | | |
| | | | |
| Non-Agency Mortgage Backed Securities (continued) | | | | | | | | | | | | | | | | |
Greenwich Capital Commercial Funding Corporation Series 2006-GG7 Class AM ± | | | 5.88 | % | | | 07/10/2038 | | | $ | 2,040,000 | | | $ | 2,136,139 | |
Lehman XS Trust Series 2006-18N Class A5A ±(i) | | | 0.45 | | | | 12/25/2036 | | | | 3,731,897 | | | | 1,382,750 | |
| | | | |
Total Non-Agency Mortgage Backed Securities (Cost $9,226,483) | | | | | | | | | | | | | | | 8,452,346 | |
| | | | | | | | | | | | | | | | |
| | | | |
| | | Dividend Yield | | | | | | Shares | | | | |
| Preferred Stocks: 0.14% | | | | | | | | | | | | | | | | |
| | | | |
Financials: 0.14% | | | | | | | | | | | | | | | | |
| | | | |
| Consumer Finance: 0.14% | | | | | | | | | | | | | | | | |
GMAC Capital Trust ± | | | 8.13 | | | | | | | | 26,000 | | | | 610,480 | |
| | | | | | | | | | | | | | | | |
| | | | |
Total Preferred Stocks (Cost $650,000) | | | | | | | | | | | | | | | 610,480 | |
| | | | | | | | | | | | | | | | |
| | | | |
| | | Interest Rate | | | | | | Principal | | | | |
| Term Loans: 13.06% | | | | | | | | | | | | | | | | |
Advantage Sales & Marketing Incorporated | | | 7.75 | | | | 06/18/2018 | | | $ | 475,000 | | | | 469,362 | |
Allison Transmission Incorporated | | | 2.50 | | | | 08/07/2014 | | | | 1,903,884 | | | | 1,882,465 | |
ASH Multifamily Laundry Systems LLC | | | 5.00 | | | | 08/28/2014 | | | | 493,243 | | | | 488,621 | |
Capital Automotive LP | | | 3.50 | | | | 03/10/2017 | | | | 3,169,315 | | | | 3,134,453 | |
CCM Merger Incorporated | | | 5.00 | | | | 03/01/2017 | | | | 3,297,968 | | | | 3,293,845 | |
Coinmach Corporation | | | 3.00 | | | | 11/20/2014 | | | | 3,177,452 | | | | 2,926,433 | |
Community Health Systems Incorporated | | | 2.25 | | | | 07/25/2014 | | | | 2,634,465 | | | | 2,599,426 | |
Community Health Systems Incorporated | | | 2.25 | | | | 07/25/2014 | | | | 135,334 | | | | 133,534 | |
Dunkin Brands Incorporated | | | 3.00 | | | | 11/23/2017 | | | | 500,000 | | | | 498,510 | |
Fairpoint Communications Incorporated | | | 4.50 | | | | 01/22/2016 | | | | 3,550,736 | | | | 2,996,218 | |
Federal Mogul Corporation | | | 1.94 | | | | 12/29/2014 | | | | 2,836,092 | | | | 2,712,722 | |
Federal Mogul Corporation | | | 1.94 | | | | 12/28/2015 | | | | 1,446,985 | | | | 1,384,042 | |
First Data Corporation | | | 2.75 | | | | 09/24/2014 | | | | 1,392,761 | | | | 1,331,480 | |
First Data Corporation | | | 2.75 | | | | 09/24/2014 | | | | 1,742,926 | | | | 1,666,238 | |
First Data Corporation | | | 2.75 | | | | 09/24/2014 | | | | 2,600,651 | | | | 2,486,222 | |
Focus Brands Incorporated < | | | 9.00 | | | | 08/22/2018 | | | | 450,000 | | | | 445,500 | |
Goodyear Tire & Rubber Company | | | 1.50 | | | | 04/30/2014 | | | | 1,875,000 | | | | 1,844,531 | |
Gray Television Incorporated | | | 3.50 | | | | 12/31/2014 | | | | 1,895,330 | | | | 1,872,529 | |
HCA Incorporated | | | 2.50 | | | | 05/01/2016 | | | | 2,887,500 | | | | 2,795,216 | |
HHI Holdings Limited | | | 5.50 | | | | 03/21/2017 | | | | 397,000 | | | | 396,008 | |
HMSC Corporation | | | 5.50 | | | | 10/03/2014 | | | | 677,829 | | | | 399,919 | |
Level 3 Financing Incorporated | | | 2.25 | | | | 03/13/2014 | | | | 1,000,000 | | | | 983,500 | |
Local TV Finance LLC | | | 4.00 | | | | 05/07/2015 | | | | 2,796,494 | | | | 2,782,512 | |
LPL Holdings Incorporated | | | 1.75 | | | | 06/28/2013 | | | | 1,767,021 | | | | 1,753,397 | |
Merisant Company (i) | | | 4.50 | | | | 01/08/2014 | | | | 893,738 | | | | 880,332 | |
Mission Broadcasting Incorporated | | | 4.00 | | | | 09/30/2016 | �� | | | 77,736 | | | | 77,153 | |
Newsday LLC | | | 10.50 | | | | 08/01/2013 | | | | 2,825,000 | | | | 2,906,219 | |
Nexstar Broadcasting Incorporated | | | 4.00 | | | | 09/30/2016 | | | | 121,591 | | | | 120,679 | |
Springleaf Finance Corporation | | | 4.25 | | | | 05/05/2017 | | | | 700,000 | | | | 638,127 | |
SunGard Data Systems Incorporated | | | 1.75 | | | | 02/28/2014 | | | | 446,911 | | | | 445,870 | |
The Geo Group Incorporated | | | 2.75 | | | | 06/22/2017 | | | | 320,125 | | | | 318,524 | |
TXU Energy Company LLC | | | 3.50 | | | | 10/10/2014 | | | | 13,917,978 | | | | 8,471,177 | |
TXU Energy Company LLC | | | 4.50 | | | | 10/10/2017 | | | | 275,000 | | | | 153,398 | |
| | | | |
Total Term Loans (Cost $58,745,441) | | | | | | | | | | | | | | | 55,288,162 | |
| | | | | | | | | | | | | | | | |
The accompanying notes are an integral part of these financial statements.
| | | | |
| 16 | | Wells Fargo Advantage High Yield Bond Fund | | Portfolio of Investments—February 29, 2012 (Unaudited) |
| | | | | | | | | | | | | | | | |
| Security Name | | Interest Rate | | | Maturity Date | | | Principal | | | Value | |
| | | | | | | | | | | | | | | | |
| | | | |
Yankee Corporate Bonds and Notes: 3.84% | | | | | | | | | | | | | | | | |
| | | | |
Consumer Discretionary: 0.64% | | | | | | | | | | | | | | | | |
| | | | |
| Media: 0.64% | | | | | | | | | | | | | | | | |
Videotron Limited 144A | | | 5.00 | % | | | 07/15/2022 | | | $ | 225,000 | | | $ | 225,000 | |
Videotron Limited | | | 6.38 | | | | 12/15/2015 | | | | 380,000 | | | | 388,550 | |
Videotron Limited | | | 6.88 | | | | 01/15/2014 | | | | 331,000 | | | | 332,241 | |
Videotron Limited | | | 9.13 | | | | 04/15/2018 | | | | 1,585,000 | | | | 1,755,388 | |
| | | | |
| | | | | | | | | | | | | | | 2,701,179 | |
| | | | | | | | | | | | | | | | |
| | | | |
Energy: 0.06% | | | | | | | | | | | | | | | | |
| | | | |
| Oil, Gas & Consumable Fuels: 0.06% | | | | | | | | | | | | | | | | |
Griffin Coal Mining Company Limited (s) | | | 9.50 | | | | 12/01/2016 | | | | 342,722 | | | | 272,036 | |
| | | | | | | | | | | | | | | | |
| | | | |
Financials: 0.00% | | | | | | | | | | | | | | | | |
| | | | |
| Diversified Financial Services: 0.00% | | | | | | | | | | | | | | | | |
Preferred Term Securities XII Limited (s)(i) | | | 1.17 | | | | 12/24/2033 | | | | 720,000 | | | | 216 | |
| | | | | | | | | | | | | | | | |
| | | | |
Information Technology: 0.36% | | | | | | | | | | | | | | | | |
| | | | |
| Computers & Peripherals: 0.36% | | | | | | | | | | | | | | | | |
Seagate HDD Cayman | | | 6.88 | | | | 05/01/2020 | | | | 400,000 | | | | 438,000 | |
Seagate Technology Holdings | | | 6.80 | | | | 10/01/2016 | | | | 650,000 | | | | 723,125 | |
Seagate Technology Holdings 144A | | | 7.00 | | | | 11/01/2021 | | | | 350,000 | | | | 387,625 | |
| | | | |
| | | | | | | | | | | | | | | 1,548,750 | |
| | | | | | | | | | | | | | | | |
| | | | |
Materials: 0.83% | | | | | | | | | | | | | | | | |
| | | | |
| Metals & Mining: 0.83% | | | | | | | | | | | | | | | | |
Novelis Incorporated | | | 7.25 | | | | 02/15/2015 | | | | 990,000 | | | | 983,634 | |
Novelis Incorporated | | | 8.38 | | | | 12/15/2017 | | | | 550,000 | | | | 602,250 | |
Novelis Incorporated | | | 8.75 | | | | 12/15/2020 | | | | 1,725,000 | | | | 1,923,375 | |
| | | | |
| | | | | | | | | | | | | | | 3,509,259 | |
| | | | | | | | | | | | | | | | |
| | | | |
Telecommunication Services: 1.95% | | | | | | | | | | | | | | | | |
| | | | |
| Wireless Telecommunication Services: 1.95% | | | | | | | | | | | | | | | | |
Intelsat Jackson Holdings | | | 7.25 | | | | 04/01/2019 | | | | 400,000 | | | | 420,000 | |
Intelsat Jackson Holdings | | | 7.50 | | | | 04/01/2021 | | | | 550,000 | | | | 581,625 | |
Intelsat Limited | | | 8.50 | | | | 11/01/2019 | | | | 1,100,000 | | | | 1,207,250 | |
Intelsat Limited | | | 9.50 | | | | 06/15/2016 | | | | 2,214,000 | | | | 2,330,235 | |
Intelsat Limited | | | 11.25 | | | | 06/15/2016 | | | | 2,375,000 | | | | 2,511,563 | |
Telesat Canada Incorporated | | | 11.00 | | | | 11/01/2015 | | | | 1,125,000 | | | | 1,199,510 | |
| | | | |
| | | | | | | | | | | | | | | 8,250,183 | |
| | | | | | | | | | | | | | | | |
| | | | |
Total Yankee Corporate Bonds and Notes (Cost $15,648,424) | | | | | | | | | | | | | | | 16,281,623 | |
| | | | | | | | | | | | | | | | |
The accompanying notes are an integral part of these financial statements.
| | | | | | |
| Portfolio of Investments—February 29, 2012 (Unaudited) | | Wells Fargo Advantage High Yield Bond Fund | | | 17 | |
| | | | | | | | | | | | | | |
| Security Name | | Yield | | | | | Shares | | | Value | |
| | | | | | | | | | | | | | |
| | | | |
Short-Term Investments: 3.40% | | | | | | | | | | | | | | |
| | | | |
| Investment Companies: 3.40% | | | | | | | | | | | | | | |
Wells Fargo Advantage Cash Investment Money Market Fund, Institutional Class (l)(u)## | | | 0.02 | % | | | | | 8,522,722 | | | $ | 8,522,722 | |
Wells Fargo Securities Lending Cash Investments, LLC (l)(u)(v)(r) | | | 0.15 | | | | | | 5,880,475 | | | | 5,880,475 | |
| | | | |
Total Short-Term Investments (Cost $14,403,197) | | | | | | | | | | | | | 14,403,197 | |
| | | | | | | | | | | | | | |
| | | | | | | | |
| Total Investments in Securities | | | | | | | | |
| (Cost $417,038,399)* | | | 100.35 | % | | | 424,989,197 | |
Other Assets and Liabilities, Net | | | (0.35 | ) | | | (1,502,817 | ) |
| | | | | | | | |
| Total Net Assets | | | 100.00 | % | | $ | 423,486,380 | |
| | | | | | | | |
| † | Non-income earning security. |
| 144A | Security that may be resold to “qualified institutional buyers” under Rule 144A or security offered pursuant to Section 4(2) of the Securities Act of 1933, as amended. |
| ¥ | A payment-in-kind (PIK) security is a security in which the issuer may make interest or dividend payments in cash or additional securities. These additional securities generally have the same terms as the original holdings. |
| « | All or a portion of this security is on loan. |
| ± | Variable rate investment. |
| (s) | Security is currently in default with regards to scheduled interest and/or principal payments. The Fund has stopped accruing interest on this security. |
| < | All or a portion of the position represents an unfunded loan commitment. |
| (l) | Investment in an affiliate. |
| (u) | Rate shown is the 7-day annualized yield at period end. |
| ## | All or a portion of this security has been segregated for when-issued, delayed delivery securities or unfunded loans. |
| (v) | Security represents investment of cash collateral received from securities on loan. |
| (r) | The investment company is exempt from registration under Section 3(c)(7) of the 1940 Act. |
| * | Cost for federal income tax purposes is $418,133,214 and net unrealized appreciation (depreciation) consists of: |
| | | | |
Gross unrealized appreciation | | $ | 17,979,853 | |
Gross unrealized depreciation | | | (11,123,870 | ) |
| | | | |
Net unrealized appreciation | | $ | 6,855,983 | |
The accompanying notes are an integral part of these financial statements.
| | | | |
| 18 | | Wells Fargo Advantage High Yield Bond Fund | | Statement of Assets and Liabilities—February 29, 2012 (Unaudited) |
| | | | |
| | | | |
| |
Assets | | | | |
Investments | | | | |
In unaffiliated securities (including securities on loan), at value (see cost below) | | $ | 410,586,000 | |
In affiliated securities, at value (see cost below) | | | 14,403,197 | |
| | | | |
Total investments, at value (see cost below) | | | 424,989,197 | |
Foreign currency, at value (see cost below) | | | 45 | |
Receivable for investments sold | | | 762,308 | |
Receivable for Fund shares sold | | | 431,800 | |
Receivable for interest | | | 7,161,240 | |
Receivable for securities lending income | | | 1,147 | |
Prepaid expenses and other assets | | | 159,551 | |
| | | | |
Total assets | | | 433,505,288 | |
| | | | |
| |
Liabilities | | | | |
Dividends payable | | | 705,718 | |
Payable for investments purchased | | | 2,269,913 | |
Payable for Fund shares redeemed | | | 629,722 | |
Payable upon receipt of securities loaned | | | 5,880,475 | |
Advisory fee payable | | | 176,478 | |
Distribution fees payable | | | 73,486 | |
Due to other related parties | | | 71,921 | |
Accrued expenses and other liabilities | | | 211,195 | |
| | | | |
Total liabilities | | | 10,018,908 | |
| | | | |
Total net assets | | $ | 423,486,380 | |
| | | | |
| |
NET ASSETS CONSIST OF | | | | |
Paid-in capital | | $ | 495,632,896 | |
Undistributed net investment income | | | 43,023 | |
Accumulated net realized losses on investments | | | (80,140,338 | ) |
Net unrealized gains on investments | | | 7,950,799 | |
| | | | |
Total net assets | | $ | 423,486,380 | |
| | | | |
| |
COMPUTATION OF NET ASSET VALUE AND OFFERING PRICE PER SHARE1 | | | | |
Net assets – Class A | | $ | 274,168,669 | |
Shares outstanding – Class A | | | 87,633,098 | |
Net asset value per share – Class A | | | $3.13 | |
Maximum offering price per share – Class A2 | | | $3.28 | |
Net assets – Class B | | $ | 15,674,967 | |
Shares outstanding – Class B | | | 5,009,066 | |
Net asset value per share – Class B | | | $3.13 | |
Net assets – Class C | | $ | 98,111,711 | |
Shares outstanding – Class C | | | 31,353,000 | |
Net asset value per share – Class C | | | $3.13 | |
Net assets – Administrator Class | | $ | 35,531,033 | |
Shares outstanding – Administrator Class | | | 11,352,184 | |
Net asset value per share – Administrator Class | | | $3.13 | |
| |
Investments in unaffiliated securities, at cost | | $ | 402,635,202 | |
| | | | |
Investments in affiliated securities, at cost | | $ | 14,403,197 | |
| | | | |
Total investments, at cost | | $ | 417,038,399 | |
| | | | |
Securities on loan, at value | | $ | 5,763,137 | |
| | | | |
Foreign currency, at cost | | $ | 44 | |
| | | | |
| 1. | The Fund has an unlimited number of authorized shares. |
| 2. | Maximum offering price is computed as 100/95.50 of net asset value. On investments of $50,000 or more, the offering price is reduced. |
The accompanying notes are an integral part of these financial statements.
| | | | | | |
| Statement of Operations—Six Months Ended February 29, 2012 (Unaudited) | | Wells Fargo Advantage High Yield Bond Fund | | | 19 | |
| | | | |
| | | | |
| |
Investment income | | | | |
Interest | | | 15,394,856 | |
Dividends | | | 26,753 | |
Income from affiliated securities | | | 5,504 | |
Securities lending income, net | | | 2,504 | |
| | | | |
Total investment income | | | 15,429,617 | |
| | | | |
| |
Expenses | | | | |
Advisory fee | | | 994,935 | |
Administration fees | | | | |
Fund level | | | 99,493 | |
Class A | | | 203,824 | |
Class B | | | 14,022 | |
Class C | | | 75,690 | |
Administrator Class | | | 15,527 | |
Shareholder servicing fees | | | | |
Class A | | | 318,474 | |
Class B | | | 21,683 | |
Class C | | | 118,267 | |
Administrator Class | | | 36,633 | |
Distribution fees | | | | |
Class B | | | 65,726 | |
Class C | | | 354,797 | |
Custody and accounting fees | | | 15,940 | |
Professional fees | | | 23,076 | |
Registration fees | | | 34,959 | |
Shareholder report expenses | | | 30,283 | |
Trustees’ fees and expenses | | | 5,045 | |
Other fees and expenses | | | 995 | |
| | | | |
Total expenses | | | 2,429,369 | |
Less: Fee waivers and/or expense reimbursements | | | (22,061 | ) |
| | | | |
Net expenses | | | 2,407,308 | |
| | | | |
Net investment income | | | 13,022,309 | |
| | | | |
| |
REALIZED AND UNREALIZED GAINS (LOSSES) ON INVESTMENTS | | | | |
Net realized gains on investments | | | 661,157 | |
Net change in unrealized gains (losses) on investments | | | 13,111,343 | |
| | | | |
Net realized and unrealized gains (losses) on investments | | | 13,772,500 | |
| | | | |
Net increase in net assets resulting from operations | | $ | 26,794,809 | |
| | | | |
The accompanying notes are an integral part of these financial statements.
| | | | |
| 20 | | Wells Fargo Advantage High Yield Bond Fund | | Statements of Changes in Net Assets |
| | | | | | | | | | | | | | | | |
| | | Six Months Ended
February 29, 2012
(Unaudited) | | | Year Ended
August 31, 2011 | |
| | | | |
Operations | | | | | | | | | | | | | | | | |
Net investment income | | | | | | $ | 13,022,309 | | | | | | | $ | 29,834,488 | |
Net realized gains on investments | | | | | | | 661,157 | | | | | | | | 18,328,825 | |
Net change in unrealized gains (losses) on investments | | | | | | | 13,111,343 | | | | | | | | (19,115,729 | ) |
| | | | | | | | | | | | | | | | |
Net increase in net assets resulting from operations | | | | | | | 26,794,809 | | | | | | | | 29,047,584 | |
| | | | | | | | | | | | | | | | |
| | | | |
Distributions to shareholders from | | | | | | | | | | | | | | | | |
Net investment income | | | | | | | | | | | | | | | | |
Class A | | | | | | | (8,572,534 | ) | | | | | | | (18,554,559 | ) |
Class B | | | | | | | (523,662 | ) | | | | | | | (2,252,736 | ) |
Class C | | | | | | | (2,828,427 | ) | | | | | | | (6,131,831 | ) |
Administrator Class | | | | | | | (1,078,575 | ) | | | | | | | (2,801,013 | ) |
| | | | | | | | | | | | | | | | |
Total distributions to shareholders | | | | | | | (13,003,198 | ) | | | | | | | (29,740,139 | ) |
| | | | | | | | | | | | | | | | |
| | | | |
Capital share transactions | | | Shares | | | | | | | | Shares | | | | | |
Proceeds from shares sold | | | | | | | | | | | | | | | | |
Class A | | | 20,748,353 | | | | 62,734,106 | | | | 25,463,806 | | | | 80,049,390 | |
Class B | | | 116,465 | | | | 353,905 | | | | 373,740 | | | | 1,173,000 | |
Class C | | | 1,665,130 | | | | 5,071,381 | | | | 3,288,763 | | | | 10,292,728 | |
Administrator Class | | | 5,157,823 | | | | 15,622,808 | | | | 11,790,846 | | | | 37,115,185 | |
| | | | | | | | | | | | | | | | |
| | | | | | | 83,782,200 | | | | | | | | 128,630,303 | |
| | | | | | | | | | | | | | | | |
Reinvestment of distributions | | | | | | | | | | | | | | | | |
Class A | | | 1,947,403 | | | | 5,930,928 | | | | 3,862,061 | | | | 12,114,402 | |
Class B | | | 103,515 | | | | 314,618 | | | | 422,754 | | | | 1,325,963 | |
Class C | | | 549,623 | | | | 1,672,760 | | | | 1,076,487 | | | | 3,376,287 | |
Administrator Class | | | 311,814 | | | | 950,723 | | | | 690,610 | | | | 2,169,149 | |
| | | | | | | | | | | | | | | | |
| | | | | | | 8,869,029 | | | | | | | | 18,985,801 | |
| | | | | | | | | | | | | | | | |
Payment for shares redeemed | | | | | | | | | | | | | | | | |
Class A | | | (14,580,391 | ) | | | (44,146,394 | ) | | | (41,982,769 | ) | | | (131,414,318 | ) |
Class B | | | (2,364,351 | ) | | | (7,136,811 | ) | | | (10,261,000 | ) | | | (32,338,491 | ) |
Class C | | | (2,579,798 | ) | | | (7,811,551 | ) | | | (7,067,045 | ) | | | (22,162,100 | ) |
Administrator Class | | | (2,782,522 | ) | | | (8,402,682 | ) | | | (19,790,065 | ) | | | (61,845,746 | ) |
| | | | | | | | | | | | | | | | |
| | | | | | | (67,497,438 | ) | | | | | | | (247,760,655 | ) |
| | | | | | | | | | | | | | | | |
Net increase (decrease) in net assets resulting
from capital share transactions | | | | | | | 25,153,791 | | | | | | | | (100,144,551 | ) |
| | | | | | | | | | | | | | | | |
Total increase (decrease) in net assets | | | | | | | 38,945,402 | | | | | | | | (100,837,106 | ) |
| | | | | | | | | | | | | | | | |
| | | | |
Net assets | | | | | | | | | | | | | | | | |
Beginning of period | | | | | | | 384,540,978 | | | | | | | | 485,378,084 | |
| | | | | | | | | | | | | | | | |
End of period | | | | | | $ | 423,486,380 | | | | | | | $ | 384,540,978 | |
| | | | | | | | | | | | | | | | |
Undistributed net investment income | | | | | | $ | 43,023 | | | | | | | $ | 23,912 | |
| | | | | | | | | | | | | | | | |
The accompanying notes are an integral part of these financial statements.
| | | | | | |
| Financial Highlights | | Wells Fargo Advantage High Yield Bond Fund | | | 21 | |
(For a share outstanding throughout each period)
| | | | | | | | | | | | | | | | | | | | | | | | | | | | |
| | | Six Months Ended
February 29, 2012 (Unaudited) | | | Year Ended August 31, | | | Year Ended April 30, | |
| Class A | | | 2011 | | | 20101,2 | | | 20101 | | | 20091 | | | 20081 | | | 20071 | |
Net asset value, beginning of period | | $ | 3.03 | | | $ | 3.05 | | | $ | 3.10 | | | $ | 2.39 | | | $ | 3.13 | | | $ | 3.40 | | | $ | 3.31 | |
Net investment income | | | 0.10 | | | | 0.21 | | | | 0.08 | | | | 0.25 | | | | 0.27 | | | | 0.25 | | | | 0.24 | 3 |
Net realized and unrealized gains (losses)
on investments | | | 0.10 | | | | (0.02 | ) | | | (0.05 | ) | | | 0.72 | | | | (0.76 | ) | | | (0.28 | ) | | | 0.09 | |
| | | | | | | | | | | | | | | | | | | | | | | | | | | | |
Total from investment operations | | | 0.20 | | | | 0.19 | | | | 0.03 | | | | 0.97 | | | | (0.49 | ) | | | (0.03 | ) | | | 0.33 | |
Distributions to shareholders from | | | | | | | | | | | | | | | | | | | | | | | | | | | | |
Net investment income | | | (0.10 | ) | | | (0.21 | ) | | | (0.08 | ) | | | (0.26 | ) | | | (0.25 | ) | | | (0.24 | ) | | | (0.24 | ) |
Net asset value, end of period | | $ | 3.13 | | | $ | 3.03 | | | $ | 3.05 | | | $ | 3.10 | | | $ | 2.39 | | | $ | 3.13 | | | $ | 3.40 | |
Total return4 | | | 6.79 | % | | | 6.07 | % | | | 0.99 | % | | | 42.27 | % | | | (15.50 | )% | | | (0.92 | )% | | | 10.35 | % |
Ratios to average net assets (annualized) | | | | | | | | | | | | | | | | | | | | | | | | | | | | |
Gross expenses | | | 1.02 | % | | | 1.02 | % | | | 1.06 | % | | | 1.14 | % | | | 1.22 | % | | | 1.12 | % | | | 1.10 | % |
Net expenses | | | 1.02 | % | | | 1.02 | % | | | 1.05 | % | | | 1.13 | % | | | 1.08 | % | | | 1.07 | % | | | 1.06 | % |
Net investment income | | | 6.74 | % | | | 6.60 | % | | | 7.70 | % | | | 8.96 | % | | | 10.60 | % | | | 7.82 | % | | | 7.19 | % |
Supplemental data | | | | | | | | | | | | | | | | | | | | | | | | | | | | |
Portfolio turnover rate | | | 13 | % | | | 70 | % | | | 46 | % | | | 129 | % | | | 119 | % | | | 110 | % | | | 48 | % |
Net assets, end of period (000’s omitted) | | | $274,169 | | | | $240,653 | | | | $281,044 | | | | $292,039 | | | | $217,199 | | | | $270,758 | | | | $335,411 | |
| 1. | After the close of business on July 9, 2010, the Fund acquired the net assets of Evergreen High Income Fund which became the accounting and performance survivor in the transaction. The information for the periods prior to July 12, 2010 is that of Class A of Evergreen High Income Fund. |
| 2. | For the four months ended August 31, 2010. The Fund changed its fiscal year end from April 30 to August 31, effective August 31, 2010. |
| 3. | Calculated based upon average shares outstanding. |
| 4. | Total return calculations do not include any sales charges. Returns for periods of less than one year are not annualized. |
The accompanying notes are an integral part of these financial statements.
| | | | |
| 22 | | Wells Fargo Advantage High Yield Bond Fund | | Financial Highlights |
(For a share outstanding throughout each period)
| | | | | | | | | | | | | | | | | | | | | | | | | | | | |
| | | Six Months Ended
February 29, 2012 (Unaudited) | | | Year Ended August 31, | | | Year ended April 30, | |
| Class B | | | 2011 | | | 20101,2 | | | 20101 | | | 20091 | | | 20081 | | | 20071 | |
Net asset value, beginning of period | | $ | 3.03 | | | $ | 3.05 | | | $ | 3.10 | | | $ | 2.39 | | | $ | 3.13 | | | $ | 3.40 | | | $ | 3.31 | |
Net investment income | | | 0.09 | 3 | | | 0.18 | 3 | | | 0.07 | | | | 0.22 | | | | 0.25 | 3 | | | 0.22 | | | | 0.21 | 3 |
Net realized and unrealized gains (losses)
on investments | | | 0.10 | | | | (0.02 | ) | | | (0.05 | ) | | | 0.73 | | | | (0.76 | ) | | | (0.28 | ) | | | 0.09 | |
| | | | | | | | | | | | | | | | | | | | | | | | | | | | |
Total from investment operations | | | 0.19 | | | | 0.16 | | | | 0.02 | | | | 0.95 | | | | (0.51 | ) | | | (0.06 | ) | | | 0.30 | |
Distributions to shareholders from | | | | | | | | | | | | | | | | | | | | | | | | | | | | |
Net investment income | | | (0.09 | ) | | | (0.18 | ) | | | (0.07 | ) | | | (0.24 | ) | | | (0.23 | ) | | | (0.21 | ) | | | (0.21 | ) |
Net asset value, end of period | | $ | 3.13 | | | $ | 3.03 | | | $ | 3.05 | | | $ | 3.10 | | | $ | 2.39 | | | $ | 3.13 | | | $ | 3.40 | |
Total return4 | | | 6.40 | % | | | 5.28 | % | | | 0.74 | % | | | 41.23 | % | | | (16.13 | )% | | | (1.65 | )% | | | 9.55 | % |
Ratios to average net assets (annualized) | | | | | | | | | | | | | | | | | | | | | | | | | | | | |
Gross expenses | | | 1.76 | % | | | 1.78 | % | | | 1.81 | % | | | 1.89 | % | | | 1.97 | % | | | 1.82 | % | | | 1.80 | % |
Net expenses | | | 1.76 | % | | | 1.77 | % | | | 1.81 | % | | | 1.88 | % | | | 1.83 | % | | | 1.82 | % | | | 1.80 | % |
Net investment income | | | 5.98 | % | | | 5.85 | % | | | 6.98 | % | | | 8.29 | % | | | 9.70 | % | | | 7.06 | % | | | 6.46 | % |
Supplemental data | | | | | | | | | | | | | | | | | | | | | | | | | | | | |
Portfolio turnover rate | | | 13 | % | | | 70 | % | | | 46 | % | | | 129 | % | | | 119 | % | | | 110 | % | | | 48 | % |
Net assets, end of period (000’s omitted) | | | $15,675 | | | | $21,656 | | | | $50,671 | | | | $54,017 | | | | $58,429 | | | | $108,327 | | | | $150,609 | |
| 1. | After the close of business on July 9, 2010, the Fund acquired the net assets of Evergreen High Income Fund which became the accounting and performance survivor in the transaction. The information for the periods prior to July 12, 2010 is that of Class B of Evergreen High Income Fund. |
| 2. | For the four months ended August 31, 2010. The Fund changed its fiscal year end from April 30 to August 31, effective August 31, 2010. |
| 3. | Calculated based upon average shares outstanding. |
| 4. | Total return calculations do not include any sales charges. Returns for periods of less than one year are not annualized. |
The accompanying notes are an integral part of these financial statements.
| | | | | | |
| Financial Highlights | | Wells Fargo Advantage High Yield Bond Fund | | | 23 | |
(For a share outstanding throughout each period)
| | | | | | | | | | | | | | | | | | | | | | | | | | | | |
| | | Six Months Ended
February 29, 2012 (Unaudited) | | | Year Ended August 31, | | | Year Ended April 30, | |
| Class C | | | 2011 | | | 20101,2 | | | 20101 | | | 20091 | | | 20081 | | | 20071 | |
Net asset value, beginning of period | | $ | 3.03 | | | $ | 3.05 | | | $ | 3.10 | | | $ | 2.39 | | | $ | 3.13 | | | $ | 3.40 | | | $ | 3.31 | |
Net investment income | | | 0.09 | | | | 0.18 | | | | 0.07 | | | | 0.23 | | | | 0.25 | | | | 0.22 | | | | 0.21 | 3 |
Net realized and unrealized gains (losses)
on investments | | | 0.10 | | | | (0.02 | ) | | | (0.05 | ) | | | 0.72 | | | | (0.76 | ) | | | (0.28 | ) | | | 0.09 | |
| | | | | | | | | | | | | | | | | | | | | | | | | | | | |
Total from investment operations | | | 0.19 | | | | 0.16 | | | | 0.02 | | | | 0.95 | | | | (0.51 | ) | | | (0.06 | ) | | | 0.30 | |
Distributions to shareholders from | | | | | | | | | | | | | | | | | | | | | | | | | | | | |
Net investment income | | | (0.09 | ) | | | (0.18 | ) | | | (0.07 | ) | | | (0.24 | ) | | | (0.23 | ) | | | (0.21 | ) | | | (0.21 | ) |
Net asset value, end of period | | $ | 3.13 | | | $ | 3.03 | | | $ | 3.05 | | | $ | 3.10 | | | $ | 2.39 | | | $ | 3.13 | | | $ | 3.40 | |
Total return4 | | | 6.40 | % | | | 5.28 | % | | | 0.74 | % | | | 41.23 | % | | | (16.13 | )% | | | (1.65 | )% | | | 9.55 | % |
Ratios to average net assets (annualized) | | | | | | | | | | | | | | | | | | | | | | | | | | | | |
Gross expenses | | | 1.77 | % | | | 1.77 | % | | | 1.81 | % | | | 1.89 | % | | | 1.97 | % | | | 1.82 | % | | | 1.80 | % |
Net expenses | | | 1.77 | % | | | 1.77 | % | | | 1.81 | % | | | 1.88 | % | | | 1.83 | % | | | 1.82 | % | | | 1.80 | % |
Net investment income | | | 5.99 | % | | | 5.85 | % | | | 6.97 | % | | | 8.21 | % | | | 9.79 | % | | | 7.06 | % | | | 6.46 | % |
Supplemental data | | | | | | | | | | | | | | | | | | | | | | | | | | | | |
Portfolio turnover rate | | | 13 | % | | | 70 | % | | | 46 | % | | | 129 | % | | | 119 | % | | | 110 | % | | | 48 | % |
Net assets, end of period (000’s omitted) | | | $98,112 | | | | $95,999 | | | | $104,954 | | | | $106,886 | | | | $78,995 | | | | $118,638 | | | | $161,941 | |
| 1. | After the close of business on July 9, 2010, the Fund acquired the net assets of Evergreen High Income Fund which became the accounting and performance survivor in the transaction. The information for the periods prior to July 12, 2010 is that of Class C of Evergreen High Income Fund. |
| 2. | For the four months ended August 31, 2010. The Fund changed its fiscal year end from April 30 to August 31, effective August 31, 2010. |
| 3. | Calculated based upon average shares outstanding. |
| 4. | Total return calculations do not include any sales charges. Returns for periods of less than one year are not annualized. |
The accompanying notes are an integral part of these financial statements.
| | | | |
| 24 | | Wells Fargo Advantage High Yield Bond Fund | | Financial Highlights |
(For a share outstanding throughout each period)
| | | | | | | | | | | | | | | | | | | | | | | | | | | | |
| | | Six Months Ended
February 29, 2012 (Unaudited) | | | Year Ended August 31, | | | Year Ended April 30, | |
| Administrator Class | | | 2011 | | | 20101,2 | | | 20101 | | | 20091 | | | 20081 | | | 20071 | |
Net asset value, beginning of period | | $ | 3.03 | | | $ | 3.05 | | | $ | 3.10 | | | $ | 2.39 | | | $ | 3.13 | | | $ | 3.40 | | | $ | 3.31 | |
Net investment income | | | 0.10 | | | | 0.22 | | | | 0.08 | | | | 0.26 | | | | 0.28 | 3 | | | 0.26 | | | | 0.25 | 3 |
Net realized and unrealized gains (losses)
on investments | | | 0.10 | | | | (0.03 | ) | | | (0.05 | ) | | | 0.72 | | | | (0.76 | ) | | | (0.29 | ) | | | 0.09 | |
| | | | | | | | | | | | | | | | | | | | | | | | | | | | |
Total from investment operations | | | 0.20 | | | | 0.19 | | | | 0.03 | | | | 0.98 | | | | (0.48 | ) | | | (0.03 | ) | | | 0.34 | |
Distributions to shareholders from | | | | | | | | | | | | | | | | | | | | | | | | | | | | |
Net investment income | | | (0.10 | ) | | | (0.21 | ) | | | (0.08 | ) | | | (0.27 | ) | | | (0.26 | ) | | | (0.24 | ) | | | (0.25 | ) |
Net asset value, end of period | | $ | 3.13 | | | $ | 3.03 | | | $ | 3.05 | | | $ | 3.10 | | | $ | 2.39 | | | $ | 3.13 | | | $ | 3.40 | |
Total return4 | | | 6.91 | % | | | 6.30 | % | | | 1.07 | % | | | 42.62 | % | | | (15.28 | )% | | | (0.66 | )% | | | 10.65 | % |
Ratios to average net assets (annualized) | | | | | | | | | | | | | | | | | | | | | | | | | | | | |
Gross expenses | | | 0.94 | % | | | 0.95 | % | | | 0.87 | % | | | 0.89 | % | | | 0.94 | % | | | 0.82 | % | | | 0.80 | % |
Net expenses | | | 0.80 | % | | | 0.80 | % | | | 0.81 | % | | | 0.88 | % | | | 0.80 | % | | | 0.82 | % | | | 0.80 | % |
Net investment income | | | 6.96 | % | | | 6.79 | % | | | 7.95 | % | | | 9.17 | % | | | 11.89 | % | | | 8.05 | % | | | 7.42 | % |
Supplemental data | | | | | | | | | | | | | | | | | | | | | | | | | | | | |
Portfolio turnover rate | | | 13 | % | | | 70 | % | | | 46 | % | | | 129 | % | | | 119 | % | | | 110 | % | | | 48 | % |
Net assets, end of period (000’s omitted) | | | $35,531 | | | | $26,234 | | | | $48,709 | | | | $93,639 | | | | $68,991 | | | | $25,729 | | | | $27,147 | |
| 1. | After the close of business on July 9, 2010, the Fund acquired the net assets of Evergreen High Income Fund which became the accounting and performance survivor in the transaction. The information for the periods prior to July 12, 2010 is that of Class I of Evergreen High Income Fund. |
| 2. | For the four months ended August 31, 2010. The Fund changed its fiscal year end from April 30 to August 31, effective August 31, 2010. |
| 3. | Calculated based upon average shares outstanding. |
| 4. | Returns for periods of less than one year are not annualized. |
The accompanying notes are an integral part of these financial statements.
| | | | | | |
| Notes to Financial Statements (Unaudited) | | Wells Fargo Advantage High Yield Bond Fund | | | 25 | |
1. ORGANIZATION
Wells Fargo Funds Trust (the “Trust”), a Delaware statutory trust organized on March 10, 1999, is an open-end management investment company registered under the Investment Company Act of 1940, as amended (the “1940 Act”). These financial statements report on Wells Fargo Advantage High Yield Bond Fund (the “Fund”) which is a diversified series of the Trust.
2. SIGNIFICANT ACCOUNTING POLICIES
The following significant accounting policies, which are consistently followed in the preparation of the financial statements of the Fund, are in conformity with U.S. generally accepted accounting principles which require management to make estimates and assumptions that affect the reported amounts of assets and liabilities, disclosure of contingent assets and liabilities at the date of the financial statements, and the reported amounts of revenues and expenses during the reporting period. Actual results could differ from those estimates.
Securities valuation
Fixed income securities with original maturities exceeding 60 days are valued based on available evaluated prices received from an independent pricing service approved by the Board of Trustees which may utilize both transaction data and market information such as yield, prices of securities of comparable quality, coupon rate, maturity, type of issue, trading characteristics and other market data. If valuations are not available from the pricing service or values received are deemed not representative of market value, values will be obtained from a third party broker-dealer or determined based on the Fund’s Fair Value Procedures.
Debt securities of sufficient credit quality with original maturities of 60 days or less generally are valued at amortized cost which approximates fair value. The amortized cost method involves valuing a security at its cost, plus accretion of discount or minus amortization of premium over the period until maturity.
Investments in equity securities are valued each business day as of the close of regular trading on the New York Stock Exchange, which is usually 4:00 p.m. (Eastern Time). Securities which are traded on a national or foreign securities exchange are valued at the last reported sales price, except that securities listed on The Nasdaq Stock Market, Inc. (“Nasdaq”) are valued at the Nasdaq Official Closing Price (“NOCP”), and if no NOCP is available, then at the last reported sales price. If no sales price is shown on the Nasdaq, the bid price will be used. In the absence of any sale of securities listed on the Nasdaq, and in the case of other securities (including U.S. Government obligations, but excluding debt securities maturing in 60 days or less), the price will be deemed “stale” and the valuations will be determined in accordance with the Fund’s Fair Value Procedures.
Investments in open-end mutual funds and non-registered investment companies are generally valued at net asset value.
Investments which are not valued using any of the methods discussed above, are valued at their fair value, as determined by procedures established in good faith and approved by the Board of Trustees.
Foreign currency translation
The accounting records of the Fund are maintained in U.S. dollars. Assets, including investment securities, and liabilities denominated in foreign currency are translated into U.S. dollars at the prevailing rates of exchange at the date of valuation. Purchases and sales of securities, and income and expenses are translated at the prevailing rate of exchange on the respective dates of such transactions. Reported net realized foreign exchange gains or losses arise from sales of foreign currencies, currency gains or losses realized between the trade and settlement dates on securities transactions, and the difference between the amounts of dividends, interest and foreign withholding taxes recorded and the U.S. dollar equivalent of the amounts actually paid or received. Net unrealized foreign exchange gains and losses arise from changes in the fair value of assets and liabilities other than investments in securities resulting in changes in exchange rates.
The changes in net assets arising from changes in exchange rates and the changes in net assets resulting from changes in market prices of securities are not separately presented. Such changes are recorded with net realized and unrealized gains or losses from investments. Gains and losses from certain foreign currency transactions are treated as ordinary income for U.S. federal income tax purposes.
Security loans
The Fund may lend its securities from time to time in order to earn additional income in the form of fees or interest on securities received as collateral or the investment of any cash received as collateral. The Fund continues to receive
| | | | |
| 26 | | Wells Fargo Advantage High Yield Bond Fund | | Notes to Financial Statements (Unaudited) |
interest or dividends on the securities loaned. The Fund receives collateral in the form of cash or securities with a value at least equal to the value of the securities on loan. The value of the loaned securities is determined at the close of each business day and any additional required collateral is delivered to the Fund on the next business day. In a securities lending transaction, the net asset value of the Fund will be affected by an increase or decrease in the value of the securities loaned and by an increase or decrease in the value of the instrument in which collateral is invested. The amount of securities lending activity undertaken by the Fund fluctuates from time to time. In the event of default or bankruptcy by the borrower, the Fund may be prevented from recovering the loaned securities or gaining access to the collateral or may experience delays or costs in doing so. In addition, the investment of any cash collateral received may lose all or part of its value. The Fund has the right under the lending agreement to recover the securities from the borrower on demand.
The Fund lends its securities through an unaffiliated securities lending agent. Cash collateral received in connection with its securities lending transactions is invested in Wells Fargo Securities Lending Cash Investments, LLC (the “Cash Collateral Fund”). The Cash Collateral Fund is exempt from registration under Section 3(c)(7) of the 1940 Act and is managed by Wells Fargo Funds Management LLC (“Funds Management”) and is sub-advised by Wells Capital Management Incorporated (“Wells Capital Management”). Funds Management receives an advisory fee starting at 0.05% and declining to 0.01% as the average daily net assets of the Cash Collateral Fund increase. All of the fees received by Funds Management are paid to Wells Capital Management for its services as sub-adviser. The Cash Collateral Fund seeks to provide a positive return compared to the daily Fed Funds Open rate by investing in high-quality, U.S. dollar-denominated short-term money market instruments. Cash Collateral Fund investments are fair valued based upon the amortized cost valuation technique. Income earned from investment in the Cash Collateral Fund is included in securities lending income on the Statement of Operations.
When-issued transactions
The Fund may purchase securities on a forward commitment or ‘when-issued’ basis. The Fund records a when-issued transaction on the trade date and will segregate assets to cover its obligation by confirming the availability of qualifying assets having a value sufficient to make payment for the securities purchased. Securities purchased on a when-issued basis are marked-to-market daily and the Fund begins earning interest on the settlement date. Losses may arise due to changes in the market value of the underlying securities or if the counterparty does not perform under the contract.
Term loans
The Fund may invest in term loans. The loans are marked-to-market daily and the Fund begins earning interest when the loans are funded. The loans pay interest at rates which are periodically reset by reference to a base lending rate plus a spread. The Fund assumes the credit risk of the borrower and there could be potential loss to the Fund in the event of default by the borrower.
Security transactions and income recognition
Securities transactions are recorded on a trade date basis. Realized gains or losses are reported on the basis of identified cost of securities delivered.
Interest income is accrued daily and bond discounts are accreted and premiums are amortized daily based on the effective interest method. To the extent debt obligations are placed on non-accrual status, any related interest income may be reduced by writing off interest receivables when the collection of all or a portion of interest has become doubtful based on consistently applied procedures. If the issuer subsequently resumes interest payments or when the collectability of interest is reasonably assured, the debt obligation is removed from non-accrual status.
Dividend income is recognized on the ex-dividend date.
Distributions to shareholders
Distributions to shareholders from net investment income are accrued daily and paid monthly. Distributions from net realized gains, if any, are recorded on the ex-dividend date. Such distributions are determined in conformity with income tax regulations, which may differ from generally accepted accounting principles.
Federal and other taxes
The Fund intends to continue to qualify as a regulated investment company by distributing substantially all of its investment company taxable income and any net realized capital gains (after reduction for capital loss carryforwards) sufficient to relieve it from all, or substantially all, federal income taxes. Accordingly, no provision for federal income taxes was required.
| | | | | | |
| Notes to Financial Statements (Unaudited) | | Wells Fargo Advantage High Yield Bond Fund | | | 27 | |
The Fund’s income and federal excise tax returns and all financial records supporting those returns for the prior three fiscal years are subject to examination by the federal and Delaware revenue authorities.
Under the recently enacted Regulated Investment Company Modernization Act of 2010, the Fund is permitted to carry forward capital losses incurred in taxable years which began after December 22, 2010 for an unlimited period. However, any losses incurred are required to be utilized prior to the losses incurred in pre-enactment taxable years. As a result of this ordering rule, pre-enactment capital loss carryforwards may be more likely to expire unused. Additionally, post-enactment capital losses that are carried forward will retain their character as either short-term or long-term capital losses rather than being considered all short-term as under previous law.
As of August 31, 2011, the Fund had net capital loss carryforwards, which were available to offset future net realized capital gains, in the amount of $79,747,392 with $42,496,700 expiring in 2016 and $37,250,692 expiring in 2017.
Class allocations
The separate classes of shares offered by the Fund differ principally in applicable sales charges, distribution, shareholder servicing and administration fees. Shareholders of each class bear certain expenses that pertain to that particular class. All shareholders bear the common expenses of the Fund, earn income from the portfolio, and are allocated unrealized gains and losses pro rata based on the average daily net assets of each class, without distinction between share classes. Dividends are determined separately for each class based on income and expenses allocable to each class. Realized gains and losses are allocated to each class pro rata based upon the net assets of each class on the date realized. Differences in per share dividend rates generally result from the relative weightings of pro rata income and realized gain allocations and from differences in separate class expenses, including distribution, shareholder servicing and administration fees.
3. FAIR VALUATION MEASUREMENTS
Fair value measurements of investments are determined within a framework that has established a fair value hierarchy based upon the various data inputs utilized in determining the value of the Fund’s investments. The three-level hierarchy gives the highest priority to unadjusted quoted prices in active markets for identical assets or liabilities (Level 1) and the lowest priority to significant unobservable inputs (Level 3). The Fund’s investments are classified within the fair value hierarchy based on the lowest level of input that is significant to the fair value measurement. The inputs are summarized into three broad levels as follows:
| n | | Level 1 – quoted prices in active markets for identical securities |
| n | | Level 2 – other significant observable inputs (including quoted prices for similar securities, interest rates, prepayment speeds, credit risk, etc.) |
| n | | Level 3 – significant unobservable inputs (including the Fund’s own assumptions in determining the fair value of investments) |
The inputs or methodologies used for valuing securities are not necessarily an indication of the risk associated with investing in those securities.
As of February 29, 2012, the inputs used in valuing the Fund’s assets, which are carried at fair value, were as follows:
| | | | | | | | | | | | | | | | |
| Investments in Securities | | Quoted Prices (Level 1) | | | Significant Other Observable Inputs (Level 2) | | | Significant Unobservable Inputs (Level 3) | | | Total | |
Equity securities | | | | | | | | | | | | | | | | |
Common stocks | | $ | 266,506 | | | $ | 7,360 | | | $ | 0 | | | $ | 273,866 | |
Preferred stocks | | | 610,480 | | | | 0 | | | | 0 | | | | 610,480 | |
| | | | |
Corporate bonds and notes | | | 0 | | | | 329,679,523 | | | | 0 | | | | 329,679,523 | |
| | | | |
Non-agency mortgage backed securities | | | 0 | | | | 8,452,346 | | | | 0 | | | | 8,452,346 | |
| | | | |
Term loans | | | 0 | | | | 54,173,711 | | | | 1,114,451 | | | | 55,288,162 | |
| | | | |
Yankee corporate bonds and notes | | | 0 | | | | 16,281,623 | | | | 0 | | | | 16,281,623 | |
| | | | |
Short-term investments | | | | | | | | | | | | | | | | |
Investment companies | | | 8,522,722 | | | | 5,880,475 | | | | 0 | | | | 14,403,197 | |
| | | $ | 9,399,708 | | | $ | 414,475,038 | | | $ | 1,114,451 | | | $ | 424,989,197 | |
| | | | |
| 28 | | Wells Fargo Advantage High Yield Bond Fund | | Notes to Financial Statements (Unaudited) |
Further details on the major security types listed above can be found in the Portfolio of Investments.
Transfers in and transfers out are recognized at the end of the reporting period. For the six months ended February 29, 2012, the Fund did not have any significant transfers into/out of Level 1 and Level 2.
The following is a reconciliation of assets in which significant unobservable inputs (Level 3) were used in determining fair value:
| | | | | | | | | | | | | | | | |
| | | Corporate
bonds and
notes | | | Term loans | | | Yankee
corporate
bonds and
notes | | | Total | |
Balance as of August 31, 2011 | | $ | 462,300 | | | $ | 15,291,680 | | | $ | 216 | | | $ | 15,754,196 | |
Accrued discounts (premiums) | | | (448 | ) | | | 136,661 | | | | 0 | | | | 136,213 | |
Realized gains (losses) | | | 0 | | | | 113,217 | | | | 0 | | | | 113,217 | |
Change in unrealized gains (losses) | | | (32,902 | ) | | | 285,023 | | | | 0 | | | | 252,121 | |
Purchases | | | 0 | | | | 125,313 | | | | 0 | | | | 125,313 | |
Sales | | | 0 | | | | (4,386,365 | ) | | | 0 | | | | (4,386,365 | ) |
Transfers into Level 3 | | | 0 | | | | 0 | | | | 0 | | | | 0 | |
Transfers out of Level 3 | | | (428,950 | ) | | | (10,451,078 | ) | | | (216 | ) | | | (10,880,244 | ) |
Balance as of February 29, 2012 | | $ | 0 | | | $ | 1,114,451 | | | $ | 0 | | | $ | 1,114,451 | |
Change in unrealized gains (losses)
relating to securities still held at February 29, 2012 | | $ | 0 | | | $ | (19,219 | ) | | $ | 0 | | | $ | (19,219 | ) |
Transfers out of Level 3 into Level 2 are due to the availability of significant observable inputs which are currently used in the determination of the fair value of the securities.
4. TRANSACTIONS WITH AFFILIATES AND OTHER EXPENSES
Advisory fee
The Trust has entered into an advisory contract with Funds Management, an indirect wholly owned subsidiary of Wells Fargo & Company (“Wells Fargo”). The adviser is responsible for implementing investment policies and guidelines and for supervising the sub-adviser, who is responsible for day-to-day portfolio management of the Fund.
Pursuant to the contract, Funds Management is entitled to receive an annual advisory fee starting at 0.50% and declining to 0.40% as the average daily net assets of the Fund increase. For the six months ended February 29, 2012, the advisory fee was equivalent to an annual rate of 0.50% of the Fund’s average daily net assets.
Funds Management has retained the services of certain sub-advisers to provide daily portfolio management to the Fund. The fees related to sub-advisory services are borne directly by Funds Management and do not increase the overall fees paid by the Fund. Wells Capital Management, an affiliate of Funds Management, is the sub-adviser to the Fund and is entitled to receive a fee from Funds Management at an annual rate starting at 0.35% and declining to 0.20% as the average daily net assets of the Fund increase.
Administration and transfer agent fees
The Trust has entered into an administration agreement with Funds Management. Under this agreement, for providing administrative services, which includes paying fees and expenses for services provided by the transfer agent, sub-transfer agents, omnibus account servicers and record-keepers, Funds Management is entitled to receive from the Fund an annual fund level administration fee starting at 0.05% and declining to 0.03% as the average daily net assets of the Fund increase and a class level administration fee which is calculated based on the average daily net assets of each class as follows:
| | | | |
| | | Class Level Administration Fee | |
Class A, Class B, Class C | | | 0.16 | % |
Administrator Class | | | 0.10 | |
| | | | | | |
| Notes to Financial Statements (Unaudited) | | Wells Fargo Advantage High Yield Bond Fund | | | 29 | |
Funds Management has contractually waived and/or reimbursed advisory and administration fees to the extent necessary to maintain certain net operating expense ratios for the Fund. Waiver of fees and/or reimbursement of expenses by Funds Management were made first from fund level expenses on a proportionate basis and then from class specific expenses. Funds Management has committed through July 11, 2013 to waive fees and/or reimburse expenses to the extent necessary to cap the Fund’s expenses at 1.03% for Class A, 1.78% for Class B, 1.78% for Class C and 0.80% for Administrator Class.
Distribution fees
The Trust has adopted a Distribution Plan for Class B and Class C shares of the Fund pursuant to Rule 12b-1 under the 1940 Act. Distribution fees are charged to Class B and Class C shares and paid to Wells Fargo Funds Distributor, LLC, the principal underwriter, at an annual rate of 0.75% of the average daily net assets of Class B and Class C shares.
For the six months ended February 29, 2012, Wells Fargo Funds Distributor, LLC received $9,034 from the sale of Class A shares and $6,928 and $534 in contingent deferred sales charges from redemptions of Class B and Class C shares, respectively.
Shareholder servicing fees
The Trust has entered into contracts with one or more shareholder servicing agents, whereby each class of the Fund is charged a fee at an annual rate of 0.25% of the average daily net assets of each respective class.
A portion of these total shareholder servicing fees were paid to affiliates of Wells Fargo.
5. INVESTMENT PORTFOLIO TRANSACTIONS
Purchases and sales of investments, excluding U.S. Government obligations (if any) and short-term securities (securities with maturities of one year or less at purchase date), for the six months ended February 29, 2012 were $99,246,373 and $81,821,306, respectively.
As of February 29, 2012, the Fund had unfunded loan commitments of $441,000.
6. BANK BORROWINGS
The Trust (excluding the money market funds) and Wells Fargo Variable Trust are parties to a $150,000,000 revolving credit agreement with State Street Bank and Trust Company, whereby the Fund is permitted to use bank borrowings for temporary or emergency purposes, such as to fund shareholder redemption requests. Interest under the credit agreement is charged to the Fund based on a borrowing rate equal to the higher of the Federal Funds rate in effect on that day plus 1.25% or the overnight LIBOR rate in effect on that day plus 1.25%. In addition, an annual commitment fee equal to 0.10% of the unused balance is allocated to each participating fund. Prior to September 6, 2011, the revolving credit agreement was for $125,000,000 and the annual commitment fee paid by the Fund was 0.125% of the unused balance. For the six months ended February 29, 2012, the Fund paid $503 in commitment fees.
For the six months ended February 29, 2012, there were no borrowings by the Fund under the agreement.
7. INDEMNIFICATION
Under the Trust’s organizational documents, the officers and directors are indemnified against certain liabilities that may arise out of performance of their duties to the Trust. Additionally, in the normal course of business, the Trust may enter into contracts with service providers that contain a variety of indemnification clauses. The Trust’s maximum exposure under these arrangements is dependent on future claims that may be made against the Fund and, therefore, cannot be estimated.
8. NEW ACCOUNTING PRONOUNCEMENTS
In May 2011, the Financial Accounting Standards Board (“FASB”) issued Accounting Standards Update (“ASU”) No. 2011-04 “Amendments to Achieve Common Fair Value Measurement and Disclosure Requirements in U.S. GAAP and IFRSs”. ASU No. 2011-04 amends FASB ASC Topic 820, Fair Value Measurements and Disclosures, to establish common requirements for measuring fair value and for disclosing information about fair value measurements in accordance with GAAP. The ASU is effective prospectively for interim and annual periods beginning after December 15, 2011. Management expects that adoption of the ASU will result in additional disclosures in the financial statements, as applicable.
| | | | |
| 30 | | Wells Fargo Advantage High Yield Bond Fund | | Notes to Financial Statements (Unaudited) |
In April 2011, FASB issued ASU No. 2011-03 “Reconsideration of Effective Control for Repurchase Agreements”. ASU No. 2011-03 amends FASB ASC Topic 860, Transfers and Servicing, specifically the criteria required to determine whether a repurchase agreement (repo) and similar agreements should be accounted for as sales of financial assets or secured borrowings with commitments. ASU No. 2011-03 changes the assessment of effective control by focusing on the transferor’s contractual rights and obligations and removing the criterion to assess its ability to exercise those rights or honor those obligations. This could result in changes to the way entities account for certain transactions including repurchase agreements, mortgage dollar rolls and reverse repurchase agreements. The ASU will become effective on a prospective basis for new transfers and modifications to existing transactions as of the beginning of the first interim or annual period beginning on or after December 15, 2011. Management has evaluated the impact of adopting the ASU and expects no significant changes.
| | | | | | |
| Other Information (Unaudited) | | Wells Fargo Advantage High Yield Bond Fund | | | 31 | |
PROXY VOTING INFORMATION
A description of the policies and procedures that the Fund uses to determine how to vote proxies relating to portfolio securities is available without charge, upon request, by calling 1-800-222-8222, visiting our Web site at wellsfargoadvantagefunds.com, or visiting the SEC Web site at sec.gov. Information regarding how the Fund voted proxies relating to portfolio securities during the most recent 12-month period ended June 30 is available without charge on the Fund’s Web site at wellsfargoadvantagefunds.com or by visiting the SEC Web site at sec.gov.
PORTFOLIO HOLDINGS INFORMATION
The complete portfolio holdings for the Fund are publicly available on the Fund’s Web site (wellsfargoadvantagefunds.com) on a monthly, 30-day or more delayed basis. In addition, top ten holdings information for the Fund is publicly available on the Fund’s Web site on a monthly, seven-day or more delayed basis. The Fund files its complete schedule of portfolio holdings with the SEC for the first and third quarters of each fiscal year on Form N-Q, which is available without charge by visiting the SEC Web site at sec.gov. In addition, the Fund’s Form N-Q may be reviewed and copied at the SEC’s Public Reference Room in Washington, DC, and at regional offices in New York City, at 233 Broadway, and in Chicago, at 175 West Jackson Boulevard, Suite 900. Information about the Public Reference Room may be obtained by calling 1-800-SEC-0330.
| | | | |
| 32 | | Wells Fargo Advantage High Yield Bond Fund | | Other Information (Unaudited) |
BOARD OF TRUSTEES
The following table provides basic information about the Board of Trustees (the “Trustees”) of the Trust and Officers of the Trust. This table should be read in conjunction with the Prospectus and the Statement of Additional Information1 of the Fund. Each of the Trustees and Officers listed below acts in identical capacities for the Wells Fargo Advantage family of funds, which consists of 137 funds comprising the Wells Fargo Funds Trust, Wells Fargo Variable Trust, Wells Fargo Master Trust and four closed-end funds (collectively the “Fund Complex”). All of the Trustees are also Members of the Audit and Governance Committees of each Trust in the Fund Complex. The mailing address of each Trustee and Officer is 525 Market Street, 12th Floor, San Francisco, CA 94105. Each Trustee and Officer serves an indefinite term, however, each Trustee serves such term until reaching the mandatory retirement age established by the Trustees.
Independent Trustees
| | | | | | |
Name and Year of Birth | | Position Held and Length of Service | | Principal Occupations During Past Five Years | | Other Directorships During
Past Five Years |
Peter G. Gordon
(Born 1942) | | Trustee, since 1998; Chairman, since 2005 (Lead Trustee since 2001) | | Co-Founder, Retired Chairman, President and CEO of Crystal Geyser Water Company. Trustee Emeritus, Colby College | | Asset Allocation Trust |
Isaiah Harris, Jr.
(Born 1952) | | Trustee, since 2009 | | Retired. Prior thereto, President and CEO of BellSouth Advertising and Publishing Corp. from 2005 to 2007, President and CEO of BellSouth Enterprises from 2004 to 2005 and President of BellSouth Consumer Services from 2000 to 2003. Emeritus member of the Iowa State University Foundation Board of Governors. Emeritus Member of the Advisory Board of Iowa State University School of Business. Mr. Harris is a certified public accountant. | | CIGNA Corporation; Deluxe Corporation; Asset Allocation Trust |
Judith M. Johnson
(Born 1949) | | Trustee, since 2008 | | Retired. Prior thereto, Chief Executive Officer and Chief Investment Officer of Minneapolis Employees Retirement Fund from 1996 to 2008. Ms. Johnson is an attorney, certified public accountant and a certified managerial accountant. | | Asset Allocation Trust |
Leroy Keith, Jr.
(Born 1939) | | Trustee, since 2010 | | Chairman, Bloc Global Services (development and construction). Trustee of the Evergreen Funds from 1983 to 2010. Former Managing Director, Almanac Capital Management (commodities firm), former Partner, Stonington Partners, Inc. (private equity fund), former Director, Obagi Medical Products Co. and former Director, Lincoln Educational Services. | | Trustee, Virtus Fund Complex (consisting of 40 portfolios as of 12/31/11); Asset Allocation Trust |
David F. Larcker
(Born 1950) | | Trustee, since 2009 | | James Irvin Miller Professor of Accounting at the Graduate School of Business, Stanford University, Director of Corporate Governance Research Program and Senior Faculty of The Rock Center for Corporate Governance since 2006. From 2005 to 2008, Professor of Accounting at the Graduate School of Business, Stanford University. Prior thereto, Ernst & Young Professor of Accounting at The Wharton School, University of Pennsylvania from 1985 to 2005. | | Asset Allocation Trust |
Olivia S. Mitchell
(Born 1953) | | Trustee, since 2006 | | International Foundation of Employee Benefit Plans Professor, Wharton School of the University of Pennsylvania since 1993. Director of Wharton’s Pension Research Council and Boettner Center on Pensions & Retirement Research, and Research Associate at the National Bureau of Economic Research. Previously, Cornell University Professor from 1978 to 1993. | | Asset Allocation Trust |
| | | | | | |
| Other Information (Unaudited) | | Wells Fargo Advantage High Yield Bond Fund | | | 33 | |
| | | | | | |
Name and Year of Birth | | Position Held and Length of Service | | Principal Occupations During Past Five Years | | Other Directorships During
Past Five Years |
Timothy J. Penny
(Born 1951) | | Trustee, since 1996 | | President and CEO of Southern Minnesota Initiative Foundation, a non-profit organization, since 2007 and Senior Fellow at the Humphrey Institute Policy Forum at the University of Minnesota since 1995. Member of the Board of Trustees of NorthStar Education Finance, Inc., a non-profit organization, since 2007. | | Asset Allocation Trust |
Michael S. Scofield
(Born 1943) | | Trustee, since 2010 | | Served on the Investment Company Institute’s Board of Governors and Executive Committee from 2008-2011 as well the Governing Council of the Independent Directors Council from 2006-2011 and the Independent Directors Council Executive Committee from 2008-2011. Chairman of the IDC from 2008-2010. Institutional Investor (Fund Directions) Trustee of Year in 2007. Trustee of the Evergreen Funds (and its predecessors) from 1984 to 2010. Chairman of the Evergreen Funds from 2000-2010. Former Trustee of the Mentor Funds. Retired Attorney, Law Offices of Michael S. Scofield and former Director and Chairman, Branded Media Corporation (multi-media branding company). | | Asset Allocation Trust |
Donald C. Willeke
(Born 1940) | | Trustee, since 1996 | | Principal of the law firm of Willeke & Daniels. General Counsel of the Minneapolis Employees Retirement Fund from 1984 until its consolidation into the Minnesota Public Employees Retirement Association on June 30, 2010. Director and Vice Chair of The Free Trust (non-profit corporation). Director of the American Chestnut Foundation (non-profit corporation). | | Asset Allocation Trust |
Officers
| | | | | | |
Name and Year of Birth | | Position Held and
Length of Service | | Principal Occupations During Past Five Years | | |
Karla M. Rabusch
(Born 1959) | | President, since 2003 | | Executive Vice President of Wells Fargo Bank, N.A. and President of Wells Fargo Funds Management, LLC since 2003. Senior Vice President and Chief Administrative Officer of Wells Fargo Funds Management, LLC from 2001 to 2003. | | |
C. David Messman
(Born 1960) | | Secretary, since 2000; Chief Legal Counsel, since 2003 | | Senior Vice President and Secretary of Wells Fargo Funds Management, LLC since 2001. Vice President and Managing Senior Counsel of Wells Fargo Bank, N.A. since 1996. | | |
Kasey Phillips
(Born 1970) | | Treasurer, since 2009 | | Senior Vice President of Wells Fargo Funds Management, LLC since 2009. Senior Vice President of Evergreen Investment Management Company, LLC from 2006 to 2010. Treasurer of the Evergreen Funds from 2005 to 2010. | | |
David Berardi
(Born 1975) | | Assistant Treasurer, since 2009 | | Vice President of Wells Fargo Funds Management, LLC since 2009. Vice President of Evergreen Investment Management Company, LLC from 2008 to 2010. Assistant Vice President of Evergreen Investment Services, Inc. from 2004 to 2008. Manager of Fund Reporting and Control for Evergreen Investment Management Company, LLC from 2004 to 2010. | | |
Jeremy DePalma
(Born 1974) | | Assistant Treasurer, since 2009 | | Senior Vice President of Wells Fargo Funds Management, LLC since 2009. Senior Vice President of Evergreen Investment Management Company, LLC from 2008 to 2010. Vice President, Evergreen Investment Services, Inc. from 2004 to 2007. Head of the Fund Reporting and Control Team within Fund Administration from 2005 to 2010. | | |
Debra Ann Early
(Born 1964) | | Chief Compliance Officer, since 2007 | | Chief Compliance Officer of Wells Fargo Funds Management, LLC since 2007. Chief Compliance Officer of Parnassus Investments from 2005 to 2007. Chief Financial Officer of Parnassus Investments from 2004 to 2007 and Senior Audit Manager of PricewaterhouseCoopers LLP from 1998 to 2004. | | |
| 1. | The Statement of Additional Information includes additional information about the Trustees and is available, without charge, upon request, by calling 1-800-222-8222 or by visiting the Web site at wellsfargoadvantagefunds.com. |
| | | | |
| 34 | | Wells Fargo Advantage High Yield Bond Fund | | List of Abbreviations |
The following is a list of common abbreviations for terms and entities which may have appeared in this report.
| ACB | — Agricultural Credit Bank |
| ADR | — American Depository Receipt |
| ADS | — American Depository Shares |
| AGC-ICC | — Assured Guaranty Corporation - Insured Custody Certificates |
| AGM | — Assured Guaranty Municipal |
| AMBAC | — American Municipal Bond Assurance Corporation |
| AMT | — Alternative Minimum Tax |
| BAN | — Bond Anticipation Notes |
| BHAC | — Berkshire Hathaway Assurance Corporation |
| CAB | — Capital Appreciation Bond |
| CCAB | — Convertible Capital Appreciation Bond |
| CDA | — Community Development Authority |
| CDO | — Collateralized Debt Obligation |
| COP | — Certificate of Participation |
| DRIVER | — Derivative Inverse Tax-Exempt Receipts |
| DW&P | — Department of Water & Power |
| DWR | — Department of Water Resources |
| ECFA | — Educational & Cultural Facilities Authority |
| EDA | — Economic Development Authority |
| EDFA | — Economic Development Finance Authority |
| ETF | — Exchange-Traded Fund |
| FFCB | — Federal Farm Credit Bank |
| FGIC | — Financial Guaranty Insurance Corporation |
| FHA | — Federal Housing Authority |
| FHLB | — Federal Home Loan Bank |
| FHLMC | — Federal Home Loan Mortgage Corporation |
| FNMA | — Federal National Mortgage Association |
| GDR | — Global Depository Receipt |
| GNMA | — Government National Mortgage Association |
| HCFR | — Healthcare Facilities Revenue |
| HEFA | — Health & Educational Facilities Authority |
| HEFAR | — Higher Education Facilities Authority Revenue |
| HFA | — Housing Finance Authority |
| HFFA | — Health Facilities Financing Authority |
| IBC | — Insured Bond Certificate |
| IDA | — Industrial Development Authority |
| IDAG | — Industrial Development Agency |
| IDR | — Industrial Development Revenue |
| KRW | — Republic of Korea Won |
| LIBOR | — London Interbank Offered Rate |
| LLC | — Limited Liability Company |
| LLP | — Limited Liability Partnership |
| MBIA | — Municipal Bond Insurance Association |
| MFHR | — Multi-Family Housing Revenue |
| MSTR | — Municipal Securities Trust Receipts |
| MUD | — Municipal Utility District |
| NATL-RE | — National Public Finance Guarantee Corporation |
| PCFA | — Pollution Control Finance Authority |
| PCR | — Pollution Control Revenue |
| PFA | — Public Finance Authority |
| PFFA | — Public Facilities Financing Authority |
| PFOTER | — Puttable Floating Option Tax-Exempt Receipts |
| plc | — Public Limited Company |
| PUTTER | — Puttable Tax-Exempt Receipts |
| R&D | — Research & Development |
| RDA | — Redevelopment Authority |
| RDFA | — Redevelopment Finance Authority |
| REIT | — Real Estate Investment Trust |
| ROC | — Reset Option Certificates |
| SAVRS | — Select Auction Variable Rate Securities |
| SBA | — Small Business Authority |
| SFHR | — Single Family Housing Revenue |
| SFMR | — Single Family Mortgage Revenue |
| SPDR | — Standard & Poor’s Depositary Receipts |
| TAN | — Tax Anticipation Notes |
| TIPS | — Treasury Inflation-Protected Securities |
| TRAN | — Tax Revenue Anticipation Notes |
| TCR | — Transferable Custody Receipts |
| TTFA | — Transportation Trust Fund Authority |
| TVA | — Tennessee Valley Authority |
| XLCA | — XL Capital Assurance |


FOR MORE INFORMATION
More information about Wells Fargo Advantage Funds is available free upon request. To obtain literature, please write, e-mail, visit the Fund’s Web site, or call:
Wells Fargo Advantage Funds
P.O. Box 8266
Boston, MA 02266-8266
E-mail: wfaf@wellsfargo.com
Web site: wellsfargoadvantagefunds.com
Individual investors: 1-800-222-8222
Retail investment professionals: 1-888-877-9275
Institutional investment professionals: 1-866-765-0778
This report and the financial statements contained herein are submitted for the general information of the shareholders of Wells Fargo Advantage Funds. If this report is used for promotional purposes, distribution of the report must be accompanied or preceded by a current prospectus. For a prospectus containing more complete information, including charges and expenses, call 1-800-222-8222 or visit the Fund’s Web site at wellsfargoadvantagefunds.com. Please consider the investment objectives, risks, charges, and expenses of the investment carefully before investing. This and other information about Wells Fargo Advantage Funds can be found in the current prospectus. Read the prospectus carefully before you invest or send money.
Wells Fargo Funds Management, LLC, a wholly owned subsidiary of Wells Fargo & Company, provides investment advisory and administrative services for Wells Fargo Advantage Funds. Other affiliates of Wells Fargo & Company provide subadvisory and other services for the Funds. The Funds are distributed by Wells Fargo Funds Distributor, LLC, Member FINRA/SIPC, an affiliate of Wells Fargo & Company.
NOT FDIC INSURED ¡ NO BANK GUARANTEE ¡ MAY LOSE VALUE
© 2012 Wells Fargo Funds Management, LLC. All rights reserved.
| | |
 | | 208523 04-12 SA218/SAR218 2-12 |

Wells Fargo Advantage Income Plus Fund

Semi-Annual Report
February 29, 2012

Reduce clutter. Save trees.
Sign up for electronic delivery of prospectuses and shareholder reports at wellsfargo.com/advantagedelivery
Contents
The views expressed and any forward-looking statements are as of February 29, 2012, unless otherwise noted, and are those of the Fund managers and/or Wells Fargo Funds Management, LLC. Discussions of individual securities, or the markets generally, or any Wells Fargo Advantage Fund are not intended as individual recommendations. Future events or results may vary significantly from those expressed in any forward-looking statements; the views expressed are subject to change at any time in response to changing circumstances in the market. Wells Fargo Funds Management, LLC, disclaims any obligation to publicly update or revise any views expressed or forward-looking statements.
NOT FDIC INSURED ¡ NO BANK GUARANTEE ¡ MAY LOSE VALUE

WELLS FARGO INVESTMENT HISTORY
| | |
| |
| 1932 | | Keystone creates one of the first mutual fund families. |
| |
| 1971 | | Wells Fargo & Company introduces one of the first institutional index funds. |
| |
| 1978 | | Wells Fargo applies Markowitz and Sharpe’s research on Modern Portfolio Theory to introduce one of the industry’s first Tactical Asset Allocation (TAA) models in institutional separately managed accounts. |
| |
| 1984 | | Wells Fargo Stagecoach Funds launches its first asset allocation fund. |
| |
| 1989 | | The Tactical Asset Allocation (TAA) Model is first applied to Wells Fargo’s asset allocation mutual funds. |
| |
| 1994 | | Wells Fargo introduces the LifePath Funds, one of the first suites of target date funds (now the Wells Fargo Advantage Dow Jones Target Date FundsSM). |
| |
| 1996 | | Evergreen Investments and Keystone Funds merge. |
| |
| 1997 | | Wells Fargo launches Wells Fargo Advantage WealthBuilder PortfoliosSM, a fund-of-funds suite of products that includes the use of quantitative models to shift assets among investment styles. |
| |
| 1999 | | Norwest Advantage Funds and Stagecoach Funds are reorganized into Wells Fargo Funds after the merger of Norwest and Wells Fargo. |
| |
| 2002 | | Evergreen Retail and Evergreen Institutional companies form the umbrella asset management company, Evergreen Investments. |
| |
| 2005 | | The integration of Strong Funds with Wells Fargo Funds creates Wells Fargo Advantage Funds, resulting in one of the top 20 mutual fund companies in the United States. |
| |
| 2006 | | Wells Fargo Advantage Funds relaunches the target date product line as Wells Fargo Advantage Dow Jones Target Date Funds. |
| |
| 2010 | | The mergers and reorganizations of Evergreen and Wells Fargo Advantage mutual funds are completed, unifying the families under the brand of Wells Fargo Advantage Funds. |
Wells Fargo Advantage Funds®
Wells Fargo Advantage Funds skillfully guides institutions, financial advisors, and individuals through the investment terrain to help them reach their financial objectives. Everything we do on behalf of investors is backed by our unique combination of qualifications.
Strength
Our organization is built on the standards of integrity and service established by our parent company—Wells Fargo & Company—more than 150 years ago. And, because we’re part of a highly diversified financial enterprise, we offer the depth of resources to help investors succeed.
Expertise
Our multi-boutique model offers investors access to the independent thinking of premier investment managers that have been chosen for their time-tested strategies. While each team specializes in a specific investment strategy, collectively they provide investors a wide choice of distinct investment styles. Our dedication to investment excellence doesn’t end with our expertise in manager selection—risk management, analysis, and rigorous ongoing review seek to ensure each manager’s investment process remains consistent.
Partnership
Our collaborative approach is built around understanding the needs and goals of our clients. By adhering to core principles of sound judgment and steady guidance, we support you through every stage of the investment decision process.
Carefully consider a fund’s investment objectives, risks, charges, and expenses before investing. For a current prospectus and, if available, a summary prospectus, containing this and other information, visit wellsfargoadvantagefunds.com. Read it carefully before investing.
Wells Fargo Funds Management, LLC, a wholly owned subsidiary of Wells Fargo & Company, provides investment advisory and administrative services for Wells Fargo Advantage Funds®. Other affiliates of Wells Fargo & Company provide subadvisory and other services for the Funds. The Funds are distributed by Wells Fargo Funds Distributor, LLC, Member FINRA/SIPC, an affiliate of Wells Fargo & Company.
“Dow Jones®” and “Dow Jones Target Date IndexesSM” are service marks of Dow Jones Trademark Holdings, LLC (“Dow Jones”), have been licensed to CME Group Index Services LLC (“CME Indexes”) and have been sublicensed for use for certain purposes by Global Index Advisors, Inc, and Wells Fargo Funds Management, LLC. The Wells Fargo Advantage Dow Jones Target Date FundsSM based on the Dow Jones Target Date IndexesSM, are not sponsored, endorsed, sold or promoted by Dow Jones, CME Indexes or their respective affiliates and none of them makes any representation regarding the advisability of investing in such product(s).
NOT FDIC INSURED ¡ NO BANK GUARANTEE ¡ MAY LOSE VALUE
Not part of the semi-annual report.
Wells Fargo Advantage Funds offers more than 110 mutual funds across a wide range of asset classes, representing over $218 billion in assets under management, as of February 29, 2012.
| | | | |
| Equity Funds | | | | |
Asia Pacific Fund | | Equity Value Fund | | Precious Metals Fund |
C&B Large Cap Value Fund | | Global Opportunities Fund | | Premier Large Company Growth Fund |
C&B Mid Cap Value Fund | | Growth Fund | | Small Cap Opportunities Fund |
Capital Growth Fund | | Index Fund | | Small Cap Value Fund |
Common Stock Fund | | International Equity Fund | | Small Company Growth Fund |
Disciplined U.S. Core Fund | | International Value Fund | | Small Company Value Fund |
Discovery Fund† | | Intrinsic Small Cap Value Fund | | Small/Mid Cap Core Fund |
Diversified Equity Fund | | Intrinsic Value Fund | | Small/Mid Cap Value Fund |
Diversified International Fund | | Intrinsic World Equity Fund | | Special Mid Cap Value Fund |
Diversified Small Cap Fund | | Large Cap Core Fund | | Special Small Cap Value Fund |
Emerging Growth Fund | | Large Cap Growth Fund | | Specialized Technology Fund |
Emerging Markets Equity Fund | | Large Company Value Fund | | Strategic Large Cap Growth Fund |
Endeavor Select Fund† | | Omega Growth Fund | | Traditional Small Cap Growth Fund |
Enterprise Fund† | | Opportunity Fund† | | Utility and Telecommunications Fund |
| Bond Funds | | | | |
Adjustable Rate Government Fund | | Inflation-Protected Bond Fund | | Short-Term Bond Fund |
California Limited-Term Tax-Free Fund | | Intermediate Tax/AMT-Free Fund | | Short-Term High Yield Bond Fund |
California Tax-Free Fund | | International Bond Fund | | Short-Term Municipal Bond Fund |
Colorado Tax-Free Fund | | Minnesota Tax-Free Fund | | Strategic Municipal Bond Fund |
Government Securities Fund | | Municipal Bond Fund | | Total Return Bond Fund |
High Income Fund | | North Carolina Tax-Free Fund | | Ultra Short-Term Income Fund |
High Yield Bond Fund | | Pennsylvania Tax-Free Fund | | Ultra Short-Term Municipal Income Fund |
Income Plus Fund | | Short Duration Government Bond Fund | | Wisconsin Tax-Free Fund |
| Asset Allocation Funds | | | | |
Absolute Return Fund | | WealthBuilder Equity Portfolio† | | Target 2020 Fund† |
Asset Allocation Fund | | WealthBuilder Growth Allocation Portfolio† | | Target 2025 Fund† |
Conservative Allocation Fund | | WealthBuilder Growth Balanced Portfolio† | | Target 2030 Fund† |
Diversified Capital Builder Fund | | WealthBuilder Moderate Balanced Portfolio† | | Target 2035 Fund† |
Diversified Income Builder Fund | | WealthBuilder Tactical Equity Portfolio† | | Target 2040 Fund† |
Growth Balanced Fund | | Target Today Fund† | | Target 2045 Fund† |
Index Asset Allocation Fund | | Target 2010 Fund† | | Target 2050 Fund† |
Moderate Balanced Fund | | Target 2015 Fund† | | Target 2055 Fund† |
WealthBuilder Conservative Allocation Portfolio† | | | | |
| Money Market Funds | | | | |
100% Treasury Money Market Fund | | Heritage Money Market Fund† | | National Tax-Free Money Market Fund |
California Municipal Money Market Fund | | Money Market Fund | | Prime Investment Money Market Fund |
Cash Investment Money Market Fund | | Municipal Cash Management Money Market Fund | | Treasury Plus Money Market Fund |
Government Money Market Fund | | Municipal Money Market Fund | | |
| Variable Trust Funds1 | | | | |
VT Discovery Fund† | | VT Intrinsic Value Fund | | VT Small Cap Growth Fund |
VT Index Asset Allocation Fund | | VT Omega Growth Fund | | VT Small Cap Value Fund |
VT International Equity Fund | | VT Opportunity Fund† | | VT Total Return Bond Fund |
An investment in a money market fund is not insured or guaranteed by the Federal Deposit Insurance Corporation or any other government agency. Although the Wells Fargo Advantage Money Market Funds seek to preserve the value of your investment at $1.00 per share, it is possible to lose money by investing in a money market fund.
| 1. | The Variable Trust Funds are generally available only through insurance company variable contracts. |
| † | In this report, the Wells Fargo Advantage Discovery FundSM, Wells Fargo Advantage Endeavor Select FundSM, Wells Fargo Advantage Enterprise FundSM, Wells Fargo Advantage Opportunity FundSM, Wells Fargo Advantage WealthBuilder Conservative Allocation PortfolioSM, Wells Fargo Advantage WealthBuilder Equity PortfolioSM, Wells Fargo Advantage WealthBuilder Growth Allocation PortfolioSM, Wells Fargo Advantage WealthBuilder Growth Balanced PortfolioSM, Wells Fargo Advantage WealthBuilder Moderate Balanced PortfolioSM, Wells Fargo Advantage WealthBuilder Tactical Equity PortfolioSM, Wells Fargo Advantage Dow Jones Target Today FundSM, Wells Fargo Advantage Dow Jones Target 2010 FundSM, Wells Fargo Advantage Dow Jones Target 2015 FundSM, Wells Fargo Advantage Dow Jones Target 2020 FundSM, Wells Fargo Advantage Dow Jones Target 2025 FundSM, Wells Fargo Advantage Dow Jones Target 2030 FundSM, Wells Fargo Advantage Dow Jones Target 2035 FundSM, Wells Fargo Advantage Dow Jones Target 2040 FundSM, Wells Fargo Advantage Dow Jones Target 2045 FundSM, Wells Fargo Advantage Dow Jones Target 2050 FundSM, Wells Fargo Advantage Dow Jones Target 2055 FundSM, Wells Fargo Advantage Heritage Money Market FundSM, Wells Fargo Advantage VT Discovery FundSM, and Wells Fargo Advantage VT Opportunity FundSM are referred to as the Discovery Fund, Endeavor Select Fund, Enterprise Fund, Opportunity Fund, WealthBuilder Conservative Allocation Portfolio, WealthBuilder Equity Portfolio, WealthBuilder Growth Allocation Portfolio, WealthBuilder Growth Balanced Portfolio, WealthBuilder Moderate Balanced Portfolio, WealthBuilder Tactical Equity Portfolio, Target Today Fund, Target 2010 Fund, Target 2015 Fund, Target 2020 Fund, Target 2025 Fund, Target 2030 Fund, Target 2035 Fund, Target 2040 Fund, Target 2045 Fund, Target 2050 Fund, Target 2055 Fund, Heritage Money Market Fund, VT Discovery Fund, and VT Opportunity Fund, respectively. |
Not part of the semi-annual report.
| | | | |
| 2 | | Wells Fargo Advantage Income Plus Fund | | Letter to Shareholders |

Karla M. Rabusch,
President
Wells Fargo Advantage Funds
The theme for the period was a shift from risk aversion in the first half to burgeoning trends of improving investor confidence in the second half, which significantly improved pricing in the lower-rated asset classes.
On the whole, investment-grade fixed-income securities performed positively during the period, but the strongest returns came from the high-yield market.
Dear Valued Shareholder:
We are pleased to offer you this semi-annual report for the Wells Fargo Advantage Income Plus Fund, which covers the six-month period that ended February 29, 2012. During the period, fixed-income performance was best among the lower-rated securities, as improved investor confidence in the U.S. economy and the U.S. credit markets encouraged investors to return to riskier asset classes.
The period began with heightened risk aversion but ended with stronger investor confidence.
The six-month period began with the worsening of the Greek crisis, which amplified risk aversion across the global credit markets. This in turn led to a powerful rally in U.S. Treasuries and a sharp decline in high-yield bond prices, most notably in the lowest-quality credit tiers. During this time, most investment-grade fixed-income markets continued to generate positive returns—although certain areas of the riskiest segments of the markets declined—and U.S. Treasury yields reached the lowest levels in decades, even surpassing the low yield levels reached in the summer of 2010.
The last three months of the period were characterized by a strong reversal of the trends of the first three months. In October 2011, the high-yield market recovered significantly, benefiting from indications of improving policy with regard to managing the debt crisis from Europe and the formal announcement of a European debt deal late in the month. Due to renewed concerns about the European Union’s ability to manage the debt crisis, November 2011 saw a modest decline in investment-grade corporate bond prices and a sharp correction in high-yield corporate bonds, but another strong recovery in pricing started in December and carried into the first two months of 2012. Investor confidence strengthened as the U.S. economy demonstrated signs of sustainable growth and U.S. credit markets began to show some resistance to the credit problems of Europe. Thus, the theme for the period was a shift from risk aversion in the first half to burgeoning trends of improving investor confidence in the second half, which significantly improved pricing in the lower-rated asset classes.
On the whole, investment-grade fixed-income securities performed positively during the period, but the strongest returns came from the high-yield market. In fact, the best returns for the six-month period came from the lowest-rated credit tiers, despite the fact that they significantly underperformed in August and September 2011. Similar trends were true in the structured products sector, as lower-rated commercial mortgage-backed securities were among the best performers for the period, despite underperforming in the first two months.
The Federal Reserve launched Operation Twist in September.
With economic concerns and credit woes escalating in Europe and some continued uncertainty about the growth outlook in the U.S. during August and September 2011, the Federal Reserve (Fed) intervened yet again with monetary accommodations—this time with “Operation Twist,” which was announced and launched in September 2011. With Operation Twist, the Fed endeavored to flatten the yield curve and drive long-term rates down by selling short-term Treasuries and using the proceeds to purchase long-term Treasuries. The Fed stated that it is unlikely to raise rates before 2014, which should keep yields on Treasuries low. Despite this announcement, problems in Europe caused Treasuries to continue to rally in the first 3 months of the period, while credit spreads on corporate and
| | | | | | |
| Letter to Shareholders | | Wells Fargo Advantage Income Plus Fund | | | 3 | |
securitized sectors widened with increasing risk aversion. However, with an improved U.S. economic outlook and greater investor confidence, the last three months of the period saw a slight decline in U.S. Treasury prices and significant improvement in high-yield corporate bond prices. Credit spreads in the corporate and securitized sectors broadly tightened in December 2011 and January and February 2012.
Although U.S. economic conditions appear to have improved over the course of the period, the recovery continues to face some headwinds in the form of languishing housing values and elevated unemployment levels, which may continue to create some volatility in the fixed-income markets. While we cannot say definitively what near-term performance will look like, we continue to encourage investors to maintain fully diversified, actively managed portfolios, which may provide better protection from risk and added opportunities to capture relative value. While heightened volatility may be uncomfortable to experience in the short term, we believe it can lead to unique opportunities to add relative value for investors with long-term investment horizons.
Don’t let short-term uncertainty derail long-term investment goals.
Periods of uncertainty can present challenges, but experience has taught us that maintaining a long-term investment strategy based on individual goals and risk tolerance can be an effective way to plan for the future. To help you create a sound strategy based on your personal goals and risk tolerance, Wells Fargo Advantage Funds offers more than 110 mutual funds and other investments spanning a wide range of asset classes and investment styles. Although diversification cannot guarantee an investment profit or prevent losses, we believe it can be an effective way to manage investment risk and potentially smooth out overall portfolio performance.
In our opinion, diligent and earnest assessment of the fundamental risks in individual fixed-income securities will be a key differentiating factor between which investment strategies perform well and which do not. At Wells Fargo Advantage Funds, we intend to continue measuring relative-value opportunities in the fixed-income markets and across our lineup of funds. We believe it is particularly important to have diligent investment analysts in charge of investor assets in changing markets. As evidenced by the performance of fixed-income assets during the recent six-month period, heightened risks also often accompany such opportunities.
Thank you for choosing to invest with Wells Fargo Advantage Funds. We appreciate your confidence in us and remain committed to helping you meet your financial needs. For current information about your fund investments, contact your investment professional, visit our Web site at wellsfargoadvantagefunds.com, or call us directly at 1-800-222-8222. We are available 24 hours a day, 7 days a week.
Sincerely,

Karla M. Rabusch
President
Wells Fargo Advantage Funds
| | | | |
| 4 | | Wells Fargo Advantage Income Plus Fund | | Letter to Shareholders |
Notice to Shareholders
The Board of Trustees for Wells Fargo Advantage Funds has unanimously approved the following modifications to certain net asset value (NAV) waiver privileges and commission schedules:
| | n | | Effective May 1, 2012, automatic investment plan (AIP) purchases and proceeds received from systematic withdrawals will no longer qualify for NAV repurchase privileges. | |
| | n | | Effective May 1, 2012, discretionary rights to waive the upfront commission for Class C and “jumbo” Class A share purchases will no longer be granted to broker/dealers. However, we will continue to waive the Class C shares contingent deferred sales charge for redemptions by employer-sponsored retirement plans where the dealer of record waived its commission at the time of purchase. | |
| | n | | Effective July 31, 2012, NAV purchase privileges for former Evergreen Class IS and Class R shareholders are being modified to remove the ability to purchase Class A shares at NAV unless those shares are held directly with the Fund on or after July 31, 2012. | |
Please contact your investment professional or call us directly at 1-800-222-8222 if you have any questions on this Notice to Shareholders.
| | | | | | |
| Performance Highlights (Unaudited) | | Wells Fargo Advantage Income Plus Fund | | | 5 | |
INVESTMENT OBJECTIVE
The Fund seeks total return, consisting of income and capital appreciation.
ADVISER
Wells Fargo Funds Management, LLC
SUB-ADVISER
Wells Capital Management Incorporated
PORTFOLIO MANAGERS
Michael J. Bray, CFA
D. James Newton II, CFA, CPA
Thomas M. Price, CFA
Janet S. Rilling, CFA, CPA
FUND INCEPTION
July 13, 1998
| | | | |
TEN LARGEST LONG-TERM HOLDINGS1
(AS OF FEBRUARY 29, 2012) | | | |
U.S. Treasury Note, 0.50%, 08/15/2014 | | | 5.85% | |
FNMA, 4.00%, 03/15/2042 | | | 4.74% | |
U.S. Treasury Note, 2.25%, 07/31/2018 | | | 3.70% | |
FNMA, 4.50%, 03/15/2042 | | | 3.20% | |
U.S. Treasury Note, 1.25%, 04/15/2014 | | | 2.97% | |
U.S. Treasury Note, 1.00%, 10/31/2016 | | | 2.96% | |
FHLMC, 3.50%, 03/15/2042 | | | 2.71% | |
U.S. Treasury Bond, 4.25%, 11/15/2040 | | | 2.71% | |
U.S. Treasury Bond, 6.25%, 08/15/2023 | | | 2.25% | |
FNMA, 5.00%, 08/01/2040 | | | 2.04% | |
| | |
CREDIT QUALITY2
(AS OF FEBRUARY 29, 2012) | | |
|
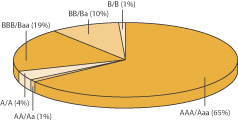 |
| 1. | The ten largest long-term holdings are calculated based on the value of the securities divided by total net assets of the Fund. Holdings are subject to change and may have changed since the date specified. |
| 2. | The ratings indicated are from Standard & Poor’s, Moody’s Investors Service, and/or Fitch Ratings Ltd. Credit Quality Ratings: Credit quality ratings apply to underlying holdings of the Fund and not the Fund itself. Standard & Poor’s rates the creditworthiness of bonds, ranging from AAA (highest) to D (lowest). Ratings from A to CCC may be modified by the addition of a plus (+) or minus (–) sign to show relative standing within the rating categories. Standard & Poor’s rates the creditworthiness of short-term notes from SP-1 (highest) to SP-3 (lowest). Moody’s rates the creditworthiness of bonds, ranging from Aaa (highest) to C (lowest). Ratings Aa to B may be modified by the addition of a number 1 (highest) to 3 (lowest) to show relative standing within the ratings categories. Moody’s rates the creditworthiness of short-term U.S. tax-exempt municipal securities from MIG 1/VMIG 1 (highest) to SG (lowest). Fitch rates the creditworthiness of bonds, ranging from AAA (highest) to D (lowest). If a security was rated by all three rating agencies, the middle rating was utilized. If rated by two of three rating agencies, the lower rating was utilized and if rated by one of the agencies that rating was utilized. Credit quality is subject to change and is calculated based on the total investments of the Fund. |
| | | | |
| 6 | | Wells Fargo Advantage Income Plus Fund | | Performance Highlights (Unaudited) |
AVERAGE ANNUAL TOTAL RETURN3 (%) (AS OF FEBRUARY 29, 2012)
| | | | | | | | | | | | | | | | | | | | | | | | | | | | | | | | | | | | | | | | | | | | |
| | | | | | Including Sales Charge | | | Excluding Sales Charge | | | Expense Ratios4 | |
| | | Inception Date | | | 6 Months* | | | 1 Year | | | 5 Year | | | 10 Year | | | 6 Months* | | | 1 Year | | | 5 Year | | | 10 Year | | | Gross | | | Net5 | |
Class A (STYAX) | | | 07/13/1998 | | | | (1.01 | ) | | | 3.76 | | | | 6.13 | | | | 6.05 | | | | 3.68 | | | | 8.64 | | | | 7.12 | | | | 6.55 | | | | 0.89% | | | | 0.89% | |
Class B (STYBX)** | | | 07/13/1998 | | | | (1.64 | ) | | | 2.82 | | | | 6.01 | | | | 5.97 | | | | 3.36 | | | | 7.82 | | | | 6.32 | | | | 5.97 | | | | 1.64% | | | | 1.64% | |
Class C (WFIPX) | | | 07/13/1998 | | | | 2.38 | | | | 6.86 | | | | 6.33 | | | | 5.76 | | | | 3.38 | | | | 7.86 | | | | 6.33 | | | | 5.76 | | | | 1.64% | | | | 1.64% | |
Administrator Class (WIPDX) | | | 07/30/2010 | | | | | | | | | | | | | | | | | | | | 3.84 | | | | 8.87 | | | | 7.19 | | | | 6.51 | | | | 0.83% | | | | 0.74% | |
Institutional Class (WIPIX) | | | 07/18/2008 | | | | | | | | | | | | | | | | | | | | 3.93 | | | | 9.02 | | | | 7.36 | | | | 6.67 | | | | 0.56% | | | | 0.56% | |
Investor Class (WIPNX) | | | 07/18/2008 | | | | | | | | | | | | | | | | | | | | 3.75 | | | | 8.65 | | | | 7.10 | | | | 6.54 | | | | 0.92% | | | | 0.92% | |
Barclays U.S. Universal Bond Index6 | | | | | | | | | | | | | | | | | | | | | | | 3.08 | | | | 8.22 | | | | 6.34 | | | | 5.96 | | | | | | | | | |
| * | Returns for periods of less than one year are not annualized. |
| ** | Class B shares are closed to investment, except in connection with the reinvestment of any distributions and permitted exchanges. |
Figures quoted represent past performance, which is no guarantee of future results and do not reflect the deduction of taxes that a shareholder may pay on fund distributions or the redemption of fund shares. Investment return and principal value of an investment will fluctuate so that an investor’s shares, when redeemed, may be worth more or less than their original cost. Performance shown without sales charges would be lower if sales charges were reflected. Current performance may be lower or higher than the performance data quoted and assumes the reinvestment of dividends and capital gains. Current month-end performance is available on the Fund’s Web site – wellsfargoadvantagefunds.com.
Index returns do not include transaction costs associated with buying and selling securities, any mutual fund fees or expenses or any taxes. It is not possible to invest directly in an index.
For Class A shares, the maximum front-end sales charge is 4.50%. For Class B shares, the maximum contingent deferred sales charge is 5.00%. For Class C shares, the maximum contingent deferred sales charge is 1.00%. Performance including sales charge assumes the sales charge for the corresponding time period. Administrator Class, Institutional Class and Investor Class shares are sold without a front-end sales charge or contingent deferred sales charge.
Bond fund values fluctuate in response to the financial condition of individual issuers, general market and economic conditions, and changes in interest rates. In general, when interest rates rise, bond fund values fall and investors may lose principal value. The use of derivatives may reduce returns and/or increase volatility. Certain investment strategies tend to increase the total risk of an investment (relative to the broader market). This Fund is exposed to foreign investment risk, high-yield securities risk, and mortgage and asset-backed securities risk. Consult the Fund’s prospectus for additional information on these and other risks.
| 3. | Historical performance shown for the Administrator Class shares prior to their inception reflects the performance of the Institutional Class shares and has been adjusted to include the higher expenses applicable to the Administrator Class shares. Historical performance shown for the Investor Class shares prior to their inception reflects the performance of the Class A shares and has been adjusted to include the higher expenses applicable to the Investor Class shares. Historical performance shown for the Institutional Class shares prior to their inception reflects the performance of the Class A shares and includes the higher expenses applicable to the Class A shares. If these expenses had not been included, returns would be higher. |
| 4. | Reflects the expense ratios as stated in the most recent prospectuses. |
| 5. | The Adviser has committed through July 11, 2013 to waive fees and/or reimburse expenses to the extent necessary to cap the Fund’s Total Annual Fund Operating Expenses After Fee Waiver, excluding certain expenses, at 0.87% for Class A, 1.62% for Class B, 1.62% for Class C, 0.72% for Administrator Class, 0.58% for Institutional Class and 0.90% for Investor Class. Without this cap, the Fund’s returns would have been lower. |
| 6. | The Barclays U.S. Universal Bond Index is an unmanaged market value-weighted performance benchmark for the U.S. dollar denominated bond market, which includes investment-grade, high yield, and emerging market debt securities with maturities of one year or more. You cannot invest directly in an index. |
| | | | | | |
| Fund Expenses (Unaudited) | | Wells Fargo Advantage Income Plus Fund | | | 7 | |
As a shareholder of the Fund, you incur two types of costs: (1) transaction costs, including sales charges (loads) on purchase payments and contingent deferred sales charges (if any) on redemptions and (2) ongoing costs, including management fees; distribution (12b-1) and/or shareholder service fees; and other Fund expenses. This example is intended to help you understand your ongoing costs (in dollars) of investing in the Fund and to compare these costs with the ongoing costs of investing in other mutual funds.
The example is based on an investment of $1,000 invested at the beginning of the six-month period and held for the entire period from September 1, 2011 to February 29, 2012.
Actual Expenses
The “Actual” line of the table below provides information about actual account values and actual expenses. You may use the information in this line, together with the amount you invested, to estimate the expenses that you paid over the period. Simply divide your account value by $1,000 (for example, an $8,600 account value divided by $1,000 = 8.6), then multiply the result by the number in the “Actual” line under the heading entitled “Expenses Paid During Period” for your applicable class of shares to estimate the expenses you paid on your account during this period.
Hypothetical Example for Comparison Purposes
The “Hypothetical” line of the table below provides information about hypothetical account values and hypothetical expenses based on the Fund’s actual expense ratio and an assumed rate of return of 5% per year before expenses, which is not the Fund’s actual return. The hypothetical account values and expenses may not be used to estimate the actual ending account balance or expenses you paid for the period. You may use this information to compare the ongoing costs of investing in the Fund and other funds. To do so, compare this 5% hypothetical example with the 5% hypothetical examples that appear in the shareholder reports of the other funds.
Please note that the expenses shown in the table are meant to highlight your ongoing costs only and do not reflect any transactional costs, such as sales charges (loads) and contingent deferred sales charges. Therefore, the “Hypothetical” line of the table is useful in comparing ongoing costs only, and will not help you determine the relative total costs of owning different funds. In addition, if these transactional costs were included, your costs would have been higher.
| | | | | | | | | | | | | | | | |
| | | Beginning
Account Value
09-01-2011 | | | Ending
Account Value
02-29-2012 | | | Expenses
Paid During
the Period1 | | | Net Annual
Expense Ratio | |
Class A | | | | | | | | | | | | | | | | |
Actual | | $ | 1,000.00 | | | $ | 1,036.76 | | | $ | 4.46 | | | | 0.88 | % |
Hypothetical (5% return before expenses) | | $ | 1,000.00 | | | $ | 1,020.49 | | | $ | 4.42 | | | | 0.88 | % |
Class B | | | | | | | | | | | | | | | | |
Actual | | $ | 1,000.00 | | | $ | 1,033.58 | | | $ | 8.24 | | | | 1.63 | % |
Hypothetical (5% return before expenses) | | $ | 1,000.00 | | | $ | 1,016.76 | | | $ | 8.17 | | | | 1.63 | % |
Class C | | | | | | | | | | | | | | | | |
Actual | | $ | 1,000.00 | | | $ | 1,033.82 | | | $ | 8.24 | | | | 1.63 | % |
Hypothetical (5% return before expenses) | | $ | 1,000.00 | | | $ | 1,016.76 | | | $ | 8.17 | | | | 1.63 | % |
Administrator Class | | | | | | | | | | | | | | | | |
Actual | | $ | 1,000.00 | | | $ | 1,038.44 | | | $ | 3.75 | | | | 0.74 | % |
Hypothetical (5% return before expenses) | | $ | 1,000.00 | | | $ | 1,021.18 | | | $ | 3.72 | | | | 0.74 | % |
Institutional Class | | | | | | | | | | | | | | | | |
Actual | | $ | 1,000.00 | | | $ | 1,039.30 | | | $ | 2.84 | | | | 0.56 | % |
Hypothetical (5% return before expenses) | | $ | 1,000.00 | | | $ | 1,022.08 | | | $ | 2.82 | | | | 0.56 | % |
Investor Class | | | | | | | | | | | | | | | | |
Actual | | $ | 1,000.00 | | | $ | 1,037.50 | | | $ | 4.56 | | | | 0.90 | % |
Hypothetical (5% return before expenses) | | $ | 1,000.00 | | | $ | 1,020.39 | | | $ | 4.52 | | | | 0.90 | % |
| 1. | Expenses paid is equal to the annualized expense ratio of each class multiplied by the average account value over the period, multiplied by the number of days in the most recent fiscal half-year divided by the number of days in the fiscal year (to reflect the one-half year period). |
| | | | |
| 8 | | Wells Fargo Advantage Income Plus Fund | | Portfolio of Investments—February 29, 2012 (Unaudited) |
| | | | | | | | | | | | | | | | |
| Security Name | | Interest Rate | | | Maturity Date | | | Principal | | | Value | |
| | | | | | | | | | | | | | | | |
| | | | |
| Agency Securities: 31.05% | | | | | | | | | | | | | | | | |
FHLMC ± | | | 2.21 | % | | | 01/01/2036 | | | $ | 114,259 | | | $ | 120,054 | |
FHLMC %% | | | 3.50 | | | | 03/15/2042 | | | | 18,565,000 | | | | 19,159,414 | |
FHLMC %% | | | 4.00 | | | | 03/15/2042 | | | | 6,310,000 | | | | 6,618,598 | |
FHLMC | | | 5.00 | | | | 08/01/2040 | | | | 1,366,778 | | | | 1,473,131 | |
FHLMC %% | | | 5.00 | | | | 03/15/2042 | | | | 1,900,000 | | | | 2,045,766 | |
FHLMC | | | 5.50 | | | | 11/01/2023 | | | | 457,404 | | | | 498,004 | |
FHLMC | | | 5.50 | | | | 09/01/2038 | | | | 10,085,111 | | | | 10,956,977 | |
FHLMC | | | 5.50 | | | | 06/01/2040 | | | | 3,013,638 | | | | 3,274,169 | |
FHLMC | | | 7.50 | | | | 05/01/2038 | | | | 36,606 | | | | 44,334 | |
FHLMC | | | 8.00 | | | | 02/01/2030 | | | | 982 | | | | 1,198 | |
FHLMC | | | 14.00 | | | | 09/01/2012 | | | | 39 | | | | 38 | |
FHLMC Series 2736 Class BC | | | 5.00 | | | | 12/15/2029 | | | | 193,855 | | | | 194,816 | |
FHLMC Series M009 Class A ± | | | 5.40 | | | | 10/15/2021 | | | | 1,056,377 | | | | 1,137,253 | |
FHLMC Series T-42 Class A5 | | | 7.50 | | | | 02/25/2042 | | | | 3,176,954 | | | | 3,824,611 | |
FHLMC Structured Pass-Through Securities Series T-57 Class 2A1 ± | | | 3.53 | | | | 07/25/2043 | | | | 99,178 | | | | 101,244 | |
FHLMC Structured Pass-Through Securities Series T-59 Class 2A1 ± | | | 3.18 | | | | 10/25/2043 | | | | 89,365 | | | | 90,885 | |
FNMA ± | | | 2.40 | | | | 01/01/2036 | | | | 331,937 | | | | 348,852 | |
FNMA ± | | | 2.48 | | | | 09/01/2036 | | | | 100,389 | | | | 106,858 | |
FNMA ± | | | 2.51 | | | | 08/01/2036 | | | | 142,021 | | | | 151,149 | |
FNMA | | | 3.50 | | | | 02/01/2026 | | | | 3,331,447 | | | | 3,497,127 | |
FNMA %% | | | 3.50 | | | | 03/15/2027 | | | | 2,875,000 | | | | 3,015,156 | |
FNMA | | | 4.00 | | | | 09/01/2024 | | | | 354,924 | | | | 376,013 | |
FNMA %% | | | 4.00 | | | | 03/15/2042 | | | | 31,835,000 | | | | 33,501,365 | |
FNMA %% | | | 4.00 | | | | 03/15/2027 | | | | 2,600,000 | | | | 2,752,750 | |
FNMA | | | 4.26 | | | | 04/01/2021 | | | | 2,969,795 | | | | 3,319,518 | |
FNMA | | | 4.39 | | | | 01/01/2020 | | | | 1,603,865 | | | | 1,799,973 | |
FNMA | | | 4.46 | | | | 05/01/2020 | | | | 1,928,793 | | | | 2,174,632 | |
FNMA %% | | | 4.50 | | | | 03/15/2042 | | | | 21,225,000 | | | | 22,621,206 | |
FNMA %% | | | 4.50 | | | | 03/15/2027 | | | | 3,240,000 | | | | 3,467,306 | |
FNMA | | | 5.00 | | | | 01/01/2024 | | | | 937,088 | | | | 1,011,511 | |
FNMA | | | 5.00 | | | | 02/01/2036 | | | | 213,534 | | | | 230,855 | |
FNMA | | | 5.00 | | | | 06/01/2040 | | | | 4,973,898 | | | | 5,375,030 | |
FNMA | | | 5.00 | | | | 08/01/2040 | | | | 13,322,228 | | | | 14,396,631 | |
FNMA %% | | | 5.00 | | | | 03/15/2027 | | | | 3,416,000 | | | | 3,688,746 | |
FNMA | | | 5.50 | | | | 08/01/2034 | | | | 664,118 | | | | 725,786 | |
FNMA | | | 5.50 | | | | 02/01/2035 | | | | 206,733 | | | | 225,929 | |
FNMA | | | 5.50 | | | | 08/01/2038 | | | | 2,366,206 | | | | 2,602,193 | |
FNMA | | | 5.50 | | | | 08/01/2038 | | | | 3,408,707 | | | | 3,745,363 | |
FNMA %% | | | 5.50 | | | | 03/15/2027 | | | | 720,000 | | | | 783,112 | |
FNMA | | | 5.97 | | | | 03/01/2012 | | | | 158,060 | | | | 159,127 | |
FNMA | | | 6.00 | | | | 10/01/2037 | | | | 4,474,742 | | | | 4,929,308 | |
FNMA | | | 6.00 | | | | 11/01/2037 | | | | 392,531 | | | | 432,406 | |
FNMA | | | 6.00 | | | | 08/01/2038 | | | | 548,803 | | | | 604,553 | |
FNMA %% | | | 6.00 | | | | 03/15/2042 | | | | 7,665,000 | | | | 8,432,697 | |
FNMA | | | 6.50 | | | | 07/01/2036 | | | | 167,812 | | | | 190,391 | |
FNMA | | | 6.50 | | | | 07/01/2036 | | | | 96,287 | | | | 109,243 | |
FNMA | | | 6.50 | | | | 11/01/2036 | | | | 57,624 | | | | 65,233 | |
FNMA | | | 6.50 | | | | 07/01/2037 | | | | 5,252,752 | | | | 5,938,190 | |
FNMA | | | 7.00 | | | | 03/01/2024 | | | | 3,066,240 | | | | 3,281,776 | |
FNMA | | | 7.00 | | | | 07/01/2036 | | | | 55,075 | | | | 63,812 | |
The accompanying notes are an integral part of these financial statements.
| | | | | | |
| Portfolio of Investments—February 29, 2012 (Unaudited) | | Wells Fargo Advantage Income Plus Fund | | | 9 | |
| | | | | | | | | | | | | | | | |
| Security Name | | Interest Rate | | | Maturity Date | | | Principal | | | Value | |
| | | | | | | | | | | | | | | | |
| | | | |
| Agency Securities (continued) | | | | | | | | | | | | | | | | |
FNMA | | | 7.00 | % | | | 11/01/2037 | | | $ | 107,599 | | | $ | 121,595 | |
FNMA | | | 7.50 | | | | 05/01/2038 | | | | 12,390 | | | | 13,730 | |
FNMA | | | 7.87 | | | | 07/01/2026 | | | | 2,706,285 | | | | 2,933,538 | |
FNMA Grantor Trust Series 2002-T12 Class A3 | | | 7.50 | | | | 05/25/2042 | | | | 12,503 | | | | 14,787 | |
FNMA Series 2003-W14 Class 2A ± | | | 2.52 | | | | 06/25/2035 | | | | 255,848 | | | | 267,841 | |
FNMA Series 2003-W14 Class 2A ± | | | 3.62 | | | | 01/25/2043 | | | | 137,069 | | | | 145,250 | |
FNMA Series 2004-7 Class AE | | | 5.00 | | | | 12/25/2030 | | | | 265,448 | | | | 267,521 | |
FNMA Whole Loan Series 2003-W8 Class 4A ± | | | 3.31 | | | | 11/25/2042 | | | | 269,756 | | | | 285,931 | |
FNMA Whole Loan Series 2004-W11 Class 1A3 | | | 7.00 | | | | 05/25/2044 | | | | 2,972,601 | | | | 3,355,952 | |
FNMA Whole Loan Series 2004-W15 Class 1A3 | | | 7.00 | | | | 08/25/2044 | | | | 2,311,286 | | | | 2,685,564 | |
GNMA %% | | | 4.00 | | | | 03/15/2042 | | | | 4,225,000 | | | | 4,549,797 | |
GNMA %% | | | 4.50 | | | | 03/15/2042 | | | | 7,130,000 | | | | 7,771,701 | |
GNMA | | | 5.00 | | | | 07/20/2040 | | | | 3,818,010 | | | | 4,213,908 | |
GNMA | | | 7.50 | | | | 12/15/2029 | | | | 1,340 | | | | 1,609 | |
GNMA Series 2005-90 Class A | | | 3.76 | | | | 09/16/2028 | | | | 1,750,691 | | | | 1,791,297 | |
GNMA Series 2007-12 Class A | | | 3.96 | | | | 06/16/2031 | | | | 1,007,327 | | | | 1,032,638 | |
GNMA Series 2007-12 Class C ± | | | 5.28 | | | | 04/16/2041 | | | | 485,000 | | | | 532,126 | |
GNMA Series 2008-22 Class XM ±(c) | | | 1.20 | | | | 02/16/2050 | | | | 14,693,527 | | | | 548,509 | |
GNMA Series 2008-86 Class D | | | 5.46 | | | | 04/16/2040 | | | | 4,365,000 | | | | 5,126,500 | |
| | | | |
Total Agency Securities (Cost $214,013,625) | | | | | | | | | | | | | | | 219,324,083 | |
| | | | | | | | | | | | | | | | |
| | | | |
| Asset-Backed Securities: 0.92% | | | | | | | | | | | | | | | | |
Chase Issuance Trust Series 2005-A6 Class A6 ± | | | 0.32 | | | | 07/15/2014 | | | | 430,000 | | | | 430,117 | |
Citibank Credit Card Issuance Trust Series 2005-C1 Class C1 | | | 5.50 | | | | 03/24/2017 | | | | 285,000 | | | | 315,086 | |
Countrywide Asset Backed Certificates Series 2004-S1 Class A3 | | | 4.62 | | | | 02/25/2035 | | | | 709,563 | | | | 670,256 | |
CVS Pass-Through Trust Series T | | | 6.04 | | | | 12/10/2028 | | | | 2,371,105 | | | | 2,613,906 | |
Discover Card Master Trust Series 2008-A4 Class A4 | | | 5.65 | | | | 12/15/2015 | | | | 2,345,000 | | | | 2,500,678 | |
| | | | |
Total Asset-Backed Securities (Cost $6,060,859) | | | | | | | | | | | | | | | 6,530,043 | |
| | | | | | | | | | | | | | | | |
| | | | |
Corporate Bonds and Notes: 25.88% | | | | | | | | | | | | | | | | |
| | | | |
Consumer Discretionary: 5.13% | | | | | | | | | | | | | | | | |
| | | | |
| Auto Components: 0.46% | | | | | | | | | | | | | | | | |
Delphi Corporation 144A | | | 6.13 | | | | 05/15/2021 | | | | 2,000,000 | | | | 2,145,000 | |
TRW Automotive Incorporated 144A | | | 7.25 | | | | 03/15/2017 | | | | 1,000,000 | | | | 1,112,500 | |
| | | | |
| | | | | | | | | | | | | | | 3,257,500 | |
| | | | | | | | | | | | | | | | |
| | | | |
| Automobiles: 0.37% | | | | | | | | | | | | | | | | |
Ford Motor Company | | | 7.45 | | | | 07/16/2031 | | | | 2,000,000 | | | | 2,567,500 | |
| | | | | | | | | | | | | | | | |
| | | | |
| Hotels, Restaurants & Leisure: 0.76% | | | | | | | | | | | | | | | | |
Agua Caliente Band of Cahuilla Indians 144A(i) | | | 6.44 | | | | 10/01/2016 | | | | 682,000 | | | | 613,841 | |
Darden Restaurants Incorporated | | | 6.80 | | | | 10/15/2037 | | | | 2,490,000 | | | | 2,858,251 | |
Seminole Tribe of Florida 144A | | | 7.75 | | | | 10/01/2017 | | | | 1,750,000 | | | | 1,898,750 | |
| | | | |
| | | | | | | | | | | | | | | 5,370,842 | |
| | | | | | | | | | | | | | | | |
| | | | |
| Internet & Catalog Retail: 0.43% | | | | | | | | | | | | | | | | |
Expedia Incorporated | | | 5.95 | | | | 08/15/2020 | | | | 2,985,000 | | | | 3,048,181 | |
| | | | | | | | | | | | | | | | |
The accompanying notes are an integral part of these financial statements.
| | | | |
| 10 | | Wells Fargo Advantage Income Plus Fund | | Portfolio of Investments—February 29, 2012 (Unaudited) |
| | | | | | | | | | | | | | | | |
| Security Name | | Interest Rate | | | Maturity Date | | | Principal | | | Value | |
| | | | | | | | | | | | | | | | |
| | | | |
| Media: 1.85% | | | | | | | | | | | | | | | | |
CBS Corporation | | | 7.88 | % | | | 07/30/2030 | | | $ | 2,210,000 | | | $ | 2,937,941 | |
CCO Holdings LLC | | | 8.13 | | | | 04/30/2020 | | | | 2,000,000 | | | | 2,240,000 | |
CSC Holdings LLC | | | 7.88 | | | | 02/15/2018 | | | | 1,000,000 | | | | 1,130,000 | |
DISH DBS Corporation | | | 7.88 | | | | 09/01/2019 | | | | 2,000,000 | | | | 2,350,000 | |
News America Incorporated | | | 7.85 | | | | 03/01/2039 | | | | 2,765,000 | | | | 3,490,788 | |
Vivendi SA 144A | | | 6.63 | | | | 04/04/2018 | | | | 800,000 | | | | 904,402 | |
| | | | |
| | | | | | | | | | | | | | | 13,053,131 | |
| | | | | | | | | | | | | | | | |
| | | | |
| Multiline Retail: 0.29% | | | | | | | | | | | | | | | | |
Macy’s Retail Holdings Incorporated | | | 6.65 | | | | 07/15/2024 | | | | 1,750,000 | | | | 2,043,549 | |
| | | | | | | | | | | | | | | | |
| | | | |
| Specialty Retail: 0.97% | | | | | | | | | | | | | | | | |
Advance Auto Parts Incorporated | | | 5.75 | | | | 05/01/2020 | | | | 2,000,000 | | | | 2,266,544 | |
Best Buy Company Incorporated | | | 6.75 | | | | 07/15/2013 | | | | 2,273,000 | | | | 2,404,507 | |
Limited Brands Incorporated | | | 6.63 | | | | 04/01/2021 | | | | 2,000,000 | | | | 2,200,000 | |
| | | | |
| | | | | | | | | | | | | | | 6,871,051 | |
| | | | | | | | | | | | | | | | |
| | | | |
Consumer Staples: 1.43% | | | | | | | | | | | | | | | | |
| | | | |
| Beverages: 0.32% | | | | | | | | | | | | | | | | |
Constellation Brands Incorporated | | | 7.25 | | | | 09/01/2016 | | | | 2,000,000 | | | | 2,260,000 | |
| | | | | | | | | | | | | | | | |
| | | | |
| Food Products: 0.75% | | | | | | | | | | | | | | | | |
H.J. Heinz Finance Company 144A | | | 7.13 | | | | 08/01/2039 | | | | 2,350,000 | | | | 3,092,701 | |
TreeHouse Foods Incorporated | | | 7.75 | | | | 03/01/2018 | | | | 2,000,000 | | | | 2,190,000 | |
| | | | |
| | | | | | | | | | | | | | | 5,282,701 | |
| | | | | | | | | | | | | | | | |
| | | | |
| Tobacco: 0.36% | | | | | | | | | | | | | | | | |
Lorillard Incorporated | | | 8.13 | | | | 06/23/2019 | | | | 1,185,000 | | | | 1,483,093 | |
Reynolds Group Holdings 144A | | | 7.88 | | | | 08/15/2019 | | | | 1,000,000 | | | | 1,095,000 | |
| | | | |
| | | | | | | | | | | | | | | 2,578,093 | |
| | | | | | | | | | | | | | | | |
| | | | |
Energy: 3.11% | | | | | | | | | | | | | | | | |
| | | | |
| Oil, Gas & Consumable Fuels: 3.11% | | | | | | | | | | | | | | | | |
Bill Barrett Corporation | | | 7.63 | | | | 10/01/2019 | | | | 400,000 | | | | 418,000 | |
Chesapeake Energy Corporation 144A | | | 6.63 | | | | 11/15/2019 | | | | 2,000,000 | | | | 2,040,000 | |
Consol Energy Incorporated | | | 8.25 | | | | 04/01/2020 | | | | 2,000,000 | | | | 2,180,000 | |
El Paso Pipeline Partners Operating LLC | | | 5.00 | | | | 10/01/2021 | | | | 2,000,000 | | | | 2,087,920 | |
Energy Transfer Equity LP | | | 7.50 | | | | 10/15/2020 | | | | 1,750,000 | | | | 2,003,750 | |
Energy Transfer Partners LP | | | 6.50 | | | | 02/01/2042 | | | | 3,000,000 | | | | 3,323,907 | |
Newfield Exploration Company | | | 6.88 | | | | 02/01/2020 | | | | 1,750,000 | | | | 1,890,000 | |
Petrobras International Finance Company | | | 6.75 | | | | 01/27/2041 | | | | 2,000,000 | | | | 2,319,318 | |
Suburban Propane Partners LP | | | 7.38 | | | | 03/15/2020 | | | | 1,750,000 | | | | 1,863,750 | |
Tesoro Corporation | | | 9.75 | | | | 06/01/2019 | | | | 2,000,000 | | | | 2,275,000 | |
Texas Eastern Transmission LP | | | 7.00 | | | | 07/15/2032 | | | | 1,250,000 | | | | 1,558,645 | |
| | | | |
| | | | | | | | | | | | | | | 21,960,290 | |
| | | | | | | | | | | | | | | | |
| | | | |
Financials: 7.62% | | | | | | | | | | | | | | | | |
| | | | |
| Capital Markets: 0.39% | | | | | | | | | | | | | | | | |
Alterra Finance LLC | | | 6.25 | | | | 09/30/2020 | | | | 2,610,000 | | | | 2,747,490 | |
| | | | | | | | | | | | | | | | |
The accompanying notes are an integral part of these financial statements.
| | | | | | |
| Portfolio of Investments—February 29, 2012 (Unaudited) | | Wells Fargo Advantage Income Plus Fund | | | 11 | |
| | | | | | | | | | | | | | | | |
| Security Name | | Interest Rate | | | Maturity Date | | | Principal | | | Value | |
| | | | | | | | | | | | | | | | |
| | | | |
| Commercial Banks: 1.90% | | | | | | | | | | | | | | | | |
Australia and New Zealand Banking Group Limited 144A | | | 2.40 | % | | | 11/23/2016 | | | $ | 3,320,000 | | | $ | 3,343,891 | |
Banco Santander Brasil SA 144A | | | 4.63 | | | | 02/13/2017 | | | | 2,110,000 | | | | 2,101,560 | |
Fifth Third Bancorp | | | 6.25 | | | | 05/01/2013 | | | | 2,245,000 | | | | 2,370,632 | |
Key Bank NA | | | 4.95 | | | | 09/15/2015 | | | | 2,180,000 | | | | 2,335,020 | |
PNC Financial Services Group Incorporated ± | | | 8.25 | | | | 12/31/2049 | | | | 1,415,000 | | | | 1,456,915 | |
Regions Bank | | | 7.50 | | | | 05/15/2018 | | | | 1,650,000 | | | | 1,798,500 | |
| | | | |
| | | | | | | | | | | | | | | 13,406,518 | |
| | | | | | | | | | | | | | | | |
| | | | |
| Consumer Finance: 1.13% | | | | | | | | | | | | | | | | |
Discover Financial Services | | | 10.25 | | | | 07/15/2019 | | | | 2,380,000 | | | | 3,034,719 | |
International Lease Finance Corporation | | | 8.25 | | | | 12/15/2020 | | | | 2,000,000 | | | | 2,229,458 | |
SLM Corporation | | | 8.00 | | | | 03/25/2020 | | | | 2,485,000 | | | | 2,733,500 | |
| | | | |
| | | | | | | | | | | | | | | 7,997,677 | |
| | | | | | | | | | | | | | | | |
| | | | |
| Diversified Financial Services: 1.77% | | | | | | | | | | | | | | | | |
Bank of America Corporation | | | 6.50 | | | | 08/01/2016 | | | | 2,795,000 | | | | 3,021,563 | |
Citigroup Incorporated | | | 5.38 | | | | 08/09/2020 | | | | 2,535,000 | | | | 2,759,322 | |
Citigroup Incorporated | | | 5.88 | | | | 01/30/2042 | | | | 1,890,000 | | | | 2,009,172 | |
JPMorgan Chase & Company Series 1 ± | | | 7.90 | | | | 12/31/2049 | | | | 1,750,000 | | | | 1,903,790 | |
Moody’s Corporation | | | 5.50 | | | | 09/01/2020 | | | | 2,630,000 | | | | 2,798,396 | |
| | | | |
| | | | | | | | | | | | | | | 12,492,243 | |
| | | | | | | | | | | | | | | | |
| | | | |
| Insurance: 2.06% | | | | | | | | | | | | | | | | |
Liberty Mutual Group 144A | | | 6.70 | | | | 08/15/2016 | | | | 2,220,000 | | | | 2,436,028 | |
National Life Insurance Company of Vermont 144A | | | 10.50 | | | | 09/15/2039 | | | | 1,600,000 | | | | 2,065,202 | |
Platinum Underwriters Finance Incorporated Series B | | | 7.50 | | | | 06/01/2017 | | | | 2,100,000 | | | | 2,261,784 | |
Protective Life Corporation | | | 8.45 | | | | 10/15/2039 | | | | 2,500,000 | | | | 2,941,798 | |
Prudential Financial Incorporated ± | | | 8.88 | | | | 06/15/2038 | | | | 2,000,000 | | | | 2,390,000 | |
Torchmark Corporation | | | 9.25 | | | | 06/15/2019 | | | | 1,945,000 | | | | 2,446,440 | |
| | | | |
| | | | | | | | | | | | | | | 14,541,252 | |
| | | | | | | | | | | | | | | | |
| | | | |
| REITs: 0.37% | | | | | | | | | | | | | | | | |
Dexus Property Group 144A | | | 7.13 | | | | 10/15/2014 | | | | 2,435,000 | | | | 2,621,687 | |
| | | | | | | | | | | | | | | | |
| | | | |
Health Care: 1.30% | | | | | | | | | | | | | | | | |
| | | | |
| Health Care Equipment & Supplies: 0.24% | | | | | | | | | | | | | | | | |
Fresenius Medical Care Holdings Incorporated | | | 6.88 | | | | 07/15/2017 | | | | 1,500,000 | | | | 1,665,000 | |
| | | | | | | | | | | | | | | | |
| | | | |
| Health Care Providers & Services: 0.81% | | | | | | | | | | | | | | | | |
Cigna Corporation | | | 5.38 | | | | 02/15/2042 | | | | 1,855,000 | | | | 1,993,045 | |
HCA Incorporated | | | 6.50 | | | | 02/15/2020 | | | | 1,750,000 | | | | 1,876,875 | |
Lifepoint Hospitals Incorporated | | | 6.63 | | | | 10/01/2020 | | | | 1,750,000 | | | | 1,881,250 | |
| | | | |
| | | | | | | | | | | | | | | 5,751,170 | |
| | | | | | | | | | | | | | | | |
| | | | |
| Pharmaceuticals: 0.25% | | | | | | | | | | | | | | | | |
Aristotle Holding Incorporated 144A | | | 2.10 | | | | 02/12/2015 | | | | 1,725,000 | | | | 1,738,836 | |
| | | | | | | | | | | | | | | | |
The accompanying notes are an integral part of these financial statements.
| | | | |
| 12 | | Wells Fargo Advantage Income Plus Fund | | Portfolio of Investments—February 29, 2012 (Unaudited) |
| | | | | | | | | | | | | | | | |
| Security Name | | Interest Rate | | | Maturity Date | | | Principal | | | Value | |
| | | | | | | | | | | | | | | | |
| | | | |
Industrials: 2.86% | | | | | | | | | | | | | | | | |
| | | | |
| Aerospace & Defense: 0.30% | | | | | | | | | | | | | | | | |
Esterline Technologies Corporation | | | 7.00 | % | | | 08/01/2020 | | | $ | 1,750,000 | | | $ | 1,933,750 | |
Hexcel Corporation | | | 6.75 | | | | 02/01/2015 | | | | 167,000 | | | | 168,461 | |
| | | | |
| | | | | | | | | | | | | | | 2,102,211 | |
| | | | | | | | | | | | | | | | |
| | | | |
| Commercial Services & Supplies: 0.22% | | | | | | | | | | | | | | | | |
Equifax Incorporated | | | 6.30 | | | | 07/01/2017 | | | | 1,335,000 | | | | 1,535,836 | |
| | | | | | | | | | | | | | | | |
| | | | |
| Electrical Equipment: 0.25% | | | | | | | | | | | | | | | | |
Belden CDT Incorporated | | | 7.00 | | | | 03/15/2017 | | | | 1,750,000 | | | | 1,802,500 | |
| | | | | | | | | | | | | | | | |
| | | | |
| Industrial Conglomerates: 0.38% | | | | | | | | | | | | | | | | |
General Electric Capital Corporation ± | | | 6.38 | | | | 11/15/2067 | | | | 2,670,000 | | | | 2,710,050 | |
| | | | | | | | | | | | | | | | |
| | | | |
| Machinery: 0.91% | | | | | | | | | | | | | | | | |
Briggs & Stratton Corporation | | | 6.88 | | | | 12/15/2020 | | | | 1,750,000 | | | | 1,850,625 | |
Case New Holland Incorporated | | | 7.88 | | | | 12/01/2017 | | | | 2,000,000 | | | | 2,350,000 | |
SPX Corporation | | | 6.88 | | | | 09/01/2017 | | | | 2,000,000 | | | | 2,220,000 | |
| | | | |
| | | | | | | | | | | | | | | 6,420,625 | |
| | | | | | | | | | | | | | | | |
| | | | |
| Professional Services: 0.80% | | | | | | | | | | | | | | | | |
FTI Consulting Incorporated | | | 6.75 | | | | 10/01/2020 | | | | 2,000,000 | | | | 2,162,500 | |
Verisk Analytics Incorporated | | | 5.80 | | | | 05/01/2021 | | | | 3,220,000 | | | | 3,498,082 | |
| | | | |
| | | | | | | | | | | | | | | 5,660,582 | |
| | | | | | | | | | | | | | | | |
| | | | |
Information Technology: 1.49% | | | | | | | | | | | | | | | | |
| | | | |
| Communications Equipment: 0.27% | | | | | | | | | | | | | | | | |
Brocade Communications Systems Incorporated | | | 6.88 | | | | 01/15/2020 | | | | 1,750,000 | | | | 1,955,625 | |
| | | | | | | | | | | | | | | | |
| | | | |
| Electronic Equipment, Instruments & Components: 0.36% | | | | | | | | | | | | | | | | |
Corning Incorporated | | | 7.25 | | | | 08/15/2036 | | | | 2,092,000 | | | | 2,548,935 | |
| | | | | | | | | | | | | | | | |
| | | | |
| Internet Software & Services: 0.59% | | | | | | | | | | | | | | | | |
Equinix Incorporated | | | 7.00 | | | | 07/15/2021 | | | | 2,000,000 | | | | 2,210,000 | |
Tencent Holdings Limited 144A | | | 4.63 | | | | 12/12/2016 | | | | 1,935,000 | | | | 1,947,446 | |
| | | | |
| | | | | | | | | | | | | | | 4,157,446 | |
| | | | | | | | | | | | | | | | |
| | | | |
| Office Electronics: 0.27% | | | | | | | | | | | | | | | | |
Xerox Corporation | | | 8.25 | | | | 05/15/2014 | | | | 1,685,000 | | | | 1,892,425 | |
| | | | | | | | | | | | | | | | |
| | | | |
Materials: 1.09% | | | | | | | | | | | | | | | | |
| | | | |
| Containers & Packaging: 0.24% | | | | | | | | | | | | | | | | |
Sealed Air Corporation 144A | | | 8.13 | | | | 09/15/2019 | | | | 1,500,000 | | | | 1,695,000 | |
| | | | | | | | | | | | | | | | |
| | | | |
| Metals & Mining: 0.37% | | | | | | | | | | | | | | | | |
Freeport-McMoRan Copper & Gold Incorporated | | | 8.38 | | | | 04/01/2017 | | | | 2,470,000 | | | | 2,585,549 | |
| | | | | | | | | | | | | | | | |
| | | | |
| Paper & Forest Products: 0.48% | | | | | | | | | | | | | | | | |
International Paper Company | | | 7.30 | | | | 11/15/2039 | | | | 2,665,000 | | | | 3,422,526 | |
| | | | | | | | | | | | | | | | |
The accompanying notes are an integral part of these financial statements.
| | | | | | |
| Portfolio of Investments—February 29, 2012 (Unaudited) | | Wells Fargo Advantage Income Plus Fund | | | 13 | |
| | | | | | | | | | | | | | | | |
| Security Name | | Interest Rate | | | Maturity Date | | | Principal | | | Value | |
| | | | | | | | | | | | | | | | |
| | | | |
Telecommunication Services: 1.04% | | | | | | | | | | | | | | | | |
| | | | |
| Diversified Telecommunication Services: 0.56% | | | | | | | | | | | | | | | | |
Frontier Communications Corporation | | | 8.25 | % | | | 04/15/2017 | | | $ | 750,000 | | | $ | 810,000 | |
Qwest Corporation | | | 8.38 | | | | 05/01/2016 | | | | 1,060,000 | | | | 1,241,510 | |
Windstream Corporation | | | 7.75 | | | | 10/15/2020 | | | | 1,750,000 | | | | 1,911,875 | |
| | | | |
| | | | | | | | | | | | | | | 3,963,385 | |
| | | | | | | | | | | | | | | | |
| | | | |
| Wireless Telecommunication Services: 0.48% | | | | | | | | | | | | | | | | |
Alltel Corporation | | | 7.00 | | | | 07/01/2012 | | | | 1,285,000 | | | | 1,311,891 | |
American Tower Corporation | | | 7.00 | | | | 10/15/2017 | | | | 1,765,000 | | | | 2,036,148 | |
| | | | |
| | | | | | | | | | | | | | | 3,348,039 | |
| | | | | | | | | | | | | | | | |
| | | | |
Utilities: 0.81% | | | | | | | | | | | | | | | | |
| | | | |
| Electric Utilities: 0.32% | | | | | | | | | | | | | | | | |
Dolphin Subsidiary II Incorporated 144A | | | 7.25 | | | | 10/15/2021 | | | | 2,000,000 | | | | 2,280,000 | |
| | | | | | | | | | | | | | | | |
| | | | |
| Independent Power Producers & Energy Traders: 0.49% | | | | | | | | | | | | | | | | |
FPL Energy Caithness Funding 144A(i) | | | 7.65 | | | | 12/31/2018 | | | | 1,734,448 | | | | 1,932,123 | |
NRG Energy Incorporated | | | 7.63 | | | | 01/15/2018 | | | | 1,500,000 | | | | 1,518,750 | |
| | | | |
| | | | | | | | | | | | | | | 3,450,873 | |
| | | | | | | | | | | | | | | | |
| | | | |
Total Corporate Bonds and Notes (Cost $172,339,180) | | | | | | | | | | | | | | | 182,786,318 | |
| | | | | | | | | | | | | | | | |
| | | | |
Municipal Bonds and Notes: 0.95% | | | | | | | | | | | | | | | | |
| | | | |
| California: 0.45% | | | | | | | | | | | | | | | | |
San Jose CA Airport Taxable Series B (Airport Revenue, AGM LOC) | | | 6.60 | | | | 03/01/2041 | | | | 3,000,000 | | | | 3,160,050 | |
| | | | | | | | | | | | | | | | |
| | | | |
| Illinois: 0.45% | | | | | | | | | | | | | | | | |
Illinois GO (GO-State) | | | 4.51 | | | | 03/01/2015 | | | | 3,000,000 | | | | 3,159,390 | |
| | | | | | | | | | | | | | | | |
| | | | |
| Other: 0.05% | | | | | | | | | | | | | | | | |
Seneca Nation Indians Capital Improvements Authority Series 07 B (Miscellaneous Revenue) 144A(i) | | | 6.75 | | | | 12/01/2013 | | | | 365,000 | | | | 360,759 | |
| | | | | | | | | | | | | | | | |
| | | | |
Total Municipal Bonds and Notes (Cost $6,281,650) | | | | | | | | | | | | | | | 6,680,199 | |
| | | | | | | | | | | | | | | | |
| | | | |
| Non-Agency Mortgage Backed Securities: 3.82% | | | | | | | | | | | | | | | | |
Citigroup Commercial Mortgage Trust Series 2006-C4 Class A3 ± | | | 5.73 | | | | 03/15/2049 | | | | 2,885,000 | | | | 3,286,560 | |
Citigroup Commercial Mortgage Trust Series 2007-C6 Class A4 ± | | | 5.70 | | | | 12/10/2049 | | | | 3,085,000 | | | | 3,550,301 | |
Commercial Mortgage Trust Pass-Through Certificates Series 2004-LB4A Class A4 | | | 4.58 | | | | 10/15/2037 | | | | 1,205,914 | | | | 1,209,037 | |
Commercial Mortgage Trust Pass-Through Certificates Series 2006 Class C7 ± | | | 5.77 | | | | 06/10/2046 | | | | 2,555,000 | | | | 2,646,684 | |
Commercial Mortgage Trust Pass-Through Certificates Series 2007-C9 Class A4 ± | | | 5.81 | | | | 12/10/2049 | | | | 1,730,000 | | | | 2,000,126 | |
Credit Suisse First Boston Mortgage Securities Corporation Series 1998-C2 Class AX ±(c) | | | 0.58 | | | | 11/15/2030 | | | | 565,715 | | | | 3,881 | |
Credit Suisse Mortgage Capital Certificates Series 2006-C3 Class A3 ± | | | 5.81 | | | | 06/15/2038 | | | | 2,400,000 | | | | 2,706,077 | |
Financial Asset Securitization Incorporated Series 1997-NAM2 Class B2 | | | 7.88 | | | | 07/25/2027 | | | | 98,569 | | | | 96,672 | |
Lehman Brothers UBS Commercial Mortgage Trust Series 2003-C8 Class A3 | | | 4.83 | | | | 11/15/2027 | | | | 2,213,463 | | | | 2,252,199 | |
Lehman Brothers UBS Commercial Mortgage Trust Series 2006-C1 Class A4 | | | 5.16 | | | | 02/15/2031 | | | | 2,790,000 | | | | 3,111,952 | |
The accompanying notes are an integral part of these financial statements.
| | | | |
| 14 | | Wells Fargo Advantage Income Plus Fund | | Portfolio of Investments—February 29, 2012 (Unaudited) |
| | | | | | | | | | | | | | | | |
| Security Name | | Interest Rate | | | Maturity Date | | | Principal | | | Value | |
| | | | | | | | | | | | | | | | |
| | | | |
| Non-Agency Mortgage Backed Securities (continued) | | | | | | | | | | | | | | | | |
Mach One Trust Commercial Mortgage Backed Series 2004-1 Class X ±(c)144A(i) | | | 0.93 | % | | | 05/28/2040 | | | $ | 1,558,650 | | | $ | 12,438 | |
Merrill Lynch Countrywide Commercial Mortgage Trust Series 2006-4 Class AM ± | | | 5.20 | | | | 12/12/2049 | | | | 2,285,000 | | | | 2,259,337 | |
Morgan Stanley Capital I Series 2004-RR2 Class X ±(c)144A(i) | | | 0.75 | | | | 10/28/2033 | | | | 1,219,931 | | | | 8,088 | |
SACO I Trust Series 2005-2 Class A ±144A(i) | | | 0.64 | | | | 04/25/2035 | | | | 6,799 | | | | 2,647 | |
TIAA Real Estate CDO Limited Series 2007-C4 Class A3 ± | | | 5.71 | | | | 08/15/2039 | | | | 2,235,000 | | | | 2,417,112 | |
Washington Mutual Mortgage Pass-Through Certificates Series 2007-HY7 Class 3A2 ± | | | 5.29 | | | | 07/25/2037 | | | | 1,880,555 | | | | 1,432,492 | |
| | | | |
Total Non-Agency Mortgage Backed Securities (Cost $26,685,502) | | | | | | | | | | | | | | | 26,995,603 | |
| | | | | | | | | | | | | | | | |
| | | | |
| U.S. Treasury Securities: 29.20% | | | | | | | | | | | | | | | | |
U.S. Treasury Bond | | | 3.13 | | | | 11/15/2041 | | | | 4,855,000 | | | | 4,883,067 | |
U.S. Treasury Bond ## | | | 4.25 | | | | 11/15/2040 | | | | 15,555,000 | | | | 19,144,798 | |
U.S. Treasury Bond | | | 4.38 | | | | 05/15/2040 | | | | 4,115,000 | | | | 5,164,325 | |
U.S. Treasury Bond | | | 4.50 | | | | 02/15/2036 | | | | 4,415,000 | | | | 5,602,909 | |
U.S. Treasury Bond | | | 6.25 | | | | 08/15/2023 | | | | 11,190,000 | | | | 15,872,321 | |
U.S. Treasury Bond | | | 6.38 | | | | 08/15/2027 | | | | 8,170,000 | | | | 12,150,326 | |
U.S. Treasury Note | | | 0.25 | | | | 01/31/2014 | | | | 12,880,000 | | | | 12,868,434 | |
U.S. Treasury Note | | | 0.50 | | | | 08/15/2014 | | | | 41,190,000 | | | | 41,318,719 | |
U.S. Treasury Note | | | 0.63 | | | | 12/31/2012 | | | | 10,485,000 | | | | 10,523,092 | |
U.S. Treasury Note | | | 1.00 | | | | 10/31/2016 | | | | 20,715,000 | | | | 20,905,972 | |
U.S. Treasury Note | | | 1.25 | | | | 04/15/2014 | | | | 20,590,000 | | | | 20,988,931 | |
U.S. Treasury Note | | | 1.38 | | | | 02/28/2019 | | | | 8,510,000 | | | | 8,493,745 | |
U.S. Treasury Note | | | 2.00 | | | | 02/15/2022 | | | | 2,255,000 | | | | 2,258,876 | |
U.S. Treasury Note | | | 2.25 | | | | 07/31/2018 | | | | 24,600,000 | | | | 26,129,825 | |
| | | | |
Total U.S. Treasury Securities (Cost $199,931,990) | | | | | | | | | | | | | | | 206,305,340 | |
| | | | | | | | | | | | | | | | |
| | | | |
Yankee Corporate Bonds and Notes: 8.66% | | | | | | | | | | | | | | | | |
| | | | |
Consumer Discretionary: 1.05% | | | | | | | | | | | | | | | | |
| | | | |
| Media: 1.05% | | | | | | | | | | | | | | | | |
British Sky Broadcasting Group plc 144A | | | 9.50 | | | | 11/15/2018 | | | | 2,170,000 | | | | 2,937,447 | |
Globo Comunicacoes e Participacoes SA 144A | | | 7.25 | | | | 04/26/2022 | | | | 2,380,000 | | | | 2,499,000 | |
Myriad International Holdings BV 144A | | | 6.38 | | | | 07/28/2017 | | | | 1,755,000 | | | | 1,948,050 | |
| | | | |
| | | | | | | | | | | | | | | 7,384,497 | |
| | | | | | | | | | | | | | | | |
| | | | |
Energy: 0.32% | | | | | | | | | | | | | | | | |
| | | | |
| Energy Equipment & Services: 0.32% | | | | | | | | | | | | | | | | |
Weatherford International Limited | | | 9.63 | | | | 03/01/2019 | | | | 1,665,000 | | | | 2,255,264 | |
| | | | | | | | | | | | | | | | |
| | | | |
Financials: 5.41% | | | | | | | | | | | | | | | | |
| | | | |
| Capital Markets: 0.14% | | | | | | | | | | | | | | | | |
Macquarie Group Limited 144A | | | 6.00 | | | | 01/14/2020 | | | | 1,000,000 | | | | 982,686 | |
| | | | | | | | | | | | | | | | |
| | | | |
| Commercial Banks: 4.58% | | | | | | | | | | | | | | | | |
Banco Macro SA 144A | | | 5.50 | | | | 07/12/2020 | | | | 2,510,000 | | | | 2,761,000 | |
Bank Nederlandse Gemeenten 144A | | | 2.50 | | | | 01/11/2016 | | | | 5,420,000 | | | | 5,526,888 | |
Bank of Nova Scotia 144A | | | 2.15 | | | | 08/03/2016 | | | | 2,790,000 | | | | 2,878,951 | |
The accompanying notes are an integral part of these financial statements.
| | | | | | |
| Portfolio of Investments—February 29, 2012 (Unaudited) | | Wells Fargo Advantage Income Plus Fund | | | 15 | |
| | | | | | | | | | | | | | | | |
| Security Name | | Interest Rate | | | Maturity Date | | | Principal | | | Value | |
| | | | | | | | | | | | | | | | |
| | | | |
| Commercial Banks (continued) | | | | | | | | | | | | | | | | |
BBVA Bancomer SA 144A | | | 4.50 | % | | | 03/10/2016 | | | $ | 2,090,000 | | | $ | 2,142,250 | |
Commonwealth Bank of Australia ±144A | | | 6.02 | | | | 12/31/2049 | | | | 1,580,000 | | | | 1,514,811 | |
Export Import Bank of Korea | | | 5.13 | | | | 06/29/2020 | | | | 2,600,000 | | | | 2,783,968 | |
ICICI Bank Limited 144A | | | 4.75 | | | | 11/25/2016 | | | | 3,000,000 | | | | 2,978,277 | |
Itau Unibanco Holdings SA 144A | | | 5.75 | | | | 01/22/2021 | | | | 2,335,000 | | | | 2,422,563 | |
Kommunalbanken AS 144A | | | 2.38 | | | | 01/19/2016 | | | | 2,330,000 | | | | 2,414,812 | |
Landwirtsch Rentenbank « | | | 2.50 | | | | 02/15/2016 | | | | 3,150,000 | | | | 3,302,580 | |
Westpac Banking Corporation 144A | | | 1.90 | | | | 12/14/2012 | | | | 3,615,000 | | | | 3,647,741 | |
| | | | |
| | | | | | | | | | | | | | | 32,373,841 | |
| | | | | | | | | | | | | | | | |
| | | | |
| Consumer Finance: 0.69% | | | | | | | | | | | | | | | | |
Inmarsat Finance plc 144A | | | 7.38 | | | | 12/01/2017 | | | | 1,750,000 | | | | 1,872,500 | |
Rio Tinto Finance USA Limited | | | 9.00 | | | | 05/01/2019 | | | | 2,175,000 | | | | 2,999,295 | |
| | | | |
| | | | | | | | | | | | | | | 4,871,795 | |
| | | | | | | | | | | | | | | | |
| | | | |
Materials: 0.55% | | | | | | | | | | | | | | | | |
| | | | |
| Metals & Mining: 0.55% | | | | | | | | | | | | | | | | |
Arcelormittal | | | 6.13 | | | | 06/01/2018 | | | | 1,900,000 | | | | 2,010,884 | |
Teck Resources Limited | | | 10.25 | | | | 05/15/2016 | | | | 1,650,000 | | | | 1,898,896 | |
| | | | |
| | | | | | | | | | | | | | | 3,909,780 | |
| | | | | | | | | | | | | | | | |
| | | | |
Telecommunication Services: 0.89% | | | | | | | | | | | | | | | | |
| | | | |
| Diversified Telecommunication Services: 0.89% | | | | | | | | | | | | | | | | |
Telecom Italia Capital SA | | | 5.25 | | | | 10/01/2015 | | | | 1,545,000 | | | | 1,560,450 | |
Telefonica Emisiones SAU | | | 5.13 | | | | 04/27/2020 | | | | 1,880,000 | | | | 1,855,658 | |
Telefonos de Mexico SAB de CV | | | 5.50 | | | | 11/15/2019 | | | | 2,485,000 | | | | 2,848,063 | |
| | | | |
| | | | | | | | | | | | | | | 6,264,171 | |
| | | | | | | | | | | | | | | | |
| | | | |
Utilities: 0.44% | | | | | | | | | | | | | | | | |
| | | | |
| Electric Utilities: 0.44% | | | | | | | | | | | | | | | | |
Western Power Distributions Holdings Limited 144A | | | 7.38 | | | | 12/15/2028 | | | | 2,750,000 | | | | 3,131,908 | |
| | | | | | | | | | | | | | | | |
| | | | |
Total Yankee Corporate Bonds and Notes (Cost $57,015,961) | | | | | | | | | | | | | | | 61,173,942 | |
| | | | | | | | | | | | | | | | |
| | | | |
Yankeee Government Bonds: 0.38% | | | | | | | | | | | | | | | | |
State of Qatar 144A | | | 4.50 | | | | 01/20/2022 | | | | 2,580,000 | | | | 2,683,200 | |
| | | | | | | | | | | | | | | | |
| | | | |
Total Yankee Government Bonds (Cost $2,553,445) | | | | | | | | | | | | | | | 2,683,200 | |
| | | | | | | | | | | | | | | | |
| | | | |
| Other: 0.24% | | | | | | | | | | | | | | | | |
Gryphon Funding Limited, Pass-Through Entity (i)(a)(v) | | | | | | | | | | | 1,196,894 | | | | 323,162 | |
VFNC Corporation, Pass-Through Entity, 0.24% ±144A(i)(a)(v) | | | | | | | | | | | 3,185,791 | | | | 1,369,890 | |
| | | | |
Total Other (Cost $689,500) | | | | | | | | | | | | | | | 1,693,052 | |
| | | | | | | | | | | | | | | | |
| | | | |
| | | Yield | | | | | | Shares | | | | |
| Short-Term Investments: 16.52% | | | | | | | | | | | | | | | | |
| | | | |
| Investment Companies: 16.45% | | | | | | | | | | | | | | | | |
Wells Fargo Advantage Cash Investment Money Market Fund,
Institutional Class (l)(u)## | | | 0.02 | | | | | | | | 113,692,336 | | | | 113,692,336 | |
Wells Fargo Securities Lending Cash Investments, LLC (v)(l)(u)(r) | | | 0.15 | | | | | | | | 2,519,956 | | | | 2,519,956 | |
| | | | |
| | | | | | | | | | | | | | | 116,212,292 | |
| | | | | | | | | | | | | | | | |
The accompanying notes are an integral part of these financial statements.
| | | | |
| 16 | | Wells Fargo Advantage Income Plus Fund | | Portfolio of Investments—February 29, 2012 (Unaudited) |
| | | | | | | | | | | | | | | | |
| Security Name | | Yield | | | Maturity Date | | | Principal | | | Value | |
| | | | | | | | | | | | | | | | |
| | | | |
| U.S. Treasury Securities: 0.07% | | | | | | | | | | | | | | | | |
U.S. Treasury Bill # | | | 0.05 | % | | | 03/29/2012 | | | $ | 100,000 | | | $ | 99,996 | |
U.S. Treasury Bill # | | | 0.08 | | | | 03/29/2012 | | | | 400,000 | | | | 399,975 | |
| | | | |
| | | | | | | | | | | | | | | 499,971 | |
| | | | | | | | | | | | | | | | |
| | | | |
Total Short-Term Investments (Cost $116,712,280) | | | | | | | | | | | | | | | 116,712,263 | |
| | | | | | | | | | | | | | | | |
| | | | | | | | |
| Total Investments in Securities | | | | | | | | |
| (Cost $802,283,992) * | | | 117.62 | % | | | 830,884,043 | |
Other Assets and Liabilities, Net | | | (17.62 | ) | | | (124,497,320 | ) |
| | | | | | | | |
| Total Net Assets | | | 100.00 | % | | $ | 706,386,723 | |
| | | | | | | | |
| ± | Variable rate investment. |
| %% | Security issued on a when-issued (TBA) basis. |
| (c) | Interest-only securities entitle holders to receive only the interest payments on the underlying mortgages. The principal amount shown is the notional amount of the underlying mortgages. Interest rate disclosed represents the coupon rate. |
| 144A | Security that may be resold to “qualified institutional buyers” under Rule 144A or security offered pursuant to Section 4(2) of the Securities Act of 1933, as amended. |
| « | All or a portion of this security is on loan. |
| (a) | Security is fair valued by the Management Valuation Team, and in certain instances by the Board of Trustees, in accordance with procedures approved by the Board of Trustees. |
| (v) | Security represents investment of cash collateral received from securities on loan. |
| (l) | Investment in an affiliate. |
| (u) | Rate shown is the 7-day annualized yield at period end. |
| ## | All or a portion of this security has been segregated for when-issued securities. |
| (r) | The investment company is exempt from registration under Section 3(c)(7) of the 1940 Act. |
| # | All or a portion of this security is segregated as collateral for investments in derivative instruments. |
| * | Cost for federal income tax purposes is $755,708,179 and net unrealized appreciation (depreciation) consists of: |
| | | | |
Gross unrealized appreciation | | $ | 76,584,607 | |
Gross unrealized depreciation | | | (1,408,743 | ) |
| | | | |
Net unrealized appreciation | | $ | 75,175,864 | |
The accompanying notes are an integral part of these financial statements.
| | | | | | |
| Statement of Assets and Liabilities—February 29, 2012 (Unaudited) | | Wells Fargo Advantage Income Plus Fund | | | 17 | |
| | | | |
| | | | |
| |
Assets | | | | |
Investments | | | | |
In unaffiliated securities (including securities on loan), at value (see cost below) | | $ | 714,671,751 | |
In affiliated securities, at value (see cost below) | | | 116,212,292 | |
| | | | |
Total investments, at value (see cost below) | | | 830,884,043 | |
Receivable for investments sold | | | 11,936,152 | |
Principal paydown receivable | | | 61 | |
Receivable for Fund shares sold | | | 1,080,838 | |
Receivable for interest | | | 5,377,143 | |
Receivable for daily variation margin on open futures contracts | | | 98,094 | |
Receivable for securities lending income | | | 561 | |
Prepaid expenses and other assets | | | 204,990 | |
| | | | |
Total assets | | | 849,581,882 | |
| | | | |
| |
Liabilities | | | | |
Payable for investments purchased | | | 138,911,471 | |
Payable for Fund shares redeemed | | | 586,144 | |
Payable upon receipt of securities loaned | | | 3,209,456 | |
Advisory fee payable | | | 206,666 | |
Distribution fees payable | | | 24,568 | |
Due to other related parties | | | 63,148 | |
Accrued expenses and other liabilities | | | 193,706 | |
| | | | |
Total liabilities | | | 143,195,159 | |
| | | | |
Total net assets | | $ | 706,386,723 | |
| | | | |
| |
NET ASSETS CONSIST OF | | | | |
Paid-in capital | | $ | 713,924,484 | |
Undistributed net investment income | | | 389,548 | |
Accumulated net realized losses on investments | | | (36,474,860 | ) |
Net unrealized gains on investments | | | 28,547,551 | |
| | | | |
Total net assets | | $ | 706,386,723 | |
| | | | |
| |
COMPUTATION OF NET ASSET VALUE AND OFFERING PRICE PER SHARE1 | | | | |
Net assets – Class A | | $ | 176,678,139 | |
Shares outstanding – Class A | | | 14,371,415 | |
Net asset value per share – Class A | | | $12.29 | |
Maximum offering price per share – Class A2 | | | $12.87 | |
Net assets – Class B | | $ | 3,411,049 | |
Shares outstanding – Class B | | | 277,028 | |
Net asset value per share – Class B | | | $12.31 | |
Net assets – Class C | | $ | 38,338,718 | |
Shares outstanding – Class C | | | 3,120,161 | |
Net asset value per share – Class C | | | $12.29 | |
Net assets – Administrator Class | | $ | 131,520,247 | |
Shares outstanding – Administrator Class | | | 10,714,157 | |
Net asset value per share – Administrator Class | | | $12.28 | |
Net assets – Institutional Class | | $ | 162,291,320 | |
Shares outstanding – Institutional Class | | | 13,203,599 | |
Net asset value per share – Institutional Class | | | $12.29 | |
Net assets – Investor Class | | $ | 194,147,250 | |
Shares outstanding – Investor Class | | | 15,793,816 | |
Net asset value per share – Investor Class | | | $12.29 | |
Investments in unaffiliated securities, at cost | | $ | 686,071,700 | |
| | | | |
Investments in affiliated securities, at cost | | $ | 116,212,292 | |
| | | | |
Total investments, at cost | | $ | 802,283,992 | |
| | | | |
Securities on loan, at value | | $ | 3,142,673 | |
| | | | |
| 1. | The Fund has an unlimited number of authorized shares. |
| 2. | Maximum offering price is computed as 100/95.50 of net asset value. On investments of $50,000 or more, the offering price is reduced. |
The accompanying notes are an integral part of these financial statements.
| | | | |
| 18 | | Wells Fargo Advantage Income Plus Fund | | Statement of Operations—Six Months Ended February 29, 2012 (Unaudited) |
| | | | |
| | | | |
| |
Investment income | | | | |
Interest | | $ | 12,039,719 | |
Dividends | | | 3,471 | |
Income from affiliated securities | | | 43,222 | |
Securities lending income, net | | | 12,937 | |
| | | | |
Total investment income | | | 12,099,349 | |
| | | | |
| |
Expenses | | | | |
Advisory fee | | | 1,319,277 | |
Administration fees | | | | |
Fund level | | | 167,616 | |
Class A | | | 135,550 | |
Class B | | | 2,814 | |
Class C | | | 26,791 | |
Administrator Class | | | 56,700 | |
Institutional Class | | | 64,139 | |
Investor Class | | | 180,759 | |
Shareholder servicing fees | | | | |
Class A | | | 211,796 | |
Class B | | | 4,373 | |
Class C | | | 41,861 | |
Administrator Class | | | 141,426 | |
Investor Class | | | 225,507 | |
Distribution fees | | | | |
Class B | | | 13,190 | |
Class C | | | 125,584 | |
Custody and accounting fees | | | 21,947 | |
Professional fees | | | 25,051 | |
Registration fees | | | 32,633 | |
Shareholder report expenses | | | 15,555 | |
Trustees’ fees and expenses | | | 5,936 | |
Other fees and expenses | | | 10,847 | |
| | | | |
Total expenses | | | 2,829,352 | |
Less: Fee waivers and/or expense reimbursements | | | (57,781 | ) |
| | | | |
Net expenses | | | 2,771,571 | |
| | | | |
Net investment income | | | 9,327,778 | |
| | | | |
| |
REALIZED AND UNREALIZED GAINS (LOSSES) ON INVESTMENTS | | | | |
| |
Net realized gains (losses) on: | | | | |
Unaffiliated securities | | | 12,045,427 | |
Futures transactions | | | (152,141 | ) |
| | | | |
Net realized gains on investments | | | 11,893,286 | |
| | | | |
| |
Net change in unrealized gains (losses) on: | | | | |
Unaffiliated securities | | | 4,088,154 | |
Futures transactions | | | (19,030 | ) |
| | | | |
Net change in unrealized gains (losses) on investments | | | 4,069,124 | |
| | | | |
Net realized and unrealized gains (losses) on investments | | | 15,962,410 | |
| | | | |
Net increase in net assets resulting from operations | | $ | 25,290,188 | |
| | | | |
The accompanying notes are an integral part of these financial statements.
| | | | | | |
| Statements of Changes in Net Assets | | Wells Fargo Advantage Income Plus Fund | | | 19 | |
| | | | | | | | | | | | | | | | |
| | | Six Months Ended
February 29, 2012
(Unaudited) | | | Year Ended
August 31, 2011 | |
| | | | |
Operations | | | | | | | | | | | | | | | | |
Net investment income | | | | | | $ | 9,327,778 | | | | | | | $ | 20,206,814 | |
Net realized gains on investments | | | | | | | 11,893,286 | | | | | | | | 7,235,550 | |
Net change in unrealized gains (losses) on investments | | | | | | | 4,069,124 | | | | | | | | 1,438,824 | |
| | | | | | | | | | | | | | | | |
Net increase in net assets resulting from operations | | | | | | | 25,290,188 | | | | | | | | 28,881,188 | |
| | | | | | | | | | | | | | | | |
| | | | |
Distributions to shareholders from | | | | | | | | | | | | | | | | |
Net investment income | | | | | | | | | | | | | | | | |
Class A | | | | | | | (2,198,010 | ) | | | | | | | (7,253,660 | ) |
Class B | | | | | | | (31,771 | ) | | | | | | | (126,499 | ) |
Class C | | | | | | | (308,849 | ) | | | | | | | (775,337 | ) |
Administrator Class | | | | | | | (1,573,942 | ) | | | | | | | (1,288,066 | ) |
Institutional Class | | | | | | | (2,344,343 | ) | | | | | | | (5,565,679 | ) |
Investor Class | | | | | | | (2,446,440 | ) | | | | | | | (6,235,854 | ) |
Net realized gains | | | | | | | | | | | | | | | | |
Class A | | | | | | | (453,790 | ) | | | | | | | (2,570,215 | ) |
Class B | | | | | | | (8,925 | ) | | | | | | | (55,169 | ) |
Class C | | | | | | | (86,836 | ) | | | | | | | (300,818 | ) |
Administrator Class | | | | | | | (312,299 | ) | | | | | | | (24,938 | ) |
Institutional Class | | | | | | | (424,887 | ) | | | | | | | (1,471,630 | ) |
Investor Class | | | | | | | (505,596 | ) | | | | | | | (1,899,529 | ) |
| | | | | | | | | | | | | | | | |
Total distributions to shareholders | | | | | | | (10,695,688 | ) | | | | | | | (27,567,394 | ) |
| | | | | | | | | | | | | | | | |
| | | | |
Capital share transactions | | | Shares | | | | | | | | Shares | | | | | |
Proceeds from shares sold | | | | | | | | | | | | | | | | |
Class A | | | 2,080,559 | | | | 25,259,279 | | | | 5,063,452 | | | | 59,779,883 | |
Class B | | | 33,428 | | | | 406,981 | | | | 67,095 | | | | 799,510 | |
Class C | | | 860,609 | | | | 10,445,080 | | | | 556,323 | | | | 6,596,391 | |
Administrator Class | | | 4,517,650 | | | | 54,535,696 | | | | 8,546,199 | | | | 100,875,382 | |
Institutional Class | | | 406,712 | | | | 4,946,458 | | | | 2,029,087 | | | | 24,130,906 | |
Investor Class | | | 1,080,657 | | | | 13,121,714 | | | | 1,904,015 | | | | 22,594,674 | |
| | | | | | | | | | | | | | | | |
| | | | | | | 108,715,208 | | | | | | | | 214,776,746 | |
| | | | | | | | | | | | | | | | |
Reinvestment of distributions | | | | | | | | | | | | | | | | |
Class A | | | 162,124 | | | | 1,967,558 | | | | 678,417 | | | | 7,991,473 | |
Class B | | | 2,607 | | | | 31,673 | | | | 11,396 | | | | 134,447 | |
Class C | | | 21,478 | | | | 260,553 | | | | 57,653 | | | | 679,224 | |
Administrator Class | | | 152,808 | | | | 1,852,143 | | | | 106,380 | | | | 1,261,230 | |
Institutional Class | | | 205,636 | | | | 2,494,830 | | | | 542,974 | | | | 6,406,206 | |
Investor Class | | | 217,564 | | | | 2,639,840 | | | | 610,699 | | | | 7,203,352 | |
| | | | | | | | | | | | | | | | |
| | | | | | | 9,246,597 | | | | | | | | 23,675,932 | |
| | | | | | | | | | | | | | | | |
Payment for shares redeemed | | | | | | | | | | | | | | | | |
Class A | | | (1,456,373 | ) | | | (17,729,330 | ) | | | (13,928,582 | ) | | | (164,089,087 | ) |
Class B | | | (95,396 | ) | | | (1,159,101 | ) | | | (253,152 | ) | | | (2,996,286 | ) |
Class C | | | (286,082 | ) | | | (3,478,733 | ) | | | (611,787 | ) | | | (7,241,866 | ) |
Administrator Class | | | (1,450,539 | ) | | | (17,532,697 | ) | | | (1,159,186 | ) | | | (13,782,662 | ) |
Institutional Class | | | (811,659 | ) | | | (9,836,307 | ) | | | (1,428,770 | ) | | | (17,000,233 | ) |
Investor Class | | | (1,214,416 | ) | | | (14,740,575 | ) | | | (3,319,807 | ) | | | (39,257,635 | ) |
| | | | | | | | | | | | | | | | |
| | | | | | | (64,476,743 | ) | | | | | | | (244,367,769 | ) |
| | | | | | | | | | | | | | | | |
Net increase (decrease) in net assets resulting
from capital share transactions | | | | | | | 53,485,062 | | | | | | | | (5,915,091 | ) |
| | | | | | | | | | | | | | | | |
Total increase (decrease) in net assets | | | | | | | 68,079,562 | | | | | | | | (4,601,297 | ) |
| | | | | | | | | | | | | | | | |
| | | | |
Net assets | | | | | | | | | | | | | | | | |
Beginning of period | | | | | | | 638,307,161 | | | | | | | | 642,908,458 | |
| | | | | | | | | | | | | | | | |
End of period | | | | | | $ | 706,386,723 | | | | | | | $ | 638,307,161 | |
| | | | | | | | | | | | | | | | |
Undistributed (overdistributed) net investment income | | | | | | $ | 389,548 | | | | | | | $ | (34,875 | ) |
| | | | | | | | | | | | | | | | |
The accompanying notes are an integral part of these financial statements.
| | | | |
| 20 | | Wells Fargo Advantage Income Plus Fund | | Financial Highlights |
(For a share outstanding throughout each period)
| | | | | | | | | | | | | | | | | | | | | | | | | | | | |
| | | Six Months Ended February 29, 2012
(Unaudited) | | | Year Ended August 31, | | | Year Ended May 31, | |
| Class A | | | 2011 | | | 20101 | | | 2010 | | | 2009 | | | 2008 | | | 2007 | |
Net asset value, beginning of period | | $ | 12.04 | | | $ | 12.00 | | | $ | 11.59 | | | $ | 10.82 | | | $ | 10.70 | | | $ | 10.65 | | | $ | 10.49 | |
Net investment income | | | 0.16 | | | | 0.37 | 2 | | | 0.09 | 2 | | | 0.37 | 2 | | | 0.42 | 2 | | | 0.48 | 2 | | | 0.53 | 2 |
Net realized and unrealized gains (losses)
on investments | | | 0.28 | | | | 0.18 | | | | 0.44 | | | | 0.88 | | | | 0.15 | | | | 0.08 | | | | 0.19 | |
| | | | | | | | | | | | | | | | | | | | | | | | | | | | |
Total from investment operations | | | 0.44 | | | | 0.55 | | | | 0.53 | | | | 1.25 | | | | 0.57 | | | | 0.56 | | | | 0.72 | |
Distributions to shareholders from | | | | | | | | | | | | | | | | | | | | | | | | | | | | |
Net investment income | | | (0.16 | ) | | | (0.42 | ) | | | (0.12 | ) | | | (0.48 | ) | | | (0.45 | ) | | | (0.51 | ) | | | (0.56 | ) |
Net realized gains | | | (0.03 | ) | | | (0.09 | ) | | | 0.00 | | | | 0.00 | | | | 0.00 | | | | 0.00 | | | | 0.00 | |
| | | | | | | | | | | | | | | | | | | | | | | | | | | | |
Total distributions to shareholders | | | (0.19 | ) | | | (0.51 | ) | | | (0.12 | ) | | | (0.48 | ) | | | (0.45 | ) | | | (0.51 | ) | | | (0.56 | ) |
Net asset value, end of period | | $ | 12.29 | | | $ | 12.04 | | | $ | 12.00 | | | $ | 11.59 | | | $ | 10.82 | | | $ | 10.70 | | | $ | 10.65 | |
Total return3 | | | 3.68 | % | | | 4.76 | % | | | 4.62 | % | | | 11.74 | % | | | 5.52 | % | | | 5.37 | % | | | 7.04 | % |
Ratios to average net assets (annualized) | | | | | | | | | | | | | | | | | | | | | | | | | | | | |
Gross expenses | | | 0.89 | % | | | 0.88 | % | | | 0.91 | % | | | 1.03 | % | | | 1.05 | % | | | 1.35 | % | | | 1.34 | % |
Net expenses | | | 0.88 | % | | | 0.88 | % | | | 0.88 | % | | | 0.90 | % | | | 0.90 | % | | | 1.00 | % | | | 1.00 | % |
Net investment income | | | 2.73 | % | | | 3.17 | % | | | 3.07 | % | | | 3.29 | % | | | 4.01 | % | | | 4.50 | % | | | 4.96 | % |
Supplemental data | | | | | | | | | | | | | | | | | | | | | | | | | | | | |
Portfolio turnover rate | | | 119 | % | | | 215 | % | | | 84 | % | | | 187 | % | | | 455 | % | | | 245 | % | | | 205 | % |
Net assets, end of period (000’s omitted) | | | $176,678 | | | | $163,499 | | | | $261,227 | | | | $130,382 | | | | $94,938 | | | | $43,481 | | | | $37,526 | |
| 1. | For the three months ended August 31, 2010. The Fund changed its fiscal year end from May 31 to August 31, effective August 31, 2010. |
| 2. | Calculated based upon average shares outstanding. |
| 3. | Total return calculations do not include any sales charges. Returns for periods of less than one year are not annualized. |
The accompanying notes are an integral part of these financial statements.
| | | | | | |
| Financial Highlights | | Wells Fargo Advantage Income Plus Fund | | | 21 | |
(For a share outstanding throughout each period)
| | | | | | | | | | | | | | | | | | | | | | | | | | | | |
| | | Six Months Ended February 29, 2012
(Unaudited) | | | Year Ended August 31, | | | Year Ended May 31, | |
| Class B | | | 2011 | | | 20101 | | | 2010 | | | 2009 | | | 2008 | | | 2007 | |
Net asset value, beginning of period | | $ | 12.05 | | | $ | 12.01 | | | $ | 11.61 | | | $ | 10.82 | | | $ | 10.70 | | | $ | 10.65 | | | $ | 10.49 | |
Net investment income | | | 0.11 | 2 | | | 0.29 | 2 | | | 0.07 | 2 | | | 0.29 | 2 | | | 0.35 | 2 | | | 0.40 | 2 | | | 0.35 | 2 |
Net realized and unrealized gains (losses)
on investments | | | 0.29 | | | | 0.17 | | | | 0.43 | | | | 0.89 | | | | 0.14 | | | | 0.08 | | | | 0.29 | |
| | | | | | | | | | | | | | | | | | | | | | | | | | | | |
Total from investment operations | | | 0.40 | | | | 0.46 | | | | 0.50 | | | | 1.18 | | | | 0.49 | | | | 0.48 | | | | 0.64 | |
Distributions to shareholders from | | | | | | | | | | | | | | | | | | | | | | | | | | | | |
Net investment income | | | (0.11 | ) | | | (0.33 | ) | | | (0.10 | ) | | | (0.39 | ) | | | (0.37 | ) | | | (0.43 | ) | | | (0.48 | ) |
Net realized gains | | | (0.03 | ) | | | (0.09 | ) | | | 0.00 | | | | 0.00 | | | | 0.00 | | | | 0.00 | | | | 0.00 | |
| | | | | | | | | | | | | | | | | | | | | | | | | | | | |
Total distributions to shareholders | | | (0.14 | ) | | | (0.42 | ) | | | (0.10 | ) | | | (0.39 | ) | | | (0.37 | ) | | | (0.43 | ) | | | (0.48 | ) |
Net asset value, end of period | | $ | 12.31 | | | $ | 12.05 | | | $ | 12.01 | | | $ | 11.61 | | | $ | 10.82 | | | $ | 10.70 | | | $ | 10.65 | |
Total return3 | | | 3.36 | % | | | 3.97 | % | | | 4.31 | % | | | 11.04 | % | | | 4.69 | % | | | 4.58 | % | | | 6.24 | % |
Ratios to average net assets (annualized) | | | | | | | | | | | | | | | | | | | | | | | | | | | | |
Gross expenses | | | 1.63 | % | | | 1.63 | % | | | 1.65 | % | | | 1.78 | % | | | 1.80 | % | | | 2.10 | % | | | 2.09 | % |
Net expenses | | | 1.63 | % | | | 1.63 | % | | | 1.62 | % | | | 1.65 | % | | | 1.65 | % | | | 1.75 | % | | | 1.75 | % |
Net investment income | | | 1.85 | % | | | 2.40 | % | | | 2.33 | % | | | 2.54 | % | | | 3.30 | % | | | 3.75 | % | | | 4.24 | % |
Supplemental data | | | | | | | | | | | | | | | | | | | | | | | | | | | | |
Portfolio turnover rate | | | 119 | % | | | 215 | % | | | 84 | % | | | 187 | % | | | 455 | % | | | 245 | % | | | 205 | % |
Net assets, end of period (000’s omitted) | | | $3,411 | | | | $4,054 | | | | $6,140 | | | | $1,839 | | | | $3,937 | | | | $7,067 | | | | $10,682 | |
| 1. | For the three months ended August 31, 2010. The Fund changed its fiscal year end from May 31 to August 31, effective August 31, 2010. |
| 2. | Calculated based upon average shares outstanding. |
| 3. | Total return calculations do not include any sales charges. Returns for periods of less than one year are not annualized. |
The accompanying notes are an integral part of these financial statements.
| | | | |
| 22 | | Wells Fargo Advantage Income Plus Fund | | Financial Highlights |
(For a share outstanding throughout each period)
| | | | | | | | | | | | | | | | | | | | | | | | | | | | |
| | | Six Months Ended February 29, 2012
(Unaudited) | | | Year Ended August 31, | | | Year Ended May 31, | |
| Class C | | | 2011 | | | 20101 | | | 2010 | | | 2009 | | | 2008 | | | 2007 | |
Net asset value, beginning of period | | $ | 12.03 | | | $ | 12.00 | | | $ | 11.59 | | | $ | 10.82 | | | $ | 10.69 | | | $ | 10.65 | | | $ | 10.49 | |
Net investment income | | | 0.11 | 2 | | | 0.29 | 2 | | | 0.07 | 2 | | | 0.29 | 2 | | | 0.35 | 2 | | | 0.40 | 2 | | | 0.43 | 2 |
Net realized and unrealized gains (losses)
on investments | | | 0.29 | | | | 0.16 | | | | 0.44 | | | | 0.88 | | | | 0.15 | | | | 0.07 | | | | 0.21 | |
| | | | | | | | | | | | | | | | | | | | | | | | | | | | |
Total from investment operations | | | 0.40 | | | | 0.45 | | | | 0.51 | | | | 1.17 | | | | 0.50 | | | | 0.47 | | | | 0.64 | |
Distributions to shareholders from | | | | | | | | | | | | | | | | | | | | | | | | | | | | |
Net investment income | | | (0.11 | ) | | | (0.33 | ) | | | (0.10 | ) | | | (0.40 | ) | | | (0.37 | ) | | | (0.43 | ) | | | (0.48 | ) |
Net realized gains | | | (0.03 | ) | | | (0.09 | ) | | | 0.00 | | | | 0.00 | | | | 0.00 | | | | 0.00 | | | | 0.00 | |
| | | | | | | | | | | | | | | | | | | | | | | | | | | | |
Total distributions to shareholders | | | (0.14 | ) | | | (0.42 | ) | | | (0.10 | ) | | | (0.40 | ) | | | (0.37 | ) | | | (0.43 | ) | | | (0.48 | ) |
Net asset value, end of period | | $ | 12.29 | | | $ | 12.03 | | | $ | 12.00 | | | $ | 11.59 | | | $ | 10.82 | | | $ | 10.69 | | | $ | 10.65 | |
Total return3 | | | 3.38 | % | | | 3.92 | % | | | 4.42 | % | | | 10.93 | % | | | 4.85 | % | | | 4.50 | % | | | 6.24 | % |
Ratios to average net assets (annualized) | | | | | | | | | | | | | | | | | | | | | | | | | | | | |
Gross expenses | | | 1.64 | % | | | 1.63 | % | | | 1.66 | % | | | 1.78 | % | | | 1.80 | % | | | 2.10 | % | | | 2.09 | % |
Net expenses | | | 1.63 | % | | | 1.63 | % | | | 1.63 | % | | | 1.65 | % | | | 1.65 | % | | | 1.75 | % | | | 1.75 | % |
Net investment income | | | 1.84 | % | | | 2.41 | % | | | 2.32 | % | | | 2.53 | % | | | 3.32 | % | | | 3.75 | % | | | 4.23 | % |
Supplemental data | | | | | | | | | | | | | | | | | | | | | | | | | | | | |
Portfolio turnover rate | | | 119 | % | | | 215 | % | | | 84 | % | | | 187 | % | | | 455 | % | | | 245 | % | | | 205 | % |
Net assets, end of period (000’s omitted) | | | $38,339 | | | | $30,364 | | | | $30,253 | | | | $14,533 | | | | $7,242 | | | | $4,870 | | | | $4,633 | |
| 1. | For the three months ended August 31, 2010. The Fund changed its fiscal year end from May 31 to August 31, effective August 31, 2010. |
| 2. | Calculated based upon average shares outstanding. |
| 3. | Total return calculations do not include any sales charges. Returns for periods of less than one year are not annualized. |
The accompanying notes are an integral part of these financial statements.
| | | | | | |
| Financial Highlights | | Wells Fargo Advantage Income Plus Fund | | | 23 | |
(For a share outstanding throughout each period)
| | | | | | | | | | | | |
| | | Six Months Ended February 29, 2012
(Unaudited) | | | Year Ended August 31, | |
| Administrator Class | | | 2011 | | | 20101 | |
Net asset value, beginning of period | | $ | 12.02 | | | $ | 12.00 | | | $ | 11.87 | |
Net investment income | | | 0.17 | | | | 0.39 | 2 | | | 0.03 | 2 |
Net realized and unrealized gains (losses) on investments | | | 0.29 | | | | 0.16 | | | | 0.14 | |
| | | | | | | | | | | | |
Total from investment operations | | | 0.46 | | | | 0.55 | | | | 0.17 | |
Distributions to shareholders from | | | | | | | | | | | | |
Net investment income | | | (0.17 | ) | | | (0.44 | ) | | | (0.04 | ) |
Net realized gains | | | (0.03 | ) | | | (0.09 | ) | | | 0.00 | |
| | | | | | | | | | | | |
Total distributions to shareholders | | | (0.20 | ) | | | (0.53 | ) | | | (0.04 | ) |
Net asset value, end of period | | $ | 12.28 | | | $ | 12.02 | | | $ | 12.00 | |
Total return3 | | | 3.84 | % | | | 4.82 | % | | | 1.43 | % |
Ratios to average net assets (annualized) | | | | | | | | | | | | |
Gross expenses | | | 0.83 | % | | | 0.82 | % | | | 0.86 | % |
Net expenses | | | 0.74 | % | | | 0.75 | % | | | 0.86 | % |
Net investment income | | | 2.72 | % | | | 3.29 | % | | | 3.31 | % |
Supplemental data | | | | | | | | | | | | |
Portfolio turnover rate | | | 119 | % | | | 215 | % | | | 84 | % |
Net assets, end of period (000’s omitted) | | | $131,520 | | | | $90,063 | | | | $10 | |
| 1. | For the period from July 30, 2010 (commencement of class operations) to August 31, 2010. |
| 2. | Calculated based upon average shares outstanding. |
| 3. | Returns for periods of less than one year are not annualized. |
The accompanying notes are an integral part of these financial statements.
| | | | |
| 24 | | Wells Fargo Advantage Income Plus Fund | | Financial Highlights |
(For a share outstanding throughout each period)
| | | | | | | | | | | | | | | | | | | | |
| | | Six Months Ended February 29, 2012
(Unaudited) | | | Year Ended August 31, | | | Year Ended May 31, | |
| Institutional Class | | | 2011 | | | 20101 | | | 2010 | | | 20092 | |
Net asset value, beginning of period | | $ | 12.03 | | | $ | 12.00 | | | $ | 11.60 | | | $ | 10.82 | | | $ | 10.51 | |
Net investment income | | | 0.18 | | | | 0.41 | 3 | | | 0.10 | 3 | | | 0.41 | 3 | | | 0.39 | 3 |
Net realized and unrealized gains (losses) on investments | | | 0.29 | | | | 0.17 | | | | 0.43 | | | | 0.88 | | | | 0.36 | |
| | | | | | | | | | | | | | | | | | | | |
Total from investment operations | | | 0.47 | | | | 0.58 | | | | 0.53 | | | | 1.29 | | | | 0.75 | |
Distributions to shareholders from | | | | | | | | | | | | | | | | | | | | |
Net investment income | | | (0.18 | ) | | | (0.46 | ) | | | (0.13 | ) | | | (0.51 | ) | | | (0.44 | ) |
Net realized gains | | | (0.03 | ) | | | (0.09 | ) | | | 0.00 | | | | 0.00 | | | | 0.00 | |
| | | | | | | | | | | | | | | | | | | | |
Total distributions to shareholders | | | (0.21 | ) | | | (0.55 | ) | | | (0.13 | ) | | | (0.51 | ) | | | (0.44 | ) |
Net asset value, end of period | | $ | 12.29 | | | $ | 12.03 | | | $ | 12.00 | | | $ | 11.60 | | | $ | 10.82 | |
Total return4 | | | 3.93 | % | | | 5.04 | % | | | 4.71 | % | | | 12.06 | % | | | 7.29 | % |
Ratios to average net assets (annualized) | | | | | | | | | | | | | | | | | | | | |
Gross expenses | | | 0.56 | % | | | 0.55 | % | | | 0.59 | % | | | 0.68 | % | | | 0.69 | % |
Net expenses | | | 0.56 | % | | | 0.55 | % | | | 0.56 | % | | | 0.61 | % | | | 0.61 | % |
Net investment income | | | 2.91 | % | | | 3.53 | % | | | 3.36 | % | | | 3.58 | % | | | 4.29 | % |
Supplemental data | | | | | | | | | | | | | | | | | | | | |
Portfolio turnover rate | | | 119 | % | | | 215 | % | | | 84 | % | | | 187 | % | | | 455 | % |
Net assets, end of period (000’s omitted) | | | $162,291 | | | | $161,276 | | | | $147,102 | | | | $112,163 | | | | $97,574 | |
| 1. | For the three months ended August 31, 2010. The Fund changed its fiscal year end from May 31 to August 31, effective August 31, 2010. |
| 2. | For the period from July 18, 2008 (commencement of class operations) to May 31, 2009. |
| 3. | Calculated based upon average shares outstanding. |
| 4. | Returns for periods of less than one year are not annualized. |
The accompanying notes are an integral part of these financial statements.
| | | | | | |
| Financial Highlights | | Wells Fargo Advantage Income Plus Fund | | | 25 | |
(For a share outstanding throughout each period)
| | | | | | | | | | | | | | | | | | | | |
| | | Six Months Ended February 29, 2012
(Unaudited) | | | Year Ended August 31, | | | Year Ended May 31, | |
| Investor Class | | | 2011 | | | 20101 | | | 2010 | | | 20092 | |
Net asset value, beginning of period | | $ | 12.03 | | | $ | 12.00 | | | $ | 11.60 | | | $ | 10.82 | | | $ | 10.51 | |
Net investment income | | | 0.16 | | | | 0.37 | 3 | | | 0.09 | 3 | | | 0.37 | 3 | | | 0.36 | 3 |
Net realized and unrealized gains (losses) on investments | | | 0.29 | | | | 0.17 | | | | 0.43 | | | | 0.88 | | | | 0.36 | |
| | | | | | | | | | | | | | | | | | | | |
Total from investment operations | | | 0.45 | | | | 0.54 | | | | 0.52 | | | | 1.25 | | | | 0.72 | |
Distributions to shareholders from | | | | | | | | | | | | | | | | | | | | |
Net investment income | | | (0.16 | ) | | | (0.42 | ) | | | (0.12 | ) | | | (0.47 | ) | | | (0.41 | ) |
Net realized gains | | | (0.03 | ) | | | (0.09 | ) | | | 0.00 | | | | 0.00 | | | | 0.00 | |
| | | | | | | | | | | | | | | | | | | | |
Total distributions to shareholders | | | (0.19 | ) | | | (0.51 | ) | | | (0.12 | ) | | | (0.47 | ) | | | (0.41 | ) |
Net asset value, end of period | | $ | 12.29 | | | $ | 12.03 | | | $ | 12.00 | | | $ | 11.60 | | | $ | 10.82 | |
Total return4 | | | 3.75 | % | | | 4.67 | % | | | 4.52 | % | | | 11.79 | % | | | 6.99 | % |
Ratios to average net assets (annualized) | | | | | | | | | | | | | | | | | | | | |
Gross expenses | | | 0.90 | % | | | 0.90 | % | | | 0.97 | % | | | 1.07 | % | | | 1.08 | % |
Net expenses | | | 0.90 | % | | | 0.90 | % | | | 0.92 | % | | | 0.94 | % | | | 0.94 | % |
Net investment income | | | 2.60 | % | | | 3.14 | % | | | 3.00 | % | | | 3.25 | % | | | 3.94 | % |
Supplemental data | | | | | | | | | | | | | | | | | | | | |
Portfolio turnover rate | | | 119 | % | | | 215 | % | | | 84 | % | | | 187 | % | | | 455 | % |
Net assets, end of period (000’s omitted) | | | $194,147 | | | | $189,051 | | | | $198,176 | | | | $188,551 | | | | $177,010 | |
| 1. | For the three months ended August 31, 2010. The Fund changed its fiscal year end from May 31 to August 31, effective August 31, 2010. |
| 2. | For the period from July 18, 2008 (commencement of class operations) to May 31, 2009. |
| 3. | Calculated based upon average shares outstanding. |
| 4. | Returns for periods of less than one year are not annualized. |
The accompanying notes are an integral part of these financial statements.
| | | | |
| 26 | | Wells Fargo Advantage Income Plus Fund | | Notes to Financial Statements (Unaudited) |
1. ORGANIZATION
Wells Fargo Funds Trust (the “Trust”), a Delaware statutory trust organized on March 10, 1999, is an open-end management investment company registered under the Investment Company Act of 1940, as amended (the “1940 Act”). These financial statements report on Wells Fargo Advantage Income Plus Fund (the “Fund”) which is a diversified series of the Trust.
2. SIGNIFICANT ACCOUNTING POLICIES
The following significant accounting policies, which are consistently followed in the preparation of the financial statements of the Fund, are in conformity with U.S. generally accepted accounting principles which require management to make estimates and assumptions that affect the reported amounts of assets and liabilities, disclosure of contingent assets and liabilities at the date of the financial statements, and the reported amounts of revenues and expenses during the reporting period. Actual results could differ from those estimates.
Securities valuation
Fixed income securities with original maturities exceeding 60 days are valued based on available evaluated prices received from an independent pricing service approved by the Board of Trustees which may utilize both transaction data and market information such as yield, prices of securities of comparable quality, coupon rate, maturity, type of issue, trading characteristics and other market data. If valuations are not available from the pricing service or values received are deemed not representative of market value, values will be obtained from a third party broker-dealer or determined based on the Fund’s Fair Value Procedures.
Debt securities of sufficient credit quality with original maturities of 60 days or less generally are valued at amortized cost which approximates fair value. The amortized cost method involves valuing a security at its cost, plus accretion of discount or minus amortization of premium over the period until maturity.
Investments in equity securities are valued each business day as of the close of regular trading on the New York Stock Exchange, which is usually 4:00 p.m. (Eastern Time). Securities which are traded on a national or foreign securities exchange are valued at the last reported sales price, except that securities listed on The Nasdaq Stock Market, Inc. (“Nasdaq”) are valued at the Nasdaq Official Closing Price (“NOCP”), and if no NOCP is available, then at the last reported sales price. If no sales price is shown on the Nasdaq, the bid price will be used. In the absence of any sale of securities listed on the Nasdaq, and in the case of other securities (including U.S. Government obligations, but excluding debt securities maturing in 60 days or less), the price will be deemed “stale” and the valuations will be determined in accordance with the Fund’s Fair Value Procedures.
Investments in open-end mutual funds and non-registered investment companies are generally valued at net asset value.
Investments which are not valued using any of the methods discussed above, are valued at their fair value, as determined by procedures established in good faith and approved by the Board of Trustees.
Security loans
The Fund may lend its securities from time to time in order to earn additional income in the form of fees or interest on securities received as collateral or the investment of any cash received as collateral. The Fund continues to receive interest or dividends on the securities loaned. The Fund receives collateral in the form of cash or securities with a value at least equal to the value of the securities on loan. The value of the loaned securities is determined at the close of each business day and any additional required collateral is delivered to the Fund on the next business day. In a securities lending transaction, the net asset value of the Fund will be affected by an increase or decrease in the value of the securities loaned and by an increase or decrease in the value of the instrument in which collateral is invested. The amount of securities lending activity undertaken by the Fund fluctuates from time to time. In the event of default or bankruptcy by the borrower, the Fund may be prevented from recovering the loaned securities or gaining access to the collateral or may experience delays or costs in doing so. In addition, the investment of any cash collateral received may lose all or part of its value. The Fund has the right under the lending agreement to recover the securities from the borrower on demand.
The Fund lends its securities through an unaffiliated securities lending agent. Cash collateral received in connection with its securities lending transactions is invested in Wells Fargo Securities Lending Cash Investments, LLC (the “Cash Collateral Fund”). The Cash Collateral Fund is exempt from registration under Section 3(c)(7) of the 1940 Act and is managed by Wells Fargo Funds Management LLC (“Funds Management”) and is sub-advised by Wells Capital Management
| | | | | | |
| Notes to Financial Statements (Unaudited) | | Wells Fargo Advantage Income Plus Fund | | | 27 | |
Incorporated (“Wells Capital Management”). Funds Management receives an advisory fee starting at 0.05% and declining to 0.01% as the average daily net assets of the Cash Collateral Fund increase. All of the fees received by Funds Management are paid to Wells Capital Management for its services as sub-adviser. The Cash Collateral Fund seeks to provide a positive return compared to the daily Fed Funds Open rate by investing in high-quality, U.S. dollar-denominated short-term money market instruments. Cash Collateral Fund investments are fair valued based upon the amortized cost valuation technique. Income earned from investment in the Cash Collateral Fund is included in securities lending income on the Statement of Operations.
For Wells Fargo Advantage Funds that participated in securities lending activity prior to February 13, 2009, certain structured investment vehicles purchased in a joint account by the former securities lending agent defaulted or were impaired. Certain of the Wells Fargo Advantage Funds still hold ownership interest in these structured investment vehicles, which have since been restructured as pass-through securities. If the Fund holds an ownership interest in such pass-through securities, information regarding this ownership interest can be found in the Portfolio of Investments under the category “Other”.
When-issued transactions
The Fund may purchase securities on a forward commitment or ‘when-issued’ basis. The Fund records a when-issued transaction on the trade date and will segregate assets to cover its obligation by confirming the availability of qualifying assets having a value sufficient to make payment for the securities purchased. Securities purchased on a when-issued basis are marked-to-market daily and the Fund begins earning interest on the settlement date. Losses may arise due to changes in the market value of the underlying securities or if the counterparty does not perform under the contract.
Futures contracts
The Fund may be subject to interest rate risk in the normal course of pursuing its investment objectives. The Fund may buy and sell futures contracts in order to gain exposure to, or protect against, changes in security values and interest rates. The primary risks associated with the use of futures contracts are the imperfect correlation between changes in market values of securities held by the Fund and the prices of futures contracts, and the possibility of an illiquid market.
Futures contracts are valued based upon their quoted daily settlement prices when available. The aggregate principal amounts of the contracts are not recorded in the financial statements. Fluctuations in the value of the contracts are recorded in the Statement of Assets and Liabilities as an asset or liability and in the Statement of Operations as unrealized gains or losses until the contracts are closed, at which point they are recorded as net realized gains or losses on futures contracts. With futures contracts, there is minimal counterparty risk to the Fund since futures are exchange traded and the exchange’s clearinghouse, as counterparty to all exchange traded futures, guarantees the futures against default.
Mortgage dollar roll transactions
The Fund may engage in mortgage dollar roll transactions with respect to mortgage-backed securities issued by Government National Mortgage Association (GNMA), Federal National Mortgage Association (FNMA) and Federal Home Loan Mortgage Corporation (FHLMC). In a mortgage dollar roll transaction, the Fund sells a mortgage-backed security to a financial institution, such as a bank or broker-dealer and simultaneously agrees to repurchase a substantially similar security from the institution at a later date at an agreed upon price. The mortgage-backed securities that are repurchased will bear the same interest rate as those sold, but generally will be collateralized by different pools of mortgages with different pre-payment histories. During the roll period, the Fund foregoes principal and interest paid on the securities. The Fund is compensated by the difference between the current sales price and the forward price for the future purchase as well as by the earnings on the cash proceeds of the initial sale. Mortgage dollar rolls may be renewed without physical delivery of the securities subject to the contract. The Fund accounts for TBA dollar roll transactions as purchases and sales.
Security transactions and income recognition
Securities transactions are recorded on a trade date basis. Realized gains or losses are reported on the basis of identified cost of securities delivered.
Interest income is accrued daily and bond discounts are accreted and premiums are amortized daily based on the effective interest method. To the extent debt obligations are placed on non-accrual status, any related interest income may be reduced by writing off interest receivables when the collection of all or a portion of interest has become doubtful based on consistently applied procedures. If the issuer subsequently resumes interest payments or when the collectability of interest is reasonably assured, the debt obligation is removed from non-accrual status.
| | | | |
| 28 | | Wells Fargo Advantage Income Plus Fund | | Notes to Financial Statements (Unaudited) |
Dividend income is recognized on the ex-dividend date.
Distributions to shareholders
Distributions to shareholders from net investment income are accrued daily and paid monthly. Distributions from net realized gains, if any, are recorded on the ex-dividend date. Such distributions are determined in conformity with income tax regulations, which may differ from generally accepted accounting principles.
Federal and other taxes
The Fund intends to continue to qualify as a regulated investment company by distributing substantially all of its investment company taxable income and any net realized capital gains (after reduction for capital loss carryforwards) sufficient to relieve it from all, or substantially all, federal income taxes. Accordingly, no provision for federal income taxes was required.
The Fund’s income and federal excise tax returns and all financial records supporting those returns for the prior three fiscal years are subject to examination by the federal and Delaware revenue authorities.
Under the recently enacted Regulated Investment Company Modernization Act of 2010, the Fund is permitted to carry forward capital losses incurred in taxable years which began after December 22, 2010 for an unlimited period. However, any losses incurred are required to be utilized prior to the losses incurred in pre-enactment taxable years. As a result of this ordering rule, pre-enactment capital loss carryforwards may be more likely to expire unused. Additionally, post-enactment capital losses that are carried forward will retain their character as either short-term or long-term capital losses rather than being considered all short-term as under previous law.
At August 31, 2011, net capital loss carryforwards, which were available to offset future net realized capital gains, were as follows:
| | | | | | | | |
Expiration |
| 2013 | | 2014 | | 2015 | | 2016 | | 2017 |
| $869,776 | | $4,304,664 | | $9,072,772 | | $21,588,119 | | $10,272,813 |
Class allocations
The separate classes of shares offered by the Fund differ principally in applicable sales charges, distribution, shareholder servicing and administration fees. Shareholders of each class bear certain expenses that pertain to that particular class. All shareholders bear the common expenses of the Fund, earn income from the portfolio, and are allocated unrealized gains and losses pro rata based on the average daily net assets of each class, without distinction between share classes. Dividends are determined separately for each class based on income and expenses allocable to each class. Realized gains and losses are allocated to each class pro rata based upon the net assets of each class on the date realized. Differences in per share dividend rates generally result from the relative weightings of pro rata income and realized gain allocations and from differences in separate class expenses, including distribution, shareholder servicing and administration fees.
3. FAIR VALUATION MEASUREMENTS
Fair value measurements of investments are determined within a framework that has established a fair value hierarchy based upon the various data inputs utilized in determining the value of the Fund’s investments. The three-level hierarchy gives the highest priority to unadjusted quoted prices in active markets for identical assets or liabilities (Level 1) and the lowest priority to significant unobservable inputs (Level 3). The Fund’s investments are classified within the fair value hierarchy based on the lowest level of input that is significant to the fair value measurement. The inputs are summarized into three broad levels as follows:
| n | | Level 1 – quoted prices in active markets for identical securities |
| n | | Level 2 – other significant observable inputs (including quoted prices for similar securities, interest rates, prepayment speeds, credit risk, etc.) |
| n | | Level 3 – significant unobservable inputs (including the Fund’s own assumptions in determining the fair value of investments) |
The inputs or methodologies used for valuing securities are not necessarily an indication of the risk associated with investing in those securities.
| | | | | | |
| Notes to Financial Statements (Unaudited) | | Wells Fargo Advantage Income Plus Fund | | | 29 | |
As of February 29, 2012, the inputs used in valuing the Fund’s assets, which are carried at fair value, were as follows:
| | | | | | | | | | | | | | | | |
| Investments in Securities | | Quoted Prices
(Level 1) | | | Significant Other
Observable Inputs
(Level 2) | | | Significant
Unobservable Inputs
(Level 3) | | | Total | |
| | | | |
Agency securities | | $ | 0 | | | $ | 219,324,083 | | | $ | 0 | | | $ | 219,324,083 | |
| | | | |
Asset-backed securities | | | 0 | | | | 6,530,043 | | | | 0 | | | | 6,530,043 | |
| | | | |
Corporate bonds and notes | | | 0 | | | | 182,786,318 | | | | 0 | | | | 182,786,318 | |
| | | | |
Municipal bonds and notes | | | 0 | | | | 6,680,199 | | | | 0 | | | | 6,680,199 | |
| | | | |
Non-agency mortgage backed securities | | | 0 | | | | 26,995,603 | | | | 0 | | | | 26,995,603 | |
| | | | |
U.S. Treasury securities | | | 206,305,340 | | | | 0 | | | | 0 | | | | 206,305,340 | |
| | | | |
Yankee corporate bonds and notes | | | 0 | | | | 61,173,942 | | | | 0 | | | | 61,173,942 | |
| | | | |
Yankee government bonds | | | 0 | | | | 2,683,200 | | | | 0 | | | | 2,683,200 | |
| | | | |
Other | | | 0 | | | | 0 | | | | 1,693,052 | | | | 1,693,052 | |
| | | | |
Short-term investments | | | | | | | | | | | | | | | | |
Investment companies | | | 113,692,336 | | | | 2,519,956 | | | | 0 | | | | 116,212,292 | |
U.S. Treasury securities | | | 499,971 | | | | 0 | | | | 0 | | | | 499,971 | |
| | | $ | 320,497,647 | | | $ | 508,693,344 | | | $ | 1,693,052 | | | $ | 830,884,043 | |
Further details on the major security types listed above can be found in the Portfolio of Investments.
As of February 29, 2012, the inputs used in valuing the Fund’s other financial instruments, which are carried at fair value, were as follows:
| | | | | | | | | | | | | | | | |
| Other financial instruments | | Quoted Prices
(Level 1) | | | Significant Other
Observable Inputs
(Level 2) | | | Significant
Unobservable Inputs
(Level 3) | | | Total | |
Futures contracts+ | | $ | (52,500 | ) | | $ | 0 | | | $ | 0 | | | $ | (52,500 | ) |
| + | Futures contracts are presented at the unrealized gains or losses on the instrument. |
Transfers in and transfers out are recognized at the end of the reporting period. For the six months ended February 29, 2012, the Fund did not have any significant transfers into/out of Level 1 and Level 2.
The following is a reconciliation of assets in which significant unobservable inputs (Level 3) were used in determining fair value:
| | | | | | | | | | | | |
| | | Preferred
stocks | | | Other | | | Total | |
Balance as of August 31, 2011 | | $ | 52,650 | | | $ | 2,312,454 | | | $ | 2,365,104 | |
Accrued discounts (premiums) | | | 0 | | | | 0 | | | | 0 | |
Realized gains (losses) | | | (4,085 | ) | | | 0 | | | | (4,085 | ) |
Change in unrealized gains (losses) | | | 2,485 | | | | (353,648 | ) | | | (351,163 | ) |
Purchases | | | 0 | | | | 0 | | | | 0 | |
Sales | | | (51,050 | ) | | | (265,754 | ) | | | (316,804 | ) |
Transfers into Level 3 | | | 0 | | | | 0 | | | | 0 | |
Transfers out of Level 3 | | | 0 | | | | 0 | | | | 0 | |
Balance as of February 29, 2012 | | $ | 0 | | | $ | 1,693,052 | | | $ | 1,693,052 | |
Change in unrealized gains (losses)
relating to securities still held at February 29, 2012 | | $ | 0 | | | $ | (483,891 | ) | | $ | (483,891 | ) |
| | | | |
| 30 | | Wells Fargo Advantage Income Plus Fund | | Notes to Financial Statements (Unaudited) |
4. TRANSACTIONS WITH AFFILIATES AND OTHER EXPENSES
Advisory fee
The Trust has entered into an advisory contract with Funds Management, an indirect wholly owned subsidiary of Wells Fargo & Company (“Wells Fargo”). The adviser is responsible for implementing investment policies and guidelines and for supervising the sub-adviser, who is responsible for day-to-day portfolio management of the Fund.
Pursuant to the contract, Funds Management is entitled to receive an annual advisory fee starting at 0.40% and declining to 0.30% as the average daily net assets of the Fund increase. For the six months ended February 29, 2012, the advisory fee was equivalent to an annual rate of 0.39% of the Fund’s average daily net assets.
Funds Management has retained the services of certain sub-advisers to provide daily portfolio management to the Fund. The fees related to sub-advisory services are borne directly by Funds Management and do not increase the overall fees paid by the Fund. Wells Capital Management, an affiliate of Funds Management, is the sub-adviser to the Fund and is entitled to receive a fee from Funds Management at an annual rate starting at 0.20% and declining to 0.10% as the average daily net assets of the Fund increase.
Administration and transfer agent fees
The Trust has entered into an administration agreement with Funds Management. Under this agreement, for providing administrative services, which includes paying fees and expenses for services provided by the transfer agent, sub-transfer agents, omnibus account servicers and record-keepers, Funds Management is entitled to receive from the Fund an annual fund level administration fee starting at 0.05% and declining to 0.03% as the average daily net assets of the Fund increase and a class level administration fee which is calculated based on the average daily net assets of each class as follows:
| | | | |
| | | Class Level
Administration Fee | |
Class A, Class B, Class C | | | 0.16 | % |
Administrator Class | | | 0.10 | |
Institutional Class | | | 0.08 | |
Investor Class | | | 0.19 | |
Funds Management has contractually waived and/or reimbursed advisory and administration fees to the extent necessary to maintain certain net operating expense ratios for the Fund. Waiver of fees and/or reimbursement of expenses by Funds Management were made first from fund level expenses on a proportionate basis and then from class specific expenses. Funds Management has committed through July 11, 2013 to waive fees and/or reimburse expenses to the extent necessary to cap the Fund’s expenses at 0.87% for Class A, 1.62% for Class B, 1.62% for Class C, 0.72% for Administrator Class, 0.58% for Institutional Class and 0.90% for Investor Class.
Distribution fees
The Trust has adopted a Distribution Plan for Class B and Class C shares of the Fund pursuant to Rule 12b-1 under the 1940 Act. Distribution fees are charged to Class B and Class C shares and paid to Wells Fargo Funds Distributor, LLC, the principal underwriter, at an annual rate of 0.75% of the average daily net assets of Class B and Class C shares.
For the six months ended February 29, 2012, Wells Fargo Funds Distributor, LLC received $14,237 from the sale of Class A shares and $10, $1,073 and $1,914 in contingent deferred sales charges from redemptions of Class A, Class B and Class C shares, respectively.
Shareholder servicing fees
The Trust has entered into contracts with one or more shareholder servicing agents, whereby Class A, Class B, Class C, Administrator Class and Investor Class of the Fund is charged a fee at an annual rate of 0.25% of the average daily net assets of each respective class.
A portion of these total shareholder servicing fees were paid to affiliates of Wells Fargo.
| | | | | | |
| Notes to Financial Statements (Unaudited) | | Wells Fargo Advantage Income Plus Fund | | | 31 | |
5. INVESTMENT PORTFOLIO TRANSACTIONS
Purchases and sales of investments, excluding short-term securities (securities with maturities of one year or less at purchase date), for the six months ended February 29, 2012 were as follows:
| | | | | | |
| Purchases at Cost | | Sales Proceeds |
| U.S. Government | | Non-U.S. Government | | U.S. Government | | Non-U.S. Government |
| $751,508,755 | | $112,230,473 | | $696,812,720 | | $107,784,370 |
6. DERIVATIVE TRANSACTIONS
During the six months ended February 29, 2012, the Fund entered into futures contracts to speculate on interest rates.
At February 29, 2012, the Fund had long and short futures contracts outstanding as follows:
| | | | | | | | | | | | |
| Expiration Date | | Contracts | | Type | | Contract
Value at
February 29, 2012 | | | Net Unrealized
Gains (Losses) | |
| June 2012 | | 26 Long | | 2-Year U.S. Treasury Notes | | $ | 5,726,094 | | | $ | (456 | ) |
| June 2012 | | 123 Long | | 5-Year U.S. Treasury Notes | | | 15,150,141 | | | | 3,610 | |
| June 2012 | | 135 Short | | 10-Year U.S. Treasury Notes | | | 17,678,672 | | | | (46,663 | ) |
| June 2012 | | 94 Short | | 30-Year U.S. Treasury Bonds | | | 13,315,688 | | | | (8,991 | ) |
The Fund had an average notional amount of $10,644,213 and $20,275,580 in long and short futures contracts, respectively, during the six months ended February 29, 2012.
On February 29, 2012, the cumulative unrealized losses on futures contracts in the amount of $52,500 is reflected in net unrealized gains on investments on the Statement of Assets and Liabilities. The receivable for daily variation margin on open futures contracts reflected in the Statement of Assets and Liabilities only represents the current day’s variation margin. The realized losses and change in unrealized gains (losses) on futures contracts are reflected in the Statement of Operations.
7. BANK BORROWINGS
The Trust (excluding the money market funds) and Wells Fargo Variable Trust are parties to a $150,000,000 revolving credit agreement with State Street Bank and Trust Company, whereby the Fund is permitted to use bank borrowings for temporary or emergency purposes, such as to fund shareholder redemption requests. Interest under the credit agreement is charged to the Fund based on a borrowing rate equal to the higher of the Federal Funds rate in effect on that day plus 1.25% or the overnight LIBOR rate in effect on that day plus 1.25%. In addition, an annual commitment fee equal to 0.10% of the unused balance is allocated to each participating fund. Prior to September 6, 2011, the revolving credit agreement was for $125,000,000 and the annual commitment fee paid by the Fund was 0.125% of the unused balance. For the six months ended February 29, 2012, the Fund paid $484 in commitment fees.
For the six months ended February 29, 2012, there were no borrowings by the Fund under the agreement.
8. INDEMNIFICATION
Under the Trust’s organizational documents, the officers and directors are indemnified against certain liabilities that may arise out of performance of their duties to the Trust. Additionally, in the normal course of business, the Trust may enter into contracts with service providers that contain a variety of indemnification clauses. The Trust’s maximum exposure under these arrangements is dependent on future claims that may be made against the Fund and, therefore, cannot be estimated.
9. NEW ACCOUNTING PRONOUNCEMENTS
In May 2011, the Financial Accounting Standards Board (“FASB”) issued Accounting Standards Update (“ASU”) No. 2011-04 “Amendments to Achieve Common Fair Value Measurement and Disclosure Requirements in U.S. GAAP and IFRSs”. ASU No. 2011-04 amends FASB ASC Topic 820, Fair Value Measurements and Disclosures, to establish common requirements for measuring fair value and for disclosing information about fair value measurements in accordance with
| | | | |
| 32 | | Wells Fargo Advantage Income Plus Fund | | Notes to Financial Statements (Unaudited) |
GAAP. The ASU is effective prospectively for interim and annual periods beginning after December 15, 2011. Management expects that adoption of the ASU will result in additional disclosures in the financial statements, as applicable.
In April 2011, FASB issued ASU No. 2011-03 “Reconsideration of Effective Control for Repurchase Agreements”. ASU No. 2011-03 amends FASB ASC Topic 860, Transfers and Servicing, specifically the criteria required to determine whether a repurchase agreement (repo) and similar agreements should be accounted for as sales of financial assets or secured borrowings with commitments. ASU No. 2011-03 changes the assessment of effective control by focusing on the transferor’s contractual rights and obligations and removing the criterion to assess its ability to exercise those rights or honor those obligations. This could result in changes to the way entities account for certain transactions including repurchase agreements, mortgage dollar rolls and reverse repurchase agreements. The ASU will become effective on a prospective basis for new transfers and modifications to existing transactions as of the beginning of the first interim or annual period beginning on or after December 15, 2011. Management has evaluated the impact of adopting the ASU and expects no significant changes.
| | | | | | |
| Other Information (Unaudited) | | Wells Fargo Advantage Income Plus Fund | | | 33 | |
PROXY VOTING INFORMATION
A description of the policies and procedures that the Fund uses to determine how to vote proxies relating to portfolio securities is available without charge, upon request, by calling 1-800-222-8222, visiting our Web site at wellsfargoadvantagefunds.com, or visiting the SEC Web site at sec.gov. Information regarding how the Fund voted proxies relating to portfolio securities during the most recent 12-month period ended June 30 is available without charge on the Fund’s Web site at wellsfargoadvantagefunds.com or by visiting the SEC Web site at sec.gov.
PORTFOLIO HOLDINGS INFORMATION
The complete portfolio holdings for the Fund are publicly available on the Fund’s Web site (wellsfargoadvantagefunds.com) on a monthly, 30-day or more delayed basis. In addition, top ten holdings information for the Fund is publicly available on the Fund’s Web site on a monthly, seven-day or more delayed basis. The Fund files its complete schedule of portfolio holdings with the SEC for the first and third quarters of each fiscal year on Form N-Q, which is available without charge by visiting the SEC Web site at sec.gov. In addition, the Fund’s Form N-Q may be reviewed and copied at the SEC’s Public Reference Room in Washington, DC, and at regional offices in New York City, at 233 Broadway, and in Chicago, at 175 West Jackson Boulevard, Suite 900. Information about the Public Reference Room may be obtained by calling 1-800-SEC-0330.
| | | | |
| 34 | | Wells Fargo Advantage Income Plus Fund | | Other Information (Unaudited) |
BOARD OF TRUSTEES
The following table provides basic information about the Board of Trustees (the “Trustees”) of the Trust and Officers of the Trust. This table should be read in conjunction with the Prospectus and the Statement of Additional Information1 of the Fund. Each of the Trustees and Officers listed below acts in identical capacities for the Wells Fargo Advantage family of funds, which consists of 137 funds comprising the Wells Fargo Funds Trust, Wells Fargo Variable Trust, Wells Fargo Master Trust and four closed-end funds (collectively the “Fund Complex”). All of the Trustees are also Members of the Audit and Governance Committees of each Trust in the Fund Complex. The mailing address of each Trustee and Officer is 525 Market Street, 12th Floor, San Francisco, CA 94105. Each Trustee and Officer serves an indefinite term, however, each Trustee serves such term until reaching the mandatory retirement age established by the Trustees.
Independent Trustees
| | | | | | |
Name and Year of Birth | | Position Held and Length of Service | | Principal Occupations During Past Five Years | | Other Directorships During
Past Five Years |
Peter G. Gordon
(Born 1942) | | Trustee, since 1998; Chairman, since 2005 (Lead Trustee since 2001) | | Co-Founder, Retired Chairman, President and CEO of Crystal Geyser Water Company. Trustee Emeritus, Colby College | | Asset Allocation Trust |
Isaiah Harris, Jr.
(Born 1952) | | Trustee, since 2009 | | Retired. Prior thereto, President and CEO of BellSouth Advertising and Publishing Corp. from 2005 to 2007, President and CEO of BellSouth Enterprises from 2004 to 2005 and President of BellSouth Consumer Services from 2000 to 2003. Emeritus member of the Iowa State University Foundation Board of Governors. Emeritus Member of the Advisory Board of Iowa State University School of Business. Mr. Harris is a certified public accountant. | | CIGNA Corporation; Deluxe Corporation; Asset Allocation Trust |
Judith M. Johnson
(Born 1949) | | Trustee, since 2008 | | Retired. Prior thereto, Chief Executive Officer and Chief Investment Officer of Minneapolis Employees Retirement Fund from 1996 to 2008. Ms. Johnson is an attorney, certified public accountant and a certified managerial accountant. | | Asset Allocation Trust |
Leroy Keith, Jr.
(Born 1939) | | Trustee, since 2010 | | Chairman, Bloc Global Services (development and construction). Trustee of the Evergreen Funds from 1983 to 2010. Former Managing Director, Almanac Capital Management (commodities firm), former Partner, Stonington Partners, Inc. (private equity fund), former Director, Obagi Medical Products Co. and former Director, Lincoln Educational Services. | | Trustee, Virtus Fund Complex (consisting of 40 portfolios as of 12/31/11); Asset Allocation Trust |
David F. Larcker
(Born 1950) | | Trustee, since 2009 | | James Irvin Miller Professor of Accounting at the Graduate School of Business, Stanford University, Director of Corporate Governance Research Program and Senior Faculty of The Rock Center for Corporate Governance since 2006. From 2005 to 2008, Professor of Accounting at the Graduate School of Business, Stanford University. Prior thereto, Ernst & Young Professor of Accounting at The Wharton School, University of Pennsylvania from 1985 to 2005. | | Asset Allocation Trust |
Olivia S. Mitchell
(Born 1953) | | Trustee, since 2006 | | International Foundation of Employee Benefit Plans Professor, Wharton School of the University of Pennsylvania since 1993. Director of Wharton’s Pension Research Council and Boettner Center on Pensions & Retirement Research, and Research Associate at the National Bureau of Economic Research. Previously, Cornell University Professor from 1978 to 1993. | | Asset Allocation Trust |
| | | | | | |
| Other Information (Unaudited) | | Wells Fargo Advantage Income Plus Fund | | | 35 | |
| | | | | | |
Name and Year of Birth | | Position Held and Length of Service | | Principal Occupations During Past Five Years | | Other Directorships During
Past Five Years |
Timothy J. Penny
(Born 1951) | | Trustee, since 1996 | | President and CEO of Southern Minnesota Initiative Foundation, a non-profit organization, since 2007 and Senior Fellow at the Humphrey Institute Policy Forum at the University of Minnesota since 1995. Member of the Board of Trustees of NorthStar Education Finance, Inc., a non-profit organization, since 2007. | | Asset Allocation Trust |
Michael S. Scofield
(Born 1943) | | Trustee, since 2010 | | Served on the Investment Company Institute’s Board of Governors and Executive Committee from 2008-2011 as well the Governing Council of the Independent Directors Council from 2006-2011 and the Independent Directors Council Executive Committee from 2008-2011. Chairman of the IDC from 2008-2010. Institutional Investor (Fund Directions) Trustee of Year in 2007. Trustee of the Evergreen Funds (and its predecessors) from 1984 to 2010. Chairman of the Evergreen Funds from 2000-2010. Former Trustee of the Mentor Funds. Retired Attorney, Law Offices of Michael S. Scofield and former Director and Chairman, Branded Media Corporation (multi-media branding company). | | Asset Allocation Trust |
Donald C. Willeke
(Born 1940) | | Trustee, since 1996 | | Principal of the law firm of Willeke & Daniels. General Counsel of the Minneapolis Employees Retirement Fund from 1984 until its consolidation into the Minnesota Public Employees Retirement Association on June 30, 2010. Director and Vice Chair of The Free Trust (non-profit corporation). Director of the American Chestnut Foundation (non-profit corporation). | | Asset Allocation Trust |
Officers
| | | | | | |
Name and Year of Birth | | Position Held and
Length of Service | | Principal Occupations During Past Five Years | | |
Karla M. Rabusch
(Born 1959) | | President, since 2003 | | Executive Vice President of Wells Fargo Bank, N.A. and President of Wells Fargo Funds Management, LLC since 2003. Senior Vice President and Chief Administrative Officer of Wells Fargo Funds Management, LLC from 2001 to 2003. | | |
C. David Messman
(Born 1960) | | Secretary, since 2000; Chief Legal Counsel, since 2003 | | Senior Vice President and Secretary of Wells Fargo Funds Management, LLC since 2001. Vice President and Managing Senior Counsel of Wells Fargo Bank, N.A. since 1996. | | |
Kasey Phillips
(Born 1970) | | Treasurer, since 2009 | | Senior Vice President of Wells Fargo Funds Management, LLC since 2009. Senior Vice President of Evergreen Investment Management Company, LLC from 2006 to 2010. Treasurer of the Evergreen Funds from 2005 to 2010. | | |
David Berardi
(Born 1975) | | Assistant Treasurer, since 2009 | | Vice President of Wells Fargo Funds Management, LLC since 2009. Vice President of Evergreen Investment Management Company, LLC from 2008 to 2010. Assistant Vice President of Evergreen Investment Services, Inc. from 2004 to 2008. Manager of Fund Reporting and Control for Evergreen Investment Management Company, LLC from 2004 to 2010. | | |
Jeremy DePalma
(Born 1974) | | Assistant Treasurer, since 2009 | | Senior Vice President of Wells Fargo Funds Management, LLC since 2009. Senior Vice President of Evergreen Investment Management Company, LLC from 2008 to 2010. Vice President, Evergreen Investment Services, Inc. from 2004 to 2007. Head of the Fund Reporting and Control Team within Fund Administration from 2005 to 2010. | | |
Debra Ann Early
(Born 1964) | | Chief Compliance Officer, since 2007 | | Chief Compliance Officer of Wells Fargo Funds Management, LLC since 2007. Chief Compliance Officer of Parnassus Investments from 2005 to 2007. Chief Financial Officer of Parnassus Investments from 2004 to 2007 and Senior Audit Manager of PricewaterhouseCoopers LLP from 1998 to 2004. | | |
| 1. | The Statement of Additional Information includes additional information about the Trustees and is available, without charge, upon request, by calling 1-800-222-8222 or by visiting the Web site at wellsfargoadvantagefunds.com. |
| | | | |
| 36 | | Wells Fargo Advantage Income Plus Fund | | List of Abbreviations |
The following is a list of common abbreviations for terms and entities which may have appeared in this report.
| ACB | — Agricultural Credit Bank |
| ADR | — American Depository Receipt |
| ADS | — American Depository Shares |
| AGC-ICC | — Assured Guaranty Corporation - Insured Custody Certificates |
| AGM | — Assured Guaranty Municipal |
| AMBAC | — American Municipal Bond Assurance Corporation |
| AMT | — Alternative Minimum Tax |
| BAN | — Bond Anticipation Notes |
| BHAC | — Berkshire Hathaway Assurance Corporation |
| CAB | — Capital Appreciation Bond |
| CCAB | — Convertible Capital Appreciation Bond |
| CDA | — Community Development Authority |
| CDO | — Collateralized Debt Obligation |
| COP | — Certificate of Participation |
| DRIVER | — Derivative Inverse Tax-Exempt Receipts |
| DW&P | — Department of Water & Power |
| DWR | — Department of Water Resources |
| ECFA | — Educational & Cultural Facilities Authority |
| EDA | — Economic Development Authority |
| EDFA | — Economic Development Finance Authority |
| ETF | — Exchange-Traded Fund |
| FFCB | — Federal Farm Credit Bank |
| FGIC | — Financial Guaranty Insurance Corporation |
| FHA | — Federal Housing Authority |
| FHLB | — Federal Home Loan Bank |
| FHLMC | — Federal Home Loan Mortgage Corporation |
| FNMA | — Federal National Mortgage Association |
| GDR | — Global Depository Receipt |
| GNMA | — Government National Mortgage Association |
| HCFR | — Healthcare Facilities Revenue |
| HEFA | — Health & Educational Facilities Authority |
| HEFAR | — Higher Education Facilities Authority Revenue |
| HFA | — Housing Finance Authority |
| HFFA | — Health Facilities Financing Authority |
| IBC | — Insured Bond Certificate |
| IDA | — Industrial Development Authority |
| IDAG | — Industrial Development Agency |
| IDR | — Industrial Development Revenue |
| KRW | — Republic of Korea Won |
| LIBOR | — London Interbank Offered Rate |
| LLC | — Limited Liability Company |
| LLP | — Limited Liability Partnership |
| MBIA | — Municipal Bond Insurance Association |
| MFHR | — Multi-Family Housing Revenue |
| MSTR | — Municipal Securities Trust Receipts |
| MUD | — Municipal Utility District |
| NATL-RE | — National Public Finance Guarantee Corporation |
| PCFA | — Pollution Control Finance Authority |
| PCR | — Pollution Control Revenue |
| PFA | — Public Finance Authority |
| PFFA | — Public Facilities Financing Authority |
| PFOTER | — Puttable Floating Option Tax-Exempt Receipts |
| plc | — Public Limited Company |
| PUTTER | — Puttable Tax-Exempt Receipts |
| R&D | — Research & Development |
| RDA | — Redevelopment Authority |
| RDFA | — Redevelopment Finance Authority |
| REIT | — Real Estate Investment Trust |
| ROC | — Reset Option Certificates |
| SAVRS | — Select Auction Variable Rate Securities |
| SBA | — Small Business Authority |
| SFHR | — Single Family Housing Revenue |
| SFMR | — Single Family Mortgage Revenue |
| SPDR | — Standard & Poor’s Depositary Receipts |
| TAN | — Tax Anticipation Notes |
| TIPS | — Treasury Inflation-Protected Securities |
| TRAN | — Tax Revenue Anticipation Notes |
| TCR | — Transferable Custody Receipts |
| TTFA | — Transportation Trust Fund Authority |
| TVA | — Tennessee Valley Authority |
| XLCA | — XL Capital Assurance |
This page is intentionally left blank.
This page is intentionally left blank.


FOR MORE INFORMATION
More information about Wells Fargo Advantage Funds is available free upon request. To obtain literature, please write, e-mail, visit the Fund’s Web site, or call:
Wells Fargo Advantage Funds
P.O. Box 8266
Boston, MA 02266-8266
E-mail: wfaf@wellsfargo.com
Web site: wellsfargoadvantagefunds.com
Individual investors: 1-800-222-8222
Retail investment professionals: 1-888-877-9275
Institutional investment professionals: 1-866-765-0778
This report and the financial statements contained herein are submitted for the general information of the shareholders of Wells Fargo Advantage Funds. If this report is used for promotional purposes, distribution of the report must be accompanied or preceded by a current prospectus. For a prospectus containing more complete information, including charges and expenses, call 1-800-222-8222 or visit the Fund’s Web site at wellsfargoadvantagefunds.com. Please consider the investment objectives, risks, charges, and expenses of the investment carefully before investing. This and other information about Wells Fargo Advantage Funds can be found in the current prospectus. Read the prospectus carefully before you invest or send money.
Wells Fargo Funds Management, LLC, a wholly owned subsidiary of Wells Fargo & Company, provides investment advisory and administrative services for Wells Fargo Advantage Funds. Other affiliates of Wells Fargo & Company provide subadvisory and other services for the Funds. The Funds are distributed by Wells Fargo Funds Distributor, LLC, Member FINRA/SIPC, an affiliate of Wells Fargo & Company.
NOT FDIC INSURED ¡ NO BANK GUARANTEE ¡ MAY LOSE VALUE
© 2012 Wells Fargo Funds Management, LLC. All rights reserved.
| | |
 | | 208524 04-12 SA219/SAR219 2-12 |

Wells Fargo Advantage
Short Duration Government Bond Fund

Semi-Annual Report
February 29, 2012

Reduce clutter. Save trees.
Sign up for electronic delivery of prospectuses and shareholder reports at wellsfargo.com/advantagedelivery
Contents
The views expressed and any forward-looking statements are as of February 29, 2012, unless otherwise noted, and are those of the Fund managers and/or Wells Fargo Funds Management, LLC. Discussions of individual securities, or the markets generally, or any Wells Fargo Advantage Fund are not intended as individual recommendations. Future events or results may vary significantly from those expressed in any forward-looking statements; the views expressed are subject to change at any time in response to changing circumstances in the market. Wells Fargo Funds Management, LLC, disclaims any obligation to publicly update or revise any views expressed or forward-looking statements.
NOT FDIC INSURED ¡ NO BANK GUARANTEE ¡ MAY LOSE VALUE

WELLS FARGO INVESTMENT HISTORY
| | |
| |
| 1932 | | Keystone creates one of the first mutual fund families. |
| |
| 1971 | | Wells Fargo & Company introduces one of the first institutional index funds. |
| |
| 1978 | | Wells Fargo applies Markowitz and Sharpe’s research on Modern Portfolio Theory to introduce one of the industry’s first Tactical Asset Allocation (TAA) models in institutional separately managed accounts. |
| |
| 1984 | | Wells Fargo Stagecoach Funds launches its first asset allocation fund. |
| |
| 1989 | | The Tactical Asset Allocation (TAA) Model is first applied to Wells Fargo’s asset allocation mutual funds. |
| |
| 1994 | | Wells Fargo introduces the LifePath Funds, one of the first suites of target date funds (now the Wells Fargo Advantage Dow Jones Target Date FundsSM). |
| |
| 1996 | | Evergreen Investments and Keystone Funds merge. |
| |
| 1997 | | Wells Fargo launches Wells Fargo Advantage WealthBuilder PortfoliosSM, a fund-of-funds suite of products that includes the use of quantitative models to shift assets among investment styles. |
| |
| 1999 | | Norwest Advantage Funds and Stagecoach Funds are reorganized into Wells Fargo Funds after the merger of Norwest and Wells Fargo. |
| |
| 2002 | | Evergreen Retail and Evergreen Institutional companies form the umbrella asset management company, Evergreen Investments. |
| |
| 2005 | | The integration of Strong Funds with Wells Fargo Funds creates Wells Fargo Advantage Funds, resulting in one of the top 20 mutual fund companies in the United States. |
| |
| 2006 | | Wells Fargo Advantage Funds relaunches the target date product line as Wells Fargo Advantage Dow Jones Target Date Funds. |
| |
| 2010 | | The mergers and reorganizations of Evergreen and Wells Fargo Advantage mutual funds are completed, unifying the families under the brand of Wells Fargo Advantage Funds. |
Wells Fargo Advantage Funds®
Wells Fargo Advantage Funds skillfully guides institutions, financial advisors, and individuals through the investment terrain to help them reach their financial objectives. Everything we do on behalf of investors is backed by our unique combination of qualifications.
Strength
Our organization is built on the standards of integrity and service established by our parent company—Wells Fargo & Company—more than 150 years ago. And, because we’re part of a highly diversified financial enterprise, we offer the depth of resources to help investors succeed.
Expertise
Our multi-boutique model offers investors access to the independent thinking of premier investment managers that have been chosen for their time-tested strategies. While each team specializes in a specific investment strategy, collectively they provide investors a wide choice of distinct investment styles. Our dedication to investment excellence doesn’t end with our expertise in manager selection—risk management, analysis, and rigorous ongoing review seek to ensure each manager’s investment process remains consistent.
Partnership
Our collaborative approach is built around understanding the needs and goals of our clients. By adhering to core principles of sound judgment and steady guidance, we support you through every stage of the investment decision process.
Carefully consider a fund’s investment objectives, risks, charges, and expenses before investing. For a current prospectus and, if available, a summary prospectus, containing this and other information, visit wellsfargoadvantagefunds.com. Read it carefully before investing.
Wells Fargo Funds Management, LLC, a wholly owned subsidiary of Wells Fargo & Company, provides investment advisory and administrative services for Wells Fargo Advantage Funds®. Other affiliates of Wells Fargo & Company provide subadvisory and other services for the Funds. The Funds are distributed by Wells Fargo Funds Distributor, LLC, Member FINRA/SIPC, an affiliate of Wells Fargo & Company.
“Dow Jones®” and “Dow Jones Target Date IndexesSM” are service marks of Dow Jones Trademark Holdings, LLC (“Dow Jones”), have been licensed to CME Group Index Services LLC (“CME Indexes”) and have been sublicensed for use for certain purposes by Global Index Advisors, Inc, and Wells Fargo Funds Management, LLC. The Wells Fargo Advantage Dow Jones Target Date FundsSM based on the Dow Jones Target Date IndexesSM, are not sponsored, endorsed, sold or promoted by Dow Jones, CME Indexes or their respective affiliates and none of them makes any representation regarding the advisability of investing in such product(s).
NOT FDIC INSURED ¡ NO BANK GUARANTEE ¡ MAY LOSE VALUE
Not part of the semi-annual report.
Wells Fargo Advantage Funds offers more than 110 mutual funds across a wide range of asset classes, representing over $218 billion in assets under management, as of February 29, 2012.
| | | | |
| Equity Funds | | | | |
Asia Pacific Fund | | Equity Value Fund | | Precious Metals Fund |
C&B Large Cap Value Fund | | Global Opportunities Fund | | Premier Large Company Growth Fund |
C&B Mid Cap Value Fund | | Growth Fund | | Small Cap Opportunities Fund |
Capital Growth Fund | | Index Fund | | Small Cap Value Fund |
Common Stock Fund | | International Equity Fund | | Small Company Growth Fund |
Disciplined U.S. Core Fund | | International Value Fund | | Small Company Value Fund |
Discovery Fund† | | Intrinsic Small Cap Value Fund | | Small/Mid Cap Core Fund |
Diversified Equity Fund | | Intrinsic Value Fund | | Small/Mid Cap Value Fund |
Diversified International Fund | | Intrinsic World Equity Fund | | Special Mid Cap Value Fund |
Diversified Small Cap Fund | | Large Cap Core Fund | | Special Small Cap Value Fund |
Emerging Growth Fund | | Large Cap Growth Fund | | Specialized Technology Fund |
Emerging Markets Equity Fund | | Large Company Value Fund | | Strategic Large Cap Growth Fund |
Endeavor Select Fund† | | Omega Growth Fund | | Traditional Small Cap Growth Fund |
Enterprise Fund† | | Opportunity Fund† | | Utility and Telecommunications Fund |
| Bond Funds | | | | |
Adjustable Rate Government Fund | | Inflation-Protected Bond Fund | | Short-Term Bond Fund |
California Limited-Term Tax-Free Fund | | Intermediate Tax/AMT-Free Fund | | Short-Term High Yield Bond Fund |
California Tax-Free Fund | | International Bond Fund | | Short-Term Municipal Bond Fund |
Colorado Tax-Free Fund | | Minnesota Tax-Free Fund | | Strategic Municipal Bond Fund |
Government Securities Fund | | Municipal Bond Fund | | Total Return Bond Fund |
High Income Fund | | North Carolina Tax-Free Fund | | Ultra Short-Term Income Fund |
High Yield Bond Fund | | Pennsylvania Tax-Free Fund | | Ultra Short-Term Municipal Income Fund |
Income Plus Fund | | Short Duration Government Bond Fund | | Wisconsin Tax-Free Fund |
| Asset Allocation Funds | | | | |
Absolute Return Fund | | WealthBuilder Equity Portfolio† | | Target 2020 Fund† |
Asset Allocation Fund | | WealthBuilder Growth Allocation Portfolio† | | Target 2025 Fund† |
Conservative Allocation Fund | | WealthBuilder Growth Balanced Portfolio† | | Target 2030 Fund† |
Diversified Capital Builder Fund | | WealthBuilder Moderate Balanced Portfolio† | | Target 2035 Fund† |
Diversified Income Builder Fund | | WealthBuilder Tactical Equity Portfolio† | | Target 2040 Fund† |
Growth Balanced Fund | | Target Today Fund† | | Target 2045 Fund† |
Index Asset Allocation Fund | | Target 2010 Fund† | | Target 2050 Fund† |
Moderate Balanced Fund | | Target 2015 Fund† | | Target 2055 Fund† |
WealthBuilder Conservative Allocation Portfolio† | | | | |
| Money Market Funds | | | | |
100% Treasury Money Market Fund | | Heritage Money Market Fund† | | National Tax-Free Money Market Fund |
California Municipal Money Market Fund | | Money Market Fund | | Prime Investment Money Market Fund |
Cash Investment Money Market Fund | | Municipal Cash Management Money Market Fund | | Treasury Plus Money Market Fund |
Government Money Market Fund | | Municipal Money Market Fund | | |
| Variable Trust Funds1 | | | | |
VT Discovery Fund† | | VT Intrinsic Value Fund | | VT Small Cap Growth Fund |
VT Index Asset Allocation Fund | | VT Omega Growth Fund | | VT Small Cap Value Fund |
VT International Equity Fund | | VT Opportunity Fund† | | VT Total Return Bond Fund |
An investment in a money market fund is not insured or guaranteed by the Federal Deposit Insurance Corporation or any other government agency. Although the Wells Fargo Advantage Money Market Funds seek to preserve the value of your investment at $1.00 per share, it is possible to lose money by investing in a money market fund.
| 1. | The Variable Trust Funds are generally available only through insurance company variable contracts. |
| † | In this report, the Wells Fargo Advantage Discovery FundSM, Wells Fargo Advantage Endeavor Select FundSM, Wells Fargo Advantage Enterprise FundSM, Wells Fargo Advantage Opportunity FundSM, Wells Fargo Advantage WealthBuilder Conservative Allocation PortfolioSM, Wells Fargo Advantage WealthBuilder Equity PortfolioSM, Wells Fargo Advantage WealthBuilder Growth Allocation PortfolioSM, Wells Fargo Advantage WealthBuilder Growth Balanced PortfolioSM, Wells Fargo Advantage WealthBuilder Moderate Balanced PortfolioSM, Wells Fargo Advantage WealthBuilder Tactical Equity PortfolioSM, Wells Fargo Advantage Dow Jones Target Today FundSM, Wells Fargo Advantage Dow Jones Target 2010 FundSM, Wells Fargo Advantage Dow Jones Target 2015 FundSM, Wells Fargo Advantage Dow Jones Target 2020 FundSM, Wells Fargo Advantage Dow Jones Target 2025 FundSM, Wells Fargo Advantage Dow Jones Target 2030 FundSM, Wells Fargo Advantage Dow Jones Target 2035 FundSM, Wells Fargo Advantage Dow Jones Target 2040 FundSM, Wells Fargo Advantage Dow Jones Target 2045 FundSM, Wells Fargo Advantage Dow Jones Target 2050 FundSM, Wells Fargo Advantage Dow Jones Target 2055 FundSM, Wells Fargo Advantage Heritage Money Market FundSM, Wells Fargo Advantage VT Discovery FundSM, and Wells Fargo Advantage VT Opportunity FundSM are referred to as the Discovery Fund, Endeavor Select Fund, Enterprise Fund, Opportunity Fund, WealthBuilder Conservative Allocation Portfolio, WealthBuilder Equity Portfolio, WealthBuilder Growth Allocation Portfolio, WealthBuilder Growth Balanced Portfolio, WealthBuilder Moderate Balanced Portfolio, WealthBuilder Tactical Equity Portfolio, Target Today Fund, Target 2010 Fund, Target 2015 Fund, Target 2020 Fund, Target 2025 Fund, Target 2030 Fund, Target 2035 Fund, Target 2040 Fund, Target 2045 Fund, Target 2050 Fund, Target 2055 Fund, Heritage Money Market Fund, VT Discovery Fund, and VT Opportunity Fund, respectively. |
Not part of the semi-annual report.
| | | | |
| 2 | | Wells Fargo Advantage Short Duration Government Bond Fund | | Letter to Shareholders |

Karla M. Rabusch,
President
Wells Fargo Advantage Funds
The theme for the period was a shift from risk aversion in the first half to burgeoning trends of improving investor confidence in the second half, which significantly improved pricing in the lower-rated asset classes.
On the whole, investment-grade fixed-income securities performed positively during the period, but the strongest returns came from the high-yield market.
Dear Valued Shareholder:
We are pleased to offer you this semi-annual report for the Wells Fargo Advantage Short Duration Government Bond Fund, which covers the six-month period that ended February 29, 2012. During the period, fixed-income performance was best among the lower-rated securities, as improved investor confidence in the U.S. economy and the U.S. credit markets encouraged investors to return to riskier asset classes.
The period began with heightened risk aversion but ended with stronger investor confidence.
The six-month period began with the worsening of the Greek crisis, which amplified risk aversion across the global credit markets. This in turn led to a powerful rally in U.S. Treasuries and a sharp decline in high-yield bond prices, most notably in the lowest-quality credit tiers. During this time, most investment-grade fixed-income markets continued to generate positive returns—although certain areas of the riskiest segments of the markets declined—and U.S. Treasury yields reached the lowest levels in decades, even surpassing the low yield levels reached in the summer of 2010.
The last three months of the period were characterized by a strong reversal of the trends of the first three months. In October 2011, the high-yield market recovered significantly, benefiting from indications of improving policy with regard to managing the debt crisis from Europe and the formal announcement of a European debt deal late in the month. Due to renewed concerns about the European Union’s ability to manage the debt crisis, November 2011 saw a modest decline in investment-grade corporate bond prices and a sharp correction in high-yield corporate bonds, but another strong recovery in pricing started in December and carried into the first two months of 2012. Investor confidence strengthened as the U.S. economy demonstrated signs of sustainable growth and U.S. credit markets began to show some resistance to the credit problems of Europe. Thus, the theme for the period was a shift from risk aversion in the first half to burgeoning trends of improving investor confidence in the second half, which significantly improved pricing in the lower-rated asset classes.
On the whole, investment-grade fixed-income securities performed positively during the period, but the strongest returns came from the high-yield market. In fact, the best returns for the six-month period came from the lowest-rated credit tiers, despite the fact that they significantly underperformed in August and September 2011. Similar trends were true in the structured products sector, as lower-rated commercial mortgage-backed securities were among the best performers for the period, despite underperforming in the first two months.
The Federal Reserve launched Operation Twist in September.
With economic concerns and credit woes escalating in Europe and some continued uncertainty about the growth outlook in the U.S. during August and September 2011, the Federal Reserve (Fed) intervened yet again with monetary accommodations—this time with “Operation Twist,” which was announced and launched in September 2011. With Operation Twist, the Fed endeavored to flatten the yield curve and drive long-term rates down by selling short-term Treasuries
| | | | | | |
| Letter to Shareholders | | Wells Fargo Advantage Short Duration Government Bond Fund | | | 3 | |
and using the proceeds to purchase long-term Treasuries. The Fed stated that it is unlikely to raise rates before 2014, which should keep yields on Treasuries low. Despite this announcement, problems in Europe caused Treasuries to continue to rally in the first 3 months of the period, while credit spreads on corporate and securitized sectors widened with increasing risk aversion. However, with an improved U.S. economic outlook and greater investor confidence, the last three months of the period saw a slight decline in U.S. Treasury prices and significant improvement in high-yield corporate bond prices. Credit spreads in the corporate and securitized sectors broadly tightened in December 2011 and January and February 2012.
Although U.S. economic conditions appear to have improved over the course of the period, the recovery continues to face some headwinds in the form of languishing housing values and elevated unemployment levels, which may continue to create some volatility in the fixed-income markets. While we cannot say definitively what near-term performance will look like, we continue to encourage investors to maintain fully diversified, actively managed portfolios, which may provide better protection from risk and added opportunities to capture relative value. While heightened volatility may be uncomfortable to experience in the short term, we believe it can lead to unique opportunities to add relative value for investors with long-term investment horizons.
Don’t let short-term uncertainty derail long-term investment goals.
Periods of uncertainty can present challenges, but experience has taught us that maintaining a long-term investment strategy based on individual goals and risk tolerance can be an effective way to plan for the future. To help you create a sound strategy based on your personal goals and risk tolerance, Wells Fargo Advantage Funds offers more than 110 mutual funds and other investments spanning a wide range of asset classes and investment styles. Although diversification cannot guarantee an investment profit or prevent losses, we believe it can be an effective way to manage investment risk and potentially smooth out overall portfolio performance.
In our opinion, diligent and earnest assessment of the fundamental risks in individual fixed-income securities will be a key differentiating factor between which investment strategies perform well and which do not. At Wells Fargo Advantage Funds, we intend to continue measuring relative-value opportunities in the fixed-income markets and across our lineup of funds. We believe it is particularly important to have diligent investment analysts in charge of investor assets in changing markets. As evidenced by the performance of fixed-income assets during the recent six-month period, heightened risks also often accompany such opportunities.
| | | | |
| 4 | | Wells Fargo Advantage Short Duration Government Bond Fund | | Letter to Shareholders |
Thank you for choosing to invest with Wells Fargo Advantage Funds. We appreciate your confidence in us and remain committed to helping you meet your financial needs. For current information about your fund investments, contact your investment professional, visit our Web site at wellsfargoadvantagefunds.com, or call us directly at 1-800-222-8222. We are available 24 hours a day, 7 days a week.
Sincerely,

Karla M. Rabusch
President
Wells Fargo Advantage Funds
Notice to Shareholders
The Board of Trustees for Wells Fargo Advantage Funds has unanimously approved the following modifications to certain net asset value (NAV) waiver privileges and commission schedules:
| | n | | Effective May 1, 2012, automatic investment plan (AIP) purchases and proceeds received from systematic withdrawals will no longer qualify for NAV repurchase privileges. | |
| | n | | Effective May 1, 2012, discretionary rights to waive the upfront commission for Class C and “jumbo” Class A share purchases will no longer be granted to broker/dealers. However, we will continue to waive the Class C shares contingent deferred sales charge for redemptions by employer-sponsored retirement plans where the dealer of record waived its commission at the time of purchase. | |
| | n | | Effective July 31, 2012, NAV purchase privileges for former Evergreen Class IS and Class R shareholders are being modified to remove the ability to purchase Class A shares at NAV unless those shares are held directly with the Fund on or after July 31, 2012. | |
Please contact your investment professional or call us directly at 1-800-222-8222 if you have any questions on this Notice to Shareholders.
| | | | | | |
| Performance Highlights (Unaudited) | | Wells Fargo Advantage Short Duration Government Bond Fund | | | 5 | |
INVESTMENT OBJECTIVE
The Fund seeks to provide current income consistent with capital preservation.
ADVISER
Wells Fargo Funds Management, LLC
SUB-ADVISER
Wells Capital Management Incorporated
PORTFOLIO MANAGERS
Thomas O’Connor, CFA
Troy Ludgood
FUND INCEPTION
December 18, 1992
| | | | |
TEN LARGEST LONG-TERM HOLDINGS1 (AS OF FEBRUARY 29, 2012) | |
U.S. Treasury Note, 0.13%, 12/31/2013 | | | 8.48% | |
U.S. Treasury Note, 0.25%, 02/15/2015 | | | 7.69% | |
U.S. Treasury Note, 1.75%, 01/31/2014 | | | 5.99% | |
U.S. Treasury Note, 0.25%, 11/30/2013 | | | 5.11% | |
U.S. Treasury Note, 0.50%, 10/15/2014 | | | 4.51% | |
FNMA, 5.50%, 05/25/2040 | | | 2.80% | |
FNMA, 0.60%, 08/01/2037 | | | 2.56% | |
U.S. Treasury Note, 0.38%, 11/15/2014 | | | 2.19% | |
FHLMC Series 3674 Class HJ, 5.50%, 04/15/2040 | | | 1.83% | |
FNMA, 3.00%, 12/01/2099 | | | 1.81% | |
| | |
PORTFOLIO ALLOCATION2 (AS OF FEBRUARY 29, 2012) |
|
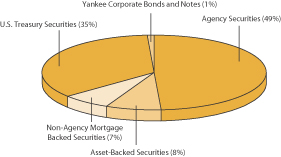 |
| 1. | The ten largest long-term holdings are calculated based on the value of the securities divided by total net assets of the Fund. Holdings are subject to change and may have changed since the date specified. |
| 2. | Portfolio allocation is subject to change and is calculated based on the total long-term investments of the Fund. |
| | | | |
| 6 | | Wells Fargo Advantage Short Duration Government Bond Fund | | Performance Highlights (Unaudited) |
AVERAGE ANNUAL TOTAL RETURN3 (%) (AS OF FEBRUARY 29, 2012)
| | | | | | | | | | | | | | | | | | | | | | | | | | | | | | | | | | | | | | | | | | | | |
| | | | | | Including Sales Charge | | | Excluding Sales Charge | | | Expense Ratios4 | |
| | | Inception Date | | | 6 Months* | | | 1 Year | | | 5 Year | | | 10 Year | | | 6 Months* | | | 1 Year | | | 5 Year | | | 10 Year | | | Gross | | | Net5 | |
Class A (MSDAX) | | | 03/11/1996 | | | | (2.19 | ) | | | (0.62 | ) | | | 3.70 | | | | 3.26 | | | | 0.84 | | | | 2.46 | | | | 4.33 | | | | 3.57 | | | | 0.88% | | | | 0.84% | |
Class B (MSDBX)** | | | 05/31/2002 | | | | (2.44 | ) | | | (1.31 | ) | | | 3.71 | | | | 3.23 | | | | 0.56 | | | | 1.69 | | | | 3.71 | | | | 3.23 | | | | 1.63% | | | | 1.59% | |
Class C (MSDCX) | | | 05/31/2002 | | | | (0.54 | ) | | | 0.69 | | | | 3.53 | | | | 2.76 | | | | 0.46 | | | | 1.69 | | | | 3.53 | | | | 2.76 | | | | 1.63% | | | | 1.59% | |
Administrator Class (MNSGX) | | | 12/18/1992 | | | | | | | | | | | | | | | | | | | | 0.95 | | | | 2.69 | | | | 4.59 | | | | 3.84 | | | | 0.82% | | | | 0.61% | |
Institutional Class (WSGIX) | | | 04/08/2005 | | | | | | | | | | | | | | | | | | | | 1.04 | | | | 2.88 | | | | 4.75 | | | | 3.96 | | | | 0.55% | | | | 0.43% | |
Barclays 1-3 Year U.S. Government Bond Index6 | | | | | | | | | | | | | | | | | | | | | | | 0.10 | | | | 1.50 | | | | 3.59 | | | | 3.31 | | | | | | | | | |
| * | Returns for periods of less than one year are not annualized. |
| ** | Class B shares are closed to investment, except in connection with the reinvestment of any distributions and permitted exchanges. |
Figures quoted represent past performance, which is no guarantee of future results and do not reflect the deduction of taxes that a shareholder may pay on fund distributions or the redemption of fund shares. Investment return and principal value of an investment will fluctuate so that an investor’s shares, when redeemed, may be worth more or less than their original cost. Performance shown without sales charges would be lower if sales charges were reflected. Current performance may be lower or higher than the performance data quoted and assumes the reinvestment of dividends and capital gains. Current month-end performance is available on the Fund’s Web site – wellsfargoadvantagefunds.com
Index returns do not include transaction costs associated with buying and selling securities, any mutual fund fees or expenses or any taxes. It is not possible to invest directly in an index.
For Class A shares, the maximum front-end sales charge is 3.00%. For Class B shares, the maximum contingent deferred sales charge is 3.00%. For Class C shares, the maximum contingent deferred sales charge is 1.00%. Performance including sales charge assumes the sales charge for the corresponding time period. Administrator and Institutional Class shares are sold without a front-end sales charge or contingent deferred sales charge.
Bond fund values fluctuate in response to the financial condition of individual issuers, general market and economic conditions, and changes in interest rates. In general, when interest rates rise, bond fund values fall and investors may lose principal value. Securities issued by U.S. government agencies or government-sponsored entities may not be guaranteed by the U.S. Treasury. Certain investment strategies tend to increase the total risk of an investment (relative to the broader market). This Fund is exposed to mortgage- and asset-backed securities risk. Consult the Fund’s prospectus for additional information on these and other risks. The U.S. government guarantee applies to certain underlying securities and not to shares of the Fund.
| 3. | Historical performance shown for the Class B and Class C shares prior to their inception reflects the performance of the Administrator Class shares, adjusted to include the higher expenses applicable to Class B and Class C shares. Historical performance shown for the Institutional Class shares prior to their inception reflects the performance of the Administrator Class shares and includes the higher expenses applicable to the Administrator Class shares. If these expenses had not been included, returns would be higher. |
| 4. | Reflects the expense ratios as stated in the most recent prospectuses. |
| 5. | The Adviser has committed through December 31, 2012 to waive fees and/or reimburse expenses to the extent necessary to cap the Fund’s Total Annual Fund Operating Expenses After Fee Waiver, excluding certain expenses, at 0.83% for Class A, 1.58% for Class B, 1.58% for Class C, 0.60% for Administrator Class and 0.42% for Institutional Class. Without this cap, the Fund’s returns would have been lower. |
| 6. | The Barclays 1-3 Year U.S. Government Bond Index is the 1-3 year component of the Barclays U.S. Government Bond Index and is composed of all publicly issued, non-convertible domestic debt of the U.S. Government and its agencies. The Barclays 1-3 Year U.S. Government Bond Index also includes corporate debt guaranteed by the U.S. Government. Only notes and bonds with a minimum maturity of one year up to a maximum maturity of 2.9 years are included. You cannot invest directly in an index. |
| | | | | | |
| Fund Expenses (Unaudited) | | Wells Fargo Advantage Short Duration Government Bond Fund | | | 7 | |
As a shareholder of the Fund, you incur two types of costs: (1) transaction costs, including sales charges (loads) on purchase payments and contingent deferred sales charges (if any) on redemptions and (2) ongoing costs, including management fees; distribution (12b-1) and/or shareholder service fees; and other Fund expenses. This example is intended to help you understand your ongoing costs (in dollars) of investing in the Fund and to compare these costs with the ongoing costs of investing in other mutual funds.
The example is based on an investment of $1,000 invested at the beginning of the six-month period and held for the entire period from September 1, 2011 to February 29, 2012.
Actual Expenses
The “Actual” line of the table below provides information about actual account values and actual expenses. You may use the information in this line, together with the amount you invested, to estimate the expenses that you paid over the period. Simply divide your account value by $1,000 (for example, an $8,600 account value divided by $1,000 = 8.6), then multiply the result by the number in the “Actual” line under the heading entitled “Expenses Paid During Period” for your applicable class of shares to estimate the expenses you paid on your account during this period.
Hypothetical Example for Comparison Purposes
The “Hypothetical” line of the table below provides information about hypothetical account values and hypothetical expenses based on the Fund’s actual expense ratio and an assumed rate of return of 5% per year before expenses, which is not the Fund’s actual return. The hypothetical account values and expenses may not be used to estimate the actual ending account balance or expenses you paid for the period. You may use this information to compare the ongoing costs of investing in the Fund and other funds. To do so, compare this 5% hypothetical example with the 5% hypothetical examples that appear in the shareholder reports of the other funds.
Please note that the expenses shown in the table are meant to highlight your ongoing costs only and do not reflect any transactional costs, such as sales charges (loads) and contingent deferred sales charges. Therefore, the “Hypothetical” line of the table is useful in comparing ongoing costs only, and will not help you determine the relative total costs of owning different funds. In addition, if these transactional costs were included, your costs would have been higher.
| | | | | | | | | | | | | | | | |
| | | Beginning
Account Value
09-01-2011 | | | Ending
Account Value
02-29-2012 | | | Expenses
Paid During
the Period1 | | | Net Annual
Expense Ratio | |
Class A | | | | | | | | | | | | | | | | |
Actual | | $ | 1,000.00 | | | $ | 1,008.35 | | | $ | 4.14 | | | | 0.83 | % |
Hypothetical (5% return before expenses) | | $ | 1,000.00 | | | $ | 1,020.74 | | | $ | 4.17 | | | | 0.83 | % |
Class B | | | | | | | | | | | | | | | | |
Actual | | $ | 1,000.00 | | | $ | 1,005.58 | | | $ | 7.88 | | | | 1.58 | % |
Hypothetical (5% return before expenses) | | $ | 1,000.00 | | | $ | 1,017.01 | | | $ | 7.92 | | | | 1.58 | % |
Class C | | | | | | | | | | | | | | | | |
Actual | | $ | 1,000.00 | | | $ | 1,004.60 | | | $ | 7.87 | | | | 1.58 | % |
Hypothetical (5% return before expenses) | | $ | 1,000.00 | | | $ | 1,017.01 | | | $ | 7.92 | | | | 1.58 | % |
Administrator Class | | | | | | | | | | | | | | | | |
Actual | | $ | 1,000.00 | | | $ | 1,009.50 | | | $ | 3.00 | | | | 0.60 | % |
Hypothetical (5% return before expenses) | | $ | 1,000.00 | | | $ | 1,021.88 | | | $ | 3.02 | | | | 0.60 | % |
Institutional Class | | | | | | | | | | | | | | | | |
Actual | | $ | 1,000.00 | | | $ | 1,010.41 | | | $ | 2.10 | | | | 0.42 | % |
Hypothetical (5% return before expenses) | | $ | 1,000.00 | | | $ | 1,022.77 | | | $ | 2.11 | | | | 0.42 | % |
| 1. | Expenses paid is equal to the annualized expense ratio of each class multiplied by the average account value over the period, multiplied by the number of days in the most recent fiscal half-year divided by the number of days in the fiscal year (to reflect the one-half year period). |
| | | | |
| 8 | | Wells Fargo Advantage Short Duration Government Bond Fund | | Portfolio of Investments—February 29, 2012 (Unaudited) |
| | | | | | | | | | | | | | | | |
| Security Name | | Interest Rate | | | Maturity Date | | | Principal | | | Value | |
| | | | | | | | | | | | | | | | |
| | | | |
| Agency Securities: 48.67% | | | | | | | | | | | | | | | | |
FHLMC ± | | | 2.90 | % | | | 01/01/2042 | | | $ | 5,007,852 | | | $ | 5,230,138 | |
FHLMC ± | | | 3.58 | | | | 08/01/2041 | | | | 1,984,409 | | | | 2,084,044 | |
FHLMC ± | | | 3.63 | | | | 10/01/2041 | | | | 9,642,108 | | | | 10,150,617 | |
FHLMC | | | 4.50 | | | | 05/15/2037 | | | | 2,338,275 | | | | 2,488,959 | |
FHLMC | | | 5.00 | | | | 03/15/2039 | | | | 5,714,630 | | | | 6,182,795 | |
FHLMC ± | | | 5.17 | | | | 05/01/2038 | | | | 5,019,524 | | | | 5,407,919 | |
FHLMC ± | | | 5.60 | | | | 11/01/2039 | | | | 6,620,341 | | | | 7,151,554 | |
FHLMC ± | | | 5.62 | | | | 04/01/2037 | | | | 3,613,530 | | | | 3,906,703 | |
FHLMC ± | | | 5.66 | | | | 11/01/2037 | | | | 8,041,245 | | | | 8,709,100 | |
FHLMC ± | | | 5.66 | | | | 01/01/2038 | | | | 1,913,688 | | | | 2,068,536 | |
FHLMC ± | | | 5.67 | | | | 07/01/2038 | | | | 3,666,463 | | | | 4,010,449 | |
FHLMC ± | | | 5.73 | | | | 07/01/2038 | | | | 3,658,691 | | | | 3,961,751 | |
FHLMC ± | | | 5.86 | | | | 08/01/2036 | | | | 1,712,686 | | | | 1,858,062 | |
FHLMC ± | | | 5.87 | | | | 05/01/2036 | | | | 7,273,650 | | | | 7,866,991 | |
FHLMC | | | 6.00 | | | | 05/15/2039 | | | | 10,405,563 | | | | 11,526,032 | |
FHLMC ± | | | 6.03 | | | | 04/01/2037 | | | | 7,963,552 | | | | 8,630,060 | |
FHLMC | | | 6.50 | | | | 11/01/2037 | | | | 2,128,273 | | | | 2,410,697 | |
FHLMC | | | 6.50 | | | | 12/01/2038 | | | | 3,356,194 | | | | 3,731,294 | |
FHLMC | | | 7.00 | | | | 05/01/2035 | | | | 3,451,186 | | | | 4,017,709 | |
FHLMC | | | 7.00 | | | | 03/25/2044 | | | | 2,709,515 | | | | 3,170,454 | |
FHLMC Series 3035 Class PA | | | 5.50 | | | | 09/15/2035 | | | | 4,124,183 | | | | 4,627,321 | |
FHLMC Series 3674 Class HJ | | | 5.50 | | | | 04/15/2040 | | | | 24,702,690 | | | | 27,228,148 | |
FHLMC Series 3704 Class CT | | | 7.00 | | | | 12/15/2036 | | | | 3,537,595 | | | | 4,152,246 | |
FHLMC Series T-11 Class A8 | | | 6.50 | | | | 01/25/2028 | | | | 2,648,999 | | | | 3,028,012 | |
FHLMC Series T-42 Class A5 | | | 7.50 | | | | 02/25/2042 | | | | 68,393 | | | | 82,336 | |
FHLMC Series T-60 Class 1A3 | | | 7.50 | | | | 03/25/2044 | | | | 86,354 | | | | 98,419 | |
FHLMC Structured Pass-Through Securities Series T-41 Class 3A ± | | | 6.99 | | | | 07/25/2032 | | | | 168,912 | | | | 194,390 | |
FHLMC Structured Pass-Through Securities Series T-51 Class 2A ± | | | 7.50 | | | | 08/25/2042 | | | | 2,529,766 | | | | 2,989,773 | |
FHLMC Structured Pass-Through Securities Series T-55 Class 1A2 | | | 7.00 | | | | 03/25/2043 | | | | 822,396 | | | | 931,274 | |
FHLMC Structured Pass-Through Securities Series T-57 Class 1A3 | | | 7.50 | | | | 07/25/2043 | | | | 575,847 | | | | 664,297 | |
FHLMC Structured Pass-Through Securities Series T-59 Class 1A3 | | | 7.50 | | | | 10/25/2043 | | | | 235,091 | | | | 269,153 | |
FNMA ± | | | 2.95 | | | | 12/01/2041 | | | | 3,611,094 | | | | 3,764,161 | |
FNMA %% | | | 3.00 | | | | 12/01/2099 | | | | 19,100,000 | | | | 19,762,531 | |
FNMA %% | | | 3.00 | | | | 12/01/2099 | | | | 26,000,000 | | | | 26,828,750 | |
FNMA ± | | | 3.09 | | | | 10/01/2041 | | | | 1,772,766 | | | | 1,852,385 | |
FNMA ± | | | 3.20 | | | | 10/01/2041 | | | | 13,121,397 | | | | 13,697,604 | |
FNMA ± | | | 3.30 | | | | 11/01/2041 | | | | 9,455,342 | | | | 9,910,525 | |
FNMA ± | | | 3.34 | | | | 12/01/2041 | | | | 3,648,093 | | | | 3,818,868 | |
FNMA ± | | | 3.35 | | | | 07/01/2041 | | | | 16,473,024 | | | | 17,212,304 | |
FNMA ± | | | 3.41 | | | | 10/01/2041 | | | | 4,238,360 | | | | 4,454,554 | |
FNMA ± | | | 3.51 | | | | 10/01/2041 | | | | 9,942,858 | | | | 10,461,108 | |
FNMA ± | | | 3.56 | | | | 07/01/2041 | | | | 6,536,232 | | | | 6,854,932 | |
FNMA ± | | | 3.60 | | | | 09/01/2041 | | | | 13,152,055 | | | | 13,828,579 | |
FNMA ± | | | 3.65 | | | | 07/01/2041 | | | | 10,547,792 | | | | 11,086,668 | |
FNMA ± | | | 3.67 | | | | 07/01/2041 | | | | 3,645,291 | | | | 3,833,613 | |
FNMA ± | | | 5.11 | | | | 06/01/2039 | | | | 5,377,830 | | | | 5,780,958 | |
FNMA ± | | | 5.14 | | | | 04/01/2038 | | | | 400,957 | | | | 431,439 | |
FNMA | | | 5.50 | | | | 05/25/2040 | | | | 37,693,744 | | | | 41,579,434 | |
FNMA ± | | | 5.65 | | | | 07/01/2036 | | | | 3,984,998 | | | | 4,302,850 | |
FNMA ± | | | 5.84 | | | | 06/01/2037 | | | | 1,577,536 | | | | 1,707,917 | |
The accompanying notes are an integral part of these financial statements.
| | | | | | |
| Portfolio of Investments—February 29, 2012 (Unaudited) | | Wells Fargo Advantage Short Duration Government Bond Fund | | | 9 | |
| | | | | | | | | | | | | | | | |
| Security Name | | Interest Rate | | | Maturity Date | | | Principal | | | Value | |
| | | | | | | | | | | | | | | | |
| | | | |
| Agency Securities (continued) | | | | | | | | | | | | | | | | |
FNMA ± | | | 5.86 | % | | | 11/01/2037 | | | $ | 2,174,821 | | | $ | 2,355,081 | |
FNMA ± | | | 5.95 | | | | 12/01/2037 | | | | 2,091,891 | | | | 2,266,562 | |
FNMA | | | 6.00 | | | | 03/25/2035 | | | | 1,821,000 | | | | 2,073,226 | |
FNMA | | | 6.00 | | | | 04/01/2035 | | | | 7,259,127 | | | | 8,100,893 | |
FNMA | | | 6.00 | | | | 08/01/2037 | | | | 34,076,781 | | | | 38,028,316 | |
FNMA | | | 6.00 | | | | 10/01/2038 | | | | 18,630,024 | | | | 20,790,357 | |
FNMA | | | 6.00 | | | | 03/01/2040 | | | | 16,578,654 | | | | 18,262,793 | |
FNMA | | | 6.05 | | | | 07/01/2012 | | | | 5,073,362 | | | | 5,182,572 | |
FNMA ± | | | 6.29 | | | | 08/01/2037 | | | | 3,829,385 | | | | 4,180,674 | |
FNMA | | | 6.50 | | | | 08/01/2036 | | | | 3,223,484 | | | | 3,663,931 | |
FNMA | | | 6.50 | | | | 08/01/2037 | | | | 19,970,990 | | | | 22,801,700 | |
FNMA | | | 6.50 | | | | 06/01/2038 | | | | 17,133,936 | | | | 19,476,849 | |
FNMA | | | 6.50 | | | | 08/01/2039 | | | | 14,986,545 | | | | 17,035,822 | |
FNMA | | | 6.50 | | | | 02/01/2041 | | | | 4,725,971 | | | | 5,372,205 | |
FNMA ± | | | 6.55 | | | | 09/01/2036 | | | | 3,832,122 | | | | 4,199,013 | |
FNMA | | | 7.00 | | | | 04/01/2035 | | | | 3,610,727 | | | | 4,216,560 | |
FNMA Grantor Trust Series 2000-T06 Class A1 | | | 7.50 | | | | 06/25/2030 | | | | 864,010 | | | | 1,004,508 | |
FNMA Grantor Trust Series 2001-T01 Class A1 | | | 7.50 | | | | 10/25/2040 | | | | 4,301,326 | | | | 5,028,577 | |
FNMA Grantor Trust Series 2001-T03 Class A1 | | | 7.50 | | | | 11/25/2040 | | | | 937,001 | | | | 1,098,177 | |
FNMA Grantor Trust Series 2001-T08 Class A1 | | | 7.50 | | | | 07/25/2041 | | | | 1,127,393 | | | | 1,245,184 | |
FNMA Grantor Trust Series 2001-T16 Class A2 | | | 7.00 | | | | 07/25/2042 | | | | 1,832,645 | | | | 2,141,792 | |
FNMA Grantor Trust Series 2002-T11 Class B | | | 5.34 | | | | 04/25/2012 | | | | 13,931,000 | | | | 13,974,339 | |
FNMA Grantor Trust Series 2002-T12 Class A3 | | | 7.50 | | | | 05/25/2042 | | | | 4,765,158 | | | | 5,635,706 | |
FNMA Grantor Trust Series 2002-T19 Class A3 | | | 7.50 | | | | 07/25/2042 | | | | 1,619,686 | | | | 1,934,971 | |
FNMA Series 1999-T02 Class A1 ± | | | 7.50 | | | | 01/19/2039 | | | | 610,178 | | | | 690,356 | |
FNMA Series 2001-50 Class BA | | | 7.00 | | | | 10/25/2041 | | | | 98,053 | | | | 113,200 | |
FNMA Series 2001-T04 Class A1 | | | 7.50 | | | | 07/25/2041 | | | | 126,781 | | | | 148,048 | |
FNMA Series 2001-W03 Class A ± | | | 7.00 | | | | 09/25/2041 | | | | 1,054,625 | | | | 1,212,615 | |
FNMA Series 2002-14 Class A1 | | | 7.00 | | | | 01/25/2042 | | | | 894,872 | | | | 1,034,319 | |
FNMA Series 2002-14 Class A2 | | | 7.50 | | | | 01/25/2042 | | | | 1,871,829 | | | | 2,186,101 | |
FNMA Series 2002-26 Class A2 | | | 7.50 | | | | 01/25/2048 | | | | 2,179,295 | | | | 2,536,907 | |
FNMA Series 2002-26 Class A1 | | | 7.00 | | | | 01/25/2048 | | | | 1,209,461 | | | | 1,412,615 | |
FNMA Series 2002-33 Class A2 | | | 7.50 | | | | 06/25/2032 | | | | 289,034 | | | | 332,189 | |
FNMA Series 2002-80 Class A1 | | | 6.50 | | | | 11/25/2042 | | | | 1,914,958 | | | | 2,147,146 | |
FNMA Series 2002-90 Class A1 | | | 6.50 | | | | 06/25/2042 | | | | 33,919 | | | | 39,513 | |
FNMA Series 2002-W01 Class 2A ± | | | 7.09 | | | | 02/25/2042 | | | | 769,741 | | | | 896,687 | |
FNMA Series 2002-W06 Class 2A ± | | | 7.12 | | | | 06/25/2042 | | | | 481,499 | | | | 556,527 | |
FNMA Series 2002-W6 Class 2A1 ± | | | 6.65 | | | | 06/25/2042 | | | | 16,259 | | | | 18,438 | |
FNMA Series 2003-W01 Class 2A ± | | | 7.08 | | | | 12/25/2042 | | | | 351,330 | | | | 410,734 | |
FNMA Series 2003-W04 Class 4A ± | | | 7.28 | | | | 10/25/2042 | | | | 1,173,878 | | | | 1,368,985 | |
FNMA Series 2003-W2 Class 1A1 | | | 6.50 | | | | 07/25/2042 | | | | 24,044 | | | | 27,765 | |
FNMA Series 2004-W02 Class 5A | | | 7.50 | | | | 03/25/2044 | | | | 233,041 | | | | 271,001 | |
FNMA Series 2004-W09 Class 1A3 | | | 6.05 | | | | 02/25/2044 | | | | 6,589,169 | | | | 7,282,061 | |
FNMA Series 2004-W09 Class 2A3 | | | 7.50 | | | | 02/25/2044 | | | | 1,165,712 | | | | 1,387,987 | |
FNMA Series 2005-W03 Class 1A | | | 7.50 | | | | 03/25/2045 | | | | 391,541 | | | | 462,449 | |
FNMA Series 2006-114 Class PD | | | 6.00 | | | | 12/25/2036 | | | | 11,123,694 | | | | 12,747,318 | |
FNMA Series 2008-46 Class LA | | | 5.50 | | | | 06/25/2038 | | | | 1,569,610 | | | | 1,751,571 | |
FNMA Series 2009-019 Class TA | | | 4.50 | | | | 12/25/2037 | | | | 3,032,751 | | | | 3,176,466 | |
FNMA Series 2009-047 Class MT | | | 7.00 | | | | 07/25/2039 | | | | 2,638,690 | | | | 3,018,635 | |
FNMA Series 2009-047 Class PA | | | 4.50 | | | | 07/25/2039 | | | | 6,599,215 | | | | 6,966,936 | |
The accompanying notes are an integral part of these financial statements.
| | | | |
| 10 | | Wells Fargo Advantage Short Duration Government Bond Fund | | Portfolio of Investments—February 29, 2012 (Unaudited) |
| | | | | | | | | | | | | | | | |
| Security Name | | Interest Rate | | | Maturity Date | | | Principal | | | Value | |
| | | | | | | | | | | | | | | | |
| | | | |
| Agency Securities (continued) | | | | | | | | | | | | | | | | |
FNMA Series 2009-111 Class CL | | | 4.50 | % | | | 03/25/2038 | | | $ | 3,193,947 | | | $ | 3,394,770 | |
FNMA Series 2009-14 Class A | | | 7.00 | | | | 06/25/2035 | | | | 4,996,332 | | | | 5,768,960 | |
FNMA Series 2010-111 Class WA ± | | | 6.03 | | | | 10/25/2040 | | | | 1,579,990 | | | | 1,793,671 | |
FNMA Series 2010-64 Class BA | | | 5.00 | | | | 05/25/2040 | | | | 12,287,416 | | | | 13,202,419 | |
FNMA Series 2011-M2 Class A1 | | | 2.02 | | | | 07/25/2021 | | | | 5,035,895 | | | | 5,120,060 | |
FNMA Series 2012-3 Class CD | | | 7.00 | | | | 02/25/2042 | | | | 19,811,775 | | | | 22,956,445 | |
FNMA Whole Loan Series 2002-W08 Class A3 | | | 7.50 | | | | 06/25/2042 | | | | 165,708 | | | | 188,980 | |
FNMA Whole Loan Series 2004-W08 Class 3A | | | 7.50 | | | | 06/25/2044 | | | | 1,973,697 | | | | 2,320,369 | |
FNMA Whole Loan Series 2004-W11 Class 1A2 | | | 6.50 | | | | 05/25/2044 | | | | 10,061,288 | | | | 11,359,887 | |
FNMA Whole Loan Series 2004-W14 Class 2A | | | 7.50 | | | | 07/25/2044 | | | | 200,667 | | | | 231,786 | |
FNMA Whole Loan Series 2005-W01 Class 1A4 | | | 7.50 | | | | 10/25/2044 | | | | 667,354 | | | | 782,548 | |
FNMA Whole Loan Series 2005-W04 Class 1A3 | | | 7.00 | | | | 08/25/2035 | | | | 1,526,141 | | | | 1,763,615 | |
GNMA ± | | | 3.00 | | | | 10/20/2041 | | | | 9,897,974 | | | | 10,359,378 | |
GNMA ± | | | 3.00 | | | | 01/20/2042 | | | | 1,813,180 | | | | 1,894,303 | |
GNMA ± | | | 3.50 | | | | 09/20/2041 | | | | 3,416,582 | | | | 3,630,408 | |
GNMA ± | | | 3.50 | | | | 01/20/2042 | | | | 2,674,539 | | | | 2,838,958 | |
GNMA | | | 6.00 | | | | 09/15/2035 | | | | 18,401,521 | | | | 20,816,054 | |
GNMA Series 2009-42 Class CT | | | 6.00 | | | | 08/16/2035 | | | | 2,239,339 | | | | 2,544,939 | |
| | | | |
Total Agency Securities (Cost $719,565,081) | | | | | | | | | | | | | | | 723,232,340 | |
| | | | | | | | | | | | | | | | |
| | | | |
| Asset-Backed Securities: 7.50% | | | | | | | | | | | | | | | | |
AESOP Funding II LLC Series 2011-2A Class A 144A | | | 2.37 | | | | 11/20/2014 | | | | 7,510,000 | | | | 7,631,209 | |
Ally Master Owner Trust Series 2011-4 Class A2 | | | 1.54 | | | | 09/15/2016 | | | | 5,613,000 | | | | 5,655,025 | |
Ally Master Owner Trust Series 2012-1 Class A1 ± | | | 1.05 | | | | 02/15/2017 | | | | 9,401,000 | | | | 9,401,124 | |
Capital Auto Receivables Asset Carat Series 2008-1 Class A4A | | | 4.46 | | | | 07/15/2014 | | | | 849,323 | | | | 855,914 | |
Citibank Omni Master Trust Series 2009-A14 Class A14 ±144A | | | 3.00 | | | | 08/15/2018 | | | | 9,169,000 | | | | 9,678,778 | |
Greenwich Capital Commercial Funding Corporation Series 2005-GGS Class A4 ± | | | 5.24 | | | | 04/10/2037 | | | | 8,210,000 | | | | 8,875,930 | |
MMCA Automobile Trust Series 2009-A Class A4 144A | | | 6.25 | | | | 11/16/2015 | | | | 4,462,784 | | | | 4,606,463 | |
Nelnet Student Loan Trust Series 2006-1 Class A4 ± | | | 0.58 | | | | 11/23/2022 | | | | 11,489,000 | | | | 11,337,989 | |
Nelnet Student Loan Trust Series 2006-2 Class A4 ± | | | 0.64 | | | | 10/26/2026 | | | | 13,952,000 | | | | 13,771,931 | |
SLM Student Loan Trust Series 2001-1 Class A3 ± | | | 0.77 | | | | 04/25/2023 | | | | 5,428,000 | | | | 5,357,065 | |
SLM Student Loan Trust Series 2002-6 Class A4 ± | | | 0.53 | | | | 03/15/2019 | | | | 3,019,780 | | | | 2,991,937 | |
SLM Student Loan Trust Series 2005-1 Class A2 ± | | | 0.64 | | | | 04/27/2020 | | | | 3,102,352 | | | | 3,070,206 | |
SLM Student Loan Trust Series 2006-9 Class A4 ± | | | 0.63 | | | | 10/25/2022 | | | | 15,046,000 | | | | 14,723,045 | |
SLM Student Loan Trust Series 2008-4 Class A3 ± | | | 1.81 | | | | 10/25/2017 | | | | 3,358,000 | | | | 3,421,218 | |
SLM Student Loan Trust Series 2011-B Class A4 ±144A | | | 1.10 | | | | 12/16/2024 | | | | 4,819,978 | | | | 4,773,317 | |
SLM Student Loan Trust Series 2011-C Class A1 ±144A | | | 1.65 | | | | 12/15/2023 | | | | 5,283,249 | | | | 5,284,222 | |
| | | | |
Total Asset-Backed Securities (Cost $111,153,777) | | | | | | | | | | | | | | | 111,435,373 | |
| | | | | | | | | | | | | | | | |
| | | | |
| Non-Agency Mortgage Backed Securities: 7.42% | | | | | | | | | | | | | | | | |
Bank of America Commercial Mortgage Incorporated Series 2004-6 Class A3 | | | 4.51 | | | | 12/10/2042 | | | | 1,070,285 | | | | 1,093,901 | |
Bank of America Commercial Mortgage Incorporated Series 2004-6 Class A5 | | | 4.81 | | | | 12/10/2042 | | | | 4,608,000 | | | | 4,951,803 | |
Bank of America Commercial Mortgage Incorporated Series 2005-6 Class A4 ± | | | 5.19 | | | | 09/10/2047 | | | | 3,580,000 | | | | 4,011,970 | |
Bear Stearns Commercial Mortgage Securities Incorporated Series 2004-T16 Class A6 ± | | | 4.75 | | | | 02/13/2046 | | | | 9,051,000 | | | | 9,770,373 | |
Citigroup Commercial Mortgage Trust Series 2005-EMG Class A4 144A | | | 4.52 | | | | 09/20/2051 | | | | 2,294,225 | | | | 2,350,364 | |
The accompanying notes are an integral part of these financial statements.
| | | | | | |
| Portfolio of Investments—February 29, 2012 (Unaudited) | | Wells Fargo Advantage Short Duration Government Bond Fund | | | 11 | |
| | | | | | | | | | | | | | | | |
| Security Name | | Interest Rate | | | Maturity Date | | | Principal | | | Value | |
| | | | | | | | | | | | | | | | |
| | | | |
| Non-Agency Mortgage Backed Securities (continued) | | | | | | | | | | | | | | | | |
Commercial Mortgage Pass-Through Certificates Series 2005-LP5 Class A4 ± | | | 4.98 | % | | | 05/10/2043 | | | $ | 5,726,000 | | | $ | 6,290,469 | |
Credit Suisse First Boston Mortgage Securities Corporation Series 2005-C1 Class A4 ± | | | 5.01 | | | | 02/15/2038 | | | | 3,595,000 | | | | 3,921,041 | |
Developers Diversified Realty Corporation Series 2009-DDR1 Class A 144A | | | 3.81 | | | | 10/14/2022 | | | | 20,416,991 | | | | 21,423,119 | |
ESA Trust Series 2010-ESHA Class A 144A | | | 2.95 | | | | 11/05/2027 | | | | 17,904,758 | | | | 18,095,516 | |
GMAC Commercial Mortgage Securities Incorporated Series 2004-C2 Class A4 ± | | | 5.30 | | | | 08/10/2038 | | | | 3,671,000 | | | | 3,966,225 | |
GS Mortgage Securities Corporation II Series 2005-GG4 Class A4 | | | 4.75 | | | | 07/10/2039 | | | | 5,746,000 | | | | 6,248,620 | |
JPMorgan Chase Commercial Mortgage Securities Corporation Series 2010-C1 Class A1 144A | | | 3.85 | | | | 06/15/2043 | | | | 3,642,145 | | | | 3,834,403 | |
Lehman Brothers UBS Commercial Mortgage Trust Series 2004-C6 Class A6 ± | | | 5.02 | | | | 08/15/2029 | | | | 4,578,000 | | | | 4,923,007 | |
Lehman Brothers UBS Commercial Mortgage Trust Series 2005-C2 Class A4 | | | 5.00 | | | | 04/15/2030 | | | | 1,032,135 | | | | 1,070,259 | |
Lehman Brothers UBS Commercial Mortgage Trust Series 2005-C7 Class A3 ± | | | 5.44 | | | | 11/15/2030 | | | | 3,106,000 | | | | 3,241,502 | |
Merrill Lynch Mortgage Trust Series 2005-CIP1 Class A3A ± | | | 4.95 | | | | 07/12/2038 | | | | 1,968,000 | | | | 2,084,391 | |
Merrill Lynch Mortgage Trust Series 2005-CKI1 Class A3 ± | | | 5.22 | | | | 11/12/2037 | | | | 2,477,190 | | | | 2,500,295 | |
Morgan Stanley Capital I Series 2005-HQ6 Class A4 | | | 4.99 | | | | 08/13/2042 | | | | 5,120,000 | | | | 5,634,366 | |
Morgan Stanley Capital I Series 2005-T17 Class A5 | | | 4.78 | | | | 12/13/2041 | | | | 4,537,000 | | | | 4,892,120 | |
| | | | |
Total Non-Agency Mortgage Backed Securities (Cost $109,242,720) | | | | | | | | | | | | | | | 110,303,744 | |
| | | | | | | | | | | | | | | | |
| | | | |
| U.S. Treasury Securities: 35.21% | | | | | | | | | | | | | | | | |
U.S. Treasury Note « | | | 0.13 | | | | 12/31/2013 | | | | 126,466,000 | | | | 126,075,726 | |
U.S. Treasury Note | | | 0.25 | | | | 11/30/2013 | | | | 75,999,000 | | | | 75,951,501 | |
U.S. Treasury Note | | | 0.25 | | | | 01/31/2014 | | | | 14,391,000 | | | | 14,378,077 | |
U.S. Treasury Note | | | 0.25 | | | | 02/28/2014 | | | | 1,430,000 | | | | 1,428,547 | |
U.S. Treasury Note | | | 0.25 | | | | 12/15/2014 | | | | 2,520,000 | | | | 2,509,172 | |
U.S. Treasury Note | | | 0.25 | | | | 02/15/2015 | | | | 114,906,000 | | | | 114,340,433 | |
U.S. Treasury Note ## | | | 0.38 | | | | 11/15/2014 | | | | 32,601,000 | | | | 32,578,082 | |
U.S. Treasury Note « | | | 0.50 | | | | 10/15/2014 | | | | 66,767,000 | | | | 66,954,749 | |
U.S. Treasury Note | | | 1.75 | | | | 01/31/2014 | | | | 86,586,000 | | | | 88,970,492 | |
| | | | |
Total U.S. Treasury Securities (Cost $523,731,837) | | | | | | | | | | | | | | | 523,186,779 | |
| | | | | | | | | | | | | | | | |
| | | | |
Yankee Corporate Bonds and Notes: 1.18% | | | | | | | | | | | | | | | | |
| | | | |
Financials: 1.18% | | | | | | | | | | | | | | | | |
| | | | |
| Commercial Banks: 1.18% | | | | | | | | | | | | | | | | |
Nordea Eiendomskreditt AS ±144A | | | 1.00 | | | | 04/07/2015 | | | | 18,010,000 | | | | 17,478,291 | |
| | | | | | | | | | | | | | | | |
| | | | |
Total Yankee Corporate Bonds and Notes (Cost $18,010,000) | | | | | | | | | | | | | | | 17,478,291 | |
| | | | | | | | | | | | | | | | |
| | | | |
| Other: 0.05% | | | | | | | | | | | | | | | | |
Gryphon Funding Limited, Pass-Through Entity (a)(i)(v) | | | | | | | | | | | 564,730 | | | | 152,477 | |
VFNC Corporation, Pass-Through Entity, 0.24% ±144A(a)(i)(v) | | | | | | | | | | | 1,503,151 | | | | 646,355 | |
| | | | |
Total Other (Cost $325,327) | | | | | | | | | | | | | | | 798,832 | |
| | | | | | | | | | | | | | | | |
The accompanying notes are an integral part of these financial statements.
| | | | |
| 12 | | Wells Fargo Advantage Short Duration Government Bond Fund | | Portfolio of Investments—February 29, 2012 (Unaudited) |
| | | | | | | | | | | | | | |
| Security Name | | Yield | | | | | Shares | | | Value | |
| | | | | | | | | | | | | | |
| | | | |
Short-Term Investments: 2.02% | | | | | | | | | | | | | | |
| | | | |
| Investment Companies: 2.02% | | | | | | | | | | | | | | |
Wells Fargo Advantage Government Money Market Fund, Institutional Class (l)(u)## | | | 0.01 | % | | | | | 17,007,807 | | | $ | 17,007,807 | |
Wells Fargo Securities Lending Cash Investments, LLC (l)(u)(v)(r) | | | 0.15 | | | | | | 13,023,473 | | | | 13,023,473 | |
| | | | |
Total Short-Term Investments (Cost $30,031,280) | | | | | | | | | | | | | 30,031,280 | |
| | | | | | | | | | | | | | |
| | | | | | | | |
| Total Investments in Securities | | | | | | | | |
| (Cost $1,512,060,022)* | | | 102.05 | % | | | 1,516,466,639 | |
Other Assets and Liabilities, Net | | | (2.05 | ) | | | (30,426,127 | ) |
| | | | | | | | |
| Total Net Assets | | | 100.00 | % | | $ | 1,486,040,512 | |
| | | | | | | | |
| ± | Variable rate investment. |
| %% | Security issued on a when-issued (TBA) basis. |
| 144A | Security that may be resold to “qualified institutional buyers” under Rule 144A or security offered pursuant to Section 4(2) of the Securities Act of 1933, as amended. |
| « | All or a portion of this security is on loan. |
| ## | All or a portion of this security has been segregated for when-issued securities. |
| (a) | Security is fair valued by the Management Valuation Team, and in certain instances by the Board of Trustees, in accordance with procedures approved by the Board of Trustees. |
| (l) | Investment in an affiliate. |
| (u) | Rate shown is the 7-day annualized yield at period end. |
| (v) | Security represents investment of cash collateral received from securities on loan. |
| (r) | The investment company is exempt from registration under Section 3(c)(7) of the 1940 Act. |
| * | Cost for federal income tax purposes is $1,512,855,910 and net unrealized appreciation (depreciation) consists of: |
| | | | |
Gross unrealized appreciation | | $ | 7,193,819 | |
Gross unrealized depreciation | | | (3,583,090 | ) |
| | | | |
Net unrealized appreciation | | $ | 3,610,729 | |
The accompanying notes are an integral part of these financial statements.
| | | | | | |
| Statement of Assets and Liabilities—February 29, 2012 (Unaudited) | | Wells Fargo Advantage Short Duration Government Bond Fund | | | 13 | |
| | | | |
| | | | |
| |
Assets | | | | |
Investments | | | | |
In unaffiliated securities (including securities on loan), at value (see cost below) | | $ | 1,486,435,359 | |
In affiliated securities, at value (see cost below) | | | 30,031,280 | |
| | | | |
Total investments, at value (see cost below) | | | 1,516,466,639 | |
Receivable for investments sold | | | 50,636,649 | |
Principal paydown receivable | | | 1,635,040 | |
Receivable for Fund shares sold | | | 3,757,323 | |
Receivable for interest | | | 4,121,856 | |
Receivable for securities lending income | | | 1,194 | |
Prepaid expenses and other assets | | | 70,657 | |
| | | | |
Total assets | | | 1,576,689,358 | |
| | | | |
| |
Liabilities | | | | |
Dividends payable | | | 325,983 | |
Payable for investments purchased | | | 74,900,692 | |
Payable for Fund shares redeemed | | | 1,401,827 | |
Payable upon receipt of securities loaned | | | 13,348,800 | |
Advisory fee payable | | | 307,567 | |
Distribution fees payable | | | 45,697 | |
Due to other related parties | | | 172,491 | |
Accrued expenses and other liabilities | | | 145,789 | |
| | | | |
Total liabilities | | | 90,648,846 | |
| | | | |
Total net assets | | $ | 1,486,040,512 | |
| | | | |
| |
NET ASSETS CONSIST OF | | | | |
Paid-in capital | | $ | 1,482,830,477 | |
Overdistributed net investment income | | | (4,400,366 | ) |
Accumulated net realized losses on investments | | | 3,203,784 | |
Net unrealized gains on investments | | | 4,406,617 | |
| | | | |
Total net assets | | $ | 1,486,040,512 | |
| | | | |
| |
COMPUTATION OF NET ASSET VALUE AND OFFERING PRICE PER SHARE1 | | | | |
Net assets – Class A | | $ | 186,235,728 | |
Shares outstanding – Class A | | | 17,998,055 | |
Net asset value per share – Class A | | | $10.35 | |
Maximum offering price per share – Class A2 | | | $10.67 | |
Net assets – Class B | | $ | 1,468,098 | |
Shares outstanding – Class B | | | 141,770 | |
Net asset value per share – Class B | | | $10.36 | |
Net assets – Class C | | $ | 75,979,589 | |
Shares outstanding – Class C | | | 7,330,768 | |
Net asset value per share – Class C | | | $10.36 | |
Net assets – Administrator Class | | $ | 268,558,338 | |
Shares outstanding – Administrator Class | | | 25,912,725 | |
Net asset value per share – Administrator Class | | | $10.36 | |
Net assets – Institutional Class | | $ | 953,798,759 | |
Shares outstanding – Institutional Class | | | 92,042,070 | |
Net asset value per share – Institutional Class | | | $10.36 | |
| |
Investments in unaffiliated securities, at cost | | $ | 1,482,028,742 | |
| | | | |
Investments in affiliated securities, at cost | | $ | 30,031,280 | |
| | | | |
Total investments, at cost | | $ | 1,512,060,022 | |
| | | | |
Securities on loan, at value | | $ | 13,057,273 | |
| | | | |
| 1. | The Fund has an unlimited number of authorized shares. |
| 2. | Maximum offering price is computed as 100/97 of net asset value. On investments of $50,000 or more, the offering price is reduced. |
The accompanying notes are an integral part of these financial statements.
| | | | |
| 14 | | Wells Fargo Advantage Short Duration Government Bond Fund | | Statement of Operations—Six Months Ended February 29, 2012 (Unaudited) |
| | | | |
| | | | |
| |
Investment income | | | | |
Interest | | $ | 15,353,824 | |
Securities lending income, net | | | 12,271 | |
Income from affiliated securities | | | 5,720 | |
| | | | |
Total investment income | | | 15,371,815 | |
| | | | |
| |
Expenses | | | | |
Advisory fee | | | 2,814,324 | |
Administration fees | | | | |
Fund level | | | 375,407 | |
Class A | | | 137,899 | |
Class B | | | 1,179 | |
Class C | | | 58,284 | |
Administrator Class | | | 122,625 | |
Institutional Class | | | 403,870 | |
Shareholder servicing fees | | | | |
Class A | | | 215,468 | |
Class B | | | 1,842 | |
Class C | | | 91,069 | |
Administrator Class | | | 301,793 | |
Distribution fees | | | | |
Class B | | | 5,527 | |
Class C | | | 273,206 | |
Custody and accounting fees | | | 45,010 | |
Professional fees | | | 14,501 | |
Registration fees | | | 44,682 | |
Shareholder report expenses | | | 69,125 | |
Trustees’ fees and expenses | | | 7,124 | |
Other fees and expenses | | | 23,412 | |
| | | | |
Total expenses | | | 5,006,347 | |
Less: Fee waivers and/or expense reimbursements | | | (847,733 | ) |
| | | | |
Net expenses | | | 4,158,614 | |
| | | | |
Net investment income | | | 11,213,201 | |
| | | | |
| |
REALIZED AND UNREALIZED GAINS (LOSSES) ON INVESTMENTS | | | | |
Net realized gains on investments | | | 6,170,104 | |
Net change in unrealized gains (losses) on investments | | | (2,687,613 | ) |
| | | | |
Net realized and unrealized gains (losses) on investments | | | 3,482,491 | |
| | | | |
Net increase in net assets resulting from operations | | $ | 14,695,692 | |
| | | | |
The accompanying notes are an integral part of these financial statements.
| | | | | | |
| Statements of Changes in Net Assets | | Wells Fargo Advantage Short Duration Government Bond Fund | | | 15 | |
| | | | | | | | | | | | | | | | |
| | | Six Months Ended
February 29, 2012
(Unaudited) | | | Year Ended
August 31, 2011 | |
| | | | |
Operations | | | | | | | | | | | | | | | | |
Net investment income | | | | | | $ | 11,213,201 | | | | | | | $ | 23,987,550 | |
Net realized gains on investments | | | | | | | 6,170,104 | | | | | | | | 10,883,104 | |
Net change in unrealized gains (losses) on investments | | | | | | | (2,687,613 | ) | | | | | | | (3,083,100 | ) |
| | | | | | | | | | | | | | | | |
Net increase in net assets resulting from operations | | | | | | | 14,695,692 | | | | | | | | 31,787,554 | |
| | | | | | | | | | | | | | | | |
| | | | |
Distributions to shareholders from | | | | | | | | | | | | | | | | |
Net investment income | | | | | | | | | | | | | | | | |
Class A | | | | | | | (1,622,787 | ) | | | | | | | (4,061,268 | ) |
Class B | | | | | | | (8,228 | ) | | | | | | | (23,296 | ) |
Class C | | | | | | | (408,076 | ) | | | | | | | (1,182,810 | ) |
Administrator Class | | | | | | | (2,581,088 | ) | | | | | | | (7,563,181 | ) |
Institutional Class | | | | | | | (11,528,816 | ) | | | | | | | (21,281,597 | ) |
Net realized gains | | | | | | | | | | | | | | | | |
Class A | | | | | | | 0 | | | | | | | | (1,462,161 | ) |
Class B | | | | | | | 0 | | | | | | | | (12,266 | ) |
Class C | | | | | | | 0 | | | | | | | | (645,874 | ) |
Administrator Class | | | | | | | 0 | | | | | | | | (2,149,194 | ) |
Institutional Class | | | | | | | 0 | | | | | | | | (6,350,799 | ) |
| | | | | | | | | | | | | | | | |
Total distributions to shareholders | | | | | | | (16,148,995 | ) | | | | | | | (44,732,446 | ) |
| | | | | | | | | | | | | | | | |
| | | | |
Capital share transactions | | | Shares | | | | | | | | Shares | | | | | |
Proceeds from shares sold | | | | | | | | | | | | | | | | |
Class A | | | 4,539,021 | | | | 46,928,955 | | | | 6,878,676 | | | | 71,400,284 | |
Class B | | | 17,994 | | | | 186,200 | | | | 72,561 | | | | 753,857 | |
Class C | | | 1,539,255 | | | | 15,942,679 | | | | 2,257,721 | | | | 23,477,444 | |
Administrator Class | | | 6,791,031 | | | | 70,291,275 | | | | 9,630,990 | | | | 100,053,410 | |
Institutional Class | | | 39,217,328 | | | | 406,369,419 | | | | 55,684,486 | | | | 579,243,062 | |
| | | | | | | | | | | | | | | | |
| | | | | | | 539,718,528 | | | | | | | | 774,928,057 | |
| | | | | | | | | | | | | | | | |
Reinvestment of distributions | | | | | | | | | | | | | | | | |
Class A | | | 121,592 | | | | 1,257,529 | | | | 418,538 | | | | 4,333,583 | |
Class B | | | 698 | | | | 7,222 | | | | 3,211 | | | | 33,264 | |
Class C | | | 30,855 | | | | 319,576 | | | | 141,938 | | | | 1,471,055 | |
Administrator Class | | | 192,862 | | | | 1,997,292 | | | | 749,866 | | | | 7,786,418 | |
Institutional Class | | | 1,045,466 | | | | 10,824,289 | | | | 2,512,689 | | | | 26,029,511 | |
| | | | | | | | | | | | | | | | |
| | | | | | | 14,405,908 | | | | | | | | 39,653,831 | |
| | | | | | | | | | | | | | | | |
Payment for shares redeemed | | | | | | | | | | | | | | | | |
Class A | | | (2,374,218 | ) | | | (24,546,277 | ) | | | (8,968,788 | ) | | | (93,071,586 | ) |
Class B | | | (25,797 | ) | | | (266,920 | ) | | | (74,707 | ) | | | (776,180 | ) |
Class C | | | (898,483 | ) | | | (9,302,763 | ) | | | (2,619,967 | ) | | | (27,140,094 | ) |
Administrator Class | | | (4,918,882 | ) | | | (50,917,795 | ) | | | (28,074,212 | ) | | | (292,944,511 | ) |
Institutional Class | | | (31,353,473 | ) | | | (324,466,715 | ) | | | (29,667,924 | ) | | | (308,094,416 | ) |
| | | | | | | | | | | | | | | | |
| | | | | | | (409,500,470 | ) | | | | | | | (722,026,787 | ) |
| | | | | | | | | | | | | | | | |
Net increase in net assets resulting
from capital share transactions | | | | | | | 144,623,966 | | | | | | | | 92,555,101 | |
| | | | | | | | | | | | | | | | |
Total increase in net assets | | | | | | | 143,170,663 | | | | | | | | 79,610,209 | |
| | | | | | | | | | | | | | | | |
| | | | |
Net assets | | | | | | | | | | | | | | | | |
Beginning of period | | | | | | | 1,342,869,849 | | | | | | | | 1,263,259,640 | |
| | | | | | | | | | | | | | | | |
End of period | | | | | | $ | 1,486,040,512 | | | | | | | $ | 1,342,869,849 | |
| | | | | | | | | | | | | | | | |
Undistributed (overdistributed) net investment income | | | | | | $ | (4,400,366 | ) | | | | | | $ | 535,428 | |
| | | | | | | | | | | | | | | | |
The accompanying notes are an integral part of these financial statements.
| | | | |
| 16 | | Wells Fargo Advantage Short Duration Government Bond Fund | | Financial Highlights |
(For a share outstanding throughout each period)
| | | | | | | | | | | | | | | | | | | | | | | | | | | | |
| | | Six Months Ended
February 29, 2012 (Unaudited) | | | Year Ended August 31, | | | Year Ended May 31, | |
| Class A | | | 2011 | | | 20101 | | | 2010 | | | 2009 | | | 2008 | | | 2007 | |
Net asset value, beginning of period | | $ | 10.36 | | | $ | 10.47 | | | $ | 10.41 | | | $ | 10.30 | | | $ | 10.01 | | | $ | 9.85 | | | $ | 9.81 | |
Net investment income | | | 0.06 | | | | 0.16 | | | | 0.05 | | | | 0.19 | 2 | | | 0.37 | | | | 0.40 | | | | 0.39 | |
Net realized and unrealized gains (losses)
on investments | | | 0.03 | | | | 0.07 | | | | 0.08 | | | | 0.20 | | | | 0.32 | | | | 0.18 | | | | 0.06 | |
| | | | | | | | | | | | | | | | | | | | | | | | | | | | |
Total from investment operations | | | 0.09 | | | | 0.23 | | | | 0.13 | | | | 0.39 | | | | 0.69 | | | | 0.58 | | | | 0.45 | |
Distributions to shareholders from | | | | | | | | | | | | | | | | | | | | | | | | | | | | |
Net investment income | | | (0.10 | ) | | | (0.25 | ) | | | (0.07 | ) | | | (0.28 | ) | | | (0.40 | ) | | | (0.42 | ) | | | (0.41 | ) |
Net realized gains | | | 0.00 | | | | (0.09 | ) | | | 0.00 | | | | 0.00 | | | | 0.00 | | | | 0.00 | | | | 0.00 | |
| | | | | | | | | | | | | | | | | | | | | | | | | | | | |
Total distributions to shareholders | | | (0.10 | ) | | | (0.34 | ) | | | (0.07 | ) | | | (0.28 | ) | | | (0.40 | ) | | | (0.42 | ) | | | (0.41 | ) |
Net asset value, end of period | | $ | 10.35 | | | $ | 10.36 | | | $ | 10.47 | | | $ | 10.41 | | | $ | 10.30 | | | $ | 10.01 | | | $ | 9.85 | |
Total return3 | | | 0.84 | % | | | 2.17 | % | | | 1.23 | % | | | 3.85 | % | | | 7.05 | % | | | 5.95 | % | | | 4.69 | % |
Ratios to average net assets (annualized) | | | | | | | | | | | | | | | | | | | | | | | | | | | | |
Gross expenses | | | 0.86 | % | | | 0.87 | % | | | 0.86 | % | | | 0.88 | % | | | 0.94 | % | | | 1.11 | % | | | 1.10 | % |
Net expenses | | | 0.83 | % | | | 0.83 | % | | | 0.84 | % | | | 0.85 | % | | | 0.85 | % | | | 0.85 | % | | | 0.85 | % |
Net investment income | | | 1.25 | % | | | 1.60 | % | | | 1.85 | % | | | 1.86 | % | | | 3.61 | % | | | 4.02 | % | | | 4.04 | % |
Supplemental data | | | | | | | | | | | | | | | | | | | | | | | | | | | | |
Portfolio turnover rate | | | 214 | % | | | 485 | % | | | 135 | % | | | 501 | % | | | 277 | % | | | 210 | % | | | 493 | % |
Net assets, end of period (000’s omitted) | | | $186,236 | | | | $162,719 | | | | $181,951 | | | | $162,737 | | | | $105,430 | | | | $66,495 | | | | $77,602 | |
| 1. | For the three months ended August 31, 2010. The Fund changed its fiscal year end from May 31 to August 31, effective August 31, 2010. |
| 2. | Calculated based upon average shares outstanding. |
| 3. | Total return calculations do not include any sales charges. Returns for periods of less than one year are not annualized. |
The accompanying notes are an integral part of these financial statements.
| | | | | | |
| Financial Highlights | | Wells Fargo Advantage Short Duration Government Bond Fund | | | 17 | |
(For a share outstanding throughout each period)
| | | | | | | | | | | | | | | | | | | | | | | | | | | | |
| | | Six Months Ended
February 29, 2012 (Unaudited) | | | Year Ended August 31, | | | Year Ended May 31, | |
| Class B | | | 2011 | | | 20101 | | | 2010 | | | 2009 | | | 2008 | | | 2007 | |
Net asset value, beginning of period | | $ | 10.36 | | | $ | 10.48 | | | $ | 10.42 | | | $ | 10.31 | | | $ | 10.01 | | | $ | 9.86 | | | $ | 9.81 | |
Net investment income | | | 0.03 | | | | 0.09 | | | | 0.03 | | | | 0.14 | 2 | | | 0.30 | | | | 0.33 | | | | 0.33 | |
Net realized and unrealized gains (losses)
on investments | | | 0.03 | | | | 0.05 | | | | 0.08 | | | | 0.18 | | | | 0.32 | | | | 0.16 | | | | 0.06 | |
| | | | | | | | | | | | | | | | | | | | | | | | | | | | |
Total from investment operations | | | 0.06 | | | | 0.14 | | | | 0.11 | | | | 0.32 | | | | 0.62 | | | | 0.49 | | | | 0.39 | |
Distributions to shareholders from | | | | | | | | | | | | | | | | | | | | | | | | | | | | |
Net investment income | | | (0.06 | ) | | | (0.17 | ) | | | (0.05 | ) | | | (0.21 | ) | | | (0.32 | ) | | | (0.34 | ) | | | (0.34 | ) |
Net realized gains | | | 0.00 | | | | (0.09 | ) | | | 0.00 | | | | 0.00 | | | | 0.00 | | | | 0.00 | | | | 0.00 | |
| | | | | | | | | | | | | | | | | | | | | | | | | | | | |
Total distributions to shareholders | | | (0.06 | ) | | | (0.26 | ) | | | (0.05 | ) | | | (0.21 | ) | | | (0.32 | ) | | | (0.34 | ) | | | (0.34 | ) |
Net asset value, end of period | | $ | 10.36 | | | $ | 10.36 | | | $ | 10.48 | | | $ | 10.42 | | | $ | 10.31 | | | $ | 10.01 | | | $ | 9.86 | |
Total return3 | | | 0.56 | % | | | 1.32 | % | | | 1.04 | % | | | 3.08 | % | | | 6.36 | % | | | 5.06 | % | | | 4.01 | % |
Ratios to average net assets (annualized) | | | | | | | | | | | | | | | | | | | | | | | | | | | | |
Gross expenses | | | 1.61 | % | | | 1.62 | % | | | 1.62 | % | | | 1.66 | % | | | 1.69 | % | | | 1.86 | % | | | 1.85 | % |
Net expenses | | | 1.58 | % | | | 1.58 | % | | | 1.59 | % | | | 1.60 | % | | | 1.60 | % | | | 1.60 | % | | | 1.60 | % |
Net investment income | | | 0.49 | % | | | 0.85 | % | | | 1.07 | % | | | 1.30 | % | | | 2.90 | % | | | 3.29 | % | | | 3.29 | % |
Supplemental data | | | | | | | | | | | | | | | | | | | | | | | | | | | | |
Portfolio turnover rate | | | 214 | % | | | 485 | % | | | 135 | % | | | 501 | % | | | 277 | % | | | 210 | % | | | 493 | % |
Net assets, end of period (000’s omitted) | | | $1,468 | | | | $1,543 | | | | $1,548 | | | | $1,760 | | | | $4,779 | | | | $7,260 | | | | $12,230 | |
| 1. | For the three months ended August 31, 2010. The Fund changed its fiscal year end from May 31 to August 31, effective August 31, 2010. |
| 2. | Calculated based upon average shares outstanding. |
| 3. | Total return calculations do not include any sales charges. Returns for periods of less than one year are not annualized. |
The accompanying notes are an integral part of these financial statements.
| | | | |
| 18 | | Wells Fargo Advantage Short Duration Government Bond Fund | | Financial Highlights |
(For a share outstanding throughout each period)
| | | | | | | | | | | | | | | | | | | | | | | | | | | | |
| | | Six Months Ended
February 29, 2012 (Unaudited) | | | Year Ended August 31, | | | Year Ended May 31, | |
| Class C | | | 2011 | | | 20101 | | | 2010 | | | 2009 | | | 2008 | | | 2007 | |
Net asset value, beginning of period | | $ | 10.37 | | | $ | 10.48 | | | $ | 10.43 | | | $ | 10.32 | | | $ | 10.02 | | | $ | 9.87 | | | $ | 9.82 | |
Net investment income | | | 0.03 | | | | 0.08 | | | | 0.03 | | | | 0.11 | 2 | | | 0.34 | | | | 0.31 | | | | 0.30 | |
Net realized and unrealized gains (losses)
on investments | | | 0.02 | | | | 0.07 | | | | 0.07 | | | | 0.20 | | | | 0.28 | | | | 0.18 | | | | 0.09 | |
| | | | | | | | | | | | | | | | | | | | | | | | | | | | |
Total from investment operations | | | 0.05 | | | | 0.15 | | | | 0.10 | | | | 0.31 | | | | 0.62 | | | | 0.49 | | | | 0.39 | |
Distributions to shareholders from | | | | | | | | | | | | | | | | | | | | | | | | | | | | |
Net investment income | | | (0.06 | ) | | | (0.17 | ) | | | (0.05 | ) | | | (0.20 | ) | | | (0.32 | ) | | | (0.34 | ) | | | (0.34 | ) |
Net realized gains | | | 0.00 | | | | (0.09 | ) | | | 0.00 | | | | 0.00 | | | | 0.00 | | | | 0.00 | | | | 0.00 | |
| | | | | | | | | | | | | | | | | | | | | | | | | | | | |
Total distributions to shareholders | | | (0.06 | ) | | | (0.26 | ) | | | (0.05 | ) | | | (0.20 | ) | | | (0.32 | ) | | | (0.34 | ) | | | (0.34 | ) |
Net asset value, end of period | | $ | 10.36 | | | $ | 10.37 | | | $ | 10.48 | | | $ | 10.43 | | | $ | 10.32 | | | $ | 10.02 | | | $ | 9.87 | |
Total return3 | | | 0.46 | % | | | 1.41 | % | | | 0.94 | % | | | 3.06 | % | | | 6.34 | % | | | 5.06 | % | | | 4.01 | % |
Ratios to average net assets (annualized) | | | | | | | | | | | | | | | | | | | | | | | | | | | | |
Gross expenses | | | 1.61 | % | | | 1.62 | % | | | 1.62 | % | | | 1.65 | % | | | 1.69 | % | | | 1.86 | % | | | 1.85 | % |
Net expenses | | | 1.58 | % | | | 1.58 | % | | | 1.59 | % | | | 1.60 | % | | | 1.60 | % | | | 1.60 | % | | | 1.60 | % |
Net investment income | | | 0.49 | % | | | 0.85 | % | | | 1.10 | % | | | 1.01 | % | | | 2.82 | % | | | 3.28 | % | | | 3.29 | % |
Supplemental data | | | | | | | | | | | | | | | | | | | | | | | | | | | | |
Portfolio turnover rate | | | 214 | % | | | 485 | % | | | 135 | % | | | 501 | % | | | 277 | % | | | 210 | % | | | 493 | % |
Net assets, end of period (000’s omitted) | | | $75,980 | | | | $69,077 | | | | $72,124 | | | | $65,664 | | | | $18,009 | | | | $7,087 | | | | $8,440 | |
| 1. | For the three months ended August 31, 2010. The Fund changed its fiscal year end from May 31 to August 31, effective August 31, 2010. |
| 2. | Calculated based upon average shares outstanding. |
| 3. | Total return calculations do not include any sales charges. Returns for periods of less than one year are not annualized. |
The accompanying notes are an integral part of these financial statements.
| | | | | | |
| Financial Highlights | | Wells Fargo Advantage Short Duration Government Bond Fund | | | 19 | |
(For a share outstanding throughout each period)
| | | | | | | | | | | | | | | | | | | | | | | | | | | | |
| | | Six Months Ended
February 29, 2012 (Unaudited) | | | Year Ended August 31, | | | Year Ended May 31, | |
| Administrator Class | | | 2011 | | | 20101 | | | 2010 | | | 2009 | | | 2008 | | | 2007 | |
Net asset value, beginning of period | | $ | 10.37 | | | $ | 10.48 | | | $ | 10.42 | | | $ | 10.32 | | | $ | 10.02 | | | $ | 9.86 | | | $ | 9.82 | |
Net investment income | | | 0.08 | | | | 0.17 | | | | 0.05 | | | | 0.22 | 2 | | | 0.39 | | | | 0.42 | | | | 0.42 | |
Net realized and unrealized gains (losses)
on investments | | | 0.02 | | | | 0.08 | | | | 0.08 | | | | 0.19 | | | | 0.33 | | | | 0.18 | | | | 0.06 | |
| | | | | | | | | | | | | | | | | | | | | | | | | | | | |
Total from investment operations | | | 0.10 | | | | 0.25 | | | | 0.13 | | | | 0.41 | | | | 0.72 | | | | 0.60 | | | | 0.48 | |
Distributions to shareholders from | | | | | | | | | | | | | | | | | | | | | | | | | | | | |
Net investment income | | | (0.11 | ) | | | (0.27 | ) | | | (0.07 | ) | | | (0.31 | ) | | | (0.42 | ) | | | (0.44 | ) | | | (0.44 | ) |
Net realized gains | | | 0.00 | | | | (0.09 | ) | | | 0.00 | | | | 0.00 | | | | 0.00 | | | | 0.00 | | | | 0.00 | |
| | | | | | | | | | | | | | | | | | | | | | | | | | | | |
Total distributions to shareholders | | | (0.11 | ) | | | (0.36 | ) | | | (0.07 | ) | | | (0.31 | ) | | | (0.42 | ) | | | (0.44 | ) | | | (0.44 | ) |
Net asset value, end of period | | $ | 10.36 | | | $ | 10.37 | | | $ | 10.48 | | | $ | 10.42 | | | $ | 10.32 | | | $ | 10.02 | | | $ | 9.86 | |
Total return3 | | | 0.95 | % | | | 2.41 | % | | | 1.29 | % | | | 4.01 | % | | | 7.42 | % | | | 6.21 | % | | | 4.95 | % |
Ratios to average net assets (annualized) | | | | | | | | | | | | | | | | | | | | | | | | | | | | |
Gross expenses | | | 0.80 | % | | | 0.80 | % | | | 0.79 | % | | | 0.80 | % | | | 0.84 | % | | | 0.93 | % | | | 0.92 | % |
Net expenses | | | 0.60 | % | | | 0.60 | % | | | 0.60 | % | | | 0.60 | % | | | 0.60 | % | | | 0.60 | % | | | 0.60 | % |
Net investment income | | | 1.46 | % | | | 1.84 | % | | | 2.06 | % | | | 2.13 | % | | | 3.89 | % | | | 4.26 | % | | | 4.28 | % |
Supplemental data | | | | | | | | | | | | | | | | | | | | | | | | | | | | |
Portfolio turnover rate | | | 214 | % | | | 485 | % | | | 135 | % | | | 501 | % | | | 277 | % | | | 210 | % | | | 493 | % |
Net assets, end of period (000’s omitted) | | | $268,558 | | | | $247,357 | | | | $435,363 | | | | $505,432 | | | | $356,409 | | | | $246,592 | | | | $310,530 | |
| 1. | For the three months ended August 31, 2010. The Fund changed its fiscal year end from May 31 to August 31, effective August 31, 2010. |
| 2. | Calculated based upon average shares outstanding. |
| 3. | Returns for periods of less than one year are not annualized. |
The accompanying notes are an integral part of these financial statements.
| | | | |
| 20 | | Wells Fargo Advantage Short Duration Government Bond Fund | | Financial Highlights |
(For a share outstanding throughout each period)
| | | | | | | | | | | | | | | | | | | | | | | | | | | | |
| | | Six Months Ended
February 29, 2012 (Unaudited) | | | Year Ended August 31, | | | Year Ended May 31, | |
| Institutional Class | | | 2011 | | | 20101 | | | 2010 | | | 2009 | | | 2008 | | | 2007 | |
Net asset value, beginning of period | | $ | 10.37 | | | $ | 10.48 | | | $ | 10.43 | | | $ | 10.32 | | | $ | 10.02 | | | $ | 9.86 | | | $ | 9.82 | |
Net investment income | | | 0.08 | | | | 0.21 | | | | 0.06 | | | | 0.31 | 2 | | | 0.41 | | | | 0.44 | | | | 0.44 | |
Net realized and unrealized gains (losses)
on investments | | | 0.03 | | | | 0.06 | | | | 0.07 | | | | 0.13 | | | | 0.33 | | | | 0.18 | | | | 0.06 | |
| | | | | | | | | | | | | | | | | | | | | | | | | | | | |
Total from investment operations | | | 0.11 | | | | 0.27 | | | | 0.13 | | | | 0.44 | | | | 0.74 | | | | 0.62 | | | | 0.50 | |
Distributions to shareholders from | | | | | | | | | | | | | | | | | | | | | | | | | | | | |
Net investment income | | | (0.12 | ) | | | (0.29 | ) | | | (0.08 | ) | | | (0.33 | ) | | | (0.44 | ) | | | (0.46 | ) | | | (0.46 | ) |
Net realized gains | | | 0.00 | | | | (0.09 | ) | | | 0.00 | | | | 0.00 | | | | 0.00 | | | | 0.00 | | | | 0.00 | |
| | | | | | | | | | | | | | | | | | | | | | | | | | | | |
Total distributions to shareholders | | | (0.12 | ) | | | (0.38 | ) | | | (0.08 | ) | | | (0.33 | ) | | | (0.44 | ) | | | (0.46 | ) | | | (0.46 | ) |
Net asset value, end of period | | $ | 10.36 | | | $ | 10.37 | | | $ | 10.48 | | | $ | 10.43 | | | $ | 10.32 | | | $ | 10.02 | | | $ | 9.86 | |
Total return3 | | | 1.04 | % | | | 2.59 | % | | | 1.24 | % | | | 4.30 | % | | | 7.61 | % | | | 6.40 | % | | | 5.13 | % |
Ratios to average net assets (annualized) | | | | | | | | | | | | | | | | | | | | | | | | | | | | |
Gross expenses | | | 0.53 | % | | | 0.54 | % | | | 0.53 | % | | | 0.55 | % | | | 0.59 | % | | | 0.67 | % | | | 0.65 | % |
Net expenses | | | 0.42 | % | | | 0.42 | % | | | 0.42 | % | | | 0.42 | % | | | 0.42 | % | | | 0.42 | % | | | 0.42 | % |
Net investment income | | | 1.65 | % | | | 1.97 | % | | | 2.27 | % | | | 2.98 | % | | | 4.02 | % | | | 4.42 | % | | | 4.48 | % |
Supplemental data | | | | | | | | | | | | | | | | | | | | | | | | | | | | |
Portfolio turnover rate | | | 214 | % | | | 485 | % | | | 135 | % | | | 501 | % | | | 277 | % | | | 210 | % | | | 493 | % |
Net assets, end of period (000’s omitted) | | | $953,799 | | | | $862,174 | | | | $572,274 | | | | $489,762 | | | | $248,124 | | | | $87,784 | | | | $55,973 | |
| 1. | For the three months ended August 31, 2010. The Fund changed its fiscal year end from May 31 to August 31, effective August 31, 2010. |
| 2. | Calculated based upon average shares outstanding. |
| 3. | Returns for periods of less than one year are not annualized. |
The accompanying notes are an integral part of these financial statements.
| | | | | | |
| Notes to Financial Statements (Unaudited) | | Wells Fargo Advantage Short Duration Government Bond Fund | | | 21 | |
1. ORGANIZATION
Wells Fargo Funds Trust (the “Trust”), a Delaware statutory trust organized on March 10, 1999, is an open-end management investment company registered under the Investment Company Act of 1940, as amended (the “1940 Act”). These financial statements report on Wells Fargo Advantage Short Duration Government Bond Fund (the “Fund”) which is a diversified series of the Trust.
2. SIGNIFICANT ACCOUNTING POLICIES
The following significant accounting policies, which are consistently followed in the preparation of the financial statements of the Fund, are in conformity with U.S. generally accepted accounting principles which require management to make estimates and assumptions that affect the reported amounts of assets and liabilities, disclosure of contingent assets and liabilities at the date of the financial statements, and the reported amounts of revenues and expenses during the reporting period. Actual results could differ from those estimates.
Securities valuation
Fixed income securities with original maturities exceeding 60 days are valued based on available evaluated prices received from an independent pricing service approved by the Board of Trustees which may utilize both transaction data and market information such as yield, prices of securities of comparable quality, coupon rate, maturity, type of issue, trading characteristics and other market data. If valuations are not available from the pricing service or values received are deemed not representative of market value, values will be obtained from a third party broker-dealer or determined based on the Fund’s Fair Value Procedures.
Debt securities of sufficient credit quality with original maturities of 60 days or less generally are valued at amortized cost which approximates fair value. The amortized cost method involves valuing a security at its cost, plus accretion of discount or minus amortization of premium over the period until maturity.
Investments in open-end mutual funds and non-registered investment companies are generally valued at net asset value.
Investments which are not valued using any of the methods discussed above, are valued at their fair value, as determined by procedures established in good faith and approved by the Board of Trustees.
Security loans
The Fund may lend its securities from time to time in order to earn additional income in the form of fees or interest on securities received as collateral or the investment of any cash received as collateral. The Fund continues to receive interest or dividends on the securities loaned. The Fund receives collateral in the form of cash or securities with a value at least equal to the value of the securities on loan. The value of the loaned securities is determined at the close of each business day and any additional required collateral is delivered to the Fund on the next business day. In a securities lending transaction, the net asset value of the Fund will be affected by an increase or decrease in the value of the securities loaned and by an increase or decrease in the value of the instrument in which collateral is invested. The amount of securities lending activity undertaken by the Fund fluctuates from time to time. In the event of default or bankruptcy by the borrower, the Fund may be prevented from recovering the loaned securities or gaining access to the collateral or may experience delays or costs in doing so. In addition, the investment of any cash collateral received may lose all or part of its value. The Fund has the right under the lending agreement to recover the securities from the borrower on demand.
The Fund lends its securities through an unaffiliated securities lending agent. Cash collateral received in connection with its securities lending transactions is invested in Wells Fargo Securities Lending Cash Investments, LLC (the “Cash Collateral Fund”). The Cash Collateral Fund is exempt from registration under Section 3(c)(7) of the 1940 Act and is managed by Wells Fargo Funds Management LLC (“Funds Management”) and is sub-advised by Wells Capital Management Incorporated (“Wells Capital Management”). Funds Management receives an advisory fee starting at 0.05% and declining to 0.01% as the average daily net assets of the Cash Collateral Fund increase. All of the fees received by Funds Management are paid to Wells Capital Management for its services as sub-adviser. The Cash Collateral Fund seeks to provide a positive return compared to the daily Fed Funds Open rate by investing in high-quality, U.S. dollar-denominated short-term money market instruments. Cash Collateral Fund investments are fair valued based upon the amortized cost valuation technique. Income earned from investment in the Cash Collateral Fund is included in securities lending income on the Statement of Operations.
| | | | |
| 22 | | Wells Fargo Advantage Short Duration Government Bond Fund | | Notes to Financial Statements (Unaudited) |
For Wells Fargo Advantage Funds that participated in securities lending activity prior to February 13, 2009, certain structured investment vehicles purchased in a joint account by the former securities lending agent defaulted or were impaired. Certain of the Wells Fargo Advantage Funds still hold ownership interest in these structured investment vehicles, which have since been restructured as pass-through securities. If the Fund holds an ownership interest in such pass-through securities, information regarding this ownership interest can be found in the Portfolio of Investments under the category “Other”.
When-issued transactions
The Fund may purchase securities on a forward commitment or ‘when-issued’ basis. The Fund records a when-issued transaction on the trade date and will segregate assets to cover its obligation by confirming the availability of qualifying assets having a value sufficient to make payment for the securities purchased. Securities purchased on a when-issued basis are marked-to-market daily and the Fund begins earning interest on the settlement date. Losses may arise due to changes in the market value of the underlying securities or if the counterparty does not perform under the contract.
Security transactions and income recognition
Securities transactions are recorded on a trade date basis. Realized gains or losses are reported on the basis of identified cost of securities delivered.
Interest income is accrued daily and bond discounts are accreted and premiums are amortized daily based on the effective interest method. To the extent debt obligations are placed on non-accrual status, any related interest income may be reduced by writing off interest receivables when the collection of all or a portion of interest has become doubtful based on consistently applied procedures. If the issuer subsequently resumes interest payments or when the collectability of interest is reasonably assured, the debt obligation is removed from non-accrual status.
Distributions to shareholders
Distributions to shareholders from net investment income are accrued daily and paid monthly. Distributions from net realized gains, if any, are recorded on the ex-dividend date. Such distributions are determined in conformity with income tax regulations, which may differ from generally accepted accounting principles.
Federal and other taxes
The Fund intends to continue to qualify as a regulated investment company by distributing substantially all of its investment company taxable income and any net realized capital gains (after reduction for capital loss carryforwards) sufficient to relieve it from all, or substantially all, federal income taxes. Accordingly, no provision for federal income taxes was required.
The Fund’s income and federal excise tax returns and all financial records supporting those returns for the prior three fiscal years are subject to examination by the federal and Delaware revenue authorities.
Under the recently enacted Regulated Investment Company Modernization Act of 2010, the Fund is permitted to carry forward capital losses incurred in taxable years which began after December 22, 2010 for an unlimited period. However, any losses incurred are required to be utilized prior to the losses incurred in pre-enactment taxable years. As a result of this ordering rule, pre-enactment capital loss carryforwards may be more likely to expire unused. Additionally, post-enactment capital losses that are carried forward will retain their character as either short-term or long-term capital losses rather than being considered all short-term as under previous law.
As of August 31, 2011, the Fund had $1,918,624 of current year deferred post-October capital losses, which would be treated as realized for tax purposes on the first day of the succeeding year.
Class allocations
The separate classes of shares offered by the Fund differ principally in applicable sales charges, distribution, shareholder servicing and administration fees. Shareholders of each class bear certain expenses that pertain to that particular class. All shareholders bear the common expenses of the Fund, earn income from the portfolio, and are allocated unrealized gains and losses pro rata based on the average daily net assets of each class, without distinction between share classes. Dividends are determined separately for each class based on income and expenses allocable to each class. Realized gains and losses are allocated to each class pro rata based upon the net assets of each class on the date realized. Differences in per share dividend rates generally result from the relative weightings of pro rata income and realized gain allocations and from differences in separate class expenses, including distribution, shareholder servicing and administration fees.
| | | | | | |
| Notes to Financial Statements (Unaudited) | | Wells Fargo Advantage Short Duration Government Bond Fund | | | 23 | |
3. FAIR VALUATION MEASUREMENTS
Fair value measurements of investments are determined within a framework that has established a fair value hierarchy based upon the various data inputs utilized in determining the value of the Fund’s investments. The three-level hierarchy gives the highest priority to unadjusted quoted prices in active markets for identical assets or liabilities (Level 1) and the lowest priority to significant unobservable inputs (Level 3). The Fund’s investments are classified within the fair value hierarchy based on the lowest level of input that is significant to the fair value measurement. The inputs are summarized into three broad levels as follows:
| n | | Level 1 – quoted prices in active markets for identical securities |
| n | | Level 2 – other significant observable inputs (including quoted prices for similar securities, interest rates, prepayment speeds, credit risk, etc.) |
| n | | Level 3 – significant unobservable inputs (including the Fund’s own assumptions in determining the fair value of investments) |
The inputs or methodologies used for valuing securities are not necessarily an indication of the risk associated with investing in those securities.
As of February 29, 2012, the inputs used in valuing the Fund’s assets, which are carried at fair value, were as follows:
| | | | | | | | | | | | | | | | |
| Investments in Securities | | Quoted Prices (Level 1) | | | Significant Other
Observable Inputs (Level 2) | | | Significant Unobservable Inputs (Level 3) | | | Total | |
| | | | |
Agency securities | | $ | 0 | | | $ | 723,232,340 | | | $ | 0 | | | $ | 723,232,340 | |
| | | | |
Asset-backed securities | | | 0 | | | | 111,435,373 | | | | 0 | | | | 111,435,373 | |
| | | | |
Non-agency mortgage backed securities | | | 0 | | | | 110,303,744 | | | | 0 | | | | 110,303,744 | |
| | | | |
U.S. Treasury securities | | | 523,186,779 | | | | 0 | | | | 0 | | | | 523,186,779 | |
| | | | |
Yankee corporate bonds and notes | | | 0 | | | | 17,478,291 | | | | 0 | | | | 17,478,291 | |
| | | | |
Other | | | 0 | | | | 0 | | | | 798,832 | | | | 798,832 | |
| | | | |
Short-term investments | | | | | | | | | | | | | | | | |
Investment companies | | | 17,007,807 | | | | 13,023,473 | | | | 0 | | | | 30,031,280 | |
| | | $ | 540,194,586 | | | $ | 975,473,221 | | | $ | 798,832 | | | $ | 1,516,466,639 | |
Further details on the major security types listed above can be found in the Portfolio of Investments.
Transfers in and transfers out are recognized at the end of the reporting period. For the six months ended February 29, 2012, the Fund did not have any significant transfers into/out of Level 1 and Level 2.
The following is a reconciliation of assets in which significant unobservable inputs (Level 3) were used in determining fair value:
| | | | |
| | | Other | |
Balance as of August 31, 2011 | | $ | 1,091,085 | |
Accrued discounts (premiums) | | | 0 | |
Realized gains (losses) | | | 0 | |
Change in unrealized gains (losses) | | | (166,862 | ) |
Purchases | | | 0 | |
Sales | | | (125,391 | ) |
Transfers into Level 3 | | | 0 | |
Transfers out of Level 3 | | | 0 | |
Balance as of February 29, 2012 | | $ | 798,832 | |
Change in unrealized gains (losses) relating to securities still held at February 29, 2012 | | $ | (228,314 | ) |
| | | | |
| 24 | | Wells Fargo Advantage Short Duration Government Bond Fund | | Notes to Financial Statements (Unaudited) |
4. TRANSACTIONS WITH AFFILIATES AND OTHER EXPENSES
Advisory fee
The Trust has entered into an advisory contract with Funds Management, an indirect wholly owned subsidiary of Wells Fargo & Company (“Wells Fargo”). The adviser is responsible for implementing investment policies and guidelines and for supervising the sub-adviser, who is responsible for day-to-day portfolio management of the Fund.
Pursuant to the contract, Funds Management is entitled to receive an annual advisory fee starting at 0.40% and declining to 0.30% as the average daily net assets of the Fund increase. For the six months ended February 29, 2012, the advisory fee was equivalent to an annual rate of 0.37% of the Fund’s average daily net assets.
Funds Management has retained the services of certain sub-advisers to provide daily portfolio management to the Fund. The fees related to sub-advisory services are borne directly by Funds Management and do not increase the overall fees paid by the Fund. Wells Capital Management, an affiliate of Funds Management, is the sub-adviser to the Fund and is entitled to receive a fee from Funds Management at an annual rate starting at 0.15% and declining to 0.05% as the average daily net assets of the Fund increase.
Administration and transfer agent fees
The Trust has entered into an administration agreement with Funds Management. Under this agreement, for providing administrative services, which includes paying fees and expenses for services provided by the transfer agent, sub-transfer agents, omnibus account servicers and record-keepers, Funds Management is entitled to receive from the Fund an annual fund level administration fee starting at 0.05% and declining to 0.03% as the average daily net assets of the Fund increase and a class level administration fee which is calculated based on the average daily net assets of each class as follows:
| | | | |
| | | Class Level Administration Fee | |
Class A, Class B, Class C | | | 0.16 | % |
Administrator Class | | | 0.10 | |
Institutional Class | | | 0.08 | |
Funds Management has contractually waived and/or reimbursed advisory and administration fees to the extent necessary to maintain certain net operating expense ratios for the Fund. Waiver of fees and/or reimbursement of expenses by Funds Management were made first from fund level expenses on a proportionate basis and then from class specific expenses. Funds Management has committed through December 31, 2012 to waive fees and/or reimburse expenses to the extent necessary to cap the Fund’s expenses at 0.83% for Class A, 1.58% for Class B, 1.58% for Class C, 0.60% for Administrator Class and 0.42% for Institutional Class.
Distribution fees
The Trust has adopted a Distribution Plan for Class B and Class C shares of the Fund pursuant to Rule 12b-1 under the 1940 Act. Distribution fees are charged to Class B and Class C shares and paid to Wells Fargo Funds Distributor, LLC, the principal underwriter, at an annual rate of 0.75% of the average daily net assets of Class B and Class C shares.
For the six months ended February 29, 2012, Wells Fargo Funds Distributor, LLC received $8,751 from the sale of Class A shares and $26 and $5,973 in contingent deferred sales charges from redemptions of Class B and Class C shares, respectively.
Shareholder servicing fees
The Trust has entered into contracts with one or more shareholder servicing agents, whereby Class A, Class B, Class C and Administrator Class of the Fund is charged a fee at an annual rate of 0.25% of the average daily net assets of each respective class.
A portion of these total shareholder servicing fees were paid to affiliates of Wells Fargo.
| | | | | | |
| Notes to Financial Statements (Unaudited) | | Wells Fargo Advantage Short Duration Government Bond Fund | | | 25 | |
5. INVESTMENT PORTFOLIO TRANSACTIONS
Purchases and sales of investments, excluding short-term securities (securities with maturities of one year or less at purchase date), for the six months ended February 29, 2012 were as follows:
| | | | | | | | |
| Purchases at Cost | | Sales Proceeds | |
| U.S. Government | | Non-U.S. Government | | U.S. Government | | Non-U.S. Government | |
| $3,352,101,752 | | $123,172,882 | | $3,187,334,405 | | $ | 97,556,504 | |
6. BANK BORROWINGS
The Trust (excluding the money market funds) and Wells Fargo Variable Trust are parties to a $150,000,000 revolving credit agreement with State Street Bank and Trust Company, whereby the Fund is permitted to use bank borrowings for temporary or emergency purposes, such as to fund shareholder redemption requests. Interest under the credit agreement is charged to the Fund based on a borrowing rate equal to the higher of the Federal Funds rate in effect on that day plus 1.25% or the overnight LIBOR rate in effect on that day plus 1.25%. In addition, an annual commitment fee equal to 0.10% of the unused balance is allocated to each participating fund. Prior to September 6, 2011, the revolving credit agreement was for $125,000,000 and the annual commitment fee paid by the Fund was 0.125% of the unused balance. For the six months ended February 29, 2012, the Fund paid $1,085 in commitment fees.
For the six months ended February 29, 2012, there were no borrowings by the Fund under the agreement.
7. INDEMNIFICATION
Under the Trust’s organizational documents, the officers and directors are indemnified against certain liabilities that may arise out of performance of their duties to the Trust. Additionally, in the normal course of business, the Trust may enter into contracts with service providers that contain a variety of indemnification clauses. The Trust’s maximum exposure under these arrangements is dependent on future claims that may be made against the Fund and, therefore, cannot be estimated.
8. NEW ACCOUNTING PRONOUNCEMENTS
In May 2011, the Financial Accounting Standards Board (“FASB”) issued Accounting Standards Update (“ASU”) No. 2011-04 “Amendments to Achieve Common Fair Value Measurement and Disclosure Requirements in U.S. GAAP and IFRSs”. ASU No. 2011-04 amends FASB ASC Topic 820, Fair Value Measurements and Disclosures, to establish common requirements for measuring fair value and for disclosing information about fair value measurements in accordance with GAAP. The ASU is effective prospectively for interim and annual periods beginning after December 15, 2011. Management expects that adoption of the ASU will result in additional disclosures in the financial statements, as applicable.
In April 2011, FASB issued ASU No. 2011-03 “Reconsideration of Effective Control for Repurchase Agreements”. ASU No. 2011-03 amends FASB ASC Topic 860, Transfers and Servicing, specifically the criteria required to determine whether a repurchase agreement (repo) and similar agreements should be accounted for as sales of financial assets or secured borrowings with commitments. ASU No. 2011-03 changes the assessment of effective control by focusing on the transferor’s contractual rights and obligations and removing the criterion to assess its ability to exercise those rights or honor those obligations. This could result in changes to the way entities account for certain transactions including repurchase agreements, mortgage dollar rolls and reverse repurchase agreements. The ASU will become effective on a prospective basis for new transfers and modifications to existing transactions as of the beginning of the first interim or annual period beginning on or after December 15, 2011. Management has evaluated the impact of adopting the ASU and expects no significant changes.
| | | | |
| 26 | | Wells Fargo Advantage Short Duration Government Bond Fund | | Other Information (Unaudited) |
PROXY VOTING INFORMATION
A description of the policies and procedures that the Fund uses to determine how to vote proxies relating to portfolio securities is available without charge, upon request, by calling 1-800-222-8222, visiting our Web site at wellsfargoadvantagefunds.com, or visiting the SEC Web site at sec.gov. Information regarding how the Fund voted proxies relating to portfolio securities during the most recent 12-month period ended June 30 is available without charge on the Fund’s Web site at wellsfargoadvantagefunds.com or by visiting the SEC Web site at sec.gov.
PORTFOLIO HOLDINGS INFORMATION
The complete portfolio holdings for the Fund are publicly available on the Fund’s Web site (wellsfargoadvantagefunds.com) on a monthly, 30-day or more delayed basis. In addition, top ten holdings information for the Fund is publicly available on the Fund’s Web site on a monthly, seven-day or more delayed basis. The Fund files its complete schedule of portfolio holdings with the SEC for the first and third quarters of each fiscal year on Form N-Q, which is available without charge by visiting the SEC Web site at sec.gov. In addition, the Fund’s Form N-Q may be reviewed and copied at the SEC’s Public Reference Room in Washington, DC, and at regional offices in New York City, at 233 Broadway, and in Chicago, at 175 West Jackson Boulevard, Suite 900. Information about the Public Reference Room may be obtained by calling 1-800-SEC-0330.
| | | | | | |
| Other Information (Unaudited) | | Wells Fargo Advantage Short Duration Government Bond Fund | | | 27 | |
BOARD OF TRUSTEES
The following table provides basic information about the Board of Trustees (the “Trustees”) of the Trust and Officers of the Trust. This table should be read in conjunction with the Prospectus and the Statement of Additional Information1 of the Fund. Each of the Trustees and Officers listed below acts in identical capacities for the Wells Fargo Advantage family of funds, which consists of 137 funds comprising the Wells Fargo Funds Trust, Wells Fargo Variable Trust, Wells Fargo Master Trust and four closed-end funds (collectively the “Fund Complex”). All of the Trustees are also Members of the Audit and Governance Committees of each Trust in the Fund Complex. The mailing address of each Trustee and Officer is 525 Market Street, 12th Floor, San Francisco, CA 94105. Each Trustee and Officer serves an indefinite term, however, each Trustee serves such term until reaching the mandatory retirement age established by the Trustees.
Independent Trustees
| | | | | | |
Name and Year of Birth | | Position Held and Length of Service | | Principal Occupations During Past Five Years | | Other Directorships During
Past Five Years |
Peter G. Gordon
(Born 1942) | | Trustee, since 1998; Chairman, since 2005 (Lead Trustee since 2001) | | Co-Founder, Retired Chairman, President and CEO of Crystal Geyser Water Company. Trustee Emeritus, Colby College | | Asset Allocation Trust |
Isaiah Harris, Jr.
(Born 1952) | | Trustee, since 2009 | | Retired. Prior thereto, President and CEO of BellSouth Advertising and Publishing Corp. from 2005 to 2007, President and CEO of BellSouth Enterprises from 2004 to 2005 and President of BellSouth Consumer Services from 2000 to 2003. Emeritus member of the Iowa State University Foundation Board of Governors. Emeritus Member of the Advisory Board of Iowa State University School of Business. Mr. Harris is a certified public accountant. | | CIGNA Corporation; Deluxe Corporation; Asset Allocation Trust |
Judith M. Johnson
(Born 1949) | | Trustee, since 2008 | | Retired. Prior thereto, Chief Executive Officer and Chief Investment Officer of Minneapolis Employees Retirement Fund from 1996 to 2008. Ms. Johnson is an attorney, certified public accountant and a certified managerial accountant. | | Asset Allocation Trust |
Leroy Keith, Jr.
(Born 1939) | | Trustee, since 2010 | | Chairman, Bloc Global Services (development and construction). Trustee of the Evergreen Funds from 1983 to 2010. Former Managing Director, Almanac Capital Management (commodities firm), former Partner, Stonington Partners, Inc. (private equity fund), former Director, Obagi Medical Products Co. and former Director, Lincoln Educational Services. | | Trustee, Virtus Fund Complex (consisting of 40 portfolios as of 12/31/11); Asset Allocation Trust |
David F. Larcker
(Born 1950) | | Trustee, since 2009 | | James Irvin Miller Professor of Accounting at the Graduate School of Business, Stanford University, Director of Corporate Governance Research Program and Senior Faculty of The Rock Center for Corporate Governance since 2006. From 2005 to 2008, Professor of Accounting at the Graduate School of Business, Stanford University. Prior thereto, Ernst & Young Professor of Accounting at The Wharton School, University of Pennsylvania from 1985 to 2005. | | Asset Allocation Trust |
Olivia S. Mitchell
(Born 1953) | | Trustee, since 2006 | | International Foundation of Employee Benefit Plans Professor, Wharton School of the University of Pennsylvania since 1993. Director of Wharton’s Pension Research Council and Boettner Center on Pensions & Retirement Research, and Research Associate at the National Bureau of Economic Research. Previously, Cornell University Professor from 1978 to 1993. | | Asset Allocation Trust |
| | | | |
| 28 | | Wells Fargo Advantage Short Duration Government Bond Fund | | Other Information (Unaudited) |
| | | | | | |
Name and Year of Birth | | Position Held and Length of Service | | Principal Occupations During Past Five Years | | Other Directorships During
Past Five Years |
Timothy J. Penny
(Born 1951) | | Trustee, since 1996 | | President and CEO of Southern Minnesota Initiative Foundation, a non-profit organization, since 2007 and Senior Fellow at the Humphrey Institute Policy Forum at the University of Minnesota since 1995. Member of the Board of Trustees of NorthStar Education Finance, Inc., a non-profit organization, since 2007. | | Asset Allocation Trust |
Michael S. Scofield
(Born 1943) | | Trustee, since 2010 | | Served on the Investment Company Institute’s Board of Governors and Executive Committee from 2008-2011 as well the Governing Council of the Independent Directors Council from 2006-2011 and the Independent Directors Council Executive Committee from 2008-2011. Chairman of the IDC from 2008-2010. Institutional Investor (Fund Directions) Trustee of Year in 2007. Trustee of the Evergreen Funds (and its predecessors) from 1984 to 2010. Chairman of the Evergreen Funds from 2000-2010. Former Trustee of the Mentor Funds. Retired Attorney, Law Offices of Michael S. Scofield and former Director and Chairman, Branded Media Corporation (multi-media branding company). | | Asset Allocation Trust |
Donald C. Willeke
(Born 1940) | | Trustee, since 1996 | | Principal of the law firm of Willeke & Daniels. General Counsel of the Minneapolis Employees Retirement Fund from 1984 until its consolidation into the Minnesota Public Employees Retirement Association on June 30, 2010. Director and Vice Chair of The Free Trust (non-profit corporation). Director of the American Chestnut Foundation (non-profit corporation). | | Asset Allocation Trust |
Officers
| | | | | | |
Name and Year of Birth | | Position Held and
Length of Service | | Principal Occupations During Past Five Years | | |
Karla M. Rabusch
(Born 1959) | | President, since 2003 | | Executive Vice President of Wells Fargo Bank, N.A. and President of Wells Fargo Funds Management, LLC since 2003. Senior Vice President and Chief Administrative Officer of Wells Fargo Funds Management, LLC from 2001 to 2003. | | |
C. David Messman
(Born 1960) | | Secretary, since 2000; Chief Legal Counsel, since 2003 | | Senior Vice President and Secretary of Wells Fargo Funds Management, LLC since 2001. Vice President and Managing Senior Counsel of Wells Fargo Bank, N.A. since 1996. | | |
Kasey Phillips
(Born 1970) | | Treasurer, since 2009 | | Senior Vice President of Wells Fargo Funds Management, LLC since 2009. Senior Vice President of Evergreen Investment Management Company, LLC from 2006 to 2010. Treasurer of the Evergreen Funds from 2005 to 2010. | | |
David Berardi
(Born 1975) | | Assistant Treasurer, since 2009 | | Vice President of Wells Fargo Funds Management, LLC since 2009. Vice President of Evergreen Investment Management Company, LLC from 2008 to 2010. Assistant Vice President of Evergreen Investment Services, Inc. from 2004 to 2008. Manager of Fund Reporting and Control for Evergreen Investment Management Company, LLC from 2004 to 2010. | | |
Jeremy DePalma
(Born 1974) | | Assistant Treasurer, since 2009 | | Senior Vice President of Wells Fargo Funds Management, LLC since 2009. Senior Vice President of Evergreen Investment Management Company, LLC from 2008 to 2010. Vice President, Evergreen Investment Services, Inc. from 2004 to 2007. Head of the Fund Reporting and Control Team within Fund Administration from 2005 to 2010. | | |
Debra Ann Early
(Born 1964) | | Chief Compliance Officer, since 2007 | | Chief Compliance Officer of Wells Fargo Funds Management, LLC since 2007. Chief Compliance Officer of Parnassus Investments from 2005 to 2007. Chief Financial Officer of Parnassus Investments from 2004 to 2007 and Senior Audit Manager of PricewaterhouseCoopers LLP from 1998 to 2004. | | |
| 1. | The Statement of Additional Information includes additional information about the Trustees and is available, without charge, upon request, by calling 1-800-222-8222 or by visiting the Web site at wellsfargoadvantagefunds.com. |
| | | | | | |
| List of Abbreviations | | Wells Fargo Advantage Short Duration Government Bond Fund | | | 29 | |
The following is a list of common abbreviations for terms and entities which may have appeared in this report.
| ACB | — Agricultural Credit Bank |
| ADR | — American Depository Receipt |
| ADS | — American Depository Shares |
| AGC-ICC | — Assured Guaranty Corporation - Insured Custody Certificates |
| AGM | — Assured Guaranty Municipal |
| AMBAC | — American Municipal Bond Assurance Corporation |
| AMT | — Alternative Minimum Tax |
| BAN | — Bond Anticipation Notes |
| BHAC | — Berkshire Hathaway Assurance Corporation |
| CAB | — Capital Appreciation Bond |
| CCAB | — Convertible Capital Appreciation Bond |
| CDA | — Community Development Authority |
| CDO | — Collateralized Debt Obligation |
| COP | — Certificate of Participation |
| DRIVER | — Derivative Inverse Tax-Exempt Receipts |
| DW&P | — Department of Water & Power |
| DWR | — Department of Water Resources |
| ECFA | — Educational & Cultural Facilities Authority |
| EDA | — Economic Development Authority |
| EDFA | — Economic Development Finance Authority |
| ETF | — Exchange-Traded Fund |
| FFCB | — Federal Farm Credit Bank |
| FGIC | — Financial Guaranty Insurance Corporation |
| FHA | — Federal Housing Authority |
| FHLB | — Federal Home Loan Bank |
| FHLMC | — Federal Home Loan Mortgage Corporation |
| FNMA | — Federal National Mortgage Association |
| GDR | — Global Depository Receipt |
| GNMA | — Government National Mortgage Association |
| HCFR | — Healthcare Facilities Revenue |
| HEFA | — Health & Educational Facilities Authority |
| HEFAR | — Higher Education Facilities Authority Revenue |
| HFA | — Housing Finance Authority |
| HFFA | — Health Facilities Financing Authority |
| IBC | — Insured Bond Certificate |
| IDA | — Industrial Development Authority |
| IDAG | — Industrial Development Agency |
| IDR | — Industrial Development Revenue |
| KRW | — Republic of Korea Won |
| LIBOR | — London Interbank Offered Rate |
| LLC | — Limited Liability Company |
| LLP | — Limited Liability Partnership |
| MBIA | — Municipal Bond Insurance Association |
| MFHR | — Multi-Family Housing Revenue |
| MSTR | — Municipal Securities Trust Receipts |
| MUD | — Municipal Utility District |
| NATL-RE | — National Public Finance Guarantee Corporation |
| PCFA | — Pollution Control Finance Authority |
| PCR | — Pollution Control Revenue |
| PFA | — Public Finance Authority |
| PFFA | — Public Facilities Financing Authority |
| PFOTER | — Puttable Floating Option Tax-Exempt Receipts |
| plc | — Public Limited Company |
| PUTTER | — Puttable Tax-Exempt Receipts |
| R&D | — Research & Development |
| RDA | — Redevelopment Authority |
| RDFA | — Redevelopment Finance Authority |
| REIT | — Real Estate Investment Trust |
| ROC | — Reset Option Certificates |
| SAVRS | — Select Auction Variable Rate Securities |
| SBA | — Small Business Authority |
| SFHR | — Single Family Housing Revenue |
| SFMR | — Single Family Mortgage Revenue |
| SPDR | — Standard & Poor’s Depositary Receipts |
| TAN | — Tax Anticipation Notes |
| TIPS | — Treasury Inflation-Protected Securities |
| TRAN | — Tax Revenue Anticipation Notes |
| TCR | — Transferable Custody Receipts |
| TTFA | — Transportation Trust Fund Authority |
| TVA | — Tennessee Valley Authority |
| XLCA | — XL Capital Assurance |
This page is intentionally left blank.


FOR MORE INFORMATION
More information about Wells Fargo Advantage Funds is available free upon request. To obtain literature, please write, e-mail, visit the Fund’s Web site, or call:
Wells Fargo Advantage Funds
P.O. Box 8266
Boston, MA 02266-8266
E-mail: wfaf@wellsfargo.com
Web site: wellsfargoadvantagefunds.com
Individual investors: 1-800-222-8222
Retail investment professionals: 1-888-877-9275
Institutional investment professionals: 1-866-765-0778
This report and the financial statements contained herein are submitted for the general information of the shareholders of Wells Fargo Advantage Funds. If this report is used for promotional purposes, distribution of the report must be accompanied or preceded by a current prospectus. For a prospectus containing more complete information, including charges and expenses, call 1-800-222-8222 or visit the Fund’s Web site at wellsfargoadvantagefunds.com. Please consider the investment objectives, risks, charges, and expenses of the investment carefully before investing. This and other information about Wells Fargo Advantage Funds can be found in the current prospectus. Read the prospectus carefully before you invest or send money.
Wells Fargo Funds Management, LLC, a wholly owned subsidiary of Wells Fargo & Company, provides investment advisory and administrative services for Wells Fargo Advantage Funds. Other affiliates of Wells Fargo & Company provide subadvisory and other services for the Funds. The Funds are distributed by Wells Fargo Funds Distributor, LLC, Member FINRA/SIPC, an affiliate of Wells Fargo & Company.
NOT FDIC INSURED ¡ NO BANK GUARANTEE ¡ MAY LOSE VALUE
© 2012 Wells Fargo Funds Management, LLC. All rights reserved.
| | |
 | | 208525 04-12 SA220/SAR220 2-12 |

Wells Fargo Advantage Short-Term Bond Fund

Semi-Annual Report
February 29, 2012

Reduce clutter. Save trees.
Sign up for electronic delivery of prospectuses and shareholder reports at wellsfargo.com/advantagedelivery
Contents
The views expressed and any forward-looking statements are as of February 29, 2012, unless otherwise noted, and are those of the Fund managers and/or Wells Fargo Funds Management, LLC. Discussions of individual securities, or the markets generally, or any Wells Fargo Advantage Fund are not intended as individual recommendations. Future events or results may vary significantly from those expressed in any forward-looking statements; the views expressed are subject to change at any time in response to changing circumstances in the market. Wells Fargo Funds Management, LLC, disclaims any obligation to publicly update or revise any views expressed or forward-looking statements.
NOT FDIC INSURED ¡ NO BANK GUARANTEE ¡ MAY LOSE VALUE

WELLS FARGO INVESTMENT HISTORY
| | |
| |
| 1932 | | Keystone creates one of the first mutual fund families. |
| |
| 1971 | | Wells Fargo & Company introduces one of the first institutional index funds. |
| |
| 1978 | | Wells Fargo applies Markowitz and Sharpe’s research on Modern Portfolio Theory to introduce one of the industry’s first Tactical Asset Allocation (TAA) models in institutional separately managed accounts. |
| |
| 1984 | | Wells Fargo Stagecoach Funds launches its first asset allocation fund. |
| |
| 1989 | | The Tactical Asset Allocation (TAA) Model is first applied to Wells Fargo’s asset allocation mutual funds. |
| |
| 1994 | | Wells Fargo introduces the LifePath Funds, one of the first suites of target date funds (now the Wells Fargo Advantage Dow Jones Target Date FundsSM). |
| |
| 1996 | | Evergreen Investments and Keystone Funds merge. |
| |
| 1997 | | Wells Fargo launches Wells Fargo Advantage WealthBuilder PortfoliosSM, a fund-of-funds suite of products that includes the use of quantitative models to shift assets among investment styles. |
| |
| 1999 | | Norwest Advantage Funds and Stagecoach Funds are reorganized into Wells Fargo Funds after the merger of Norwest and Wells Fargo. |
| |
| 2002 | | Evergreen Retail and Evergreen Institutional companies form the umbrella asset management company, Evergreen Investments. |
| |
| 2005 | | The integration of Strong Funds with Wells Fargo Funds creates Wells Fargo Advantage Funds, resulting in one of the top 20 mutual fund companies in the United States. |
| |
| 2006 | | Wells Fargo Advantage Funds relaunches the target date product line as Wells Fargo Advantage Dow Jones Target Date Funds. |
| |
| 2010 | | The mergers and reorganizations of Evergreen and Wells Fargo Advantage mutual funds are completed, unifying the families under the brand of Wells Fargo Advantage Funds. |
Wells Fargo Advantage Funds®
Wells Fargo Advantage Funds skillfully guides institutions, financial advisors, and individuals through the investment terrain to help them reach their financial objectives. Everything we do on behalf of investors is backed by our unique combination of qualifications.
Strength
Our organization is built on the standards of integrity and service established by our parent company—Wells Fargo & Company—more than 150 years ago. And, because we’re part of a highly diversified financial enterprise, we offer the depth of resources to help investors succeed.
Expertise
Our multi-boutique model offers investors access to the independent thinking of premier investment managers that have been chosen for their time-tested strategies. While each team specializes in a specific investment strategy, collectively they provide investors a wide choice of distinct investment styles. Our dedication to investment excellence doesn’t end with our expertise in manager selection—risk management, analysis, and rigorous ongoing review seek to ensure each manager’s investment process remains consistent.
Partnership
Our collaborative approach is built around understanding the needs and goals of our clients. By adhering to core principles of sound judgment and steady guidance, we support you through every stage of the investment decision process.
Carefully consider a fund’s investment objectives, risks, charges, and expenses before investing. For a current prospectus and, if available, a summary prospectus, containing this and other information, visit wellsfargoadvantagefunds.com. Read it carefully before investing.
Wells Fargo Funds Management, LLC, a wholly owned subsidiary of Wells Fargo & Company, provides investment advisory and administrative services for Wells Fargo Advantage Funds®. Other affiliates of Wells Fargo & Company provide subadvisory and other services for the Funds. The Funds are distributed by Wells Fargo Funds Distributor, LLC, Member FINRA/SIPC, an affiliate of Wells Fargo & Company.
“Dow Jones®” and “Dow Jones Target Date IndexesSM” are service marks of Dow Jones Trademark Holdings, LLC (“Dow Jones”), have been licensed to CME Group Index Services LLC (“CME Indexes”) and have been sublicensed for use for certain purposes by Global Index Advisors, Inc, and Wells Fargo Funds Management, LLC. The Wells Fargo Advantage Dow Jones Target Date FundsSM based on the Dow Jones Target Date IndexesSM, are not sponsored, endorsed, sold or promoted by Dow Jones, CME Indexes or their respective affiliates and none of them makes any representation regarding the advisability of investing in such product(s).
NOT FDIC INSURED ¡ NO BANK GUARANTEE ¡ MAY LOSE VALUE
Not part of the semi-annual report.
Wells Fargo Advantage Funds offers more than 110 mutual funds across a wide range of asset classes, representing over $218 billion in assets under management, as of February 29, 2012.
| | | | |
| Equity Funds | | | | |
Asia Pacific Fund | | Equity Value Fund | | Precious Metals Fund |
C&B Large Cap Value Fund | | Global Opportunities Fund | | Premier Large Company Growth Fund |
C&B Mid Cap Value Fund | | Growth Fund | | Small Cap Opportunities Fund |
Capital Growth Fund | | Index Fund | | Small Cap Value Fund |
Common Stock Fund | | International Equity Fund | | Small Company Growth Fund |
Disciplined U.S. Core Fund | | International Value Fund | | Small Company Value Fund |
Discovery Fund† | | Intrinsic Small Cap Value Fund | | Small/Mid Cap Core Fund |
Diversified Equity Fund | | Intrinsic Value Fund | | Small/Mid Cap Value Fund |
Diversified International Fund | | Intrinsic World Equity Fund | | Special Mid Cap Value Fund |
Diversified Small Cap Fund | | Large Cap Core Fund | | Special Small Cap Value Fund |
Emerging Growth Fund | | Large Cap Growth Fund | | Specialized Technology Fund |
Emerging Markets Equity Fund | | Large Company Value Fund | | Strategic Large Cap Growth Fund |
Endeavor Select Fund† | | Omega Growth Fund | | Traditional Small Cap Growth Fund |
Enterprise Fund† | | Opportunity Fund† | | Utility and Telecommunications Fund |
| Bond Funds | | | | |
Adjustable Rate Government Fund | | Inflation-Protected Bond Fund | | Short-Term Bond Fund |
California Limited-Term Tax-Free Fund | | Intermediate Tax/AMT-Free Fund | | Short-Term High Yield Bond Fund |
California Tax-Free Fund | | International Bond Fund | | Short-Term Municipal Bond Fund |
Colorado Tax-Free Fund | | Minnesota Tax-Free Fund | | Strategic Municipal Bond Fund |
Government Securities Fund | | Municipal Bond Fund | | Total Return Bond Fund |
High Income Fund | | North Carolina Tax-Free Fund | | Ultra Short-Term Income Fund |
High Yield Bond Fund | | Pennsylvania Tax-Free Fund | | Ultra Short-Term Municipal Income Fund |
Income Plus Fund | | Short Duration Government Bond Fund | | Wisconsin Tax-Free Fund |
| Asset Allocation Funds | | | | |
Absolute Return Fund | | WealthBuilder Equity Portfolio† | | Target 2020 Fund† |
Asset Allocation Fund | | WealthBuilder Growth Allocation Portfolio† | | Target 2025 Fund† |
Conservative Allocation Fund | | WealthBuilder Growth Balanced Portfolio† | | Target 2030 Fund† |
Diversified Capital Builder Fund | | WealthBuilder Moderate Balanced Portfolio† | | Target 2035 Fund† |
Diversified Income Builder Fund | | WealthBuilder Tactical Equity Portfolio† | | Target 2040 Fund† |
Growth Balanced Fund | | Target Today Fund† | | Target 2045 Fund† |
Index Asset Allocation Fund | | Target 2010 Fund† | | Target 2050 Fund† |
Moderate Balanced Fund | | Target 2015 Fund† | | Target 2055 Fund† |
WealthBuilder Conservative Allocation Portfolio† | | | | |
| Money Market Funds | | | | |
100% Treasury Money Market Fund | | Heritage Money Market Fund† | | National Tax-Free Money Market Fund |
California Municipal Money Market Fund | | Money Market Fund | | Prime Investment Money Market Fund |
Cash Investment Money Market Fund | | Municipal Cash Management Money Market Fund | | Treasury Plus Money Market Fund |
Government Money Market Fund | | Municipal Money Market Fund | | |
| Variable Trust Funds1 | | | | |
VT Discovery Fund† | | VT Intrinsic Value Fund | | VT Small Cap Growth Fund |
VT Index Asset Allocation Fund | | VT Omega Growth Fund | | VT Small Cap Value Fund |
VT International Equity Fund | | VT Opportunity Fund† | | VT Total Return Bond Fund |
An investment in a money market fund is not insured or guaranteed by the Federal Deposit Insurance Corporation or any other government agency. Although the Wells Fargo Advantage Money Market Funds seek to preserve the value of your investment at $1.00 per share, it is possible to lose money by investing in a money market fund.
| 1. | The Variable Trust Funds are generally available only through insurance company variable contracts. |
| † | In this report, the Wells Fargo Advantage Discovery FundSM, Wells Fargo Advantage Endeavor Select FundSM, Wells Fargo Advantage Enterprise FundSM, Wells Fargo Advantage Opportunity FundSM, Wells Fargo Advantage WealthBuilder Conservative Allocation PortfolioSM, Wells Fargo Advantage WealthBuilder Equity PortfolioSM, Wells Fargo Advantage WealthBuilder Growth Allocation PortfolioSM, Wells Fargo Advantage WealthBuilder Growth Balanced PortfolioSM, Wells Fargo Advantage WealthBuilder Moderate Balanced PortfolioSM, Wells Fargo Advantage WealthBuilder Tactical Equity PortfolioSM, Wells Fargo Advantage Dow Jones Target Today FundSM, Wells Fargo Advantage Dow Jones Target 2010 FundSM, Wells Fargo Advantage Dow Jones Target 2015 FundSM, Wells Fargo Advantage Dow Jones Target 2020 FundSM, Wells Fargo Advantage Dow Jones Target 2025 FundSM, Wells Fargo Advantage Dow Jones Target 2030 FundSM, Wells Fargo Advantage Dow Jones Target 2035 FundSM, Wells Fargo Advantage Dow Jones Target 2040 FundSM, Wells Fargo Advantage Dow Jones Target 2045 FundSM, Wells Fargo Advantage Dow Jones Target 2050 FundSM, Wells Fargo Advantage Dow Jones Target 2055 FundSM, Wells Fargo Advantage Heritage Money Market FundSM, Wells Fargo Advantage VT Discovery FundSM, and Wells Fargo Advantage VT Opportunity FundSM are referred to as the Discovery Fund, Endeavor Select Fund, Enterprise Fund, Opportunity Fund, WealthBuilder Conservative Allocation Portfolio, WealthBuilder Equity Portfolio, WealthBuilder Growth Allocation Portfolio, WealthBuilder Growth Balanced Portfolio, WealthBuilder Moderate Balanced Portfolio, WealthBuilder Tactical Equity Portfolio, Target Today Fund, Target 2010 Fund, Target 2015 Fund, Target 2020 Fund, Target 2025 Fund, Target 2030 Fund, Target 2035 Fund, Target 2040 Fund, Target 2045 Fund, Target 2050 Fund, Target 2055 Fund, Heritage Money Market Fund, VT Discovery Fund, and VT Opportunity Fund, respectively. |
Not part of the semi-annual report.
| | | | |
| 2 | | Wells Fargo Advantage Short-Term Bond Fund | | Letter to Shareholders |

Karla M. Rabusch,
President
Wells Fargo Advantage Funds
The theme for the period was a shift from risk aversion in the first half to burgeoning trends of improving investor confidence in the second half, which significantly improved pricing in the lower-rated asset classes.
On the whole, investment-grade fixed-income securities performed positively during the period, but the strongest returns came from the high-yield market.
Dear Valued Shareholder:
We are pleased to offer you this semi-annual report for the Wells Fargo Advantage Short-Term Bond Fund, which covers the six-month period that ended February 29, 2012. During the period, fixed-income performance was best among the lower-rated securities, as improved investor confidence in the U.S. economy and the U.S. credit markets encouraged investors to return to riskier asset classes.
The period began with heightened risk aversion but ended with stronger investor confidence.
The six-month period began with the worsening of the Greek crisis, which amplified risk aversion across the global credit markets. This in turn led to a powerful rally in U.S. Treasuries and a sharp decline in high-yield bond prices, most notably in the lowest-quality credit tiers. During this time, most investment-grade fixed-income markets continued to generate positive returns—although certain areas of the riskiest segments of the markets declined—and U.S. Treasury yields reached the lowest levels in decades, even surpassing the low yield levels reached in the summer of 2010.
The last three months of the period were characterized by a strong reversal of the trends of the first three months. In October 2011, the high-yield market recovered significantly, benefiting from indications of improving policy with regard to managing the debt crisis from Europe and the formal announcement of a European debt deal late in the month. Due to renewed concerns about the European Union’s ability to manage the debt crisis, November 2011 saw a modest decline in investment-grade corporate bond prices and a sharp correction in high-yield corporate bonds, but another strong recovery in pricing started in December and carried into the first two months of 2012. Investor confidence strengthened as the U.S. economy demonstrated signs of sustainable growth and U.S. credit markets began to show some resistance to the credit problems of Europe. Thus, the theme for the period was a shift from risk aversion in the first half to burgeoning trends of improving investor confidence in the second half, which significantly improved pricing in the lower-rated asset classes.
On the whole, investment-grade fixed-income securities performed positively during the period, but the strongest returns came from the high-yield market. In fact, the best returns for the six-month period came from the lowest-rated credit tiers, despite the fact that they significantly underperformed in August and September 2011. Similar trends were true in the structured products sector, as lower-rated commercial mortgage-backed securities were among the best performers for the period, despite underperforming in the first two months.
The Federal Reserve launched Operation Twist in September.
With economic concerns and credit woes escalating in Europe and some continued uncertainty about the growth outlook in the U.S. during August and September 2011, the Federal Reserve (Fed) intervened yet again with monetary accommodations—this time with “Operation Twist,” which was announced and launched in September 2011. With Operation Twist, the Fed endeavored to flatten the yield curve and drive long-term rates down by selling short-term Treasuries and using the proceeds to purchase long-term Treasuries. The Fed stated that it is unlikely to raise rates before 2014, which should keep yields on Treasuries low. Despite this announcement, problems in Europe caused Treasuries to continue to rally in the first 3 months of the period, while credit spreads on corporate and
| | | | | | |
| Letter to Shareholders | | Wells Fargo Advantage Short-Term Bond Fund | | | 3 | |
securitized sectors widened with increasing risk aversion. However, with an improved U.S. economic outlook and greater investor confidence, the last three months of the period saw a slight decline in U.S. Treasury prices and significant improvement in high-yield corporate bond prices. Credit spreads in the corporate and securitized sectors broadly tightened in December 2011 and January and February 2012.
Although U.S. economic conditions appear to have improved over the course of the period, the recovery continues to face some headwinds in the form of languishing housing values and elevated unemployment levels, which may continue to create some volatility in the fixed-income markets. While we cannot say definitively what near-term performance will look like, we continue to encourage investors to maintain fully diversified, actively managed portfolios, which may provide better protection from risk and added opportunities to capture relative value. While heightened volatility may be uncomfortable to experience in the short term, we believe it can lead to unique opportunities to add relative value for investors with long-term investment horizons.
Don’t let short-term uncertainty derail long-term investment goals.
Periods of uncertainty can present challenges, but experience has taught us that maintaining a long-term investment strategy based on individual goals and risk tolerance can be an effective way to plan for the future. To help you create a sound strategy based on your personal goals and risk tolerance, Wells Fargo Advantage Funds offers more than 110 mutual funds and other investments spanning a wide range of asset classes and investment styles. Although diversification cannot guarantee an investment profit or prevent losses, we believe it can be an effective way to manage investment risk and potentially smooth out overall portfolio performance.
In our opinion, diligent and earnest assessment of the fundamental risks in individual fixed-income securities will be a key differentiating factor between which investment strategies perform well and which do not. At Wells Fargo Advantage Funds, we intend to continue measuring relative-value opportunities in the fixed-income markets and across our lineup of funds. We believe it is particularly important to have diligent investment analysts in charge of investor assets in changing markets. As evidenced by the performance of fixed-income assets during the recent six-month period, heightened risks also often accompany such opportunities.
Thank you for choosing to invest with Wells Fargo Advantage Funds. We appreciate your confidence in us and remain committed to helping you meet your financial needs. For current information about your fund investments, contact your investment professional, visit our Web site at wellsfargoadvantagefunds.com, or call us directly at 1-800-222-8222. We are available 24 hours a day, 7 days a week.
Sincerely,

Karla M. Rabusch
President
Wells Fargo Advantage Funds
| | | | |
| 4 | | Wells Fargo Advantage Short-Term Bond Fund | | Letter to Shareholders |
Notice to Shareholders
The Board of Trustees for Wells Fargo Advantage Funds has unanimously approved the following modifications to certain net asset value (NAV) waiver privileges and commission schedules:
| | n | | Effective May 1, 2012, automatic investment plan (AIP) purchases and proceeds received from systematic withdrawals will no longer qualify for NAV repurchase privileges. | |
| | n | | Effective May 1, 2012, discretionary rights to waive the upfront commission for Class C and “jumbo” Class A share purchases will no longer be granted to broker/dealers. However, we will continue to waive the Class C shares contingent deferred sales charge for redemptions by employer-sponsored retirement plans where the dealer of record waived its commission at the time of purchase. | |
| | n | | Effective July 31, 2012, NAV purchase privileges for former Evergreen Class IS and Class R shareholders are being modified to remove the ability to purchase Class A shares at NAV unless those shares are held directly with the Fund on or after July 31, 2012. | |
Please contact your investment professional or call us directly at 1-800-222-8222 if you have any questions on this Notice to Shareholders.
| | | | | | |
| Performance Highlights (Unaudited) | | Wells Fargo Advantage Short-Term Bond Fund | | | 5 | |
INVESTMENT OBJECTIVE
The Fund seeks current income consistent with capital preservation.
ADVISER
Wells Fargo Funds Management, LLC
SUB-ADVISER
Wells Capital Management Incorporated
PORTFOLIO MANAGERS
Jay N. Mueller, CFA
D. James Newton II, CFA, CPA
Christopher Y. Kauffman, CFA
FUND INCEPTION
August 31, 1987
| | | | |
TEN LARGEST LONG-TERM HOLDINGS1
(AS OF FEBRUARY 29, 2012) | |
FHLMC, 3.63%, 10/18/2013 | | | 1.63% | |
U.S. Treasury Note, 1.00%, 7/15/2013 | | | 1.32% | |
Nordea Eiendomskreditt, 1.88%, 4/7/2014 | | | 1.02% | |
Chase Issuance Trust Series 2009-A2 Class A2,
1.80%, 4/15/2014 | | | 0.93% | |
Citibank Credit Card Issuance Trust Series 2009-A1 Class A1, 2.00%, 3/17/2014 | | | 0.85% | |
JPMorgan Chase & Company, 0.82%, 12/26/2012 | | | 0.82% | |
Bank of America Corporation, 3.13%, 6/15/2012 | | | 0.78% | |
Ford Credit Auto Lease Trust Series 2011-B Class A2,
0.82%, 1/15/2014 | | | 0.77% | |
Morgan Stanley Capital I 2004-T13 Class A4,
4.66%, 9/13/2045 | | | 0.76% | |
FNMA, 3.25%, 4/1/2015 | | | 0.75% | |
|
CREDIT QUALITY2
(AS OF FEBRUARY 29, 2012) |
|
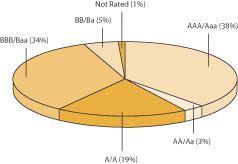 |
| 1. | The ten largest long-term holdings are calculated based on the value of the securities divided by total net assets of the Fund. Holdings are subject to change and may have changed since the date specified. |
| 2. | The ratings indicated are from Standard & Poor’s, Moody’s Investors Service, and/or Fitch Ratings Ltd. Credit Quality Ratings: Credit quality ratings apply to underlying holdings of the Fund and not the Fund itself. Standard & Poor’s rates the creditworthiness of bonds, ranging from AAA (highest) to D (lowest). Ratings from A to CCC may be modified by the addition of a plus (+) or minus (–) sign to show relative standing within the rating categories. Standard & Poor’s rates the creditworthiness of short-term notes from SP-1 (highest) to SP-3 (lowest). Moody’s rates the creditworthiness of bonds, ranging from Aaa (highest) to C (lowest). Ratings Aa to B may be modified by the addition of a number 1 (highest) to 3 (lowest) to show relative standing within the ratings categories. Moody’s rates the creditworthiness of short-term U.S. tax-exempt municipal securities from MIG 1/VMIG 1 (highest) to SG (lowest). Fitch rates the creditworthiness of bonds, ranging from AAA (highest) to D (lowest). If a security was rated by all three rating agencies, the middle rating was utilized. If rated by two of three rating agencies, the lower rating was utilized and if rated by one of the agencies that rating was utilized. Credit quality is subject to change and is calculated based on the total investments of the Fund. |
| | | | |
| 6 | | Wells Fargo Advantage Short-Term Bond Fund | | Performance Highlights (Unaudited) |
AVERAGE ANNUAL TOTAL RETURN3 (%) (AS OF FEBRUARY 29, 2012)
| | | | | | | | | | | | | | | | | | | | | | | | | | | | | | | | | | | | | | | | | | | | |
| | | | | | Including Sales Charge | | | Excluding Sales Charge | | | Expense Ratios4 | |
| | | Inception Date | | | 6 Months* | | | 1 Year | | | 5 Year | | | 10 Year | | | 6 Months* | | | 1 Year | | | 5 Year | | | 10 Year | | | Gross | | | Net5 | |
Class A (SSTVX) | | | 08/31/1999 | | | | (2.13 | ) | | | (0.85 | ) | | | 3.24 | | | | 3.11 | | | | 0.89 | | | | 2.22 | | | | 3.87 | | | | 3.42 | | | | 0.90% | | | | 0.81% | |
Class C (WFSHX) | | | 03/31/2008 | | | | (0.48 | ) | | | 0.45 | | | | 3.06 | | | | 2.71 | | | | 0.52 | | | | 1.45 | | | | 3.06 | | | | 2.71 | | | | 1.65% | | | | 1.56% | |
Institutional Class (SSHIX) | | | 08/31/1999 | | | | | | | | | | | | | | | | | | | | 0.94 | | | | 2.54 | | | | 4.18 | | | | 3.85 | | | | 0.57% | | | | 0.49% | |
Investor Class (SSTBX) | | | 08/31/1987 | | | | | | | | | | | | | | | | | | | | 0.76 | | | | 2.18 | | | | 3.80 | | | | 3.44 | | | | 0.93% | | | | 0.84% | |
Barclays 1-3 Year U.S. Government/ Credit Bond Index6 | | | | | | | | | | | | | | | | 0.40 | | | | 1.75 | | | | 3.85 | | | | 3.59 | | | | | | | | | |
| * | Returns for periods of less than one year are not annualized. |
Figures quoted represent past performance, which is no guarantee of future results and do not reflect the deduction of taxes that a shareholder may pay on fund distributions or the redemption of fund shares. Investment return and principal value of an investment will fluctuate so that an investor’s shares, when redeemed, may be worth more or less than their original cost. Performance shown without sales charges would be lower if sales charges were reflected. Current performance may be lower or higher than the performance data quoted and assumes the reinvestment of dividends and capital gains. Current month-end performance is available on the Fund’s Web site – wellsfargoadvantagefunds.com
Index returns do not include transaction costs associated with buying and selling securities, any mutual fund fees or expenses or any taxes. It is not possible to invest directly in an index.
For Class A shares, the maximum front-end sales charge is 3.00%. For Class C shares, the maximum contingent deferred sales charge is 1.00%. Performance including sales charge assumes the sales charge for the corresponding time period. Institutional Class and Investor Class shares are sold without a front-end sales charge or contingent deferred sales charge.
Bond fund values fluctuate in response to the financial condition of individual issuers, general market and economic conditions, and changes in interest rates. In general, when interest rates rise, bond fund values fall and investors may lose principal value. The use of derivatives may reduce returns and/or increase volatility. Certain investment strategies tend to increase the total risk of an investment (relative to the broader market). This Fund is exposed to foreign investment risk, high-yield securities risk, and mortgage and asset-backed securities risk. Consult the Fund’s prospectus for additional information on these and other risks.
| 3. | Historical performance shown for the Class A shares through June 19, 2008 includes Advisor Class expenses. Historical performance shown for the Class C shares prior to their inception reflects the performance of the Investor Class shares, adjusted to include the higher expenses applicable to Class C shares. |
| 4. | Reflects the expense ratios as stated in the most recent prospectuses. |
| 5. | The Adviser has committed through December 31, 2012 to waive fees and/or reimburse expenses to the extent necessary to cap the Fund’s Total Annual Fund Operating Expenses After Fee Waiver, excluding certain expenses, at 0.80% for Class A, 1.55% for Class C, 0.48% for Institutional Class and 0.83% for Investor Class. Without this cap, the Fund’s returns would have been lower. |
| 6. | The Barclays 1-3 Year U.S. Government/Credit Bond Index is the 1-3 year component of the Barclays Government/Credit Bond Index which includes securities in the Government and Credit Indices. The Government Index includes treasuries (i.e., public obligations of the U.S. Treasury that have remaining maturities of more than one year) and agencies (i.e., publicly issued debt of U.S. Government agencies, quasi-federal corporations, and corporate or foreign debt guaranteed by the U.S. Government). The Credit Index includes publicly issued U.S. corporate and foreign debentures and secured notes that meet specified maturity, liquidity, and quality requirements. |
| | | | | | |
| Fund Expenses (Unaudited) | | Wells Fargo Advantage Short-Term Bond Fund | | | 7 | |
As a shareholder of the Fund, you incur two types of costs: (1) transaction costs, including sales charges (loads) on purchase payments and contingent deferred sales charges (if any) on redemptions and (2) ongoing costs, including management fees; distribution (12b-1) and/or shareholder service fees; and other Fund expenses. This example is intended to help you understand your ongoing costs (in dollars) of investing in the Fund and to compare these costs with the ongoing costs of investing in other mutual funds.
The example is based on an investment of $1,000 invested at the beginning of the six-month period and held for the entire period from September 1, 2011 to February 29, 2012.
Actual Expenses
The “Actual” line of the table below provides information about actual account values and actual expenses. You may use the information in this line, together with the amount you invested, to estimate the expenses that you paid over the period. Simply divide your account value by $1,000 (for example, an $8,600 account value divided by $1,000 = 8.6), then multiply the result by the number in the “Actual” line under the heading entitled “Expenses Paid During Period” for your applicable class of shares to estimate the expenses you paid on your account during this period.
Hypothetical Example for Comparison Purposes
The “Hypothetical” line of the table below provides information about hypothetical account values and hypothetical expenses based on the Fund’s actual expense ratio and an assumed rate of return of 5% per year before expenses, which is not the Fund’s actual return. The hypothetical account values and expenses may not be used to estimate the actual ending account balance or expenses you paid for the period. You may use this information to compare the ongoing costs of investing in the Fund and other funds. To do so, compare this 5% hypothetical example with the 5% hypothetical examples that appear in the shareholder reports of the other funds.
Please note that the expenses shown in the table are meant to highlight your ongoing costs only and do not reflect any transactional costs, such as sales charges (loads) and contingent deferred sales charges. Therefore, the “Hypothetical” line of the table is useful in comparing ongoing costs only, and will not help you determine the relative total costs of owning different funds. In addition, if these transactional costs were included, your costs would have been higher.
| | | | | | | | | | | | | | | | |
| | | Beginning
Account Value
09-01-2011 | | | Ending
Account Value
02-29-2012 | | | Expenses
Paid During
the Period1 | | | Net Annual
Expense Ratio | |
Class A | | | | | | | | | | | | | | | | |
Actual | | $ | 1,000.00 | | | $ | 1,008.94 | | | $ | 4.00 | | | | 0.80 | % |
Hypothetical (5% return before expenses) | | $ | 1,000.00 | | | $ | 1,020.89 | | | $ | 4.02 | | | | 0.80 | % |
Class C | | | | | | | | | | | | | | | | |
Actual | | $ | 1,000.00 | | | $ | 1,005.19 | | | $ | 7.73 | | | | 1.55 | % |
Hypothetical (5% return before expenses) | | $ | 1,000.00 | | | $ | 1,017.16 | | | $ | 7.77 | | | | 1.55 | % |
Institutional Class | | | | | | | | | | | | | | | | |
Actual | | $ | 1,000.00 | | | $ | 1,009.38 | | | $ | 2.40 | | | | 0.48 | % |
Hypothetical (5% return before expenses) | | $ | 1,000.00 | | | $ | 1,022.48 | | | $ | 2.41 | | | | 0.48 | % |
Investor Class | | | | | | | | | | | | | | | | |
Actual | | $ | 1,000.00 | | | $ | 1,007.63 | | | $ | 4.14 | | | | 0.83 | % |
Hypothetical (5% return before expenses) | | $ | 1,000.00 | | | $ | 1,020.74 | | | $ | 4.17 | | | | 0.83 | % |
| 1. | Expenses paid is equal to the annualized expense ratio of each class multiplied by the average account value over the period, multiplied by the number of days in the most recent fiscal half-year divided by the number of days in the fiscal year (to reflect the one-half year period). |
| | | | |
| 8 | | Wells Fargo Advantage Short-Term Bond Fund | | Portfolio of Investments—February 29, 2012 (Unaudited) |
| | | | | | | | | | | | | | | | |
| Security Name | | Interest Rate | | | Maturity Date | | | Principal | | | Value | |
| | | | | | | | | | | | | | | | |
| | | | |
| Agency Securities: 8.60% | | | | | | | | | | | | | | | | |
FHLMC | | | 1.13 | % | | | 07/27/2012 | | | $ | 3,000,000 | | | $ | 3,011,730 | |
FHLMC ± | | | 2.49 | | | | 04/01/2032 | | | | 80,515 | | | | 84,221 | |
FHLMC ± | | | 2.62 | | | | 07/01/2029 | | | | 8,675 | | | | 9,191 | |
FHLMC ± | | | 2.66 | | | | 09/01/2031 | | | | 8,026 | | | | 8,132 | |
FHLMC | | | 3.63 | | | | 10/18/2013 | | | | 10,000,000 | | | | 10,528,370 | |
FHLMC ± | | | 3.95 | | | | 05/01/2026 | | | | 217,356 | | | | 228,300 | |
FHLMC | | | 7.00 | | | | 11/17/2013 | | | | 10,581 | | | | 10,610 | |
FHLMC | | | 7.50 | | | | 06/01/2012 | | | | 646 | | | | 650 | |
FHLMC | | | 7.50 | | | | 10/01/2012 | | | | 1,800 | | | | 1,820 | |
FHLMC | | | 8.50 | | | | 09/01/2017 | | | | 220,712 | | | | 245,569 | |
FHLMC | | | 9.00 | | | | 08/01/2018 | | | | 208,809 | | | | 236,132 | |
FHLMC | | | 9.00 | | | | 06/01/2019 | | | | 254,457 | | | | 287,707 | |
FHLMC | | | 9.00 | | | | 10/01/2019 | | | | 384,946 | | | | 446,842 | |
FHLMC | | | 9.50 | | | | 12/01/2022 | | | | 349,229 | | | | 402,718 | |
FHLMC | | | 10.50 | | | | 01/01/2016 | | | | 3,731 | | | | 4,191 | |
FHLMC | | | 10.50 | | | | 11/01/2017 | | | | 1,440 | | | | 1,682 | |
FHLMC | | | 10.50 | | | | 08/01/2018 | | | | 135,324 | | | | 158,283 | |
FHLMC | | | 10.50 | | | | 02/01/2019 | | | | 1,888 | | | | 2,233 | |
FHLMC | | | 10.50 | | | | 04/01/2019 | | | | 1,031 | | | | 1,236 | |
FHLMC | | | 10.50 | | | | 05/01/2019 | | | | 772 | | | | 928 | |
FHLMC | | | 10.50 | | | | 06/01/2019 | | | | 8,684 | | | | 10,254 | |
FHLMC | | | 10.50 | | | | 07/01/2019 | | | | 1,495 | | | | 1,806 | |
FHLMC | | | 7.44 | | | | 03/15/2013 | | | | 384 | | | | 384 | |
FHLMC Series 2301 Class MO | | | 6.00 | | | | 10/15/2013 | | | | 3,734,693 | | | | 3,825,317 | |
FHLMC Series 2958 Class QD | | | 4.50 | | | | 04/15/2020 | | | | 3,703,000 | | | | 4,060,285 | |
FHLMC Series T-42 Class A6 | | | 9.50 | | | | 02/25/2042 | | | | 677,940 | | | | 807,377 | |
FHLMC Series T-57 Class 2A1 ± | | | 3.53 | | | | 07/25/2043 | | | | 33,886 | | | | 34,592 | |
FHLMC Series T-59 Class 2A1 ± | | | 3.18 | | | | 10/25/2043 | | | | 1,315,406 | | | | 1,337,772 | |
FNMA ± | | | 2.30 | | | | 11/01/2031 | | | | 109,704 | | | | 115,412 | |
FNMA | | | 3.25 | | | | 04/01/2015 | | | | 4,562,940 | | | | 4,870,181 | |
FNMA | | | 6.00 | | | | 04/01/2021 | | | | 2,986,395 | | | | 3,254,657 | |
FNMA | | | 6.00 | | | | 03/01/2033 | | | | 1,331,015 | | | | 1,488,687 | |
FNMA | | | 6.50 | | | | 08/01/2031 | | | | 819,642 | | | | 939,149 | |
FNMA | | | 8.00 | | | | 03/01/2013 | | | | 5,402 | | | | 5,438 | |
FNMA | | | 8.00 | | | | 04/01/2017 | | | | 301,198 | | | | 333,660 | |
FNMA | | | 8.00 | | | | 09/01/2019 | | | | 209,490 | | | | 233,924 | |
FNMA | | | 8.00 | | | | 09/01/2023 | | | | 21,002 | | | | 23,607 | |
FNMA | | | 8.33 | | | | 07/15/2020 | | | | 67,025 | | | | 78,149 | |
FNMA | | | 8.50 | | | | 11/01/2012 | | | | 1,111 | | | | 1,118 | |
FNMA | | | 8.50 | | | | 07/01/2018 | | | | 124,572 | | | | 139,366 | |
FNMA | | | 8.50 | | | | 02/01/2023 | | | | 183,976 | | | | 205,534 | |
FNMA | | | 9.00 | | | | 02/15/2020 | | | | 2,482 | | | | 2,930 | |
FNMA | | | 9.00 | | | | 11/01/2024 | | | | 201,974 | | | | 241,867 | |
FNMA | | | 11.00 | | | | 10/15/2020 | | | | 194,673 | | | | 222,935 | |
FNMA | | | 12.00 | | | | 03/01/2017 | | | | 27,829 | | | | 30,675 | |
FNMA Series 2002-T1 Class A4 | | | 9.50 | | | | 11/25/2031 | | | | 123,079 | | | | 148,629 | |
FNMA Series 2002-T12 Class A4 | | | 9.50 | | | | 05/25/2042 | | | | 1,056,539 | | | | 1,351,645 | |
FNMA Series 1989-29 Class Z | | | 10.00 | | | | 06/25/2019 | | | | 212,209 | | | | 243,124 | |
FNMA Series 1989-63 Class Z | | | 9.40 | | | | 10/25/2019 | | | | 123,431 | | | | 138,430 | |
FNMA Series 2004-90 Class XY | | | 4.00 | | | | 09/25/2034 | | | | 2,824,961 | | | | 3,038,402 | |
The accompanying notes are an integral part of these financial statements.
| | | | | | |
| Portfolio of Investments—February 29, 2012 (Unaudited) | | Wells Fargo Advantage Short-Term Bond Fund | | | 9 | |
| | | | | | | | | | | | | | | | |
| Security Name | | Interest Rate | | | Maturity Date | | | Principal | | | Value | |
| | | | | | | | | | | | | | | | |
| | | | |
| Agency Securities (continued) | | | | | | | | | | | | | | | | |
FNMA Series G95-2 ± | | | 10.00 | % | | | 05/25/2020 | | | $ | 296,124 | | | $ | 71,868 | |
FNMA Series 2003-W11 Class A1 ± | | | 3.10 | | | | 06/25/2033 | | | | 43,128 | | | | 43,118 | |
FNMA Series 2003-W6 Class 6A ± | | | 3.19 | | | | 08/25/2042 | | | | 1,791,781 | | | | 1,941,382 | |
FNMA Series 2003-W6 Class PT4 ± | | | 9.40 | | | | 10/25/2042 | | | | 162,746 | | | | 191,837 | |
FNMA Series 2004-W6 Class 1A4 | | | 5.50 | | | | 07/25/2034 | | | | 3,108,075 | | | | 3,215,340 | |
GNMA | | | 1.83 | | | | 03/16/2039 | | | | 4,500,000 | | | | 4,535,766 | |
GNMA | | | 7.00 | | | | 05/15/2013 | | | | 3,108 | | | | 3,087 | |
GNMA | | | 7.50 | | | | 02/15/2013 | | | | 872 | | | | 881 | |
GNMA | | | 8.00 | | | | 12/15/2023 | | | | 74,402 | | | | 88,753 | |
GNMA | | | 9.00 | | | | 11/15/2017 | | | | 121,546 | | | | 137,620 | |
GNMA | | | 9.00 | | | | 11/15/2024 | | | | 55,709 | | | | 65,151 | |
GNMA | | | 10.00 | | | | 02/20/2018 | | | | 12,771 | | | | 14,923 | |
GNMA | | | 12.50 | | | | 04/15/2019 | | | | 409,359 | | | | 416,328 | |
GNMA Series 2005-90 Class A | | | 3.76 | | | | 09/16/2028 | | | | 1,945,212 | | | | 1,990,330 | |
SBA (c)(a)(i) | | | 3.68 | | | | 10/06/2015 | | | | 97,336 | | | | 4,244 | |
| | | | |
Total Agency Securities (Cost $54,201,148) | | | | | | | | | | | | | | | 55,576,479 | |
| | | | | | | | | | | | | | | | |
| | | | |
| Asset-Backed Securities: 9.68% | | | | | | | | | | | | | | | | |
Chase Issuance Trust Series 2007-A18 Class A ± | | | 0.51 | | | | 01/15/2015 | | | | 1,600,000 | | | | 1,603,715 | |
Chase Issuance Trust Series 2009-A2 Class A2 ± | | | 1.80 | | | | 04/15/2014 | | | | 6,000,000 | | | | 6,011,761 | |
Citibank Credit Card Issuance Trust Series 2009-A1 Class A1 ± | | | 2.00 | | | | 03/17/2014 | | | | 5,500,000 | | | | 5,503,906 | |
CNH Equipment Trust Series 2011-A Class A2 | | | 0.62 | | | | 06/16/2014 | | | | 908,541 | | | | 908,636 | |
ContiMortgage Net Interest Margin Notes Series 1997-A Class A (c)(a)(i)(s) | | | 7.23 | | | | 10/16/2028 | | | | 4,232,333 | | | | 1,323 | |
Ford Credit Auto Lease Trust Series 2011-B Class A2 | | | 0.82 | | | | 01/15/2014 | | | | 5,000,000 | | | | 5,005,512 | |
Ford Credit Auto Lease Trust Series 2012-A Class A2 | | | 0.63 | | | | 04/15/2014 | | | | 3,200,000 | | | | 3,199,608 | |
GS Mortgage Securities Corporation II Series 2011-GC3 Class A1 144A | | | 2.33 | | | | 03/10/2044 | | | | 3,733,961 | | | | 3,808,088 | |
Home Equity Asset Trust Series 2003-6 Class M1 ± | | | 1.29 | | | | 02/25/2034 | | | | 2,108,687 | | | | 1,629,907 | |
Honda Auto Receivables Owner Trust Series 2010-3 Class A2 | | | 0.53 | | | | 01/21/2013 | | | | 197,186 | | | | 197,200 | |
Honda Auto Receivables Owner Trust Series 2012-1 Class A2 | | | 0.57 | | | | 08/15/2014 | | | | 3,500,000 | | | | 3,500,440 | |
Hyundai Auto Lease Securitization Trust Series 2011 Class A2 144A | | | 0.69 | | | | 11/15/2013 | | | | 1,600,000 | | | | 1,600,456 | |
John Deere Owner Trust Series 2011-A Class A2 | | | 0.64 | | | | 06/16/2014 | | | | 2,383,745 | | | | 2,385,045 | |
John Deere Owner Trust Series 2012-A Class A2 | | | 0.82 | | | | 06/16/2014 | | | | 3,500,000 | | | | 3,499,922 | |
Mercedes-Benz Auto Lease Trust Series 2011-1A Class A2 144A | | | 0.79 | | | | 04/15/2013 | | | | 1,410,714 | | | | 1,411,345 | |
Mercedes-Benz Auto Lease Trust Series 2011-B Class A2 144A | | | 0.90 | | | | 01/15/2014 | | | | 3,500,000 | | | | 3,503,670 | |
Morgan Stanley Capital I 2004-T13 Class A4 | | | 4.66 | | | | 09/13/2045 | | | | 4,670,000 | | | | 4,921,391 | |
Newcastle Investment Trust Series 2011-MH1 Class A 144A | | | 2.45 | | | | 12/10/2033 | | | | 1,554,336 | | | | 1,570,262 | |
Nissan Auto Lease Trust Series 2010-B Class A2 | | | 0.90 | | | | 05/15/2013 | | | | 1,117,843 | | | | 1,118,600 | |
Nissan Auto Receivables Owner Trust Series 2010-A Class A2 | | | 0.55 | | | | 03/15/2013 | | | | 189,254 | | | | 189,269 | |
Nissan Auto Receivables Owner Trust Series 2011-A Class A2 | | | 0.65 | | | | 12/16/2013 | | | | 4,614,155 | | | | 4,624,559 | |
Porsche Innovative Lease Owner Pilot Series 2011-1 Class A2 144A | | | 0.92 | | | | 02/20/2014 | | | | 3,500,000 | | | | 3,504,560 | |
Residential Asset Securities Corporation Series 2001-KS1 Class AII ± | | | 0.71 | | | | 03/25/2032 | | | | 36,724 | | | | 35,634 | |
Structured Asset Investment Loan Trust Series 2003-BC10 Class M1 ± | | | 1.37 | | | | 10/25/2033 | | | | 1,104,922 | | | | 864,537 | |
Structured Asset Investment Loan Trust Series 2003-BC3 Class M1 ± | | | 1.67 | | | | 04/25/2033 | | | | 1,361,285 | | | | 1,079,503 | |
Toyota Auto Receivables Owner Trust Series 2010-C Class A2 | | | 0.51 | | | | 12/17/2012 | | | | 268,190 | | | | 268,200 | |
Volkswagen Auto Lease Trust Series 2010-A Class A2 | | | 0.77 | | | | 01/22/2013 | | | | 586,124 | | | | 586,310 | |
| | | | |
Total Asset-Backed Securities (Cost $67,762,008) | | | | | | | | | | | | | | | 62,533,359 | |
| | | | | | | | | | | | | | | | |
The accompanying notes are an integral part of these financial statements.
| | | | |
| 10 | | Wells Fargo Advantage Short-Term Bond Fund | | Portfolio of Investments—February 29, 2012 (Unaudited) |
| | | | | | | | | | | | | | | | |
| Security Name | | Interest Rate | | | Maturity Date | | | Principal | | | Value | |
| | | | | | | | | | | | | | | | |
| | | | |
Corporate Bonds and Notes: 45.90% | | | | | | | | | | | | | | | | |
| | | | |
| Consumer Discretionary: 9.21% | | | | | | | | | | | | | | | | |
| | | | |
| Auto Components: 0.48% | | | | | | | | | | | | | | | | |
AutoZone Incorporated | | | 5.88 | % | | | 10/15/2012 | | | $ | 3,000,000 | | | $ | 3,091,641 | |
| | | | | | | | | | | | | | | | |
| | | | |
| Diversified Consumer Services: 0.31% | | | | | | | | | | | | | | | | |
Life Technologies Corporation | | | 3.38 | | | | 03/01/2013 | | | | 2,000,000 | | | | 2,038,636 | |
| | | | | | | | | | | | | | | | |
| | | | |
| Hotels, Restaurants & Leisure: 1.08% | | | | | | | | | | | | | | | | |
Darden Restaurants Incorporated | | | 5.63 | | | | 10/15/2012 | | | | 2,000,000 | | | | 2,055,554 | |
Starwood Hotels & Resorts Worldwide Incorporated | | | 7.88 | | | | 10/15/2014 | | | | 2,500,000 | | | | 2,862,500 | |
Yum! Brands Incorporated | | | 7.70 | | | | 07/01/2012 | | | | 2,000,000 | | | | 2,040,362 | |
| | | | |
| | | | | | | | | | | | | | | 6,958,416 | |
| | | | | | | | | | | | | | | | |
| | | | |
| Leisure Equipment & Products: 0.46% | | | | | | | | | | | | | | | | |
Hasbro Incorporated | | | 6.13 | | | | 05/15/2014 | | | | 2,725,000 | | | | 2,973,005 | |
| | | | | | | | | | | | | | | | |
| | | | |
| Media: 4.19% | | | | | | | | | | | | | | | | |
CBS Corporation | | | 8.20 | | | | 05/15/2014 | | | | 3,000,000 | | | | 3,425,805 | |
Comcast Corporation | | | 10.63 | | | | 07/15/2012 | | | | 2,500,000 | | | | 2,574,618 | |
Historic TW Incorporated | | | 9.13 | | | | 01/15/2013 | | | | 2,000,000 | | | | 2,137,112 | |
Interpublic Group of Companies Incorporated | | | 6.25 | | | | 11/15/2014 | | | | 2,860,000 | | | | 3,120,975 | |
News America Incorporated | | | 5.30 | | | | 12/15/2014 | | | | 3,120,000 | | | | 3,463,768 | |
Sirius XM Radio Incorporated 144A | | | 9.75 | | | | 09/01/2015 | | | | 3,000,000 | | | | 3,247,500 | |
TCM LLC 144A | | | 3.55 | | | | 01/15/2015 | | | | 2,000,000 | | | | 2,104,708 | |
Time Warner Cable Incorporated | | | 8.25 | | | | 02/14/2014 | | | | 3,000,000 | | | | 3,410,856 | |
Viacom Incorporated | | | 4.38 | | | | 09/15/2014 | | | | 3,300,000 | | | | 3,568,604 | |
| | | | |
| | | | | | | | | | | | | | | 27,053,946 | |
| | | | | | | | | | | | | | | | |
| | | | |
| Multiline Retail: 0.79% | | | | | | | | | | | | | | | | |
JCPenney Company Incorporated | | | 9.00 | | | | 08/01/2012 | | | | 3,000,000 | | | | 3,093,750 | |
Macy’s Incorporated | | | 5.35 | | | | 03/15/2012 | | | | 2,000,000 | | | | 2,001,900 | |
| | | | |
| | | | | | | | | | | | | | | 5,095,650 | |
| | | | | | | | | | | | | | | | |
| | | | |
| Specialty Retail: 1.90% | | | | | | | | | | | | | | | | |
Best Buy Company Incorporated | | | 6.75 | | | | 07/15/2013 | | | | 3,035,000 | | | | 3,210,593 | |
Harley Davidson Funding 144A | | | 5.75 | | | | 12/15/2014 | | | | 1,500,000 | | | | 1,627,826 | |
Home Depot Incorporated | | | 5.25 | | | | 12/16/2013 | | | | 3,000,000 | | | | 3,249,408 | |
Staples Incorporated | | | 9.75 | | | | 01/15/2014 | | | | 3,665,000 | | | | 4,203,018 | |
| | | | |
| | | | | | | | | | | | | | | 12,290,845 | |
| | | | | | | | | | | | | | | | |
| | | | |
Consumer Staples: 2.36% | | | | | | | | | | | | | | | | |
| | | | |
| Beverages: 0.49% | | | | | | | | | | | | | | | | |
Miller Brewing Corporation 144A | | | 5.50 | | | | 08/15/2013 | | | | 3,000,000 | | | | 3,179,652 | |
| | | | | | | | | | | | | | | | |
| | | | |
| Food & Staples Retailing: 0.51% | | | | | | | | | | | | | | | | |
Safeway Incorporated | | | 6.25 | | | | 03/15/2014 | | | | 3,000,000 | | | | 3,311,016 | |
| | | | | | | | | | | | | | | | |
The accompanying notes are an integral part of these financial statements.
| | | | | | |
| Portfolio of Investments—February 29, 2012 (Unaudited) | | Wells Fargo Advantage Short-Term Bond Fund | | | 11 | |
| | | | | | | | | | | | | | | | |
| Security Name | | Interest Rate | | | Maturity Date | | | Principal | | | Value | |
| | | | | | | | | | | | | | | | |
| | | | |
| Food Products: 0.50% | | | | | | | | | | | | | | | | |
Cadbury Schweppes Company 144A | | | 5.13 | % | | | 10/01/2013 | | | $ | 3,000,000 | | | $ | 3,185,199 | |
Kraft Foods Incorporated | | | 6.25 | | | | 06/01/2012 | | | | 22,000 | | | | 22,291 | |
| | | | |
| | | | | | | | | | | | | | | 3,207,490 | |
| | | | | | | | | | | | | | | | |
| | | | |
| Household Products: 0.51% | | | | | | | | | | | | | | | | |
Clorox Company | | | 5.00 | | | | 01/15/2015 | | | | 3,000,000 | | | | 3,278,085 | |
| | | | | | | | | | | | | | | | |
| | | | |
| Tobacco: 0.35% | | | | | | | | | | | | | | | | |
Altria Group Incorporated | | | 7.75 | | | | 02/06/2014 | | | | 2,000,000 | | | | 2,251,856 | |
| | | | | | | | | | | | | | | | |
| | | | |
Energy: 3.84% | | | | | | | | | | | | | | | | |
| | | | |
| Energy Equipment & Services: 1.46% | | | | | | | | | | | | | | | | |
Indiana Michigan Power Company | | | 6.38 | | | | 11/01/2012 | | | | 2,000,000 | | | | 2,074,014 | |
Kinder Morgan Energy Partners LP | | | 5.13 | | | | 11/15/2014 | | | | 3,000,000 | | | | 3,256,914 | |
Nevada Power Company | | | 6.50 | | | | 04/15/2012 | | | | 2,000,000 | | | | 2,011,880 | |
Weatherford International Limited | | | 5.15 | | | | 03/15/2013 | | | | 2,000,000 | | | | 2,069,056 | |
| | | | |
| | | | | | | | | | | | | | | 9,411,864 | |
| | | | | | | | | | | | | | | | |
| | | | |
Oil, Gas & Consumable Fuels: 2.38% | | | | | | | | | | | | | | | | |
El Paso Pipeline Partners Operating LLC | | | 4.10 | | | | 11/15/2015 | | | | 3,000,000 | | | | 3,086,085 | |
Petrohawk Energy Corporation | | | 7.88 | | | | 06/01/2015 | | | | 3,000,000 | | | | 3,168,750 | |
Trans Canada Pipelines Corporation | | | 0.88 | | | | 03/02/2015 | | | | 3,000,000 | | | | 2,991,792 | |
Valero Energy Corporation | | | 4.75 | | | | 04/01/2014 | | | | 2,820,000 | | | | 2,985,413 | |
Williams Partners LP | | | 3.80 | | | | 02/15/2015 | | | | 3,000,000 | | | | 3,174,129 | |
| | | | |
| | | | | | | | | | | | | | | 15,406,169 | |
| | | | | | | | | | | | | | | | |
| | | | |
Financials: 15.36% | | | | | | | | | | | | | | | | |
| | | | |
| Commercial Banks: 3.02% | | | | | | | | | | | | | | | | |
Australia and New Zealand Banking Group Limited 144A | | | 2.40 | | | | 11/23/2016 | | | | 3,000,000 | | | | 3,021,588 | |
Bank of New York Mellon Corporation ± | | | 0.74 | | | | 06/29/2012 | | | | 1,600,000 | | | | 1,602,890 | |
Credit Suisse | | | 2.20 | | | | 01/14/2014 | | | | 3,000,000 | | | | 3,024,495 | |
Hudson United Bank | | | 7.00 | | | | 05/15/2012 | | | | 1,195,000 | | | | 1,207,748 | |
Inter-American Development Bank ± | | | 0.94 | | | | 05/20/2014 | | | | 4,000,000 | | | | 4,054,564 | |
Key Bank NA | | | 5.50 | | | | 09/17/2012 | | | | 2,000,000 | | | | 2,051,448 | |
M&I Marshall & IIsley Bank | | | 5.25 | | | | 09/04/2012 | | | | 3,240,000 | | | | 3,309,336 | |
PNC Funding Corporation ± | | | 0.78 | | | | 04/01/2012 | | | | 1,200,000 | | | | 1,200,643 | |
| | | | |
| | | | | | | | | | | | | | | 19,472,712 | |
| | | | | | | | | | | | | | | | |
| | | | |
| Consumer Finance: 1.70% | | | | | | | | | | | | | | | | |
American Honda Finance Corporation 144A | | | 2.38 | | | | 03/18/2013 | | | | 2,600,000 | | | | 2,646,371 | |
Capital One Financial Corporation | | | 6.25 | | | | 11/15/2013 | | | | 2,000,000 | | | | 2,139,080 | |
Ford Motor Credit Company LLC | | | 3.88 | | | | 01/15/2015 | | | | 3,000,000 | | | | 3,075,684 | |
General Electric Capital Corporation | | | 4.80 | | | | 05/01/2013 | | | | 3,000,000 | | | | 3,135,195 | |
| | | | |
| | | | | | | | | | | | | | | 10,996,330 | |
| | | | | | | | | | | | | | | | |
| | | | |
| Diversified Financial Services: 4.75% | | | | | | | | | | | | | | | | |
American Express Centurion | | | 5.55 | | | | 10/17/2012 | | | | 2,000,000 | | | | 2,058,216 | |
Bank of America Corporation | | | 3.13 | | | | 06/15/2012 | | | | 5,000,000 | | | | 5,042,270 | |
The accompanying notes are an integral part of these financial statements.
| | | | |
| 12 | | Wells Fargo Advantage Short-Term Bond Fund | | Portfolio of Investments—February 29, 2012 (Unaudited) |
| | | | | | | | | | | | | | | | |
| Security Name | | Interest Rate | | | Maturity Date | | | Principal | | | Value | |
| | | | | | | | | | | | | | | | |
| | | | |
| Diversified Financial Services (continued) | | | | | | | | | | | | | | | | |
ERAC USA Finance Company 144A | | | 2.25 | % | | | 01/10/2014 | | | $ | 3,000,000 | | | $ | 3,003,690 | |
Fifth Third Bancorp Cincinnati Ohio ± | | | 0.61 | | | | 05/17/2013 | | | | 2,000,000 | | | | 1,979,142 | |
JPMorgan Chase & Company ± | | | 0.82 | | | | 12/26/2012 | | | | 5,300,000 | | | | 5,317,331 | |
Morgan Stanley | | | 4.75 | | | | 04/01/2014 | | | | 3,000,000 | | | | 3,035,241 | |
Raymond James Financial Incorporated | | | 4.25 | | | | 04/15/2016 | | | | 2,000,000 | | | | 2,074,610 | |
Santander Holdings USA | | | 4.63 | | | | 04/19/2016 | | | | 2,000,000 | | | | 1,981,648 | |
SLM Corporation | | | 5.13 | | | | 08/27/2012 | | | | 3,000,000 | | | | 3,031,713 | |
Woodside Finance Limited 144A | | | 4.50 | | | | 11/10/2014 | | | | 3,000,000 | | | | 3,142,518 | |
| | | | |
| | | | | | | | | | | | | | | 30,666,379 | |
| | | | | | | | | | | | | | | | |
| | | | |
| Insurance: 2.54% | | | | | | | | | | | | | | | | |
American International Group Incorporated | | | 4.25 | | | | 05/15/2013 | | | | 3,000,000 | | | | 3,061,986 | |
Genworth Life Institutional Funding Trust 144A | | | 5.88 | | | | 05/03/2013 | | | | 2,035,000 | | | | 2,083,311 | |
Mass Mutual Global Funding II 144A | | | 3.63 | | | | 07/16/2012 | | | | 1,000,000 | | | | 1,010,830 | |
Metropolitan Life Global Funding I 144A | | | 2.00 | | | | 01/10/2014 | | | | 1,000,000 | | | | 1,010,878 | |
Metropolitan Life Global Funding I 144A | | | 5.13 | | | | 04/10/2013 | | | | 2,000,000 | | | | 2,087,288 | |
Montpelier Holdings Limited | | | 6.13 | | | | 08/15/2013 | | | | 2,900,000 | | | | 3,024,973 | |
New York Life Global Funding 144A | | | 5.25 | | | | 10/16/2012 | | | | 2,000,000 | | | | 2,057,454 | |
Pricoa Global Funding 144A | | | 5.40 | | | | 10/18/2012 | | | | 2,000,000 | | | | 2,057,942 | |
| | | | |
| | | | | | | | | | | | | | | 16,394,662 | |
| | | | | | | | | | | | | | | | |
| | | | |
| REITs: 3.35% | | | | | | | | | | | | | | | | |
American Tower Corporation | | | 4.63 | | | | 04/01/2015 | | | | 3,174,000 | | | | 3,365,637 | |
Dexus Property Group 144A | | | 7.13 | | | | 10/15/2014 | | | | 3,000,000 | | | | 3,230,004 | |
Digital Realty Trust LP | | | 4.50 | | | | 07/15/2015 | | | | 3,000,000 | | | | 3,130,251 | |
Federal Realty Investment Trust | | | 5.95 | | | | 08/15/2014 | | | | 1,000,000 | | | | 1,078,441 | |
Healthcare Realty Trust Incorporated | | | 5.13 | | | | 04/01/2014 | | | | 2,000,000 | | | | 2,071,220 | |
Nationwide Health Properties Incorporated | | | 8.25 | | | | 07/01/2012 | | | | 1,720,000 | | | | 1,742,790 | |
Ventas Realty LP | | | 9.00 | | | | 05/01/2012 | | | | 3,000,000 | | | | 3,027,192 | |
WEA Finance LLC 144A | | | 7.50 | | | | 06/02/2014 | | | | 3,630,000 | | | | 4,022,991 | |
| | | | |
| | | | | | | | | | | | | | | 21,668,526 | |
| | | | | | | | | | | | | | | | |
| | | | |
Health Care: 2.51% | | | | | | | | | | | | | | | | |
| | | | |
| Biotechnology: 0.48% | | | | | | | | | | | | | | | | |
Amgen Incorporated | | | 1.88 | | | | 11/15/2014 | | | | 3,000,000 | | | | 3,069,513 | |
| | | | | | | | | | | | | | | | |
| | | | |
| Health Care Equipment & Supplies: 0.34% | | | | | | | | | | | | | | | | |
Boston Scientific Corporation | | | 6.25 | | | | 11/15/2015 | | | | 2,000,000 | | | | 2,223,974 | |
| | | | | | | | | | | | | | | | |
| | | | |
| Health Care Providers & Services: 1.40% | | | | | | | | | | | | | | | | |
AmerisourceBergen Corporation | | | 5.88 | | | | 09/15/2015 | | | | 3,450,000 | | | | 3,970,836 | |
Anthem Incorporated | | | 6.80 | | | | 08/01/2012 | | | | 2,925,000 | | | | 2,998,760 | |
UnitedHealth Group Incorporated | | | 4.88 | | | | 02/15/2013 | | | | 2,000,000 | | | | 2,079,406 | |
| | | | |
| | | | | | | | | | | | | | | 9,049,002 | |
| | | | | | | | | | | | | | | | |
| | | | |
| Pharmaceuticals: 0.29% | | | | | | | | | | | | | | | | |
Aristotle Holding Incorporated 144A | | | 2.10 | | | | 02/12/2015 | | | | 1,875,000 | | | | 1,890,039 | |
| | | | | | | | | | | | | | | | |
The accompanying notes are an integral part of these financial statements.
| | | | | | |
| Portfolio of Investments—February 29, 2012 (Unaudited) | | Wells Fargo Advantage Short-Term Bond Fund | | | 13 | |
| | | | | | | | | | | | | | | | |
| Security Name | | Interest Rate | | | Maturity Date | | | Principal | | | Value | |
| | | | | | | | | | | | | | | | |
| | | | |
Industrials: 4.42% | | | | | | | | | | | | | | | | |
| | | | |
| Aerospace & Defense: 0.49% | | | | | | | | | | | | | | | | |
BAE Systems Holdings Incorporated 144A | | | 4.95 | % | | | 06/01/2014 | | | $ | 3,000,000 | | | $ | 3,165,612 | |
| | | | | | | | | | | | | | | | |
| | | | |
| Building Products: 1.15% | | | | | | | | | | | | | | | | |
Masco Corporation | | | 5.88 | | | | 07/15/2012 | | | | 3,400,000 | | | | 3,433,745 | |
Tyco Electronics Group SA | | | 1.60 | | | | 02/03/2015 | | | | 4,000,000 | | | | 4,013,836 | |
| | | | |
| | | | | | | | | | | | | | | 7,447,581 | |
| | | | | | | | | | | | | | | | |
| | | | |
| Commercial Services & Supplies: 1.08% | | | | | | | | | | | | | | | | |
Brambles USA Incorporation 144A | | | 3.95 | | | | 04/01/2015 | | | | 2,000,000 | | | | 2,072,124 | |
Equifax Incorporated | | | 4.45 | | | | 12/01/2014 | | | | 2,000,000 | | | | 2,127,100 | |
R.R. Donnelley & Sons Company | | | 4.95 | | | | 04/01/2014 | | | | 2,685,000 | | | | 2,752,125 | |
| | | | |
| | | | | | | | | | | | | | | 6,951,349 | |
| | | | | | | | | | | | | | | | |
| | | | |
| Electrical Equipment: 0.94% | | | | | | | | | | | | | | | | |
Agilent Technologies Incorporated | | | 4.45 | | | | 09/14/2012 | | | | 2,000,000 | | | | 2,035,492 | |
Roper Industries Incorporated | | | 6.63 | | | | 08/15/2013 | | | | 3,800,000 | | | | 4,060,159 | |
| | | | |
| | | | | | | | | | | | | | | 6,095,651 | |
| | | | | | | | | | | | | | | | |
| | | | |
| Machinery: 0.43% | | | | | | | | | | | | | | | | |
SPX Corporation | | | 7.63 | | | | 12/15/2014 | | | | 2,450,000 | | | | 2,750,125 | |
| | | | | | | | | | | | | | | | |
| | | | |
| Road & Rail: 0.33% | | | | | | | | | | | | | | | | |
CSX Corporation | | | 6.30 | | | | 03/15/2012 | | | | 2,100,000 | | | | 2,103,104 | |
| | | | | | | | | | | | | | | | |
| | | | |
Information Technology: 1.35% | | | | | | | | | | | | | | | | |
| | | | |
| Computers & Peripherals: 0.52% | | | | | | | | | | | | | | | | |
Hewlett Packard Company | | | 2.63 | | | | 12/09/2014 | | | | 3,225,000 | | | | 3,343,967 | |
| | | | | | | | | | | | | | | | |
| | | | |
| Office Electronics: 0.32% | | | | | | | | | | | | | | | | |
Xerox Corporation | | | 8.25 | | | | 05/15/2014 | | | | 1,855,000 | | | | 2,083,352 | |
| | | | | | | | | | | | | | | | |
| | | | |
| Software: 0.51% | | | | | | | | | | | | | | | | |
CA Incorporated | | | 6.13 | | | | 12/01/2014 | | | | 3,000,000 | | | | 3,315,330 | |
| | | | | | | | | | | | | | | | |
| | | | |
Materials: 0.16% | | | | | | | | | | | | | | | | |
| | | | |
| Metals & Mining: 0.16% | | | | | | | | | | | | | | | | |
Arcelormittal Company | | | 3.75 | | | | 02/25/2015 | | | | 1,000,000 | | | | 1,017,520 | |
| | | | | | | | | | | | | | | | |
| | | | |
Telecommunication Services: 2.39% | | | | | | | | | | | | | | | | |
| | | | |
| Diversified Telecommunication Services: 1.92% | | | | | | | | | | | | | | | | |
AT&T Incorporated | | | 0.88 | | | | 02/13/2015 | | | | 3,555,000 | | | | 3,547,492 | |
Crown Castle Towers LLC 144A | | | 3.21 | | | | 08/15/2035 | | | | 2,000,000 | | | | 2,052,562 | |
Qwest Corporation ± | | | 3.80 | | | | 06/15/2013 | | | | 2,500,000 | | | | 2,543,750 | |
Verizon New England Incorporated | | | 4.75 | | | | 10/01/2013 | | | | 3,000,000 | | | | 3,155,664 | |
Verizon Wireless Capital LLC | | | 7.38 | | | | 11/15/2013 | | | | 1,000,000 | | | | 1,109,863 | |
| | | | |
| | | | | | | | | | | | | | | 12,409,331 | |
| | | | | | | | | | | | | | | | |
The accompanying notes are an integral part of these financial statements.
| | | | |
| 14 | | Wells Fargo Advantage Short-Term Bond Fund | | Portfolio of Investments—February 29, 2012 (Unaudited) |
| | | | | | | | | | | | | | | | |
| Security Name | | Interest Rate | | | Maturity Date | | | Principal | | | Value | |
| | | | | | | | | | | | | | | | |
| | | | |
| Wireless Telecommunication Services: 0.47% | | | | | | | | | | | | | | | | |
Alltel Corporation | | | 7.00 | % | | | 07/01/2012 | | | $ | 945,000 | | | $ | 964,776 | |
SBA Tower Trust 144A | | | 4.25 | | | | 04/15/2040 | | | | 2,000,000 | | | | 2,058,106 | |
| | | | |
| | | | | | | | | | | | | | | 3,022,882 | |
| | | | | | | | | | | | | | | | |
| | | | |
Utilities: 4.30% | | | | | | | | | | | | | | | | |
| | | | |
| Electric Utilities: 4.15% | | | | | | | | | | | | | | | | |
Allegheny Energy Supply Company LLC 144A | | | 8.25 | | | | 04/15/2012 | | | | 2,000,000 | | | | 2,014,248 | |
Ameren Corporation | | | 8.88 | | | | 05/15/2014 | | | | 3,738,000 | | | | 4,200,667 | |
Duke Energy Ohio Incorporated | | | 5.70 | | | | 09/15/2012 | | | | 3,000,000 | | | | 3,082,035 | |
FPL Group Capital Incorporation | | | 2.60 | | | | 09/01/2015 | | | | 3,000,000 | | | | 3,073,836 | |
Great Plains Energy Incorporated | | | 2.75 | | | | 08/15/2013 | | | | 1,000,000 | | | | 1,009,179 | |
Interstate Power & Light Company | | | 3.30 | | | | 06/15/2015 | | | | 3,750,000 | | | | 3,913,808 | |
Niagara Mohawk Power Corporation 144A | | | 3.55 | | | | 10/01/2014 | | | | 3,667,000 | | | | 3,894,398 | |
PECO Energy Company | | | 5.00 | | | | 10/01/2014 | | | | 2,000,000 | | | | 2,192,574 | |
Virginia Electric & Power Company | | | 5.25 | | | | 12/15/2015 | | | | 3,000,000 | | | | 3,418,839 | |
| | | | |
| | | | | | | | | | | | | | | 26,799,584 | |
| | | | | | | | | | | | | | | | |
| | | | |
| Multi-Utilities: 0.15% | | | | | | | | | | | | | | | | |
CMS Energy Corporation | | | 2.75 | | | | 05/15/2014 | | | | 1,000,000 | | | | 998,899 | |
| | | | | | | | | | | | | | | | |
| | | | |
Total Corporate Bonds and Notes (Cost $292,167,056) | | | | | | | | | | | | | | | 296,483,695 | |
| | | | | | | | | | | | | | | | |
| | | | |
Municipal Bonds and Notes: 5.34% | | | | | | | | | | | | | | | | |
| | | | |
| Alabama: 0.26% | | | | | | | | | | | | | | | | |
Courtland AL Industrial Development Board International Paper Company Project Series A (IDR) | | | 5.00 | | | | 11/01/2013 | | | | 1,570,000 | | | | 1,650,306 | |
| | | | | | | | | | | | | | | | |
| | | | |
| California: 1.06% | | | | | | | | | | | | | | | | |
California PCFA Waste Services Incorporated Series A (Resource Recovery Revenue) ± | | | 2.63 | | | | 06/01/2018 | | | | 3,000,000 | | | | 3,067,890 | |
Northern California Power Agency Series B (Utilities Revenue) | | | 2.75 | | | | 07/01/2012 | | | | 1,750,000 | | | | 1,762,775 | |
University of California Build America Bonds (Education Revenue) ± | | | 1.99 | | | | 05/15/2050 | | | | 2,000,000 | | | | 2,026,340 | |
| | | | |
| | | | | | | | | | | | | | | 6,857,005 | |
| | | | | | | | | | | | | | | | |
| | | | |
| Florida: 0.49% | | | | | | | | | | | | | | | | |
Miami-Dade County FL IDA Waste Management Incorporated Florida Project (Resource Recovery Revenue) ± | | | 2.63 | | | | 08/01/2023 | | | | 1,200,000 | | | | 1,216,836 | |
Miami-Dade County FL School Board COP (Lease Revenue, NATL-RE FGIC Insured) | | | 5.00 | | | | 05/01/2013 | | | | 1,870,000 | | | | 1,972,083 | |
| | | | |
| | | | | | | | | | | | | | | 3,188,919 | |
| | | | | | | | | | | | | | | | |
| | | | |
| Georgia: 0.50% | | | | | | | | | | | | | | | | |
Georgia Municipal Gas Authority Taxable Gas Portfolio III Series F (Energy Revenue, GO of Authority Insured) | | | 4.77 | | | | 08/01/2015 | | | | 3,000,000 | | | | 3,243,210 | |
| | | | | | | | | | | | | | | | |
| | | | |
| Kentucky: 0.28% | | | | | | | | | | | | | | | | |
Kenton County KY Airport Board Cincinnati Northern Kentucky Series A (Airport Revenue, XLCA Insured) | | | 5.00 | | | | 03/01/2012 | | | | 1,830,000 | | | | 1,830,366 | |
| | | | | | | | | | | | | | | | |
The accompanying notes are an integral part of these financial statements.
| | | | | | |
| Portfolio of Investments—February 29, 2012 (Unaudited) | | Wells Fargo Advantage Short-Term Bond Fund | | | 15 | |
| | | | | | | | | | | | | | | | |
| Security Name | | Interest Rate | | | Maturity Date | | | Principal | | | Value | |
| | | | | | | | | | | | | | | | |
| | | | |
| Louisiana: 0.47% | | | | | | | | | | | | | | | | |
Louisiana State Gas & Fuels Tax Build America Bonds Series A-4 (Tax Revenue) ± | | | 2.77 | % | | | 05/01/2043 | | | $ | 3,000,000 | | | $ | 3,012,660 | |
| | | | | | | | | | | | | | | | |
| | | | |
| New Jersey: 0.46% | | | | | | | | | | | | | | | | |
Atlantic City NJ Tax Appeal (Tax Revenue) | | | 2.13 | | | | 12/15/2013 | | | | 3,000,000 | | | | 3,006,120 | |
| | | | | | | | | | | | | | | | |
| | | | |
| New York: 0.06% | | | | | | | | | | | | | | | | |
Onondaga County NY Property Tax Receivables (Lease Revenue) | | | 3.50 | | | | 04/01/2013 | | | | 375,000 | | | | 375,345 | |
| | | | | | | | | | | | | | | | |
| | | | |
| Ohio: 0.46% | | | | | | | | | | | | | | | | |
Columbus Franklin County OH Finance Authority Research & Development (IDR) | | | 3.45 | | | | 02/15/2015 | | | | 2,885,000 | | | | 2,954,442 | |
| | | | | | | | | | | | | | | | |
| | | | |
| Oregon: 0.49% | | | | | | | | | | | | | | | | |
Oregon School Boards Association Series A (Miscellaneous Revenue, NATL-RE FGIC Insured) (z) | | | 1.10 | | | | 06/30/2013 | | | | 3,200,000 | | | | 3,152,800 | |
| | | | | | | | | | | | | | | | |
| | | | |
| Texas: 0.02% | | | | | | | | | | | | | | | | |
Reeves County TX Lease Rentals Law Enforcement (Lease Revenue, ACA Insured) | | | 5.75 | | | | 03/01/2012 | | | | 125,000 | | | | 125,011 | |
| | | | | | | | | | | | | | | | |
| | | | |
| West Virginia: 0.47% | | | | | | | | | | | | | | | | |
West Virginia Solid Waste Disposal Facilities Amos Project Series A (Resource Recovery Revenue) ± | | | 2.00 | | | | 01/01/2041 | | | | 3,000,000 | | | | 3,011,970 | |
| | | | | | | | | | | | | | | | |
| | | | |
| Wisconsin: 0.32% | | | | | | | | | | | | | | | | |
Menomonee Falls WI (Tax Revenue) | | | 4.25 | | | | 11/01/2014 | | | | 2,000,000 | | | | 2,070,700 | |
| | | | | | | | | | | | | | | | |
| | | | |
Total Municipal Bonds and Notes (Cost $33,897,725) | | | | | | | | | | | | | | | 34,478,854 | |
| | | | | | | | | | | | | | | | |
| | | | |
| Non-Agency Mortgage Backed Securities: 6.61% | | | | | | | | | | | | | | | | |
Aames Mortgage Trust Series 2003-1 Class M1 ± | | | 1.26 | | | | 10/25/2033 | | | | 4,193,292 | | | | 3,351,191 | |
Bank of America Mortgage Securities Series 2002-K Class 3A1 ± | | | 2.68 | | | | 10/20/2032 | | | | 83,371 | | | | 83,352 | |
Bear Stearns Commercial Mortgage Securities Series 2004-PWR3 Class A3 | | | 4.49 | | | | 02/11/2041 | | | | 3,389,574 | | | | 3,455,600 | |
Citigroup Mortgage Loan Trust Incorporated Series 2004-HYB4 Class AA ± | | | 0.57 | | | | 12/25/2034 | | | | 163,549 | | | | 138,902 | |
ContiMortgage Home Equity Trust Series 1996-2 ±(c)(i)— | | | 0.00 | | | | 07/15/2027 | | | | 1,460,681 | | | | 44 | |
Countrywide Home Loans Mortgage Pass-Through Trust Series 2001-HYB1 Class 2A1 ± | | | 1.94 | | | | 06/19/2031 | | | | 482,405 | | | | 463,173 | |
Countrywide Home Loans Mortgage Pass-Through Trust Series 2004-20 Class 3A1 ± | | | 2.32 | | | | 09/25/2034 | | | | 119,603 | | | | 75,695 | |
Credit Suisse First Boston Mortgage Securities Corporation Series 2003-C3 Class A5 | | | 3.94 | | | | 05/15/2038 | | | | 2,936,908 | | | | 3,006,880 | |
Credit Suisse First Boston Mortgage Securities Corporation Series 2006-C1 Class AAB ± | | | 5.43 | | | | 02/15/2039 | | | | 1,942,964 | | | | 2,056,788 | |
Drexel Burnham Lambert CMO Trust Series T Class 4 | | | 8.45 | | | | 09/20/2019 | | | | 254,846 | | | | 255,693 | |
EquiFirst Mortgage Loan Trust Series 2003-2 Class 3A3 ± | | | 1.04 | | | | 09/25/2033 | | | | 823,810 | | | | 690,515 | |
Golden National Mortgage Asset Backed Certificates Series 1998-GN1 Class M2 | | | 8.02 | | | | 02/25/2027 | | | | 61,118 | | | | 61,151 | |
GS Mortgage Securites Corporation II Series 2003-C1 Class A3 | | | 4.61 | | | | 01/10/2040 | | | | 2,969,000 | | | | 3,036,690 | |
GSMPS Mortgage Loan Trust Series 1998-1 Class A ±144A | | | 8.00 | | | | 09/19/2027 | | | | 530,653 | | | | 550,981 | |
GSMPS Mortgage Loan Trust Series 2004-4 Class 1AF ±144A | | | 0.64 | | | | 06/25/2034 | | | | 1,701,276 | | | | 1,456,505 | |
GSMPS Mortgage Loan Trust Series 2004-4 Class 2A1 ±144A | | | 3.66 | | | | 06/25/2034 | | | | 1,325,171 | | | | 1,193,828 | |
The accompanying notes are an integral part of these financial statements.
| | | | |
| 16 | | Wells Fargo Advantage Short-Term Bond Fund | | Portfolio of Investments—February 29, 2012 (Unaudited) |
| | | | | | | | | | | | | | | | |
| Security Name | | Interest Rate | | | Maturity Date | | | Principal | | | Value | |
| | | | | | | | | | | | | | | | |
| | | | |
| Non-Agency Mortgage Backed Securities (continued) | | | | | | | | | | | | | | | | |
GSMPS Mortgage Loan Trust Series 2006-RP1 Class 1AF1 ±144A | | | 0.59 | % | | | 01/25/2036 | | | $ | 1,253,546 | | | $ | 980,429 | |
GSMPS Mortgage Loan Trust Series 2006-RP2 Class 1AF1 ±144A | | | 0.64 | | | | 04/25/2036 | | | | 1,586,608 | | | | 1,270,217 | |
GSR Mortgage Loan Trust Series 2004-1 Class 2A2 ± | | | 1.94 | | | | 04/25/2032 | | | | 251,165 | | | | 221,454 | |
Jeffries & Company Series 2010-R7 Class 7A6 ±144A | | | 3.25 | | | | 10/26/2036 | | | | 990,659 | | | | 988,001 | |
JPMorgan Chase Commercial Mortgage Securities Corporation Series 2003-C1 Class A2 | | | 4.99 | | | | 01/12/2037 | | | | 2,965,000 | | | | 3,042,902 | |
Master Mortgages Trust Series 2002-3 Class 4A1 ± | | | 2.63 | | | | 10/25/2032 | | | | 19,612 | | | | 18,895 | |
Morgan Stanley Capital I Series 1999-WF1 Class X ±(c)144A | | | 1.13 | | | | 11/15/2031 | | | | 5,473,707 | | | | 159,745 | |
Morgan Stanley Capital I Series 2004-IQ8 Class A4 | | | 4.90 | | | | 06/15/2040 | | | | 1,484,929 | | | | 1,486,297 | |
Morgan Stanley Dean Witter Capital I Series 2003-IQ4 Class A2 | | | 4.07 | | | | 05/15/2040 | | | | 2,536,385 | | | | 2,598,795 | |
Morgan Stanley Dean Witter Captial I Series 2003-TOP9 Class A2 | | | 4.74 | | | | 11/13/2036 | | | | 3,636,580 | | | | 3,711,523 | |
Nomura Asset Acceptance Corporation Series 2005-AR1 Class 1A1 ± | | | 2.73 | | | | 02/25/2035 | | | | 1,683,495 | | | | 1,458,498 | |
Nomura Asset Securities Corporation Series 1998-D6 Class A2 ± | | | 7.31 | | | | 03/15/2030 | | | | 2,475,000 | | | | 2,577,368 | |
Residential Finance Limited Partnership Series 2003-C Class B3 ±144A | | | 1.65 | | | | 09/10/2035 | | | | 2,945,183 | | | | 2,286,375 | |
Salomon Brothers Mortgage Securities VI Series 1987-3 Class A (z) | | | 0.20 | | | | 10/23/2017 | | | | 5,950 | | | | 5,883 | |
Structured Asset Securities Corporation Series 1998-RF2 Class A ±(i)144A | | | 7.80 | | | | 07/15/2027 | | | | 1,599,776 | | | | 1,614,731 | |
Structured Mortgage Asset Residential Trust Series 1992-5B Class BO (z) | | | 1.93 | | | | 06/25/2023 | | | | 9,524 | | | | 7,644 | |
Terwin Mortgage Trust Series 2004-21HE Class 1A1 ± | | | 1.20 | | | | 12/25/2034 | | | | 47,080 | | | | 40,290 | |
Wilshire Funding Corporation Series 1996-3 Class M2 ± | | | 5.71 | | | | 08/25/2032 | | | | 150,254 | | | | 146,991 | |
Wilshire Funding Corporation Series 1996-3 Class M3 ± | | | 5.71 | | | | 08/25/2032 | | | | 152,726 | | | | 145,727 | |
Wilshire Funding Corporation Series 1998-2 Class M1 ± | | | 2.00 | | | | 12/28/2037 | | | | 49,990 | | | | 45,108 | |
| | | | |
Total Non-Agency Mortgage Backed Securities (Cost $45,686,893) | | | | | | | | | | | | | | | 42,683,861 | |
| | | | | | | | | | | | | | | | |
| | | | |
| | | Diviend Yield | | | | | | Shares | | | | |
| Preferred Stocks: 0.25% | | | | | | | | | | | | | | | | |
| | | | |
Financials: 0.25% | | | | | | | | | | | | | | | | |
| | | | |
| Commercial Banks: 0.25% | | | | | | | | | | | | | | | | |
Huntington Bancshares ± | | | 0.76 | % | | | | | | | 80,000 | | | | 1,622,504 | |
| | | | | | | | | | | | | | | | |
| | | | |
Total Preferred Stocks (Cost $1,958,484) | | | | | | | | | | | | | | | 1,622,504 | |
| | | | | | | | | | | | | | | | |
| | | | |
| | | Interest Rate | | | | | | Principal | | | | |
| U.S. Treasury Securities: 2.06% | | | | | | | | | | | | | | | | |
U.S. Treasury Note | | | 0.50 | | | | 08/15/2014 | | | $ | 1,910,000 | | | | 1,915,969 | |
U.S. Treasury Note | | | 1.00 | | | | 07/15/2013 | | | | 8,450,000 | | | | 8,536,477 | |
U.S. Treasury Note | | | 1.50 | | | | 07/31/2016 | | | | 2,105,000 | | | | 2,173,413 | |
U.S. Treasury Note | | | 1.88 | | | | 02/28/2014 | | | | 665,000 | | | | 685,574 | |
U.S. Treasury Note | | | 4.88 | | | | 06/30/2012 | | | | 25,000 | | | | 25,395 | |
| | | | |
Total U.S. Treasury Securities (Cost $13,246,148) | | | | | | | | | | | | | | | 13,336,828 | |
| | | | | | | | | | | | | | | | |
| | | | |
Yankee Corporate Bonds and Notes: 17.92% | | | | | | | | | | | | | | | | |
| | | | |
Consumer Discretionary: 0.95% | | | | | | | | | | | | | | | | |
| | | | |
| Media: 0.62% | | | | | | | | | | | | | | | | |
Pearson Finance Two plc 144A | | | 5.50 | | | | 05/06/2013 | | | | 2,500,000 | | | | 2,622,890 | |
Vivendi SA 144A | | | 5.75 | | | | 04/04/2013 | | | | 1,335,000 | | | | 1,388,212 | |
| | | | |
| | | | | | | | | | | | | | | 4,011,102 | |
| | | | | | | | | | | | | | | | |
The accompanying notes are an integral part of these financial statements.
| | | | | | |
| Portfolio of Investments—February 29, 2012 (Unaudited) | | Wells Fargo Advantage Short-Term Bond Fund | | | 17 | |
| | | | | | | | | | | | | | | | |
| Security Name | | Interest Rate | | | Maturity Date | | | Principal | | | Value | |
| | | | | | | | | | | | | | | | |
| | | | |
| Multiline Retail: 0.33% | | | | | | | | | | | | | | | | |
Wesfarmers Limited 144A | | | 7.00 | % | | | 04/10/2013 | | | $ | 2,000,000 | | | $ | 2,115,762 | |
| | | | | | | | | | | | | | | | |
| | | | |
Consumer Staples: 0.33% | | | | | | | | | | | | | | | | |
| | | | |
| Food & Staples Retailing: 0.33% | | | | | | | | | | | | | | | | |
Delhaize Group | | | 5.88 | | | | 02/01/2014 | | | | 2,000,000 | | | | 2,151,918 | |
| | | | | | | | | | | | | | | | |
| | | | |
Energy: 0.98% | | | | | | | | | | | | | | | | |
| | | | |
| Oil, Gas & Consumable Fuels: 0.98% | | | | | | | | | | | | | | | | |
Husky Energy Incorporated | | | 5.90 | | | | 06/15/2014 | | | | 3,000,000 | | | | 3,275,244 | |
Petrobras International Finance Company | | | 2.88 | | | | 02/06/2015 | | | | 3,000,000 | | | | 3,070,791 | |
| | | | |
| | | | | | | | | | | | | | | 6,346,035 | |
| | | | | | | | | | | | | | | | |
| | | | |
Financials: 12.39% | | | | | | | | | | | | | | | | |
| | | | |
| Capital Markets: 1.10% | | | | | | | | | | | | | | | | |
Amvescap plc | | | 5.38 | | | | 12/15/2014 | | | | 1,600,000 | | | | 1,738,315 | |
BP Capital Markets plc | | | 5.25 | | | | 11/07/2013 | | | | 3,000,000 | | | | 3,222,795 | |
Macquarie Group Limited 144A | | | 7.30 | | | | 08/01/2014 | | | | 2,005,000 | | | | 2,112,771 | |
| | | | |
| | | | | | | | | | | | | | | 7,073,881 | |
| | | | | | | | | | | | | | | | |
| | | | |
| Commercial Banks: 9.75% | | | | | | | | | | | | | | | | |
ABN Amro Bank NV 144A | | | 3.00 | | | | 01/31/2014 | | | | 2,630,000 | | | | 2,627,491 | |
Australia & New Zealand Banking Group Limited ±144A | | | 0.84 | | | | 06/18/2012 | | | | 4,000,000 | | | | 4,000,860 | |
Banco Santander Chile 144A | | | 2.88 | | | | 11/13/2012 | | | | 2,000,000 | | | | 1,997,568 | |
Bank of Montreal 144A« | | | 1.30 | | | | 10/31/2014 | | | | 2,500,000 | | | | 2,526,330 | |
Bank of Nova Scotia 144A | | | 1.65 | | | | 10/29/2015 | | | | 3,430,000 | | | | 3,493,832 | |
Bank of Nova Scotia 144A | | | 2.15 | | | | 08/03/2016 | | | | 3,000,000 | | | | 3,095,646 | |
Canadian Imperial Bank 144A« | | | 0.90 | | | | 09/19/2014 | | | | 4,100,000 | | | | 4,105,031 | |
Canadian Imperial Bank 144A | | | 2.75 | | | | 01/27/2016 | | | | 3,000,000 | | | | 3,137,604 | |
Commonwealth Bank of Australia ± | | | 1.01 | | | | 07/23/2014 | | | | 4,000,000 | | | | 3,951,624 | |
Corp Andina De Fomento | | | 3.75 | | | | 01/15/2016 | | | | 3,385,000 | | | | 3,480,305 | |
HSBC Bank plc 144A« | | | 1.63 | | | | 07/07/2014 | | | | 4,000,000 | | | | 4,012,768 | |
Lloyds TSB Bank plc 144A | | | 4.38 | | | | 01/12/2015 | | | | 2,910,000 | | | | 2,972,254 | |
Nordea Eiendomskreditt 144A | | | 1.88 | | | | 04/07/2014 | | | | 6,500,000 | | | | 6,563,018 | |
Royal Bank of Scotland plc | | | 3.95 | | | | 09/21/2015 | | | | 3,115,000 | | | | 3,137,721 | |
Standard Chartered plc 144A | | | 3.85 | | | | 04/27/2015 | | | | 2,760,000 | | | | 2,861,930 | |
Swedbank Hypotek 144A | | | 2.13 | | | | 08/31/2016 | | | | 3,000,000 | | | | 3,000,381 | |
Toronto Dominion Bank 144A« | | | 0.88 | | | | 09/12/2014 | | | | 4,000,000 | | | | 4,002,388 | |
Westpac Banking Corporation ±144A | | | 0.73 | | | | 12/14/2012 | | | | 4,000,000 | | | | 4,005,024 | |
| | | | |
| | | | | | | | | | | | | | | 62,971,775 | |
| | | | | | | | | | | | | | | | |
| | | | |
| Diversified Financial Services: 1.54% | | | | | | | | | | | | | | | | |
Abbey National Treasury Services plc | | | 4.00 | | | | 04/27/2016 | | | | 3,000,000 | | | | 2,949,057 | |
BAT International Finance plc 144A | | | 8.13 | | | | 11/15/2013 | | | | 2,000,000 | | | | 2,218,614 | |
UBS AG Stamford CT | | | 2.25 | | | | 08/12/2013 | | | | 2,000,000 | | | | 2,006,156 | |
Volkswagen International Finance NV 144A | �� | | 1.88 | | | | 04/01/2014 | | | | 2,770,000 | | | | 2,800,121 | |
| | | | |
| | | | | | | | | | | | | | | 9,973,948 | |
| | | | | | | | | | | | | | | | |
The accompanying notes are an integral part of these financial statements.
| | | | |
| 18 | | Wells Fargo Advantage Short-Term Bond Fund | | Portfolio of Investments—February 29, 2012 (Unaudited) |
| | | | | | | | | | | | | | | | |
| Security Name | | Interest Rate | | | Maturity Date | | | Principal | | | Value | |
| | | | | | | | | | | | | | | | |
| | | | |
Materials: 1.81% | | | | | | | | | | | | | | | | |
| | | | |
| Metals & Mining: 1.64% | | | | | | | | | | | | | | | | |
Arcelormittal Company | | | 5.38 | % | | | 06/01/2013 | | | $ | 3,500,000 | | | $ | 3,630,974 | |
Rio Tinto Finance USA Limited | | | 8.95 | | | | 05/01/2014 | | | | 3,000,000 | | | | 3,502,266 | |
Teck Resources Limited | | | 10.25 | | | | 05/15/2016 | | | | 3,000,000 | | | | 3,452,538 | |
| | | | |
| | | | | | | | | | | | | | | 10,585,778 | |
| | | | | | | | | | | | | | | | |
| | | | |
| Paper & Forest Products: 0.17% | | | | | | | | | | | | | | | | |
PE Paper Escrow GmbH 144A | | | 12.00 | | | | 08/01/2014 | | | | 1,000,000 | | | | 1,090,000 | |
| | | | | | | | | | | | | | | | |
| | | | |
Telecommunication Services: 1.46% | | | | | | | | | | | | | | | | |
| | | | |
| Diversified Telecommunication Services: 1.15% | | | | | | | | | | | | | | | | |
Deutsche Telekom International Finance BV | | | 5.25 | | | | 07/22/2013 | | | | 3,000,000 | | | | 3,157,287 | |
Telecom Italia Capital | | | 5.25 | | | | 11/15/2013 | | | | 1,500,000 | | | | 1,522,500 | |
Telefonos de Mexico SA | | | 5.50 | | | | 01/27/2015 | | | | 2,510,000 | | | | 2,744,828 | |
| | | | |
| | | | | | | | | | | | | | | 7,424,615 | |
| | | | | | | | | | | | | | | | |
| | | | |
| Wireless Telecommunication Services: 0.31% | | | | | | | | | | | | | | | | |
Telefonica Moviles Chile SA 144A | | | 2.88 | | | | 11/09/2015 | | | | 2,000,000 | | | | 1,998,140 | |
| | | | | | | | | | | | | | | | |
| | | | |
Total Yankee Corporate Bonds and Notes (Cost $113,941,314) | | | | | | | | | | | | | | | 115,742,954 | |
| | | | | | | | | | | | | | | | |
| | | | |
| Other: 0.08% | | | | | | | | | | | | | | | | |
Gryphon Funding Limited, Pass-Through Entity (a)(i)(v) | | | | | | | | | | | 358,151 | | | | 96,701 | |
VFNC Corporation, Pass-Through Entity, 0.24% ±(a)(i)144A(v) | | | | | | | | | | | 953,297 | | | | 409,918 | |
| | | | |
Total Other (Cost $206,321) | | | | | | | | | | | | | | | 506,619 | |
| | | | | | | | | | | | | | | | |
| | | | |
| | | Yield | | | | | | | | | | |
| Short-Term Investments: 5.32% | | | | | | | | | | | | | | | | |
| | | | |
| U.S. Treasury Securities: 0.05% | | | | | | | | | | | | | | | | |
U.S. Treasury Bill # | | | 0.08 | | | | 03/29/2012 | | | | 300,000 | | | | 299,981 | |
| | | | | | | | | | | | | | | | |
| | | | |
| | | | | | | | | Shares | | | | |
| Investment Companies: 5.27% | | | | | | | | | | | | | | | | |
Wells Fargo Advantage Cash Investment Money Market Fund, Institutional Class (l)(u) | | | 0.02 | % | | | | | | | 21,118,512 | | | | 21,118,512 | |
Wells Fargo Securities Lending Cash Investments, LLC (v)(l)(u)(r) | | | 0.15 | | | | | | | | 12,951,391 | | | | 12,951,391 | |
| | | | |
| | | | | | | | | | | | | | | 34,069,903 | |
| | | | | | | | | | | | | | | | |
| | | | |
Total Short-Term Investments (Cost $34,369,900) | | | | | | | | | | | | | | | 34,369,884 | |
| | | | | | | | | | | | | | | | |
| | | | | | | | |
| Total Investments in Securities | | | | | | | | |
| (Cost $657,436,997) | | | 101.76 | % | | | 657,335,037 | |
Other Assets and Liabilities, Net | | | (1.76 | ) | | | (11,384,249 | ) |
| | | | | | | | |
| Total Net Assets* | | | 100.00 | % | | $ | 645,950,788 | |
| | | | | | | | |
The accompanying notes are an integral part of these financial statements.
| | | | | | |
| Portfolio of Investments—February 29, 2012 (Unaudited) | | Wells Fargo Advantage Short-Term Bond Fund | | | 19 | |
| ± | Variable rate investment. |
| (c) | Interest-only securities entitle holders to receive only the interest payments on the underlying mortgages. The principal amount shown is the notional amount of the underlying mortgages. Interest rate disclosed represents the coupon rate. |
| (a) | Security is fair valued by the Management Valuation Team, and in certain instances by the Board of Trustees, in accordance with procedures approved by the Board of Trustees. |
| (s) | Security which has defaulted on payment of interest and/or principal. |
| 144A | Security that may be resold to “qualified institutional buyers” under Rule 144A or security offered pursuant to Section 4(2) of the Securities Act of 1933, as amended. |
| (z) | Zero coupon security. Rate represents yield to maturity. |
| « | All or a portion of this security is on loan. |
| (v) | Security represents investment of cash collateral received from securities on loan. |
| # | All or a portion of this security is segregated as collateral for investments in derivative instruments. |
| (l) | Investment in an affiliate. |
| (u) | Rate shown is the 7-day annualized yield at period end. |
| — | Security which has defaulted on payment of interest and/or principal. The Fund has stopped accruing interest on this security. |
| (r) | The investment company is exempt from registration under Section 3(c)(7) of the 1940 Act. |
| * | Cost for federal income tax purposes is $657,604,638 and net unrealized appreciation (depreciation) consists of: |
| | | | |
Gross unrealized appreciation | | $ | 10,109,919 | |
Gross unrealized depreciation | | | (10,379,520 | ) |
| | | | |
Net unrealized depreciation | | $ | (269,601 | ) |
The accompanying notes are an integral part of these financial statements.
| | | | |
| 20 | | Wells Fargo Advantage Short-Term Bond Fund | | Statement of Assets and Liabilities—February 29, 2012 (Unaudited) |
| | | | |
| | | | |
| |
Assets | | | | |
Investments | | | | |
In unaffiliated securities (including securities on loan), at value (see cost below) | | $ | 623,265,134 | |
In affiliated securities, at value (see cost below) | | | 34,069,903 | |
| | | | |
Total investments, at value (see cost below) | | | 657,335,037 | |
Receivable for investments sold | | | 6,492,847 | |
Principal paydown receivable | | | 34,930 | |
Receivable for Fund shares sold | | | 633,533 | |
Receivable for interest | | | 5,588,160 | |
Receivable for securities lending income | | | 3,253 | |
Prepaid expenses and other assets | | | 54,571 | |
| | | | |
Total assets | | | 670,142,331 | |
| | | | |
| |
Liabilities | | | | |
Dividends payable | | | 221,786 | |
Payable for investments purchased | | | 9,688,495 | |
Payable for Fund shares redeemed | | | 773,588 | |
Payable upon receipt of securities loaned | | | 13,157,713 | |
Payable for daily variation margin on open futures contracts | | | 19,469 | |
Advisory fee payable | | | 160,554 | |
Distribution fees payable | | | 11,525 | |
Due to other related parties | | | 75,732 | |
Accrued expenses and other liabilities | | | 82,681 | |
| | | | |
Total liabilities | | | 24,191,543 | |
| | | | |
Total net assets | | $ | 645,950,788 | |
| | | | |
| |
NET ASSETS CONSIST OF | | | | |
Paid-in capital | | $ | 646,013,354 | |
Overdistributed net investment income | | | (13,637 | ) |
Accumulated net realized gains on investments | | | 59,698 | |
Net unrealized losses on investments | | | (108,627 | ) |
| | | | |
Total net assets | | $ | 645,950,788 | |
| | | | |
| |
COMPUTATION OF NET ASSET VALUE AND OFFERING PRICE PER SHARE1 | | | | |
Net assets – Class A | | $ | 53,111,112 | |
Shares outstanding – Class A | | | 6,063,900 | |
Net asset value per share – Class A | | | $8.76 | |
Maximum offering price per share – Class A2 | | | $9.03 | |
Net assets – Class C | | $ | 19,343,928 | |
Shares outstanding – Class C | | | 2,210,778 | |
Net asset value per share – Class C | | | $8.75 | |
Net assets – Institutional Class | | $ | 321,092,274 | |
Shares outstanding – Institutional Class | | | 36,638,752 | |
Net asset value per share – Institutional Class | | | $8.76 | |
Net assets – Investor Class | | $ | 252,403,474 | |
Shares outstanding – Investor Class | | | 28,830,706 | |
Net asset value per share – Investor Class | | | $8.75 | |
| |
Investments in unaffiliated securities, at cost | | $ | 623,367,094 | |
| | | | |
Investments in affiliated securities, at cost | | $ | 34,069,903 | |
| | | | |
Total investments, at cost | | $ | 657,436,997 | |
| | | | |
Securities on loan, at value | | $ | 12,874,998 | |
| | | | |
| 1. | The Fund has an unlimited number of authorized shares. |
| 2. | Maximum offering price is computed as 100/97 of net asset value. On investments of $50,000 or more, the offering price is reduced. |
The accompanying notes are an integral part of these financial statements.
| | | | | | |
| Statement of Operations—Six Months Ended February 29, 2012 (Unaudited) | | Wells Fargo Advantage Short-Term Bond Fund | | | 21 | |
| | | | |
| | | | |
| |
Investment income | | | | |
Interest | | $ | 8,069,049 | |
Income from affiliated securities | | | 101,694 | |
Securities lending income, net | | | 13,486 | |
Dividends | | | 3,094 | |
| | | | |
Total investment income | | | 8,187,323 | |
| | | | |
| |
Expenses | | | | |
Advisory fee | | | 1,283,172 | |
Administration fees | | | | |
Fund level | | | 162,802 | |
Class A | | | 44,441 | |
Class C | | | 15,794 | |
Institutional Class | | | 130,942 | |
Investor Class | | | 236,130 | |
Shareholder servicing fees | | | | |
Class A | | | 69,440 | |
Class C | | | 24,678 | |
Investor Class | | | 310,195 | |
Distribution fees | | | | |
Class C | | | 74,033 | |
Custody and accounting fees | | | 24,344 | |
Professional fees | | | 17,168 | |
Registration fees | | | 36,259 | |
Shareholder report expenses | | | 10,341 | |
Trustees’ fees and expenses | | | 7,124 | |
Other fees and expenses | | | 11,586 | |
| | | | |
Total expenses | | | 2,458,449 | |
Less: Fee waivers and/or expense reimbursements | | | (266,071 | ) |
| | | | |
Net expenses | | | 2,192,378 | |
| | | | |
Net investment income | | | 5,994,945 | |
| | | | |
| |
REALIZED AND UNREALIZED GAINS (LOSSES) ON INVESTMENTS | | | | |
| |
Net realized gains (losses) on: | | | | |
Unaffiliated securities | | | 312,331 | |
Futures transactions | | | (55,019 | ) |
| | | | |
Net realized gains on investments | | | 257,312 | |
| | | | |
| |
Net change in unrealized gains (losses) on: | | | | |
Unaffiliated securities | | | (62,375 | ) |
Futures transactions | | | (3,896 | ) |
| | | | |
Net change in unrealized gains (losses) on investments | | | (66,271 | ) |
| | | | |
Net realized and unrealized gains (losses) on investments | | | 191,041 | |
| | | | |
Net increase in net assets resulting from operations | | $ | 6,185,986 | |
| | | | |
The accompanying notes are an integral part of these financial statements.
| | | | |
| 22 | | Wells Fargo Advantage Short-Term Bond Fund | | Statements of Changes in Net Assets |
| | | | | | | | | | | | | | | | |
| | | Six Months Ended
February 29, 2012
(Unaudited) | | | Year Ended
August 31, 2011 | |
| | | | |
Operations | | | | | | | | | | | | | | | | |
Net investment income | | | | | | $ | 5,994,945 | | | | | | | $ | 12,334,886 | |
Net realized gains on investments | | | | | | | 257,312 | | | | | | | | 3,596,470 | |
Net change in unrealized gains (losses) on investments | | | | | | | (66,271 | ) | | | | | | | (1,292,627 | ) |
| | | | | | | | | | | | | | | | |
Net increase in net assets resulting from operations | | | | | | | 6,185,986 | | | | | | | | 14,638,729 | |
| | | | | | | | | | | | | | | | |
| | | | |
Distributions to shareholders from | | | | | | | | | | | | | | | | |
Net investment income | | | | | | | | | | | | | | | | |
Class A | | | | | | | (497,994 | ) | | | | | | | (1,012,375 | ) |
Class C | | | | | | | (102,912 | ) | | | | | | | (201,120 | ) |
Institutional Class | | | | | | | (3,451,348 | ) | | | | | | | (6,914,679 | ) |
Investor Class | | | | | | | (2,187,586 | ) | | | | | | | (4,921,466 | ) |
| | | | | | | | | | | | | | | | |
Total distributions to shareholders | | | | | | | (6,239,840 | ) | | | | | | | (13,049,640 | ) |
| | | | | | | | | | | | | | | | |
| | | | |
Capital share transactions | | | Shares | | | | | | | | Shares | | | | | |
Proceeds from shares sold | | | | | | | | | | | | | | | | |
Class A | | | 1,406,061 | | | | 12,259,109 | | | | 4,351,540 | | | | 38,071,832 | |
Class C | | | 394,953 | | | | 3,438,657 | | | | 1,173,221 | | | | 10,272,685 | |
Institutional Class | | | 5,016,467 | | | | 43,792,227 | | | | 19,661,224 | | | | 172,410,238 | |
Investor Class | | | 2,844,409 | | | | 24,762,463 | | | | 3,537,399 | | | | 30,970,052 | |
| | | | | | | | | | | | | | | | |
| | | | | | | 84,252,456 | | | | | | | | 251,724,807 | |
| | | | | | | | | | | | | | | | |
Reinvestment of distributions | | | | | | | | | | | | | | | | |
Class A | | | 49,229 | | | | 429,156 | | | | 104,391 | | | | 914,277 | |
Class C | | | 9,886 | | | | 86,083 | | | | 19,034 | | | | 166,604 | |
Institutional Class | | | 226,708 | | | | 1,978,048 | | | | 432,972 | | | | 3,795,511 | |
Investor Class | | | 222,733 | | | | 1,941,029 | | | | 488,922 | | | | 4,280,138 | |
| | | | | | | | | | | | | | | | |
| | | | | | | 4,434,316 | | | | | | | | 9,156,530 | |
| | | | | | | | | | | | | | | | |
Payment for shares redeemed | | | | | | | | | | | | | | | | |
Class A | | | (1,847,291 | ) | | | (16,121,413 | ) | | | (3,394,555 | ) | | | (29,710,138 | ) |
Class C | | | (423,378 | ) | | | (3,686,153 | ) | | | (601,286 | ) | | | (5,262,203 | ) |
Institutional Class | | | (5,924,418 | ) | | | (51,773,097 | ) | | | (16,189,801 | ) | | | (141,875,382 | ) |
Investor Class | | | (2,617,843 | ) | | | (22,804,244 | ) | | | (6,193,074 | ) | | | (54,165,350 | ) |
| | | | | | | | | | | | | | | | |
| | | | | | | (94,384,907 | ) | | | | | | | (231,013,073 | ) |
| | | | | | | | | | | | | | | | |
Net increase (decrease) in net assets resulting
from capital share transactions | | | | | | | (5,698,135 | ) | | | | | | | 29,868,264 | |
| | | | | | | | | | | | | | | | |
Total increase (decrease) in net assets | | | | | | | (5,751,989 | ) | | | | | | | 31,457,353 | |
| | | | | | | | | | | | | | | | |
| | | | |
Net assets | | | | | | | | | | | | | | | | |
Beginning of period | | | | | | | 651,702,777 | | | | | | | | 620,245,424 | |
| | | | | | | | | | | | | | | | |
End of period | | | | | | $ | 645,950,788 | | | | | | | $ | 651,702,777 | |
| | | | | | | | | | | | | | | | |
Undistributed (overdistributed) net investment income | | | | | | $ | (13,637 | ) | | | | | | $ | 231,258 | |
| | | | | | | | | | | | | | | | |
The accompanying notes are an integral part of these financial statements.
| | | | | | |
| Financial Highlights | | Wells Fargo Advantage Short-Term Bond Fund | | | 23 | |
(For a share outstanding throughout each period)
| | | | | | | | | | | | | | | | | | | | | | | | | | | | |
| | | Six Months Ended
February 29, 2012 (Unaudited) | | | Year Ended August 31, | | | Year Ended May 31, | |
| Class A | | | 2011 | | | 20101 | | | 2010 | | | 20092 | | | 20082 | | | 20072 | |
Net asset value, beginning of period | | $ | 8.76 | | | $ | 8.73 | | | $ | 8.66 | | | $ | 8.23 | | | $ | 8.38 | | | $ | 8.49 | | | $ | 8.47 | |
Net investment income | | | 0.07 | | | | 0.16 | | | | 0.05 | | | | 0.23 | | | | 0.32 | | | | 0.40 | | | | 0.40 | |
Net realized and unrealized gains (losses)
on investments | | | 0.01 | | | | 0.04 | | | | 0.07 | | | | 0.46 | | | | (0.15 | ) | | | (0.11 | ) | | | 0.03 | |
| | | | | | | | | | | | | | | | | | | | | | | | | | | | |
Total from investment operations | | | 0.08 | | | | 0.20 | | | | 0.12 | | | | 0.69 | | | | 0.17 | | | | 0.29 | | | | 0.43 | |
Distributions to shareholders from | | | | | | | | | | | | | | | | | | | | | | | | | | | | |
Net investment income | | | (0.08 | ) | | | (0.17 | ) | | | (0.05 | ) | | | (0.26 | ) | | | (0.32 | ) | | | (0.40 | ) | | | (0.41 | ) |
Net asset value, end of period | | $ | 8.76 | | | $ | 8.76 | | | $ | 8.73 | | | $ | 8.66 | | | $ | 8.23 | | | $ | 8.38 | | | $ | 8.49 | |
Total return3 | | | 0.89 | % | | | 2.33 | % | | | 1.37 | % | | | 8.43 | % | | | 2.14 | % | | | 3.50 | % | | | 5.18 | % |
Ratios to average net assets (annualized) | | | | | | | | | | | | | | | | | | | | | | | | | | | | |
Gross expenses | | | 0.89 | % | | | 0.89 | % | | | 0.89 | % | | | 0.93 | % | | | 0.95 | % | | | 1.09 | % | | | 1.10 | % |
Net expenses | | | 0.80 | % | | | 0.80 | % | | | 0.80 | % | | | 0.80 | % | | | 0.80 | % | | | 0.81 | % | | | 0.85 | % |
Net investment income | | | 1.72 | % | | | 1.84 | % | | | 2.05 | % | | | 2.64 | % | | | 3.86 | % | | | 4.69 | % | | | 4.77 | % |
Supplemental data | | | | | | | | | | | | | | | | | | | | | | | | | | | | |
Portfolio turnover rate | | | 17 | % | | | 51 | % | | | 11 | % | | | 45 | % | | | 50 | % | | | 47 | % | | | 38 | % |
Net assets, end of period (000’s omitted) | | | $53,111 | | | | $56,555 | | | | $47,121 | | | | $41,369 | | | | $16,456 | | | | $11,904 | | | | $6,938 | |
| 1. | For the three months ended August 31, 2010. The Fund changed its fiscal year end from May 31 to August 31, effective August 31, 2010. |
| 2. | On June 19, 2008, Advisor Class was renamed Class A. |
| 3. | Total return calculations do not include any sales charges. Returns for periods of less than one year are not annualized. |
The accompanying notes are an integral part of these financial statements.
| | | | |
| 24 | | Wells Fargo Advantage Short-Term Bond Fund | | Financial Highlights |
(For a share outstanding throughout each period)
| | | | | | | | | | | | | | | | | | | | | | | | |
| | | Six Months Ended
February 29, 2012 (Unaudited) | | | Year Ended August 31, | | | Year Ended May 31, | |
| Class C | | | 2011 | | | 20101 | | | 2010 | | | 2009 | | | 20082 | |
Net asset value, beginning of period | | $ | 8.75 | | | $ | 8.73 | | | $ | 8.65 | | | $ | 8.22 | | | $ | 8.37 | | | $ | 8.45 | |
Net investment income | | | 0.04 | | | | 0.10 | | | | 0.03 | | | | 0.16 | | | | 0.26 | | | | 0.05 | |
Net realized and unrealized gains (losses)
on investments | | | 0.01 | | | | 0.03 | | | | 0.08 | | | | 0.46 | | | | (0.15 | ) | | | (0.08 | ) |
| | | | | | | | | | | | | | | | | | | | | | | | |
Total from investment operations | | | 0.05 | | | | 0.13 | | | | 0.11 | | | | 0.62 | | | | 0.11 | | | | (0.03 | ) |
Distributions to shareholders from | | | | | | | | | | | | | | | | | | | | | | | | |
Net investment income | | | (0.05 | ) | | | (0.11 | ) | | | (0.03 | ) | | | (0.19 | ) | | | (0.26 | ) | | | (0.05 | ) |
Net asset value, end of period | | $ | 8.75 | | | $ | 8.75 | | | $ | 8.73 | | | $ | 8.65 | | | $ | 8.22 | | | $ | 8.37 | |
Total return3 | | | 0.52 | % | | | 1.45 | % | | | 1.29 | % | | | 7.61 | % | | | 1.35 | % | | | (0.37 | )% |
Ratios to average net assets (annualized) | | | | | | | | | | | | | | | | | | | | | | | | |
Gross expenses | | | 1.64 | % | | | 1.65 | % | | | 1.65 | % | | | 1.68 | % | | | 1.67 | % | | | 1.85 | % |
Net expenses | | | 1.55 | % | | | 1.55 | % | | | 1.55 | % | | | 1.55 | % | | | 1.53 | % | | | 1.58 | % |
Net investment income | | | 0.97 | % | | | 1.10 | % | | | 1.28 | % | | | 1.70 | % | | | 2.72 | % | | | 3.56 | % |
Supplemental data | | | | | | | | | | | | | | | | | | | | | | | | |
Portfolio turnover rate | | | 17 | % | | | 51 | % | | | 11 | % | | | 45 | % | | | 50 | % | | | 47 | % |
Net assets, end of period (000’s omitted) | | | $19,344 | | | | $19,510 | | | | $14,299 | | | | $11,050 | | | | $1,199 | | | | $10 | |
| 1. | For the three months ended August 31, 2010. The Fund changed its fiscal year end from May 31 to August 31, effective August 31, 2010. |
| 2. | For the period from March 31, 2008 (commencement of class operations) to May 31, 2008. |
| 3. | Total return calculations do not include any sales charges. Returns for periods of less than one year are not annualized. |
The accompanying notes are an integral part of these financial statements.
| | | | | | |
| Financial Highlights | | Wells Fargo Advantage Short-Term Bond Fund | | | 25 | |
(For a share outstanding throughout each period)
| | | | | | | | | | | | | | | | | | | | | | | | | | | | |
| | | Six Months Ended
February 29, 2012 (Unaudited) | | | Year Ended August 31, | | | Year May 31, | |
| Institutional Class | | | 2011 | | | 20101 | | | 2010 | | | 2009 | | | 2008 | | | 2007 | |
Net asset value, beginning of period | | $ | 8.77 | | | $ | 8.74 | | | $ | 8.66 | | | $ | 8.24 | | | $ | 8.39 | | | $ | 8.49 | | | $ | 8.48 | |
Net investment income | | | 0.09 | | | | 0.19 | | | | 0.06 | | | | 0.25 | | | | 0.35 | | | | 0.43 | | | | 0.44 | |
Net realized and unrealized gains (losses)
on investments | | | (0.01 | ) | | | 0.04 | | | | 0.08 | | | | 0.45 | | | | (0.15 | ) | | | (0.10 | ) | | | 0.01 | |
| | | | | | | | | | | | | | | | | | | | | | | | | | | | |
Total from investment operations | | | 0.08 | | | | 0.23 | | | | 0.14 | | | | 0.70 | | | | 0.20 | | | | 0.33 | | | | 0.45 | |
Distributions to shareholders from | | | | | | | | | | | | | | | | | | | | | | | | | | | | |
Net investment income | | | (0.09 | ) | | | (0.20 | ) | | | (0.06 | ) | | | (0.28 | ) | | | (0.35 | ) | | | (0.43 | ) | | | (0.44 | ) |
Net asset value, end of period | | $ | 8.76 | | | $ | 8.77 | | | $ | 8.74 | | | $ | 8.66 | | | $ | 8.24 | | | $ | 8.39 | | | $ | 8.49 | |
Total return2 | | | 0.94 | % | | | 2.66 | % | | | 1.57 | % | | | 8.65 | % | | | 2.47 | % | | | 3.97 | % | | | 5.45 | % |
Ratios to average net assets (annualized) | | | | | | | | | | | | | | | | | | | | | | | | | | | | |
Gross expenses | | | 0.56 | % | | | 0.56 | % | | | 0.56 | % | | | 0.58 | % | | | 0.59 | % | | | 0.64 | % | | | 0.65 | % |
Net expenses | | | 0.48 | % | | | 0.48 | % | | | 0.48 | % | | | 0.48 | % | | | 0.48 | % | | | 0.48 | % | | | 0.48 | % |
Net investment income | | | 2.03 | % | | | 2.17 | % | | | 2.38 | % | | | 2.84 | % | | | 4.22 | % | | | 5.08 | % | | | 5.14 | % |
Supplemental data | | | | | | | | | | | | | | | | | | | | | | | | | | | | |
Portfolio turnover rate | | | 17 | % | | | 51 | % | | | 11 | % | | | 45 | % | | | 50 | % | | | 47 | % | | | 38 | % |
Net assets, end of period (000’s omitted) | | | $321,092 | | | | $327,124 | | | | $292,080 | | | | $285,559 | | | | $77,900 | | | | $87,101 | | | | $80,153 | |
| 1. | For the three months ended August 31, 2010. The Fund changed its fiscal year end from May 31 to August 31, effective August 31, 2010. |
| 2. | Returns for periods of less than one year are not annualized. |
The accompanying notes are an integral part of these financial statements.
| | | | |
| 26 | | Wells Fargo Advantage Short-Term Bond Fund | | Financial Highlights |
(For a share outstanding throughout each period)
| | | | | | | | | | | | | | | | | | | | | | | | | | | | |
| | | Six Months Ended
February 29, 2012 (Unaudited) | | | Year Ended August 31, | | | Year Ended May 31 | |
| Investor Class | | | 2011 | | | 20101 | | | 2010 | | | 2009 | | | 2008 | | | 2007 | |
Net asset value, beginning of period | | $ | 8.76 | | | $ | 8.73 | | | $ | 8.66 | | | $ | 8.23 | | | $ | 8.38 | | | $ | 8.48 | | | $ | 8.47 | |
Net investment income | | | 0.07 | | | | 0.16 | | | | 0.05 | | | | 0.23 | | | | 0.32 | | | | 0.40 | | | | 0.40 | |
Net realized and unrealized gains (losses)
on investments | | | 0.00 | | | | 0.04 | | | | 0.07 | | | | 0.45 | | | | (0.15 | ) | | | (0.10 | ) | | | 0.02 | |
| | | | | | | | | | | | | | | | | | | | | | | | | | | | |
Total from investment operations | | | 0.07 | | | | 0.20 | | | | 0.12 | | | | 0.68 | | | | 0.17 | | | | 0.30 | | | | 0.42 | |
Distributions to shareholders from | | | | | | | | | | | | | | | | | | | | | | | | | | | | |
Net investment income | | | (0.08 | ) | | | (0.17 | ) | | | (0.05 | ) | | | (0.25 | ) | | | (0.32 | ) | | | (0.40 | ) | | | (0.41 | ) |
Net asset value, end of period | | $ | 8.75 | | | $ | 8.76 | | | $ | 8.73 | | | $ | 8.66 | | | $ | 8.23 | | | $ | 8.38 | | | $ | 8.48 | |
Total return2 | | | 0.76 | % | | | 2.30 | % | | | 1.36 | % | | | 8.38 | % | | | 2.09 | % | | | 3.57 | % | | | 5.01 | % |
Ratios to average net assets (annualized) | | | | | | | | | | | | | | | | | | | | | | | | | | | | |
Gross expenses | | | 0.92 | % | | | 0.92 | % | | | 0.94 | % | | | 0.99 | % | | | 0.99 | % | | | 1.23 | % | | | 1.27 | % |
Net expenses | | | 0.83 | % | | | 0.83 | % | | | 0.84 | % | | | 0.85 | % | | | 0.85 | % | | | 0.87 | % | | | 0.90 | % |
Net investment income | | | 1.69 | % | | | 1.82 | % | | | 2.02 | % | | | 2.73 | % | | | 3.87 | % | | | 4.70 | % | | | 4.71 | % |
Supplemental data | | | | | | | | | | | | | | | | | | | | | | | | | | | | |
Portfolio turnover rate | | | 17 | % | | | 51 | % | | | 11 | % | | | 45 | % | | | 50 | % | | | 47 | % | | | 38 | % |
Net assets, end of period (000’s omitted) | | | $252,403 | | | | $248,514 | | | | $266,746 | | | | $267,625 | | | | $250,572 | | | | $268,790 | | | | $299,346 | |
| 1. | For the three months ended August 31, 2010. The Fund changed its fiscal year end from May 31 to August 31, effective August 31, 2010. |
| 2. | Returns for periods of less than one year are not annualized. |
The accompanying notes are an integral part of these financial statements.
| | | | | | |
| Notes to Financial Statements (Unaudited) | | Wells Fargo Advantage Short-Term Bond Fund | | | 27 | |
1. ORGANIZATION
Wells Fargo Funds Trust (the “Trust”), a Delaware statutory trust organized on March 10, 1999, is an open-end management investment company registered under the Investment Company Act of 1940, as amended (the “1940 Act”). These financial statements report on Wells Fargo Advantage Short-Term Bond Fund (the “Fund”) which is a diversified series of the Trust.
2. SIGNIFICANT ACCOUNTING POLICIES
The following significant accounting policies, which are consistently followed in the preparation of the financial statements of the Fund, are in conformity with U.S. generally accepted accounting principles which require management to make estimates and assumptions that affect the reported amounts of assets and liabilities, disclosure of contingent assets and liabilities at the date of the financial statements, and the reported amounts of revenues and expenses during the reporting period. Actual results could differ from those estimates.
Securities valuation
Fixed income securities with original maturities exceeding 60 days are valued based on available evaluated prices received from an independent pricing service approved by the Board of Trustees which may utilize both transaction data and market information such as yield, prices of securities of comparable quality, coupon rate, maturity, type of issue, trading characteristics and other market data. If valuations are not available from the pricing service or values received are deemed not representative of market value, values will be obtained from a third party broker-dealer or determined based on the Fund’s Fair Value Procedures.
Debt securities of sufficient credit quality with original maturities of 60 days or less generally are valued at amortized cost which approximates fair value. The amortized cost method involves valuing a security at its cost, plus accretion of discount or minus amortization of premium over the period until maturity.
Investments in equity securities are valued each business day as of the close of regular trading on the New York Stock Exchange, which is usually 4:00 p.m. (Eastern Time). Securities which are traded on a national or foreign securities exchange are valued at the last reported sales price, except that securities listed on The Nasdaq Stock Market, Inc. (“Nasdaq”) are valued at the Nasdaq Official Closing Price (“NOCP”), and if no NOCP is available, then at the last reported sales price. If no sales price is shown on the Nasdaq, the bid price will be used. In the absence of any sale of securities listed on the Nasdaq, and in the case of other securities (including U.S. Government obligations, but excluding debt securities maturing in 60 days or less), the price will be deemed “stale” and the valuations will be determined in accordance with the Fund’s Fair Value Procedures.
Investments in open-end mutual funds and non-registered investment companies are generally valued at net asset value.
Investments which are not valued using any of the methods discussed above, are valued at their fair value, as determined by procedures established in good faith and approved by the Board of Trustees.
Security loans
The Fund may lend its securities from time to time in order to earn additional income in the form of fees or interest on securities received as collateral or the investment of any cash received as collateral. The Fund continues to receive interest or dividends on the securities loaned. The Fund receives collateral in the form of cash or securities with a value at least equal to the value of the securities on loan. The value of the loaned securities is determined at the close of each business day and any additional required collateral is delivered to the Fund on the next business day. In a securities lending transaction, the net asset value of the Fund will be affected by an increase or decrease in the value of the securities loaned and by an increase or decrease in the value of the instrument in which collateral is invested. The amount of securities lending activity undertaken by the Fund fluctuates from time to time. In the event of default or bankruptcy by the borrower, the Fund may be prevented from recovering the loaned securities or gaining access to the collateral or may experience delays or costs in doing so. In addition, the investment of any cash collateral received may lose all or part of its value. The Fund has the right under the lending agreement to recover the securities from the borrower on demand.
The Fund lends its securities through an unaffiliated securities lending agent. Cash collateral received in connection with its securities lending transactions is invested in Wells Fargo Securities Lending Cash Investments, LLC (the “Cash Collateral Fund”). The Cash Collateral Fund is exempt from registration under Section 3(c)(7) of the 1940 Act and is managed by
| | | | |
| 28 | | Wells Fargo Advantage Short-Term Bond Fund | | Notes to Financial Statements (Unaudited) |
Wells Fargo Funds Management LLC (“Funds Management”) and is sub-advised by Wells Capital Management Incorporated (“Wells Capital Management”). Funds Management receives an advisory fee starting at 0.05% and declining to 0.01% as the average daily net assets of the Cash Collateral Fund increase. All of the fees received by Funds Management are paid to Wells Capital Management for its services as sub-adviser. The Cash Collateral Fund seeks to provide a positive return compared to the daily Fed Funds Open rate by investing in high-quality, U.S. dollar-denominated short-term money market instruments. Cash Collateral Fund investments are fair valued based upon the amortized cost valuation technique. Income earned from investment in the Cash Collateral Fund is included in securities lending income on the Statement of Operations.
For Wells Fargo Advantage Funds that participated in securities lending activity prior to February 13, 2009, certain structured investment vehicles purchased in a joint account by the former securities lending agent defaulted or were impaired. Certain of the Wells Fargo Advantage Funds still hold ownership interest in these structured investment vehicles, which have since been restructured as pass-through securities. If the Fund holds an ownership interest in such pass-through securities, information regarding this ownership interest can be found in the Portfolio of Investments under the category “Other”.
When-issued transactions
The Fund may purchase securities on a forward commitment or ‘when-issued’ basis. The Fund records a when-issued transaction on the trade date and will segregate assets to cover its obligation by confirming the availability of qualifying assets having a value sufficient to make payment for the securities purchased. Securities purchased on a when-issued basis are marked-to-market daily and the Fund begins earning interest on the settlement date. Losses may arise due to changes in the market value of the underlying securities or if the counterparty does not perform under the contract.
Term loans
The Fund may invest in term loans. The loans are marked-to-market daily and the Fund begins earning interest when the loans are funded. The loans pay interest at rates which are periodically reset by reference to a base lending rate plus a spread. The Fund assumes the credit risk of the borrower and there could be potential loss to the Fund in the event of default by the borrower.
Futures contracts
The Fund may be subject to interest rate risk in the normal course of pursuing its investment objectives. The Fund may buy and sell futures contracts in order to gain exposure to, or protect against, changes in security values and interest rates. The primary risks associated with the use of futures contracts are the imperfect correlation between changes in market values of securities held by the Fund and the prices of futures contracts, and the possibility of an illiquid market.
Futures contracts are valued based upon their quoted daily settlement prices when available. The aggregate principal amounts of the contracts are not recorded in the financial statements. Fluctuations in the value of the contracts are recorded in the Statement of Assets and Liabilities as an asset or liability and in the Statement of Operations as unrealized gains or losses until the contracts are closed, at which point they are recorded as net realized gains or losses on futures contracts. With futures contracts, there is minimal counterparty risk to the Fund since futures are exchange traded and the exchange’s clearinghouse, as counterparty to all exchange traded futures, guarantees the futures against default.
Security transactions and income recognition
Securities transactions are recorded on a trade date basis. Realized gains or losses are reported on the basis of identified cost of securities delivered.
Interest income is accrued daily and bond discounts are accreted and premiums are amortized daily based on the effective interest method. To the extent debt obligations are placed on non-accrual status, any related interest income may be reduced by writing off interest receivables when the collection of all or a portion of interest has become doubtful based on consistently applied procedures. If the issuer subsequently resumes interest payments or when the collectability of interest is reasonably assured, the debt obligation is removed from non-accrual status.
Dividend income is recognized on the ex-dividend date.
| | | | | | |
| Notes to Financial Statements (Unaudited) | | Wells Fargo Advantage Short-Term Bond Fund | | | 29 | |
Distributions to shareholders
Distributions to shareholders from net investment income are accrued daily and paid monthly. Distributions from net realized gains, if any, are recorded on the ex-dividend date. Such distributions are determined in conformity with income tax regulations, which may differ from generally accepted accounting principles.
Federal and other taxes
The Fund intends to continue to qualify as a regulated investment company by distributing substantially all of its investment company taxable income and any net realized capital gains (after reduction for capital loss carryforwards) sufficient to relieve it from all, or substantially all, federal income taxes. Accordingly, no provision for federal income taxes was required.
The Fund’s income and federal excise tax returns and all financial records supporting those returns for the prior three fiscal years are subject to examination by the federal and Delaware revenue authorities.
Under the recently enacted Regulated Investment Company Modernization Act of 2010, the Fund is permitted to carry forward capital losses incurred in taxable years which began after December 22, 2010 for an unlimited period. However, any losses incurred are required to be utilized prior to the losses incurred in pre-enactment taxable years. As a result of this ordering rule, pre-enactment capital loss carryforwards may be more likely to expire unused. Additionally, post-enactment capital losses that are carried forward will retain their character as either short-term or long-term capital losses rather than being considered all short-term as under previous law.
As of August 31, 2011, the Fund had net capital loss carryforwards, which were available to offset future net realized capital gains, in the amount of $72,329 expiring in 2014.
Class allocations
The separate classes of shares offered by the Fund differ principally in applicable sales charges, distribution, shareholder servicing and administration fees. Shareholders of each class bear certain expenses that pertain to that particular class. All shareholders bear the common expenses of the Fund, earn income from the portfolio, and are allocated unrealized gains and losses pro rata based on the average daily net assets of each class, without distinction between share classes. Dividends are determined separately for each class based on income and expenses allocable to each class. Realized gains and losses are allocated to each class pro rata based upon the net assets of each class on the date realized. Differences in per share dividend rates generally result from the relative weightings of pro rata income and realized gain allocations and from differences in separate class expenses, including distribution, shareholder servicing and administration fees.
3. FAIR VALUATION MEASUREMENTS
Fair value measurements of investments are determined within a framework that has established a fair value hierarchy based upon the various data inputs utilized in determining the value of the Fund’s investments. The three-level hierarchy gives the highest priority to unadjusted quoted prices in active markets for identical assets or liabilities (Level 1) and the lowest priority to significant unobservable inputs (Level 3). The Fund’s investments are classified within the fair value hierarchy based on the lowest level of input that is significant to the fair value measurement. The inputs are summarized into three broad levels as follows:
| n | | Level 1 – quoted prices in active markets for identical securities |
| n | | Level 2 – other significant observable inputs (including quoted prices for similar securities, interest rates, prepayment speeds, credit risk, etc.) |
| n | | Level 3 – significant unobservable inputs (including the Fund’s own assumptions in determining the fair value of investments) |
The inputs or methodologies used for valuing securities are not necessarily an indication of the risk associated with investing in those securities.
| | | | |
| 30 | | Wells Fargo Advantage Short-Term Bond Fund | | Notes to Financial Statements (Unaudited) |
As of February 29, 2012, the inputs used in valuing the Fund’s assets, which are carried at fair value, were as follows:
| | | | | | | | | | | | | | | | |
| Investments in Securities | | Quoted Prices (Level 1) | | | Significant Other
Observable Inputs (Level 2) | | | Significant Unobservable Inputs (Level 3) | | | Total | |
| | | | |
Agency securities | | $ | 0 | | | $ | 55,572,235 | | | $ | 4,244 | | | $ | 55,576,479 | |
| | | | |
Asset-backed securities | | | 0 | | | | 62,532,036 | | | | 1,323 | | | | 62,533,359 | |
| | | | |
Corporate bonds and notes | | | 0 | | | | 296,483,695 | | | | 0 | | | | 296,483,695 | |
| | | | |
Equity securities | | | | | | | | | | | | | | | | |
Preferred stocks | | | 0 | | | | 1,622,504 | | | | 0 | | | | 1,622,504 | |
| | | | |
Municipal bonds and notes | | | 0 | | | | 34,478,854 | | | | 0 | | | | 34,478,854 | |
| | | | |
Non-agency mortgage back securities | | | 0 | | | | 42,683,861 | | | | 0 | | | | 42,683,861 | |
| | | | |
U.S Treasury securities | | | 13,336,828 | | | | 0 | | | | 0 | | | | 13,336,828 | |
| | | | |
Yankee corporate bonds and notes | | | 0 | | | | 115,742,954 | | | | 0 | | | | 115,742,954 | |
| | | | |
Other | | | 0 | | | | 0 | | | | 506,619 | | | | 506,619 | |
| | | | |
Short-term investments | | | | | | | | | | | | | | | | |
Investment companies | | | 21,118,512 | | | | 12,951,391 | | | | 0 | | | | 34,069,903 | |
U.S. Treasury securities | | | 299,981 | | | | 0 | | | | 0 | | | | 299,981 | |
| | | $ | 34,755,321 | | | $ | 622,067,530 | | | $ | 512,186 | | | $ | 657,335,037 | |
Further details on the major security types listed above can be found in the Portfolio of Investments.
As of February 29, 2012, the inputs used in valuing the Fund’s other financial instruments, which are carried at fair value, were as follows:
| | | | | | | | | | | | | | | | |
| Other financial instruments | | Quoted Prices (Level 1) | | | Significant Other
Observable Inputs (Level 2) | | | Significant Unobservable Inputs (Level 3) | | | Total | |
Futures contracts+ | | $ | (6,667 | ) | | $ | 0 | | | $ | 0 | | | $ | (6,667 | ) |
| + | Futures contracts are presented at the unrealized gains or losses on the instrument. |
Transfers in and transfers out are recognized at the end of the reporting period. For the six months ended February 29, 2012, the Fund did not have any significant transfers into/out of Level 1 and Level 2.
The following is a reconciliation of assets in which significant unobservable inputs (Level 3) were used in determining fair value:
| | | | | | | | | | | | | | | | | | | | | | | | |
| | | Agency
securities | | | Asset-
backed
securities | | | Corporate
bonds and
notes | | | Non-agency
mortgage
back
securities | | | Other | | | Total | |
Balance as of August 31, 2011 | | $ | 112,644 | | | $ | 13,509 | | | $ | 1,636,231 | | | $ | 1,922,151 | | | $ | 691,965 | | | $ | 4,376,500 | |
Accrued discounts (premiums) | | | 27 | | | | 0 | | | | (9,902 | ) | | | (6 | ) | | | 0 | | | | (9,881 | ) |
Realized gains (losses) | | | (76,491 | ) | | | (302,764 | ) | | | (261 | ) | | | (2,931 | ) | | | 0 | | | | (382,447 | ) |
Change in unrealized gains (losses) | | | 75,027 | | | | 142,326 | | | | (29,746 | ) | | | 9,919 | | | | (105,823 | ) | | | 91,703 | |
Purchases | | | 0 | | | | 148,252 | | | | 0 | | | | 0 | | | | 0 | | | | 148,252 | |
Sales | | | (106,579 | ) | | | 0 | | | | (1,596,322 | ) | | | (941,132 | ) | | | (79,523 | ) | | | (2,723,556 | ) |
Transfer into Level 3 | | | 0 | | | | 0 | | | | 0 | | | | 0 | | | | 0 | | | | 0 | |
Transfer out of Level 3 | | | (384 | ) | | | 0 | | | | 0 | | | | (988,001 | ) | | | 0 | | | | (988,385 | ) |
Balance as of February 29, 2012 | | $ | 4,244 | | | $ | 1,323 | | | $ | 0 | | | $ | 0 | | | $ | 506,619 | | | $ | 512,186 | |
Change in unrealized gains (losses) relating to securities still held at February 29, 2012 | | $ | (983 | ) | | $ | (148,206 | ) | | $ | 0 | | | $ | 0 | | | $ | (144,797 | ) | | $ | (293,986 | ) |
Transfers out of Level 3 into Level 2 are due to the availability of significant observable inputs which are currently used in the determination of the fair value of the securities.
| | | | | | |
| Notes to Financial Statements (Unaudited) | | Wells Fargo Advantage Short-Term Bond Fund | | | 31 | |
4. TRANSACTIONS WITH AFFILIATES AND OTHER EXPENSES
Advisory fee
The Trust has entered into an advisory contract with Funds Management, an indirect wholly owned subsidiary of Wells Fargo & Company (“Wells Fargo”). The adviser is responsible for implementing investment policies and guidelines and for supervising the sub-adviser, who is responsible for day-to-day portfolio management of the Fund.
Pursuant to the contract, Funds Management is entitled to receive an annual advisory fee starting at 0.40% and declining to 0.30% as the average daily net assets of the Fund increase. For the six months ended February 29, 2012, the advisory fee was equivalent to an annual rate of 0.39% of the Fund’s average daily net assets.
Funds Management has retained the services of certain sub-advisers to provide daily portfolio management to the Fund. The fees related to sub-advisory services are borne directly by Funds Management and do not increase the overall fees paid by the Fund. Wells Capital Management, an affiliate of Funds Management, is the sub-adviser to the Fund and is entitled to receive a fee from Funds Management at an annual rate starting at 0.15% and declining to 0.05% as the average daily net assets of the Fund increase.
Administration and transfer agent fees
The Trust has entered into an administration agreement with Funds Management. Under this agreement, for providing administrative services, which includes paying fees and expenses for services provided by the transfer agent, sub-transfer agents, omnibus account servicers and record-keepers, Funds Management is entitled to receive from the Fund an annual fund level administration fee starting at 0.05% and declining to 0.03% as the average daily net assets of the Fund increase and a class level administration fee which is calculated based on the average daily net assets of each class as follows:
| | | | |
| | | Class Level Administration Fee | |
Class A, Class C | | | 0.16 | % |
Institutional Class | | | 0.08 | |
Investor Class | | | 0.19 | |
Funds Management has contractually waived and/or reimbursed advisory and administration fees to the extent necessary to maintain certain net operating expense ratios for the Fund. Waiver of fees and/or reimbursement of expenses by Funds Management were made first from fund level expenses on a proportionate basis and then from class specific expenses. Funds Management has committed through December 31, 2012, to waive fees and/or reimburse expenses to the extent necessary to cap the Fund’s expenses at 0.80% for Class A, 1.55% for Class C, 0.48% for Institutional Class and 0.83% for Investor Class.
Distribution fees
The Trust has adopted a Distribution Plan for Class C shares of the Fund pursuant to Rule 12b-1 under the 1940 Act. Distribution fees are charged to Class C shares and paid to Wells Fargo Funds Distributor, LLC, the principal underwriter, at an annual rate of 0.75% of its average daily net assets.
For the six months ended February 29, 2012, Wells Fargo Funds Distributor, LLC received $1,935 from the sale of Class A shares and $20 and $495 in contingent deferred sales charges from redemptions of Class A and Class C shares, respectively.
Shareholder servicing fees
The Trust has entered into contracts with one or more shareholder servicing agents, whereby Class A, Class C and Investor Class of the Fund is charged a fee at an annual rate of 0.25% of the average daily net assets of each respective class.
A portion of these total shareholder servicing fees were paid to affiliates of Wells Fargo.
| | | | |
| 32 | | Wells Fargo Advantage Short-Term Bond Fund | | Notes to Financial Statements (Unaudited) |
5. INVESTMENT PORTFOLIO TRANSACTIONS
Purchases and sales of investments, excluding short-term securities (securities with maturities of one year or less at purchase date), for the six months ended February 29, 2012 were as follows:
| | | | | | | | | | | | | | |
| Purchases at Cost | | | Sales Proceeds | |
| U.S. Government | | | Non-U.S. Government | | | U.S. Government | | | Non-U.S. Government | |
| $ | 23,644,221 | | | $ | 110,510,456 | | | $ | 12,511,523 | | | $ | 89,256,946 | |
6. DERIVATIVE TRANSACTIONS
During the six months ended February 29, 2012, the Fund entered into futures contracts for speculate on interest rates.
At February 29, 2012, the Fund had long/short futures contracts outstanding as follows:
| | | | | | | | | | | | | | | | | | |
| Expiration Date | | | Contracts | | | Type | | | Contract
Value at
February 29, 2012 | | | Net
Unrealized
Gains (Losses) | |
| | June 2012 | | | | 371 Long | | | | 2-Year U.S. Treasury Notes | | | $ | 81,706,954 | | | $ | (6,502 | ) |
| | June 2012 | | | | 17 Short | | | | 5-Year U.S. Treasury Notes | | | | 2,093,922 | | | | (165 | ) |
The Fund had an average notional amount of $74,406,170 in long futures contracts and $4,619,930 in short futures contracts during the six months ended February 29, 2012.
On February 29, 2012, the cumulative unrealized losses on futures contracts in the amount of $6,667 are reflected in net unrealized losses on investments on the Statement of Assets and Liabilities. The payable for daily variation margin on open futures contracts reflected in the Statement of Assets and Liabilities only represents the current day’s variation margin. The realized losses and change in unrealized gains (losses) on futures contracts are reflected in the Statement of Operations.
7. BANK BORROWINGS
The Trust (excluding the money market funds) and Wells Fargo Variable Trust are parties to a $150,000,000 revolving credit agreement with State Street Bank and Trust Company, whereby the Fund is permitted to use bank borrowings for temporary or emergency purposes, such as to fund shareholder redemption requests. Interest under the credit agreement is charged to the Fund based on a borrowing rate equal to the higher of the Federal Funds rate in effect on that day plus 1.25% or the overnight LIBOR rate in effect on that day plus 1.25%. In addition, an annual commitment fee equal to 0.10% of the unused balance is allocated to each participating fund. Prior to September 6, 2011, the revolving credit agreement was for $125,000,000 and the annual commitment fee was equal 0.125% of the unused balance. For the six months ended February 29, 2012, the Fund paid $489 in commitment fees.
For the six months ended February 29, 2012, there were no borrowings by the Fund under the agreement.
8. INDEMNIFICATION
Under the Trust’s organizational documents, the officers and directors are indemnified against certain liabilities that may arise out of performance of their duties to the Trust. Additionally, in the normal course of business, the Trust may enter into contracts with service providers that contain a variety of indemnification clauses. The Trust’s maximum exposure under these arrangements is dependent on future claims that may be made against the Fund and, therefore, cannot be estimated.
9. NEW ACCOUNTING PRONOUNCEMENTS
In May 2011, the Financial Accounting Standards Board (“FASB”) issued Accounting Standards Update (“ASU”) No. 2011-04 “Amendments to Achieve Common Fair Value Measurement and Disclosure Requirements in U.S. GAAP and IFRSs”. ASU No. 2011-04 amends FASB ASC Topic 820, Fair Value Measurements and Disclosures, to establish common requirements for measuring fair value and for disclosing information about fair value measurements in accordance with GAAP. The ASU is effective prospectively for interim and annual periods beginning after December 15, 2011. Management expects that adoption of the ASU will result in additional disclosures in the financial statements, as applicable.
| | | | | | |
| Notes to Financial Statements (Unaudited) | | Wells Fargo Advantage Short-Term Bond Fund | | | 33 | |
In April 2011, FASB issued ASU No. 2011-03 “Reconsideration of Effective Control for Repurchase Agreements”. ASU No. 2011-03 amends FASB ASC Topic 860, Transfers and Servicing, specifically the criteria required to determine whether a repurchase agreement (repo) and similar agreements should be accounted for as sales of financial assets or secured borrowings with commitments. ASU No. 2011-03 changes the assessment of effective control by focusing on the transferor’s contractual rights and obligations and removing the criterion to assess its ability to exercise those rights or honor those obligations. This could result in changes to the way entities account for certain transactions including repurchase agreements, mortgage dollar rolls and reverse repurchase agreements. The ASU will become effective on a prospective basis for new transfers and modifications to existing transactions as of the beginning of the first interim or annual period beginning on or after December 15, 2011. Management has evaluated the impact of adopting the ASU and expects no significant changes.
| | | | |
| 34 | | Wells Fargo Advantage Short-Term Bond Fund | | Other Information (Unaudited) |
PROXY VOTING INFORMATION
A description of the policies and procedures that the Fund uses to determine how to vote proxies relating to portfolio securities is available without charge, upon request, by calling 1-800-222-8222, visiting our Web site at wellsfargoadvantagefunds.com, or visiting the SEC Web site at sec.gov. Information regarding how the Fund voted proxies relating to portfolio securities during the most recent 12-month period ended June 30 is available without charge on the Fund’s Web site at wellsfargoadvantagefunds.com or by visiting the SEC Web site at sec.gov.
PORTFOLIO HOLDINGS INFORMATION
The complete portfolio holdings for the Fund are publicly available on the Fund’s Web site (wellsfargoadvantagefunds.com) on a monthly, 30-day or more delayed basis. In addition, top ten holdings information for the Fund is publicly available on the Fund’s Web site on a monthly, seven-day or more delayed basis. The Fund files its complete schedule of portfolio holdings with the SEC for the first and third quarters of each fiscal year on Form N-Q, which is available without charge by visiting the SEC Web site at sec.gov. In addition, the Fund’s Form N-Q may be reviewed and copied at the SEC’s Public Reference Room in Washington, DC, and at regional offices in New York City, at 233 Broadway, and in Chicago, at 175 West Jackson Boulevard, Suite 900. Information about the Public Reference Room may be obtained by calling 1-800-SEC-0330.
| | | | | | |
| Other Information (Unaudited) | | Wells Fargo Advantage Short-Term Bond Fund | | | 35 | |
BOARD OF TRUSTEES
The following table provides basic information about the Board of Trustees (the “Trustees”) of the Trust and Officers of the Trust. This table should be read in conjunction with the Prospectus and the Statement of Additional Information1 of the Fund. Each of the Trustees and Officers listed below acts in identical capacities for the Wells Fargo Advantage family of funds, which consists of 137 funds comprising the Wells Fargo Funds Trust, Wells Fargo Variable Trust, Wells Fargo Master Trust and four closed-end funds (collectively the “Fund Complex”). All of the Trustees are also Members of the Audit and Governance Committees of each Trust in the Fund Complex. The mailing address of each Trustee and Officer is 525 Market Street, 12th Floor, San Francisco, CA 94105. Each Trustee and Officer serves an indefinite term, however, each Trustee serves such term until reaching the mandatory retirement age established by the Trustees.
Independent Trustees
| | | | | | |
Name and Year of Birth | | Position Held and Length of Service | | Principal Occupations During Past Five Years | | Other Directorships During
Past Five Years |
Peter G. Gordon
(Born 1942) | | Trustee, since 1998; Chairman, since 2005 (Lead Trustee since 2001) | | Co-Founder, Retired Chairman, President and CEO of Crystal Geyser Water Company. Trustee Emeritus, Colby College | | Asset Allocation Trust |
Isaiah Harris, Jr.
(Born 1952) | | Trustee, since 2009 | | Retired. Prior thereto, President and CEO of BellSouth Advertising and Publishing Corp. from 2005 to 2007, President and CEO of BellSouth Enterprises from 2004 to 2005 and President of BellSouth Consumer Services from 2000 to 2003. Emeritus member of the Iowa State University Foundation Board of Governors. Emeritus Member of the Advisory Board of Iowa State University School of Business. Mr. Harris is a certified public accountant. | | CIGNA Corporation; Deluxe Corporation; Asset Allocation Trust |
Judith M. Johnson
(Born 1949) | | Trustee, since 2008 | | Retired. Prior thereto, Chief Executive Officer and Chief Investment Officer of Minneapolis Employees Retirement Fund from 1996 to 2008. Ms. Johnson is an attorney, certified public accountant and a certified managerial accountant. | | Asset Allocation Trust |
Leroy Keith, Jr.
(Born 1939) | | Trustee, since 2010 | | Chairman, Bloc Global Services (development and construction). Trustee of the Evergreen Funds from 1983 to 2010. Former Managing Director, Almanac Capital Management (commodities firm), former Partner, Stonington Partners, Inc. (private equity fund), former Director, Obagi Medical Products Co. and former Director, Lincoln Educational Services. | | Trustee, Virtus Fund Complex (consisting of 40 portfolios as of 12/31/11); Asset Allocation Trust |
David F. Larcker
(Born 1950) | | Trustee, since 2009 | | James Irvin Miller Professor of Accounting at the Graduate School of Business, Stanford University, Director of Corporate Governance Research Program and Senior Faculty of The Rock Center for Corporate Governance since 2006. From 2005 to 2008, Professor of Accounting at the Graduate School of Business, Stanford University. Prior thereto, Ernst & Young Professor of Accounting at The Wharton School, University of Pennsylvania from 1985 to 2005. | | Asset Allocation Trust |
Olivia S. Mitchell
(Born 1953) | | Trustee, since 2006 | | International Foundation of Employee Benefit Plans Professor, Wharton School of the University of Pennsylvania since 1993. Director of Wharton’s Pension Research Council and Boettner Center on Pensions & Retirement Research, and Research Associate at the National Bureau of Economic Research. Previously, Cornell University Professor from 1978 to 1993. | | Asset Allocation Trust |
| | | | |
| 36 | | Wells Fargo Advantage Short-Term Bond Fund | | Other Information (Unaudited) |
| | | | | | |
Name and Year of Birth | | Position Held and Length of Service | | Principal Occupations During Past Five Years | | Other Directorships During
Past Five Years |
Timothy J. Penny
(Born 1951) | | Trustee, since 1996 | | President and CEO of Southern Minnesota Initiative Foundation, a non-profit organization, since 2007 and Senior Fellow at the Humphrey Institute Policy Forum at the University of Minnesota since 1995. Member of the Board of Trustees of NorthStar Education Finance, Inc., a non-profit organization, since 2007. | | Asset Allocation Trust |
Michael S. Scofield
(Born 1943) | | Trustee, since 2010 | | Served on the Investment Company Institute’s Board of Governors and Executive Committee from 2008-2011 as well the Governing Council of the Independent Directors Council from 2006-2011 and the Independent Directors Council Executive Committee from 2008-2011. Chairman of the IDC from 2008-2010. Institutional Investor (Fund Directions) Trustee of Year in 2007. Trustee of the Evergreen Funds (and its predecessors) from 1984 to 2010. Chairman of the Evergreen Funds from 2000-2010. Former Trustee of the Mentor Funds. Retired Attorney, Law Offices of Michael S. Scofield and former Director and Chairman, Branded Media Corporation (multi-media branding company). | | Asset Allocation Trust |
Donald C. Willeke
(Born 1940) | | Trustee, since 1996 | | Principal of the law firm of Willeke & Daniels. General Counsel of the Minneapolis Employees Retirement Fund from 1984 until its consolidation into the Minnesota Public Employees Retirement Association on June 30, 2010. Director and Vice Chair of The Free Trust (non-profit corporation). Director of the American Chestnut Foundation (non-profit corporation). | | Asset Allocation Trust |
Officers
| | | | | | |
Name and Year of Birth | | Position Held and
Length of Service | | Principal Occupations During Past Five Years | | |
Karla M. Rabusch
(Born 1959) | | President, since 2003 | | Executive Vice President of Wells Fargo Bank, N.A. and President of Wells Fargo Funds Management, LLC since 2003. Senior Vice President and Chief Administrative Officer of Wells Fargo Funds Management, LLC from 2001 to 2003. | | |
C. David Messman
(Born 1960) | | Secretary, since 2000; Chief Legal Counsel, since 2003 | | Senior Vice President and Secretary of Wells Fargo Funds Management, LLC since 2001. Vice President and Managing Senior Counsel of Wells Fargo Bank, N.A. since 1996. | | |
Kasey Phillips
(Born 1970) | | Treasurer, since 2009 | | Senior Vice President of Wells Fargo Funds Management, LLC since 2009. Senior Vice President of Evergreen Investment Management Company, LLC from 2006 to 2010. Treasurer of the Evergreen Funds from 2005 to 2010. | | |
David Berardi
(Born 1975) | | Assistant Treasurer, since 2009 | | Vice President of Wells Fargo Funds Management, LLC since 2009. Vice President of Evergreen Investment Management Company, LLC from 2008 to 2010. Assistant Vice President of Evergreen Investment Services, Inc. from 2004 to 2008. Manager of Fund Reporting and Control for Evergreen Investment Management Company, LLC from 2004 to 2010. | | |
Jeremy DePalma
(Born 1974) | | Assistant Treasurer, since 2009 | | Senior Vice President of Wells Fargo Funds Management, LLC since 2009. Senior Vice President of Evergreen Investment Management Company, LLC from 2008 to 2010. Vice President, Evergreen Investment Services, Inc. from 2004 to 2007. Head of the Fund Reporting and Control Team within Fund Administration from 2005 to 2010. | | |
Debra Ann Early
(Born 1964) | | Chief Compliance Officer, since 2007 | | Chief Compliance Officer of Wells Fargo Funds Management, LLC since 2007. Chief Compliance Officer of Parnassus Investments from 2005 to 2007. Chief Financial Officer of Parnassus Investments from 2004 to 2007 and Senior Audit Manager of PricewaterhouseCoopers LLP from 1998 to 2004. | | |
| 1. | The Statement of Additional Information includes additional information about the Trustees and is available, without charge, upon request, by calling 1-800-222-8222 or by visiting the Web site at wellsfargoadvantagefunds.com. |
| | | | | | |
| List of Abbreviations | | Wells Fargo Advantage Short-Term Bond Fund | | | 37 | |
The following is a list of common abbreviations for terms and entities which may have appeared in this report.
| ACB | — Agricultural Credit Bank |
| ADR | — American Depository Receipt |
| ADS | — American Depository Shares |
| AGC-ICC | — Assured Guaranty Corporation - Insured Custody Certificates |
| AGM | — Assured Guaranty Municipal |
| AMBAC | — American Municipal Bond Assurance Corporation |
| AMT | — Alternative Minimum Tax |
| BAN | — Bond Anticipation Notes |
| BHAC | — Berkshire Hathaway Assurance Corporation |
| CAB | — Capital Appreciation Bond |
| CCAB | — Convertible Capital Appreciation Bond |
| CDA | — Community Development Authority |
| CDO | — Collateralized Debt Obligation |
| COP | — Certificate of Participation |
| DRIVER | — Derivative Inverse Tax-Exempt Receipts |
| DW&P | — Department of Water & Power |
| DWR | — Department of Water Resources |
| ECFA | — Educational & Cultural Facilities Authority |
| EDA | — Economic Development Authority |
| EDFA | — Economic Development Finance Authority |
| ETF | — Exchange-Traded Fund |
| FFCB | — Federal Farm Credit Bank |
| FGIC | — Financial Guaranty Insurance Corporation |
| FHA | — Federal Housing Authority |
| FHLB | — Federal Home Loan Bank |
| FHLMC | — Federal Home Loan Mortgage Corporation |
| FNMA | — Federal National Mortgage Association |
| GDR | — Global Depository Receipt |
| GNMA | — Government National Mortgage Association |
| HCFR | — Healthcare Facilities Revenue |
| HEFA | — Health & Educational Facilities Authority |
| HEFAR | — Higher Education Facilities Authority Revenue |
| HFA | — Housing Finance Authority |
| HFFA | — Health Facilities Financing Authority |
| IBC | — Insured Bond Certificate |
| IDA | — Industrial Development Authority |
| IDAG | — Industrial Development Agency |
| IDR | — Industrial Development Revenue |
| KRW | — Republic of Korea Won |
| LIBOR | — London Interbank Offered Rate |
| LLC | — Limited Liability Company |
| LLP | — Limited Liability Partnership |
| MBIA | — Municipal Bond Insurance Association |
| MFHR | — Multi-Family Housing Revenue |
| MSTR | — Municipal Securities Trust Receipts |
| MUD | — Municipal Utility District |
| NATL-RE | — National Public Finance Guarantee Corporation |
| PCFA | — Pollution Control Finance Authority |
| PCR | — Pollution Control Revenue |
| PFA | — Public Finance Authority |
| PFFA | — Public Facilities Financing Authority |
| PFOTER | — Puttable Floating Option Tax-Exempt Receipts |
| plc | — Public Limited Company |
| PUTTER | — Puttable Tax-Exempt Receipts |
| R&D | — Research & Development |
| RDA | — Redevelopment Authority |
| RDFA | — Redevelopment Finance Authority |
| REIT | — Real Estate Investment Trust |
| ROC | — Reset Option Certificates |
| SAVRS | — Select Auction Variable Rate Securities |
| SBA | — Small Business Authority |
| SFHR | — Single Family Housing Revenue |
| SFMR | — Single Family Mortgage Revenue |
| SPDR | — Standard & Poor’s Depositary Receipts |
| TAN | — Tax Anticipation Notes |
| TIPS | — Treasury Inflation-Protected Securities |
| TRAN | — Tax Revenue Anticipation Notes |
| TCR | — Transferable Custody Receipts |
| TTFA | — Transportation Trust Fund Authority |
| TVA | — Tennessee Valley Authority |
| XLCA | — XL Capital Assurance |
This page is intentionally left blank.


FOR MORE INFORMATION
More information about Wells Fargo Advantage Funds is available free upon request. To obtain literature, please write, e-mail, visit the Fund’s Web site, or call:
Wells Fargo Advantage Funds
P.O. Box 8266
Boston, MA 02266-8266
E-mail: wfaf@wellsfargo.com
Web site: wellsfargoadvantagefunds.com
Individual investors: 1-800-222-8222
Retail investment professionals: 1-888-877-9275
Institutional investment professionals: 1-866-765-0778
This report and the financial statements contained herein are submitted for the general information of the shareholders of Wells Fargo Advantage Funds. If this report is used for promotional purposes, distribution of the report must be accompanied or preceded by a current prospectus. For a prospectus containing more complete information, including charges and expenses, call 1-800-222-8222 or visit the Fund’s Web site at wellsfargoadvantagefunds.com. Please consider the investment objectives, risks, charges, and expenses of the investment carefully before investing. This and other information about Wells Fargo Advantage Funds can be found in the current prospectus. Read the prospectus carefully before you invest or send money.
Wells Fargo Funds Management, LLC, a wholly owned subsidiary of Wells Fargo & Company, provides investment advisory and administrative services for Wells Fargo Advantage Funds. Other affiliates of Wells Fargo & Company provide subadvisory and other services for the Funds. The Funds are distributed by Wells Fargo Funds Distributor, LLC, Member FINRA/SIPC, an affiliate of Wells Fargo & Company.
NOT FDIC INSURED ¡ NO BANK GUARANTEE ¡ MAY LOSE VALUE
© 2012 Wells Fargo Funds Management, LLC. All rights reserved.
| | |
 | | 208526 04-12 SA221/SAR221 2-12 |

Wells Fargo Advantage
Short-Term High Yield Bond Fund

Semi-Annual Report
February 29, 2012

Reduce clutter. Save trees.
Sign up for electronic delivery of prospectuses and shareholder reports at wellsfargo.com/advantagedelivery
Contents
The views expressed and any forward-looking statements are as of February 29, 2012, unless otherwise noted, and are those of the Fund managers and/or Wells Fargo Funds Management, LLC. Discussions of individual securities, or the markets generally, or any Wells Fargo Advantage Fund are not intended as individual recommendations. Future events or results may vary significantly from those expressed in any forward-looking statements; the views expressed are subject to change at any time in response to changing circumstances in the market. Wells Fargo Funds Management, LLC, disclaims any obligation to publicly update or revise any views expressed or forward-looking statements.
NOT FDIC INSURED ¡ NO BANK GUARANTEE ¡ MAY LOSE VALUE

WELLS FARGO INVESTMENT HISTORY
| | |
| |
| 1932 | | Keystone creates one of the first mutual fund families. |
| |
| 1971 | | Wells Fargo & Company introduces one of the first institutional index funds. |
| |
| 1978 | | Wells Fargo applies Markowitz and Sharpe’s research on Modern Portfolio Theory to introduce one of the industry’s first Tactical Asset Allocation (TAA) models in institutional separately managed accounts. |
| |
| 1984 | | Wells Fargo Stagecoach Funds launches its first asset allocation fund. |
| |
| 1989 | | The Tactical Asset Allocation (TAA) Model is first applied to Wells Fargo’s asset allocation mutual funds. |
| |
| 1994 | | Wells Fargo introduces the LifePath Funds, one of the first suites of target date funds (now the Wells Fargo Advantage Dow Jones Target Date FundsSM). |
| |
| 1996 | | Evergreen Investments and Keystone Funds merge. |
| |
| 1997 | | Wells Fargo launches Wells Fargo Advantage WealthBuilder PortfoliosSM, a fund-of-funds suite of products that includes the use of quantitative models to shift assets among investment styles. |
| |
| 1999 | | Norwest Advantage Funds and Stagecoach Funds are reorganized into Wells Fargo Funds after the merger of Norwest and Wells Fargo. |
| |
| 2002 | | Evergreen Retail and Evergreen Institutional companies form the umbrella asset management company, Evergreen Investments. |
| |
| 2005 | | The integration of Strong Funds with Wells Fargo Funds creates Wells Fargo Advantage Funds, resulting in one of the top 20 mutual fund companies in the United States. |
| |
| 2006 | | Wells Fargo Advantage Funds relaunches the target date product line as Wells Fargo Advantage Dow Jones Target Date Funds. |
| |
| 2010 | | The mergers and reorganizations of Evergreen and Wells Fargo Advantage mutual funds are completed, unifying the families under the brand of Wells Fargo Advantage Funds. |
Wells Fargo Advantage Funds®
Wells Fargo Advantage Funds skillfully guides institutions, financial advisors, and individuals through the investment terrain to help them reach their financial objectives. Everything we do on behalf of investors is backed by our unique combination of qualifications.
Strength
Our organization is built on the standards of integrity and service established by our parent company—Wells Fargo & Company—more than 150 years ago. And, because we’re part of a highly diversified financial enterprise, we offer the depth of resources to help investors succeed.
Expertise
Our multi-boutique model offers investors access to the independent thinking of premier investment managers that have been chosen for their time-tested strategies. While each team specializes in a specific investment strategy, collectively they provide investors a wide choice of distinct investment styles. Our dedication to investment excellence doesn’t end with our expertise in manager selection—risk management, analysis, and rigorous ongoing review seek to ensure each manager’s investment process remains consistent.
Partnership
Our collaborative approach is built around understanding the needs and goals of our clients. By adhering to core principles of sound judgment and steady guidance, we support you through every stage of the investment decision process.
Carefully consider a fund’s investment objectives, risks, charges, and expenses before investing. For a current prospectus and, if available, a summary prospectus, containing this and other information, visit wellsfargoadvantagefunds.com. Read it carefully before investing.
Wells Fargo Funds Management, LLC, a wholly owned subsidiary of Wells Fargo & Company, provides investment advisory and administrative services for Wells Fargo Advantage Funds®. Other affiliates of Wells Fargo & Company provide subadvisory and other services for the Funds. The Funds are distributed by Wells Fargo Funds Distributor, LLC, Member FINRA/SIPC, an affiliate of Wells Fargo & Company.
“Dow Jones®” and “Dow Jones Target Date IndexesSM” are service marks of Dow Jones Trademark Holdings, LLC (“Dow Jones”), have been licensed to CME Group Index Services LLC (“CME Indexes”) and have been sublicensed for use for certain purposes by Global Index Advisors, Inc, and Wells Fargo Funds Management, LLC. The Wells Fargo Advantage Dow Jones Target Date FundsSM based on the Dow Jones Target Date IndexesSM, are not sponsored, endorsed, sold or promoted by Dow Jones, CME Indexes or their respective affiliates and none of them makes any representation regarding the advisability of investing in such product(s).
NOT FDIC INSURED ¡ NO BANK GUARANTEE ¡ MAY LOSE VALUE
Not part of the semi-annual report.
Wells Fargo Advantage Funds offers more than 110 mutual funds across a wide range of asset classes, representing over $218 billion in assets under management, as of February 29, 2012.
| | | | |
| Equity Funds | | | | |
Asia Pacific Fund | | Equity Value Fund | | Precious Metals Fund |
C&B Large Cap Value Fund | | Global Opportunities Fund | | Premier Large Company Growth Fund |
C&B Mid Cap Value Fund | | Growth Fund | | Small Cap Opportunities Fund |
Capital Growth Fund | | Index Fund | | Small Cap Value Fund |
Common Stock Fund | | International Equity Fund | | Small Company Growth Fund |
Disciplined U.S. Core Fund | | International Value Fund | | Small Company Value Fund |
Discovery Fund† | | Intrinsic Small Cap Value Fund | | Small/Mid Cap Core Fund |
Diversified Equity Fund | | Intrinsic Value Fund | | Small/Mid Cap Value Fund |
Diversified International Fund | | Intrinsic World Equity Fund | | Special Mid Cap Value Fund |
Diversified Small Cap Fund | | Large Cap Core Fund | | Special Small Cap Value Fund |
Emerging Growth Fund | | Large Cap Growth Fund | | Specialized Technology Fund |
Emerging Markets Equity Fund | | Large Company Value Fund | | Strategic Large Cap Growth Fund |
Endeavor Select Fund† | | Omega Growth Fund | | Traditional Small Cap Growth Fund |
Enterprise Fund† | | Opportunity Fund† | | Utility and Telecommunications Fund |
| Bond Funds | | | | |
Adjustable Rate Government Fund | | Inflation-Protected Bond Fund | | Short-Term Bond Fund |
California Limited-Term Tax-Free Fund | | Intermediate Tax/AMT-Free Fund | | Short-Term High Yield Bond Fund |
California Tax-Free Fund | | International Bond Fund | | Short-Term Municipal Bond Fund |
Colorado Tax-Free Fund | | Minnesota Tax-Free Fund | | Strategic Municipal Bond Fund |
Government Securities Fund | | Municipal Bond Fund | | Total Return Bond Fund |
High Income Fund | | North Carolina Tax-Free Fund | | Ultra Short-Term Income Fund |
High Yield Bond Fund | | Pennsylvania Tax-Free Fund | | Ultra Short-Term Municipal Income Fund |
Income Plus Fund | | Short Duration Government Bond Fund | | Wisconsin Tax-Free Fund |
| Asset Allocation Funds | | | | |
Absolute Return Fund | | WealthBuilder Equity Portfolio† | | Target 2020 Fund† |
Asset Allocation Fund | | WealthBuilder Growth Allocation Portfolio† | | Target 2025 Fund† |
Conservative Allocation Fund | | WealthBuilder Growth Balanced Portfolio† | | Target 2030 Fund† |
Diversified Capital Builder Fund | | WealthBuilder Moderate Balanced Portfolio† | | Target 2035 Fund† |
Diversified Income Builder Fund | | WealthBuilder Tactical Equity Portfolio† | | Target 2040 Fund† |
Growth Balanced Fund | | Target Today Fund† | | Target 2045 Fund† |
Index Asset Allocation Fund | | Target 2010 Fund† | | Target 2050 Fund† |
Moderate Balanced Fund | | Target 2015 Fund† | | Target 2055 Fund† |
WealthBuilder Conservative Allocation Portfolio† | | | | |
| Money Market Funds | | | | |
100% Treasury Money Market Fund | | Heritage Money Market Fund† | | National Tax-Free Money Market Fund |
California Municipal Money Market Fund | | Money Market Fund | | Prime Investment Money Market Fund |
Cash Investment Money Market Fund | | Municipal Cash Management Money Market Fund | | Treasury Plus Money Market Fund |
Government Money Market Fund | | Municipal Money Market Fund | | |
| Variable Trust Funds1 | | | | |
VT Discovery Fund† | | VT Intrinsic Value Fund | | VT Small Cap Growth Fund |
VT Index Asset Allocation Fund | | VT Omega Growth Fund | | VT Small Cap Value Fund |
VT International Equity Fund | | VT Opportunity Fund† | | VT Total Return Bond Fund |
An investment in a money market fund is not insured or guaranteed by the Federal Deposit Insurance Corporation or any other government agency. Although the Wells Fargo Advantage Money Market Funds seek to preserve the value of your investment at $1.00 per share, it is possible to lose money by investing in a money market fund.
| 1. | The Variable Trust Funds are generally available only through insurance company variable contracts. |
| † | In this report, the Wells Fargo Advantage Discovery FundSM, Wells Fargo Advantage Endeavor Select FundSM, Wells Fargo Advantage Enterprise FundSM, Wells Fargo Advantage Opportunity FundSM, Wells Fargo Advantage WealthBuilder Conservative Allocation PortfolioSM, Wells Fargo Advantage WealthBuilder Equity PortfolioSM, Wells Fargo Advantage WealthBuilder Growth Allocation PortfolioSM, Wells Fargo Advantage WealthBuilder Growth Balanced PortfolioSM, Wells Fargo Advantage WealthBuilder Moderate Balanced PortfolioSM, Wells Fargo Advantage WealthBuilder Tactical Equity PortfolioSM, Wells Fargo Advantage Dow Jones Target Today FundSM, Wells Fargo Advantage Dow Jones Target 2010 FundSM, Wells Fargo Advantage Dow Jones Target 2015 FundSM, Wells Fargo Advantage Dow Jones Target 2020 FundSM, Wells Fargo Advantage Dow Jones Target 2025 FundSM, Wells Fargo Advantage Dow Jones Target 2030 FundSM, Wells Fargo Advantage Dow Jones Target 2035 FundSM, Wells Fargo Advantage Dow Jones Target 2040 FundSM, Wells Fargo Advantage Dow Jones Target 2045 FundSM, Wells Fargo Advantage Dow Jones Target 2050 FundSM, Wells Fargo Advantage Dow Jones Target 2055 FundSM, Wells Fargo Advantage Heritage Money Market FundSM, Wells Fargo Advantage VT Discovery FundSM, and Wells Fargo Advantage VT Opportunity FundSM are referred to as the Discovery Fund, Endeavor Select Fund, Enterprise Fund, Opportunity Fund, WealthBuilder Conservative Allocation Portfolio, WealthBuilder Equity Portfolio, WealthBuilder Growth Allocation Portfolio, WealthBuilder Growth Balanced Portfolio, WealthBuilder Moderate Balanced Portfolio, WealthBuilder Tactical Equity Portfolio, Target Today Fund, Target 2010 Fund, Target 2015 Fund, Target 2020 Fund, Target 2025 Fund, Target 2030 Fund, Target 2035 Fund, Target 2040 Fund, Target 2045 Fund, Target 2050 Fund, Target 2055 Fund, Heritage Money Market Fund, VT Discovery Fund, and VT Opportunity Fund, respectively. |
Not part of the semi-annual report.
| | | | |
| 2 | | Wells Fargo Advantage Short-Term High Yield Bond Fund | | Letter to Shareholders |

Karla M. Rabusch,
President
Wells Fargo Advantage Funds
The theme for the period was a shift from risk aversion in the first half to burgeoning trends of improving investor confidence in the second half, which significantly improved pricing in the lower-rated asset classes.
On the whole, investment-grade fixed-income securities performed positively during the period, but the strongest returns came from the high-yield market.
Dear Valued Shareholder:
We are pleased to offer you this semi-annual report for the Wells Fargo Advantage Short-Term High Yield Bond Fund, which covers the six-month period that ended February 29, 2012. During the period, fixed-income performance was best among the lower-rated securities, as improved investor confidence in the U.S. economy and the U.S. credit markets encouraged investors to return to riskier asset classes.
The period began with heightened risk aversion but ended with stronger investor confidence.
The six-month period began with the worsening of the Greek crisis, which amplified risk aversion across the global credit markets. This in turn led to a powerful rally in U.S. Treasuries and a sharp decline in high-yield bond prices, most notably in the lowest-quality credit tiers. During this time, most investment-grade fixed-income markets continued to generate positive returns—although certain areas of the riskiest segments of the markets declined—and U.S. Treasury yields reached the lowest levels in decades, even surpassing the low yield levels reached in the summer of 2010.
The last three months of the period were characterized by a strong reversal of the trends of the first three months. In October 2011, the high-yield market recovered significantly, benefiting from indications of improving policy with regard to managing the debt crisis from Europe and the formal announcement of a European debt deal late in the month. Due to renewed concerns about the European Union’s ability to manage the debt crisis, November 2011 saw a modest decline in investment-grade corporate bond prices and a sharp correction in high-yield corporate bonds, but another strong recovery in pricing started in December and carried into the first two months of 2012. Investor confidence strengthened as the U.S. economy demonstrated signs of sustainable growth and U.S. credit markets began to show some resistance to the credit problems of Europe. Thus, the theme for the period was a shift from risk aversion in the first half to burgeoning trends of improving investor confidence in the second half, which significantly improved pricing in the lower-rated asset classes.
On the whole, investment-grade fixed-income securities performed positively during the period, but the strongest returns came from the high-yield market. In fact, the best returns for the six-month period came from the lowest-rated credit tiers, despite the fact that they significantly underperformed in August and September 2011. Similar trends were true in the structured products sector, as lower-rated commercial mortgage-backed securities were among the best performers for the period, despite underperforming in the first two months.
The Federal Reserve launched Operation Twist in September.
With economic concerns and credit woes escalating in Europe and some continued uncertainty about the growth outlook in the U.S. during August and September 2011, the Federal Reserve (Fed) intervened yet again with monetary accommodations—this time with “Operation Twist,” which was announced and launched in September 2011. With Operation Twist, the Fed endeavored to flatten the yield curve and drive long-term rates down by selling short-term Treasuries and using the proceeds to purchase long-term Treasuries. The Fed stated that it is unlikely to raise rates before 2014, which should keep yields on Treasuries low. Despite this announcement, problems in Europe caused Treasuries to continue to rally in the first 3 months of the period, while credit spreads on corporate and
| | | | | | |
| Letter to Shareholders | | Wells Fargo Advantage Short-Term High Yield Bond Fund | | | 3 | |
securitized sectors widened with increasing risk aversion. However, with an improved U.S. economic outlook and greater investor confidence, the last three months of the period saw a slight decline in U.S. Treasury prices and significant improvement in high-yield corporate bond prices. Credit spreads in the corporate and securitized sectors broadly tightened in December 2011 and January and February 2012.
Although U.S. economic conditions appear to have improved over the course of the period, the recovery continues to face some headwinds in the form of languishing housing values and elevated unemployment levels, which may continue to create some volatility in the fixed-income markets. While we cannot say definitively what near-term performance will look like, we continue to encourage investors to maintain fully diversified, actively managed portfolios, which may provide better protection from risk and added opportunities to capture relative value. While heightened volatility may be uncomfortable to experience in the short term, we believe it can lead to unique opportunities to add relative value for investors with long-term investment horizons.
Don’t let short-term uncertainty derail long-term investment goals.
Periods of uncertainty can present challenges, but experience has taught us that maintaining a long-term investment strategy based on individual goals and risk tolerance can be an effective way to plan for the future. To help you create a sound strategy based on your personal goals and risk tolerance, Wells Fargo Advantage Funds offers more than 110 mutual funds and other investments spanning a wide range of asset classes and investment styles. Although diversification cannot guarantee an investment profit or prevent losses, we believe it can be an effective way to manage investment risk and potentially smooth out overall portfolio performance.
In our opinion, diligent and earnest assessment of the fundamental risks in individual fixed-income securities will be a key differentiating factor between which investment strategies perform well and which do not. At Wells Fargo Advantage Funds, we intend to continue measuring relative-value opportunities in the fixed-income markets and across our lineup of funds. We believe it is particularly important to have diligent investment analysts in charge of investor assets in changing markets. As evidenced by the performance of fixed-income assets during the recent six-month period, heightened risks also often accompany such opportunities.
Thank you for choosing to invest with Wells Fargo Advantage Funds. We appreciate your confidence in us and remain committed to helping you meet your financial needs. For current information about your fund investments, contact your investment professional, visit our Web site at wellsfargoadvantagefunds.com, or call us directly at 1-800-222-8222. We are available 24 hours a day, 7 days a week.
Sincerely,

Karla M. Rabusch
President
Wells Fargo Advantage Funds
| | | | |
| 4 | | Wells Fargo Advantage Short-Term High Yield Bond Fund | | Letter to Shareholders |
Notice to Shareholders
The Board of Trustees for Wells Fargo Advantage Funds has unanimously approved the following modifications to certain net asset value (NAV) waiver privileges and commission schedules:
| | n | | Effective May 1, 2012, automatic investment plan (AIP) purchases and proceeds received from systematic withdrawals will no longer qualify for NAV repurchase privileges. | |
| | n | | Effective May 1, 2012, discretionary rights to waive the upfront commission for Class C and “jumbo” Class A share purchases will no longer be granted to broker/dealers. However, we will continue to waive the Class C shares contingent deferred sales charge for redemptions by employer-sponsored retirement plans where the dealer of record waived its commission at the time of purchase. | |
| | n | | Effective July 31, 2012, NAV purchase privileges for former Evergreen Class IS and Class R shareholders are being modified to remove the ability to purchase Class A shares at NAV unless those shares are held directly with the Fund on or after July 31, 2012. | |
Please contact your investment professional or call us directly at 1-800-222-8222 if you have any questions on this Notice to Shareholders.
| | | | | | |
| Performance Highlights (Unaudited) | | Wells Fargo Advantage Short-Term High Yield Bond Fund | | | 5 | |
INVESTMENT OBJECTIVE
The Fund seeks total return, consisting of a high level of current income and capital appreciation.
ADVISER
Wells Fargo Funds Management, LLC
SUB-ADVISER
Wells Capital Management Incorporated
PORTFOLIO MANAGERS
Kevin J. Maas, CFA
Thomas M. Price, CFA
Michael J. Schueller, CFA
FUND INCEPTION
June 30, 1997
| | | | |
TEN LARGEST LONG-TERM HOLDINGS1
(AS OF FEBRUARY 29, 2012) | |
EchoStar DBS Corporation, 6.62%, 10/01/2014 | | | 1.20% | |
Virgin Media Finance plc, 9.50%, 08/15/2016 | | | 1.19% | |
SBA Telecommunications Incorporated, 8.00%, 08/15/2016 | | | 1.19% | |
SPX Corporation, 7.62%, 12/15/2014 | | | 1.18% | |
Crown Castle International Corporation, 9.00%, 01/15/2015 | | | 1.15% | |
CCH II Capital Corporation, 13.50%, 11/30/2016 | | | 1.13% | |
Ford Motor Credit Company LLC, 8.70%, 10/01/2014 | | | 1.12% | |
R.R. Donnelley & Sons Company, 4.95%, 04/01/2014 | | | 1.07% | |
CIT Group Incorporated, 5.25%, 04/01/2014 | | | 1.07% | |
Embarq Corporation, 7.08%, 06/01/2016 | | | 1.03% | |
| | |
CREDIT QUALITY2
(AS OF FEBRUARY 29, 2012) |
|
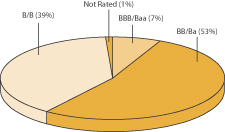 |
| 1. | The ten largest long-term holdings are calculated based on the value of the securities divided by total net assets of the Fund. Holdings are subject to change and may have changed since the date specified. |
| 2. | The ratings indicated are from Standard & Poor’s, Moody’s Investors Service, and/or Fitch Ratings Ltd. Credit Quality Ratings: Credit quality ratings apply to underlying holdings of the Fund and not the Fund itself. Standard & Poor’s rates the creditworthiness of bonds, ranging from AAA (highest) to D (lowest). Ratings from A to CCC may be modified by the addition of a plus (+) or minus (–) sign to show relative standing within the rating categories. Standard & Poor’s rates the creditworthiness of short-term notes from SP-1 (highest) to SP-3 (lowest). Moody’s rates the creditworthiness of bonds, ranging from Aaa (highest) to C (lowest). Ratings Aa to B may be modified by the addition of a number 1 (highest) to 3 (lowest) to show relative standing within the ratings categories. Moody’s rates the creditworthiness of short-term U.S. tax-exempt municipal securities from MIG 1/VMIG 1 (highest) to SG (lowest). Fitch rates the creditworthiness of bonds, ranging from AAA (highest) to D (lowest). If a security was rated by all three rating agencies, the middle rating was utilized. If rated by two of three rating agencies, the lower rating was utilized and if rated by one of the agencies that rating was utilized. Credit quality is subject to change and is calculated based on the total investments of the Fund. |
| | | | |
| 6 | | Wells Fargo Advantage Short-Term High Yield Bond Fund | | Performance Highlights (Unaudited) |
AVERAGE ANNUAL TOTAL RETURN3 (%) (AS OF FEBRUARY 29, 2012)
| | | | | | | | | | | | | | | | | | | | | | | | | | | | | | | | | | | | | | | | | | | | |
| | | | | | Including Sales Charge | | | Excluding Sales Charge | | | Expense Ratios4 | |
| | | Inception Date | | | 6 Months* | | | 1 Year | | | 5 Year | | | 10 Year | | | 6 Months* | | | 1 Year | | | 5 Year | | | 10 Year | | | Gross | | | Net5 | |
Class A (SSTHX) | | | 02/29/2000 | | | | 2.04 | | | | 1.03 | | | | 4.00 | | | | 4.28 | | | | 5.19 | | | | 4.16 | | | | 4.63 | | | | 4.60 | | | | 1.02% | | | | 0.82% | |
Class C (WFHYX) | | | 03/31/2008 | | | | 3.80 | | | | 2.38 | | | | 3.85 | | | | 3.89 | | | | 4.80 | | | | 3.38 | | | | 3.85 | | | | 3.89 | | | | 1.77% | | | | 1.57% | |
Administrator Class (WDHYX) | | | 07/30/2010 | | | | | | | | | | | | | | | | | | | | 5.41 | | | | 4.33 | | | | 4.68 | | | | 4.62 | | | | 0.96% | | | | 0.66% | |
Investor Class (STHBX) | | | 06/30/1997 | | | | | | | | | | | | | | | | | | | | 5.31 | | | | 4.13 | | | | 4.60 | | | | 4.63 | | | | 1.05% | | | | 0.85% | |
Short-Term High Yield Bond Index III6 | | | | | | | | | | | | | | | | | | | | | | | 5.72 | | | | 5.63 | | | | 7.41 | | | | 7.52 | | | | | | | | | |
BofA Merrill Lynch High Yield U.S. Corporates, Cash Pay, BB Rated, 1-5 Year Index7 | | | | | | | | | | | | | | | | | | | | | | | 5.73 | | | | 5.74 | | | | 7.32 | | | | 6.82 | | | | | | | | | |
| * | Returns for periods of less than one year are not annualized. |
Figures quoted represent past performance, which is no guarantee of future results and do not reflect the deduction of taxes that a shareholder may pay on fund distributions or the redemption of fund shares. Investment return and principal value of an investment will fluctuate so that an investor’s shares, when redeemed, may be worth more or less than their original cost. Performance shown without sales charges would be lower if sales charges were reflected. Current performance may be lower or higher than the performance data quoted and assumes the reinvestment of dividends and capital gains. Current month-end performance is available on the Fund’s Web site – wellsfargoadvantagefunds.com.
Index returns do not include transaction costs associated with buying and selling securities, any mutual fund fees or expenses or any taxes. It is not possible to invest directly in an index.
For Class A shares, the maximum front-end sales charge is 3.00%. For Class C shares, the maximum contingent deferred sales charge is 1.00%. Performance including sales charge assumes the sales charge for the corresponding time period. Administrator Class and Investor Class shares are sold without a front-end sales charge or contingent deferred sales charge.
Bond fund values fluctuate in response to the financial condition of individual issuers, general market and economic conditions, and changes in interest rates. In general, when interest rates rise, bond fund values fall and investors may lose principal value. High-yield securities have a greater risk of default and tend to be more volatile than higher-rated debt securities. The use of derivatives may reduce returns and/or increase volatility. Certain investment strategies tend to increase the total risk of an investment (relative to the broader market). This Fund is exposed to foreign investment risk. Consult the Fund’s prospectus for additional information on these and other risks.
| 3. | Historical performance shown for the Class A shares through June 19, 2008 includes Advisor Class expenses. Historical performance shown for the Class C shares prior to their inception reflects the performance of the Investor Class shares, adjusted to include the higher expenses applicable to Class C shares. Historical performance shown for the Administrator Class shares prior to their inception reflects the performance of the Class A shares, and includes the higher expenses applicable to Class A. If these expenses had not been included, returns would be higher. |
| 4. | Reflects the expense ratios as stated in the most recent prospectuses. |
| 5. | The Adviser has committed through December 31, 2012 to waive fees and/or reimburse expenses to the extent necessary to cap the Fund’s Total Annual Fund Operating Expenses After Fee Waiver, excluding certain expenses, at 0.81% for Class A, 1.56% for Class C, 0.65% for Administrator Class and 0.84% for Investor Class. Without this cap, the Fund’s returns would have been lower. |
| 6. | The Short-Term High Yield Bond Index III is comprised of 70% of BofA Merrill Lynch High Yield U.S. Corporates, Cash Pay, BB Rated, 1-5 Year Index and 30% of BofA Merrill Lynch High Yield U.S. Corporates, Cash Pay, B Rated, 1-5 Year Index. The BofA Merrill Lynch High Yield U.S. Corporates, Cash Pay, BB Rated, 1-5 Year Index is an unmanaged index that generally tracks the performance of BB rated US dollar-denominated corporate bonds publicly issued in the U.S. domestic market with maturities of one to five years. The BofA Merrill Lynch High Yield U.S. Corporates, Cash Pay, B Rated, 1-5 Year Index is an unmanaged index that generally tracks the performance of B rated US dollar-denominated corporate bonds publicly issued in the US domestic market with maturities of one to five years. You cannot invest directly in an index. |
| 7. | The BofA Merrill Lynch High Yield U.S. Corporates, Cash Pay, BB Rated, 1-5 Year Index is an unmanaged index that generally tracks the performance of BB rated U.S. dollar-denominated corporate bonds publicly issued in the U.S. domestic market with maturities of one to five years. You cannot invest directly in an index. |
| | | | | | |
| Fund Expenses (Unaudited) | | Wells Fargo Advantage Short-Term High Yield Bond Fund | | | 7 | |
As a shareholder of the Fund, you incur two types of costs: (1) transaction costs, including sales charges (loads) on purchase payments and contingent deferred sales charges (if any) on redemptions and (2) ongoing costs, including management fees; distribution (12b-1) and/or shareholder service fees; and other Fund expenses. This example is intended to help you understand your ongoing costs (in dollars) of investing in the Fund and to compare these costs with the ongoing costs of investing in other mutual funds.
The example is based on an investment of $1,000 invested at the beginning of the six-month period and held for the entire period from September 1, 2011 to February 29, 2012.
Actual Expenses
The “Actual” line of the table below provides information about actual account values and actual expenses. You may use the information in this line, together with the amount you invested, to estimate the expenses that you paid over the period. Simply divide your account value by $1,000 (for example, an $8,600 account value divided by $1,000 = 8.6), then multiply the result by the number in the “Actual” line under the heading entitled “Expenses Paid During Period” for your applicable class of shares to estimate the expenses you paid on your account during this period.
Hypothetical Example for Comparison Purposes
The “Hypothetical” line of the table below provides information about hypothetical account values and hypothetical expenses based on the Fund’s actual expense ratio and an assumed rate of return of 5% per year before expenses, which is not the Fund’s actual return. The hypothetical account values and expenses may not be used to estimate the actual ending account balance or expenses you paid for the period. You may use this information to compare the ongoing costs of investing in the Fund and other funds. To do so, compare this 5% hypothetical example with the 5% hypothetical examples that appear in the shareholder reports of the other funds.
Please note that the expenses shown in the table are meant to highlight your ongoing costs only and do not reflect any transactional costs, such as sales charges (loads) and contingent deferred sales charges. Therefore, the “Hypothetical” line of the table is useful in comparing ongoing costs only, and will not help you determine the relative total costs of owning different funds. In addition, if these transactional costs were included, your costs would have been higher.
| | | | | | | | | | | | | | | | |
| | | Beginning
Account Value
09-01-2011 | | | Ending
Account Value
02-29-2012 | | | Expenses
Paid During
the Period1 | | | Net Annual
Expense Ratio | |
Class A | | | | | | | | | | | | | | | | |
Actual | | $ | 1,000.00 | | | $ | 1,051.91 | | | $ | 4.13 | | | | 0.81 | % |
Hypothetical (5% return before expenses) | | $ | 1,000.00 | | | $ | 1,020.84 | | | $ | 4.07 | | | | 0.81 | % |
Class C | | | | | | | | | | | | | | | | |
Actual | | $ | 1,000.00 | | | $ | 1,048.01 | | | $ | 7.94 | | | | 1.56 | % |
Hypothetical (5% return before expenses) | | $ | 1,000.00 | | | $ | 1,017.11 | | | $ | 7.82 | | | | 1.56 | % |
Administrator Class | | | | | | | | | | | | | | | | |
Actual | | $ | 1,000.00 | | | $ | 1,054.06 | | | $ | 3.32 | | | | 0.65 | % |
Hypothetical (5% return before expenses) | | $ | 1,000.00 | | | $ | 1,021.63 | | | $ | 3.27 | | | | 0.65 | % |
Investor Class | | | | | | | | | | | | | | | | |
Actual | | $ | 1,000.00 | | | $ | 1,053.07 | | | $ | 4.29 | | | | 0.84 | % |
Hypothetical (5% return before expenses) | | $ | 1,000.00 | | | $ | 1,020.69 | | | $ | 4.22 | | | | 0.84 | % |
| 1. | Expenses paid is equal to the annualized expense ratio of each class multiplied by the average account value over the period, multiplied by the number of days in the most recent fiscal half-year divided by the number of days in the fiscal year (to reflect the one-half year period). |
| | | | |
| 8 | | Wells Fargo Advantage Short-Term High Yield Bond Fund | | Portfolio of Investments—February 29, 2012 (Unaudited) |
| | | | | | | | | | | | | | | | |
| Security Name | | Interest Rate | | | Maturity Date | | | Principal | | | Value | |
| | | | | | | | | | | | | | | | |
| | | | |
Corporate Bonds and Notes: 67.69% | | | | | | | | | | | | | | | | |
| | | | |
Consumer Discretionary: 20.80% | | | | | | | | | | | | | | | | |
| | | | |
| Auto Components: 2.24% | | | | | | | | | | | | | | | | |
American Axle & Manufacturing Holdings Incorporated | | | 5.25 | % | | | 02/11/2014 | | | $ | 7,000,000 | | | $ | 7,140,000 | |
American Axle & Manufacturing Holdings Incorporated 144A | | | 9.25 | | | | 01/15/2017 | | | | 2,500,000 | | | | 2,800,000 | |
Tenneco Incorporated | | | 8.13 | | | | 11/15/2015 | | | | 5,000,000 | | | | 5,206,300 | |
TRW Automotive Incorporated 144A | | | 8.88 | | | | 12/01/2017 | | | | 3,325,000 | | | | 3,699,063 | |
UR Financing Escrow Corporation 144A | | | 5.75 | | | | 07/15/2018 | | | | 500,000 | | | | 513,750 | |
| | | | |
| | | | | | | | | | | | | | | 19,359,113 | |
| | | | | | | | | | | | | | | | |
| | | | |
| Diversified Consumer Services: 0.90% | | | | | | | | | | | | | | | | |
Service Corporation International | | | 6.75 | | | | 04/01/2015 | | | | 3,300,000 | | | | 3,642,374 | |
Service Corporation International | | | 7.38 | | | | 10/01/2014 | | | | 3,740,000 | | | | 4,132,700 | |
| | | | |
| | | | | | | | | | | | | | | 7,775,074 | |
| | | | | | | | | | | | | | | | |
| | | | |
| Hotels, Restaurants & Leisure: 2.12% | | | | | | | | | | | | | | | | |
Firekeepers Development Authority 144A | | | 13.88 | | | | 05/01/2015 | | | | 7,000,000 | | | | 7,848,750 | |
MGM Resorts International | | | 10.38 | | | | 05/15/2014 | | | | 4,000,000 | | | | 4,550,000 | |
Starwood Hotels & Resorts Worldwide Incorporated | | | 7.88 | | | | 10/15/2014 | | | | 3,000,000 | | | | 3,435,000 | |
Tunica-Biloxi Gaming Authority 144A | | | 9.00 | | | | 11/15/2015 | | | | 2,580,000 | | | | 2,496,150 | |
| | | | |
| | | | | | | | | | | | | | | 18,329,900 | |
| | | | | | | | | | | | | | | | |
| | | | |
| Household Durables: 2.43% | | | | | | | | | | | | | | | | |
DR Horton Incorporated | | | 6.13 | | | | 01/15/2014 | | | | 3,000,000 | | | | 3,168,750 | |
Jarden Corporation | | | 8.00 | | | | 05/01/2016 | | | | 6,500,000 | | | | 7,109,375 | |
Mohawk Industries Incorporated | | | 6.88 | | | | 01/15/2016 | | | | 5,000,000 | | | | 5,531,250 | |
Mohawk Industries Incorporated Series D | | | 7.20 | | | | 04/15/2012 | | | | 2,107,000 | | | | 2,109,634 | |
Pulte Homes Incorporated | | | 5.25 | | | | 01/15/2014 | | | | 3,000,000 | | | | 3,090,000 | |
| | | | |
| | | | | | | | | | | | | | | 21,009,009 | |
| | | | | | | | | | | | | | | | |
| | | | |
| Leisure Equipment & Products: 0.64% | | | | | | | | | | | | | | | | |
Easton Bell Sports Incorporated | | | 9.75 | | | | 12/01/2016 | | | | 5,000,000 | | | | 5,550,000 | |
| | | | | | | | | | | | | | | | |
| | | | |
| Media: 8.24% | | | | | | | | | | | | | | | | |
Belo Corporation | | | 6.75 | | | | 05/30/2013 | | | | 2,000,000 | | | | 2,090,000 | |
Belo Corporation | | | 8.00 | | | | 11/15/2016 | | | | 1,580,000 | | | | 1,759,725 | |
CCH II Capital Corporation | | | 13.50 | | | | 11/30/2016 | | | | 8,500,000 | | | | 9,775,000 | |
Clear Channel Communications Incorporated | | | 9.25 | | | | 12/15/2017 | | | | 5,000,000 | | | | 5,500,000 | |
CSC Holdings LLC | | | 8.50 | | | | 04/15/2014 | | | | 7,000,000 | | | | 7,770,000 | |
EchoStar DBS Corporation | | | 6.63 | | | | 10/01/2014 | | | | 9,505,000 | | | | 10,360,450 | |
Gannett Companies Incorporated | | | 6.38 | | | | 04/01/2012 | | | | 2,000,000 | | | | 2,005,000 | |
Gannett Companies Incorporated | | | 8.75 | | | | 11/15/2014 | | | | 5,000,000 | | | | 5,625,000 | |
Insight Communications 144A | | | 9.38 | | | | 07/15/2018 | | | | 6,355,000 | | | | 7,292,363 | |
Lamar Media Corporation Series C | | | 9.75 | | | | 04/01/2014 | | | | 7,500,000 | | | | 8,531,250 | |
Sirius XM Radio Incorporated 144A | | | 8.75 | | | | 04/01/2015 | | | | 5,500,000 | | | | 6,242,500 | |
Sirius XM Radio Incorporated 144A | | | 9.75 | | | | 09/01/2015 | | | | 4,000,000 | | | | 4,330,000 | |
| | | | |
| | | | | | | | | | | | | | | 71,281,288 | |
| | | | | | | | | | | | | | | | |
The accompanying notes are an integral part of these financial statements.
| | | | | | |
| Portfolio of Investments—February 29, 2012 (Unaudited) | | Wells Fargo Advantage Short-Term High Yield Bond Fund | | | 9 | |
| | | | | | | | | | | | | | | | |
| Security Name | | Interest Rate | | | Maturity Date | | | Principal | | | Value | |
| | | | | | | | | | | | | | | | |
| | | | |
| Multiline Retail: 0.32% | | | | | | | | | | | | | | | | |
Macy’s Incorporated | | | 5.75 | % | | | 07/15/2014 | | | $ | 2,500,000 | | | $ | 2,750,368 | |
| | | | | | | | | | | | | | | | |
| | | | |
| Specialty Retail: 2.21% | | | | | | | | | | | | | | | | |
Avis Budget Car Rental LLC ±« | | | 3.00 | | | | 05/15/2014 | | | | 7,150,000 | | | | 6,935,500 | |
Limited Brands Incorporated | | | 5.25 | | | | 11/01/2014 | | | | 7,000,000 | | | | 7,446,250 | |
Simmons Bedding Company 144A | | | 11.25 | | | | 07/15/2015 | | | | 4,540,000 | | | | 4,693,180 | |
| | | | |
| | | | | | | | | | | | | | | 19,074,930 | |
| | | | | | | | | | | | | | | | |
| | | | |
| Textiles, Apparel & Luxury Goods: 1.70% | | | | | | | | | | | | | | | | |
Hanesbrands Incorporated | | | 8.00 | | | | 12/15/2016 | | | | 6,000,000 | | | | 6,675,000 | |
Jones Group Incorporated | | | 5.13 | | | | 11/15/2014 | | | | 8,000,000 | | | | 7,990,000 | |
| | | | |
| | | | | | | | | | | | | | | 14,665,000 | |
| | | | | | | | | | | | | | | | |
| | | | |
Consumer Staples: 3.87% | | | | | | | | | | | | | | | | |
| | | | |
| Beverages: 0.84% | | | | | | | | | | | | | | | | |
Constellation Brands Incorporated | | | 8.38 | | | | 12/15/2014 | | | | 6,385,000 | | | | 7,246,975 | |
| | | | | | | | | | | | | | | | |
| | | | |
| Food & Staples Retailing: 0.70% | | | | | | | | | | | | | | | | |
Albertsons Incorporated | | | 7.25 | | | | 05/01/2013 | | | | 5,750,000 | | | | 6,030,313 | |
| | | | | | | | | | | | | | | | |
| | | | |
| Food Products: 1.54% | | | | | | | | | | | | | | | | |
Dole Food Company Incorporated | | | 13.88 | | | | 03/15/2014 | | | | 5,500,000 | | | | 6,297,500 | |
Smithfield Foods Incorporated | | | 10.00 | | | | 07/15/2014 | | | | 6,000,000 | | | | 7,035,000 | |
| | | | |
| | | | | | | | | | | | | | | 13,332,500 | |
| | | | | | | | | | | | | | | | |
| | | | |
| Household Products: 0.79% | | | | | | | | | | | | | | | | |
Spectrum Brands | | | 9.50 | | | | 06/15/2018 | | | | 6,000,000 | | | | 6,840,000 | |
| | | | | | | | | | | | | | | | |
| | | | |
Energy: 9.71% | | | | | | | | | | | | | | | | |
| | | | |
| Oil, Gas & Consumable Fuels: 9.71% | | | | | | | | | | | | | | | | |
Arch Coal Incorporated | | | 8.75 | | | | 08/01/2016 | | | | 6,000,000 | | | | 6,600,000 | |
Arch Western Finance LLC | | | 6.75 | | | | 07/01/2013 | | | | 1,658,000 | | | | 1,666,290 | |
Berry Petroleum Companies Class A | | | 10.25 | | | | 06/01/2014 | | | | 2,000,000 | | | | 2,300,000 | |
Bill Barrett Corporation | | | 9.88 | | | | 07/15/2016 | | | | 6,000,000 | | | | 6,630,000 | |
Chesapeake Energy Corporation | | | 9.50 | | | | 02/15/2015 | | | | 7,700,000 | | | | 8,855,000 | |
CITGO Petroleum Corporation 144A | | | 11.50 | | | | 07/01/2017 | | | | 4,000,000 | | | | 4,480,000 | |
Coffeyville Resources Refining & Marketing LLC 144A | | | 9.00 | | | | 04/01/2015 | | | | 5,000,000 | | | | 5,350,000 | |
Encore Acquisition Company | | | 9.50 | | | | 05/01/2016 | | | | 2,500,000 | | | | 2,793,750 | |
Forest Oil Corporation | | | 8.50 | | | | 02/15/2014 | | | | 6,000,000 | | | | 6,510,000 | |
Holly Energy Partners LP | | | 6.25 | | | | 03/01/2015 | | | | 7,675,000 | | | | 7,675,000 | |
Kinder Morgan Incorporated | | | 5.15 | | | | 03/01/2015 | | | | 7,000,000 | | | | 7,323,745 | |
Newfield Exploration Company | | | 6.63 | | | | 09/01/2014 | | | | 4,000,000 | | | | 4,060,000 | |
Petrohawk Energy Corporation | | | 10.50 | | | | 08/01/2014 | | | | 5,500,000 | | | | 6,111,875 | |
Plains Exploration & Production Company | | | 10.00 | | | | 03/01/2016 | | | | 1,500,000 | | | | 1,672,500 | |
Quicksilver Resources Incorporated « | | | 8.25 | | | | 08/01/2015 | | | | 3,000,000 | | | | 3,052,500 | |
Tesoro Corporation | | | 6.25 | | | | 11/01/2012 | | | | 2,000,000 | | | | 2,050,000 | |
Tesoro Corporation | | | 6.63 | | | | 11/01/2015 | | | | 3,545,000 | | | | 3,615,900 | |
Whiting Petroleum Corporation | | | 7.00 | | | | 02/01/2014 | | | | 3,000,000 | | | | 3,210,000 | |
| | | | |
| | | | | | | | | | | | | | | 83,956,560 | |
| | | | | | | | | | | | | | | | |
The accompanying notes are an integral part of these financial statements.
| | | | |
| 10 | | Wells Fargo Advantage Short-Term High Yield Bond Fund | | Portfolio of Investments—February 29, 2012 (Unaudited) |
| | | | | | | | | | | | | | | | |
| Security Name | | Interest Rate | | | Maturity Date | | | Principal | | | Value | |
| | | | | | | | | | | | | | | | |
| | | | |
Financials: 6.86% | | | | | | | | | | | | | | | | |
| | | | |
| Commercial Banks: 1.76% | | | | | | | | | | | | | | | | |
AmSouth Bancorporation | | | 4.85 | % | | | 04/01/2013 | | | $ | 5,014,000 | | | $ | 5,032,803 | |
CIT Group Incorporated 144A | | | 4.75 | | | | 02/15/2015 | | | | 1,000,000 | | | | 1,015,000 | |
CIT Group Incorporated 144A | | | 5.25 | | | | 04/01/2014 | | | | 9,000,000 | | | | 9,202,500 | |
| | | | |
| | | | | | | | | | | | | | | 15,250,303 | |
| | | | | | | | | | | | | | | | |
| | | | |
| Consumer Finance: 3.94% | | | | | | | | | | | | | | | | |
Ally Financial Incorporated | | | 5.50 | | | | 02/15/2017 | | | | 1,500,000 | | | | 1,519,433 | |
Ford Motor Credit Company LLC | | | 3.88 | | | | 01/15/2015 | | | | 2,000,000 | | | | 2,050,456 | |
Ford Motor Credit Company LLC | | | 8.70 | | | | 10/01/2014 | | | | 8,500,000 | | | | 9,667,586 | |
GMAC LLC | | | 6.75 | | | | 12/01/2014 | | | | 1,000,000 | | | | 1,056,250 | |
GMAC LLC | | | 7.50 | | | | 12/31/2013 | | | | 3,000,000 | | | | 3,195,000 | |
JBS USA Finance Incorporated | | | 11.63 | | | | 05/01/2014 | | | | 2,000,000 | | | | 2,317,500 | |
Nielsen Finance LLC | | | 11.63 | | | | 02/01/2014 | | | | 6,975,000 | | | | 8,108,438 | |
SLM Corporation | | | 5.00 | | | | 10/01/2013 | | | | 6,000,000 | | | | 6,144,000 | |
| | | | |
| | | | | | | | | | | | | | | 34,058,663 | |
| | | | | | | | | | | | | | | | |
| | | | |
| Diversified Financial Services: 0.86% | | | | | | | | | | | | | | | | |
Ally Financial Incorporated | | | 4.50 | | | | 02/11/2014 | | | | 3,000,000 | | | | 3,030,000 | |
Dolphin Subsidiary II Incorporated 144A | | | 6.50 | | | | 10/15/2016 | | | | 4,000,000 | | | | 4,360,000 | |
| | | | |
| | | | | | | | | | | | | | | 7,390,000 | |
| | | | | | | | | | | | | | | | |
| | | | |
| REIT: 0.30% | | | | | | | | | | | | | | | | |
Host Marriott LP Series Q | | | 6.75 | | | | 06/01/2016 | | | | 2,515,000 | | | | 2,599,881 | |
| | | | | | | | | | | | | | | | |
| | | | |
Health Care: 2.43% | | | | | | | | | | | | | | | | |
| | | | |
| Health Care Equipment & Supplies: 0.93% | | | | | | | | | | | | | | | | |
Fresenius US Finance II Incorporated 144A | | | 9.00 | | | | 07/15/2015 | | | | 7,000,000 | | | | 8,085,000 | |
| | | | | | | | | | | | | | | | |
| | | | |
| Health Care Providers & Services: 1.50% | | | | | | | | | | | | | | | | |
Community Health Systems Incorporated Series WI « | | | 8.88 | | | | 07/15/2015 | | | | 4,500,000 | | | | 4,713,750 | |
HCA Incorporated | | | 6.25 | | | | 02/15/2013 | | | | 2,000,000 | | | | 2,060,000 | |
Health Management plc | | | 6.13 | | | | 04/15/2016 | | | | 5,930,000 | | | | 6,189,438 | |
| | | | |
| | | | | | | | | | | | | | | 12,963,188 | |
| | | | | | | | | | | | | | | | |
| | | | |
Industrials: 12.56% | | | | | | | | | | | | | | | | |
| | | | |
| Aerospace & Defense: 1.39% | | | | | | | | | | | | | | | | |
Alliant Techsystems Incorporated | | | 6.75 | | | | 04/01/2016 | | | | 5,000,000 | | | | 5,125,000 | |
Geoeye Incorporated | | | 9.63 | | | | 10/01/2015 | | | | 6,250,000 | | | | 6,906,250 | |
| | | | |
| | | | | | | | | | | | | | | 12,031,250 | |
| | | | | | | | | | | | | | | | |
| | | | |
| Commercial Services & Supplies: 6.29% | | | | | | | | | | | | | | | | |
Acco Brands Corporation | | | 10.63 | | | | 03/15/2015 | | | | 5,000,000 | | | | 5,518,800 | |
ARAMARK Corporation ± | | | 4.05 | | | | 02/01/2015 | | | | 2,500,000 | | | | 2,490,625 | |
ARAMARK Corporation | | | 8.50 | | | | 02/01/2015 | | | | 3,000,000 | | | | 3,078,780 | |
Case Corporation | | | 7.25 | | | | 01/15/2016 | | | | 5,500,000 | | | | 6,063,750 | |
Casella Waste Systems Incorporated | | | 11.00 | | | | 07/15/2014 | | | | 5,000,000 | | | | 5,418,750 | |
Corrections Corporation of America | | | 6.25 | | | | 03/15/2013 | | | | 504,000 | | | | 504,630 | |
The accompanying notes are an integral part of these financial statements.
| | | | | | |
| Portfolio of Investments—February 29, 2012 (Unaudited) | | Wells Fargo Advantage Short-Term High Yield Bond Fund | | | 11 | |
| | | | | | | | | | | | | | | | |
| Security Name | | Interest Rate | | | Maturity Date | | | Principal | | | Value | |
| | | | | | | | | | | | | | | | |
| | | | |
| Commercial Services & Supplies (continued) | | | | | | | | | | | | | | | | |
Deluxe Corporation | | | 5.13 | % | | | 10/01/2014 | | | $ | 5,000,000 | | | $ | 5,062,500 | |
International Lease Finance Corporation | | | 5.65 | | | | 06/01/2014 | | | | 3,000,000 | | | | 3,067,500 | |
International Lease Finance Corporation 144A | | | 6.50 | | | | 09/01/2014 | | | | 5,000,000 | | | | 5,325,000 | |
Libbey Glass Incorporated | | | 10.00 | | | | 02/15/2015 | | | | 8,000,000 | | | | 8,590,000 | |
R.R. Donnelley & Sons Company | | | 4.95 | | | | 04/01/2014 | | | | 9,000,000 | | | | 9,225,000 | |
| | | | |
| | | | | | | | | | | | | | | 54,345,335 | |
| | | | | | | | | | | | | | | | |
| | | | |
| Machinery: 2.76% | | | | | | | | | | | | | | | | |
Case New Holland Incorporated | | | 7.75 | | | | 09/01/2013 | | | | 3,500,000 | | | | 3,745,000 | |
SPX Corporation | | | 7.63 | | | | 12/15/2014 | | | | 9,085,000 | | | | 10,197,913 | |
Terex Corporation | | | 10.88 | | | | 06/01/2016 | | | | 5,000,000 | | | | 5,681,250 | |
Westinghouse Air Brake Technology Corporation | | | 6.88 | | | | 07/31/2013 | | | | 4,000,000 | | | | 4,200,000 | |
| | | | |
| | | | | | | | | | | | | | | 23,824,163 | |
| | | | | | | | | | | | | | | | |
| | | | |
| Professional Services: 0.66% | | | | | | | | | | | | | | | | |
FTI Consulting Incorporated | | | 7.75 | | | | 10/01/2016 | | | | 5,500,000 | | | | 5,726,875 | |
| | | | | | | | | | | | | | | | |
| | | | |
| Trading Companies & Distributors: 1.46% | | | | | | | | | | | | | | | | |
Ashtead Capital Incorporated 144A | | | 9.00 | | | | 08/15/2016 | | | | 5,500,000 | | | | 5,747,500 | |
United Rentals North America Incorporated | | | 10.88 | | | | 06/15/2016 | | | | 6,000,000 | | | | 6,855,000 | |
| | | | |
| | | | | | | | | | | | | | | 12,602,500 | |
| | | | | | | | | | | | | | | | |
| | | | |
Information Technology: 0.80% | | | | | | | | | | | | | | | | |
| | | | |
| Electronic Equipment, Instruments & Components: 0.80% | | | | | | | | | | | | | | | | |
Jabil Circuit Incorporated | | | 7.75 | | | | 07/15/2016 | | | | 6,000,000 | | | | 6,960,000 | |
| | | | | | | | | | | | | | | | |
| | | | |
Materials: 3.07% | | | | | | | | | | | | | | | | |
| | | | |
| Containers & Packaging: 2.38% | | | | | | | | | | | | | | | | |
Ball Corporation | | | 7.13 | | | | 09/01/2016 | | | | 7,000,000 | | | | 7,665,000 | |
Berry Plastics Corporation | | | 8.25 | | | | 11/15/2015 | | | | 5,000,000 | | | | 5,375,000 | |
Silgan Holdings Incorporated | | | 7.25 | | | | 08/15/2016 | | | | 7,000,000 | | | | 7,560,000 | |
| | | | |
| | | | | | | | | | | | | | | 20,600,000 | |
| | | | | | | | | | | | | | | | |
| | | | |
| Metals & Mining: 0.36% | | | | | | | | | | | | | | | | |
United States Steel Corporation | | | 5.65 | | | | 06/01/2013 | | | | 3,000,000 | | | | 3,082,500 | |
| | | | | | | | | | | | | | | | |
| | | | |
| Paper & Forest Products: 0.33% | | | | | | | | | | | | | | | | |
Neenah Paper Incorporated | | | 7.38 | | | | 11/15/2014 | | | | 2,834,000 | | | | 2,855,255 | |
| | | | | | | | | | | | | | | | |
| | | | |
Telecommunication Services: 6.74% | | | | | | | | | | | | | | | | |
| | | | |
| Diversified Telecommunication Services: 4.56% | | | | | | | | | | | | | | | | |
Cincinnati Bell Incorporated | | | 7.00 | | | | 02/15/2015 | | | | 6,000,000 | | | | 6,060,000 | |
Frontier Communications Corporation | | | 7.88 | | | | 04/15/2015 | | | | 2,000,000 | | | | 2,145,000 | |
Frontier Communications Corporation | | | 8.25 | | | | 05/01/2014 | | | | 6,340,000 | | | | 6,894,750 | |
Intelsat Jackson Holdings Limited | | | 9.50 | | | | 06/15/2016 | | | | 2,000,000 | | | | 2,105,000 | |
Qwest Communications International Incorporated Series B | | | 7.50 | | | | 02/15/2014 | | | | 5,500,000 | | | | 5,519,250 | |
SBA Telecommunications Incorporated | | | 8.00 | | | | 08/15/2016 | | | | 9,500,000 | | | | 10,236,250 | |
Windstream Corporation | | | 8.13 | | | | 08/01/2013 | | | | 6,000,000 | | | | 6,435,000 | |
| | | | |
| | | | | | | | | | | | | | | 39,395,250 | |
| | | | | | | | | | | | | | | | |
The accompanying notes are an integral part of these financial statements.
| | | | |
| 12 | | Wells Fargo Advantage Short-Term High Yield Bond Fund | | Portfolio of Investments—February 29, 2012 (Unaudited) |
| | | | | | | | | | | | | | | | |
| Security Name | | Interest Rate | | | Maturity Date | | | Principal | | | Value | |
| | | | | | | | | | | | | | | | |
| | | | |
| Wireless Telecommunication Services: 2.18% | | | | | | | | | | | | | | | | |
Crown Castle International Corporation | | | 9.00 | % | | | 01/15/2015 | | | $ | 9,000,000 | | | $ | 9,922,500 | |
Embarq Corporation | | | 7.08 | | | | 06/01/2016 | | | | 8,000,000 | | | | 8,911,672 | |
| | | | |
| | | | | | | | | | | | | | | 18,834,172 | |
| | | | | | | | | | | | | | | | |
| | | | |
Utilities: 0.85% | | | | | | | | | | | | | | | | |
| | | | |
| Independent Power Producers & Energy Traders: 0.85% | | | | | | | | | | | | | | | | |
AES Corporation | | | 7.75 | | | | 03/01/2014 | | | | 6,750,000 | | | | 7,340,625 | |
| | | | | | | | | | | | | | | | |
| | | | |
Total Corporate Bonds and Notes (Cost $574,878,604) | | | | | | | | | | | | | | | 585,145,990 | |
| | | | | | | | | | | | | | | | |
| | | | |
Municipal Bonds and Notes: 1.05% | | | | | | | | | | | | | | | | |
| | | | |
| California: 0.57% | | | | | | | | | | | | | | | | |
California Judgment Trust (Miscellaneous Revenue) ± | | | 1.70 | | | | 06/01/2015 | | | | 5,165,000 | | | | 4,898,228 | |
| | | | | | | | | | | | | | | | |
| | | | |
Michigan: 0.48% | | | | | | | | | | | | | | | | |
Wayne County MI (Tax Revenue) | | | 5.00 | | | | 09/15/2013 | | | | 4,131,000 | | | | 4,152,646 | |
| | | | | | | | | | | | | | | | |
| | | | |
Total Municipal Bonds and Notes (Cost $8,997,050) | | | | | | | | | | | | | | | 9,050,874 | |
| | | | | | | | | | | | | | | | |
| | | | |
| Non-Agency Mortgage Backed Securities: 0.01% | | | | | | | | | | | | | | | | |
Salomon Brothers Mortgage Securities VII Series 1994-5 Class B2 ± | | | 2.84 | | | | 04/25/2024 | | | | 89,572 | | | | 73,406 | |
| | | | | | | | | | | | | | | | |
| | | | |
Total Non-Agency Mortgage Backed Securities (Cost $89,695) | | | | | | | | | | | | | | | 73,406 | |
| | | | | | | | | | | | | | | | |
| | | | |
| Term Loans: 21.74% | | | | | | | | | | | | | | | | |
American Rock Salt Holdings LLC | | | 5.50 | | | | 04/25/2017 | | | | 5,955,000 | | | | 5,533,922 | |
Atlantic Broadband Finance LLC | | | 4.00 | | | | 03/08/2016 | | | | 4,322,312 | | | | 4,303,423 | |
Biomet Incorporated | | | 3.46 | | | | 03/25/2015 | | | | 6,377,465 | | | | 6,306,420 | |
Chrysler Group LLC | | | 6.00 | | | | 05/24/2017 | | | | 3,980,000 | | | | 3,989,472 | |
Cinemark USA Incorporated | | | 3.63 | | | | 04/29/2016 | | | | 2,917,385 | | | | 2,911,929 | |
CommScope Incorporated | | | 5.00 | | | | 01/14/2018 | | | | 2,977,500 | | | | 2,976,130 | |
Community Health Systems Incorporated | | | 3.00 | | | | 07/25/2014 | | | | 3,712,541 | | | | 3,663,165 | |
Community Health Systems Incorporated | | | 3.25 | | | | 07/25/2014 | | | | 190,632 | | | | 188,097 | |
Convatec Limited | | | 5.75 | | | | 12/22/2016 | | | | 495,000 | | | | 493,609 | |
DaVita Incorporated | | | 4.50 | | | | 10/20/2016 | | | | 4,950,000 | | | | 4,961,336 | |
Dean Foods Company | | | 2.08 | | | | 04/02/2014 | | | | 2,426,137 | | | | 2,382,564 | |
Delphi Corporation | | | 3.50 | | | | 03/31/2017 | | | | 4,068,421 | | | | 4,063,295 | |
Dollar General Corporation | | | 3.14 | | | | 07/07/2014 | | | | 4,659,542 | | | | 4,660,054 | |
Education Management LLC | | | 2.38 | | | | 06/03/2013 | | | | 1,978,630 | | | | 1,923,605 | |
Federal Mogul Corporation | | | 2.19 | | | | 12/28/2015 | | | | 1,337,420 | | | | 1,279,242 | |
Federal Mogul Corporation | | | 2.20 | | | | 12/29/2014 | | | | 2,621,343 | | | | 2,507,315 | |
Freescale Semiconductor | | | 4.52 | | | | 12/01/2016 | | | | 2,990,221 | | | | 2,913,611 | |
Getty Images Incorporated | | | 5.25 | | | | 11/07/2016 | | | | 3,922,756 | | | | 3,937,466 | |
Goodman Global Holdings Incorporated | | | 5.75 | | | | 10/28/2016 | | | | 4,191,083 | | | | 4,211,452 | |
HCA Incorporated | | | 2.50 | | | | 11/18/2013 | | | | 6,826,832 | | | | 6,788,465 | |
Hertz Corporation | | | 3.75 | | | | 03/09/2018 | | | | 496,250 | | | | 494,930 | |
Iasis Healthcare Corporation | | | 5.00 | | | | 05/03/2018 | | | | 5,955,000 | | | | 5,917,781 | |
Intelsat Jackson Holdings SA | | | 5.25 | | | | 04/02/2018 | | | | 3,970,000 | | | | 3,963,251 | |
KAR Auction Services Incorporated | | | 5.00 | | | | 05/19/2017 | | | | 4,965,763 | | | | 4,959,556 | |
Manitowoc Company Incorporated | | | 4.25 | | | | 11/13/2017 | | | | 4,150,000 | | | | 4,137,550 | |
MedAssets Incorporated | | | 5.25 | | | | 11/16/2016 | | | | 3,189,409 | | | | 3,190,079 | |
The accompanying notes are an integral part of these financial statements.
| | | | | | |
| Portfolio of Investments—February 29, 2012 (Unaudited) | | Wells Fargo Advantage Short-Term High Yield Bond Fund | | | 13 | |
| | | | | | | | | | | | | | | | |
| Security Name | | Interest Rate | | | Maturity Date | | | Principal | | | Value | |
| | | | | | | | | | | | | | | | |
| | | | |
| Term Loans (continued) | | | | | | | | | | | | | | | | |
MetroPCS Wireless Incorporated < | | | 4.11 | % | | | 11/04/2016 | | | $ | 7,450,330 | | | $ | 7,385,140 | |
Michaels Stores Incorporated | | | 5.13 | | | | 07/31/2016 | | | | 6,000,000 | | | | 5,965,500 | |
NBTY Incorporated | | | 4.25 | | | | 10/02/2017 | | | | 5,172,889 | | | | 5,170,199 | |
Neiman Marcus Group | | | 4.75 | | | | 05/16/2018 | | | | 4,000,000 | | | | 3,968,000 | |
Novelis Incorporated | | | 4.00 | | | | 03/10/2017 | | | | 2,970,000 | | | | 2,955,150 | |
Omnova Solutions Incorporated | | | 5.75 | | | | 05/31/2017 | | | | 2,345,313 | | | | 2,331,639 | |
Phillips Van Heusen Corporation | | | 3.50 | | | | 05/06/2016 | | | | 3,092,630 | | | | 3,095,723 | |
Pinnacle Foods Finance LLC | | | 2.84 | | | | 04/02/2014 | | | | 2,985,812 | | | | 2,967,659 | |
Reynolds Group Holdings Incorporated | | | 6.50 | | | | 02/09/2018 | | | | 3,927,287 | | | | 3,962,632 | |
RMK Acquisition Corporation (Aramark) | | | 0.15 | | | | 01/27/2014 | | | | 253,281 | | | | 251,136 | |
RMK Acquisition Corporation (Aramark) | | | 2.45 | | | | 01/27/2014 | | | | 2,612,497 | | | | 2,590,369 | |
Seminole Tribe of Florida | | | 2.13 | | | | 03/05/2014 | | | | 680,334 | | | | 670,693 | |
Seminole Tribe of Florida | | | 2.13 | | | | 03/05/2014 | | | | 378,266 | | | | 372,906 | |
Seminole Tribe of Florida | | | 2.13 | | | | 03/05/2014 | | | | 1,365,158 | | | | 1,345,814 | |
Sensata Technologies BV | | | 4.00 | | | | 05/11/2018 | | | | 4,975,000 | | | | 4,964,602 | |
Styron LLC | | | 6.01 | | | | 08/02/2017 | | | | 495,000 | | | | 446,327 | |
Sungard Data Systems Incorporated | | | 2.00 | | | | 02/28/2014 | | | | 1,957,431 | | | | 1,952,870 | |
Sungard Data Systems Incorporated | | | 4.06 | | | | 02/26/2016 | | | | 1,546,473 | | | | 1,542,916 | |
Swift Transportation Companies Incorporated | | | 6.00 | | | | 12/15/2017 | | | | 4,000,000 | | | | 3,990,000 | |
Swift Transportation Companies Incorporated | | | 6.00 | | | | 12/21/2016 | | | | 7,050,324 | | | | 7,050,324 | |
Syniverse Technologies Incorporated | | | 5.25 | | | | 12/21/2017 | | | | 990,000 | | | | 991,703 | |
Terex Corporation | | | 5.50 | | | | 04/28/2017 | | | | 1,995,000 | | | | 2,009,125 | |
Time Warner Telecom Holdings | | | 3.50 | | | | 12/29/2016 | | | | 6,014,150 | | | | 5,989,071 | |
Toys R Us | | | 5.25 | | | | 09/01/2016 | | | | 2,955,000 | | | | 2,957,837 | |
Toys R Us | | | 6.00 | | | | 06/14/2018 | | | | 2,977,500 | | | | 2,942,157 | |
Transdigm Incorporated | | | 4.00 | | | | 02/14/2017 | | | | 3,960,000 | | | | 3,956,515 | |
UCI International Incorporated | | | 5.50 | | | | 07/26/2017 | | | | 3,616,722 | | | | 3,625,764 | |
Vanguard Health Holding Company LLC | | | 5.00 | | | | 01/29/2016 | | | | 3,930,523 | | | | 3,920,697 | |
West Corporation | | | 4.62 | | | | 07/15/2016 | | | | 5,928,923 | | | | 5,930,168 | |
| | | | |
Total Term Loans (Cost $188,095,660) | | | | | | | | | | | | | | | 187,960,355 | |
| | | | | | | | | | | | | | | | |
| | | | |
Yankee Corporate Bonds and Notes: 3.97% | | | | | | | | | | | | | | | | |
| | | | |
Consumer Discretionary: 1.72% | | | | | | | | | | | | | | | | |
| | | | |
| Media: 1.72% | | | | | | | | | | | | | | | | |
Videotron Limited | | | 6.88 | | | | 01/15/2014 | | | | 4,612,000 | | | | 4,629,295 | |
Virgin Media Finance plc | | | 9.50 | | | | 08/15/2016 | | | | 9,000,000 | | | | 10,260,000 | |
| | | | |
| | | | | | | | | | | | | | | 14,889,295 | |
| | | | | | | | | | | | | | | | |
| | | | |
Financials: 0.62% | | | | | | | | | | | | | | | | |
| | | | |
| Consumer Finance: 0.62% | | | | | | | | | | | | | | | | |
Ineos Finance plc 144A | | | 9.00 | | | | 05/15/2015 | | | | 5,000,000 | | | | 5,300,000 | |
| | | | | | | | | | | | | | | | |
| | | | |
Materials: 1.63% | | | | | | | | | | | | | | | | |
| | | | |
| Metals & Mining: 0.73% | | | | | | | | | | | | | | | | |
FMG Resources Limited 144A | | | 7.00 | | | | 11/01/2015 | | | | 6,000,000 | | | | 6,345,000 | |
| | | | | | | | | | | | | | | | |
| | | | |
| Paper & Forest Products: 0.90% | | | | | | | | | | | | | | | | |
PE Paper Escrow GmbH 144A | | | 12.00 | | | | 08/01/2014 | | | | 4,805,000 | | | | 5,237,450 | |
The accompanying notes are an integral part of these financial statements.
| | | | |
| 14 | | Wells Fargo Advantage Short-Term High Yield Bond Fund | | Portfolio of Investments—February 29, 2012 (Unaudited) |
| | | | | | | | | | | | | | | | |
| Security Name | | Interest Rate | | | Maturity Date | | | Principal | | | Value | |
| | | | | | | | | | | | | | | | |
| | | | |
| Paper & Forest Products (continued) | | | | | | | | | | | | | | | | |
UPM Kymmene Corporation 144A | | | 5.63 | % | | | 12/01/2014 | | | $ | 2,500,000 | | | $ | 2,525,000 | |
| | | | |
| | | | | | | | | | | | | | | 7,762,450 | |
| | | | | | | | | | | | | | | | |
| | | | |
Total Yankee Corporate Bonds and Notes (Cost $34,244,391) | | | | | | | | | | | | | | | 34,296,745 | |
| | | | | | | | | | | | | | | | |
| | | | |
| Other: 0.01% | | | | | | | | | | | | | | | | |
Gryphon Funding Limited, Pass-Through Entity (v)(i)(a) | | | | | | | | | | | 145,205 | | | | 39,205 | |
VFNC Corporation, Pass-Through Entity, 0.24% 144A±(v)(i)(a) | | | | | | | | | | | 163,758 | | | | 70,416 | |
| | | | |
Total Other (Cost $48,075) | | | | | | | | | | | | | | | 109,621 | |
| | | | | | | | | | | | | | | | |
| | | | |
| | | Yield | | | | | | Shares | | | | |
| Short-Term Investments: 6.66% | | | | | | | | | | | | | | | | |
| | | | |
| Investment Companies: 6.66% | | | | | | | | | | | | | | | | |
Wells Fargo Advantage Cash Investment Money Market Fund, Institutional Class (l)(u)## | | | 0.02 | | | | | | | | 51,180,928 | | | | 51,180,928 | |
Wells Fargo Securities Lending Cash Investments, LLC (v)(l)(u)(r) | | | 0.15 | | | | | | | | 6,347,100 | | | | 6,347,100 | |
| | | | |
Total Short-Term Investments (Cost $57,528,028) | | | | | | | | | | | | | | | 57,528,028 | |
| | | | | | | | | | | | | | | | |
| | | | | | | | |
| Total Investments in Securities | | | | | | | | |
| (Cost $863,881,503) * | | | 101.13 | % | | | 874,165,019 | |
Other Assets and Liabilities, Net | | | (1.13 | ) | | | (9,759,040 | ) |
| | | | | | | | |
| Total Net Assets | | | 100.00 | % | | $ | 864,405,979 | |
| | | | | | | | |
| 144A | Security that may be resold to “qualified institutional buyers” under Rule 144A or security offered pursuant to Section 4(2) of the Securities Act of 1933, as amended. |
| ± | Variable rate investment. |
| « | All or a portion of this security is on loan. |
| < | All or a portion of the position represents an unfunded loan commitment. |
| (v) | Security represents investment of cash collateral received from securities on loan. |
| (a) | Security is fair valued by the Management Valuation Team, and in certain instances by the Board of Trustees, in accordance with procedures approved by the Board of Trustees. |
| (l) | Investment in an affiliate. |
| (u) | Rate shown is the 7-day annualized yield at period end. |
| ## | All or a portion of this security has been segregated for when-issued securities or unfunded loans. |
| (r) | The investment company is exempt from registration under Section 3(c)(7) of the 1940 Act. |
| * | Cost for federal income tax purposes is $863,941,771 and net unrealized appreciation (depreciation) consists of: |
| | | | |
Gross unrealized appreciation | | $ | 13,010,845 | |
Gross unrealized depreciation | | | (2,787,597 | ) |
| | | | |
Net unrealized appreciation | | $ | 10,223,248 | |
The accompanying notes are an integral part of these financial statements.
| | | | | | |
| Statement of Assets and Liabilities—February 29, 2012 (Unaudited) | | Wells Fargo Advantage Short-Term High Yield Bond Fund | | | 15 | |
| | | | |
| | | | |
| |
Assets | | | | |
Investments | | | | |
In unaffiliated securities (including securities on loan), at value (see cost below) | | $ | 816,636,991 | |
In affiliated securities, at value (see cost below) | | | 57,528,028 | |
| | | | |
Total investments, at value (see cost below) | | | 874,165,019 | |
Receivable for investments sold | | | 3,571,429 | |
Receivable for Fund shares sold | | | 3,002,624 | |
Receivable for interest | | | 11,919,176 | |
Receivable for securities lending income | | | 1,754 | |
Prepaid expenses and other assets | | | 78,033 | |
| | | | |
Total assets | | | 892,738,035 | |
| | | | |
| |
Liabilities | | | | |
Dividends payable | | | 786,644 | |
Payable for investments purchased | | | 19,309,056 | |
Payable for Fund shares redeemed | | | 1,273,616 | |
Payable upon receipt of securities loaned | | | 6,395,175 | |
Advisory fee payable | | | 211,015 | |
Distribution fees payable | | | 49,410 | |
Due to other related parties | | | 114,280 | |
Accrued expenses and other liabilities | | | 192,860 | |
| | | | |
Total liabilities | | | 28,332,056 | |
| | | | |
Total net assets | | $ | 864,405,979 | |
| | | | |
| |
NET ASSETS CONSIST OF | | | | |
Paid-in capital | | $ | 857,601,606 | |
Overdistributed net investment income | | | (795,792 | ) |
Accumulated net realized losses on investments | | | (2,683,351 | ) |
Net unrealized gains on investments | | | 10,283,516 | |
| | | | |
Total net assets | | $ | 864,405,979 | |
| | | | |
| |
COMPUTATION OF NET ASSET VALUE AND OFFERING PRICE PER SHARE1 | | | | |
Net assets – Class A | | $ | 211,263,912 | |
Shares outstanding – Class A | | | 25,661,778 | |
Net asset value per share – Class A | | | $8.23 | |
Maximum offering price per share – Class A2 | | | $8.48 | |
Net assets – Class C | | $ | 85,293,198 | |
Shares outstanding – Class C | | | 10,360,341 | |
Net asset value per share – Class C | | | $8.23 | |
Net assets – Administrator Class | | $ | 356,560,423 | |
Shares outstanding – Administrator Class | | | 43,325,167 | |
Net asset value per share – Administrator Class | | | $8.23 | |
Net assets – Investor Class | | $ | 211,288,446 | |
Shares outstanding – Investor Class | | | 25,666,532 | |
Net asset value per share – Investor Class | | | $8.23 | |
| |
Investments in unaffiliated securities, at cost | | $ | 806,353,475 | |
| | | | |
Investments in affiliated securities, at cost | | $ | 57,528,028 | |
| | | | |
Total investments, at cost | | $ | 863,881,503 | |
| | | | |
Securities on loan, at value | | $ | 6,256,513 | |
| | | | |
| 1. | The Fund has an unlimited number of authorized shares. |
| 2. | Maximum offering price is computed as 100/97 of net asset value. On investments of $50,000 or more, the offering price is reduced. |
The accompanying notes are an integral part of these financial statements.
| | | | |
| 16 | | Wells Fargo Advantage Short-Term High Yield Bond Fund | | Statement of Operations—Six Months Ended February 29, 2012 (Unaudited) |
| | | | |
| | | | |
| |
Investment income | | | | |
Interest | | $ | 20,333,603 | |
Income from affiliated securities | | | 32,420 | |
Securities lending income, net | | | 6,605 | |
| | | | |
Total investment income | | | 20,372,628 | |
| | | | |
| |
Expenses | | | | |
Advisory fee | | | 1,892,432 | |
Administration fees | | | | |
Fund level | | | 192,660 | |
Class A | | | 160,944 | |
Class C | | | 61,741 | |
Administrator Class | | | 150,808 | |
Investor Class | | | 181,136 | |
Shareholder servicing fees | | | | |
Class A | | | 251,475 | |
Class C | | | 96,470 | |
Administrator Class | | | 366,416 | |
Investor Class | | | 238,337 | |
Distribution fees | | | | |
Class C | | | 289,409 | |
Custody and accounting fees | | | 27,031 | |
Professional fees | | | 18,679 | |
Registration fees | | | 27,650 | |
Shareholder report expenses | | | 43,287 | |
Trustees’ fees and expenses | | | 5,274 | |
Other fees and expenses | | | 20,386 | |
| | | | |
Total expenses | | | 4,024,135 | |
Less: Fee waivers and/or expense reimbursements | | | (826,321 | ) |
| | | | |
Net expenses | | | 3,197,814 | |
| | | | |
Net investment income | | | 17,174,814 | |
| | | | |
| |
REALIZED AND UNREALIZED GAINS (LOSSES) ON INVESTMENTS | | | | |
Net realized losses on investments | | | (2,594,226 | ) |
Net change in unrealized gains (losses) on investments | | | 26,035,023 | |
| | | | |
Net realized and unrealized gains (losses) on investments | | | 23,440,797 | |
| | | | |
Net increase in net assets resulting from operations | | $ | 40,615,611 | |
| | | | |
The accompanying notes are an integral part of these financial statements.
| | | | | | |
| Statements of Changes in Net Assets | | Wells Fargo Advantage Short-Term High Yield Bond Fund | | | 17 | |
| | | | | | | | | | | | | | | | |
| | | Six Months Ended
February 29, 2012
(Unaudited) | | | Year Ended
August 31, 2011 | |
| | | | |
Operations | | | | | | | | | | | | | | | | |
Net investment income | | | | | | $ | 17,174,814 | | | | | | | $ | 29,291,466 | |
Net realized gains (losses) on investments | | | | | | | (2,594,226 | ) | | | | | | | 4,578,954 | |
Net change in unrealized gains (losses) on investments | | | | | | | 26,035,023 | | | | | | | | (22,425,918 | ) |
| | | | | | | | | | | | | | | | |
Net increase in net assets resulting from operations | | | | | | | 40,615,611 | | | | | | | | 11,444,502 | |
| | | | | | | | | | | | | | | | |
| | | | |
Distributions to shareholders from | | | | | | | | | | | | | | | | |
Net investment income | | | | | | | | | | | | | | | | |
Class A | | | | | | | (4,509,730 | ) | | | | | | | (9,606,382 | ) |
Class C | | | | | | | (1,436,479 | ) | | | | | | | (2,133,766 | ) |
Administrator Class | | | | | | | (6,995,496 | ) | | | | | | | (8,867,546 | ) |
Investor Class | | | | | | | (4,233,109 | ) | | | | | | | (8,752,298 | ) |
Net realized gains | | | | | | | | | | | | | | | | |
Class A | | | | | | | (1,020,607 | ) | | | | | | | 0 | |
Class C | | | | | | | (396,551 | ) | | | | | | | 0 | |
Administrator Class | | | | | | | (1,507,050 | ) | | | | | | | 0 | |
Investor Class | | | | | | | (980,285 | ) | | | | | | | 0 | |
| | | | | | | | | | | | | | | | |
Total distributions to shareholders | | | | | | | (21,079,307 | ) | | | | | | | (29,359,992 | ) |
| | | | | | | | | | | | | | | | |
| | | | |
Capital share transactions | | | Shares | | | | | | | | Shares | | | | | |
Proceeds from shares sold | | | | | | | | | | | | | | | | |
Class A | | | 5,952,135 | | | | 48,380,262 | | | | 19,332,346 | | | | 160,007,266 | |
Class C | | | 2,139,450 | | | | 17,397,281 | | | | 5,908,141 | | | | 48,870,662 | |
Administrator Class | | | 19,882,686 | | | | 161,068,385 | | | | 40,593,904 | | | | 335,757,566 | |
Investor Class | | | 11,116,522 | | | | 90,128,839 | | | | 16,435,101 | | | | 135,892,540 | |
| | | | | | | | | | | | | | | | |
| | | | | | | 316,974,767 | | | | | | | | 680,528,034 | |
| | | | | | | | | | | | | | | | |
Reinvestment of distributions | | | | | | | | | | | | | | | | |
Class A | | | 599,632 | | | | 4,870,384 | | | | 955,857 | | | | 7,892,159 | |
Class C | | | 167,538 | | | | 1,360,946 | | | | 178,177 | | | | 1,470,543 | |
Administrator Class | | | 605,672 | | | | 4,923,351 | | | | 445,301 | | | | 3,671,974 | |
Investor Class | | | 538,441 | | | | 4,373,799 | | | | 850,959 | | | | 7,027,165 | |
| | | | | | | | | | | | | | | | |
| | | | | | | 15,528,480 | | | | | | | | 20,061,841 | |
| | | | | | | | | | | | | | | | |
Payment for shares redeemed | | | | | | | | | | | | | | | | |
Class A | | | (5,970,518 | ) | | | (48,453,497 | ) | | | (24,011,790 | ) | | | (197,683,942 | ) |
Class C | | | (886,085 | ) | | | (7,200,535 | ) | | | (1,551,311 | ) | | | (12,789,167 | ) |
Administrator Class | | | (8,199,372 | ) | | | (66,625,196 | ) | | | (10,010,360 | ) | | | (82,141,751 | ) |
Investor Class | | | (7,264,881 | ) | | | (58,961,520 | ) | | | (17,750,448 | ) | | | (146,262,384 | ) |
| | | | | | | | | | | | | | | | |
| | | | | | | (181,240,748 | ) | | | | | | | (438,877,244 | ) |
| | | | | | | | | | | | | | | | |
Net increase in net assets resulting from capital share transactions | | | | | | | 151,262,499 | | | | | | | | 261,712,631 | |
| | | | | | | | | | | | | | | | |
Total increase in net assets | | | | | | | 170,798,803 | | | | | | | | 243,797,141 | |
| | | | | | | | | | | | | | | | |
| | | | |
Net assets | | | | | | | | | | | | | | | | |
Beginning of period | | | | | | | 693,607,176 | | | | | | | | 449,810,035 | |
| | | | | | | | | | | | | | | | |
End of period | | | | | | $ | 864,405,979 | | | | | | | $ | 693,607,176 | |
| | | | | | | | | | | | | | | | |
Overdistributed net investment income | | | | | | $ | (795,792 | ) | | | | | | $ | (795,792 | ) |
| | | | | | | | | | | | | | | | |
The accompanying notes are an integral part of these financial statements.
| | | | |
| 18 | | Wells Fargo Advantage Short-Term High Yield Bond Fund | | Financial Highlights |
(For a share outstanding throughout each period)
| | | | | | | | | | | | | | | | | | | | | | | | | | | | |
| | | Six Months Ended
February 29, 2012 (Unaudited) | | | Year Ended August 31, | | | Year Ended May 31, | |
| Class A | | | 2011 | | | 20101 | | | 2010 | | | 20092 | | | 20082 | | | 20072 | |
Net asset value, beginning of period | | $ | 8.04 | | | $ | 8.18 | | | $ | 8.09 | | | $ | 7.82 | | | $ | 8.31 | | | $ | 8.54 | | | $ | 8.49 | |
Net investment income | | | 0.18 | | | | 0.40 | | | | 0.11 | | | | 0.45 | | | | 0.40 | | | | 0.47 | | | | 0.49 | |
Net realized and unrealized gains (losses)
on investments | | | 0.23 | | | | (0.14 | ) | | | 0.09 | | | | 0.26 | | | | (0.49 | ) | | | (0.23 | ) | | | 0.05 | |
| | | | | | | | | | | | | | | | | | | | | | | | | | | | |
Total from investment operations | | | 0.41 | | | | 0.26 | | | | 0.20 | | | | 0.71 | | | | (0.09 | ) | | | 0.24 | | | | 0.54 | |
Distributions to shareholders from | | | | | | | | | | | | | | | | | | | | | | | | | | | | |
Net investment income | | | (0.18 | ) | | | (0.40 | ) | | | (0.11 | ) | | | (0.44 | ) | | | (0.40 | ) | | | (0.47 | ) | | | (0.49 | ) |
Net realized gains | | | (0.04 | ) | | | 0.00 | | | | 0.00 | | | | 0.00 | | | | 0.00 | | | | 0.00 | | | | 0.00 | |
| | | | | | | | | | | | | | | | | | | | | | | | | | | | |
Total distributions to shareholders | | | (0.22 | ) | | | (0.40 | ) | | | (0.11 | ) | | | (0.44 | ) | | | (0.40 | ) | | | (0.47 | ) | | | (0.49 | ) |
Net asset value, end of period | | $ | 8.23 | | | $ | 8.04 | | | $ | 8.18 | | | $ | 8.09 | | | $ | 7.82 | | | $ | 8.31 | | | $ | 8.54 | |
Total return3 | | | 5.19 | % | | | 3.10 | % | | | 2.43 | % | | | 9.17 | % | | | (0.89 | )% | | | 2.98 | % | | | 6.48 | % |
Ratios to average net assets (annualized) | | | | | | | | | | | | | | | | | | | | | | | | | | | | |
Gross expenses | | | 0.99 | % | | | 1.00 | % | | | 1.01 | % | | | 1.03 | % | | | 1.08 | % | | | 1.20 | % | | | 1.22 | % |
Net expenses | | | 0.81 | % | | | 0.81 | % | | | 0.81 | % | | | 0.81 | % | | | 0.81 | % | | | 0.86 | % | | | 0.86 | % |
Net investment income | | | 4.48 | % | | | 4.77 | % | | | 5.14 | % | | | 5.50 | % | | | 5.27 | % | | | 5.70 | % | | | 5.70 | % |
Supplemental data | | | | | | | | | | | | | | | | | | | | | | | | | | | | |
Portfolio turnover rate | | | 11 | % | | | 36 | % | | | 15 | % | | | 40 | % | | | 46 | % | | | 59 | % | | | 50 | % |
Net assets, end of period (000’s omitted) | | | $211,264 | | | | $201,523 | | | | $235,754 | | | | $212,688 | | | | $110,451 | | | | $15,781 | | | | $22,076 | |
| 1. | For the three months ended August 31, 2010. The Fund changed its fiscal year end from May 31 to August 31, effective August 31, 2010. |
| 2. | On June 20, 2008, Advisor Class was renamed Class A. |
| 3. | Total return calculations do not include any sales charges. Returns for periods of less than one year are not annualized. |
The accompanying notes are an integral part of these financial statements.
| | | | | | |
| Financial Highlights | | Wells Fargo Advantage Short-Term High Yield Bond Fund | | | 19 | |
(For a share outstanding throughout each period)
| | | | | | | | | | | | | | | | | | | | | | | | |
| | | Six Months Ended
February 29, 2012 (Unaudited) | | | Year Ended August 31, | | | Year Ended May 31, | |
| Class C | | | 2011 | | | 20101 | | | 2010 | | | 2009 | | | 20082 | |
Net asset value, beginning of period | | $ | 8.04 | | | $ | 8.18 | | | $ | 8.09 | | | $ | 7.82 | | | $ | 8.31 | | | $ | 8.22 | |
Net investment income | | | 0.15 | | | | 0.33 | | | | 0.09 | | | | 0.38 | | | | 0.34 | | | | 0.06 | |
Net realized and unrealized gains (losses)
on investments | | | 0.23 | | | | (0.14 | ) | | | 0.09 | | | | 0.26 | | | | (0.49 | ) | | | 0.09 | |
| | | | | | | | | | | | | | | | | | | | | | | | |
Total from investment operations | | | 0.38 | | | | 0.19 | | | | 0.18 | | | | 0.64 | | | | (0.15 | ) | | | 0.15 | |
Distributions to shareholders from | | | | | | | | | | | | | | | | | | | | | | | | |
Net investment income | | | (0.15 | ) | | | (0.33 | ) | | | (0.09 | ) | | | (0.37 | ) | | | (0.34 | ) | | | (0.06 | ) |
Net realized gains | | | (0.04 | ) | | | 0.00 | | | | 0.00 | | | | 0.00 | | | | 0.00 | | | | 0.00 | |
| | | | | | | | | | | | | | | | | | | | | | | | |
Total distributions to shareholders | | | (0.19 | ) | | | (0.33 | ) | | | (0.09 | ) | | | (0.37 | ) | | | (0.34 | ) | | | (0.06 | ) |
Net asset value, end of period | | $ | 8.23 | | | $ | 8.04 | | | $ | 8.18 | | | $ | 8.09 | | | $ | 7.82 | | | $ | 8.31 | |
Total return3 | | | 4.80 | % | | | 2.33 | % | | | 2.24 | % | | | 8.35 | % | | | (1.70 | )% | | | 2.48 | % |
Ratios to average net assets (annualized) | | | | | | | | | | | | | | | | | | | | | | | | |
Gross expenses | | | 1.74 | % | | | 1.75 | % | | | 1.76 | % | | | 1.78 | % | | | 1.76 | % | | | 1.97 | % |
Net expenses | | | 1.56 | % | | | 1.56 | % | | | 1.56 | % | | | 1.56 | % | | | 1.56 | % | | | 1.56 | % |
Net investment income | | | 3.72 | % | | | 3.97 | % | | | 4.39 | % | | | 4.69 | % | | | 4.50 | % | | | 4.37 | % |
Supplemental data | | | | | | | | | | | | | | | | | | | | | | | | |
Portfolio turnover rate | | | 11 | % | | | 36 | % | | | 15 | % | | | 40 | % | | | 46 | % | | | 59 | % |
Net assets, end of period (000’s omitted) | | | $85,293 | | | | $71,831 | | | | $36,050 | | | | $32,985 | | | | $11,096 | | | | $18 | |
| 1. | For the three months ended August 31, 2010. The Fund changed its fiscal year end from May 31 to August 31, effective August 31, 2010. |
| 2. | For the period from March 31, 2008 (commencement of class operations) to May 31, 2008. |
| 3. | Total return calculations do not include any sales charges. Returns for periods of less than one year are not annualized. |
The accompanying notes are an integral part of these financial statements.
| | | | |
| 20 | | Wells Fargo Advantage Short-Term High Yield Bond Fund | | Financial Highlights |
(For a share outstanding throughout each period)
| | | | | | | | | | | | |
| | | Six Months Ended
February 29, 2012 (Unaudited) | | | Year Ended August 31, | |
| Administrator Class | | | 2011 | | | 20101 | |
Net asset value, beginning of period | | $ | 8.03 | | | $ | 8.18 | | | $ | 8.18 | |
Net investment income | | | 0.19 | | | | 0.41 | | | | 0.03 | 2 |
Net realized and unrealized gains (losses) on investments | | | 0.24 | | | | (0.15 | ) | | | 0.00 | |
| | | | | | | | | | | | |
Total from investment operations | | | 0.43 | | | | 0.26 | | | | 0.03 | |
Distributions to shareholders from | | | | | | | | | | | | |
Net investment income | | | (0.19 | ) | | | (0.41 | ) | | | (0.03 | ) |
Net realized gains | | | (0.04 | ) | | | 0.00 | | | | 0.00 | |
| | | | | | | | | | | | |
Total distributions to shareholders | | | (0.23 | ) | | | (0.41 | ) | | | (0.03 | ) |
Net asset value, end of period | | $ | 8.23 | | | $ | 8.03 | | | $ | 8.18 | |
Total return3 | | | 5.41 | % | | | 3.15 | % | | | 0.39 | % |
Ratios to average net assets (annualized) | | | | | | | | | | | | |
Gross expenses | | | 0.92 | % | | | 0.94 | % | | | 0.89 | % |
Net expenses | | | 0.65 | % | | | 0.65 | % | | | 0.64 | % |
Net investment income | | | 4.64 | % | | | 4.87 | % | | | 4.39 | % |
Supplemental data | | | | | | | | | | | | |
Portfolio turnover rate | | | 11 | % | | | 36 | % | | | 15 | % |
Net assets, end of period (000’s omitted) | | | $356,560 | | | | $249,301 | | | | $60 | |
| 1. | For the period from July 30, 2010 (commencement of class operations) to August 31, 2010. |
| 2. | Calculated based upon average shares outstanding. |
| 3. | Returns for periods of less than one year are not annualized. |
The accompanying notes are an integral part of these financial statements.
| | | | | | |
| Financial Highlights | | Wells Fargo Advantage Short-Term High Yield Bond Fund | | | 21 | |
(For a share outstanding throughout each period)
| | | | | | | | | | | | | | | | | | | | | | | | | | | | |
| | | Six Months Ended
February 29, 2012 (Unaudited) | | | Year Ended August 31, | | | Year Ended May 31, | |
| Investor Class | | | 2011 | | | 20101 | | | 2010 | | | 2009 | | | 2008 | | | 2007 | |
Net asset value, beginning of period | | $ | 8.03 | | | $ | 8.18 | | | $ | 8.09 | | | $ | 7.82 | | | $ | 8.31 | | | $ | 8.54 | | | $ | 8.49 | |
Net investment income | | | 0.18 | | | | 0.39 | | | | 0.11 | | | | 0.44 | | | | 0.40 | | | | 0.47 | | | | 0.49 | |
Net realized and unrealized gains (losses)
on investments | | | 0.24 | | | | (0.15 | ) | | | 0.08 | | | | 0.26 | | | | (0.49 | ) | | | (0.23 | ) | | | 0.05 | |
| | | | | | | | | | | | | | | | | | | | | | | | | | | | |
Total from investment operations | | | 0.42 | | | | 0.24 | | | | 0.19 | | | | 0.70 | | | | (0.09 | ) | | | (0.24 | ) | | | 0.54 | |
Distributions to shareholders from | | | | | | | | | | | | | | | | | | | | | | | | | | | | |
Net investment income | | | (0.18 | ) | | | (0.39 | ) | | | (0.10 | ) | | | (0.43 | ) | | | (0.40 | ) | | | (0.47 | ) | | | (0.49 | ) |
Net realized gains | | | (0.04 | ) | | | 0.00 | | | | 0.00 | | | | 0.00 | | | | 0.00 | | | | 0.00 | | | | 0.00 | |
| | | | | | | | | | | | | | | | | | | | | | | | | | | | |
Total distributions to shareholders | | | (0.22 | ) | | | (0.39 | ) | | | (0.10 | ) | | | (0.43 | ) | | | (0.40 | ) | | | (0.47 | ) | | | (0.49 | ) |
Net asset value, end of period | | $ | 8.23 | | | $ | 8.03 | | | $ | 8.18 | | | $ | 8.09 | | | $ | 7.82 | | | $ | 8.31 | | | $ | 8.54 | |
Total return2 | | | 5.31 | % | | | 2.95 | % | | | 2.42 | % | | | 9.12 | % | | | (0.91 | )% | | | 2.98 | % | | | 6.48 | % |
Ratios to average net assets (annualized) | | | | | | | | | | | | | | | | | | | | | | | | | | | | |
Gross expenses | | | 1.02 | % | | | 1.03 | % | | | 1.05 | % | | | 1.07 | % | | | 1.13 | % | | | 1.34 | % | | | 1.39 | % |
Net expenses | | | 0.84 | % | | | 0.84 | % | | | 0.85 | % | | | 0.86 | % | | | 0.84 | % | | | 0.86 | % | | | 0.86 | % |
Net investment income | | | 4.44 | % | | | 4.76 | % | | | 5.10 | % | | | 5.49 | % | | | 5.20 | % | | | 5.69 | % | | | 5.70 | % |
Supplemental data | | | | | | | | | | | | | | | | | | | | | | | | | | | | |
Portfolio turnover rate | | | 11 | % | | | 36 | % | | | 15 | % | | | 40 | % | | | 46 | % | | | 59 | % | | | 50 | % |
Net assets, end of period (000’s omitted) | | | $211,288 | | | | $170,952 | | | | $177,946 | | | | $165,759 | | | | $128,789 | | | | $70,420 | | | | $96,071 | |
| 1. | For the three months ended August 31, 2010. The Fund changed its fiscal year end from May 31 to August 31, effective August 31, 2010. |
| 2. | Returns for periods of less than one year are not annualized. |
The accompanying notes are an integral part of these financial statements.
| | | | |
| 22 | | Wells Fargo Advantage Short-Term High Yield Bond Fund | | Notes to Financial Statements (Unaudited) |
1. ORGANIZATION
Wells Fargo Funds Trust (the “Trust”), a Delaware statutory trust organized on March 10, 1999, is an open-end management investment company registered under the Investment Company Act of 1940, as amended (the “1940 Act”). These financial statements report on Wells Fargo Advantage Short-Term High Yield Bond Fund (the “Fund”) which is a diversified series of the Trust.
2. SIGNIFICANT ACCOUNTING POLICIES
The following significant accounting policies, which are consistently followed in the preparation of the financial statements of the Fund, are in conformity with U.S. generally accepted accounting principles which require management to make estimates and assumptions that affect the reported amounts of assets and liabilities, disclosure of contingent assets and liabilities at the date of the financial statements, and the reported amounts of revenues and expenses during the reporting period. Actual results could differ from those estimates.
Securities valuation
Fixed income securities with original maturities exceeding 60 days are valued based on evaluated prices received from an independent pricing service approved by the Board of Trustees which may utilize both transaction data and market information such as yield, prices of securities of comparable quality, coupon rate, maturity, type of issue, trading characteristics and other market data. If valuations are not available from the pricing service or values received are deemed not representative of market value, values will be obtained from a third party broker-dealer or determined based on the Fund’s Fair Value Procedures.
Debt securities of sufficient credit quality with original maturities of 60 days or less generally are valued at amortized cost which approximates fair value. The amortized cost method involves valuing a security at its cost, plus accretion of discount or minus amortization of premium over the period until maturity.
Investments in open-end mutual funds and non-registered investment companies are generally valued at net asset value.
Investments which are not valued using any of the methods discussed above, are valued at their fair value, as determined by procedures established in good faith and approved by the Board of Trustees.
Security loans
The Fund may lend its securities from time to time in order to earn additional income in the form of fees or interest on securities received as collateral or the investment of any cash received as collateral. The Fund continues to receive interest or dividends on the securities loaned. The Fund receives collateral in the form of cash or securities with a value at least equal to the value of the securities on loan. The value of the loaned securities is determined at the close of each business day and any additional required collateral is delivered to the Fund on the next business day. In a securities lending transaction, the net asset value of the Fund will be affected by an increase or decrease in the value of the securities loaned and by an increase or decrease in the value of the instrument in which collateral is invested. The amount of securities lending activity undertaken by the Fund fluctuates from time to time. In the event of default or bankruptcy by the borrower, the Fund may be prevented from recovering the loaned securities or gaining access to the collateral or may experience delays or costs in doing so. In addition, the investment of any cash collateral received may lose all or part of its value. The Fund has the right under the lending agreement to recover the securities from the borrower on demand.
The Fund lends its securities through an unaffiliated securities lending agent. Cash collateral received in connection with its securities lending transactions is invested in Wells Fargo Securities Lending Cash Investments, LLC (the “Cash Collateral Fund”). The Cash Collateral Fund is exempt from registration under Section 3(c)(7) of the 1940 Act and is managed by Wells Fargo Funds Management LLC (“Funds Management”) and is sub-advised by Wells Capital Management Incorporated (“Wells Capital Management”). Funds Management receives an advisory fee starting at 0.05% and declining to 0.01% as the average daily net assets of the Cash Collateral Fund increase. All of the fees received by Funds Management are paid to Wells Capital Management for its services as sub-adviser. The Cash Collateral Fund seeks to provide a positive return compared to the daily Fed Funds Open rate by investing in high-quality, U.S. dollar-denominated short-term money market instruments. Cash Collateral Fund investments are fair valued based upon the amortized cost valuation technique. Income earned from investment in the Cash Collateral Fund is included in securities lending income on the Statement of Operations.
| | | | | | |
| Notes to Financial Statements (Unaudited) | | Wells Fargo Advantage Short-Term High Yield Bond Fund | | | 23 | |
For Wells Fargo Advantage Funds that participated in securities lending activity prior to February 13, 2009, certain structured investment vehicles purchased in a joint account by the former securities lending agent defaulted or were impaired. Certain of the Wells Fargo Advantage Funds still hold ownership interest in these structured investment vehicles, which have since been restructured as pass-through securities. If the Fund holds an ownership interest in such pass-through securities, information regarding this ownership interest can be found in the Portfolio of Investments under the category “Other”.
When-issued transactions
The Fund may purchase securities on a forward commitment or ‘when-issued’ basis. The Fund records a when-issued transaction on the trade date and will segregate assets to cover its obligation by confirming the availability of qualifying assets having a value sufficient to make payment for the securities purchased. Securities purchased on a when-issued basis are marked-to-market daily and the Fund begins earning interest on the settlement date. Losses may arise due to changes in the market value of the underlying securities or if the counterparty does not perform under the contract.
Term loans
The Fund may invest in term loans. The loans are marked-to-market daily and the Fund begins earning interest when the loans are funded. The loans pay interest at rates which are periodically reset by reference to a base lending rate plus a spread. The Fund assumes the credit risk of the borrower and there could be potential loss to the Fund in the event of default by the borrower.
Security transactions and income recognition
Securities transactions are recorded on a trade date basis. Realized gains or losses are reported on the basis of identified cost of securities delivered.
Interest income is accrued daily and bond discounts are accreted and premiums are amortized daily based on the effective interest method. To the extent debt obligations are placed on non-accrual status, any related interest income may be reduced by writing off interest receivables when the collection of all or a portion of interest has become doubtful based on consistently applied procedures. If the issuer subsequently resumes interest payments or when the collectability of interest is reasonably assured, the debt obligation is removed from non-accrual status.
Distributions to shareholders
Distributions to shareholders from net investment income are accrued daily and paid monthly. Distributions from net realized gains, if any, are recorded on the ex-dividend date. Such distributions are determined in conformity with income tax regulations, which may differ from generally accepted accounting principles.
Federal and other taxes
The Fund intends to continue to qualify as a regulated investment company by distributing substantially all of its investment company taxable income and any net realized capital gains (after reduction for capital loss carryforwards) sufficient to relieve it from all, or substantially all, federal income taxes. Accordingly, no provision for federal income taxes was required.
The Fund’s income and federal excise tax returns and all financial records supporting those returns for the prior three fiscal years are subject to examination by the federal and Delaware revenue authorities.
Under the recently enacted Regulated Investment Company Modernization Act of 2010, the Fund is permitted to carry forward capital losses incurred in taxable years which began after December 22, 2010 for an unlimited period. However, any losses incurred are required to be utilized prior to the losses incurred in pre-enactment taxable years. As a result of this ordering rule, pre-enactment capital loss carryforwards may be more likely to expire unused. Additionally, post-enactment capital losses that are carried forward will retain their character as either short-term or long-term capital losses rather than be considered all short-term as under previous law.
Class allocations
The separate classes of shares offered by the Fund differ principally in applicable sales charges, distribution, shareholder servicing and administration fees. Shareholders of each class bear certain expenses that pertain to that particular class. All shareholders bear the common expenses of the Fund, earn income from the portfolio, and are allocated unrealized gains and losses pro rata based on the average daily net assets of each class, without distinction between share classes.
| | | | |
| 24 | | Wells Fargo Advantage Short-Term High Yield Bond Fund | | Notes to Financial Statements (Unaudited) |
Dividends are determined separately for each class based on income and expenses allocable to each class. Realized gains and losses are allocated to each class pro rata based upon the net assets of each class on the date realized. Differences in per share dividend rates generally result from the relative weightings of pro rata income and realized gain allocations and from differences in separate class expenses, including distribution, shareholder servicing and administration fees.
3. FAIR VALUATION MEASUREMENTS
Fair value measurements of investments are determined within a framework that has established a fair value hierarchy based upon the various data inputs utilized in determining the value of the Fund’s investments. The three-level hierarchy gives the highest priority to unadjusted quoted prices in active markets for identical assets or liabilities (Level 1) and the lowest priority to significant unobservable inputs (Level 3). The Fund’s investments are classified within the fair value hierarchy based on the lowest level of input that is significant to the fair value measurement. The inputs are summarized into three broad levels as follows:
| n | | Level 1 – quoted prices in active markets for identical securities |
| n | | Level 2 – other significant observable inputs (including quoted prices for similar securities, interest rates, prepayment speeds, credit risk, etc.) |
| n | | Level 3 – significant unobservable inputs (including the Fund’s own assumptions in determining the fair value of investments) |
The inputs or methodologies used for valuing securities are not necessarily an indication of the risk associated with investing in those securities.
As of February 29, 2012, the inputs used in valuing the Fund’s assets, which are carried at fair value, were as follows:
| | | | | | | | | | | | | | | | |
| Investments in Securities | | Quoted Prices (Level 1) | | | Significant Other
Observable Inputs (Level 2) | | | Significant Unobservable Inputs (Level 3) | | | Total | |
| | | | |
Corporate bonds and notes | | $ | 0 | | | $ | 585,145,990 | | | $ | 0 | | | $ | 585,145,990 | |
| | | | |
Municipal bonds and notes | | | 0 | | | | 9,050,874 | | | | 0 | | | | 9,050,874 | |
| | | | |
Non agency mortgage-backed securities | | | 0 | | | | 73,406 | | | | 0 | | | | 73,406 | |
| | | | |
Term loans | | | 0 | | | | 187,960,355 | | | | 0 | | | | 187,960,355 | |
| | | | |
Yankee corporate bonds and notes | | | 0 | | | | 34,296,745 | | | | 0 | | | | 34,296,745 | |
| | | | |
Other | | | 0 | | | | 0 | | | | 109,621 | | | | 109,621 | |
| | | | |
Short-term investments | | | | | | | | | | | | | | | | |
Investment companies | | | 51,180,928 | | | | 6,347,100 | | | | 0 | | | | 57,528,028 | |
| | | $ | 51,180,928 | | | $ | 822,874,470 | | | $ | 109,621 | | | $ | 874,165,019 | |
Further details on the major security types listed above can be found in the Portfolio of Investments.
Transfers in and transfers out are recognized at the end of the reporting period. For the six months ended February 29, 2012, the Fund did not have any significant transfers into/out of Level 1 and Level 2.
| | | | | | |
| Notes to Financial Statements (Unaudited) | | Wells Fargo Advantage Short-Term High Yield Bond Fund | | | 25 | |
The following is a reconciliation of assets in which significant unobservable inputs (Level 3) were used in determining fair value:
| | | | | | | | | | | | | | | | |
| | | Corporate
bonds and
notes | | | Term
loans | | | Other | | | Total | |
Balance as of August 31, 2011 | | $ | 1,899,438 | | | $ | 29,375,878 | | | $ | 152,136 | | | $ | 31,427,452 | |
Accrued discounts (premiums) | | | (10,574 | ) | | | 8,864 | | | | 0 | | | | (1,710 | ) |
Realized gains (losses) | | | (327 | ) | | | (418,468 | ) | | | 0 | | | | (418,795 | ) |
Change in unrealized gains (losses) | | | (35,426 | ) | | | 897,944 | | | | (25,328 | ) | | | 837,190 | |
Purchases | | | 0 | | | | 0 | | | | 0 | | | | 0 | |
Sales | | | (1,853,111 | ) | | | (6,533,745 | ) | | | (17,187 | ) | | | (8,404,043 | ) |
Transfers into Level 3 | | | 0 | | | | 0 | | | | 0 | | | | 0 | |
Transfers out of Level 3 | | | 0 | | | | (23,330,473 | ) | | | 0 | | | | (23,330,473 | ) |
Balance as of February 29, 2012 | | $ | 0 | | | $ | 0 | | | $ | 109,621 | | | $ | 109,621 | |
Change in unrealized gains (losses)
relating to securities still held at February 29, 2012 | | $ | 0 | | | $ | 0 | | | $ | (34,204 | ) | | $ | (34,204 | ) |
Transfers out of Level 3 into Level 2 are due to the availability of significant observable inputs which are currently used in the determination of the fair value of the securities.
4. TRANSACTIONS WITH AFFILIATES AND OTHER EXPENSES
Advisory fee
The Trust has entered into an advisory contract with Funds Management, an indirect wholly owned subsidiary of Wells Fargo & Company (“Wells Fargo”). The adviser is responsible for implementing investment policies and guidelines and for supervising the sub-adviser, who is responsible for day-to-day portfolio management of the Fund.
Pursuant to the contract, Funds Management is entitled to receive an annual advisory fee starting at 0.50% and declining to 0.40% as the average daily net assets of the Fund increase. For the six months ended February 29, 2012, the advisory fee was equivalent to an annual rate of 0.49% of the Fund’s average daily net assets.
Funds Management has retained the services of certain sub-advisers to provide daily portfolio management to the Fund. The fees related to sub-advisory services are borne directly by Funds Management and do not increase the overall fees paid by the Fund. Wells Capital Management, an affiliate of Funds Management, is the sub-adviser to the Fund and is entitled to receive a fee from Funds Management at an annual rate starting at 0.35% and declining to 0.20% as the average daily net assets of the Fund increase.
Administration and transfer agent fees
The Trust has entered into an administration agreement with Funds Management. Under this agreement, for providing administrative services, which includes paying fees and expenses for services provided by the transfer agent, sub-transfer agents, omnibus account servicers and record-keepers, Funds Management is entitled to receive from the Fund an annual fund level administration fee starting at 0.05% and declining to 0.03% as the average daily net assets of the Fund increase and a class level administration fee which is calculated based on the average daily net assets of each class as follows:
| | | | |
| | | Class Level Administration Fee | |
Class A, Class C | | | 0.16 | % |
Administrator Class | | | 0.10 | |
Investor Class | | | 0.19 | |
Funds Management has contractually waived and/or reimbursed advisory and administration fees to the extent necessary to maintain certain net operating expense ratios for the Fund. Waiver of fees and/or reimbursement of expenses by Funds Management were made first from fund level expenses on a proportionate basis and then from class specific expenses. Funds Management has committed through December 31, 2012 to waive fees and/or reimburse expenses to the extent necessary to cap the Fund’s expenses at 0.81% for Class A, 1.56% for Class C, 0.65% for Administrator Class and 0.84% for Investor Class.
| | | | |
| 26 | | Wells Fargo Advantage Short-Term High Yield Bond Fund | | Notes to Financial Statements (Unaudited) |
Distribution fees
The Trust has adopted a Distribution Plan for Class C shares of the Fund pursuant to Rule 12b-1 under the 1940 Act. Distribution fees are charged to Class C shares and paid to Wells Fargo Funds Distributor, LLC, the principal underwriter, at an annual rate of 0.75% of its average daily net assets.
For the six months ended February 29, 2012, Wells Fargo Funds Distributor, LLC received $9,051 from the sale of Class A shares and $744 and $9,162 in contingent deferred sales charges from redemptions of Class A and Class C shares, respectively.
Shareholder servicing fees
The Trust has entered into contracts with one or more shareholder servicing agents, whereby each class of the Fund is charged a fee at an annual rate of 0.25% of the average daily net assets of each respective class.
A portion of these total shareholder servicing fees were paid to affiliates of Wells Fargo.
5. INVESTMENT PORTFOLIO TRANSACTIONS
Purchases and sales of investments, excluding U.S. Government obligations (if any) and short-term securities (securities with original maturities of one year or less at purchase date), for the six months ended February 29, 2012 were $245,208,963 and $76,399,427, respectively.
As of February 29, 2012, the Fund had unfunded term loan commitments of $2,002,500.
6. BANK BORROWINGS
The Trust (excluding the money market funds) and Wells Fargo Variable Trust are parties to a $150,000,000 revolving credit agreement with State Street Bank and Trust Company, whereby the Fund is permitted to use bank borrowings for temporary or emergency purposes, such as to fund shareholder redemption requests. Interest under the credit agreement is charged to the Fund based on a borrowing rate equal to the higher of the Federal Funds rate in effect on that day plus 1.25% or the overnight LIBOR rate in effect on that day plus 1.25%. In addition, an annual commitment fee equal to 0.10% of the unused balance is allocated to each participating fund. Prior to September 6, 2011, the revolving credit agreement was for $125,000,000 and the annual commitment fee paid by the Fund was 0.125% of the unused balance. For the six months ended February 29, 2012, the Fund paid $942 in commitment fees.
For the six months ended February 29, 2012, there were no borrowings by the Fund under the agreement.
7. INDEMNIFICATION
Under the Trust’s organizational documents, the officers and directors are indemnified against certain liabilities that may arise out of performance of their duties to the Trust. Additionally, in the normal course of business, the Trust may enter into contracts with service providers that contain a variety of indemnification clauses. The Trust’s maximum exposure under these arrangements is dependent on future claims that may be made against the Fund and, therefore, cannot be estimated.
8. NEW ACCOUNTING PRONOUNCEMENTS
In May 2011, the Financial Accounting Standards Board (“FASB”) issued Accounting Standards Update (“ASU”) No. 2011-04 “Amendments to Achieve Common Fair Value Measurement and Disclosure Requirements in U.S. GAAP and IFRSs”. ASU No. 2011-04 amends FASB ASC Topic 820, Fair Value Measurements and Disclosures, to establish common requirements for measuring fair value and for disclosing information about fair value measurements in accordance with GAAP. The ASU is effective prospectively for interim and annual periods beginning after December 15, 2011. Management expects that adoption of the ASU will result in additional disclosures in the financial statements, as applicable.
In April 2011, FASB issued ASU No. 2011-03 “Reconsideration of Effective Control for Repurchase Agreements”. ASU No. 2011-03 amends FASB ASC Topic 860, Transfers and Servicing, specifically the criteria required to determine whether a repurchase agreement (repo) and similar agreements should be accounted for as sales of financial assets or secured borrowings with commitments. ASU No. 2011-03 changes the assessment of effective control by focusing on the transferor’s contractual rights and obligations and removing the criterion to assess its ability to exercise those rights or honor those obligations. This could result in changes to the way entities account for certain transactions including repurchase agreements, mortgage dollar rolls and reverse repurchase agreements. The ASU will become effective on a prospective basis for new transfers and modifications to existing transactions as of the beginning of the first interim or annual period beginning on or after December 15, 2011. Management has evaluated the impact of adopting the ASU and expects no significant changes.
| | | | | | |
| Other Information (Unaudited) | | Wells Fargo Advantage Short-Term High Yield Bond Fund | | | 27 | |
PROXY VOTING INFORMATION
A description of the policies and procedures that the Fund uses to determine how to vote proxies relating to portfolio securities is available without charge, upon request, by calling 1-800-222-8222, visiting our Web site at wellsfargoadvantagefunds.com, or visiting the SEC Web site at sec.gov. Information regarding how the Fund voted proxies relating to portfolio securities during the most recent 12-month period ended June 30 is available without charge on the Fund’s Web site at wellsfargoadvantagefunds.com or by visiting the SEC Web site at sec.gov.
PORTFOLIO HOLDINGS INFORMATION
The complete portfolio holdings for the Fund are publicly available on the Fund’s Web site (wellsfargoadvantagefunds.com) on a monthly, 30-day or more delayed basis. In addition, top ten holdings information for the Fund is publicly available on the Fund’s Web site on a monthly, seven-day or more delayed basis. The Fund files its complete schedule of portfolio holdings with the SEC for the first and third quarters of each fiscal year on Form N-Q, which is available without charge by visiting the SEC Web site at sec.gov. In addition, the Fund’s Form N-Q may be reviewed and copied at the SEC’s Public Reference Room in Washington, DC, and at regional offices in New York City, at 233 Broadway, and in Chicago, at 175 West Jackson Boulevard, Suite 900. Information about the Public Reference Room may be obtained by calling 1-800-SEC-0330.
| | | | |
| 28 | | Wells Fargo Advantage Short-Term High Yield Bond Fund | | Other Information (Unaudited) |
BOARD OF TRUSTEES
The following table provides basic information about the Board of Trustees (the “Trustees”) of the Trust and Officers of the Trust. This table should be read in conjunction with the Prospectus and the Statement of Additional Information1 of the Fund. Each of the Trustees and Officers listed below acts in identical capacities for the Wells Fargo Advantage family of funds, which consists of 137 funds comprising the Wells Fargo Funds Trust, Wells Fargo Variable Trust, Wells Fargo Master Trust and four closed-end funds (collectively the “Fund Complex”). All of the Trustees are also Members of the Audit and Governance Committees of each Trust in the Fund Complex. The mailing address of each Trustee and Officer is 525 Market Street, 12th Floor, San Francisco, CA 94105. Each Trustee and Officer serves an indefinite term, however, each Trustee serves such term until reaching the mandatory retirement age established by the Trustees.
Independent Trustees
| | | | | | |
Name and Year of Birth | | Position Held and Length of Service | | Principal Occupations During Past Five Years | | Other Directorships During
Past Five Years |
Peter G. Gordon
(Born 1942) | | Trustee, since 1998; Chairman, since 2005 (Lead Trustee since 2001) | | Co-Founder, Retired Chairman, President and CEO of Crystal Geyser Water Company. Trustee Emeritus, Colby College | | Asset Allocation Trust |
Isaiah Harris, Jr.
(Born 1952) | | Trustee, since 2009 | | Retired. Prior thereto, President and CEO of BellSouth Advertising and Publishing Corp. from 2005 to 2007, President and CEO of BellSouth Enterprises from 2004 to 2005 and President of BellSouth Consumer Services from 2000 to 2003. Emeritus member of the Iowa State University Foundation Board of Governors. Emeritus Member of the Advisory Board of Iowa State University School of Business. Mr. Harris is a certified public accountant. | | CIGNA Corporation; Deluxe Corporation; Asset Allocation Trust |
Judith M. Johnson
(Born 1949) | | Trustee, since 2008 | | Retired. Prior thereto, Chief Executive Officer and Chief Investment Officer of Minneapolis Employees Retirement Fund from 1996 to 2008. Ms. Johnson is an attorney, certified public accountant and a certified managerial accountant. | | Asset Allocation Trust |
Leroy Keith, Jr.
(Born 1939) | | Trustee, since 2010 | | Chairman, Bloc Global Services (development and construction). Trustee of the Evergreen Funds from 1983 to 2010. Former Managing Director, Almanac Capital Management (commodities firm), former Partner, Stonington Partners, Inc. (private equity fund), former Director, Obagi Medical Products Co. and former Director, Lincoln Educational Services. | | Trustee, Virtus Fund Complex (consisting of 40 portfolios as of 12/31/11); Asset Allocation Trust |
David F. Larcker
(Born 1950) | | Trustee, since 2009 | | James Irvin Miller Professor of Accounting at the Graduate School of Business, Stanford University, Director of Corporate Governance Research Program and Senior Faculty of The Rock Center for Corporate Governance since 2006. From 2005 to 2008, Professor of Accounting at the Graduate School of Business, Stanford University. Prior thereto, Ernst & Young Professor of Accounting at The Wharton School, University of Pennsylvania from 1985 to 2005. | | Asset Allocation Trust |
Olivia S. Mitchell
(Born 1953) | | Trustee, since 2006 | | International Foundation of Employee Benefit Plans Professor, Wharton School of the University of Pennsylvania since 1993. Director of Wharton’s Pension Research Council and Boettner Center on Pensions & Retirement Research, and Research Associate at the National Bureau of Economic Research. Previously, Cornell University Professor from 1978 to 1993. | | Asset Allocation Trust |
| | | | | | |
| Other Information (Unaudited) | | Wells Fargo Advantage Short-Term High Yield Bond Fund | | | 29 | |
| | | | | | |
Name and Year of Birth | | Position Held and Length of Service | | Principal Occupations During Past Five Years | | Other Directorships During
Past Five Years |
Timothy J. Penny
(Born 1951) | | Trustee, since 1996 | | President and CEO of Southern Minnesota Initiative Foundation, a non-profit organization, since 2007 and Senior Fellow at the Humphrey Institute Policy Forum at the University of Minnesota since 1995. Member of the Board of Trustees of NorthStar Education Finance, Inc., a non-profit organization, since 2007. | | Asset Allocation Trust |
Michael S. Scofield
(Born 1943) | | Trustee, since 2010 | | Served on the Investment Company Institute’s Board of Governors and Executive Committee from 2008-2011 as well the Governing Council of the Independent Directors Council from 2006-2011 and the Independent Directors Council Executive Committee from 2008-2011. Chairman of the IDC from 2008-2010. Institutional Investor (Fund Directions) Trustee of Year in 2007. Trustee of the Evergreen Funds (and its predecessors) from 1984 to 2010. Chairman of the Evergreen Funds from 2000-2010. Former Trustee of the Mentor Funds. Retired Attorney, Law Offices of Michael S. Scofield and former Director and Chairman, Branded Media Corporation (multi-media branding company). | | Asset Allocation Trust |
Donald C. Willeke
(Born 1940) | | Trustee, since 1996 | | Principal of the law firm of Willeke & Daniels. General Counsel of the Minneapolis Employees Retirement Fund from 1984 until its consolidation into the Minnesota Public Employees Retirement Association on June 30, 2010. Director and Vice Chair of The Free Trust (non-profit corporation). Director of the American Chestnut Foundation (non-profit corporation). | | Asset Allocation Trust |
Officers
| | | | | | |
Name and Year of Birth | | Position Held and
Length of Service | | Principal Occupations During Past Five Years | | |
Karla M. Rabusch
(Born 1959) | | President, since 2003 | | Executive Vice President of Wells Fargo Bank, N.A. and President of Wells Fargo Funds Management, LLC since 2003. Senior Vice President and Chief Administrative Officer of Wells Fargo Funds Management, LLC from 2001 to 2003. | | |
C. David Messman
(Born 1960) | | Secretary, since 2000; Chief Legal Counsel, since 2003 | | Senior Vice President and Secretary of Wells Fargo Funds Management, LLC since 2001. Vice President and Managing Senior Counsel of Wells Fargo Bank, N.A. since 1996. | | |
Kasey Phillips
(Born 1970) | | Treasurer, since 2009 | | Senior Vice President of Wells Fargo Funds Management, LLC since 2009. Senior Vice President of Evergreen Investment Management Company, LLC from 2006 to 2010. Treasurer of the Evergreen Funds from 2005 to 2010. | | |
David Berardi
(Born 1975) | | Assistant Treasurer, since 2009 | | Vice President of Wells Fargo Funds Management, LLC since 2009. Vice President of Evergreen Investment Management Company, LLC from 2008 to 2010. Assistant Vice President of Evergreen Investment Services, Inc. from 2004 to 2008. Manager of Fund Reporting and Control for Evergreen Investment Management Company, LLC from 2004 to 2010. | | |
Jeremy DePalma
(Born 1974) | | Assistant Treasurer, since 2009 | | Senior Vice President of Wells Fargo Funds Management, LLC since 2009. Senior Vice President of Evergreen Investment Management Company, LLC from 2008 to 2010. Vice President, Evergreen Investment Services, Inc. from 2004 to 2007. Head of the Fund Reporting and Control Team within Fund Administration from 2005 to 2010. | | |
Debra Ann Early
(Born 1964) | | Chief Compliance Officer, since 2007 | | Chief Compliance Officer of Wells Fargo Funds Management, LLC since 2007. Chief Compliance Officer of Parnassus Investments from 2005 to 2007. Chief Financial Officer of Parnassus Investments from 2004 to 2007 and Senior Audit Manager of PricewaterhouseCoopers LLP from 1998 to 2004. | | |
| 1. | The Statement of Additional Information includes additional information about the Trustees and is available, without charge, upon request, by calling 1-800-222-8222 or by visiting the Web site at wellsfargoadvantagefunds.com. |
| | | | |
| 30 | | Wells Fargo Advantage Short-Term High Yield Bond Fund | | List of Abbreviations |
The following is a list of common abbreviations for terms and entities which may have appeared in this report.
| ACB | — Agricultural Credit Bank |
| ADR | — American Depository Receipt |
| ADS | — American Depository Shares |
| AGC-ICC | — Assured Guaranty Corporation - Insured Custody Certificates |
| AGM | — Assured Guaranty Municipal |
| AMBAC | — American Municipal Bond Assurance Corporation |
| AMT | — Alternative Minimum Tax |
| BAN | — Bond Anticipation Notes |
| BHAC | — Berkshire Hathaway Assurance Corporation |
| CAB | — Capital Appreciation Bond |
| CCAB | — Convertible Capital Appreciation Bond |
| CDA | — Community Development Authority |
| CDO | — Collateralized Debt Obligation |
| COP | — Certificate of Participation |
| DRIVER | — Derivative Inverse Tax-Exempt Receipts |
| DW&P | — Department of Water & Power |
| DWR | — Department of Water Resources |
| ECFA | — Educational & Cultural Facilities Authority |
| EDA | — Economic Development Authority |
| EDFA | — Economic Development Finance Authority |
| ETF | — Exchange-Traded Fund |
| FFCB | — Federal Farm Credit Bank |
| FGIC | — Financial Guaranty Insurance Corporation |
| FHA | — Federal Housing Authority |
| FHLB | — Federal Home Loan Bank |
| FHLMC | — Federal Home Loan Mortgage Corporation |
| FNMA | — Federal National Mortgage Association |
| GDR | — Global Depository Receipt |
| GNMA | — Government National Mortgage Association |
| HCFR | — Healthcare Facilities Revenue |
| HEFA | — Health & Educational Facilities Authority |
| HEFAR | — Higher Education Facilities Authority Revenue |
| HFA | — Housing Finance Authority |
| HFFA | — Health Facilities Financing Authority |
| IBC | — Insured Bond Certificate |
| IDA | — Industrial Development Authority |
| IDAG | — Industrial Development Agency |
| IDR | — Industrial Development Revenue |
| KRW | — Republic of Korea Won |
| LIBOR | — London Interbank Offered Rate |
| LLC | — Limited Liability Company |
| LLP | — Limited Liability Partnership |
| MBIA | — Municipal Bond Insurance Association |
| MFHR | — Multi-Family Housing Revenue |
| MSTR | — Municipal Securities Trust Receipts |
| MUD | — Municipal Utility District |
| NATL-RE | — National Public Finance Guarantee Corporation |
| PCFA | — Pollution Control Finance Authority |
| PCR | — Pollution Control Revenue |
| PFA | — Public Finance Authority |
| PFFA | — Public Facilities Financing Authority |
| PFOTER | — Puttable Floating Option Tax-Exempt Receipts |
| plc | — Public Limited Company |
| PUTTER | — Puttable Tax-Exempt Receipts |
| R&D | — Research & Development |
| RDA | — Redevelopment Authority |
| RDFA | — Redevelopment Finance Authority |
| REIT | — Real Estate Investment Trust |
| ROC | — Reset Option Certificates |
| SAVRS | — Select Auction Variable Rate Securities |
| SBA | — Small Business Authority |
| SFHR | — Single Family Housing Revenue |
| SFMR | — Single Family Mortgage Revenue |
| SPDR | — Standard & Poor’s Depositary Receipts |
| TAN | — Tax Anticipation Notes |
| TIPS | — Treasury Inflation-Protected Securities |
| TRAN | — Tax Revenue Anticipation Notes |
| TCR | — Transferable Custody Receipts |
| TTFA | — Transportation Trust Fund Authority |
| TVA | — Tennessee Valley Authority |
| XLCA | — XL Capital Assurance |


FOR MORE INFORMATION
More information about Wells Fargo Advantage Funds is available free upon request. To obtain literature, please write, e-mail, visit the Fund’s Web site, or call:
Wells Fargo Advantage Funds
P.O. Box 8266
Boston, MA 02266-8266
E-mail: wfaf@wellsfargo.com
Web site: wellsfargoadvantagefunds.com
Individual investors: 1-800-222-8222
Retail investment professionals: 1-888-877-9275
Institutional investment professionals: 1-866-765-0778
This report and the financial statements contained herein are submitted for the general information of the shareholders of Wells Fargo Advantage Funds. If this report is used for promotional purposes, distribution of the report must be accompanied or preceded by a current prospectus. For a prospectus containing more complete information, including charges and expenses, call 1-800-222-8222 or visit the Fund’s Web site at wellsfargoadvantagefunds.com. Please consider the investment objectives, risks, charges, and expenses of the investment carefully before investing. This and other information about Wells Fargo Advantage Funds can be found in the current prospectus. Read the prospectus carefully before you invest or send money.
Wells Fargo Funds Management, LLC, a wholly owned subsidiary of Wells Fargo & Company, provides investment advisory and administrative services for Wells Fargo Advantage Funds. Other affiliates of Wells Fargo & Company provide subadvisory and other services for the Funds. The Funds are distributed by Wells Fargo Funds Distributor, LLC, Member FINRA/SIPC, an affiliate of Wells Fargo & Company.
NOT FDIC INSURED ¡ NO BANK GUARANTEE ¡ MAY LOSE VALUE
© 2012 Wells Fargo Funds Management, LLC. All rights reserved.
| | |
 | | 208527 04-12 SA222/SAR222 2-12 |

Wells Fargo Advantage
Ultra Short-Term Income Fund

Semi-Annual Report
February 29, 2012

Reduce clutter. Save trees.
Sign up for electronic delivery of prospectuses and shareholder reports at wellsfargo.com/advantagedelivery
Contents
The views expressed and any forward-looking statements are as of February 29, 2012, unless otherwise noted, and are those of the Fund managers and/or Wells Fargo Funds Management, LLC. Discussions of individual securities, or the markets generally, or any Wells Fargo Advantage Fund are not intended as individual recommendations. Future events or results may vary significantly from those expressed in any forward-looking statements; the views expressed are subject to change at any time in response to changing circumstances in the market. Wells Fargo Funds Management, LLC, disclaims any obligation to publicly update or revise any views expressed or forward-looking statements.
NOT FDIC INSURED ¡ NO BANK GUARANTEE ¡ MAY LOSE VALUE

WELLS FARGO INVESTMENT HISTORY
| | |
| |
| 1932 | | Keystone creates one of the first mutual fund families. |
| |
| 1971 | | Wells Fargo & Company introduces one of the first institutional index funds. |
| |
| 1978 | | Wells Fargo applies Markowitz and Sharpe’s research on Modern Portfolio Theory to introduce one of the industry’s first Tactical Asset Allocation (TAA) models in institutional separately managed accounts. |
| |
| 1984 | | Wells Fargo Stagecoach Funds launches its first asset allocation fund. |
| |
| 1989 | | The Tactical Asset Allocation (TAA) Model is first applied to Wells Fargo’s asset allocation mutual funds. |
| |
| 1994 | | Wells Fargo introduces the LifePath Funds, one of the first suites of target date funds (now the Wells Fargo Advantage Dow Jones Target Date FundsSM). |
| |
| 1996 | | Evergreen Investments and Keystone Funds merge. |
| |
| 1997 | | Wells Fargo launches Wells Fargo Advantage WealthBuilder PortfoliosSM, a fund-of-funds suite of products that includes the use of quantitative models to shift assets among investment styles. |
| |
| 1999 | | Norwest Advantage Funds and Stagecoach Funds are reorganized into Wells Fargo Funds after the merger of Norwest and Wells Fargo. |
| |
| 2002 | | Evergreen Retail and Evergreen Institutional companies form the umbrella asset management company, Evergreen Investments. |
| |
| 2005 | | The integration of Strong Funds with Wells Fargo Funds creates Wells Fargo Advantage Funds, resulting in one of the top 20 mutual fund companies in the United States. |
| |
| 2006 | | Wells Fargo Advantage Funds relaunches the target date product line as Wells Fargo Advantage Dow Jones Target Date Funds. |
| |
| 2010 | | The mergers and reorganizations of Evergreen and Wells Fargo Advantage mutual funds are completed, unifying the families under the brand of Wells Fargo Advantage Funds. |
Wells Fargo Advantage Funds®
Wells Fargo Advantage Funds skillfully guides institutions, financial advisors, and individuals through the investment terrain to help them reach their financial objectives. Everything we do on behalf of investors is backed by our unique combination of qualifications.
Strength
Our organization is built on the standards of integrity and service established by our parent company—Wells Fargo & Company—more than 150 years ago. And, because we’re part of a highly diversified financial enterprise, we offer the depth of resources to help investors succeed.
Expertise
Our multi-boutique model offers investors access to the independent thinking of premier investment managers that have been chosen for their time-tested strategies. While each team specializes in a specific investment strategy, collectively they provide investors a wide choice of distinct investment styles. Our dedication to investment excellence doesn’t end with our expertise in manager selection—risk management, analysis, and rigorous ongoing review seek to ensure each manager’s investment process remains consistent.
Partnership
Our collaborative approach is built around understanding the needs and goals of our clients. By adhering to core principles of sound judgment and steady guidance, we support you through every stage of the investment decision process.
Carefully consider a fund’s investment objectives, risks, charges, and expenses before investing. For a current prospectus and, if available, a summary prospectus, containing this and other information, visit wellsfargoadvantagefunds.com. Read it carefully before investing.
Wells Fargo Funds Management, LLC, a wholly owned subsidiary of Wells Fargo & Company, provides investment advisory and administrative services for Wells Fargo Advantage Funds®. Other affiliates of Wells Fargo & Company provide subadvisory and other services for the Funds. The Funds are distributed by Wells Fargo Funds Distributor, LLC, Member FINRA/SIPC, an affiliate of Wells Fargo & Company.
“Dow Jones®” and “Dow Jones Target Date IndexesSM” are service marks of Dow Jones Trademark Holdings, LLC (“Dow Jones”), have been licensed to CME Group Index Services LLC (“CME Indexes”) and have been sublicensed for use for certain purposes by Global Index Advisors, Inc, and Wells Fargo Funds Management, LLC. The Wells Fargo Advantage Dow Jones Target Date FundsSM based on the Dow Jones Target Date IndexesSM, are not sponsored, endorsed, sold or promoted by Dow Jones, CME Indexes or their respective affiliates and none of them makes any representation regarding the advisability of investing in such product(s).
NOT FDIC INSURED ¡ NO BANK GUARANTEE ¡ MAY LOSE VALUE
Not part of the semi-annual report.
Wells Fargo Advantage Funds offers more than 110 mutual funds across a wide range of asset classes, representing over $218 billion in assets under management, as of February 29, 2012.
| | | | |
| Equity Funds | | | | |
Asia Pacific Fund | | Equity Value Fund | | Precious Metals Fund |
C&B Large Cap Value Fund | | Global Opportunities Fund | | Premier Large Company Growth Fund |
C&B Mid Cap Value Fund | | Growth Fund | | Small Cap Opportunities Fund |
Capital Growth Fund | | Index Fund | | Small Cap Value Fund |
Common Stock Fund | | International Equity Fund | | Small Company Growth Fund |
Disciplined U.S. Core Fund | | International Value Fund | | Small Company Value Fund |
Discovery Fund† | | Intrinsic Small Cap Value Fund | | Small/Mid Cap Core Fund |
Diversified Equity Fund | | Intrinsic Value Fund | | Small/Mid Cap Value Fund |
Diversified International Fund | | Intrinsic World Equity Fund | | Special Mid Cap Value Fund |
Diversified Small Cap Fund | | Large Cap Core Fund | | Special Small Cap Value Fund |
Emerging Growth Fund | | Large Cap Growth Fund | | Specialized Technology Fund |
Emerging Markets Equity Fund | | Large Company Value Fund | | Strategic Large Cap Growth Fund |
Endeavor Select Fund† | | Omega Growth Fund | | Traditional Small Cap Growth Fund |
Enterprise Fund† | | Opportunity Fund† | | Utility and Telecommunications Fund |
| Bond Funds | | | | |
Adjustable Rate Government Fund | | Inflation-Protected Bond Fund | | Short-Term Bond Fund |
California Limited-Term Tax-Free Fund | | Intermediate Tax/AMT-Free Fund | | Short-Term High Yield Bond Fund |
California Tax-Free Fund | | International Bond Fund | | Short-Term Municipal Bond Fund |
Colorado Tax-Free Fund | | Minnesota Tax-Free Fund | | Strategic Municipal Bond Fund |
Government Securities Fund | | Municipal Bond Fund | | Total Return Bond Fund |
High Income Fund | | North Carolina Tax-Free Fund | | Ultra Short-Term Income Fund |
High Yield Bond Fund | | Pennsylvania Tax-Free Fund | | Ultra Short-Term Municipal Income Fund |
Income Plus Fund | | Short Duration Government Bond Fund | | Wisconsin Tax-Free Fund |
| Asset Allocation Funds | | | | |
Absolute Return Fund | | WealthBuilder Equity Portfolio† | | Target 2020 Fund† |
Asset Allocation Fund | | WealthBuilder Growth Allocation Portfolio† | | Target 2025 Fund† |
Conservative Allocation Fund | | WealthBuilder Growth Balanced Portfolio† | | Target 2030 Fund† |
Diversified Capital Builder Fund | | WealthBuilder Moderate Balanced Portfolio† | | Target 2035 Fund† |
Diversified Income Builder Fund | | WealthBuilder Tactical Equity Portfolio† | | Target 2040 Fund† |
Growth Balanced Fund | | Target Today Fund† | | Target 2045 Fund† |
Index Asset Allocation Fund | | Target 2010 Fund† | | Target 2050 Fund† |
Moderate Balanced Fund | | Target 2015 Fund† | | Target 2055 Fund† |
WealthBuilder Conservative Allocation Portfolio† | | | | |
| Money Market Funds | | | | |
100% Treasury Money Market Fund | | Heritage Money Market Fund† | | National Tax-Free Money Market Fund |
California Municipal Money Market Fund | | Money Market Fund | | Prime Investment Money Market Fund |
Cash Investment Money Market Fund | | Municipal Cash Management Money Market Fund | | Treasury Plus Money Market Fund |
Government Money Market Fund | | Municipal Money Market Fund | | |
| Variable Trust Funds1 | | | | |
VT Discovery Fund† | | VT Intrinsic Value Fund | | VT Small Cap Growth Fund |
VT Index Asset Allocation Fund | | VT Omega Growth Fund | | VT Small Cap Value Fund |
VT International Equity Fund | | VT Opportunity Fund† | | VT Total Return Bond Fund |
An investment in a money market fund is not insured or guaranteed by the Federal Deposit Insurance Corporation or any other government agency. Although the Wells Fargo Advantage Money Market Funds seek to preserve the value of your investment at $1.00 per share, it is possible to lose money by investing in a money market fund.
| 1. | The Variable Trust Funds are generally available only through insurance company variable contracts. |
| † | In this report, the Wells Fargo Advantage Discovery FundSM, Wells Fargo Advantage Endeavor Select FundSM, Wells Fargo Advantage Enterprise FundSM, Wells Fargo Advantage Opportunity FundSM, Wells Fargo Advantage WealthBuilder Conservative Allocation PortfolioSM, Wells Fargo Advantage WealthBuilder Equity PortfolioSM, Wells Fargo Advantage WealthBuilder Growth Allocation PortfolioSM, Wells Fargo Advantage WealthBuilder Growth Balanced PortfolioSM, Wells Fargo Advantage WealthBuilder Moderate Balanced PortfolioSM, Wells Fargo Advantage WealthBuilder Tactical Equity PortfolioSM, Wells Fargo Advantage Dow Jones Target Today FundSM, Wells Fargo Advantage Dow Jones Target 2010 FundSM, Wells Fargo Advantage Dow Jones Target 2015 FundSM, Wells Fargo Advantage Dow Jones Target 2020 FundSM, Wells Fargo Advantage Dow Jones Target 2025 FundSM, Wells Fargo Advantage Dow Jones Target 2030 FundSM, Wells Fargo Advantage Dow Jones Target 2035 FundSM, Wells Fargo Advantage Dow Jones Target 2040 FundSM, Wells Fargo Advantage Dow Jones Target 2045 FundSM, Wells Fargo Advantage Dow Jones Target 2050 FundSM, Wells Fargo Advantage Dow Jones Target 2055 FundSM, Wells Fargo Advantage Heritage Money Market FundSM, Wells Fargo Advantage VT Discovery FundSM, and Wells Fargo Advantage VT Opportunity FundSM are referred to as the Discovery Fund, Endeavor Select Fund, Enterprise Fund, Opportunity Fund, WealthBuilder Conservative Allocation Portfolio, WealthBuilder Equity Portfolio, WealthBuilder Growth Allocation Portfolio, WealthBuilder Growth Balanced Portfolio, WealthBuilder Moderate Balanced Portfolio, WealthBuilder Tactical Equity Portfolio, Target Today Fund, Target 2010 Fund, Target 2015 Fund, Target 2020 Fund, Target 2025 Fund, Target 2030 Fund, Target 2035 Fund, Target 2040 Fund, Target 2045 Fund, Target 2050 Fund, Target 2055 Fund, Heritage Money Market Fund, VT Discovery Fund, and VT Opportunity Fund, respectively. |
Not part of the semi-annual report.
| | | | |
| 2 | | Wells Fargo Advantage Ultra Short-Term Income Fund | | Letter to Shareholders |

Karla M. Rabusch,
President
Wells Fargo Advantage Funds
The theme for the period was a shift from risk aversion in the first half to burgeoning trends of improving investor confidence in the second half, which significantly improved pricing in the lower-rated asset classes.
On the whole, investment-grade fixed-income securities performed positively during the period, but the strongest returns came from the high-yield market.
Dear Valued Shareholder:
We are pleased to offer you this semi-annual report for the Wells Fargo Advantage Ultra Short-Term Income Fund, which covers the six-month period that ended February 29, 2012. During the period, fixed-income performance was best among the lower-rated securities, as improved investor confidence in the U.S. economy and the U.S. credit markets encouraged investors to return to riskier asset classes.
The period began with heightened risk aversion but ended with stronger investor confidence.
The six-month period began with the worsening of the Greek crisis, which amplified risk aversion across the global credit markets. This in turn led to a powerful rally in U.S. Treasuries and a sharp decline in high-yield bond prices, most notably in the lowest-quality credit tiers. During this time, most investment-grade fixed-income markets continued to generate positive returns—although certain areas of the riskiest segments of the markets declined—and U.S. Treasury yields reached the lowest levels in decades, even surpassing the low yield levels reached in the summer of 2010.
The last three months of the period were characterized by a strong reversal of the trends of the first three months. In October 2011, the high-yield market recovered significantly, benefiting from indications of improving policy with regard to managing the debt crisis from Europe and the formal announcement of a European debt deal late in the month. Due to renewed concerns about the European Union’s ability to manage the debt crisis, November 2011 saw a modest decline in investment-grade corporate bond prices and a sharp correction in high-yield corporate bonds, but another strong recovery in pricing started in December and carried into the first two months of 2012. Investor confidence strengthened as the U.S. economy demonstrated signs of sustainable growth and U.S. credit markets began to show some resistance to the credit problems of Europe. Thus, the theme for the period was a shift from risk aversion in the first half to burgeoning trends of improving investor confidence in the second half, which significantly improved pricing in the lower-rated asset classes.
On the whole, investment-grade fixed-income securities performed positively during the period, but the strongest returns came from the high-yield market. In fact, the best returns for the six-month period came from the lowest-rated credit tiers, despite the fact that they significantly underperformed in August and September 2011. Similar trends were true in the structured products sector, as lower-rated commercial mortgage-backed securities were among the best performers for the period, despite underperforming in the first two months.
The Federal Reserve launched Operation Twist in September.
With economic concerns and credit woes escalating in Europe and some continued uncertainty about the growth outlook in the U.S. during August and September 2011, the Federal Reserve (Fed) intervened yet again with monetary accommodations—this time with “Operation Twist,” which was announced and launched in September 2011. With Operation Twist, the Fed endeavored to flatten the yield curve and drive long-term rates down by selling short-term Treasuries and using the proceeds to purchase long-term Treasuries. The Fed stated that it is unlikely to raise rates before 2014, which should keep yields on Treasuries low. Despite this announcement, problems in Europe caused Treasuries to continue to rally in the first 3 months of the period, while credit spreads on corporate and
| | | | | | |
| Letter to Shareholders | | Wells Fargo Advantage Ultra Short-Term Income Fund | | | 3 | |
securitized sectors widened with increasing risk aversion. However, with an improved U.S. economic outlook and greater investor confidence, the last three months of the period saw a slight decline in U.S. Treasury prices and significant improvement in high-yield corporate bond prices. Credit spreads in the corporate and securitized sectors broadly tightened in December 2011 and January and February 2012.
Although U.S. economic conditions appear to have improved over the course of the period, the recovery continues to face some headwinds in the form of languishing housing values and elevated unemployment levels, which may continue to create some volatility in the fixed-income markets. While we cannot say definitively what near-term performance will look like, we continue to encourage investors to maintain fully diversified, actively managed portfolios, which may provide better protection from risk and added opportunities to capture relative value. While heightened volatility may be uncomfortable to experience in the short term, we believe it can lead to unique opportunities to add relative value for investors with long-term investment horizons.
Don’t let short-term uncertainty derail long-term investment goals.
Periods of uncertainty can present challenges, but experience has taught us that maintaining a long-term investment strategy based on individual goals and risk tolerance can be an effective way to plan for the future. To help you create a sound strategy based on your personal goals and risk tolerance, Wells Fargo Advantage Funds offers more than 110 mutual funds and other investments spanning a wide range of asset classes and investment styles. Although diversification cannot guarantee an investment profit or prevent losses, we believe it can be an effective way to manage investment risk and potentially smooth out overall portfolio performance.
In our opinion, diligent and earnest assessment of the fundamental risks in individual fixed-income securities will be a key differentiating factor between which investment strategies perform well and which do not. At Wells Fargo Advantage Funds, we intend to continue measuring relative-value opportunities in the fixed-income markets and across our lineup of funds. We believe it is particularly important to have diligent investment analysts in charge of investor assets in changing markets. As evidenced by the performance of fixed-income assets during the recent six-month period, heightened risks also often accompany such opportunities.
Thank you for choosing to invest with Wells Fargo Advantage Funds. We appreciate your confidence in us and remain committed to helping you meet your financial needs. For current information about your fund investments, contact your investment professional, visit our Web site at wellsfargoadvantagefunds.com, or call us directly at 1-800-222-8222. We are available 24 hours a day, 7 days a week.
Sincerely,

Karla M. Rabusch
President
Wells Fargo Advantage Funds
| | | | |
| 4 | | Wells Fargo Advantage Ultra Short-Term Income Fund | | Letter to Shareholders |
Notice to Shareholders
The Board of Trustees for Wells Fargo Advantage Funds has unanimously approved the following modifications to certain net asset value (NAV) waiver privileges and commission schedules:
| | n | | Effective May 1, 2012, automatic investment plan (AIP) purchases and proceeds received from systematic withdrawals will no longer qualify for NAV repurchase privileges. | |
| | n | | Effective May 1, 2012, discretionary rights to waive the upfront commission for Class C and “jumbo” Class A share purchases will no longer be granted to broker/dealers. However, we will continue to waive the Class C shares contingent deferred sales charge for redemptions by employer-sponsored retirement plans where the dealer of record waived its commission at the time of purchase. | |
| | n | | Effective July 31, 2012, NAV purchase privileges for former Evergreen Class IS and Class R shareholders are being modified to remove the ability to purchase Class A shares at NAV unless those shares are held directly with the Fund on or after July 31, 2012. | |
Please contact your investment professional or call us directly at 1-800-222-8222 if you have any questions on this Notice to Shareholders.
| | | | | | |
| Performance Highlights (Unaudited) | | Wells Fargo Advantage Ultra Short-Term Income Fund | | | 5 | |
INVESTMENT OBJECTIVE
The Fund seeks current income consistent with capital preservation.
ADVISER
Wells Fargo Funds Management, LLC
SUB-ADVISER
Wells Capital Management Incorporated
PORTFOLIO MANAGERS
Christopher Y. Kauffman, CFA
Jay N. Mueller, CFA
D. James Newton II, CFA, CPA
Thomas M. Price, CFA
FUND INCEPTION
November 25, 1988
| | | | |
TEN LARGEST LONG-TERM HOLDINGS1
(AS OF FEBRUARY 29, 2012) | | | |
Bank Nederlandse Gemeenten, 5.00%, 05/16/2014 | | | 1.27% | |
Canadian Imperial Bank of Commerce, 2.00%, 02/04/2013 | | | 1.19% | |
SpareBank 1 Boligkreditt, 1.25%, 10/25/2014 | | | 1.17% | |
Nordea Eiendomskreditt, 1.88%, 04/07/2014 | | | 1.06% | |
Stadshypotek AB, 1.45%, 09/30/2013 | | | 1.05% | |
Bank of Nova Scotia, 1.45%, 07/26/2013 | | | 1.02% | |
Chase Issuance Trust Series 2009-A2 Class A2, 1.80%, 04/15/2014 | | | 0.92% | |
Nissan Auto Receivables Owner Trust Series 2011-A Class A2, 0.65%, 12/16/2013 | | | 0.88% | |
Citibank Credit Card Issuance Trust Series 2009-A1 Class A1, 2.00%, 03/17/2014 | | | 0.88% | |
HSBC Bank plc, 1.63%, 07/07/2014 | | | 0.84% | |
| | |
CREDIT QUALITY2
(AS OF FEBRUARY 29, 2012) | | |
|
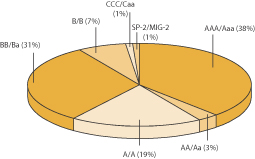 |
| 1. | The ten largest long-term holdings are calculated based on the value of the securities divided by total net assets of the Fund. Holdings are subject to change and may have changed since the date specified. |
| 2. | The ratings indicated are from Standard & Poor’s, Moody’s Investors Service, and/or Fitch Ratings Ltd. Credit Quality Ratings: Credit quality ratings apply to underlying holdings of the Fund and not the Fund itself. Standard & Poor’s rates the creditworthiness of bonds, ranging from AAA (highest) to D (lowest). Ratings from A to CCC may be modified by the addition of a plus (+) or minus (–) sign to show relative standing within the rating categories. Standard & Poor’s rates the creditworthiness of short-term notes from SP-1 (highest) to SP-3 (lowest). Moody’s rates the creditworthiness of bonds, ranging from Aaa (highest) to C (lowest). Ratings Aa to B may be modified by the addition of a number 1 (highest) to 3 (lowest) to show relative standing within the ratings categories. Moody’s rates the creditworthiness of short-term U.S. tax-exempt municipal securities from MIG 1/VMIG 1 (highest) to SG (lowest). Fitch rates the creditworthiness of bonds, ranging from AAA (highest) to D (lowest). If a security was rated by all three rating agencies, the middle rating was utilized. If rated by two of three rating agencies, the lower rating was utilized and if rated by one of the agencies that rating was utilized. Credit quality is subject to change and is calculated based on the total investments of the Fund. |
| | | | |
| 6 | | Wells Fargo Advantage Ultra Short-Term Income Fund | | Performance Highlights (Unaudited) |
AVERAGE ANNUAL TOTAL RETURN3 (%) (AS OF FEBRUARY 29, 2012)
| | | | | | | | | | | | | | | | | | | | | | | | | | | | | | | | | | | | | | | | | | | | |
| | | | | | Including Sales Charge | | | Excluding Sales Charge | | | Expense Ratios4 | |
| | | Inception Date | | | 6 Months* | | | 1 Year | | | 5 Year | | | 10 Year | | | 6 Months* | | | 1 Year | | | 5 Year | | | 10 Year | | | Gross | | | Net5 | |
Class A (SADAX) | | | 08/31/1999 | | | | (1.39 | ) | | | (1.33 | ) | | | 1.25 | | | | 2.03 | | | | 0.62 | | | | 0.69 | | | | 1.66 | | | | 2.24 | | | | 0.88% | | | | 0.71% | |
Class C (WUSTX) | | | 07/18/2008 | | | | (0.75 | ) | | | (1.07 | ) | | | 0.90 | | | | 1.57 | | | | 0.25 | | | | (0.07 | ) | | | 0.90 | | | | 1.57 | | | | 1.63% | | | | 1.46% | |
Administrator Class (WUSDX) | | | 04/08/2005 | | | | | | | | | | | | | | | | | | | | 0.81 | | | | 0.83 | | | | 1.82 | | | | 2.47 | | | | 0.82% | | | | 0.56% | |
Institutional Class (SADIX) | | | 08/31/1999 | | | | | | | | | | | | | | | | | | | | 0.91 | | | | 1.04 | | | | 2.03 | | | | 2.74 | | | | 0.55% | | | | 0.36% | |
Investor Class (STADX) | | | 11/25/1988 | | | | | | | | | | | | | | | | | | | | 0.72 | | | | 0.77 | | | | 1.64 | | | | 2.30 | | | | 0.91% | | | | 0.74% | |
Barclays Short-Term U.S. Government/Credit Bond Index6 | | | | | | | | | | | | | | | | | | | | | | | 0.15 | | | | 0.35 | | | | 2.16 | | | | NA | | | | | | | | | |
Barclays 9-12 Month U.S. Short Treasury Index7 | | | | | | | | | | | | | | | | | | | | | | | 0.06 | | | | 0.40 | | | | 2.30 | | | | 2.42 | | | | | | | | | |
Barclays 1-3 Year U.S. Government/Credit Bond Index8 | | | | | | | | | | | | | | | | | | | | | | | 0.40 | | | | 1.75 | | | | 3.85 | | | | 3.59 | | | | | | | | | |
| * | Returns for periods of less than one year are not annualized. |
Figures quoted represent past performance, which is no guarantee of future results and do not reflect the deduction of taxes that a shareholder may pay on fund distributions or the redemption of fund shares. Investment return and principal value of an investment will fluctuate so that an investor’s shares, when redeemed, may be worth more or less than their original cost. Performance shown without sales charges would be lower if sales charges were reflected. Current performance may be lower or higher than the performance data quoted and assumes the reinvestment of dividends and capital gains. Current month-end performance is available on the Fund’s Web site – wellsfargoadvantagefunds.com
Index returns do not include transaction costs associated with buying and selling securities, any mutual fund fees or expenses or any taxes. It is not possible to invest directly in an index.
For Class A shares, the maximum front-end sales charge is 2.00%. For Class C shares, the maximum contingent deferred sales charge is 1.00%. Performance including sales charge assumes the sales charge for the corresponding time period. Administrator Class, Institutional, and Investor Class shares are sold without a front-end sales charge or contingent deferred sales charge.
Bond fund values fluctuate in response to the financial condition of individual issuers, general market and economic conditions, and changes in interest rates. In general, when interest rates rise, bond fund values fall and investors may lose principal value. The use of derivatives may reduce returns and/or increase volatility. Certain investment strategies tend to increase the total risk of an investment (relative to the broader market). This Fund is exposed to foreign investment risk, high-yield securities risk, and mortgage and asset-backed securities risk. Consult the Fund’s prospectus for additional information on these and other risks.
| 3. | Historical performance shown for the Class A shares through June 19, 2008 includes Advisor Class expenses. Historical performance shown for the Class C shares prior to their inception reflects the performance of the Investor Class shares, adjusted to include the higher expenses applicable to Class C shares. Historical performance shown for the Administrator Class shares prior to their inception reflects the performance of the Institutional Class shares, and has been adjusted to include the higher expenses applicable to the Administrator Class shares. |
| 4. | Reflects the expense ratios as stated in the most recent prospectuses. |
| 5. | The Adviser has committed through July 11, 2013 to waive fees and/or reimburse expenses to the extent necessary to cap the Fund’s Total Annual Fund Operating Expenses After Fee Waiver, excluding certain expenses, at 0.70% for Class A, 1.45% for Class C, 0.55% for Administrator Class, 0.35% for Institutional Class and 0.73% for Investor Class. Without this cap, the Fund’s returns would have been lower. |
| 6. | The Barclays Short-Term U.S. Government/Credit Bond Index contains securities that have fallen out of the Barclays U.S. Government/Credit Index because of the standard minimum one-year to maturity constraint. Securities in the Barclays Short-Term U.S. Government/Credit Bond Index must have a maturity from 1 up to (but not including) 12 months. However, the limited performance history of the index does not allow for comparison to all periods of the Fund’s performance. This index has an inception date of August 1, 2004. You cannot invest directly in an index. |
| 7. | The Barclays 9-12 Month U.S. Short Treasury Index includes aged U.S. Treasury Bills, notes and bonds with a remaining maturity from 9 up to (but not including) 12 months. It excludes zero coupon STRIPS. You cannot invest directly in an index. |
| 8. | The Barclays 1-3 Year U.S. Government/Credit Bond Index is the 1-3 year component of the Barclays Government/Credit Bond Index which includes securities in the Government and Credit Indices. The Government Index includes treasuries (i.e., public obligations of the U.S. Treasury that have remaining maturities of more than one year) and agencies (i.e., publicly issued debt of U.S. Government agencies, quasi-federal corporations, and corporate or foreign debt guaranteed by the U.S. Government). The Credit Index includes publicly issued U.S. corporate and foreign debentures and secured notes that meet specified maturity, liquidity, and quality requirements. You cannot invest directly in an index. |
| | | | | | |
| Fund Expenses (Unaudited) | | Wells Fargo Advantage Ultra Short-Term Income Fund | | | 7 | |
As a shareholder of the Fund, you incur two types of costs: (1) transaction costs, including sales charges (loads) on purchase payments and contingent deferred sales charges (if any) on redemptions and (2) ongoing costs, including management fees; distribution (12b-1) and/or shareholder service fees; and other Fund expenses. This example is intended to help you understand your ongoing costs (in dollars) of investing in the Fund and to compare these costs with the ongoing costs of investing in other mutual funds.
The example is based on an investment of $1,000 invested at the beginning of the six-month period and held for the entire period from September 1, 2011 to February 29, 2012.
Actual Expenses
The “Actual” line of the table below provides information about actual account values and actual expenses. You may use the information in this line, together with the amount you invested, to estimate the expenses that you paid over the period. Simply divide your account value by $1,000 (for example, an $8,600 account value divided by $1,000 = 8.6), then multiply the result by the number in the “Actual” line under the heading entitled “Expenses Paid During Period” for your applicable class of shares to estimate the expenses you paid on your account during this period.
Hypothetical Example for Comparison Purposes
The “Hypothetical” line of the table below provides information about hypothetical account values and hypothetical expenses based on the Fund’s actual expense ratio and an assumed rate of return of 5% per year before expenses, which is not the Fund’s actual return. The hypothetical account values and expenses may not be used to estimate the actual ending account balance or expenses you paid for the period. You may use this information to compare the ongoing costs of investing in the Fund and other funds. To do so, compare this 5% hypothetical example with the 5% hypothetical examples that appear in the shareholder reports of the other funds.
Please note that the expenses shown in the table are meant to highlight your ongoing costs only and do not reflect any transactional costs, such as sales charges (loads) and contingent deferred sales charges. Therefore, the “Hypothetical” line of the table is useful in comparing ongoing costs only, and will not help you determine the relative total costs of owning different funds. In addition, if these transactional costs were included, your costs would have been higher.
| | | | | | | | | | | | | | | | |
| | | Beginning
Account Value
09-01-2011 | | | Ending
Account Value
02-29-2012 | | | Expenses
Paid During
the Period1 | | | Net Annual
Expense Ratio | |
Class A | | | | | | | | | | | | | | | | |
Actual | | $ | 1,000.00 | | | $ | 1,006.21 | | | $ | 3.49 | | | | 0.70 | % |
Hypothetical (5% return before expenses) | | $ | 1,000.00 | | | $ | 1,021.38 | | | $ | 3.52 | | | | 0.70 | % |
Class C | | | | | | | | | | | | | | | | |
Actual | | $ | 1,000.00 | | | $ | 1,002.46 | | | $ | 7.22 | | | | 1.45 | % |
Hypothetical (5% return before expenses) | | $ | 1,000.00 | | | $ | 1,017.65 | | | $ | 7.27 | | | | 1.45 | % |
Administrator Class | | | | | | | | | | | | | | | | |
Actual | | $ | 1,000.00 | | | $ | 1,008.15 | | | $ | 2.75 | | | | 0.55 | % |
Hypothetical (5% return before expenses) | | $ | 1,000.00 | | | $ | 1,022.13 | | | $ | 2.77 | | | | 0.55 | % |
Institutional Class | | | | | | | | | | | | | | | | |
Actual | | $ | 1,000.00 | | | $ | 1,009.14 | | | $ | 1.75 | | | | 0.35 | % |
Hypothetical (5% return before expenses) | | $ | 1,000.00 | | | $ | 1,023.12 | | | $ | 1.76 | | | | 0.35 | % |
Investor Class | | | | | | | | | | | | | | | | |
Actual | | $ | 1,000.00 | | | $ | 1,007.24 | | | $ | 3.64 | | | | 0.73 | % |
Hypothetical (5% return before expenses) | | $ | 1,000.00 | | | $ | 1,021.23 | | | $ | 3.67 | | | | 0.73 | % |
| 1. | Expenses paid is equal to the annualized expense ratio of each class multiplied by the average account value over the period, multiplied by the number of days in the most recent fiscal half-year divided by the number of days in the fiscal year (to reflect the one-half year period). |
| | | | |
| 8 | | Wells Fargo Advantage Ultra Short-Term Income Fund | | Portfolio of Investments—February 29, 2012 (Unaudited) |
| | | | | | | | | | | | | | | | |
| Security Name | | Interest Rate | | | Maturity Date | | | Principal | | | Value | |
| | | | | | | | | | | | | | | | |
| | | | |
| Agency Securities: 5.30% | | | | | | | | | | | | | | | | |
FHLB | | | 5.00 | % | | | 08/15/2012 | | | $ | 5,140,005 | | | $ | 5,339,020 | |
FHLMC ± | | | 2.49 | | | | 04/01/2032 | | | | 191,224 | | | | 200,025 | |
FHLMC ± | | | 2.50 | | | | 06/01/2032 | | | | 12,329 | | | | 13,002 | |
FHLMC ± | | | 2.54 | | | | 01/01/2029 | | | | 95,134 | | | | 96,007 | |
FHLMC ± | | | 2.62 | | | | 07/01/2029 | | | | 8,675 | | | | 9,191 | |
FHLMC ± | | | 2.69 | | | | 10/01/2031 | | | | 87,927 | | | | 88,105 | |
FHLMC | | | 7.00 | | | | 06/01/2031 | | | | 612,086 | | | | 715,670 | |
FHLMC | | | 7.50 | | | | 06/01/2012 | | | | 6,378 | | | | 6,414 | |
FHLMC | | | 7.50 | | | | 10/01/2012 | | | | 2,572 | | | | 2,600 | |
FHLMC | | | 8.00 | | | | 01/01/2013 | | | | 344 | | | | 345 | |
FHLMC | | | 9.00 | | | | 11/01/2016 | | | | 128,171 | | | | 144,673 | |
FHLMC | | | 9.00 | | | | 12/01/2016 | | | | 901,615 | | | | 1,006,355 | |
FHLMC | | | 9.00 | | | | 08/01/2018 | | | | 231,899 | | | | 262,243 | |
FHLMC | | | 9.00 | | | | 10/01/2019 | | | | 112,793 | | | | 130,930 | |
FHLMC | | | 9.50 | | | | 12/01/2016 | | | | 88,445 | | | | 100,502 | |
FHLMC | | | 9.50 | | | | 05/01/2020 | | | | 43,542 | | | | 48,984 | |
FHLMC | | | 9.50 | | | | 09/01/2020 | | | | 264,646 | | | | 312,915 | |
FHLMC | | | 9.50 | | | | 12/01/2022 | | | | 597,168 | | | | 688,632 | |
FHLMC | | | 10.00 | | | | 11/01/2021 | | | | 90,238 | | | | 105,175 | |
FHLMC | | | 10.50 | | | | 05/01/2020 | | | | 200,348 | | | | 242,832 | |
FHLMC Structured Pass-Through Securities Series T-42 Class A6 | | | 9.50 | | | | 02/25/2042 | | | | 1,303,730 | | | | 1,552,649 | |
FNMA ± | | | 1.87 | | | | 10/01/2031 | | | | 170,301 | | | | 175,175 | |
FNMA ± | | | 2.30 | | | | 11/01/2031 | | | | 157,676 | | | | 165,882 | |
FNMA ± | | | 2.36 | | | | 05/01/2032 | | | | 95,563 | | | | 99,350 | |
FNMA ± | | | 2.43 | | | | 12/01/2040 | | | | 590,065 | | | | 624,227 | |
FNMA ± | | | 2.54 | | | | 06/01/2032 | | | | 211,053 | | | | 212,422 | |
FNMA ± | | | 2.61 | | | | 01/01/2023 | | | | 28,183 | | | | 28,362 | |
FNMA ± | | | 3.16 | | | | 04/01/2033 | | | | 9,709 | | | | 10,265 | |
FNMA ± | | | 3.83 | | | | 07/01/2033 | | | | 70,261 | | | | 70,775 | |
FNMA | | | 6.00 | | | | 04/01/2021 | | | | 5,546,163 | | | | 6,044,364 | |
FNMA | | | 6.50 | | | | 08/01/2031 | | | | 1,318,706 | | | | 1,510,978 | |
FNMA | | | 7.00 | | | | 05/01/2013 | | | | 17,493 | | | | 17,543 | |
FNMA | | | 7.00 | | | | 11/01/2014 | | | | 162,285 | | | | 171,451 | |
FNMA | | | 8.00 | | | | 03/01/2013 | | | | 5,979 | | | | 6,019 | |
FNMA | | | 8.33 | | | | 07/15/2020 | | | | 93,317 | | | | 108,805 | |
FNMA | | | 8.50 | | | | 11/01/2012 | | | | 1,490 | | | | 1,498 | |
FNMA | | | 8.50 | | | | 07/01/2017 | | | | 575,097 | | | | 642,463 | |
FNMA | | | 9.00 | | | | 10/01/2013 | | | | 7,956 | | | | 8,059 | |
FNMA | | | 9.00 | | | | 12/01/2016 | | | | 610,716 | | | | 683,567 | |
FNMA | | | 9.00 | | | | 02/15/2020 | | | | 281,252 | | | | 332,020 | |
FNMA | | | 9.00 | | | | 10/01/2021 | | | | 193,745 | | | | 224,622 | |
FNMA | | | 9.00 | | | | 06/01/2024 | | | | 256,132 | | | | 301,622 | |
FNMA | | | 9.50 | | | | 12/01/2020 | | | | 190,781 | | | | 225,887 | |
FNMA | | | 9.50 | | | | 03/01/2021 | | | | 52,591 | | | | 60,515 | |
FNMA | | | 10.00 | | | | 03/01/2018 | | | | 75,522 | | | | 84,656 | |
FNMA | | | 10.25 | | | | 09/01/2021 | | | | 219,389 | | | | 262,869 | |
FNMA | | | 10.50 | | | | 10/01/2014 | | | | 50,071 | | | | 54,115 | |
FNMA | | | 10.50 | | | | 08/01/2020 | | | | 11,491 | | | | 13,550 | |
FNMA | | | 10.50 | | | | 04/01/2022 | | | | 340,308 | | | | 396,572 | |
FNMA Grantor Trust Series 2000-T6 Class A2 | | | 9.50 | | | | 06/25/2030 | | | | 811,501 | | | | 947,133 | |
The accompanying notes are an integral part of these financial statements.
| | | | | | |
| Portfolio of Investments—February 29, 2012 (Unaudited) | | Wells Fargo Advantage Ultra Short-Term Income Fund | | | 9 | |
| | | | | | | | | | | | | | | | |
| Security Name | | Interest Rate | | | Maturity Date | | | Principal | | | Value | |
| | | | | | | | | | | | | | | | |
| | | | |
| Agency Securities (continued) | | | | | | | | | | | | | | | | |
FNMA Grantor Trust Series 2001-T10 Class A3 | | | 9.50 | % | | | 12/25/2041 | | | $ | 1,927,218 | | | $ | 2,300,975 | |
FNMA Grantor Trust Series 2001-T12 Class A3 | | | 9.50 | | | | 08/25/2041 | | | | 1,701,348 | | | | 2,051,112 | |
FNMA Grantor Trust Series 2001-T8 Class A3 ± | | | 3.87 | | | | 07/25/2041 | | | | 3,648,133 | | | | 3,692,444 | |
FNMA Grantor Trust Series 2002-T1 Class A4 | | | 9.50 | | | | 11/25/2031 | | | | 2,296,098 | | | | 2,772,755 | |
FNMA Series 1988-4 Class Z | | | 9.25 | | | | 03/25/2018 | | | | 111,101 | | | | 125,080 | |
FNMA Series 1988-5 Class Z | | | 9.20 | | | | 03/25/2018 | | | | 46,084 | | | | 46,626 | |
FNMA Series 1988-9 Class Z | | | 9.45 | | | | 04/25/2018 | | | | 66,084 | | | | 75,084 | |
FNMA Series 1989-30 Class Z | | | 9.50 | | | | 06/25/2019 | | | | 345,086 | | | | 392,566 | |
FNMA Series 1989-49 Class E | | | 9.30 | | | | 08/25/2019 | | | | 51,231 | | | | 57,426 | |
FNMA Series 1990-111 Class Z | | | 8.75 | | | | 09/25/2020 | | | | 64,435 | | | | 70,915 | |
FNMA Series 1990-119 Class J | | | 9.00 | | | | 10/25/2020 | | | | 167,911 | | | | 195,216 | |
FNMA Series 1990-124 Class Z | | | 9.00 | | | | 10/25/2020 | | | | 100,839 | | | | 117,487 | |
FNMA Series 1990-21 Class Z | | | 9.00 | | | | 03/25/2020 | | | | 275,423 | | | | 319,396 | |
FNMA Series 1990-27 Class Z | | | 9.00 | | | | 03/25/2020 | | | | 173,936 | | | | 201,480 | |
FNMA Series 1990-30 Class D | | | 9.75 | | | | 03/25/2020 | | | | 82,498 | | | | 96,595 | |
FNMA Series 1990-77 Class D | | | 9.00 | | | | 06/25/2020 | | | | 80,957 | | | | 92,290 | |
FNMA Series 1991-132 Class Z | | | 8.00 | | | | 10/25/2021 | | | | 381,076 | | | | 450,406 | |
FNMA Series 1992-71 Class X | | | 8.25 | | | | 05/25/2022 | | | | 127,634 | | | | 153,202 | |
FNMA Series 2007-2 Class FA ± | | | 0.44 | | | | 02/25/2037 | | | | 1,339,796 | | | | 1,333,195 | |
FNMA Series 2007-B2 Class AB | | | 5.50 | | | | 12/25/2020 | | | | 2,547,240 | | | | 2,638,026 | |
FNMA Series 2011-56 Class AC | | | 2.00 | | | | 07/25/2018 | | | | 1,533,280 | | | | 1,562,466 | |
FNMA Series G-22 Class ZT | | | 8.00 | | | | 12/25/2016 | | | | 701,213 | | | | 784,887 | |
FNMA Whole Loan Series 2002-W4 Class A6 ± | | | 3.41 | | | | 05/25/2042 | | | | 1,631,106 | | | | 1,735,343 | |
FNMA Whole Loan Series 2003-W11 Class A1 ± | | | 3.10 | | | | 06/25/2033 | | | | 111,192 | | | | 111,168 | |
FNMA Whole Loan Series 2003-W3 Class 1A4 ± | | | 3.41 | | | | 08/25/2042 | | | | 68,579 | | | | 73,165 | |
FNMA Whole Loan Series 2003-W6 Class 6A ± | | | 3.19 | | | | 08/25/2042 | | | | 4,927,398 | | | | 5,338,800 | |
FNMA Whole Loan Series 2004-W6 Class 1A4 | | | 5.50 | | | | 07/25/2034 | | | | 6,310,053 | | | | 6,527,823 | |
GNMA | | | 7.00 | | | | 05/15/2013 | | | | 66,369 | | | | 65,912 | |
GNMA | | | 7.00 | | | | 06/15/2033 | | | | 1,170,611 | | | | 1,401,543 | |
GNMA | | | 7.50 | | | | 02/15/2013 | | | | 921 | | | | 930 | |
GNMA | | | 8.00 | | | | 01/15/2013 | | | | 1,317 | | | | 1,333 | |
GNMA | | | 9.00 | | | | 11/15/2017 | | | | 212,963 | | | | 241,126 | |
GNMA | | | 9.50 | | | | 11/15/2017 | | | | 54,835 | | | | 62,145 | |
GNMA | | | 10.00 | | | | 10/20/2017 | | | | 157,110 | | | | 176,620 | |
GNMA Series 2005-90 Class A | | | 3.76 | | | | 09/16/2028 | | | | 3,501,382 | | | | 3,582,593 | |
| | | | |
Total Agency Securities (Cost $59,676,601) | | | | | | | | | | | | | | | 63,399,165 | |
| | | | | | | | | | | | | | | | |
| | | | |
| Asset-Backed Securities: 13.18% | | | | | | | | | | | | | | | | |
Chase Issuance Trust Series 2007-A18 Class A ± | | | 0.51 | | | | 01/15/2015 | | | | 3,400,000 | | | | 3,407,894 | |
Chase Issuance Trust Series 2009-A2 Class A2 ± | | | 1.80 | | | | 04/15/2014 | | | | 11,000,000 | | | | 11,021,562 | |
Citibank Credit Card Issuance Trust Series 2009-A1 Class A1 ± | | | 2.00 | | | | 03/17/2014 | | | | 10,500,000 | | | | 10,507,457 | |
CNH Equipment Trust Series 2011-A Class A2 | | | 0.62 | | | | 06/16/2014 | | | | 1,817,083 | | | | 1,817,272 | |
ContiMortgage Net Interest Margin Notes Series 1997-A Class A (c)(a)(s)(i) | | | 7.23 | | | | 10/16/2028 | | | | 8,464,667 | | | | 2,645 | |
Countrywide Asset-Backed Certificates Series 2007-S1 Class A1A ± | | | 0.35 | | | | 11/25/2036 | | | | 269,852 | | | | 260,246 | |
Ford Credit Auto Lease Trust Series 2011-A Class A2 | | | 0.74 | | | | 09/15/2013 | | | | 6,000,000 | | | | 6,001,380 | |
Ford Credit Auto Lease Trust Series 2011-B Class A2 | | | 0.82 | | | | 01/15/2014 | | | | 10,000,000 | | | | 10,011,024 | |
Ford Credit Auto Lease Trust Series 2012-A Class A2 | | | 0.63 | | | | 04/15/2014 | | | | 5,800,000 | | | | 5,799,289 | |
Ford Credit Auto Owner Trust Series 2012-A Class A2 | | | 0.62 | | | | 09/15/2014 | | | | 4,000,000 | | | | 4,003,068 | |
Home Equity Asset Trust Series 2003-7 Class M1 ± | | | 1.22 | | | | 03/25/2034 | | | | 5,637,624 | | | | 4,119,637 | |
Honda Auto Receivables Owner Trust Series 2010-3 Class A2 | | | 0.53 | | | | 01/21/2013 | | | | 350,553 | | | | 350,577 | |
The accompanying notes are an integral part of these financial statements.
| | | | |
| 10 | | Wells Fargo Advantage Ultra Short-Term Income Fund | | Portfolio of Investments—February 29, 2012 (Unaudited) |
| | | | | | | | | | | | | | | | |
| Security Name | | Interest Rate | | | Maturity Date | | | Principal | | | Value | |
| | | | | | | | | | | | | | | | |
| | | | |
| Asset-Backed Securities (continued) | | | | | | | | | | | | | | | | |
Honda Auto Receivables Owner Trust Series 2011-1 Class A2 | | | 0.65 | % | | | 06/17/2013 | | | $ | 4,199,717 | | | $ | 4,201,883 | |
Honda Auto Receivables Owner Trust Series 2011-2 Class A2 | | | 0.57 | | | | 07/18/2013 | | | | 6,075,920 | | | | 6,077,785 | |
Honda Auto Receivables Owner Trust Series 2012-1 Class A2 | | | 0.57 | | | | 08/15/2014 | | | | 7,000,000 | | | | 7,000,879 | |
Hyundai Auto Lease Securitization Trust Series 2011 Class A2 144A | | | 0.69 | | | | 11/15/2013 | | | | 3,400,000 | | | | 3,400,970 | |
Hyundai Auto Receivables Trust Hart Series 2011-C Class A2 | | | 0.62 | | | | 07/15/2014 | | | | 2,430,000 | | | | 2,431,579 | |
Hyundai Auto Receivables Trust Hart Series 2012-A Class A2 | | | 0.85 | | | | 06/16/2014 | | | | 4,000,000 | | | | 3,999,872 | |
Hyundai Auto Receivables Trust Series 2010 B Class A2 | | | 0.57 | | | | 03/15/2013 | | | | 81,945 | | | | 81,950 | |
John Deere Owner Trust Series 2011-A Class A2 | | | 0.64 | | | | 06/16/2014 | | | | 5,562,072 | | | | 5,565,105 | |
John Deere Owner Trust Series 2012-A Class A2 | | | 0.82 | | | | 06/16/2014 | | | | 6,500,000 | | | | 6,499,854 | |
Mercedes-Benz Auto Lease Trust Series 2011-1A Class A2 144A | | | 0.79 | | | | 04/15/2013 | | | | 2,821,429 | | | | 2,822,690 | |
Mercedes-Benz Auto Lease Trust Series 2011-B Class A2 144A | | | 0.90 | | | | 01/15/2014 | | | | 7,500,000 | | | | 7,507,865 | |
Morgan Stanley Capital I 2004-T13 Class A4 | | | 4.66 | | | | 09/13/2045 | | | | 8,330,000 | | | | 8,778,412 | |
Nissan Auto Lease Trust Series 2010-B Class A2 | | | 0.90 | | | | 05/15/2013 | | | | 2,477,140 | | | | 2,478,818 | |
Nissan Auto Receivables Owner Trust Series 2011-B Class A2 | | | 0.74 | | | | 09/15/2014 | | | | 1,050,000 | | | | 1,052,129 | |
Nissan Auto Receivables Owner Trust Series 2010-A Class A2 | | | 0.55 | | | | 03/15/2013 | | | | 351,472 | | | | 351,500 | |
Nissan Auto Receivables Owner Trust Series 2011-A Class A2 | | | 0.65 | | | | 12/16/2013 | | | | 10,486,716 | | | | 10,510,360 | |
Porsche Financial Auto Securitization Series 2011-1 Class A2 144A | | | 0.56 | | | | 12/16/2013 | | | | 3,628,857 | | | | 3,629,222 | |
Porsche Innovative Lease Owner Pilot Series 2011-1 Class A2 144A | | | 0.92 | | | | 02/20/2014 | | | | 6,500,000 | | | | 6,508,468 | |
Residential Asset Securities Corporation Series 2001-KS1 Class AII ± | | | 0.71 | | | | 03/25/2032 | | | | 88,293 | | | | 85,672 | |
Structured Asset Investment Loan Trust Series 2003-BC10 Class M1 ± | | | 1.37 | | | | 10/25/2033 | | | | 3,038,536 | | | | 2,377,475 | |
Structured Asset Investment Loan Trust Series 2003-BC3 Class M1 ± | | | 1.67 | | | | 04/25/2033 | | | | 5,445,138 | | | | 4,318,011 | |
Toyota Auto Receivables Owner Trust Series 2010-C Class A2 | | | 0.51 | | | | 12/17/2012 | | | | 536,380 | | | | 536,399 | |
Volkswagen Auto Lease Trust Series 2010-A Class A2 | | | 0.77 | | | | 01/22/2013 | | | | 1,063,230 | | | | 1,063,566 | |
Volkswagen Auto Lease Trust Series 2011-A Class A2 | | | 1.00 | | | | 02/20/2014 | | | | 6,000,000 | | | | 6,013,583 | |
Volkswagen Auto Loan Enhanced Valet Series 2012-1 Class A2 | | | 0.61 | | | | 10/20/2014 | | | | 3,000,000 | | | | 3,002,606 | |
| | | | |
Total Asset-Backed Securities (Cost $169,399,252) | | | | | | | | | | | | | | | 157,598,704 | |
| | | | | | | | | | | | | | | | |
| | | | |
Corporate Bonds and Notes: 43.10% | | | | | | | | | | | | | | | | |
| | | | |
Consumer Discretionary: 8.31% | | | | | | | | | | | | | | | | |
| | | | |
| Auto Components: 0.43% | | | | | | | | | | | | | | | | |
AutoZone Incorporated | | | 5.88 | | | | 10/15/2012 | | | | 5,000,000 | | | | 5,152,735 | |
| | | | | | | | | | | | | | | | |
| | | | |
| Diversified Consumer Services: 0.85% | | | | | | | | | | | | | | | | |
Life Technologies Corporation | | | 3.38 | | | | 03/01/2013 | | | | 5,000,000 | | | | 5,096,590 | |
Science Applications International Corporation | | | 6.25 | | | | 07/01/2012 | | | | 5,000,000 | | | | 5,090,035 | |
| | | | |
| | | | | | | | | | | | | | | 10,186,625 | |
| | | | | | | | | | | | | | | | |
| | | | |
| Hotels, Restaurants & Leisure: 0.86% | | | | | | | | | | | | | | | | |
Marriott International | | | 4.63 | | | | 06/15/2012 | | | | 6,038,000 | | | | 6,089,462 | |
Starwood Hotels & Resorts Worldwide Incorporated | | | 6.25 | | | | 02/15/2013 | | | | 4,000,000 | | | | 4,175,000 | |
| | | | |
| | | | | | | | | | | | | | | 10,264,462 | |
| | | | | | | | | | | | | | | | |
| | | | |
| Household Durables: 0.89% | | | | | | | | | | | | | | | | |
Mohawk Industries Incorporated Series D | | | 7.20 | | | | 04/15/2012 | | | | 4,250,000 | | | | 4,255,313 | |
Newell Rubbermaid Incorporated | | | 5.50 | | | | 04/15/2013 | | | | 6,095,000 | | | | 6,377,010 | |
| | | | |
| | | | | | | | | | | | | | | 10,632,323 | |
| | | | | | | | | | | | | | | | |
The accompanying notes are an integral part of these financial statements.
| | | | | | |
| Portfolio of Investments—February 29, 2012 (Unaudited) | | Wells Fargo Advantage Ultra Short-Term Income Fund | | | 11 | |
| | | | | | | | | | | | | | | | |
| Security Name | | Interest Rate | | | Maturity Date | | | Principal | | | Value | |
| | | | | | | | | | | | | | | | |
| | | | |
| Media: 3.01% | | | | | | | | | | | | | | | | |
CBS Corporation | | | 8.20 | % | | | 05/15/2014 | | | $ | 7,000,000 | | | $ | 7,993,545 | |
EchoStar DBS Corporation | | | 7.00 | | | | 10/01/2013 | | | | 3,000,000 | | | | 3,221,250 | |
Historic TW Incorporated | | | 9.13 | | | | 01/15/2013 | | | | 3,270,000 | | | | 3,494,178 | |
Mcgraw-Hill Companies Incorporated | | | 5.38 | | | | 11/15/2012 | | | | 2,025,000 | | | | 2,088,889 | |
Sirius XM Radio Incorporated 144A | | | 9.75 | | | | 09/01/2015 | | | | 5,500,000 | | | | 5,953,750 | |
Time Warner Cable Incorporated | | | 5.40 | | | | 07/02/2012 | | | | 6,100,000 | | | | 6,193,422 | |
Viacom Incorporated | | | 4.38 | | | | 09/15/2014 | | | | 6,512,000 | | | | 7,042,044 | |
| | | | |
| | | | | | | | | | | | | | | 35,987,078 | |
| | | | | | | | | | | | | | | | |
| | | | |
| Multiline Retail: 1.15% | | | | | | | | | | | | | | | | |
JCPenney Company Incorporated | | | 9.00 | | | | 08/01/2012 | | | | 6,280,000 | | | | 6,476,250 | |
Macy’s Incorporated | | | 5.35 | | | | 03/15/2012 | | | | 4,250,000 | | | | 4,254,038 | |
Target Corporation | | | 5.88 | | | | 03/01/2012 | | | | 3,019,000 | | | | 3,019,000 | |
| | | | |
| | | | | | | | | | | | | | | 13,749,288 | |
| | | | | | | | | | | | | | | | |
| | | | |
| Specialty Retail: 1.12% | | | | | | | | | | | | | | | | |
Best Buy Company Incorporated | | | 6.75 | | | | 07/15/2013 | | | | 5,500,000 | | | | 5,818,208 | |
Home Depot Incorporated | | | 5.25 | | | | 12/16/2013 | | | | 7,000,000 | | | | 7,581,952 | |
| | | | |
| | | | | | | | | | | | | | | 13,400,160 | |
| | | | | | | | | | | | | | | | |
| | | | |
Consumer Staples: 2.57% | | | | | | | | | | | | | | | | |
| | | | |
| Beverages: 0.46% | | | | | | | | | | | | | | | | |
Anheuser Busch InBev Worldwide Incorporated ± | | | 1.30 | | | | 03/26/2013 | | | | 3,000,000 | | | | 3,016,416 | |
Anheuser Busch InBev Worldwide Incorporated | | | 3.00 | | | | 10/15/2012 | | | | 2,495,000 | | | | 2,531,138 | |
| | | | |
| | | | | | | | | | | | | | | 5,547,554 | |
| | | | | | | | | | | | | | | | |
| | | | |
| Food & Staples Retailing: 0.89% | | | | | | | | | | | | | | | | |
Safeway Incorporated | | | 5.80 | | | | 08/15/2012 | | | | 5,500,000 | | | | 5,611,529 | |
Wm.Wrigley Jr. Company 144A | | | 2.45 | | | | 06/28/2012 | | | | 5,000,000 | | | | 5,026,600 | |
| | | | |
| | | | | | | | | | | | | | | 10,638,129 | |
| | | | | | | | | | | | | | | | |
| | | | |
| Food Products: 0.75% | | | | | | | | | | | | | | | | |
Cadbury Schweppes Company 144A | | | 5.13 | | | | 10/01/2013 | | | | 6,545,000 | | | | 6,949,042 | |
HJ Heinz Finance Company | | | 6.00 | | | | 03/15/2012 | | | | 2,000,000 | | | | 2,002,894 | |
| | | | |
| | | | | | | | | | | | | | | 8,951,936 | |
| | | | | | | | | | | | | | | | |
| | | | |
| Tobacco: 0.47% | | | | | | | | | | | | | | | | |
UST Incorporated | | | 6.63 | | | | 07/15/2012 | | | | 5,500,000 | | | | 5,606,222 | |
| | | | | | | | | | | | | | | | |
| | | | |
Energy: 3.76% | | | | | | | | | | | | | | | | |
| | | | |
| Energy Equipment & Services: 1.07% | | | | | | | | | | | | | | | | |
Enterprise Products Operating LLC | | | 4.60 | | | | 08/01/2012 | | | | 6,017,000 | | | | 6,112,051 | |
Kinder Morgan Energy Partners LP | | | 7.13 | | | | 03/15/2012 | | | | 6,700,000 | | | | 6,711,243 | |
| | | | |
| | | | | | | | | | | | | | | 12,823,294 | |
| | | | | | | | | | | | | | | | |
| | | | |
| Oil, Gas & Consumable Fuels: 2.69% | | | | | | | | | | | | | | | | |
Chesapeake Energy Corporation | | | 7.63 | | | | 07/15/2013 | | | | 4,000,000 | | | | 4,240,000 | |
El Paso Corporation | | | 7.38 | | | | 12/15/2012 | | | | 1,000,000 | | | | 1,032,329 | |
The accompanying notes are an integral part of these financial statements.
| | | | |
| 12 | | Wells Fargo Advantage Ultra Short-Term Income Fund | | Portfolio of Investments—February 29, 2012 (Unaudited) |
| | | | | | | | | | | | | | | | |
| Security Name | | Interest Rate | | | Maturity Date | | | Principal | | | Value | |
| | | | | | | | | | | | | | | | |
| | | | |
| Oil, Gas & Consumable Fuels (continued) | | | | | | | | | | | | | | | | |
Kinder Morgan Incorporated | | | 6.50 | % | | | 09/01/2012 | | | $ | 7,000,000 | | | $ | 7,140,000 | |
Petrobras International Finance Company | | | 2.88 | | | | 02/06/2015 | | | | 4,000,000 | | | | 4,094,388 | |
Trans Canada Pipelines Corporation | | | 0.88 | | | | 03/02/2015 | | | | 2,000,000 | | | | 1,994,528 | |
Transcontinental Gas Pipe Corporation | | | 8.88 | | | | 07/15/2012 | | | | 6,000,000 | | | | 6,171,834 | |
Valero Energy Corporation | | | 4.75 | | | | 04/01/2014 | | | | 5,125,000 | | | | 5,425,617 | |
Weatherford International Incorporated | | | 5.95 | | | | 06/15/2012 | | | | 2,020,000 | | | | 2,043,424 | |
| | | | |
| | | | | | | | | | | | | | | 32,142,120 | |
| | | | | | | | | | | | | | | | |
| | | | |
Financials: 10.62% | | | | | | | | | | | | | | | | |
| | | | |
| Commercial Banks: 2.99% | | | | | | | | | | | | | | | | |
Branch Banking & Trust Corporation | | | 3.85 | | | | 07/27/2012 | | | | 665,000 | | | | 673,872 | |
Branch Banking & Trust Corporation | | | 4.75 | | | | 10/01/2012 | | | | 6,000,000 | | | | 6,125,646 | |
Charter One Bank NA | | | 6.38 | | | | 05/15/2012 | | | | 5,000,000 | | | | 5,035,745 | |
Credit Suisse | | | 2.20 | | | | 01/14/2014 | | | | 6,000,000 | | | | 6,048,990 | |
Hudson United Bank | | | 7.00 | | | | 05/15/2012 | | | | 1,925,000 | | | | 1,945,536 | |
Key Bank NA | | | 5.50 | | | | 09/17/2012 | | | | 3,000,000 | | | | 3,077,172 | |
Key Bank NA | | | 5.70 | | | | 08/15/2012 | | | | 3,000,000 | | | | 3,063,660 | |
M&I Marshall & IIsley Bank | | | 5.25 | | | | 09/04/2012 | | | | 6,510,000 | | | | 6,649,314 | |
PNC Funding Corporation ± | | | 0.78 | | | | 04/01/2012 | | | | 2,100,000 | | | | 2,101,126 | |
Union Bank NA | | | 2.13 | | | | 12/16/2013 | | | | 1,000,000 | | | | 1,015,689 | |
| | | | |
| | | | | | | | | | | | | | | 35,736,750 | |
| | | | | | | | | | | | | | | | |
| | | | |
| Consumer Finance: 2.15% | | | | | | | | | | | | | | | | |
American Express Credit Corporation | | | 7.30 | | | | 08/20/2013 | | | | 7,000,000 | | | | 7,608,888 | |
American Honda Finance Corporation 144A | | | 2.38 | | | | 03/18/2013 | | | | 4,000,000 | | | | 4,071,340 | |
Capital One Financial Corporation | | | 7.38 | | | | 05/23/2014 | | | | 7,000,000 | | | | 7,790,335 | |
Ford Motor Credit Company LLC | | | 3.88 | | | | 01/15/2015 | | | | 4,000,000 | | | | 4,100,912 | |
Ford Motor Credit Company LLC | | | 7.00 | | | | 10/01/2013 | | | | 2,000,000 | | | | 2,141,588 | |
| | | | |
| | | | | | | | | | | | | | | 25,713,063 | |
| | | | | | | | | | | | | | | | |
| | | | |
| Diversified Financial Services: 1.98% | | | | | | | | | | | | | | | | |
Citigroup Incorporated | | | 6.50 | | | | 08/19/2013 | | | | 7,000,000 | | | | 7,417,767 | |
General Electric Capital Corporation ± | | | 0.66 | | | | 06/12/2012 | | | | 8,500,000 | | | | 8,496,677 | |
HSBC Finance Corporation | | | 7.00 | | | | 05/15/2012 | | | | 5,095,000 | | | | 5,156,517 | |
Invesco Limited | | | 5.38 | | | | 02/27/2013 | | | | 2,465,000 | | | | 2,565,794 | |
| | | | |
| | | | | | | | | | | | | | | 23,636,755 | |
| | | | | | | | | | | | | | | | |
| | | | |
| Insurance: 1.22% | | | | | | | | | | | | | | | | |
AON Corporation | | | 7.38 | | | | 12/14/2012 | | | | 6,000,000 | | | | 6,284,220 | |
ASIF Global Financing XIX 144A | | | 4.90 | | | | 01/17/2013 | | | | 3,000,000 | | | | 3,060,000 | |
Genworth Life Institutional Funding Trust 144A | | | 5.88 | | | | 05/03/2013 | | | | 3,715,000 | | | | 3,803,194 | |
Mass Mutual Global Funding II 144A | | | 3.63 | | | | 07/16/2012 | | | | 1,500,000 | | | | 1,516,245 | |
| | | | |
| | | | | | | | | | | | | | | 14,663,659 | |
| | | | | | | | | | | | | | | | |
| | | | |
| REITs: 2.28% | | | | | | | | | | | | | | | | |
Duke Realty LP | | | 5.88 | | | | 08/15/2012 | | | | 4,000,000 | | | | 4,063,804 | |
Duke Realty LP | | | 6.25 | | | | 05/15/2013 | | | | 1,950,000 | | | | 2,050,934 | |
ERP Operating LP | | | 6.63 | | | | 03/15/2012 | | | | 5,975,000 | | | | 5,984,841 | |
The accompanying notes are an integral part of these financial statements.
| | | | | | |
| Portfolio of Investments—February 29, 2012 (Unaudited) | | Wells Fargo Advantage Ultra Short-Term Income Fund | | | 13 | |
| | | | | | | | | | | | | | | | |
| Security Name | | Interest Rate | | | Maturity Date | | | Principal | | | Value | |
| | | | | | | | | | | | | | | | |
| | | | |
| REITs (continued) | | | | | | | | | | | | | | | | |
HCP Incorporated | | | 5.63 | % | | | 02/28/2013 | | | $ | 1,000,000 | | | $ | 1,026,824 | |
Health Care REIT Incorporated | | | 8.00 | | | | 09/12/2012 | | | | 3,986,000 | | | | 4,083,888 | |
Simon Property Group LP | | | 5.45 | | | | 03/15/2013 | | | | 4,800,000 | | | | 5,000,506 | |
Ventas Realty LP | | | 9.00 | | | | 05/01/2012 | | | | 5,000,000 | | | | 5,045,320 | |
| | | | |
| | | | | | | | | | | | | | | 27,256,117 | |
| | | | | | | | | | | | | | | | |
| | | | |
Health Care: 3.06% | | | | | | | | | | | | | | | | |
| | | | |
| Biotechnology: 1.15% | | | | | | | | | | | | | | | | |
Amgen Incorporated | | | 1.88 | | | | 11/15/2014 | | | | 6,000,000 | | | | 6,139,026 | |
Biogen Idec Incorporated | | | 6.00 | | | | 03/01/2013 | | | | 7,226,000 | | | | 7,578,795 | |
| | | | |
| | | | | | | | | | | | | | | 13,717,821 | |
| | | | | | | | | | | | | | | | |
| | | | |
| Health Care Providers & Services: 1.49% | | | | | | | | | | | | | | | | |
Anthem Incorporated | | | 6.80 | | | | 08/01/2012 | | | | 5,000,000 | | | | 5,126,085 | |
Aristotle Holding Incorporated 144A | | | 2.10 | | | | 02/12/2015 | | | | 3,400,000 | | | | 3,427,271 | |
Express Scripts Incorporated | | | 5.25 | | | | 06/15/2012 | | | | 5,251,000 | | | | 5,314,122 | |
McKesson HBOC Incorporated | | | 5.25 | | | | 03/01/2013 | | | | 3,829,000 | | | | 3,992,077 | |
| | | | |
| | | | | | | | | | | | | | | 17,859,555 | |
| | | | | | | | | | | | | | | | |
| | | | |
| Pharmaceuticals: 0.42% | | | | | | | | | | | | | | | | |
Teva Pharmaceutical Finance LLC | | | 1.50 | | | | 06/15/2012 | | | | 5,000,000 | | | | 5,015,470 | |
| | | | | | | | | | | | | | | | |
| | | | |
Industrials: 4.05% | | | | | | | | | | | | | | | | |
| | | | |
| Building Products: 0.51% | | | | | | | | | | | | | | | | |
Masco Corporation | | | 5.88 | | | | 07/15/2012 | | | | 6,000,000 | | | | 6,059,550 | |
| | | | | | | | | | | | | | | | |
| | | | |
| Commercial Services & Supplies: 1.06% | | | | | | | | | | | | | | | | |
Pitney Bowes Incorporated | | | 3.88 | | | | 06/15/2013 | | | | 6,412,000 | | | | 6,587,330 | |
R.R. Donnelley & Sons Company | | | 4.95 | | | | 04/01/2014 | | | | 6,000,000 | | | | 6,150,000 | |
| | | | |
| | | | | | | | | | | | | | | 12,737,330 | |
| | | | | | | | | | | | | | | | |
| | | | |
| Electrical Equipment: 1.00% | | | | | | | | | | | | | | | | |
Agilent Technologies Incorporated | | | 4.45 | | | | 09/14/2012 | | | | 4,500,000 | | | | 4,579,857 | |
Roper Industries Incorporated | | | 6.63 | | | | 08/15/2013 | | | | 6,895,000 | | | | 7,367,052 | |
| | | | |
| | | | | | | | | | | | | | | 11,946,909 | |
| | | | | | | | | | | | | | | | |
| | | | |
| Machinery: 0.45% | | | | | | | | | | | | | | | | |
Case New Holland Incorporated | | | 7.75 | | | | 09/01/2013 | | | | 5,000,000 | | | | 5,350,000 | |
| | | | | | | | | | | | | | | | |
| | | | |
| Road & Rail: 1.03% | | | | | | | | | | | | | | | | |
CSX Corporation | | | 6.30 | | | | 03/15/2012 | | | | 2,000,000 | | | | 2,002,956 | |
ERAC USA Finance Company 144A | | | 5.80 | | | | 10/15/2012 | | | | 6,000,000 | | | | 6,169,446 | |
Union Pacific Corporation | | | 5.45 | | | | 01/31/2013 | | | | 4,000,000 | | | | 4,173,196 | |
| | | | |
| | | | | | | | | | | | | | | 12,345,598 | |
| | | | | | | | | | | | | | | | |
| | | | |
Information Technology: 2.52% | | | | | | | | | | | | | | | | |
| | | | |
| Computers & Peripherals: 0.02% | | | | | | | | | | | | | | | | |
Hewlett-Packard Company | | | 2.95 | | | | 08/15/2012 | | | | 265,000 | | | | 267,004 | |
| | | | | | | | | | | | | | | | |
The accompanying notes are an integral part of these financial statements.
| | | | |
| 14 | | Wells Fargo Advantage Ultra Short-Term Income Fund | | Portfolio of Investments—February 29, 2012 (Unaudited) |
| | | | | | | | | | | | | | | | |
| Security Name | | Interest Rate | | | Maturity Date | | | Principal | | | Value | |
| | | | | | | | | | | | | | | | |
| | | | |
| IT Services: 0.62% | | | | | | | | | | | | | | | | |
Electronic Data Systems Corporation Series B | | | 6.00 | % | | | 08/01/2013 | | | $ | 7,000,000 | | | $ | 7,466,718 | |
| | | | | | | | | | | | | | | | |
| | | | |
| Office Electronics: 0.56% | | | | | | | | | | | | | | | | |
Xerox Corporation | | | 8.25 | | | | 05/15/2014 | | | | 6,000,000 | | | | 6,738,606 | |
| | | | | | | | | | | | | | | | |
| | | | |
| Semiconductors & Semiconductor Equipment: 0.76% | | | | | | | | | | | | | | | | |
Broadcom Corporation | | | 1.50 | | | | 11/01/2013 | | | | 4,000,000 | | | | 4,049,188 | |
National Semiconductor Corporation | | | 6.15 | | | | 06/15/2012 | | | | 4,908,000 | | | | 4,982,155 | |
| | | | |
| | | | | | | | | | | | | | | 9,031,343 | |
| | | | | | | | | | | | | | | | |
| | | | |
| Software: 0.56% | | | | | | | | | | | | | | | | |
CA Incorporated | | | 6.13 | | | | 12/01/2014 | | | | 6,000,000 | | | | 6,630,660 | |
| | | | | | | | | | | | | | | | |
| | | | |
Materials: 1.47% | | | | | | | | | | | | | | | | |
| | | | |
| Metals & Mining: 1.47% | | | | | | | | | | | | | | | | |
Arcelormittal Company | | | 3.75 | | | | 02/25/2015 | | | | 2,000,000 | | | | 2,035,040 | |
Barrick Gold Corporation | | | 1.75 | | | | 05/30/2014 | | | | 7,000,000 | | | | 7,140,630 | |
Freeport-McMoRan Copper & Gold Incorporated | | | 1.40 | | | | 02/13/2015 | | | | 3,000,000 | | | | 3,005,334 | |
Rio Tinto Alcan Incorporated | | | 4.88 | | | | 09/15/2012 | | | | 1,000,000 | | | | 1,023,089 | |
Teck Cominco Incorporated | | | 7.00 | | | | 09/15/2012 | | | | 3,270,000 | | | | 3,369,379 | |
United States Steel Corporation | | | 5.65 | | | | 06/01/2013 | | | | 1,000,000 | | | | 1,027,500 | |
| | | | |
| | | | | | | | | | | | | | | 17,600,972 | |
| | | | | | | | | | | | | | | | |
| | | | |
Telecommunication Services: 3.10% | | | | | | | | | | | | | | | | |
| | | | |
| Diversified Telecommunication Services: 3.10% | | | | | | | | | | | | | | | | |
AT&T Incorporated | | | 0.88 | | | | 02/13/2015 | | | | 6,445,000 | | | | 6,431,388 | |
Bellsouth Corporation 144A | | | 4.46 | | | | 04/26/2021 | | | | 6,000,000 | | | | 6,032,244 | |
CenturyTel Incorporated | | | 7.88 | | | | 08/15/2012 | | | | 3,000,000 | | | | 3,085,185 | |
Citizens Communications Company | | | 6.25 | | | | 01/15/2013 | | | | 4,500,000 | | | | 4,646,250 | |
Qwest Corporation ± | | | 3.80 | | | | 06/15/2013 | | | | 3,000,000 | | | | 3,052,500 | |
Verizon Virginia Incorporated Series A | | | 4.63 | | | | 03/15/2013 | | | | 6,070,000 | | | | 6,308,757 | |
Verizon Wireless Capital LLC | | | 7.38 | | | | 11/15/2013 | | | | 6,688,000 | | | | 7,422,764 | |
| | | | |
| | | | | | | | | | | | | | | 36,979,088 | |
| | | | | | | | | | | | | | | | |
| | | | |
Utilities: 3.64% | | | | | | | | | | | | | | | | |
| | | | |
| Electric Utilities: 3.39% | | | | | | | | | | | | | | | | |
Allegheny Energy Supply Company LLC 144A | | | 8.25 | | | | 04/15/2012 | | | | 3,000,000 | | | | 3,021,372 | |
Aquila Incorporated Step Bond | | | 11.88 | | | | 07/01/2012 | | | | 5,055,000 | | | | 5,232,269 | |
Carolina Power & Light Company | | | 6.50 | | | | 07/15/2012 | | | | 6,000,000 | | | | 6,130,290 | |
CenterPoint Energy Houston Electric LLC Series U | | | 7.00 | | | | 03/01/2014 | | | | 5,669,000 | | | | 6,319,127 | |
Columbus Southern Power Company ± | | | 0.96 | | | | 03/16/2012 | | | | 5,000,000 | | | | 4,999,360 | |
Commonwealth Edison Company | | | 6.15 | | | | 03/15/2012 | | | | 4,000,000 | | | | 4,006,252 | |
Dominion Resources Incorporated | | | 5.00 | | | | 03/15/2013 | | | | 8,425,000 | | | | 8,792,220 | |
Public Services Electricity & Gas | | | 0.85 | | | | 08/15/2014 | | | | 2,000,000 | | | | 2,007,208 | |
| | | | |
| | | | | | | | | | | | | | | 40,508,098 | |
| | | | | | | | | | | | | | | | |
The accompanying notes are an integral part of these financial statements.
| | | | | | |
| Portfolio of Investments—February 29, 2012 (Unaudited) | | Wells Fargo Advantage Ultra Short-Term Income Fund | | | 15 | |
| | | | | | | | | | | | | | | | |
| Security Name | | Interest Rate | | | Maturity Date | | | Principal | | | Value | |
| | | | | | | | | | | | | | | | |
| | | | |
| Multi-Utilities: 0.25% | | | | | | | | | | | | | | | | |
DTE Energy Company ± | | | 1.23 | % | | | 06/03/2013 | | | $ | 3,000,000 | | | $ | 3,009,597 | |
| | | | | | | | | | | | | | | | |
| | | | |
Total Corporate Bonds and Notes (Cost $513,157,323) | | | | | | | | | | | | | | | 515,352,589 | |
| | | | | | | | | | | | | | | | |
| | | | |
Municipal Bonds and Notes: 2.97% | | | | | | | | | | | | | | | | |
| | | | |
| California: 0.15% | | | | | | | | | | | | | | | | |
Glendale CA Redevelopment Agency Tax Allocation (Tax Revenue) | | | 3.50 | | | | 12/01/2012 | | | | 1,730,000 | | | | 1,734,948 | |
| | | | | | | | | | | | | | | | |
| | | | |
| Florida: 0.24% | | | | | | | | | | | | | | | | |
Miami-Dade County FL IDA Waste Management Incorporated Florida Project (Resource Recovery Revenue) ±§ | | | 2.63 | | | | 08/01/2023 | | | | 2,800,000 | | | | 2,839,284 | |
| | | | | | | | | | | | | | | | |
| | | | |
| Georgia: 0.14% | | | | | | | | | | | | | | | | |
Atlanta GA Development Authority Tuff Yamacraw Project Class B (IDR, AMBAC Insured) | | | 4.65 | | | | 01/01/2013 | | | | 1,670,000 | | | | 1,686,082 | |
| | | | | | | | | | | | | | | | |
| | | | |
| Kentucky: 0.25% | | | | | | | | | | | | | | | | |
Louisville/Jefferson County KY PCR Louisville Gas & Electric Project Series A (Utilities Revenue) ±§ | | | 1.90 | | | | 10/01/2033 | | | | 3,000,000 | | | | 3,003,480 | |
| | | | | | | | | | | | | | | | |
| | | | |
| Louisiana: 0.44% | | | | | | | | | | | | | | | | |
Louisiana State Gas & Fuels Tax Build America Bonds Series A-4 (Tax Revenue) ±§ | | | 2.77 | | | | 05/01/2043 | | | | 5,250,000 | | | | 5,272,155 | |
| | | | | | | | | | | | | | | | |
| | | | |
| Minnesota: 0.12% | | | | | | | | | | | | | | | | |
Minnesota Tobacco Securitization Authority Series A (Tobacco Revenue) | | | 2.64 | | | | 03/01/2014 | | | | 1,500,000 | | | | 1,487,265 | |
| | | | | | | | | | | | | | | | |
| | | | |
| New Jersey: 0.12% | | | | | | | | | | | | | | | | |
Atlantic City NJ (Tax Revenue, AGM Insured) | | | 4.00 | | | | 12/15/2013 | | | | 1,375,000 | | | | 1,422,878 | |
| | | | | | | | | | | | | | | | |
| | | | |
| New York: 0.05% | | | | | | | | | | | | | | | | |
Onondaga County NY Property Tax Receivables (Lease Revenue) | | | 3.50 | | | | 04/01/2013 | | | | 595,000 | | | | 595,547 | |
| | | | | | | | | | | | | | | | |
| | | | |
| Ohio: 0.41% | | | | | | | | | | | | | | | | |
Ohio State Air Quality Development Authority PCR FirstEnergy Series D (IDR) ±§ | | | 4.75 | | | | 08/01/2029 | | | | 1,800,000 | | | | 1,822,860 | |
Ohio State Water Development Authority Solid Waste Management Incorporated Project (Resource Recovery Revenue) ± | | | 1.75 | | | | 06/01/2013 | | | | 3,000,000 | | | | 3,032,130 | |
| | | | |
| | | | | | | | | | | | | | | 4,854,990 | |
| | | | | | | | | | | | | | | | |
| | | | |
| Oklahoma: 0.15% | | | | | | | | | | | | | | | | |
Oklahoma County OK Finance Authority Build America Bonds (Lease Revenue) | | | 2.33 | | | | 11/01/2012 | | | | 1,725,000 | | | | 1,738,369 | |
| | | | | | | | | | | | | | | | |
| | | | |
| Oregon: 0.10% | | | | | | | | | | | | | | | | |
Oregon State School Boards Association Series A (Miscellaneous Revenue, NATL-RE FGIC Insured) (z) | | | 0.54 | | | | 06/30/2012 | | | | 1,250,000 | | | | 1,247,738 | |
| | | | | | | | | | | | | | | | |
| | | | |
| Pennsylvania: 0.08% | | | | | | | | | | | | | | | | |
Pennsylvania EDFA Waste Management Project (Resource Recovery Revenue) ±§ | | | 2.63 | | | | 12/01/2033 | | | | 1,000,000 | | | | 1,013,580 | |
| | | | | | | | | | | | | | | | |
The accompanying notes are an integral part of these financial statements.
| | | | |
| 16 | | Wells Fargo Advantage Ultra Short-Term Income Fund | | Portfolio of Investments—February 29, 2012 (Unaudited) |
| | | | | | | | | | | | | | | | |
| Security Name | | Interest Rate | | | Maturity Date | | | Principal | | | Value | |
| | | | | | | | | | | | | | | | |
| | | | |
| Texas: 0.22% | | | | | | | | | | | | | | | | |
Houston TX Airport Services Sub-Lien Series A (Airport Revenue) | | | 5.00 | % | | | 07/01/2013 | | | $ | 2,500,000 | | | $ | 2,631,300 | |
| | | | | | | | | | | | | | | | |
| | | | |
| West Virginia: 0.50% | | | | | | | | | | | | | | | | |
West Virginia Solid Waste Disposal Facilities Amos Project Series A (Utilities Revenue) ± | | | 2.00 | | | | 01/01/2041 | | | | 6,000,000 | | | | 6,023,940 | |
| | | | | | | | | | | | | | | | |
| | | | |
Total Municipal Bonds and Notes (Cost $35,451,937) | | | | | | | | | | | | | | | 35,551,556 | |
| | | | | | | | | | | | | | | | |
| | | | |
| Non-Agency Mortgage Backed Securities: 7.53% | | | | | | | | | | | | | | | | |
Aames Mortgage Trust Series 2003-1 Class M1 ± | | | 1.26 | | | | 10/25/2033 | | | | 8,134,986 | | | | 6,501,310 | |
Bank of America Mortgage Securities Series 2002-K Class 3A1 ± | | | 2.68 | | | | 10/20/2032 | | | | 9,263 | | | | 9,261 | |
Bear Stearns Commercial Mortgage Securities Series 2003-PWR2 Class A4 ± | | | 5.19 | | | | 05/11/2039 | | | | 1,000,000 | | | | 1,047,734 | |
Bear Stearns Commercial Mortgage Securities Series 2004-PWR3 Class A3 | | | 4.49 | | | | 02/11/2041 | | | | 2,353,871 | | | | 2,399,722 | |
Citicorp Mortgage Securities Incorporated Series 1992-7 Class A ± | | | 2.24 | | | | 03/25/2022 | | | | 145,508 | | | | 143,945 | |
Collateralized Mortgage Obligation Trust Series 66 Class Z | | | 8.00 | | | | 09/20/2021 | | | | 167,041 | | | | 187,987 | |
Commercial Mortgage Trust Pass-Through Certificates Series 2004-LB4A Class A4 | | | 4.58 | | | | 10/15/2037 | | | | 1,595,727 | | | | 1,599,860 | |
Countrywide Alternative Loan Trust Series 2003-2011 T1 Class A1 | | | 4.75 | | | | 07/25/2018 | | | | 2,824,042 | | | | 2,896,648 | |
Countrywide Home Loans Mortgage Pass-Through Trust Series 2001-HYB1 Class 1A1 ± | | | 2.16 | | | | 06/19/2031 | | | | 694,066 | | | | 664,501 | |
Countrywide Home Loans Mortgage Pass-Through Trust Series 2001-HYB1 Class 2A1 ± | | | 1.94 | | | | 06/19/2031 | | | | 411,858 | | | | 395,439 | |
Countrywide Home Loans Mortgage Pass-Through Trust Series 2004-20 Class 3A1 ± | | | 2.32 | | | | 09/25/2034 | | | | 287,712 | | | | 182,089 | |
Credit Suisse First Boston Mortgage Securities Corporation Series 2003-C3 Class A5 | | | 3.94 | | | | 05/15/2038 | | | | 1,370,557 | | | | 1,403,211 | |
DLJ Mortgage Acceptance Corporation Series 1990-2 Class A ± | | | 3.03 | | | | 01/25/2022 | | | | 233,268 | | | | 230,671 | |
DLJ Mortgage Acceptance Corporation Series 1991-3 Class A1 ± | | | 2.00 | | | | 01/25/2021 | | | | 63,633 | | | | 62,505 | |
EquiFirst Mortgage Loan Trust Series 2003-2 Class 3A3 ± | | | 1.04 | | | | 09/25/2033 | | | | 951,126 | | | | 797,231 | |
GE Capital Commercial Mortgage Corporation Series 2002-2A Class A3 | | | 5.35 | | | | 08/11/2036 | | | | 4,417,617 | | | | 4,461,197 | |
GE Capital Commercial Mortgage Corporation Series 2003-C1 Class A4 | | | 4.82 | | | | 01/10/2038 | | | | 2,955,737 | | | | 3,034,279 | |
Greenwich Capital Commercial Funding Corporation Series 2003-C1 Class A4 | | | 4.11 | | | | 07/05/2035 | | | | 3,556,635 | | | | 3,648,101 | |
GSMPS Mortgage Loan Trust Series 1998-1 Class A ±144A | | | 8.00 | | | | 09/19/2027 | | | | 122,050 | | | | 126,726 | |
GSMPS Mortgage Loan Trust Series 2004-4 Class 1AF ±144A | | | 0.64 | | | | 06/25/2034 | | | | 3,554,016 | | | | 3,042,682 | |
GSMPS Mortgage Loan Trust Series 2004-4 Class 2A1 ±144A | | | 3.66 | | | | 06/25/2034 | | | | 3,152,992 | | | | 2,840,486 | |
GSMPS Mortgage Loan Trust Series 2006-RP1 Class 1AF1 ±144A | | | 0.59 | | | | 01/25/2036 | | | | 3,451,957 | | | | 2,699,858 | |
GSR Mortgage Loan Trust Series 2004-1 Class 2A2 ± | | | 1.94 | | | | 04/25/2032 | | | | 1,318,614 | | | | 1,162,632 | |
Housing Securities Incorporated Series 1992-8 Class C ± | | | 2.81 | | | | 06/25/2024 | | | | 85,895 | | | | 81,439 | |
Housing Securities Incorporated Series 1992-8 Class E ± | | | 3.72 | | | | 06/25/2024 | | | | 190,044 | | | | 188,448 | |
Jeffries & Company Series 2010-R7 Class 7A6 ±144A | | | 3.25 | | | | 10/26/2036 | | | | 1,872,894 | | | | 1,867,869 | |
JPMorgan Chase Commercial Mortgage Securities Corporation Series 2002-C1 Class A3 | | | 5.38 | | | | 07/12/2037 | | | | 973,288 | | | | 980,657 | |
JPMorgan Chase Commercial Mortgage Securities Corporation Series 2003-C1 Class A2 | | | 4.99 | | | | 01/12/2037 | | | | 6,140,000 | | | | 6,301,322 | |
Master Mortgages Trust Series 2002-3 Class 4A1 ± | | | 2.63 | | | | 10/25/2032 | | | | 39,223 | | | | 37,790 | |
Morgan Stanley Capital I Series 2003-T11 Class A4 | | | 5.15 | | | | 06/13/2041 | | | | 7,032,443 | | | | 7,299,950 | |
Morgan Stanley Capital I Series 2004-IQ7 Class A3 ± | | | 5.35 | | | | 06/15/2038 | | | | 1,589,768 | | | | 1,602,871 | |
Morgan Stanley Capital I Series 2004-IQ8 Class A4 | | | 4.90 | | | | 06/15/2040 | | | | 3,154,961 | | | | 3,157,867 | |
Morgan Stanley Dean Witter Capital I Series 2003-IQ4 Class A2 | | | 4.07 | | | | 05/15/2040 | | | | 4,651,549 | | | | 4,766,005 | |
Morgan Stanley Dean Witter Capital I Series 2004-T15 Class A3 | | | 5.03 | | | | 06/13/2041 | | | | 1,577,188 | | | | 1,618,384 | |
The accompanying notes are an integral part of these financial statements.
| | | | | | |
| Portfolio of Investments—February 29, 2012 (Unaudited) | | Wells Fargo Advantage Ultra Short-Term Income Fund | | | 17 | |
| | | | | | | | | | | | | | | | |
| Security Name | | Interest Rate | | | Maturity Date | | | Principal | | | Value | |
| | | | | | | | | | | | | | | | |
| | | | |
| Non-Agency Mortgage Backed Securities (continued) | | | | | | | | | | | | | | | | |
Morgan Stanley Mortgage Trust Series 35 Class 2 ±(w)(i) | | | 15,198.50 | % | | | 04/20/2021 | | | $ | 42 | | | $ | 8,740 | |
Nomura Asset Securities Corporation Series 1998-D6 Class A2 ± | | | 7.31 | | | | 03/15/2030 | | | | 4,500,000 | | | | 4,686,125 | |
Prudential Home Mortgage Securities Series 1988-1 Class A ± | | | 2.49 | | | | 04/25/2018 | | | | 31,551 | | | | 30,625 | |
Resecuritization Mortgage Trust Series 1998-B Class A ±144A(i) | | | 0.49 | | | | 04/26/2021 | | | | 11,649 | | | | 11,063 | |
Residential Finance LP Series 2003-C Class B3 ±144A | | | 1.65 | | | | 09/10/2035 | | | | 6,116,918 | | | | 4,748,624 | |
Residential Finance LP Series 2003-C Class B4 ±144A | | | 1.85 | | | | 09/10/2035 | | | | 3,624,840 | | | | 2,704,312 | |
SACO I Trust Series 2005-2 Class A ±144A(i) | | | 0.64 | | | | 04/25/2035 | | | | 70,822 | | | | 27,570 | |
Salomon Brothers Mortgage Securities VII Series 1990-2 Class A ± | | | 1.89 | | | | 11/25/2020 | | | | 624,035 | | | | 625,107 | |
Structured Asset Mortgage Investments Incorporated Series 2001-4 Class A1 ± | | | 8.96 | | | | 10/25/2024 | | | | 2,143,581 | | | | 2,196,658 | |
Structured Asset Mortgage Investments Incorporated Series 2001-4 Class A2 ± | | | 9.65 | | | | 10/25/2024 | | | | 255,760 | | | | 263,911 | |
Structured Asset Securities Corporation Series 1998-2 Class A ± | | | 0.76 | | | | 02/25/2028 | | | | 397,457 | | | | 352,210 | |
Structured Asset Securities Corporation Series 1998-RF1 Class A ±144A | | | 7.83 | | | | 04/15/2027 | | | | 2,443,071 | | | | 2,455,871 | |
Structured Asset Securities Corporation Series 1998-RF2 Class A ±144A | | | 7.80 | | | | 07/15/2027 | | | | 3,083,589 | | | | 3,112,414 | |
Terwin Mortgage Trust Series 2004-21HE Class 1A1 ± | | | 1.20 | | | | 12/25/2034 | | | | 99,133 | | | | 84,837 | |
Wilshire Funding Corporation Series 1996-3 Class M2 ± | | | 5.71 | | | | 08/25/2032 | | | | 248,348 | | | | 242,954 | |
Wilshire Funding Corporation Series 1996-3 Class M3 ± | | | 5.71 | | | | 08/25/2032 | | | | 222,544 | | | | 212,344 | |
Wilshire Funding Corporation Series 1998-2 Class M1 ± | | | 2.00 | | | | 12/28/2037 | | | | 954,796 | | | | 861,544 | |
| | | | |
Total Non-Agency Mortgage Backed Securities (Cost $96,652,195) | | | | | | | | | | | | | | | 90,065,586 | |
| | | | | | | | | | | | | | | | |
| | | | |
| Term Loans: 0.03% | | | | | | | | | | | | | | | | |
SUPERVALU Incorporated | | | 1.62 | | | | 06/01/2012 | | | | 381,513 | | | | 380,845 | |
| | | | | | | | | | | | | | | | |
| | | | |
Total Term Loans (Cost $379,667) | | | | | | | | | | | | | | | 380,845 | |
| | | | | | | | | | | | | | | | |
| | | | |
Yankee Corporate Bonds and Notes: 17.17% | | | | | | | | | | | | | | | | |
| | | | |
Consumer Discretionary: 0.35% | | | | | | | | | | | | | | | | |
| | | | |
| Multiline Retail: 0.35% | | | | | | | | | | | | | | | | |
Wesfarmers Limited 144A | | | 7.00 | | | | 04/10/2013 | | | | 4,000,000 | | | | 4,231,524 | |
| | | | | | | | | | | | | | | | |
| | | | |
Energy: 1.16% | | | | | | | | | | | | | | | | |
| | | | |
| Oil, Gas & Consumable Fuels: 1.16% | | | | | | | | | | | | | | | | |
Husky Energy Incorporated | | | 6.25 | | | | 06/15/2012 | | | | 6,000,000 | | | | 6,091,854 | |
Noble Corporation | | | 5.88 | | | | 06/01/2013 | | | | 7,420,000 | | | | 7,797,864 | |
| | | | |
| | | | | | | | | | | | | | | 13,889,718 | |
| | | | | | | | | | | | | | | | |
| | | | |
Financials: 12.75% | | | | | | | | | | | | | | | | |
| | | | |
| Capital Markets: 0.63% | | | | | | | | | | | | | | | | |
BP Capital Markets plc | | | 5.25 | | | | 11/07/2013 | | | | 7,000,000 | | | | 7,519,855 | |
| | | | | | | | | | | | | | | | |
| | | | |
| Commercial Banks: 11.76% | | | | | | | | | | | | | | | | |
ANZ National (International) Limited 144A | | | 2.38 | | | | 12/21/2012 | | | | 3,500,000 | | | | 3,541,542 | |
Australia & New Zealand Banking Group Limited ±144A | | | 0.84 | | | | 06/18/2012 | | | | 6,000,000 | | | | 6,001,290 | |
Banco Santander Chile 144A | | | 2.88 | | | | 11/13/2012 | | | | 4,000,000 | | | | 3,995,136 | |
Bank Nederlandse Gemeenten | | | 5.00 | | | | 05/16/2014 | | | | 14,000,000 | | | | 15,133,272 | |
Bank of Montreal 144A« | | | 1.30 | | | | 10/31/2014 | | | | 5,500,000 | | | | 5,557,926 | |
Bank of New York Mellon Corporation ± | | | 0.74 | | | | 06/29/2012 | | | | 2,700,000 | | | | 2,704,876 | |
Bank of Nova Scotia 144A | | | 1.45 | | | | 07/26/2013 | | | | 12,000,000 | | | | 12,153,228 | |
The accompanying notes are an integral part of these financial statements.
| | | | |
| 18 | | Wells Fargo Advantage Ultra Short-Term Income Fund | | Portfolio of Investments—February 29, 2012 (Unaudited) |
| | | | | | | | | | | | | | | | |
| Security Name | | Interest Rate | | | Maturity Date | | | Principal | | | Value | |
| | | | | | | | | | | | | | | | |
| | | | |
| Commercial Banks (continued) | | | | | | | | | | | | | | | | |
Canadian Imperial Bank 144A« | | | 0.90 | % | | | 09/19/2014 | | | $ | 4,000,000 | | | $ | 4,004,908 | |
Canadian Imperial Bank 144A | | | 2.00 | | | | 02/04/2013 | | | | 14,000,000 | | | | 14,192,080 | |
Commonwealth Bank of Australia ±144A | | | 1.11 | | | | 03/19/2013 | | | | 4,500,000 | | | | 4,506,503 | |
HSBC Bank plc 144A« | | | 1.63 | | | | 07/07/2014 | | | | 10,000,000 | | | | 10,031,920 | |
ING Bank NV ±144A | | | 1.60 | | | | 03/15/2013 | | | | 6,000,000 | | | | 5,978,982 | |
Nordea Eiendomskreditt 144A | | | 1.88 | | | | 04/07/2014 | | | | 12,500,000 | | | | 12,621,188 | |
SpareBank 1 Boligkreditt 144A | | | 1.25 | | | | 10/25/2014 | | | | 14,000,000 | | | | 14,014,686 | |
Stadshypotek AB 144A | | | 1.45 | | | | 09/30/2013 | | | | 12,500,000 | | | | 12,594,688 | |
Svenska Handelsbanken AB 144A | | | 2.88 | | | | 09/14/2012 | | | | 2,507,000 | | | | 2,534,763 | |
Westpac Banking Corporation ±144A | | | 0.73 | | | | 12/14/2012 | | | | 5,000,000 | | | | 5,006,280 | |
Westpac Banking Corporation | | | 2.25 | | | | 11/19/2012 | | | | 3,000,000 | | | | 3,037,392 | |
Xstrata Finance Canada Limited 144A | | | 2.85 | | | | 11/10/2014 | | | | 3,000,000 | | | | 3,062,157 | |
| | | | |
| | | | | | | | | | | | | | | 140,672,817 | |
| | | | | | | | | | | | | | | | |
| | | | |
| Diversified Financial Services: 0.36% | | | | | | | | | | | | | | | | |
Amvescap plc | | | 5.63 | | | | 04/17/2012 | | | | 4,250,000 | | | | 4,272,963 | |
| | | | | | | | | | | | | | | | |
| | | | |
Industrials: 0.33% | | | | | | | | | | | | | | | | |
| | | | |
| Building Products: 0.33% | | | | | | | | | | | | | | | | |
Tyco Electronics Group SA | | | 6.00 | | | | 10/01/2012 | | | | 3,830,000 | | | | 3,947,129 | |
| | | | | | | | | | | | | | | | |
| | | | |
Materials: 1.14% | | | | | | | | | | | | | | | | |
| | | | |
| Metals & Mining: 1.14% | | | | | | | | | | | | | | | | |
Arcelormittal Company | | | 5.38 | | | | 06/01/2013 | | | | 7,500,000 | | | | 7,780,658 | |
Rio Tinto Finance USA Limited | | | 8.95 | | | | 05/01/2014 | | | | 5,000,000 | | | | 5,837,110 | |
| | | | |
| | | | | | | | | | | | | | | 13,617,768 | |
| | | | | | | | | | | | | | | | |
| | | | |
Telecommunication Services: 1.44% | | | | | | | | | | | | | | | | |
| | | | |
| Diversified Telecommunication Services: 1.44% | | | | | | | | | | | | | | | | |
British Telecommunications plc | | | 5.15 | | | | 01/15/2013 | | | | 3,553,000 | | | | 3,688,487 | |
Deutsche Telekom International Finance BV | | | 5.25 | | | | 07/22/2013 | | | | 7,000,000 | | | | 7,366,997 | |
Telefonica Emisiones SAU | | | 2.58 | | | | 04/26/2013 | | | | 6,145,000 | | | | 6,143,593 | |
| | | | |
| | | | | | | | | | | | | | | 17,199,077 | |
| | | | | | | | | | | | | | | | |
| | | | |
Total Yankee Corporate Bonds and Notes (Cost $204,498,608) | | | | | | | | | | | | | | | 205,350,851 | |
| | | | | | | | | | | | | | | | |
| | | | |
| Other: 0.03% | | | | | | | | | | | | | | | | |
Gryphon Funding Limited, Pass-Through Entity (v)(a)(i) | | | | | | | | | | | 198,148 | | | | 53,500 | |
VFNC Corporation, Pass-Through Entity 0.24% ±144A(v)(a)(i) | | | | | | | | | | | 527,413 | | | | 226,788 | |
| | | | |
Total Other (Cost $114,148) | | | | | | | | | | | | | | | 280,288 | |
| | | | | | | | | | | | | | | | |
The accompanying notes are an integral part of these financial statements.
| | | | | | |
| Portfolio of Investments—February 29, 2012 (Unaudited) | | Wells Fargo Advantage Ultra Short-Term Income Fund | | | 19 | |
| | | | | | | | | | | | | | | | |
| Security Name | | Yield | | | Maturity Date | | | Principal | | | Value | |
| | | | | | | | | | | | | | | | |
| Short-Term Investments: 12.65% | | | | | | | | | | | | | | | | |
| | | | |
| U.S. Treasury Securities: 0.07% | | | | | | | | | | | | | | | | |
U.S. Treasury Bill # | | | 0.08 | % | | | 03/29/2012 | | | $ | 800,000 | | | $ | 799,950 | |
| | | | | | | | | | | | | | | | |
| | | | |
| | | | | | | | | Shares | | | | |
| Investment Companies: 12.58% | | | | | | | | | | | | | | | | |
Wells Fargo Advantage Cash Investment Money Market Fund, Institutional Class (l)(u) ## | | | 0.02 | | | | | | | | 136,537,829 | | | | 136,537,829 | |
Wells Fargo Securities Lending Cash Investments, LLC (l)(u)(v)(r) | | | 0.15 | | | | | | | | 13,887,329 | | | | 13,887,329 | |
| | | | |
| | | | | | | | | | | | | | | 150,425,158 | |
| | | | | | | | | | | | | | | | |
| | | | |
Total Short-Term Investments (Cost $151,225,152) | | | | | | | | | | | | | | | 151,225,108 | |
| | | | | | | | | | | | | | | | |
| | | | | | | | |
| Total Investments in Securities | | | | | | | | |
| (Cost $1,230,554,883) * | | | 101.96 | % | | | 1,219,204,692 | |
Other Assets and Liabilities, Net | | | (1.96 | ) | | | (23,434,894 | ) |
| | | | | | | | |
| Total Net Assets | | | 100.00 | % | | $ | 1,195,769,798 | |
| | | | | | | | |
| ± | Variable rate investment. |
| (c) | Interest-only securities entitle holders to receive only the interest payments on the underlying mortgages. The principal amount shown is the notional amount of the underlying mortgages. Interest rate disclosed represents the coupon rate. |
| (a) | Security is fair valued by the Management Valuation Team, and in certain instances by the Board of Trustees, in accordance with procedures approved by the Board of Trustees. |
| (s) | Security which has defaulted on payment of interest and/or principal. |
| § | These securities are subject to a demand feature which reduces the effective maturity. |
| 144A | Security that may be resold to “qualified institutional buyers” under Rule 144A or security offered pursuant to Section 4(2) of the Securities Act of 1933, as amended. |
| (w) | This security is a structured note which generates income based on a coupon formula (-1,500 * 1 month LIBOR + 15,573.5%) and the prepayment behavior of the underlying collateral. The coupon is subject to a mandatory cap of 15,573.5% and a mandatory floor of 11%. The current interest rate is (-1,500*0.25%)+15,573.5% = 15,198.50%. |
| « | All or a portion of this security is on loan. |
| (v) | Security represents investment of cash collateral received from securities on loan. |
| # | All or a portion of this security is segregated as collateral for investments in derivative instruments. |
| (l) | Investment in an affiliate. |
| (u) | Rate shown is the 7-day annualized yield at period end. |
| ## | All or a portion of this security has been segregated for when-issued securities. |
| (r) | The investment company is exempt from registration under Section 3(c)(7) of the 1940 Act. |
| * | Cost for federal income tax purposes is $1,230,739,508 and net unrealized appreciation (depreciation) consists of: |
| | | | |
Gross unrealized appreciation | | $ | 8,015,523 | |
Gross unrealized depreciation | | | (19,550,339 | ) |
| | | | |
Net unrealized depreciation | | $ | (11,534,816 | ) |
The accompanying notes are an integral part of these financial statements.
| | | | |
| 20 | | Wells Fargo Advantage Ultra Short-Term Income Fund | | Statement of Assets and Liabilities—February 29, 2012 (Unaudited) |
| | | | |
| | | | |
| |
Assets | | | | |
Investments | | | | |
In unaffiliated securities (including securities on loan), at value (see cost below) | | $ | 1,068,779,534 | |
In affiliated securities, at value (see cost below) | | | 150,425,158 | |
| | | | |
Total investments, at value (see cost below) | | | 1,219,204,692 | |
Receivable for investments sold | | | 2,525,941 | |
Principal paydown receivable | | | 87,496 | |
Receivable for Fund shares sold | | | 1,798,867 | |
Receivable for interest | | | 10,489,429 | |
Receivable for daily variation margin on open futures contracts | | | 84,469 | |
Receivable for securities lending income | | | 3,671 | |
Prepaid expenses and other assets | | | 66,179 | |
| | | | |
Total assets | | | 1,234,260,744 | |
| | | | |
| |
Liabilities | | | | |
Dividends payable | | | 240,919 | |
Payable for investments purchased | | | 20,365,401 | |
Payable for Fund shares redeemed | | | 3,388,965 | |
Payable upon receipt of securities loaned | | | 14,001,477 | |
Advisory fee payable | | | 170,951 | |
Distribution fees payable | | | 9,865 | |
Due to other related parties | | | 162,090 | |
Accrued expenses and other liabilities | | | 151,278 | |
| | | | |
Total liabilities | | | 38,490,946 | |
| | | | |
Total net assets | | $ | 1,195,769,798 | |
| | | | |
| |
NET ASSETS CONSIST OF | | | | |
Paid-in capital | | $ | 1,303,919,853 | |
Overdistributed net investment income | | | (337,668 | ) |
Accumulated net realized losses on investments | | | (96,478,207 | ) |
Net unrealized losses on investments | | | (11,334,180 | ) |
| | | | |
Total net assets | | $ | 1,195,769,798 | |
| | | | |
| |
COMPUTATION OF NET ASSET VALUE AND OFFERING PRICE PER SHARE1 | | | | |
Net assets – Class A | | $ | 137,608,621 | |
Shares outstanding – Class A | | | 16,141,820 | |
Net asset value per share – Class A | | | $8.52 | |
Maximum offering price per share – Class A2 | | | $8.69 | |
Net assets – Class C | | $ | 16,436,158 | |
Shares outstanding – Class C | | | 1,928,301 | |
Net asset value per share – Class C | | | $8.52 | |
Net assets – Administrator Class | | $ | 96,608,318 | |
Shares outstanding – Administrator Class | | | 11,376,770 | |
Net asset value per share – Administrator Class | | | $8.49 | |
Net assets – Institutional Class | | $ | 579,939,249 | |
Shares outstanding – Institutional Class | | | 68,061,243 | |
Net asset value per share – Institutional Class | | | $8.52 | |
Net assets – Investor Class | | $ | 365,177,452 | |
Shares outstanding – Investor Class | | | 42,817,869 | |
Net asset value per share – Investor Class | | | $8.53 | |
| |
Investments in unaffiliated securities, at cost | | $ | 1,080,129,725 | |
| | | | |
Investments in affiliated securities, at cost | | $ | 150,425,158 | |
| | | | |
Total investments, at cost | | $ | 1,230,554,883 | |
| | | | |
Securities on loan, at value | | $ | 13,704,840 | |
| | | | |
| 1. | The Fund has an unlimited amount of authorized shares. |
| 2. | Maximum offering price is computed as 100/98 of net asset value. On investments of $50,000 or more, the offering price is reduced. |
The accompanying notes are an integral part of these financial statements.
| | | | | | |
| Statement of Operations—Six Months Ended February 29, 2012 (Unaudited) | | Wells Fargo Advantage Ultra Short-Term Income Fund | | | 21 | |
| | | | |
| | | | |
| |
Investment income | | | | |
Interest | | $ | 11,394,486 | |
Income from affiliated securities | | | 220,781 | |
Securities lending income, net | | | 27,925 | |
| | | | |
Total investment income | | | 11,643,192 | |
| | | | |
| |
Expenses | | | | |
Advisory fee | | | 2,343,128 | |
Administration fees | | | | |
Fund level | | | 308,093 | |
Class A | | | 122,835 | |
Class C | | | 14,658 | |
Administrator Class | | | 50,911 | |
Institutional Class | | | 234,767 | |
Investor Class | | | 353,180 | |
Shareholder servicing fees | | | | |
Class A | | | 191,930 | |
Class C | | | 22,903 | |
Administrator Class | | | 122,881 | |
Investor Class | | | 464,710 | |
Distribution fees | | | | |
Class C | | | 68,709 | |
Custody and accounting fees | | | 37,436 | |
Professional fees | | | 21,167 | |
Registration fees | | | 55,877 | |
Shareholder report expenses | | | 77,747 | |
Trustees’ fees and expenses | | | 7,202 | |
Other fees and expenses | | | 27,674 | |
| | | | |
Total expenses | | | 4,525,808 | |
Less: Fee waivers and/or expense reimbursements | | | (1,191,498 | ) |
| | | | |
Net expenses | | | 3,334,310 | |
| | | | |
Net investment income | | | 8,308,882 | |
| | | | |
| |
REALIZED AND UNREALIZED GAINS (LOSSES) ON INVESTMENTS | | | | |
| |
Net realized gains (losses) on: | | | | |
Unaffiliated securities | | | (2,644,245 | ) |
Futures transactions | | | 169,188 | |
| | | | |
Net realized losses on investments | | | (2,475,057 | ) |
| | | | |
| |
Net change in unrealized gains (losses) on: | | | | |
Unaffiliated securities | | | 3,379,512 | |
Futures transactions | | | 133,410 | |
| | | | |
Net change in unrealized gains (losses) on investments | | | 3,512,922 | |
| | | | |
Net realized and unrealized gains (losses) on investments | | | 1,037,865 | |
| | | | |
Net increase in net assets resulting from operations | | $ | 9,346,747 | |
| | | | |
The accompanying notes are an integral part of these financial statements.
| | | | |
| 22 | | Wells Fargo Advantage Ultra Short-Term Income Fund | | Statements of Changes in Net Assets |
| | | | | | | | | | | | | | | | |
| | | Six Months Ended
February 29, 2012
(Unaudited) | | | Year Ended
August 31, 2011 | |
| | | | |
Operations | | | | | | | | | | | | | | | | |
Net investment income | | | | | | $ | 8,308,882 | | | | | | | $ | 16,357,676 | |
Net realized losses on investments | | | | | | | (2,475,057 | ) | | | | | | | (10,290,781 | ) |
Net change in unrealized gains (losses) on investments | | | | | | | 3,512,922 | | | | | | | | 11,493,756 | |
| | | | | | | | | | | | | | | | |
Net increase in net assets resulting from operations | | | | | | | 9,346,747 | | | | | | | | 17,560,651 | |
| | | | | | | | | | | | | | | | |
| | | | |
Distributions to shareholders from | | | | | | | | | | | | | | | | |
Net investment income | | | | | | | | | | | | | | | | |
Class A | | | | | | | (961,685 | ) | | | | | | | (2,364,368 | ) |
Class C | | | | | | | (46,053 | ) | | | | | | | (121,803 | ) |
Administrator Class | | | | | | | (713,267 | ) | | | | | | | (2,105,923 | ) |
Institutional Class | | | | | | | (4,689,104 | ) | | | | | | | (8,589,073 | ) |
Investor Class | | | | | | | (2,263,662 | ) | | | | | | | (5,527,588 | ) |
| | | | | | | | | | | | | | | | |
Total distributions to shareholders | | | | | | | (8,673,771 | ) | | | | | | | (18,708,755 | ) |
| | | | | | | | | | | | | | | | |
| | | | |
Capital share transactions | | | Shares | | | | | | | | Shares | | | | | |
Proceeds from shares sold | | | | | | | | | | | | | | | | |
Class A | | | 6,408,466 | | | | 54,468,440 | | | | 16,609,045 | | | | 142,249,012 | |
Class C | | | 195,258 | | | | 1,659,926 | | | | 1,471,494 | | | | 12,583,348 | |
Administrator Class | | | 3,269,401 | | | | 27,684,256 | | | | 16,037,475 | | | | 136,840,531 | |
Institutional Class | | | 29,888,745 | | | | 253,977,979 | | | | 126,731,420 | | | | 1,084,663,988 | |
Investor Class | | | 4,134,709 | | | | 35,158,346 | | | | 13,846,035 | | | | 118,606,838 | |
| | | | | | | | | | | | | | | | |
| | | | | | | 372,948,947 | | | | | | | | 1,494,943,717 | |
| | | | | | | | | | | | | | | | |
Reinvestment of distributions | | | | | | | | | | | | | | | | |
Class A | | | 89,391 | | | | 759,692 | | | | 219,878 | | | | 1,882,345 | |
Class C | | | 4,082 | | | | 34,690 | | | | 11,700 | | | | 100,162 | |
Administrator Class | | | 63,111 | | | | 534,372 | | | | 206,734 | | | | 1,763,127 | |
Institutional Class | | | 371,293 | | | | 3,154,992 | | | | 610,542 | | | | 5,223,955 | |
Investor Class | | | 246,877 | | | | 2,099,364 | | | | 589,761 | | | | 5,050,370 | |
| | | | | | | | | | | | | | | | |
| | | | | | | 6,583,110 | | | | | | | | 14,019,959 | |
| | | | | | | | | | | | | | | | |
Payment for shares redeemed | | | | | | | | | | | | | | | | |
Class A | | | (9,229,948 | ) | | | (78,425,981 | ) | | | (22,479,813 | ) | | | (192,388,389 | ) |
Class C | | | (515,649 | ) | | | (4,380,819 | ) | | | (1,731,271 | ) | | | (14,816,194 | ) |
Administrator Class | | | (4,619,346 | ) | | | (39,098,396 | ) | | | (27,810,867 | ) | | | (237,252,666 | ) |
Institutional Class | | | (32,295,439 | ) | | | (274,369,621 | ) | | | (87,878,062 | ) | | | (751,540,648 | ) |
Investor Class | | | (6,741,695 | ) | | | (57,329,316 | ) | | | (20,555,497 | ) | | | (176,043,901 | ) |
| | | | | | | | | | | | | | | | |
| | | | | | | (453,604,133 | ) | | | | | | | (1,372,041,798 | ) |
| | | | | | | | | | | | | | | | |
Net increase (decrease) in net assets resulting
from capital share transactions | | | | | | | (74,072,076 | ) | | | | | | | 136,921,878 | |
| | | | | | | | | | | | | | | | |
Total increase (decrease) in net assets | | | | | | | (73,399,100 | ) | | | | | | | 135,773,774 | |
| | | | | | | | | | | | | | | | |
| | | | |
Net assets | | | | | | | | | | | | | | | | |
Beginning of period | | | | | | | 1,269,168,898 | | | | | | | | 1,133,395,124 | |
| | | | | | | | | | | | | | | | |
End of period | | | | | | $ | 1,195,769,798 | | | | | | | $ | 1,269,168,898 | |
| | | | | | | | | | | | | | | | |
Undistributed (overdistributed) net investment income | | | | | | $ | (337,668 | ) | | | | | | $ | 27,221 | |
| | | | | | | | | | | | | | | | |
The accompanying notes are an integral part of these financial statements.
| | | | | | |
| Financial Highlights | | Wells Fargo Advantage Ultra Short-Term Income Fund | | | 23 | |
(For a share outstanding throughout each period)
| | | | | | | | | | | | | | | | | | | | | | | | | | | | |
| | | Six Months Ended
February 29, 2012 (Unaudited) | | | Year Ended August 31, | | | Year Ended May 31, | |
| Class A | | | 2011 | | | 20101 | | | 2010 | | | 20092 | | | 20082 | | | 20072 | |
Net asset value, beginning of period | | $ | 8.52 | | | $ | 8.52 | | | $ | 8.48 | | | $ | 8.03 | | | $ | 8.71 | | | $ | 9.09 | | | $ | 9.12 | |
Net investment income | | | 0.05 | | | | 0.10 | | | | 0.04 | | | | 0.17 | | | | 0.31 | | | | 0.43 | | | | 0.47 | |
Net realized and unrealized gains (losses) on investments | | | 0.00 | | | | 0.02 | | | | 0.04 | | | | 0.48 | | | | (0.68 | ) | | | (0.37 | ) | | | (0.02 | ) |
| | | | | | | | | | | | | | | | | | | | | | | | | | | | |
Total from investment operations | | | 0.05 | | | | 0.12 | | | | 0.08 | | | | 0.65 | | | | (0.37 | ) | | | 0.06 | | | | 0.45 | |
Distributions to shareholders from | | | | | | | | | | | | | | | | | | | | | | | | | | | | |
Net investment income | | | (0.05 | ) | | | (0.12 | ) | | | (0.04 | ) | | | (0.20 | ) | | | (0.31 | ) | | | (0.44 | ) | | | (0.48 | ) |
Net asset value, end of period | | $ | 8.52 | | | $ | 8.52 | | | $ | 8.52 | | | $ | 8.48 | | | $ | 8.03 | | | $ | 8.71 | | | $ | 9.09 | |
Total return3 | | | 0.62 | % | | | 1.37 | % | | | 0.94 | % | | | 8.22 | % | | | (4.27 | )% | | | 0.68 | % | | | 5.06 | % |
Ratios to average net assets (annualized) | | | | | | | | | | | | | | | | | | | | | | | | | | | | |
Gross expenses | | | 0.88 | % | | | 0.87 | % | | | 0.88 | % | | | 0.91 | % | | | 0.93 | % | | | 1.08 | % | | | 1.06 | % |
Net expenses | | | 0.70 | % | | | 0.70 | % | | | 0.70 | % | | | 0.70 | % | | | 0.70 | % | | | 0.73 | % | | | 0.80 | % |
Net investment income | | | 1.19 | % | | | 1.17 | % | | | 1.62 | % | | | 1.98 | % | | | 3.70 | % | | | 4.89 | % | | | 5.13 | % |
Supplemental data | | | | | | | | | | | | | | | | | | | | | | | | | | | | |
Portfolio turnover rate | | | 21 | % | | | 60 | % | | | 9 | % | | | 45 | % | | | 32 | % | | | 48 | % | | | 28 | % |
Net assets, end of period (000’s omitted) | | | $137,609 | | | | $160,768 | | | | $208,845 | | | | $154,016 | | | | $44,163 | | | | $42,615 | | | | $44,858 | |
| 1. | For the three months ended August 31, 2010. The Fund changed its fiscal year end from May 31 to August 31, effective August 31, 2010. |
| 2. | On June 20, 2008, Advisor Class was renamed Class A. |
| 3. | Total return calculations do not include any sales charges. Returns for periods of less than one year are not annualized. |
The accompanying notes are an integral part of these financial statements.
| | | | |
| 24 | | Wells Fargo Advantage Ultra Short-Term Income Fund | | Financial Highlights |
(For a share outstanding throughout each period)
| | | | | | | | | | | | | | | | | | | | |
| | | Six Months Ended
February 29, 2012
(Unaudited) | | | Year Ended August 31, | | | Year Ended May 31, | |
| Class C | | | 2011 | | | 20101 | | | 2010 | | | 20092 | |
Net asset value, beginning of period | | | $8.52 | | | | $8.52 | | | | $8.48 | | | | $8.03 | | | | $8.57 | |
Net investment income | | | 0.02 | | | | 0.04 | | | | 0.02 | | | | 0.12 | | | | 0.21 | |
Net realized and unrealized gains (losses)
on investments | | | 0.00 | | | | 0.01 | | | | 0.04 | | | | 0.47 | | | | (0.54 | ) |
| | | | | | | | | | | | | | | | | | | | |
Total from investment operations | | | 0.02 | | | | 0.05 | | | | 0.06 | | | | 0.59 | | | | (0.33 | ) |
Distributions to shareholders from | | | | | | | | | | | | | | | | | | | | |
Net investment income | | | (0.02 | ) | | | (0.05 | ) | | | (0.02 | ) | | | (0.14 | ) | | | (0.21 | ) |
Net asset value, end of period | | $ | 8.52 | | | $ | 8.52 | | | $ | 8.52 | | | $ | 8.48 | | | $ | 8.03 | |
Total return3 | | | 0.25 | % | | | 0.61 | % | | | 0.75 | % | | | 7.41 | % | | | (3.85 | )% |
Ratios to average net assets (annualized) | | | | | | | | | | | | | | | | | | | | |
Gross expenses | | | 1.63 | % | | | 1.62 | % | | | 1.63 | % | | | 1.67 | % | | | 1.64 | % |
Net expenses | | | 1.45 | % | | | 1.45 | % | | | 1.45 | % | | | 1.45 | % | | | 1.45 | % |
Net investment income | | | 0.44 | % | | | 0.43 | % | | | 0.88 | % | | | 1.30 | % | | | 2.77 | % |
Supplemental data | | | | | | | | | | | | | | | | | | | | |
Portfolio turnover rate | | | 21 | % | | | 60 | % | | | 9 | % | | | 45 | % | | | 32 | % |
Net assets, end of period (000’s omitted) | | | $16,436 | | | | $19,117 | | | | $21,226 | | | | $16,519 | | | | $4,775 | |
| 1. | For the three months ended August 31, 2010. The Fund changed its fiscal year end from May 31 to August 31, effective August 31, 2010. |
| 2. | For the period from July 18, 2008 (commencement of class operations) to May 31, 2009. |
| 3. | Total return calculations do not include any sales charges. Returns for periods of less than one year are not annualized. |
The accompanying notes are an integral part of these financial statements.
| | | | | | |
| Financial Highlights | | Wells Fargo Advantage Ultra Short-Term Income Fund | | | 25 | |
(For a share outstanding throughout each period)
| | | | | | | | | | | | | | | | | | | | | | | | | | | | |
| | | Six Months Ended
February 29, 2012 (Unaudited) | | | Year Ended August 31, | | | Year Ended May 31, | |
| Administrator Class | | | 2011 | | | 20101 | | | 2010 | | | 2009 | | | 2008 | | | 2007 | |
Net asset value, beginning of period | | $ | 8.48 | | | $ | 8.48 | | | $ | 8.45 | | | $ | 8.00 | | | $ | 8.68 | | | $ | 9.06 | | | $ | 9.09 | |
Net investment income | | | 0.06 | | | | 0.11 | | | | 0.04 | | | | 0.19 | | | | 0.32 | | | | 0.46 | | | | 0.49 | |
Net realized and unrealized gains (losses) on investments | | | 0.01 | | | | 0.02 | | | | 0.03 | | | | 0.46 | | | | (0.68 | ) | | | (0.38 | ) | | | (0.02 | ) |
| | | | | | | | | | | | | | | | | | | | | | | | | | | | |
Total from investment operations | | | 0.07 | | | | 0.13 | | | | 0.07 | | | | 0.65 | | | | (0.36 | ) | | | 0.08 | | | | 0.47 | |
Distributions to shareholders from | | | | | | | | | | | | | | | | | | | | | | | | | | | | |
Net investment income | | | (0.06 | ) | | | (0.13 | ) | | | (0.04 | ) | | | (0.20 | ) | | | (0.32 | ) | | | (0.46 | ) | | | (0.50 | ) |
Net asset value, end of period | | $ | 8.49 | | | $ | 8.48 | | | $ | 8.48 | | | $ | 8.45 | | | $ | 8.00 | | | $ | 8.68 | | | $ | 9.06 | |
Total return2 | | | 0.81 | % | | | 1.52 | % | | | 0.86 | % | | | 8.41 | % | | | (4.15 | )% | | | 0.84 | % | | | 5.27 | % |
Ratios to average net assets (annualized) | | | | | | | | | | | | | | | | | | | | | | | | | | | | |
Gross expenses | | | 0.81 | % | | | 0.79 | % | | | 0.79 | % | | | 0.81 | % | | | 0.81 | % | | | 0.90 | % | | | 0.88 | % |
Net expenses | | | 0.55 | % | | | 0.55 | % | | | 0.55 | % | | | 0.55 | % | | | 0.55 | % | | | 0.57 | % | | | 0.60 | % |
Net investment income | | | 1.34 | % | | | 1.33 | % | | | 1.65 | % | | | 2.32 | % | | | 3.77 | % | | | 5.03 | % | | | 5.36 | % |
Supplemental data | | | | | | | | | | | | | | | | | | | | | | | | | | | | |
Portfolio turnover rate | | | 21 | % | | | 60 | % | | | 9 | % | | | 45 | % | | | 32 | % | | | 48 | % | | | 28 | % |
Net assets, end of period (000’s omitted) | | | $96,608 | | | | $107,449 | | | | $205,587 | | | | $82,835 | | | | $59,184 | | | | $28,254 | | | | $17,003 | |
| 1. | For the three months ended August 31, 2010. The Fund changed its fiscal year end from May 31 to August 31, effective August 31, 2010. |
| 2. | Returns for periods of less than one year are not annualized. |
The accompanying notes are an integral part of these financial statements.
| | | | |
| 26 | | Wells Fargo Advantage Ultra Short-Term Income Fund | | Financial Highlights |
(For a share outstanding throughout each period)
| | | | | | | | | | | | | | | | | | | | | | | | | | | | |
| | | Six Months Ended
February 29, 2012 (Unaudited) | | | Year Ended August 31, | | | Year Ended May 31, | |
| Institutional Class | | | 2011 | | | 20101 | | | 2010 | | | 2009 | | | 2008 | | | 2007 | |
Net asset value, beginning of period | | $ | 8.51 | | | $ | 8.51 | | | $ | 8.48 | | | $ | 8.03 | | | $ | 8.71 | | | $ | 9.09 | | | $ | 9.12 | |
Net investment income | | | 0.07 | | | | 0.13 | | | | 0.04 | | | | 0.19 | | | | 0.33 | | | | 0.47 | | | | 0.51 | |
Net realized and unrealized gains (losses) on investments | | | 0.01 | | | | 0.02 | | | | 0.04 | | | | 0.49 | | | | (0.67 | ) | | | (0.37 | ) | | | (0.02 | ) |
| | | | | | | | | | | | | | | | | | | | | | | | | | | | |
Total from investment operations | | | 0.08 | | | | 0.15 | | | | 0.08 | | | | 0.68 | | | | (0.34 | ) | | | 0.10 | | | | 0.49 | |
Distributions to shareholders from | | | | | | | | | | | | | | | | | | | | | | | | | | | | |
Net investment income | | | (0.07 | ) | | | (0.15 | ) | | | (0.05 | ) | | | (0.23 | ) | | | (0.34 | ) | | | (0.48 | ) | | | (0.52 | ) |
Net asset value, end of period | | $ | 8.52 | | | $ | 8.51 | | | $ | 8.51 | | | $ | 8.48 | | | $ | 8.03 | | | $ | 8.71 | | | $ | 9.09 | |
Total return2 | | | 0.91 | % | | | 1.72 | % | | | 1.03 | % | | | 8.48 | % | | | (3.93 | )% | | | 1.07 | % | | | 5.54 | % |
Ratios to average net assets (annualized) | | | | | | | | | | | | | | | | | | | | | | | | | | | | |
Gross expenses | | | 0.55 | % | | | 0.54 | % | | | 0.54 | % | | | 0.57 | % | | | 0.59 | % | | | 0.63 | % | | | 0.61 | % |
Net expenses | | | 0.35 | % | | | 0.35 | % | | | 0.35 | % | | | 0.35 | % | | | 0.35 | % | | | 0.35 | % | | | 0.35 | % |
Net investment income | | | 1.54 | % | | | 1.50 | % | | | 2.01 | % | | | 2.26 | % | | | 4.09 | % | | | 5.24 | % | | | 5.57 | % |
Supplemental data | | | | | | | | | | | | | | | | | | | | | | | | | | | | |
Portfolio turnover rate | | | 21 | % | | | 60 | % | | | 9 | % | | | 45 | % | | | 32 | % | | | 48 | % | | | 28 | % |
Net assets, end of period (000’s omitted) | | | $579,939 | | | | $596,838 | | | | $260,747 | | | | $197,087 | | | | $27,680 | | | | $61,898 | | | | $42,757 | |
| 1. | For the three months ended August 31, 2010. The Fund changed its fiscal year end from May 31 to August 31, effective August 31, 2010. |
| 2. | Returns for periods of less than one year are not annualized. |
The accompanying notes are an integral part of these financial statements.
| | | | | | |
| Financial Highlights | | Wells Fargo Advantage Ultra Short-Term Income Fund | | | 27 | |
(For a share outstanding throughout each period)
| | | | | | | | | | | | | | | | | | | | | | | | | | | | |
| | | Six Months Ended
February 29, 2012 (Unaudited) | | | Year Ended August 31, | | | Year Ended May 31, | |
| Investor Class | | | 2011 | | | 20101 | | | 2010 | | | 2009 | | | 2008 | | | 2007 | |
Net asset value, beginning of period | | $ | 8.52 | | | $ | 8.52 | | | $ | 8.48 | | | $ | 8.03 | | | $ | 8.71 | | | $ | 9.09 | | | $ | 9.12 | |
Net investment income | | | 0.05 | | | | 0.10 | | | | 0.04 | | | | 0.18 | | | | 0.31 | | | | 0.43 | | | | 0.47 | |
Net realized and unrealized gains (losses) on investments | | | 0.01 | | | | 0.01 | | | | 0.04 | | | | 0.47 | | | | (0.68 | ) | | | (0.37 | ) | | | (0.02 | ) |
| | | | | | | | | | | | | | | | | | | | | | | | | | | | |
Total from investment operations | | | 0.06 | | | | 0.11 | | | | 0.08 | | | | 0.65 | | | | (0.37 | ) | | | 0.06 | | | | 0.45 | |
Distributions to shareholders from | | | | | | | | | | | | | | | | | | | | | | | | | | | | |
Net investment income | | | (0.05 | ) | | | (0.11 | ) | | | (0.04 | ) | | | (0.20 | ) | | | (0.31 | ) | | | (0.44 | ) | | | (0.48 | ) |
Net asset value, end of period | | $ | 8.53 | | | $ | 8.52 | | | $ | 8.52 | | | $ | 8.48 | | | $ | 8.03 | | | $ | 8.71 | | | $ | 9.09 | |
Total return2 | | | 0.72 | % | | | 1.34 | % | | | 0.93 | % | | | 8.18 | % | | | (4.32 | )% | | | 0.64 | % | | | 5.02 | % |
Ratios to average net assets (annualized) | | | | | | | | | | | | | | | | | | | | | | | | | | | | |
Gross expenses | | | 0.91 | % | | | 0.90 | % | | | 0.92 | % | | | 0.98 | % | | | 0.99 | % | | | 1.21 | % | | | 1.23 | % |
Net expenses | | | 0.73 | % | | | 0.73 | % | | | 0.74 | % | | | 0.75 | % | | | 0.75 | % | | | 0.78 | % | | | 0.84 | % |
Net investment income | | | 1.16 | % | | | 1.15 | % | | | 1.66 | % | | | 2.16 | % | | | 3.69 | % | | | 4.86 | % | | | 5.10 | % |
Supplemental data | | | | | | | | | | | | | | | | | | | | | | | | | | | | |
Portfolio turnover rate | | | 21 | % | | | 60 | % | | | 9 | % | | | 45 | % | | | 32 | % | | | 48 | % | | | 28 | % |
Net assets, end of period (000’s omitted) | | | $365,177 | | | | $384,998 | | | | $436,991 | | | | $453,772 | | | | $423,039 | | | | $594,246 | | | | $718,019 | |
| 1. | For the three months ended August 31, 2010. The Fund changed its fiscal year end from May 31 to August 31, effective August 31, 2010. |
| 2. | Returns for periods of less than one year are not annualized. |
The accompanying notes are an integral part of these financial statements.
| | | | |
| 28 | | Wells Fargo Advantage Ultra Short-Term Income Fund | | Notes to Financial Statements (Unaudited) |
1. ORGANIZATION
Wells Fargo Funds Trust (the “Trust”), a Delaware statutory trust organized on March 10, 1999, is an open-end management investment company registered under the Investment Company Act of 1940, as amended (the “1940 Act”). These financial statements report on Wells Fargo Advantage Ultra Short-Term Income Fund (the “Fund”) which is a diversified series of the Trust.
2. SIGNIFICANT ACCOUNTING POLICIES
The following significant accounting policies, which are consistently followed in the preparation of the financial statements of the Fund, are in conformity with U.S. generally accepted accounting principles which require management to make estimates and assumptions that affect the reported amounts of assets and liabilities, disclosure of contingent assets and liabilities at the date of the financial statements, and the reported amounts of revenues and expenses during the reporting period. Actual results could differ from those estimates.
Securities valuation
Fixed income securities with original maturities exceeding 60 days are valued based on available evaluated prices received from an independent pricing service approved by the Board of Trustees which may utilize both transaction data and market information such as yield, prices of securities of comparable quality, coupon rate, maturity, type of issue, trading characteristics and other market data. If valuations are not available from the pricing service or values received are deemed not representative of market value, values will be obtained from a third party broker-dealer or determined based on the Fund’s Fair Value Procedures.
Debt securities of sufficient credit quality with original maturities of 60 days or less generally are valued at amortized cost which approximates fair value. The amortized cost method involves valuing a security at its cost, plus accretion of discount or minus amortization of premium over the period until maturity.
Investments in open-end mutual funds and non-registered investment companies are generally valued at net asset value.
Investments which are not valued using any of the methods discussed above, are valued at their fair value, as determined by procedures established in good faith and approved by the Board of Trustees.
Security loans
The Fund may lend its securities from time to time in order to earn additional income in the form of fees or interest on securities received as collateral or the investment of any cash received as collateral. The Fund continues to receive interest or dividends on the securities loaned. The Fund receives collateral in the form of cash or securities with a value at least equal to the value of the securities on loan. The value of the loaned securities is determined at the close of each business day and any additional required collateral is delivered to the Fund on the next business day. In a securities lending transaction, the net asset value of the Fund will be affected by an increase or decrease in the value of the securities loaned and by an increase or decrease in the value of the instrument in which collateral is invested. The amount of securities lending activity undertaken by the Fund fluctuates from time to time. In the event of default or bankruptcy by the borrower, the Fund may be prevented from recovering the loaned securities or gaining access to the collateral or may experience delays or costs in doing so. In addition, the investment of any cash collateral received may lose all or part of its value. The Fund has the right under the lending agreement to recover the securities from the borrower on demand.
The Fund lends its securities through an unaffiliated securities lending agent. Cash collateral received in connection with its securities lending transactions is invested in Wells Fargo Securities Lending Cash Investments, LLC (the “Cash Collateral Fund”). The Cash Collateral Fund is exempt from registration under Section 3(c)(7) of the 1940 Act and is managed by Wells Fargo Funds Management LLC (“Funds Management”) and is sub-advised by Wells Capital Management Incorporated (“Wells Capital Management”). Funds Management receives an advisory fee starting at 0.05% and declining to 0.01% as the average daily net assets of the Cash Collateral Fund increase. All of the fees received by Funds Management are paid to Wells Capital Management for its services as sub-adviser. The Cash Collateral Fund seeks to provide a positive return compared to the daily Fed Funds Open rate by investing in high-quality, U.S. dollar-denominated short-term money market instruments. Cash Collateral Fund investments are fair valued based upon the amortized cost valuation technique. Income earned from investment in the Cash Collateral Fund is included in securities lending income on the Statement of Operations.
| | | | | | |
| Notes to Financial Statements (Unaudited) | | Wells Fargo Advantage Ultra Short-Term Income Fund | | | 29 | |
For Wells Fargo Advantage Funds that participated in securities lending activity prior to February 13, 2009, certain structured investment vehicles purchased in a joint account by the former securities lending agent defaulted or were impaired. Certain of the Wells Fargo Advantage Funds still hold ownership interest in these structured investment vehicles, which have since been restructured as pass-through securities. If the Fund holds an ownership interest in such pass-through securities, information regarding this ownership interest can be found in the Portfolio of Investments under the category “Other”.
When-issued transactions
The Fund may purchase securities on a forward commitment or ‘when-issued’ basis. The Fund records a when-issued transaction on the trade date and will segregate assets to cover its obligation by confirming the availability of qualifying assets having a value sufficient to make payment for the securities purchased. Securities purchased on a when-issued basis are marked-to-market daily and the Fund begins earning interest on the settlement date. Losses may arise due to changes in the market value of the underlying securities or if the counterparty does not perform under the contract.
Term loans
The Fund may invest in term loans. The loans are marked-to-market daily and the Fund begins earning interest when the loans are funded. The loans pay interest at rates which are periodically reset by reference to a base lending rate plus a spread. The Fund assumes the credit risk of the borrower and there could be potential loss to the Fund in the event of default by the borrower.
Futures contracts
The Fund may be subject to interest rate risk in the normal course of pursuing its investment objectives. The Fund may buy and sell futures contracts in order to gain exposure to, or protect against, changes in security values and interest rates. The primary risks associated with the use of futures contracts are the imperfect correlation between changes in market values of securities held by the Fund and the prices of futures contracts, and the possibility of an illiquid market.
Futures contracts are valued based upon their quoted daily settlement prices when available. The aggregate principal amounts of the contracts are not recorded in the financial statements. Fluctuations in the value of the contracts are recorded in the Statement of Assets and Liabilities as an asset or liability and in the Statement of Operations as unrealized gains or losses until the contracts are closed, at which point they are recorded as net realized gains or losses on futures contracts. With futures contracts, there is minimal counterparty risk to the Fund since futures are exchange traded and the exchange’s clearinghouse, as counterparty to all exchange traded futures, guarantees the futures against default.
Security transactions and income recognition
Securities transactions are recorded on a trade date basis. Realized gains or losses are reported on the basis of identified cost of securities delivered.
Interest income is accrued daily and bond discounts are accreted and premiums are amortized daily based on the effective interest method. To the extent debt obligations are placed on non-accrual status, any related interest income may be reduced by writing off interest receivables when the collection of all or a portion of interest has become doubtful based on consistently applied procedures. If the issuer subsequently resumes interest payments or when the collectability of interest is reasonably assured, the debt obligation is removed from non-accrual status.
Distributions to shareholders
Distributions to shareholders from net investment income are accrued daily and paid monthly. Distributions from net realized gains, if any, are recorded on the ex-dividend date. Such distributions are determined in conformity with income tax regulations, which may differ from generally accepted accounting principles.
Federal and other taxes
The Fund intends to continue to qualify as a regulated investment company by distributing substantially all of its investment company taxable income and any net realized capital gains (after reduction for capital loss carryforwards) sufficient to relieve it from all, or substantially all, federal income taxes. Accordingly, no provision for federal income taxes was required.
The Fund’s income and federal excise tax returns and all financial records supporting those returns for the prior three fiscal years are subject to examination by the federal and Delaware revenue authorities.
| | | | |
| 30 | | Wells Fargo Advantage Ultra Short-Term Income Fund | | Notes to Financial Statements (Unaudited) |
Under the recently enacted Regulated Investment Company Modernization Act of 2010, the Fund is permitted to carry forward capital losses incurred in taxable years which began after December 22, 2010 for an unlimited period. However, any losses incurred are required to be utilized prior to the losses incurred in pre-enactment taxable years. As a result of this ordering rule, pre-enactment capital loss carryforwards may be more likely to expire unused. Additionally, post-enactment capital losses that are carried forward will retain their character as either short-term or long-term capital losses rather than being considered all short-term as under previous law.
At August 31, 2011, net capital loss carryforwards, which were available to offset future net realized capital gains, were as follows:
| | | | | | | | | | | | | | | | | | | | | | | | | | | | |
Expiration | |
| 2012 | | 2013 | | | 2014 | | | 2015 | | | 2016 | | | 2017 | | | 2018 | | | 2019 | |
| $1,305,797 | | $ | 477,614 | | | $ | 25,866,042 | | | $ | 2,154,408 | | | $ | 8,848,032 | | | $ | 35,029,445 | | | $ | 7,738,751 | | | $ | 7,448,920 | |
As of August 31, 2011, the Fund had $4,949,516 of current year deferred post-October capital losses, which would be treated as realized for tax purposes on the first day of the succeeding year.
Class allocations
The separate classes of shares offered by the Fund differ principally in applicable sales charges, distribution, shareholder servicing and administration fees. Shareholders of each class bear certain expenses that pertain to that particular class. All shareholders bear the common expenses of the Fund, earn income from the portfolio, and are allocated unrealized gains and losses pro rata based on the average daily net assets of each class, without distinction between share classes. Dividends are determined separately for each class based on income and expenses allocable to each class. Realized gains and losses are allocated to each class pro rata based upon the net assets of each class on the date realized. Differences in per share dividend rates generally result from the relative weightings of pro rata income and realized gain allocations and from differences in separate class expenses, including distribution, shareholder servicing and administration fees.
3. FAIR VALUATION MEASUREMENTS
Fair value measurements of investments are determined within a framework that has established a fair value hierarchy based upon the various data inputs utilized in determining the value of the Fund’s investments. The three-level hierarchy gives the highest priority to unadjusted quoted prices in active markets for identical assets or liabilities (Level 1) and the lowest priority to significant unobservable inputs (Level 3). The Fund’s investments are classified within the fair value hierarchy based on the lowest level of input that is significant to the fair value measurement. The inputs are summarized into three broad levels as follows:
| n | | Level 1 – quoted prices in active markets for identical securities |
| n | | Level 2 – other significant observable inputs (including quoted prices for similar securities, interest rates, prepayment speeds, credit risk, etc.) |
| n | | Level 3 – significant unobservable inputs (including the Fund’s own assumptions in determining the fair value of investments) |
The inputs or methodologies used for valuing securities are not necessarily an indication of the risk associated with investing in those securities.
| | | | | | |
| Notes to Financial Statements (Unaudited) | | Wells Fargo Advantage Ultra Short-Term Income Fund | | | 31 | |
As of February 29, 2012, the inputs used in valuing the Fund’s assets, which are carried at fair value, were as follows:
| | | | | | | | | | | | | | | | |
| Investments in Securities | | Quoted Prices (Level 1) | | | Significant Other
Observable Inputs (Level 2) | | | Significant Unobservable Inputs (Level 3) | | | Total | |
Agency securities | | $ | 0 | | | $ | 63,399,165 | | | $ | 0 | | | $ | 63,399,165 | |
Asset-backed securities | | | 0 | | | | 157,596,059 | | | | 2,645 | | | | 157,598,704 | |
Corporate bonds and notes | | | 0 | | | | 515,352,589 | | | | 0 | | | | 515,352,589 | |
Municipal bonds and notes | | | 0 | | | | 35,551,556 | | | | 0 | | | | 35,551,556 | |
Non-agency mortgage backed securities | | | 0 | | | | 90,065,586 | | | | 0 | | | | 90,065,586 | |
Term loans | | | 0 | | | | 380,845 | | | | 0 | | | | 380,845 | |
Yankee corporate bonds and bonds | | | 0 | | | | 205,350,851 | | | | 0 | | | | 205,350,851 | |
Other | | | 0 | | | | 0 | | | | 280,288 | | | | 280,288 | |
Short-term investments | | | | | | | | | | | | | | | | |
U.S. Treasury securities | | | 799,950 | | | | 0 | | | | 0 | | | | 799,950 | |
Investment companies | | | 136,537,829 | | | | 13,887,329 | | | | 0 | | | | 150,425,158 | |
| | | $ | 137,337,779 | | | $ | 1,081,583,980 | | | $ | 282,933 | | | $ | 1,219,204,692 | |
Further details on the major security types listed above can be found in the Portfolio of Investments.
As of February 29, 2012, the inputs used in valuing the Fund’s other financial instruments, which are carried at fair value, were as follows:
| | | | | | | | | | | | | | | | |
| Other financial instruments | | Quoted Prices (Level 1) | | | Significant Other
Observable Inputs (Level 2) | | | Significant Unobservable Inputs (Level 3) | | | Total | |
Futures contracts+ | | $ | 16,011 | | | $ | 0 | | | $ | 0 | | | $ | 16,011 | |
| + | Futures contracts are presented at the unrealized gains or losses on the instrument. |
Transfers in and transfers out are recognized at the end of the reporting period. For the six months ended February 29, 2012, the Fund did not have any significant transfers into/out of Level 1 and Level 2.
The following is a reconciliation of assets in which significant unobservable inputs (Level 3) were used in determining fair value:
| | | | | | | | | | | | | | | | | | | | |
| | | Asset-
backed
securities | | | Corporate
bonds and
notes | | | Non-agency
mortgage
backed
securities | | | Other | | | Total | |
Balance as of August 31, 2011 | | $ | 3,239,702 | | | $ | 2,713,483 | | | $ | 3,633,931 | | | $ | 382,831 | | | $ | 9,969,947 | |
Accrued discounts (premiums) | | | (8,203 | ) | | | (46,723 | ) | | | (12 | ) | | | 0 | | | | (54,938 | ) |
Realized gains (losses) | | | (366,729 | ) | | | (1,441 | ) | | | (5,541 | ) | | | 0 | | | | (373,711 | ) |
Change in unrealized gains (losses) | | | 64,370 | | | | (18,018 | ) | | | 18,752 | | | | (58,547 | ) | | | 6,557 | |
Purchases | | | 296,505 | | | | 0 | | | | 0 | | | | 0 | | | | 296,505 | |
Sales | | | (3,223,000 | ) | | | (2,647,301 | ) | | | (1,779,261 | ) | | | (43,996 | ) | | | (7,693,558 | ) |
Transfers into Level 3 | | | 0 | | | | 0 | | | | 0 | | | | 0 | | | | 0 | |
Transfers out of Level 3 | | | 0 | | | | 0 | | | | (1,867,869 | ) | | | 0 | | | | (1,867,869 | ) |
Balance as of February 29, 2012 | | $ | 2,645 | | | $ | 0 | | | $ | 0 | | | $ | 280,288 | | | $ | 282,933 | |
Change in unrealized gains (losses)
relating to securities still held at February 29, 2012 | | $ | 0 | | | $ | 0 | | | $ | 0 | | | $ | (80,109 | ) | | $ | (80,109 | ) |
Transfers out of Level 3 into Level 2 are due to the availability of significant observable inputs which are currently used in the determination of the fair value of the securities.
| | | | |
| 32 | | Wells Fargo Advantage Ultra Short-Term Income Fund | | Notes to Financial Statements (Unaudited) |
4. TRANSACTIONS WITH AFFILIATES AND OTHER EXPENSES
Advisory fee
The Trust has entered into an advisory contract with Funds Management, an indirect wholly owned subsidiary of Wells Fargo & Company (“Wells Fargo”). The adviser is responsible for implementing investment policies and guidelines and for supervising the sub-advisers, who is responsible for day-to-day portfolio management of the Fund.
Pursuant to the contract, Funds Management is entitled to receive an annual advisory fee starting at 0.40% and declining to 0.30% as the average daily net assets of the Fund increase. For the six months ended February 29, 2012, the advisory fee was equivalent to an annual rate of 0.38% of the Fund’s average daily net assets.
Funds Management has retained the services of certain sub-advisers to provide daily portfolio management to the Fund. The fees related to sub-advisory services are borne directly by Funds Management and do not increase the overall fees paid by the Fund. Wells Capital Management, an affiliate of Funds Management, is the sub-adviser to the Fund and is entitled to receive a fee from Funds Management at an annual rate starting at 0.15% and declining to 0.05% as the average daily net assets of the Fund increase.
Administration and transfer agent fees
The Trust has entered into an administration agreement with Funds Management. Under this agreement, for providing administrative services, which includes paying fees and expenses for services provided by the transfer agent, sub-transfer agents, omnibus account servicers and record-keepers, Funds Management is entitled to receive from the Fund an annual fund level administration fee starting at 0.05% and declining to 0.03% as the average daily net assets of the Fund increase and a class level administration fee which is calculated based on the average daily net assets of each class as follows:
| | | | |
| | | Class Level Administration Fee | |
Class A, Class C | | | 0.16 | % |
Administrator Class | | | 0.10 | |
Institutional Class | | | 0.08 | |
Investor Class | | | 0.19 | |
Funds Management has contractually waived and/or reimbursed advisory and administration fees to the extent necessary to maintain certain net operating expense ratios for the Fund. Waiver of fees and/or reimbursement of expenses by Funds Management were made first from fund level expenses on a proportionate basis and then from class specific expenses. Funds Management has committed through July 11, 2013 to waive fees and/or reimburse expenses to the extent necessary to cap the Fund’s expenses at 0.70% for Class A, 1.45% for Class C, 0.55% for Administrator Class, 0.35% for Institutional Class and 0.73% for Investor Class.
Distribution fees
The Trust has adopted a Distribution Plan for Class C shares of the Fund pursuant to Rule 12b-1 under the 1940 Act. Distribution fees are charged to Class C shares and paid to Wells Fargo Funds Distributor, LLC, the principal underwriter, at an annual rate of 0.75% of the average daily net assets of Class C shares.
For the six months ended February 29, 2012, Wells Fargo Funds Distributor, LLC received $2,031 from the sale of Class A shares and $1,106 and $1,222 in contingent deferred sales charges from redemptions of Class A and Class C shares, respectively.
Shareholder servicing fees
The Trust has entered into contracts with one or more shareholder servicing agents, whereby Class A, Class C, Administrator Class and Investor Class of the Fund is charged a fee at an annual rate of 0.25% of the average daily net assets of each respective class.
A portion of these total shareholder servicing fees were paid to affiliates of Wells Fargo.
| | | | | | |
| Notes to Financial Statements (Unaudited) | | Wells Fargo Advantage Ultra Short-Term Income Fund | | | 33 | |
5. INVESTMENT PORTFOLIO TRANSACTIONS
Purchases and sales of investments, excluding short-term securities (securities with maturities of one year or less at purchase date), for the six months ended February 29, 2012 were as follows:
| | | | | | | | | | | | |
Purchases at Cost | | | Sales Proceeds | |
| U.S. Government | | Non-U.S. Government | | | U.S. Government | | | Non-U.S. Government | |
| $18,555,764 | | $ | 219,166,645 | | | $ | 137 | | | $ | 313,964,585 | |
6. DERIVATIVE TRANSACTIONS
During the six months ended February 29, 2012, the Fund entered into futures contracts to speculate on interest rates.
At February 29, 2012, the Fund had short futures contracts outstanding as follows:
| | | | | | | | | | | | | | |
| Expiration Date | | Contracts | | | Type | | Contract
Value at
February 29, 2012 | | | Net
Unrealized
Gains (Losses) | |
| June 2012 | | | 1,229 Short | | | 2-Year U.S. Treasury Notes | | $ | 270,668,048 | | | $ | 16,351 | |
| June 2012 | | | 35 Short | | | 5-Year U.S. Treasury Notes | | | 4,311,016 | | | | (340 | ) |
The Fund had an average notional amount of $334,417,369 in short futures contracts during the six months ended February 29, 2012.
On February 29, 2012, the cumulative unrealized gains on futures contracts in the amount of $16,011 is reflected in net unrealized losses on investments on the Statement of Assets and Liabilities. The receivable for daily variation margin on open futures contracts reflected in the Statement of Assets and Liabilities only represents the current day’s variation margin. The realized gains and change in unrealized gains (losses) on futures contracts are reflected in the Statement of Operations.
7. BANK BORROWINGS
The Trust (excluding the money market funds) and Wells Fargo Variable Trust are parties to a $150,000,000 revolving credit agreement with State Street Bank and Trust Company, whereby the Fund is permitted to use bank borrowings for temporary or emergency purposes, such as to fund shareholder redemption requests. Interest under the credit agreement is charged to the Fund based on a borrowing rate equal to the higher of the Federal Funds rate in effect on that day plus 1.25% or the overnight LIBOR rate in effect on that day plus 1.25%. In addition, an annual commitment fee equal to 0.10% of the unused balance is allocated to each participating fund. Prior to September 6, 2011, the revolving credit agreement was for $125,000,000 and the annual commitment fee paid by the Fund was 0.125% of the unused balance. For the six months ended February 29, 2012, the Fund paid $1,625 in commitment fees.
For the six months ended February 29, 2012, there were no borrowings by the Fund under the agreement.
8. INDEMNIFICATION
Under the Trust’s organizational documents, the officers and directors are indemnified against certain liabilities that may arise out of performance of their duties to the Trust. Additionally, in the normal course of business, the Trust may enter into contracts with service providers that contain a variety of indemnification clauses. The Trust’s maximum exposure under these arrangements is dependent on future claims that may be made against the Fund and, therefore, cannot be estimated.
9. NEW ACCOUNTING PRONOUNCEMENTS
In May 2011, the Financial Accounting Standards Board (“FASB”) issued Accounting Standards Update (“ASU”) No. 2011-04 “Amendments to Achieve Common Fair Value Measurement and Disclosure Requirements in U.S. GAAP and IFRSs”. ASU No. 2011-04 amends FASB ASC Topic 820, Fair Value Measurements and Disclosures, to establish common requirements for measuring fair value and for disclosing information about fair value measurements in accordance with GAAP. The ASU is effective prospectively for interim and annual periods beginning after December 15, 2011. Management expects that adoption of the ASU will result in additional disclosures in the financial statements, as applicable.
| | | | |
| 34 | | Wells Fargo Advantage Ultra Short-Term Income Fund | | Notes to Financial Statements (Unaudited) |
In April 2011, FASB issued ASU No. 2011-03 “Reconsideration of Effective Control for Repurchase Agreements”. ASU No. 2011-03 amends FASB ASC Topic 860, Transfers and Servicing, specifically the criteria required to determine whether a repurchase agreement (repo) and similar agreements should be accounted for as sales of financial assets or secured borrowings with commitments. ASU No. 2011-03 changes the assessment of effective control by focusing on the transferor’s contractual rights and obligations and removing the criterion to assess its ability to exercise those rights or honor those obligations. This could result in changes to the way entities account for certain transactions including repurchase agreements, mortgage dollar rolls and reverse repurchase agreements. The ASU will become effective on a prospective basis for new transfers and modifications to existing transactions as of the beginning of the first interim or annual period beginning on or after December 15, 2011. Management has evaluated the impact of adopting the ASU and expects no significant changes.
| | | | | | |
| Other Information (Unaudited) | | Wells Fargo Advantage Ultra Short-Term Income Fund | | | 35 | |
PROXY VOTING INFORMATION
A description of the policies and procedures that the Fund uses to determine how to vote proxies relating to portfolio securities is available without charge, upon request, by calling 1-800-222-8222, visiting our Web site at wellsfargoadvantagefunds.com, or visiting the SEC Web site at sec.gov. Information regarding how the Fund voted proxies relating to portfolio securities during the most recent 12-month period ended June 30 is available without charge on the Fund’s Web site at wellsfargoadvantagefunds.com or by visiting the SEC Web site at sec.gov.
PORTFOLIO HOLDINGS INFORMATION
The complete portfolio holdings for the Fund are publicly available on the Fund’s Web site (wellsfargoadvantagefunds.com) on a monthly, 30-day or more delayed basis. In addition, top ten holdings information for the Fund is publicly available on the Fund’s Web site on a monthly, seven-day or more delayed basis. The Fund files its complete schedule of portfolio holdings with the SEC for the first and third quarters of each fiscal year on Form N-Q, which is available without charge by visiting the SEC Web site at sec.gov. In addition, the Fund’s Form N-Q may be reviewed and copied at the SEC’s Public Reference Room in Washington, DC, and at regional offices in New York City, at 233 Broadway, and in Chicago, at 175 West Jackson Boulevard, Suite 900. Information about the Public Reference Room may be obtained by calling 1-800-SEC-0330.
| | | | |
| 36 | | Wells Fargo Advantage Ultra Short-Term Income Fund | | Other Information (Unaudited) |
BOARD OF TRUSTEES
The following table provides basic information about the Board of Trustees (the “Trustees”) of the Trust and Officers of the Trust. This table should be read in conjunction with the Prospectus and the Statement of Additional Information1 of the Fund. Each of the Trustees and Officers listed below acts in identical capacities for the Wells Fargo Advantage family of funds, which consists of 137 funds comprising the Wells Fargo Funds Trust, Wells Fargo Variable Trust, Wells Fargo Master Trust and four closed-end funds (collectively the “Fund Complex”). All of the Trustees are also Members of the Audit and Governance Committees of each Trust in the Fund Complex. The mailing address of each Trustee and Officer is 525 Market Street, 12th Floor, San Francisco, CA 94105. Each Trustee and Officer serves an indefinite term, however, each Trustee serves such term until reaching the mandatory retirement age established by the Trustees.
Independent Trustees
| | | | | | |
Name and Year of Birth | | Position Held and Length of Service | | Principal Occupations During Past Five Years | | Other Directorships During
Past Five Years |
Peter G. Gordon
(Born 1942) | | Trustee, since 1998; Chairman, since 2005 (Lead Trustee since 2001) | | Co-Founder, Retired Chairman, President and CEO of Crystal Geyser Water Company. Trustee Emeritus, Colby College | | Asset Allocation Trust |
Isaiah Harris, Jr.
(Born 1952) | | Trustee, since 2009 | | Retired. Prior thereto, President and CEO of BellSouth Advertising and Publishing Corp. from 2005 to 2007, President and CEO of BellSouth Enterprises from 2004 to 2005 and President of BellSouth Consumer Services from 2000 to 2003. Emeritus member of the Iowa State University Foundation Board of Governors. Emeritus Member of the Advisory Board of Iowa State University School of Business. Mr. Harris is a certified public accountant. | | CIGNA Corporation; Deluxe Corporation; Asset Allocation Trust |
Judith M. Johnson
(Born 1949) | | Trustee, since 2008 | | Retired. Prior thereto, Chief Executive Officer and Chief Investment Officer of Minneapolis Employees Retirement Fund from 1996 to 2008. Ms. Johnson is an attorney, certified public accountant and a certified managerial accountant. | | Asset Allocation Trust |
Leroy Keith, Jr.
(Born 1939) | | Trustee, since 2010 | | Chairman, Bloc Global Services (development and construction). Trustee of the Evergreen Funds from 1983 to 2010. Former Managing Director, Almanac Capital Management (commodities firm), former Partner, Stonington Partners, Inc. (private equity fund), former Director, Obagi Medical Products Co. and former Director, Lincoln Educational Services. | | Trustee, Virtus Fund Complex (consisting of 40 portfolios as of 12/31/11); Asset Allocation Trust |
David F. Larcker
(Born 1950) | | Trustee, since 2009 | | James Irvin Miller Professor of Accounting at the Graduate School of Business, Stanford University, Director of Corporate Governance Research Program and Senior Faculty of The Rock Center for Corporate Governance since 2006. From 2005 to 2008, Professor of Accounting at the Graduate School of Business, Stanford University. Prior thereto, Ernst & Young Professor of Accounting at The Wharton School, University of Pennsylvania from 1985 to 2005. | | Asset Allocation Trust |
Olivia S. Mitchell
(Born 1953) | | Trustee, since 2006 | | International Foundation of Employee Benefit Plans Professor, Wharton School of the University of Pennsylvania since 1993. Director of Wharton’s Pension Research Council and Boettner Center on Pensions & Retirement Research, and Research Associate at the National Bureau of Economic Research. Previously, Cornell University Professor from 1978 to 1993. | | Asset Allocation Trust |
| | | | | | |
| Other Information (Unaudited) | | Wells Fargo Advantage Ultra Short-Term Income Fund | | | 37 | |
| | | | | | |
Name and Year of Birth | | Position Held and Length of Service | | Principal Occupations During Past Five Years | | Other Directorships During
Past Five Years |
Timothy J. Penny
(Born 1951) | | Trustee, since 1996 | | President and CEO of Southern Minnesota Initiative Foundation, a non-profit organization, since 2007 and Senior Fellow at the Humphrey Institute Policy Forum at the University of Minnesota since 1995. Member of the Board of Trustees of NorthStar Education Finance, Inc., a non-profit organization, since 2007. | | Asset Allocation Trust |
Michael S. Scofield
(Born 1943) | | Trustee, since 2010 | | Served on the Investment Company Institute’s Board of Governors and Executive Committee from 2008-2011 as well the Governing Council of the Independent Directors Council from 2006-2011 and the Independent Directors Council Executive Committee from 2008-2011. Chairman of the IDC from 2008-2010. Institutional Investor (Fund Directions) Trustee of Year in 2007. Trustee of the Evergreen Funds (and its predecessors) from 1984 to 2010. Chairman of the Evergreen Funds from 2000-2010. Former Trustee of the Mentor Funds. Retired Attorney, Law Offices of Michael S. Scofield and former Director and Chairman, Branded Media Corporation (multi-media branding company). | | Asset Allocation Trust |
Donald C. Willeke
(Born 1940) | | Trustee, since 1996 | | Principal of the law firm of Willeke & Daniels. General Counsel of the Minneapolis Employees Retirement Fund from 1984 until its consolidation into the Minnesota Public Employees Retirement Association on June 30, 2010. Director and Vice Chair of The Free Trust (non-profit corporation). Director of the American Chestnut Foundation (non-profit corporation). | | Asset Allocation Trust |
Officers
| | | | | | |
Name and Year of Birth | | Position Held and
Length of Service | | Principal Occupations During Past Five Years | | |
Karla M. Rabusch
(Born 1959) | | President, since 2003 | | Executive Vice President of Wells Fargo Bank, N.A. and President of Wells Fargo Funds Management, LLC since 2003. Senior Vice President and Chief Administrative Officer of Wells Fargo Funds Management, LLC from 2001 to 2003. | | |
C. David Messman
(Born 1960) | | Secretary, since 2000; Chief Legal Counsel, since 2003 | | Senior Vice President and Secretary of Wells Fargo Funds Management, LLC since 2001. Vice President and Managing Senior Counsel of Wells Fargo Bank, N.A. since 1996. | | |
Kasey Phillips
(Born 1970) | | Treasurer, since 2009 | | Senior Vice President of Wells Fargo Funds Management, LLC since 2009. Senior Vice President of Evergreen Investment Management Company, LLC from 2006 to 2010. Treasurer of the Evergreen Funds from 2005 to 2010. | | |
David Berardi
(Born 1975) | | Assistant Treasurer, since 2009 | | Vice President of Wells Fargo Funds Management, LLC since 2009. Vice President of Evergreen Investment Management Company, LLC from 2008 to 2010. Assistant Vice President of Evergreen Investment Services, Inc. from 2004 to 2008. Manager of Fund Reporting and Control for Evergreen Investment Management Company, LLC from 2004 to 2010. | | |
Jeremy DePalma
(Born 1974) | | Assistant Treasurer, since 2009 | | Senior Vice President of Wells Fargo Funds Management, LLC since 2009. Senior Vice President of Evergreen Investment Management Company, LLC from 2008 to 2010. Vice President, Evergreen Investment Services, Inc. from 2004 to 2007. Head of the Fund Reporting and Control Team within Fund Administration from 2005 to 2010. | | |
Debra Ann Early
(Born 1964) | | Chief Compliance Officer, since 2007 | | Chief Compliance Officer of Wells Fargo Funds Management, LLC since 2007. Chief Compliance Officer of Parnassus Investments from 2005 to 2007. Chief Financial Officer of Parnassus Investments from 2004 to 2007 and Senior Audit Manager of PricewaterhouseCoopers LLP from 1998 to 2004. | | |
| 1. | The Statement of Additional Information includes additional information about the Trustees and is available, without charge, upon request, by calling 1-800-222-8222 or by visiting the Web site at wellsfargoadvantagefunds.com. |
| | | | |
| 38 | | Wells Fargo Advantage Ultra Short-Term Income Fund | | List of Abbreviations |
The following is a list of common abbreviations for terms and entities which may have appeared in this report.
| ACB | — Agricultural Credit Bank |
| ADR | — American Depository Receipt |
| ADS | — American Depository Shares |
| AGC-ICC | — Assured Guaranty Corporation - Insured Custody Certificates |
| AGM | — Assured Guaranty Municipal |
| AMBAC | — American Municipal Bond Assurance Corporation |
| AMT | — Alternative Minimum Tax |
| BAN | — Bond Anticipation Notes |
| BHAC | — Berkshire Hathaway Assurance Corporation |
| CAB | — Capital Appreciation Bond |
| CCAB | — Convertible Capital Appreciation Bond |
| CDA | — Community Development Authority |
| CDO | — Collateralized Debt Obligation |
| COP | — Certificate of Participation |
| DRIVER | — Derivative Inverse Tax-Exempt Receipts |
| DW&P | — Department of Water & Power |
| DWR | — Department of Water Resources |
| ECFA | — Educational & Cultural Facilities Authority |
| EDA | — Economic Development Authority |
| EDFA | — Economic Development Finance Authority |
| ETF | — Exchange-Traded Fund |
| FFCB | — Federal Farm Credit Bank |
| FGIC | — Financial Guaranty Insurance Corporation |
| FHA | — Federal Housing Authority |
| FHLB | — Federal Home Loan Bank |
| FHLMC | — Federal Home Loan Mortgage Corporation |
| FNMA | — Federal National Mortgage Association |
| GDR | — Global Depository Receipt |
| GNMA | — Government National Mortgage Association |
| HCFR | — Healthcare Facilities Revenue |
| HEFA | — Health & Educational Facilities Authority |
| HEFAR | — Higher Education Facilities Authority Revenue |
| HFA | — Housing Finance Authority |
| HFFA | — Health Facilities Financing Authority |
| IBC | — Insured Bond Certificate |
| IDA | — Industrial Development Authority |
| IDAG | — Industrial Development Agency |
| IDR | — Industrial Development Revenue |
| KRW | — Republic of Korea Won |
| LIBOR | — London Interbank Offered Rate |
| LLC | — Limited Liability Company |
| LLP | — Limited Liability Partnership |
| MBIA | — Municipal Bond Insurance Association |
| MFHR | — Multi-Family Housing Revenue |
| MSTR | — Municipal Securities Trust Receipts |
| MUD | — Municipal Utility District |
| NATL-RE | — National Public Finance Guarantee Corporation |
| PCFA | — Pollution Control Finance Authority |
| PCR | — Pollution Control Revenue |
| PFA | — Public Finance Authority |
| PFFA | — Public Facilities Financing Authority |
| PFOTER | — Puttable Floating Option Tax-Exempt Receipts |
| plc | — Public Limited Company |
| PUTTER | — Puttable Tax-Exempt Receipts |
| R&D | — Research & Development |
| RDA | — Redevelopment Authority |
| RDFA | — Redevelopment Finance Authority |
| REIT | — Real Estate Investment Trust |
| ROC | — Reset Option Certificates |
| SAVRS | — Select Auction Variable Rate Securities |
| SBA | — Small Business Authority |
| SFHR | — Single Family Housing Revenue |
| SFMR | — Single Family Mortgage Revenue |
| SPDR | — Standard & Poor’s Depositary Receipts |
| TAN | — Tax Anticipation Notes |
| TIPS | — Treasury Inflation-Protected Securities |
| TRAN | — Tax Revenue Anticipation Notes |
| TCR | — Transferable Custody Receipts |
| TTFA | — Transportation Trust Fund Authority |
| TVA | — Tennessee Valley Authority |
| XLCA | — XL Capital Assurance |


FOR MORE INFORMATION
More information about Wells Fargo Advantage Funds is available free upon request. To obtain literature, please write, e-mail, visit the Fund’s Web site, or call:
Wells Fargo Advantage Funds
P.O. Box 8266
Boston, MA 02266-8266
E-mail: wfaf@wellsfargo.com
Web site: wellsfargoadvantagefunds.com
Individual investors: 1-800-222-8222
Retail investment professionals: 1-888-877-9275
Institutional investment professionals: 1-866-765-0778
This report and the financial statements contained herein are submitted for the general information of the shareholders of Wells Fargo Advantage Funds. If this report is used for promotional purposes, distribution of the report must be accompanied or preceded by a current prospectus. For a prospectus containing more complete information, including charges and expenses, call 1-800-222-8222 or visit the Fund’s Web site at wellsfargoadvantagefunds.com. Please consider the investment objectives, risks, charges, and expenses of the investment carefully before investing. This and other information about Wells Fargo Advantage Funds can be found in the current prospectus. Read the prospectus carefully before you invest or send money.
Wells Fargo Funds Management, LLC, a wholly owned subsidiary of Wells Fargo & Company, provides investment advisory and administrative services for Wells Fargo Advantage Funds. Other affiliates of Wells Fargo & Company provide subadvisory and other services for the Funds. The Funds are distributed by Wells Fargo Funds Distributor, LLC, Member FINRA/SIPC, an affiliate of Wells Fargo & Company.
NOT FDIC INSURED ¡ NO BANK GUARANTEE ¡ MAY LOSE VALUE
© 2012 Wells Fargo Funds Management, LLC. All rights reserved.
| | |
 | | 208528 04-12 SA223/SAR223 2-12 |
ITEM 2. CODE OF ETHICS
Not required in this filing
ITEM 3. AUDIT COMMITTEE FINANCIAL EXPERT
Not required in this filing.
ITEM 4. PRINCIPAL ACCOUNTANT FEES AND SERVICES
Not required in this filing.
ITEM 5. AUDIT COMMITTEE OF LISTED REGISTRANTS
Not required in this filing.
ITEM 6. SCHEDULE OF INVESTMENTS
The Schedule of Investments is included as part of the report to shareholders filed under Item 1 of this Form.
ITEM 7. DISCLOSURE OF PROXY VOTING POLICIES AND PROCEDURES FOR CLOSED-END MANAGEMENT INVESTMENT COMPANIES
Not applicable.
ITEM 8. PORTFOLIO MANAGERS OF CLOSED-END MANAGEMENT INVESTMENT COMPANIES
Not applicable.
ITEM 9. PURCHASES OF EQUITY SECURITIES BY CLOSED-END MANAGEMEENT INVESTMENT COMPANY AND AFFILIATED PURCHASES
Not applicable.
ITEM 10. SUBMISSION OF MATTERS TO A VOTE OF SECURITY HOLDERS
The Governance Committee (the “Committee”) of the Board of Trustees of the registrant (the “Trust”) has adopted procedures by which a shareholder of any series of the Trust may submit properly a nominee recommendation for the Committee’s consideration.
The shareholder must submit any such recommendation (a “Shareholder Recommendation”) in writing to the Trust, to the attention of the Trust’s Secretary, at the address of the principal executive offices of the Trust.
The Shareholder Recommendation must be delivered to, or mailed and received at, the principal executive offices of the Trust not less than forty-five (45) calendar days nor more than seventy-five (75) calendar days prior to the date of the Committee meeting at which the nominee would be considered.
The Shareholder Recommendation must include: (i) a statement in writing setting forth (A) the name, age, date of birth, business address, residence address and nationality of the person recommended by the shareholder (the “candidate”); (B) the series (and, if applicable, class) and number of all shares of the Trust owned of record or beneficially by the candidate, as reported to such shareholder by the candidate; (C) any other information regarding the candidate called for with respect to director nominees by paragraphs (a), (d), (e) and (f) of Item 401 of Regulation S-K or paragraph (b) of Item 22 of Rule 14a-101 (Schedule 14A) under the Securities Exchange Act of 1934, as amended (the “Exchange Act”), adopted by the Securities and Exchange Commission (or the corresponding provisions of any regulation or rule subsequently adopted by the Securities and Exchange Commission or any successor agency applicable to the Trust); (D) any other information regarding the candidate that would be required to be disclosed if the candidate were a nominee in a proxy statement or other filing required to be made in connection with solicitation of proxies for election of directors pursuant to Section 14 of the Exchange Act and the rules and regulations promulgated thereunder; and (E) whether the recommending shareholder believes that the candidate is or will be an “interested person” of the Trust (as defined in the Investment Company Act of 1940, as amended) and, if not an “interested person,” information regarding the candidate that will be sufficient for the Trust to make such determination; (ii) the written and signed consent of the candidate to be named as a nominee and to serve as a Trustee if elected; (iii) the recommending shareholder’s name as it appears on the Trust’s books; (iv) the series (and, if applicable, class) and number of all shares of the Trust owned beneficially and of record by the recommending shareholder; and (v) a description of all arrangements or understandings between the recommending shareholder and the candidate and any other person or persons (including their names) pursuant to which the recommendation is being made by the recommending shareholder. In addition, the Committee may require the candidate to interview in person and furnish such other information as it may reasonably require or deem necessary to determine the eligibility of such candidate to serve as a Trustee of the Trust.
ITEM 11. CONTROLS AND PROCEDURES
(a) The President and Treasurer have concluded that the Wells Fargo Funds Trust (the “Trust”) disclosure controls and procedures (as defined in Rule 30a-3(c) under the Investment Company Act of 1940) provide reasonable assurances that material information relating to the Trust is made known to them by the appropriate persons, based on their evaluation of these controls and procedures as of a date within 90 days of the filing of this report.
(b) There were no significant changes in the Trust’s internal controls over financial reporting (as defined in Rule 30a-3(d) under the Investment Company Act of 1940) that occurred during the second quarter of the period covered by this report that materially affected, or is reasonably likely to materially affect, the registrant’s internal control over financial reporting.
ITEM 12. EXHIBITS
(a)(1) Not required in this filing.
(a)(2) Certification pursuant to Rule 30a-2(a) under the Investment Company Act of 1940 (17 CFR 270.30a-2(a)) is filed and attached hereto as Exhibit 99.CERT.
(a)(3) Not applicable.
(b) Certification pursuant to Rule 30a-2(b) under the Investment Company Act of 1940 (17 CFR 270.30a-2(b)) is filed and attached hereto as Exhibit 99.906CERT.
SIGNATURES
Pursuant to the requirements of the Securities Exchange Act of 1934 and the Investment Company Act of 1940, the registrant has duly caused this report to be signed on its behalf by the undersigned, thereunto duly authorized.
| | |
Wells Fargo Funds Trust |
| |
By: | | |
| | /s/ Karla M. Rabusch |
| |
| | Karla M. Rabusch |
| | President |
|
Date: April 25, 2012 |
Pursuant to the requirements of the Securities Exchange Act of 1934 and the Investment Company Act of 1940, this report has been signed below by the following persons on behalf of the registrant and in the capacities and on the date indicated.
| | |
By: | | |
| | /s/ Karla M. Rabusch |
| |
| | Karla M. Rabusch |
| | President |
|
Date: April 25, 2012 |
| |
By: | | |
| | /s/ Kasey L. Phillips |
| |
| | Kasey L. Phillips |
| | Treasurer |
|
Date: April 25, 2012 |